SLEEP NUMBER CORP
10-Ks and 10-Qs
|
|
|
|
|
|
|
|
|
|
|
|
|
|
|
|
|
|
|
|
|
|
|
|
|
|
|
|
|
|
|
|
|
|
|
|
|
|
|
|
|
|
|
|
|
|
|
|
|
|
|
|
|
UNITED STATES SECURITIES AND EXCHANGE COMMISSION
WASHINGTON, D.C. 20549
FORM 10-K
(Mark one)
|
x
|
ANNUAL REPORT PURSUANT TO SECTION 13 OR 15(d) OF THE SECURITIES EXCHANGE ACT OF 1934
|
For the Fiscal Year Ended
December 30, 2017
|
o
|
TRANSITION REPORT PURSUANT TO SECTION 13 OR 15(d) OF THE SECURITIES EXCHANGE ACT OF 1934
|
For the transition period from _________ to _________.
Commission File No. 0-25121
SLEEP NUMBER CORPORATION
(Exact name of registrant as specified in its charter)
|
MINNESOTA
|
|
41-1597886
|
|
(State or other jurisdiction of incorporation or organization)
|
|
(I.R.S. Employer Identification No.)
|
|
1001 Third Avenue South
|
|
|
|
Minneapolis, Minnesota
|
|
55404
|
|
(Address of principal executive offices)
|
|
(Zip Code)
|
Registrant's telephone number, including area code:
(763) 551-7000
Securities registered pursuant to Section 12(b) of the Act:
|
Title of each class
|
|
Name of each exchange on which registered
|
|
Common Stock, par value $0.01 per share
|
|
The NASDAQ Stock Market LLC
|
|
|
|
(NASDAQ Global Select Market)
|
|
Securities registered pursuant to Section 12(g) of the Act:
None
|
||
Indicate by check mark if the Registrant is a well-known seasoned issuer, as defined by Rule 405 of the Securities Act. YES
ý
NO
o
Indicate by check mark if the Registrant is not required to file reports pursuant to Section 13 or Section 15(d) of the Act. YES
o
NO
ý
Indicate by check mark whether the Registrant (1) has filed all reports required to be filed by Section 13 or 15(d) of the Securities Exchange Act of 1934 during the preceding 12 months (or for such shorter period that the Registrant was required to file such reports), and (2) has been subject to such filing requirements for the past 90 days. YES
ý
NO
o
Indicate by check mark whether the registrant has submitted electronically and posted on its corporate Web site, if any, every Interactive Data File required to be submitted and posted pursuant to Rule 405 of Regulation S-T (§ 232.405 of this chapter) during the preceding 12 months (or for such shorter period that the registrant was required to submit and post such files). YES
ý
NO
o
Indicate by check mark if disclosure of delinquent filers pursuant to Item 405 of Regulation S-K (§ 229.405 of this chapter) is not contained herein, and will not be contained, to the best of Registrant’s knowledge, in definitive proxy or information statements incorporated by reference in Part III of this Form 10-K or any amendment to this Form 10-K.
ý
Indicate by check mark whether the Registrant is a large accelerated filer, an accelerated filer, a non-accelerated filer, smaller reporting company, or an emerging growth company. See the definitions of “large accelerated filer,” “accelerated filer,” “smaller reporting company," and "emerging growth company" in Rule 12b-2 of the Exchange Act.
|
Large accelerated filer
|
ý
|
|
|
Accelerated filer
o
|
|
Non-accelerated filer
|
o
|
(Do not check if a smaller reporting company)
|
|
Smaller reporting company
o
|
|
Emerging growth company
o
|
||||
If an emerging growth company, indicate by check mark if the registrant has elected not to use the extended transition period for complying with any new or revised financial accounting standards provided pursuant to Section 13(a) of the Exchange Act.
o
Indicate by check mark whether the Registrant is a shell company (as defined in Rule 12b-2 of the Exchange Act). YES
o
NO
ý
The aggregate market value of the common stock held by non-affiliates of the Registrant as of
July 1, 2017
, was
$882,558,000
(based on the last reported sale price of the Registrant’s common stock on that date as reported by NASDAQ).
As of
January 26, 2018
, there were
38,487,000
shares of the Registrant’s Common Stock outstanding.
DOCUMENTS INCORPORATED BY REFERENCE
Portions of the registrant’s proxy statement to be furnished to shareholders in connection with its
2018
Annual Meeting of Shareholders are incorporated by reference in Part III, Items 10-14 of this Annual Report on Form 10-K.
As used in this Form 10-K, the terms “we,” “us,” “our,” the “Company,” and “Sleep Number” mean Sleep Number Corporation and its subsidiaries and the term “common stock” means our common stock, par value $0.01 per share.
As used in this Form 10-K, the term “bedding” includes mattresses, box springs and foundations.
Sleep Number®, SleepIQ®, Sleep Number 360®, SleepIQ Kids®, the Double Arrow logo, Select Comfort®, AirFit®, BAM Labs®, the “B” logo, Comfortaire®, ComfortFit®, Comfort.Individualized.®, Does Your Bed Do That?®, the DualTemp logo, the DualAir Technology Inside logo, FlexTop®, IndividualFit®, Individualized Sleep Experiences®, It®, Know Better Sleep®, Pillow[ology]®, PillowFit®, Probably the Best Bed in the World®, Sleep Number Inner Circle®, Tech-e®, Smart Bed For Smart Kids®, Smart Bed Technology®, The Only Bed That Grows With Them®, The Only Bed That Knows You®, Tonight Bedtime. Tomorrow The World®, We Make Beds Smart®, What’s Your Sleep Number?®, SleepIQ LABS™, Auto Snore™, HealthIQ™, HeartIQ™, Rapid Sleep Onset™, RespiratoryIQ™, Responsive Air™, Sleep For The Future℠, Sleep Is My Super Power™, Sleep Is Training™, Sleep30™, WellnessIQ™, ActiveComfort™, CoolFit™, DualAir™, DualTemp™, Firmness Control™, FlexFit™, In Balance™, PartnerSnore™, The Bed Reborn™, the SleepIQ LABS logo, The Bed That Moves You™
, our bed model names, and our other marks and stylized logos are trademarks and/or service marks of Sleep Number. This Form 10-K may also contain trademarks, trade names and service marks that are owned by other persons or entities.
Our fiscal year ends on the Saturday closest to December 31, and, unless the context otherwise requires, all references to years in this Form 10-K refer to our fiscal years. Our fiscal year is based on a 52- or 53-week year. All years presented in this Form 10-K are 52 weeks, except for the 2014 fiscal year ended January 3, 2015, which is a 53-week year.
i
TABLE OF CONTENTS
|
PART I
|
|||
|
|
|
|
|
|
|
Item 1.
|
||
|
|
|
|
|
|
|
Item 1A.
|
||
|
|
|
|
|
|
|
Item 1B.
|
||
|
|
|
|
|
|
|
Item 2.
|
||
|
|
|
|
|
|
|
Item 3.
|
||
|
|
|
|
|
|
|
Item 4.
|
||
|
|
|
|
|
|
PART II
|
|||
|
|
|
|
|
|
|
Item 5.
|
Market for Registrant's Common Equity, Related Stockholder Matters and Issuer Purchases of Equity Securities
|
|
|
|
|
|
|
|
|
Item 6.
|
||
|
|
|
|
|
|
|
Item 7.
|
||
|
|
|
|
|
|
|
Item 7A.
|
||
|
|
|
|
|
|
|
Item 8.
|
||
|
|
|
|
|
|
|
Item 9.
|
Changes in and Disagreements with Accountants on Accounting and Financial Disclosure
|
|
|
|
|
|
|
|
|
Item 9A.
|
||
|
|
|
|
|
|
|
Item 9B.
|
||
|
|
|
|
|
|
PART III
|
|||
|
|
|
|
|
|
|
Item 10.
|
||
|
|
|
|
|
|
|
Item 11.
|
||
|
|
|
|
|
|
|
Item 12.
|
||
|
|
|
|
|
|
|
Item 13.
|
||
|
|
|
|
|
|
|
Item 14.
|
||
|
|
|
|
|
|
PART IV
|
|||
|
|
|
|
|
|
|
Item 15.
|
||
|
Item 16.
|
Form 10-K Summary
|
||
ii
This Annual Report on Form 10-K contains or incorporates by reference certain forward-looking statements within the meaning of the Private Securities Litigation Reform Act of 1995. For this purpose, any statements contained in or incorporated by reference into this Annual Report on Form 10-K that are not statements of historical fact may be deemed to be forward-looking statements, including but not limited to projections of revenues, results of operations, financial condition or other financial items; any statements of plans, strategies and objectives of management for future operations; any statements regarding proposed new products, services or developments; any statements regarding future economic conditions, prospects or performance; statements of belief and any statement or assumptions underlying any of the foregoing. In addition, we or others on our behalf may make forward-looking statements from time to time in oral presentations, including telephone conferences and/or Webcasts open to the public, in press releases or reports, on our Internet Website or otherwise. We try to identify forward-looking statements in this report and elsewhere by using words such as “may,” “will,” “should,” “could,” “expect,” “anticipate,” “believe,” “estimate,” “plan,” “project,” “predict,” “intend,” “potential,” “continue” or the negative of these or similar terms.
Our forward-looking statements speak only as of the date made and by their nature involve substantial risks and uncertainties. Our actual results may differ materially depending on a variety of factors, including the items discussed in greater detail below under the caption “Risk Factors.” These risks and uncertainties are not exclusive and further information concerning the Company and our business, including factors that potentially could materially affect our financial results or condition, may emerge from time to time, including factors that we may consider immaterial or do not anticipate at this time.
We wish to caution readers not to place undue reliance on any forward-looking statement and to recognize that forward-looking statements are predictions of future results, which may not occur as anticipated. We assume no obligation to update forward-looking statements to reflect actual results or changes in factors or assumptions affecting such forward-looking statements. We advise you, however, to review and consider any further disclosures we make on related subjects in our quarterly reports on Form 10-Q and current reports on Form 8-K that we file with or furnish to the Securities and Exchange Commission.
Overview
Sleep Number Corporation (formerly Select Comfort Corporation), based in Minneapolis, Minnesota, was founded in 1987. In 1998, Sleep Number became a publicly traded company. We are listed on The NASDAQ Stock Market LLC (NASDAQ Global Select Market) under the symbol “SNBR.” When used herein, the terms “Sleep Number,” “Company,” “we,” “us” and “our” refer to Sleep Number Corporation, including consolidated subsidiaries.
Our mission is to improve lives by individualizing sleep experiences. Our vision is to become one of the world's most beloved brands by delivering an unparalleled sleep experience. We expect to achieve our goals by executing our consumer innovation strategy with three significant competitive advantages: proprietary sleep innovations, lifelong customer relationships and exclusive retail distribution.
As the leader in sleep innovation, Sleep Number delivers the best quality sleep through effortless, adjustable comfort and biometric sleep tracking. We are a visionary in health and wellness, proving the connection between sleep and well-being. We have a vertically integrated business model and are the exclusive designer, manufacturer, marketer, retailer and servicer of Sleep Number beds. We offer consumers high-quality, individualized sleep solutions and services, including a complete line of Sleep Number beds, bases and bedding accessories. We are the pioneer in biometric sleep tracking and adjustability. Only the Sleep Number bed offers SleepIQ technology - a proprietary sensor technology that tracks each individual’s sleep and works directly with the bed’s DualAir system to automatically adjust the comfort level of each sleeper. With the SleepIQ technology platform, we are powering one of the most comprehensive databases of biometric sleep data in the world, and fundamentally changing the way we monitor and manage health. Through daily digital interactions that build lifelong relationships, SleepIQ technology also communicates how you slept and provides insights on what adjustments you can make to optimize your sleep and improve your daily life. Sleep Number also offers FlextFit adjustable bases, Sleep Number pillows, sheets and other bedding products. As a direct-to-consumer brand, we offer consumers a cohesive experience across our Sleep Number stores, online at SleepNumber.com or via phone at (800) 753-3768.
We are committed to delivering superior shareholder value through three primary drivers of earnings per share growth: increasing consumer demand, leveraging our business model and deploying capital efficiently. Since 2012, we have transformed the business with
$487 million
of capital expenditures and acquisitions. This effort has strengthened our competitive advantages and positioned us for accelerated profits and cash generation. In
2017
, we increased net sales by 10% to
$1.4 billion
and increased operating income by 20% to
$92 million
.
2
In September 2015, we completed the acquisition of BAM Labs, Inc. (now operating as SleepIQ LABS), the leading provider of biometric sensor and sleep monitoring technology for data-driven health and wellness. The addition of SleepIQ LABS strengthens Sleep Number’s leadership in sleep innovation, adjustability and individualization. The acquisition broadens and deepens electrical, biomedical, software and backend capabilities - API (application program interface) and bio-signal analysis. Our ownership and control of biometric data advances smart, connected products that empower our customers to experience quality sleep.
In the fourth quarter of 2015, we replaced our nearly 20-year-old legacy computer systems with a new vertically integrated Enterprise Resource Planning (ERP) system. The new operating platform enables operational efficiencies, improves customer convenience and supports the growth of our business.
Proprietary Sleep Innovations
The Sleep Number 360® Smart Bed
In January 2017 at CES (the world’s preeminent technology showcase and innovation catalyst), Sleep Number introduced the Sleep Number 360 smart bed line, the most significant innovation in our 30-year history. The Sleep Number 360 smart bed won 13 awards at CES, including being named the Best of Innovation Honoree in the Home Appliances category. Powered by SleepIQ technology, the Sleep Number 360 smart beds intuitively sense and automatically adjust comfort to keep both partners sleeping soundly all night. The SleepIQ technology platform integrates hardware, software and design to deliver effortless adjustability, sleep tracking and connectivity.
The Sleep Number 360 smart mattresses and FlexFit smart adjustable bases will include these features that deliver improved quality sleep:
|
•
|
Self-adjusting comfort throughout the night. As sleep positions change during the night, Responsive Air technology adjusts the bed’s comfort via the two air chambers inside the mattress.
|
|
•
|
Foot-warming feature to fall asleep faster. It’s clinically proven that people fall asleep faster when their feet are warmed. SleepIQ technology knows the sleepers’ bedtime routines and warms the foot of the bed before bedtime with Rapid Sleep Onset technology.
|
|
•
|
Partner Snore adjustment. At the touch of a button, the 360 Smart Bed will elevate your partner’s head, which may relieve mild common snoring.
|
As of December 30, 2017, we have deployed three smart bed models: the p6, i7 and i10 Sleep Number 360 smart beds. The remainder of the 360 smart bed line will also be deployed in phases and we expect to have the core line transitioned by mid-year 2018.
Sleep Number® Bed Offerings
Unlike the “one-size-fits-all” solution offered by other mattress brands, the Sleep Number bed offers individualized comfort that is adjustable on each side of the bed. Our proprietary DualAir technology, which features two independent air chambers, allows couples to adjust firmness to their own individual preference at the touch of a button. Sleepers can each enjoy their ideal firmness, support and pressure-relieving comfort - their Sleep Number setting - for deep, restful sleep.
The benefits of our proprietary Sleep Number bed have been validated through clinical sleep research, which has shown that participants who slept on a Sleep Number bed generally fell asleep faster, experienced more deep sleep with fewer disturbances and experienced greater relief from back pain than those sleeping on a traditional innerspring mattress.
We offer Sleep Number beds in good, better and best price ranges within the premium mattress category, and in a broad range of sizes, including twin, full, queen, eastern king and California king.
|
•
|
The Classic Series offers Sleep Number adjustability starting at $899 for a queen mattress. The series includes the Sleep Number c2 and c4 beds.
|
|
•
|
The Performance Series includes our most popular mattresses with a perfect balance of softness and pressure-relieving support. The series includes the Sleep Number p5 bed and Sleep Number 360 p6 smart bed.
|
|
•
|
The Innovation Series is the ultimate in individualized comfort and temperature-balancing innovation, including the Sleep Number i8 bed, the Sleep Number 360 i7 smart bed and the 360 i10 smart bed.
|
Our commitment to quality, value, and service has been recognized by customers through J.D. Power. The J.D. Power's survey measures customer satisfaction with mattress purchases based on seven factors: comfort, price, support, durability, warranty, features
3
and customer service. Sleep Number was ranked highest in customer satisfaction with mattresses in 2016 and 2017, and second highest in 2018.
SleepIQ® Technology
SleepIQ technology is a touchless, biometric sensor technology that tracks sleep during the night. Launched by Sleep Number in 2014, SleepIQ technology tracks the user's sleep by gathering hundreds of biometric readings per second continuously (heart rate, motion and breathing). The accuracy of SleepIQ technology heart rate, breath rate and movement measurements has been validated through in-home trials and sleep center studies. Based on this data, a proprietary algorithm delivers a personal SleepIQ score, from 1 to 100, to consumers each morning. SleepIQ also connects with leading health, fitness and sleep environment apps - including Apple® Health, FitBit
®
, Nest Learning Thermostat™, MapMyRun™ and Nokia Health Mate™ - to show a holistic view of how lifestyle choices may affect sleep.
The Sleep Number bed is the only bed that lets you track and optimize your sleep with SleepIQ technology. It empowers the sleeper to achieve their best possible sleep each night. In addition, SleepIQ can be added to Sleep Number beds purchased after 2008.
FlexFit™ Adjustable Base Technology
We offer a full line of exclusive FlexFit adjustable bases that enable customers to raise the head or foot of the bed, and to experience the comfort of massage. Our Partner Snore technology lets a user gently raise their partner’s head to relieve mild common snoring.
In conjunction with the 360 smart beds, we introduced a new line of FlexFit smart adjustable bases in 2017. This new series integrates with SleepIQ technology to deliver the new features and functionality previously described, and will replace our existing FlexFit base models.
Additional Sleep Number Innovations
Our exclusive Sleep Number bedding collection comprises a full line of sleep products that are designed to solve sleep issues. Sleep Number has a wide assortment of pillows designed to fit each individual's size, shape and sleeping position for more comfortable sleep. Our innovative bedding features make it easier to make your bed: our SmartFit design keeps sheets securely in place and Logic Label takes the guesswork out of making your bed. We also offer a wide assortment of temperature-balancing products including a DualTemp layer. This proprietary sleep innovation features active air technology that allows each person to select his or her ideal temperature at the simple touch of a button and can be used with any mattress brand or adjustable base.
The SleepIQ Kids bed extends Sleep Number's core DualAir adjustability and SleepIQ technology to the children's mattress market via two models, the k1 and the k2. It is the only bed that adjusts with children as they grow.
Exclusive Distribution
With the importance of building a brand relationship directly with consumers, nearly
99%
of our net sales are direct to consumers through a cohesive experience across our Sleep Number stores, online at SleepNumber.com or via phone.
Since 2012, we have rebuilt our store portfolio and expanded our national footprint. This strategy has included repositioning a large percentage of our mall stores to stronger off-mall locations, improving the size and positioning within malls and adding stores in both existing and new trade areas. We are well positioned with a healthy retail store portfolio that is highly productive. As of year-end
2017
, approximately
49%
of our stores are less than five years old.
We target high-quality, convenient and visible store locations based on several factors, including each market’s overall sales potential, store geographic location, demographics and proximity to other specialty retail stores. As the exclusive distributor of Sleep Number products, we target one store per 350,000 - 500,000 people. This places our stores within an average radius of 10 miles, or 20-minute drive times, for most of our target customers.
Our award-winning store design and improved real estate locations support our value-added retail experience, which results in high store productivity and profitability. Our stores deliver nearly $1,000 of annual net sales per square foot and we average approximately
$667,000
in annual net sales per full-time retail employee. Since 2012, we have increased our average store size by more than
58%
to
2,647
square feet.
As of
December 30, 2017
, we had
556
retail stores in all 50 U.S. states, including new stores opened in Alaska and Hawaii,
57%
of which were in non-mall locations. We have targeted up to 650 stores by 2019.
4
Working in conjunction with our retail stores, we have a cohesive online experience that helps customers easily engage in relevant content, research our products and solutions, transact online and find post-sales support. Our experience expands our digital brand connecting with consumers to drive deeper awareness, consideration and engagement.
We have adopted an agile development approach to our online initiatives. This means we deploy rapid experimentation and iterations of our digital experiences. Results include faster time-to-market of online improvements to drive store traffic and online conversion. Sleep Number products are available exclusively at SleepNumber.com or Sleep Number stores.
Our retail business accounted for
92%
of our net sales in
2017
. Average annual net sales per comparable store were
$2.4 million
in 2017. In
2017
,
98%
of our stores open for a full year generated net sales over $1 million and
61%
of our stores open for a full year generated net sales over $2 million. We now have more than
20%
of our store base delivering greater than $3 million in annual net sales. In 2017, our online and phone sales accounted for
7%
of our net sales and wholesale accounted for 1% of our net sales.
Marketing
We use a broad set of marketing and advertising instruments to extend brand reach, deepen brand engagement, and motivate and educate customers for traffic to our brand. Our actions result in acquiring new customers and driving referral and repeat business. Our marketing efforts target a broad customer demographic: 30-54 years old with greater than $75,000 household income for our core line of products. Our customers care about their own and their family's sleep quality and know that it leads to better overall health and well-being.
Marketing drives growth in our business by building brand relevance, reputation, consumer awareness, consideration and ongoing engagement with our benefit-driven sleep innovations, which results in increased quality traffic to our website and stores. Our advertising communications utilize a mix of national and local marketing to target existing customers for referral and repeat purchases and to attract new customers. Television is our most efficient media, followed by digital and social media. We continue to build our in-house digital capabilities, content marketing, user experience and data-driven tools to make deeper connections with our customers, increase brand demand and improve media efficiency. In
2017
, media expense represented
13.4%
of net sales.
In early 2018, we entered into a multi-year partnership as the official sleep and wellness partner of the NFL aimed at amplifying our brand, our analytics and loyal customer-base. We will help players compete more effectively by measuring, understanding and maximizing the benefits of a great night's sleep. Sleep Number will work with players, teams and trainers as they integrate sleep insights into their overall performance regimens.
Operations
Manufacturing and Distribution
We have two manufacturing plants located in Irmo, South Carolina and Salt Lake City, Utah. The manufacturing operations in South Carolina and Utah consist of cutting and sewing of the fabric covers for our beds, and final assembly and packaging of mattresses and bases. In addition, our electrical Firmness Control systems are assembled in our Utah plant.
We obtain all the raw materials and components used to produce our beds from outside sources. A number of components, including our proprietary air chambers, our adjustable foundations, various components for our Firmness Control systems, as well as fabrics and zippers, are sourced from suppliers who currently serve as our sole or primary source of supply for these components. We believe we can obtain these raw materials and components from other sources of supply, although we could experience some short-term disruption in our ability to fulfill orders in the event of an unexpected loss of supply from one of our primary suppliers. We utilize dual sourcing on targeted components when effective.
We have taken, and continue to take, various measures to mitigate the potential impact of an unexpected disruption in supply from any sole-source suppliers, including increasing safety stocks and identifying potential secondary sources of supply. All the suppliers that produce unique or proprietary products for us have in place either contingency or disaster recovery plans or redundant production capabilities in other locations in order to safeguard against any unforeseen disasters. We review these plans and sites on a regular basis to ensure the suppliers' ability to maintain an uninterrupted supply of materials and components.
Historically, we manufactured our bed components in our two plants and completed final bed assembly in customers’ homes. We are pursuing a multi-year evolution to enable delivery of assembled mattresses. In 2017, we opened two assembly distribution centers to assemble beds prior to delivery. We expect to expand this capability to approximately six assembly distribution centers over the next couple of years. We are also advancing our outbound logistics network to reduce product handling, hand-offs, damage and costs while
5
in transit to customers’ homes. We see these initiatives providing a superior and reliable experience for customers with lower costs for the business.
Home Delivery Service
Nearly
85%
of our beds sold are installed through our full-service home delivery team or by our third-party service providers in selected markets. The balance of beds are shipped directly to our customers and self-assembled.
Customer Service
We have an in-house customer service team of specialists that provide service and support via phone, email, “live chat” and social media. Direct access to our customers is a unique advantage that also provides insights and identifies emerging trends as we strive to continuously improve our product and service quality and advance our product innovation.
Research and Development
As a consumer-driven innovation company, Sleep Number conducts extensive research to understand consumer needs. This research informs the design and delivery of our sleep innovations and our customer experience. We have a robust product development organization that fuels our innovations. In 2015, we acquired BAM Labs, Inc. (now operating as SleepIQ LABS), a leading provider of biometric sensor and sleep monitoring for data-driven health and wellness. This is significant as consumers are rapidly adopting new digital tools and using their personal data to improve health and wellness. Technology that improves the quality of sleep and overall wellness will continue to be a top priority for Sleep Number. Our research and development expenses were
$28 million
in
2017
,
$28 million
in
2016
and
$16 million
in
2015
.
Management Information Systems
We use information technology systems to operate, analyze and manage our business, to reduce operating costs and to enhance our customers' experience. Our major systems include an in-store order entry system, a retail portal system, a payment processing system, in-bound and out-bound telecommunications systems for direct marketing, delivery scheduling and customer service, e-commerce systems, a data warehouse system and an enterprise resource planning system. These systems are primarily comprised of packaged applications licensed from various software vendors plus a limited number of internally developed programs. Please refer to the information set forth in Part I, Item 1A.,
Risk Factors,
for a discussion of certain risks that may be encountered in connection with our management information systems.
Intellectual Property
We hold various U.S. and foreign patents and patent applications regarding certain elements of the design and function of our products, including air control systems, remote control systems, air chamber features, mattress construction, foundation systems, sensing systems, as well as other technology. We have numerous U.S. patents, expiring at various dates between
February 2019 and November 2035
, and numerous U.S. patent applications pending. We also have numerous foreign patents and patent applications pending. Notwithstanding these patents and patent applications, we cannot ensure that these patent rights will provide substantial protection or that others will not be able to develop products that are similar to or competitive with our products.
We have a number of trademarks and service marks registered with the U.S. Patent and Trademark Office, including Sleep Number®, SleepIQ®, Sleep Number 360®, SleepIQ Kids®, the Double Arrow logo, Select Comfort®, AirFit®, BAM Labs®, the “B” logo, Comfortaire®, ComfortFit®, Comfort.Individualized.®, Does Your Bed Do That?®, the DualTemp logo, the DualAir Technology Inside logo, FlexTop®, IndividualFit®, Individualized Sleep Experiences®, It®, Know Better Sleep®, Pillow[ology]®, PillowFit®, Probably the Best Bed in the World®, Sleep Number Inner Circle®, Tech-e®, Smart Bed For Smart Kids®, Smart Bed Technology®, The Only Bed That Grows With Them®, The Only Bed That Knows You®, Tonight Bedtime. Tomorrow The World®, We Make Beds Smart®, and What’s Your Sleep Number?®. We have several trademarks that are the subject of pending applications, including SleepIQ LABS™, Auto Snore™, HealthIQ™, HeartIQ™, Rapid Sleep Onset™, RespiratoryIQ™, Responsive Air™, Sleep for the Future℠, Sleep Is My Super Power™, Sleep Is Training™, Sleep30™ and WellnessIQ™. Each registered mark is renewable indefinitely as long as the mark remains in use and/or is not deemed to be invalid or canceled. We also have a number of common law trademarks, including ActiveComfort™, CoolFit™, DualAir™, DualTemp™, Firmness Control™, FlexFit™, In Balance™, PartnerSnore™, the SleepIQ LABS logo, The Bed Reborn™, The Bed That Moves You™ and our bed model names. Several of our trademarks have been registered, or are the subject of pending applications for registration, in various foreign countries. We also have other intellectual property rights related to our products, processes and technologies, including trade secrets, trade dress and copyrights. We protect and enforce our intellectual property rights, including through litigation as necessary.
6
Industry and Competition
The U.S. bedding industry is a mature and generally stable industry. According to the International Sleep Products Association (ISPA), the industry has grown by approximately 5% annually over the last 20 years and at an estimated 6% annually, on average, over the past five years. We believe that industry unit growth has been primarily driven by population growth, an increase in the number of homes (including secondary residences) and the increased size of homes. We believe growth in average wholesale prices resulted from a shift to both larger and higher-quality beds, which are typically more expensive. According to ISPA, industry wholesale shipments of mattresses and foundations (excluding adjustable bases) were estimated to be
$8.5 billion
in 2017 compared to $8.4 billion in 2016.
Furniture/Today,
a furniture industry trade publication, has ranked Sleep Number as the
5
th largest mattress manufacturer and
2
nd largest U.S. bedding retailer for 2016, with a
7%
market share of industry retail revenue.
The retail bedding industry is fragmented and highly competitive. Our Company-Controlled distribution channel is exclusive, and we compete against regional and local specialty bedding retailers, home furnishing stores, mass merchants, national discount stores and online marketers. Our consumer innovation strategy with exclusive distribution is highly differentiated, and results in retail-leading customer experience.
Manufacturers in the bedding industry compete on price, quality, brand name recognition, product availability and product performance, including the perceived levels of comfort and support provided by a mattress. There is a high degree of concentration among manufacturers, who produce innerspring, memory foam and hybrid beds, under nationally recognized brand names, including Tempur Sealy, Stearns & Foster, Serta and Simmons. In recent years, numerous (over 100) direct-to-consumer companies and low cost importers have entered the market, offering “bed-in-a-box” products to consumers primarily through the Internet. These companies market directly to consumers, competing primarily on convenience of online shopping and speed of delivery. Their products are generally foam-based and undifferentiated in terms of sleep benefits.
Governmental Regulation and Compliance
As a vertically integrated manufacturer and retailer, we are subject to extensive federal, state and local laws and regulations affecting all aspects of our business.
As a manufacturer, we are committed to product quality and safety, including adherence to all applicable laws and regulations affecting our products. Compliance with federal fire retardant standards developed by the U.S. Consumer Product Safety Commission, including rigorous and costly testing, has increased the cost and complexity of manufacturing our products and may adversely impact the speed and cost of product development efforts. Further, our manufacturing and other business operations and facilities are, or may, become subject to additional federal, state or local laws or regulations relating to supply chain transparency, conflict minerals sourcing and disclosure, end-of-life disposal and recycling requirements and other laws or regulations relating to environmental protection and health and safety requirements. We are not aware of any national or local environmental laws or regulations that may require material capital expenditures or which may materially affect our competitive position or our operational results, financial position or cash flows.
As a retailer, we are subject to additional laws and regulations that apply to retailers generally and govern the marketing and sale of our products and the operation of both our retail stores and our e-commerce activities. Many of the statutory and regulatory requirements which impact our retail and e-commerce operations are consumer-focused and pertain to activities such as the advertising and selling of credit-based promotional offers, truth-in-advertising, privacy, “do not call/mail” requirements, warranty disclosure, delivery timing requirements, accessibility and similar requirements.
All of our operations are or may become subject to federal, state and local labor laws including, but not limited to, those relating to occupational health and safety, employee privacy, wage and hour, overtime pay, harassment and discrimination, equal opportunity and employee leaves and benefits. We are also subject to existing and emerging federal and state laws relating to data security.
It is our policy and practice to comply with all legal and regulatory requirements and our procedures and internal controls are designed to promote such compliance.
Customers
No single customer accounts for 10% or more of our net sales.
7
Seasonality
Our business is modestly impacted by seasonal influences inherent in the U.S. bedding industry and general retail shopping patterns. The U.S. bedding industry generally experiences lower sales in the second quarter of the calendar year and increased sales during selected holiday or promotional periods.
Working Capital
We are able to operate with minimal working capital requirements because we sell directly to customers, utilize a primarily hybrid "make-to-stock" production process and operate retail stores that serve mainly as showrooms. We have historically generated sufficient cash flows to self-fund operations through an accelerated cash-conversion cycle. In February 2018, we amended our revolving credit facility (Credit Agreement) with a syndicate of banks (Lenders). The Credit Agreement provides a revolving credit facility for general corporate purposes with net aggregate availability of $300 million. The Credit Agreement contains an accordion feature that allows us to increase the amount of the credit facility from $300 million up to $450 million in total availability, subject to Lenders' approval. The Credit Agreement matures in February 2023.
Qualified customers are offered revolving credit to finance purchases through a private-label consumer credit facility provided by Synchrony Bank. Approximately
47%
of our net sales in
2017
were financed by Synchrony Bank. Our current agreement with Synchrony Bank expires
December 31, 2020
, subject to earlier termination upon certain events and subject to automatic extensions. We pay Synchrony Bank a fee for extended credit promotional financing offers. Under the terms of our agreement, Synchrony Bank sets the minimum acceptable credit ratings, the interest rates, fees and all other terms and conditions of the customer accounts, including collection policies and procedures. As the receivables are owned by Synchrony Bank, at no time are the receivables purchased or acquired from us. We are not liable to Synchrony Bank for our customers' credit defaults. In connection with all purchases financed under these arrangements, Synchrony Bank pays us an amount equal to the total amount of such purchases, net of promotional related discounts, upon delivery to the customer. Customers that do not qualify for credit under our agreement with Synchrony Bank may apply for credit under a secondary program that we offer through another provider.
Team Members
At
December 30, 2017
, we employed
4,099
individuals, including
2,105
retail sales and support team members,
412
customer service team members,
1,080
manufacturing and logistics team members, and
502
management and administrative team members. Approximately
72
of our team members were employed on a part-time or temporary basis at
December 30, 2017
. Except for managerial team members and professional support staff, all of our team members are paid on an hourly basis (plus commissions for sales professionals). Additionally, we provide various broad-participation incentive compensation programs tied to various performance objectives. None of our team members are represented by a labor union or covered by a collective bargaining agreement. We have a highly engaged team working in a values-driven culture, which we believe is important for an innovation company with such an aspirational vision and life-changing mission.
8
Executive Officers of the Registrant
SHELLY R. IBACH,
58
President and Chief Executive Officer (Joined the Company in April 2007 and was promoted to President and CEO in June 2012)
Shelly R. Ibach, Sleep Number
®
setting 40, is the President and Chief Executive Officer (CEO) for Sleep Number (NASDAQ: SNBR). From June 2011 to June 2012, Ms. Ibach served as the company’s Executive Vice President and Chief Operating Officer and from October 2008 to June 2011, she served as Executive Vice President, Sales & Merchandising. Ms. Ibach joined the company in April 2007 as Senior Vice President of U.S. sales for company-owned channels. Before joining the company, Ms. Ibach was Senior Vice President and General Merchandise Manager for Macy’s home division. From 1982 to 2005, Ms. Ibach held various leadership and executive positions within Target Corporation.
MELISSA BARRA,
46
Senior Vice President, Chief Strategy and Customer Relationship Officer (Joined the Company in 2013 and was promoted to current role in January 2015)
Melissa Barra, Sleep Number
®
setting 30, serves as the Senior Vice President, Chief Strategy and Customer Relationship Officer. Ms. Barra was Vice President, Consumer Insights and Strategy from February 2013 to January 2015. Prior to joining Sleep Number in February 2013, Ms. Barra was Vice President, Process Reengineering Officer for Best Buy Co., Inc. from 2011 to 2012. In a dual role, she also served as Vice President, Finance, New Business Customer Solutions Group from 2010 to 2012. From 2005 to 2010, she held leadership positions in Strategic Alliances and Corporate Development for Best Buy. Prior to Best Buy, Ms. Barra held corporate finance and strategy leadership roles in companies in the U.S. and internationally, including Grupo Futuro S.A., Citibank and GE Capital.
ANNIE L. BLOOMQUIST,
48
Senior Vice President and Chief Product Officer (Joined the Company in 2008 and was promoted to current role in June 2012)
Annie L. Bloomquist, Sleep Number
®
setting 25, serves as the Senior Vice President and Chief Product Officer and leads all product innovation, research and development for software and hardware, product brand management, clinical sleep research and merchandising. Ms. Bloomquist was the Chief Product and Merchandising Officer from June 2011 to June 2012. Ms. Bloomquist joined Sleep Number in May 2008 as Vice President and General Merchandise Manager. Prior to joining Sleep Number, Ms. Bloomquist held leadership positions in product and merchandising at Macy’s and Marshall Field’s Department Stores for Target Corporation.
KEVIN K. BROWN,
49
Senior Vice President and Chief Marketing Officer (Joined the Company in 2013)
Kevin K. Brown, Sleep Number
®
setting 40, serves as the Senior Vice President and Chief Marketing Officer for Sleep Number. Prior to joining Sleep Number in January 2014, Mr. Brown served as Group Vice President, Chief Marketing Officer for Meijer, Inc., a regional chain of retail supercenters, from 2011 to 2013. From 2007 to 2011, Mr. Brown held executive marketing leadership roles at Sears Holdings Corporation, including Vice President, Chief Marketing Officer for the home appliances business unit. Previously, Mr. Brown held the position of Senior Vice President, Marketing for Jo-Ann Stores, Inc., from 2004 to 2006. Prior to Jo-Ann Stores, he was an associate partner for Accenture.
DAVID R. CALLEN,
51
Senior Vice President and Chief Financial Officer (Joined the Company in 2014)
David R. Callen, Sleep Number
®
setting 30, serves as the Senior Vice President and Chief Financial Officer for Sleep Number. Prior to joining Sleep Number in April 2014, Mr. Callen served as the Principal Financial Officer, Vice President, Finance and Treasurer for Ethan Allen Interiors, Inc., from 2007 to 2014. Previously, Mr. Callen served for more than 15 years in increasingly responsible international financial management positions, emphasizing brand support and manufacturing across industries including automotive, dental, outdoor recreational products, high tech and public accounting.
ANDY P. CARLIN,
54
Executive Vice President, Chief Sales and Services Officer (Joined the Company in 2008 and was promoted to current role in April 2016)
Andy P. Carlin, Sleep Number
®
setting 55, serves as the Executive Vice President and Chief Sales and Service Officer for Sleep Number and leads all sales channels, real estate and home delivery operations. From June 2012 to April 2016, Mr. Carlin was Senior Vice President and Chief Sales Officer; from May 2011 to June 2012, Mr. Carlin was the Vice President and Chief Sales Officer; and from January 2009 to May 2011 he was the Vice President of U.S. Retail Sales. Mr. Carlin joined Sleep Number in January 2008 as Regional Vice President, East Region. Prior to joining Sleep Number, Mr. Carlin spent more than 20 years in sales leadership roles for companies including Senior Vice President of Store Operations at Gander Mountain from 2003 to 2008, Kohl’s Department Stores from 1995 to 2003 and the department store division of Target Corporation from 1986 to 1995.
9
PATRICIA A. DIRKS,
61
Senior Vice President and Chief Human Resources Officer (Joined the Company in 2014)
Patricia A. Dirks (Tricia), Sleep Number
®
setting 30, serves as the Senior Vice President and Chief Human Resources Officer for Sleep Number and leads all human resources functions. Prior to joining Sleep Number in April 2014, Ms. Dirks served as Senior Vice President Organizational Effectiveness for Target Corporation. From 2004 to 2009, Ms. Dirks was Vice President Headquarters Human Resources for Target Corporation. Prior to 2004, Ms. Dirks was Senior Vice President Human Resources at Marshall Field's of Target Corporation.
MARK A. KIMBALL,
59
Senior Vice President and Chief Legal and Risk Officer and Secretary (Joined the Company in 1999)
Mark A. Kimball, Sleep Number
®
setting 55, serves as Sleep Number's Senior Vice President, Chief Legal and Risk Officer and Secretary. From August 2003 to June 2011, Mr. Kimball held the position of Senior Vice President, General Counsel, Chief Administrative Officer and Secretary. From July 2000 to August 2003, Mr. Kimball served as Senior Vice President, Human Resources and Legal, General Counsel, Chief Administrative Officer and Secretary. From May 1999 to July 2000, Mr. Kimball served as the company’s Senior Vice President, Chief Administrative Officer, General Counsel and Secretary. For more than five years prior to joining Sleep Number, Mr. Kimball was a partner in the law firm of Oppenheimer Wolff & Donnelly LLP practicing in the area of corporate finance.
SURESH KRISHNA,
49
Senior Vice President and Chief Operations, Supply Chain and Lean Officer (Joined the Company in 2016)
Suresh Krishna, Sleep Number
®
setting 40, serves as the Senior Vice President and Chief Operations, Supply Chain and Lean Officer of Sleep Number. Prior to joining Sleep Number, Mr. Krishna joined Polaris in 2010 as Vice President of Global Operations and Integration, leading a 6,500+ person operations organization and driving a culture change to embrace lean across the entire enterprise. In July 2014, he was promoted to Vice President and Business Unit Head of Europe Middle East & Africa (EMEA) for Polaris, where he was responsible for a full P&L with factories, R&D centers, subsidiaries, distributors and dealer networks across more than 60 countries. From 2007 to 2010, he served as Vice President Global Operations, Supply Chain and IT at a division of UTC Fire & Security. Krishna also served in a variety of roles for Diageo, including Vice President of Supply Chain, North America; as a Program Director for an ERP implementation; and as a Director of Strategic Planning and Finance. Earlier in his career he was an associate at Booz Allen & Hamilton.
J. HUNTER SAKLAD,
48
Senior Vice President, Chief Information Officer (Joined the Company in 2004 and was promoted to current role in December 2012)
Hunter Saklad, Sleep Number
®
setting 50, is the Senior Vice President and Chief Information Officer at Sleep Number. From June 2011 to December 2012, Mr. Saklad served as the Vice President, Consumer Insight and Strategy at Sleep Number. From March 2006 to June 2011 he was Vice President of Finance and held a variety of positions across Finance serving business partners in marketing, sales, supply chain, FP&A, investor relations and treasury. Mr. Saklad joined Sleep Number in October 2004 as Sr. Director of Finance. Prior to joining Sleep Number, Mr. Saklad held finance leadership roles at Ford Motor Company and Visteon.
10
Available Information
We are subject to the reporting requirements of the Exchange Act and its rules and regulations. The Exchange Act requires us to file reports, proxy statements and other information with the Securities and Exchange Commission (SEC). Copies of our reports, proxy statements and other information can be read and copied at:
SEC Public Reference Room
100 F Street NE
Washington, D.C. 20549
Information on the operation of the Public Reference Room may be obtained by calling the SEC at 1-800-SEC-0330. The SEC maintains a website that contains reports, proxy statements and other information regarding issuers that file electronically with the SEC. These materials may be obtained electronically by accessing the SEC’s home page at
http://www.sec.gov
.
Our corporate Internet website is
www.SleepNumber.com
. Through a link to a third-party content provider, our corporate website provides free access to our annual reports on Form 10-K, quarterly reports on Form 10-Q, current reports on Form 8-K and all amendments to those reports filed or furnished pursuant to Section 13(a) or 15(d) of the Securities Exchange Act of 1934 as soon as reasonably practicable after electronic filing with the SEC. These documents are posted on our website at
www.SleepNumber.com
— select the “
Investors
” link, the "
Financials & Filings
" link, and then the “
SEC Filings
” link. The information contained on our website or connected to our website is not incorporated by reference into this Form 10-K and should not be considered part of this report.
We also make available, free of charge on our website, the charters of the Audit Committee, Management Development and Compensation Committee, and Corporate Governance and Nominating Committee as well as our Code of Business Conduct (including any amendment to, or waiver from, a provision of our Code of Business Conduct) adopted by our Board. These documents are posted on our website — select the “
Investors
” link, the “
Governance
” link and then the "
Documents & Charters
" link.
Copies of any of the above referenced information will also be made available, free of charge, upon written request to:
Sleep Number Corporation
Investor Relations Department
1001 Third Avenue South
Minneapolis, MN 55404
11
An investment in our common stock involves a high degree of risk. You should carefully consider the specific risks set forth below and other matters described in this Annual Report on Form 10-K before making an investment decision. The risks and uncertainties described below are not the only ones facing us. Additional risks and uncertainties, including risks and uncertainties not presently known to us or that we currently see as immaterial, may also harm our business. If any of these risks occur, our business, results of operations, cash flows and financial condition could be materially and adversely affected.
Current and future economic conditions could materially
adversely affect our sales, profitability, cash flows and financial condition.
Our success depends significantly upon discretionary consumer spending, which is influenced by a number of general economic factors, including without limitation economic growth, consumer confidence, the housing market, employment and income levels, interest rates, inflation, taxation and the level of customer traffic in malls and shopping centers. Adverse trends in any of these economic factors may adversely affect our sales, profitability, cash flows and financial condition.
Our future growth and profitability depends upon the effectiveness and efficiency of our marketing programs.
We are highly dependent on the effectiveness of our marketing messages and the efficiency of our advertising expenditures in generating consumer awareness and sales of our products. We continue to evolve our marketing strategies, adjusting our messages, the amount we spend on advertising and where we spend it. We may not always be successful in developing effective messages, as the consumer and competition changes, and in achieving efficiency in our advertising expenditures.
Consumers are increasingly using digital tools as a part of their shopping experience. As a result, our future growth and profitability will depend in part on (i) the effectiveness and efficiency of our on-line experience, including without limitation advertising and search optimization programs, in generating consumer awareness and sales of our products, (ii) our ability to prevent confusion among consumers that can result from search engines that allow competitors to use or bid on our trademarks to direct consumers to competitors’ websites, (iii) our ability to prevent Internet publication of false or misleading information regarding our products or our competitors’ products; (iv) the nature and tone of consumer sentiment published on various social media sites; and (v) the stability of our website. In recent periods, competitor spending on Internet-based marketing programs has increased, including without limitation from a number of direct-to-consumer, Internet-based retailers, which has and may continue to increase the cost of basic search terms and the cost of our Internet-based marketing programs.
If our marketing messages are ineffective or our advertising expenditures and other marketing programs, including digital programs, are inefficient in creating awareness and consideration of our products and brand name, and in driving consumer traffic to our website or stores, our sales, profitability, cash flows and financial condition may be adversely impacted. In addition, if we are not effective in preventing the publication of confusing, false or misleading information regarding our brand or our products, or if there is significant negative consumer sentiment on social media regarding our brand or our products, our sales, profitability, cash flows and financial condition may be adversely impacted.
Our future growth and profitability depends on our ability to execute our Company-Controlled distribution strategy.
The vast majority of our sales occur through our Company-Controlled distribution channel, including our retail stores, and this Company-Controlled distribution channel represents our largest opportunity for growth in sales and improvement in profitability. Our retail stores carry significant fixed costs. We also make significant capital expenditures as we open new stores and remodel or reposition existing stores. We are highly dependent on our ability to maintain and increase sales per store to cover these fixed expenses, provide a return on our capital investments and improve our operating margins.
Many of our stores are mall-based. We depend on the continued popularity of malls as shopping destinations and the ability of mall anchor tenants and other attractions to generate customer traffic for our mall-based retail stores. Any decrease in mall traffic could adversely affect our sales, profitability, cash flows and financial condition.
Our Company-Controlled distribution strategy results in relatively few points of distribution, including 556 retail stores in 50 U.S. states as of the end of 2017. Several of the mattress manufacturers and retailers with which we compete have significantly more points of distribution than we do, which makes us highly dependent on our ability to drive consumers to our points of distribution to gain market share.
12
Our longer term Company-Controlled distribution strategy is also dependent on our ability to renew existing store leases and to secure suitable locations for new store openings, in each case on a cost-effective basis. We may encounter higher than anticipated rents and other costs in connection with managing our retail store base, or may be unable to find or obtain suitable new locations.
Failure to achieve and maintain a high level of product quality could negatively impact our sales, profitability, cash flows and financial condition.
Our products are highly differentiated from traditional innerspring mattresses and from viscoelastic and other foam mattresses, which have little or no technology and do not rely on electronics and air control systems. As a result, our beds may be susceptible to failures that do not exist with traditional or foam mattresses. Failure to achieve and maintain acceptable quality standards could impact consumer acceptance of our products or could result in negative media and Internet reports or owner dissatisfaction that could negatively impact our brand image and sales levels.
In addition, a decline in product quality could result in an increase in return rates and a corresponding decrease in sales, or an increase in product warranty claims in excess of our warranty reserves. An unexpected increase in return rates or warranty claims could harm our sales, profitability, cash flows and financial condition.
As a consumer innovation company with differentiated products, we face an inherent risk of exposure to product liability claims if the use of our products is alleged to have resulted in personal injury or property damage. If any of our products proves to be defective, we may be required to recall or redesign such products. We have at times experienced increased returns and adverse impacts on sales, as well as product liability litigation, as a result of media reports related to the alleged propensity of our products to develop mold. We may experience additional adverse impacts on sales and additional litigation if any similar media reports were to occur in the future. We maintain insurance against some forms of product liability claims, but such coverage may not be adequate for liabilities actually incurred. A successful claim brought against us in excess of available insurance coverage, or any claim or product recall that results in significant adverse publicity against us, may have a material adverse effect on our sales, profitability, cash flows and financial condition.
Our future growth and profitability depends in part on our ability to continue to improve and expand our product line and to successfully execute new product introductions.
As described in greater detail below, the mattress industry, as well as the market for sleep monitoring products, are both highly competitive, and our ability to compete effectively and to profitably grow our market share depends in part on our ability to continue to improve and expand our product line of adjustable firmness air beds, SleepIQ technology and related accessory products. We incur significant research and development and other expenditures in the pursuit of improvements and additions to our product line. If these efforts do not result in meaningful product improvements or new product introductions, or if we are not able to gain widespread consumer acceptance of product improvements or new product introductions, our sales, profitability, cash flows and financial condition may be adversely affected. In addition, if any significant product improvements or new product introductions are not successful, our reputation and brand image may be adversely affected.
In 2017, we began to introduce a new line of mattresses to replace our prior line of mattresses, and this new product introduction will continue in 2018 as we plan to convert the remainder of our product line. This new product launch requires significant transition costs in our supply chain and retail stores. If we are not able to gain widespread consumer acceptance of this new product line, or if we do not successfully execute the new product introduction effectively and efficiently, our sales, profitability, cash flows and financial condition may be adversely affected.
Significant competition could adversely affect our business
.
Because of the vertical integration of our business model, our products and distribution channels face significant competition from both manufacturers of different types of mattresses and a variety of retailers. Our SleepIQ technology also faces significant competition from various manufacturers and retailers of sleep tracking and monitoring products.
The mattress industry is characterized by a high degree of concentration among the largest manufacturers of innerspring mattresses and foam mattresses and one dominant national mattress retailer. Many newer competitors in the mattress industry have begun to offer “bed-in-a-box” or similar products directly to consumers through the Internet and other distribution channels.
A variety of sleep tracking and monitoring products that compete with our SleepIQ technology have been introduced by various manufacturers and retailers, both within and outside of the traditional mattress industry.
13
Some of the manufacturers that we compete with have substantially greater financial, marketing and manufacturing resources and greater brand name recognition than we do and sell products through broader and more established distribution channels. Our national, exclusive distribution competes with other retailers who generally provide a wider selection of mattress alternatives than we offer. A number of these retailers also have more points of distribution and greater brand name recognition than we do.
These manufacturing and retailing competitors, or new entrants into the market, may compete aggressively and gain market share with existing or new products, and may pursue or expand their presence in the adjustable firmness air bed segment of the market as well as in the market for sleep tracking and monitoring products. We have limited ability to anticipate the timing and scale of new product introductions, advertising campaigns or new pricing strategies by our competitors, which could inhibit our ability to retain or increase market share, or to maintain our product margins.
If we are unable to effectively compete with other manufacturers and retailers of mattress and sleep tracking and monitoring products, our sales, profitability, cash flows and financial condition may be adversely impacted.
Our intellectual property rights may not prevent others from using our technology or trademarks in connection with the sale of competitive products. We may be subject to claims that our products, processes or trademarks infringe intellectual property rights of others.
We own various U.S. and foreign patents and patent applications related to certain elements of the design and function of our beds and related products. We own numerous registered and unregistered trademarks and trademark applications, including in particular our
Sleep Number
and
SleepIQ
trademarks, as well as other intellectual property rights, including trade secrets, trade dress and copyrights, which we believe have significant value and are important to the marketing of our products. These intellectual property rights may not provide sufficient protection against infringement or piracy, may not prevent competitors from developing and marketing products that are similar to or competitive with our beds or other products, and may be costly and time-consuming to protect and enforce. Our patents are also subject to varying expiration dates. In addition, the laws of some foreign countries may not protect our intellectual property rights and confidential information to the same extent as the laws of the United States. If we are unable to protect and enforce our intellectual property, we may be unable to prevent other companies from using our technology or trademarks in connection with competitive products, which could adversely affect our sales, profitability, cash flows and financial condition.
We may be subject to claims that our products, processes or trademarks infringe the intellectual property rights of others. The defense of these claims, even if we are ultimately successful, may result in costly litigation, and if we are not successful in our defense, we could be subject to injunctions, liability for damages or royalty obligations and our sales, profitability, cash flows and financial condition could be adversely affected.
A reduction in the availability of credit to consumers generally or under our existing consumer credit programs could harm our sales, profitability, cash flows and financial condition.
A significant percentage of our sales are made under consumer credit programs through third parties. The amount of credit available to consumers may be adversely impacted by macroeconomic factors that affect the financial position of consumers and as suppliers of credit adjust their lending criteria. In addition, changes in federal regulations effective in 2010 placed additional restrictions on all consumer credit programs, including limiting the types of promotional credit offerings that may be offered to consumers.
Synchrony Bank provides credit to our customers through a private label credit card agreement that is currently scheduled to expire on December 31, 2020, subject to earlier termination upon certain events. Synchrony Bank has discretion to control the content of financing offers to our customers and to set minimum credit standards under which credit is extended to customers.
Reduction of credit availability due to changing economic conditions, changes in credit standards under our private label credit card program or changes in regulatory requirements, or the termination of our agreement with Synchrony Bank, could harm our sales, profitability, cash flows and financial condition.
We could be vulnerable to shortages in supply of components necessary to manufacture our products due to our manufacturing processes with minimal levels of inventory or due to global shortages of supply of electronic componentry, which may harm our ability to satisfy consumer demand and may adversely impact our sales and profitability.
A significant percentage of our products are assembled after we receive orders from customers utilizing manufacturing processes with minimal levels of raw materials, work-in-process inventories and finished goods inventories. Lead times for ordered components may vary significantly, and some components used to manufacture our products are provided on a sole source basis. In addition, with the increasing prevalence of and consumer demand for electronic products, the global supply of electronic componentry is increasingly
14
strained, which may lead to shortages in supply and increased prices. Any unexpected shortage of materials caused by any disruption or unavailability of supply or an unexpected increase in the demand for our products, could lead to delays in shipping our beds to customers and increased costs. Any such delays could adversely affect our sales, customer satisfaction, profitability, cash flows and financial condition.
We rely upon several key suppliers that are, in some instances, the only source of supply currently used by us for particular materials, components or services. A disruption in the supply or substantial increase in cost of any of these products or services could harm our sales, profitability, cash flows and financial condition.
We currently obtain all of the materials and components used to produce our beds from outside sources including some who are located outside the United States. In several cases, including our proprietary air chambers, our proprietary blow-molded foundations, our adjustable foundations, various components for our Firmness Control systems, certain foam formulations, as well as fabrics and zippers, we have chosen to obtain these materials and components from suppliers who serve as the only source of supply, or who supply the vast majority of our needs of the particular material or component. While we believe that these materials and components, or suitable replacements, could be obtained from other sources, in the event of a disruption or loss of supply of relevant materials or components for any reason, we may not be able to find alternative sources of supply, or if found, may not be found on comparable terms. If our relationship with the primary supplier of our air chambers or the supplier of our adjustable foundations is terminated, we could have difficulty in replacing these sources since there are relatively few other suppliers presently capable of manufacturing these components.
Similarly, we rely on UPS and other carriers to deliver some of our products to customers on a timely and cost-effective basis. Any significant delay in deliveries to our customers could lead to increased returns and cause us to lose sales. Any increase in freight charges could increase our costs of doing business and harm our sales, profitability, cash flows and financial condition.
Fluctuations in commodity prices could result in an increase in component costs and/or delivery costs.
Our business is subject to significant increases or volatility in the prices of certain commodities, including but not limited to electronic componentry, fuel, oil, natural gas, rubber, cotton, plastic resin, steel and chemical ingredients used to produce foam. Increases in prices of these commodities or other inflationary pressures may result in significant cost increases for our raw materials and product components, as well as increases in the cost of delivering our products to our customers. To the extent we are unable to offset any such increased costs through value engineering and similar initiatives, or through price increases, our profitability, cash flows and financial condition may be adversely impacted. If we choose to increase prices to offset the increased costs, our sales volumes could be adversely impacted.
Our business is subject to risks inherent in global sourcing activities.
Our air chambers and some of our other components are manufactured outside the United States, and therefore are subject to risks associated with foreign sourcing of materials, including but not limited to:
|
•
|
Political instability resulting in disruption of trade;
|
|
•
|
Existing or potential duties, tariffs or quotas on certain types of goods that may be imported into the United States;
|
|
•
|
Disruptions in transportation due to acts of terrorism, shipping delays, foreign or domestic dock strikes, customs inspections or other factors;
|
|
•
|
Foreign currency fluctuations; and
|
|
•
|
Economic uncertainties, including inflation.
|
These factors could increase our costs of doing business with foreign suppliers, lead to inadequate inventory levels or delays in shipping beds to our customers, which could harm our sales, customer satisfaction, profitability, cash flows and financial condition.
Disruption of operations in either of our two main manufacturing facilities could increase our costs of doing business or lead to delays in shipping our beds.
We have two main manufacturing plants, which are located in Irmo, South Carolina and Salt Lake City, Utah. A significant percentage of our products are assembled to fulfill orders rather than stocking finished goods inventory in our plants or stores. Therefore, the disruption of operations of either of our two main manufacturing facilities for a significant period of time may increase our costs of doing business and lead to delays in shipping our beds to customers. Such delays could adversely affect our sales, customer satisfaction, profitability, cash flows and financial condition.
15
Our business is subject to a wide variety of government laws and regulations. These laws and regulations, as well as any new or changed laws or regulations, could disrupt our operations or increase our compliance costs. Failure to comply with such laws and regulations could have further adverse impact.
We are subject to a wide variety of laws and regulations relating to the bedding industry or to various aspects of our business. Laws and regulations at the federal, state and local levels frequently change and we cannot always reasonably predict the impact from, or the ultimate cost of compliance with, future regulatory or administrative changes. Changes in law, the imposition of new or additional regulations or the enactment of any new or more stringent legislation that impacts employment and labor, trade, advertising and marketing practices, pricing, consumer credit offerings, product testing and safety, transportation and logistics, health care, tax, accounting, privacy and data security, health and safety or environmental issues, among others, could require us to change the way we do business and could have a material adverse impact on our sales, profitability, cash flows and financial condition. New or different laws or regulations could increase direct compliance costs for us or may cause our vendors to raise the prices they charge us because of increased compliance costs. Further, the adoption of a multi-layered regulatory approach to any one of the state or federal laws or regulations to which we are currently subject, particularly where the layers are in conflict, could require alteration of our manufacturing processes or operational parameters which may adversely impact our business.
Legislative or regulatory changes that impact our relationship with our workforce, such as minimum wage requirements or health insurance or other employee benefits mandates, could increase our expenses and adversely affect our operations. While it is our policy and practice to comply with legal and regulatory requirements and our procedures and internal controls are designed to promote such compliance, we cannot assure that all of our operations will comply with all such legal and regulatory requirements. Further, laws and regulations change over time and we may be required to incur significant expenses and/or to modify our operations in order to ensure compliance. This could harm our profitability or financial condition. If we are found to be in violation of any laws or regulations, we could become subject to fines, penalties, damages or other sanctions as well as potential adverse publicity or litigation exposure. This could adversely impact our business, reputation, sales, profitability, cash flows or financial condition.
Regulatory requirements related to flammability standards for mattresses may increase our product costs and increase the risk of disruption to our business.
The federal Consumer Product Safety Commission adopted new flammability standards and related regulations which became effective nationwide in July 2007 for mattresses and mattress and foundation sets. Compliance with these requirements has resulted in higher materials and manufacturing costs for our products, and has required modifications to our information systems and business operations, further increasing our costs and negatively impacting our capacity.
These regulations require manufacturers to implement quality assurance programs and encourage manufacturers to conduct random testing of products. These regulations also require maintenance and retention of compliance documentation. These quality assurance and documentation requirements are costly to implement and maintain. If any product testing, other evidence, or regulatory inspections yield results indicating that any of our products may not meet the flammability standards, we may be required to temporarily cease production and distribution and/or to recall products from the field, and we may be subject to fines or penalties, any of which outcomes could harm our business, reputation, sales, profitability, cash flows and financial condition.
Pending or unforeseen litigation and the potential for adverse publicity associated with litigation could adversely impact our business, reputation, financial results or financial condition.
We are involved from time to time in various legal proceedings arising in the ordinary course of our business, including primarily commercial, product liability, employment and intellectual property claims. We currently do not expect the outcome of any pending matters to have a material effect on our consolidated results of operations, financial position or cash flows. Litigation, however, is inherently unpredictable, and it is possible that the ultimate outcome of one or more pending claims asserted against us, or claims that may be asserted in the future that we are currently not aware of, or adverse publicity resulting from any such litigation, could adversely impact our business, reputation, sales, profitability, cash flows and financial condition.
Any improvements or upgrades to our management information systems that may be required to meet the evolving needs of our business as well as existing and emerging regulatory requirements may be costly to implement and may take longer or require greater resources than anticipated, and may result in disruptions to our systems or business.
We depend on our management information systems for many aspects of our business. In the fourth quarter of 2015, we implemented a new ERP system and continue to implement operational improvements under this new system. If our new systems are disrupted in any material way, or improvements or upgrades are required to meet the evolving needs of our business and existing and emerging regulatory requirements, we may be required to incur significant capital expenditures in the pursuit of improvements or upgrades to
16
our management information systems. These efforts may take longer and may require greater financial and other resources than anticipated, may cause distraction of key personnel, and may cause short-term disruptions to our existing systems and our business. Any of these outcomes could impair our ability to achieve critical strategic initiatives and could adversely impact our sales, profitability, cash flows and financial condition.
Our information systems may be subject to attacks by hackers or other cyber threats that could compromise the security of our systems, which could substantially disrupt our business and could result in the breach of consumers' or employees' private data.
Our information systems contain personal information related to our customers and employees in the ordinary course of our business, such as credit card and demographic information of our customers, SleepIQ data from our customer base and social security numbers and demographic information of our employees. While we maintain security measures to protect this information, a breach of these security measures, such as through third-party action, employee error, malfeasance or otherwise, could compromise the security of our customers’ and employees’ personal information. As the techniques used to breach such security measures change frequently and may not be recognized until launched against a target, we may be unable to anticipate these techniques or to implement adequate preventive measures. Any failure of our systems and processes to adequately protect customer or employee personal information from theft or loss could adversely impact our business, reputation, sales, profitability, cash flows and financial condition.
Our future growth and profitability depends in part upon our ability to attract, retain and motivate qualified personnel.
As a vertically integrated manufacturer and retailer, our future growth and profitability will depend in part upon our ability to attract, retain and motivate qualified personnel in a wide variety of areas to execute our growth strategy, including qualified management and executive personnel and qualified retail sales professionals and managers. The failure to attract, retain and motivate qualified personnel may hinder our ability to execute our business strategy and growth initiatives and may adversely impact our sales, profitability, cash flows and financial condition.
None.
17
ITEM 2.
PROPERTIES
Retail Locations
We currently lease all of our existing retail store locations and expect that our policy of leasing stores, rather than owning stores, will continue. We lease our retail stores under operating leases which, in addition to the minimum lease payments, may require payment of a proportionate share of the real estate taxes and certain building operating expenses. Our retail store leases generally provide for an initial lease term of five to 10 years. In addition, our mall-based retail store leases may require payment of contingent rent based on net sales in excess of certain thresholds. Certain retail store leases may contain options to extend the term of the original lease.
The following table summarizes the geographic locations of our
556
retail stores as of
December 30, 2017
:
|
|
Retail
Stores
|
|
|
Retail
Stores
|
|
|
Retail
Stores
|
|
|||||
|
Alabama
|
8
|
|
Louisiana
|
8
|
|
Ohio
|
19
|
|
|||||
|
Alaska
|
1
|
|
Maine
|
2
|
|
Oklahoma
|
4
|
|
|||||
|
Arizona
|
10
|
|
Maryland
|
13
|
|
Oregon
|
6
|
|
|||||
|
Arkansas
|
4
|
|
Massachusetts
|
11
|
|
Pennsylvania
|
20
|
|
|||||
|
California
|
67
|
|
Michigan
|
18
|
|
Rhode Island
|
1
|
|
|||||
|
Colorado
|
14
|
|
Minnesota
|
15
|
|
South Carolina
|
8
|
|
|||||
|
Connecticut
|
6
|
|
Mississippi
|
5
|
|
South Dakota
|
2
|
|
|||||
|
Delaware
|
2
|
|
Missouri
|
13
|
|
Tennessee
|
11
|
|
|||||
|
Florida
|
39
|
|
Montana
|
4
|
|
Texas
|
51
|
|
|||||
|
Georgia
|
20
|
|
Nebraska
|
3
|
|
Utah
|
6
|
|
|||||
|
Hawaii
|
1
|
|
Nevada
|
5
|
|
Vermont
|
1
|
|
|||||
|
Idaho
|
3
|
|
New Hampshire
|
4
|
|
Virginia
|
17
|
|
|||||
|
Illinois
|
21
|
|
New Jersey
|
14
|
|
Washington
|
13
|
|
|||||
|
Indiana
|
10
|
|
New Mexico
|
3
|
|
West Virginia
|
2
|
|
|||||
|
Iowa
|
8
|
|
New York
|
17
|
|
Wisconsin
|
11
|
|
|||||
|
Kansas
|
7
|
|
North Carolina
|
15
|
|
Wyoming
|
1
|
|
|||||
|
Kentucky
|
8
|
|
North Dakota
|
4
|
|
Total
|
556
|
|
|||||
Manufacturing, Distribution and Headquarters
We lease our 238,000 square-foot corporate headquarters in Minneapolis, Minnesota. The lease term commenced in November 2017 and runs through October 2032. The lease includes three five-year renewal options.
We lease two manufacturing and distribution centers in Irmo, South Carolina and Salt Lake City, Utah of approximately 151,000 square feet and approximately 101,000 square feet, respectively. The Irmo facility lease runs through June 2026, with two five-year renewal options. The Salt Lake City facility lease runs through July 2020, with two five-year renewal options. We also lease one storage facility in Salt Lake City of approximately 57,000 square feet through April 2020, and a second storage facility in Salt Lake City of approximately 80,000 square feet through November 2019.
We lease a bedding collection and fulfillment center in Brooklyn Park, Minnesota consisting of approximately 60,000 square feet. This lease runs through July 2020, with two three-year renewal options.
We lease a call center in Jefferson, Louisiana consisting of approximately 28,000 square feet. This lease runs through August 2022, with two three-year renewal options.
We lease one facility for our SleepIQ LABS operations in San Jose, California of approximately 13,000 square feet which runs through August 2018 and contains one three-year renewal option.
We lease approximately 900 square feet of office space in Portland, Oregon, which runs through September 2019.
18
We are involved from time to time in various legal proceedings arising in the ordinary course of our business, including primarily commercial, product liability, employment and intellectual property claims. In accordance with generally accepted accounting principles in the United States, we record a liability in our consolidated financial statements with respect to any of these matters when it is both probable that a liability has been incurred and the amount of the liability can be reasonably estimated. With respect to currently pending legal proceedings, we have not established an estimated range of reasonably possible additional losses either because we believe that we have valid defenses to claims asserted against us or the proceeding has not advanced to a stage of discovery that would enable us to establish an estimate. We currently do not expect the outcome of these matters to have a material effect on our consolidated results of operations, financial position or cash flows. Litigation, however, is inherently unpredictable, and it is possible that the ultimate outcome of one or more claims asserted against us could adversely impact our consolidated results of operations, financial position or cash flows. We expense legal costs as incurred.
On January 12, 2015, Plaintiffs David and Katina Spade commenced a purported class action lawsuit in New Jersey state court against Sleep Number alleging that Sleep Number violated New Jersey consumer statutes by failing to provide to purchasing consumers certain disclosures required by the New Jersey Furniture Regulations. It is undisputed that plaintiffs suffered no actual damages or in any way relied upon or were impacted by the alleged omissions. Nonetheless, on behalf of a purported class of New Jersey purchasers of Sleep Number beds and bases, plaintiffs seek to recover a $100 statutory fine for each alleged omission, along with attorneys’ fees and costs. Sleep Number removed the case to the United States District Court for the District of New Jersey, which subsequently granted Sleep Number’s motion to dismiss. Plaintiffs appealed to the United States Court of Appeals for the Third Circuit, which has certified two questions of law to the New Jersey Supreme Court relating to whether plaintiffs who have suffered no actual injury may bring claims. The New Jersey Supreme Court has accepted the certified questions and oral arguments were heard in November 2017. As the United States District Court for the District of New Jersey determined, we believe that the case is without merit and the order of dismissal should be affirmed.
Not applicable.
19
Our common stock trades on The NASDAQ Stock Market LLC (NASDAQ Global Select Market) under the symbol “SNBR.” As of
January 26, 2018
, there were approximately
220
holders of record of our common stock. The following table sets forth the quarterly high and low sales prices per share of our common stock, at closing, as reported by NASDAQ for the two most recent fiscal years.
|
|
First
Quarter
|
Second
Quarter
|
Third
Quarter
|
Fourth
Quarter
|
||||||||||||
|
Fiscal 2017
|
|
|
|
|
||||||||||||
|
High
|
$
|
24.79
|
|
$
|
35.60
|
|
$
|
34.97
|
|
$
|
38.00
|
|
||||
|
Low
|
19.53
|
|
24.49
|
|
28.49
|
|
29.84
|
|
||||||||
|
Fiscal 2016
|
|
|
|
|
|
|
|
|
||||||||
|
High
|
$
|
21.24
|
|
$
|
24.68
|
|
$
|
27.68
|
|
$
|
24.33
|
|
||||
|
Low
|
15.58
|
|
19.17
|
|
21.31
|
|
18.55
|
|
||||||||
We are not restricted from paying cash dividends under our credit agreement so long as we are not in default under the credit agreement and so long as the payment of such dividends would not create an event of default. However, we have not historically paid, and have no current plans to pay, cash dividends on our common stock.
Information concerning share repurchases completed during the fourth quarter of
fiscal 2017
is set forth below:
|
Fiscal Period
|
Total
Number of Shares
Purchased
(1)(2)
|
Average
Price Paid
per Share
|
Total Number
of Shares
Purchased as
|
Approximate
Dollar Value
of Shares that
May Yet Be
Purchased
Under the
Plans or
Programs
(3)
|
||||||||||
|
October 1, 2017 through October 28, 2017
|
241,934
|
|
$
|
32.21
|
|
240,530
|
|
$
|
492,252,000
|
|
||||
|
October 29, 2017 through November 25, 2017
|
349,171
|
|
32.18
|
|
348,429
|
|
481,041,000
|
|
||||||
|
November 26, 2017 through December 30, 2017
|
432,649
|
|
37.12
|
|
432,173
|
|
465,000,000
|
|
||||||
|
Total
|
1,023,754
|
|
$
|
34.27
|
|
1,021,132
|
|
$
|
465,000,000
|
|
||||
___________________
|
(1)
|
Under our Board-approved
$500 million
share repurchase program, we repurchased
1,021,132
shares of our common stock at a cost of
$35 million
(based on trade dates) during the three months ended
December 30, 2017
.
|
|
(2)
|
In connection with the vesting of employee restricted stock grants, we also repurchased
2,622
shares of our common stock at a cost of
$87,000
during the three months ended
December 30, 2017
.
|
|
(3)
|
There is no expiration date governing the period over which we can repurchase shares under our Board-approved share repurchase program. Any repurchased shares are constructively retired and returned to an unissued status.
|
20
Comparative Stock Performance
The graph below compares the total cumulative shareholder return on our common stock over the last five years to the total cumulative return on the Standard and Poor’s (S&P) 400 Specialty Stores Index and The NASDAQ Stock Market (U.S.) Index assuming a $100 investment made on
December 29, 2012
. Each of the three measures of cumulative total return assumes reinvestment of dividends. The stock performance shown on the graph below is not necessarily indicative of future price performance. The information contained in this “Comparative Stock Performance” section shall not be deemed to be “soliciting material” or “filed” or incorporated by reference in future filings with the SEC, or subject to the liabilities of Section 18 of the Securities Exchange Act of 1934, as amended, except to the extent that we specifically request that it be treated as soliciting material or incorporate it by reference into a document filed under the Securities Act of 1933, as amended, or the Securities Exchange Act of 1934, as amended.
COMPARISON OF FIVE-YEAR CUMULATIVE TOTAL RETURN
AMONG SLEEP NUMBER CORPORATION, S&P 400 SPECIALTY STORES INDEX,
AND THE NASDAQ STOCK MARKET (U.S.) INDEX
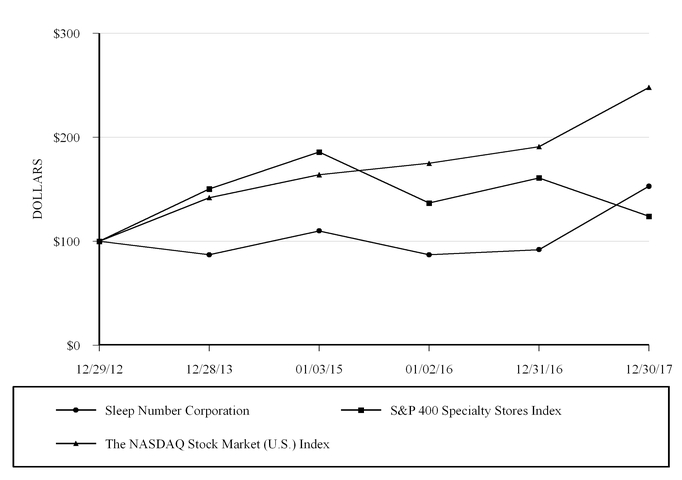
|
|
12/29/2012
|
12/28/2013
|
1/3/2015
|
1/2/2016
|
12/31/2016
|
12/30/2017
|
||||||||||||||||||
|
Sleep Number Corporation
|
$
|
100
|
|
$
|
87
|
|
$
|
110
|
|
$
|
87
|
|
$
|
92
|
|
$
|
153
|
|
||||||
|
S&P 400 Specialty Stores Index
|
100
|
|
150
|
|
186
|
|
137
|
|
161
|
|
124
|
|
||||||||||||
|
The NASDAQ Stock Market (U.S.) Index
|
100
|
|
142
|
|
164
|
|
175
|
|
191
|
|
248
|
|
||||||||||||
21
(in thousands, except per share and selected operating data, unless otherwise indicated)
The Consolidated Statements of Operations Data and Consolidated Balance Sheet Data presented below have been derived from our Consolidated Financial Statements and should be read in conjunction with “Management’s Discussion and Analysis of Financial Condition and Results of Operations” and our Consolidated Financial Statements and Notes thereto included in this Annual Report on Form 10-K.
|
|
Year
|
||||||||||||||||||
|
|
2017
|
2016
|
2015
|
2014
(1)
|
2013
|
||||||||||||||
|
Consolidated Statements of Operations Data:
|
|
|
|
|
|||||||||||||||
|
Net sales
|
$
|
1,444,497
|
|
$
|
1,311,291
|
|
$
|
1,213,699
|
|
$
|
1,156,757
|
|
$
|
960,171
|
|
||||
|
Gross profit
|
897,347
|
|
810,160
|
|
740,751
|
|
706,850
|
|
601,755
|
|
|||||||||
|
Operating expenses:
|
|||||||||||||||||||
|
Sales and marketing
|
650,357
|
|
595,845
|
|
550,475
|
|
512,007
|
|
439,156
|
|
|||||||||
|
General and administrative
|
127,269
|
|
109,674
|
|
99,209
|
|
84,864
|
|
62,433
|
|
|||||||||
|
Research and development
|
27,806
|
|
27,991
|
|
15,971
|
|
8,233
|
|
9,478
|
|
|||||||||
|
Operating income
|
91,915
|
|
76,650
|
|
75,096
|
|
101,746
|
|
90,688
|
|
|||||||||
|
Net income
|
$
|
65,077
|
|
$
|
51,417
|
|
$
|
50,519
|
|
$
|
67,974
|
|
$
|
60,081
|
|
||||
|
Net income per share:
|
|||||||||||||||||||
|
Basic
|
$
|
1.58
|
|
$
|
1.11
|
|
$
|
0.99
|
|
$
|
1.27
|
|
$
|
1.10
|
|
||||
|
Diluted
|
$
|
1.55
|
|
$
|
1.10
|
|
$
|
0.97
|
|
$
|
1.25
|
|
$
|
1.08
|
|
||||
|
Shares used in calculation of net income per share:
|
|||||||||||||||||||
|
Basic
|
41,212
|
|
46,154
|
|
51,252
|
|
53,452
|
|
54,866
|
|
|||||||||
|
Diluted
|
42,085
|
|
46,902
|
|
52,101
|
|
54,193
|
|
55,803
|
|
|||||||||
|
Consolidated Balance Sheet Data:
|
|||||||||||||||||||
|
Cash, cash equivalents and marketable debt securities
|
$
|
3,651
|
|
$
|
11,609
|
|
$
|
36,114
|
|
$
|
166,045
|
|
$
|
145,014
|
|
||||
|
Total assets
|
471,834
|
|
457,166
|
|
500,897
|
|
474,187
|
|
381,765
|
|
|||||||||
|
Total shareholders’ equity
|
89,156
|
|
160,320
|
|
222,339
|
|
256,907
|
|
225,220
|
|
|||||||||
|
Selected Operating Data:
|
|||||||||||||||||||
|
Stores open at period-end
|
556
|
|
540
|
|
488
|
|
463
|
|
440
|
|
|||||||||
|
Stores opened during period
|
36
|
|
72
|
|
38
|
|
57
|
|
71
|
|
|||||||||
|
Stores closed during period
|
20
|
|
20
|
|
13
|
|
34
|
|
41
|
|
|||||||||
|
Average revenue per store (000’s)
(2)
|
$
|
2,420
|
|
$
|
2,364
|
|
$
|
2,377
|
|
$
|
2,327
|
|
$
|
2,093
|
|
||||
|
Percentage of stores with more than $1.0 million in net sales
(2)
|
98
|
%
|
98
|
%
|
99
|
%
|
98
|
%
|
96
|
%
|
|||||||||
|
Percentage of stores with more than $2.0 million in net sales
(2)
|
61
|
%
|
61
|
%
|
62
|
%
|
59
|
%
|
46
|
%
|
|||||||||
|
Average revenue per mattress unit - Company-Controlled channel
(3)
|
$
|
4,283
|
|
$
|
4,046
|
|
$
|
4,028
|
|
$
|
3,671
|
|
$
|
3,245
|
|
||||
|
Company-Controlled comparable-sales increase (decrease)
(4)
|
4
|
%
|
1
|
%
|
3
|
%
|
12
|
%
|
(4
|
)%
|
|||||||||
|
Total retail square footage (at period-end) (000's)
|
1,489
|
|
1,399
|
|
1,214
|
|
1,106
|
|
949
|
|
|||||||||
|
Average square footage per store open during period
(2)
|
2,647
|
|
2,538
|
|
2,445
|
|
2,302
|
|
1,985
|
|
|||||||||
|
Net sales per square foot
(2)
|
$
|
920
|
|
$
|
937
|
|
$
|
980
|
|
$
|
1,025
|
|
$
|
1,077
|
|
||||
|
Average store age (in months at period-end)
|
97
|
|
93
|
|
99
|
|
97
|
|
102
|
|
|||||||||
|
Earnings before interest, depreciation and amortization (Adjusted EBITDA)
(5)
|
$
|
169,097
|
|
$
|
145,689
|
|
$
|
133,057
|
|
$
|
148,223
|
|
$
|
125,020
|
|
||||
|
Free cash flows
(5)
|
$
|
112,778
|
|
$
|
93,793
|
|
$
|
22,356
|
|
$
|
67,874
|
|
$
|
11,294
|
|
||||
|
Return on invested capital (ROIC)
(5)
|
14.3
|
%
|
12.2
|
%
|
11.2
|
%
|
15.1
|
%
|
15.1
|
%
|
|||||||||
___________________
|
(1)
|
Fiscal year 2014 had 53 weeks. All other fiscal years presented had 52 weeks.
|
|
(2)
|
For stores open during the entire period indicated.
|
|
(3)
|
Represents Company-Controlled channel total net sales divided by Company-Controlled channel mattress units.
|
|
(4)
|
Stores are included in the comparable sales calculation in the 13th full month of operation. Stores that have been remodeled or repositioned within the same shopping center remain in the comparable-store base. The number of comparable stores used to calculate such data was
512
,
459
,
442
,
396
and
359
for
2017
,
2016
,
2015
,
2014
and
2013
, respectively. Fiscal 2014 included 53 weeks, as compared to 52 weeks for the other periods presented. Comparable sales have been adjusted and reported as if all years had the same number of weeks.
|
|
(5)
|
These non-GAAP measures are not in accordance with, or preferable to, GAAP financial data. However, we are providing this information as we believe it facilitates annual and year-over-year comparisons for investors and financial analysts. See pages 23 and 24 for the reconciliation of these non-GAAP measures to the appropriate GAAP measures.
|
22
Non-GAAP Data Reconciliations
Earnings before Interest, Taxes, Depreciation and Amortization (Adjusted EBITDA)
(in thousands)
We define earnings before interest, taxes, depreciation and amortization (Adjusted EBITDA) as net income plus: income tax expense, interest expense, depreciation and amortization, stock-based compensation and asset impairments. Management believes Adjusted EBITDA is a useful indicator of our financial performance and our ability to generate cash from operating activities. Our definition of Adjusted EBITDA may not be comparable to similarly titled definitions used by other companies. The table below reconciles Adjusted EBITDA, which is a non-GAAP financial measure, to the comparable GAAP financial measure:
|
|
Year
|
|||||||||||||||||||
|
|
2017
|
2016
|
2015
|
2014
|
2013
|
|||||||||||||||
|
Net income
|
$
|
65,077
|
|
$
|
51,417
|
|
$
|
50,519
|
|
$
|
67,974
|
|
$
|
60,081
|
|
|||||
|
Income tax expense
|
25,961
|
|
24,516
|
|
24,911
|
|
34,134
|
|
30,930
|
|
||||||||||
|
Interest expense
|
975
|
|
811
|
|
160
|
|
53
|
|
51
|
|
||||||||||
|
Depreciation and amortization
|
61,077
|
|
56,910
|
|
46,916
|
|
38,767
|
|
29,599
|
|
||||||||||
|
Stock-based compensation
|
15,763
|
|
11,961
|
|
10,290
|
|
6,798
|
|
4,232
|
|
||||||||||
|
Asset impairments
|
244
|
|
74
|
|
261
|
|
497
|
|
127
|
|
||||||||||
|
Adjusted EBITDA
|
$
|
169,097
|
|
$
|
145,689
|
|
$
|
133,057
|
|
$
|
148,223
|
|
$
|
125,020
|
|
|||||
Free Cash Flow
(in thousands)
Our “free cash flow” data is considered a non-GAAP financial measure and is not in accordance with, or preferable to, “net cash provided by operations,” or GAAP financial data. However, we are providing this information as we believe it facilitates analysis for investors and financial analysts.
|
|
Year
|
|||||||||||||||||||
|
|
2017
|
2016
|
2015
|
2014
|
2013
|
|||||||||||||||
|
Net cash provided by operating activities
|
$
|
172,607
|
|
$
|
151,645
|
|
$
|
107,942
|
|
$
|
144,468
|
|
$
|
88,105
|
|
|||||
|
Less: Purchases of property and equipment
|
(59,829
|
)
|
(57,852
|
)
|
(85,586
|
)
|
(76,594
|
)
|
(76,811
|
)
|
||||||||||
|
Free cash flow
|
$
|
112,778
|
|
$
|
93,793
|
|
$
|
22,356
|
|
$
|
67,874
|
|
$
|
11,294
|
|
|||||
23
Non-GAAP Data Reconciliations (continued)
Return on Invested Capital (ROIC)
(in thousands)
ROIC is a financial measure we use to determine how efficiently we deploy our capital. It quantifies the return we earn on our invested capital. Management believes ROIC is also a useful metric for investors and financial analysts. We compute ROIC as outlined below. Our definition and calculation of ROIC may not be comparable to similarly titled definitions and calculations used by other companies. The tables below reconcile net operating profit after taxes (NOPAT) and total invested capital, which are non-GAAP financial measures, to the comparable GAAP financial measures:
|
|
Year
|
|||||||||||||||||||
|
|
2017
|
2016
|
2015
|
2014
|
2013
|
|||||||||||||||
|
Net operating profit after taxes (NOPAT)
|
||||||||||||||||||||
|
Operating income
|
$
|
91,915
|
|
$
|
76,650
|
|
$
|
75,096
|
|
$
|
101,746
|
|
$
|
90,688
|
|
|||||
|
Add: Rent expense
(1)
|
74,019
|
|
67,416
|
|
62,369
|
|
57,605
|
|
50,289
|
|
||||||||||
|
Add: Interest income
|
97
|
|
94
|
|
494
|
|
415
|
|
375
|
|
||||||||||
|
Less: Depreciation on capitalized operating leases
(2)
|
(18,865
|
)
|
(17,185
|
)
|
(16,203
|
)
|
(14,265
|
)
|
(13,095
|
)
|
||||||||||
|
Less: Income taxes
(3)
|
(48,970
|
)
|
(41,933
|
)
|
(40,384
|
)
|
(48,900
|
)
|
(43,827
|
)
|
||||||||||
|
NOPAT
|
$
|
98,196
|
|
$
|
85,042
|
|
$
|
81,372
|
|
$
|
96,601
|
|
$
|
84,430
|
|
|||||
|
Average invested capital
|
||||||||||||||||||||
|
Total equity
|
$
|
89,156
|
|
$
|
160,320
|
|
$
|
222,339
|
|
$
|
256,907
|
|
$
|
225,220
|
|
|||||
|
Less: Cash greater than target
(4)
|
—
|
|
—
|
|
—
|
|
(37,319
|
)
|
(29,622
|
)
|
||||||||||
|
Add: Long-term debt
(5)
|
—
|
|
—
|
|
—
|
|
—
|
|
2
|
|
||||||||||
|
Add: Capitalized operating lease obligations
(6)
|
592,152
|
|
539,328
|
|
498,952
|
|
460,840
|
|
402,312
|
|
||||||||||
|
Total invested capital at end of period
|
$
|
681,308
|
|
$
|
699,648
|
|
$
|
721,291
|
|
$
|
680,428
|
|
$
|
597,912
|
|
|||||
|
Average invested capital
(7)
|
$
|
686,436
|
|
$
|
699,576
|
|
$
|
726,756
|
|
$
|
639,118
|
|
$
|
560,133
|
|
|||||
|
Return on invested capital (ROIC)
(8)
|
14.3
|
%
|
12.2
|
%
|
11.2
|
%
|
15.1
|
%
|
15.1
|
%
|
||||||||||
___________________
(1)
Rent expense is added back to operating income to show the impact of owning versus leasing the related assets.
(2)
Depreciation is based on the average of the last five fiscal quarters' ending capitalized operating lease obligations (see note 6) for the respective reporting periods with an assumed thirty-year useful life. This is subtracted from operating income to illustrate the impact of owning versus leasing the related assets.
(3)
Reflects annual effective income tax rates, before discrete adjustments, of
33.3%
,
33.0%
,
33.2%
,
33.6%
and
34.2%
for
2017
,
2016
,
2015
,
2014
and
2013
, respectively.
(4)
Cash greater than target is defined as cash, cash equivalents and marketable debt securities less customer prepayments in excess of $100 million.
(5)
Long-term debt includes capital lease obligations, if applicable.
(6)
A multiple of eight times annual rent expense is used as an estimate for capitalizing our operating lease obligations. The methodology utilized aligns with the methodology of a nationally recognized credit rating agency.
(7)
Average invested capital represents the average of the last five fiscal quarters' ending invested capital balances.
(8)
ROIC equals NOPAT divided by average invested capital.
Note - Our ROIC calculation and data are considered non-GAAP financial measures and are not in accordance with, or preferable to, GAAP financial data. However, we are providing this information as we believe it facilitates analysis of the Company's financial performance by investors and financial analysts.
GAAP - generally accepted accounting principles in the U.S.
24
Forward-Looking Statements
The discussion in this Annual Report contains certain forward-looking statements that relate to future plans, events, financial results or performance. You can identify forward-looking statements by those that are not historical in nature, particularly those that use terminology such as “may,” “will,” “should,” “could,” “expect,” “anticipate,” “believe,” “estimate,” “plan,” “project,” “predict,” “intend,” “potential,” “continue” or the negative of these or similar terms. These statements are subject to certain risks and uncertainties that could cause actual results to differ materially from our historical experience and our present expectations or projections. These risks and uncertainties include, among others:
|
•
|
Current and future general and industry economic trends and consumer confidence;
|
|
•
|
The effectiveness of our marketing messages;
|
|
•
|
The efficiency of our advertising and promotional efforts;
|
|
•
|
Our ability to execute our Company-Controlled distribution strategy;
|
|
•
|
Our ability to achieve and maintain acceptable levels of product and service quality, and acceptable product return and warranty claims rates;
|
|
•
|
Our ability to continue to improve and expand our product line, and consumer acceptance of our products, product quality, innovation and brand image;
|
|
•
|
Industry competition, the emergence of additional competitive products and the adequacy of our intellectual property rights to protect our products and brand from competitive or infringing activities;
|
|
•
|
The potential for claims that our products, processes or trademarks infringe the intellectual property rights of others;
|
|
•
|
Availability of attractive and cost-effective consumer credit options;
|
|
•
|
Our manufacturing processes with minimal levels of inventory, which may leave us vulnerable to shortages in supply;
|
|
•
|
Our dependence on significant suppliers and our ability to maintain relationships with key suppliers, including several sole-source suppliers;
|
|
•
|
Rising commodity costs and other inflationary pressures;
|
|
•
|
Risks inherent in global sourcing activities, including the potential for shortages in supply;
|
|
•
|
Risks of disruption in the operation of either of our two main manufacturing facilities;
|
|
•
|
Increasing government regulation;
|
|
•
|
Pending or unforeseen litigation and the potential for adverse publicity associated with litigation;
|
|
•
|
The adequacy of our management information systems to meet the evolving needs of our business and existing and evolving risks and regulatory standards applicable to data privacy and security;
|
|
•
|
The costs and potential disruptions to our business related to upgrading our management information systems;
|
|
•
|
The vulnerability of our management information systems to attacks by hackers or other cyber threats that could compromise the security of our systems or disrupt our business;
|
|
•
|
Our ability to attract, retain and motivate qualified management, executive and other key employees, including qualified retail sales professionals and managers.
|
Additional information concerning these and other risks and uncertainties is contained under the caption "Risk Factors" in this Annual Report on Form 10-K.
Management’s Discussion and Analysis of Financial Condition and Results of Operations (MD&A) is intended to provide a reader of our consolidated financial statements with a narrative from the perspective of management on our financial condition, results of operations, liquidity and certain other factors that may affect our future results. Our MD&A is presented in six sections:
|
•
|
Overview
|
|
•
|
Results of Operations
|
|
•
|
Liquidity and Capital Resources
|
|
•
|
Off-Balance-Sheet Arrangements and Contractual Obligations
|
|
•
|
Critical Accounting Policies and Estimates
|
|
•
|
Recent Accounting Pronouncements
|
25
Overview
Business Overview
Our mission is to improve lives by individualizing sleep experiences. Our vision is to become one of the world's most beloved brands by delivering an unparalleled sleep experience. We plan to achieve this by strengthening our three significant competitive advantages: proprietary sleep innovations, lifelong customer relationships and exclusive retail distribution.
We have a vertically integrated business model and are the exclusive designer, manufacturer, marketer, retailer and servicer of Sleep Number beds. We offer consumers high-quality, individualized sleep solutions and services, including a complete line of Sleep Number beds, bases and bedding accessories. We are the pioneer in biometric sleep tracking and adjustability. Only the Sleep Number bed offers SleepIQ technology - a proprietary sensor technology that tracks each individual’s sleep and works directly with the bed’s DualAir system to automatically adjust the comfort level of each sleeper. Through daily digital interactions that build lifelong relationships, SleepIQ technology also communicates how you slept and provides insights on what adjustments you can make to optimize your sleep and improve your daily life. Sleep Number also offers FlextFit adjustable bases, and Sleep Number pillows, sheets and other bedding products. As a national specialty mattress retailer, we offer consumers a cohesive experience across our Sleep Number stores, online at SleepNumber.com or via phone at (800)753-3768.
We are committed to delivering superior shareholder value through three primary drivers of earnings per share growth: increasing consumer demand, leveraging our business model and deploying capital efficiently. We are the sleep innovation leader and drive growth through effective brand marketing and a differentiated retail experience.
We generate revenue by marketing our innovations to new and existing customers, and selling products through two distribution channels. Our Company-Controlled channel, which includes Retail, Online and Phone, sells directly to consumers. Our Wholesale/Other channel sells to and through selected retail and wholesale customers in the United States.
We are also the only vertically integrated bed manufacturer/retailer in the U.S. We have two manufacturing plants that distribute Sleep Number products. We also offer mattress home delivery and installation, and maintain an in-house customer service department. This integration enables operational synergies and efficiencies, and a strong working capital position. Vertical integration allows us to build a long-term loyal customer relationship as we service the consumer through the full purchase and ownership cycle. This relationship with our customer creates a productive cycle of repeat and referral business.
Results of Operations
Fiscal
2017
Summary
Financial highlights for
fiscal 2017
were as follows:
|
•
|
Net sales for
2017
increased
10%
to
$1.44 billion
, compared with
$1.31 billion
in the prior year. Company-Controlled comparable sales increased
4%
and sales from
16
net new stores opened in the past 12 months added
7
percentage points (ppt.) of growth in
2017
.
|
|
•
|
In May 2017, we began selling our Sleep Number 360™ i7 and i10 smart beds. The Sleep Number 360 smart bed won 13 awards at CES, including being named the Best of Innovation Honoree in the Home Appliance category. We launched our third smart bed model (the p6) in December 2017, and remain on track to complete the phased implementation of our 360 smart bed line by mid-year 2018.
|
|
•
|
On a trailing twelve-month basis, sales per store (for stores open at least one year) of
$2.4 million
increased
2%
from the comparable period one-year ago.
|
|
•
|
Operating income for
2017
increased
20%
to
$92 million
, or
6.4%
of net sales, compared with
$77 million
, or
5.8%
of net sales, for the same period one-year ago. The increase in operating income was attributable to: (i) the
10%
increase in net sales; (ii) a 0.3
ppt. improvement in our gross profit rate; and (iii) the operating expense leverage resulting from a
10%
increase in net sales, partially offset by transition costs associated with the launch of our Sleep Number 360 smart beds and evolution of our supply chain.
|
|
•
|
Net income in 2017
increased
27%
to
$65 million
, or
$1.55
per diluted share, compared with net income of
$51 million
, or
$1.10
per diluted share in
2016
.
|
26
|
•
|
We achieved a return on invested capital (ROIC) of
14.3%
in
2017
, well above our weighted average cost of capital.
|
|
•
|
Cash provided by operating activities increased by 14% in
2017
to
$173 million
, compared with
$152 million
for the prior year. Purchases of property and equipment for
2017
increased to
$60 million
, compared with
$58 million
in
2016
.
|
|
•
|
At
December 30, 2017
, cash and cash equivalents totaled
$4 million
compared with
$12 million
at
December 31, 2016
. We ended 2017 with
$25 million
of borrowings under our
$153 million
revolving credit facility, as planned. We utilize our credit facility for general corporate purposes and to meet our seasonal working capital requirements. In February 2018, we amended our revolving credit facility to increase our net aggregate availability to $300 million.
|
|
•
|
Effective as of October 1, 2017, our Board approved an increase in our total remaining share repurchase authorization to $500 million. In
2017
, we repurchased
5.4 million
shares of our common stock at a cost of
$150 million
(
$28.00
per share). As of
December 30, 2017
, the remaining authorization under our Board-approved share repurchase program was
$465 million
.
|
The following table sets forth our results of operations expressed as dollars and percentages of net sales. Figures are in millions, except percentages and per share amounts. Amounts may not add due to rounding differences.
|
|
2017
|
2016
|
2015
|
||||||||||||||||||
|
|
$
|
% of
Net Sales
|
$
|
% of
Net Sales
|
$
|
% of
Net Sales
|
|||||||||||||||
|
Net sales
|
$
|
1,444.5
|
|
100.0
|
%
|
$
|
1,311.3
|
|
100.0
|
%
|
$
|
1,213.7
|
|
100.0
|
%
|
||||||
|
Cost of sales
|
547.2
|
|
37.9
|
|
501.1
|
|
38.2
|
|
472.9
|
|
39.0
|
|
|||||||||
|
Gross profit
|
897.3
|
|
62.1
|
|
810.2
|
|
61.8
|
|
740.8
|
|
61.0
|
|
|||||||||
|
Operating expenses:
|
|
|
|
||||||||||||||||||
|
Sales and marketing
|
650.4
|
|
45.0
|
|
595.8
|
|
45.4
|
|
550.5
|
|
45.4
|
|
|||||||||
|
General and administrative
|
127.3
|
|
8.8
|
|
109.7
|
|
8.4
|
|
99.2
|
|
8.2
|
|
|||||||||
|
Research and development
|
27.8
|
|
1.9
|
|
28.0
|
|
2.1
|
|
16.0
|
|
1.3
|
|
|||||||||
|
Total operating expenses
|
805.4
|
|
55.8
|
|
733.5
|
|
55.9
|
|
665.7
|
|
54.8
|
|
|||||||||
|
Operating income
|
91.9
|
|
6.4
|
|
76.7
|
|
5.8
|
|
75.1
|
|
6.2
|
|
|||||||||
|
Other (expense) income, net
|
(0.9
|
)
|
(0.1
|
)
|
(0.7
|
)
|
(0.1
|
)
|
0.3
|
|
0.0
|
|
|||||||||
|
Income before income taxes
|
91.0
|
|
6.3
|
|
75.9
|
|
5.8
|
|
75.4
|
|
6.2
|
|
|||||||||
|
Income tax expense
|
26.0
|
|
1.8
|
|
24.5
|
|
1.9
|
|
24.9
|
|
2.1
|
|
|||||||||
|
Net income
|
$
|
65.1
|
|
4.5
|
%
|
$
|
51.4
|
|
3.9
|
%
|
$
|
50.5
|
|
4.2
|
%
|
||||||
|
Net income per share:
|
|
|
|
|
|
|
|||||||||||||||
|
Basic
|
$
|
1.58
|
|
|
|
$
|
1.11
|
|
$
|
0.99
|
|
||||||||||
|
Diluted
|
$
|
1.55
|
|
|
|
$
|
1.10
|
|
$
|
0.97
|
|
||||||||||
|
Weighted-average number of common shares:
|
|
|
|
|
|||||||||||||||||
|
Basic
|
41.2
|
|
|
|
46.2
|
|
51.3
|
|
|||||||||||||
|
Diluted
|
42.1
|
|
|
|
46.9
|
|
52.1
|
|
|||||||||||||
The percentage of our total net sales, by dollar volume, from each of our channels was as follows:
|
2017
|
2016
|
2015
|
|||||||
|
Company-Controlled channel
|
98.7
|
%
|
97.7
|
%
|
97.6
|
%
|
|||
|
Wholesale/Other channel
|
1.3
|
%
|
2.3
|
%
|
2.4
|
%
|
|||
|
Total
|
100.0
|
%
|
100.0
|
%
|
100.0
|
%
|
|||
27
The components of total net sales growth, including comparable net sales changes, were as follows:
|
|
Net Sales Increase/(Decrease)
|
||||||||
|
|
2017
|
2016
|
2015
|
||||||
|
Retail comparable-store sales
(1)
|
3
|
%
|
0
|
%
|
3
|
%
|
|||
|
Online and phone
(1)
|
16
|
%
|
25
|
%
|
(4
|
%)
|
|||
|
Company-Controlled comparable sales change
(1)
|
4
|
%
|
1
|
%
|
3
|
%
|
|||
|
Net opened/closed stores
|
7
|
%
|
7
|
%
|
2
|
%
|
|||
|
Total Company-Controlled channel
|
11
|
%
|
8
|
%
|
5
|
%
|
|||
|
Wholesale/Other channel
|
(38
|
%)
|
5
|
%
|
(9
|
%)
|
|||
|
Total net sales change
|
10
|
%
|
8
|
%
|
5
|
%
|
|||
___________________
(1)
Stores are included in the comparable-store calculation in the 13th full month of operations. Stores that have been remodeled or repositioned within the same shopping center remain in the comparable-store base.
Other sales metrics were as follows:
|
|
2017
|
2016
|
2015
|
|||||||||
|
Average sales per store
(1)
($ in thousands)
|
$
|
2,420
|
|
$
|
2,364
|
|
$
|
2,377
|
|
|||
|
Average sales per square foot
(1)
|
$
|
920
|
|
$
|
937
|
|
$
|
980
|
|
|||
|
Stores > $1 million in net sales
(1)
|
98
|
%
|
98
|
%
|
99
|
%
|
||||||
|
Stores > $2 million in net sales
(1)
|
61
|
%
|
61
|
%
|
62
|
%
|
||||||
|
Average revenue per mattress unit – Company-Controlled channel
(2)
|
$
|
4,283
|
|
$
|
4,046
|
|
$
|
4,028
|
|
|||
___________________
(1)
Trailing twelve months for stores included in our comparable-store sales calculation.
(2)
Represents Company-Controlled channel total net sales divided by Company-Controlled channel mattress units.
The number of retail stores operating during the last three years was as follows:
|
|
2017
|
2016
|
2015
|
||||||
|
Beginning of period
|
540
|
|
488
|
|
463
|
|
|||
|
Opened
|
36
|
|
72
|
|
38
|
|
|||
|
Closed
|
(20
|
)
|
(20
|
)
|
(13
|
)
|
|||
|
End of period
|
556
|
|
540
|
|
488
|
|
|||
28
Comparison of
2017
and
2016
Net sales
Net sales in
2017
increased
10%
to
$1.44 billion
, compared with
$1.31 billion
for the same period one year ago. The sales increase was driven by a
4%
comparable sales
increase
in our Company-Controlled channel and 7 percentage points (ppt.) of growth from sales generated by
16
net new retail stores opened in the past 12 months, partially offset by a decrease in Wholesale/Other channel sales.
The
$133 million
net sales increase compared with the same period one year ago was primarily comprised of: (i) a $91 million increase resulting from net store openings; and (ii) a $54 million sales increase from Company-Controlled comparable sales; partially offset by (iii) a $12 million decrease in Wholesale/Other channel sales. Company-Controlled mattress units increased 5% compared to the prior-year period. Average revenue per mattress unit in our Company-Controlled channel increased by 6%.
Gross profit
Gross profit of
$897 million
increased by
$87 million
, or
11%
, compared with $810 million for the same period one year ago. The gross profit rate increased to
62.1%
of net sales for
2017
, compared with
61.8%
for the prior-year period. The prior-year gross profit rate was negatively impacted by actions taken to manage operating issues associated with our ERP implementation during the first six months of 2016. The current-year gross profit rate improvement of 0.3 ppt. benefited from manufacturing and supply chain efficiencies, including lean initiatives, and lower sales return and exchange costs compared with the same period one year ago. In addition, our gross profit rate can fluctuate from year to year due to a variety of other factors, including warranty expenses, product mix changes and performance-based incentive compensation.
Sales and marketing expenses
Sales and marketing expenses in
2017
increased
9%
to
$650 million
, compared with
$596 million
last year. The sales and marketing expense rate decreased to
45.0%
of net sales compared with
45.4%
for the same period one year ago due to: (i) leveraging our media spending, which increased by 2% compared with the prior year, while net sales increased by 10%; partially offset by (ii) an increase in customer financing expenses, as a larger percentage of our customers took advantage of promotional financing offers; and (iii) an increase in selling compensation expense, including higher performance-based incentive compensation resulting from the strong 2017 net sales growth and financial performance.
General and administrative expenses
General and administrative (G&A) expenses
increased
$18 million
to
$127 million
in
2017
, compared with
$110 million
in the prior year and increased to
8.8%
of net sales, compared with
8.4%
of net sales one year ago. The
$18 million
increase in G&A expenses consisted of the following major components: (i) a $12.2 million increase in employee compensation, including a year-over-year increase in company-wide performance-based incentive compensation, enhanced digital marketing capabilities, and salary and wage rate increases that were in line with inflation; (ii) $2.6 million of additional depreciation and amortization expense, including incremental depreciation expense from capital expenditures that support the growth of our business; and (iii) a
$2.8 million increase in miscellaneous other expenses. The G&A expense rate increased by 0.4 ppt. in
2017
compared with the same period one year ago due to the increase in expenses discussed above, partially offset by the leveraging impact of the
10%
net sales increase.
Research and development expenses
Research and development expenses for the
year ended
December 30, 2017
were
$28 million
, consistent with the same period one year ago. The expense rate for the
year ended
December 30, 2017
decreased to
1.9%
of net sales compared to
2.1%
of net sales for the prior year. The spending level is consistent with our long-term consumer innovation strategy.
Income tax expense
Income tax expense was
$26 million
for the
year ended
December 30, 2017
, compared with
$25 million
for the same period one year ago. The effective tax rate for the
year ended
December 30, 2017
was
28.5%
compared with
32.3%
for the prior-year period. The effective tax rates for 2016 reflects tax benefits associated with our acquisition of BAM Labs, Inc. including higher research and development tax credits. The effective tax rate for 2017 benefited from: (i) a provisional tax benefit resulting from revaluing deferred taxes in accordance with the "Tax Cuts and Jobs Act"; (ii) stock-based compensation excess tax benefits in accordance with new Financial Accounting Standards Board (FASB) guidance effective for us beginning in 2017; and (iii) the recognition of additional tax credits. Under previous FASB guidance, stock-based compensation excess tax benefits or deficiencies were recognized in additional
29
paid-in capital in our consolidated balance sheet. See Note 1,
New Accounting Pronouncements
, in the Notes to the Condensed Consolidated Financial Statements for additional details.
Comparison of 2016 and 2015
Enterprise Resource Planning (ERP) system implementation
In the fourth quarter of 2015, we replaced our nearly 20-year-old legacy computer systems with a new vertically integrated Enterprise Resource Planning (ERP) system. We completed our ERP implementation by the end of the first quarter of 2016. Implementation issues negatively affected fourth-quarter 2015 net sales and profits, and to a lesser degree, first-quarter and second-quarter 2016 net sales and profits. The new operating platform enables operational efficiencies, improved customer convenience and supports the growth of our business.
Net sales
Net sales in 2016 increased 8% to $1.31 billion, compared with $1.21 billion for the same period one year ago. The sales increase was driven by a 1% comparable sales increase in our Company-Controlled channel, 7 percentage points (ppt.) of growth from sales generated by 52 net new retail stores opened in the past 12 months and an increase in Wholesale/Other channel sales.
The $98 million net sales increase compared with the same period one year ago was primarily comprised of an $83 million increase resulting from net store openings and a $14 million sales increase from Company-Controlled comparable sales. Company-Controlled mattress units increased 8% compared to the prior-year period. Average revenue per mattress unit in our Company-Controlled channel was consistent with the prior year.
Gross profit
Gross profit of $810 million increased by $69 million, or 9%, compared with the same period one year ago. The gross profit rate increased to 61.8% of net sales for 2016, compared with 61.0% for the prior-year period. The 0.8 ppt. increase in the gross profit rate was primarily due to material cost reductions, operating efficiencies, and lower sales return and exchange costs. In addition, our gross profit rate can fluctuate from year-to-year due to a variety of other factors, including warranty expenses, product mix changes and performance-based incentive compensation.
Sales and marketing expenses
Sales and marketing expenses in 2016 increased 8% to $596 million, compared with $550 million last year. The marketing expense rate of 45.4% of net sales was consistent with the same period one year ago due to: (i) leveraging our media spending, which increased by 5% compared with the prior year, while net sales increased by 8%; partially offset by (ii) higher customer service costs; and (iii) an increase in customer financing expenses, as a larger percentage of our customers took advantage of promotional financing offers.
General and administrative expenses
General and administrative (G&A) expenses increased $10.5 million to $110 million in 2016, compared with $99 million in the prior year and increased to 8.4% of net sales, compared with 8.2% of net sales one year ago. The $10.5 million increase in G&A expenses consisted of the following major components: (i) a $10.4 million increase in employee compensation, including headcount increases to support business growth initiatives, and salary and wage rate increases that were in line with inflation; (ii) $6.5 million of additional
depreciation expense resulting from the increase in capital expenditures to support the growth of the business, including our new ERP system that was launched in the fourth quarter of 2015; (iii) a $3.5 million gain (net of acquisition-related expenses) in 2015 related to our previously held minority equity investment in BAM Labs, Inc.; and (iv) a
$1.5 million increase in miscellaneous other expenses. These increases were partially offset by $11.6 million of data conversion and training expenses incurred in 2015 to support the launch of our ERP system. The G&A expense rate increased by 0.2 ppt. in 2016 compared with the same period one year ago due to the increase in expenses discussed above, partially offset by the leveraging impact of the 8% net sales increase.
30
Research and development expenses
Research and development expenses for the year ended December 31, 2016 were $28 million, or 2.1% of net sales, compared with $16 million, or 1.3% of net sales, for the same period one year ago. The $12 million increase in R&D expenses was due to increased investments to support product innovations, including a $9.7 million increase in expenses related to SleepIQ LABS' operations (post acquisition; acquired on September 15, 2015). The $12 million increase is consistent with our long-term consumer innovation strategy.
Income tax expense
Income tax expense was $25 million for the year ended December 31, 2016, compared with $25 million for the same period one year ago. The effective tax rate for the year ended December 31, 2016 was 32.3% compared with 33.0% for the prior-year period. The effective tax rates for 2016 and 2015 include tax benefits associated with our acquisition of BAM Labs, including higher research and development tax credits.
Liquidity and Capital Resources
Managing our liquidity and capital resources is an important part of our commitment to deliver superior shareholder value. Our business model, which can operate with minimal working capital, does not require additional capital from external sources to fund operations or organic growth. Our primary sources of liquidity are cash flows provided by operating activities and cash available under our $300 million revolving credit facility (increased in February 2018 from $153 million). The cash generated from ongoing operations, and cash available under our revolving credit facility are expected to be adequate to maintain operations and fund anticipated expansion and strategic initiatives for the foreseeable future.
As of
December 30, 2017
, cash and cash equivalents totaled
$4 million
compared with
$12 million
as of
December 31, 2016
. The
$8 million
decrease was primarily due to
$173 million
of cash provided by operating activities and
$25 million
of borrowings under our line of credit, which was more than offset by
$60 million
of cash used to purchase property and equipment and
$155 million
of cash used to repurchase our common stock (
$150 million
under our Board-approved share repurchase program and
$5 million
in connection with the vesting of employee restricted stock grants).
The following table summarizes our cash flows (dollars in millions). Amounts may not add due to rounding differences:
|
|
2017
|
2016
|
||||||
|
Total cash provided by (used in):
|
|
|
||||||
|
Operating activities
|
$
|
172.6
|
|
$
|
151.6
|
|
||
|
Investing activities
|
(56.6
|
)
|
(42.7
|
)
|
||||
|
Financing activities
|
(123.9
|
)
|
(118.4
|
)
|
||||
|
Net decrease in cash and cash equivalents
|
$
|
(8.0
|
)
|
$
|
(9.4
|
)
|
||
Cash provided by operating activities for the fiscal year ended
December 30, 2017
was
$173 million
compared with
$152 million
for the fiscal year ended
December 31, 2016
. Significant components of the
$21 million
year-over-year change in cash from operating activities included: (i) a $14 million increase in net income in 2017 compared with 2016; (ii) a $23 million fluctuation in income taxes based on a $15 million income taxes receivable at the end of 2015 compared with income tax liabilities at the end of 2016 and 2017; (iii) a $13 million fluctuation in accrued compensation and benefits due to the year-over-year changes in company-wide performance-based incentive compensation resulting from the strong 2017 financial performance; and (iv) the ERP implementation issues we experienced in our plants and supply chain during the fourth quarter of 2015 that resulted in higher inventory levels, increased accounts receivables, increased accounts payables and higher customer prepayments at the end of 2015.
Net cash used in investing activities was
$57 million
for the fiscal year ended
December 30, 2017
, compared with
$43 million
for the same period one year ago. Investing activities for the current-year period included
$60 million
of property and equipment purchases, compared with $58 million for the same period last year. We
decreased
our net investments in marketable debt securities by
$15 million
during the fiscal year ended December 31, 2016 and held no marketable debt securities at December 30, 2017 or December 31, 2016.
Net cash
used in
financing activities was
$124 million
for the fiscal year ended
December 30, 2017
, compared with net cash
used in
financing activities of
$118 million
for the same period one year ago. During the fiscal year ended
December 30, 2017
, we repurchased
$155 million
of our common stock (
$150 million
under our Board-approved share repurchase program and
$5 million
in connection with the vesting of employee restricted stock grants) compared with
$127 million
during the same period one year ago.
31
Short-term borrowings increased by $22 million during the current-year period, reflecting $25 million of borrowings under our revolving credit facility as of December 30, 2017, compared with no borrowing as of December 31, 2016. Changes in book overdrafts are included in the net change in short-term borrowings. Financing activities for both periods reflect the cash proceeds from the exercise of employee stock options.
Under our Board-approved share repurchase program, we repurchased
5.4 million
shares at a cost of
$150 million
(
$28.00
per share) during the fiscal year ended
December 30, 2017
. During
2016
, we repurchased
5.9 million
shares at a cost of
$125 million
(
$21.02
per share). Effective as of October 1, 2017, our Board approved an increase in our total remaining share repurchase authorization to $500 million. As of
December 30, 2017
, the remaining authorization under our Board-approved share repurchase program was
$465 million
. There is no expiration date governing the period over which we can repurchase shares.
In February 2018, we amended our revolving credit facility (Credit Agreement) with a syndicate of banks (Lenders). The Credit Agreement provides a revolving credit facility for general corporate purposes with net aggregate availability of $300 million. The Credit Agreement contains an accordion feature that allows us to increase the amount of the credit facility from $300 million up to $450 million in total availability, subject to Lenders' approval. The Credit Agreement matures in February 2023.
The credit agreement provides the Lenders with a collateral security interest in substantially all of our assets and those of our subsidiaries and requires us to comply with, among other things, a maximum leverage ratio and a minimum interest coverage ratio. Under the terms of the credit agreement we pay a variable rate of interest and a commitment fee based on our leverage ratio. As of December 30, 2017, we had $25 million in outstanding borrowings and $3 million in outstanding letters of credit. As of December 30, 2017, the weighted-average interest rate on borrowings outstanding under the credit facility was
3.1%
. We were in compliance with all financial covenants.
We have an agreement with Synchrony Bank to offer qualified customers revolving credit arrangements to finance purchases from us (Synchrony Agreement). The Synchrony Agreement contains certain financial covenants, including a maximum leverage ratio and a minimum interest coverage ratio. As of
December 30, 2017
, we were in compliance with all financial covenants.
Under the terms of the Synchrony Agreement, Synchrony Bank sets the minimum acceptable credit ratings, the interest rates, fees and all other terms and conditions of the customer accounts, including collection policies and procedures, and is the owner of the accounts.
Off-Balance-Sheet Arrangements and Contractual Obligations
As of
December 30, 2017
, we were not involved in any unconsolidated special purpose entity transactions. Other than our operating leases and a
$3 million
outstanding letter of credit, we do not have any off-balance-sheet financing. A summary of our operating lease obligations is included in the “Contractual Obligations” section (as follows). Additional information regarding our operating leases is available in Item 2,
Properties
, and Note 7,
Leases
, of the Notes to Consolidated Financial Statements, included in Item 8,
Financial Statements and Supplementary Data
, of this Annual Report on Form 10-K.
Contractual Obligations
The following table presents information regarding our contractual obligations as of December 30, 2017 (in thousands):
|
|
Payments Due by Period
(1)
|
|||||||||||||||||||
|
|
Total
|
< 1 Year
|
1 - 3 Years
|
3 - 5 Years
|
> 5 Years
|
|||||||||||||||
|
Operating leases
(2)
|
$
|
436,767
|
|
$
|
70,604
|
|
$
|
123,183
|
|
$
|
97,941
|
|
$
|
145,039
|
|
|||||
|
Purchase commitments
|
8,600
|
|
8,600
|
|
—
|
|
—
|
|
—
|
|
||||||||||
|
Total
|
$
|
445,367
|
|
$
|
79,204
|
|
$
|
123,183
|
|
$
|
97,941
|
|
$
|
145,039
|
|
|||||
___________________
(1)
Our unrecognized tax benefits, including interest and penalties, of
$3 million
have not been included in the Contractual Obligations table as we are not able to determine a reasonable estimate of timing of the cash settlement with the respective taxing authorities.
(2)
These amounts include the payments related to
38
lease commitments for future retail store locations. These lease commitments provide for minimum rentals over the next
five
to
ten
years, which if consummated based on current cost estimates, would approximate
$54 million
over the initial lease term.
32
Critical Accounting Policies and Estimates
Our consolidated financial statements are prepared in accordance with U.S. generally accepted accounting principles (GAAP). In connection with the preparation of our financial statements, we are required to make estimates and assumptions about future events, and apply judgments that affect the reported amounts of assets, liabilities, sales, expenses and the related disclosure. Predicting future events is inherently an imprecise activity and as such requires the use of judgment. We base our assumptions, estimates and judgments on historical experience, current trends and other factors that management believes to be relevant at the time our consolidated financial statements are prepared. On a regular basis, management reviews the accounting policies, assumptions, estimates and judgments to ensure that our financial statements are presented fairly and in accordance with GAAP. However, because future events and their effects cannot be determined with certainty, actual results could differ from our assumptions and estimates, and such differences could be material.
Our significant accounting policies are discussed in Note 1,
Business and Summary of Significant Accounting
Policies
, of the Notes to Consolidated Financial Statements, included in Item 8,
Financial Statements and Supplementary Data
, of this Annual Report on Form 10-K. Management believes the accounting policies discussed below are the most critical because they require management’s most difficult, subjective or complex judgments, resulting from the need to make estimates about the effect of matters that are inherently uncertain. Management has reviewed these critical accounting policies and estimates, and related disclosures with the Audit Committee of our Board.
Our critical accounting policies and estimates relate to stock-based compensation, goodwill and indefinite-lived intangible assets, warranty liabilities and revenue recognition.
|
Description
|
Judgments and Uncertainties
|
Effect if Actual Results
Differ From Assumptions
|
||
|
Stock-Based Compensation
|
||||
|
We have stock-based compensation plans, which include non-qualified stock options and stock awards.
See Note 1,
Business and Summary of Significant Accounting Policies
, and Note 10,
Shareholders’ Equity
, to the Notes to Consolidated Financial Statements, included in Item 8,
Financial Statements and Supplementary Data
, of this Annual Report on Form 10-K, for a complete discussion of our stock-based compensation programs.
|
Option-pricing models and generally accepted valuation techniques require management to make assumptions and to apply judgment to determine the fair value of our awards. These assumptions and judgments include estimating the volatility of our stock price, future employee forfeiture rates and future employee stock option exercise behaviors. Changes in these assumptions can materially affect the fair value estimates or future earnings adjustments.
Performance-based stock awards require management to make assumptions regarding the likelihood of achieving performance targets. |
We do not believe there is a reasonable likelihood that there will be a material change in the future estimates or assumptions we use to determine stock-based compensation expense. However, if actual results are not consistent with our estimates or assumptions, we may be exposed to changes in stock-based compensation expense that could be material.
In addition, if actual results are not consistent with the assumptions used, the stock-based compensation expense reported in our financial statements may not be representative of the actual economic cost of the stock-based compensation. Finally, if the actual forfeiture rates, or the actual achievement of performance targets, are not consistent with the assumptions used, we could experience future earnings adjustments. A 10% change in our stock-based compensation expense for the year ended December 30, 2017, would have affected net income by approximately $1.1 million in 2017. |
||
|
Goodwill and Indefinite-Lived Intangible Assets
|
||||
|
Goodwill represents the excess of cost over the fair value of identifiable net assets of businesses acquired. Our indefinite-lived intangible assets include trade names/trademarks.
See Note 1, Business and Summary of Significant Accounting Policies and Note 7, Goodwill and Intangible Assets, Net , to the Notes to Consolidated Financial Statements, included in Item 8, Financial Statements and Supplementary Data , of this Annual Report on Form 10-K, for a complete discussion of our goodwill and indefinite-lived intangible assets. |
The determination of fair value involves uncertainties because it requires management to make assumptions and to apply judgment to estimate industry and economic factors and the profitability of future business strategies. Management’s assumptions also include projected revenues, operating profit levels and discount rates, as well as consideration of any other factors that may indicate potential impairment.
|
In the fourth quarter of fiscal 2017, management completed its annual goodwill and other indefinite-lived intangible asset impairment tests and determined there was no impairment. We believe our assumptions and judgments used in estimating cash flows and determining fair value were reasonable. However, unexpected changes to such assumptions and judgments could affect our impairment analyses and future results of operations, including an impairment charge that could be material.
|
||
33
|
Description
|
Judgments and Uncertainties
|
Effect if Actual Results
Differ From Assumptions |
||
|
Warranty Liabilities
|
||||
|
We provide a limited warranty on most of the products we sell.
See Note 1,
Business and Summary of Significant Accounting Policies
, to the Notes to Consolidated Financial Statements, included in Item 8,
Financial Statements and Supplementary Data
, of this Annual Report on Form 10-K, for a complete discussion of our warranty program and liabilities.
|
The majority of our warranty claims are incurred within the first year. However, our warranty liability contains uncertainties because our warranty obligations cover an extended period of time. A revision of estimated claim rates or the projected cost of materials and freight associated with sending replacement parts to customers could have a material adverse effect on future results of operations.
|
We have not made any material changes in our warranty liability assessment methodology during the past three fiscal years. We do not believe there is a reasonable likelihood that there will be a material change in the estimates or assumptions we use to calculate our warranty liability. However, if actual results are not consistent with our estimates or assumptions, we may be exposed to losses or gains that could be material.
A 10% change in our warranty liability at December 30, 2017, would have affected net income by approximately $0.6 million in 2017.
|
||
|
Revenue Recognition
|
||||
|
Certain accounting estimates relating to revenue recognition contain uncertainty because they require management to make assumptions and to apply judgment regarding the effects of future events.
See Note 1,
Business and Summary of Significant Accounting Policies
,
to the Notes to Consolidated Financial Statements, included in Item 8,
Financial Statements and Supplementary Data
, of this Annual Report on Form 10-K, for a complete discussion of our revenue recognition policies.
|
Our estimates of sales returns contain uncertainties as actual sales return rates may vary from expected rates, resulting in adjustments to net sales in future periods. These adjustments could have an adverse effect on future results of operations.
|
We have not made any material changes in the accounting methodology used to establish our sales returns allowance during the past three fiscal years. We do not believe there is a reasonable likelihood that there will be a material change in the estimates or assumptions we use to calculate our sales returns allowance. However, if actual results are not consistent with our estimates or assumptions, we may be exposed to additional losses or gains in future periods.
A 10% change in our sales returns allowance at December 30, 2017 would have affected net income by approximately $1.3 million in 2017. |
||
Recent Accounting Pronouncements
See “Part II, Item 8. Financial Statements and Supplementary Data – Notes to Consolidated Financial Statements – Note 1 – Business and Summary of Significant Accounting Policies - New Accounting Pronouncements” for recent accounting pronouncements that may affect our financial reporting.
We are exposed to changes in short-term market interest rates that will impact our net interest expense. If overall interest rates were
one percentage point higher than current rates, our net interest expense would not change by a significant amount based on the
$25 million
of borrowings under our revolving credit facility at
December 30, 2017
. We do not manage our interest-rate volatility risk through the use of derivative instruments.
34
REPORT OF INDEPENDENT REGISTERED PUBLIC ACCOUNTING FIRM
To the Board of Directors and Shareholders of
Sleep Number Corporation
Minneapolis, Minnesota
Opinion on the Financial Statements
We have audited the accompanying consolidated balance sheets of Sleep Number Corporation and subsidiaries (the “Company,” formerly Select Comfort Corporation) as of December 30, 2017 and December 31, 2016, the related consolidated statements of income, comprehensive income, shareholders’ equity, and cash flows for each of the three years in the period ended December 30, 2017, and the related notes and the schedule listed in the Index at Item 15 (collectively referred to as the “financial statements”). In our opinion, the financial statements present fairly, in all material respects, the financial position of the Company as of December 30, 2017 and December 31, 2016, and the results of its operations and its cash flows for each of the three years in the period ended December 30, 2017, in conformity with accounting principles generally accepted in the United States of America.
We have also audited, in accordance with the standards of the Public Company Accounting Oversight Board (United States) (PCAOB), the Company's internal control over financial reporting as of December 30, 2017, based on criteria established in
Internal Control - Integrated Framework (2013)
issued by the Committee of Sponsoring Organizations of the Treadway Commission and our report dated February 27, 2018, expressed an unqualified opinion on the Company's internal control over financial reporting.
Basis for Opinion
These financial statements are the responsibility of the Company's management. Our responsibility is to express an opinion on the Company's financial statements based on our audits. We are a public accounting firm registered with the PCAOB and are required to be independent with respect to the Company in accordance with the U.S. federal securities laws and the applicable rules and regulations of the Securities and Exchange Commission and the PCAOB.
We conducted our audits in accordance with the standards of the PCAOB. Those standards require that we plan and perform the audit to obtain reasonable assurance about whether the financial statements are free of material misstatement, whether due to error or fraud. Our audits included performing procedures to assess the risks of material misstatement of the financial statements, whether due to error or fraud, and performing procedures that respond to those risks. Such procedures included examining, on a test basis, evidence regarding the amounts and disclosures in the financial statements. Our audits also included evaluating the accounting principles used and significant estimates made by management, as well as evaluating the overall presentation of the financial statements. We believe that our audits provide a reasonable basis for our opinion.
/s/ DELOITTE & TOUCHE LLP
Minneapolis, Minnesota
February 27, 2018
We have served as the Company's auditor since 2010.
35
REPORT OF INDEPENDENT REGISTERED PUBLIC ACCOUNTING FIRM
To the Board of Directors and Shareholders of
Sleep Number Corporation
Minneapolis, Minnesota
Opinion on Internal Control over Financial Reporting
We have audited the internal control over financial reporting of Sleep Number Corporation and subsidiaries (the “Company,” formerly Select Comfort Corporation) as of December 30, 2017, based on the criteria established in
Internal Control-Integrated Framework (2013)
issued by the Committee of Sponsoring Organizations of the Treadway Commission (COSO). In our opinion, the Company maintained, in all material respects, effective internal control over financial reporting as of December 30, 2017, based on criteria established in Internal Control - Integrated Framework (2013) issued by COSO.
We have also audited, in accordance with the standards of the Public Company Accounting Oversight Board (United States) (PCAOB),
the consolidated financial statements and financial statement schedule as of and for the year ended December 30, 2017
, of the Company and our report dated February 27, 2018 expressed
an unqualified opinion on those financial statements and financial statement schedule.
Basis for Opinion
The Company’s management is responsible for maintaining effective internal control over financial reporting and for its assessment of the effectiveness of internal control over financial reporting, included in the accompanying
Management’s Report on Internal Control Over Financial Reporting
. Our responsibility is to express an opinion on the Company’s internal control over financial reporting based on our audit. We are a public accounting firm registered with the PCAOB and are required to be independent with respect to the Company in accordance with the U.S. federal securities laws and the applicable rules and regulations of the Securities and Exchange Commission and the PCAOB.
We conducted our audit in accordance with the standards of the PCAOB. Those standards require that we plan and perform the audit to obtain reasonable assurance about whether effective internal control over financial reporting was maintained in all material respects. Our audit included obtaining an understanding of internal control over financial reporting, assessing the risk that a material weakness exists, testing and evaluating the design and operating effectiveness of internal control based on the assessed risk, and performing such other procedures as we considered necessary in the circumstances. We believe that our audit provides a reasonable basis for our opinion.
Definition and Limitations of Internal Control over Financial Reporting
A company’s internal control over financial reporting is a process designed to provide reasonable assurance regarding the reliability of financial reporting and the preparation of financial statements for external purposes in accordance with generally accepted accounting principles. A company’s internal control over financial reporting includes those policies and procedures that (1) pertain to the maintenance of records that, in reasonable detail, accurately and fairly reflect the transactions and dispositions of the assets of the company; (2) provide reasonable assurance that transactions are recorded as necessary to permit preparation of financial statements in accordance with generally accepted accounting principles, and that receipts and expenditures of the company are being made only in accordance with authorizations of management and directors of the company; and (3) provide reasonable assurance regarding prevention or timely detection of unauthorized acquisition, use, or disposition of the company’s assets that could have a material effect on the financial statements.
Because of its inherent limitations, internal control over financial reporting may not prevent or detect misstatements. Also, projections of any evaluation of effectiveness to future periods are subject to the risk that controls may become inadequate because of changes in conditions, or that the degree of compliance with the policies or procedures may deteriorate.
/s/ DELOITTE & TOUCHE LLP
Minneapolis, Minnesota
February 27, 2018
36
SLEEP NUMBER CORPORATION
AND SUBSIDIARIES
December 30, 2017
and
December 31, 2016
(in thousands, except per share amounts)
|
2017
|
2016
|
||||||
|
Assets
|
|
|
|||||
|
Current assets:
|
|
|
|||||
|
Cash and cash equivalents
|
$
|
3,651
|
|
$
|
11,609
|
|
|
|
Accounts receivable, net of allowance for doubtful accounts of $714 and $884, respectively
|
19,312
|
|
19,705
|
|
|||
|
Inventories
|
84,298
|
|
75,026
|
|
|||
|
Prepaid expenses
|
17,565
|
|
8,705
|
|
|||
|
Other current assets
|
27,665
|
|
23,282
|
|
|||
|
Total current assets
|
152,491
|
|
138,327
|
|
|||
|
Non-current assets:
|
|
|
|
||||
|
Property and equipment, net
|
208,646
|
|
208,367
|
|
|||
|
Goodwill and intangible assets, net
|
77,588
|
|
80,817
|
|
|||
|
Deferred income taxes
|
2,625
|
|
4,667
|
|
|||
|
Other non-current assets
|
30,484
|
|
24,988
|
|
|||
|
Total assets
|
$
|
471,834
|
|
$
|
457,166
|
|
|
|
Liabilities and Shareholders’ Equity
|
|
|
|
||||
|
Current liabilities:
|
|
|
|
||||
|
Borrowings under revolving credit facility
|
$
|
24,500
|
|
$
|
—
|
|
|
|
Accounts payable
|
129,194
|
|
105,375
|
|
|||
|
Customer prepayments
|
27,767
|
|
26,207
|
|
|||
|
Accrued sales returns
|
19,270
|
|
15,222
|
|
|||
|
Compensation and benefits
|
34,602
|
|
19,455
|
|
|||
|
Taxes and withholding
|
24,234
|
|
23,430
|
|
|||
|
Other current liabilities
|
46,822
|
|
35,628
|
|
|||
|
Total current liabilities
|
306,389
|
|
225,317
|
|
|||
|
Non-current liabilities:
|
|
|
|
||||
|
Other non-current liabilities
|
76,289
|
|
71,529
|
|
|||
|
Total liabilities
|
382,678
|
|
296,846
|
|
|||
|
Shareholders’ equity:
|
|
|
|
||||
|
Undesignated preferred stock; 5,000 shares authorized, no shares issued and outstanding
|
—
|
|
—
|
|
|||
|
Common stock, $0.01 par value; 142,500 shares authorized, 38,813 and 43,569 shares issued and outstanding, respectively
|
388
|
|
436
|
|
|||
|
Additional paid-in capital
|
—
|
|
—
|
|
|||
|
Retained earnings
|
88,768
|
|
159,884
|
|
|||
|
Total shareholders’ equity
|
89,156
|
|
160,320
|
|
|||
|
Total liabilities and shareholders’ equity
|
$
|
471,834
|
|
$
|
457,166
|
|
|
See accompanying notes to consolidated financial statements.
37
SLEEP NUMBER CORPORATION
AND SUBSIDIARIES
Years ended
December 30, 2017
,
December 31, 2016
and
January 2, 2016
(in thousands, except per share amounts)
|
|
2017
|
2016
|
2015
|
||||||||
|
Net sales
|
$
|
1,444,497
|
|
$
|
1,311,291
|
|
$
|
1,213,699
|
|
||
|
Cost of sales
|
547,150
|
|
501,131
|
|
472,948
|
|
|||||
|
Gross profit
|
897,347
|
|
810,160
|
|
740,751
|
|
|||||
|
Operating expenses:
|
|
|
|
|
|||||||
|
Sales and marketing
|
650,357
|
|
595,845
|
|
550,475
|
|
|||||
|
General and administrative
|
127,269
|
|
109,674
|
|
99,209
|
|
|||||
|
Research and development
|
27,806
|
|
27,991
|
|
15,971
|
|
|||||
|
Total operating expenses
|
805,432
|
|
733,510
|
|
665,655
|
|
|||||
|
Operating income
|
91,915
|
|
76,650
|
|
75,096
|
|
|||||
|
Other (expense) income, net
|
(877
|
)
|
(717
|
)
|
334
|
|
|||||
|
Income before income taxes
|
91,038
|
|
75,933
|
|
75,430
|
|
|||||
|
Income tax expense
|
25,961
|
|
24,516
|
|
24,911
|
|
|||||
|
Net income
|
$
|
65,077
|
|
$
|
51,417
|
|
$
|
50,519
|
|
||
|
Basic net income per share:
|
|
|
|
|
|
|
|||||
|
Net income per share – basic
|
$
|
1.58
|
|
$
|
1.11
|
|
$
|
0.99
|
|
||
|
Weighted-average shares – basic
|
41,212
|
|
46,154
|
|
51,252
|
|
|||||
|
Diluted net income per share:
|
|
|
|
|
|
|
|||||
|
Net income per share – diluted
|
$
|
1.55
|
|
$
|
1.10
|
|
$
|
0.97
|
|
||
|
Weighted-average shares – diluted
|
42,085
|
|
46,902
|
|
52,101
|
|
|||||
See accompanying notes to consolidated financial statements.
38
SLEEP NUMBER CORPORATION
AND SUBSIDIARIES
Consolidated Statements of Comprehensive Income
Years ended
December 30, 2017
,
December 31, 2016
and
January 2, 2016
(in thousands)
|
|
2017
|
2016
|
2015
|
|||||||||
|
Net income
|
$
|
65,077
|
|
$
|
51,417
|
|
$
|
50,519
|
|
|||
|
Other comprehensive income – unrealized gain on available-for-sale marketable debt securities, net of income tax
|
—
|
|
14
|
|
20
|
|
||||||
|
Comprehensive income
|
$
|
65,077
|
|
$
|
51,431
|
|
$
|
50,539
|
|
|||
See accompanying notes to consolidated financial statements.
39
SLEEP NUMBER CORPORATION
AND SUBSIDIARIES
Consolidated Statements of Shareholders’ Equity
Years ended
December 30, 2017
,
December 31, 2016
and
January 2, 2016
(in thousands)
|
|
Common Stock
|
Additional
Paid-in
Capital
|
Retained
Earnings
|
Accumulated
Other
Comprehensive
Income/(Loss)
|
Total
|
|||||||||||||||||
|
Shares
|
Amount
|
|||||||||||||||||||||
|
Balance at January 3, 2015
|
52,798
|
|
$
|
528
|
|
$
|
—
|
|
$
|
256,413
|
|
$
|
(34
|
)
|
$
|
256,907
|
|
|||||
|
Net income
|
—
|
|
—
|
|
—
|
|
50,519
|
|
—
|
|
50,519
|
|
||||||||||
|
Other comprehensive income:
|
||||||||||||||||||||||
|
Unrealized gain on available-for-sale marketable debt securities, net of tax
|
—
|
|
—
|
|
—
|
|
—
|
|
20
|
|
20
|
|
||||||||||
|
Exercise of common stock options
|
253
|
|
3
|
|
2,973
|
|
—
|
|
—
|
|
2,976
|
|
||||||||||
|
Tax effect from stock-based compensation
|
—
|
|
—
|
|
1,828
|
|
—
|
|
—
|
|
1,828
|
|
||||||||||
|
Stock-based compensation
|
(7
|
)
|
—
|
|
10,290
|
|
—
|
|
—
|
|
10,290
|
|
||||||||||
|
Repurchases of common stock
|
(3,642
|
)
|
(37
|
)
|
(15,091
|
)
|
(85,073
|
)
|
—
|
|
(100,201
|
)
|
||||||||||
|
Balance at January 2, 2016
|
49,402
|
|
$
|
494
|
|
$
|
—
|
|
$
|
221,859
|
|
$
|
(14
|
)
|
$
|
222,339
|
|
|||||
|
Net income
|
—
|
|
—
|
|
—
|
|
51,417
|
|
—
|
|
51,417
|
|
||||||||||
|
Other comprehensive income:
|
||||||||||||||||||||||
|
Unrealized gain on available-for-sale marketable debt securities, net of tax
|
—
|
|
—
|
|
—
|
|
—
|
|
14
|
|
14
|
|
||||||||||
|
Exercise of common stock options
|
188
|
|
2
|
|
2,296
|
|
—
|
|
—
|
|
2,298
|
|
||||||||||
|
Tax effect from stock-based compensation
|
—
|
|
—
|
|
(1,016
|
)
|
—
|
|
—
|
|
(1,016
|
)
|
||||||||||
|
Stock-based compensation
|
11
|
|
—
|
|
11,961
|
|
—
|
|
—
|
|
11,961
|
|
||||||||||
|
Repurchases of common stock
|
(6,032
|
)
|
(60
|
)
|
(13,241
|
)
|
(113,392
|
)
|
—
|
|
(126,693
|
)
|
||||||||||
|
Balance at December 31, 2016
|
43,569
|
|
$
|
436
|
|
$
|
—
|
|
$
|
159,884
|
|
$
|
—
|
|
$
|
160,320
|
|
|||||
|
Net income
|
—
|
|
—
|
|
—
|
|
65,077
|
|
—
|
|
65,077
|
|
||||||||||
|
Exercise of common stock options
|
222
|
|
2
|
|
3,239
|
|
—
|
|
—
|
|
3,241
|
|
||||||||||
|
Stock-based compensation
|
594
|
|
6
|
|
15,757
|
|
—
|
|
—
|
|
15,763
|
|
||||||||||
|
Repurchases of common stock
|
(5,572
|
)
|
(56
|
)
|
(18,996
|
)
|
(136,193
|
)
|
—
|
|
(155,245
|
)
|
||||||||||
|
Balance at December 30, 2017
|
38,813
|
|
$
|
388
|
|
$
|
—
|
|
$
|
88,768
|
|
$
|
—
|
|
$
|
89,156
|
|
|||||
See accompanying notes to consolidated financial statements.
40
SLEEP NUMBER CORPORATION
AND SUBSIDIARIES
Years Ended
December 30, 2017
,
December 31, 2016
and
January 2, 2016
(in thousands)
|
|
2017
|
2016
|
2015
|
||||||||
|
Cash flows from operating activities:
|
|
|
|||||||||
|
Net income
|
$
|
65,077
|
|
$
|
51,417
|
|
$
|
50,519
|
|
||
|
Adjustments to reconcile net income to net cash provided by operating activities:
|
|
|
|
|
|
||||||
|
Depreciation and amortization
|
61,291
|
|
57,172
|
|
47,630
|
|
|||||
|
Stock-based compensation
|
15,763
|
|
11,961
|
|
10,290
|
|
|||||
|
Net loss on disposals and impairments of assets
|
249
|
|
27
|
|
190
|
|
|||||
|
Excess tax benefits from stock-based compensation
|
—
|
|
(517
|
)
|
(2,182
|
)
|
|||||
|
Deferred income taxes
|
2,042
|
|
(1,640
|
)
|
11,924
|
|
|||||
|
Gain on sale of non-marketable equity securities
|
—
|
|
—
|
|
(6,891
|
)
|
|||||
|
Changes in operating assets and liabilities, net of effect of acquisition:
|
|
|
|
||||||||
|
Accounts receivable
|
393
|
|
9,297
|
|
(9,259
|
)
|
|||||
|
Inventories
|
(9,272
|
)
|
11,574
|
|
(33,065
|
)
|
|||||
|
Income taxes
|
1,697
|
|
25,119
|
|
(13,943
|
)
|
|||||
|
Prepaid expenses and other assets
|
(12,405
|
)
|
(2,195
|
)
|
8,680
|
|
|||||
|
Accounts payable
|
21,779
|
|
(4,965
|
)
|
19,130
|
|
|||||
|
Customer prepayments
|
1,560
|
|
(25,266
|
)
|
22,735
|
|
|||||
|
Accrued compensation and benefits
|
15,398
|
|
2,808
|
|
(17,493
|
)
|
|||||
|
Other taxes and withholding
|
(893
|
)
|
2,723
|
|
135
|
|
|||||
|
Other accruals and liabilities
|
9,928
|
|
14,130
|
|
19,542
|
|
|||||
|
Net cash provided by operating activities
|
172,607
|
|
151,645
|
|
107,942
|
|
|||||
|
Cash flows from investing activities:
|
|
|
|||||||||
|
Purchases of property and equipment
|
(59,829
|
)
|
(57,852
|
)
|
(85,586
|
)
|
|||||
|
Decrease in restricted cash
|
3,150
|
|
—
|
|
—
|
|
|||||
|
Proceeds from sales of property and equipment
|
36
|
|
92
|
|
72
|
|
|||||
|
Proceeds from marketable debt securities
|
—
|
|
21,053
|
|
127,664
|
|
|||||
|
Investments in marketable debt securities
|
—
|
|
(5,968
|
)
|
(29,299
|
)
|
|||||
|
Acquisition of business
|
—
|
|
—
|
|
(70,018
|
)
|
|||||
|
Proceeds from non-marketable equity securities
|
—
|
|
—
|
|
12,891
|
|
|||||
|
Net cash used in investing activities
|
(56,643
|
)
|
(42,675
|
)
|
(44,276
|
)
|
|||||
|
Cash flows from financing activities:
|
|
|
|
|
|||||||
|
Repurchases of common stock
|
(155,245
|
)
|
(126,693
|
)
|
(100,201
|
)
|
|||||
|
Net increase in short-term borrowings
|
28,094
|
|
5,932
|
|
1,097
|
|
|||||
|
Proceeds from issuance of common stock
|
3,241
|
|
2,298
|
|
2,976
|
|
|||||
|
Debt issuance costs
|
(12
|
)
|
(409
|
)
|
(721
|
)
|
|||||
|
Excess tax benefits from stock-based compensation
|
—
|
|
517
|
|
2,182
|
|
|||||
|
Net cash used in financing activities
|
(123,922
|
)
|
(118,355
|
)
|
(94,667
|
)
|
|||||
|
Net decrease in cash and cash equivalents
|
(7,958
|
)
|
(9,385
|
)
|
(31,001
|
)
|
|||||
|
Cash and cash equivalents, at beginning of period
|
11,609
|
|
20,994
|
|
51,995
|
|
|||||
|
Cash and cash equivalents, at end of period
|
$
|
3,651
|
|
$
|
11,609
|
|
$
|
20,994
|
|
||
|
Supplemental Disclosure of Cash Flow Information
|
|||||||||||
|
Income taxes paid (received)
|
$
|
22,807
|
|
$
|
(653
|
)
|
$
|
26,681
|
|
||
|
Interest paid
|
$
|
753
|
|
$
|
608
|
|
$
|
96
|
|
||
|
Purchases of property and equipment included in accounts payable
|
$
|
3,964
|
|
$
|
5,517
|
|
$
|
5,051
|
|
||
See accompanying notes to consolidated financial statements.
41
SLEEP NUMBER CORPORATION
AND SUBSIDIARIES
Notes to Consolidated Financial Statements
(1) Business and Summary of Significant Accounting Policies
Business & Basis of Presentation
Sleep Number Corporation (previously Select Comfort Corporation) and our 100%-owned subsidiaries (Sleep Number or the Company) have a vertically integrated business model and are the exclusive designer, manufacturer, marketer, retailer and servicer of Sleep Number® beds. We are the pioneer in biometric sleep tracking and adjustability. Only the Sleep Number bed offers SleepIQ technology - a proprietary sensor technology that tracks each individual's sleep and works directly with the bed’s DualAir system to automatically adjust the comfort level of each sleeper. SleepIQ technology communicates how you slept and provides insights on what adjustments you can make to optimize your sleep and improve your daily life. Sleep Number also offers FlextFit adjustable bases, and Sleep Number pillows, sheets and other bedding products.
We generate revenue by marketing our innovations to new and existing customers, and selling products through two distribution channels. Our Company-Controlled channel, which includes retail, online and phone, sells directly to consumers. Our Wholesale/Other channel sells to and through selected retail and wholesale customers in the United States.
The consolidated financial statements include the accounts of Sleep Number Corporation and our subsidiaries. All significant intra-entity balances and transactions have been eliminated in consolidation.
Fiscal Year
Our fiscal year ends on the Saturday closest to December 31. Fiscal years and their respective fiscal year ends were as follows: fiscal
2017
ended
December 30, 2017
; fiscal
2016
ended
December 31, 2016
; and fiscal
2015
ended
January 2, 2016
. Fiscal years 2017, 2016 and 2015 each had 52 weeks.
Use of Estimates in the Preparation of Financial Statements
The preparation of consolidated financial statements in conformity with U.S. generally accepted accounting principles (GAAP) requires us to make estimates and assumptions. These estimates and assumptions affect the reported amounts of assets and liabilities, disclosure of contingent assets and liabilities at the date of the consolidated financial statements, and the reported amounts of sales, expenses and income taxes during the reporting period. Predicting future events is inherently an imprecise activity and, as such, requires the use of judgment. As future events and their effects cannot be determined with precision, actual results could differ significantly from these estimates. Changes in these estimates will be reflected in the financial statements in future periods. Our critical accounting policies consist of stock-based compensation, goodwill and indefinite-lived intangible assets, warranty liabilities and revenue recognition.
Cash and Cash Equivalents
Cash and cash equivalents include highly liquid investments with original maturities of three months or less. The carrying value of these investments approximates fair value due to their short-term maturity. Our banking arrangements allow us to fund outstanding checks when presented to the financial institution for payment, resulting in book overdrafts. Book overdrafts are included in accounts payable in our consolidated balance sheets and in net increase in short-term borrowings in the financing activities section of our consolidated statements of cash flows. Book overdrafts totaled
$30 million
and
$27 million
at
December 30, 2017
, and
December 31, 2016
, respectively.
Concentration of Credit Risk
Our investment policy’s primary focus is to preserve principal and maintain adequate liquidity. Our investment policy addresses the concentration of credit risk by limiting the concentration in certain investment types. Our exposure to a concentration of credit risk consists primarily of cash and cash equivalents. We place our cash with high-credit quality issuers and financial institutions. Prior to 2017 we held investments in U.S. agency securities, corporate debt securities and municipal bonds. We believe no significant concentration of credit risk exists with respect to our cash and cash equivalents.
42
SLEEP NUMBER CORPORATION
AND SUBSIDIARIES
Notes to Consolidated Financial Statements - (continued)
Accounts Receivable
Accounts receivable are recorded net of an allowance for expected losses and consist primarily of receivables from wholesale customers and receivables from third-party financiers for customer credit card purchases. The allowance is recognized in an amount equal to anticipated future write-offs. We estimate future write-offs based on delinquencies, aging trends, industry risk trends, our historical experience and current trends. Account balances are charged off against the allowance when we believe it is probable the receivable will not be recovered.
Inventories
Inventories include materials, labor and overhead and are stated at the lower of cost or net realizable value. Cost is determined by the first-in, first-out method.
Property and Equipment
Property and equipment, carried at cost, is depreciated using the straight-line method over the estimated useful lives of the assets. The cost and related accumulated depreciation of assets sold or retired is removed from the accounts with any resulting gain or loss included in net income in our consolidated statements of operations. Maintenance and repairs are charged to expense as incurred. Major renewals and betterments that extend useful life are capitalized.
Leasehold improvements are depreciated over the shorter of the estimated useful lives of the assets or the contractual term of the lease, with consideration of lease renewal options if renewal appears probable.
Estimated useful lives of our property and equipment by major asset category are as follows:
|
Leasehold improvements
|
5 to 15 years
|
|
Furniture and equipment
|
5 to 15 years
|
|
Production machinery
|
3 to 7 years
|
|
Computer equipment and software
|
3 to 12 years
|
Goodwill and Intangible Assets, Net
Goodwill is the difference between the purchase price of a company and the fair market value of the acquired company's net identifiable assets. Our intangible assets include developed technologies, trade names/trademarks and customer relationships. Definite-lived intangible assets are being amortized using the straight-line method over their estimated lives, ranging from
8
-
10
years.
Asset Impairment Charges
Long-lived Assets and Definite-lived Intangible Assets
- we review our long-lived assets and definite-lived intangible assets for impairment whenever events or changes in circumstances indicate that the carrying amount of an asset may not be recoverable. When evaluating long-lived assets for potential impairment, we first compare the carrying value of the asset to the estimated future cash flows (undiscounted and without interest charges - plus proceeds expected from disposition, if any). If the estimated undiscounted cash flows are less than the carrying value of the asset, we calculate an impairment loss. The impairment loss calculation compares the carrying value of the asset to the asset’s estimated fair value. When we recognize an impairment loss, the carrying amount of the asset is reduced to estimated fair value based on discounted cash flows, quoted market prices or other valuation techniques. Assets to be disposed of are reported at the lower of the carrying amount of the asset or fair value less costs to sell. We review retail store assets for potential impairment based on historical cash flows, lease termination provisions and expected future retail store operating results. If we recognize an impairment loss for a depreciable long-lived asset, the adjusted carrying amount of the asset becomes its new cost basis and will be depreciated (amortized) over the remaining useful life of that asset.
Goodwill and Indefinite-lived Intangible Assets
- goodwill and indefinite-lived intangible assets are not amortized, but are tested for impairment annually or when there are indicators of impairment using a fair value approach. The Financial Accounting Standards Board's (FASB) guidance allows us to perform either a quantitative assessment or a qualitative assessment before calculating the fair
43
SLEEP NUMBER CORPORATION
AND SUBSIDIARIES
Notes to Consolidated Financial Statements - (continued)
value of a reporting unit. We have elected to perform the quantitative assessment. The quantitative goodwill impairment test is a two-step process. The first step is a comparison of the fair value of the reporting unit with its carrying amount, including goodwill. If this step reflects impairment, then the loss would be measured as the excess of recorded goodwill over its implied fair value. Implied fair value is the excess of fair value of the reporting unit over the fair value of all identified assets and liabilities. Fair value is determined using a market-based approach utilizing widely accepted valuation techniques, including quoted market prices and our market capitalization. Indefinite-lived intangible assets are assessed for impairment by comparing the carrying value of an asset with its fair value. If the carrying value exceeds fair value, an impairment loss is recognized in an amount equal to the excess. Based on our
2017
assessments, we determined there was no impairment.
Warranty Liabilities
We provide a limited warranty on most of the products we sell. The estimated warranty costs, which are expensed at the time of sale and included in cost of sales, are based on historical trends and warranty claim rates incurred by us and are adjusted for any current trends as appropriate. Actual warranty claim costs could differ from these estimates. We regularly assess and adjust the estimate of accrued warranty claims by updating claims rates for actual trends and projected claim costs.
We classify as non-current those estimated warranty costs expected to be paid out in greater than one year. The activity in the accrued warranty liabilities account was as follows (in thousands):
|
|
2017
|
2016
|
2015
|
||||||||
|
Balance at beginning of period
|
$
|
8,633
|
|
$
|
10,028
|
|
$
|
5,824
|
|
||
|
Additions charged to costs and expenses for current-year sales
|
12,214
|
|
9,034
|
|
9,368
|
|
|||||
|
Deductions from reserves
|
(10,752
|
)
|
(10,016
|
)
|
(6,486
|
)
|
|||||
|
Changes in liability for pre-existing warranties during the current year, including expirations
|
(775
|
)
|
(413
|
)
|
1,322
|
|
|||||
|
Balance at end of period
|
$
|
9,320
|
|
$
|
8,633
|
|
$
|
10,028
|
|
||
Fair Value Measurements
Fair value measurements are reported in one of three levels based on the lowest level of significant input used:
|
•
|
Level 1 – observable inputs such as quoted prices in active markets;
|
|
•
|
Level 2 – inputs, other than the quoted prices in active markets, that are observable either directly or indirectly; and
|
|
•
|
Level 3 – unobservable inputs in which there is little or no market data, which require the reporting entity to develop its own assumptions.
|
We generally estimate fair value of long-lived assets, including our retail stores, using the income approach, which we base on estimated future cash flows (discounted and with interest charges). The inputs used to determine fair value relate primarily to future assumptions regarding sales volumes, gross profit rates, retail store operating expenses and applicable probability weightings regarding future alternative uses. These inputs are categorized as Level 3 inputs under the fair value measurements guidance. The inputs used represent management’s assumptions about what information market participants would use in pricing the assets and are based upon the best information available at the balance sheet date.
Dividends
We are not restricted from paying cash dividends under our credit agreement so long as we are not in default under the credit agreement and so long as the payment of such dividends would not create an event of default. However, we have not historically paid, and have no current plans to pay, cash dividends on our common stock.
Revenue Recognition
Revenue is recognized when the sales price is fixed or determinable, collectability is reasonably assured and title passes. Amounts billed to customers for delivery and setup are included in net sales. Revenue is reported net of estimated sales returns and excludes sales taxes.
44
SLEEP NUMBER CORPORATION
AND SUBSIDIARIES
Notes to Consolidated Financial Statements - (continued)
We accept sales returns during a 100-night trial period. The accrued sales returns estimate is based on historical return rates and is adjusted for any current trends as appropriate. If actual returns vary from expected rates, sales in future periods are adjusted.
Our SleepIQ system is a multiple-element arrangement with deliverables that include a bed, hardware and software. We analyze our multiple-element arrangement(s) to determine whether the deliverables can be separated or whether they must be accounted for as a single unit of accounting. We determined that the SleepIQ system has two units of accounting consisting of: (i) the bed; and (ii) the hardware/software. The hardware and software are not separable as the hardware and related software are not sold separately and the software is integral to the hardware’s functionality. We valued the two units of accounting based on their relative selling prices.
At
December 30, 2017
and
December 31, 2016
, we had deferred revenue totaling
$73 million
and
$61 million
, of which
$30 million
and
$21 million
are included in other current liabilities, respectively, and
$43 million
and
$40 million
are included in other non-current liabilities, respectively, in our consolidated balance sheets. We also have related deferred costs totaling
$43 million
and
$33 million
, of which
$17 million
and
$12 million
are included in other current assets, respectively, and
$26 million
and
$22 million
are included in other non-current assets, respectively, in our consolidated balance sheets. The deferred revenue and costs are recognized over the product’s estimated life of
four years
.
Cost of Sales, Sales and Marketing, General and Administrative (G&A) and Research & Development (R&D) Expenses
The following tables summarize the primary costs classified in each major expense category (the classification of which may vary within our industry):
|
Cost of Sales
|
|
Sales & Marketing
|
|
• Costs associated with purchasing, manufacturing, shipping, handling and delivering our products to our retail stores and customers;
• Physical inventory losses, scrap and obsolescence;
• Related occupancy and depreciation expenses;
• Costs associated with returns and exchanges; and
• Estimated costs to service customer warranty claims.
|
|
• Advertising, marketing and media production;
• Marketing and selling materials such as brochures, videos, websites, customer mailings and in-store signage;
• Payroll and benefits for sales and customer service staff;
• Store occupancy costs;
• Store depreciation expense;
• Credit card processing fees; and
• Promotional financing costs.
|
|
G&A
|
|
R&D
(1)
|
|
• Payroll and benefit costs for corporate employees, including information technology, legal, human resources, finance, sales and marketing administration, investor relations and risk management;
• Occupancy costs of corporate facilities;
• Depreciation related to corporate assets;
• Information hardware, software and maintenance;
• Insurance;
• Investor relations costs; and
• Other overhead costs.
|
|
• Internal labor and benefits related to research and development activities;
• Outside consulting services related to research and development activities; and
• Testing equipment related to research and development activities.
(1)
Costs incurred in connection with R&D are charged to expense as incurred.
|
45
SLEEP NUMBER CORPORATION
AND SUBSIDIARIES
Notes to Consolidated Financial Statements - (continued)
Operating Leases
We lease our retail, office and manufacturing space under operating leases which, in addition to the minimum lease payments, may require payment of a proportionate share of the real estate taxes and certain building operating expenses. Our retail store leases generally provide for an initial lease term of
five
to
10
years. In addition, our mall-based retail store leases may require payment of contingent rent based on net sales in excess of certain thresholds. Certain retail store leases may contain options to extend the term of the original lease.
Minimum rent expense, which excludes contingent rents, is recognized on a straight-line basis over the lease term, after consideration of rent escalations and rent holidays. We record any difference between the straight-line rent amounts and amounts payable under the leases as part of deferred rent, in other current liabilities or other non-current liabilities, as appropriate. The lease term for purposes of the calculation begins on the earlier of the lease commencement date or the date we take possession of the property. During lease renewal negotiations that extend beyond the original lease term, we estimate straight-line rent expense based on current market conditions. At
December 30, 2017
, and
December 31, 2016
, deferred rent included in other current liabilities in our consolidated balance sheets was
$1 million
and
$0.2 million
, respectively, and deferred rent included in other non-current liabilities in our consolidated balance sheets was
$10 million
and
$10 million
, respectively. Contingent rent expense is recorded when it is probable the expense has been incurred and the amount is reasonably estimable. Future payments for real estate taxes and certain building operating expenses for which we are obligated are not included in minimum lease payments.
Leasehold improvements that are funded by landlord incentives or allowances under an operating lease are recorded as deferred lease incentives, in other current liabilities or other non-current liabilities, as appropriate and amortized as reductions to rent expense over the lease term. At
December 30, 2017
, and
December 31, 2016
, deferred lease incentives included in other current liabilities in our consolidated balance sheets were
$3 million
and
$3 million
, respectively, and deferred lease incentives included in other non-current liabilities in our consolidated balance sheets were
$10 million
and
$9 million
, respectively.
Pre-Opening Costs
Costs associated with the start-up and promotion of new retail store openings are expensed as incurred.
Advertising Costs
We incur advertising costs associated with print, digital and broadcast advertisements. Advertising costs are charged to expense when the ad first runs. Advertising expense was
$194 million
,
$190 million
and
$181 million
in
2017
,
2016
and
2015
, respectively. Advertising costs deferred and included in prepaid expenses in our consolidated balance sheets were
$2 million
and
$1 million
as of
December 30, 2017
, and
December 31, 2016
, respectively.
Insurance
We are self-insured for certain losses related to health and workers’ compensation claims, although we obtain third-party insurance coverage to limit exposure to these claims. We estimate our self-insured liabilities using a number of factors including historical claims experience and analysis of incurred but not reported claims. Our self-insurance liability was
$8 million
and
$6 million
at
December 30, 2017
, and
December 31, 2016
, respectively. At
December 30, 2017
, and
December 31, 2016
,
$5 million
and
$3 million
, respectively, were included in compensation and benefits in our consolidated balance sheets and
$3 million
and
$3 million
, respectively, were included in other non-current liabilities in our consolidated balance sheets.
Software Capitalization
For software developed or obtained for internal use, we capitalize direct external costs associated with developing or obtaining internal-use software. In addition, we capitalize certain payroll and payroll-related costs for employees who are directly involved with the development of such applications. Capitalized costs related to internal-use software under development are treated as construction-in-progress until the program, feature or functionality is ready for its intended use, at which time depreciation commences. We expense any data conversion or training costs as incurred.
46
SLEEP NUMBER CORPORATION
AND SUBSIDIARIES
Notes to Consolidated Financial Statements - (continued)
Stock-Based Compensation
We compensate officers, directors and key employees with stock-based compensation under
two
stock plans approved by our shareholders in 2004 and 2010 and administered under the supervision of our Board of Directors (Board). At
December 30, 2017
, a total of
2.6 million
shares were available for future grant under the 2010 stock plan. These plans include non-qualified stock options and stock awards.
We record stock-based compensation expense based on the award’s fair value at the grant date and the awards that are expected to vest. We recognize stock-based compensation expense over the period during which an employee is required to provide services in exchange for the award. We reduce compensation expense by estimated forfeitures. Forfeitures are estimated using historical experience and projected employee turnover. Beginning in 2017, we include, as part of cash flows from operating activities, the benefit of tax deductions in excess of recognized stock-based compensation expense. In addition, excess tax benefits or deficiencies that in prior years were recorded in additional paid-in capital are now recorded as discrete adjustments to income tax expense. See "
New Accounting Pronouncements
" below regarding revised guidance for stock-based compensation in 2017.
Stock Options
- stock option awards are granted at exercise prices equal to the closing price of our stock on the grant date. Generally, options vest proportionally over
three years
and expire after
10 years
. Compensation expense is recognized ratably over the vesting period.
We determine the fair value of stock options granted and the resulting compensation expense at the date-of-grant using the Black-Scholes-Merton option-pricing model. Descriptions of significant assumptions used to estimate the expected volatility, risk-free interest rate and expected term are as follows:
Expected Volatility
– expected volatility was determined based on implied volatility of our traded options and historical volatility of our stock price.
Risk-Free Interest Rate
– the risk-free interest rate was based on the implied yield available on U.S. Treasury zero-coupon issues at the date of grant with a term equal to the expected term.
Expected Term –
expected term represents the period that our stock-based awards are expected to be outstanding and was determined based on historical experience and anticipated future exercise patterns, giving consideration to the contractual terms of unexercised stock-based awards.
Stock Awards
- we issue stock awards to certain employees in conjunction with our stock-based compensation plan. The stock awards generally vest over three years based on continued employment (time-based). Compensation expense related to stock awards, except for stock awards with a market condition, is determined on the grant date based on the publicly quoted closing price of our common stock and is charged to earnings on a straight-line basis over the vesting period. Stock awards with a market condition are valued using a Monte Carlo simulation model. The significant assumptions used to estimate the expected volatility and risk-free interest rate are similar to those described above in
Stock Options.
Certain time-based stock awards have a performance condition (performance-based). The final number of shares earned for performance-based stock awards and the related compensation expense is adjusted up or down to the extent the performance target is met as of the last day of the performance period. The actual number of shares that will ultimately be awarded range from
0%
-
200%
of the targeted amount for the
2017
,
2016
and
2015
awards. We evaluate the likelihood of meeting the performance targets at each reporting period and adjust compensation expense, on a cumulative basis, based on the expected achievement of each of the performance targets. For performance-based stock awards granted in
2017
,
2016
and
2015
, the performance targets are growth in net sales and in operating profit, and the performance periods are fiscal 2017 through 2019, fiscal 2016 through 2018, and 2015 through 2017, respectively.
See Note 9,
Shareholders’ Equity
, for additional information on stock-based compensation.
47
SLEEP NUMBER CORPORATION
AND SUBSIDIARIES
Notes to Consolidated Financial Statements - (continued)
Income Taxes
We recognize deferred tax assets and liabilities for the future tax consequences attributable to temporary differences between the financial statement carrying amounts of existing assets and liabilities and their respective tax bases. Deferred tax assets and liabilities are measured using enacted tax rates expected to apply to taxable income in the years in which those temporary differences are expected to be recovered or settled. The effect on deferred tax assets and liabilities of a change in tax rates is recognized in income in the period that includes the enactment date. A valuation allowance is established for any portion of deferred tax assets that are not considered more likely than not to be realized. We evaluate all available positive and negative evidence, including our forecast of future taxable income, to assess the need for a valuation allowance on our deferred tax assets.
We record a liability for unrecognized tax benefits from uncertain tax positions taken, or expected to be taken, in our tax returns. We follow a two-step approach to recognizing and measuring uncertain tax positions. The first step is to evaluate the tax position for recognition by determining if the available evidence indicates it is more likely than not that the position will be sustained on audit, including resolution of related appeals or litigation processes, if any. The second step is to measure the tax benefit as the largest amount which is more than 50% likely of being realized upon ultimate settlement. We consider many factors when evaluating and estimating our tax positions and tax benefits, which may require periodic adjustments, and may not accurately forecast actual outcomes.
We classify net interest and penalties related to income taxes as a component of income tax expense in our consolidated statements of operations.
Net Income Per Share
We calculate basic net income per share by dividing net income by the weighted-average number of common shares outstanding during the period. We calculate diluted net income per share based on the weighted-average number of common shares outstanding adjusted by the number of potentially dilutive common shares as determined by the treasury stock method. Potentially dilutive shares consist of stock options and stock awards.
Sources of Supply
We currently obtain materials and components used to produce our beds from outside sources. As a result, we are dependent upon suppliers that in some instances, are our sole source of supply. We are continuing our efforts to dual-source key components. The failure of one or more of our suppliers to provide us with materials or components on a timely basis could significantly impact our consolidated results of operations and net income per share. We believe we can obtain these raw materials and components from other sources of supply in the ordinary course of business, although an unexpected loss of supply over a short period of time may not allow us to replace these sources in the ordinary course of business.
New Accounting Pronouncements
Recently Adopted Accounting Guidance
In March 2016, the Financial Accounting Standards Board (FASB) issued new guidance on the accounting for, and disclosure of, stock-based compensation which we adopted effective January 1, 2017. The new guidance is intended to simplify several aspects of the accounting for stock-based compensation arrangements, including the income tax impact, forfeitures and classification on the statement of cash flows. Under the previous guidance, excess tax benefits and deficiencies were recognized in additional paid-in capital in the consolidated balance sheets. Upon adoption of the new guidance, these excess tax benefits or deficiencies are required to be recognized as discrete adjustments to income tax expense in the consolidated statements of operations on a prospective basis. During fiscal 2017, excess tax benefits of
$1.4 million
were recognized as a reduction of income tax expense, rather than in additional paid-in capital.
In addition, under the new guidance, excess income tax benefits from stock-based compensation arrangements are classified as an operating activity in the statement of cash flows rather than as a financing activity. This resulted in an increase to operating cash flows of
$2.3 million
for fiscal 2017. We elected to apply the new cash flow classification guidance prospectively. The prior-years'
48
SLEEP NUMBER CORPORATION
AND SUBSIDIARIES
Notes to Consolidated Financial Statements - (continued)
statements of cash flows have not been adjusted. We have also elected to continue to estimate the number of stock-based awards expected to vest, as permitted by the new guidance, rather than electing to account for forfeitures as they occur.
Accounting Guidance Issued but Not Yet Adopted as of December 30, 2017
In May 2014, the FASB issued a comprehensive new revenue recognition model that requires a company to recognize revenue in a manner that depicts the transfer of goods or services to a customer at an amount that reflects the consideration it expects to receive in exchange for those goods or services. This new guidance will be effective for us beginning December 31, 2017 and we will use the modified retrospective transition method. Under this method, we will recognize the cumulative effect of the changes in retained earnings at December 31, 2017, but will not restate prior periods.
We have substantially completed our evaluation of the impact of the new revenue recognition standard on our consolidated financial statements and have determined that the transition adjustments to be recorded upon adoption are not material and we do not expect material changes in the timing of revenue recognition. We continue to evaluate the impact of the new standard on our disclosures. We also expect that the adoption and changes to our ongoing procedures and methodologies will require adjustments to our internal controls over financial reporting.
In February 2016, the FASB issued new guidance on accounting for leases that generally requires most leases to be recognized on the balance sheet. This new guidance is effective for reporting periods beginning after December 15, 2018. The provisions of this new guidance are to be applied using a modified retrospective approach, with elective reliefs, which requires application of the new guidance for all periods presented. We are evaluating the effect of the new standard on our consolidated financial statements and related disclosures. We are the lessee under various agreements for facilities and equipment that are currently accounted for as operating leases. A discussion of our operating leases is included in Note 1,
Business and Summary of Significant Accounting Policies,
and Note 7,
Leases
. This new guidance is effective for us beginning December 30, 2018.
(2) Acquisition of BAM Labs, Inc.
In September 2015, we completed the acquisition of BAM Labs, Inc. (now operating as SleepIQ LABS), the leading provider of biometric sensor and sleep monitoring for data-driven health and wellness. The addition of SleepIQ LABS strengthened Sleep Number’s leadership in sleep innovation, adjustability and individualization. The acquisition broadened and deepened our electrical, biomedical, software and backend capabilities - API (application program interface), and bio-signal analysis. Our ownership and control of biometric data advances smart, connected products that empower our customers with the knowledge to adjust for their best sleep.
We previously held a
$6 million
minority equity investment in BAM Labs, Inc. based on the cost method. We acquired the remaining capital stock of BAM Labs, Inc. for
$57 million
for a total enterprise value of
$70 million
. In connection with the acquisition, our equity investment was remeasured to a fair value of
$13 million
resulting in a
$4 million
gain net of expenses, including
$3 million
of acquisition-related expenses. The remeasured fair value of our equity investment was based on the fair value of BAM Labs, Inc. at the acquisition date. The net gain of
$4 million
was included in general and administrative expenses on our consolidated statement of operations for the year ended January 2, 2016. The acquisition of SleepIQ LABS did not have a significant impact on our consolidated results of operations, operating cash flows or financial position for the years ended December 30, 2017, December 31, 2016 or January 2, 2016.
49
SLEEP NUMBER CORPORATION
AND SUBSIDIARIES
Notes to Consolidated Financial Statements - (continued)
The following table summarizes the fair value of the net assets acquired as of the acquisition date (in thousands):
|
Accounts receivable
|
$
|
105
|
|
|
Prepaid expenses
|
98
|
|
|
|
Property and equipment
|
91
|
|
|
|
Deferred income taxes
|
2,754
|
|
|
|
Goodwill
|
55,083
|
|
|
|
Intangible assets
|
13,619
|
|
|
|
Total assets acquired
|
71,750
|
|
|
|
Accounts payable
|
269
|
|
|
|
Compensation and benefits
|
322
|
|
|
|
Other non-current liabilities
|
1,141
|
|
|
|
Total liabilities acquired
|
1,732
|
|
|
|
Net assets acquired
|
$
|
70,018
|
|
Intangible assets of
$14 million
consisted of developed technologies with an estimated useful life of
eight years
. The goodwill will not be deductible for income tax purposes.
(3) Fair Value Measurements
At
December 30, 2017
and
December 31, 2016
, we had
$4 million
and
$2 million
, respectively, of debt and equity securities that fund our deferred compensation plan and are classified in other non-current assets. We also had corresponding deferred compensation plan liabilities of
$4 million
and
$2 million
at
December 30, 2017
and
December 31, 2016
, respectively, which are included in other non-current liabilities. The majority of the debt and equity securities are Level 1 as they trade with sufficient frequency and volume to enable us to obtain pricing information on an ongoing basis. Unrealized gains/(losses) on the debt and equity securities offset those associated with the corresponding deferred compensation plan liabilities.
(4) Inventories
Inventories consisted of the following (in thousands):
|
|
December 30,
2017 |
December 31,
2016 |
|||||
|
Raw materials
|
$
|
6,577
|
|
$
|
7,973
|
|
|
|
Work in progress
|
170
|
|
72
|
|
|||
|
Finished goods
|
77,551
|
|
66,981
|
|
|||
|
|
$
|
84,298
|
|
$
|
75,026
|
|
|
Our finished goods inventory, as of
December 30, 2017
, was comprised of
$25 million
of finished beds, including retail display beds and deliveries in-transit to those customers who have utilized home delivery services,
$35 million
of finished components that were ready for assembly for the completion of beds, and
$18 million
of retail accessories.
Our finished goods inventory, as of
December 31, 2016
, was comprised of
$21 million
of finished beds, including retail display beds and deliveries in-transit to those customers who have utilized home delivery services,
$29 million
of finished components that were ready for assembly for the completion of beds, and
$17 million
of retail accessories.
50
SLEEP NUMBER CORPORATION
AND SUBSIDIARIES
Notes to Consolidated Financial Statements - (continued)
(5) Property and Equipment
Property and equipment consisted of the following (in thousands):
|
|
December 30,
2017 |
December 31,
2016 |
||||||
|
Land
|
$
|
1,999
|
|
$
|
1,999
|
|
||
|
Leasehold improvements
|
102,495
|
|
97,600
|
|
||||
|
Furniture and equipment
|
94,265
|
|
81,541
|
|
||||
|
Production machinery, computer equipment and software
|
224,758
|
|
209,900
|
|
||||
|
Construction in progress
|
5,661
|
|
13,823
|
|
||||
|
Less: Accumulated depreciation and amortization
|
(220,532
|
)
|
(196,496
|
)
|
||||
|
|
$
|
208,646
|
|
$
|
208,367
|
|
||
(6) Goodwill and Intangible Assets, Net
Goodwill and Indefinite-Lived Intangible Assets
Goodwill was
$64 million
at
December 30, 2017
and
December 31, 2016
. Indefinite-lived trade name/trademarks totaled
$1.4 million
at
December 30, 2017
and
December 31, 2016
.
Definite-Lived Intangible Assets
The following table provides the gross carrying amount and related accumulated amortization of our definite-lived intangible assets (in thousands):
|
December 30, 2017
|
December 31, 2016
|
||||||||||||||
|
Gross Carrying
Amount
|
Accumulated
Amortization
|
Gross Carrying
Amount
|
Accumulated
Amortization
|
||||||||||||
|
Developed technologies
|
$
|
18,851
|
|
$
|
6,705
|
|
$
|
18,851
|
|
$
|
4,524
|
|
|||
|
Customer relationships
|
2,413
|
|
2,413
|
|
2,413
|
|
1,365
|
|
|||||||
|
Trade names/trademarks
|
101
|
|
101
|
|
101
|
|
101
|
|
|||||||
|
$
|
21,365
|
|
$
|
9,219
|
|
$
|
21,365
|
|
$
|
5,990
|
|
||||
Amortization expense in
2017
,
2016
and
2015
for definite-lived intangible assets was
$3 million
,
$2 million
and
$1 million
, respectively. Annual amortization for definite-lived intangible assets is expected to be approximately
$2 million
for 2018 through 2022.
(7) Leases
Rent expense was as follows (in thousands):
|
Facility Rents:
|
2017
|
2016
|
2015
|
|||||||||
|
Minimum rents
|
$
|
66,239
|
|
$
|
59,002
|
|
$
|
52,650
|
|
|||
|
Contingent rents
|
2,845
|
|
3,099
|
|
5,168
|
|
||||||
|
Total
|
$
|
69,084
|
|
$
|
62,101
|
|
$
|
57,818
|
|
|||
|
Equipment Rents
|
$
|
4,935
|
|
$
|
5,316
|
|
$
|
4,362
|
|
|||
51
SLEEP NUMBER CORPORATION
AND SUBSIDIARIES
Notes to Consolidated Financial Statements - (continued)
The aggregate minimum rental commitments under operating leases for subsequent years are as follows (in thousands):
|
2018
|
$
|
70,604
|
|
|
|
2019
|
65,114
|
|
||
|
2020
|
58,069
|
|
||
|
2021
|
52,284
|
|
||
|
2022
|
45,657
|
|
||
|
Thereafter
|
145,039
|
|
||
|
Total future minimum lease payments
|
$
|
436,767
|
|
|
(8) Credit Agreement
Our revolving credit facility as of December 30, 2017 had a net aggregate availability of
$153 million
. The credit facility is for general corporate purposes and is also utilized to meet our seasonal working capital requirements. The credit agreement provides the Lenders with a collateral security interest in substantially all of our assets and those of our subsidiaries and requires us to comply with, among other things, a maximum leverage ratio and a minimum interest coverage ratio. Under the terms of the credit agreement we pay a variable rate of interest and a commitment fee based on our leverage ratio.
As of
December 30, 2017
, we had
$25 million
in outstanding borrowings and
$3 million
in outstanding letters of credit. We had additional borrowing capacity of
$125 million
. As of
December 30, 2017
, the weighted-average interest rate on borrowings outstanding under the credit facility was
3.1%
and we were in compliance with all financial covenants.
In February 2018, we amended our revolving credit facility (Credit Agreement, as amended) to increase our net aggregate availability
from
$153 million
to
$300 million
. We maintained the accordion feature which allows us to increase the amount of the credit facility
from
$300 million
to
$450 million
, subject to Lenders' approval. The Credit Agreement, as amended, matures in
February 2023
. There were no other significant changes to the Credit Agreement's terms and conditions.
(9) Shareholders’ Equity
Stock-Based Compensation Expense
Total stock-based compensation expense was as follows (in thousands):
|
|
2017
|
2016
|
2015
|
|||||||||
|
Stock options
|
$
|
2,344
|
|
$
|
2,281
|
|
$
|
2,634
|
|
|||
|
Stock awards
|
13,419
|
|
9,680
|
|
7,656
|
|
||||||
|
Total stock-based compensation expense
|
15,763
|
|
11,961
|
|
10,290
|
|
||||||
|
Income tax benefit
|
5,249
|
|
3,947
|
|
3,413
|
|
||||||
|
Total stock-based compensation expense, net of tax
|
$
|
10,514
|
|
$
|
8,014
|
|
$
|
6,877
|
|
|||
52
SLEEP NUMBER CORPORATION
AND SUBSIDIARIES
Notes to Consolidated Financial Statements - (continued)
Stock Options
A summary of our stock option activity was as follows (in thousands, except per share amounts and years):
|
|
Stock
Options
|
Weighted-
Average
Exercise
Price per
Share
|
Weighted-
Average
Remaining
Contractual
Term (years)
|
Aggregate
Intrinsic
Value
(1)
|
|||||||||
|
Balance at December 31, 2016
|
1,354
|
|
$
|
18.70
|
|
5.9
|
$
|
7,541
|
|
||||
|
Granted
|
262
|
|
24.26
|
|
|
|
|
||||||
|
Exercised
|
(222
|
)
|
14.58
|
|
|
|
|
||||||
|
Canceled/Forfeited
|
(39
|
)
|
26.17
|
|
|
|
|
||||||
|
Outstanding at December 30, 2017
|
1,355
|
|
$
|
20.23
|
|
6.2
|
$
|
23,515
|
|
||||
|
Exercisable at December 30, 2017
|
879
|
|
$
|
18.79
|
|
4.8
|
$
|
16,533
|
|
||||
|
Vested and expected to vest at December 30, 2017
|
1,321
|
|
$
|
20.16
|
|
6.1
|
$
|
23,023
|
|
||||
___________________
|
(1)
|
Aggregate intrinsic value includes only those options where the current share price is equal to or greater than the share price on the date of grant.
|
Other information pertaining to options was as follows (in thousands, except per share amounts):
|
|
2017
|
2016
|
2015
|
|||||||||
|
Weighted-average grant date fair value of stock options granted
|
$
|
10.33
|
|
$
|
8.85
|
|
$
|
15.94
|
|
|||
|
Total intrinsic value (at exercise) of stock options exercised
|
$
|
3,586
|
|
$
|
2,088
|
|
$
|
4,592
|
|
|||
Cash received from the exercise of stock options for the fiscal year ended
December 30, 2017
was
$3.2 million
. Our tax benefit related to the exercise of stock options for the fiscal year ended
December 30, 2017
was
$1.3 million
.
At
December 30, 2017
, there was
$2.8 million
of total stock option compensation expense related to non-vested stock options not yet recognized, which is expected to be recognized over a weighted-average period of
1.8
years.
During 2016,
30,500
market-based stock options were granted and had a weighted-average grant date fair value of
$10.25
per option. These options are reflected in the stock option activity table above. There were no market-based stock options granted in 2015 or 2017. The assumptions used to calculate the fair value of market-based stock options granted using the
Monte Carlo simulation model
were as follows:
|
Valuation Assumptions
|
2017
|
2016
|
2015
|
||||
|
Expected dividend yield
|
NA
|
0
|
%
|
NA
|
|||
|
Expected volatility
|
NA
|
50
|
%
|
NA
|
|||
|
Risk-free interest rate
|
NA
|
1.8
|
%
|
NA
|
|||
Except for the market-based stock options discussed above, the fair value of options granted was calculated using the Black-Scholes-Merton option-pricing model.
53
SLEEP NUMBER CORPORATION
AND SUBSIDIARIES
Notes to Consolidated Financial Statements - (continued)
The assumptions used to calculate the fair value of options granted using the
Black-Scholes-Merton option-pricing model
were as follows:
|
Valuation Assumptions
|
2017
|
2016
|
2015
|
||||||
|
Expected dividend yield
|
0
|
%
|
0
|
%
|
0
|
%
|
|||
|
Expected volatility
|
46
|
%
|
50
|
%
|
54
|
%
|
|||
|
Risk-free interest rate
|
2.0
|
%
|
1.4
|
%
|
1.6
|
%
|
|||
|
Expected term (in years)
|
5.1
|
|
5.2
|
|
5.2
|
|
|||
Stock Awards
Stock award activity was as follows (in thousands, except per share amounts):
|
|
Time-
Based
Stock
Awards
|
Weighted-Average
Grant Date
Fair Value
|
Performance- and
Market-Based
Stock Awards
|
Weighted-Average
Grant Date
Fair Value
|
||||||||
|
Outstanding at December 31, 2016
|
530
|
|
$20.83
|
899
|
|
$20.87
|
||||||
|
Granted
|
217
|
|
25.81
|
|
568
|
|
23.03
|
|
||||
|
Vested
|
(312
|
)
|
20.35
|
|
(338
|
)
|
16.73
|
|
||||
|
Canceled/Forfeited
|
(40
|
)
|
22.47
|
|
(66
|
)
|
19.88
|
|
||||
|
Outstanding at December 30, 2017
|
395
|
|
$23.77
|
1,063
|
|
$23.41
|
||||||
At
December 30, 2017
, there was
$5.5 million
of unrecognized compensation expense related to non-vested time-based stock awards, which is expected to be recognized over a weighted-average period of
1.8 years
and
$15.2 million
of unrecognized compensation expense related to non-vested performance-based and market-based stock awards, which is expected to be recognized over a weighted-average period of
2.1 years
.
During 2017,
270,895
performance-based stock awards with a market condition were granted and had a weighted-average grant date fair value of
$22.40
per award. These stock awards are reflected in the "Performance- and Market-Based Stock Awards" column in the stock award activity table above. There were no market-based stock awards granted in 2016 or 2015. The assumptions used to calculate the fair value of the 2017 performance-base stock awards with a market condition, using the
Monte Carlo simulation model
, were as follows:
|
Valuation Assumptions
|
2017
|
2016
|
2015
|
|||
|
Expected dividend yield
|
0%
|
NA
|
NA
|
|||
|
Expected volatility
|
46%
|
NA
|
NA
|
|||
|
Risk-free interest rate
|
1.5%
|
NA
|
NA
|
|||
Repurchases of Common Stock
Repurchases of our common stock were as follows (in thousands):
|
|
2017
|
2016
|
2015
|
|||||||||
|
Amount repurchased under Board-approved share repurchase program
|
$
|
150,000
|
|
$
|
125,000
|
|
$
|
98,446
|
|
|||
|
Amount repurchased in connection with the vesting of employee restricted stock grants
|
5,245
|
|
1,693
|
|
1,755
|
|
||||||
|
Total amount repurchased
|
$
|
155,245
|
|
$
|
126,693
|
|
$
|
100,201
|
|
|||
Effective as of October 1, 2017, our Board approved an increase in our total remaining share repurchase authorization to
$500 million
. As of
December 30, 2017
, the remaining authorization under our Board-approved share repurchase program was
$465 million
. There is no expiration date governing the period over which we can repurchase shares. Any repurchased shares are constructively retired and
54
SLEEP NUMBER CORPORATION
AND SUBSIDIARIES
Notes to Consolidated Financial Statements - (continued)
returned to an unissued status. The cost of stock repurchases is first charged to additional paid-in-capital. Once additional paid-in capital is reduced to zero, any additional amounts are charged to retained earnings.
Net Income per Common Share
The components of basic and diluted net income per share were as follows (in thousands, except per share amounts):
|
|
2017
|
2016
|
2015
|
||||||||
|
Net income
|
$
|
65,077
|
|
$
|
51,417
|
|
$
|
50,519
|
|
||
|
Reconciliation of weighted-average shares outstanding:
|
|
|
|
|
|||||||
|
Basic weighted-average shares outstanding
|
41,212
|
|
46,154
|
|
51,252
|
|
|||||
|
Dilutive effect of stock-based awards
|
873
|
|
748
|
|
849
|
|
|||||
|
Diluted weighted-average shares outstanding
|
42,085
|
|
46,902
|
|
52,101
|
|
|||||
|
Net income per share – basic
|
$
|
1.58
|
|
$
|
1.11
|
|
$
|
0.99
|
|
||
|
Net income per share – diluted
|
$
|
1.55
|
|
$
|
1.10
|
|
$
|
0.97
|
|
||
Additional potential dilutive stock options totaling
0.4 million
,
0.6 million
and
0.4 million
for
2017
,
2016
and
2015
, respectively, have been excluded from our diluted net income per share calculations because these securities’ exercise prices were anti-dilutive (e.g., greater than the average market price of our common stock).
(10) Other (Expense) Income, Net
Other (expense) income, net, consisted of the following (in thousands):
|
|
2017
|
2016
|
2015
|
||||||||
|
Interest expense
|
$
|
(975
|
)
|
$
|
(811
|
)
|
$
|
(160
|
)
|
||
|
Interest income
|
98
|
|
94
|
|
$
|
494
|
|
||||
|
Other (expense) income, net
|
$
|
(877
|
)
|
$
|
(717
|
)
|
$
|
334
|
|
||
(11) Income Taxes
Income tax expense consisted of the following (in thousands):
|
2017
|
2016
|
2015
|
||||||||||
|
Current:
|
||||||||||||
|
Federal
|
$
|
19,153
|
|
$
|
21,634
|
|
$
|
7,272
|
|
|||
|
State
|
4,046
|
|
5,289
|
|
3,870
|
|
||||||
|
|
23,199
|
|
26,923
|
|
11,142
|
|
||||||
|
Deferred:
|
|
|
|
|
|
|
||||||
|
Federal
|
2,734
|
|
(105
|
)
|
13,567
|
|
||||||
|
State
|
28
|
|
(2,302
|
)
|
202
|
|
||||||
|
|
2,762
|
|
(2,407
|
)
|
13,769
|
|
||||||
|
Income tax expense
|
$
|
25,961
|
|
$
|
24,516
|
|
$
|
24,911
|
|
|||
55
SLEEP NUMBER CORPORATION
AND SUBSIDIARIES
Notes to Consolidated Financial Statements - (continued)
The following table provides a reconciliation between the statutory federal income tax rate and our effective income tax rate:
|
|
2017
|
2016
|
2015
|
||||||
|
Statutory federal income tax
|
35.0
|
%
|
35.0
|
%
|
35.0
|
%
|
|||
|
State income taxes, net of federal benefit
|
2.5
|
|
2.6
|
|
3.0
|
|
|||
|
Manufacturing deduction
|
(3.5
|
)
|
(3.3
|
)
|
(1.7
|
)
|
|||
|
Effect of 2018 deferred tax rate change
|
(1.9
|
)
|
—
|
|
—
|
|
|||
|
Changes in unrecognized tax benefits
|
(0.6
|
)
|
1.2
|
|
0.3
|
|
|||
|
Non-taxable acquisition-related transactions
|
—
|
|
—
|
|
(2.6
|
)
|
|||
|
Other
|
(3.0
|
)
|
(3.2
|
)
|
(1.0
|
)
|
|||
|
Effective income tax rate
|
28.5
|
%
|
32.3
|
%
|
33.0
|
%
|
|||
We file income tax returns with the U.S. federal government and various state jurisdictions. In the normal course of business, we are subject to examination by federal and state taxing authorities. We are no longer subject to federal income tax examinations for years prior to
2014
or state income tax examinations prior to
2013
.
On December 22, 2017, the Tax Cuts and Jobs Act (TCJA) was enacted. The TCJA reduces the statutory federal tax rate from 35% to 21% starting in 2018. In addition, there were various other tax law changes that impacted us. In connection with the reduction of the federal tax rate, we recognized a provisional tax benefit of
$1.7 million
for the year ended December 30, 2017. This provisional tax benefit is related to the re-measurement of U.S. deferred tax assets and liabilities using a federal tax rate of 21%, which, under the TCJA, is expected to be in place when such deferred assets and liabilities reverse in future periods.
The other provisions of the TCJA did not have a significant impact on our consolidated financial statements for the year ended December 30, 2017, but may impact our effective tax rate in subsequent periods.
The TCJA has significant complexity and our final tax liability may differ from these estimates, due to, among other things, guidance that may be issued by the U.S. Treasury Department and the Internal Revenue Service, and related interpretations and clarifications of tax law. For the re-measurement of the deferred tax assets and liabilities, further analysis may be required to refine our calculations and related account balances.
We will complete the remaining elements of our analysis during 2018, and any adjustments to the provisional tax benefit will be included in income tax expense in the appropriate period, in accordance with the U.S. generally accepted accounting principles.
56
SLEEP NUMBER CORPORATION
AND SUBSIDIARIES
Notes to Consolidated Financial Statements - (continued)
Deferred Income Taxes
The tax effects of temporary differences that give rise to deferred income taxes were as follows (in thousands):
|
2017
|
2016
|
|||||||
|
Deferred tax assets:
|
||||||||
|
Stock-based compensation
|
$
|
6,940
|
|
$
|
9,834
|
|
||
|
Deferred rent and lease incentives
|
6,007
|
|
8,388
|
|
||||
|
Warranty and returns liabilities
|
6,602
|
|
7,948
|
|
||||
|
Net operating loss carryforwards and credits
|
3,240
|
|
6,368
|
|
||||
|
Compensation and benefits
|
3,315
|
|
4,115
|
|
||||
|
Other
|
3,321
|
|
5,264
|
|
||||
|
Total gross deferred tax assets
|
29,425
|
|
41,917
|
|
||||
|
Valuation allowance
|
(615
|
)
|
(620
|
)
|
||||
|
Total deferred tax assets after valuation allowance
|
28,810
|
|
41,297
|
|
||||
|
Deferred tax liabilities:
|
||||||||
|
Property and equipment
|
21,475
|
|
27,049
|
|
||||
|
Deferred revenue
|
723
|
|
3,279
|
|
||||
|
Other
|
3,987
|
|
6,302
|
|
||||
|
Total gross deferred tax liabilities
|
26,185
|
|
36,630
|
|
||||
|
Net deferred tax assets
|
$
|
2,625
|
|
$
|
4,667
|
|
||
At
December 30, 2017
, we had net operating loss carryforwards for federal purposes of
$3 million
, which will expire between
2025
and
2034
, and for state income tax purposes of
$6 million
, which will expire between
2028
and
2037
.
We evaluate our deferred income taxes quarterly to determine if valuation allowances are required. As part of this evaluation, we assess whether valuation allowances should be established for any deferred tax assets that are not considered more likely than not to be realized, using all available evidence, both positive and negative. This assessment considers, among other matters, the nature, frequency, and severity of historical losses, forecasts of future profitability, taxable income in available carryback periods and tax planning strategies. In making such judgments, significant weight is given to evidence that can be objectively verified. We have provided a
$0.6 million
valuation allowance resulting primarily from our inability to utilize certain foreign net operating losses, and federal net operating losses associated with our acquisition of BAM Labs, Inc.
Unrecognized Tax Benefits
Reconciliations of the beginning and ending amounts of unrecognized tax benefits for
2017
,
2016
and
2015
were as follows (in thousands):
|
|
Federal and State Tax
|
|||||||||||
|
|
2017
|
2016
|
2015
|
|||||||||
|
Beginning balance
|
$
|
3,460
|
|
$
|
2,077
|
|
$
|
742
|
|
|||
|
Increases related to current-year tax positions
|
330
|
|
326
|
|
1,277
|
|
||||||
|
Increases related to prior-year tax positions
|
87
|
|
1,594
|
|
113
|
|
||||||
|
Decreases related to prior-year tax positions
|
(1,038
|
)
|
—
|
|
—
|
|
||||||
|
Lapse of statute of limitations
|
—
|
|
(333
|
)
|
(55
|
)
|
||||||
|
Settlements with taxing authorities
|
—
|
|
(204
|
)
|
—
|
|
||||||
|
Ending balance
|
$
|
2,839
|
|
$
|
3,460
|
|
$
|
2,077
|
|
|||
As of
December 30, 2017
and
December 31, 2016
, we had
$3 million
and
$4 million
, respectively, of unrecognized tax benefits, which if recognized, would affect our effective tax rate. The amount of unrecognized tax benefits is not expected to change materially within the next 12 months.
57
(12) Profit Sharing and 401(k) Plan
Under our profit sharing and 401(k) plan, eligible employees may defer up to
50%
of their compensation on a pre-tax basis, subject to Internal Revenue Service limitations. Each year, we may make a discretionary contribution equal to a percentage of the employee’s contribution. During
2017
,
2016
and
2015
, our contributions, net of forfeitures, were
$5 million
,
$5 million
and
$4 million
, respectively.
(13) Commitments and Contingencies
Legal Proceedings
We are involved from time to time in various legal proceedings arising in the ordinary course of our business, including primarily commercial, product liability, employment and intellectual property claims. In accordance with generally accepted accounting principles in the United States, we record a liability in our consolidated financial statements with respect to any of these matters when it is both probable that a liability has been incurred and the amount of the liability can be reasonably estimated. With respect to currently pending legal proceedings, we have not established an estimated range of reasonably possible additional losses either because we believe that we have valid defenses to claims asserted against us or the proceeding has not advanced to a stage of discovery that would enable us to establish an estimate. We currently do not expect the outcome of these matters to have a material effect on our consolidated results of operations, financial position or cash flows. Litigation, however, is inherently unpredictable, and it is possible that the ultimate outcome of one or more claims asserted against us could adversely impact our consolidated results of operations, financial position or cash flows. We expense legal costs as incurred.
On January 12, 2015, Plaintiffs David and Katina Spade commenced a purported class action lawsuit in New Jersey state court against Sleep Number alleging that Sleep Number violated New Jersey consumer statutes by failing to provide to purchasing consumers certain disclosures required by the New Jersey Furniture Regulations. It is undisputed that plaintiffs suffered no actual damages or in any way relied upon or were impacted by the alleged omissions. Nonetheless, on behalf of a purported class of New Jersey purchasers of Sleep Number beds and bases, plaintiffs seek to recover a $100 statutory fine for each alleged omission, along with attorneys’ fees and costs. Sleep Number removed the case to the United States District Court for the District of New Jersey, which subsequently granted Sleep Number’s motion to dismiss. Plaintiffs appealed to the United States Court of Appeals for the Third Circuit, which has certified two questions of law to the New Jersey Supreme Court relating to whether plaintiffs who have suffered no actual injury may bring claims. The New Jersey Supreme Court has accepted the certified questions and oral arguments were heard in November 2017. As the United States District Court for the District of New Jersey determined, we believe that the case is without merit and the order of dismissal should be affirmed.
Consumer Credit Arrangements
We refer customers seeking extended financing to certain third party financiers (Card Servicers). The Card Servicers, if credit is granted, establish the interest rates, fees, and all other terms and conditions of the customer’s account based on their evaluation of the creditworthiness of the customer. As the receivables are owned by the Card Servicers, at no time are the receivables purchased or acquired from us. We are not liable to the Card Servicers for our customers’ credit defaults.
Commitments
As of
December 30, 2017
, we had
$9 million
of inventory purchase commitments. As part of the normal course of business, there are a limited number of inventory supply contracts that contain penalty provisions for failure to purchase contracted quantities. We do not currently expect any payments under these provisions. At
December 30, 2017
, we had entered into
38
lease commitments for future retail store locations. These lease commitments provide for minimum rentals over the next
five
to
10
years, which if consummated based on current cost estimates, would approximate
$54 million
over the initial lease term. The minimum rentals for these lease commitments have been included in the future minimum lease payments in Note 7,
Leases
.
58
SLEEP NUMBER CORPORATION
AND SUBSIDIARIES
Notes to Consolidated Financial Statements - (continued)
(14) Summary of Quarterly Financial Data (unaudited)
The following is a condensed summary of our quarterly results (in thousands, except net income (loss) per share amounts). Quarterly diluted net income (loss) per share amounts may not total to the respective annual amount due to changes in weighted-average shares outstanding during the year.
|
2017
|
First
|
Second
|
Third
|
Fourth
|
Fiscal
Year
|
|||||||||||||||
|
Net sales
|
$
|
393,899
|
|
$
|
284,673
|
|
$
|
402,646
|
|
$
|
363,279
|
|
$
|
1,444,497
|
|
|||||
|
Gross profit
|
246,459
|
|
176,619
|
|
253,465
|
|
220,804
|
|
897,347
|
|
||||||||||
|
Operating income (loss)
|
35,828
|
|
(3,061
|
)
|
39,029
|
|
20,119
|
|
91,915
|
|
||||||||||
|
Net income (loss)
|
24,461
|
|
(778
|
)
|
25,603
|
|
15,791
|
|
65,077
|
|
||||||||||
|
Net income (loss) per share – diluted
|
$
|
0.56
|
|
$
|
(0.02
|
)
|
$
|
0.62
|
|
$
|
0.39
|
|
$
|
1.55
|
|
|||||
|
2016
|
First
|
Second
|
Third
|
Fourth
|
Fiscal
Year
|
|||||||||||||||
|
Net sales
|
$
|
352,980
|
|
$
|
276,878
|
|
$
|
367,988
|
|
$
|
313,445
|
|
$
|
1,311,291
|
|
|||||
|
Gross profit
|
209,074
|
|
171,261
|
|
232,343
|
|
197,482
|
|
810,160
|
|
||||||||||
|
Operating income
|
19,898
|
|
2,396
|
|
39,044
|
|
15,312
|
|
76,650
|
|
||||||||||
|
Net income
|
12,969
|
|
1,416
|
|
25,745
|
|
11,287
|
|
51,417
|
|
||||||||||
|
Net income per share – diluted
|
$
|
0.27
|
|
$
|
0.03
|
|
$
|
0.56
|
|
$
|
0.25
|
|
$
|
1.10
|
|
|||||
59
None
Conclusions Regarding the Effectiveness of Disclosure Controls and Procedures
We maintain disclosure controls and procedures, as defined in Exchange Act Rule 13a-15(e), that are designed to ensure that information required to be disclosed by the Company in the reports that it files or submits under the Securities Exchange Act of 1934, as amended, is recorded, processed, summarized and reported within the time periods specified in the Securities and Exchange Commission’s rules and forms, and that such information is accumulated and communicated to the Company’s management, including its principal executive officer and principal financial officer, or persons performing similar functions, as appropriate to allow timely decisions regarding required disclosure. Our management, with the participation of our chief executive officer and chief financial officer, evaluated the effectiveness of the design and operation of our disclosure controls and procedures as of the end of the period covered by this annual report. Based on this evaluation, our principal executive officer and principal financial officer concluded that our disclosure controls and procedures were effective as of the end of the period covered by this annual report.
Management’s Report on Internal Control Over Financial Reporting
Sleep Number’s management is responsible for establishing and maintaining adequate internal control over financial reporting, as such term is defined in Exchange Act Rule 13a-15(f). Our internal control over financial reporting is a process designed to provide reasonable assurance regarding the reliability of financial reporting and the preparation of financial statements for external purposes in accordance with generally accepted accounting principles. Our internal control over financial reporting includes those policies and procedures that (1) pertain to the maintenance of records that, in reasonable detail, accurately and fairly reflect the transactions and dispositions of the assets of the Company; (2) provide reasonable assurance that transactions are recorded as necessary to permit preparation of financial statements in accordance with U.S. generally accepted accounting principles, and that receipts and expenditures of the Company are being made only in accordance with authorizations of management and directors of the Company; and (3) provide reasonable assurance regarding prevention or timely detection of unauthorized acquisition, use or disposition of the Company’s assets that could have a material effect on the financial statements.
Because of its inherent limitations, internal control over financial reporting may not prevent or detect misstatements. Also, projections of any evaluation of effectiveness to future periods are subject to the risk that controls may become inadequate because of changes in conditions, or that the degree of compliance with the policies or procedures may deteriorate.
Sleep Number’s management is responsible for establishing and maintaining adequate internal control over financial reporting, as such term is defined in Exchange Act Rules 13a-15(f). Management, with the participation of our principal executive officer and principal financial officer, evaluated the effectiveness of our internal control over financial reporting based on the framework in
Internal Control – Integrated Framework (2013)
issued by the Committee of Sponsoring Organizations of the Treadway Commission. Based on this evaluation under these criteria, management concluded that our internal control over financial reporting was effective as of
December 30, 2017
. The report of Deloitte & Touche LLP, our independent registered public accounting firm, regarding the effectiveness of our internal control over financial reporting is included in this report in “Part II, Item 8, Financial Statements and Supplementary Data” under “Report of Independent Registered Public Accounting Firm.”
Fourth Quarter Changes in Internal Control Over Financial Reporting
There were no changes in our internal control over financial reporting during the quarter ended
December 30, 2017
that have materially affected, or are reasonably likely to materially affect, our internal control over financial reporting.
Not applicable.
60
The information under the captions “Election of Directors,” “Corporate Governance” and “Section 16(a) Beneficial Ownership Reporting Compliance” in our Proxy Statement for our
2018
Annual Meeting of Shareholders is incorporated herein by reference. Information concerning our executive officers is included in Part I of this report under the caption “Executive Officers of the Registrant.”
We have adopted a Code of Business Conduct applicable to our directors, officers and employees (including our principal executive officer, principal financial officer and principal accounting officer). The Code of Business Conduct is available on the Investor Relations section of our website at
www.SleepNumber.com. S
elect the "
Investors
" link, the “
Governance
” link and then the "
Documents & Charters
" link. In the event that we amend or waive any of the provisions of the Code of Business Conduct applicable to our principal executive officer, principal financial officer and principal accounting officer, we intend to disclose the same on our website at
www.SleepNumber.com
.
The information under the caption “Executive Compensation” in our Proxy Statement for our
2018
Annual Meeting of Shareholders is incorporated herein by reference.
Stock Ownership
The information under the caption “Stock Ownership of Management and Certain Beneficial Owners” in our Proxy Statement for our
2018
Annual Meeting of Shareholders is incorporated herein by reference.
Securities Authorized for Issuance under Equity Compensation Plans
The information under the caption "Equity Compensation Plan Information" in our Proxy Statement for our
2018
Annual Meeting of Shareholders is incorporated herein by reference.
The information under the caption “Corporate Governance” in our Proxy Statement for our
2018
Annual Meeting of Shareholders is incorporated herein by reference.
The information under the caption “Ratification of Selection of Independent Registered Public Accounting Firm” in our Proxy Statement for our
2018
Annual Meeting of Shareholders is incorporated herein by reference.
61
(a) Consolidated Financial Statements and Schedule
(1) Financial Statements
All financial statements as set forth under Item 8 of this report.
(2)
Consolidated Financial Statement Schedule
The following Report and financial statement schedule are included in this Part IV:
Schedule II - Valuation and Qualifying Accounts
All other schedules are omitted because they are not applicable or the required information is included in the consolidated financial statements or notes thereto.
(3)
Exhibits
The exhibits to this Report are listed in the Exhibit Index below.
We will furnish a copy of the exhibits referred to above at a reasonable cost to any shareholder upon receipt of a written request. Requests should be sent to: Sleep Number Corporation, Investor Relations Department, 1001 Third Avenue South, Minneapolis, MN 55404.
62
The following is a list of each management contract or compensatory plan or arrangement required to be filed
as an exhibit to this Annual Report on Form 10-K pursuant to Item 15(c):
|
1.
|
Select Comfort Corporation 2004 Stock Incentive Plan (Amended and Restated as of January 1, 2007)
|
|
2.
|
Form of Nonstatutory Stock Option Award Agreement under the 2004 Stock Incentive Plan
|
|
3.
|
Form of Restricted Stock Award Agreement under the 2004 Stock Incentive Plan
|
|
4.
|
Form of Performance Stock Award Agreement under the 2004 Stock Incentive Plan
|
|
5.
|
Form of Nonstatutory Stock Option Award Agreement (Subject to Performance Adjustment) under the 2004 Stock Incentive Plan
|
|
6.
|
Select Comfort Corporation Amended and Restated 2010 Omnibus Incentive Plan
|
|
7.
|
Form of Nonstatutory Stock Option Award Agreement under the 2010 Omnibus Incentive Plan
|
|
8.
|
Form of Restricted Stock Award Agreement under the 2010 Omnibus Incentive Plan
|
|
9.
|
Form of Performance Stock Award Agreement under the 2010 Omnibus Incentive Plan
|
|
10.
|
Select Comfort Executive Investment Plan (December 1, 2014 Restatement)
|
|
11.
|
Employment Offer Letter from Select Comfort Corporation to Shelly R. Ibach dated February 9, 2007
|
|
12.
|
Employment Offer Letter from Select Comfort Corporation to David R. Callen dated March 14, 2014
|
|
13.
|
Employment Offer Letter from Select Comfort Corporation to Mark A. Kimball dated April 22, 1999
|
|
14.
|
Select Comfort Corporation Executive Physical Plan
|
|
15.
|
Summary of Executive Tax and Financial Planning Program
|
|
16.
|
Amended and Restated Select Comfort Corporation Executive Severance Pay Plan
|
|
17.
|
First Amendment to Amended and Restated Select Comfort Corporation Executive Severance Pay Plan
|
|
18.
|
Summary of Non-Employee Director Compensation
|
Not applicable.
63
SLEEP NUMBER CORPORATION
EXHIBIT INDEX TO ANNUAL REPORT ON FORM 10-K
FOR THE YEAR ENDED
DECEMBER 30, 2017
|
Exhibit
No.
|
|
Description
|
|
Method of Filing
|
|
|
|
|
|
|
|
3.1
|
Third Restated Articles of Incorporation of the Company, as amended
|
|
||
|
3.2
|
Articles of Amendment to Third Restated Articles of Incorporation of the Company
|
|||
|
3.3
|
Articles of Amendment to Third Restated Articles of Incorporation of the Company
|
|||
|
3.4
|
Restated Bylaws of the Company
|
|||
|
10.1
|
Lease Agreement dated September 9, 2015 between the Company and Truluck Industries, Inc.
|
|||
|
10.2
|
Lease Agreement dated September 30, 1998 between the Company and ProLogis Development Services Incorporated
|
|||
|
10.3
|
Second Amendment to Lease Agreement dated June 15, 2015 between the Company and CLFP - SLIC 8, L.P. (successor in interest to ProLogis Development Services Incorporated)
|
|||
|
10.4
|
Lease Agreement between DCI 1001 Minneapolis Venture, LLC, as Landlord, and Sleep Number Corporation, as Tenant, dated October 21, 2016
|
|||
|
10.5
|
First Amendment, dated June 22, 2017, to Lease Agreement between DCI 1001 Minneapolis Venture, LLC, as Landlord, and Sleep Number Corporation, as Tenant, dated October 21, 2016
|
|||
|
10.6
|
Sleep Number Corporation 2004 Stock Incentive Plan (Amended and Restated as of January 1, 2007)
|
|||
|
10.7
|
Form of Nonstatutory Stock Option Award Agreement under the Sleep Number Corporation 2004 Stock Incentive Plan
|
|||
64
|
Exhibit
No.
|
|
Description
|
|
Method of Filing
|
|
10.8
|
Form of Restricted Stock Award Agreement under the Sleep Number Corporation 2004 Stock Incentive Plan
|
|||
|
10.9
|
Form of Performance Stock Award Agreement under the Sleep Number Corporation 2004 Stock Incentive Plan
|
|||
|
10.10
|
Form of Nonstatutory Stock Option Award Agreement (Subject to Performance Adjustment) under the Sleep Number Corporation 2004 Stock Incentive Plan
|
|||
|
10.11
|
Sleep Number Corporation Amended and Restated 2010 Omnibus Incentive Plan
|
|||
|
10.12
|
Form of Nonstatutory Stock Option Award Agreement under the 2010 Omnibus Incentive Plan
|
|||
|
10.13
|
Form of Restricted Stock Award Agreement under the 2010 Omnibus Incentive Plan
|
|||
|
10.14
|
Form of Performance Stock Award Agreement under the 2010 Omnibus Incentive Plan
|
|||
|
10.15
|
Form of Performance-Based Restricted Stock Unit Award Agreement - EPS Target
|
|||
|
10.16
|
Sleep Number Executive Investment Plan (December 1, 2014 Restatement)
|
|||
|
10.17
|
Employment Offer Letter from Sleep Number Corporation to Shelly R. Ibach dated February 9, 2007
|
|||
|
10.18
|
Employment Offer Letter from Sleep Number Corporation to David R. Callen dated March 14, 2014
|
|||
|
10.19
|
Employment Offer Letter from Sleep Number Corporation to Mark A. Kimball dated April 22, 1999
|
|||
65
|
Exhibit
No.
|
|
Description
|
|
Method of Filing
|
|
10.20
|
Sleep Number Corporation Executive Physical Plan
|
|||
|
10.21
|
Summary of Executive Tax and Financial Planning Program
|
|
||
|
10.22
|
Amended and Restated Sleep Number Corporation Executive Severance Pay Plan
|
|||
|
10.23
|
Summary of Non-Employee Director Compensation
|
|||
|
10.24
|
Master Supply Agreement dated July 16, 2013 between the Company and Supplier
(1)
|
|||
|
10.25
|
Retailer Program Agreement effective as of January 1, 2014 by and between Synchrony Bank, Sleep Number Corporation and Select Comfort Retail Corporation
(1)
|
|||
|
10.26
|
First Amendment to Retailer Program Agreement, dated effective as of October 1, 2014 by and between Synchrony Bank, Sleep Number Corporation and Select Comfort Retail Corporation
|
|||
|
10.27
|
Second Amendment to Retailer Program Agreement, dated November 4, 2015 by and between Synchrony Bank, Sleep Number Corporation and Select Comfort Retail Corporation
(1)
|
|||
|
10.28
|
Sleep Number Corporation Non-Employee Director Deferral Plan
|
|||
|
10.29
|
Amended and Restated Credit and Security Agreement, dated as of February 14, 2018 among Sleep Number Corporation, U.S. Bank National Association and the several banks and other financial institutions from time to time party thereto.
|
|||
|
21.1
|
Subsidiaries of the Company
|
|||
|
23.1
|
Consent of Independent Registered Public Accounting Firm
|
|||
|
24.1
|
Power of Attorney
|
|||
|
31.1
|
|
Certification of CEO pursuant to Section 302 of the Sarbanes-Oxley Act of 2002
|
|
|
66
|
Exhibit
No.
|
|
Description
|
|
Method of Filing
|
|
|
|
|
|
|
|
31.2
|
|
Certification of CFO pursuant to Section 302 of the Sarbanes-Oxley Act of 2002
|
|
|
|
|
|
|
|
|
|
32.1
|
|
Certification of CEO pursuant to Section 906 of the Sarbanes-Oxley Act of 2002, 18 U.S.C. Section 1350
|
|
|
|
|
|
|
|
|
|
32.2
|
|
Certification of CFO pursuant to Section 906 of the Sarbanes-Oxley Act of 2002, 18 U.S.C. Section 1350
|
|
|
|
|
|
|
|
|
|
101
|
|
The following financial information from the Company's Annual Report on Form 10-K for the period ended December 30, 2017, filed with the SEC on February 27, 2018, formatted in eXtensible Business Reporting Language: (i) Consolidated Balance Sheets as of December 30, 2017 and December 31, 2016; (ii) Consolidated Statements of Operations for the years ended December 30, 2017, December 31, 2016 and January 2, 2016; (iii) Consolidated Statements of Comprehensive Income for the years ended December 30, 2017, December 31, 2016 and January 2, 2016; (iv) Consolidated Statements of Shareholders' Equity for the years ended December 30, 2017, December 31, 2016 and January 2, 2016; (v) Consolidated Statements of Cash Flows for the years ended December 30, 2017, December 31, 2016 and January 2, 2016; and (vi) Notes to Consolidated Financial Statements.
|
|
Filed herewith
|
___________________
|
(1)
|
Confidential treatment has been requested by the issuer with respect to designated portions contained within document. Such portions have been omitted and filed separately with the Securities and Exchange Commission pursuant to Rule 24b-2 of the Securities and Exchange Act of 1934, as amended.
|
|
(2)
|
This exhibit shall not be deemed “filed” for purposes of Section 18 of the Securities Act of 1934, as amended, (15 U.S.C. 78r) or otherwise subject to the liability of that section. Such exhibit will not be deemed to be incorporated by reference into any document filed under the Securities Act of 1933, as amended, or under the Securities Exchange Act of 1934, as amended, except as otherwise expressly stated in any such filing.
|
67
SIGNATURES
Pursuant to the requirements of Section 13 or 15(d) of the Securities and Exchange Act of 1934, the Registrant has duly caused this report to be signed on its behalf by the undersigned, thereunto duly authorized.
|
|
SLEEP NUMBER CORPORATION
|
|
|||
|
|
(Registrant)
|
|
|||
|
|
|
|
|||
|
Dated:
|
February 27, 2018
|
By:
|
|
/s/ Shelly R. Ibach
|
|
|
|
|
|
Shelly R. Ibach
|
|
|
|
|
|
|
Chief Executive Officer
|
|
|
|
|
|
|
(principal executive officer)
|
|
|
|
By:
|
/s/ David R. Callen
|
||||
|
David R. Callen
|
|||||
|
Chief Financial Officer
|
|||||
|
(principal financial officer)
|
|||||
|
|
|
|
|
|
|
|
|
By:
|
|
/s/ Robert J. Poirier
|
|
|
|
|
|
|
Robert J. Poirier
|
|
|
|
|
|
|
Chief Accounting Officer
|
|
|
|
|
|
|
(principal accounting officer)
|
|
|
68
POWER OF ATTORNEY
Know all persons by these presents, that each person whose signature appears below constitutes and appoints Shelly R. Ibach, David R. Callen and Mark A. Kimball, and each of them, as such person’s true and lawful attorneys-in-fact and agents, with full power of substitution and resubstitution, for such person and in such person’s name, place and stead, in any and all capacities, to sign any and all amendments to this Report, and to file the same, with all exhibits thereto, and other documents in connection therewith, with the Securities and Exchange Commission, granting unto said attorneys-in-fact and agents, and each of them, full power and authority to do and perform each and every act and thing requisite and necessary to be done in connection therewith, as fully to all intents and purposes as such person might or could do in person, hereby ratifying and confirming that all said attorneys-in-fact and agents, or any of them or their or such person’s substitute or substitutes, may lawfully do or cause to be done by virtue thereof.
Pursuant to the requirements of the Securities Exchange Act of 1934, this Report has been signed below by the following persons on behalf of the Registrant and in the capacities and on the date or dates indicated.
|
Name
|
Title
|
Date
|
||
|
/s/ Jean-Michel Valette
|
Chairman of the Board
|
February 21, 2018
|
||
|
Jean-Michel Valette
|
||||
|
/s/ Shelly R. Ibach
|
Director
|
February 26, 2018
|
||
|
Shelly R. Ibach
|
||||
|
/s/ Daniel I. Alegre
|
Director
|
February 21, 2018
|
||
|
Daniel I. Alegre
|
||||
|
/s/ Stephen L. Gulis, Jr.
|
Director
|
February 26, 2018
|
||
|
Stephen L. Gulis, Jr.
|
||||
|
/s/ Michael J. Harrison
|
Director
|
February 23, 2018
|
||
|
Michael J. Harrison
|
||||
|
/s/ Brenda J. Lauderback
|
Director
|
February 24, 2018
|
||
|
Brenda J. Lauderback
|
||||
|
/s/ Barbara R. Matas
|
Director
|
February 23, 2018
|
||
|
Barbara R. Matas
|
||||
|
/s/ Kathleen L. Nedorostek
|
Director
|
February 26, 2018
|
||
|
Kathleen L. Nedorostek
|
||||
|
/s/ Vicki A. O'Meara
|
Director
|
February 25, 2018
|
||
|
Vicki A. O'Meara
|
||||
|
/s/ Michael A. Peel
|
Director
|
February 26, 2018
|
||
|
Michael A. Peel
|
||||
69
SLEEP NUMBER CORPORATION AND SUBSIDIARIES
Schedule II - Valuation and Qualifying Accounts
(in thousands)
|
Description
|
2017
|
2016
|
2015
|
|||||||||
|
Allowance for doubtful accounts
|
||||||||||||
|
Balance at beginning of period
|
$
|
884
|
|
$
|
1,039
|
|
$
|
739
|
|
|||
|
Additions charged to costs and expenses
|
915
|
|
1,224
|
|
1,577
|
|
||||||
|
Deductions from reserves
|
(1,085
|
)
|
(1,379
|
)
|
(1,277
|
)
|
||||||
|
Balance at end of period
|
$
|
714
|
|
$
|
884
|
|
$
|
1,039
|
|
|||
|
Accrued sales returns
|
||||||||||||
|
Balance at beginning of period
|
$
|
15,222
|
|
$
|
20,562
|
|
$
|
15,262
|
|
|||
|
Additions charged to costs and expenses
|
77,226
|
|
71,958
|
|
84,265
|
|
||||||
|
Deductions from reserves
|
(73,178
|
)
|
(77,298
|
)
|
(78,965
|
)
|
||||||
|
Balance at end of period
|
$
|
19,270
|
|
$
|
15,222
|
|
$
|
20,562
|
|
|||
70
TABLE OF CONTENTS
Part IItem 1. BusinessItem 1A. Risk FactorsItem 1B. Unresolved Staff CommentsItem 2. PropertiesItem 3. Legal ProceedingsItem 4. Mine Safety DisclosuresPart IIItem 5. Market For Registrant S Common Equity, Related Stockholder Matters and Issuer Purchases Of Equity SecuritiesPart OfItem 6. Selected Financial DataItem 7. Management S Discussion and Analysis Of Financial Condition and Results Of OperationsItem 7A. Quantitative and Qualitative Disclosures About Market RiskItem 8. Financial Statements and Supplementary DataItem 9. Changes in and Disagreements with Accountants on Accounting and Financial DisclosureItem 9A. Controls and ProceduresItem 9B. Other InformationPart IIIItem 10. Directors, Executive Officers and Corporate GovernanceItem 11. Executive CompensationItem 12. Security Ownership Of Certain Beneficial Owners and Management and Related Stockholder MattersItem 13. Certain Relationships and Related Transactions, and Director IndependenceItem 14. Principal Accounting Fees and ServicesPart IVItem 15. Exhibits, Financial Statement SchedulesItem 16. Form 10-k Summary