SMART SAND, INC.
10-Ks and 10-Qs
|
|
|
|
|
|
|
|
|
|
|
|
|
|
|
|
|
|
|
|
|
|
|
|
|
|
|
|
|
|
|
|
|
|
|
|
|
|
|
|
|
|
|
|
|
|
|
|
|
|
|
|
|
|
|
|
|
|
|
|
|
|
|
|
|
|
|
|
|
|
|
|
|
|
|
|
|
|
|
|
|
|
|
|
|
|
|
|
|
|
|
|
|
|
|
|
|
|
|
|
|
|
|
|
|
|
|
|
|
|
|
|
|
|
|
|
|
|
|
|
|
|
|
|
|
|
|
|
|
|
|
|
|
|
|
|
|
|
|
|
|
|
|
|
|
UNITED STATES
SECURITIES AND EXCHANGE COMMISSION
Washington, D.C. 20549
__________________________________________________
FORM 10-K
__________________________________________________
|
x
|
ANNUAL REPORT PURSUANT TO SECTION 13 OR 15(d) OF THE SECURITIES EXCHANGE ACT OF 1934
|
For the Annual Period Ended
December 31, 2018
OR
|
¨
|
TRANSITION REPORT PURSUANT TO SECTION 13 OR 15(d) OF THE SECURITIES EXCHANGE ACT OF 1934
|
For the Transition Period from ___ to ___
Commission file number 001-37936
__________________________________________________________________________________________________________________________________________________________________________________________

SMART SAND, INC.
(Exact name of registrant as specified in its charter)
|
Delaware
|
45-2809926
|
|
(State or other jurisdiction of incorporation or organization)
|
(I.R.S. Employer Identification Number)
|
|
1725 Hughes Landing Blvd, Suite 800
|
|
|
The Woodlands, Texas 77380
|
(281) 231-2660
|
|
(Address of principal executive offices)
|
(Registrant’s telephone number)
|
|
Securities registered pursuant to Section 12(b) of the Act:
|
|
|
Title of each class
|
Name of each exchange on which registered
|
|
Common Stock, par value $0.001 per share
|
The NASDAQ Stock Market LLC
|
|
Securities registered pursuant to Section 12(g) of the Act:
None
|
|
Indicate by check mark if the registrant is a well-known seasoned issuer, as defined in Rule 405 of the Securities Act. Yes
¨
No
x
Indicate by check mark if the registrant is not required to file reports pursuant to Section 13 or Section 15(d) of the Securities Exchange Act of 1934. Yes
¨
No
x
Indicate by check mark whether the registrant (1) has filed all reports required to be filed by Section 13 or 15(d) of the Securities Exchange Act of 1934 during the preceding 12 months (or for such shorter period that the registrant was required to file such reports), and (2) has been subject to such filing requirements for the past 90 days. Yes
x
No
¨
Indicate by check mark whether the registrant has submitted electronically and posted on its corporate Web site, if any, every Interactive Data File required to be submitted and posted pursuant to Rule 405 of Regulation S-T (§232.405 of this chapter) during the preceding 12 months (or for such shorter period that the registrant was required to submit and post such files). Yes
x
No
¨
Indicate by check mark if disclosure of delinquent filers pursuant to Item 405 of Regulation S-K (§229.405) is not contained herein, and will not be contained, to the best of registrant’s knowledge, in definitive proxy or information statements incorporated by reference in Part III of this Form 10-K or any amendment to this Form 10-K.
¨
Indicate by check mark whether the registrant is a large accelerated filer, an accelerated filer, a non-accelerated filer, a smaller reporting company, or an emerging growth company. See the definitions of “large accelerated filer,” “accelerated filer,” “smaller reporting company,” and “emerging growth company” in Rule 12b-2 of the Exchange Act.
|
Large accelerated filer ☐
|
Accelerated filer
ý
|
Non-accelerated filer ☐
|
Smaller reporting company
ý
|
Emerging growth company
ý
|
If an emerging growth company, indicate by check mark if the registrant has elected not to use the extended transition period for complying with any new or revised financial accounting standards provided pursuant to Section 13(a) of the Exchange Act.
x
Indicate by check mark whether the registrant is a shell company (as defined in Rule 12b-2 of the Act). Yes
¨
No
x
As of June 29, 2018, the last business day of the registrant’s second fiscal quarter of 2018, the aggregate market value of the registrant’s common stock held by non-affiliates of the registrant was
$113,607,795
based on the closing price of $5.31 per share, as reported on NASDAQ on that date.
Number of shares of common shares outstanding, par value $0.001 per share as of
March 7, 2019
was
41,013,671
.
DOCUMENTS INCORPORATED BY REFERENCE
Portions of the registrant’s proxy statement for the 2019 Annual Meeting of Stockholders are incorporated herein by reference in Part III of this Annual Report on Form 10-K. Such proxy statement will be filed with the Securities and Exchange Commission within 120 days of the registrant’s fiscal year ended
December 31, 2018
.
TABLE OF CONTENTS
|
|
|
|
PAGE
|
|
|
|
|
|
|
|
|
|
|
|
|
|||
|
|
|||
|
|
|||
|
|
|||
|
|
|||
|
|
|||
|
|
|
|
|
|
|
|
||
|
|
|
|
|
|
|
|||
|
|
|||
|
|
|||
|
|
|||
|
|
|||
|
|
|||
|
|
|||
|
|
|||
|
|
|
|
|
|
|
|
||
|
|
|
|
|
|
|
|||
|
|
|||
|
|
|||
|
|
|||
|
|
|||
|
|
|
|
|
|
|
|
||
|
|
|
|
|
|
|
|||
|
|
|||
|
|
|
|
|
|
|
|||
|
|
|
|
|
Certain Definitions
The following definitions apply throughout this annual report unless the context requires otherwise:
|
“We”, “Us”, “Company”, “Smart Sand” or “Our”
|
Smart Sand, Inc., a company organized under the laws of Delaware, and its subsidiaries.
|
|
|
“shares”, “stock”
|
The common stock of Smart Sand, Inc., nominal value $0.001 per share.
|
|
|
“Credit Agreement”, “Credit Facility”
|
On December 8, 2016, the Company entered into a $45 million 3-year senior secured revolving credit facility under a revolving credit agreement with Jefferies Finance LLC as administrative and collateral agent (the “Credit Agreement”). This credit facility was amended: (i) on April 8, 2018, to increase our total borrowing capacity to $60 million; (ii) on July 13, 2018, to among other things, (A) increase the limit on our ability to sell, transfer or dispose of assets, subject to certain considerations from an aggregate amount of $25 million to $55 million, (B) increase the limit on our ability to incur capital lease obligations from an aggregate principal amount of $15 million to $30 million and (C) exclude certain current and future earn-out obligations from the definition of indebtedness in the Credit Agreement; and (iii) on February 22, 2019 to, among other things (A) extend the maturity date to June 30, 2020 and (B) decrease our total borrowing capacity to $50 million between June 30, 2019 to December 31, 2019 (“Credit Facility”).
|
|
|
“Exchange Act”
|
The Securities Exchange Act of 1934, as amended.
|
|
|
“Securities Act”
|
The Securities Act of 1933, as amended.
|
|
|
“FCA”, “DAT”, “DAP”
|
Free Carrier, Delivered at Terminal, Delivered at Place, respectively, Incoterms 2010.
|
|
|
“FASB”, “ASU”, “ASC”
|
Financial Accounting Standards Board, Accounting Standards Update, Accounting Standards Codification, respectively.
|
|
3
Disclaimer Regarding Forward-looking Statements
This Annual Report on Form 10-K contains forward-looking statements that are subject to risks and uncertainties. All statements other than statements of historical fact included in this Annual Report on Form 10-K are forward-looking statements. Forward-looking statements give our current expectations and projections relating to our financial condition, results of operations, plans, objectives, future performance and business. You can identify forward-looking statements by the fact that they do not relate strictly to historical or current facts. These statements may include words such as “anticipate’’, “estimate’’, “expect”, “project”, “plan”, “intend”, “believe”, “may”, “will”, “should”, “can have”, “likely” and other words and terms of similar meaning in connection with any discussion of the timing or nature of future operating or financial performance or other events. For example, all statements we make relating to our estimated and projected costs, expenditures, cash flows, growth rates and financial results, our plans and objectives for future operations, growth or initiatives, strategies or the expected outcome or impact of pending or threatened litigation are forward-looking statements. All forward-looking statements are subject to risks and uncertainties that may cause actual results to differ materially from those that we expected, including without limitation:
|
•
|
fluctuations in demand for raw frac sand;
|
|
•
|
the cyclical nature of our customers' businesses;
|
|
•
|
operating risks that are beyond our control, such as changes in the price and availability of transportation, natural gas or electricity; unusual or unexpected geological formations or pressures; pit wall failures or rock falls: or unanticipated ground, grade or water conditions;
|
|
•
|
our dependence on our Oakdale mine and processing facility for current sales;
|
|
•
|
the level of activity in the oil and natural gas industries;
|
|
•
|
the development of either effective alternative proppants or new processes to replace hydraulic fracturing;
|
|
•
|
increased competition from new sources of raw frac sand supply, including new raw frac sand mines in locations such as the Permian Basin of West Texas;
|
|
•
|
federal, state and local legislative and regulatory initiatives relating to hydraulic fracturing and the potential for related regulatory action or litigation affecting our customers' operations;
|
|
•
|
our rights and ability to mine our properties and our renewal or receipt of the required permits and approvals from governmental authorities and other third parties;
|
|
•
|
our ability to implement our capacity expansion plans within our current timetable and budget and our ability to secure demand for our increased production capacity, along with the actual operating costs we will incur once we have completed the capacity expansion;
|
|
•
|
our ability to successfully compete in the raw frac sand market;
|
|
•
|
loss of, or reduction in, business from our largest customers;
|
|
•
|
increasing costs or a lack of dependability or availability of transportation services and transload network access or infrastructure;
|
|
•
|
increases in the prices of, or interruptions in the supply of, natural gas, electricity, or any other energy sources;
|
|
•
|
increases in the price of diesel fuel;
|
|
•
|
loss of or diminished access to water;
|
|
•
|
our ability to successfully complete acquisitions or integrate acquired businesses;
|
|
•
|
our ability
to fully protect our intellectual property rights;
|
|
•
|
our ability to make capital expenditures to maintain, develop and increase our asset base and our ability to obtain needed capital or financing on satisfactory terms;
|
|
•
|
restrictions imposed by our indebtedness on our current and future operations;
|
4
|
•
|
contractual obligations that require us to deliver minimum amounts of frac sand or purchase minimum amounts of services;
|
|
•
|
the accuracy of our estimates of mineral reserves and resource deposits;
|
|
•
|
a shortage of skilled labor and rising costs in the frac sand mining and manufacturing industries;
|
|
•
|
our ability to attract and retain key personnel;
|
|
•
|
our ability to maintain satisfactory labor relations;
|
|
•
|
our ability to maintain effective quality control systems at our mining, processing and production facilities;
|
|
•
|
seasonal and severe weather conditions;
|
|
•
|
fluctuations in our sales and results of operations due to seasonality and other factors;
|
|
•
|
interruptions or failures in our information technology systems, including cyber-attacks;
|
|
•
|
the impact of a terrorist attack or armed conflict;
|
|
•
|
extensive and evolving environmental, mining, health and safety, licensing, reclamation and other regulation (and changes in their enforcement or interpretation);
|
|
•
|
silica-related health issues and corresponding litigation;
|
|
•
|
our ability to acquire, maintain or renew financial assurances related to the reclamation and restoration of mining property; and
|
|
•
|
other factors disclosed in Item I A. "Risk Factors" and elsewhere in this Annual Report on Form 10-K.
|
We derive many of our forward-looking statements from our operating budgets and forecasts, which are based on many detailed assumptions. While we believe that our assumptions are reasonable, we caution that it is very difficult to predict the impact of known factors, and it is impossible for us to anticipate all factors that could affect our actual results. Important factors that could cause actual results to differ materially from our expectations, or cautionary statements, are disclosed under Item 1A, “Risk Factors” and Item 7, “Management’s Discussion and Analysis of Financial Condition and Results of Operations” in this Annual Report on Form 10-K. All written and oral forward-looking statements attributable to us, or persons acting on our behalf, are expressly qualified in their entirety by these cautionary statements as well as other cautionary statements that are made from time to time in our other filings with the Securities and Exchange Commission (the “SEC”) and public communications. You should evaluate all forward-looking statements made in this Annual Report on Form 10-K in the context of these risks and uncertainties.
We caution you that the important factors referenced above may not contain all of the factors that are important to you. In addition, we cannot assure you that we will realize the results or developments we expect or anticipate or, even if substantially realized, that they will result in the consequences or affect us or our operations in the way we expect. The forward-looking statements included in this Annual Report on Form 10-K are made only as of the date hereof. We undertake no obligation to update or revise any forward-looking statement as a result of new information, future events or otherwise, except as otherwise required by law
5
PART I
ITEM 1. — BUSINESS
Overview
We are a fully integrated frac sand supply and services company, offering complete mine to wellsite solutions for our customers. We produce low-cost, high quality Northern White raw frac sand, which is a premium proppant used to enhance hydrocarbon recovery rates in the hydraulic fracturing of oil and natural gas wells. We also offer proppant logistics solutions to our customers through our in-basin transloading terminal and wellsite storage capabilities. We currently market our products and services primarily to oil and natural gas exploration and production companies and oilfield service companies and sell our products under a combination of long-term take-or-pay contracts and spot sales in the open market. We believe that the size and favorable geologic characteristics of our sand reserves, the strategic location and logistical advantages of our facilities, our proprietary portable wellsite storage solutions and the industry experience of our senior management team have positioned us as a highly attractive provider of raw frac sand and proppant logistics services from the mine to the wellsite.
We own and operate a raw frac sand mine and related processing facility near Oakdale, Wisconsin, at which we have approximately
317 million tons
of proven recoverable sand reserves as of
December 31, 2018
. We incorporated in Delaware in July 2011 and began operations with 1.1 million tons of annual nameplate processing capacity in July 2012. After several expansions, our current annual nameplate processing capacity at our Oakdale facility is approximately
5.5 million tons
of raw frac sand. Our integrated Oakdale facility, with on-site rail infrastructure and wet and dry sand processing facilities, has access to two Class I rail lines and enables us to process and cost effectively deliver products to our customers.
On March 15, 2018, we acquired the rights to operate a unit train capable transloading terminal in Van Hook, North Dakota to service the Bakken Formation in the Williston Basin. We paid cash consideration of approximately $15.5 million to acquire certain assets at the Van Hook terminal, and entered into a long-term lease agreement in connection with the transaction. As part of this transaction, we entered into a long-term agreement with Canadian Pacific Railway to service the Van Hook terminal directly along with the other key oil and natural gas exploration and production basins of North America. The Van Hook terminal became operational in April 2018. Since operations commenced, we have been providing Northern White sand in-basin at this terminal to our customers. We believe this new terminal provides us with an opportunity to expand our customer base and offer more efficient delivery options to customers operating in the Williston Basin.
On June 1, 2018, we acquired substantially all of the assets of Quickthree Solutions, Inc. (“Quickthree”), a manufacturer of portable vertical proppant storage solution systems. We paid cash consideration of approximately $30.0 million at closing and up to $12.8 million in potential earn-out payments, which are to be paid as system components are built and made available for sale or lease over a three-year period from the acquisition date. We believe that this acquisition provides us with the technology, production capacity and management team to compete further in the proppant logistics market and will provide us with an opportunity to expand our customer base by being able to offer proppant logistics services all the way to the wellsite.
We own a second property in Jackson County, Wisconsin, which we call the Hixton site. The Hixton site is also located adjacent to a Class I rail line and is fully permitted to initiate operations and is available for future development. As of
December 31, 2018
, our Hixton site had approximately
100 million tons
of proven recoverable sand reserves. We have no immediate plans to further develop this site.
We also hold two long-term surface mining leases for properties located in the Permian Basin in Texas that are available for future development. The first site consists of
1,772 acres
in Winkler County, Texas. This location is adjacent to the Texas & New Mexico Railway (TXN) short line with direct access to State Highway 18. The second site consists of
2,447 acres
in Crane County, Texas. This location has direct access to Interstate Highway 20. The Permian Basin sites have been acquired for a combined cost of less than $5.0 million and have low associated ongoing costs. Based on our preliminary testing, we believe there are sufficient quantities on these sites to establish reserves in the future. We have no immediate plans to develop these sites.
For the years ended
December 31, 2018
,
2017
and
2016
, we generated net income of approximately
$18.7 million
,
$21.5 million
and
$10.4 million
, respectively, and Adjusted EBITDA of approximately
$66.0 million
,
$30.6 million
and
$37.8 million
, respectively. For the definition of Adjusted EBITDA and a reconciliation to its most directly comparable financial measure calculated and presented in accordance with U.S. Generally Accepted Accounting Principles (“GAAP”), please read “Note Regarding Non-GAAP Financial Measures.” For more financial information about our business, please read “Selected Financial Data.”
From early 2017 through the second quarter of 2018, improvements in oil and natural gas prices created a more stable market environment. During the second half of 2018, the demand for Northern White sand decreased, which we believe was due primarily to insufficient takeaway capacity for the incremental oil and natural gas production coming online in the Permian
6
Basin, along with increased availability of regional sand as a source of proppant in the Permian basin. Additionally, oil and natural gas companies reduced their spending in the latter portion of the year due to strong spending in the first half of 2018 and lower oil prices, particularly in the fourth quarter of 2018. Our spot sales continued at decreased rates through the second half of 2018, and we agreed to temporary price adjustments under certain of our long-term agreements. In general, we received term extensions in exchange for such price adjustments. Otherwise, the contractual terms under our long-term agreements have not changed materially. In general, customers under long-term take-or-pay contracts are required to make periodic shortfall payments if their contracted volumes are not taken, which we recognize as revenue in our results of operations in the period in which the obligation becomes due. Contracted volumes decreased in the fourth quarter of 2018, which resulted in additional shortfall revenue.
Northern White raw frac sand, which is found predominantly in Wisconsin and limited portions of Minnesota and Illinois, is considered a premium proppant due to its favorable physical characteristics. While we anticipate that regional sand may affect the demand for Northern White sand in some of the oil and natural gas operating basins in which we operate, we believe there will continue to be demand for our high-quality Northern White raw frac sand. We expect demand for our frac sand to grow from customers who are focused on long-term well performance and ultimate recovery of reserves from the oil and natural gas wells they are completing as well as those interested in the efficiency of their logistics supply chain and delivery of sand to the wellsite. Additionally, we believe the development of North America’s unconventional oil and natural gas reservoirs will continue to grow and increased proppant usage per well trends will continue, particularly with respect to finer mesh sizes. We expect the trend of using larger volumes of finer mesh materials, such as 100 mesh sand and 40/70 mesh sand, to continue.
Competitive Strengths
We believe that we will be able to successfully execute our business strategies because of the following competitive strengths:
|
•
|
Long-lived, strategically located, high-quality reserve base.
We believe our Oakdale facility is one of the few raw frac sand mine and production facilities that has the unique combination of a large high-quality reserve base of primarily fine mesh sand that is contiguous to its production and primary rail loading facilities. We have an implied proven reserve life of approximately
58 years
based on our current annual nameplate processing capacity of
5.5 million tons
. We believe that with further development and permitting, the Oakdale facility ultimately could be expanded to allow production of up to
9 million tons
of raw frac sand per year.
|
We believe our reserve base positions us well to take advantage of current market trends of increasing demand for finer mesh raw frac sand. We also believe that having our mine, processing facilities and primary rail loading facilities at our Oakdale facility provides us with an overall low-cost structure, which enables us to compete effectively for sales of Northern White raw frac sand and to achieve attractive operating margins. The proximity of our mine, processing plants and primary rail loading facilities at one location eliminates the need for us to truck sand on public roads between the mine and the production facility or between wet and drying processing facilities, eliminating additional costs to produce and ship our sand.
|
•
|
Intrinsic logistics advantage.
We believe that we are one of the few raw frac sand producers with a facility custom-designed for the specific purpose of delivering raw frac sand to all of the major U.S. oil and natural gas producing basins by an on-site rail facility that can simultaneously accommodate multiple unit trains. Our on-site transportation assets at Oakdale include approximately
nine miles
of rail track in a triple-loop configuration and
four
railcar loading facilities that are connected to a Class I rail line owned by Canadian Pacific. We believe our customized on-site logistical configuration yields lower operating and transportation costs compared to manifest train or single-unit train facilities as a result of our higher railcar utilization, more efficient use of locomotive power and more predictable movement of product between mine and destination. In addition, we have a transload facility on a Class I rail line owned by Union Pacific in Byron Township, Wisconsin, approximately three miles from the Oakdale facility. This transload facility, which is capable of handling multiple unit trains simultaneously, allows us to ship sand directly to our customers on more than one Class I rail carrier. We believe that we are the only sand facility in Wisconsin that has dual served rail capabilities, which should create competition among our rail carriers and allow us to provide more competitive logistics options for our customers.
|
|
•
|
Expanded logistics solutions.
Our recently acquired transloading terminal in Van Hook, North Dakota, became operational in April 2018. This terminal is capable of handling multiple unit trains simultaneously, and we have been providing in-basin sand at this terminal to our customers since operations began in April 2018. We believe this new terminal provides us with an opportunity to expand our customer base and offer more efficient delivery options to customers operating in the Bakken Formation in the Williston Basin. We believe our recent acquisition of Quickthree provides us with the technology, production capacity and management team to compete further in the
|
7
proppant logistics market and will provide us with an opportunity to expand our customer base by being able to offer proppant logistics services all the way to the wellsite.
|
•
|
Ample liquidity and financial flexibility.
We believe we have ample liquidity to pursue our growth initiatives. As of December 31, 2018, we have cash on hand of
$1.5 million
and undrawn availability of
$15.5 million
on our $60.0 million Credit Facility. In February 2019, we entered into an agreement with the existing lenders on our Credit Facility to, among other things, extend the maturity date of the Credit Facility to June 30, 2020 and also to reduce the total capacity to $50.0 million by December 31, 2019. Additionally, we have entered into various financing arrangements which allow us to borrow an additional
$14.2 million
. We intend to utilize these funds to continue the manufacturing of our wellsite proppant storage solutions equipment. Additionally, 13% of our railcar fleet comes off lease in 2019, which allows us additional flexibility to manage costs should reduced activity continue.
|
|
•
|
Focus on safety and environmental stewardship.
We are committed to maintaining a culture that prioritizes safety, the environment and our relationship with the communities in which we operate, which we believe is critical to the success of our business. In August 2014, we were accepted as a “Tier 1” participant in Wisconsin’s voluntary “Green Tier” program, which encourages, recognizes and rewards companies for voluntarily exceeding environmental, health and safety legal requirements. In addition, we committed to certification under ISO standards and, in April 2016, we received ISO 9001 and ISO 14001 registrations for our quality management system and environmental management system programs, respectively. In 2018, we received two awards for lowest injury rate for medium sized companies from the Industrial Mineral Association. We are one of a select group of companies who are members of the Wisconsin Industrial Sand Association, which promotes safe and environmentally responsible sand mining standards.
|
|
•
|
Experienced management team.
The members of our senior management team bring significant experience to the market environment in which we operate. Their expertise covers a range of disciplines, including industry-specific operating and technical knowledge and experience managing high-growth businesses.
|
Business Strategies
Our principal business objective is to provide a fully-integrated sand and logistics solution to our customers and increase stockholder value. We expect to achieve this objective through the following business strategies:
|
•
|
Expanding and optimizing our logistics infrastructure and developing additional origination and destination points.
We intend to further optimize our logistics infrastructure and develop additional origination and destination points. We expect to capitalize on our Oakdale facility’s ability to simultaneously accommodate multiple unit trains on-site with the Canadian Pacific rail network and ship on two Class I rail carriers to maximize our product shipment rates, increase our railcar utilization and lower our transportation costs. Through our transloading facility located on the Union Pacific rail network approximately three miles from our Oakdale facility, we have the ability to ship our raw frac sand directly to our customers on more than one Class I rail carrier. This facility provides increased delivery options for our customers, greater competition among our rail carriers and potentially lower freight costs. In 2018, we added a new multi-unit train capable terminal in Van Hook, North Dakota, which we believe allows us to be one of the most efficient and low-cost sources of raw frac sand in the Bakken formation in the Williston Basin. We also acquired a manufacturer of portable vertical frac sand silo equipment, which will allow us to expand the logistics services we can provide all the way to the wellsite for our customers.
|
The benefits of our long-term growth strategy for in-basin delivery of sand include new contracted customers by marketing through our own terminal, more opportunity for spot sales by forward deploying sand and the opportunity to capture incremental margin on the sale of sand farther down the supply chain by managing the cost of rail, terminal and wellsite storage operations. Additionally, having a presence in-basin gives us an opportunity to have a base of operations from which to market our wellsite solutions. We believe our wellsite storage solutions compare favorably to our competitors in that:
|
i.
|
our portable silos can be set up or taken down rapidly;
|
|
ii.
|
our trailers detach, which reduces their footprint on the wellsite;
|
|
iii.
|
our storage silos include industry-leading passive and active dust suppression technology; and
|
|
iv.
|
our patented system has the capability of a gravity-fed operation and when used in combination with our Quickload system, our silos can be filled by both pneumatic and gravity dump trailers.
|
Through the expansion of our wellsite storage solutions fleet and other logistics options, we continue evaluating ways to reduce the landed cost of our products in the basin and to the wellsite for our customers while increasing our customized service offerings to provide our customers with additional delivery and pricing alternatives, including selling product on an “as-delivered” basis to the wellsite.
8
|
•
|
Focusing on organic growth by increasing our utilization of our existing facility.
We intend to continue to pursue opportunities to maximize the value and the utilization of our Oakdale facility in Wisconsin as a producer of high-quality Northern White raw frac sand through the addition of new contracted volumes. Despite the emergence of regional sand in the Permian basin, we believe the proppant market continues to offer attractive long-term growth fundamentals for Northern White raw frac sand due to its superior results as a proppant outweighing the incremental cost savings of regional sand.
|
According to Spears and Associates, Inc. (“Spears”), demand in 2018, in North American basins, increased approximately 33% over 2017 levels and demand in 2019 is expected to increase 4% over 2018 levels. Spears estimates that over the next two years, proppant demand is projected to grow from 98 million tons per year in 2018 to 120 million tons per year in 2020, as exploration and production operators drilling for oil and natural gas continue to increase their use of horizontal drilling and continue to increase the volume of proppant per well drilled through longer lateral well lengths and increased proppant per lateral foot drilled. Additionally, we believe raw frac sand will continue to be a preferred proppant by operators over resin-coated and manufactured ceramics due to the cost advantages.
|
•
|
Focusing on being a low-cost producer and continuing to make process improvements.
We will continue to focus on being a low-cost producer, which we believe will permit us to compete effectively for sales of raw frac sand and to achieve attractive operating margins. Our low-cost structure results from a number of key attributes, including, among others, our (i) relatively low royalty rates, (ii) balance of coarse and fine mineral reserve deposits and corresponding contractual demand that minimizes yield loss, and (iii) Oakdale facility’s proximity to two Class I rail lines and other sand logistics infrastructure. We have strategically designed our operations to provide for low-cost production. For example, as part of our recent Oakdale expansion, we enclosed two dryers and one wet plant in a single building to allow these processing plants to operate on a year-round basis. This should allow us to more efficiently match our wet sand production with our drying capacity and to better utilize our workforce with a goal to reduce the overall cost of production. In addition, we seek to maximize our mining yields on an ongoing basis by targeting sales volumes that more closely match our reserve gradation in order to minimize mining and processing of superfluous tonnage. We also continue to evaluate other mining techniques to reduce the overall cost of our mining operations.
|
|
•
|
Creating flexible sales activities.
We believe that demand for our products will remain strong in basins where regional sand is not widely available, such as the Bakken in North Dakota and Marcellus and Utica formations in the Northeast region of the United States. We continue to have discussions with operators in these regions regarding new relationship and growth opportunities. We also believe that the long-term benefits of high quality Northern White sand outweighs the short-term cost savings provided by regional sand in the Permian basin. We believe there are additional opportunities for customers in the Permian and other basins, which have regional supply, who are focused on the long-term performance of their production and on the long-term efficiency of the logistics of their supply needs.
|
Our Customers and Contracts
We sell raw frac sand under long-term take-or-pay contracts as well as in the spot market if we have excess production and the spot market conditions are favorable. As of
December 31, 2018
, approximately 58% of our current annual nameplate capacity of
5.5 million tons
is under contract with a volume-weighted average remaining term of approximately 2 years.
Demand for proppants through the first half of 2016 dropped due to the downturn in commodity prices originating in late 2014 and the corresponding reduction in oil and natural gas drilling, completion and production activity. The change in demand during this period impacted contract discussions and negotiated terms with our customers as existing contracts were adjusted, resulting in a combination of reduced average selling prices per ton, and adjustments to take-or-pay volumes and lengths of contracts. We believe we have mitigated the short-term negative impact on revenues of some of these adjustments through contractual shortfall and reservation payments. During the market downturn, customers began to purchase more volumes on a spot basis as compared to committing to long-term contracts, and this trend continued until oil and natural gas drilling and completion activity began to increase beginning in the fourth quarter of 2016. In 2017, drilling and completion activity returned to higher levels, which led customers to more actively consider contracting proppant volumes under term contracts rather than continuing to rely on buying proppant on a spot basis in the market. From early 2017 through the second quarter of 2018, improvements in oil and natural gas prices created a more stable market environment. During the second half of 2018, the demand for Northern White sand decreased, which we believe was due primarily to insufficient takeaway capacity for the incremental oil and natural gas production coming online in the Permian Basin, along with increased availability of regional sand as a source of proppant in the Permian basin. Additionally, oil and natural gas companies reduced their spending in the latter portion of the year due to strong spending in the first half of 2018 and lower oil prices, particularly in the fourth quarter of 2018. Our spot sales continued at decreased rates through the second half of 2018, and we have agreed to temporary price adjustments, typically in exchange for term extensions under certain of our long-term agreements. The contractual terms
9
under our long-term agreements have not otherwise materially changed. In general, customers under long-term take-or-pay contracts are required to make periodic shortfall payments, which we recognize as revenue in our results of operations in the period in which the obligation becomes due. Contracted volumes decreased in the fourth quarter of 2018, resulting in additional shortfall revenue.
Our core customers are oil and natural gas exploration and production and oilfield service companies. These customers have signed long-term take-or-pay contracts, which mitigate our risk of non-performance by such customers. Our contracts provide for a true-up payment in the event the customer does not take delivery of the minimum volume of raw frac sand specified in the contract and, in some cases, has not purchased in certain prior periods an amount exceeding the minimum volume, resulting in a shortfall. The true-up payment is designed to compensate us, at least in part, for our margins for the applicable contract period and is calculated by multiplying the contract price (or, in many cases, a discounted contract price) by the tonnage shortfall. Any sales of the shortfall volumes to other customers on the spot market would provide us with additional margin on these volumes. Additionally, some of our contracts include monthly reservation charges that the customer is required to pay for minimum monthly volumes regardless of whether the customer takes delivery of the sand. For the year ended
December 31, 2018
, sales to
Liberty
,
EQT
,
WPX Energy
, and
Hess
accounted for
22.8%
,
21.4%
,
11.6%
, and
10.6%
, respectively, of total revenue, and the remainder of our revenues represented sales to twenty customers. For the year ended
December 31, 2017
, Rice Energy, Liberty, Weatherford, and US Well Services accounted for
27.1%
,
20.6%
,
13.7%
, and
10.2%
, respectively, of our total revenues, and the remainder of our revenues represented sales to sixteen customers. For the year ended
December 31, 2016
, EOG Resources, Weatherford, US Well Services, and Nabors Completion & Production Services accounted for
37.5%
,
25.2%
,
22.4%
, and
10.8%
, respectively, of our total revenues, and the remainder of our revenues represented sales to five customers. Please read “Risk Factors—Risks Inherent in Our Business—A substantial majority of our revenues have been generated under contracts with a limited number of customers, and the loss of, material nonpayment or nonperformance by or significant reduction in purchases by any of them could adversely affect our business, results of operations and financial condition.” For the years ended
December 31, 2018
,
2017
, and
2016
, we generated approximately
80.1%
,
79.8%
, and 97.6%, respectively, of our revenues from raw frac sand delivered under long-term take-or-pay contracts.
Certain of our contracts include variable product prices indexed to the price of crude oil (based upon the average price of West Texas Intermediate crude oil (“WTI”) as listed on
www.eia.doe.gov
). Many of our contracts also contain provisions allowing for monetary adjustment including: (i) annual percentage price escalators, or (ii) market factor increases (and in some cases decreases), including a natural gas surcharge/reduction and/or a propane surcharge/reduction which are applied if the Average Natural Gas Price or the Average Quarterly Mont Belvieu TX Propane Spot Price, respectively, as listed by the U.S. Energy Information Administration, are above or below the applicable benchmark set forth in the contract for the preceding calendar quarter.
Our contracts generally provide that, if we are unable to deliver the contracted minimum volume of raw frac sand, the customer has the right to purchase replacement raw frac sand from alternative sources, provided that our inability to supply is not the result of an excusable delay. In the event that the price of replacement raw frac sand exceeds the contract price and our inability to supply the contracted minimum volume is not the result of an excusable delay, we are responsible for the price difference, up to a specified limit. At
December 31, 2018
, we had significant levels of raw frac sand inventory on hand; therefore, we consider the likelihood of any such penalties as remote.
Certain of our contracts allow the customer to defer a portion of the annual minimum volume to future contract years, subject to a maximum deferral amount. The mesh size specifications in our contracts vary and include a mix of 20/40, 30/50, 40/70 and 100 mesh raw frac sand. In the event that one or more of our current contract customers decides not to continue purchasing our raw frac sand following the expiration of its contract with us, we believe that we will be able to sell the volume of sand that they previously purchased to other customers through long-term contracts or sales on the spot market.
Capital Plans
We expect to continue expanding our manufactured wellsite proppant storage solutions and evaluate other proposed projects and related expenditures, such as investments in transload facilities located in various operating basins, in light of customer demand and energy market trends. There can be no assurance, however, that all or any of these initiatives will be executed or that the results therefrom will be materially beneficial to our financial performance.
Industry Trends Impacting Our Business
Unless otherwise indicated, the information set forth under “—Industry Trends Impacting Our Business,” including all statistical data and related forecasts, is derived from Spears’ “Proppant Market Report with Frac Market Overview - Q4 2018” published in the first quarter of 2019. While we are not aware of any misstatements regarding the proppant industry data presented herein, estimates involve risks and uncertainties and are subject to change based on various factors, including those discussed under the heading “Risk Factors.”
10
Demand Trends
According to Spears, the North American proppant market, including raw frac sand, ceramic and resin-coated proppant, was approximately 98 million tons in 2018, which is a 33% increase over the 74 million tons Spears reported for 2017. Spears estimates that 2019 demand will increase 4% and 2020 demand will increase another 14%, representing an increase of approximately 25 million tons in proppant demand over the next two years.

|
2014
|
2015
|
2016
|
2017
|
2018
|
2019E
|
2020E
|
|
|
New US Horizontal Wells
|
20,819
|
14,413
|
8,599
|
13,116
|
15,691
|
14,840
|
15,233
|
|
Proppant Demand (Mil Tons)
|
67
|
52
|
40
|
74
|
98
|
101
|
120
|
Demand growth for raw frac sand and other proppants is primarily driven by advancements in oil and natural gas drilling and well completion technology and techniques, such as horizontal drilling and hydraulic fracturing. These advancements have made the extraction of oil and natural gas increasingly cost-effective in formations that historically would have been uneconomic to develop. More proppant is being used per well, which is driving the increase in proppant demand despite horizontal drilling activity stabilizing. Spears estimates that proppant demand will reach approximately 101 million tons in 2019 and 120 million tons in 2020. Spears also estimates that average proppant usage per well was approximately 5,800 tons per well in 2018 and will rise to approximately 7,400 tons per well by the end of 2020.
Supply Trends
In 2018, significant sand capacity was added in numerous regions, primarily in the Permian Basin. The total mine capacity outpaced customer demand for raw frac sand leading to an over-supplied market, which has put pricing pressure on raw frac sand pricing. Several factors contributed to this supply surplus, including overdevelopment of new sand mines in response to the prior year shortage, increase in the usage of local sand, and logistical challenges on delivering sand in the higher quantities required by the new higher proppant intensity wells.
Supplies of high-quality Northern White raw frac sand are limited to select areas, predominantly in western Wisconsin and limited areas of Minnesota and Illinois. The ability to obtain large contiguous reserves in these areas is a key constraint and can be an important supply consideration when assessing the economic viability of a potential raw frac sand facility. Further constraining the supply and throughput of Northern White raw frac sand is that not all of the large reserve mines have on-site excavation, processing or logistics capabilities. Historically, much of the capital investment in Northern White raw frac sand mines was used to develop coarser deposits in western Wisconsin, which is inconsistent with the increasing demand for finer mesh raw frac sand in recent years. As such, we’ve seen competitors in the Northern White frac sand market reduce their capacity by shuttering or idling operations as the shift to finer sands in hydraulic fracturing of oil and natural gas wells erodes the ongoing economic viability of producing coarser grades of sand.
11
Permits
We operate in a highly regulated environment overseen by many government regulatory and enforcement bodies at the local, state and federal levels. To conduct our mining operations, we are required to have obtained permits and approvals that address environmental, land use and safety issues at our Oakdale facility, Byron transload facility and our Hixton mine location. Our current and planned areas for excavation at our Oakdale property are permitted for extraction of our proven reserves. Portions of our Oakdale property lie in areas designated as wetlands, which will require additional local, state and federal permits prior to mining and reclaiming those areas.
We also meet requirements for several international standards concerning safety, greenhouse gases and rail operations. We have voluntarily agreed to meet the standards of the Wisconsin Department of Natural Resources’ “Green Tier” program, the “National Industrial Sand Association” (“NISA”) and the “Wisconsin Industrial Sand Association.” Further, we have agreed to meet the standards required to maintain our ISO 9001-2015 and ISO 14001-2015 quality/environmental management system registrations. These voluntary requirements are tracked and managed along with our permits.
While resources invested in securing permits are significant, this cost has not had a material adverse effect on our results of operations or financial condition. We cannot ensure that existing environmental laws and regulations will not be reinterpreted or revised or that new environmental laws and regulations will not be adopted or become applicable to us. Revised or additional environmental requirements that result in increased compliance costs or additional operating restrictions could have a material adverse effect on our business.
Major Stockholder
Our largest stockholder is Clearlake Capital Group, L.P., which, together with its affiliates and related persons, we refer to as Clearlake. Clearlake is a leading private investment firm founded in 2006. With a sector-focused approach, the firm seeks to partner with world-class management teams by providing patient, long-term capital to dynamic businesses that can benefit from Clearlake’s operational improvement approach,
O.P.S.®
. The firm’s core target sectors are industrials and energy; software, and technology-enabled services; and consumer. Clearlake has managed approximately $8 billion of institutional capital since inception and its senior investment principals have led or co-led over 100 investments. We believe our relationship with Clearlake provides us with a unique resource to effectively compete for acquisitions within the industry by being able to take advantage of their experience in acquiring businesses to assist us in seeking out, evaluating and closing attractive acquisition opportunities over time.
Competition
The proppant industry is highly competitive. Please read “Risk Factors—Risks Inherent in Our Business—We face significant competition that may cause us to lose market share.” There are numerous large and small producers in all sand producing regions of North America with whom we compete, many of which also offer solutions for unloading, storing and delivering proppant to the wellsite. Our main competitors include Badger Mining Corporation, Emerge Energy Services LP, Hi-Crush Partners LP, Covia Holdings Corporation, U.S. Silica Holdings, Inc., Black Mountain Sand, Vista Proppants and Logistics, Atlas Sand, and Solaris Oilfield Infrastructure, Inc.
Although some of our competitors have greater financial and other resources than we do, we believe that we are well-positioned competitively due to our patented wellsite solutions which offer numerous benefits over our competition, low cost of sand production, logistics infrastructure and high-quality, balanced reserve profile. The most important factors on which we compete are the performance of patented wellsite storage solutions technology, service capabilities, product quality, proven performance, sand characteristics, transportation capabilities, reliability of supply, price and logistics services. Demand for raw frac sand and logistics solutions and the prices that we will be able to obtain for our products, to the extent not subject to a fixed price or take-or-pay contract, are closely linked to proppant consumption patterns for the completion of oil and natural gas wells in North America. These consumption patterns are influenced by numerous factors, including, among other things, the price for oil and natural gas and hydraulic fracturing activity, including the number of stages completed and the amount of proppant used per stage. Further, these consumption patterns are also influenced by the location, quality, price and availability of raw frac sand and other types of proppants such as resin-coated sand and ceramic proppant.
Seasonality
Our business is affected to some extent by seasonal fluctuations in weather that impact the production levels for a portion of our wet processing plant capacity. While our dry plants are able to process finished product volumes evenly throughout the year, our excavation and our wet sand processing activities have historically been limited to primarily non-winter months. As a consequence, we have experienced lower cash operating costs in the first and fourth quarter of each calendar year, and higher cash operating costs in the second and third quarter of each calendar year when we overproduced to meet demand in the winter months. These higher cash operating costs were capitalized into inventory and expensed when these tons are sold, which can lead to us having higher overall costs in the first and fourth quarters of each calendar year as we expense inventory costs that were previously capitalized. However, during the fourth quarter of 2017, we finished construction
12
of one of our new wet plants, which is an indoor facility that allows us to produce wet sand inventory year-round to support a portion of our dry sand processing capacity, which may reduce certain of the effects of this seasonality. We may also sell raw frac sand for use in oil and natural gas producing basins where severe weather conditions may curtail drilling activities and, as a result, our sales volumes to those areas may be reduced during such severe weather periods. For a discussion of the impact of weather on our operations, please read “Risk Factors—Seasonal and severe weather conditions could have a material adverse impact on our business, results of operations and financial condition” and “Risk Factors—Our cash flow fluctuates on a seasonal basis.”
Intellectual Property
Our intellectual property primarily consists of trade secrets, know-how and trademarks. We own patents and have patent applications pending related to our portable wellsite storage solutions. All of the issued patents have an expiration date after July 2030. With respect to our other products, we principally rely on trade secrets, rather than patents, to protect our proprietary processes, methods, documentation and other technologies, as well as certain other business information.
Insurance
We believe that our insurance coverage is customary for the industry in which we operate and adequate for our business. As is customary in the proppant industry, we review our safety equipment and procedures and carry insurance against most, but not all, risks of our business. Losses and liabilities not covered by insurance would increase our costs. To address the hazards inherent in our business, we maintain insurance coverage that includes physical damage coverage, third-party general liability insurance, employer’s liability, business interruption, environmental and pollution and other coverage, although coverage for environmental and pollution-related losses is subject to significant limitations.
Environmental and Occupational Health and Safety Regulations
We are subject to stringent and complex federal, state and local laws and regulations governing the discharge of materials into the environment or otherwise relating to protection of worker health, safety and the environment. Compliance with these laws and regulations may expose us to significant costs and liabilities and cause us to incur significant capital expenditures in our operations. Any failure to comply with these laws and regulations may result in the assessment of administrative, civil and criminal penalties, imposition of remedial obligations, and the issuance of injunctions delaying or prohibiting operations. Private parties may also have the right to pursue legal actions to enforce compliance as well as to seek damages for non-compliance with environmental laws and regulations or for personal injury or property damage. In addition, the trend in environmental regulation is to place more restrictions on activities that may affect the environment, and thus, any changes in, or more stringent enforcement of, these laws and regulations that result in more stringent and costly pollution control equipment, the occurrence of delays in the permitting or performance of projects, or waste handling, storage, transport, disposal or remediation requirements could have a material adverse effect on our operations and financial position.
We do not believe that compliance by us with federal, state or local environmental laws and regulations will have a material adverse effect on our business, financial position or results of operations or cash flows. We cannot be assured, however, that future events, such as changes in existing laws or enforcement policies, the promulgation of new laws or regulations or the development or discovery of new facts or conditions adverse to our operations will not cause us to incur significant costs. The following is a discussion of material environmental and worker health and safety laws, as amended from time to time that relate to our operations or those of our customers that could have a material adverse effect on our business.
Air Emissions
Our operations are subject to the federal Clean Air Act (“CAA”) and related state and local laws, which restrict the emission of air pollutants and impose permitting, monitoring and reporting requirements on various sources. Over the next several years, we may be required to incur certain capital expenditures for air pollution control equipment or to address other air emissions-related issues. Changing and increasingly stringent requirements, future non-compliance, or failure to maintain necessary permits or other authorizations could require us to incur substantial costs or suspend or terminate our operations.
Climate Change
In recent years, the U.S. Congress has considered legislation to reduce emissions of greenhouse gases (“GHG”). It presently appears unlikely that comprehensive climate legislation will be passed by either house of Congress in the near future. However, a number of states are addressing GHG emissions, primarily through the development of emission inventories or regional GHG cap and trade programs. Depending on the particular program, we could be required to control GHG emissions or to purchase and surrender allowances for GHG emissions resulting from our operations. Independent of Congress, the U.S. Environmental Protection Agency (“EPA”) has adopted regulations controlling GHG emissions under its existing authority. Compliance with new legislation may require us to incur substantial costs or suspend or terminate our operations.
13
Water Discharges
The Clean Water Act (“CWA”) and analogous state laws impose restrictions and strict controls with respect to the discharge of pollutants, including spills and leaks of oil and other substances, into state waters or waters of the United States. The discharge of pollutants into regulated waters is prohibited, except in accordance with the terms of a permit issued by the EPA or an analogous state agency. The CWA and regulations implemented thereunder also prohibit the discharge of dredge and fill material into regulated waters, including jurisdictional wetlands, unless authorized by the Army Corps of Engineers (“Corps”) pursuant to an appropriately issued permit. In addition, the CWA and analogous state laws require individual permits or coverage under general permits for discharges of storm water runoff from certain types of facilities. Compliance with new rules and legislation could require us to face increased costs and delays with respect to obtaining permits for expansion activities. Federal and state regulatory agencies can impose administrative, civil and criminal penalties as well as other enforcement mechanisms for non-compliance with discharge permits or other requirements of the CWA and analogous state laws and regulations.
Hydraulic Fracturing
We supply raw frac sand to hydraulic fracturing operators in the oil and natural gas industry. Hydraulic fracturing is an important and increasingly common practice that is used to stimulate production of oil and natural gas from low permeability hydrocarbon bearing subsurface rock formations. The hydraulic fracturing process involves the injection of water, proppants, and chemicals under pressure into the formation to fracture the surrounding rock, increase permeability and stimulate production. Although we do not directly engage in hydraulic fracturing activities, our customers purchase our raw frac sand for use in their hydraulic fracturing activities.
The adoption of new laws or regulations at the federal or state levels imposing reporting obligations on, or otherwise limiting or delaying, the hydraulic fracturing process could make it more difficult to complete natural gas wells, increase our customers’ costs of compliance and doing business, and otherwise adversely affect the hydraulic fracturing services they perform, which could negatively impact demand for our raw frac sand.
Non-Hazardous and Hazardous Wastes
The Resource Conservation and Recovery Act (“RCRA”) and comparable state laws control the management and disposal of hazardous and non-hazardous waste. These laws and regulations govern the generation, storage, treatment, transfer and disposal of wastes that we generate. In the course of our operations, we generate waste that are regulated as non-hazardous wastes and hazardous wastes, obligating us to comply with applicable standards relating to the management and disposal of such wastes. In addition, drilling fluids, produced waters, and most of the other wastes associated with the exploration, development, and production of oil or natural gas, if properly handled, are currently exempt from regulation as hazardous waste under RCRA and, instead, are regulated under RCRA’s less stringent non-hazardous waste provisions, state laws or other federal laws. However, it is possible that certain oil and natural gas drilling and production wastes now classified as non-hazardous could be classified as hazardous wastes in the future. A loss of the RCRA exclusion for drilling fluids, produced waters and related wastes could result in an increase in our customers’ costs to manage and dispose of generated wastes and a corresponding decrease in their drilling operations, which developments could have a material adverse effect on our business.
Site Remediation
The Comprehensive Environmental Response, Compensation, and Liability Act, as amended (“CERCLA”) and comparable state laws impose strict, joint and several liability without regard to fault or the legality of the original conduct on certain classes of persons that contributed to the release of a hazardous substance into the environment. These persons include the owner and operator of a disposal site where a hazardous substance release occurred and any company that transported, disposed of, or arranged for the transport or disposal of hazardous substances released at the site. Under CERCLA, such persons may be liable for the costs of remediating the hazardous substances that have been released into the environment, for damages to natural resources, and for the costs of certain health studies. In addition, where contamination may be present, it is not uncommon for the neighboring landowners and other third parties to file claims for personal injury, property damage and recovery of response costs. We have not received notification that we may be potentially responsible for cleanup costs under CERCLA at any site.
Endangered Species
The Endangered Species Act (“ESA”) restricts activities that may affect endangered or threatened species or their habitats. Similar protections are offered to migratory birds under the Migratory Bird Treaty Act. As a result of a settlement approved by the U.S. District Court for the District of Columbia in 2011, the U.S. Fish and Wildlife Service (“FWS”) was required to consider listing numerous species as endangered or threatened under the Endangered Species Act before the completion of the agency’s 2017 fiscal year. The FWS did not meet the deadline. Current ESA listings and the designation of previously unprotected species as threatened or endangered in areas where we or our customers operate could cause us or our customers to incur increased costs arising from species protection measures and could result in delays or limitations in our or
14
our customers’ performance of operations, which could adversely affect or reduce demand for our raw frac sand. For example, the dunes sagebrush lizard, which is found only in the active and semi-stable shinnery oak dunes of southeastern New Mexico and adjacent portions of Texas, was a candidate species for listing under the ESA by the FWS for many years. In 2010, the FWS proposed listing the dunes sagebrush lizard as an endangered species under the ESA. In response, the Texas Comptroller’s Office created the Texas Conservation Plan (“TCP”) in 2012 to minimize disturbances to the dunes sagebrush lizard’s habitat. Our site in Crane County, Texas has been included in the TCP. In June 2012, the FWS declined to list the species as endangered under the ESA. Currently, the Texas Comptroller’s Office is working with the FWS to replace the TCP with a new Candidate Conservation Agreement with Assurances (“CCAA”) that includes an updated habitat map. FWS will review the draft CCAA and the Texas Comptroller’s Office has indicated on its website that it expects the CCAA to receive final approval by spring 2019.
Mining and Workplace Safety
Our sand mining operations are subject to mining safety regulation. The U.S. Mining Safety and Health Administration (“MSHA”) is the primary regulatory organization governing raw frac sand mining and processing. Accordingly, MSHA regulates quarries, surface mines, underground mines and the industrial mineral processing facilities associated with and located at quarries and mines. The mission of MSHA is to administer the provisions of the Federal Mine Safety and Health Act of 1977 and to enforce compliance with mandatory miner safety and health standards. As part of MSHA’s oversight, representatives perform at least two unannounced inspections annually for each above-ground facility.
OSHA has promulgated new rules for workplace exposure to respirable silica for several other industries. Respirable silica is a known health hazard for workers exposed over long periods. MSHA is expected to adopt similar rules as part of its “Long Term Items” for rulemaking. Airborne respirable silica is associated with work areas at our site and is monitored closely through routine testing and MSHA inspection. If the workplace exposure limit is lowered significantly, we may be required to incur certain capital expenditures for equipment to reduce this exposure. Smart Sand also adheres to the NISA’s respiratory protection program, and ensures that workers are provided with fitted respirators and ongoing radiological monitoring.
Environmental Reviews
Our operations may be subject to broad environmental review under the National Environmental Policy Act, as amended, (“NEPA”). NEPA requires federal agencies to evaluate the environmental impact of all “major federal actions” significantly affecting the quality of the human environment. The granting of a federal permit for a major development project, such as a mining operation, may be considered a “major federal action” that requires review under NEPA. As part of this evaluation, the federal agency considers a broad array of environmental impacts, including, among other things, impacts on air quality, water quality, wildlife (including threatened and endangered species), historic and archeological resources, geology, socioeconomics, and aesthetics. NEPA also requires the consideration of alternatives to the project. The NEPA review process, especially the preparation of a full environmental impact statement, can be time consuming and expensive. The purpose of the NEPA review process is to inform federal agencies’ decision-making on whether federal approval should be granted for a project and to provide the public with an opportunity to comment on the environmental impacts of a proposed project. Though NEPA requires only that an environmental evaluation be conducted and does not mandate a particular result, a federal agency could decide to deny a permit or impose certain conditions on its approval, based on its environmental review under NEPA, or a third party could challenge the adequacy of a NEPA review and thereby delay the issuance of a federal permit or approval.
State and Local Regulation
We are subject to a variety of state and local environmental review and permitting requirements. Some states, including Wisconsin where our current projects are located, have state laws similar to NEPA; thus, our development of a new site or the expansion of an existing site may be subject to comprehensive state environmental reviews even if it is not subject to NEPA. In some cases, the state environmental review may be more stringent than the federal review. Our operations may require state-law based permits in addition to federal permits, requiring state agencies to consider a range of issues, many the same as federal agencies, including, among other things, a project’s impact on wildlife and their habitats, historic and archaeological sites, aesthetics, agricultural operations, and scenic areas. Wisconsin has specific permitting and review processes for commercial silica mining operations, and state agencies may impose different or additional monitoring or mitigation requirements than federal agencies. The development of new sites and our existing operations also are subject to a variety of local environmental and regulatory requirements, including land use, zoning, building, and transportation requirements.
Demand for raw frac sand in the oil and natural gas industry drove a significant increase in the production of frac sand. As a result, some local communities expressed concern regarding silica sand mining operations. These concerns have generally included exposure to ambient silica sand dust, truck traffic, water usage and blasting. In response, certain state and local communities have developed or are in the process of developing regulations or zoning restrictions intended to minimize dust from becoming airborne, control the flow of truck traffic, significantly curtail the amount of practicable area for mining activities, provide compensation to local residents for potential impacts of mining activities and, in some cases, ban issuance of new permits for mining activities. To date, we have not experienced any material impact to our existing mining operations or
15
planned capacity expansions as a result of these types of concerns. We would expect this trend to continue as oil and natural gas production increases.
In August 2014, we were accepted as a Tier 1 participant in Wisconsin’s voluntary Green Tier program, which encourages, recognizes and rewards companies for voluntarily exceeding environmental, health and safety legal requirements. Successful Tier 1 participants are required to demonstrate a strong record of environmental compliance, develop and implement an environmental management system meeting certain criteria, conduct and submit annual performance reviews to the Wisconsin Department of Natural Resources, promptly correct any findings of non-compliance discovered during these annual performance reviews, and make certain commitments regarding future environmental program improvements. Our most recent annual report required under the Tier 1 protocol was submitted to the Green Tier Program contact on August 1, 2018.
Employees
As of
December 31, 2018
, we employed
323
people. None of our employees are subject to collective bargaining agreements. We consider our employee relations to be good.
Executive Officers of the Registrant
Charles E. Young
Charles E. Young was named Chief Executive Officer in July 2014. Mr. Young has also served as a director since September 2011. Mr. Young founded Smart Sand, LLC (our predecessor) and served as its President from November 2009 to August 2011. Mr. Young served as our President and Secretary from September 2011 to July 2014. Mr. Young has over 20 years of executive and entrepreneurial experience in the high-technology, telecommunications and renewable energy industries. He previously served as the President and Founder of Premier Building Systems, a construction, solar, geothermal and energy audit company in Pennsylvania and New Jersey from 2006 to 2011. Mr. Young serves as a director for Gravity Oilfield Services, Inc., a privately-held company. Mr. Young received a B.A. in Political Science from Miami University. Mr. Young is the brother of William John Young, our Chief Operating Officer, and James D. Young, our Executive Vice President, General Counsel and Secretary. We believe that Mr. Young’s industry experience and deep knowledge of our business makes him well suited to serve as Chief Executive Officer and Director.
Lee E. Beckelman
Lee E. Beckelman was named Chief Financial Officer in August 2014. From December 2009 to February 2014, Mr. Beckelman served as Executive Vice President and Chief Financial Officer of Hilcorp Energy Company, an exploration and production company. From February 2008 to October 2009, he served as the Executive Vice President and Chief Financial Officer of Price Gregory Services, Incorporated, a crude oil and natural gas pipeline construction firm until its sale to Quanta Services. Prior thereto, Mr. Beckelman served in various roles from 2002 to 2007 at Hanover Compressor Company, an international oilfield service company, until its merger with Universal Compression to form Exterran Holdings. Mr. Beckelman received his BBA in Finance with High Honors from the University of Texas at Austin.
William John Young
William John Young was named Chief Operating Officer in April 2018. Prior to that time, he served as Executive Vice President of Sales and Logistics from October 2016 to April 2018. Mr. Young served as Vice President of Sales and Logistics from May 2014 to September 2016 and Director of Sales from November 2011 to April 2014. Prior to joining us, Mr. Young was a Director of Sales for Comcast Corporation from 2002 to 2011. Mr. Young brings over 20 years of experience in the mining, commercial telecommunications and broadband industries. Mr. Young received a BSc in Biology from Dalhousie University. Mr. Young is the brother of Charles E. Young, our Chief Executive Officer and member of our board of directors, and James D. Young, our Executive Vice President, General Counsel and Secretary.
Robert Kiszka
Robert Kiszka was named Executive Vice President of Operations in May 2014. Previously, Mr. Kiszka served as the Vice President of Operations from September 2011 to May 2014. Mr. Kiszka has over 20 years of construction, real estate, renewable energy and mining experience. Mr. Kiszka has been the owner of A-1 Bracket Group Inc. since 2005 and was a member of Premier Building Systems LLC from 2010 to 2011. Mr. Kiszka attended Pedagogical University in Krakow, Poland and Rutgers University.
Ronald P. Whelan
Ronald P. Whelan was named Executive Vice President of Sales in June 2018. Prior to that time, he served as Executive Vice President of Business Development from April 2017 to June 2018, Vice President of Business Development from September 2016 to March 2017 and as Director of Business Development from April 2014 to August 2016. Prior to being named Director of Business Development, Mr. Whelan was the Operations Manager responsible for the design, development and production of the Oakdale facility from November 2011 to April 2014. Before joining Smart Sand, Mr. Whelan ran his own
16
software design company from 2004 to 2011 and was a member of Premier Building Systems LLC from 2008 to 2009. Mr. Whelan has over 17 years of entrepreneurial experience in mining, technology and renewable energy industries. Mr. Whelan received a B.A. in Marketing from Bloomsburg University and M.S. in Instructional Technology from Bloomsburg University.
James D. Young
James D. Young was named Executive Vice President, General Counsel and Secretary in June 2017. Prior to joining us, Mr. Young was a partner of the law firm Fox Rothschild LLP, where he worked for thirteen years and served as our outside general counsel. Mr. Young received a J.D. from Rutgers University School of Law and a B.A. in History and Political Science from the University of Toronto. Mr. Young is the brother of Charles E. Young, our Chief Executive Officer and member of our board of directors, and William John Young, our Chief Operating Officer.
Susan Neumann
Susan Neumann was named Vice President of Accounting and Controller in October 2016. Previously, Ms. Neumann was named Controller and Secretary in April 2013 and July 2014, respectively. Prior to joining us in April 2013, Ms. Neumann was an assurance senior manager at BDO USA, LLP (“BDO”). At BDO, she served in various roles in the assurance group from September 2000 to March 2013. Ms. Neumann received an MBA with a Global Perspective from Arcadia University and a B.A. in Accounting from Beaver College (currently Arcadia University).
Available Information
Our website address is
www.smartsand.com
. Our annual reports on Form 10-K, quarterly reports on Form 10-Q, current reports on Form 8-K and amendments to those reports are available on our website, without charge, as soon as reasonably practicable after they are filed electronically with the SEC. The SEC also maintains a website that contains reports, proxy and information statements and other information statements and other information regarding issuers who file electronically with the SEC. The SEC’s website address is
www.sec.gov
.
ITEM 1A. — RISK FACTORS
Risks Inherent in Our Business
Our business and financial performance depend on the level of activity in the oil and natural gas industry.
Substantially all of our revenues are derived from sales to companies in the oil and natural gas industry. As a result, our operations are dependent on the levels of activity in oil and natural gas exploration, development and production. More specifically, the demand for the proppants we produce and our wellsite storage solutions is closely related to the number of oil and natural gas wells completed in geological formations where sand-based proppants are used in fracturing activities. These activity levels are affected by both short- and long-term trends in oil and natural gas prices, among other factors.
Oil and natural gas prices and, therefore, the level of exploration, development and production activity, have experienced a high level of volatility leading to sustained declines from the highs in the latter half of 2014 that continued through early 2016. Beginning in September 2014 and continuing through early 2016, increasing global supply of oil, including a decision by the Organization of the Petroleum Exporting Countries (“OPEC”) to sustain its production levels in spite of the decline in oil prices, in conjunction with weakened demand from slowing economic growth in the Eurozone and China, created downward pressure on crude oil prices resulting in reduced demand for our products and pressure to reduce our product prices. In November and December 2016, OPEC and non-OPEC producers reached a curtailment agreement to curb output for the first six months of 2017, which led to less oil price volatility and increased drilling and well completion activity beginning late in 2016 and continuing into 2017. In November 2017, the curtailment agreement was upheld which led to continued drilling activity into 2018. In late 2018, the price of crude oil decreased a significant amount in a short period of time due to, among other things, a larger than expected increase in oil supplies. In December 2018, OPEC and non-OPEC producers reached another curtailment agreement to curb output for the first six months of 2019. Should the curtailment agreement not be maintained or other sources of production continue to rise at levels not supported by current demand, these factors could lead to lower oil prices and reduced drilling and well completion activity which could adversely impact our operations. Furthermore, the availability of key resources that impact drilling activity has significantly fluctuated recently, which could impact product demand.
A prolonged reduction in oil and natural gas prices would generally depress the level of oil and natural gas exploration, development, production and well completion activity and would result in a corresponding decline in the demand for the proppants we produce and our wellsite storage solutions. Such a decline would have a material adverse effect on our business, results of operation and financial condition. The commercial development of economically viable alternative energy sources (such as wind, solar, geothermal, tidal, fuel cells and biofuels) could have a similar effect. In addition, certain U.S. federal income tax deductions currently available with respect to oil and natural gas exploration and development may be eliminated.
17
Any future decreases in the rate at which oil and natural gas reserves are discovered or developed, whether due to the passage of legislation, increased governmental regulation leading to limitations, or prohibitions on exploration and drilling activity, including hydraulic fracturing, or other factors, could have a material adverse effect on our business and financial condition, even in a stronger oil and natural gas price environment.
Future regulations relating to and interpretations of the recently enacted Tax Cuts and Jobs Act may have a material impact on our financial condition and results of operations.
The Tax Cuts and Jobs Act of 2017 (the “Tax Reform Act”) was signed into law on December 22, 2017. Among other things, the Tax Reform Act reduces the U.S. corporate tax rate from 35% to 21%, imposes significant additional limitations on the deductibility of interest, and allows the expensing of capital expenditures. The Tax Reform Act is highly complex and subject to interpretation. The presentation of our financial condition and results of operations is based upon our current interpretation of the provisions contained in the Tax Reform Act. The Treasury Department and the Internal Revenue Service continue to release regulations relating to and interpretive guidance of the legislation contained in the Tax Reform Act. Any significant variance of our current interpretation of such legislation from any future regulations or interpretive guidance could result in a change to the presentation of our financial condition and results of operations and could negatively affect our business.
We previously had difficulty maintaining compliance with the covenants and ratios required under our former revolving credit facility. We may have similar difficulties with our Credit Facility. Failure to maintain compliance with these financial covenants or ratios could adversely affect our business, financial condition, results of operations and cash flows.
Historically, we relied on our former revolving credit facility, which was paid in full and terminated using the proceeds of our initial public offering (“IPO”) in November 2016, and expect to rely on our Credit Facility or any future replacement of this facility to provide liquidity and support for our growth objectives, as necessary. Our Credit Facility requires us to comply with certain financial covenants and ratios. Our ability to comply with these restrictions and covenants in the future is uncertain and will be affected by the levels of cash flow from our operations and events or circumstances beyond our control, including events and circumstances that may stem from the condition of financial markets and commodity price levels. At December 31, 2018 and 2017 we were in compliance with the covenants contained in our Credit Facility.
In the event that we are unable to access sufficient capital to fund our business and planned capital expenditures, we may be required to curtail potential acquisitions, strategic growth projects, portions of our current operations and other activities. A lack of capital could result in a decrease in our operations, subject us to claims of breach under customer and supplier contracts and may force us to sell some of our assets or issue additional equity on an untimely or unfavorable basis, each of which could adversely affect our business, financial condition, results of operations and cash flows.
A substantial majority of our revenues have been generated under contracts with a limited number of customers, and the loss of, material nonpayment or nonperformance by or significant reduction in purchases by any of them could adversely affect our business, results of operations and financial condition.
As of January 1, 2019, we were contracted to sell raw frac sand produced from our Oakdale facility under
eight
long-term take-or-pay contracts with a weighted average remaining life of approximately
two
years. Because we have a small number of customers contracted under long-term take-or-pay contracts, these contracts subject us to counterparty risk. The ability or willingness of each of our customers to perform its obligations under a contract with us will depend on a number of factors that are beyond our control and may include, among other things, the overall financial condition of the counterparty, the condition of the U.S. oil and natural gas exploration and production industry, continuing use of raw frac sand in hydraulic fracturing operations and general economic conditions. In addition, in depressed market conditions, our customers may no longer need the amount of raw frac sand for which they have contracted or may be able to obtain comparable products at a lower price. If our customers experience a significant downturn in their business or financial condition, they may attempt to renegotiate our contracts. For example, certain of our existing contracts were adjusted in late 2018 and early 2019 resulting in a combination of reduced average selling prices per ton, adjustments to take-or-pay volumes and length of contract. We are also in litigation with two of our contracted customers over nonpayment of amounts due under such contracts. If any of our major customers substantially reduces or altogether ceases purchasing our raw frac sand and we are not able to generate replacement sales of raw frac sand into the market, our business, financial condition and results of operations could be adversely affected until such time as we generate replacement sales in the market. In addition, as contracts expire, depending on market conditions at the time, our customers may choose not to extend these contracts which could lead to a significant reduction of sales volumes and corresponding revenues, cash flows and financial condition if we are not able to replace these contracts with new sales volumes. Additionally, even if we were to replace any lost contract volumes, lower prices for our product could materially reduce our revenues, cash flow and financial condition.
18
We are exposed to the credit risk of our customers, and any material nonpayment or nonperformance by our customers could adversely affect our business, results of operations and financial condition.
We are subject to the risk of loss resulting from nonpayment or nonperformance by our customers. Our credit procedures and policies may not be adequate to fully eliminate customer credit risk. If we fail to adequately assess the creditworthiness of existing or future customers or unanticipated deterioration in their creditworthiness, any resulting increase in nonpayment or nonperformance by them and our inability to re-market or otherwise use the production could have a material adverse effect on our business, results of operations and financial condition. A decline in natural gas and crude oil prices could negatively impact the financial condition of our customers and sustained lower prices could impact their ability to meet their financial obligations to us. Further, our contract counterparties may not perform or adhere to our existing or future contractual arrangements. To the extent one or more of our contract counterparties is in financial distress or commences bankruptcy proceedings, contracts with these counterparties may be subject to renegotiation or rejection under applicable provisions of the United States Bankruptcy Code. Any material nonpayment or nonperformance by our contract counterparties due to inability or unwillingness to perform or adhere to contractual arrangements could adversely affect our business and results of operations.
Our proppant sales are subject to fluctuations in market pricing.
A majority of our supply agreements involving the sale of raw frac sand have market-based pricing mechanisms. Accordingly, in periods with decreasing prices, our results of operations may be lower than if our agreements had fixed prices. During these periods our customers may also elect to reduce their purchases from us and seek to find alternative, cheaper sources of supply. In periods with increasing prices, these agreements permit us to increase prices; however, these increases are generally calculated on a quarterly basis and do not increase on a dollar-for-dollar basis with increases in spot market pricing. Furthermore, certain volume-based supply agreements may influence the ability to fully capture current market pricing. These pricing provisions may result in significant variability in our results of operations and cash flows from period to period.
Changes in supply and demand dynamics could also impact market pricing for proppants. A number of existing proppant providers and new market entrants have started new operations or expanded existing operations, primarily in regional sand projects. In periods where sources of supply of raw frac sand exceed market demand, market prices for raw frac sand may decline and our results of operations and cash flows may continue to decline, be volatile, or otherwise be adversely affected. For example, beginning in September 2014 and continuing through mid-2016, increasing global supply of oil, in conjunction with weakened demand from slowing economic growth in the Eurozone and China, created downward pressure on crude oil prices resulting in reduced demand for hydraulic fracturing services leading to a corresponding reduced demand for our products and pressure to reduce our product prices. Similarly, in late 2018, due to a greater than expected increase in the global supply of oil and lowered demand expectations due, in part, to a trade dispute between the United States and China, the price of crude oil decreased, which resulted in lower demand for our products in the second half of 2018 and may continue to impact results going forward.
We face significant competition that may cause us to lose market share.
The proppant industry is highly competitive. The proppant market is characterized by a small number of large, national producers and a larger number of small, regional or local producers. Competition in this industry is based on price, consistency and quality of product, site location, distribution and logistics capabilities, customer service, reliability of supply, breadth of product offering (including wellsite storage products and services) and technical support.
Some of our competitors have greater financial and other resources than we do. In addition, our larger competitors may develop technology superior to ours or may have production facilities that offer lower-cost transportation to certain customer locations than we do. When the demand for hydraulic fracturing services decreases or the supply of proppant available in the market increases, prices in the raw frac sand market can materially decrease. Furthermore, oil and natural gas exploration and production companies and other providers of hydraulic fracturing services have acquired and in the future may acquire their own raw frac sand reserves to fulfill their proppant requirements, and these other market participants may expand their existing raw frac sand production capacity, all of which would negatively impact demand for our raw frac sand. In addition, increased competition in the proppant industry could have an adverse impact on our ability to enter into long-term contracts or to enter into contracts on favorable terms. For example, new supplies of regional raw frac sand from our competitors have come online in 2018, primarily in the Permian Basin of West Texas. These new supplies may have a negative long-term impact on our ability to market our Northern White Sand in the Permian Basin or other markets in close proximity to these new mines, which could lead to pressure to reduce prices to compete effectively with these new regional suppliers.
19
We may be required to make substantial capital expenditures to develop and increase our asset base. The inability to obtain needed capital or financing on satisfactory terms, or at all, could have an adverse effect on our business, results of operations and financial condition.
Although we currently use a significant amount of our cash generated from our operations to fund the development of our asset base, we also rely on the availability of credit to fund capital expenditures. Our ability to obtain debt financing or to access the capital markets for future equity or debt offerings may be limited by our financial condition at the time of any such financing or offering, the covenants contained in our Credit Facility or other future debt agreements, adverse market conditions or other contingencies and uncertainties that are beyond our control. Our failure to obtain the funds necessary to maintain, develop and increase our asset base could adversely impact our business, results of operations and financial condition.
Even if we are able to obtain financing or access the capital markets, incurring additional debt may significantly increase our interest expense and financial leverage, and our level of indebtedness could restrict our ability to fund future development and acquisition activities. In addition, the issuance of additional equity interests may result in significant dilution to our existing common stockholders.
Inaccuracies in estimates of volumes and qualities of our sand reserves could result in lower than expected sales and higher than expected cost of production.
John T. Boyd, our independent reserve engineers, prepared estimates of our reserves based on engineering, economic and geological data assembled and analyzed by our engineers and geologists. However, raw frac sand reserve estimates are by nature imprecise and depend to some extent on statistical inferences drawn from available data, which may prove unreliable. There are numerous uncertainties inherent in estimating quantities and qualities of reserves and non-reserve raw frac sand deposits and costs to mine recoverable reserves, including many factors beyond our control. Estimates of economically recoverable raw frac sand reserves necessarily depend on a number of factors and assumptions, all of which may vary considerably from actual results, such as:
|
•
|
geological and mining conditions and/or effects from prior mining that may not be fully identified by available data or that may differ from experience;
|
|
•
|
assumptions concerning future prices of raw frac sand, operating costs, mining technology improvements, development costs and reclamation costs; and
|
|
•
|
assumptions concerning future effects of regulation, including wetland mitigation requirements, the issuance of required permits and the assessment of taxes by governmental agencies.
|
Any inaccuracy in John T. Boyd’s estimates related to our raw frac sand reserves or non-reserve raw frac sand deposits could result in lower than expected sales or higher than expected costs. For example, John T. Boyd’s estimates of our proven recoverable sand reserves assume that our revenue and cost structure will remain relatively constant over the life of our reserves. If these assumptions prove to be inaccurate, some or all of our reserves may not be economically mineable, which could have a material adverse effect on our results of operations and cash flows. In addition, our current customer contracts require us to deliver raw frac sand that meets certain API and ISO specifications. If John T. Boyd’s estimates of the quality of our reserves, including the volumes of the various specifications of those reserves, prove to be inaccurate, we may incur significantly higher excavation costs without corresponding increases in revenues, we may not be able to meet our contractual obligations, or our facilities may have a shorter than expected reserve life, any of which could have a material adverse effect on our results of operations and cash flows.
All of our sales are generated at one facility, and that facility is primarily served by one rail line. Any adverse developments at that facility or on the primary rail line could have a material adverse effect on our business, financial condition and results of operations.
All of our sales are currently derived from our Oakdale facility located in Oakdale, Wisconsin, which is served primarily by a Class I rail line owned by Canadian Pacific. Any adverse development at this facility or on the rail line due to catastrophic events or weather, or any other event that would cause us to curtail, suspend or terminate operations at our Oakdale facility, could result in us being unable to meet our contracted sand deliveries. Although we have access to a second Class I rail line owned by Union Pacific at our Byron facility, we could not facilitate all shipments of product from the Byron facility. We maintain insurance coverage to cover a portion of these types of risks; however, there are potential risks associated with our operations not covered by insurance. There also may be certain risks covered by insurance where the policy does not reimburse us for all of the costs related to a loss. Downtime or other delays or interruptions to our operations that are not covered by insurance could have a material adverse effect on our business, results of operations and financial condition. In addition, under our long-term take-or-pay contracts, if we are unable to deliver contracted volumes and a customer arranges for delivery from a
20
third party at a higher price, we may be required to pay that customer the difference between our contract price and the price of the third-party product.
If we are unable to make acquisitions on economically acceptable terms, our future growth would be limited.
A portion of our strategy to grow our business is dependent on our ability to make acquisitions. If we are unable to make acquisitions from third parties because we are unable to identify attractive acquisition candidates or negotiate acceptable purchase contracts, we are unable to obtain financing for these acquisitions on economically acceptable terms or we are outbid by competitors, our future growth may be limited. Any acquisition involves potential risks, some of which are beyond our control, including, among other things:
|
•
|
mistaken assumptions about revenues and costs, including synergies;
|
|
•
|
inability to integrate successfully the businesses we acquire;
|
|
•
|
inability to hire, train or retain qualified personnel to manage and operate our business and newly acquired assets;
|
|
•
|
the assumption of unknown liabilities;
|
|
•
|
limitations on rights to indemnity from the seller;
|
|
•
|
mistaken assumptions about the overall costs of equity or debt;
|
|
•
|
diversion of management’s attention from other business concerns;
|
|
•
|
unforeseen difficulties operating in new product areas or new geographic areas; and
|
|
•
|
customer or key employee losses at the acquired businesses.
|
If we consummate any future acquisitions, our capitalization and results of operations may change significantly, and common stockholders will not have the opportunity to evaluate the economic, financial and other relevant information that we will consider in determining the application of these funds and other resources.
We may not be able to complete greenfield development or expansion projects or, if we do, we may not realize the expected benefits.
Any greenfield development or expansion project requires us to raise substantial capital and obtain numerous state and local permits. A decision by any governmental agency not to issue a required permit or substantial delays in the permitting process could prevent us from pursuing the development or expansion project. In addition, if the demand for our products declines during a period in which we experience delays in raising capital or completing the permitting process, we may not realize the expected benefits from our greenfield facility or expansion project. Furthermore, our new or modified facilities may not operate at designed capacity or may cost more to operate than we expect. The inability to complete greenfield development or expansion projects or to complete them on a timely basis and in turn grow our business could adversely affect our business and results of operations.
Restrictions in our Credit Facility may limit our ability to capitalize on potential acquisition and other business opportunities.
The operating and financial restrictions and covenants in our Credit Facility and any future financing agreements could restrict our ability to finance future operations or capital needs or to expand or pursue our business activities. For example, our Credit Facility restricts or limits our ability to:
|
•
|
grant liens;
|
|
•
|
incur additional indebtedness;
|
|
•
|
engage in a merger, consolidation or dissolution;
|
|
•
|
enter into transactions with affiliates;
|
|
•
|
sell or otherwise dispose of assets, businesses and operations;
|
|
•
|
materially alter the character of our business as conducted at the time of filing of this annual report; and
|
21
|
•
|
make acquisitions, investments and capital expenditures.
|
Furthermore, our revolving Credit Facility contains certain operating and financial covenants. Our ability to comply with such covenants and restrictions contained in our Credit Facility may be affected by events beyond our control, including prevailing economic, financial and industry conditions. If market or other economic conditions deteriorate, our ability to comply with these covenants may be impaired. If we violate any of the restrictions, covenants, ratios or tests in the Credit Facility, a significant portion of our indebtedness may become immediately due and payable, and any lenders’ commitment to make further loans to us may terminate. We might not have, or be able to obtain, sufficient funds to make these accelerated payments. Any subsequent replacement of the Credit Facility or any new indebtedness could have similar or greater restrictions. Please read “Management’s Discussion and Analysis of Financial Condition and Results of Operations—Credit Facilities—Indebtedness.”
We face distribution and logistical challenges in our business.
Transportation and logistical operating expenses comprise a significant portion of the costs incurred by our customers to deliver raw frac sand to the wellhead, which could favor suppliers located in close proximity to the customer. As oil and natural gas prices fluctuate, our customers may shift their focus to different resource plays, some of which may be located in geographic areas that do not have well-developed transportation and distribution infrastructure systems, or seek contracts with additional delivery and pricing alternatives including contracts that sell product on an “as-delivered” basis at the target shale basin. Serving our customers in these less-developed areas presents distribution and other operational challenges that may affect our sales and negatively impact our operating costs and any delays we experience in optimizing our logistics infrastructure or developing additional origination and destination points may adversely affect our ability to renew existing contracts with customers seeking additional delivery and pricing alternatives. Disruptions in transportation services, including shortages of railcars, lack of developed infrastructure, weather-related problems, flooding, drought, accidents, mechanical difficulties, strikes, lockouts, bottlenecks or other events could affect our ability to timely and cost effectively deliver to our customers and could temporarily impair the ability of our customers to take delivery and, in certain circumstances, constitute a force majeure event under our customer contracts, permitting our customers to suspend taking delivery of and paying for our raw frac sand (and in some cases terminating the agreement after a period of time). Additionally, increases in the price of transportation costs, including freight charges, fuel surcharges, transloading fees, terminal switch fees and demurrage costs, could negatively impact operating costs if we are unable to pass those increased costs along to our customers. Accordingly, because we are so dependent on rail infrastructure, if there are disruptions of the rail transportation services utilized by us or our customers, and we or our customers are unable to find alternative transportation providers to transport our products, our business and results of operations could be adversely affected. Further, declining volumes could result in railcar over-capacity, which would lead to railcar storage fees while, at the same time, we would continue to incur lease costs for those railcars in storage. Failure to find long-term solutions to these logistical challenges could adversely affect our ability to respond quickly to the needs of our customers or result in additional increased costs, and thus could negatively impact our business, results of operations and financial condition.
We may be adversely affected by decreased demand for raw frac sand due to the development of effective alternative proppants or new processes to replace hydraulic fracturing.
Raw frac sand is a proppant used in the completion and re-completion of oil and natural gas wells to stimulate and maintain oil and natural gas production through the process of hydraulic fracturing. Raw frac sand is the most commonly used proppant and is less expensive than other proppants, such as resin-coated sand and manufactured ceramics. A significant shift in demand from raw frac sand to other proppants, or the development of new processes to make hydraulic fracturing more efficient could replace it altogether, could cause a decline in the demand for the raw frac sand we produce and result in a material adverse effect on our business, results of operations and financial condition.
An increase in the supply of raw frac sand having similar characteristics as the raw frac sand we produce could make it more difficult for us to renew or replace our existing contracts on favorable terms, or at all.
If significant new reserves of raw frac sand are discovered and developed, and those raw frac sands have similar characteristics to the raw frac sand we produce, we may be unable to renew or replace our existing contracts on favorable terms, or at all. Specifically, if raw frac sand becomes more readily available, our customers may not be willing to enter into long-term take-or-pay contracts, may demand lower prices or both, which could have a material adverse effect on our business, results of operations and financial condition. For example, new supplies of regional raw frac sand from our competitors have come online in 2018, primarily in the Permian Basin of West Texas. These new supplies may have a negative long-term impact on our ability to market our Northern White Sand in the Permian Basin or other markets in close proximity to these new mines, which could lead to pressure to reduce prices to compete effectively with these new regional suppliers.
22
Federal, state and local legislative and regulatory initiatives relating to hydraulic fracturing and the potential for related litigation could result in increased costs, additional operating restrictions or delays for our customers, which could cause a decline in the demand for our raw frac sand and negatively impact our business, results of operations and financial condition.
We supply raw frac sand to hydraulic fracturing operators in the oil and natural gas industry. Hydraulic fracturing is an important practice that is used to stimulate production of oil and natural gas from low permeability hydrocarbon bearing subsurface rock formations. The hydraulic fracturing process involves the injection of water, proppants, and chemicals under pressure into the formation to fracture the surrounding rock, increase permeability and stimulate production.
Although we do not directly engage in hydraulic fracturing activities, our customers purchase our raw frac sand for use in their hydraulic fracturing activities. Hydraulic fracturing is typically regulated by state oil and natural gas commissions and similar agencies. Some states have adopted, and other states are considering adopting, regulations that could impose new or more stringent permitting, disclosure or well construction requirements on hydraulic fracturing operations. Aside from state laws, local land use restrictions may restrict drilling in general or hydraulic fracturing in particular. Municipalities may adopt local ordinances attempting to prohibit hydraulic fracturing altogether or, at a minimum, allow such fracturing processes within their jurisdictions to proceed but regulating the time, place and manner of those processes. In addition, federal agencies have started to assert regulatory authority over the process and various studies have been conducted or are currently underway by the EPA, and other federal agencies concerning the potential environmental impacts of hydraulic fracturing activities. At the same time, certain environmental groups have suggested that additional laws may be needed and, in some instances, have pursued voter ballot initiatives to more closely and uniformly limit or otherwise regulate the hydraulic fracturing process, and legislation has been proposed by some members of Congress to provide for such regulation.
The adoption of new laws or regulations at the federal, state or local levels imposing reporting obligations on, or otherwise limiting or delaying, the hydraulic fracturing process could make it more difficult to complete natural gas wells, increase our customers’ costs of compliance and doing business, and otherwise adversely affect the hydraulic fracturing services they perform, which could negatively impact demand for our raw frac sand. In addition, heightened political, regulatory, and public scrutiny of hydraulic fracturing practices could expose us or our customers to increased legal and regulatory proceedings, which could be time-consuming, costly, or result in substantial legal liability or significant reputational harm. We could be directly affected by adverse litigation involving us, or indirectly affected if the cost of compliance limits the ability of our customers to operate. Such costs and scrutiny could directly or indirectly, through reduced demand for our raw frac sand, have a material adverse effect on our business, financial condition and results of operations.
Our long-term take-or-pay contracts may preclude us from taking advantage of increasing prices for raw frac sand or mitigating the effect of increased operational costs during the term of those contracts.
The long-term take-or-pay contracts we have may negatively impact our results of operations. Our long-term take-or-pay contracts require our customers to pay a specified price for a specified volume of raw frac sand each month. Although our long-term take-or-pay contracts provide for price increases based on crude oil prices, such increases are generally calculated on a quarterly basis and do not increase dollar-for-dollar with increases in spot market prices. As a result, in periods with increasing prices our sales may not keep pace with market prices.
Additionally, if our operational costs increase during the terms of our long-term take-or-pay contracts, we will not be able to pass some of those increased costs to our customers. If we are unable to otherwise mitigate those increased operational costs, our net income could decline.
Our operations are subject to operational hazards and unforeseen interruptions for which we may not be adequately insured.
Our operations are exposed to potential natural disasters, including blizzards, tornadoes, storms, floods, other adverse weather conditions and earthquakes. If any of these events were to occur, we could incur substantial losses because of personal injury or loss of life, severe damage to and destruction of property and equipment, and pollution or other environmental damage resulting in curtailment or suspension of our operations.
We are not fully insured against all risks incident to our business, including the risk of our operations being interrupted due to severe weather and natural disasters. Furthermore, we may be unable to maintain or obtain insurance of the type and amount we desire at reasonable rates. As a result of market conditions, premiums and deductibles for certain of our insurance policies have increased and could escalate further. In addition, sub-limits have been imposed for certain risks. In some instances, certain insurance could become unavailable or available only for reduced amounts of coverage. If we were to incur a significant liability for which we are not fully insured, it could have a material adverse effect on our business, results of operations and financial condition.
23
Our production process consumes large amounts of natural gas and electricity. An increase in the price or a significant interruption in the supply of these or any other energy sources could have a material adverse effect on our business, results of operations and financial condition.
Energy costs, primarily natural gas and electricity, represented approximately
6.6%
of our total cost of goods sold for the year ended
December 31, 2018
. Natural gas is currently the primary fuel source used for drying in our raw frac sand production process. As a result, our profitability will be impacted by the price and availability of natural gas we purchase from third parties. Because we have not contracted for the provision of all of our natural gas usage on a fixed-price basis, our costs and profitability will be impacted by fluctuations in prices for natural gas. The price and supply of natural gas is unpredictable and can fluctuate significantly based on international, political and economic circumstances, as well as other events outside our control, such as changes in supply and demand due to weather conditions, actions by OPEC, governmental sanctions, and other oil and natural gas producers, regional production patterns, security threats and environmental concerns. In addition, potential climate change regulations or carbon or emissions taxes could result in higher cost of production for energy, which may be passed on to us in whole or in part. In order to manage the risk of volatile natural gas prices, we may hedge natural gas prices through the use of derivative financial instruments, such as forwards, swaps and futures. However, these measures carry risk (including nonperformance by counterparties) and do not in any event entirely eliminate the risk of decreased margins as a result of propane or natural gas price increases. We further attempt to mitigate these risks by including in our sales contracts fuel surcharges based on natural gas prices exceeding certain benchmarks. A significant increase in the price of energy that is not recovered through an increase in the price of our products or covered through our hedging arrangements or an extended interruption in the supply of natural gas or electricity to our production facilities could have a material adverse effect on our business, results of operations and financial condition.
Increases in the price of diesel fuel may adversely affect our business, results of operations and financial condition.
Diesel fuel costs generally fluctuate with increasing and decreasing world crude oil prices and, accordingly, are subject to political, economic and market factors that are outside of our control. Our operations are dependent on earthmoving equipment, locomotives and tractor trailers, and diesel fuel costs are a significant component of the operating expense of these vehicles. Accordingly, increased diesel fuel costs could have an adverse effect on our business, results of operations and financial condition.
A facility closure entails substantial costs, and if we close our facility sooner than anticipated, our results of operations may be adversely affected.
We base our assumptions regarding the life of our Oakdale facility on detailed studies that we perform from time to time, but our studies and assumptions may not prove to be accurate. If we close our Oakdale facility sooner than expected, sales will decline unless we are able to acquire and develop additional facilities, which may not be possible. The closure of our Oakdale facility would involve significant fixed closure costs, including accelerated employment legacy costs, severance-related obligations, reclamation and other environmental costs and the costs of terminating long-term obligations, including energy contracts and equipment leases. We accrue for the costs of reclaiming open pits, stockpiles, non-saleable sand, ponds, roads and other mining support areas over the estimated mining life of our property. If we were to reduce the estimated life of our Oakdale facility, the fixed facility closure costs would be applied to a shorter period of production, which would increase the cost of production per ton produced and could materially and adversely affect our business, results of operations and financial condition.
Applicable statutes and regulations require that mining property be reclaimed following a mine closure in accordance with specified standards and an approved reclamation plan. The plan addresses matters such as removal of facilities and equipment, regrading, prevention of erosion and other forms of water pollution, re-vegetation and post-mining land use. We may be required to post a surety bond or other form of financial assurance equal to the cost of reclamation as set forth in the approved reclamation plan. The establishment of the final mine closure reclamation liability is based on permit requirements and requires various estimates and assumptions, principally associated with reclamation costs and production levels. If our accruals for expected reclamation and other costs associated with facility closures for which we will be responsible were later determined to be insufficient, our business, results of operations and financial condition may be adversely affected.
Our operations are dependent on our rights and ability to mine our properties and on our having renewed or received the required permits and approvals from governmental authorities and other third parties.
We hold numerous governmental, environmental, mining and other permits, water rights and approvals authorizing operations at our Oakdale facility. For our extraction and processing in Wisconsin, the permitting process is subject to federal, state and local authority. For example, on the federal level, a
Mine Identification Request (MSHA Form 7000-51)
must be filed and obtained before mining commences. If wetlands are impacted, a
U.S. Army Corps of Engineers Wetland Permit
is required. At the state level, a series of permits are required related to air quality, wetlands, water quality (waste water, storm water),
24
grading permits, endangered species, archeological assessments and high capacity wells in addition to others depending upon site specific factors and operational detail. At the local level, zoning, building, storm water, erosion control, wellhead protection, road usage and access are all regulated and require permitting to some degree. A non-metallic mining reclamation permit is required. A decision by a governmental agency or other third party to deny or delay issuing a new or renewed permit or approval, or to revoke or substantially modify an existing permit or approval, could have a material adverse effect on our business, results of operations and financial condition.
Title to, and the area of, mineral properties and water rights may also be disputed. Mineral properties sometimes contain claims or transfer histories that examiners cannot verify. A successful claim that we do not have title to our property or lack appropriate water rights could cause us to lose any rights to explore, develop and extract minerals, without compensation for our prior expenditures relating to such property. Our business may suffer a material adverse effect in the event we have title deficiencies.
A shortage of skilled labor together with rising labor costs in the excavation industry may further increase operating costs, which could adversely affect our business, results of operations and financial condition.
Efficient sand excavation using modern techniques and equipment requires skilled laborers, preferably with several years of experience and proficiency in multiple tasks, including processing of mined minerals. If there is a shortage of experienced labor in Wisconsin, we may find it difficult to hire or train the necessary number of skilled laborers to perform our own operations which could have an adverse impact on our business, results of operations and financial condition.
Our business may suffer if we lose, or are unable to attract and retain, key personnel.
We depend to a large extent on the services of our senior management team and other key personnel. Members of our senior management and other key employees bring significant experience to the market environment in which we operate. Competition for management and key personnel is intense, and the pool of qualified candidates is limited. The loss of any of these individuals or the failure to attract additional personnel, as needed, could have a material adverse effect on our operations and could lead to higher labor costs or the use of less-qualified personnel. In addition, if any of our executives or other key employees were to join a competitor or form a competing company, we could lose customers, suppliers, know-how and key personnel. We do not maintain key-man life insurance with respect to any of our employees. Our success is dependent on our ability to continue to attract, employ and retain highly skilled personnel.
Failure to maintain effective quality control systems at our mining, processing and production facilities could have a material adverse effect on our business, results of operations and financial condition.
The performance and quality of our products are critical to the success of our business. These factors depend significantly on the effectiveness of our quality control systems, which, in turn, depends on a number of factors, including the design of our quality control systems, our quality-training program and our ability to ensure that our employees adhere to our quality control policies and guidelines. Any significant failure or deterioration of our quality control systems could have a material adverse effect on our business, results of operations and financial condition.
Seasonal and severe weather conditions could have a material adverse impact on our business, results of operations and financial condition.
Our business could be materially adversely affected by severe weather conditions. Severe weather conditions may affect our customers’ operations, thus reducing their need for our products, impact our operations by resulting in weather-related damage to our facilities and equipment and impact our customers’ ability to take delivery of our products at our plant site. Any weather-related interference with our operations could force us to delay or curtail services and potentially breach our contractual obligations to deliver minimum volumes or result in a loss of productivity and an increase in our operating costs.
In addition, winter weather conditions impact our operations by causing us to reduce our excavation and wet plant related production activities during the winter months. During non-winter months, we excavate excess sand to build a stockpile that will feed the dry plants (along with the sand provided by our year-round wet plant), which continue to operate during the winter months. Unexpected winter conditions (such as winter arriving earlier than expected or lasting longer than expected) may result in us not having a sufficient sand stockpile to operate our dry plants during winter months, which could result in us being unable to deliver our contracted sand amounts during such time and lead to a material adverse effect on our business, results of operations and financial condition.
Our cash flow fluctuates on a seasonal basis.
Our cash flow is affected by a variety of factors, including weather conditions and seasonal periods. Seasonal fluctuations in weather impact the production levels at our wet processing plant. While our sales and finished product
25
production levels are contracted evenly throughout the year, our mining and wet sand processing activities are reduced during winter months. As a consequence, we experience lower cash costs in the first and fourth quarter of each calendar year.
We do not own the land on which our Van Hook, North Dakota terminal facility is located, which could disrupt our operations.
We do not own the land on which our Van Hook, North Dakota terminal is located and instead own a leasehold interest and right-of-way for the operation of this facility. Upon expiration, termination or other lapse of our current leasehold terms, we may be unable to renew our existing lease or right-of-way on terms favorable to us, or at all. Any renegotiation on less favorable terms or inability to enter into new leases on economically acceptable terms upon the expiration, termination or other lapse of our current lease or right-of-way could cause us to cease operations on the affected land, increase costs related to continuing operations elsewhere and have a material adverse effect on our business, financial condition and results of operations.
A terrorist attack or armed conflict could harm our business.
Terrorist activities, anti-terrorist efforts and other armed conflicts involving the United States could adversely affect the U.S. and global economies and could prevent us from meeting financial and other obligations. We could experience loss of business, delays or defaults in payments from payors or disruptions of fuel supplies and markets if pipelines, production facilities, processing plants, refineries or transportation facilities are direct targets or indirect casualties of an act of terror or war. Such activities could reduce the overall demand for oil and natural gas, which, in turn, could also reduce the demand for our raw frac sand. Terrorist activities and the threat of potential terrorist activities and any resulting economic downturn could adversely affect our results of operations, impair our ability to raise capital or otherwise adversely impact our ability to realize certain business strategies.
Diminished access to water may adversely affect our operations or the operations of our customers.
The mining and processing activities at our facility requires significant amounts of water. Additionally, the development of oil and natural gas properties through fracture stimulation likewise requires significant water use. We have obtained water rights that we currently use to service the activities at our Oakdale facility, and we plan to obtain all required water rights to service other properties we may develop or acquire in the future. However, the amount of water that we and our customers are entitled to use pursuant to our water rights must be determined by the appropriate regulatory authorities in the jurisdictions in which we and our customers operate. Such regulatory authorities may amend the regulations regarding such water rights, increase the cost of maintaining such water rights or eliminate our current water rights, and we and our customers may be unable to retain all or a portion of such water rights. These new regulations, which could also affect local municipalities and other industrial operations, could have a material adverse effect on our operating costs and effectiveness if implemented. Such changes in laws, regulations or government policy and related interpretations pertaining to water rights may alter the environment in which we and our customers do business, which may negatively affect our financial condition and results of operations.
We may be subject to interruptions or failures in our information technology systems, including cyber-attacks.
We rely on sophisticated information technology systems and infrastructure to support our business, including process control technology. Any of these systems may be susceptible to outages due to fire, floods, power loss, telecommunication failures, usage errors by employees, computer viruses, cyber-attacks or other security breaches, or similar events. If our information technology systems are damaged or cease to function properly, we may have to make a significant investment to fix or replace them, and we may suffer loss of critical data and interruptions or delays in our operations.
We may be the target of attempted cyber-attacks, computer viruses, malicious code, phishing attacks, denial of service attacks and other information security threats. To date, cyber-attacks have not had a material impact on our financial condition, results or business; however, we could suffer material financial or other losses in the future and we are not able to predict the severity of these attacks. The occurrence of a cyber-attack, breach, unauthorized access, misuse, computer virus or other malicious code or other cyber security event could jeopardize or result in the unauthorized disclosure, gathering, monitoring, misuse, corruption, loss or destruction of confidential and other information that belongs to us, our customers, our counterparties, or third-party service providers that is processed and stored in, and transmitted through, our computer systems and networks. The occurrence of such an event could also result in damage to our software, computers or systems, or otherwise cause interruptions or malfunctions in our, our customers’, our counterparties’ or third parties’ operations. This could result in significant losses, loss of customers and business opportunities, reputational damage, litigation, regulatory fines, penalties or intervention, reimbursement or other compensatory costs, or otherwise adversely affect our business, financial condition or results of operations.
26
The reliability and capacity of our information technology systems is critical to our operations. Any material disruption in our information technology systems, or delays or difficulties in implementing or integrating new systems or enhancing current systems, could have an adverse effect on our business, and results of operations.
If we are unable to fully protect our intellectual property rights, we may suffer a loss in our competitive advantage.
The commercial success of our newly acquired sand storage operation depends on patented and proprietary information and technologies, know-how and other intellectual property. Because of the technical nature of this business, we rely on a combination of patent, copyright, trademark and trade secret laws, and restrictions on disclosure to protect our intellectual property. As of June 30, 2018, we had several patents related to our silo operations, including patents related to our silo storage system and patents related to lifting and lowering our storage silos. We customarily enter into confidentiality or license agreements with our employees, consultants and corporate partners and control access to and distribution of our design information, documentation and other patented and proprietary information. In addition, in the future we may acquire additional patents or patent portfolios, which could require significant cash expenditures. However, third parties may knowingly or unknowingly infringe our patent or other proprietary rights, or challenge patents or proprietary rights held by us, and pending and future trademark and patent applications may not be approved. Failure to protect, monitor and control the use of our existing intellectual property rights could cause us to lose our competitive advantage and incur significant expenses. It is possible that our competitors or others could independently develop the same or similar technologies or otherwise obtain access to our unpatented technologies. In such case, our trade secrets would not prevent third parties from competing with us. Consequently, our results of operations may be adversely affected. Furthermore, third parties or our employees may infringe or misappropriate our patented or proprietary technologies or other intellectual property rights, which could also harm our business and results of operations. Policing unauthorized use of intellectual property rights can be difficult and expensive, and adequate remedies may not be available.
We may be adversely affected by disputes regarding intellectual property rights of third parties.
Third parties from time to time may initiate litigation against us by asserting that the conduct of our business infringes, misappropriates or otherwise violates intellectual property rights. We may not prevail in any such legal proceedings related to such claims, and our storage systems and related items may be found to infringe, impair, misappropriate, dilute or otherwise violate the intellectual property rights of others. If we are sued for infringement and lose, we could be required to pay substantial damages and/or be enjoined from using or selling the infringing products or technology. Any legal proceeding concerning intellectual property could be protracted and costly regardless of the merits of any claim and is inherently unpredictable and could have a material adverse effect on our financial condition, regardless of its outcome.
If we were to discover that our technologies or products infringe valid intellectual property rights of third parties, we may need to obtain licenses from these parties or substantially re-engineer our products in order to avoid infringement. We may not be able to obtain the necessary licenses on acceptable terms, or at all, or be able to re-engineer our products successfully. If our inability to obtain required licenses for our technologies or products prevents us from selling our products, that could adversely impact our financial condition and results of operations.
We currently rely on a limited number of suppliers for certain equipment and materials to build our systems, and our reliance on a limited number of suppliers for such equipment and materials exposes us to risks including price and timing of delivery.
We currently rely on a limited number of suppliers for equipment and materials to build our systems. If demand for our systems or the components necessary to build such systems increases or our suppliers for our equipment face financial distress or bankruptcy, our suppliers may not be able to provide such equipment on schedule at the current price or at all. In particular, steel is the principal raw material used in the manufacture of our systems, and the price of steel has historically fluctuated on a cyclical basis and will depend on a variety of factors over which we have no control, including trade tariffs. Additionally, we depend on a limited number of suppliers for certain mechanical and electrical components that we use in our systems which may not have direct replacements available from alternate suppliers. If our suppliers are unable to provide the raw materials and components needed to build our systems on schedule at the current price or at all, we could be required to seek other suppliers for the raw materials and components needed to build and operate our systems, which may adversely affect our revenues or increase our costs. Any inability to find alternative components at prices or with quality specifications similar to those deployed today could result in delays or a loss of customers.
Unsatisfactory safety performance may negatively affect our customer relationships and, to the extent we fail to retain existing customers or attract new customers, adversely impact our revenues.
Our ability to retain existing customers and attract new business is dependent on many factors, including our ability to demonstrate that we can reliably and safely operate all aspects of our business in a manner that is consistent with applicable
27
laws, rules and permits, which legal requirements are subject to change. In addition, certain customers require compliance with their internal safety protocols. Existing and potential customers consider the safety record of their third-party service providers to be of high importance in their decision to engage such providers. If one or more accidents were to occur in connection with our business, the affected customer may seek to terminate, cancel or substantially reduce its business with us, which could cause us to lose substantial revenues. Furthermore, our ability to attract new customers may be impaired if such potential customers elect not to engage us because they view our safety record as unacceptable. In addition, it is possible that we will experience multiple or particularly severe accidents in the future, causing our safety record to deteriorate. This may be more likely as we continue to grow, if we experience high employee turnover or labor shortage, or if we hire inexperienced personnel to bolster our staffing needs.
We may be subject to legal claims, such as personal injury and property damage, which could materially adversely affect our financial condition, prospects and results of operations.
As we focus on growing our business, particularly as it relates to increasing our last-mile solutions, our business may become increasingly subject to inherent risks that can cause personal injury or loss of life, damage to or destruction of property, equipment or the environment or the suspension of our operations. In addition, we may be subject to legal proceedings with our customers or suppliers, particularly as it relates to contract disputes. Regardless of the merit of particular claims, litigation may be expensive, time consuming, disruptive to our operations and distracting to management.
The outcome of litigation is inherently uncertain. If one or more legal matters were resolved against us or an indemnified third party in a reporting period for amounts in excess of management’s expectations, our financial condition and operating results for that reporting period could be materially adversely affected. Further, such an outcome could result in significant compensatory, punitive or trebled monetary damages, disgorgement of revenue or profits, remedial corporate measures or injunctive relief against us that could materially adversely affect our financial condition and operating results. We maintain what we believe is customary and reasonable insurance to protect our business against these potential losses, but such insurance may not be adequate to cover our liabilities, and we are not fully insured against all risks.
Risks Related to Environmental, Mining and Other Regulation
We and our customers are subject to extensive environmental and occupational health and safety regulations that impose, and will continue to impose, significant costs and liabilities. In addition, future regulations, or more stringent enforcement of existing regulations, could increase those costs and liabilities, which could adversely affect our results of operations.
We are subject to a variety of federal, state, and local regulatory environmental requirements affecting the mining and mineral processing industry, including among others, those relating to employee health and safety, environmental permitting and licensing, air and water emissions, water pollution, waste management, remediation of soil and groundwater contamination, land use, reclamation and restoration of properties, hazardous materials, and natural resources. Some environmental laws impose substantial penalties for noncompliance, and others, such as the federal CERCLA, may impose strict, retroactive, and joint and several liabilities for the remediation of releases of hazardous substances. Liability under CERCLA, or similar state and local laws, may be imposed as a result of conduct that was lawful at the time it occurred or for the conduct of, or conditions caused by, prior operators or other third parties. Failure to properly handle, transport, store, or dispose of hazardous materials or otherwise conduct our operations in compliance with environmental laws could expose us to liability for governmental penalties, cleanup costs, and civil or criminal liability associated with releases of such materials into the environment, damages to property, natural resources and other damages, as well as potentially impair our ability to conduct our operations. In addition, future environmental laws and regulations could restrict our ability to expand our facilities or extract our mineral deposits or could require us to acquire costly equipment or to incur other significant expenses in connection with our business. Future events, including adoption of new, or changes in any existing environmental requirements (or their interpretation or enforcement) and the costs associated with complying with such requirements, could have a material adverse effect on us.
Any failure by us to comply with applicable environmental laws and regulations may cause governmental authorities to take actions that could adversely impact our operations and financial condition, including:
|
•
|
issuance of administrative, civil, or criminal penalties;
|
|
•
|
denial, modification, or revocation of permits or other authorizations;
|
|
•
|
occurrence of delays in permitting or performance of projects;
|
|
•
|
imposition of injunctive obligations or other limitations on our operations, including cessation of operations; and
|
28
|
•
|
requirements to perform site investigatory, remedial, or other corrective actions.
|
Any such regulations could require us to modify existing permits or obtain new permits, implement additional pollution control technology, curtail operations, increase significantly our operating costs, or impose additional operating restrictions among our customers that reduce demand for our services.
We may not be able to comply with any new or amended laws and regulations that are adopted, and any new or amended laws and regulations could have a material adverse effect on our operating results by requiring us to modify our operations or equipment or shut down our facility. Additionally, our customers may not be able to comply with any new or amended laws and regulations, which could cause our customers to curtail or cease operations. We cannot at this time reasonably estimate our costs of compliance or the timing of any costs associated with any new or amended laws and regulations, or any material adverse effect that any new or modified standards will have on our customers and, consequently, on our operations.
Silica-related legislation, health issues and litigation could have a material adverse effect on our business, reputation or results of operations.
We are subject to laws and regulations relating to human exposure to crystalline silica. Several federal and state regulatory authorities, including MSHA, may continue to propose changes in their regulations regarding workplace exposure to crystalline silica, such as permissible exposure limits and required controls and personal protective equipment. We may not be able to comply with any new or amended laws and regulations that are adopted, and any new or amended laws and regulations could have a material adverse effect on our operating results by requiring us to modify or cease our operations.
In addition, the inhalation of respirable crystalline silica is associated with the lung disease silicosis. There is evidence of an association between crystalline silica exposure or silicosis and lung cancer and a possible association with other diseases, including immune system disorders such as scleroderma. These health risks have been, and may continue to be, a significant issue confronting the proppant industry. Concerns over silicosis and other potential adverse health effects, as well as concerns regarding potential liability from the use of raw frac sand, may have the effect of discouraging our customers’ use of our raw frac sand. The actual or perceived health risks of mining, processing and handling proppants could materially and adversely affect proppant producers, including us, through reduced use of frac sand, the threat of product liability or employee lawsuits, increased scrutiny by federal, state and local regulatory authorities of us and our customers or reduced financing sources available to the frac sand industry.
We are subject to the Federal Mine Safety and Health Act of 1977, which imposes stringent health and safety standards on numerous aspects of our operations.
Our operations are subject to the Federal Mine Safety and Health Act of 1977, as amended by the Mine Improvement and New Emergency Response Act of 2006, which imposes stringent health and safety standards on numerous aspects of mineral extraction and processing operations, including the training of personnel, operating procedures, operating equipment, and other matters. Our failure to comply with such standards, or changes in such standards or the interpretation or enforcement thereof, could have a material adverse effect on our business and financial condition or otherwise impose significant restrictions on our ability to conduct mineral extraction and processing operations.
We and our customers are subject to other extensive regulations, including licensing, plant and wildlife protection and reclamation regulation, that impose, and will continue to impose, significant costs and liabilities. In addition, future regulations, or more stringent enforcement of existing regulations, could increase those costs and liabilities, which could adversely affect our results of operations.
In addition to the regulatory matters described above, we and our customers are subject to extensive governmental regulation on matters such as permitting and licensing requirements, plant and wildlife protection, wetlands protection, reclamation and restoration activities at mining properties after mining is completed, the discharge of materials into the environment, and the effects that mining and hydraulic fracturing have on groundwater quality and availability. Our future success depends, among other things, on the quantity and quality of our raw frac sand deposits, our ability to extract these deposits profitably, and our customers being able to operate their businesses as they currently do.
In order to obtain permits and renewals of permits in the future, we may be required to prepare and present data to governmental authorities pertaining to the potential adverse impact that any proposed excavation or production activities, individually or in the aggregate, may have on the environment. Certain approval procedures may require preparation of archaeological surveys, endangered species studies, and other studies to assess the environmental impact of new sites or the expansion of existing sites. Compliance with these regulatory requirements is expensive and significantly lengthens the time needed to develop a site. Finally, obtaining or renewing required permits is sometimes delayed or prevented due to community opposition and other factors beyond our control. The denial of a permit essential to our operations or the imposition of
29
conditions with which it is not practicable or feasible to comply could impair or prevent our ability to develop or expand a site. Significant opposition to a permit by neighboring property owners, members of the public, or other third parties, or delay in the environmental review and permitting process also could delay or impair our ability to develop or expand a site. New legal requirements, including those related to the protection of the environment, could be adopted that could materially adversely affect our mining operations (including our ability to extract or the pace of extraction of mineral deposits), our cost structure, or our customers’ ability to use our raw frac sand. Such current or future regulations could have a material adverse effect on our business and we may not be able to obtain or renew permits in the future.
Our inability to acquire, maintain or renew financial assurances related to the reclamation and restoration of mining property could have a material adverse effect on our business, financial condition and results of operations.
We are generally obligated to restore property in accordance with regulatory standards and our approved reclamation plan after it has been mined. We are required under federal, state, and local laws to maintain financial assurances, such as surety bonds, to secure such obligations. The inability to acquire, maintain or renew such assurances, as required by federal, state, and local laws, could subject us to fines and penalties as well as the revocation of our operating permits. Such inability could result from a variety of factors, including:
|
•
|
the lack of availability, higher expense, or unreasonable terms of such financial assurances;
|
|
•
|
the ability of current and future financial assurance counterparties to increase required collateral; and
|
|
•
|
the exercise by financial assurance counterparties of any rights to refuse to renew the financial assurance instruments.
|
Our inability to acquire, maintain, or renew necessary financial assurances related to the reclamation and restoration of mining property could have a material adverse effect on our business, financial condition, and results of operations.
Climate change legislation and regulatory initiatives could result in increased compliance costs for us and our customers.
In recent years, the U.S. Congress has considered legislation to reduce emissions of GHGs, including methane, a primary component of natural gas, and carbon dioxide, a byproduct of the burning of natural gas. It presently appears unlikely that comprehensive climate legislation will be passed by either house of Congress in the near future, although energy legislation and other regulatory initiatives are expected to be proposed that may be relevant to GHG emissions issues. In addition, a number of states are addressing GHG emissions, primarily through the development of emission inventories or regional GHG cap and trade programs. Depending on the particular program, we could be required to control GHG emissions or to purchase and surrender allowances for GHG emissions resulting from our operations. Independent of Congress, the EPA has adopted regulations controlling GHG emissions under its existing authority under the federal CAA. For example, following its findings that emissions of GHGs present an endangerment to human health and the environment because such emissions contributed to warming of the earth’s atmosphere and other climatic changes, the EPA has adopted regulations under existing provisions of the CAA that, among other things establish construction and operating permit reviews for GHG emissions from certain large stationary sources that are already potential major sources for conventional pollutants. In addition, the EPA has adopted rules requiring the monitoring and reporting of GHG emissions from specified production, processing, transmission and storage facilities in the United States on an annual basis. In addition, in December 2015, over 190 countries, including the United States, reached an agreement to reduce global greenhouse gas emissions, also known as the Paris Agreement. The Paris Agreement entered into force in November 2016 after more than 170 nations, including the United States, ratified or otherwise indicated their intent to be bound by the agreement. However, in June 2017, President Trump announced that the United States intends to withdraw from the Paris Agreement and to seek negotiations either to reenter the Paris Agreement on different terms or enter into a separate agreement. In August 2017, the U.S. Department of State officially informed the United Nations of the United States’ intent to withdraw from the Paris Agreement. The Paris Agreement provides for a four-year exit process beginning when it took effect in November 2016, which would result in an effective exit date of November 2020. The United States’ adherence to the exit process and/or the terms on which the United States may re-enter the Paris Agreement or a separately negotiated agreement are unclear at this time. To the extent that the United States and other countries implement this agreement or impose other climate change regulations on the oil and natural gas industry, it could have an adverse effect on our business because substantial limitations on GHG emissions could adversely affect demand for the oil and natural gas that is produced by our customers. Finally, many scientists have concluded that increasing concentrations of GHGs in the Earth’s atmosphere may produce climate changes that have significant physical effects, such as increased frequency and severity of storms, floods and other climatic events; if any such effects were to occur, they could have an adverse effect on our operations and our customers’ exploration and production operations.
30
Risks Related to Ownership of Our Common Stock
Our stock price could be volatile, and you may not be able to resell shares of your common stock at or above the price you paid.
The stock markets in general have experienced extreme volatility that has often been unrelated to the operating performance of particular companies. These broad market fluctuations may adversely affect the trading price of our common stock. Volatility in the market price of our common stock may prevent you from being able to sell your common stock at or above the price at which you purchased the stock. As a result, you may suffer a loss on your investment. Securities class action litigation has often been instituted against companies following periods of volatility in the overall market and in the market price of a company’s securities. Such litigation, if instituted against us, could result in very substantial costs, divert our management’s attention and resources and harm our business, operating results and financial condition.
In addition to the risks described in this section, the market price of our common stock may fluctuate significantly in response to a number of factors, most of which we cannot control, including:
|
•
|
our operating and financial performance;
|
|
•
|
quarterly variations in the rate of growth of our financial indicators, such as revenues, EBITDA, Adjusted EBITDA, contribution margin, net income, and net income per share;
|
|
•
|
the public reaction to our press releases, our other public announcements, and our filings with the SEC;
|
|
•
|
strategic actions by our competitors;
|
|
•
|
our failure to meet revenue or earnings estimates by research analysts or other investors;
|
|
•
|
changes in revenue or earnings estimates, or changes in recommendations or withdrawal of research coverage, by equity research analysts;
|
|
•
|
speculation in the press or investment community;
|
|
•
|
the failure of research analysts to cover our common stock;
|
|
•
|
sales of our common stock by us or our, stockholders, or the perception that such sales may occur;
|
|
•
|
changes in accounting principles, policies, guidance, interpretations, or standards;
|
|
•
|
additions or departures of key management personnel;
|
|
•
|
actions by our stockholders;
|
|
•
|
general market conditions, including fluctuations in commodity prices, sand-based proppants, or industrial and recreational sand-based products;
|
|
•
|
domestic and international economic, legal and regulatory factors unrelated to our performance; and
|
|
•
|
the realization of any risks described under this “Risk Factors” section.
|
We are subject to certain requirements of Section 404 of the Sarbanes-Oxley Act. If we are unable to timely comply with Section 404 or if the costs related to compliance are significant, our profitability, stock price, results of operations and financial condition could be materially adversely affected.
We are required to comply with certain provisions of Section 404 of the Sarbanes-Oxley Act beginning December 31, 2017. Section 404 requires that we document and test our internal control over financial reporting and issue management’s assessment of our internal control over financial reporting. This section also requires that our independent registered public accounting firm opine on those internal controls upon becoming a large accelerated filer, as defined in the SEC rules, or otherwise ceasing to qualify as an emerging growth company under the JOBS Act. We are evaluating our existing controls against the standards adopted by the Committee of Sponsoring Organizations of the Treadway Commission. During the course of our ongoing evaluation and integration of the internal control over financial reporting, we may identify areas requiring improvement, and we may have to design enhanced processes and controls to address issues identified through this review.
We believe that the out-of-pocket costs, diversion of management’s attention from running the day-to-day operations and operational changes caused by the need to comply with the requirements of Section 404 of the Sarbanes-Oxley Act could
31
be significant. If the time and costs associated with such compliance exceed our current expectations, our results of operations could be adversely affected.
If we fail to comply with the requirements of Section 404 or if we or our independent registered public accounting firm identify and report such material weaknesses, the accuracy and timeliness of the filing of our annual and quarterly reports may be materially adversely affected and could cause investors to lose confidence in our reported financial information, which could have a negative effect on the stock price of our common stock. In addition, a material weakness in the effectiveness of our internal control over financial reporting could result in an increased chance of fraud and the loss of customers, reduce our ability to obtain financing and require additional expenditures to comply with these requirements, each of which could have a material adverse effect on our business, results of operations and financial condition.
The concentration of our capital stock ownership among our largest stockholders and their affiliates will limit your ability to influence corporate matters.
As of
December 31, 2018
, Clearlake beneficially owns approximately
26.5%
of our outstanding common stock and our Chief Executive Officer beneficially owns approximately
15.3%
of our outstanding common stock. Consequently, Clearlake and our Chief Executive Officer (each of whom we sometimes refer to as a “Principal Stockholder”) will continue to have significant influence over all matters that require approval by our stockholders, including the election of directors and approval of significant corporate transactions. Additionally, we are party to a stockholders’ agreement pursuant to which, so long as either Principal Stockholder maintains certain beneficial ownership levels of our common stock, each Principal Stockholder will have certain rights, including board of directors and committee designation rights and consent rights, including the right to consent to change in control transactions. For additional information, please read “Certain Relationships and Related Party Transactions—Stockholders Agreement” in the prospectus included in our Registration Statement on Form S-1 (Registration No. 333-215554), initially filed with the SEC on January 13, 2017. This concentration of ownership and the rights of our Principal Stockholders under the stockholders agreement, will limit your ability to influence corporate matters, and as a result, actions may be taken that you may not view as beneficial.
Furthermore, conflicts of interest could arise in the future between us, on the one hand, and Clearlake and its affiliates, including its portfolio companies, on the other hand, concerning among other things, potential competitive business activities or business opportunities. Clearlake is a private equity firm in the business of making investments in entities in a variety of industries. As a result, Clearlake’s existing and future portfolio companies which it controls may compete with us for investment or business opportunities. These conflicts of interest may not be resolved in our favor.
The price of our common stock may fluctuate significantly, and you could lose all or part of your investment.
As of
December 31, 2018
, there were
21,392,115
publicly traded shares of common stock held by our public common stockholders. Although our common stock is listed on the NASDAQ, we do not know whether an active trading market will continue to develop or how liquid that market might be. You may not be able to resell your common stock at or above the public offering price. Additionally, the lack of liquidity may result in wide bid-ask spreads, contribute to significant fluctuations in the market price of the common stock and limit the number of investors who are able to buy the common stock.
Our amended and restated certificate of incorporation contains a provision renouncing our interest and expectancy in certain corporate opportunities.
Our amended and restated certificate of incorporation provides for the allocation of certain corporate opportunities between us and Clearlake. Under these provisions, neither Clearlake, its affiliates and investment funds, nor any of their respective principals, officers, members, managers and/or employees, including any of the foregoing who serve as our officers or directors, will have any duty to refrain from engaging, directly or indirectly, in the same business activities or similar business activities or lines of business in which we operate. For instance, a director of our company who also serves or is a principal, officer, member, manager and/or employee of Clearlake or any of its affiliates or investment funds may pursue certain acquisitions or other opportunities that may be complementary to our business and, as a result, such acquisition or other opportunities may not be available to us. These potential conflicts of interest could have a material adverse effect on our business, financial condition and results of operations if attractive corporate opportunities are allocated by Clearlake to itself or its affiliates or investment funds instead of to us. The terms of our amended and restated certificate of incorporation are more fully described in “Description of Capital Stock” in the prospectus included in our Registration Statement on Form S-1 (Registration No. 333-215554), initially filed with the SEC on January 13, 2017.
32
If securities or industry analysts do not publish research or reports or publish unfavorable research about our business, the price and trading volume of our common stock could decline.
The trading market for our common stock depends in part on the research and reports that securities or industry analysts publish about us or our business. If one or more of the analysts who covers us downgrades our securities, the price of our securities would likely decline. If one or more of these analysts ceases to cover us or fails to publish regular reports on us, interest in the purchase of our securities could decrease, which could cause the price of our common stock and other securities and their trading volume to decline.
Our amended and restated certificate of incorporation and amended and restated bylaws, as well as Delaware law, contain provisions that could discourage acquisition bids or merger proposals, which may adversely affect the market price of our common stock.
Our amended and restated certificate of incorporation authorizes our board of directors to issue preferred stock without stockholder approval. If our board of directors elects to issue preferred stock, it could be more difficult for a third party to acquire us. In addition, some provisions of our amended and restated certificate of incorporation and amended and restated bylaws could make it more difficult for a third party to acquire control of us, even if the change of control would be beneficial to our stockholders, including:
|
•
|
advance notice provisions for stockholder proposals and nominations for elections to the board of directors to be acted upon at meetings of stockholders;
|
|
•
|
provisions that divide our board of directors into three classes of directors, with the classes to be as nearly equal in number as possible;
|
|
•
|
provisions that prohibit stockholder action by written consent after the date on which our Principal Stockholders collectively cease to beneficially own at least 50% of the voting power of the outstanding shares of our stock entitled to vote;
|
|
•
|
provisions that provide that special meetings of stockholders may be called only by the board of directors or, for so long as a Principal Stockholder continues to beneficially own at least 20% of the voting power of the outstanding shares of our stock, such Principal Stockholder;
|
|
•
|
provisions that provide that our stockholders may only amend our certificate of incorporation or bylaws with the approval of at least 66 2/3% of the voting power of the outstanding shares of our stock entitled to vote, or for so long as our Principal Stockholders collectively continue to beneficially own at least 50% of the voting power of the outstanding shares of our stock entitled to vote, with the approval of a majority of the voting power of the outstanding shares of our stock entitled to vote;
|
|
•
|
provisions that provide that the board of directors is expressly authorized to adopt, or to alter or repeal our bylaws; and
|
|
•
|
provisions that establish advance notice and certain information requirements for nominations for election to our board of directors or for proposing matters that can be acted upon by stockholders at stockholder meetings.
|
We do not currently, and do not intend to, pay dividends on our common stock, and our debt agreements place certain restrictions on our ability to do so. Consequently, your only opportunity to achieve a return on your investment is if the price of our common stock appreciates.
We do not currently, and do not plan to, declare dividends on shares of our common stock in the foreseeable future. Additionally, our Credit Facility places certain restrictions on our ability to pay cash dividends. Consequently, unless we revise our dividend policy, your only opportunity to achieve a return on your investment in us will be if you sell your common stock at a price greater than you paid for it. There is no guarantee that the price of our common stock that will prevail in the market will ever exceed the price that you previously paid.
Future sales of our common stock in the public market could reduce our stock price, and the sale or issuance of equity or convertible securities may dilute your ownership in us.
We may sell additional shares of common stock in subsequent public offerings. We may also issue additional shares of common stock or convertible securities. As of
December 31, 2018
, we have outstanding
41,001,067
shares of common stock. Clearlake beneficially owns
10,849,015
shares of our common stock, or approximately
26.5%
of our total outstanding shares
33
and our Chief Executive Officer beneficially owns
6,284,162
shares of our common stock, or approximately
15.3%
of our total outstanding shares.
In connection with our initial public offering, we filed a registration statement with the SEC on Form S-8 providing for the registration of shares of our common stock issued or reserved for issuance under our equity incentive plans. Subject to the satisfaction of vesting conditions and the requirements of Rule 144, shares registered under the registration statement on Form S-8 will be available for resale immediately in the public market without restriction.
We have provided certain registration rights for the sale of common stock by certain existing stockholders in the future. The sale of these shares could have an adverse impact on the price of our common stock or on any trading market that may develop.
We cannot predict the size of future issuances of our common stock or securities convertible into common stock or the effect, if any, that future issuances and sales of shares of our common stock will have on the market price of our common stock. Sales of substantial amounts of our common stock (including shares issued in connection with an acquisition), or the perception that such sales could occur, may adversely affect prevailing market prices of our common stock.
We are an “emerging growth company” and we cannot be certain if the reduced disclosure requirements applicable to emerging growth companies will make our common stock less attractive to investors.
We are an “emerging growth company,” as defined in the JOBS Act and we intend to take advantage of certain exemptions from various reporting requirements that are applicable to other public companies, including, but not limited to, not being required to comply with the auditor attestation requirements of Section 404 of the Sarbanes-Oxley Act, reduced disclosure obligations regarding executive compensation in our periodic reports and proxy statements, and exemptions from the requirements of holding a nonbinding advisory vote on executive compensation and stockholder approval of any golden parachute payments not previously approved. We intend to take advantage of these reporting exemptions until we are no longer an emerging growth company. We cannot predict if investors will find our common stock less attractive because we will rely on these exemptions. If some investors find our common stock less attractive as a result, there may be a less active trading market for our common stock and our stock price may be more volatile.
We will remain an emerging growth company for up to five years, although we will lose that status sooner if we have more than $1.07 billion of revenues in a fiscal year, have more than $700 million in market value of our common stock held by non-affiliates as of any June 30 or issue more than $1.0 billion of non-convertible debt over a rolling three-year period.
Under the JOBS Act, emerging growth companies can delay adopting new or revised accounting standards until such time as those standards apply to private companies. We have irrevocably elected not to avail ourselves of this exemption from new or revised accounting standards and, therefore, we will be subject to the same new or revised accounting standards as other public companies that are not emerging growth companies.
To the extent that we rely on any of the exemptions available to emerging growth companies, you will receive less information about our executive compensation and internal control over financial reporting than issuers that are not emerging growth companies.
We may issue preferred stock whose terms could adversely affect the voting power or value of our common stock.
Our amended and restated certificate of incorporation authorizes us to issue, without the approval of our stockholders, one or more classes or series of preferred stock having such designations, preferences, limitations and relative rights, including preferences over our common stock respecting dividends and distributions, as our board of directors may determine. The terms of one or more classes or series of preferred stock could adversely impact the voting power or value of our common stock. For example, we might grant holders of preferred stock the right to elect some number of our directors in all events or on the happening of specified events or the right to veto specified transactions. Similarly, the repurchase or redemption rights or liquidation preferences we might assign to holders of preferred stock could affect the residual value of the common stock.
Our amended and restated certificate of incorporation designates the Court of Chancery of the State of Delaware as the sole and exclusive forum for certain types of actions and proceedings that may be initiated by our stockholders, which could limit our stockholders’ ability to obtain a favorable judicial forum for disputes with us or our directors, officers, employees or agents.
Our amended and restated certificate of incorporation provides that unless we consent in writing to the selection of an alternative forum, the Court of Chancery of the State of Delaware will, to the fullest extent permitted by applicable law, be the sole and exclusive forum for (i) any derivative action or proceeding brought on our behalf, (ii) any action asserting a claim of breach of a fiduciary duty owed by any of our directors, officers, employees or agents to us or our stockholders, (iii) any action
34
asserting a claim arising pursuant to any provision of the Delaware General Corporation Law (the “DGCL”), our amended and restated certificate of incorporation or our bylaws, or (iv) any action asserting a claim against us that is governed by the internal affairs doctrine, in each such case subject to such Court of Chancery having personal jurisdiction over the indispensable parties named as defendants therein. Any person or entity purchasing or otherwise acquiring any interest in shares of our capital stock will be deemed to have notice of, and consented to, the provisions of our amended and restated certificate of incorporation described in the preceding sentence. This choice of forum provision may limit a stockholder’s ability to bring a claim in a judicial forum that it finds favorable for disputes with us or our directors, officers, employees or agents, which may discourage such lawsuits against us and such persons. Alternatively, if a court were to find these provisions of our amended and restated certificate of incorporation inapplicable to, or unenforceable in respect of, one or more of the specified types of actions or proceedings, we may incur additional costs associated with resolving such matters in other jurisdictions, which could adversely affect our business, financial condition or results of operations.
ITEM 1B. — UNRESOLVED STAFF COMMENTS
None.
ITEM 2. — PROPERTIES
Our primary facility is our
1,256 acres
raw frac sand mine and related processing facility near Oakdale, Wisconsin. In addition, we have invested in two transloading facilities, one in Byron Township, Wisconsin, approximately three miles from our Oakdale facility, and one in Van Hook, North Dakota.
In addition to these currently operating facilities, we also own approximately
959 acres
in Jackson County, Wisconsin (“Hixton”). The Hixton site is fully permitted to initiate operations and is available for future development. As of
December 31, 2018
, our Hixton site had approximately
100 million tons
of proven recoverable sand reserves. We have no immediate plans to further develop this site.
The following tables provide key characteristics of our Oakdale facility and Hixton site:
Our Oakdale Facility (as of
December 31, 2018
)
|
Facility Characteristic
|
|
Description
|
|
Site geography
|
|
Situated on 1,256 contiguous acres, with on-site processing and rail loading facilities.
|
|
Proven recoverable reserves
|
|
317 million tons.
|
|
Deposits
|
|
Sand reserves of up to 200 feet; grade mesh sizes 20/40, 30/50, 40/70 and 100 mesh.
|
|
Proven reserve mix
|
|
Approximately 19% of 20/40 and coarser substrate, 41% of finer 40/70 mesh substrate and approximately 40% of fine 100 mesh substrate. Our 30/50 gradation is a derivative of the 20/40 and 40/70 blends.
|
|
Excavation technique
|
|
Generally shallow overburden allowing for surface excavation.
|
|
Annual nameplate processing capacity
|
|
5.5 million tons effective as of the second quarter of 2018.
|
|
Logistics capabilities
|
|
Dual served rail line logistics capabilities. On-site transportation infrastructure capable of simultaneously accommodating multiple unit trains and connected to the Canadian Pacific rail network. Additional unit train capable transload facility located approximately three miles from the Oakdale facility in Byron Township that provides access to the Union Pacific rail network.
|
|
Royalties
|
|
$0.50 per ton sold of 70 mesh and coarser substrate.
|
|
Expansion Capabilities
|
|
We believe that with further development and permitting, the Oakdale facility could ultimately be expanded to allow production of up to 9 million tons of raw frac sand per year.
|
35
Our Hixton Site (as of
December 31, 2018
)
|
Facility Characteristic
|
|
Description
|
|
Site geography
|
|
Situated on 959 contiguous acres, with access to a Canadian National Class I rail line.
|
|
Proven recoverable reserves
|
|
100 million tons
|
|
Deposits
|
|
Sand reserves with an average thickness of 120 feet; grade mesh sizes 20/40, 30/50, 40/70 and 100 mesh.
|
|
Proven reserve mix
|
|
Approximately 72% of 70 mesh and coarser substrate and approximately 28% of 100 mesh substrate.
|
|
Logistics capabilities
|
|
Planned on-site transportation infrastructure capable of simultaneously accommodating multiple unit trains and connected to the Canadian National rail network.
|
|
Royalties
|
|
$0.50 per ton sold of 70 mesh and coarser substrate.
|
We have entered into two long-term surface mining leases for properties located in the Permian Basin in Texas that are available for future development. The first site consists of
1,772 acres
in Winkler County, Texas. This location is adjacent to the Texas & New Mexico Railway (TXN) short line with direct access to State Highway 18. The second site consists of
2,447 acres
in Crane County, Texas. This location has direct access to Interstate Highway 20. Based on our preliminary testing, we believe there are sufficient quantities on these sites to establish reserves in the future. We have no immediate plans to further develop this site.
We lease a 56,000 square foot facility in Saskatoon, Saskatchewan, Canada where we manufacture our wellsite proppant storage solutions.
Our Reserves
We believe that our strategically located Oakdale and Hixton sites provide us with a large and high-quality mineral reserves base. Mineral resources and reserves are typically classified by confidence (reliability) levels based on the level of exploration, consistency and assurance of geologic knowledge of the deposit. This classification system considers different levels of geoscientific knowledge and varying degrees of technical and economic evaluation. Mineral reserves are derived from in situ resources through application of modifying factors, such as mining, analytical, economic, marketing, legal, environmental, social and governmental factors, relative to mining methods, processing techniques, economics and markets. In estimating our reserves, John T. Boyd does not classify a resource as a reserve unless that resource can be demonstrated to have reasonable certainty to be recovered economically in accordance with the modifying factors listed above. “Reserves” are defined by SEC Industry Guide 7 as that part of a mineral deposit that could be economically and legally extracted or produced at the time of the reserve determination. Industry Guide 7 defines “proven (measured) reserves” as reserves for which (a) quantity is computed from dimensions revealed in outcrops, trenches, workings or drill holes; grade and/or quality are computed from the results of detailed sampling and (b) the sites for inspection, sampling and measurement are spaced so closely and the geologic character is so well defined that size, shape, depth and mineral content of reserves are well-established.
In estimating our reserves, as listed in the table above, John T. Boyd categorizes our reserves as proven recoverable in accordance with these SEC definitions. The quantity and nature of the sand reserves at our Oakdale site are estimated by third-party geologists and mining engineers, and we internally track the depletion rate on an interim basis. The recovery percentage following processing is also an important criterion in determining economic viability of our mineral reserves. We estimated an average processing recovery of approximately 70% at our Oakdale and Hixton locations. Before acquiring new reserves, we perform surveying, drill core analysis and other tests to confirm the quantity and quality of the acquired reserves.
Our Oakdale reserves are located on
1,256 contiguous acres
in Monroe County, Wisconsin. We own our Monroe County acreage in fee and acquired surface and mineral rights on all of such acreage from multiple landowners in separate transactions. Our mineral rights are subject to an aggregate non-participating royalty interest of $0.50 per ton sold of coarser than 70 mesh, which we believe is significantly lower than many of our competitors.
In addition to the Oakdale facility, we own the Hixton site that is on approximately
959 acres
in Jackson County, Wisconsin. The Hixton site is fully permitted and available for future development. We own our Jackson County acreage in fee and acquired surface and mineral rights on all of such acreage from multiple landowners in separate transactions. Our mineral rights are subject to an aggregate non-participating royalty interest of $0.50 per ton sold of coarser than 70 mesh, which we believe is significantly lower than many of our competitors.
36
To opine as to the economic viability of our reserves, John T. Boyd reviewed our financial cost and revenue per ton data at the time of the reserve determination. Historical mineral prices are considered in the context of market supply and demand dynamics to further assess the long-term economic viability of the mineral reserve assets that were evaluated over a thirty year measurement period. A range of average sales price assumptions was considered to estimate proven reserves in accordance with the Commission’s definitions. For our Oakdale location, the assumed average sales price was between $26 and $43 per ton over the course of the 30-year measurement period. For our Hixton location, the assumed average sales price was between $23 and $34 per ton over the course of the 30 year measurement period. The reserve estimates are updated annually based on a variety of factors, including sales, changes to mineral properties, changes in mine plan, current pricing forecasts and other business strategies. The recovery percentage following processing is also an important criterion in determining economic viability of our mineral reserves. An estimated average processing recovery of approximately 68% was used for our Oakdale and Hixton locations.
Based on their review of our cost structure and their extensive experience with similar operations, John T. Boyd concluded that it is reasonable to assume that we will operate under a similar cost structure over the remaining life of our reserves. John T. Boyd further assumed that if our revenue per ton remained relatively constant over the life of the reserves, our current operating margins are sufficient to expect continued profitability throughout the life of our reserves.
ITEM 3. — LEGAL PROCEEDINGS
From time to time we may be involved in litigation relating to claims arising out of our operations in the normal course of business. The disclosure called for by Part I, Item 3 regarding our legal proceedings is incorporated by reference herein from Part II, Item 8. Note 17 - Commitments and Contingencies - Litigation of the notes to the consolidated financial statements in this Form 10-K for the year ended December 31, 2018.
ITEM 4. — MINE SAFETY DISCLOSURES
We are committed to maintaining a culture that prioritizes mine safety. We believe that our commitment to safety, the environment and the communities in which we operate is critical to the success of our business. Our sand mining operations are subject to mining safety regulation. The U.S. Mining Safety and Health Administration (“MSHA”) is the primary regulatory organization governing raw frac sand mining and processing. Accordingly, MSHA regulates quarries, surface mines, underground mines and the industrial mineral processing facilities associated with and located at quarries and mines. The mission of MSHA is to administer the provisions of the Federal Mine Safety and Health Act of 1977 and to enforce compliance with mandatory miner safety and health standards. As part of MSHA’s oversight, representatives perform at least two unannounced inspections annually for each above-ground facility.
We are also subject to regulations by the U.S. Occupational Safety and Health Administration (“OSHA”) which has promulgated rules for workplace exposure to respirable silica for several other industries. Respirable silica is a known health hazard for workers exposed over long periods. MSHA is expected to adopt similar rules as part of its “Long Term Items” for rulemaking. Airborne respirable silica is associated with work areas at our site and is monitored closely through routine testing and MSHA inspection. If the workplace exposure limit is lowered significantly, we may be required to incur certain capital expenditures for equipment to reduce this exposure. Smart Sand also adheres to the National Industrial Sand Association’s (“NISA”) respiratory protection program, and ensures that workers are provided with fitted respirators and ongoing radiological monitoring.
Our operations are subject to the Federal Mine Safety and Health Act of 1977, as amended by the Mine Improvement and New Emergency Response Act of 2006, which imposes stringent health and safety standards on numerous aspects of mineral extraction and processing operations, including the training of personnel, operating procedures, operating equipment, and other matters. Our failure to comply with such standards, or changes in such standards or the interpretation or enforcement thereof, could have a material adverse effect on our business and financial condition or otherwise impose significant restrictions on our ability to conduct mineral extraction and processing operations. Following passage of The Mine Improvement and New Emergency Response Act of 2006, MSHA significantly increased the numbers of citations and orders charged against mining operations. The dollar penalties assessed for citations issued has also increased in recent years. Information concerning mine safety violations or other regulatory matters required by Section 1503(a) of the Dodd-Frank Wall Street Reform and Consumer Protection Act and Item 104 of Regulation S-K (17 CFR 229.104) is included in Exhibit 95.1 to this Report.
37
PART II
ITEM 5. — MARKET FOR REGISTRANT’S COMMON EQUITY, RELATED STOCKHOLDER MATTERS AND ISSUER PURCHASES OF EQUITY SECURITIES
Shares of our common stock, traded publicly under the symbol, “SND,” have been publicly traded since November 4, 2016, when our common stock was listed and began trading on the NASDAQ Global Select Market (“NASDAQ”). Prior to that date, there was no public market for our stock.
Holders of Record
On
March 7, 2019
, there were
41,013,671
shares of our common stock outstanding, which were held by approximately 29 stockholders of record. Because many of our shares of common stock are held by brokers and other institutions on behalf of stockholders, we are unable to estimate the total number of stockholders represented by these record holders.
Dividends
Our ability to pay dividends is governed by (i) the provisions of Delaware corporate law, (ii) our Certificate of Incorporation and Bylaws, and (iii) our Credit Facility. To date, we have not paid or declared any dividends on our common stock and there is no assurance that we will pay any cash dividends on our common stock in the future. The future payment of cash dividends on our common stock, if any, is within the discretion of our board of directors and will depend on our earnings, capital requirements, financial condition, and other relevant factors.
Smart Sand, Inc. Comparative Stock Performance Graph
The graph below compares the cumulative total stockholder return on our common stock, the cumulative total return on the Russell 3000 Index, the Standard and Poor’s Small Cap 600 GICS Oil & Gas Equipment & Services Sub-Industry Index and a composite average of publicly traded proppant peer companies (U.S. Silica Holding, Inc., Hi-Crush Partners LP, CARBO Ceramics, Inc. and Emerge Energy Services, LP) since November 4, 2016, the first day our stock traded on the NASDAQ.
The Graph assumes $100 was invested on November 4, 2016, the first day our stock was traded on the NASDAQ, in our common stock, the Russell 3000, the Standard and Poor’s Small Cap 600 GICS Oil &Gas Equipment & Services Sub-Industry Index and a composite of publicly traded proppant peer companies. The cumulative total return assumes the reinvestment of all dividends. We elected to include the stock performance of a composite of our publicly traded peers as we believe it is an appropriate benchmark for our line of business/industry.
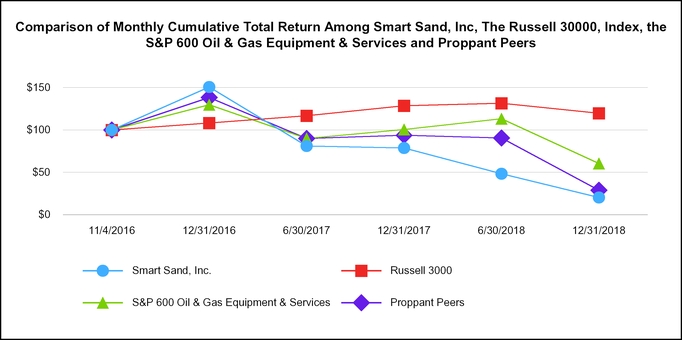
The information contained in this Smart Sand, Inc. Comparative Stock Performance Graph section shall not be deemed to be “soliciting material” or “filed” or incorporated by reference in future filings with the SEC, or subject to the liabilities of
38
Section 18 of the Exchange Act, except to the extent that we specifically incorporate it by reference into a document filed under the Securities Act or the Exchange Act.
Unregistered Sales of Equity Securities and Use of Proceeds
During the year ended
December 31, 2018
, no shares were sold by the Company without registration under the Securities Act of 1933.
Purchases of Equity Securities by the Issuer and Affiliated Purchasers
We are authorized to repurchase shares through open market purchases at prevailing market prices or through privately negotiated transactions as permitted by securities laws and other legal requirements. On November 8, 2018, we announced that the board of directors had approved the repurchase of up to 2,000,000 shares of our common stock during the twelve month period following the announcement of the share repurchase program.
|
Total number of shares purchased
|
Average price paid per share
|
Total number of shares purchased as part of publicly announced plans or programs
|
Maximum number of shares that may yet be purchased under the plans or programs
|
|||||||||
|
October 2018
|
—
|
|
$
|
—
|
|
—
|
|
—
|
|
|||
|
November 2018
|
588,200
|
|
$
|
3.37
|
|
588,200
|
|
1,411,800
|
|
|||
|
December 2018
|
—
|
|
$
|
—
|
|
—
|
|
1,411,800
|
|
|||
|
588,200
|
|
$
|
3.37
|
|
588,200
|
|
||||||
At December 31, 2018, the maximum number of shares that the Company may repurchase under the current repurchase authority was 1,411,800 shares.
39
ITEM 6. — SELECTED FINANCIAL DATA
The selected historical consolidated financial data presented below should be read in conjunction with “Risk Factors,” “Management’s Discussion and Analysis of Financial Condition and Results of Operations” and our consolidated financial statements and the related notes and other financial data included elsewhere in this document.
|
|
Year Ended December 31,
|
||||||||||||||||||
|
|
2018
|
2017
|
2016
(4)
|
2015
|
2014
|
||||||||||||||
|
|
(in thousands, except per share and per ton amounts)
|
||||||||||||||||||
|
Income Statement Data:
|
|
|
|
|
|
|
|
|
|||||||||||
|
Revenues
|
$
|
212,470
|
|
$
|
137,212
|
|
$
|
59,231
|
|
$
|
47,698
|
|
$
|
68,170
|
|
||||
|
Cost of goods sold
|
144,903
|
|
100,304
|
|
26,569
|
|
21,003
|
|
29,934
|
|
|||||||||
|
Gross profit
|
67,567
|
|
36,908
|
|
32,662
|
|
26,695
|
|
38,236
|
|
|||||||||
|
Operating expenses
|
41,688
|
|
18,203
|
|
12,271
|
|
10,112
|
|
12,470
|
|
|||||||||
|
Operating income
|
25,879
|
|
18,705
|
|
20,391
|
|
16,583
|
|
25,766
|
|
|||||||||
|
Net income
(1)
|
18,688
|
|
21,526
|
|
10,379
|
|
4,990
|
|
7,556
|
|
|||||||||
|
Net income per common share
(1)
:
|
|
|
|
|
|
|
|
|
|||||||||||
|
Basic
|
$
|
0.46
|
|
$
|
0.54
|
|
$
|
0.43
|
|
$
|
0.23
|
|
$
|
0.34
|
|
||||
|
Diluted
|
$
|
0.46
|
|
$
|
0.53
|
|
$
|
0.42
|
|
$
|
0.19
|
|
$
|
0.29
|
|
||||
|
Balance Sheet Data (at period end):
|
|
|
|
|
|
|
|
|
|||||||||||
|
Property, plant and equipment, net
(1)
|
$
|
248,396
|
|
$
|
171,762
|
|
$
|
104,096
|
|
$
|
108,928
|
|
$
|
85,815
|
|
||||
|
Total assets
|
320,292
|
|
246,802
|
|
173,452
|
|
132,564
|
|
109,629
|
|
|||||||||
|
Long-term debt, net of current portion
|
47,893
|
|
—
|
|
860
|
|
64,583
|
|
60,842
|
|
|||||||||
|
Total stockholders’ equity (deficit)
(1)
|
209,360
|
|
190,022
|
|
142,442
|
|
3,729
|
|
(1,957
|
)
|
|||||||||
|
Cash Flow Statement Data:
|
|
|
|
|
|
|
|
|
|||||||||||
|
Net cash provided by operating activities
|
$
|
50,909
|
|
$
|
15,628
|
|
$
|
26,703
|
|
$
|
30,703
|
|
$
|
22,137
|
|
||||
|
Net cash used in investing activities
|
(125,989
|
)
|
(51,148
|
)
|
(2,470
|
)
|
(29,375
|
)
|
(30,888
|
)
|
|||||||||
|
Net cash provided by financing activities
|
41,319
|
|
23,213
|
|
19,405
|
|
1,766
|
|
7,434
|
|
|||||||||
|
Other Data:
|
|
|
|
|
|
|
|
|
|||||||||||
|
Capital expenditures
(3)
|
$
|
110,761
|
|
$
|
69,378
|
|
$
|
(546
|
)
|
$
|
28,102
|
|
$
|
34,719
|
|
||||
|
Adjusted EBITDA
(2)
|
65,993
|
|
30,615
|
|
37,839
|
|
23,881
|
|
33,330
|
|
|||||||||
|
Contribution margin
(2)
|
83,864
|
|
44,197
|
|
38,738
|
|
31,625
|
|
41,717
|
|
|||||||||
|
Contribution margin per ton
(2)
|
$
|
28.00
|
|
$
|
18.05
|
|
$
|
46.90
|
|
$
|
42.11
|
|
$
|
33.24
|
|
||||
|
Tons Sold
|
2,995
|
|
2,449
|
|
826
|
|
751
|
|
1,255
|
|
|||||||||
|
(1)
|
The amounts previously reported have been updated to reflect an immaterial correction as of and for the years ended December 31, 2016, 2015 and 2014. The year ended December 31, 2017 includes an immaterial reclassification in Property, plant and equipment, net.
|
|
(2)
|
For our definitions of the non-GAAP financial measures of EBITDA, Adjusted EBITDA and contribution margin, and reconciliations of Adjusted EBITDA and contribution margin to our most directly comparable financial measures calculated and presented in accordance with GAAP, please see the section entitled “Non-GAAP Financial Measures” in Item 7 of this Form 10-K.
|
|
(3)
|
Negative capital expenditures for the year ended December 31, 2016 resulted from return of deposits paid for projects included in construction in progress. The year ended December 31, 2018 includes approximately $30.0 million for the acquisition of Quickthree and $15.5 million for the acquisition of assets at the Van Hook terminal.
|
|
(4)
|
Includes the impact of our IPO, including proceeds received and additional charges incurred.
|
_________________________
40
ITEM 7. — MANAGEMENT’S DISCUSSION AND ANALYSIS FINANCIAL CONDITION AND RESULTS OF OPERATIONS
Forward-Looking Statements
The following discussion and analysis of our financial condition and results of operations should be read together with Item 6, “Selected Financial Data,” Item 1, “Business,” and the Consolidated Financial Statements in Item 8 of this Annual Report on Form 10-K and the related notes included elsewhere in this report. This discussion contains forward-looking statements as a result of many factors, including those set forth under Item 1, “Business—Forward-Looking Statements” and Item 1A, “Risk Factors,” and elsewhere in this report. These statements are based on current expectations and assumptions that are subject to risks and uncertainties. Actual results could differ materially from those discussed in or implied by forward-looking statements. Factors that could cause or contribute to these differences include those discussed below and elsewhere in this report, particularly in Item 1A, “Risk Factors.”
Factors Impacting Comparability of Our Financial Results
Our historical results of operations and cash flows are not indicative of results of operations and cash flows to be expected in the future, principally for the following reasons:
|
•
|
Impairment of goodwill and other intangible asset.
In 2018 we recorded an impairment of our goodwill and indefinite-lived intangible asset in the amount of
$17.8 million
, which was recorded as an operating expense on the consolidated income statement. The impairment charge reduced our earnings per share by
$0.44
per share for the year ended
December 31, 2018
. See our discussion in the “GAAP Results of Operations - Year Ended
December 31, 2018
compared to the Year Ended
December 31, 2017
: Operating Expenses” for additional information regarding this transaction.
|
|
•
|
Expansion of our Oakdale facility
. In May 2018, we completed an expansion project to increase our nameplate processing capacity at our Oakdale facility from 3.3 million tons per year to
5.5 million tons
per year.
|
|
•
|
We have increased our deliveries of sand to the basins.
In 2018, a greater portion of the raw frac sand that we sold was delivered directly to the basins. This results in higher average selling prices along with additional costs related to such delivery.
|
|
•
|
Market Trends
. Demand for proppants through the first half of 2016 decreased due to the downturn in commodity prices originating in late 2014 and the corresponding reduction in oil and natural gas drilling, completion and production activity. The change in demand during this period impacted contract discussions and negotiated terms with our customers as existing contracts were adjusted, resulting in a combination of reduced average selling prices per ton, and adjustments to take-or-pay volumes and lengths of contracts. During the market downturn, customers began to purchase more volumes on a spot basis as compared to committing to long-term contracts, and this trend continued until oil and natural gas drilling and completion activity began to increase beginning in the fourth quarter of 2016. From early 2017 through the second quarter of 2018, improvements in oil and natural gas prices created a more stable market environment. During the second half of 2018, the demand for Northern White sand decreased, which we believe was due primarily to insufficient takeaway capacity for the incremental oil and natural gas production coming online in the Permian Basin, along with increased availability of regional sand as a source of proppant in the Permian basin. Additionally, oil and natural gas companies reduced their spending in the latter portion of the year due to strong spending in the first half of 2018 and lower oil prices, particularly in the fourth quarter of 2018. Our spot sales continued at decreased rates through the second half of 2018, and we have agreed to temporary price adjustments under certain of our long-term agreements. In general, we have received a term extension in exchange for such price adjustments. Otherwise, the contractual terms under our long-term agreements have not changed materially. In general, customers under long-term take or pay contracts are required to make periodic shortfall payments, which we recognize as revenue in our results of operations in the period in which the obligation becomes due. Contracted volumes have decreased in the fourth quarter of 2018, resulting in additional shortfall revenue.
|
Overview
We are a fully integrated frac sand supply and services company, offering complete mine to wellsite solutions for our customers. We produce low-cost, high quality Northern White raw frac sand, which is a premium proppant used to enhance hydrocarbon recovery rates in the hydraulic fracturing of oil and natural gas wells. We also offer proppant logistics solutions to our customers through our in-basin transloading terminal and wellsite storage capabilities. We currently market our products and services primarily to oil and natural gas exploration and production companies and oilfield service companies and sell our
41
products under a combination of long-term take-or-pay contracts and spot sales in the open market. We believe that the size and favorable geologic characteristics of our sand reserves, the strategic location and logistical advantages of our facilities, our proprietary portable wellsite storage solutions and the industry experience of our senior management team have positioned us as a highly attractive provider of raw frac sand and proppant logistics services from the mine to the wellsite.
We own and operate a raw frac sand mine and related processing facility near Oakdale, Wisconsin, at which we have approximately
317 million tons
of proven recoverable sand reserves as of
December 31, 2018
. We incorporated in Delaware in July 2011 and began operations with 1.1 million tons of annual nameplate processing capacity in July 2012. After several expansions, our current annual nameplate processing capacity at our Oakdale facility is approximately
5.5 million tons
of raw frac sand per year. Our integrated Oakdale facility, with onsite rail infrastructure and wet and dry sand processing facilities, has access to two Class I rail lines, which enables us to process and cost effectively deliver products to our customers.
Recent Developments
Wellsite Storage Solutions
On June 1, 2018, we acquired substantially all of the assets of Quickthree Solutions, Inc. (“Quickthree”), a manufacturer of portable vertical proppant storage solution systems. The consideration for the transaction consisted of approximately $30.0 million in cash, which was paid at closing using cash on hand and advances under the Credit Facility, and up to $12.8 million in potential earn-out payments, which are to be paid as system components are built and made available for sale or lease over the three-year period from the acquisition date. We believe that this acquisition provides us the technology, production capacity and management team to compete further in the proppant logistics market and will provide us with an opportunity to expand our customer base by being able to offer proppant logistics services all the way to the wellsite.
Van Hook Transload Terminal
On March 15, 2018, we acquired the rights to operate a multi-unit train capable transloading terminal in Van Hook, North Dakota to service the Bakken Formation, in the Williston Basin. We paid consideration of approximately $15.5 million to acquire certain assets at the Van Hook terminal, and entered into a long-term lease agreement in connection with the transaction. As part of this transaction, we entered into a long-term agreement with Canadian Pacific Railway to service the Van Hook terminal directly along with the other key oil and natural gas exploration and production basins of North America. The Van Hook terminal became operational in April 2018. Since operations have commenced, we have been providing Northern White sand in-basin at this terminal to our customers. We believe this new terminal provides us with an opportunity to expand our customer base and offer more efficient delivery options to customers operating in the Williston Basin.
Assets and Operations
Oakdale
Our sand reserves include a balanced concentration of coarse sand, (19% 20/40 and coarser), finer sand (41% of 40/70 mesh) and fine sand (40% 60/140 gradation, which we refer to in this annual report as “100 mesh”). Our 30/50 gradation is a derivative of the 20/40 and 40/70 blends. We believe that this mix of coarse and fine sand reserves, combined with contractual demand for our products across a range of mesh sizes, provides us with relatively higher mining yields and lower processing costs than frac sand mines with predominantly coarse sand reserves. In addition, our approximate
317 million tons
of proven recoverable reserves implies a reserve life of approximately
58 years
based on our current annual nameplate processing capacity of
5.5 million tons
. This long reserve life enables us to better serve demand for different types of raw frac sand as compared to mines with shorter reserve lives.
Our Oakdale facility is purpose-built to exploit the reserve profile in place and produce high-quality raw frac sand. Unlike some of our competitors, our primary processing and rail loading facilities are located in close proximity to the mine site, which limits the need for us to truck sand on public roads between the mine and the production facility or between wet and dry processing facilities. Our on-site transportation assets include approximately
nine miles
of rail track in a triple-loop configuration and
four
railcar loading facilities that are connected to a Class I rail line owned by Canadian Pacific. This enables us to simultaneously accommodate multiple unit trains and significantly increases our efficiency in meeting our customers’ raw frac sand transportation needs. With the addition of our unit train capable transload facility approximately three miles from the Oakdale facility in Byron Township, Wisconsin, we also have the ability to ship sand to our customers on the Union Pacific network. We believe that we are the only sand facility in Wisconsin that has dual served rail capabilities, which should create competition among our rail carriers and allow us to provide more competitive logistics options for our customers.
Due to sustained freezing temperatures in our area of operation during winter months, we have historically halted the operation of our wet plant for approximately three to five months. As a result, we have excavated and washed sand in excess of
42
current delivery requirements during the months when the wet plant was operational. This excess sand is placed in stockpiles that feed the dry plants and enable us to fill customer orders throughout the year without interruption. Our second wet plant facility, brought online in the fourth quarter of 2017, is enclosed, which allows us to operate at full capacity during the winter months.
Logistics
Through our acquisitions of the transloading terminal in Van Hook, North Dakota and a manufacturer of portable vertical frac sand storage systems, we have expanded our logistics capabilities. We now provide Northern White sand in-basin to customers operating in the Williston Basin and we have the technology, production capacity and management team to compete further in the raw frac sand supply chain for our customers by offering logistics services all the way to the wellsite.
We intend to continue expanding our footprint in-basin through the addition of one or more terminals in other oil and natural gas operating basins while expanding our wellsite storage solutions fleets. Benefits of our long-term growth strategy for in-basin delivery of sand include new contracted customers by marketing through our own terminal, more opportunity for spot sales by forward deploying sand and the opportunity to capture incremental margin on the sale of sand farther down the supply chain by managing the cost of rail and terminal operations. Additionally, having a presence in-basin gives us an opportunity to have a base of operations from which to market our wellsite solutions. We believe our key differentiators in our wellsite storage solutions are:
|
i.
|
our portable silos can be set up or taken down rapidly;
|
|
ii.
|
our trailers detach, which reduces their footprint;
|
|
iii.
|
our storage silos include industry-leading passive and active dust suppression technology; and
|
|
iv.
|
our patented system is the only one of its kind that has the capability of a gravity-fed operation and when used in combination with our Quickload system, our silos can be filled by both pneumatic and gravity dump trailers.
|
Through the expansion of our wellsite storage solutions fleet and the addition of one or more terminals, we continue evaluating ways to reduce the landed cost of our products in-basin and to the wellsite for our customers while increasing our customized service offerings to provide our customers with additional delivery and pricing alternatives, including selling product on an “as-delivered” basis to the wellsite.
How We Generate Revenue
We generate revenue by excavating and processing frac sand, which we sell to our customers under long-term price agreements or as spot sales at prevailing market rates. In some instances, revenues also include a charge for transportation services provided to customers. Our transportation revenue fluctuates based on a number of factors, including the volume of product transported and the distance between the plant and our customers.
We have entered into long-term take-or-pay contracts with customers that are intended to mitigate our exposure to the potential price volatility of the spot market for raw frac sand and to enhance the stability of our cash flows. Our contracts contain a minimum volume purchase requirement and provides for delivery of raw frac sand FCA at our Oakdale facility, our Van Hook transloading terminal in the Bakken, or another location specified by our customers. As of
March 1, 2019
, we have approximately
58.7%
of our current annual nameplate production capacity contracted under eight long-term take-or-pay contracts with a weighted average life of approximately two years.
Revenue is generally recognized FCA, payment made at the origination point at our facility, and title passes as the product is loaded into railcars hired by the customer or provided by us. Certain contracted and spot-rate customers have shipping terms of FCA, DAT or DAP, payment made at the destination, for which we recognize revenue when the sand is delivered.
Costs of Conducting Our Business
The principal direct costs involved in operating our business are labor, maintenance, utility costs, equipment and excavation. We incur labor costs associated with employees at our processing facility represent the most significant cost of converting raw frac sand to finished product. Our Oakdale facility undergoes maintenance to minimize unscheduled downtime and ensure the ongoing quality of our raw frac sand. We incur utility costs in connection with the operation of our processing facility, primarily electricity and natural gas, which are both susceptible to market fluctuations. We lease equipment in many areas of our operations including our plants, mining equipment and logistics services. Excavation costs with respect to the excavation of sand and other materials from which we ultimately do not derive revenue. However, the ratio of rejected
43
materials to total amounts excavated has been, and we believe will continue to be, in line with our expectations, given the extensive core sampling and other testing we undertook at the Oakdale facility. In addition, other costs include processing costs, overhead allocation, depreciation and depletion are capitalized as a component of inventory and are reflected in cost of goods sold when inventory is sold.
Overall Trends and Outlook
Demand Trends
According to Spears, the North American proppant market, including raw frac sand, ceramic and resin-coated proppant, was approximately 98 million tons in 2018, which is a 33% increase over the 74 million tons Spears reported for 2017. Spears estimates that 2019 demand will increase 4% and 2020 demand will increase another 14%, representing an increase of approximately 25 million tons in proppant demand over the next two years.
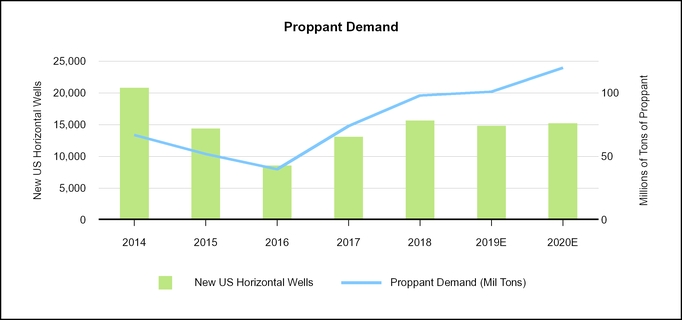
|
2014
|
2015
|
2016
|
2017
|
2018
|
2019E
|
2020E
|
|
|
New US Horizontal Wells
|
20,819
|
14,413
|
8,599
|
13,116
|
15,691
|
14,840
|
15,233
|
|
Proppant Demand (Mil Tons)
|
67
|
52
|
40
|
74
|
98
|
101
|
120
|
Demand growth for raw frac sand and other proppants is primarily driven by advancements in oil and natural gas drilling and well completion technology and techniques, such as horizontal drilling and hydraulic fracturing. These advancements have made the extraction of oil and natural gas increasingly cost-effective in formations that historically would have been uneconomic to develop. More proppant is being used per well, which is driving the increase in proppant demand despite horizontal drilling activity stabilizing. Spears estimates that proppant demand will reach approximately 101 million tons in 2019 and 120 million tons in 2020. Spears also estimates that average proppant usage per well was approximately 5,800 tons per well in 2018 and will rise to approximately 7,400 tons per well by the end of 2020.
Supply Trends
In 2018, significant capacity was added in numerous regions. The total mine capacity outpaced customer demand for raw frac sand leading to an over supplied market which has put pricing pressure on high-quality raw frac sand. Several factors contributing to this supply surplus include over-development of new sand mines in response to the prior year shortage, an increase in the usage of local sand, and logistical challenges on delivering sand in the higher quantities required by the new higher proppant intensity wells.
Supplies of high-quality Northern White raw frac sand are limited to select areas, predominantly in western Wisconsin and limited areas of Minnesota and Illinois. The ability to obtain large contiguous reserves in these areas is a key constraint and can be an important supply consideration when assessing the economic viability of a potential raw frac sand facility. Further constraining the supply and throughput of Northern White raw frac sand is that not all of the large reserve mines have onsite excavation and processing capability. Historically, much of the capital investment in Northern White raw frac sand mines was
44
used to develop coarser deposits in western Wisconsin. As such, we’ve seen competitors in the Northern White frac sand market reduce their capacity by shuttering or idling operations as the shift to finer sands in the liquid and oil plays erodes the ongoing economic viability of producing finer grades of sand.
Management’s Outlook
We generally expect the price of raw frac sand to correlate with the level of drilling activity for oil and natural gas, although the increasing supply of sand could keep the price depressed. The willingness of exploration and production companies to engage in new drilling is determined by a number of factors, the most important of which are the prevailing and projected prices of oil and natural gas, the cost to drill, complete and operate a well, the availability and cost of capital and environmental and government regulations, as well as their ability to acquire the sand at the wellsite. We generally expect the level of drilling to correlate with long-term trends in commodity prices. Similarly, oil and natural gas production levels nationally and regionally generally tend to correlate with drilling activity.
Our sand is sold on a contract basis or through spot market pricing. Our long-term take-or-pay contracts reduce exposure to fluctuations in price and provide predictability of volumes and price over the contract term. By contrast, the spot market provides us with direct access to immediate prices, offering an outlet to sell excess production at opportunistic times or during favorable market conditions, which also comes with accompanying exposure to price volatility and uncertainty.
GAAP Results of Operations
Year Ended
December 31, 2018
compared to the Year Ended
December 31, 2017
:
|
|
Year Ended December 31,
|
Change
|
|||||||||||||
|
|
2018
|
2017
|
Dollars
|
Percentage
|
|||||||||||
|
|
(in thousands, except percentage change)
|
||||||||||||||
|
Revenues
|
$
|
212,470
|
|
$
|
137,212
|
|
$
|
75,258
|
|
55
|
%
|
||||
|
Cost of goods sold
|
144,903
|
|
100,304
|
|
44,599
|
|
44
|
%
|
|||||||
|
Gross profit
|
67,567
|
|
36,908
|
|
30,659
|
|
83
|
%
|
|||||||
|
Operating expenses:
|
|||||||||||||||
|
Salaries, benefits and payroll taxes
|
11,043
|
|
8,219
|
|
2,824
|
|
34
|
%
|
|||||||
|
Depreciation and amortization
|
1,843
|
|
525
|
|
1,318
|
|
251
|
%
|
|||||||
|
Selling, general and administrative
|
12,825
|
|
9,459
|
|
3,366
|
|
36
|
%
|
|||||||
|
Change in estimated fair value of contingent consideration
|
(1,858
|
)
|
—
|
|
(1,858
|
)
|
Not meaningful
|
|
|||||||
|
Impairment of goodwill and indefinite-lived intangible asset
|
17,835
|
|
—
|
|
—
|
|
Not meaningful
|
|
|||||||
|
Total operating expenses
|
41,688
|
|
18,203
|
|
23,485
|
|
129
|
%
|
|||||||
|
Operating income
|
25,879
|
|
18,705
|
|
7,174
|
|
38
|
%
|
|||||||
|
Other income (expenses):
|
|||||||||||||||
|
Interest expense, net
|
(2,266
|
)
|
(450
|
)
|
(1,816
|
)
|
404
|
%
|
|||||||
|
Other income
|
197
|
|
462
|
|
(265
|
)
|
(57
|
)%
|
|||||||
|
Total other income (expenses), net
|
(2,069
|
)
|
12
|
|
(2,081
|
)
|
Not meaningful
|
|
|||||||
|
Income before income tax expense (benefit)
|
23,810
|
|
18,717
|
|
5,093
|
|
27
|
%
|
|||||||
|
Income tax expense (benefit)
|
5,122
|
|
(2,809
|
)
|
7,931
|
|
(282
|
)%
|
|||||||
|
Net income
|
$
|
18,688
|
|
$
|
21,526
|
|
$
|
(2,838
|
)
|
(13
|
)%
|
||||
Revenue
Revenue was
$212.5 million
(
$70.94
per ton) for the year ended
December 31, 2018
, during which we sold approximately
2,995,000
tons of sand. Revenue for the year ended
December 31, 2017
was
$137.2 million
(
$56.03
per ton), during which we sold approximately
2,449,000
tons of sand. Revenues increased for the year ended
December 31, 2018
as compared to the year ended
December 31, 2017
as a result of higher sales volumes and higher average selling prices.
The key factors contributing to the increase in revenues for the year ended
December 31, 2018
as compared to the year ended
December 31, 2017
were as follows:
45
|
•
|
Sand sales revenue increased to
$143.1 million
for the year ended
December 31, 2018
compared to
$80.2 million
for the year ended
December 31, 2017
due to increased sales volumes and higher average selling prices. Tons sold increased by
22.3%
resulting from increased exploration and production activity in the oil and natural gas industry in
2018
compared to
2017
.
|
|
•
|
Average selling price per ton increased to
$47.76
for the year ended
December 31, 2018
from
$32.74
for the year ended
December 31, 2017
due to increased volumes and higher average selling prices related to increased in-basin sand sales volumes, which are sold at a higher price than sand sold at the mine gate and favorable price adjustments under certain of our take-or-pay contracts based upon the Average Cushing Oklahoma WTI Spot Prices.
|
|
•
|
We had
$6.0 million
in contractual shortfall revenue for the year ended
December 31, 2018
and
$1.2 million
for the year ended
December 31, 2017
, respectively. Our customer contracts dictate whether customers are invoiced quarterly or at the end of their respective contract year for shortfall payments. We recognize revenue to the extent of the unfulfilled minimum contracted quantity at the shortfall price per ton as stated in the contract once payment is received or reasonably assured.
|
|
•
|
Transportation revenue, which includes freight for certain mine gate sand sales and railcar usage, increased approximately
$7.1 million
for the year ended
December 31, 2018
when compared to the year ended
December 31, 2017
, increasing from
$55.8 million
to
$62.9 million
. The increase in transportation revenue was due to the increased sales volumes in
2018
compared to
2017
as a result of increased exploration and production activity in the oil and natural gas industry as well as our increased in-basin sales activity generated from our Van Hook terminal which began operations in April 2018.
|
Cost of Goods Sold
Cost of goods sold was
$144.9 million
and
$100.3 million
, or
$48.38
and
$40.96
per ton sold, for the years ended
December 31, 2018
and
2017
, respectively. Cost of goods sold and per ton cost of goods sold increased in
2018
compared to
2017
due to higher sales volumes, which led to increased staffing, utilities and equipment expenses, and increased freight charges. Freight charges, which consist of transportation costs and railcar rental and storage expense, were
$84.4 million
and
$59.7 million
for the years ended
December 31, 2018
and
2017
, respectively. The
$24.7 million
increase in freight costs was due primarily to increased tons sold and increased in-basin activities. Additionally, we incurred
$20.9 million
and
$9.3 million
of operating labor costs for the years ended
December 31, 2018
and
2017
, respectively. The
$11.6 million
increase in labor costs was due primarily to additional contract staffing to support the expansion of the Oakdale facility. Depreciation, depletion and accretion included in cost of goods sold were
$16.3 million
and
$7.3 million
for the years ended
December 31, 2018
and
2017
, respectively.
Gross Profit
Gross profit was
$67.6 million
and
$36.9 million
for the years ended
December 31, 2018
and
2017
, respectively. The increase in gross profit for the year ended
December 31, 2018
was primarily due to higher sales volumes, including in-basin and spot sales, and higher average selling prices, partially offset by increased staffing, utilities and equipment expenses, along with increased transportation charges.
Operating Expenses
Operating expenses were
$41.7 million
and
$18.2 million
for the years ended
December 31, 2018
and
2017
, respectively. Operating expenses are primarily comprised of wages and benefits, professional services fees and other administrative expenses. An impairment charge of
$17.8
related to goodwill and an other indefinite-lived intangible asset was recorded in the fourth quarter of
2018
. The impairment charge relates primarily to the decline in our stock price in
2018
and the relationship between the resulting market capitalization and the equity recorded on our balance sheet. Additionally, salaries, benefits and payroll taxes were
$11.0 million
and
$8.2 million
for the years ended
December 31, 2018
and
2017
, respectively. The approximate
$2.8 million
increase was primarily due to additional headcount in
2018
as compared to
2017
. Selling, general and administrative expenses increased from
$9.5 million
for the year ended
December 31, 2017
to
$12.8 million
for the year ended
December 31, 2018
, primarily as a result of well-site storage solution acquisition-related costs and royalty payments relating to our Texas land leases. We recorded a decrease in the estimated fair value of contingent consideration, which resulted in an offset to operating expenses in the amount of
$1.9 million
for the year ended
December 31, 2018
, for our acquisition of Quickthree.
46
Other Income (Expense)
We incurred
$2.3 million
and
$0.5 million
of net interest expense for the years ended
December 31, 2018
and
2017
, respectively. The increase in interest expense for the year ended
December 31, 2018
was primarily due to borrowings under the Credit Facility to fund acquisition activity. Interest expense in 2017 was derived primarily from deferred finance fees and unused line fees for the Credit Facility.
Income Tax Expense (Benefit)
Income tax expense was
$5.1 million
for the year ended
December 31, 2018
compared to a benefit of
$2.8 million
for the year ended
December 31, 2017
. We recorded a tax benefit of approximately $8.5 million due to a re-measurement of deferred tax assets and liabilities in the fourth quarter of 2017, as a result of the Tax Reform Act that was enacted on December 22, 2017. For the years ended
December 31, 2018
and
2017
, our effective tax rate was approximately
21.5%
and
(15.0)%
, respectively, based on the statutory federal rate net of discrete federal and state taxes. Our effective tax rate for the year ended
December 31, 2018
benefited from the decrease in the U.S. statutory tax rate from
35.0%
in 2017 to
21.0%
in 2018. The computation of the effective tax rate for the year ended
December 31, 2018
included modifications for income tax credits, among other items. The computation for the year ended
December 31, 2017
also included a benefit related to share-based compensation and the domestic production activities deduction (“DPAD”). The DPAD was repealed for tax years beginning after January 1, 2018 under the Tax Reform Act. The computation for
2017
also included the impact of depletion method change for tax purposes on our prior year returns.
The Tax Reform Act significantly revised the U.S. corporate income tax regime by, among other things, lowering the U.S. corporate tax rate from 35% to 21% effective January 1, 2018, repealing the deduction for domestic production activities and implementing 100% direct expensing of certain non-residential property. U.S. GAAP requires that the impact of tax legislation be recognized in the period in which the law was enacted.
For the year of 2018, we recorded a net operating loss for tax purposes due to the significant amount of capital expenditures, which are eligible for 100% expensing available under the Tax Reform Act. There are additional provisions in the Tax Reform Act that could impact us that will continue to be monitored as additional guidance is released and any necessary adjustments will be recorded in the period that the guidance is released.
Net Income
Net income was
$18.7 million
for year ended
December 31, 2018
compared to
$21.5 million
for the year ended
December 31, 2017
. The decrease in net income was primarily due to an impairment charge of
$17.8 million
related to goodwill and an other indefinite-lived intangible asset was recorded in the fourth quarter of
2018
. The impairment charge relates primarily to the decline in our stock price in
2018
and the relationship between the resulting market capitalization and the equity recorded on our balance sheet. Increased sales volumes during
2018
and favorable pricing trends in the first half of the year led to higher gross profit which partially offset the impairment charge.
47
Year Ended
December 31, 2017
Compared to the Year Ended
December 31, 2016
:
|
|
Year Ended December 31,
|
Change
|
||||||||||||
|
|
2017
|
2016
|
Dollars
|
Percentage
|
||||||||||
|
|
(in thousands, except percentage change)
|
|||||||||||||
|
Revenues
|
$
|
137,212
|
|
$
|
59,231
|
|
$
|
77,981
|
|
132
|
%
|
|||
|
Cost of goods sold
|
100,304
|
|
26,569
|
|
73,735
|
|
278
|
%
|
||||||
|
Gross profit
|
36,908
|
|
32,662
|
|
4,246
|
|
13
|
%
|
||||||
|
Operating expenses:
|
||||||||||||||
|
Salaries, benefits and payroll taxes
|
8,219
|
|
7,385
|
|
834
|
|
11
|
%
|
||||||
|
Depreciation and amortization
|
525
|
|
384
|
|
141
|
|
37
|
%
|
||||||
|
Selling, general and administrative
|
9,459
|
|
4,502
|
|
4,957
|
|
110
|
%
|
||||||
|
Total operating expenses
|
18,203
|
|
12,271
|
|
5,932
|
|
48
|
%
|
||||||
|
Operating income
|
18,705
|
|
20,391
|
|
(1,686
|
)
|
(8
|
)%
|
||||||
|
Other income (expenses):
|
||||||||||||||
|
Preferred stock interest expense
|
—
|
|
(5,565
|
)
|
5,565
|
|
(100
|
)%
|
||||||
|
Interest expense, net
|
(450
|
)
|
(2,862
|
)
|
2,412
|
|
(84
|
)%
|
||||||
|
Other income
|
462
|
|
8,860
|
|
(8,398
|
)
|
(95
|
)%
|
||||||
|
Total other income (expenses), net
|
12
|
|
433
|
|
(421
|
)
|
(97
|
)%
|
||||||
|
Loss on extinguishment of debt
|
—
|
|
(1,051
|
)
|
1,051
|
|
(100
|
)%
|
||||||
|
Income before income tax (benefit) expense
|
18,717
|
|
19,773
|
|
(1,056
|
)
|
(5
|
)%
|
||||||
|
Income tax (benefit) expense
|
(2,809
|
)
|
9,394
|
|
(12,203
|
)
|
(130
|
)%
|
||||||
|
Net income
|
$
|
21,526
|
|
$
|
10,379
|
|
$
|
11,147
|
|
107
|
%
|
|||
Revenue
Revenue was
$137.2 million
for the year ended
December 31, 2017
, during which we sold approximately
2,449,000
tons of sand. Revenue for the year ended
December 31, 2016
was
$59.2 million
, during which we sold approximately
826,000
tons of sand. The increase in revenue is primarily attributable to improved market conditions and higher sales volumes (including spot sales) in
2017
, partially offset by lower average selling prices due to reservation revenue being spread over a larger amount of contractual volumes sold in
2017
compared to
2016
.
The key factors contributing to the increase in revenues and decrease in average revenue per ton for the year ended
December 31, 2017
as compared to the year ended
December 31, 2016
were as follows:
|
•
|
Sand sales revenue increased to
$80.2 million
for the year ended
December 31, 2017
compared to
$31.6 million
for the year ended
December 31, 2016
. Tons sold increased by
196%
as exploration and production activity in the oil and natural gas industry improved in
2017
compared to
2016
.
|
|
•
|
Average selling price per ton, which includes reservation charges, decreased to
$32.74
for the year ended
December 31, 2017
from
$38.28
for the year ended
December 31, 2016
due to increased volumes, which led to reservation charges being allocated to a greater number of tons sold; and
|
|
•
|
Reservation and contractual shortfall revenues were
$30.0 million
and
$1.2 million
, respectively, for the year ended
December 31, 2017
. Shortfall revenues for the year ended
December 31, 2017
resulted from
two
customers that were unable to meet the take-or-pay requirements for their respective contract year. Reservation and contractual shortfall revenues were
$15.0 million
and
$20.9 million
, respectively, for the year ended
December 31, 2016
. Shortfall revenues for the year ended
December 31, 2016
resulted from
three
customers that were unable to meet the take-or-pay requirements for their respective contract year. Certain customers were required to pay a fixed-price monthly reservation charge based on a minimum contractual volume over the remaining life of their contract, which are then credited against any applicable shortfall payments. With respect to shortfall revenues, our customer contracts dictated whether customers were invoiced quarterly or at the end of their respective contract year for shortfall payments. We recognized revenue to the extent of the unfulfilled minimum contracted quantity at the shortfall price per ton as stated in the contract once payment was received or was reasonably assured.
|
|
•
|
Transportation revenue, which included railcar rental, was approximately
$49.1 million
higher for the year ended
December 31, 2017
compared to the year ended
December 31, 2016
increasing from
$6.7 million
to
$55.8 million
|
48
due to higher freight pass-through charges billed to our customers. Railcar rental revenue was
$7.7 million
for the year ended
December 31, 2017
, increasing by approximately
$2.0 million
compared to the year ended
December 31, 2016
due to an increase in the number of railcars rented to our customers under long-term contracts.
Cost of Goods Sold
Cost of goods sold was
$100.3 million
and
$26.6 million
, or
$40.96
and
$32.30
per ton sold, for the years ended
December 31, 2017
and
2016
, respectively. Cost of goods sold and per ton cost of goods sold increased in
2017
compared to
2016
due to higher sales volumes, which led to increased staffing, utilities and equipment expenses, and increased freight charges. Freight charges, which consist of transportation costs and railcar rental and storage expense, were
$59.7 million
and
$7.9 million
for the years ended
December 31, 2017
and
2016
, respectively. The
$50.0 million
increase in freight costs was due primarily to increased tons sold and increased in-basin activities and customer sales with pass-through freight. Additionally, we incurred
$9.3 million
and
$5.2 million
of operating labor costs for the years ended
December 31, 2017
and
2016
, respectively. The
$4.1 million
increase in labor costs was due to additional staffing to support the expansion of the Oakdale facility and its operations. Depreciation, depletion and accretion included in cost of goods sold account for
$7.3 million
and
$6.1 million
for the years ended
December 31, 2017
and
2016
, respectively.
Gross Profit
Gross profit was
$36.9 million
and
$32.7 million
for the years ended
December 31, 2017
and
2016
, respectively. The increase in gross profit was primarily due to increased sales volumes and higher reservation revenue as compared to the prior year, partially offset by higher cost of goods sold and lower shortfall revenue.
Operating Expenses
Operating expenses were
$18.2 million
and
$12.3 million
for the years ended
December 31, 2017
and
2016
, respectively. Operating expenses are primarily comprised of wages and benefits, professional services fees and other administrative expenses. Salaries, benefits and payroll taxes were
$8.2 million
and
$7.4 million
for the years ended
December 31, 2017
and
2016
, respectively. The approximate
$0.8 million
increase was primarily due to additional employee headcount and stock compensation grants in
2017
compared to
2016
. Selling, general and administrative expenses increased by
$5.0 million
in
2017
compared to
2016
as a result of additional insurance, consulting and legal costs incurred as a publicly traded corporation as well as increased development activity.
Other Income (Expense)
Interest on the Series A Preferred Stock accounted for
$5.6 million
for the year ended
December 31, 2016
. The paid-in-kind interest was added to the outstanding balance of the Preferred Stock. On November 9, 2016, the Series A Preferred Stock was fully redeemed and our former revolving credit facility was paid in full and terminated using a portion of the proceeds from IPO. We incurred
$0.5 million
and
$2.9 million
of interest expense during the years ended
December 31, 2017
and
2016
, respectively. Interest expense in
2017
was derived primarily from deferred finance fees and unused line fees for our Credit Facility. Interest expense in
2016
was derived primarily from interest on our former revolving credit facility. Additional items included in interest expense included the accretion of common stock issued and transaction costs incurred in conjunction with the September 2011 Securities Purchase Agreement, deferred financing fees, and interest incurred on capital leases. No borrowings were drawn against our Credit Facility in
2017
. Other income was
$0.5 million
and
$8.9 million
for the years ended
December 31, 2017
and
2016
, respectively. In
2017
, we recognized other income of approximately $1.9 million related to the settlement of our unsecured bankruptcy claim with a former customer and $6.6 million related to the sale of our unsecured bankruptcy claim with the same customer.
Income Tax (Benefit) Expense
Income tax benefit was
$2.8 million
for the year ended
December 31, 2017
compared to income tax expense of
$9.4 million
for the year ended
December 31, 2016
. For the year ended
December 31, 2017
, our statutory tax rate and effective tax rate were approximately
35.0%
and
(15.0)%
, respectively. For the year ended
December 31, 2016
, our statutory tax rate and effective tax rate were approximately
35.0%
and
48.0%
, respectively. The difference in these tax rates for both
2017
and
2016
was primarily due to state income tax, non-deductible interest expense on the Preferred Stock costs associated with our initial public offering process. The computation of the 2017 effective tax rate includes modifications for share-based compensation, domestic manufacturing deduction, and state income tax credit among others. The computation for 2017 included the impact of depletion method change for tax purposes on our prior year returns. The effective rate was also impacted by tax reform signed into law in 2017, as indicated below. The computation for 2016 also included modifications for non-deductible interest expense on the Series A Preferred Stock. The primary drivers of the difference between the effective rates in 2017 and 2016 was the full
49
redemption of the Series A Preferred Stock in November 2016, the method of calculating depletion for tax purposes and tax reform.
As a result of the Tax Reform Act, enacted on December 22, 2017, we recorded a tax benefit of approximately $8.5 million for the year ended
December 31, 2017
due to a re-measurement of deferred tax assets and liabilities. There are additional provisions in the Tax Reform Act that could impact us that will continue to be monitored as additional guidance is released. The tax benefit represents provisional amounts and our current best estimates.
Net Income
Net income was
$21.5 million
for year ended
December 31, 2017
compared to
$10.4 million
for the year ended
December 31, 2016
. The increase in net income was primarily due to higher volumes sold and higher reservation revenue, offset by lower shortfall revenue, increased salaries and employee headcount, and additional costs incurred as a result of being publicly traded corporation. Additionally, net income was positively impacted by lower interest expense due to the full redemption of Series A Preferred Stock in November 2016, no debt outstanding on our Credit Facility and the income tax benefit recognized as a result of the Tax Reform Act.
Non-GAAP Financial Measures
EBITDA, Adjusted EBITDA and contribution margin are not financial measures presented in accordance with GAAP. We believe that the presentation of these non-GAAP financial measures will provide useful information to investors in assessing our financial condition and results of operations. Net income is the GAAP measure most directly comparable to EBITDA and Adjusted EBITDA and gross profit is the GAAP measure most directly comparable to contribution margin. Our non-GAAP financial measures should not be considered as alternatives to the most directly comparable GAAP financial measures. Each of these non-GAAP financial measures has important limitations as analytical tools because they exclude some but not all items that affect the most directly comparable GAAP financial measures. You should not consider EBITDA, Adjusted EBITDA or contribution margin in isolation or as substitutes for an analysis of our results as reported under GAAP. Because EBITDA, Adjusted EBITDA and contribution margin may be defined differently by other companies in our industry, our definitions of these non-GAAP financial measures may not be comparable to similarly titled measures of other companies, thereby diminishing their utility.
EBITDA and Adjusted EBITDA
We define EBITDA as net income, plus: (i) depreciation, depletion and amortization expense; (ii) income tax expense (benefit); (iii) interest expense; and (iv) franchise taxes. We define Adjusted EBITDA as EBITDA, plus: (i) gain or loss on sale of fixed assets or discontinued operations; (ii) integration and transition costs associated with specified transactions; (iii) equity compensation; (iv) acquisition and development costs; (v) non-recurring cash charges related to restructuring, retention and other similar actions; (vi) earn-out, contingent consideration obligations and other acquisition and development costs; and (vii) non-cash charges and unusual or non-recurring charges. Adjusted EBITDA is used as a supplemental financial measure by management and by external users of our financial statements, such as investors and commercial banks, to assess:
|
•
|
the financial performance of our assets without regard to the impact of financing methods, capital structure or historical cost basis of our assets;
|
|
•
|
the viability of capital expenditure projects and the overall rates of return on alternative investment opportunities;
|
|
•
|
our ability to incur and service debt and fund capital expenditures;
|
|
•
|
our operating performance as compared to those of other companies in our industry without regard to the impact of financing methods or capital structure; and
|
|
•
|
our debt covenant compliance, as Adjusted EBITDA is a key component of critical covenants to the Credit Facility.
|
We believe that our presentation of EBITDA and Adjusted EBITDA will provide useful information to investors in assessing our financial condition and results of operations. Net income is the GAAP measure most directly comparable to EBITDA and Adjusted EBITDA. EBITDA and Adjusted EBITDA should not be considered alternatives to net income presented in accordance with GAAP. Because EBITDA and Adjusted EBITDA may be defined differently by other companies in our industry, our definitions of EBITDA and Adjusted EBITDA may not be comparable to similarly titled measures of other companies, thereby diminishing their utility. The following table presents a reconciliation of EBITDA and Adjusted EBITDA to net income for each of the periods indicated.
50
|
|
Year Ended December 31,
|
||||||||||
|
|
2018
|
2017
|
2016
|
||||||||
|
|
(in thousands)
|
||||||||||
|
Net income
|
$
|
18,688
|
|
$
|
21,526
|
|
$
|
10,379
|
|
||
|
Depreciation, depletion and amortization
|
18,165
|
|
7,300
|
|
6,445
|
|
|||||
|
Income tax expense (benefit)
|
5,122
|
|
(2,809
|
)
|
9,394
|
|
|||||
|
Interest expense
|
2,320
|
|
700
|
|
8,436
|
|
|||||
|
Franchise taxes
|
442
|
|
339
|
|
21
|
|
|||||
|
EBITDA
|
$
|
44,737
|
|
$
|
27,056
|
|
$
|
34,675
|
|
||
|
Loss (gain) on sale of fixed assets
|
321
|
|
253
|
|
(59
|
)
|
|||||
|
Integration and transition costs
|
—
|
|
16
|
|
—
|
|
|||||
|
Initial public offering related costs
(1)
|
—
|
|
—
|
|
725
|
|
|||||
|
Equity compensation
(2)
|
2,670
|
|
1,652
|
|
1,426
|
|
|||||
|
Acquisition and development costs
(3)
|
(218
|
)
|
845
|
|
—
|
|
|||||
|
Non-cash impairment of goodwill and other intangible asset
(4)
|
17,835
|
|
—
|
|
—
|
|
|||||
|
Cash charges related to retention and employee relocation
|
674
|
|
279
|
|
—
|
|
|||||
|
Accretion of asset retirement obligations
|
(26
|
)
|
514
|
|
21
|
|
|||||
|
Loss on extinguishment of debt
|
—
|
|
—
|
|
1,051
|
|
|||||
|
Adjusted EBITDA
|
$
|
65,993
|
|
$
|
30,615
|
|
$
|
37,839
|
|
||
(1) For the year ended
December 31, 2016
, represents IPO-related bonuses.
|
(2)
|
Represents the non-cash expenses for stock-based awards issued to our employees and employee stock purchase plan compensation expense.
|
|
(3)
|
Represents costs incurred related to the business combinations and current development project activities. The year ended
December 31, 2018
includes
$1,858
decrease in the estimated fair value of our contingent consideration related to the acquisition of Quickthree, partially offset by $1,146 of costs related to the acquisition of Quickthree and $494 related to development project activities. The year ended
December 31, 2017
includes costs related to development project activities.
|
|
(4)
|
An impairment charge of
$17,835
related to goodwill and other indefinite-lived intangible asset was recorded in the fourth quarter of
2018
. The impairment charge relates primarily to the decline in our stock price in 2018 and the relationship between the resulting market capitalization and the equity recorded on our balance sheet.
|
_________________________
Adjusted EBITDA was
$66.0 million
for the year ended
December 31, 2018
compared to
$30.6 million
for the year ended
December 31, 2017
. The increase in Adjusted EBITDA for the year ended
December 31, 2018
, as compared to the prior year, was primarily due to higher sales volumes, including in-basin sales, and higher average selling prices, partially offset by increased staffing, utilities and equipment expenses, along with increased transportation charges.
Adjusted EBITDA was
$30.6 million
for the year ended
December 31, 2017
compared to
$37.8 million
for the year ended
December 31, 2016
. The decrease in Adjusted EBITDA for the year ended
December 31, 2017
, as compared to
2016
, resulted from decreased shortfall revenue and increased cost of goods sold due to higher sales volumes and the increased in-basin activities from customer sales with pass-through freight and the additional staffing to support the expansion of the Oakdale facility.
Contribution Margin
We also use contribution margin, which we define as total revenues less costs of goods sold excluding depreciation, depletion and accretion of asset retirement obligations, to measure our financial and operating performance. Contribution margin excludes other operating expenses and income, including costs not directly associated with the operations of our business such as accounting, human resources, information technology, legal, sales and other administrative activities.
Historically, we have reported production costs and production cost per ton as non-GAAP financial measures. As we expand our logistics activities and continue to sell sand closer to the wellhead, our sand production costs will only be a portion of our overall cost structure.
We believe that a transition to reporting contribution margin and contribution margin per ton sold will provide a better performance metric to management and external users of our financial statements, such as investors and commercial banks, because these metrics provide an operating and financial measure of our ability, as a combined business, to generate margin in excess of our operating cost base. As such, we believe that it is no longer relevant to report production costs or production costs per ton on a standalone basis.
51
Gross profit is the GAAP measure most directly comparable to contribution margin. Contribution margin should not be considered an alternative to gross profit presented in accordance with GAAP. Because contribution margin may be defined differently by other companies in our industry, our definition of contribution margin may not be comparable to similarly titled measures of other companies, thereby diminishing its utility. The following table presents a reconciliation of contribution margin to gross profit.
|
|
Year Ended December 31,
|
||||||||||
|
|
2018
|
2017
|
2016
|
||||||||
|
(in thousands)
|
|||||||||||
|
Revenue
|
$
|
212,470
|
|
$
|
137,212
|
|
$
|
59,231
|
|
||
|
Cost of goods sold
|
144,903
|
|
100,304
|
|
26,569
|
|
|||||
|
Gross profit
|
67,567
|
|
36,908
|
|
32,662
|
|
|||||
|
Depreciation, depletion, and accretion of asset retirement obligations included in cost of goods sold
|
16,297
|
|
7,289
|
|
6,076
|
|
|||||
|
Contribution margin
|
$
|
83,864
|
|
$
|
44,197
|
|
$
|
38,738
|
|
||
|
Contribution margin per ton
|
$
|
28.00
|
|
$
|
18.05
|
|
$
|
46.90
|
|
||
|
Total tons sold
|
2,995
|
|
2,449
|
|
826
|
|
|||||
Contribution margin was
$83.9 million
, or
$28.00
per ton sold, for the year ended
December 31, 2018
, compared to
$44.2 million
, or
$18.05
per ton sold, for the year ended
December 31, 2017
. The increase in contribution margin and contribution margin per ton sold for the year ended
December 31, 2018
, as compared to the prior year, was primarily due to the increased sales volumes overall as well as increased in-basin sales volumes through our Van Hook terminal, which began operations in April 2018, coupled with favorable pricing trends in the first half of
2018
. These positive sales volumes and pricing trends in the first half of 2018 more than compensated for reduced demand and pricing in the second half of 2018.
Contribution margin was
$44.2 million
, or
$18.05
per ton sold, for the year ended
December 31, 2017
compared to
$38.7 million
, or
$46.90
per ton sold, for the year ended
December 31, 2016
. The decrease in contribution margin per ton in
2017
was primarily due to significantly increased sales volumes and increased cost of goods sold with the inclusion of pass-through freight from customers with increased in-basin activities and additional staffing to support the expansion of the Oakdale facility.
Liquidity and Capital Resources
Currently, our primary source of liquidity is cash flow generated from operations and borrowings under our Credit Facility. Based on our balance sheet, cash flows, current market conditions and information available to us at this time, we believe that we have sufficient liquidity, which includes our Credit Facility and other available capital resources, to meet our cash needs for the next twelve months, including investing in our wellsite proppant storage solutions and other capital projects, while rightsizing our labor and equipment costs. Going forward, we expect our primary sources of liquidity to be cash flow generated from operations and borrowings under our Credit Facility.
On November 9, 2016, we consummated the IPO of
11.7 million
shares of common stock at a price of
$11.00
per share, generating net proceeds to us of
$128.7 million
before underwriting discounts and expenses. We used a portion of the net proceeds from the IPO to redeem all of our outstanding Series A Preferred Stock and to repay the outstanding indebtedness under our former revolving credit facility, which was terminated. We used the remaining net proceeds for general corporate purposes.
On February 1, 2017, we consummated a follow-on offering and sale of
1.5 million
shares of common stock at a price of
$17.50
per share, generating net proceeds to us of
$24.3 million
before underwriting discounts and expenses. We used the proceeds from this offering for capital projects and general corporate services.
52
Working Capital
Working capital is a measure of our ability to pay our liabilities as they become due. The following table presents the components of our working capital as of
December 31, 2018
compared to
December 31, 2017
.
|
|
Year Ended December 31,
|
||||||
|
|
2018
|
2017
|
|||||
|
|
(in thousands)
|
||||||
|
Total current assets
|
$
|
50,096
|
|
$
|
73,177
|
|
|
|
Total current liabilities
|
24,652
|
|
34,559
|
|
|||
|
Working capital
|
$
|
25,444
|
|
$
|
38,618
|
|
|
Our working capital was
$25.4 million
at
December 31, 2018
compared to working capital of
$38.6 million
at
December 31, 2017
. In 2018 our shortfall revenue increased near year-end, which resulted in increased accounts receivable and unbilled receivables. We also used existing cash on hand and proceeds from our Credit Facility to substantially complete the Oakdale expansion and to acquire Quickthree and the assets at the Van Hook terminal. In 2017, we closed on an equity offering of
1.5 million
shares of our common stock, generating net proceeds of approximately $24.2 million.
We believe we have sufficient liquidity to fund operations and capital projects for at least the next twelve months.
Liquidity
The following table sets forth a summary of our cash flows for the periods indicated:
|
|
Year Ended December 31,
|
||||||||||
|
|
2018
|
2017
|
2016
|
||||||||
|
|
(in thousands)
|
||||||||||
|
Net cash provided by operating activities
|
$
|
50,909
|
|
$
|
15,628
|
|
$
|
26,703
|
|
||
|
Net cash used in investing activities
|
$
|
(125,989
|
)
|
$
|
(51,148
|
)
|
$
|
(2,470
|
)
|
||
|
Net cash provided by financing activities
|
$
|
41,319
|
|
$
|
23,213
|
|
$
|
19,405
|
|
||
Net Cash Provided by Operating Activities
Net cash provided by operating activities was
$50.9 million
and
$15.6 million
for the years ended
December 31, 2018
and
2017
, respectively. Operating cash flows include net income of
$18.7 million
and $21.5 million in net earnings generated from the sale of frac sand to our customers in the years ended
December 31, 2018
and
2017
, respectively, partially offset by higher cost of production, general and administrative expenses and interest, adjusted for changes in working capital.
Net cash provided by operating activities was
$15.6 million
and
$26.7 million
for the years ended
December 31, 2017
and
2016
, respectively. Operating cash flows include net income of $21.5 million and $10.4 million in net earnings generated from the sale of frac sand to our customers in the years ended December 31, 2017 and 2016, respectively, partially offset by higher cost of production, general and administrative expenses and cash interest expense, adjusted for changes in working capital.
Net Cash Used In Investing Activities
Net cash used in investing activities was
$126.0 million
for the year ended
December 31, 2018
compared with
$51.1 million
for the year ended
December 31, 2017
. The
$74.9 million
increase was primarily the result of our acquisitions of the Van Hook terminal, Quickthree, and capital expenditures related to the completion of the Oakdale expansion project which began in 2017.
Net cash used in investing activities was
$51.1 million
for the year ended
December 31, 2017
compared with
$2.5 million
for the year ended
December 31, 2016
. The
$48.6 million
increase was primarily the result of an increase in capital expenditures related primarily to the expansion of our processing facilities in Oakdale, Wisconsin.
53
Net Cash Provided by Financing Activities
Net cash provided by financing activities was
$41.3 million
for the year ended
December 31, 2018
, which was primarily related to net draws on our Credit Facility of
$44.5 million
partially offset by repurchases of our common shares of
$2.2 million
and repayments of notes payable of
$0.6 million
.
Net cash provided by financing activities was
$23.2 million
for the year ended
December 31, 2017
, which included net proceeds from equity issuance of $24.2 million. Net cash provided by financing activities was $19.4 million for the year ended
December 31, 2016
, which included net proceeds from equity issuance of $127.3 million, offset by net repayments of $64.2 million under our former revolving credit facility and $40.3 million of Series A Preferred Stock.
Indebtedness
Credit Facility
We have total borrowing capacity of $60.0 million on our Credit Facility. Substantially all of our assets are pledged as collateral. In February 2019, we entered into an agreement with the existing lenders on our Credit Facility to, among other things, extend the maturity date of the Credit Facility to June 30, 2020 and also to reduce the total capacity to $50.0 million by December 31, 2019. As of
December 31, 2018
, we had $15.5 million in total undrawn availability under the Credit Facility.
The Credit Facility contains various reporting requirements, negative covenants and restrictive provisions and requires maintenance of financial covenants, including a fixed charge coverage ratio and a leverage ratio (each as defined in the Credit Agreement). As of
December 31, 2018
and
2017
, we were in compliance with all covenants.
Notes Payable
We have entered into various financing arrangements to support the manufacturing of our wellsite proppant storage solutions equipment with interest rates between 6.48% and 7.49%. Title to the equipment is held by the financial institutions as collateral, though the equipment is included in the Company’s property plant and equipment.
Capital Leases
We have entered into various financing arrangements to finance equipment used in the operations of our business with interest rates between
6.80%
-
7.10%
. Equipment with a cost of
$657
and
$1,484
has been capitalized and included in the Company’s property, plant and equipment as of
December 31, 2018
and
2017
, respectively.
Capital Requirements
The Company estimates that full year 2019 capital expenditures will be approximately $30 million to $40 million, excluding any additional acquisitions.
Share Repurchases
The Company is authorized to repurchase shares through open market purchases at prevailing market prices or through privately negotiated transactions as permitted by securities laws and other legal requirements. On November 8, 2018, the Company announced that the board of directors had approved the Company to repurchase up to 2,000,000 shares of the Company’s common stock during the twelve-month period following the announcement of the share repurchase program. At December 31, 2018, the maximum number of shares that the Company may repurchase under the current repurchase authority was 1,411,800 shares.
The following table presents specified information about the Company’s repurchases of ordinary shares for the year ended December 31, 2018:
|
Year Ended
|
|||
|
December 31, 2018
|
|||
|
Shares repurchased
|
588,200
|
|
|
|
Average price per share
|
$3.37
|
|
|
|
Aggregate repurchase cost (including broker costs)
|
$ 2.0 million
|
|
|
54
The program allows the Company to repurchase shares at its discretion. Market conditions, price, corporate and regulatory requirements, alternative investment opportunities, and other economic conditions will influence the timing of the repurchase and the number of shares repurchased, if any. The program does not obligate the Company to repurchase any specific number of shares and, subject to compliance with applicable securities laws and other legal requirements, may be suspended or terminated at any time without prior notice.
Off-Balance Sheet Arrangements
We had
$8.6 million
of outstanding performance bonds at each of the years ended
December 31, 2018
and
2017
.
Contractual Obligations
The following table presents our contractual obligations as of
December 31, 2018
:
|
Total
|
Less than
1 year
|
1-3
years
|
3-5
years
|
More than
5 years
|
|||||||||||||||
|
|
(in thousands)
|
||||||||||||||||||
|
Capital lease obligations
|
$
|
771
|
|
$
|
131
|
|
$
|
262
|
|
$
|
378
|
|
$
|
—
|
|
||||
|
Notes payable
|
3,830
|
|
739
|
|
1,777
|
|
1,314
|
|
—
|
|
|||||||||
|
Asset retirement obligations
|
13,322
|
|
1,704
|
|
3,327
|
|
—
|
|
8,291
|
|
|||||||||
|
Equipment, railcar and office leases
|
38,837
|
|
15,586
|
|
17,632
|
|
4,744
|
|
875
|
|
|||||||||
|
Land lease obligations
|
42,777
|
|
1,340
|
|
4,730
|
|
4,730
|
|
31,977
|
|
|||||||||
|
Credit Facility
|
44,255
|
|
—
|
|
44,255
|
|
—
|
|
—
|
|
|||||||||
|
Total
|
$
|
143,792
|
|
$
|
19,500
|
|
$
|
71,983
|
|
$
|
11,166
|
|
$
|
41,143
|
|
||||
Environmental Matters
We are subject to various federal, state and local laws and regulations governing, among other things, hazardous materials, air and water emissions, environmental contamination and reclamation and the protection of the environment and natural resources. We have made, and expect to make in the future, expenditures to comply with such laws and regulations, but cannot predict the full amount of such future expenditures.
Seasonality
Our business is affected to some extent by seasonal fluctuations in weather that impact the production levels at our wet processing plant. While our dry plants are able to process finished product volumes evenly throughout the year, our excavation and our wet sand processing activities have historically been limited to primarily non-winter months. As a consequence, we have experienced lower cash operating costs in the first and fourth quarter of each calendar year, and higher cash operating costs in the second and third quarter of each calendar year when we overproduced to meet demand in the winter months. These higher cash operating costs were capitalized into inventory and expensed when these tons are sold, which can lead to us having higher overall cost of production in the first and fourth quarters of each calendar year as we expense inventory costs that were previously capitalized. During the fourth quarter of 2017, we finished construction of a new wet plant, which is an indoor facility that allows us to produce wet sand inventory year-round to support a portion of our dry sand processing capacity, which may reduce certain of the effects of this seasonality. We may also sell raw frac sand for use in oil and natural gas producing basins where severe weather conditions may curtail drilling activities and, as a result, our sales volumes to those areas may be reduced during such severe weather periods.
Customer Concentration
For the year ended
December 31, 2018
, sales to
Liberty
,
EQT
,
WPX Energy
, and
Hess
accounted for
22.8%
,
21.4%
,
11.6%
, and
10.6%
, respectively, of total revenue. For the year ended
December 31, 2017
, sales to
Rice Energy
,
Liberty
,
Weatherford
, and
U.S. Well Services
accounted for
27.1%
,
20.6%
,
13.7%
, and
10.2%
, respectively, of total revenue. For the year ended
December 31, 2016
, sales to
EOG Resources
,
Weatherford
,
US Well Services
, and
C&J Energy Services
accounted for
37.5%
,
25.2%
,
22.4%
, and
10.8%
, respectively, of total revenue.
Critical Accounting Policies and Estimates
The discussion and analysis of our financial condition and results of operations is based on our consolidated financial statements, which have been prepared in accordance with accounting principles generally acceptable in the United States of
55
America. The preparation of these financial statements requires us to make estimates and assumptions that affect the reported amounts of assets and liabilities and the disclosure of contingent assets and liabilities at the dates of the financial statements and the reported revenues and expenses during the reporting periods. We evaluate these estimates and assumptions on an ongoing basis and base our estimates on historical experience, current conditions and various other assumptions that we believe to be reasonable under the circumstances. The results of these estimates form the basis for making judgments about the carrying values of assets and liabilities as well as identifying and assessing the accounting treatment with respect to commitments and contingencies. Our actual results may materially differ from these estimates.
Listed below are the accounting policies we believe are critical to our financial statements due to the degree of uncertainty regarding the estimates or assumptions involved, and that we believe are critical to the understanding of our operations.
Revenue Recognition
On January 1, 2018, we adopted ASC 606, “Revenue from Contracts with Customers” and all the related amendments to ASC 606 in relation to all contracts that were not completed or expired as of January 1, 2018, using the modified retrospective method. There was no adjustment made to the opening balance of retained earnings as a result of applying ASC 606. Results for reporting periods beginning January 1, 2018 are presented under ASC 606, while the comparative information is not restated and will continue to be reported under the accounting standards in effect for those periods. Under ASC 606, revenues are recognized when control of the promised goods or services is transferred to our customers, the amount of which reflects the consideration the Company expects to be entitled to in exchange for those goods or services. Prior to January 1, 2018, we recognized revenue when persuasive evidence of an arrangement exists, delivery of products has occurred, the sales price charged is fixed or determinable, collectability is reasonably assured, and the risk of loss is transferred to the customer.
Under current and former revenue standards, this generally means that sales are FCA, payment made at the origination point at our facility, and title passes as the product is loaded into railcars hired by the customer or provided by us. Deliveries of in-basin sand have shipping terms of FCA or DAT, payment made at the destination; and we recognize this revenue when the sand is received at the destination.
We derive our revenue by mining and processing sand that our customers purchase for various uses. Our revenues are primarily a function of the price per ton realized and the volumes sold. In some instances, our revenues also include transportation costs we charge to our customers, a monthly charge to reserve sand capacity and shortfall payments due from customers for minimum volume commitments. Our transportation revenue fluctuates based on a number of factors, including the volume of product we transport and the distance between our plant and our customers. Our reservation and shortfall revenue fluctuates based on negotiated contract terms.
We sell a limited amount of product under short-term price agreements or at prevailing market rates. The majority of our revenues are realized through long-term take-or-pay contracts. The expiration dates of these contracts range from 2019 through 2022. These agreements define, among other commitments, the volume of product that our customers must purchase, the volume of product that we must provide and the price that we will charge and that our customers will pay for each ton of contracted product. Prices under these agreements are generally indexed to WTI and subject to upward or downward adjustment, based upon: (i) annual percentage price increases; or (ii) market factor increases, including a natural gas surcharge/reduction and a propane surcharge/reduction which are applied if the Average Natural Gas Price or the Average Quarterly Mont Belvieu TX Propane Spot Price, respectively, as listed by the U.S. Energy Information Administration, are above the benchmark set in the contract for the preceding calendar quarter. As a result, our realized prices may not grow at rates consistent with broader industry pricing. For example, during periods of rapid price growth, our realized prices may grow more slowly than those of competitors, and during periods of price decline, our realized prices may outperform industry averages. With respect to the take-or-pay arrangements, if the customer is not allowed to make up deficiencies, we recognize revenues to the extent of the minimum contracted quantity, assuming payment is reasonably assured, based on negotiated contract terms and when rights of use are expired, which is generally either quarterly or at the end of a customer contract year rather than ratably over the respective contract year. If deficiencies can be made up, receipts in excess of actual sales are recognized as deferred revenues until production is actually taken or the right to make up deficiencies expires.
Accounts and Unbilled Receivables
Accounts receivable represents customer transactions that have been invoiced as of the balance sheet date; unbilled receivables represent customer transactions that have not yet been invoiced as of the balance sheet date. Accounts receivable are due within
30 days
, or in accordance with terms agreed upon with customers, and are stated at amounts due from customers net of any allowance for doubtful accounts. We consider accounts outstanding longer than the payment terms past due. We determine the allowance by considering a number of factors, including the length of time trade accounts receivable are past due, previous loss history, the customer’s current ability to pay its obligation, and the condition of the general economy and the
56
industry as a whole. Accounts receivable are written off when they are deemed uncollectible, and payments subsequently received on such receivables are credited to bad debt expense. As of
December 31, 2018
and
2017
, the Company recorded an allowance for doubtful accounts of
$42
and
$0
, respectively. As of
December 31, 2018
and
2017
, the portion of unbilled receivables included in deferred revenue was
$578
and
$0
, respectively.
Asset Retirement Obligation
We estimate the future cost of dismantling, restoring and reclaiming operating excavation sites and related facilities in accordance with federal, state and local regulatory requirements and recognize reclamation obligations when extraction occurs and record them as liabilities at estimated fair value. In addition, a corresponding increase in the carrying amount of the related asset is recorded and depreciated over such asset’s useful life or the estimated number of years of extraction. The reclamation liability is accreted to expense over the estimated productive life of the related asset and is subject to adjustments to reflect changes in value resulting from the passage of time and revisions to the estimates of either the timing or amount of the reclamation costs. Changes in estimates at inactive mines or mining areas are reflected in earnings in the period an estimate is revised. If the asset retirement obligation is settled for more or less than the carrying amount of the liability, a loss or gain will be recognized, respectively.
Inventory Valuation
Sand inventory is stated at the lower of cost or net realizable value using the average cost method. Costs applied to inventory include direct excavation costs, processing costs, overhead allocation, depreciation and depletion. Stockpile tonnages are calculated by measuring the number of tons added and removed from the stockpile. Tonnages are verified periodically by an independent surveyor. Costs are calculated on a per ton basis and are applied to the stockpiles based on the number of tons in the stockpile.
Spare parts inventory includes critical spare parts. We account for spare parts on a first in first out basis, and value the inventory at the lower of cost or net realizable value.
Depletion
We amortize the cost to acquire land and mineral rights using a units-of-production method, based on the total estimated reserves and tonnage extracted each period.
Impairment of Indefinite-Lived and Long-Lived Assets
In applying the acquisition method of accounting for business combinations, amounts assigned to identifiable assets and liabilities acquired were based on estimated fair values as of the date of acquisition, with the remainder recorded as goodwill. Intangible assets are initially valued at fair value using generally accepted valuation methods appropriate for the type of intangible asset. Intangible assets with definite lives are amortized over their estimated useful lives and are reviewed for impairment if indicators of impairment arise. Intangible assets with indefinite lives are tested for impairment annually as of December 31, and whenever indicators of impairment arise. The fair value of the intangible assets is compared with their carrying value and an impairment loss would be recognized for the amount by which the carrying amount exceeds the fair value. Goodwill is tested for impairment annually as of December 31, and whenever indicators of impairment arise.
For the year ended December 31, 2018, we performed both a qualitative and quantitative analysis of its goodwill and the estimated fair value of the Company was in excess of its carrying value. To perform the test, we used valuation techniques to estimate the fair value of the Company as a single reporting unit under the income and market approaches. Under the discounted cash flow method, an income approach, the business enterprise value is determined by discounting to present value the terminal value which is calculated using debt-free after-tax cash flows for a finite period of years. Key estimates in this approach were internal financial projection estimates prepared by management, business risk, and expected rates of return on capital. The guideline company method, a market approach, develops valuation multiples by comparing our reporting units to similar publicly traded companies. Key estimates and selection of valuation multiples rely on the selection of similar companies, obtaining estimates of forecast revenues and EBITDA estimates for the similar companies and selection of valuation multiples as they apply to the reporting unit characteristics. Under the similar transactions method, a market approach, actual transaction prices and operating data from companies deemed reasonably similar to the reporting units is used to develop valuation multiples as an indication of how much a knowledgeable investor in the marketplace would be willing to pay for the Company. Following the fair value determination using the methods above, we conducted an evaluation of our stock price at or near the measurement date and the relationship between the resulting market capitalization and the fair value of the Company.
57
We periodically evaluate whether current events or circumstances indicate that the carrying value of our long-lived assets may not be recoverable. If circumstances indicate that the carrying value may not be recoverable, we estimate future undiscounted net cash (without interest charges), estimated future sales prices (considering historical and current prices, price trends and related factors) and anticipated operating costs and capital expenditures. If the carrying value of our long-lived assets is less than the undiscounted cash flows, the assets are measured at fair value and an impairment is recorded if that fair value is less than the carrying value.
Our estimates of prices, recoverable proven reserves and operating and capital costs are subject to certain risks and uncertainties which may affect the recoverability of our long-lived assets. Although we have made our best estimate of these factors based on current conditions, it is reasonably possible that changes could occur, which could adversely affect our estimate of the net cash flows expected to be generated from our operating property. There were no impairment charges of our long-lived assets during the years ended December 31, 2018, 2017 or 2016. We recorded an impairment charge of $17.8 million related to goodwill and an other indefinite-lived intangible asset for the year ended December 31, 2018. The impairment charge relates primarily to the decline in our stock price in 2018 and the relationship between the resulting market capitalization and the equity recorded on our balance sheet. We did not have goodwill or indefinite-lived intangible assets in 2017 or 2016. There were no impairment charges were recorded during the years ended December 31, 2017 and 2016.
Income Taxes
Under the balance sheet approach to provide for income taxes, we recognize deferred tax assets and liabilities for the expected future tax consequences of net operating loss carryforwards and temporary differences between the carrying amounts and the tax bases of assets and liabilities. In assessing the realizability of deferred tax assets, we consider whether it is more likely than not that some portion or all of the deferred tax assets will not be realized. The ultimate realization of deferred tax assets is dependent upon the generation of future taxable income during the period in which those temporary differences become deductible. If we determine it is more likely than not that we will not be able to realize the benefits of the deductible temporary differences, we record a valuation against the net deferred tax asset.
We recognize the impact of uncertain tax positions at the largest amount that, in our judgment, is more-likely-than-not to be required to be recognized upon examination by a taxing authority.
Stock-Based Compensation
Stock-based compensation expense is recorded based upon the fair value of the award at grant date. Such costs are recognized as expense over the corresponding requisite service period. The fair value of the awards granted was calculated based on a weighted analysis of (i) publicly-traded companies in a similar line of business to us (market comparable method) and (ii) our discounted cash flows. The application of this valuation model involves inputs and assumptions that are judgmental and highly sensitive in the valuation of incentive awards, which affects compensation expense related to these awards. These inputs and assumptions include the value of a share of our common stock.
Prior to our initial public offering, we used a combination of the guideline company approach and a discounted cash flow analysis to determine the fair value of our stock. The key assumptions in this estimate included our projections of future cash flows, company-specific cost of capital used as a discount rate, lack of marketability discount, and qualitative factors to compare us to comparable guideline companies. During 2016, factors that contributed to changes in the underlying value of our stock included the continued market challenges and corresponding decline in oil and natural gas drilling activity, changes to future cash flows projected from the expansion of capacity, product mix, including mix of finer grade versus coarser grade sand, and other factors. As our operations are highly dependent on sales to the oil and natural gas industry, the market conditions for this industry had a high degree of impact on the company’s value.
Once our shares became publicly traded, we began using the actual market price of our shares or an adjusted price using a Monte Carlo simulation for awards subject to the Company’s performance as compared to a defined peer group as the grant date fair value for restricted stock awards.
58
The following is a summary of the restricted stock awards granted and the related grant date fair value in the years ended
December 31, 2018
,
2017
and
2016
.
|
|
Number of
Shares Granted
(in thousands)
|
Weighted Average
Grant Date
Fair Value
|
||||
|
For the year ended December 31, 2018
|
746
|
|
$
|
6.61
|
|
|
|
For the year ended December 31, 2017
|
352
|
|
$
|
14.77
|
|
|
|
For the year ended December 31, 2016
|
161
|
|
$
|
3.85
|
|
|
Emerging Growth Company
We qualify as an “emerging growth company” pursuant to the provisions of the JOBS Act, enacted on April 5, 2012. Section 102 of the JOBS Act provides that an “emerging growth company” can take advantage of the extended transition period provided in Section 7(a)(2)(B) of the Securities Act for complying with new or revised accounting standards. However, we are choosing to “opt out” of such extended transition period, and as a result, we will comply with new or revised accounting standards on the relevant dates on which adoption of such standards is required for non-emerging growth companies. Our election to “opt-out” of the extended transition period is irrevocable.
Recent Accounting Pronouncements
In January 2017, the FASB issues ASU 2017-04, Intangibles - Goodwill and Other (Topic 350), which simplifies the test for goodwill impairment. To simplify the subsequent measurement of goodwill, the Board eliminated Step 2 from the goodwill impairment test. In computing the implied fair value of goodwill under Step 2, an entity had to perform procedures to determine the fair value at the impairment testing date of its assets and liabilities (including unrecognized assets and liabilities) following the procedure that would be required in determining the fair value of assets acquired and liabilities assumed in a business combination. Instead, an entity should perform its annual, or interim, goodwill impairment test by comparing the fair value of a reporting unit with its carrying amount. An entity should recognize an impairment charge for the amount by which the carrying amount exceeds the reporting unit’s fair value; however, the loss recognized should not exceed the total amount of goodwill allocated to that reporting unit. The Company adopted this standard on October 1, 2018 and has applied the new accounting standard to its annual goodwill impairment test as of December 31, 2018.
In February 2016, the FASB issued ASU 2016-02, Leases (Topic 842), which replaces the existing guidance in ASC 840, Leases. ASU 2016-02 requires lessees to recognize most leases on their balance sheets as lease liabilities with corresponding right of use assets. The new lease standard does not substantially change lessor accounting. The new standard is effective for interim and annual reporting periods beginning after December 15, 2018, with early adoption permitted. The Company intends to adopt ASU 2016-02 and its related updates using the transition practical expedients, which allows the Company to use the existing lease population, classification and determination of initial direct costs when calculating the lease liability and right of use asset balances. The Company also intends to use the optional transition method, which allows the Company to initially apply the new standard at the adoption date and recognize a cumulative-effect adjustment to the opening balance of retained earnings. The Company has implemented new accounting policies and software to facilitate the recording and reporting of lease transactions and balances. The Company will record initial right of use assets and related liabilities of approximately $36 million on its consolidated balance sheet on January 1, 2019. Significant new disclosures in the notes to the financial statements will be added in the first quarterly report of 2019. The Company does not expect there to be a material impact on the other consolidated financial statements.
ITEM 7A. — QUANTITATIVE AND QUALITATIVE DISCLOSURES ABOUT MARKET RISK
Market risk is the risk of loss arising from adverse changes in market rates and prices. Historically, our risks have been predominantly related to potential changes in the fair value of our long-term debt due to fluctuations in applicable market interest rates. Going forward our market risk exposure generally will be limited to those risks that arise in the normal course of business, as we do not engage in speculative, non-operating transactions, nor do we utilize financial instruments or derivative instruments for trading purposes. We do not believe that inflation has a material impact on our financial position or results of operations during periods covered by the financial statements included in this filing.
Commodity Price Risk
The market for proppant is indirectly exposed to fluctuations in the prices of crude oil and natural gas to the extent such fluctuations impact drilling and completion activity levels and thus impact the activity levels of our customers in the oilfield services and exploration and production industries. However, because we generate the substantial majority of our revenues
59
under long-term take-or-pay contracts, we believe we have limited direct exposure to short-term fluctuations in the prices of crude oil and natural gas. We do not currently intend to hedge our indirect exposure to commodity price risk.
Interest Rate Risk
As of
December 31, 2018
, we had
$44.5 million
outstanding under our Credit Facility, which bears interest at our option at either:
|
•
|
ABR (as defined in the revolving Credit Facility), plus an applicable margin of 2.00% - 3.00%, depending on the leverage ratio; or
|
|
•
|
LIBOR plus an applicable margin of 3.00% - 4.00%, depending on the leverage ratio.
|
On December 8, 2016, we entered into the $45.0 million facility with Jefferies Finance LLC as administrative and collateral agent. On April 8, 2018, the Credit Facility was amended to increase the Company’s total borrowing capacity under the Credit Facility to $60.0 million. On July 13, 2018, the Credit Facility was amended to (i) increase the limit on the Company’s ability to sell, transfer or dispose of assets, subject to certain considerations, from an aggregate amount of $25.0 million to $55.0 million (ii) increase the limit on the Company’s ability to incur capital lease obligations from an aggregate principal amount of $15.0 million to $30.0 million and (iii) exclude certain current and future earn-out obligations from the definition of indebtedness in the Credit Agreement. On February 22, 2019, we entered into an agreement with the existing lenders on our Credit Facility to (i) extend the maturity date of the Credit Facility to June 30, 2020 and (ii) reduce the total capacity to $50.0 million by December 31, 2019. The Credit Facility contains various reporting requirements, negative covenants, restrictive provisions and requires maintenance of financial covenants, including a fixed charge coverage ratio and a leverage ratio.
Credit Risk
Substantially all of our revenue for the year ended
December 31, 2018
was generated through long-term take-or-pay contracts with eight customers. Our customers are oil and natural gas producers and oilfield service providers, all of which have been negatively impacted by the downturn in activity in the oil and natural gas industry beginning in the latter part of 2018. This concentration of counterparties operating in a single industry may increase our overall exposure to credit risk, in that the counterparties may be similarly affected by changes in economic, regulatory or other conditions. If a customer defaults or if any of our contracts expires in accordance with its terms, and we are unable to renew or replace these contracts, our gross profit and cash flows may be adversely affected.
Foreign Currency Risk
Our revenues and expenses are primarily in United States dollars; however, as a result of our acquisition of Quickthree on June 1, 2018, certain transactions are transacted in Canadian dollars. Thus, revenues, operating expenses, the results of operations, assets and liabilities may be impacted to the extent that they are not hedged by the rise and fall of the relative value of the United States dollar to the Canadian dollar. During the year ended December 31, 2018, revenue, expenses, assets and liabilities transacted in Canadian dollars were immaterial to the results of operations.
60
ITEM 8. — FINANCIAL STATEMENTS AND SUPPLEMENTARY DATA
The following Consolidated Financial Statements are filed as part of this Annual Report on Form 10-K:
|
SMART SAND, INC.
|
PAGE
|
61
Report of Independent Registered Public Accounting Firm
Board of Directors and Stockholders
Smart Sand, Inc.
Opinion on the financial statements
We have audited the accompanying consolidated balance sheets of Smart Sand, Inc. (a Delaware corporation) and subsidiaries (the “Company”) as of December 31, 2018 and 2017, the related consolidated income statements, comprehensive income, changes in stockholders’ equity, and cash flows for each of the three years in the period ended December 31, 2018, and the related notes (collectively referred to as the “financial statements”). In our opinion, the financial statements present fairly, in all material respects, the financial position of the Company
as of December 31, 2018 and 2017, and the results of its
operations and its
cash flows for each of the three years in the period ended December 31, 2018, in conformity with accounting principles generally accepted in the United States of America.
Basis for opinion
These financial statements are the responsibility of the Company’s management. Our responsibility is to express an opinion on the Company’s financial statements based on our audits. We are a public accounting firm registered with the Public Company Accounting Oversight Board (United States) (“PCAOB”) and are required to be independent with respect to the Company in accordance with the U.S. federal securities laws and the applicable rules and regulations of the Securities and Exchange Commission and the PCAOB.
We conducted our audits in accordance with the standards of the PCAOB. Those standards require that we plan and perform the audit to obtain reasonable assurance about whether the financial statements are free of material misstatement, whether due to error or fraud. The Company is not required to have, nor were we engaged to perform, an audit of its internal control over financial reporting. As part of our audits we are required to obtain an understanding of internal control over financial reporting but not for the purpose of expressing an opinion on the effectiveness of the Company’s internal control over financial reporting. Accordingly, we express no such opinion.
Our audits included performing procedures to assess the risks of material misstatement of the financial statements, whether due to error or fraud, and performing procedures that respond to those risks. Such procedures included examining, on a test basis, evidence supporting the amounts and disclosures in the financial statements. Our audits also included evaluating the accounting principles used and significant estimates made by management, as well as evaluating the overall presentation of the financial statements. We believe that our audits provide a reasonable basis for our opinion.
/s/ GRANT THORNTON LLP
We have served as the Company’s auditor since 2014.
New York, New York
March 14, 2019
62
SMART SAND, INC.
CONSOLIDATED BALANCE SHEETS
|
|
December 31,
|
||||||
|
|
2018
|
2017
|
|||||
|
|
(in thousands, except share amounts)
|
||||||
|
Assets
|
|
|
|
|
|||
|
Current assets:
|
|
|
|
|
|||
|
Cash and cash equivalents
|
$
|
1,466
|
|
$
|
34,740
|
|
|
|
Restricted cash
|
—
|
|
487
|
|
|||
|
Accounts receivable, net
|
18,989
|
|
23,377
|
|
|||
|
Unbilled receivables
|
7,823
|
|
1,192
|
|
|||
|
Inventories
|
18,575
|
|
9,532
|
|
|||
|
Prepaid expenses and other current assets
|
3,243
|
|
3,849
|
|
|||
|
Total current assets
|
50,096
|
|
73,177
|
|
|||
|
Property, plant and equipment, net
|
248,396
|
|
171,762
|
|
|||
|
Intangible assets, net
|
18,068
|
|
—
|
|
|||
|
Deferred financing costs, net
|
334
|
|
892
|
|
|||
|
Other assets
|
3,398
|
|
971
|
|
|||
|
Total assets
|
$
|
320,292
|
|
$
|
246,802
|
|
|
|
Liabilities and Stockholders’ Equity
|
|||||||
|
Current liabilities:
|
|||||||
|
Accounts payable
|
$
|
11,336
|
|
$
|
26,123
|
|
|
|
Accrued and other expenses
|
8,392
|
|
7,576
|
|
|||
|
Deferred revenue
|
4,095
|
|
—
|
|
|||
|
Current portion of long-term debt
|
829
|
|
860
|
|
|||
|
Total current liabilities
|
24,652
|
|
34,559
|
|
|||
|
Long-term debt, net of current portion
|
47,893
|
|
—
|
|
|||
|
Deferred tax liabilities, long-term, net
|
17,898
|
|
13,239
|
|
|||
|
Asset retirement obligation
|
13,322
|
|
8,982
|
|
|||
|
Contingent consideration
|
7,167
|
|
—
|
|
|||
|
Total liabilities
|
110,932
|
|
56,780
|
|
|||
|
Commitments and contingencies (Note 17)
|
|
|
|
|
|||
|
Stockholders’ equity
|
|||||||
|
Common stock, $0.001 par value, 350,000,000 shares authorized; 40,673,513
issued and 39,974,478 outstanding at December 31, 2018; 40,474,085
issued and 40,393,033 outstanding at December 31, 2017
|
40
|
|
40
|
|
|||
|
Treasury stock, at cost, 699,035 shares and 81,052 shares at
December 31, 2018 and 2017, respectively
|
(2,839
|
)
|
(666
|
)
|
|||
|
Additional paid-in capital
|
162,195
|
|
159,059
|
|
|||
|
Retained earnings
|
50,277
|
|
31,589
|
|
|||
|
Accumulated other comprehensive loss
|
(313
|
)
|
—
|
|
|||
|
Total stockholders’ equity
|
209,360
|
|
190,022
|
|
|||
|
Total liabilities and stockholders’ equity
|
$
|
320,292
|
|
$
|
246,802
|
|
|
The accompanying notes are an integral part of these consolidated financial statements.
63
SMART SAND, INC.
CONSOLIDATED INCOME STATEMENTS
|
|
Year Ended December 31,
|
||||||||||
|
|
2018
|
2017
|
2016
|
||||||||
|
|
(in thousands, except per share amounts)
|
||||||||||
|
Revenues
|
$
|
212,470
|
|
$
|
137,212
|
|
$
|
59,231
|
|
||
|
Cost of goods sold
|
144,903
|
|
100,304
|
|
26,569
|
|
|||||
|
Gross profit
|
67,567
|
|
36,908
|
|
32,662
|
|
|||||
|
Operating expenses:
|
|||||||||||
|
Salaries, benefits and payroll taxes
|
11,043
|
|
8,219
|
|
7,385
|
|
|||||
|
Depreciation and amortization
|
1,843
|
|
525
|
|
384
|
|
|||||
|
Selling, general and administrative
|
12,825
|
|
9,459
|
|
4,502
|
|
|||||
|
Change in the estimated fair value of contingent consideration
|
(1,858
|
)
|
—
|
|
—
|
|
|||||
|
Impairment of goodwill and indefinite-lived intangible asset
|
17,835
|
|
—
|
|
—
|
|
|||||
|
Total operating expenses
|
41,688
|
|
18,203
|
|
12,271
|
|
|||||
|
Operating income
|
25,879
|
|
18,705
|
|
20,391
|
|
|||||
|
Other income (expenses):
|
|||||||||||
|
Preferred stock interest expense
|
—
|
|
—
|
|
(5,565
|
)
|
|||||
|
Interest expense, net
|
(2,266
|
)
|
(450
|
)
|
(2,862
|
)
|
|||||
|
Other income
|
197
|
|
462
|
|
8,860
|
|
|||||
|
Total other income (expenses), net
|
(2,069
|
)
|
12
|
|
433
|
|
|||||
|
Loss on extinguishment of debt
|
—
|
|
—
|
|
(1,051
|
)
|
|||||
|
Income before income tax expense (benefit)
|
23,810
|
|
18,717
|
|
19,773
|
|
|||||
|
Income tax expense (benefit)
|
5,122
|
|
(2,809
|
)
|
9,394
|
|
|||||
|
Net income
|
$
|
18,688
|
|
$
|
21,526
|
|
$
|
10,379
|
|
||
|
Net income per common share:
|
|||||||||||
|
Basic
|
$
|
0.46
|
|
$
|
0.54
|
|
$
|
0.43
|
|
||
|
Diluted
|
$
|
0.46
|
|
$
|
0.53
|
|
$
|
0.42
|
|
||
|
Weighted-average number of common shares:
|
|||||||||||
|
Basic
|
40,427
|
|
40,208
|
|
24,322
|
|
|||||
|
Diluted
|
40,449
|
|
40,304
|
|
24,579
|
|
|||||
The accompanying notes are an integral part of these consolidated financial statements.
64
SMART SAND, INC.
CONSOLIDATED STATEMENTS OF COMPREHENSIVE INCOME
|
Year Ended December 31,
|
|||||||||||
|
2018
|
2017
|
2016
|
|||||||||
|
(in thousands)
|
|||||||||||
|
Net income
|
$
|
18,688
|
|
$
|
21,526
|
|
$
|
10,379
|
|
||
|
Other comprehensive income:
|
|||||||||||
|
Foreign currency translation adjustment
|
(313
|
)
|
—
|
|
—
|
|
|||||
|
Comprehensive income
|
$
|
18,375
|
|
$
|
21,526
|
|
$
|
10,379
|
|
||
The accompanying notes are an integral part of these consolidated financial statements.
65
SMART SAND, INC.
CONSOLIDATED STATEMENTS OF CHANGES IN STOCKHOLDERS’ EQUITY
|
|
Common Stock
|
Treasury Stock
|
Additional
Paid-In
Capital
|
Retained
Earnings
(Accumulated
Deficit)
|
Accumulated Other Comprehensive Loss
|
Total
Stockholders’
Equity
|
|||||||||||||||||||||||
|
|
Outstanding
Shares
|
Par Value
|
Shares
|
Amount
|
|||||||||||||||||||||||||
|
|
(in thousands, except share amounts)
|
||||||||||||||||||||||||||||
|
Balance at December 31, 2015
|
22,114,620
|
|
$
|
22
|
|
24,860
|
|
$
|
(123
|
)
|
$
|
4,146
|
|
$
|
(316
|
)
|
$
|
—
|
|
$
|
3,729
|
|
|||||||
|
Vesting of restricted stock
|
167,090
|
|
—
|
|
—
|
|
—
|
|
—
|
|
—
|
|
—
|
|
—
|
|
|||||||||||||
|
Proceeds from equity issuance, net
|
12,577,500
|
|
13
|
|
—
|
|
—
|
|
127,289
|
|
—
|
|
—
|
|
127,302
|
|
|||||||||||||
|
Exercise of warrants
|
3,999,998
|
|
4
|
|
—
|
|
—
|
|
18
|
|
—
|
|
—
|
|
22
|
|
|||||||||||||
|
Stock-based compensation, inclusive of $24 tax
expense
|
—
|
|
—
|
|
—
|
|
—
|
|
1,426
|
|
—
|
|
—
|
|
1,426
|
|
|||||||||||||
|
Restricted stock buy back
|
(42,734
|
)
|
—
|
|
42,734
|
|
(416
|
)
|
—
|
|
—
|
|
—
|
|
(416
|
)
|
|||||||||||||
|
Net income
|
—
|
|
—
|
|
—
|
|
—
|
|
—
|
|
10,379
|
|
—
|
|
10,379
|
|
|||||||||||||
|
Balance at December 31, 2016
|
38,816,474
|
|
$
|
39
|
|
67,594
|
|
$
|
(539
|
)
|
$
|
132,879
|
|
$
|
10,063
|
|
$
|
—
|
|
$
|
142,442
|
|
|||||||
|
Vesting of restricted stock
|
90,017
|
|
—
|
|
—
|
|
—
|
|
—
|
|
—
|
|
—
|
|
—
|
|
|||||||||||||
|
Stock-based compensation
|
—
|
|
—
|
|
—
|
|
—
|
|
1,973
|
|
—
|
|
—
|
|
1,973
|
|
|||||||||||||
|
Employee stock purchase plan compensation
|
—
|
|
—
|
|
—
|
|
—
|
|
39
|
|
—
|
|
—
|
|
39
|
|
|||||||||||||
|
Proceeds from equity issuance, net of
transaction costs
|
1,500,000
|
|
1
|
|
—
|
|
—
|
|
24,168
|
|
—
|
|
—
|
|
24,169
|
|
|||||||||||||
|
Restricted stock buy back
|
(13,458
|
)
|
—
|
|
13,458
|
|
(127
|
)
|
—
|
|
—
|
|
—
|
|
(127
|
)
|
|||||||||||||
|
Net income
|
—
|
|
—
|
|
—
|
|
—
|
|
—
|
|
21,526
|
|
—
|
|
21,526
|
|
|||||||||||||
|
Balance at December 31, 2017
|
40,393,033
|
|
$
|
40
|
|
81,052
|
|
$
|
(666
|
)
|
$
|
159,059
|
|
$
|
31,589
|
|
$
|
—
|
|
$
|
190,022
|
|
|||||||
|
Foreign currency translation adjustment
|
—
|
|
—
|
|
—
|
|
—
|
|
—
|
|
—
|
|
(313
|
)
|
(313
|
)
|
|||||||||||||
|
Vesting of restricted stock
|
177,464
|
|
—
|
|
—
|
|
—
|
|
—
|
|
—
|
|
—
|
|
—
|
|
|||||||||||||
|
Stock-based compensation
|
—
|
|
—
|
|
—
|
|
—
|
|
2,937
|
|
—
|
|
—
|
|
2,937
|
|
|||||||||||||
|
Employee stock purchase plan compensation
|
—
|
|
—
|
|
—
|
|
—
|
|
72
|
|
—
|
|
—
|
|
72
|
|
|||||||||||||
|
Employee stock purchase plan issuance
|
21,964
|
|
—
|
|
—
|
|
—
|
|
127
|
|
—
|
|
—
|
|
127
|
|
|||||||||||||
|
Restricted stock buy back
|
(29,783
|
)
|
—
|
|
29,783
|
|
(174
|
)
|
—
|
|
—
|
|
—
|
|
(174
|
)
|
|||||||||||||
|
Shares repurchased
|
(588,200
|
)
|
—
|
|
588,200
|
|
(1,999
|
)
|
—
|
|
—
|
|
—
|
|
(1,999
|
)
|
|||||||||||||
|
Net income
|
—
|
|
—
|
|
—
|
|
—
|
|
—
|
|
18,688
|
|
—
|
|
18,688
|
|
|||||||||||||
|
Balance at December 31, 2018
|
39,974,478
|
|
$
|
40
|
|
699,035
|
|
$
|
(2,839
|
)
|
$
|
162,195
|
|
$
|
50,277
|
|
$
|
(313
|
)
|
$
|
209,360
|
|
|||||||
The accompanying notes are an integral part of these consolidated financial statements.
66
SMART SAND, INC.
CONSOLIDATED STATEMENTS OF CASH FLOWS
|
|
Year Ended December 31,
|
||||||||||
|
|
2018
|
2017
|
2016
|
||||||||
|
|
(in thousands)
|
||||||||||
|
Operating activities:
|
|
|
|
|
|
|
|||||
|
Net income
|
$
|
18,688
|
|
$
|
21,526
|
|
$
|
10,379
|
|
||
|
Adjustments to reconcile net income to net cash provided by operating activities:
|
|||||||||||
|
Depreciation, depletion and accretion of asset retirement obligation
|
17,159
|
|
7,926
|
|
6,481
|
|
|||||
|
Goodwill and indefinite-lived intangible asset impairment
|
17,835
|
|
—
|
|
—
|
|
|||||
|
Amortization of intangible assets
|
1,002
|
|
—
|
|
—
|
|
|||||
|
Asset retirement obligation settlement
|
(3,180
|
)
|
—
|
|
—
|
|
|||||
|
Loss (gain) on disposal of assets
|
321
|
|
253
|
|
(54
|
)
|
|||||
|
Loss on extinguishment of debt
|
—
|
|
—
|
|
1,051
|
|
|||||
|
Provision for bad debt
|
42
|
|
—
|
|
—
|
|
|||||
|
Amortization of deferred financing cost
|
300
|
|
455
|
|
159
|
|
|||||
|
Accretion of debt discount
|
246
|
|
—
|
|
263
|
|
|||||
|
Deferred income taxes
|
4,659
|
|
(1,805
|
)
|
539
|
|
|||||
|
Stock-based compensation, net
|
2,937
|
|
2,012
|
|
1,426
|
|
|||||
|
Employee stock purchase plan compensation
|
72
|
|
—
|
|
—
|
|
|||||
|
Non-cash interest expense on Series A preferred stock
|
—
|
|
—
|
|
5,565
|
|
|||||
|
Change in estimated fair value of contingent consideration
|
(1,858
|
)
|
—
|
|
—
|
|
|||||
|
Changes in assets and liabilities:
|
|||||||||||
|
Accounts receivable
|
4,457
|
|
(18,038
|
)
|
(3,319
|
)
|
|||||
|
Unbilled receivables
|
(6,631
|
)
|
(788
|
)
|
3,617
|
|
|||||
|
Inventories
|
(7,343
|
)
|
4,407
|
|
(1,357
|
)
|
|||||
|
Prepaid expenses and other assets
|
(1,761
|
)
|
(3,394
|
)
|
133
|
|
|||||
|
Deferred revenue
|
4,095
|
|
(1,615
|
)
|
(5,518
|
)
|
|||||
|
Accounts payable
|
(2,271
|
)
|
9,356
|
|
761
|
|
|||||
|
Accrued and other expenses
|
2,140
|
|
2,391
|
|
(481
|
)
|
|||||
|
Income taxes payable
|
—
|
|
(7,058
|
)
|
7,058
|
|
|||||
|
Net cash provided by operating activities
|
50,909
|
|
15,628
|
|
26,703
|
|
|||||
|
Investing activities:
|
|||||||||||
|
Acquisition of businesses, net of cash acquired
|
(29,921
|
)
|
—
|
|
—
|
|
|||||
|
Purchases of property, plant and equipment
|
(96,090
|
)
|
(51,162
|
)
|
(2,519
|
)
|
|||||
|
Proceeds from disposal of assets
|
22
|
|
14
|
|
49
|
|
|||||
|
Net cash used in investing activities
|
(125,989
|
)
|
(51,148
|
)
|
(2,470
|
)
|
|||||
|
Financing activities:
|
|||||||||||
|
Repayment of line of credit
|
—
|
|
—
|
|
(1,368
|
)
|
|||||
|
Repayments of notes payable
|
(559
|
)
|
(282
|
)
|
—
|
|
|||||
|
Payments under equipment financing obligations
|
(168
|
)
|
(353
|
)
|
(409
|
)
|
|||||
|
Payment of deferred financing and debt issuance costs
|
(233
|
)
|
(193
|
)
|
(1,178
|
)
|
|||||
|
Proceeds from revolving credit facility
|
84,000
|
|
—
|
|
1,100
|
|
|||||
|
Repayment of revolving credit facility
|
(39,500
|
)
|
—
|
|
(65,316
|
)
|
|||||
|
Payment of contingent consideration
|
(175
|
)
|
—
|
|
—
|
|
|||||
|
Proceeds from equity issuance
|
127
|
|
26,251
|
|
138,371
|
|
|||||
|
Payment of equity transaction costs
|
—
|
|
(2,083
|
)
|
(11,047
|
)
|
|||||
|
Repayment of Series A preferred stock
|
—
|
|
—
|
|
(40,328
|
)
|
|||||
|
Purchase of treasury stock
|
(2,173
|
)
|
(127
|
)
|
(420
|
)
|
|||||
|
Net cash provided by financing activities
|
41,319
|
|
23,213
|
|
19,405
|
|
|||||
|
Effect of exchange rate changes on cash, cash equivalents and restricted cash
|
—
|
|
—
|
|
—
|
|
|||||
|
Net increase (decrease) in cash, cash equivalents and restricted cash
|
(33,761
|
)
|
(12,307
|
)
|
43,638
|
|
|||||
|
Cash and cash equivalents and restricted cash at beginning of year
|
35,227
|
|
47,534
|
|
3,896
|
|
|||||
|
Cash and cash equivalents and restricted cash at end of year
|
$
|
1,466
|
|
$
|
35,227
|
|
$
|
47,534
|
|
||
The accompanying notes are an integral part of these consolidated financial statements.
67
SMART SAND, INC.
NOTES TO CONSOLIDATED FINANCIAL STATEMENTS
(IN THOUSANDS, EXCEPT PER SHARE DATA)
NOTE 1 — Organization and Nature of Business
Smart Sand, Inc. and its subsidiaries are headquartered in The Woodlands, Texas. The Company was incorporated in July 2011, and is a fully integrated frac sand supply and services company, offering complete mine to wellsite logistics solutions. The Company is engaged in the excavation, processing and sale of industrial sand, or proppant, for use in hydraulic fracturing operations for the oil and natural gas industry. Its integrated Oakdale facility, with on-site rail infrastructure and wet and dry sand processing facilities, has access to two Class I rail lines and enables the Company to process and cost effectively deliver products to its customers. The Company also offers proppant logistics solutions to its customers through, among other things, its in-basin transloading terminal and wellsite storage solution capabilities.
The Company completed construction of the first phase of its mine and processing facility in Oakdale, Wisconsin and commenced operations in July 2012, and subsequently expanded its operations in 2014, 2015 and 2018. Currently the Company’s annual processing capacity is approximately
5.5 million tons
.
On March 15, 2018, the Company acquired the rights to operate a unit train capable transloading terminal in Van Hook, North Dakota to service the Bakken Formation in the Williston Basin and began providing Northern White Sand in-basin in April 2018.
On June 1, 2018, the Company acquired substantially all of the assets of Quickthree Solutions, Inc., (“Quickthree”) a manufacturer of portable vertical proppant storage solution systems. This proppant storage solution creates efficiencies, flexibility, enhanced safety and reliability for customers by providing the capability to unload, store and deliver proppant at the wellsite, as well as the ability to rapidly set up, takedown and transport the entire system. The system includes passive and active dust suppression technology, along with the capability of a gravity-fed operation.
NOTE 2 — Summary of Significant Accounting Policies
Basis of Presentation and Consolidation
The accompanying consolidated financial statements (“financial statements”) of the Company have been prepared in accordance with accounting principles generally accepted in the United States (“GAAP”) and pursuant to the rules and regulations of the Securities and Exchange Commission (“SEC”). The accompanying financial statements include those of our controlled subsidiaries. The intercompany accounts and transactions have been eliminated. In the opinion of management, all adjustments and disclosures necessary for a fair presentation of these financial statements have been included.
Use of Estimates
The preparation of financial statements in accordance with GAAP requires management to make estimates and assumptions that affect the reported amounts of assets and liabilities and disclosure of contingent liabilities at the date of the consolidated financial statements, and the reported amounts of revenues and expenses during the reporting period. Significant estimates used in the preparation of these financial statements include, but are not limited to; the sand reserves and their impact on calculating the depletion expense under the units-of-production method; the depreciation and amortization associated with property, plant and equipment and definite-lived intangible assets, impairment considerations of assets (including impairment of identified intangible assets, goodwill and other long-lived assets); estimated cost of future asset retirement obligations; stock-based compensation; recoverability of deferred tax assets; inventory reserve; collectability of receivables; and certain liabilities. Actual results could differ from management’s best estimates as additional information or actual results become available in the future, and those differences could be material.
Going Concern
Management evaluates at each annual and interim period whether there are conditions or events, considered in the aggregate, that raise substantial doubt about the Company’s ability to continue as a going concern within one year after the date that the consolidated financial statements are issued. Management’s evaluation is based on relevant conditions and events that are known and reasonably knowable at the date that the consolidated financial statements are issued. Management has concluded that there are no conditions or events, considered in the aggregate, that raise substantial doubt about the Company’s ability to continue as a going concern within one year after the date of these financial statements.
68
SMART SAND, INC.
NOTES TO CONSOLIDATED FINANCIAL STATEMENTS
(IN THOUSANDS, EXCEPT PER SHARE DATA)
Revenue Recognition
On January 1, 2018, the Company adopted ASC 606, “Revenue from Contracts with Customers” and all the related amendments to ASC 606 in relation to all contracts that were not completed or expired as of January 1, 2018, using the modified retrospective method. There was no adjustment made to the opening balance of retained earnings as a result of applying ASC 606. Results for reporting periods beginning January 1, 2018 are presented under ASC 606, while the comparative information is not restated and will continue to be reported under the accounting standards in effect for those periods.
Revenue Recognition
Revenues are recognized when control of the promised goods or services is transferred to our customers, the amount of which reflects the consideration the Company expects to be entitled to in exchange for those goods or services.
Sand Sales Revenue
The Company derives its sand sales revenue by mining and processing sand. Its revenues are primarily a function of the price per ton realized and the volumes sold. For sand delivered FCA at the origination point at the Company’s facility, title passes as the product is loaded into railcars hired by the customer or provided by the Company and revenue is recognized when title transfers at the Company’s facility. For sand delivered in-basin, the Company recognizes the revenue when title passes at the destination. The amount invoiced reflects product, transportation and any other additional handling services, such as storage or transloading the product from railcar to truck.
Prices under the Company’s long-term agreements with customers are generally indexed to the Average Cushing Oklahoma WTI Spot Prices and contain provisions allowing for adjustments including: (i) annual percentage price increases; and/or (ii) market factor adjustments, including a natural gas surcharge/reduction and a propane surcharge/reduction which are applied if the Average Natural Gas Price or the Average Quarterly Mont Belvieu TX Propane Spot Price, respectively, as listed by the U.S. Energy Information Administration, are above or below the applicable benchmark set forth in the contract for the preceding calendar quarter.
Reservation Charges
The Company requires certain customers to pay a fixed-price monthly reservation charge based on a minimum contractual volume over the remaining life of their contract, which may be applied as a per ton credit to the sales price up to a certain contractually specified monthly volume or credited against any applicable shortfall payments. The Company recognizes revenue when the customer no longer has the right to use the reservation charge towards sand sales or shortfall payments.
Shortfall Payments
The Company’s shortfall revenues are related to minimum commitments under take-or-pay contracts and based on negotiated contract terms and are recognized when rights of use are expired. The Company recognizes revenue to the extent of the unfulfilled minimum contracted quantity at the shortfall price per ton as stated in the contract.
Railcar Usage Revenue
Railcar usage revenue consists of revenue derived from the usage of the Company’s railcars by customers under long-term contracts or on an as-used basis. Based on the customer contract, the Company either recognizes revenue on the usage of railcars based on when the terms of the agreement state that the railcar is available to the customer for use, or based on a specified price per ton shipped.
Transportation Revenue
Transportation revenue consists primarily of railway transportation and transload services to deliver products to customers. The Company’s transportation revenue fluctuates based on many factors, including the volume of product it transports and the distance between its plant and customers.
69
SMART SAND, INC.
NOTES TO CONSOLIDATED FINANCIAL STATEMENTS
(IN THOUSANDS, EXCEPT PER SHARE DATA)
The following table presents our revenues disaggregated by type and percentage of total revenues for the periods indicated.
|
Year Ended December 31,
|
|||||||||||||||||||||
|
2018
|
2017
|
2016
|
|||||||||||||||||||
|
Revenue
|
Percentage of Total Revenue
|
Revenue
|
Percentage of Total Revenue
|
Revenue
|
Percentage of Total Revenue
|
||||||||||||||||
|
Sand sales revenue
|
$
|
121,377
|
|
57
|
%
|
$
|
50,200
|
|
37
|
%
|
$
|
17,076
|
|
29
|
%
|
||||||
|
Reservation charges
|
22,156
|
|
10
|
%
|
30,000
|
|
22
|
%
|
15,041
|
|
25
|
%
|
|||||||||
|
Shortfall payments
|
6,032
|
|
3
|
%
|
1,244
|
|
1
|
%
|
20,902
|
|
35
|
%
|
|||||||||
|
Railcar usage revenue
|
8,918
|
|
4
|
%
|
7,702
|
|
5
|
%
|
5,732
|
|
10
|
%
|
|||||||||
|
Transportation revenue
|
53,987
|
|
26
|
%
|
48,066
|
|
35
|
%
|
480
|
|
1
|
%
|
|||||||||
|
Total revenues
|
$
|
212,470
|
|
100
|
%
|
$
|
137,212
|
|
100
|
%
|
$
|
59,231
|
|
100
|
%
|
||||||
Contract Balances
The timing of revenue recognition, billings and cash collections results in billed accounts receivable, unbilled receivables and deferred revenue on the consolidated balance sheet. For the Company’s sand sales, amounts are billed as sand is loaded on the railcars to fill customer orders for FCA origination point sales or when sand is received at the destination for FCA or DAT destination point sales and recorded as accounts receivable. For the Company’s freight revenue, amounts billed depend on the shipping terms and are recorded as receivables accordingly. Generally, billing occurs subsequent to revenue recognition, though certain billing occurs in advance, resulting in unbilled receivables and deferred revenue, respectively. In addition, the Company sometimes receives shortfall payments from its customers and recognizes the revenue once the rights of use are expired. Changes in the unbilled receivables and deferred revenue balances for the years ended
December 31, 2018
and
2017
were not materially impacted by any other factors.
Deferred Revenues
The Company receives advance payments from certain customers in order to secure and procure a reliable provision and delivery of product. The Company classifies such advances as current or noncurrent liabilities depending upon the anticipated timing of delivery of the supplied product. Revenue is recognized upon the delivery of the product.
The Company may receive an advance payment from a customer, based on the terms of the customer’s long-term contract, for a certain volume of product to be delivered. Revenue is recognized as product is delivered and the deferred revenue is reduced.
Revenue recognized for the year ended
December 31, 2018
that was included in the deferred revenue balance at the beginning of the year was
$0
. The deferred revenue balance at
December 31, 2018
and
2017
was
$4,095
and
$0
, respectively, and classified as a current liability in the accompanying consolidated balance sheets.
Performance Obligations
A performance obligation is a promise in a contract to transfer a distinct good or service to the customer, and is the unit of account in accordance with ASC 606. A contract’s transaction price is allocated to each distinct performance obligation and recognized as revenue when, or as, the performance obligation is satisfied. Generally, the Company’s contracts include a single performance obligation that is separately identifiable, and therefore, distinct. Under ASC 606, the allocation of transaction price is not necessary if only one performance obligation is identified. The Company expects to recognize approximately
59%
of its remaining performance obligations under existing contracts as revenue in 2019 and expects to recognize the remaining
41%
as revenue by 2022.
Significant Judgments
Accounting for long-term contracts involves the use of various techniques to estimate total contract revenue, costs and satisfaction of performance obligation. The Company satisfies its performance obligation and subsequently recognizes revenue, at a point in time, upon shipment of the products as the customer obtains control over the goods once the sand is loaded into the
70
SMART SAND, INC.
NOTES TO CONSOLIDATED FINANCIAL STATEMENTS
(IN THOUSANDS, EXCEPT PER SHARE DATA)
railcars or sand is delivered to the customer’s destination. In the case of sand being delivered to customers, the transaction price is variable in nature and is directly tied to the Average Cushing Oklahoma WTI Spot Prices per barrel. There were no changes to the significant judgments used by the Company to determine the timing of satisfaction of the performance obligation under ASC 606.
Costs to Obtain or Fulfill Contracts
The Company’s costs to fulfill or obtain contracts with customers primarily consist of commissions and legal costs. Under take-or-pay contracts, the Company provides sales team members with commissions at set per ton prices. These commissions are paid on a monthly basis, when and if the sand is taken by the customer. Although sales commissions are incremental in nature, there were no up-front commission paid on the satisfactory obtainment of a contract, resulting in no sales commissions being capitalized at
December 31, 2018
. The Company also incurs legal costs relating to the drafting and negotiating of contracts with select customers. Because legal costs are not incremental in nature and are incurred regardless of whether a contract is ultimately obtained, there were no legal costs capitalized as of
December 31, 2018
. As a result, the Company did not record amortization of costs incurred to obtain the contract or any related impairment losses for the year ended
December 31, 2018
.
Cash, Cash Equivalents and Restricted Cash
The Company considers all short-term, highly liquid investments with an original maturity of three months or less to be cash equivalents. Restricted cash is cash held as collateral relating to an outstanding short-term bond assuring performance under a fuel agreement with a pipeline common carrier. Cash is maintained at financial institutions and, at times, balances may exceed federally insured limits.
Accounts and Unbilled Receivables
Accounts receivable represents customer transactions that have been invoiced as of the balance sheet date; unbilled receivables represent customer transactions that have not yet been invoiced as of the balance sheet date. Accounts receivable are due within
30 days
, or in accordance with terms agreed upon with customers, and are stated at amounts due from customers net of any allowance for doubtful accounts. The Company considers accounts outstanding longer than the payment terms past due. The Company determines the allowance by considering a number of factors, including the length of time trade accounts receivable are past due, previous loss history, a customer’s current ability to pay its obligation, and the condition of the general economy and the industry as a whole. Accounts receivable are written off when they are deemed uncollectible, and payments subsequently received on such receivables are credited to bad debt expense. As of
December 31, 2018
and
2017
, the Company recorded an allowance for doubtful accounts of
$42
and
$0
, respectively. As of
December 31, 2018
and
2017
, the portion of unbilled receivables included in deferred revenue was
$578
and
$0
, respectively. As of December 31, 2018,
$11,360
of accounts and unbilled receivables were from customers with which we have pending litigation. See Note 17 - Commitments and Contingencies for additional information.
Transportation
Transportation costs are classified as cost of goods sold. Transportation costs consist of railway transportation and transload costs to deliver products to customers. Cost of sales generated from shipping was
$70,532
,
$50,313
and
$1,172
for the years ended
December 31, 2018
,
2017
and
2016
, respectively.
Inventories
The Company’s sand inventory consists of raw material (sand that has been excavated but not processed), work-in-progress (sand that has undergone some but not all processing) and finished goods (sand that has been completely processed and is ready for sale). Costs applied to sand inventory include direct excavation costs, processing costs, overhead allocation, depreciation and depletion, transportation and additional service costs, as applicable. Stockpile tonnages are calculated by measuring the number of tons added and removed from the stockpile. Costs are calculated on a per ton basis and are applied to the stockpiles based on the number of tons in the stockpile. The Company performs monthly physical inventory measurements to verify the quantity of sand inventory on hand. Due to variation in sand density and moisture content and production processes utilized to manufacture the Company’s products, physical inventories will not necessarily detect all variances. To mitigate this risk, the Company recognizes a yield adjustment on its inventories. Sand inventory is stated at the lower of cost or net realizable value using the average cost method. For the years ended
December 31, 2018
and
2017
, respectively, the Company had
no
write-down of inventory as a result of any lower of cost or market assessment.
71
SMART SAND, INC.
NOTES TO CONSOLIDATED FINANCIAL STATEMENTS
(IN THOUSANDS, EXCEPT PER SHARE DATA)
The spare parts inventory consists of critical spare parts. Spare parts inventory is accounted for on a first-in, first-out basis at the lower of cost or net realizable value.
Deferred Financing Charges
Direct costs incurred in connection with the Credit Facility have been capitalized and are being amortized using the straight-line method, which approximates the effective interest method, over the term of the debt.
Fees attributable to the lender as of
December 31, 2018
, were
$728
and are presented as a discount to the carrying value of the debt and the unamortized amount is presented as a reduction of long-term debt on the consolidated balance sheets. Fees attributable to the lender as of
December 31, 2017
were
$1,372
and are presented as components of deferred financing charges since there was no outstanding balance on the Credit Facility as of
December 31, 2017
. Fees attributable to third parties are presented on the balance sheet as deferred financing costs, net.
Amortization expense of the deferred financing charges of
$300
,
$455
, and
$159
and accretion of debt discount of
$246
,
$0
and
$263
are included in interest expense as of
December 31, 2018
,
2017
and
2016
, respectively.
Financial Instruments
The carrying value of the Company’s financial instruments, consisting of cash, accounts receivable, accounts payable and accrued expenses, approximates their fair value due to the short maturity of such instruments. Financial instruments also consist of debt for which fair value approximates carrying values as the debt bears interest at fixed or variable rates which are reflective of current rates otherwise available to the Company. Unless otherwise noted, it is management’s opinion that the Company is not exposed to significant interest, currency or credit risks arising from these financial instruments.
Property, Plant and Equipment
Property, plant and equipment are recorded at cost. Costs related to researching, surveying, drilling, and related activities are recorded at cost and capitalized once a determination has been made that the Company’s property has proven and probable reserves. Capitalized mining costs are depleted using the units-of-production method. Construction in progress is primarily comprised of machinery and equipment which has not been placed in service and is not depreciated until the related assets or improvements are ready to be placed in service. Depreciation is calculated using the straight-line method over the estimated useful lives of the property, plant and equipment, which are:
|
|
Years
|
|
Land improvements
|
10
|
|
Plant and buildings
|
5-15
|
|
Real estate properties
|
10-40
|
|
Railroad and sidings
|
30
|
|
Vehicles
|
3-5
|
|
Machinery, equipment and tooling
|
3-15
|
|
Wellsite proppant storage solutions
|
5-15
|
|
Furniture and fixtures
|
3-10
|
|
Deferred mining costs
|
3
|
Expenditures for maintenance and repairs are charged against income as incurred; betterments that increase the value or materially extend the life of the related assets are capitalized. Upon sale or disposition of property and equipment, the cost and related accumulated depreciation and amortization are removed from the accounts and any resulting gain or loss is recognized in the consolidated income statements.
Acquisitions
The Company determines whether a transaction or other event is a business combination, which requires that the assets acquired and liabilities assumed constitute a business. Each business combination is then accounted for by applying the acquisition method. If the assets acquired are not a business, the Company accounts for the transaction or other event as an asset acquisition. Under both methods, the Company recognizes the identifiable assets acquired, the liabilities assumed, contingent considerations and any non-controlling interest in the acquired entity. In addition, for transactions that are business
72
SMART SAND, INC.
NOTES TO CONSOLIDATED FINANCIAL STATEMENTS
(IN THOUSANDS, EXCEPT PER SHARE DATA)
combinations, the Company evaluates the existence of goodwill or a gain from a bargain purchase. The Company capitalizes acquisition-related costs and fees associated with asset acquisitions and expenses acquisition-related costs and fees associated with business combinations in the period in which they are incurred.
Long-Lived Assets, Including Definite-Lived Intangible Assets
Long-lived assets, other than goodwill and other indefinite-lived intangibles, are evaluated for impairment whenever events or changes in circumstances indicate that the carrying amount of the assets may not be recoverable through the estimated undiscounted future cash flows derived from such assets. Definite-lived intangible assets primarily consist of developed technology and customer relationships. For long-lived assets used in operations, impairment losses are only recorded if the asset’s carrying amount is not recoverable through its undiscounted, probability-weighted future cash flows. The Company measures the impairment loss based on the difference between the carrying amount and the estimated fair value. When an impairment exists, the related assets are written down to fair value.
Goodwill and Other Indefinite-Lived Intangible Assets
The Company conducts its evaluation of goodwill and other indefinite-lived intangible assets at the reporting unit level on an annual basis as of December 31 and more frequently if events or circumstances indicate that the carrying value of a reporting unit exceeds its fair value. Prior to performing an impairment test, the Company assesses qualitative factors to determine whether the existence of events or circumstances leads to a determination that it is more likely than not that the fair value of a reporting unit is less than its carrying amount. If the qualitative assessment determines that an impairment is more likely than not, the Company performs a quantitative comparison of the fair value with the carrying amount, including goodwill. If this comparison reflects impairment, then the loss would be measured as the excess of recorded goodwill, or other intangible assets with indefinite lives, over its fair value. See Note 6 - Goodwill and Intangible Assets, net for additional information.
Fair Value Measurements
The Company has categorized its assets and liabilities that are measured at fair value on a recurring and non-recurring basis into a three-level fair value hierarchy, of which the first two are considered observable and the last unobservable, which are as follows:
|
•
|
Level 1—Inputs are unadjusted quoted prices in active markets for identical assets or liabilities that the Company has the ability to access at the measurement date;
|
|
•
|
Level 2—Inputs other than Level 1 that are observable, either directly or indirectly, such as quoted prices for similar assets or liabilities in active markets, quoted prices for identical or similar assets or liabilities in markets that are not active or other inputs corroborated by observable market data for substantially the full term of the assets or liabilities; and
|
|
•
|
Level 3—Unobservable inputs that reflect the Company’s assumptions that market participants would use in pricing assets or liabilities based on the best information available.
|
Contingent Consideration
The Company’s contingent consideration is measured at fair value on a recurring basis and is comprised of payments for production of silos and related equipment during the
three
-year period after the Quickthree acquisition (Note 3). Contingent liabilities are valued using significant inputs that are not observable in the market, which are defined as Level 3 inputs according to fair value measurement accounting. The Company used a probability-weighted average between
9
and
50
manufactured fleets over the remaining earnout period as the basis of its fair value determination. The actual contingent consideration could vary from the determined amount based on the actual number of silos and related equipment produced and the timing thereof. The Company estimates the fair value of contingent liabilities using a Monte Carlo simulation-based, real option pricing methodology implementation of the Income Approach. This approach utilizes inputs including market comparable information and management assessments regarding potential future scenarios, then discounts the liabilities to present value. The Company believes its estimates and assumptions are reasonable, however, there is significant judgment involved.
73
SMART SAND, INC.
NOTES TO CONSOLIDATED FINANCIAL STATEMENTS
(IN THOUSANDS, EXCEPT PER SHARE DATA)
The fair value of the Company’s financial instruments carried at fair value were as follows:
|
December 31, 2018
|
Level 1
|
Level 2
|
Level 3
|
|||||||||||||
|
Contingent consideration
|
$
|
7,167
|
|
$
|
—
|
|
$
|
—
|
|
$
|
7,167
|
|
||||
|
Total liabilities
|
$
|
7,167
|
|
$
|
—
|
|
$
|
—
|
|
$
|
7,167
|
|
||||
The following table provides a summary of changes in the fair value of the Company’s Level 3 financial instruments for the year ended
December 31, 2018
:
|
Balance as of January 1, 2018
|
$
|
—
|
|
|
|
Contingent consideration pursuant to acquisition
|
9,200
|
|
||
|
Payment of contingent consideration
|
(175
|
)
|
||
|
Fair value adjustment
|
(1,858
|
)
|
||
|
Balance as of December 31, 2018
|
$
|
7,167
|
|
|
Asset Retirement Obligation
The Company estimates the future cost of dismantling, restoring and reclaiming operating excavation sites and related facilities in accordance with federal, state and local regulatory requirements and recognizes reclamation obligations when extraction occurs and records them as liabilities at estimated fair value. In addition, a corresponding increase in the carrying amount of the related asset is recorded and depreciated over such asset’s useful life or the estimated number of years of extraction. The reclamation liability is accreted to expense over the estimated productive life of the related asset and is subject to adjustments to reflect changes in value resulting from the passage of time and revisions to the estimates of either the timing or amount of the reclamation costs. Changes in estimates at inactive mines or mining areas are reflected in earnings in the period an estimate is revised. If the asset retirement obligation is settled for more or less than the carrying amount of the liability, a loss or gain will be recognized, respectively.
Stock-Based Compensation
The Company issues restricted stock to certain employees and members of the board of directors of the Company (the “Board”) for their services on the Board. The Company estimates the grant date fair value of each share of restricted stock at issuance. For awards subject to service-based vesting conditions, the Company recognizes, in the consolidated income statements, stock-based compensation expense equal to the grant date fair value of the award on a straight-line basis over the requisite service period, which is generally the vesting term. For awards subject to both performance and service-based vesting conditions, the Company recognizes stock-based compensation expense on a straight-line basis when it is probable that the performance condition will be achieved. Forfeitures are accounted for when they occur. The Company uses the market price of its shares as the grant date fair value for restricted stock awards.
Income Taxes
On December 22, 2017, the U.S. Tax Cuts and Jobs Act (the “Tax Reform Act”) was signed into law. The SEC subsequently issued Staff Accounting Bulletin 118, which allows issuers a one year measurement period to record adjustments related to the Tax Reform Act. As a result of the Tax Reform Act, the Company recorded a tax benefit of approximately
$8,500
due to a re-measurement of deferred tax assets and liabilities in the fourth quarter of 2017. The Company has finalized the accounting for income taxes for the Tax Reform Act with no material adjustments to the provisional amounts recorded.
The Company applies the provisions of ASC 740, “Income Taxes” (“ASC 740”), which principally utilizes a balance sheet approach to provide for income taxes. Under this method, deferred tax assets and liabilities are recognized for the expected future tax consequences of net operating loss carryforwards and temporary differences between the carrying amounts and the tax bases of assets and liabilities.
ASC 740 clarifies the accounting for uncertainty in income taxes recognized in an enterprise’s financial statements. The impact of an uncertain income tax position on the income tax returns must be recognized at the largest amount that is more-likely-than-not to be required to be recognized upon audit by the relevant taxing authority. This standard also provides guidance
74
SMART SAND, INC.
NOTES TO CONSOLIDATED FINANCIAL STATEMENTS
(IN THOUSANDS, EXCEPT PER SHARE DATA)
on de-recognition, measurement, classification, interest and penalties, accounting for interim periods, disclosure and transition issues with respect to tax positions. The Company includes interest and penalties as a component of income tax expense in the consolidated income statements. For the periods presented,
no
interest and penalties were recorded.
Environmental Matters
The Company is subject to various federal, state and local laws and regulations relating to the protection of the environment. Management has established procedures for the ongoing evaluation of the Company’s operations, to identify potential environmental exposures and to comply with regulatory policies and procedures. Environmental expenditures that relate to current operations are expensed or capitalized as appropriate. Expenditures that relate to an existing condition caused by past operations and do not contribute to current or future revenue generation are expensed as incurred. Liabilities are recorded when environmental costs are probable, and the costs can be reasonably estimated. The Company maintains insurance which may cover, in whole or in part, certain environmental expenditures. As of
December 31, 2018
and
2017
, there were
no
material probable environmental matters.
Segment Information
Reportable operating segments are identified as components of an enterprise about which separate discrete financial information is available for evaluation by the chief operating decision maker, or decision-making group, in making decisions on how to allocate resources and assess performance. The Company’s chief operating decision maker is the Chief Executive Officer. The Company and the Chief Executive Officer view the Company’s operations and manage its business, including the recently acquired logistics assets and wellsite storage solutions business, as
one
reportable operating segment.
Basic and Diluted Net Income Per Share of Common Stock
Basic net income per share of common stock is computed by dividing net income attributable to common stockholders by the weighted-average number of shares of common stock outstanding during the period, excluding the dilutive effects of restricted stock. Diluted net income per share of common stock is computed by dividing the net income attributable to common stockholders by the sum of the weighted-average number of shares of common stock outstanding during the period plus the potential dilutive effects of restricted stock outstanding during the period calculated in accordance with the treasury stock method, although these shares and restricted stock are excluded if their effect is anti-dilutive. The number of shares underlying equity-based awards that were excluded from the calculation of diluted earnings per share for the years ended
December 31, 2018
,
2017
,
2016
was
854
,
251
and
0
, respectively as their effect would be anti-dilutive. The following table reconciles the weighted-average common shares outstanding used in the calculation of basic net income per share to the weighted average common shares outstanding used in the calculation of diluted net income per share:
|
|
Year Ended December 31,
|
|||||||
|
|
2018
|
2017
|
2016
|
|||||
|
Determination of Shares
|
|
|
|
|
||||
|
Weighted average common shares outstanding
|
40,427
|
|
40,208
|
|
24,322
|
|
||
|
Assumed conversion of restricted stock
|
22
|
|
96
|
|
257
|
|
||
|
Diluted weighted average common stock outstanding
|
40,449
|
|
40,304
|
|
24,579
|
|
||
Reclassification
Certain financial statement items have been reclassified to conform to the current financial statement presentation. These reclassifications have no effect on previously reported net income.
Recent Accounting Pronouncements
Adopted
In January 2017, the FASB issued ASU 2017-04, Intangibles - Goodwill and Other (Topic 350), which simplifies the test for goodwill impairment. To simplify the subsequent measurement of goodwill, the Board eliminated Step 2 from the goodwill impairment test. In computing the implied fair value of goodwill under Step 2, an entity had to perform procedures to determine the fair value at the impairment testing date of its assets and liabilities (including unrecognized assets and liabilities) following the procedure that would be required in determining the fair value of assets acquired and liabilities assumed in a business
75
SMART SAND, INC.
NOTES TO CONSOLIDATED FINANCIAL STATEMENTS
(IN THOUSANDS, EXCEPT PER SHARE DATA)
combination. Instead, an entity should perform its annual, or interim, goodwill impairment test by comparing the fair value of a reporting unit with its carrying amount. An entity should recognize an impairment charge for the amount by which the carrying amount exceeds the reporting unit’s fair value; however, the loss recognized should not exceed the total amount of goodwill allocated to that reporting unit. The Company adopted this standard on October 1, 2018 and has applied the new accounting standard to its annual goodwill impairment test as of December 31, 2018.
In January 2017, the FASB issued ASU 2017-01, Business Combinations (Topic 805) Clarifying the Definition of a Business, which clarifies the definition of a business with the objective of adding guidance to assist entities with evaluating whether transactions should be accounted for as acquisitions (or disposals) of assets or businesses. The definition of a business affects many areas of accounting including acquisitions, disposals, goodwill, and consolidation. ASU 2017-01 is effective for annual periods beginning after December 15, 2017, including interim periods within those periods. The Company adopted this standard on January 1, 2018. The adoption of this guidance did not have a material effect on the Company’s financial position, results of operation or cash flows.
In August 2016, the FASB issued ASU 2016-15, Statement of Cash Flows (Topic 230) Classification of Certain Cash Receipts and Cash Payments, which eliminates the diversity in practice related to the classification of certain cash receipts and payments for debt prepayment or extinguishment costs, the maturing of a zero-coupon bond, the settlement of contingent liabilities arising from a business combination, proceeds from insurance settlements, distributions from certain equity method investees and beneficial interests obtained in a financial asset securitization. ASU 2016-15 designates the appropriate cash flow classification, including requirements to allocate certain components of these cash receipts and payments among operating, investing and financing activities. The guidance is effective for the Company beginning after December 15, 2017. The Company adopted this guidance effective January 1, 2018. The adoption of this guidance did not have a material effect on the Company’s financial position, results of operation or cash flows.
In May 2014, the FASB issued ASU 2014-09, Revenue from Contracts with Customers. The objective of ASU 2014-09 is to establish a single comprehensive model for entities to use in accounting for revenue arising from contracts with customers and will supersede most of the existing revenue recognition guidance, including industry specific guidance. The core principle of ASU 2014-09 is that an entity recognizes revenue to depict the transfer of promised goods or services to customers in an amount that reflects the consideration to which the entity expects to be entitled in exchange for those goods or services. In applying the new guidance, an entity will: (1) identify the contract(s) with a customer; (2) identify the performance obligations in the contract; (3) determine the transaction price; (4) allocate the transaction price to the contract’s performance obligations; and (5) recognize revenue when (or as) the entity satisfies a performance obligation. ASU 2014-09 applies to all contracts with customers except those that are within the scope of other topics in the FASB ASC. In April and May 2016, the FASB issued ASU 2016-10, Revenue from Contracts with Customers - Identifying Performance Obligations and Licensing, ASU 2016-11, Revenue Recognition and Derivatives and Hedging - Recession of SEC Guidance, ASU 2016-12, Revenue from Contracts with Customers - Narrow-Scope Improvements and Practical Expedients, and ASU 2016-20, Technical Corrections and Improvements to Topic 606, Revenue from Contracts with Customers. These ASUs each affect the guidance of the new revenue recognition standard in ASU 2014-09 and related subsequent ASUs. The new guidance is effective for annual reporting periods (including interim periods within those periods) beginning after December 15, 2017 for public companies. The Company adopted this standard on January 1, 2018.
Not yet adopted
In August 2018, the FASB issued ASU 2018-13, Fair Value Measurement (Topic 820), which modifies disclosure requirements for fair value measurements by removing the disclosure of the valuation process for Level 3 fair value measurements, among other disclosure modifications. The guidance is effective for the Company beginning after December 15, 2019, although early adoption is permitted. Companies are permitted to remove or modify disclosures upon issuance while delaying adoption of the additional disclosures. The Company is currently evaluating the effects of ASU 2018-13 on its consolidated financial statements.
In February 2016, the FASB issued ASU 2016-02, Leases (Topic 842), and related amendments, which replaces the existing guidance in ASC 840, Leases. ASU 2016-02 requires lessees to recognize most leases on their balance sheets as lease liabilities with corresponding right of use assets. The new lease standard does not substantially change lessor accounting. The new standard is effective for interim and annual reporting periods beginning after December 15, 2018, with early adoption permitted. The Company intends to adopt ASU 2016-02 and its related updates using the transition practical expedients, which allows the Company to use the existing lease population, classification and determination of initial direct costs when calculating the lease liability and right of use asset balances. The Company also intends to use the optional transition method, which allows
76
SMART SAND, INC.
NOTES TO CONSOLIDATED FINANCIAL STATEMENTS
(IN THOUSANDS, EXCEPT PER SHARE DATA)
the Company to initially apply the new standard at the adoption date and recognize a cumulative-effect adjustment to the opening balance of retained earnings. The Company has implemented new accounting policies and software to facilitate the recording and reporting of lease transactions and balances. The Company will record initial right of use assets and related liabilities of approximately
$36 million
on its consolidated balance sheet on January 1, 2019. Significant new disclosures in the notes to the financial statements will be added in the first quarterly report of 2019. The Company does not expect there to be a material impact on the other consolidated financial statements.
NOTE 3 — Acquisitions
Asset Acquisition - Van Hook Crude, LLC
The acquisition of the assets of Van Hook Crude, LLC occurred on March 15, 2018. The Company acquired all of the rights, title, and interest in certain properties and assigned contracts (collectively, the “Assets”) for a total consideration of
$15,549
in cash.
The acquisition cost has been allocated over the assets as set forth below.
|
Machinery, equipment and tooling
|
$
|
1,478
|
|
|
Plant and building
|
1,407
|
|
|
|
Railroad and sidings
|
9,926
|
|
|
|
Land improvements
|
2,738
|
|
|
|
Total assets acquired
|
$
|
15,549
|
|
Business Combination - Quickthree Solutions Inc.
On June 1, 2018, the Company acquired substantially all of the assets of Quickthree Solutions, Inc., a manufacturer of portable vertical frac sand storage solution systems.
The aggregate purchase price consisted of approximately
$30,000
cash paid at closing, subject to adjustment based upon Quickthree’s closing date working capital, and up to
$12,750
in potential earn-out payments over a
three
-year period after closing. Payment of the earn-out is based upon the production of silos and related equipment during the earn-out period. The closing portion of the purchase price was paid using cash on hand and advances under the Company’s Credit Facility. The Company expects the earn-out portion of the purchase price to be paid using cash on hand, equipment financing options available to the Company and advances under the Company’s Credit Facility. Goodwill in this transaction is attributable to planned expansion into the wellsite storage solutions market, and is fully deductible for tax purposes.
The table below presents the calculation of the total purchase consideration:
|
Base price - cash
|
$
|
30,000
|
|
|
Contingent consideration – earnout
|
9,200
|
|
|
|
Working capital adjustment
|
(122
|
)
|
|
|
Total purchase consideration
|
$
|
39,078
|
|
77
SMART SAND, INC.
NOTES TO CONSOLIDATED FINANCIAL STATEMENTS
(IN THOUSANDS, EXCEPT PER SHARE DATA)
The Company’s allocation of the purchase price in connection with the acquisition was calculated as follows.
|
Fair Value
|
Useful Life
|
|||||
|
Assets Acquired
|
||||||
|
Accounts receivable
|
$
|
112
|
|
|||
|
Inventory
|
1,700
|
|
||||
|
Prepaid expenses and other current assets
|
126
|
|
||||
|
Total current assets acquired
|
$
|
1,938
|
|
|||
|
Property, plant and equipment
|
740
|
|
||||
|
Customer relationships
|
270
|
|
1 year
|
|||
|
Developed technology
|
18,800
|
|
13 years
|
|||
|
Trade name
|
900
|
|
Indefinite
|
|||
|
Goodwill
|
16,935
|
|
||||
|
Other assets
|
225
|
|
||||
|
Total non-current assets acquired
|
37,870
|
|
||||
|
Total assets acquired
|
$
|
39,808
|
|
|||
|
Liabilities Assumed
|
||||||
|
Accounts payable
|
$
|
331
|
|
|||
|
Accrued and other expenses
|
399
|
|
||||
|
Total liabilities assumed
|
730
|
|
||||
|
Estimated fair value of net assets acquired
|
$
|
39,078
|
|
|||
The purchase price allocation is considered complete as of December 31, 2018. Total acquisition costs for the Quickthree acquisition incurred during the year ended
December 31, 2018
were
$1,159
, which are included in selling, general and administrative expense on the Company’s consolidated income statements. The goodwill and trade name have been fully impaired as of December 31, 2018. See Note 6 — Goodwill and Intangible Assets, net for additional information.
The Company determined the fair value of the contingent consideration to be
$9,200
at the June 1, 2018 acquisition date and recorded it as a liability in the Company’s consolidated balance sheets. Each reporting period, the Company reassesses its inputs including market comparable information and management assessments regarding potential future scenarios, then discounts the liabilities to present value. Subsequent to the acquisition, the Company recorded an adjustment to the contingent consideration in the amount of
$1,858
on the consolidated income statements, related the decrease in fair value of contingent consideration during the year ended
December 31, 2018
. The Company will continue to reassess earn-out calculations related to the contingent consideration in future periods.
NOTE 4 — Inventories
Inventories consisted of the following:
|
|
December 31,
|
||||||
|
|
2018
|
2017
|
|||||
|
Raw material
|
$
|
1,201
|
|
$
|
298
|
|
|
|
Work in progress
|
10,070
|
|
7,825
|
|
|||
|
Finished goods
|
4,648
|
|
832
|
|
|||
|
Spare parts
|
1,356
|
|
577
|
|
|||
|
Total sand inventory
|
17,275
|
|
9,532
|
|
|||
78
SMART SAND, INC.
NOTES TO CONSOLIDATED FINANCIAL STATEMENTS
(IN THOUSANDS, EXCEPT PER SHARE DATA)
Wellsite storage solutions inventory represents work in progress inventory related to existing arrangements at the time the Company acquired Quickthree and consisted of the following:
|
|
December 31,
|
||||||
|
|
2018
|
2017
|
|||||
|
Work in progress
|
$
|
1,300
|
|
$
|
—
|
|
|
|
Total wellsite storage solutions inventory
|
$
|
1,300
|
|
$
|
—
|
|
|
|
Total inventory
|
$
|
18,575
|
|
$
|
9,532
|
|
|
NOTE 5 — Property, Plant and Equipment, net
Net property, plant and equipment consists of:
|
|
December 31,
|
||||||
|
|
2018
|
2017
|
|||||
|
Machinery, equipment and tooling
|
$
|
14,858
|
|
$
|
7,802
|
|
|
|
Wellsite proppant storage solutions
|
5,286
|
|
—
|
|
|||
|
Vehicles
|
1,955
|
|
1,546
|
|
|||
|
Furniture and fixtures
|
1,140
|
|
720
|
|
|||
|
Plant and building
|
158,882
|
|
81,561
|
|
|||
|
Real estate properties
|
4,601
|
|
4,432
|
|
|||
|
Railroad and sidings
|
27,347
|
|
10,254
|
|
|||
|
Land and land improvements
|
27,167
|
|
16,378
|
|
|||
|
Asset retirement obligation
|
16,469
|
|
8,408
|
|
|||
|
Mineral properties
|
10,075
|
|
9,878
|
|
|||
|
Deferred mining costs
|
1,806
|
|
657
|
|
|||
|
Construction in progress
|
21,619
|
|
56,493
|
|
|||
|
|
291,205
|
|
198,129
|
|
|||
|
Less: accumulated depreciation and depletion
|
42,809
|
|
26,367
|
|
|||
|
Total property, plant and equipment, net
|
$
|
248,396
|
|
$
|
171,762
|
|
|
Depreciation expense was
$17,117
,
$7,267
and
$6,441
for the years ended
December 31, 2018
,
2017
and
2016
, respectively. Depletion expense was
$47
,
$33
and
$3
for the years ended
December 31, 2018
,
2017
and
2016
, respectively.
The Company capitalized
no
interest expense for the years ended December 31, 2018 and 2017, and
$139
of interest expense associated with the construction of new plant and equipment for the year ended December 31, 2016.
NOTE 6 — Goodwill and Intangible Assets, net
Goodwill
Goodwill represents the excess of the cost of businesses acquired over the fair market value of identifiable net assets at the dates of acquisition. The following table summarizes the Company’s goodwill as of
December 31, 2018
.
|
Total Goodwill
|
||||
|
Balance at January 1, 2018
|
$
|
—
|
|
|
|
Goodwill attributable to Quickthree Solutions, Inc. acquisition
|
16,935
|
|
||
|
Impairment charge
|
(16,935
|
)
|
||
|
Balance at December 31, 2018
|
$
|
—
|
|
|
79
SMART SAND, INC.
NOTES TO CONSOLIDATED FINANCIAL STATEMENTS
(IN THOUSANDS, EXCEPT PER SHARE DATA)
The Company conducts its evaluation of goodwill at the reporting unit level on an annual basis as of December 31 and more frequently if events or circumstances indicate that the carrying value of a reporting unit exceeds its fair value. All of the Company’s operations are in one reporting unit. The Company determined the fair value of its reporting unit using both a market multiples approach and the discounted cash flows method. In the second half of 2018, the Company saw a decline in demand for frac sand, consistent with the industry as a whole, which resulted in a decline in the Company’s stock price near the measurement date. The decline in the Company’s stock price near the measurement date and the relationship between the resulting market capitalization and the equity recorded on the Company’s balance sheet resulted in a full impairment of goodwill in 2018.
Intangible assets, net
The following table summarizes the Company’s intangible assets as of
December 31, 2018
and
2017
:
|
Estimated Useful Life (Years)
|
Gross Carrying Amount at December 31, 2017
|
Assets Acquired Pursuant to Business Combination
|
Accumulated Amortization
|
Impairment Charge
|
Net Book Value at December 31, 2018
|
|||||||||||||||||
|
Developed technology
|
13
|
$
|
—
|
|
$
|
18,800
|
|
$
|
844
|
|
$
|
—
|
|
$
|
17,956
|
|
||||||
|
Customer relationships
|
1
|
—
|
|
270
|
|
158
|
|
—
|
|
112
|
|
|||||||||||
|
Trade name
|
Indefinite
|
—
|
|
900
|
|
—
|
|
900
|
|
—
|
|
|||||||||||
|
$
|
—
|
|
$
|
19,970
|
|
$
|
1,002
|
|
$
|
900
|
|
$
|
18,068
|
|
||||||||
The Company uses the straight-line method to determine the amortization expense for its definite-lived intangible assets. The weighted-average remaining useful life for the intangible assets is
12.3 years
. Amortization expense related to intangible assets was
$1,002
for the year ended
December 31, 2018
. There were no intangible assets or related amortization expense as of or for the years ended
December 31, 2017
and
2016
.
The table below reflects the future estimated amortization expense for amortizable intangible assets as of
December 31, 2018
.
|
Year ending December 31,
|
||||
|
2019
|
$
|
1,558
|
|
|
|
2020
|
1,446
|
|
||
|
2021
|
1,446
|
|
||
|
2022
|
1,446
|
|
||
|
2023
|
1,446
|
|
||
|
Thereafter
|
10,726
|
|
||
|
Total
|
$
|
18,068
|
|
|
The Company conducted a review of its indefinite-lived intangible assets as of December 31, 2018 and has determined the fair value of its indefinite-lived intangibles exceed its fair value which resulted in a full impairment of indefinite-lived intangible assets in 2018.
80
SMART SAND, INC.
NOTES TO CONSOLIDATED FINANCIAL STATEMENTS
(IN THOUSANDS, EXCEPT PER SHARE DATA)
NOTE 7 — Accrued and Other Expense
Accrued and other expense consists of the following:
|
|
December 31,
|
||||||
|
|
2018
|
2017
|
|||||
|
Employee related expenses
|
$
|
1,894
|
|
$
|
667
|
|
|
|
Accrued construction related expenses
|
948
|
|
2,197
|
|
|||
|
Accrued professional fees
|
465
|
|
529
|
|
|||
|
Accrued royalties
|
1,780
|
|
206
|
|
|||
|
Accrued freight and delivery charges
|
2,556
|
|
2,197
|
|
|||
|
Deferred rent
|
712
|
|
861
|
|
|||
|
Other accrued liabilities
|
37
|
|
919
|
|
|||
|
Total accrued liabilities
|
$
|
8,392
|
|
$
|
7,576
|
|
|
NOTE 8 — Debt
The current portion of long-term debt consists of the following:
|
|
December 31,
|
||||||
|
|
2018
|
2017
|
|||||
|
Capital leases
|
$
|
90
|
|
$
|
572
|
|
|
|
Notes payable
|
739
|
|
288
|
|
|||
|
Total current portion of long-term debt
|
$
|
829
|
|
$
|
860
|
|
|
Long-term debt consists of the following:
|
|
December 31,
|
||||||
|
|
2018
|
2017
|
|||||
|
Credit Facility
|
$
|
44,255
|
|
$
|
—
|
|
|
|
Capital leases
|
547
|
|
—
|
|
|||
|
Notes payable
|
3,091
|
|
—
|
|
|||
|
Total long-term debt, net of current portion
|
$
|
47,893
|
|
$
|
—
|
|
|
Credit Facility
On December 8, 2016, the Company entered into a
$45,000
three
-year senior secured revolving Credit Facility under a revolving credit agreement with Jefferies Finance LLC as administrative and collateral agent, which bears interest at our option at either ABR (as defined in the revolving Credit Facility), plus an applicable margin of
2.00%
-
3.00%
, depending on the leverage ratio; or LIBOR plus an applicable margin of
3.00%
-
4.00%
, depending on the leverage ratio. Substantially all of the assets of the Company are pledged as collateral under the Credit Facility.
On April 8, 2018, the Credit Facility was amended to increase the Company’s total borrowing capacity under the Credit Facility to
$60,000
. The amendment was considered a modification of the Credit Facility. On July 13, 2018, the Credit Facility was amended to, among other things, (i) increase the limit on the Company’s ability to sell, transfer or dispose of assets, subject to certain considerations, from an aggregate amount of
$25,000
to
$55,000
, (ii) increase the limit on the Company’s ability to incur capital lease obligations from an aggregate principal amount of
$15,000
to
$30,000
and (iii) exclude certain current and future earn-out obligations from the definition of indebtedness in the Credit Agreement. On February 22, 2019, we entered into an agreement with the existing lenders on the Credit Facility to, among other things, (i) extend the maturity date of the Credit Facility to June 30, 2020 and (ii) reduce the total capacity to
$50,000
by December 31, 2019. The outstanding balance on the Credit Facility i
s included in long-term liabilities on our consolidated balance sheet at December 31, 2018.
81
SMART SAND, INC.
NOTES TO CONSOLIDATED FINANCIAL STATEMENTS
(IN THOUSANDS, EXCEPT PER SHARE DATA)
The Credit Facility contains various reporting requirements, negative covenants and restrictive provisions and requires maintenance of financial covenants, including a fixed charge coverage ratio and a leverage ratio, as defined in the Credit Agreement. As of
December 31, 2018
and
2017
, the Company was in compliance with all covenants. As of
December 31, 2018
, the amount of undrawn availability was
$15,500
.
As of
December 31, 2018
, fees attributable to the lender of
$728
are presented as a discount to the carrying value of the debt and the unamortized amount is presented as a reduction of long-term debt on the consolidated balance sheet.
Notes Payable
The Company entered into various financing arrangements to finance its manufactured wellsite proppant storage solutions equipment. Upon completion of the equipment manufacturing, the Company signs a note payable and title to the equipment passes to the financial institutions as collateral. The notes bear interest at rates between
6.48%
and
7.49%
. As of
December 31, 2018
, the Company may borrow an additional
$14,170
under these arrangements.
Capital Leases
The Company entered into various financing arrangements to finance equipment with interest rates between
6.80%
and
7.10%
. Equipment with a cost of
$657
and
$1,484
was capitalized and included in the Company’s property, plant and equipment as of
December 31, 2018
and
2017
, respectively. Depreciation expense for assets under equipment leases was
$155
,
$255
and
$293
for the years ended
December 31, 2018
,
2017
and
2016
, respectively. Accumulated depreciation for assets under equipment leases was
$1,167
and
$1,013
as of
December 31, 2018
and
2017
, respectively.
Future minimum payments as of
December 31, 2018
are as follows:
|
Year Ended December 31,
|
Credit Facility
|
Notes Payable
|
Capital Leases
|
Total
|
||||||||||||
|
2019
|
$
|
—
|
|
$
|
739
|
|
$
|
131
|
|
$
|
870
|
|
||||
|
2020
|
44,500
|
|
859
|
|
131
|
|
45,490
|
|
||||||||
|
2021
|
—
|
|
918
|
|
131
|
|
1,049
|
|
||||||||
|
2022
|
—
|
|
830
|
|
131
|
|
961
|
|
||||||||
|
2023
|
—
|
|
484
|
|
247
|
|
731
|
|
||||||||
|
Total minimum payments
|
44,500
|
|
3,830
|
|
771
|
|
49,101
|
|
||||||||
|
Amount representing interest
|
—
|
|
—
|
|
(134
|
)
|
(134
|
)
|
||||||||
|
Amount representing unamortized lender fees
|
(245
|
)
|
—
|
|
—
|
|
(245
|
)
|
||||||||
|
Present value of payments
|
—
|
|
—
|
|
637
|
|
48,722
|
|
||||||||
|
Less: current portion
|
—
|
|
(739
|
)
|
(90
|
)
|
(829
|
)
|
||||||||
|
Total long-term debt, net of current portion
|
$
|
44,255
|
|
$
|
3,091
|
|
$
|
547
|
|
$
|
47,893
|
|
||||
NOTE 9 — Asset Retirement Obligation
The Company had a post-closure reclamation and site restoration obligation of
$13,322
as of
December 31, 2018
. The following is a reconciliation of the total reclamation liability for asset retirement obligations.
|
Balance at December 31, 2016
|
$
|
1,384
|
|
|
Additions and revisions of prior estimates
|
7,084
|
|
|
|
Accretion expenses
|
514
|
|
|
|
Balance at December 31, 2017
|
$
|
8,982
|
|
|
Additions and revisions of prior estimates
|
7,546
|
|
|
|
Accretion expenses
|
(26
|
)
|
|
|
Settlement of liability
|
$
|
(3,180
|
)
|
|
Balance at December 31, 2018
|
$
|
13,322
|
|
82
SMART SAND, INC.
NOTES TO CONSOLIDATED FINANCIAL STATEMENTS
(IN THOUSANDS, EXCEPT PER SHARE DATA)
NOTE 10 — Stock-Based Compensation
Equity Incentive Plan
In May 2012, the Board approved the 2012 Equity Incentive Plan (“2012 Plan”), which provides for the issuance of Awards (as defined in the 2012 Plan) of up to a maximum of
440
shares of the Company’s common stock to employees, non-employee members of the Board, and consultants of the Company. During 2014, the 2012 Plan was amended to provide for the issuance of Awards up to
880
shares of the Company’s common stock. The awards could be issued in the form of incentive stock options, non-qualified stock options or restricted stock, and have expiration dates of
5
or
10
years after issuance, depending on whether the recipient held above
10%
of the voting power of all classes of the Company’s shares as of the grant date. The exercise price was based on the fair market value of the share on the date of issuance; vesting periods were determined by the Board upon issuance of the Award.
In November 2016, in connection with its initial public offering, the Company adopted the 2016 Omnibus Incentive Plan (“2016 Plan”) which provides for the issuance of Awards (as defined in the 2016 Plan) of up to a maximum of
3,911
shares of the Company’s common stock to employees, non-employee members of the Board and consultants of the Company. The awards can be issued in the form of incentive stock options, non-qualified stock options or restricted stock. Together, the 2012 Plan and the 2016 Plan are referenced to collectively as the “Plans”.
During
2018
,
2017
and
2016
,
746
,
352
and
161
shares of restricted stock were issued under the Plans, respectively. The grant date fair value of all the restricted stock per share was
$3.03
-
$19.00
. The shares vest over
one
to
five years
from their respective grant dates. For Awards issued under the 2016 Plan, the grant date fair value was the either the actual market price of the Company’s shares or an adjusted price using a Monte Carlo simulation for awards subject to the Company’s performance as compared to a defined peer group. The significant assumptions used in the Monte Carlo simulation are presented in the following table.
|
Years ended December 31,
|
|||||
|
|
2018
|
2017
|
|||
|
Expected volatility
|
67.13
|
%
|
59.48
|
%
|
|
|
Expected life (years)
|
2.67
|
|
2.75
|
|
|
|
Risk-free interest rate
|
2.55
|
%
|
1.49
|
%
|
|
The total number of shares and their respective fair values that vested during the years ended
December 31, 2018
,
2017
and
2016
were
177
at
$1,047
,
90
at
$731
and
167
at
$1,557
, respectively. For awards issued under the 2012 Plan, the grant date fair value was calculated based on a weighted analysis of (i) publicly-traded companies in a similar line of business to the Company (market comparable method) - Level 2 inputs, and (ii) discounted cash flows of the Company - Level 3 inputs.
The Company recognized
$2,938
,
$1,973
and
$1,072
of compensation expense for the restricted stock during
2018
,
2017
and
2016
, respectively, in cost of goods sold and operating expenses on the consolidated income statements. There is no impact to the cash flows of the Company related to stock-based compensation expense. At
December 31, 2018
, the Company had unrecognized compensation expense of
$5,782
related to granted but unvested stock awards. That expense is expected to be recognized as follows:
|
Year Ended December 31,
|
|||
|
2019
|
$
|
2,772
|
|
|
2020
|
1,896
|
|
|
|
2021
|
854
|
|
|
|
2022
|
260
|
|
|
|
$
|
5,782
|
|
|
83
SMART SAND, INC.
NOTES TO CONSOLIDATED FINANCIAL STATEMENTS
(IN THOUSANDS, EXCEPT PER SHARE DATA)
The following table summarizes restricted stock activity under the Plans from January 1,
2017
through
December 31, 2018
:
|
|
Number of
Shares
|
Weighted
Average
|
||||
|
Unvested, January 1, 2017
|
274
|
|
$
|
7.35
|
|
|
|
Granted
|
352
|
|
$
|
14.77
|
|
|
|
Vested
|
(90
|
)
|
$
|
8.01
|
|
|
|
Forfeiture
|
(2
|
)
|
$
|
8.94
|
|
|
|
Unvested, December 31, 2017
|
534
|
|
$
|
11.27
|
|
|
|
Granted
|
746
|
|
$
|
6.61
|
|
|
|
Vested
|
(177
|
)
|
$
|
12.15
|
|
|
|
Forfeiture
|
(76
|
)
|
$
|
11.56
|
|
|
|
Unvested December 31, 2018
|
1,027
|
|
$
|
9.83
|
|
|
Employee Stock Purchase Plan
Shares of the Company’s common stock may be purchased by eligible employees under the Company’s 2016 Employee Stock Purchase Plan in
six
-month intervals at a purchase price equal to at least
85%
of the lesser of the fair market value of the Company’s common stock on either the first day or the last day of each
six
-month offering period. Employee purchases may not exceed
20%
of their gross compensation during an offering period.
NOTE 11 — Income Taxes
The provision for income taxes consists of the following:
|
|
Year Ended December 31,
|
||||||||||
|
|
2018
|
2017
|
2016
|
||||||||
|
Current
|
|
|
|
|
|
|
|||||
|
Federal
|
$
|
230
|
|
$
|
(965
|
)
|
$
|
8,337
|
|
||
|
State and local
|
161
|
|
(39
|
)
|
518
|
|
|||||
|
Foreign
|
72
|
|
—
|
|
—
|
|
|||||
|
Total current expense (benefit)
|
463
|
|
(1,004
|
)
|
8,855
|
|
|||||
|
Deferred
|
|||||||||||
|
Federal
|
4,611
|
|
(2,221
|
)
|
537
|
|
|||||
|
State and local
|
48
|
|
416
|
|
2
|
|
|||||
|
Foreign
|
—
|
|
—
|
|
—
|
|
|||||
|
Total deferred income tax expense (benefit)
|
4,659
|
|
(1,805
|
)
|
539
|
|
|||||
|
Total income tax expense (benefit)
|
$
|
5,122
|
|
$
|
(2,809
|
)
|
$
|
9,394
|
|
||
84
SMART SAND, INC.
NOTES TO CONSOLIDATED FINANCIAL STATEMENTS
(IN THOUSANDS, EXCEPT PER SHARE DATA)
Income tax expense differs from the amounts computed by applying the statutory income tax rates to pretax income. The statutory income tax rates were
21%
for the year ended
December 31, 2018
and
35.0%
for the years ended
December 31, 2017
and
2016
. The reconciliations from the applicable statutory income tax rates to income tax (benefit) expense are as follows:
|
|
Year Ended December 31,
|
||||||||||
|
|
2018
|
2017
|
2016
|
||||||||
|
At statutory rate
|
$
|
5,000
|
|
$
|
6,551
|
|
$
|
6,931
|
|
||
|
Non-deductible interest expense
|
—
|
|
—
|
|
1,948
|
|
|||||
|
State taxes, net of US federal benefit
|
209
|
|
377
|
|
339
|
|
|||||
|
Foreign taxes
|
72
|
|
—
|
|
—
|
|
|||||
|
Federal tax deductions
|
238
|
|
(73
|
)
|
(679
|
)
|
|||||
|
Change in applicable tax rate
|
144
|
|
(8,468
|
)
|
—
|
|
|||||
|
Provision to return permanent difference
|
(129
|
)
|
(767
|
)
|
933
|
|
|||||
|
Refund claims
|
(120
|
)
|
(201
|
)
|
—
|
|
|||||
|
Fuel tax credit
|
(243
|
)
|
(166
|
)
|
—
|
|
|||||
|
Foreign tax credit
|
(49
|
)
|
—
|
|
—
|
|
|||||
|
Other
|
—
|
|
(62
|
)
|
(78
|
)
|
|||||
|
Total income tax expense (benefit)
|
$
|
5,122
|
|
$
|
(2,809
|
)
|
$
|
9,394
|
|
||
Deferred income taxes reflect the net tax effects of loss and credit carry-forwards and temporary differences between the carrying amounts of assets and liabilities for financial reporting purposes and the amounts used for income tax purposes.
Significant components of the Company’s deferred tax assets for federal and state income taxes are as follows:
|
|
Year Ended December 31,
|
||||||
|
|
2018
|
2017
|
|||||
|
Deferred tax assets:
|
|
|
|
|
|||
|
Reserves and accruals
|
$
|
918
|
|
$
|
176
|
|
|
|
Prepaid expenses and other
|
1,086
|
|
—
|
|
|||
|
Federal net operating losses
|
7,391
|
|
—
|
|
|||
|
State net operating losses
|
106
|
|
—
|
|
|||
|
Total gross deferred tax assets
|
9,501
|
|
176
|
|
|||
|
Deferred tax liabilities:
|
|||||||
|
Prepaid expenses and other
|
—
|
|
(988
|
)
|
|||
|
Depreciation and amortization
|
(27,399
|
)
|
(12,427
|
)
|
|||
|
Total gross deferred tax liabilities
|
(27,399
|
)
|
(13,415
|
)
|
|||
|
Noncurrent deferred tax liabilities, net
|
$
|
(17,898
|
)
|
$
|
(13,239
|
)
|
|
In assessing the realizability of deferred tax assets, the Company considered whether it is more likely than not that some portion or all of the deferred tax assets will not be realized. The ultimate realization of deferred tax assets is dependent upon the generation of future taxable income during the period in which those temporary differences become deductible. At
December 31, 2018
and
2017
, based on the Company’s future income projections and reversal of taxable temporary differences, management determined it was more likely than not that the Company will be able to realize the benefits of the deductible temporary differences. As of
December 31, 2018
and
2017
, the Company determined
no
valuation allowance was necessary.
As of
December 31, 2018
, the Company had federal net operating loss carryforwards of
$35,195
, with an unlimited carryforward and state net operating loss carryforwards of
$34,991
, which will expire if unused by 2038. The Company had no federal or state net operating losses as of
December 31, 2017
.
The Company has evaluated its tax positions taken as of
December 31, 2018
and
2017
and believes all positions taken would be upheld under examination from income taxing authorities. Therefore,
no
liability for the effects of uncertain tax
85
SMART SAND, INC.
NOTES TO CONSOLIDATED FINANCIAL STATEMENTS
(IN THOUSANDS, EXCEPT PER SHARE DATA)
positions has been recorded in the accompanying consolidated balance sheets as of
December 31, 2018
or
2017
. The Company is open to examination by taxing authorities beginning with the 2014 tax year.
NOTE 12 — Retirement Benefits
U.S. Defined Contribution Plan
The Company is the sponsor of a defined contribution plan, subject to the provisions of the Employee Retirement Income Security Act of 1974, that covers substantially all U.S. employees over the age of 21 that have been employed for at least 90 days. The plan allows participants to make pre-tax and Roth after-tax contributions and the Company provides
100%
matching contributions on the first
3%
of employee contributions and
50%
matching contributions on the next
2%
of employee contributions. Employees are immediately vested in both their contributions and the Company’s matching contributions. In accordance with the provisions of the plan, the Company may make additional discretionary contributions to the accounts of its participants. There were no additional discretionary contributions during the years ended
December 31, 2018
,
2017
and
2016
. During the years ended
December 31, 2018
,
2017
and
2016
, the Company made matching contributions of
$425
,
$336
and
$248
, respectively to its U.S. Defined Contribution Plan.
Canada Group Savings Plan and Deferred Profit Sharing Plan
The Company is the sponsor of a defined contribution plan that covers substantially all Canada employees that have been employed for at least 90 days. The plan allows participants to make contributions to the Group Savings Plan and the Company provides
100%
matching contributions on between
3%
-
5%
of the employee’s salary, depending on their length of service to the Deferred Profit Sharing Plan. Employees are immediately vested in their contributions to the Group Savings Plan and vest in the Company’s contributions to the Deferred Profit Sharing Plan after two years of service. All accounts opened prior to May 31, 2018 are fully vested. Subsequent to the acquisition of Quickthree, The Company made matching contributions of
$25
to its Deferred Profit Sharing Plan.
NOTE 13 — Concentrations
As of
December 31, 2018
,
four
customers accounted for
89%
of the Company’s total accounts receivable. As of
December 31, 2017
,
three
customers accounted for
49%
of the Company’s total accounts receivable.
During the years ended
December 31, 2018
,
2017
and
2016
,
66%
,
72%
and
96%
of our revenues were earned from
four
customers, respectively.
As of
December 31, 2018
,
one
vendor accounted for
16%
of the Company’s accounts payable. As of
December 31, 2017
,
two
vendors accounted for
28%
of the Company’s accounts payable.
During the years ended
December 31, 2018
,
2017
and
2016
,
two
suppliers accounted for
40%
,
59%
and
32%
of the Company’s cost of goods sold, respectively.
The Company’s sand inventory and mining operations are located in Wisconsin. There is a risk of loss if there are significant environmental, legal or economic changes to this geographic area.
The Company currently primarily utilizes one third-party rail company to ship its products to customers from its plant. There is a risk of business loss if there are significant impacts to this third party’s operations.
NOTE 14 — Common Stock
On November 9, 2016, in connection with its initial public offering (“IPO”), the Company’s Second Amended and Restated Certificate of Incorporation became effective to provide for a stock split of all issued and outstanding shares of common stock at a ratio of
2,200
for 1 (the “Stock Split”) and increased the authorized number of shares of common stock to
350,000
shares and authorized
10,000
shares of undesignated preferred stock that may be used from time to time by the Company’s board of directors in one or more series.
Owners of fractional shares outstanding after the Stock Split were paid cash for such fractional interests. The effective date of the Stock Split was November 9, 2016. All common stock share amounts disclosed in this Form 10-K reflect the Stock Split.
86
SMART SAND, INC.
NOTES TO CONSOLIDATED FINANCIAL STATEMENTS
(IN THOUSANDS, EXCEPT PER SHARE DATA)
On November 9, 2016, the Company consummated the IPO of
11,700
shares of common stock at a price of
$11.00
per share, generating net proceeds of
$121,000
after underwriting discounts and expenses. The Company used a portion of the net proceeds from the IPO to redeem all of its outstanding Series A Preferred Stock and to repay the outstanding indebtedness under its former revolving credit facility. On November 23, 2016, the underwriters exercised in full their option to purchase additional shares of common stock from the Company and the selling stockholders. On November 29, 2016, the Company consummated the sale of
878
shares of common stock to the underwriters pursuant to the underwriters’ exercise of their over-allotment option at a price of
$11.00
per share, generating proceeds of
$9,700
before underwriting discounts and expenses. The Company received no proceeds from the sale of common stock to the underwriters by the selling stockholders. The Company intends to use the net proceeds of the IPO for general corporate purposes.
On February 1, 2017, the Company completed the public offering and sale of
1,500
shares of common stock at a price of
$17.50
per share, generating net proceeds to the Company of approximately
$24,200
after underwriting discounts and expenses. The Company used the proceeds from this offering for current capital projects and general corporate services. The offering closed on February 7, 2017.
Note 15 — Warrants
In 2011, the Company issued certain management stockholders warrants to purchase
4,000
shares of common stock for a purchase price of
$0.0045
per share. The warrants were exercisable upon the achievement of certain triggering events, as defined in the warrant agreements. On December 2, 2016, a triggering event, as defined in the warrant agreement, had been achieved and all warrants were fully exercised.
NOTE 16 — Related Party Transactions
In January 2016, the Company provided a
1
-year,
0%
loan to its Chief Executive Officer in the amount of
$61
. This loan was fully forgiven and included as compensation in September 2016.
NOTE 17 — Commitments and Contingencies
Leases
The Company is obligated under certain operating leases and rental agreements for railcars, office space, land and other equipment. Certain lease agreements contain renewal options, escalation clauses, and purchase options and are accounted for on a straight-line basis over the lease term. Future minimum annual commitments under such operating leases at
December 31, 2018
are as follows:
|
Twelve months ending December 31,
|
|||
|
2019
|
$
|
16,926
|
|
|
2020
|
12,765
|
|
|
|
2021
|
9,597
|
|
|
|
2022
|
5,753
|
|
|
|
2023
|
3,721
|
|
|
|
Thereafter
|
32,852
|
|
|
|
Total future minimum annual commitments under operating lease obligations
|
$
|
81,614
|
|
Expense related to operating leases and rental agreements was
$14,421
,
$10,239
and
$7,065
for the years ended
December 31, 2018
,
2017
and
2016
, respectively. Lease expense related to railcars is included in cost of goods sold in the consolidated statements of operations.
Litigation
In addition to the matters described below, we may be subject to various legal proceedings, claims and governmental inspections, audits or investigations arising out of our operations in the normal course of business, which cover matters such as general commercial, governmental and trade regulations, product liability, environmental, intellectual property, employment and other actions. Although the outcomes of these routine claims cannot be predicted with certainty, in the opinion of management, the ultimate resolution of these matters will not have a material adverse effect on our financial statements.
87
SMART SAND, INC.
NOTES TO CONSOLIDATED FINANCIAL STATEMENTS
(IN THOUSANDS, EXCEPT PER SHARE DATA)
U.S. Well Services, LLC
On January 14, 2019, Smart Sand, Inc. (plaintiff) filed suit against U.S. Well Services, LLC (defendant) in the Superior Court of the State of Delaware in and for New Castle County (C.A. No. N19C-01-144-PRW [CCLD]). In the suit, plaintiff alleges that defendant is in breach of contract for failure to pay amounts due and payable under a long-term take-or-pay Master Product Purchase Agreement and coterminous Railcar Usage Agreement and is seeking unspecified monetary damages and other appropriate relief. Plaintiff is also seeking a declaratory judgment that the relevant agreements are continuing in full force and effect despite defendant’s purported notice of termination to the contrary. Defendant has filed an Answer, Affirmative Defenses and Counterclaim seeking unspecified monetary damages and declaratory relief. The Company intends to both vigorously prosecute its claims and defend against U.S. Well’s counterclaims. At this time, the Company is unable to express an opinion as to the likely outcome of the matter. Amounts recorded as accounts and unbilled receivables in the financial statements do not represent the full amounts sought in this lawsuit.
Schlumberger Technology Corporation
On January 3, 2019, Smart Sand, Inc. (plaintiff) filed suit against Schlumberger Technology Corporation (defendant) in the District Court of Harris County, Texas (Case No. 2019-00557). In the suit, plaintiff alleges that defendant is in breach of contract for failure to pay amounts due and payable under a long-term take-or-pay Master Product Purchase Agreement and is seeking unspecified monetary damages and other appropriate relief. Defendant has filed an Answer, Affirmative Defenses and Counterclaim seeking unspecified monetary damages and declaratory relief. The Company intends to both vigorously prosecute its claims and defend against defendant’s counterclaims. At this time, the Company is unable to express an opinion as to the likely outcome of the matter. Amounts recorded as accounts and unbilled receivables in the financial statements do not represent the full amounts sought in this lawsuit.
Bonds
The Company entered into performance bonds with Jackson County, Wisconsin and Monroe County, Wisconsin for
$4,400
and
$900
, respectively. The Company provided these performance bonds to assure performance under the reclamation plan filed with each respective county. The Company entered into permit bonds amounting to
$1,350
with certain towns and counties in which it operates to use designated town and county roadways. The Company provided these permit bonds to assure maintenance and restoration of the roadways. The Company has an outstanding
$1,943
bond to assure performance under its agreement with a pipeline common carrier. As of
December 31, 2018
and
2017
,
$0
and
$487
, respectively, of cash is being held as collateral related to the bond and is presented as restricted cash on the consolidated balance sheet.
NOTE 18 — Supplemental Disclosures of Cash Flow information
Supplemental disclosures regarding cash flow information and non-cash investing and financing activities are as follows:
|
Year Ended December 31,
|
|||||||||||
|
2018
|
2017
|
2016
|
|||||||||
|
Cash paid for interest
|
$
|
1,660
|
|
$
|
251
|
|
$
|
3,369
|
|
||
|
Cash paid for taxes
|
$
|
666
|
|
$
|
7,664
|
|
$
|
933
|
|
||
|
Non-cash investing activities:
|
|||||||||||
|
Contingent consideration
|
$
|
9,200
|
|
$
|
—
|
|
$
|
—
|
|
||
|
Asset retirement obligation
|
$
|
7,546
|
|
$
|
7,084
|
|
$
|
(188
|
)
|
||
|
Non-cash financing activities:
|
|||||||||||
|
Equipment purchased with debt
|
$
|
4,733
|
|
$
|
—
|
|
$
|
—
|
|
||
|
Leasehold improvements funded by landlord
|
$
|
—
|
|
$
|
787
|
|
$
|
—
|
|
||
|
Write-off of remaining balance of returned equipment under capital lease
|
$
|
398
|
|
$
|
—
|
|
$
|
—
|
|
||
|
Capitalized non-cash interest into property, plant and equipment
|
$
|
—
|
|
$
|
—
|
|
$
|
139
|
|
||
|
Capitalized expenditures in accounts payable and accrued expenses
|
$
|
3,014
|
|
$
|
17,477
|
|
$
|
48
|
|
||
88
SMART SAND, INC.
NOTES TO CONSOLIDATED FINANCIAL STATEMENTS
(IN THOUSANDS, EXCEPT PER SHARE DATA)
NOTE 19 —
Quarterly Financial Data (Unaudited)
The following table sets forth our unaudited quarterly consolidated statements of operations for each of the last four quarters for the periods ended
December 31, 2018
and
2017
. This unaudited quarterly information has been prepared on the same basis as our annual audited financial statements and includes all adjustments, consisting only of normal recurring adjustments that are necessary to present fairly the financial information for the fiscal quarters presented.
|
2018:
|
First Quarter
|
Second Quarter
|
Third Quarter
|
Fourth Quarter
|
||||||||
|
Revenue
|
42,628
|
|
54,448
|
|
63,146
|
|
52,248
|
|
||||
|
Cost of goods sold
|
35,413
|
|
34,678
|
|
40,595
|
|
34,217
|
|
||||
|
Operating expenses
|
5,862
|
|
6,861
|
|
5,145
|
|
23,820
|
|
||||
|
Net income
|
975
|
|
10,021
|
|
12,125
|
|
(4,433
|
)
|
||||
|
Earnings per share, basic
|
0.02
|
|
0.25
|
|
0.30
|
|
(0.11
|
)
|
||||
|
Earnings per share, diluted
|
0.02
|
|
0.25
|
|
0.30
|
|
(0.11
|
)
|
||||
|
2017:
|
First Quarter
|
Second Quarter
|
Third Quarter
|
Fourth Quarter
|
||||||||||||
|
Revenue
|
$
|
25,059
|
|
$
|
29,787
|
|
$
|
39,329
|
|
$
|
43,037
|
|
||||
|
Cost of goods sold
|
19,662
|
|
21,407
|
|
26,297
|
|
32,938
|
|
||||||||
|
Operating expenses
|
3,839
|
|
4,570
|
|
4,261
|
|
5,533
|
|
||||||||
|
Net income
|
969
|
|
2,624
|
|
7,047
|
|
10,886
|
|
||||||||
|
Earnings per share, basic
|
0.02
|
|
0.07
|
|
0.17
|
|
0.27
|
|
||||||||
|
Earnings per share, diluted
|
0.02
|
|
0.06
|
|
0.17
|
|
0.27
|
|
||||||||
ITEM 9. — CHANGES IN AND DISAGREEMENTS WITH ACCOUNTANTS AND FINANCIAL DISCLOSURE
None.
ITEM 9A. — CONTROLS AND PROCEDURES
Evaluation of Disclosure Controls and Procedures
Our management, with the participation of our Chief Executive Officer and Chief Financial Officer, has evaluated the effectiveness of our disclosure controls and procedures (as defined in Rules 13a-15(e) and 15d-15(e) under the Exchange Act) as of the end of the period covered by this Annual Report on Form 10-K. Based on such evaluation, our Chief Executive Officer and Chief Financial Officer have concluded that as of such date, our disclosure controls and procedures were effective.
Management’s Report on Internal Control Over Financial Reporting
Our management is responsible for establishing and maintaining adequate internal control over financial reporting, as defined in Rules 13a-15(f) and 15d-15(f) of the Exchange Act. Our internal control over financial reporting is a process designed under the supervision of our Chief Executive Officer and Chief Financial Officer to provide reasonable assurance regarding the reliability of financial reporting and the preparation of financial statements for external purposes in accordance with generally accepted accounting principles.
Because of its inherent limitations, internal control over financial reporting may not detect or prevent misstatements. Also, projections of any evaluation of the effectiveness to future periods are subject to risk that controls may become inadequate because of changes in conditions, or that the degree of compliance with the policies or procedures may deteriorate.
As of December 31, 2018, our management assessed the effectiveness of our internal control over financial reporting based on the criteria for effective internal control over financial reporting established in
Internal Control - Integrated Framework
, issued by the Committee of Sponsoring Organizations of the Treadway Commission in 2013. Based on its assessment, management determined that we maintained effective internal control over financial reporting as of December 31, 2018.
89
Our independent registered public accounting firm is not yet required to formally attest to the effectiveness of our internal controls over financial reporting, and will not be required to do so for as long as we are an “emerging growth company” pursuant to the provisions of the JOBS Act.
Changes in Internal Controls Over Financial Reporting
There have been no changes in our internal control over financial reporting for the three months ended December 31, 2018 that have materially affected, or are reasonably likely to materially affect, our internal control over financial reporting.
ITEM 9B. — OTHER INFORMATION
None.
90
PART III
ITEM 10. — DIRECTORS, EXECUTIVE OFFICERS AND CORPORATE GOVERNANCE
The information required by this item with respect to directors and corporate governance will be set forth under “Proposal No. 1: Election of Directors” in the 2019 Proxy Statement and is incorporated herein by reference.
The information required by this item with respect to executive officers of Smart Sand, Inc., pursuant to instruction 3 of paragraph (b) of Item 401 of Regulation S-K, is set forth following Part I, Item 1 of this Annual Report on Form 10-K under “Executive Officers of the Registrant”.
The information required by this item regarding Section 16(a) beneficial ownership reporting compliance will be set forth under “Section 16(a) Beneficial Ownership Reporting Compliance” in the 2019 Proxy Statement and is incorporated herein by reference.
ITEM 11. — EXECUTIVE COMPENSATION
The information required by this item will be set forth under “Executive Compensation” in the 2019 Proxy Statement and is incorporated herein by reference.
ITEM 12. — SECURITY OWNERSHIP OF CERTAIN BENEFICIAL OWNERS AND MANAGEMENT AND RELATED STOCKHOLDER MATTERS
The Equity Compensation Plan Information table required pursuant to Item 201(d) of Regulation S-K will be set forth in the 2019 Proxy Statement and is incorporated herein by reference.
The information required by Item 403 of Regulation S-K regarding security ownership of certain beneficial owners and management will be set forth under “Principal Stockholders” in the 2019 Proxy Statement and is incorporated herein by reference.
ITEM 13. — CERTAIN RELATIONSHIPS AND RELATED TRANSACTIONS, AND DIRECTOR INDEPENDENCE
The information required by this item will be set forth under “Certain Relationships and Transactions with Related Persons” and “Corporate Governance” in the 2019 Proxy Statement and is incorporated herein by reference.
ITEM 14. — PRINCIPAL ACCOUNTING FEES AND SERVICES
The information required by this item will be set forth under “Ratification of the Selection of Grant Thornton LLP as the Company’s Independent Registered Public Accounting Firm for the Year Ending December 31, 2019” in the 2019 Proxy Statement and is incorporated herein by reference.
91
PART IV
ITEM 15. — EXHIBITS
|
3.1
|
||
|
3.2
|
||
|
4.1
|
||
|
4.2
|
||
|
10.1†
|
||
|
10.2†
|
||
|
10.3†
|
||
|
10.4†
|
||
|
10.5†
|
||
|
10.6†
|
||
|
10.7†
|
||
|
10.8†
|
||
|
10.9†
|
||
|
10.10‡
|
||
|
10.11‡
|
||
|
10.12‡
|
||
|
10.13‡
|
||
|
10.14‡
|
||
|
10.15‡
|
||
92
|
10.16‡
|
||
|
10.17‡
|
||
|
10.18‡
|
||
|
10.19‡
|
||
|
10.20‡
|
||
|
10.21‡
|
||
|
10.22†
|
||
|
10.23
|
||
|
10.24
|
||
|
10.25‡
|
||
|
10.26‡
|
||
|
10.27†
|
||
|
10.28†
|
||
|
10.29†
|
||
|
10.30‡
|
||
|
10.31‡
|
||
|
10.32‡
|
||
|
10.33‡
|
||
|
10.34*‡
|
||
93
|
10.35‡
|
||
|
10.36
|
||
|
10.37
|
||
|
10.38
|
||
|
10.39*‡
|
||
|
10.40*‡
|
||
|
10.41*‡
|
||
|
21.1*
|
||
|
23.1*
|
||
|
31.1*
|
||
|
31.2*
|
||
|
32.1*
t
|
||
|
32.2*
t
|
||
|
95.1*
|
||
|
101.INS*
|
XBRL Instance Document
|
|
|
101.SCH*
|
XBRL Taxonomy Extension Schema
|
|
|
101.CAL*
|
XBRL Taxonomy Extension Calculation Linkbase
|
|
|
101.DEF*
|
XBRL Taxonomy Extension Definition Linkbase
|
|
|
101.LAB*
|
XBRL Taxonomy Extension Label Linkbase
|
|
|
101.PRE*
|
XBRL Taxonomy Extension Presentation Linkbase
|
|
|
*
|
Filed herewith
|
|
†
|
Compensatory plan, contract or arrangement.
|
|
‡
|
Certain portions have been omitted pursuant to a confidential treatment request. Omitted information has been separately filed with the Securities and Exchange Commission.
|
|
t
|
This certification is deemed not filed for purposes of section 18 of the Securities Exchange Act of 1934, as amended (Exchange Act), or otherwise subject to the liability of that section, nor shall it be deemed incorporated by reference into any filing under the Securities Act of 1933, as amended or the Exchange Act.
|
ITEM 16. — FORM 10-K SUMMARY
None.
94
Signatures
Date:
March 14, 2019
Pursuant to the requirements of Section 13 or 15(d) of the Securities Exchange Act of 1934, the registrant has duly caused this report to be signed on its behalf by the undersigned, thereunto duly authorized.
|
/s/ Charles E. Young
|
|
/s/ Lee E. Beckelman
|
|
Charles E. Young,
|
Lee E. Beckelman
|
|
|
Director and Chief Executive Officer
|
Chief Financial Officer
|
|
|
(Principal Executive Officer)
|
|
(Principal Financial Officer)
|
|
|
|
|
|
/s/ Susan Neumann
|
||
|
Susan Neumann
|
||
|
Controller and Vice President of Accounting
|
||
|
(Principal Accounting Officer)
|
||
|
/s/ José E. Feliciano
|
/s/ Andrew Speaker
|
|
|
José E. Feliciano
|
Andrew Speaker
|
|
|
Director
|
Director
|
|
|
(Co-Chairman of the Board)
|
(Co-Chairman of the Board)
|
|
|
/s/ Colin Leonard
|
/s/ Timothy J. Pawlenty
|
|
|
Colin Leonard
|
Timothy J. Pawlenty
|
|
|
Director
|
Director
|
|
|
/s/ Tracy Robinson
|
/s/ Sharon Spurlin
|
|
|
Tracy Robinson
|
Sharon Spurlin
|
|
|
Director
|
Director
|
|
95
TABLE OF CONTENTS
Part IItem 1. BusinessItem 1A. Risk FactorsItem 1B. Unresolved Staff CommentsItem 2. PropertiesItem 3. Legal ProceedingsItem 4. Mine Safety DisclosuresPart IIItem 5. Market For Registrant S Common Equity, Related Stockholder Matters and Issuer Purchases Of Equity SecuritiesItem 6. Selected Financial DataItem 7. Management S Discussion and Analysis Financial Condition and Results Of OperationsItem 7A. Quantitative and Qualitative Disclosures About Market RiskItem 8. Financial Statements and Supplementary DataNote 1 Organization and Nature Of BusinessNote 2 Summary Of Significant Accounting PoliciesNote 3 AcquisitionsNote 4 InventoriesNote 5 Property, Plant and Equipment, NetNote 6 Goodwill and Intangible Assets, NetNote 7 Accrued and Other ExpenseNote 8 DebtNote 9 Asset Retirement ObligationNote 10 Stock-based CompensationNote 11 Income TaxesNote 12 Retirement BenefitsNote 13 ConcentrationsNote 14 Common StockNote 15 WarrantsNote 16 Related Party TransactionsNote 17 Commitments and ContingenciesNote 18 Supplemental Disclosures Of Cash Flow InformationNote 19 Quarterly Financial Data (unaudited)Item 9. Changes in and Disagreements with Accountants and Financial DisclosureItem 9A. Controls and ProceduresItem 9B. Other InformationPart IIIItem 10. Directors, Executive Officers and Corporate GovernanceItem 11. Executive CompensationItem 12. Security Ownership Of Certain Beneficial Owners and Management and Related Stockholder MattersItem 13. Certain Relationships and Related Transactions, and Director IndependenceItem 14. Principal Accounting Fees and ServicesPart IVItem 15. ExhibitsItem 16. Form 10-k Summary