SECURITY NATIONAL FINANCIAL CORP
10-Ks and 10-Qs
|
|
|
|
|
|
|
|
|
|
|
|
|
|
|
|
|
|
|
|
|
|
|
|
|
|
|
|
|
|
|
|
|
|
|
|
|
|
|
|
|
|
|
|
|
|
|
|
|
|
|
|
|
|
|
|
UNITED STATES SECURITIES AND EXCHANGE COMMISSION
Washington, D.C. 20549
Form 10-K
[X] ANNUAL REPORT PURSUANT TO SECTION 13 OR 15(d) OF
THE SECURITIES EXCHANGE ACT OF 1934
For the fiscal year ended December 31, 2014, or
[ ] TRANSITION REPORT PURSUANT TO SECTION 13 OR 15(d)
OF THE SECURITIES EXCHANGE ACT OF 1934
For the Transition Period from _____ to _____
Commission file number 000-09341
SECURITY NATIONAL FINANCIAL CORPORATION
(Exact name of registrant as specified in its charter)
|
UTAH
|
87-0345941
|
|
(State or other jurisdiction of incorporation or organization)
|
(I.R.S. Employer Identification No.)
|
|
5300 South 360 West, Suite 250 Salt Lake City, Utah
|
84123
|
|
(Address of principal executive offices)
|
(Zip Code)
|
|
Registrant’s telephone number, including area code:
|
(801) 264-1060
|
Securities registered pursuant to Section 12(b) of the Securities Exchange Act of 1934: None
Securities registered pursuant to Section 12(g) of the Securities Exchange Act of 1934:
|
Title of each class
|
Name of each exchange on which registered
|
|
Class A common stock, $2.00 Par Value
|
Nasdaq National Market
|
|
Class C common stock, $2.00 Par Value
|
None
|
Indicate by check mark if the registrant is a well-known seasoned issuer, as defined in Rule 405 of the Securities Act. Yes [ ] No [X]
Indicate by check mark if the registrant is not required to file reports pursuant to Section 13 or Section 15(d) of the Exchange Act. Yes [ ] No [X]
Indicate by check mark whether the registrant (1) has filed all reports required to be filed by Section 13 or 15(d) of the Exchange Act during the preceding 12 months (or for such shorter period that the registrant was required to file such reports), and (2) has been subject to such filing requirements for the past 90 days.
Yes [X] No [ ]
Indicate by check mark whether the registrant has submitted electronically and posted on its corporate Website, if any, every Interactive Data File required to be submitted and posted pursuant to Rule 405 of Regulation S-T (§ 232.405 of this chapter) during the preceding 12 months (or for such shorter period that the registrant was required to submit and post such files). Yes [X] No [ ]
Indicate by check mark if disclosure of delinquent filers pursuant to Item 405 of Regulation S-K (§229.405 of this chapter) is not contained herein, and will not be contained, to the best of registrant’s knowledge, in definitive proxy or information statements incorporated by reference in Part III of this Form 10-K or any amendment to this Form 10-K. [ ]
Indicate by check mark whether the registrant is a large accelerated filer, an accelerated filer, a non-accelerated filer, or smaller reporting company. See the definitions of “large accelerated filer,” “accelerated filer” and “smaller reporting company” in Rule 12b-2 of the Exchange Act. (check one):
|
Large accelerated filer [ ]
|
Accelerated filer [ ] |
Nonaccelerated filer [ ]
|
Smaller reporting company [X]
|
|
(Do not check if a smaller reporting company)
|
|||
Indicate by check mark whether the registrant is a shell company (as defined in Rule 12b-2 of the Exchange Act). Yes [ ] No [X]
As of June 30, 2014, the aggregate market value of the registrant’s Class A common stock held by non-affiliates of the registrant was $18,028,000 based on the $4.07 closing sale price of the Class A common stock as reported on The Nasdaq National Market.
As of March 25, 2015, there were outstanding 12,460,013 shares of Class A common stock, $2.00 par value per share, and 1,393,538 shares of Class C common stock, $2.00 par value per share.
Documents Incorporated by Reference
None.
1
Security National Financial Corporation
Form 10-K
For the Fiscal Year Ended December 31, 2014
TABLE OF CONTENTS
|
Page
|
||
|
|
||
|
Item 1.
|
Business
|
3
|
|
Item 2.
|
Properties
|
11
|
|
Item 3.
|
Legal Proceedings
|
14
|
|
Item 4.
|
Mine Safety Disclosures
|
17
|
|
|
||
|
Item 5.
|
Market for Registrant’s Common Equity, Related Stockholder Matters and Issuer Purchases of Equity Securities
|
17
|
|
Item 6.
|
Selected Financial Data
|
19
|
|
Item 7.
|
Management’s Discussion and Analysis of Financial Condition and Results of Operations
|
20
|
|
Item 7A.
|
Quantitative and Qualitative Disclosures About Market Risk
|
36
|
|
Item 8.
|
Financial Statements and Supplementary Data
|
36
|
|
Item 9.
|
Changes in and Disagreements with Accountants on Accounting and Financial Disclosure
|
108
|
|
Item 9A.
|
Controls and Procedures
|
108
|
|
Item 9B.
|
Other Information
|
108
|
|
|
||
|
Item 10.
|
Directors, Executive Officers and Corporate Governance
|
110
|
|
Item 11.
|
Executive Compensation
|
115
|
|
Item 12.
|
Security Ownership of Certain Beneficial Owners and Management and Related Stockholder Matters
|
125
|
|
Item 13.
|
Certain Relationships and Related Transactions and Director Independence
|
127
|
|
Item 14.
|
Principal Accounting Fees and Services
|
127
|
|
|
||
|
Item 15.
|
Exhibits and Financial Statement Schedules
|
128
|
2
Security National Financial Corporation (the “Company”) operates in three main business segments: life insurance, cemetery and mortuary, and mortgage loans. The life insurance segment is engaged in the business of selling and servicing selected lines of life insurance, annuity products, and accident and health insurance. These products are marketed in 38 states through a commissioned sales force of independent licensed insurance agents who may also sell insurance products of other companies. The cemetery and mortuary segment of the Company consists of seven mortuaries and five cemeteries in the state of Utah and one cemetery in the state of California. The Company also engages in pre-need selling of funeral, cemetery, mortuary and cremation services through its Utah and California operations. Many of the insurance agents also sell pre-need funeral, cemetery and cremation services. The mortgage loan segment originates and underwrites or otherwise purchases residential and commercial loans for new construction, existing homes and real estate projects. The mortgage loan segment operates through 123 wholesale and retail offices in 23 states, and is an approved mortgage lender in several other states.
The Company’s design and structure are that each business segment is related to the other business segments and contributes to the profitability of the other segments. Because of the Company’s cemetery and mortuary operations in Utah and California, the Company enjoys a level of public awareness that assists in the sales and marketing of insurance and pre-need cemetery and funeral products. The Company’s insurance subsidiaries invest their assets (including, in part, pre-paid funeral products and services) in investments authorized by the respective insurance departments of their states of domicile. The Company also pursues growth through acquisitions. The Company’s acquisition business strategy is based on reducing the overhead cost of the acquired company by utilizing the Company’s existing personnel, management, and technology while still providing quality service to customers and policyholders.
The Company was organized as a holding company in 1979, when Security National Life Insurance Company (“Security National Life”) became a wholly owned subsidiary of the Company and the former stockholders of Security National Life became stockholders of the Company. Security National Life was formed in 1965 and has acquired or purchased significant blocks of business which include Capital Investors Life Insurance Company (1994), Civil Service Employees Life Insurance Company (1995), Southern Security Life Insurance Company of Florida (1998), Menlo Life Insurance Company (1999), Acadian Life Insurance Company (2002), Paramount Security Life Insurance Company (2004), Memorial Insurance Company of America (2005), Capital Reserve Life Insurance Company (2007), Southern Security Life Insurance Company of Mississippi (2008), North America Life Insurance Company (2011), Trans-Western Life Insurance Company (2012), Mothe Life Insurance Company (2012) and DLE Life Insurance Company (2012).
The cemetery and mortuary operations have also grown through the acquisition of other cemetery and mortuary companies. The cemetery and mortuary companies that the Company has acquired and still owns Holladay Memorial Park, Inc. (1991), Cottonwood Mortuary, Inc. (1991) and Deseret Memorial, Inc. (1991).
In 1993, the Company formed SecurityNational Mortgage Company (“SecurityNational Mortgage”) to originate and refinance residential mortgage loans. In 2012, the Company formed Green Street Mortgage Services, Inc. (“Green Street Mortgage”) to originate and refinance residential mortgage loans.
See Note 14 of the Notes to Consolidated Financial Statements for additional information regarding business segments of the Company.
Life Insurance
Products
The Company, through Security National Life, issues and distributes selected lines of life insurance and annuities. The Company’s life insurance business includes funeral plans and interest-sensitive life insurance, as well as other traditional life, accident and health insurance products. The Company places specific marketing emphasis on funeral plans through pre-need planning. The Company’s other insurance subsidiaries, Memorial Insurance Company of America (“Memorial Insurance Company”), Southern Security Life Insurance Company of Mississippi (“Southern Security”) and Trans-Western Life Insurance Company (“Trans-Western”), service and maintain policies that were purchased prior to their acquisition by Security National Life.
A funeral plan is a small face value life insurance policy that generally has face coverage of up to $25,000. The Company believes that funeral plans represent a marketing niche that has lower competition because most insurance companies do not offer similar coverage. The purpose of the funeral plan policy is to pay the costs and expenses incurred at the time of a person’s death. On a per thousand dollar cost of insurance basis, these policies can be more expensive to the policyholder than many types of non-burial insurance due to their low face amount, requiring the fixed cost of the policy administration to be distributed over a smaller policy size, and the simplified underwriting practices that result in higher mortality costs.
3
Markets and Distribution
The Company is licensed to sell insurance in 38 states. The Company, in marketing its life insurance products, seeks to locate, develop and service specific niche markets. The Company’s funeral plan policies are sold primarily to persons who range in age from 45 to 85and have low to moderate income.
A majority of the Company’s funeral plan premiums come from the states of Arkansas, California, Georgia, Louisiana, Mississippi, Missouri, Texas and Utah.
The Company sells its life insurance products through direct agents, brokers and independent licensed agents who may also sell insurance products of other companies. The commissions on life insurance products range from approximately 50% to 120% of first year premiums. In those cases where the Company utilizes its direct agents in selling such policies, those agents customarily receive advances against future commissions.
In some instances, funeral plan insurance is marketed in conjunction with the Company’s cemetery and mortuary sales force. When it is marketed by that group, the beneficiary is usually the Company’s cemeteries and mortuaries. Thus, death benefits that become payable under the policy are paid to the Company’s cemetery and mortuary subsidiaries to the extent of services performed and products purchased.
In marketing funeral plan insurance, the Company also seeks and obtains third-party endorsements from other cemeteries and mortuaries within its marketing areas. Typically, these cemeteries and mortuaries will provide letters of endorsement and may share in mailing and other lead-generating costs since these businesses are usually made the beneficiary of the policy. The following table summarizes the life insurance business for the five years ended December 31, 2014:
|
2014
|
2013
|
2012
|
2011
|
2010
|
||||||||||||||||||||
|
Life Insurance
|
497,933 | 498,228 | 502,978 | 414,411 | 398,774 | |||||||||||||||||||
|
Policy/Cert Count as of December 31
|
(2 | ) | (1 | ) | ||||||||||||||||||||
|
Insurance in force as of December 31 (omitted 000)
|
$ | 2,763,496 | $ | 2,828,470 | $ | 2,913,419 | (2 | ) | $ | 2,969,648 | (1 | ) | $ | 3,003,622 | ||||||||||
|
Premiums Collected (omitted 000)
|
$ | 52,418 | $ | 50,009 | $ | 48,168 | $ | 47,982 | (1 | ) | $ | 38,579 | ||||||||||||
|
(1)
|
Includes the assumption reinsurance of North America Life Insurance Company.
|
|
|
(2)
|
Includes coinsurance with Mothe Life Insurance Company and DLE Life Insurance Company.
|
Underwriting
The factors considered in evaluating an application for ordinary life insurance coverage can include the applicant’s age, occupation, general health and medical history. Upon receipt of a satisfactory (non-funeral plan insurance) application, which contains pertinent medical questions, the Company issues insurance based upon its medical limits and requirements subject to the following general non-medical limits:
|
Age Nearest
|
Non-Medical
|
|
Birthday
|
Limits
|
|
0-50
|
$100,000
|
|
51-up
|
Medical information required (APS or exam)
|
When underwriting life insurance, the Company will sometimes issue policies with higher premium rates for substandard risks.
The Company’s funeral plan insurance is written on a simplified medical application with underwriting requirements being a completed application, a phone inspection on the applicant, and a Medical Information Bureau inquiry. There are several underwriting classes in which an applicant can be placed.
Annuities
Products
The Company’s annuity business includes single premium deferred annuities, flexible premium deferred annuities and immediate annuities. A single premium deferred annuity is a contract where the individual remits a sum of money to the Company, which is retained on deposit until such time as the individual may wish to annuitize or surrender the contract for cash. A flexible premium deferred annuity gives the contract holder the right to make premium payments of varying amounts or to make no further premium payments after his initial payment. These single and flexible premium deferred annuities can have initial surrender charges. The surrender charges act as a deterrent to individuals who may wish to prematurely surrender their annuity contracts. An immediate annuity is a contract in which the individual remits a sum of money to the Company in return for the Company’s obligation to pay a series of payments on a periodic basis over a designated period of time, such as an individual’s life, or for such other period as may be designated.
4
Annuities have guaranteed interest rates that range from 1% to 6.5% per annum. Rates above the guaranteed interest rate credited are periodically modified by the Board of Directors at their discretion. In order for the Company to realize a profit on an annuity product, the Company must maintain an interest rate spread between its investment income and the interest rate credited to the annuities. Commissions, issuance expenses and general and administrative expenses are deducted from this interest rate spread.
Markets and Distribution
The general market for the Company’s annuities is middle to older age individuals who wish to save or invest their money in a tax-deferred environment. The major source of annuity considerations comes from direct agents. Annuities are also sold in conjunction with other insurance sales. If an individual does not qualify for a funeral plan due to health considerations, the agent will often sell that individual an annuity to fund those final expenses.
The following table summarizes the annuity business for the five years ended December 31, 2014:
|
2014
|
2013
|
2012
|
2011
|
2010
|
|||||||||||||||||||
|
Annuities Policy/Cert Count as of December 31
|
12,701 | 12,703 | 12,320 | 11,313 | (1 | ) | 12,344 | ||||||||||||||||
|
Deposits Collected (omitted 000)
|
$ | 8,010 | $ | 7,281 | $ | 6,777 | $ | 5,757 | (1 | ) | $ | 6,166 | |||||||||||
|
(1)
|
Includes the assumption reinsurance of North America Life Insurance Company.
|
Accident and Health
Products
With the acquisition of Capital Investors in 1994, the Company acquired a block of accident and health policies that pay limited benefits to policyholders. The Company currently offers low-cost comprehensive diver’s accident policies that provide worldwide coverage for medical expense reimbursement in the event of diving accidents.
Markets and Distribution
The Company markets its diver’s accident policies through the internet.
The following table summarizes the accident and health insurance business for the five years ended December 31, 2014:
|
2014
|
2013
|
2012
|
2011
|
2010
|
||||||||||||||||
|
Accident and Health Policy/Cert Count as of December 31
|
5,838 | 6,451 | 7,291 | 8,268 | 9,269 | |||||||||||||||
|
Premiums Collected (omitted 000)
|
$ | 133 | $ | 144 | $ | 158 | $ | 175 | $ | 203 | ||||||||||
Reinsurance
The primary purpose of reinsurance is to enable an insurance company to write issue an insurance policy in an amount larger than the risk the Company is willing to assume for itself. The Company remains obligated for the amounts reinsured (ceded) in the event the reinsurers do not meet their obligations.
The Company currently cedes and assumes certain risks with various authorized unaffiliated reinsurers pursuant to reinsurance treaties, which are generally renewed annually. The premiums paid by the Company are based on a number of factors, primarily including the age of the insured and the risk ceded to the reinsurer.
The Company’s policy is to retain no more than $100,000 of ordinary insurance per insured life, with the excess risk being reinsured. The total amount of life insurance reinsured by other companies as of December 31, 2014 was $67,761,000, which represents approximately 2.5% of the Company’s life insurance in force on that date.
See “Management’s Discussion and Analysis of Results of Operations and Financial Condition” and “Notes to Consolidated Financial Statements” for additional disclosure and discussion regarding reinsurance.
5
Investments
The investments that support the Company’s life insurance and annuity obligations are determined by the investment committees of the Company’s subsidiaries and ratified by the full Board of Directors of the respective subsidiaries. A significant portion of the Company’s investments must meet statutory requirements governing the nature and quality of permitted investments by its insurance subsidiaries. The Company maintains a diversified portfolio consisting of common stocks, preferred stocks, municipal bonds, investment and non-investment grade bonds, mortgage loans, real estate, short-term investments and other securities and investments.
See “Management’s Discussion and Analysis of Results of Operations and Financial Condition” and “Notes to Consolidated Financial Statements” for additional disclosure and discussion regarding investments.
Cemetery and Mortuary
Products
The Company currently operates six cemeteries and seven mortuaries. Through its cemetery and mortuary operations, the Company markets a variety of products and services both on a pre-need basis (prior to death) and an at-need basis (at the time of death). The products include: plots, interment vaults, mausoleum crypts, markers, caskets, flowers and other death care related products. These services include: professional services of funeral directors, opening and closing of graves, use of chapels and viewing rooms, and use of automobiles and clothing. The Company has a mortuary at each of its cemeteries, other than Holladay Memorial Park and Singing Hills Memorial Park, and has three separate stand-alone mortuary facilities.
Markets and Distribution
The Company’s pre-need cemetery and mortuary sales are marketed to persons of all ages but are generally purchased by persons 45 years of age and older. The Company is limited in its geographic distribution of these products to areas lying within an approximate 20-mile radius of its mortuaries and cemeteries. The Company’s at-need sales are similarly limited in geographic area.
The Company actively seeks to sell its cemetery and funeral products to customers on a pre-need basis. The Company employs cemetery sales representatives on a commission basis to sell these products. Many of these pre-need cemetery and mortuary sales representatives are also licensed insurance salesmen and sell funeral plan insurance. In many instances, the Company’s cemetery and mortuary facilities are the named beneficiary of the funeral plan policies.
Potential customers are located via telephone sales prospecting, responses to letters mailed by the pre planning consultants, newspaper inserts, referrals, and door-to-door canvassing. The Company trains its sales representatives and helps generate leads for them.
Mortgage Loans
Products
The Company, through its wholly owned subsidiaries, SecurityNational Mortgage Company and Green Street Mortgage Services, Inc., is active in the residential real estate market. Both mortgage subsidiaries are approved and regulated by the U.S. Department of Housing and Urban Development (HUD), the Federal National Mortgage Association (Fannie Mae), the Federal Home Loan Mortgage Corporation (Freddie Mac), and other secondary market investors, to originate a variety of residential mortgage loan products, which are subsequently sold to investors. The Company uses internal and external funding sources to fund mortgage loans.
Security National Life originates commercial real estate loans, residential construction loans and land development loans for internal investment.
Markets and Distribution
The Company’s residential mortgage lending services are marketed primarily to real estate brokers and mortgage originators. The Company has a strong retail origination presence in the Utah, Florida, Nevada, and Texas markets in addition to three wholesale branch offices located in Florida, Texas and Utah, with sales representatives in these and other states. See “Management’s Discussion and Analysis of Results of Operations and Financial Condition” and “Notes to Consolidated Financial Statements” for additional disclosure and discussion regarding mortgage loans.
6
Recent Acquisitions and Other Business Activities
Reinsurance Agreement with American Republic Insurance Company
On February 11, 2015, the Company signed a coinsurance agreement to reinsure certain life insurance policies from American Republic Insurance Company (“American Republic”). The policies were previously reinsured by North America Life under a coinsurance agreement between World Insurance Company (“World Insurance”) and North America Life entered into on July 22, 2009, which was commuted. World Insurance was subsequently purchased by and merged into American Republic. The current coinsurance agreement is between the Company and American Republic and became effective on January 1, 2015. As part of the coinsurance agreement, American Republic transferred all contractual obligations and risks to the Company, and the Company took control of $15,004,771 of assets in a trust account held by Texas Capital Bank as the trustee.
Reinsurance Agreement with LJA Insurance Company
On December 19, 2014, the Company entered into a Coinsurance Funds Withheld Reinsurance Agreement with LJA Insurance Company (“LJA Insurance”), a Republic of the Marshall Islands domiciled insurance company. This agreement was effective November 1, 2014. Under the terms of the funds withheld agreement, the Company ceded to LJA Insurance 100% of three blocks of deferred annuities in the amount of $4,337,000 and retained the assets and recorded a funds held under coinsurance liability for the same amount. LJA Insurance agreed to pay the Company an initial ceding commission of $60,000 and an asset management fee of $16,000 per quarter to administer the policies. The Company will also receive a 90% experience refund for any profits from the business. The Company has the right to recapture the business by giving LJA Insurance 90 days written notice, or it may be terminated by mutual consent of both parties.
Sale of Paradise Chapel Funeral Home, Inc.
On December 8, 2014, the Company and its subsidiaries, Paradise Sunset Chapel Funeral Home, Inc. (“Paradise Sunset Chapel”), and Security National Life completed an asset sales transaction with 40
th
Street Developers, LLC (“40
th
Street”), to sell certain real estate. Under the terms of the asset purchase agreement among Paradise Sunset Chapel, Security National Life and 40
th
Street, 40
th
Street paid $1,505,000 at closing to Paradise Sunset Chapel and Security National Life.
Acquisition of American Funeral Financial
On June 4, 2014, the Company, through its wholly owned subsidiary, SNFC Subsidiary, LLC, completed a purchase transaction with American Funeral Financial, LLC, a South Carolina limited liability company, and Hypershop, LLC, a North Carolina limited liability company and sole owner of all the limited liability company interests of American Funeral Financial, to purchase all of the outstanding limited liability company interests, or membership units, of American Funeral Financial. American Funeral Financial is engaged in the operation of a factoring business with the principal purpose to provide funding for funeral homes and mortuaries. For the year ended December 31, 2013, American Funeral Financial had revenues of $5,026,000 with a net income of $164,000. As of December 31, 2013, the total assets of American Funeral Financial were $19,153,000 and total equity was $1,680,000.
Under the terms of the transaction, as set forth in the Purchase Agreement dated June 4, 2014, among the Company, SNFC Subsidiary, American Funeral Financial and Hypershop, the Company paid Hypershop purchase consideration equal to (i) $3,000,000 in cash, of which $175,000 was deposited into an interest bearing escrow account to be held for a period of twelve months from the closing date to pay off the indebtedness and other liabilities of American Funeral Financial, plus (ii) $12,011,183, representing the amount of the good standing receivables of American Funeral Financial, plus (iii) earn-out payments equal to .0042 of the aggregate amount of life insurance assignments funded by American Funeral Financial during the three year period following the closing date of the transaction. This earn-out liability was estimated to be $1,368,000. The purchase consideration was to be used to pay off the indebtedness that American Funeral Financial owed to Security Finance Corporation of Spartanburg, as well as to pay off all other indebtedness and liabilities of American Funeral Financial.
The good standing receivables of American Funeral Financial are defined as its assignment receivables outstanding for less than 120 days from the closing date. Within 15 business days after the expiration of the 120-day period following the closing date, the Company agrees to provide Hypershop with reasonable supporting detail of the amount of any assignment receivables included in the good standing receivables that were not collected in full by the Company during such 120-day period, and which of the uncollected good standing receivables that the Company elects to receive payment from Hypershop. Thus, under the Purchase Agreement, the Company is entitled to payment from Hypershop for any uncollected good standing receivables in which the Company elects to receive payment.
7
The uncollected good standing receivables payment is to be paid to the Company within 15 days from Hypershop’s receipt of the uncollected receivable notice from the Company through reduction of funds in the escrow account until the escrow amount has been reduced to zero or fully disbursed, and if the escrow amount is insufficient, then payment is to be made by offsetting or crediting the amounts owed to the Company from the earn-out payments owed to Hypershop until the Company has received full payment of the amount equal to the uncollected receivables payment. The Company, SNFC Subsidiary, Hypershop and American Funeral agree that if the escrow amount and the offsets against earn-out payments are insufficient to pay the amount of the uncollected good standing receivables and the outstanding indebtedness and other liabilities of American Funeral Financial as of the closing date, then the Company has no further recourse against Hypershop, and Hypershop has no further obligation or liability to the Company.
During the period between the closing date and 270 days after the closing date, the Company is required to use commercially reasonable efforts to collect all outstanding receivables, including assignment receivables outstanding for over 120 days from the closing date. In the event that the Company collects any assignment receivables that are outstanding for more than 120 days, the Company agrees to pay Hypershop the amount of such receivables within 15 business days after the receipt of such receivables. If the Company is unable to collect all the outstanding receivables that are more than 120 days from the closing date, the Company agrees to transfer to Hypershop all right, title and interest to such receivables.
With regard to earn-out payments, the Company agrees to provide earn-out payments to Hypershop on a monthly basis over a three year period in the amount equal to the life insurance assignments that American Funeral Financial has funded during the applicable monthly calculation period multiplied by the earn-out multiple of .0042. In the event any customer of American Funeral Financial has also been a customer of C & J Financial, LLC, a wholly owned subsidiary of the Company, during the twelve month period prior to the closing date, the earn-out multiple would be proportionately reduced by the funding amount provided by American Funeral Financial for such customer during the twelve month period prior to the closing date as compared to the funding amount provided by C & J Financial for such customer during the same twelve month period.
With regard to the Escrow Account, the Company and Hypershop entered into an agreement on January 21, 2015 to memorialize how the funds in the Escrow Account were to be distributed under the terms of the Purchase Agreement. The Company and Hypershop each agreed that the $175,000 in funds which were deposited into the Escrow Account at the closing of the purchase transaction pursuant to the terms of the Purchase Agreement were allocated between said parties as follows: The Company - $66,221 and Hypershop - $108,779. The Company and Hypershop also agreed to distribute the accrued interest on the funds that were deposited into the Escrow Account to Hypershop. The Escrow Agent distributed the funds from the Escrow Account per this agreement.
Reinsurance Terminated with North America Life Insurance Company
On December 1, 2013, in accordance with the terms of the Coinsurance Agreement, Security National Life, through TransWestern Life Insurance Company (“Trans-Western Life”), recaptured additional policies of Trans-Western Life from North American Life Insurance Company (“North American Life”). On December 10, 2013, pursuant to the Coinsurance Agreement, North America Life paid $2,500,000, less a ceding commission of $34,000 to Security National Life. On February 13, 2014, in accordance with the terms of the Coinsurance Agreement, Security National Life, through Trans Western Life, recaptured the remaining policies of Trans-Western Life from North American Life. Pursuant to the Coinsurance Agreement, North America Life paid $4,684,000 less a ceding commission of $57,000 to Security National Life, and the Reinsurance Agreement between Trans Western Life and North America Life was terminated.
Reorganization of Security National Financial Corporation and Certain Subsidiaries
On May 8, 2013, the Company completed a reorganization transaction involving several of its wholly owned subsidiaries. Under the terms of the Agreement and Plan of Reorganization, the Company contributed all its shares of common stock of Select Appraisal Management, Inc. (“Select Appraisal Management”), which had been a wholly owned subsidiary of the Company, to Green Street Mortgage, a wholly owned subsidiary of the Company. The purpose of the transaction was to develop the appraisal business of Select Appraisal Management through Green Street Mortgage, which would be responsible for the development, management and oversight of the appraisal business of Select Appraisal Management. SecurityNational Mortgage agreed, as part of the reorganization, to transfer to Green Street Mortgage, in the form of a dividend, the appraisal management contracts and related operations that it owned.
8
Moreover, as part of the reorganization, SecurityNational Mortgage agreed to assign to the Company, in the form of a dividend beginning January 1, 2013, the net servicing income from the mortgage servicing rights that it retains from the mortgage loans that it originates and sells on a servicing retained basis to third party investors in connection with its mortgage loan operations. Pursuant to the reorganization, SecurityNational Mortgage also agreed to pay the Company on a monthly basis the net income from its mortgage servicing operations, provided such payments do not violate the financial covenants that SecurityNational Mortgage is required to maintain with its warehouse mortgage lenders.
Finally, the Company agreed as part of the reorganization to contribute all of its shares of stock of Dry Creek Property Development, Inc. (“Dry Creek Development”), which had been a wholly owned subsidiary of the Company, to Security National Life Insurance Company (“Security National Life”). The purpose of this transaction was to help facilitate the future funding and development of approximately 13 acres of land that the Company owns in Sandy, Utah.
Regulation
The Company’s insurance subsidiaries, Security National Life, Memorial Insurance Company, Southern Security and Trans-Western are subject to comprehensive regulation in the jurisdictions in which they do business under statutes and regulations administered by state insurance commissioners. Such regulation relates to, among other things, prior approval of the acquisition of a controlling interest in an insurance company; standards of solvency which must be met and maintained; licensing of insurers and their agents; nature of and limitations on investments; deposits of securities for the benefit of policyholders; approval of policy forms and premium rates; periodic examinations of the affairs of insurance companies; annual and other reports required to be filed on the financial condition of insurers or for other purposes; and requirements regarding aggregate reserves for life policies and annuity contracts, policy claims, unearned premiums, and other matters. The Company’s insurance subsidiaries are subject to this type of regulation in any state in which they are licensed to do business. Such regulation could involve additional costs, restrict operations or delay implementation of the Company’s business plans.
The Company’s life insurance subsidiaries are currently subject to regulation in Utah, Arkansas, Mississippi and Texas under insurance holding company legislation, and other states where applicable. Generally, intercompany transfers of assets and dividend payments from insurance subsidiaries are subject to prior notice of approval from the state insurance department, if they are deemed “extraordinary” under these statutes. The insurance subsidiaries are required, under state insurance laws, to file detailed annual reports with the supervisory agencies in each of the states in which they do business. Their business and accounts are also subject to examination by these agencies. The Texas Department of Banking also audits Pre-Need Insurance policies that are issued in the state of Texas. Pre-need policies are life and annuity products sold as the funding mechanism for funeral plans through funeral homes by security National agents. The Company is required to send the Texas Department of Banking an annual report that summarizes the number of policies in force and the face amount or death benefit for each policy. This annual report also indicates the number of new policies issued for that year, all death claims paid that year, and all premiums received.
The Company’s cemetery and mortuary subsidiaries are subject to the Federal Trade Commission’s comprehensive funeral industry rules and to state regulations in the various states where such operations are domiciled. The morticians must be licensed by the respective state in which they provide their services. Similarly, the mortuaries and cemeteries are governed and licensed by state statutes and city ordinances in Utah and California. Reports are required to be kept on file on a yearly basis which include financial information concerning the number of spaces sold and, where applicable, funds provided to the Endowment Care Trust Fund. Licenses are issued annually on the basis of such reports. The cemeteries maintain city or county licenses where they conduct business.
The Company’s mortgage subsidiaries are subject to the rules and regulations of the U.S. Department of Housing and Urban Development (HUD), and to various state licensing acts and regulations and the Consumer Finance Protection Bureau (CFPB). These regulations, among other things, specify minimum capital requirements, procedures for loan origination and underwriting, licensing of brokers and loan officers, quality review audits and the fees that can be charged to borrowers. Each year, the Company is required to have an audit by an independent registered public accounting firm to verify compliance under some of these regulations. In addition to the government regulations, the Company must meet loan requirements, and underwriting guidelines of various investors who purchase the loans.
9
Income Taxes
The Company’s insurance subsidiary, Security National Life, is taxed under the Life Insurance Company Tax Act of 1984. Under the act, life insurance companies are taxed at standard corporate rates on life insurance company taxable income. Life insurance company taxable income is gross income less general business deductions, reserves for future policyholder benefits (with modifications), and a small life insurance company deduction (up to 60% of life insurance company taxable income). The Company may be subject to the corporate Alternative Minimum Tax (AMT). The exposure to AMT is primarily a result of the small life insurance company deduction. Also, under the Tax Reform Act of 1986, distributions in excess of stockholders’ surplus account or a significant decrease in life reserves will result in taxable income.
Security National Life last received the benefit of the small life insurance company deduction in 2011. In order to qualify for the small company deduction, the combined tax assets of the Company must be less than $500,000,000 and the taxable income of the life insurance companies must be less than $3,000,000 on a tax accounting basis. To the extent that the net income limitation is exceeded, the small life insurance company deduction is phased out over the next $12,000,000 of life insurance company taxable income. The combined tax assets of the Company exceeded $500,000,000 as of December 31, 2014.
Since 1990 Security National Life has computed its life insurance taxable income after establishing a provision representing a portion of the costs of acquisition of such life insurance business. The effect of the provision is that a certain percentage of the Company’s premium income is characterized as deferred expenses and recognized over a five to ten year period.
The Company’s non-life insurance company subsidiaries are taxed in general under the regular corporate tax provisions. The following subsidiaries are regulated as life insurance companies but do not meet the Internal Revenue Code definition of a life insurance company so are taxed as insurance companies other than life insurance companies: Memorial Insurance Company, Southern Security and Trans-Western. For taxable years beginning January 1, 1987, the Company may be subject to the Corporate Alternative Minimum Tax under the Tax Reform Act of 1986.
Competition
The life insurance industry is highly competitive. There are approximately 2,000 legal reserve life insurance companies in business in the United States. These insurance companies differentiate themselves through marketing techniques, product features, price and customer service. The Company’s insurance subsidiaries compete with a large number of insurance companies, many of which have greater financial resources, a longer business history, and more diversified line of insurance products than the Company. In addition, such companies generally have a larger sales force. Further, the Company competes with mutual insurance companies which may have a competitive advantage because all profits accrue to policyholders. Because the Company is smaller by industry standards and lacks broad diversification of risk, it may be more vulnerable to losses than larger, better-established companies. The Company believes that its policies and rates for the markets it serves are generally competitive.
The cemetery and mortuary industry is also highly competitive. In the Salt Lake City and San Diego areas where the Company competes, there are a number of cemeteries and mortuaries which have longer business histories, more established positions in the community, and stronger financial positions than the Company. In addition, some of the cemeteries with which the Company must compete for sales are owned by municipalities and, as a result, can offer lower prices than can the Company. The Company bears the cost of a pre-need sales program that is not incurred by those competitors which do not have a pre-need sales force. The Company believes that its products and prices are generally competitive with those in the industry.
The mortgage industry is highly competitive with a large number of mortgage companies and banks in the same geographic area in which the Company is operating. The mortgage industry in general is sensitive to changes in interest rates and the refinancing market is particularly vulnerable to changes in interest rates.
Employees
As of December 31, 2014, the Company had 1,090 full-time and 390 part-time employees.
10
The following table sets forth the location of the Company’s office facilities and certain other information relating to these properties.
|
Street
|
City
|
State
|
Function
|
Owned Leased
|
Approximate
Square
Footage
|
Lease
Amount
|
Expiration
|
||||||||
|
5300 South 360 West
|
Salt Lake City
|
UT
|
Corporate Headquarters
|
Owned
|
30,317 | $ | 485,071 | / |
yr
|
month to month
|
|||||
|
5201 Green Street
|
Salt Lake City
|
UT
|
Mortgage Operations
|
Owned
|
10,990 | $ | 13,252 | / |
mo
|
month to month
|
|||||
|
3935 I-55 South, Frontage Road
|
Jackson
|
MS
|
Insurance Operations
|
Owned
|
12,000 | $ | 84,000 | / |
yr
|
month to month
|
|||||
|
5239 Greenpine Drive
|
Murray
|
UT
|
Funeral Service Operations
|
Leased
|
1,642 | $ | 1,020 | / |
mo
|
month to month
|
|||||
|
497-A Sutton Bridge Road
|
Rainbow City
|
AL
|
Fast Funding Operations
|
Leased
|
5,500 | $ | 33,600 | / |
yr
|
6/30/2018
|
|||||
|
2567 Mall Road
|
Florence
|
AL
|
Mortgage Sales
|
Sub-Leased
|
1,600 | $ | 750 | / |
mo
|
month to month
|
|||||
|
5701 Talavi Blvd. #155
|
Glendale
|
AZ
|
Mortgage Sales
|
Leased
|
2,214 | $ | 4,358 | / |
mo
|
5/6/2015
|
|||||
|
2345 E. Thomas Road, Suite 400
|
Phoenix
|
AZ
|
Mortgage Sales
|
Leased
|
3,762 | $ | 4,232 | / |
mo
|
month to month
|
|||||
|
1701 N. Scottsdale Rd. Suite 125
|
Scottsdale
|
AZ
|
Mortgage Sales
|
Leased
|
3,140 | $ | 6,542 | / |
mo
|
month to month
|
|||||
|
900 East Hamilton Ave
|
Campbell
|
CA
|
Mortgage Sales
|
Leased
|
182 | $ | 1,409 | / |
mo
|
month to month
|
|||||
|
1900 Powell St #600-6011
|
Emeryville
|
CA
|
Mortgage Sales
|
Leased
|
100 | $ | 1,300 | / |
mo
|
10/31/2015
|
|||||
|
8505 Madison Avenue, #140
|
Fair Oaks
|
CA
|
Mortgage Sales
|
Leased
|
1,200 | $ | 2,160 | / |
mo
|
11/30/2016
|
|||||
|
3643 East 4th Street, Suite A
|
Long Beach
|
CA
|
Mortgage Sales
|
Leased
|
1,250 | $ | 2,060 | / |
mo
|
month to month
|
|||||
|
765 The City Drive #360
|
Orange
|
CA
|
Mortgage Sales
|
Leased
|
3,886 | $ | 7,772 | / |
mo
|
8/31/2017
|
|||||
|
3005 Douglas Boulevard #100
|
Roseville
|
CA
|
Mortgage Sales
|
Leased
|
3,722 | $ | 6,997 | / |
mo
|
4/14/2018
|
|||||
|
421 S. Cataract
|
San Dimas
|
CA
|
Mortgage Sales
|
Leased
|
6,200 | $ | 6,510 | / |
yr
|
month to month
|
|||||
|
817 N Broadway Ste E
|
Santa Ana
|
CA
|
Mortgage Sales
|
Leased
|
550 | $ | 1,000 | / |
mo
|
4/15/2015
|
|||||
|
7100 East Bellview Avenue #301
|
Greenwood Village
|
CO
|
Mortgage Sales
|
Leased
|
2,549 | $ | 3,717 | / |
mo
|
10/31/2016
|
|||||
|
7777 Glades Road, Suite #401A
|
Boca Raton
|
FL
|
Mortgage Sales
|
Leased
|
2,762 | $ | 7,875 | / |
mo
|
month to month
|
|||||
|
8191 College Parkway Suite 201
|
Ft Myers
|
FL
|
Mortgage Sales
|
Leased
|
1,704 | $ | 1,502 | / |
mo
|
10/31/2015
|
|||||
|
4575 Via Royal, #100
|
Ft Myers
|
FL
|
Mortgage Sales
|
Sub-Leased
|
2,631 | $ | 500 | / |
mo
|
month to month
|
|||||
|
1145 TownPark Avenue # 2215
|
Lake Mary
|
FL
|
Mortgage Sales
|
Leased
|
7,425 | $ | 13,922 | / |
mo
|
3/1/2020
|
|||||
|
7575 Dr. Phillips Blvd, Suite 270
|
Orlando
|
FL
|
Mortgage Sales
|
Leased
|
1,317 | $ | 2,571 | / |
mo
|
3/31/2018
|
|||||
|
11256 Boyette Rd
|
Riverview
|
FL
|
Mortgage Sales
|
Leased
|
120 | $ | 500 | / |
mo
|
month to month
|
|||||
|
200 9th Avenue N, Ste 200
|
Safety Harbor,
|
FL
|
Mortgage Sales
|
Leased
|
3,591 | $ | 85,266 | / |
yr
|
5/31/2015
|
|||||
|
15351 Amberly Drive
|
Tampa
|
FL
|
Mortgage Sales
|
Leased
|
153 | $ | 500 | / |
mo
|
month to month
|
|||||
|
14502 N Dale Mabry Highway
|
Tampa
|
FL
|
Mortgage Sales
|
Leased
|
250 | $ | 550 |
mo
|
3/31/2015
|
||||||
|
2445 Moon Rd#3
|
Grayson
|
GA
|
Mortgage Sales
|
Leased
|
1,800 | $ | 2,365 | / |
mo
|
month to month
|
|||||
|
841 Bishop Street #924
|
Honolulu
|
HI
|
Mortgage Sales
|
Leased
|
740 | $ | 2,263 | / |
mo
|
3/31/2015
|
|||||
|
733 Bishop Street #1880
|
Honolulu
|
HI
|
Mortgage Sales
|
Leased
|
2,812 | $ | 8,267 | / |
mo
|
month to month
|
|||||
|
28-2856 Onomea Place
|
Pepeekeo
|
HI
|
Mortgage Sales
|
Leased
|
120 | $ | 100 | / |
mo
|
month to month
|
|||||
|
3438 South 15 East, #100
|
Idaho Falls
|
ID
|
Mortgage Sales
|
Leased
|
1,401 | $ | 1,285 | / |
mo
|
1/31/2015
|
|||||
|
3999 E Overland Road
|
Meridian
|
ID
|
Mortgage Sales
|
Leased
|
1,266 | $ | 24,054 | / |
yr
|
11/30/2015
|
|||||
|
7227 W. Madison Avenue
|
Forest Park
|
IL
|
Mortgage Sales
|
Leased
|
1,800 | $ | 24,000 | / |
yr
|
month to month
|
|||||
|
6900 Houston Rd. #21 & 22
|
Florence
|
KY
|
Mortgage Sales
|
Leased
|
1,700 | $ | 1,900 | / |
mo
|
month to month
|
|||||
|
12910 Shelbyville RD
|
Louisville
|
KY
|
Mortgage Sales
|
Leased
|
100 | $ | 350 | / |
mo
|
month to month
|
|||||
|
910 Pierremont #410
|
Shreveport
|
LA
|
Mortgage Sales
|
Leased
|
174 | $ | 790 | / |
mo
|
month to month
|
|||||
|
1 Exchange Place
|
Worcester
|
MA
|
Mortgage Sales
|
Leased
|
475 | $ | 700 | / |
mo
|
8/31/2016
|
|||||
|
636 Trade Center Blvd
|
Chesterfield
|
MO
|
Mortgage Sales
|
Leased
|
1,800 | $ | 2,403 | / |
mo
|
2/28/2017
|
|||||
|
7802 Menaul Blvd NE
|
Albuquerque
|
NM
|
Mortgage Sales
|
Leased
|
3,780 | $ | 3,958 | / |
mo
|
month to month
|
|||||
|
2370 Corporate Circle, Suite 200
|
Henderson
|
NV
|
Mortgage Sales
|
Leased
|
7,741 | $ | 169,063 | / |
yr
|
12/1/2017
|
|||||
|
9330 W. Sahara Ave #270
|
Las Vegas
|
NV
|
Mortgage Sales
|
Leased
|
2,681 | $ | 3,887 | / |
mo
|
7/1/2015
|
|||||
|
6130 Elton Avenue, #223
|
Las Vegas
|
NV
|
Mortgage Sales
|
Leased
|
125 | $ | 400 | / |
mo
|
3/31/2015
|
|||||
|
3275 N Fort Apache Rd, Ste #150
|
Las Vegas
|
NV
|
Mortgage Sales
|
Leased
|
2,448 | $ | 2,448 | / |
mo
|
7/15/2015
|
|||||
|
3285 North Fort Apache Road
|
Las Vegas
|
NV
|
Mortgage Sales
|
Leased
|
1,000 | $ | 11,500 | / |
mo
|
month to month
|
|||||
|
6540 South Pecos Road, Building A, Suite 104
|
Las Vegas
|
NV
|
Mortgage Sales
|
Leased
|
2,802 | $ | 2,662 | / |
mo
|
month to month
|
|||||
|
4000 S. Eastern Avenue, Suite 310
|
Las Vegas
|
NV
|
Mortgage Sales
|
Leased
|
2,750 | $ | 52,800 | / |
yr
|
12/31/2019
|
|||||
|
3500 Lakeside Court #207
|
Reno
|
NV
|
Mortgage Sales
|
Leased
|
552 | $ | 550 | / |
mo
|
month to month
|
|||||
|
3743 Dixie Hwy,Suite B
|
Franklin
|
OH
|
Mortgage Sales
|
Leased
|
500 | $ | 400 | / |
mo
|
11/30/2015
|
|||||
|
2468 W New Orleans
|
Brokern Arrow
|
OK
|
Mortgage Sales
|
Leased
|
1,683 | $ | 1,896 | / |
mo
|
12/31/2019
|
|||||
|
3050 SE Division Street, Suite 245 (D Street Village)
|
Portland
|
OR
|
Mortgage Sales
|
Leased
|
1,078 | $ | 2,156 | / |
mo
|
10/31/2016
|
|||||
|
3311 NE MLK Jr Blvd # 203
|
Portland
|
OR
|
Mortgage Sales
|
Leased
|
1,400 | $ | 675 | / |
mo
|
month to month
|
|||||
|
10610 SE Washington
|
Portland
|
OR
|
Mortgage Sales
|
Leased
|
506 | $ | 1,000 | / |
mo
|
month to month
|
|||||
|
108 Central Avenue Ste 1
|
Goose Creek
|
SC
|
Mortgage Sales
|
Leased
|
1,071 | $ | 650 | / |
mo
|
month to month
|
|||||
|
11002 Kingston Pike # 204
|
Knoxville
|
TN
|
Mortgage Sales
|
Leased
|
1,093 | $ | 1,300 | / |
mo
|
5/31/2017
|
|||||
|
9737 Great Hills Trail, Suite 150
|
Austin
|
TX
|
Mortgage Sales
|
Leased
|
8,174 | $ | 53,536 | / |
mo
|
2/28/2017
|
|||||
|
12515-7 Research Blvd.
|
Austin
|
TX
|
Mortgage Sales
|
Leased
|
2,799 | $ | 4,082 | / |
mo
|
12/31/2018
|
|||||
|
13413 Galleria Circie, #120
|
Austin
|
TX
|
Mortgage Sales
|
Sub-Leased
|
400 | $ | 1,200 | / |
mo
|
6/30/2015
|
|||||
|
13413 Galleria Circie, #Q-180
|
Austin
|
TX
|
Mortgage Sales
|
Leased
|
1,851 | $ | 3,085 | / |
mo
|
12/31/2018
|
|||||
|
8700 Manchaca Road #603
|
Austin
|
TX
|
Mortgage Sales
|
Sub-Leased
|
1,000 | $ | 1,400 | / |
mo
|
month to month
|
|||||
|
1213 East Alton Gloor Blvd Suite H
|
Brownsville
|
TX
|
Mortgage Sales
|
Leased
|
1,000 | $ | 1,100 | / |
mo
|
9/30/2015
|
|||||
|
12201 Merit Drive, Suite 400
|
Dallas
|
TX
|
Mortgage Sales
|
Leased
|
3,047 | $ | 54,846 | / |
yr
|
7/31/2016
|
|||||
11
Item 2. Properties (Continued)
|
Street
|
City
|
State
|
Function
|
Owned Leased
|
Approximate
Square
Footage
|
Lease
Amount
|
Expiration
|
||||||||
|
310 E. Rio Grande Street
|
Eagle Pass
|
TX
|
Mortgage Sales
|
Leased
|
150 | $ | 250 | / |
mo
|
month to month
|
|||||
|
11601 Pellicano Suite A-14&15
|
El Paso
|
TX
|
Mortgage Sales
|
Sub-Leased
|
2,160 | $ | 32,400 | / |
yr
|
month to month
|
|||||
|
5780 North Mesa Street
|
El Paso
|
TX
|
Mortgage Sales
|
Leased
|
1,532 | $ | 2,048 | / |
mo
|
6/30/2015
|
|||||
|
4936 Collinwood Sutie 110
|
Fort Worth
|
TX
|
Mortgage Sales
|
Leased
|
1,900 | $ | 34,200 | / |
yr
|
12/31/2016
|
|||||
|
30417 5th Street #B
|
Fulshear
|
TX
|
Mortgage Sales
|
Sub-Leased
|
1,000 | $ | 550 | / |
mo
|
month to month
|
|||||
|
116 West 8th Street, Unit 103
|
Georgetown
|
TX
|
Mortgage Sales
|
Leased
|
135 | $ | 325 | / |
mo
|
2/28/2015
|
|||||
|
2825 Wilcrest Drive, Ste 220
|
Houston
|
TX
|
Mortgage Sales
|
Leased
|
120 | $ | 400 | / |
mo
|
month to month
|
|||||
|
17000 El Camino Real #103D
|
Houston
|
TX
|
Mortgage Sales
|
Leased
|
750 | $ | 750 | / |
mo
|
month to month
|
|||||
|
17000 El Camino Real #103C
|
Houston
|
TX
|
Mortgage Sales
|
Leased
|
460 | $ | 588 | / |
mo
|
10/31/2015
|
|||||
|
17347 Village Green Drive-102A
|
Houston
|
TX
|
Mortgage Sales
|
Sub-Leased
|
3,000 | $ | 6,445 | / |
mo
|
month to month
|
|||||
|
10613 West Sam Houston Parkway North, STE 175
|
Houston
|
TX
|
Mortgage Sales
|
Leased
|
4,572 | $ | 11,049 | / |
mo
|
12/31/2018
|
|||||
|
7322 Southwest Freeway 1818
|
Houston
|
TX
|
Mortgage Sales
|
Sub-Leased
|
1,250 | $ | 1,875 | / |
mo
|
month to month
|
|||||
|
1848 Norwood Plaza #205
|
Hurst
|
TX
|
Mortgage Sales
|
Sub-Leased
|
455 | $ | 361 | / |
mo
|
month to month
|
|||||
|
24668 Kingsland Blvd
|
Katy
|
TX
|
Mortgage Sales
|
Leased
|
150 | $ | 400 | / |
mo
|
month to month
|
|||||
|
2877 Commercial Center Blvd
|
Katy
|
TX
|
Mortgage Sales
|
Leased
|
250 | $ | 2,000 | / |
mo
|
month to month
|
|||||
|
1202 Lakeway Drive, Suite 12
|
Lakeway
|
TX
|
Mortgage Sales
|
Leased
|
1,192 | $ | 2,000 | / |
mo
|
1/3/2017
|
|||||
|
7913 McPherson, #B
|
Laredo
|
TX
|
Mortgage Sales
|
Leased
|
1,200 | $ | 1,400 | / |
mo
|
5/31/2016
|
|||||
|
3027 Marina Bay Dr #110
|
League City
|
TX
|
Mortgage Sales
|
Leased
|
180 | $ | 740 | / |
mo
|
month to month
|
|||||
|
125 North Main Street
|
Mansfield
|
TX
|
Mortgage Sales
|
Sub-Leased
|
300 | $ | 200 | / |
mo
|
month to month
|
|||||
|
802 E. Expressway 83, #A
|
Pharr
|
TX
|
Mortgage Sales
|
Sub-Leased
|
1,000 | $ | 1,100 | / |
mo
|
month to month
|
|||||
|
811 S Central Expressway #550
|
Richardson
|
TX
|
Mortgage Sales
|
Sub-Leased
|
1,080 | $ | 1,053 | / |
mo
|
month to month
|
|||||
|
1 Chisholm Trail Road, Suite 210
|
Round Rock
|
TX
|
Mortgage Sales
|
Leased
|
3,402 | $ | 3,331 | / |
mo
|
10/31/2017
|
|||||
|
2526 North Loop 1604 West, Suite 210
|
San Antonio
|
TX
|
Mortgage Sales
|
Leased
|
4,959 | $ | 10,775 | / |
mo
|
8/31/2016
|
|||||
|
9901 I-H10 West #800
|
San Antonio
|
TX
|
Mortgage Sales
|
Leased
|
100 | $ | 2,620 | / |
mo
|
6/30/2015
|
|||||
|
19901 Southwest Freeway #108
|
Sugarland
|
TX
|
Mortgage Sales
|
Sub-Leased
|
500 | $ | 500 | / |
mo
|
month to month
|
|||||
|
52 Sugar Creek Center Blvd., #150
|
Sugarland
|
TX
|
Mortgage Sales
|
Leased
|
1,788 | $ | 3,497 | / |
mo
|
12/31/2019
|
|||||
|
602 S Main St #300
|
Weatherford
|
TX
|
Mortgage Sales
|
Sub-Leased
|
1,000 | $ | 1,200 | / |
mo
|
month to month
|
|||||
|
8505 Technology Forest Place, #304
|
Woodlands
|
TX
|
Mortgage Sales
|
Leased
|
100 | $ | 2,600 | / |
mo
|
5/30/2018
|
|||||
|
13997 Minuteman Drive Suite 250
|
Draper
|
UT
|
Mortgage Sales
|
Leased
|
3,206 | $ | 5,811 | / |
mo
|
9/30/2017
|
|||||
|
13997 Minuteman Drive Suite 100
|
Draper
|
UT
|
Mortgage Sales
|
Leased
|
5,492 | $ | 9,666 | / |
mo
|
9/30/2017
|
|||||
|
497 South Main
|
Ephraim
|
UT
|
Mortgage Sales
|
Leased
|
500 | $ | 765 | / |
mo
|
9/30/2015
|
|||||
|
288 SR 248, Suite 2A
|
Kamas
|
UT
|
Mortgage Sales
|
Leased
|
1,480 | $ | 2,350 | / |
mo
|
month to month
|
|||||
|
1558 N Woodland Park Drive #400
|
Layton
|
UT
|
Mortgage Sales
|
Leased
|
1,000 | $ | 2,500 | / |
mo
|
month to month
|
|||||
|
6965 South Union Park, Suites #100, #260, #300, #460, #470, & #480
|
Midvale
|
UT
|
Mortgage Sales
|
Leased
|
37,226 | $ | 74,098 | / |
mo
|
2/28/2018
|
|||||
|
6975 Union Park Avenue STE 420
|
Midvale
|
UT
|
Mortgage Sales
|
Leased
|
6,672 | $ | 12,500 | / |
mo
|
6/30/2019
|
|||||
|
5201 South Green street
|
Murray
|
UT
|
Mortgage Sales
|
Leased
|
10,990 | $ | 12,684 | / |
mo
|
6/30/2016
|
|||||
|
1443 West 800 North, Suite 201
|
Orem
|
UT
|
Mortgage Sales
|
Leased
|
3,129 | $ | 3,781 | / |
mo
|
7/31/2015
|
|||||
|
1245 Deer Valley Drive #3A
|
Park City
|
UT
|
Mortgage Sales
|
Leased
|
2,183 | $ | 4,548 | / |
mo
|
12/31/2017
|
|||||
|
465 North Main
|
Richfield
|
UT
|
Mortgage Sales
|
Leased
|
2,848 | $ | 1,600 | / |
mo
|
month to month
|
|||||
|
1864 West 12600 South
|
Riverton
|
UT
|
Mortgage Sales
|
Leased
|
277 | $ | 6,911 | / |
yr
|
month to month
|
|||||
|
1224 South River Road, Buiding E, Suites E3 & E4
|
Saint George
|
UT
|
Mortgage Sales
|
Leased
|
1,900 | $ | 1,710 | / |
mo
|
4/30/2016
|
|||||
|
307 West 200 South, Ste 5001
|
Salt Lake City
|
UT
|
Mortgage Sales
|
Leased
|
500 | $ | 500 | / |
mo
|
month to month
|
|||||
|
5993 S. Redwood Road
|
Salt Lake City
|
UT
|
Mortgage Sales
|
Leased
|
2,800 | $ | 2,624 | / |
mo
|
5/31/2015
|
|||||
|
9980 S 300 West #201
|
Sandy
|
UT
|
Mortgage Sales
|
Leased
|
100 | $ | 1,819 | / |
mo
|
month to month
|
|||||
|
9815 South Monroe Street, suite 206
|
Sandy
|
UT
|
Mortgage Sales
|
Leased
|
2,819 | $ | 5,286 | / |
mo
|
5/31/2018
|
|||||
|
1099 West South Jordan Parkway
|
South Jordan
|
UT
|
Mortgage Sales
|
Leased
|
3,329 | $ | 46,318 | / |
yr
|
month to month
|
|||||
|
10437 South 1300 West
|
South Jordan
|
UT
|
Mortgage Sales
|
Leased
|
4,000 | $ | 7,500 | / |
mo
|
9/30/2019
|
|||||
|
6575 So. Redwood Road
|
Taylorsville
|
UT
|
Mortgage Sales
|
Leased
|
3,323 | $ | 4,638 | / |
mo
|
8/31/2019
|
|||||
|
118 East Vine Street
|
Tooele
|
UT
|
Mortgage Sales
|
Leased
|
1,000 | $ | 800 | / |
mo
|
7/31/2017
|
|||||
|
108 South 500 West
|
Vernal
|
UT
|
Mortgage Sales
|
Leased
|
100 | $ | 1,350 | / |
mo
|
month to month
|
|||||
|
10655 NE 4th St # 800
|
Bellevue
|
WA
|
Mortgage Sales
|
Leased
|
2,263 | $ | 6,883 | / |
mo
|
8/31/2017
|
|||||
|
2100 124th Avenue NE Suite 100
|
Bellevue
|
WA
|
Mortgage Sales
|
Leased
|
2,406 | $ | 5,013 | / |
mo
|
10/31/2015
|
|||||
|
160 Cascade Place #221
|
Burlington
|
WA
|
Mortgage Sales
|
Leased
|
140 | $ | 330 | / |
mo
|
month to month
|
|||||
|
1604 Hewitt Ave, Suite 703
|
Everett
|
WA
|
Mortgage Sales
|
Leased
|
2,038 | $ | 4,650 | / |
mo
|
month to month
|
|||||
|
11232 120th Ave NE # 206
|
Kirkland
|
WA
|
Mortgage Sales
|
Leased
|
500 | $ | 350 | / |
mo
|
month to month
|
|||||
|
10524 Bridgeport Way SW
|
Lakewood
|
WA
|
Mortgage Sales
|
Leased
|
100 | $ | 750 | / |
mo
|
2/28/2015
|
|||||
|
19410 8th Avenue, Suite 103
|
Poulsbo
|
WA
|
Mortgage Sales
|
Sub-Leased
|
2,385 | $ | 3,578 | / |
mo
|
month to month
|
|||||
|
318 39th ST Ave SW, STE A
|
Puyallup
|
WA
|
Mortgage Sales
|
Leased
|
3,431 | $ | 5,289 | / |
mo
|
11/30/2017
|
|||||
|
535 Dock Street #103
|
Tacoma
|
WA
|
Mortgage Sales
|
Leased
|
1,950 | $ | 2,925 | / |
mo
|
6/30/2015
|
|||||
|
15640 NE Fourth Plain Blvd #220
|
Vancouver
|
WA
|
Mortgage Sales
|
Leased
|
120 | $ | 395 | / |
mo
|
7/31/2015
|
|||||
The Company believes the office facilities it occupies are in good operating condition and adequate for current operations.
The company will enter into additional leases or modify existing leases to meet market demand. Those leases will be month to month where possible. As leases expire the Company will either renew or find comparable leases or acquire additional office space.
12
Item 2. Properties (Continued)
The following table summarizes the location and acreage of the six Company owned cemeteries, each of which includes one or more mausoleums:
|
Net Saleable Acreage
|
||||||||||||||||||
|
Name of Cemetery
|
Location
|
Date Acquired
|
Developed
Acreage (1)
|
Total
Acreage (1)
|
Acres Sold
as Cemetery
Spaces (2)
|
Total
Available
Acreage (1)
|
||||||||||||
|
Memorial Estates, Inc.
|
||||||||||||||||||
|
Lakeview Cemetery
|
1640 East Lakeview Drive
Bountiful, Utah
|
1973
|
7 | 40 | 6 | 34 | ||||||||||||
|
Mountain View Cemetery (5)
|
3115 East 7800 South
Salt Lake City, Utah
|
1973
|
17 | 54 | 16 | 38 | ||||||||||||
|
Redwood Cemetery (4) (5)
|
6500 South Redwood Road
West Jordan, Utah
|
1973
|
34 | 78 | 30 | 48 | ||||||||||||
|
Deseret Memorial Inc.
Lake Hills Cemetery (3)(6)
|
||||||||||||||||||
|
Lake Hills Cemetery (3)(6)
|
10055 South State Street
Sandy, Utah
|
1991
|
9 | 28 | 4 | 24 | ||||||||||||
|
Holladay Memorial Park, Inc.
|
||||||||||||||||||
|
Holladay Memorial Park (3)(4)
|
4900 South Memory Lane
Holladay, Utah
|
1991
|
5 | 14 | 4 | 10 | ||||||||||||
|
California Memorial Estate, Inc.
|
||||||||||||||||||
|
Singing Hills Memorial Park
|
2800 Dehesa Road
El Cajon, California
|
1995
|
8 | 35 | 4 | 31 | ||||||||||||
|
(1)
|
The acreage represents estimates of acres that are based upon survey reports, title reports, appraisal reports or the Company’s inspection of the cemeteries.
|
|
|
(2)
|
Includes spaces sold for cash and installment contract sales.
|
|
|
(3)
|
As of December 31, 2014, there were mortgages of approximately $467,000 collateralized by the property and facilities at Deseret Mortuary, Cottonwood Mortuary, Holladay Memorial Park, and Lake Hills Cemetery.
|
|
|
(4)
|
These cemeteries include two granite mausoleums.
|
|
|
(5)
|
The Company developed additional acreage at both Mountain View Cemetery and Redwood Cemetery in 2013 and plans to continue such development as needed.
|
|
|
(6)
|
In mid-October 2013, Deseret Mortuary sold to Dry Creek Development 13 Acres of unimproved land.
|
13
The following table summarizes the location, square footage and the number of viewing rooms and chapels of the seven Company owned mortuaries:
|
Date
|
Viewing
|
Square
|
||||||||||||
|
Name of Mortuary
|
Location
|
Acquired
|
Room(s)
|
Chapel(s)
|
Footage
|
|||||||||
|
Memorial Mortuary, Inc.
|
||||||||||||||
|
Memorial Mortuary
|
5850 South 900 East
|
|||||||||||||
|
Murray, Utah
|
1973
|
3 | 1 | 20,000 | ||||||||||
|
Memorial Estates, Inc.
|
||||||||||||||
|
Redwood Mortuary(2)
|
6500 South Redwood Rd.
|
|||||||||||||
|
West Jordan, Utah
|
1973
|
2 | 1 | 10,000 | ||||||||||
|
Mountain View Mortuary(2)
|
3115 East 7800 South
|
|||||||||||||
|
Salt Lake City, Utah
|
1973
|
2 | 1 | 16,000 | ||||||||||
|
Lakeview Mortuary(2)
|
1640 East Lakeview Dr.
|
|||||||||||||
|
Bountiful, Utah
|
1973
|
0 | 1 | 5,500 | ||||||||||
|
Deseret Memorial, Inc.
|
||||||||||||||
|
Deseret Mortuary(1)
|
36 East 700 South
|
|||||||||||||
|
Salt Lake City, Utah
|
1991
|
2 | 2 | 36,300 | ||||||||||
|
Lakehills Mortuary(2)
|
10055 South State St.
|
|||||||||||||
|
Sandy, Utah
|
1991
|
2 | 1 | 18,000 | ||||||||||
|
Cottonwood Mortuary, Inc.
|
||||||||||||||
|
Cottonwood Mortuary(1)(2)
|
4670 South Highland Dr.
|
|||||||||||||
|
Holladay, Utah
|
1991
|
2 | 1 | 14,500 | ||||||||||
|
(1)
|
As of December 31, 2014, there were mortgages of approximately $467,000 collateralized by the property and facilities at Deseret Mortuary, Cottonwood Mortuary, Holladay Memorial Park and Lake Hills Cemetery.
|
|
|
(2)
|
These funeral homes also provide burial niches at their respective locations.
|
Lehman Brothers - Aurora Loan Services Litigation
On April 15, 2005, SecurityNational Mortgage entered into a loan purchase agreement with Lehman Brothers Bank, FSB (“Lehman Bank”). Under the terms of the loan purchase agreement, Lehman Bank agreed to purchase mortgage loans from time to time from SecurityNational Mortgage. During 2007, Lehman Bank and its wholly owned subsidiary, Aurora Loan Services LLC (“Aurora Loan Services”), purchased a total of 1,490 mortgage loans in the aggregate amount of $352,774,000 from SecurityNational Mortgage. Lehman Bank asserted that certain of the mortgage loans that it purchased from SecurityNational Mortgage during 2007 contained alleged misrepresentations and early payment defaults. As a result of these alleged issues with the mortgage loans, Lehman Bank contended it had the right to require SecurityNational Mortgage to repurchase certain loans or be liable for losses related to such loans under the loan purchase agreement. SecurityNational Mortgage disagrees with these claims.
On December 17, 2007, SecurityNational Mortgage entered into an Indemnification Agreement with Lehman Bank and Aurora Loan Services. Under the terms of the Indemnification Agreement, SecurityNational Mortgage agreed to indemnify Lehman Bank and Aurora Loan Services for 75% of all losses that Lehman Bank and Aurora Loan Services may incur relative to breaches by mortgagors pertaining to 55 mortgage loans that were purchased from SecurityNational Mortgage. SecurityNational Mortgage was released from any obligation to pay the remaining 25% of such losses. The Indemnification Agreement also required SecurityNational Mortgage to indemnify Lehman Bank and Aurora Loan Services for 100% of any future losses incurred on mortgage loans with breaches that were not among the 55 mortgage loans.
14
Pursuant to the Indemnification Agreement, SecurityNational Mortgage paid $395,000 to Aurora Loan Services as a deposit into a reserve account, to secure any obligations of SecurityNational Mortgage under the Indemnification Agreement. This deposit was in addition to a $250,000 deposit that SecurityNational Mortgage previously made into the reserve account for a total of $645,000. Losses from mortgage loans with alleged breaches were payable from the reserve account. Lehman Bank and Aurora Loan Services were not to apply any funds from the reserve account to a particular mortgage loan, however, until an actual loss had occurred. Under the Indemnification Agreement SecurityNational Mortgage was to pay to Aurora Loan Services each calendar month the difference between the reserve account balance and $645,000, but in no event would SecurityNational Mortgage be required to make payments into the reserve account in excess of $125,000 for any calendar month.
Since the time the reserve account was established, SecurityNational Mortgage paid a total of $4,281,000 from the reserve account to indemnify Lehman Brothers Bank and Aurora Loan Services for alleged losses from 31 mortgage loans that were among 55 mortgage loans with alleged breaches that were covered by the Indemnification Agreement and ten other mortgage loans with alleged breaches. In the last monthly billing statement dated April 24, 2011 to SecurityNational Mortgage, Lehman Brothers Holdings Inc. (“Lehman Holdings”) claimed that SecurityNational Mortgage owed approximately $3,745,000 for mortgage loan losses under the Indemnification Agreement.
During 2010 and 2011, the Company recognized alleged losses of $1,289,000 and $-0-, respectively. Management cannot fully determine the total losses, however, because there could be potential claims for losses that have not yet been determined. As of December 31, 2014, the Company had not accrued for any losses under the Indemnification Agreement. SecurityNational Mortgage was involved in discussions with Lehman Bank and Lehman Holdings concerning issues under the Indemnification Agreement. During the discussion period, monthly payments for December 2010 and January, February, March and April of 2011 totaling $625,000 were abated or deferred.
On May 11, 2011, SecurityNational Mortgage filed a complaint against Aurora Bank FSB, formerly known as Lehman Bank, and Aurora Loan Services in the United States District Court for the District of Utah because it had been unable to resolve certain issues under the Indemnification Agreement with Lehman Bank and Aurora Loan Services. The complaint alleges, among other claims, material breach of the Indemnification Agreement, including a claim that neither Lehman Bank nor Aurora Loan Services owned the mortgage loans that SecurityNational Mortgage sold so as to justify the amount of payments demanded from, and made by, SecurityNational Mortgage. As a result, SecurityNational Mortgage claims it is entitled to judgment of approximately $4,000,000 against Lehman Bank, as well as Aurora Loan Services to the extent of its involvement and complicity with Lehman Bank. The complaint also alleges a second claim for material breach of a section of the Indemnification Agreement that contains an alleged “sunset” provision and that the amount of the requested payments made was not justified under the “sunset” provision.
On June 8, 2011, Lehman Holdings, which had filed for bankruptcy in September 2008, filed a complaint against SecurityNational Mortgage in the United States District Court for the District of Utah. A subsidiary of Lehman Holdings owns Lehman Bank. The complaint alleges that SecurityNational Mortgage sold loans to Lehman Bank, which were then sold to Lehman Holdings. The complaint additionally alleges that Lehman Bank and Aurora Loan Services assigned their rights and remedies under the loan purchase agreement, as well as the Indemnification Agreement, to Lehman Holdings, which latter assignment purportedly took place on March 28, 2011. Lehman Holdings declared in a letter dated June 2, 2011 that the Indemnification Agreement was null and void except as to losses previously released and discharged, which is disputed by SecurityNational Mortgage.
Lehman Holdings’ alleged claims are for damages for breach of contract and breach of warranty pursuant to a loan purchase agreement and Seller’s Guide. Based on claiming that the Indemnification Agreement is null and void pursuant to its lawsuit, Lehman Holdings has initially claimed damages in excess of $5,000,000. Prior to declaring the Indemnification Agreement null and void, Lehman Holdings claimed in a then recent billing statement under the terms of the Indemnification Agreement, that SecurityNational Mortgage owed approximately $3,745,000 for mortgage loan losses under the Indemnification Agreement. SecurityNational Mortgage strongly disagrees with the position of Lehman Holdings and, as set forth in its May 11, 2011 complaint, seeks affirmative relief of approximately $4,000,000 from Lehman Bank and Aurora Loan Services. Lehman Bank is a subsidiary of a company owned by Lehman Holdings, and Aurora Loan Services is a subsidiary of Lehman Bank.
15
On September 4, 2012, SecurityNational Mortgage filed a motion for summary judgment in its action against Lehman Bank and Aurora Loan Services on certain material issues, as well as against Lehman Holdings regarding its claims against SecurityNational Mortgage. Lehman Bank and Aurora Loan Services filed a cross motion for summary judgment as to the issues in SecurityNational Mortgage’s motion and, in the Lehman Holdings case, Lehman Holdings has requested that the Court allow a cross motion on the issues which are the subject of SecurityNational Mortgage’s September 4, 2012 motion. The cases are before two different federal judges.
On February 27, 2013, SecurityNational Mortgage’s motion for summary judgment against Lehman Bank and Aurora Loan Services and the related cross motion were heard by Judge David Nuffer of the United States District Court for the District of Utah. After an extensive hearing, Judge Nuffer requested that the parties prepare findings of fact in accordance with the Court’s earlier promulgated findings as modified at the hearing, and that each party submit proposed conclusions of law related to the motions. The motion and cross motion were taken under advisement. SecurityNational Mortgage’s motion in the Lehman Holdings case was heard on April 22, 2014 before Judge Ted Stewart of the United States District Court for the District of Utah, and is under advisement.
On May 6, 2014, Judge Nuffer issued his summary of facts, conclusions of law and order granting SecurityNational Mortgage’s motion for summary judgment and denying the cross motion of Lehman Bank and Aurora Loan Services. On May 27, 2014, Lehman Bank and Aurora Loan Services filed a motion to reconsider Judge Nuffer’s summary judgment ruling. On June 2, 2014, a hearing was held before Judge Nuffer to determine the amount owing to SecurityNational Mortgage pursuant to the summary judgment ruling. On December 23, 2014, Judge Nuffer issued an order denying Lehman Bank’s and Aurora Loan Services’ motion for reconsideration of his summary judgment ruling in favor of SecurityNational Mortgage.
On December 24, 2014, Judge Nuffer issued an amended order granting SecurityNational Mortgage’s motion for summary judgment. The amended order provided that the amount of monies previously paid by SecurityNational Mortgage that were wrongfully applied by Lehman Bank to losses on loans actually owed by Lehman Holdings, as established at the June 2, 2014 hearing, was $3,892,974. The amended order also provided for prejudgment interest at 9% per annum to SecurityNational Mortgage. The total amount of prejudgment interest awarded is $1,674,240 through May 31, 2014, with a per diem of $960 for each day after May 31, 2014 until judgment. The court also commented that further replenishment of the indemnification fund under the Indemnification Agreement appears to be barred by language in the assignment effecting a waiver, but that this issue had not been briefed before the June 2, 2014 hearing. In addition, the court stated that the offset that Lehman Bank and Aurora Loan Services pled as an affirmative defense had not yet been adjudicated by the court. Finally, the court ordered the parties to meet and confer by January 16, 2015, and to file a motion to schedule the disposition of the remaining issues in the case. The motion is to clarify whether any issues other than the offset remain to be resolved.
On May 7, 2014, Judge Stewart issued an order for the parties to submit supplemental briefs as to the effect of Judge Nuffer’s summary judgment order on SecurityNational Mortgage’s motion for summary judgment in the Lehman Holdings case. The supplemental briefing was continued until January 16, 2015. Judge Stewart also granted leave for SecurityNational Mortgage to file an additional motion for summary judgment in the Lehman Holdings case on the basis that the claims of Lehman Holdings are barred by the statute of limitations. The motion was also to be filed by January 16, 2015. The August 11, 2014 trial setting before Judge Stewart in the Lehman Holdings case was stricken without providing a new trial date.
On January 16, 2015, SecurityNational Mortgage and Lehman Holdings filed briefs with Judge Stewart concerning the effect of the rulings in Judge Nuffer’s case on the case before Judge Stewart, and on the same date SecurityNational Mortgage filed a motion for summary judgment in the Lehman Holdings case based on the statute of limitations. A hearing concerning SecurityNational Mortgage’s summary judgment motion based on the statute of limitations is scheduled before Judge Stewart on April 14, 2015. On February 28, 2015, Lehman Bank and Aurora Loan Services filed a partial summary judgment motion before Judge Nuffer asserting that the Indemnification Agreement security fund should be replenished, and for a right to offset alleged losses of approximately $8.6 million, based on more than 100 loans retained by Lehman Bank, against the amount owing to SecurityNational per Judge Nuffer’s summary judgment order. Lehman Bank and Aurora Loan Services asserts that another 124 loans are not analyzed yet for potential breaches.
SecurityNational Mortgage had until March 30, 2015 to respond to the motion of Lehman Bank and Aurora Loan Services, and to file a motion if so determined by SecurityNational Mortgage. SecurityNational Mortgage asserts that Lehman Bank and Aurora Loan Services have no rights to a replenishment of the Indemnification Agreement reserve account, or for any offset against the liability of Lehman Bank and Aurora Loan Services to SecurityNational Mortgage, including the assertion that Lehman Bank and Aurora Loan Services executed an assignment to Lehman Holdings containing a waiver and release of rights and remedies which affect the foregoing asserted replenishment and offset matters. On March 30, 2015, SecurityNational Mortgage filed a response in opposition to the partial summary judgement motion of Lehman Bank and Aurora Loan Services and also filed its own partial summary judgment motion on the same issue against Lehman Bank and Aurora Loan Services.
The Company is not a party to any other material legal proceedings outside the ordinary course of business or to any other legal proceedings, which if adversely determined, would have a material adverse effect on its financial condition or results of operation.
16
Not applicable.
The Company’s Class A common stock trades on The Nasdaq National Market under the symbol “SNFCA.” Prior to August 13, 1987, there was no active public market for the Class A and Class C common stock. As of March 25, 2015, the closing sales price of the Class A common stock was $5.41 per share. The following were the high and low market closing sales prices for the Class A common stock by quarter as reported by Nasdaq since January 1, 2013:
|
Price Range (1)
|
||||||||
|
High
|
Low
|
|||||||
|
Period (Calendar Year)
|
||||||||
|
2013
|
||||||||
|
First Quarter
|
$ | 13.09 | $ | 6.14 | ||||
|
Second Quarter
|
$ | 8.32 | $ | 5.37 | ||||
|
Third Quarter
|
$ | 6.03 | $ | 4.96 | ||||
|
Fourth Quarter
|
$ | 5.46 | $ | 4.16 | ||||
|
2014
|
||||||||
|
First Quarter
|
$ | 4.56 | $ | 3.67 | ||||
|
Second Quarter
|
$ | 4.27 | $ | 3.53 | ||||
|
Third Quarter
|
$ | 4.73 | $ | 3.86 | ||||
|
Fourth Quarter
|
$ | 5.66 | $ | 4.45 | ||||
|
2015
|
||||||||
|
First Quarter (through March 25, 2015)
|
$ | 6.24 | $ | 5.39 | ||||
(1) Sales prices have been adjusted retroactively for the effect of annual stock dividends.
The Class C common stock is not registered or traded on a national exchange. See Note 11 of the Notes to Consolidated Financial Statements.
The Company has never paid a cash dividend on its Class A or Class C common stock. The Company currently anticipates that all of its earnings will be retained for use in the operation and expansion of its business and does not intend to pay any cash dividends on its Class A or Class C common stock in the foreseeable future. Any future determination as to cash dividends will depend upon the earnings and financial position of the Company and such other factors as the Board of Directors may deem appropriate. A 5% stock dividend on Class A and Class C common stock has been paid each year from 1990 through 2014.
17
The graph below compares the cumulative total stockholder return of the Company’s Class A common stock with the cumulative total return on the Standard & Poor’s 500 Stock Index and the Standard & Poor’s Insurance Index for the period from December 31, 2010 through December 31, 2014. The graph assumes that the value of the investment in the Company’s Class A common stock and in each of the indexes was $100 at December 31, 2010 and that all dividends were reinvested.
The comparisons in the graph below are based on historical data and are not intended to forecast the possible future performance of the Company’s Class A common stock.
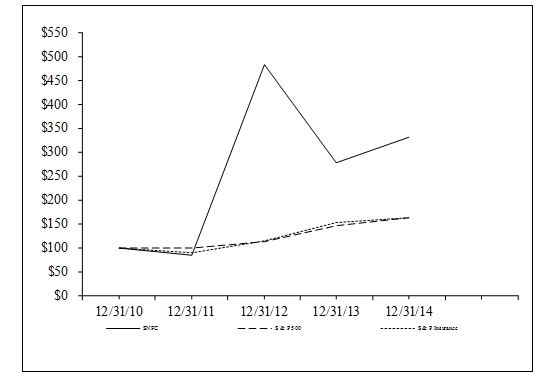
|
12/31/10
|
12/31/11
|
12/31/12
|
12/31/13
|
12/31/14
|
||||||||||||||||
|
SNFC
|
100 | 85 | 483 | 278 | 332 | |||||||||||||||
|
S & P 500
|
100 | 100 | 113 | 147 | 164 | |||||||||||||||
|
S & P Insurance
|
100 | 90 | 115 | 154 | 163 | |||||||||||||||
The graph set forth above is required by the Securities and Exchange Commission and shall not be deemed to be incorporated by reference by any general statement incorporating by reference this Form 10-K into any filing under the Securities Act of 1933, as amended, or under the Securities Exchange Act of 1934, as amended, except to the extent that the Company specifically incorporates this information by reference, and shall not otherwise be deemed soliciting material or filed under such acts.
As of December 31, 2014, there were 3,606 record holders of Class A common stock and 85 record holders of Class C common stock.
18
The following selected financial data is for each of the five years ended December 31, 2014, and is derived from the audited consolidated financial statements. The data as of December 31, 2014 and 2013, and for the three years ended December 31, 2014, should be read in conjunction with the consolidated financial statements, related notes and other financial information.
Consolidated Statement of Earnings Data:
|
Year Ended December 31
|
||||||||||||||||||||
|
2014
|
2013
|
2012(2)
|
2011(1)
|
2010
|
||||||||||||||||
|
Revenue
|
||||||||||||||||||||
|
Insurance premiums and other considerations
|
$ | 53,009,000 | $ | 50,472,000 | $ | 48,216,000 | $ | 48,457,000 | $ | 38,509,000 | ||||||||||
|
Net investment income
|
28,304,000 | 20,354,000 | 21,916,000 | 18,570,000 | 18,262,000 | |||||||||||||||
|
Net mortuary and cemetery sales
|
11,426,000 | 12,000,000 | 10,865,000 | 10,761,000 | 11,520,000 | |||||||||||||||
|
Realized gains on investments
|
1,918,000 | 1,418,000 | 1,425,000 | 2,464,000 | 1,615,000 | |||||||||||||||
|
Other than temporary impairments
|
(164,000 | ) | (336,000 | ) | (1,208,000 | ) | (841,000 | ) | (674,000 | ) | ||||||||||
|
Mortgage fee income
|
128,697,000 | 128,801,000 | 151,887,000 | 79,046,000 | 97,697,000 | |||||||||||||||
|
Other
|
3,747,000 | 2,606,000 | 1,159,000 | 1,110,000 | 1,582,000 | |||||||||||||||
|
Total revenues
|
226,937,000 | 215,315,000 | 234,260,000 | 159,567,000 | 168,511,000 | |||||||||||||||
|
Expenses
|
||||||||||||||||||||
|
Policyholder benefits
|
47,850,000 | 48,130,000 | 45,681,000 | 46,204,000 | 37,947,000 | |||||||||||||||
|
Amortization of deferred
policy acquisition costs
|
6,893,000 | 5,182,000 | 5,450,000 | 5,769,000 | 4,431,000 | |||||||||||||||
|
Selling, general and administrative expenses
|
154,866,000 | 147,406,000 | 156,310,000 | 102,513,000 | 122,217,000 | |||||||||||||||
|
Interest expense
|
2,994,000 | 2,854,000 | 3,744,000 | 1,961,000 | 2,779,000 | |||||||||||||||
|
Cost of goods and services of
the mortuaries and cemeteries
|
1,853,000 | 1,919,000 | 1,724,000 | 1,883,000 | 2,226,000 | |||||||||||||||
|
Total benefits and expenses
|
214,456,000 | 205,491,000 | 212,909,000 | 158,330,000 | 169,600,000 | |||||||||||||||
|
Earnings (loss) before income taxes
|
12,481,000 | 9,824,000 | 21,351,000 | 1,237,000 | (1,089,000 | ) | ||||||||||||||
|
Income tax benefit (expense)
|
(4,726,000 | ) | (2,238,000 | ) | (4,639,000 | ) | 62,000 | 658,000 | ||||||||||||
|
Net earnings (loss)
|
$ | 7,755,000 | $ | 7,586,000 | $ | 16,712,000 | $ | 1,299,000 | $ | (431,000 | ) | |||||||||
|
Net earnings (loss) per common share (3)
|
$ | 0.62 | $ | 0.61 | $ | 1.46 | $ | 0.12 | $ | (0.04 | ) | |||||||||
|
Weighted average outstanding
common shares (3)
|
12,519,000 | 12,366,000 | 11,428,000 | 11,187,000 | 10,981,000 | |||||||||||||||
|
Net earnings (loss) per common
share-assuming dilution (3)
|
$ | 0.60 | $ | 0.58 | $ | 1.39 | $ | 0.11 | $ | (0.04 | ) | |||||||||
|
Weighted average outstanding
common shares-assuming dilution (3)
|
12,928,000 | 12,982,000 | 12,027,000 | 11,306,000 | 10,981,000 | |||||||||||||||
19
Balance Sheet Data:
|
December 31
|
||||||||||||||||||||
|
2014
|
2013
|
2012(2)
|
2011(1)
|
2010
|
||||||||||||||||
|
Assets
|
||||||||||||||||||||
|
Investments and restricted assets
|
$ | 446,249,000 | $ | 391,523,000 | $ | 356,446,000 | $ | 337,625,000 | $ | 281,262,000 | ||||||||||
|
Cash
|
30,855,000 | 38,203,000 | 33,494,000 | 15,583,000 | 37,244,000 | |||||||||||||||
|
Receivables
|
82,079,000 | 88,832,000 | 111,157,000 | 87,252,000 | 71,035,000 | |||||||||||||||
|
Other assets
|
111,887,000 | 100,199,000 | 96,120,000 | 82,591,000 | 77,471,000 | |||||||||||||||
|
Total assets
|
$ | 671,070,000 | $ | 618,757,000 | $ | 597,217,000 | $ | 523,051,000 | $ | 467,012,000 | ||||||||||
|
Liabilities
|
||||||||||||||||||||
|
Policyholder benefits
|
$ | 481,689,000 | $ | 457,304,000 | $ | 443,388,000 | $ | 388,538,000 | $ | 351,563,000 | ||||||||||
|
Bank & other loans payable
|
29,020,000 | 18,289,000 | 11,910,000 | 25,019,000 | 7,066,000 | |||||||||||||||
|
Cemetery & mortuary liabilities
|
13,242,000 | 13,176,000 | 13,412,000 | 13,140,000 | 13,192,000 | |||||||||||||||
|
Cemetery perpetual care obligation
|
3,407,000 | 3,266,000 | 3,153,000 | 2,983,000 | 2,854,000 | |||||||||||||||
|
Other liabilities
|
46,621,000 | 38,971,000 | 45,542,000 | 32,140,000 | 32,408,000 | |||||||||||||||
|
Total liabilities
|
573,979,000 | 531,006,000 | 517,405,000 | 461,820,000 | 407,083,000 | |||||||||||||||
|
Stockholders’ equity
|
97,091,000 | 87,751,000 | 79,812,000 | 61,231,000 | 59,929,000 | |||||||||||||||
|
Total liabilities and
stockholders’ equity
|
$ | 671,070,000 | $ | 618,757,000 | $ | 597,217,000 | $ | 523,051,000 | $ | 467,012,000 | ||||||||||
|
(1) Includes the assumption reinsurance of North America Life Insurance Company.
|
|||||||||
|
(2) Includes the coinsurance with Mothe Life Insurance Company and DLE Life Insurance Company.
|
|||||||||
|
(3) Earnings per share amounts have been adjusted retroactively for the effect of annual stock dividends.
|
|||||||||
Overview
The Company’s operations over the last several years generally reflect three trends or events which the Company expects to continue: (i) increased attention to “niche” insurance products, such as the Company’s funeral plan policies and traditional whole life products; (ii) emphasis on cemetery and mortuary business; and (iii) capitalizing on relatively low interest rates by originating mortgage loans.
Insurance Operations
The following table shows the financial results for the Company’s insurance operations for the years ended December 31, 2014, 2013 and 2012. See Note 14 of the Notes to Consolidated Financial Statements.
|
Years ended December 31
(in thousands of dollars)
|
||||||||||||||||||||
|
2014
|
2013
|
2014 vs 2013 % Increase (Decrease)
|
2012
|
2013 vs 2012 % Increase (Decrease)
|
||||||||||||||||
|
Revenues from external customers
|
||||||||||||||||||||
|
Insurance premiums
|
$ | 53,009 | $ | 50,472 | 5 | % | $ | 48,216 | 5 | % | ||||||||||
|
Net investment income
|
23,008 | 15,878 | 45 | % | 16,617 | (4 | %) | |||||||||||||
|
Revenues from loan originations
|
4,029 | 851 | 373 | % | 1,334 | (36 | %) | |||||||||||||
|
Other
|
1,727 | 1,604 | 8 | % | 690 | 132 | % | |||||||||||||
|
Total
|
$ | 81,773 | $ | 68,805 | 19 | % | $ | 66,857 | 3 | % | ||||||||||
|
Intersegment revenue
|
$ | 6,128 | $ | 7,220 | (15 | %) | $ | 7,571 | (5 | %) | ||||||||||
|
Earnings before income taxes
|
$ | 8,472 | $ | 2,868 | 195 | % | $ | 4,591 | (38 | %) | ||||||||||
Intersegment revenues for the Company’s insurance operations are primarily interest income from the warehouse line provided to SecurityNational Mortgage Company. Profitability in 2014 has increased due to increases in net investment income, increases in insurance premiums and increases in loan origination revenue.
20
Cemetery and Mortuary Operations
The following table shows the condensed financial results for the Company’s cemetery and mortuary operations for the years ended December 31, 2014, 2013 and 2012. See Note 14 of the Notes to Consolidated Financial Statements.
|
Years ended December 31
(in thousands of dollars)
|
||||||||||||||||||||
|
2014
|
2013
|
2014 vs 2013 % Increase (Decrease)
|
2012
|
2013 vs 2012 % Increase (Decrease)
|
||||||||||||||||
|
Revenues from external customers
|
||||||||||||||||||||
|
Mortuary revenues
|
$ | 4,801 | $ | 5,081 | (6 | %) | $ | 4,567 | 11 | % | ||||||||||
|
Cemetery revenues
|
6,625 | 6,919 | (4 | %) | 6,297 | 10 | % | |||||||||||||
|
Realized gains on investments and other assets
|
586 | 16 | 3563 | % | 9 | 78 | % | |||||||||||||
|
Other
|
445 | 364 | 22 | % | 470 | (23 | %) | |||||||||||||
|
Total
|
$ | 12,457 | $ | 12,380 | 1 | % | $ | 11,343 | 9 | % | ||||||||||
|
Earnings before income taxes
|
$ | 663 | $ | 223 | 197 | % | $ | 219 | 2 | % | ||||||||||
The majority of the realized gain in the Company’s cemetery and mortuary operations in 2014 was due to the sale of certain real estate of Paradise Sunset Chapel. Included in other revenue was rental income from residential and commercial properties purchased from Security National Life. Memorial Estates used financing provided by Security National Life to purchase these properties. The rental income was offset by property insurance, taxes, maintenance expenses and interest payments made to Security National Life. Memorial Estates recorded depreciation on these properties of $945,000, $1,029,000 and $1,025,000 for the twelve months ended December 31, 2014, 2013 and 2012, respectively.
Mortgage Operations
Approximately 58% of the Company’s revenues for the fiscal year 2014 were through its wholly owned subsidiaries, SecurityNational Mortgage Company and Green Street Mortgage Services, Inc. Both mortgage subsidiaries are mortgage lenders incorporated under the laws of the State of Utah, and are approved and regulated by the Federal Housing Administration (FHA), a department of the U.S. Department of Housing and Urban Development (HUD), to originate mortgage loans that qualify for government insurance in the event of default by the borrower. SecurityNational Mortgage and Green Street Mortgage obtain loans from their retail offices and independent brokers and pay a commission to brokers for loans that are funded by them. Mortgage loans originated by the Company’s mortgage subsidiaries are funded from internal cash flows, including loan purchase agreements from Security National Life Insurance Company, its wholly owned subsidiary, and unaffiliated financial institutions.
SecurityNational Mortgage and Green Street Mortgage receive fees from the borrowers and secondary fees from third party investors that purchase their loans. Loans originated by SecurityNational Mortgage and Green Street Mortgage are generally sold with mortgage servicing rights released to third party investors. Since the second quarter of 2012, however, SecurityNational Mortgage has sold, but retained mortgage servicing rights on approximately 30% of its origination volume. These loans are serviced by an approved third party servicer. For the twelve months ended December 31, 2014, 2013 and 2012, SecurityNational Mortgage originated and sold 10,794 loans ($2,037,337,000 total volume), 11,484 loans ($2,147,040,000 total volume), and 13,392 loans ($2,451,843,000 total volume), respectively. For the twelve months ended December 31, 2014 and 2013, Green Street Mortgage originated and sold 33 loans ($7,298,000 total volume), and seven loans ($1,731,000 total volume), respectively. Green Street Mortgage did not originate and sell any mortgage loans prior to January 1, 2013.
21
The following table shows the condensed financial results for the Company’s mortgage operations for the years ended 2014, 2013 and 2012. See Note 14 of the Notes to Consolidated Financial Statements.
|
Years ended December 31
(in thousands of dollars)
|
||||||||||||||||||||
|
2014
|
2013
|
2014 vs 2013 % Increase (Decrease)
|
2012
|
2013 vs 2012 % Increase (Decrease)
|
||||||||||||||||
|
Revenues from external customers:
|
||||||||||||||||||||
|
Revenues from loan originations
|
$ | 102,806 | $ | 104,111 | (1 | %) | $ | 120,749 | (14 | %) | ||||||||||
|
Secondary gains from investors
|
21,862 | 23,839 | (8 | %) | 29,804 | (20 | %) | |||||||||||||
|
Total
|
$ | 124,668 | $ | 127,950 | (3 | %) | $ | 150,553 | (15 | %) | ||||||||||
|
Earnings before income taxes
|
$ | 3,346 | $ | 6,732 | (50 | %) | $ | 16,542 | (59 | %) | ||||||||||
The decrease in earnings for the Company’s mortgage operations for the twelve months ended December 31, 2014 as compared to December 31, 2013 was due to lower secondary gains on mortgage loans sold to investors and the decline in refinance activity as a result of the increase in mortgage loan interest rates in 2014.
Mortgage Loan Loss Settlements
The mortgage industry has seen potential loan losses decrease. Future loan losses are extremely difficult to estimate, especially in the current market. However, management believes that the Company’s reserve methodology and its current practice of property preservation allow it to estimate its losses on loans sold. The amounts accrued for loan losses in years ended December 31, 2014 and 2013 were $3,053,000 and $1,846,000, respectively. The estimated liability for indemnification losses is included in other liabilities and accrued expenses and, as of December 31, 2014 and 2013, the balances were $1,718,000 and $5,507,000, respectively.
Final Settlement with Wells Fargo
On April 7, 2011, SecurityNational Mortgage entered into the Settlement Agreement and Release (the "Settlement Agreement") with Wells Fargo Funding, Inc. On December 4, 2014, SecurityNational Mortgage and Wells Fargo Bank (which was assigned Wells Fargo Funding's interest in the Settlement Agreement) entered into a Second Addendum (the "Addendum") to the Settlement Agreement, in which SecurityNational Mortgage agreed to make a final payment to Wells Fargo Bank by December 30, 2014, to satisfy and terminate its remaining payment obligations under the Settlement Agreement. On December 29, 2014, SecurityNational Mortgage made the final payment to Wells Fargo Bank pursuant to the terms of the Addendum from its loan loss reserve, thereby satisfying in full its payment obligations under the Settlement Agreement.
Settlement with Bank of America, N.A. and Countrywide Home Loans, Inc.
On December 23, 2014, SecurityNational Mortgage entered into a Settlement Agreement (the “Settlement Agreement”) with Countrywide Home Loans, Inc. (“Countrywide Home Loans”), Bank of America, N.A. (“Bank of America”), successor-in-interest by the April 27, 2009 de jure merger to Countrywide Bank, FSB. Under the terms of the Settlement Agreement, SecurityNational Mortgage is required to pay a settlement amount to Bank of America and Countrywide Home Loans, jointly as settlement purchasers. On December 23, 2014, SecurityNational Mortgage made the full and final settlement payment from its mortgage loan loss reserve to Bank of America and Countrywide Home Loans by wire transfer.
The payment of the settlement amount is in full and final settlement of the claims and disputes between Bank of America and Countrywide Home Loans, and SecurityNational Mortgage under certain loan purchase agreements. Bank of America, Countrywide Home Loans and SecurityNational Mortgage are parties to the Loan Purchase Agreement, originally entered into between Countrywide Funding Corporation and SecurityNational Mortgage, dated September 27, 1994; and Countrywide Home Loans and SecurityNational Mortgage are parties to the Home Equity Loan Purchase Agreement, dated January 15, 1997, including any amendments or modifications to such agreements (collectively, the “Loan Purchase Agreements”).
22
Under the terms of the Settlement Agreement, SecurityNational Mortgage, Bank of America and Countrywide Home Loans agreed to full, complete and general mutual releases with respect to the alleged claims and disputes. In particular, Bank of America and Countrywide Home Loans, as settlement purchasers, and SecurityNational Mortgage Company, as settlement seller, and their respective parent and subsidiary entities, predecessors, successors and affiliates agree to fully, finally and completely release and forever discharge each other and their respective parent and subsidiary entities, predecessors, successors, affiliates, assigns and their respective current and past directors, officers, employees, representatives and agents from any and all claims and disputes under the Loan Purchase Agreements. The settlement agreement is subject to an exception for pervasive or system-wide fraud.
Mortgage Loan Loss Demands
Third Party Investors
There have been assertions in third party investor correspondence that SecurityNational Mortgage sold mortgage loans that allegedly contained borrower misrepresentations or experienced early payment defaults, or that were otherwise allegedly defective or not in compliance with agreements between SecurityNational Mortgage and the third party investors consisting principally of financial institutions. As a result of these claims, third party investors have made demands that SecurityNational Mortgage repurchase certain alleged defective mortgage loans that were sold to such investors or indemnify them against any losses related to such loans.
The total amount of potential claims by third party investors is difficult to determine. The Company has reserved and accrued $1,702,000 as of December 31, 2014 to settle all such investor related claims. The Company believes that the reserve for mortgage loan loss, which includes provisions for probable losses and indemnification on mortgage loans sold to investors, is reasonable based on available information. Moreover, the Company has successfully negotiated acceptable settlement terms with other third party investors that asserted claims for mortgage loan losses against SecurityNational Mortgage.
SecurityNational Mortgage disagrees with the repurchase demands and notices of potential claims from third party investors. Furthermore, SecurityNational Mortgage believes there is potential to resolve the alleged claims by the third party investors on acceptable terms. If SecurityNational Mortgage is unable to resolve such claims on acceptable terms, legal action may ensue. In the event of legal action by any third party investor, SecurityNational Mortgage believes it has significant defenses to any such action and intends to vigorously defend itself against such action.
23
JP Morgan Chase Indemnification Demand
The Company and its wholly owned subsidiary, SecurityNational Mortgage, received a notice of claim for indemnification dated December 21, 2011, from JP Morgan Chase & Co. (“JP Morgan Chase”) on behalf of EMC Mortgage, LLC (“EMC Mortgage”), relating to 21 mortgage loans that EMC Mortgage allegedly purchased as a third party investor from SecurityNational Mortgage. The notice also referenced a guaranty agreement, dated February 23, 2006, by the Company for the benefit of EMC Mortgage. The indemnification notice additionally stated that EMC Mortgage had been named in a lawsuit by the Bear Stearns Mortgage Funding Trust 2007-AR2 (the “Trust”), which was filed on September 13, 2011 in the Delaware Court of Chancery.
The lawsuit the Trust brought against EMC Mortgage contends that more than 800 residential mortgage loans that EMC Mortgage sold to the Trust (including the 21 loans allegedly originated by SecurityNational Mortgage) contained breaches of representations and warranties with respect to the mortgage loans, as well as defaults and foreclosures in many of such loans. As a result of the alleged breaches of representations and warranties by EMC Mortgage, the complaint requests that EMC Mortgage be ordered to repurchase from the Trust any loans for which it breached its representations and warranties, in the amount of the mortgage loans’ outstanding principal balance and all accrued but unpaid interest.
The indemnification notice from JP Morgan Chase further alleged that the Company and SecurityNational Mortgage are required to indemnify EMC Mortgage for any of its losses arising from the lawsuit that the Trust brought against EMC based upon allegedly untrue statements of material fact related to information that was provided by SecurityNational Mortgage. To the extent the claims in the complaint relate to the 21 mortgage loans that SecurityNational Mortgage allegedly sold to EMC Mortgage, the Company believes it has significant defenses to such claims. The Company intends to vigorously defend itself and SecurityNational Mortgage in the event that JP Morgan Chase were to bring any legal action to require the Company or SecurityNational Mortgage to indemnify it for any loss, liability or expense in connection with the lawsuit that the Trust brought against EMC Mortgage.
Mortgage Loan Loss Litigation
For a description of the litigation involving SecurityNational Mortgage and Lehman Brothers and Aurora Loan Services, reference is to Part I, Item 3. Legal Proceedings.
Significant Accounting Policies
The following is a brief summary of our significant accounting policies and a review of our most critical accounting estimates. See Note 1 of the Notes to Consolidated Financial Statements.
Insurance Operations
In accordance with generally accepted accounting principles in the United States of America (GAAP), premiums and other considerations received for interest sensitive products are reflected as increases in liabilities for policyholder account balances and not as revenues. Revenues reported for these products consist of policy charges for the cost of insurance, administration charges, amortization of policy initiation fees and surrender charges assessed against policyholder account balances. Surrender benefits paid relating to these products are reflected as decreases in liabilities for policyholder account balances and not as expenses.
The Company receives investment income earned from the funds deposited into account balances, a portion of which is passed through to the policyholders in the form of interest credited. Interest credited to policyholder account balances and benefit claims in excess of policyholder account balances are reported as expenses in the consolidated financial statements.
Premiums and other considerations received for traditional life insurance products are recognized as revenues when due. Future policy benefits are recognized as expenses over the life of the policy by means of the provision for future policy benefits.
The costs related to acquiring new business, including certain costs of issuing policies and other variable selling expenses (principally commissions), defined as deferred policy acquisition costs, are capitalized and amortized into expense. For nonparticipating traditional life products, these costs are amortized over the premium paying period of the related policies, in proportion to the ratio of annual premium revenues to total anticipated premium revenues. Such anticipated premium revenues are estimated using the same assumption used for computing liabilities for future policy benefits and are generally “locked in” at the date the policies are issued. For interest sensitive products, these costs are amortized generally in proportion to expected gross profits from surrender charges and investment, mortality and expense margins. This amortization is adjusted when the Company revises the estimate of current or future gross profits or margins. For example, deferred policy acquisition costs are amortized earlier than originally estimated when policy terminations are higher than originally estimated or when investments backing the related policyholder liabilities are sold at a gain prior to their anticipated maturity.
24
Death and other policyholder benefits reflect exposure to mortality risk and fluctuate from year to year on the level of claims incurred under insurance retention limits. The profitability of the Company is primarily affected by fluctuations in mortality, other policyholder benefits, expense levels, interest spreads (i.e., the difference between interest earned on investments and interest credited to policyholders) and persistency. The Company has the ability to mitigate adverse experience through sound underwriting, asset and liability duration matching, sound actuarial practices, adjustments to credited interest rates, policyholder dividends and cost of insurance charges.
Cemetery and Mortuary Operations
Pre-need sales of funeral services and caskets, including revenue and costs associated with the sales of pre-need funeral services and caskets, are deferred until the services are performed or the caskets are delivered.
Pre-need sales of cemetery interment rights (cemetery burial property), including revenue and costs associated with the sales of pre-need cemetery interment rights, are recognized in accordance with the retail land sales provisions of generally accepted accounting principles in the United States (GAAP). Under GAAP, recognition of revenue and associated costs from constructed cemetery property must be deferred until a minimum percentage of the sales price has been collected. Revenues related to the pre-need sale of unconstructed cemetery property will be deferred until such property is constructed and meets the criteria of GAAP, described above.
Pre-need sales of cemetery merchandise (primarily markers and vaults), including revenue and costs associated with the sales of pre-need cemetery merchandise, are deferred until the merchandise is delivered.
Pre-need sales of cemetery services (primarily merchandise delivery and installation fees and burial opening and closing fees), including revenue and costs associated with the sales of pre-need cemetery services, are deferred until the services are performed.
Prearranged funeral and pre-need cemetery customer obtaining costs, including costs incurred related to obtaining new pre-need cemetery and prearranged funeral business are accounted for under the guidance of the provisions of GAAP related to Financial Services - Insurance. Obtaining costs, which include only costs that vary with and are primarily related to the acquisition of new pre-need cemetery and prearranged funeral business, are deferred until the merchandise is delivered or services are performed.
Revenues and costs for at-need sales are recorded when a valid contract exists, the services are performed, collection is reasonably assured, and there are no significant obligations remaining.
Mortgage Operations
Mortgage fee income consists of origination fees, processing fees and certain other income related to the origination and sale of mortgage loans. For mortgage loans sold to third party investors, mortgage fee income and related expenses are recognized pursuant to generally accepted accounting principles at the time the sales of the mortgage loans comply with the sales criteria for the transfer of financial assets. The sales criteria is as follows: (i) the transferred assets have been isolated from the Company and its creditors, (ii) the transferee has the right to pledge or exchange the mortgage, and (iii) the Company does not maintain effective control over the transferred mortgage.
The Company must determine that all three sales criteria are met at the time a mortgage loan is funded. All rights and title to the mortgage loans are assigned to unrelated financial institution investors, including investor commitments for the loans made prior to warehouse banks purchasing the loans under the purchase commitments.
The Company sells all mortgage loans to third party investors without recourse. It may be required, however, to repurchase a loan or pay a fee instead of repurchase under certain events, which include the following:
|
·
|
Failure to deliver original documents specified by the investor,
|
|
·
|
The existence of misrepresentation or fraud in the origination of the loan,
|
|
·
|
The loan becomes delinquent due to nonpayment during the first several months after it is sold,
|
|
·
|
Early pay-off of a loan, as defined by the agreements,
|
|
·
|
Excessive time to settle a loan,
|
|
·
|
Investor declines purchase, and
|
|
·
|
Discontinued product and expired commitment.
|
Loan purchase commitments generally specify a date 30 to 45 days after delivery upon which the underlying loans should be settled. Depending on market conditions, these commitment settlement dates can be extended at a cost to the Company. Generally, a ten day extension will cost .125% (12.5 basis points) of the loan amount. The Company’s historical data shows that 99% of all loans originated are generally settled by the investors as agreed within 16 days after delivery. There are situations, however, when the Company determines that it is unable to enforce the settlement of loans rejected by the third-party investors and that it is in its best interest to repurchase those loans from the warehouse banks.
25
It is the Company’s policy to cure any documentation problems regarding such loans at a minimal cost for up to a six-month time period and to pursue efforts to enforce loan purchase commitments from third-party investors concerning the loans. The Company believes that six months allows adequate time to remedy any documentation issues, to enforce purchase commitments, and to exhaust other alternatives. Remedial methods include the following:
|
·
|
Research reasons for rejection,
|
|
·
|
Provide additional documents,
|
|
·
|
Request investor exceptions,
|
|
·
|
Appeal rejection decision to purchase committee, and
|
|
·
|
Commit to secondary investors.
|
Once purchase commitments have expired and other alternatives to remedy are exhausted, which could be earlier than the six month time period, the loans are repurchased and transferred to the long term investment portfolio at the lower of cost or fair value and the previously recorded sales revenue is reversed. Any loan that later becomes delinquent is evaluated by the Company at that time and any impairment is adjusted accordingly.
Determining lower of cost or market
. Cost is equal to the amount paid to the warehouse bank and the amount originally funded by the Company. Market value, while often difficult to determine, is based on the following guidelines:
|
·
|
For loans that have an active market, the Company uses the market price on the repurchase date.
|
|
·
|
For loans where there is no market but there is a similar product, the Company uses the market value for the similar product on the repurchase date.
|
|
·
|
For loans where no active market exists on the repurchase date, the Company determines that the unpaid principal balance best approximates the market value on the repurchase date, after considering the fair value of the underlying real estate collateral and estimated future cash flows.
|
The appraised value of the real estate underlying the original mortgage loan adds significance to the Company’s determination of fair value because, if the loan becomes delinquent, the Company has sufficient value to collect the unpaid principal balance or the carrying value of the loan. In determining the market value on the date of repurchase, the Company considers the total value of all of the loans because any sale of loans would be made as a pool.
Loans that are foreclosed on are reclassified as other real estate held for investment. The Company carries the foreclosed properties in Security National Life, Memorial Estates, and SecurityNational Mortgage, its life, cemeteries and mortuaries, and mortgage subsidiary, and rents the properties until it is deemed economically desirable to sell them.
Mortgage fee income is generated through the origination and refinancing of mortgage loans and is realized in accordance with GAAP related to sales of financial assets.
The majority of loans originated are sold to third party investors. The amounts sold to investors are shown on the balance sheet as mortgage loans sold to investors, and include the fees due from the investors.
Use of Significant Accounting Estimates
The preparation of financial statements in conformity with GAAP requires management to make estimates and assumptions that affect reported amounts and disclosures. It is reasonably possible that actual experience could differ from the estimates and assumptions utilized which could have a material impact on the financial statements. The following is a summary of our significant accounting estimates, and critical issues that impact them:
26
Fixed Maturities and Equity Securities Available for Sale
Securities available for sale are carried at estimated fair value, with unrealized holding gains and losses reported in accumulated other comprehensive income, which is included in stockholders’ equity after adjustment for deferred income taxes and deferred acquisition costs related to universal life products.
When the value of a security declines and the decline is determined to be other than temporary, the carrying value of the investment is reduced to its fair value and a realized loss is recorded to the extent of the decline.
Deferred Acquisition Costs
Amortization of deferred policy acquisition costs for interest sensitive products is dependent upon estimates of current and future gross profits or margins on this business. Key assumptions used include the following: yield on investments supporting the liabilities, amount of interest or dividends credited to the policies, amount of policy fees and charges, amount of expenses necessary to maintain the policies, amount of death and surrender benefits, and the length of time the policies will stay in force.
For nonparticipating traditional life products, these costs are amortized over the premium paying period of the related policies in proportion to the ratio of annual premium revenues to total anticipated premium revenues. Such anticipated premium revenues are estimated using the same assumption used for computing liabilities for future policy benefits and are generally “locked in” at the date the policies are issued.
Value of Business Acquired
Value of business acquired is the present value of estimated future profits of the acquired business and is amortized similar to deferred acquisition costs. The critical issues explained for deferred acquisition costs would also apply for value of business acquired.
Allowance for Doubtful Accounts
The Company accrues an estimate of potential losses for the collection of receivables. The significant receivables are the result of receivables due on mortgage loans sold to investors, cemetery and mortuary operations, mortgage loan operations and other receivables. The allowance is based upon the Company’s experience. The critical issue that would impact recovery of the cemetery and mortuary receivables is the overall economy. The critical issues that would impact recovery of mortgage loan operations would be interest rate risk and loan underwriting.
Future Policy Benefits
Reserves for future policy benefits for traditional life insurance products requires the use of many assumptions, including the duration of the policies, mortality experience, expenses, investment yield, lapse rates, surrender rates, and dividend crediting rates.
These assumptions are made based upon historical experience, industry standards and a best estimate of future results and, for traditional life products, include a provision for adverse deviation. For traditional life insurance, once established for a particular series of products, these assumptions are generally held constant.
Unearned Revenue
The universal life products the Company sells have significant policy initiation fees (front-end load) that are deferred and amortized into revenues over the estimated expected gross profits from surrender charges and investment, mortality and expense margins. The same issues that impact deferred acquisition costs would apply to unearned revenue.
Deferred Pre-need Cemetery and Funeral Contracts Revenues and Estimated Future Cost of Pre-need Sales
The revenue and cost associated with the sales of pre-need cemetery merchandise and funeral services are deferred until the merchandise is delivered or the service is performed.
The Company, through its cemetery and mortuary operations, provides a guaranteed funeral arrangement wherein a prospective customer can receive future goods and services at guaranteed prices. To accomplish this, the Company, through its life insurance operations, sells to the customer an increasing benefit life insurance policy that is assigned to the mortuaries. If, at the time of need, the policyholder/potential mortuary customer utilizes one of the Company’s facilities, the guaranteed funeral arrangement contract that has been assigned will provide the funeral goods and services at the contracted price. The increasing life insurance policy will cover the difference between the original contract prices and current prices. Risks may arise if the difference cannot be fully met by the life insurance policy.
27
Mortgage Servicing Rights
Mortgage Service Rights (MSR) arise from contractual agreements between the Company and third-party investors (or their agents) when mortgage loans are sold. Under these contracts, the Company is obligated to retain and provide loan servicing functions on the loans sold, in exchange for fees and other remuneration. The servicing functions typically performed include, among other responsibilities, collecting and remitting loan payments; responding to borrower inquiries; accounting for principal and interest, holding custodial (impound) funds for payment of property taxes and insurance premiums; counseling delinquent mortgagors; and supervising the acquisition of REO and property dispositions. The Company initially accounts for MSRs at fair value and subsequently accounts for them using the amortization method. MSR amortization is determined by amortizing the balance straight-line over an estimated nine year life. The Company periodically assesses MSRs accounted for using the amortization method for impairment.
Mortgage Allowance for Loan Loss and Loan Loss Reserve
The Company provides allowances for losses on its mortgage loans through an allowance for loan losses (a contra-asset account) and through the mortgage loan loss reserve (a liability account). The allowance for loan losses is an allowance for losses on the Company’s mortgage loans held for investment. The allowance is comprised of two components. The first component is an allowance for collectively evaluated impairment that is based upon the Company’s historical experience in collecting similar receivables. The second component is based upon individual evaluation of loans that are determined to be impaired. Upon determining impairment the Company establishes an individual impairment allowance based upon an assessment of the fair value of the underlying collateral.
When a mortgage loan is past due more than 90 days, the Company, where appropriate, sets up an allowance to approximate the excess of the carrying value of the mortgage loan over the estimated fair value of the underlying real estate collateral. When foreclosure is commenced on a delinquent loan, all expenses for foreclosure are expensed as incurred. Once foreclosed the carrying value should approximate its fair value and the amount will be classified as real estate owned. The Company is currently able to rent properties at a 2% to 8% gross return.
The mortgage loan loss reserve is an estimate of probable losses at the balance sheet date that the Company will realize in the future on mortgage loans sold to third party investors. The Company may be required to reimburse third party investors for costs associated with early payoff of loans within the first six months of such loans and to repurchase loans where there is a default in any of the first four monthly payments to the investors or, in lieu of repurchase, to pay a negotiated fee to the investors. The Company’s estimates are based upon historical loss experience and the best estimate of the probable loan loss liabilities.
Upon completion of a transfer that satisfies the conditions to be accounted for as a sale, the Company initially measures at fair value liabilities incurred in a sale relating to any guarantee or recourse provisions. The Company accrues a monthly allowance for indemnification losses to investors based on total production. This estimate is based on the Company’s historical experience. The amount accrued for and the charge to expense is included in selling, general and administrative expenses. The estimated liability for indemnification losses is included in other liabilities and accrued expenses. The Company believes the allowance for loan losses and the loan loss reserve represent probable loan losses incurred as of the balance sheet date.
Deferred Compensation
The Company has deferred compensation agreements with several of its current executive officers. The deferred compensation is payable upon retirement or death of these individuals either in annual installments (ten years) or a lump sum settlement, if approved by the Board of Directors. The Company has accrued the present value of these benefits based upon their future retirement dates and other factors, on its consolidated financial statements.
Depreciation
Depreciation is calculated principally on the straight-line-method over the estimated useful lives of the assets, which range from 3 to 40 years. Leasehold improvements are amortized over the lesser of the useful life or remaining lease terms.
28
Captive Insurance
This Company belongs to a captive insurance group for certain casualty, workers compensation and general liability insurance. Insurance reserves are maintained relative to these programs. The level of exposure from catastrophic events is limited by the purchase of stop-loss and aggregate liability reinsurance coverage. When estimating the insurance liabilities and related reserves, the captive insurance management considers a number of factors, which include historical claims experience, demographic factors, severity factors and valuations provided independent third-party actuaries. If actual claims or adverse development of loss reserves occurs and exceed these estimates, additional reserves may be required. The estimation process contains uncertainty since captive insurance management must use judgment to estimate the ultimate cost that will be incurred to settle reported claims and unreported claims for incidents incurred but not reported as of the balance sheet date.
Results of Consolidated Operations
2014 Compared to 2013
Total revenues increased by $11,622,000, or 5.4%, to $226,937,000 for fiscal year 2014 from $215,315,000 for the fiscal year 2013. Contributing to this increase in total revenues was a $7,950,000 increase in net investment income, a $2,537,000 increase in insurance premiums and other considerations, a $1,141,000 increase in other revenues, a $500,000 increase in realized gains on investments and other assets, and an $172,000 decrease in other than temporary impairments. This increase in total revenues was partially offset by a $574,000 decrease in net cemetery and mortuary sales, and a $104,000 decrease in mortgage fee income.
Insurance premiums and other considerations increased by $2,537,000, or 5.0%, to $53,009,000 for 2014, from $50,472,000 for the comparable period in 2013. This increase was due to an increase in renewal premiums and an increase in first year premiums as a result of increased insurance sales in 2014.
Net investment income increased by $7,950,000, or 39.1%, to $28,304,000 for 2014, from $20,354,000 for the comparable period in 2013. This increase was primarily attributable to a $3,445,000 increase in income from short-term investments, a $2,883,000 increase in interest from mortgage loans, and a $1,776,000 increase in income from real estate. This increase was partially offset by a $61,000 increase in investment expenses, a $58,000 decrease in policy loans income, and a $37,000 decrease in fixed maturity securities income.
Net cemetery and mortuary sales decreased by $574,000, or 4.8%, to $11,426,000 for 2014, from $12,000,000 for the comparable period in 2013. This decrease was primarily due to a $294,000 decrease in cemetery pre-need and at-need sales, and a $280,000 decrease in mortuary at-need sales.
Realized gains on investments and other assets increased by $500,000, or 0.5%, to $1,918,000 in realized gains for 2014, from $1,418,000 in realized gains for the comparable period in 2013. This increase in realized gains and losses on investments and other assets was primarily due to a $482,000 increase in gains and losses on other assets, and a $262,000 increase in gains and losses on fixed maturity securities held to maturity. This increase was partially offset by a $244,000 decrease in gains and losses on marketable securities.
Other than temporary impairments on investments decreased by $172,000, or 51.2%, to $164,000 for 2014 from $336,000 for the comparable period in 2013. This decrease was due to a $116,000 decrease in impairments on real estate held for investment and mortgage loans, and a $56,000 decrease in impairments on marketable securities.
Mortgage fee income decreased by $104,000, or 0.1%, to $128,697,000 for 2014, from $128,801,000 for the comparable period in 2013. This decrease was primarily attributable to lower secondary gains from mortgage loans sold to investors and the decline in refinance activity as a result of the increase in mortgage loan rates in 2014.
Other revenues increased by $1,141,000, or 43.8%, to $3,747,000 for 2014 from $2,606,000 for the comparable period in 2013. This increase was due to an increase in mortgage servicing revenues.
Total benefits and expenses were $214,456,000, or 94.5% of total revenues, for 2014, as compared to $205,491,000, or 95.3% of total revenues, for the comparable period in 2013.
Death benefits, surrenders and other policy benefits, and future policy benefits decreased by an aggregate of $280,000, or 0.6%, to $47,850,000 for 2014, from $48,130,000 for the comparable period in 2013. This decrease was primarily the result of a $1,535,000 decrease in future policy benefits, which was partially offset by increases of $1,052,000 in death benefits, and $203,000 in surrender and other policy benefits.
Amortization of deferred policy and pre-need acquisition costs and value of business acquired increased by $1,711,000, or 33.0%, to $6,893,000 for 2014, from $5,182,000 for the comparable period in 2013. This increase was primarily due to increased amortization of the value of business acquired for new acquisitions and increased amortization for deferred policy costs due to an increased amount of insurance business terminating.
29
Selling, general and administrative expenses increased by $7,458,000, or 5.1%, to $154,865,000 for 2014, from $147,407,000 for the comparable period in 2013. This increase was primarily due to a $6,564,000 increase in personnel expenses, a $4,472,000 increase in other expenses, a $1,302,000 increase in the provision for loan losses, a $678,000 increase in rent and rent related expenses, a $556,000 increase in depreciation expense on property and equipment, and a $242,000 increase in costs related to funding mortgage loans. This increase was partially offset by a $6,103,000 decrease in commission expenses and a $253,000 decrease in advertising expenses.
Interest expense increased by $140,000, or 4.9%, to $2,994,000 for 2014, from $2,854,000 for the comparable period in 2013. This increase was primarily due to a new bank loan entered into by Security National Life for real estate offset by a reduction in outstanding balances on warehouse lines of credit used to fund mortgage loans.
Cost of goods and services sold of the cemeteries and mortuaries decreased by $66,000, or 3.4%, to $1,853,000 for 2014, from $1,919,000 for the comparable period in 2013. This decrease was primarily due to a decrease in mortuary at-need sales and a decrease in cemetery pre-need and at-need sales.
Other comprehensive income for the years ended December 31, 2014 and December 31, 2013 amounted to a gain of $220,000 and a loss of $716,000, respectively. This increase of $936,000 in 2014 was primarily the result of a gain of $1,307,000 in derivatives related to mortgage loans offset by a $371,000 unrealized loss in marketable securities.
2013 Compared to 2012
Total revenues decreased by $18,945,000, or 8.1%, to $215,315,000 for fiscal year 2013 from $234,260,000 for the fiscal year 2012. Contributing to this decrease in total revenues was a $23,087,000 decrease in mortgage fee income and a $1,562,000 decrease in net investment income. This decrease in total revenues was partially offset by a $2,256,000 increase in insurance premiums and other considerations, a $1,447,000 increase in other revenues, a $1,136,000 increase in net cemetery and mortuary sales, and an $871,000 decrease in other than temporary impairments.
Insurance premiums and other considerations increased by $2,256,000, or 4.7%, to $50,472,000 for 2013, from $48,216,000 for the comparable period in 2012. This increase was due to an increase in first year premiums as a result of increased insurance sales in 2013.
Net investment income decreased by $1,562,000, or 7.1%, to $20,354,000 for 2013, from $21,916,000 for the comparable period in 2012. This decrease was primarily attributable to a $3,103,000 increase in investment expenses, an $877,000 decrease in interest from mortgage loans, a $53,000 decrease in equity securities income, and a $31,000 decrease in policy loans income. This decrease was partially offset by a $1,731,000 increase in income from real estate, a $535,000 increase in fixed maturity securities income, and a $236,000 increase in income from short-term investments.
Net cemetery and mortuary sales increased by $1,136,000, or 10.5%, to $12,000,000 for 2013, from $10,864,000 for the comparable period in 2012. This increase was primarily due to a $622,000 increase in cemetery pre-need and at-need sales, and a $514,000 increase in mortuary at-need sales.
Realized gains on investments and other assets decreased by $6,000, or 0.5%, to $1,418,000 in realized gains for 2013, from $1,424,000 in realized gains for the comparable period in 2012. This decrease in realized gains and losses on investments and other assets was primarily due to a $410,000 decrease in gains and losses on fixed maturity securities held to maturity. This decrease was partially offset by a $252,000 increase in gains and losses on other assets, and a $152,000 increase in gains and losses on marketable securities.
Other than temporary impairments on investments decreased by $871,000, or 72.2%, to $336,000 for 2013 from $1,207,000 for the comparable period in 2012. This decrease was due to a $679,000 decrease in impairments on real estate held for investment and mortgage loans, a $147,000 decrease in impairments on marketable securities, and a $45,000 decrease in impairments on fixed maturity securities held to maturity.
Mortgage fee income decreased by $23,087,000, or 15.2%, to $128,801,000 for 2013, from $151,888,000 for the comparable period in 2012. This decrease was primarily attributable to lower secondary gains from mortgage loans sold to investors and the decline in refinance activity as a result of the increase in mortgage loan rates in 2013.
Other revenues increased by $1,447,000, or 124.9%, to $2,606,000 for 2013 from $1,159,000 for the comparable period in 2012. This increase was due to an increase in mortgage servicing revenues.
30
Total benefits and expenses were $205,491,000, or 95.3% of total revenues, for 2013, as compared to $212,909,000, or 90.9% of total revenues, for the comparable period in 2012.
Death benefits, surrenders and other policy benefits, and future policy benefits increased by an aggregate of $2,449,000, or 5.4%, to $48,130,000 for 2013, from $45,681,000 for the comparable period in 2012. This increase was primarily the result of a $3,771,000 increase in death benefits, a $518,000 increase in surrender and other policy benefits, which were partially offset by a $1,840,000 decrease in future policy benefits.
Amortization of deferred policy and pre-need acquisition costs and value of business acquired decreased by $267,000, or 4.9%, to $5,182,000 for 2013, from $5,449,000 for the comparable period in 2012. This decrease was primarily due to improved persistency in the traditional life and universal life lines of business.
Selling, general and administrative expenses decreased by $8,903,000, or 5.7%, to $147,407,000 for 2013, from $156,310,000 for the comparable period in 2012. This decrease was primarily the result of a decrease in mortgage loan originations by SecurityNational Mortgage, which was attributed to the decline in refinance activity as a result of the increase in mortgage loan rates in 2013. Commission expenses decreased by $17,861,000, from $83,840,000 in 2012 to $65,979,000 in 2013 as a result of the decline in refinance activity in 2013. Costs related to funding mortgage loans decreased by $296,000, from $6,931,000 in 2012 to $6,635,000 in 2013 as a result of the decline in refinance activity in 2013. Provision for loan losses decreased by $2,488,000, from $4,239,000 in 2012 to $1,751,000 in 2013.
The decreases in selling, general and administrative expenses were partially offset by an increase in salaries of $5,921,000, from $27,099,000 in 2012 to $33,020,000 in 2013, primarily due to an increase in the number of employees. Other expenses increased by $5,821,000, from $34,200,000 in 2012 to $40,021,000 in 2013 primarily due to an increase in mortgage servicing fees.
Interest expense decreased by $890,000, or 23.8%, to $2,854,000 for 2013, from $3,744,000 for the comparable period in 2012. This decrease was primarily due to reduction in outstanding balances on warehouse lines of credit used to fund mortgage loans.
Cost of goods and services sold of the cemeteries and mortuaries increased by $195,000, or 11.3%, to $1,919,000 for 2013, from $1,724,000 for the comparable period in 2012. This increase was primarily due to an increase in mortuary at-need sales and an increase in cemetery pre-need and at-need sales.
Other comprehensive income for the years ended December 31, 2013 and December 31, 2012 amounted to a loss of $716,000 and a gain of $1,280,000, respectively. This decrease of $1,996,000 in 2013 was primarily the result of a loss of $1,873,000 in derivatives related to mortgage loans and a $123,000 unrealized loss in marketable securities.
Risks
The following is a description of the most significant risks facing the Company and how it mitigates those risks:
Legal and Regulatory Risks
. The risk that changes in the legal or regulatory environment in which the Company operates will create additional expenses and risks not anticipated by the Company in developing and pricing its products. Regulatory initiatives designed to reduce insurer profits, new legal theories or insurance company insolvencies through guaranty fund assessments may create costs for the insurer beyond those recorded in the consolidated financial statements. In addition, changes in tax law with respect to mortgage interest deductions or other public policy or legislative changes may affect the Company’s mortgage sales. Also, the Company may be subject to further regulations in the cemetery and mortuary business. The Company mitigates these risks by offering a wide range of products and by diversifying its operations, thus reducing its exposure to any single product or jurisdiction, and also by employing underwriting practices that identify and minimize the adverse impact of such risks.
Mortgage Industry Risks
. Developments in the mortgage industry and credit markets can adversely affect the Company’s ability to sell its mortgage loans to investors, which can impact the Company’s financial results by requiring it to assume the risk of holding and servicing any unsold loans.
The mortgage loan loss reserve is an estimate of probable losses at the balance sheet date that the Company will realize in the future on mortgage loans sold to third party investors. The Company’s mortgage subsidiaries may be required to reimburse third party investors for costs associated with early payoff of loans within the first six months of such loans and to repurchase loans where there is a default in any of the first four monthly payments to the investors or, in lieu of repurchase, to pay a negotiated fee to the investors. The Company’s estimates are based upon historical loss experience and the best estimate of the probable loan loss liabilities.
31
Upon completion of a transfer that satisfies the conditions to be accounted for as a sale, the Company initially measures at fair value liabilities incurred in a sale relating to any guarantee or recourse provisions. The Company accrues a monthly allowance for indemnification losses to investors based on its historical experience. The amounts accrued for loan losses in years ended December 31, 2014, 2013 and 2012 were $3,053,000, $1,846,000 and $4,053,000, respectively, and the charge to expense has been included in selling, general and administrative expenses. The estimated liability for indemnification losses is included in other liabilities and accrued expenses and, as of December 31, 2014 and 2013, the balances were $1,718,000 and $5,507,000, respectively. The Company believes the allowance for loan losses and the loan loss reserve represent probable loan losses incurred as of December 31, 2014. There is a risk, however, that future loan losses may exceed the loan loss reserves and allowances.
As of December 31, 2014, the Company’s long term mortgage loan portfolio consisted of $7,500,000 in mortgage loans with delinquencies more than 90 days. Of this amount, $1,971,000 of the loans were in foreclosure proceedings. The Company has not received or recognized any interest income on the $7,500,000 in mortgage loans with delinquencies more than 90 days. During the twelve months ended December 31, 2014 and 2013, the Company increased its allowance for mortgage losses by $389,000 and $221,000, respectively, which was charged to bad debt expense and included in selling, general and administrative expenses for the period. The allowances for mortgage loan losses as of December 31, 2014 and 2013 were $2,003,000 and $1,652,000, respectively.
There have been assertions in third party investor correspondence that SecurityNational Mortgage sold mortgage loans that allegedly contained borrower misrepresentations or experienced early payment defaults, or that were otherwise allegedly defective or not in compliance with agreements between SecurityNational Mortgage and the third party investors consisting principally of financial institutions. As a result of these claims, third party investors have made demands that SecurityNational Mortgage repurchase certain alleged defective mortgage loans that were sold to such investors or indemnify them against any losses related to such loans.
The total amount of potential claims by third party investors is difficult to determine. The Company has reserved and accrued $1,702,000 as of December 31, 2014 to settle all such investor related claims. The Company believes that the reserve for mortgage loan loss, which includes provisions for probable losses and indemnification on mortgage loans sold to investors, is reasonable based on available information. Moreover, the Company has successfully negotiated acceptable settlement terms with other third party investors that asserted claims for mortgage loan losses against SecurityNational Mortgage.
SecurityNational Mortgage disagrees with the repurchase demands and notices of potential claims from third party investors. Furthermore, SecurityNational Mortgage believes there is potential to resolve the alleged claims by the third party investors on acceptable terms. If SecurityNational Mortgage is unable to resolve such claims on acceptable terms, legal action may ensue. In the event of legal action by any third party investor, SecurityNational Mortgage believes it has significant defenses to any such action and intends to vigorously defend itself against such action.
Interest Rate Risk
. The risk that interest rates will change which may cause a decrease in the value of the Company’s investments or impair the ability of the Company to market its mortgage and cemetery/mortuary products. This change in rates may cause certain interest-sensitive products to become uncompetitive or may cause disintermediation. The Company mitigates this risk by charging fees for non-conformance with certain policy provisions, by offering products that transfer this risk to the purchaser, and by attempting to match the maturity schedule of its assets with the expected payouts of its liabilities. To the extent that liabilities come due more quickly than assets mature, the Company might have to borrow funds or sell assets prior to maturity and potentially recognize a loss on the sale.
Mortality and Morbidity Risks
. The risk that the Company’s actuarial assumptions may differ from actual mortality and morbidity experiences may cause the Company’s products to be underpriced, may cause the Company to liquidate insurance or other claims earlier than anticipated, and other potentially adverse consequences to the business. The Company minimizes this risk through sound underwriting practices, asset and liability duration matching, and sound actuarial practices.
Estimates
. The preparation of financial statements in conformity with U.S. Generally Accepted Accounting Principles (GAAP) requires management to make estimates and assumptions that affect the amounts reported in the consolidated financial statements and accompanying notes. Actual results could differ from those estimates.
The estimates susceptible to significant change are those used in determining the liability for future policy benefits and claims, those used in determining valuation allowances for mortgage loans on real estate, construction loans, estimate of probable loan loss reserve, and other receivables, and those used in determining the estimated future costs for pre-need sales. Although some variability is inherent in these estimates, management believes the amounts provided are adequate.
32
Liquidity and Capital Resources
The Company’s life insurance subsidiaries and cemetery and mortuary subsidiaries realize cash flow from premiums, contract payments and sales on personal services rendered for cemetery and mortuary business, from interest and dividends on invested assets, and from the proceeds from the maturity of held to maturity investments or sale of other investments. The mortgage subsidiaries realize cash flow from fees generated by originating and refinancing mortgage loans and interest earned on mortgages sold to investors. The Company considers these sources of cash flow to be adequate to fund future policyholder and cemetery and mortuary liabilities, which generally are long-term, and adequate to pay current policyholder claims, annuity payments, expenses on the issuance of new policies, the maintenance of existing policies, debt service, and to meet current operating expenses.
During the twelve months ended December 31, 2014 and 2013, the Company's operations provided cash of $31,016,000 and $36,652,000, respectively. This was due primarily to a $7,362,000 increase in 2014 and a $15,668,000 increase in 2013 in the balance of mortgage loans sold to investors.
The Company’s liability for future life, annuity and other benefits is expected to be paid out over the long-term due to the Company’s market niche of selling funeral plans. Funeral plans are small face value life insurance that will pay the costs and expenses incurred at the time of a person’s death. A person generally will keep these policies in force and will not surrender them prior to a person’s death. Because of the long-term nature of these liabilities, the Company is able to hold to maturity its bonds, real estate and mortgage loans thus reducing the risk of liquidating these long-term investments as a result of any sudden changes in market values.
The Company attempts to match the duration of invested assets with its policyholder and cemetery and mortuary liabilities. The Company may sell investments other than those held to maturity in the portfolio to help in this timing. The Company purchases short-term investments on a temporary basis to meet the expectations of short-term requirements of the Company’s products. The Company’s investment philosophy is intended to provide a rate of return, which will persist during the expected duration of policyholder and cemetery and mortuary liabilities regardless of future interest rate movements.
The Company’s investment policy is also to invest predominantly in fixed maturity securities, real estate, mortgage loans, and warehousing of mortgage loans on a short-term basis before selling the loans to investors in accordance with the requirements and laws governing the life insurance subsidiaries. Bonds owned by the insurance subsidiaries amounted to $134,406,000 as of December 31, 2014 compared to $142,854,000 as of December 31, 2013. This represents 30.9% and 37.1% of the total investments as of December 31, 2014, and 2013, respectively. Generally, all bonds owned by the life insurance subsidiaries are rated by the National Association of Insurance Commissioners. Under this rating system, there are six categories used for rating bonds. At December 31, 2014, 6.8% (or $9,192,000) and at December 31, 2013, 4.6% (or $6,621,000) of the Company’s total bond investments were invested in bonds in rating categories three through six, which are considered non-investment grade.
The Company has classified certain of its fixed income securities, including high-yield securities, in its portfolio as available for sale, with the remainder classified as held to maturity. In accordance with Company policy, however, any such securities purchased in the future will be classified as held to maturity. Notwithstanding, business conditions may develop in the future which may indicate a need for a higher level of liquidity in the investment portfolio. In that event, the Company believes it could sell short-term investment grade securities before liquidating higher yielding longer-term securities.
See Note 2 of the Notes to Consolidated Financial Statements for the schedule of the maturity of fixed maturity securities and for the schedule of principal payments for mortgage loans on real estate and construction loans held for investment.
If market conditions were to cause interest rates to change, the market value of the Company’s fixed income portfolio, which includes bonds, preferred stock, and mortgage loans, could change by the following amounts based on the respective basis point swing (the change in the market values were calculated using a modeling technique):
|
-200 bps
|
-100 bps
|
+100 bps
|
+200 bps
|
||||||||||||
|
Change in Market Value
|
$ | 22,870 | $ | 11,111 | $ | (13,270 | ) | $ | (23,869 | ) | |||||
| (in thousands) | |||||||||||||||
33
The Company is subject to risk based capital guidelines established by statutory regulators requiring minimum capital levels based on the perceived risk of assets, liabilities, disintermediation, and business risk. At December 31, 2014 and December 31, 2013, the life insurance subsidiaries exceeded the regulatory criteria.
The Company’s total capitalization of stockholders’ equity, and bank debt and notes payable were
$126,111,000
as of December 31
, 2014
, as compared to $106
,040,000
as of December 31, 2013. Stockholders’ equity as a percent of total capitalization was 77.0% and 82.8% as of December 31
, 2014
and December 31, 2013, respectively.
Bank debt and notes payable increased by
$10,731,000
for the twelve months ended December 31, 2014 as compared to December 31, 2013, thus decreasing the stockholders equity percentage.
Lapse rates measure the amount of insurance terminated during a particular period. The Company’s lapse rate for life insurance was 7.0% in 2014 as compared to a rate of 5.7% for 2013.
At December 31, 2014, $37,528,000 of the Company’s consolidated stockholders’ equity represents the statutory stockholders’ equity of the Company’s life insurance subsidiaries. The life insurance subsidiaries cannot pay a dividend to its parent company without the approval of state insurance regulatory authorities.
Forward-Looking Statements
The Private Securities Litigation Reform Act of 1995 provides a safe harbor for forward-looking statements to encourage companies to provide prospective information about their businesses without fear of litigation so long as those statements are identified as forward-looking and are accompanied by meaningful cautionary statements identifying important factors that could cause actual results to differ materially from those projected in such statements. The Company desires to take advantage of the “safe harbor” provisions of the act.
This Annual Report on Form 10-K contains forward-looking statements, together with related data and projections, about the Company’s projected financial results and its future plans and strategies. However, actual results and needs of the Company may vary materially from forward-looking statements and projections made from time to time by the Company on the basis of management’s then-current expectations. The business in which the Company is engaged involves changing and competitive markets, which may involve a high degree of risk, and there can be no assurance that forward-looking statements and projections will prove accurate.
Factors that may cause the Company’s actual results to differ materially from those contemplated or projected, forecast, estimated or budgeted in such forward looking statements include among others, the following possibilities: (i) heightened competition, including the intensification of price competition, the entry of new competitors, and the introduction of new products by new and existing competitors; (ii) adverse state and federal legislation or regulation, including decreases in rates, limitations on premium levels, increases in minimum capital and reserve requirements, benefit mandates and tax treatment of insurance products; (iii) fluctuations in interest rates causing a reduction of investment income or increase in interest expense and in the market value of interest rate sensitive investment; (iv) failure to obtain new customers, retain existing customers or reductions in policies in force by existing customers; (v) higher service, administrative, or general expense due to the need for additional advertising, marketing, administrative or management information systems expenditures; (vi) loss or retirement of key executives or employees; (vii) increases in medical costs; (viii) changes in the Company’s liquidity due to changes in asset and liability matching; (ix) restrictions on insurance underwriting based on genetic testing and other criteria; (x) adverse changes in the ratings obtained by independent rating agencies; (xi) failure to maintain adequate reinsurance; (xii) possible claims relating to sales practices for insurance products and claim denials and (xiii) adverse trends in mortality and morbidity; (xiv) deterioration of real estate markets and (xv) lawsuits in the ordinary course of business.
Off-Balance Sheet Agreements
At December 31, 2014, the Company was contingently liable under a standby letter of credit aggregating $699,671, to be used as collateral to cover any contingency related to additional risk assessments pertaining to the Company's captive insurance program. The Company does not expect any material losses to result from the issuance of the standby letter of credit because claims are not expected to exceed premiums paid. Accordingly, the estimated fair value of these instruments is zero.
At December 31, 2014, the Company was contingently liable under a standby letter of credit aggregating $1,250,000, to be used as collateral to cover any contingency related to claims filed in states where the Company is licensed. The Company does not expect any material losses to result from the issuance of the standby letter of credit. Accordingly, the estimated fair value of these instruments is zero.
34
At December 31, 2014 the Company was contingently liable under two standby letters of credit aggregating $139,220, issued as security deposits to guarantee payment of final bills for electric and gas utility services for a commercial real estate property owned by the Company in Wichita, Kansas.
SecurityNational Mortgage has entered into loan purchase agreements to originate and sell mortgage loans to two unaffiliated warehouse banks. On March 19, 2012, SecurityNational Mortgage and Wells Fargo Bank, N.A. (“Wells Fargo”) entered into a loan purchase agreement in which Wells Fargo agreed to provide a warehouse line of up to $55,000,000 to fund certain approved mortgage loans originated by SecurityNational Mortgage. On August 6, 2012, SecurityNational Mortgage and Wells Fargo agreed to an amendment to the March 19, 2012 loan purchase agreement to increase the amount of the warehouse line available to fund mortgage loans originated by SecurityNational Mortgage from $55,000,000 to $75,000,000.
On July 16, 2012, SecurityNational Mortgage and UBS Real Estate Securities Inc. (“UBS”) entered into a loan purchase agreement in which UBS agreed to provide a warehouse line of up to $30,000,000 to fund mortgage loans originated by SecurityNational Mortgage. On October 26, 2012, SecurityNational Mortgage and UBS agreed to an amendment to the July 16, 2012 loan purchase agreement to increase the amount of the warehouse line available to fund mortgage loans originated by SecurityNational Mortgage from $30,000,000 to $40,000,000.
Generally, when mortgage loans are sold to the warehouse banks, the Company is no longer obligated to pay the amounts outstanding on the mortgage loans, but is required to pay a fee in the form of interest on a portion of the mortgage loans between the date the loans are sold to warehouse banks and the settlement date with the third party investors. The terms of the loan purchase agreements are typically for one year, with interest accruing on a portion of the mortgage loans at annual rates ranging from 2.5% to 2.75% over the 30-day LIBOR rate.
As of December 31, 2014, there was $149,098,000 in mortgage loans in which settlements with third party investors were still pending.
The total of the Company unfunded residential construction loan commitments as of December 31, 2014 was $16,236,000.
The Company has entered into a Construction and Term Loan Agreement (“Agreement”) between Zions First National Bank, a national banking association, and Dry Creek Property Development, Inc., the Company’s wholly owned subsidiary. Under the terms of this Agreement the Company agrees to pay Zions First National Bank the principal sum of $27,500,000 plus interest. These funds are being used for the construction of a 282-unit multifamily development in Sandy City Utah. As of December 31, 2014, the Company has used $13,085,000 of these funds.
Contractual Obligations
The Company’s contractual obligations as of December 31, 2014 and the payments due by period are shown in the following table:
|
Less than
1 year
|
1-3 years
|
4-5 years
|
over
5 years
|
Total
|
||||||||||||||||
|
Non-cancelable operating leases
|
$ | 4,299,185 | $ | 7,635,126 | $ | 616,791 | $ | 20,536 | $ | 12,571,638 | ||||||||||
|
Notes and contracts payable
|
5,248,043 | 16,228,894 | 246,336 | 7,297,105 | 29,020,378 | |||||||||||||||
| $ | 9,547,228 | $ | 23,864,020 | $ | 863,127 | $ | 7,317,641 | $ | 41,592,016 | |||||||||||
Variable Interest Entities
In conjunction with the Company’s casualty insurance program, limited equity interests are held in a captive insurance entity. This program permits the Company to self-insure a portion of losses, to gain access to a wide array of safety-related services, to pool insurance risks and resources in order to obtain more competitive pricing for administration and reinsurance and to limit its risk of loss in any particular year. This entity meets the definition of a variable interest entity (VIE); however, under generally accepted accounting principles, “there is not a requirement to include this entity in the consolidated financial statements.” The maximum exposure to loss related to the Company’s involvement with this entity is limited to approximately $699,671, which is collateralized under a standby letter of credit issued on the insurance entity’s behalf. See Note 9, “Reinsurance, Commitments and Contingencies,” for additional discussion of commitments associated with the insurance program and Note 1, “Significant Accounting Policies”, for further information on a standby letter of credit. As of December 31, 2014, there are no other entities that met the definition of a variable interest entity.
35
The Company has no activities in derivative financial or commodity instruments other than those recorded and disclosed in the financial statements. See Note 18 of the consolidated financial statements included elsewhere in this Form 10-K. The Company’s exposure to market risks (i.e., interest rate risk, foreign currency exchange rate risk and equity price risk) through other financial instruments, including cash equivalents, accounts receivable and lines of credit, is not material.
INDEX TO CONSOLIDATED FINANCIAL STATEMENTS
|
Page No.
|
||
|
Financial Statements:
|
||
|
Report of Independent Registered Public Accounting Firm
|
37
|
|
|
Consolidated Balance Sheets, December 31, 2014 and 2013
|
39
|
|
|
Consolidated Statements of Earnings for the Years Ended December 31, 2014, 2013 and 2012
|
41
|
|
|
Consolidated Statements of Comprehensive Income for the Years Ended December 31, 2014, 2013 and 2012
|
42
|
|
|
Consolidated Statements of Stockholders’ Equity for the Years Ended December 31, 2014, 2013 and 2012
|
43
|
|
|
Consolidated Statements of Cash Flows for the Years Ended December 31, 2014, 2013 and 2012
|
44
|
|
|
Notes to Consolidated Financial Statements
|
46
|
|
36
REPORT OF INDEPENDENT REGISTERED PUBLIC ACCOUNTING FIRM
To the Board of Directors and the Shareholders
Security National Financial Corporation
We have audited the accompanying consolidated balance sheets of Security National Financial Corporation and Subsidiaries as of December 31, 2014 and 2013, and the related consolidated statements of earnings, comprehensive income, stockholders’ equity, and cash flows for the years then ended. Our audits also included the financial statement Schedule II, Schedule IV and Schedule V. The Company’s management is responsible for these consolidated financial statements and schedules. Our responsibility is to express an opinion on these consolidated financial statements and schedules based on our audits.
We conducted our audits in accordance with the standards of the Public Company Accounting Oversight Board (United States). Those standards require that we plan and perform the audits to obtain reasonable assurance about whether the financial statements are free of material misstatement. The company is not required to have, nor were we engaged to perform, an audit of its internal control over financial reporting. Our audits included consideration of internal control over financial reporting as a basis for designing audit procedures that are appropriate in the circumstances, but not for the purpose of expressing an opinion on the effectiveness of the company’s internal control over financial reporting. Accordingly, we express no such opinion. An audit also includes examining, on a test basis, evidence supporting the amounts and disclosures in the financial statements, assessing the accounting principles used and significant estimates made by management, as well as evaluating the overall financial statement presentation. We believe that our audits provide a reasonable basis for our opinion.
In our opinion, the consolidated financial statements referred to above present fairly, in all material respects, the consolidated financial position of Security National Financial Corporation and Subsidiaries as of December 31, 2014 and 2013, and the consolidated results of their operations and their cash flows for the years then ended in conformity with accounting principles generally accepted in the United States of America.

Salt Lake City, Utah
March 31, 2015
www.eidebailly.com
5 Triad Center, Ste. 750 | Salt Lake City, UT 84180-1128 | T 801.532.2200 | F 801.532.7944 | EOE
37
REPORT OF INDEPENDENT REGISTERED PUBLIC ACCOUNTING FIRM
To the Board of Directors and the Shareholders
Security National Financial Corporation
We have audited the accompanying consolidated statements of earnings, comprehensive income, stockholders’ equity, and cash flows for the year ended December 31, 2012. These consolidated financial statements are the responsibility of the Company’s management. Our responsibility is to express an opinion on these consolidated financial statements based on our audit.
We conducted our audit in accordance with the standards of the Public Company Accounting Oversight Board (United States). Those standards require that we plan and perform the audit to obtain reasonable assurance about whether the financial statements are free of material misstatement. The Company is not required to have, nor were we engaged to perform, an audit of its internal control over financial reporting. Our audits included consideration of internal control over financial reporting as a basis for designing audit procedures that are appropriate in the circumstances, but not for the purpose of expressing an opinion on the effectiveness of the Company’s internal control over financial reporting. Accordingly, we express no such opinion. An audit also includes examining, on a test basis, evidence supporting the amounts and disclosures in the financial statements, assessing the accounting principles used and significant estimates made by management, as well as evaluating the overall financial statement presentation. We believe that our audit provides a reasonable basis for our opinion.
In our opinion, the consolidated financial statements referred to above present fairly, in all material respects, the results of their operations and their cash flows for the year ended December 31, 2012 in conformity with accounting principles generally accepted in the United States of America.
Our audit was conducted for the purpose of forming an opinion on the basic financial statements taken as a whole. Supplemental Schedule II, IV and V is presented for purpose of additional analysis and is not a required part of the basic financial statements. Such information has been subjected to the auditing procedures applied in the audit of the basic financial statements and, in our opinion, is fairly stated in all material respects in relation to the basic financial statements taken as a whole.
/s/
HANSEN, BARNETT & MAXWELL, P.C.
Salt Lake City, Utah
March 30, 2013

38
AND SUBSIDIARIES
CONSOLIDATED BALANCE SHEETS
|
December 31
|
||||||||
|
Assets
|
2014
|
2013
|
||||||
|
Investments:
|
||||||||
|
Fixed maturity securities, held to maturity, at amortized cost
|
$ | 135,018,347 | $ | 143,466,494 | ||||
|
Equity securities, available for sale, at estimated fair value
|
6,752,750 | 4,498,756 | ||||||
|
Mortgage loans on real estate and construction loans held for
investment, net of allowances for loan losses of $2,003,055 and
$1,652,090 for 2014 and 2013
|
120,050,072 | 102,781,878 | ||||||
|
Real estate held for investment, net of accumulated depreciation
of $10,875,419 and $9,658,599 for 2014 and 2013
|
111,411,351 | 99,760,475 | ||||||
|
Policy and other loans, net of allowance
for doubtful accounts of $693,413 and $269,175 for 2014 and 2013
|
34,125,428 | 19,724,006 | ||||||
|
Short-term investments
|
27,059,495 | 12,135,719 | ||||||
|
Accrued investment income
|
2,483,253 | 2,485,054 | ||||||
|
Total investments
|
436,900,696 | 384,852,382 | ||||||
|
Cash and cash equivalents
|
30,855,320 | 38,203,164 | ||||||
|
Mortgage loans sold to investors
|
67,534,400 | 77,179,652 | ||||||
|
Receivables, net
|
14,544,093 | 11,652,572 | ||||||
|
Restricted assets
|
9,347,797 | 6,670,980 | ||||||
|
Cemetery perpetual care trust investments
|
2,645,423 | 2,414,883 | ||||||
|
Receivable from reinsurers
|
12,036,263 | 12,033,877 | ||||||
|
Cemetery land and improvements
|
10,848,085 | 10,631,573 | ||||||
|
Deferred policy and pre-need contract acquisition costs
|
50,307,503 | 45,737,940 | ||||||
|
Mortgage servicing rights
|
7,834,747 | 4,844,101 | ||||||
|
Property and equipment, net
|
11,307,714 | 11,523,160 | ||||||
|
Value of business acquired
|
8,547,627 | 8,680,845 | ||||||
|
Goodwill
|
2,765,570 | 677,039 | ||||||
|
Other
|
5,594,324 | 3,655,286 | ||||||
|
Total Assets
|
$ | 671,069,562 | $ | 618,757,454 | ||||
See accompanying notes to consolidated financial statements.
39
SECURITY NATIONAL FINANCIAL CORPORATION
AND SUBSIDIARIES
CONSOLIDATED BALANCE SHEETS (Continued)
|
December 31
|
||||||||
|
Liabilities and Stockholders' Equity
|
2014
|
2013
|
||||||
|
Liabilities
|
||||||||
|
Future life, annuity, and other benefits
|
$ | 476,727,465 | $ | 452,130,649 | ||||
|
Unearned premium reserve
|
4,961,937 | 5,173,785 | ||||||
|
Bank and other loans payable
|
29,020,378 | 18,289,438 | ||||||
|
Deferred pre-need cemetery and mortuary contract revenues
|
13,242,143 | 13,176,476 | ||||||
|
Cemetery perpetual care obligation
|
3,406,718 | 3,266,131 | ||||||
|
Accounts payable
|
1,789,387 | 2,850,575 | ||||||
|
Other liabilities and accrued expenses
|
24,408,666 | 20,167,363 | ||||||
|
Income taxes
|
20,421,767 | 15,951,848 | ||||||
|
Total liabilities
|
573,978,461 | 531,006,265 | ||||||
|
Commitments and Contingencies
|
- | - | ||||||
|
Stockholders’ Equity
|
||||||||
|
Common Stock:
|
||||||||
|
Class A: common stock - $2.00 par value; 20,000,000 shares authorized;
issued 12,459,240 shares in 2014 and 11,807,287 shares in 2013
|
24,918,480 | 23,614,574 | ||||||
|
Class B: non-voting common stock - $1.00 par value; 5,000,000
shares authorized; none issued or outstanding
|
- | - | ||||||
|
Class C: convertible common stock - $2.00 par value; 2,000,000 shares
authorized; issued 1,394,069 shares in 2014 and 1,330,191 shares in 2013
|
2,788,138 | 2,660,382 | ||||||
|
Additional paid-in capital
|
25,931,119 | 23,215,875 | ||||||
|
Accumulated other comprehensive income, net of taxes
|
1,438,566 | 1,218,396 | ||||||
|
Retained earnings
|
44,101,252 | 39,666,587 | ||||||
|
Treasury stock, at cost - 986,264 Class A shares and -0- Class C shares
in 2014; 1,141,021 Class A shares and -0- Class C shares in 2013
|
(2,086,454 | ) | (2,624,625 | ) | ||||
|
Total stockholders’ equity
|
97,091,101 | 87,751,189 | ||||||
|
Total Liabilities and Stockholders’ Equity
|
$ | 671,069,562 | $ | 618,757,454 | ||||
See accompanying notes to consolidated financial statements.
40
SECURITY NATIONAL FINANCIAL CORPORATION
AND SUBSIDIARIES
CONSOLIDATED STATEMENTS OF EARNINGS
|
Years Ended December 31
|
||||||||||||
|
2014
|
2013
|
2012
|
||||||||||
|
Revenues
:
|
||||||||||||
|
Insurance premiums and other considerations
|
$ | 53,008,679 | $ | 50,471,658 | $ | 48,216,327 | ||||||
|
Net investment income
|
28,303,740 | 20,354,002 | 21,915,577 | |||||||||
|
Net mortuary and cemetery sales
|
11,426,308 | 12,000,375 | 10,864,497 | |||||||||
|
Realized gains on investments and other assets
|
1,918,176 | 1,418,051 | 1,424,510 | |||||||||
|
Other than temporary impairments
|
(164,240 | ) | (336,226 | ) | (1,207,632 | ) | ||||||
|
Mortgage fee income
|
128,696,998 | 128,800,930 | 151,887,838 | |||||||||
|
Other
|
3,747,013 | 2,606,230 | 1,159,052 | |||||||||
|
Total revenues
|
226,936,674 | 215,315,020 | 234,260,169 | |||||||||
|
Benefits and expenses:
|
||||||||||||
|
Death benefits
|
27,100,278 | 26,048,325 | 22,277,037 | |||||||||
|
Surrenders and other policy benefits
|
2,689,686 | 2,486,611 | 1,969,051 | |||||||||
|
Increase in future policy benefits
|
18,060,151 | 19,594,890 | 21,435,191 | |||||||||
|
Amortization of deferred policy and pre-need acquisition
|
||||||||||||
|
costs and value of business acquired
|
6,892,978 | 5,181,837 | 5,449,429 | |||||||||
|
Selling, general and administrative expenses:
|
||||||||||||
|
Commissions
|
59,876,675 | 65,979,564 | 83,840,427 | |||||||||
|
Personnel
|
49,360,406 | 42,795,925 | 35,469,486 | |||||||||
|
Advertising
|
4,584,436 | 4,837,714 | 4,050,187 | |||||||||
|
Rent and rent related
|
6,135,876 | 5,457,988 | 4,503,285 | |||||||||
|
Depreciation on property and equipment
|
2,177,165 | 1,621,069 | 1,258,097 | |||||||||
|
Provision for loan losses and loss reserve
|
3,053,403 | 1,751,472 | 4,239,418 | |||||||||
|
Costs related to funding mortgage loans
|
6,877,069 | 6,635,290 | 6,931,045 | |||||||||
|
Other
|
22,800,066 | 18,328,005 | 16,017,975 | |||||||||
|
Interest expense
|
2,994,429 | 2,853,701 | 3,744,293 | |||||||||
|
Cost of goods and services sold – mortuaries and cemeteries
|
1,853,103 | 1,918,902 | 1,723,955 | |||||||||
|
Total benefits and expenses
|
214,455,721 | 205,491,293 | 212,908,876 | |||||||||
|
Earnings before income taxes
|
12,480,953 | 9,823,727 | 21,351,293 | |||||||||
|
Income tax expense
|
(4,726,305 | ) | (2,237,806 | ) | (4,638,775 | ) | ||||||
|
Net earnings
|
$ | 7,754,648 | $ | 7,585,921 | $ | 16,712,518 | ||||||
|
Net earnings per Class A equivalent common share (1)
|
$ | 0.62 | $ | 0.61 | $ | 1.46 | ||||||
|
Net earnings per Class A equivalent common share -
assuming dilution(1)
|
$ | 0.60 | $ | 0.58 | $ | 1.39 | ||||||
|
Weighted average Class A equivalent common shares
outstanding (1)
|
12,518,743 | 12,366,029 | 11,427,568 | |||||||||
|
Weighted average Class A equivalent common shares
outstanding-assuming dilution (1)
|
12,928,009 | 12,981,576 | 12,026,849 | |||||||||
(1) Earnings per share amounts have been adjusted retroactively for the effect of annual stock dividends. The weighted-average shares outstanding includes the weighted-average Class A common shares and the weighted-average Class C common shares determined on an equivalent Class A common stock basis. Class C common shares have been adjusted retroactively for the effect of the 1-for-10 reverse stock split that was approved by the stockholders in 2014. Net earnings per common share represent net earnings per equivalent Class A common share. Net earnings per Class C common share is $5.82, $5.69 and $13.90 per share for 2014, 2013 and 2012, respectively, and $4.81, $5.54 and $13.67 per share-assuming dilution for 2014, 2013 and 2012, respectively.
See accompanying notes to consolidated financial statements.
41
SECURITY NATIONAL FINANCIAL CORPORATION
AND SUBSIDIARIES
CONSOLIDATED STATEMENTS OF COMPREHENSIVE INCOME
|
Years Ended December 31
|
||||||||||||
|
2014
|
2013
|
2012
|
||||||||||
|
Net earnings
|
$ | 7,754,648 | $ | 7,585,921 | $ | 16,712,518 | ||||||
|
Other comprehensive income:
|
||||||||||||
|
Changes in:
|
||||||||||||
|
Net unrealized gains (losses) on derivative instruments
|
286,018 | (1,020,754 | ) | 852,168 | ||||||||
|
Net unrealized gains (losses) on available for sale securities
|
(65,848 | ) | 304,791 | 427,748 | ||||||||
|
Other comprehensive gain (loss)
|
220,170 | (715,963 | ) | 1,279,916 | ||||||||
|
Comprehensive income
|
$ | 7,974,818 | $ | 6,869,958 | $ | 17,992,434 | ||||||
See accompanying notes to consolidated financial statements.
42
SECURITY NATIONAL FINANCIAL CORPORATION
AND SUBSIDIARIES
CONSOLIDATED STATEMENTS OF STOCKHOLDERS’ EQUITY
For the Years Ended December 31, 2014, 2013 and 2012
|
Class A
Common Stock
|
Class C
Common Stock
|
Additional
Paid-in
Capital
|
Accumulated
Other
Comprehensive
Income (Loss)
|
Retained
Earnings
|
Treasury
Stock
|
Total
|
||||||||||||||||||||||
|
Balance at January 1, 2012
|
$ | 19,277,596 | $ | 2,027,195 | $ | 19,487,565 | $ | 654,443 | $ | 22,546,623 | $ | (2,762,835 | ) | $ | 61,230,587 | |||||||||||||
| . | ||||||||||||||||||||||||||||
|
Net earnings
|
- | - | - | - | 16,712,518 | - | 16,712,518 | |||||||||||||||||||||
|
Other comprehensive income
|
- | - | - | 1,279,916 | - | - | 1,279,916 | |||||||||||||||||||||
|
Stock based compensation
|
- | - | 251,031 | - | - | - | 251,031 | |||||||||||||||||||||
|
Exercise of stock options
|
1,371,506 | 63,782 | (1,416,982 | ) | - | - | - | 18,306 | ||||||||||||||||||||
|
Sale of treasury stock
|
- | - | (62,650 | ) | - | - | 382,401 | 319,751 | ||||||||||||||||||||
|
Stock dividends
|
1,037,404 | 104,488 | 3,003,177 | - | (4,145,069 | ) | - | - | ||||||||||||||||||||
|
Conversion Class C to Class A
|
646 | (645 | ) | (1 | ) | - | - | - | - | |||||||||||||||||||
|
Balance at December 31, 2012
|
21,687,152 | 2,194,820 | 21,262,140 | 1,934,359 | 35,114,072 | (2,380,434 | ) | 79,812,109 | ||||||||||||||||||||
|
Net earnings
|
- | - | - | - | 7,585,921 | - | 7,585,921 | |||||||||||||||||||||
|
Other comprehensive loss
|
- | - | - | (715,963 | ) | - | - | (715,963 | ) | |||||||||||||||||||
|
Stock based compensation
|
- | - | 88,369 | - | - | - | 88,369 | |||||||||||||||||||||
|
Exercise of stock options
|
719,572 | 422,422 | (345,845 | ) | - | - | (543,334 | ) | 252,815 | |||||||||||||||||||
|
Sale of treasury stock
|
- | - | 428,794 | - | - | 299,143 | 727,937 | |||||||||||||||||||||
|
Stock dividends
|
1,124,304 | 126,685 | 1,782,418 | - | (3,033,406 | ) | - | 1 | ||||||||||||||||||||
|
Conversion Class C to Class A
|
83,546 | (83,545 | ) | (1 | ) | - | - | - | - | |||||||||||||||||||
|
Balance at December 31, 2013
|
23,614,574 | 2,660,382 | 23,215,875 | 1,218,396 | 39,666,587 | (2,624,625 | ) | 87,751,189 | ||||||||||||||||||||
|
Net earnings
|
- | - | - | - | 7,754,648 | - | 7,754,648 | |||||||||||||||||||||
|
Other comprehensive income
|
- | - | - | 220,170 | - | - | 220,170 | |||||||||||||||||||||
|
Stock based compensation
|
- | - | 391,220 | - | - | 391,220 | ||||||||||||||||||||||
|
Reverse stock split true up
|
- | 30 | - | - | (30 | ) | - | - | ||||||||||||||||||||
|
Exercise of stock options
|
108,824 | - | (34,800 | ) | - | - | - | 74,024 | ||||||||||||||||||||
|
Sale of treasury stock
|
- | - | 361,679 | - | - | 538,171 | 899,850 | |||||||||||||||||||||
|
Stock dividends
|
1,190,040 | 132,767 | 1,997,147 | - | (3,319,954 | ) | - | - | ||||||||||||||||||||
|
Conversion Class C to Class A
|
5,042 | (5,041 | ) | (2 | ) | - | 1 | - | - | |||||||||||||||||||
|
Balance at December 31, 2014
|
$ | 24,918,480 | $ | 2,788,138 | $ | 25,931,119 | $ | 1,438,566 | $ | 44,101,252 | $ | (2,086,454 | ) | $ | 97,091,101 | |||||||||||||
See accompanying notes to consolidated financial statements.
43
SECURITY NATIONAL FINANCIAL CORPORATION
AND SUBSIDIARIES
CONSOLIDATED STATEMENTS OF CASH FLOWS
|
Years Ended December 31
|
||||||||||||
|
2014
|
2013
|
2012
|
||||||||||
|
Cash flows from operating activities:
|
||||||||||||
|
Net earnings
|
$ | 7,754,648 | $ | 7,585,921 | $ | 16,712,518 | ||||||
|
Adjustments to reconcile net earnings to net cash provided
by operating activities:
|
||||||||||||
|
Realized gains on investments and other assets
|
(1,918,176 | ) | (1,418,051 | ) | (1,424,510 | ) | ||||||
|
Other than temporary impairments
|
164,240 | 336,226 | 1,207,632 | |||||||||
|
Depreciation and amortization
|
4,389,472 | 4,160,760 | 2,877,743 | |||||||||
|
Provision for losses on real estate accounts and
loans receivable
|
743,386 | (584,873 | ) | (963,169 | ) | |||||||
|
Amortization of premiums and discounts
|
238,687 | 103,032 | (762,301 | ) | ||||||||
|
Provision for deferred and other income taxes
|
3,072,642 | 416,269 | 953,394 | |||||||||
|
Policy and pre-need acquisition costs deferred
|
(10,159,895 | ) | (9,666,040 | ) | (7,885,882 | ) | ||||||
|
Policy and pre-need acquisition costs amortized
|
5,590,332 | 3,841,565 | 4,234,271 | |||||||||
|
Value of business acquired amortized
|
1,302,646 | 1,340,272 | 1,215,158 | |||||||||
|
Servicing asset at amortized cost, additions
|
(3,741,381 | ) | (2,494,254 | ) | (2,797,470 | ) | ||||||
|
Amortization of mortgage servicing rights
|
750,735 | 447,623 | - | |||||||||
|
Stock based compensation expense
|
391,220 | 88,369 | 251,031 | |||||||||
|
Benefit plans funded with treasury stock
|
899,850 | 727,937 | 319,751 | |||||||||
|
Change in assets and liabilities:
|
||||||||||||
|
Land and improvements held for sale
|
(216,512 | ) | (36,345 | ) | 26,054 | |||||||
|
Future life and other benefits
|
14,084,894 | 19,182,046 | 20,508,725 | |||||||||
|
Receivables for mortgage loans sold
|
7,362,353 | 15,668,188 | (18,807,956 | ) | ||||||||
|
Other operating assets and liabilities
|
306,668 | (3,046,791 | ) | 6,751,217 | ||||||||
|
Net cash provided by operating activities
|
31,015,809 | 36,651,854 | 22,416,206 | |||||||||
|
Cash flows from investing activities:
|
||||||||||||
|
Securities held to maturity:
|
||||||||||||
|
Purchase - fixed maturity securities
|
(3,449,187 | ) | (22,849,622 | ) | (11,365,269 | ) | ||||||
|
Calls and maturities - fixed maturity securities
|
11,850,864 | 8,518,848 | 9,601,320 | |||||||||
|
Securities available for sale:
|
||||||||||||
|
Purchase - equity securities
|
(5,996,993 | ) | (2,807,367 | ) | (1,685,983 | ) | ||||||
|
Sales - equity securities
|
3,851,664 | 4,528,862 | 3,028,509 | |||||||||
|
Purchases of short-term investments
|
(18,587,022 | ) | (19,827,619 | ) | (51,823,941 | ) | ||||||
|
Sales of short-term investments
|
3,663,246 | 48,617,290 | 17,830,574 | |||||||||
|
Sales (purchases) of restricted assets
|
(2,628,764 | ) | 2,777,715 | (4,436,547 | ) | |||||||
|
Change in assets for perpetual care trusts
|
(230,921 | ) | (255,204 | ) | (265,435 | ) | ||||||
|
Amount received for perpetual care trusts
|
140,587 | 113,130 | 169,924 | |||||||||
|
Mortgage, policy, and other loans made
|
(286,974,069 | ) | (160,737,841 | ) | (117,135,836 | ) | ||||||
|
Payments received for mortgage, policy, and other loans
|
267,763,998 | 133,260,148 | 131,565,100 | |||||||||
|
Purchases of property and equipment
|
(1,520,443 | ) | (3,570,334 | ) | (3,022,393 | ) | ||||||
|
Disposal of property and equipment
|
894,805 | 33,900 | 30,524 | |||||||||
|
Purchases of real estate held for investment
|
(19,317,567 | ) | (26,749,586 | ) | (143,278 | ) | ||||||
|
Sale of real estate held for investment
|
7,269,475 | 3,352,446 | 6,886,821 | |||||||||
|
Cash received from reinsurance
|
13,553,864 | 2,466,175 | 34,485,224 | |||||||||
|
Cash paid for purchase of subsidiaries, net of cash acquired
|
(15,011,193 | ) | - | (180,591 | ) | |||||||
|
Net cash provided by (used in) investing activities
|
(44,727,656 | ) | (33,129,059 | ) | 13,538,723 | |||||||
See accompanying notes to consolidated financial statements
44
SECURITY NATIONAL FINANCIAL CORPORATION
AND SUBSIDIARIES
CONSOLIDATED STATEMENTS OF CASH FLOWS (Continued)
|
Years Ended December 31
|
||||||||||||
|
2014
|
2013
|
2012
|
||||||||||
|
Cash flows from financing activities:
|
||||||||||||
|
Annuity contract receipts
|
$ | 10,051,662 | $ | 9,385,168 | $ | 8,939,017 | ||||||
|
Annuity contract withdrawals
|
(14,519,563 | ) | (14,866,251 | ) | (13,915,777 | ) | ||||||
|
Proceeds from stock options exercised
|
74,024 | 252,815 | 18,306 | |||||||||
|
Repayment of bank loans and notes and contracts payable
|
(2,357,468 | ) | (2,292,037 | ) | (1,534,612 | ) | ||||||
|
Proceeds from bank borrowings
|
13,115,348 | 13,314,594 | 241,875 | |||||||||
|
Change in line of credit borrowings
|
- | (4,608,204 | ) | (11,791,796 | ) | |||||||
|
Net cash provided by (used in) financing activities
|
6,364,003 | 1,186,085 | (18,042,987 | ) | ||||||||
|
Net change in cash and cash equivalents
|
(7,347,844 | ) | 4,708,880 | 17,911,942 | ||||||||
|
Cash and cash equivalents at beginning of year
|
38,203,164 | 33,494,284 | 15,582,342 | |||||||||
|
Cash and cash equivalents at end of year
|
$ | 30,855,320 | $ | 38,203,164 | $ | 33,494,284 | ||||||
|
Non Cash Investing and Financing Activities
|
||||||||||||
|
Mortgage loans foreclosed into real estate
|
$ | 981,820 | $ | 3,930,297 | $ | 17,019,870 | ||||||
See accompanying notes to consolidated financial statements.
45
SECURITY NATIONAL FINANCIAL CORPORATION
AND SUBSIDIARIES
Notes to Consolidated Financial Statements
Years Ended December 31, 2014, 2013 and 2012
1)
Significant Accounting Policies
General Overview of Business
Security National Financial Corporation and its wholly owned subsidiaries (the “Company”) operate in three main business segments: life insurance, cemetery and mortuary, and mortgage loans. The life insurance segment is engaged in the business of selling and servicing selected lines of life insurance, annuity products and accident and health insurance marketed primarily in the intermountain west, California and eleven southern states. The cemetery and mortuary segment of the Company consists of seven mortuaries and five cemeteries in Utah and one cemetery in California. The mortgage loan segment is an approved government and conventional lender that originates and underwrites residential and commercial loans for new construction, existing homes and real estate projects primarily in California, Florida, Nevada, Texas, and Utah.
Basis of Presentation
The accompanying consolidated financial statements have been prepared in accordance with accounting principles generally accepted in the United States of America. The presentation of certain amounts in prior years has been reclassified to conform to the 2014 presentation.
Principles of Consolidation
These consolidated financial statements include the financial statements of the Company and its majority owned subsidiaries. All intercompany transactions and accounts have been eliminated in consolidation.
Investments
The Company’s management determines the appropriate classifications of investments in fixed maturity securities and equity securities at the acquisition date and re-evaluates the classifications at each balance sheet date.
Fixed maturity securities held to maturity
are carried at cost, adjusted for amortization of premium or accretion of discount. Although the Company has the ability and intent to hold these investments to maturity, infrequent and unusual conditions could occur under which it would sell certain of these securities. Those conditions include unforeseen changes in asset quality, significant changes in tax laws, and changes in regulatory capital requirements or permissible investments.
Fixed maturity and equity securities available for sale
are carried at estimated fair value. Changes in fair values net of income taxes are reported as unrealized appreciation or depreciation and recorded as an adjustment directly to stockholders’ equity and, accordingly, have no effect on net income.
Mortgage loans on real estate, and construction loans
are carried at their unpaid principal balances adjusted for charge-offs, the related allowance for loan losses, and net deferred fees or costs on originated loans. The Company defers related material loan origination fees, net of related direct loan origination costs, and amortizes the net fees over the term of the loans.
Mortgage loans are collateral dependent and require an appraisal at the time of underwriting and funding. Generally the Company will fund a loan not to exceed 80% of the loan’s collateral fair market value. Amounts over 80% will require mortgage insurance by an approved third party insurer. Once a loan is deemed to be impaired the Company will review the market value of the collateral and provide an allowance for any impairment.
Mortgage loans sold to investors
are carried at the amount due from third party investors, which is the estimated fair value at the balance sheet date since these amounts are generally collected within a short period of time.
Real estate held for investment
is carried at cost, less accumulated depreciation provided on a straight-line basis over the estimated useful lives of the properties, or is adjusted to a new basis for impairment in value, if any. Included are foreclosed properties which the Company intends to hold for investment purposes. These properties are recorded at the lower of cost or market value upon foreclosure.
46
SECURITY NATIONAL FINANCIAL CORPORATION
AND SUBSIDIARIES
Notes to Consolidated Financial Statements
Years Ended December 31, 2014, 2013 and 2012
1)
Significant Accounting Policies
(Continued)
Policy and other loans
are carried at the aggregate unpaid balances, less allowances for possible losses.
Short-term investments
are carried at cost and consist of certificates of deposit and commercial paper with maturities of up to one year.
Restricted assets
are assets held in a trust account for future mortuary services and merchandise and consist of cash; participations in mortgage loans with Security National Life; mutual funds carried at cost; equity securities carried at fair market value; a surplus note with Security National Life. Restricted cash also represents escrows held for borrowers and investors under servicing and appraisal agreements relating to mortgage loans, funds held by warehouse banks in accordance with loan purchase agreements and funds held in escrow for the construction of a 282-unit multifamily development in Sandy City, Utah.
Cemetery and mortuary perpetual care trust
business segment contains six wholly owned cemeteries. Of the six cemeteries owned by the Company, four cemeteries are endowment care properties. Under endowment care arrangements a portion of the price for each lot sold is withheld and invested in a portfolio of investments similar to those described in the prior paragraph. The earnings stream from the investments is designed to fund future maintenance and upkeep of the cemetery.
Realized gains and losses on investments
arise when investments are sold (as determined on a specific identification basis) or are other-than-temporarily impaired. If in management’s judgment a decline in the value of an investment below cost is other-than-temporary, the cost of the investment is written down to fair value with a corresponding charge to earnings. Factors considered in judging whether an impairment is other-than-temporary include: the financial condition, business prospects and credit worthiness of the issuer, the length of time that fair value has been less than cost, the relative amount of the decline, and the Company’s ability and intent to hold the investment until the fair value recovers, which is not assured.
Cash and Cash Equivalents
For purposes of the statement of cash flows, the Company considers all highly liquid debt instruments purchased with an original maturity of three months or less to be cash equivalents.
Cemetery Land and Improvements
The development of a cemetery involves not only the initial acquisition of raw land but the installation of roads, water lines, landscaping and other costs to establish a marketable cemetery lot. The costs of developing the cemetery are shown as an asset on the balance sheet. The amount on the balance sheet is reduced by the total cost assigned to the development of a particular lot when the criterion for recognizing a sale of that lot is met.
Property and Equipment
Property and equipment are recorded at cost. Depreciation is calculated principally on the straight-line method over the estimated useful lives of the assets which range from three to forty years. Leasehold improvements are amortized over the lesser of the useful life or remaining lease terms.
Recognition of Insurance Premiums and Other Considerations
Premiums and other consideration for traditional life insurance products (which include those products with fixed and guaranteed premiums and benefits and consist principally of whole life insurance policies, limited payment life insurance policies, and certain annuities with life contingencies) are recognized as revenues when due from policyholders. Premiums and other consideration for interest-sensitive insurance policies (which include universal life policies, interest-sensitive life policies, deferred annuities, and annuities without life contingencies) are recognized when earned and consist of amounts assessed against policyholder account balances during the period for policy administration charges and surrender charges.
47
SECURITY NATIONAL FINANCIAL CORPORATION
AND SUBSIDIARIES
Notes to Consolidated Financial Statements
Years Ended December 31, 2014, 2013 and 2012
1)
Significant Accounting Policies
(Continued)
Deferred Policy Acquisition Costs and Value of Business Acquired
Commissions and other costs, net of commission and expense allowances for reinsurance ceded, that vary with and are primarily related to the production of new insurance business have been deferred. Deferred policy acquisition costs (“DAC”) for traditional life insurance are amortized over the premium paying period of the related policies using assumptions consistent with those used in computing policy benefit reserves. For interest-sensitive insurance products, deferred policy acquisition costs are amortized generally in proportion to the present value of expected gross profits from surrender charges, investment, mortality and expense margins. This amortization is adjusted when estimates of current or future gross profits to be realized from a group of products are reevaluated. Deferred acquisition costs are written off when policies lapse or are surrendered.
The Company follows accounting principles generally accepted in the United States of America when accounting for DAC on internal replacements of insurance and investment contracts. An internal replacement is a modification in product benefits, features, rights or coverage that occurs by the exchange of a contract for a new contract, or by amendment, endorsement, or rider to contract, or by the election of a feature or coverage within a contract. Modifications that result in a replacement contract that is substantially changed from the replaced contract are accounted for as an extinguishment of the replaced contract. Unamortized DAC, unearned revenue liabilities and deferred sales inducements from the replaced contract are written-off. Modifications that result in a contract that is substantially unchanged from the replaced contract are accounted for as a continuation of the replaced contract.
Value of business acquired is the present value of estimated future profits of the acquired business and is amortized similar to deferred policy acquisition costs.
Mortgage Servicing Rights
Mortgage Service Rights (MSR) arise from contractual agreements between the Company and third-party investors (or their agents) when mortgage loans are sold. Under these contracts, the Company is obligated to retain and provide loan servicing functions on loans sold, in exchange for fees and other remuneration. The servicing functions typically performed include, among other responsibilities, collecting and remitting loan payments; responding to borrower inquiries; accounting for principal and interest, holding custodial (impound) funds for payment of property taxes and insurance premiums; counseling delinquent mortgagors; and supervising the acquisition of REO and property dispositions.
The total residential mortgage loans serviced for others consist primarily of agency conforming fixed-rate mortgage loans. The value of MSRs is derived from the net cash flows associated with the servicing contracts. The Company receives a servicing fee of generally about 0.250% annually on the remaining outstanding principal balances of the loans. Based on the result of the cash flow analysis, an asset or liability is recorded for mortgage servicing rights. The servicing fees are collected from the monthly payments made by the mortgagors. The Company generally receives other remuneration including rights to various mortgagor-contracted fees such as late charges, and collateral reconveyance charges and the Company is generally entitled to retain the interest earned on funds held pending remittance of mortgagor principal, interest, tax and insurance payments.
The Company’s subsequent accounting for MSRs is based on the class of MSRs. The Company has identified two classes of MSRs: MSRs backed by mortgage loans with initial term of 30 years and MSRs backed by mortgage loans with initial term of 15 years. The Company distinguishes between these classes of MSRs due to their differing sensitivities to change in value as the result of changes in market. After being initially recorded at fair value, MSRs backed by mortgage loans are accounted for using the amortization method. MSR amortization is determined by amortizing the balance straight-line over an estimated nine year life.
The Company periodically assesses MSRs for impairment. Impairment occurs when the current fair value of the MSR falls below the asset’s carrying value (carrying value is the amortized cost reduced by any related valuation allowance). If MSRs are impaired, the impairment is recognized in current-period earnings and the carrying value of the MSRs is adjusted through a valuation allowance.
48
SECURITY NATIONAL FINANCIAL CORPORATION
AND SUBSIDIARIES
Notes to Consolidated Financial Statements
Years Ended December 31, 2014, 2013 and 2012
1)
Significant Accounting Policies
(Continued)
Management periodically reviews the various loan strata to determine whether the value of the MSRs in a given stratum is impaired and likely to recover. When management deems recovery of the value to be unlikely in the foreseeable future, a write-down of the cost of the MSRs for that stratum to its estimated recoverable value is charged to the valuation allowance.
Derivatives
The Company is exposed to price risk due to the potential impact of changes in interest rates on the values of mortgage loan commitments from the time a derivative loan commitment is made to an applicant to the time the loan that would result from the exercise of that loan commitment is funded. Managing price risk is complicated by the fact that the ultimate percentage of derivative loan commitments that will be exercised (i.e., the number of loan commitments that will be funded) fluctuates. The probability that a loan will not be funded within the terms of the commitment is driven by a number of factors, particularly the change, if any, in mortgage rates following the inception of the interest rate lock. However, many borrowers continue to exercise derivative loan commitments even when interest rates have fallen.
In general, the probability of funding increases if mortgage rates rise and decreases if mortgage rates fall. This is due primarily to the relative attractiveness of current mortgage rates compared to the applicant’s committed rate. The probability that a loan will not be funded within the terms of the mortgage loan commitment also is influenced by the source of the applications (retail, broker or correspondent channels), proximity to rate lock expiration, purpose for the loan (purchase or refinance) product type and the application approval status. The Company has developed fallout estimates using historical data that take into account all of the variables, as well as renegotiations of rate and point commitments that tend to occur when mortgage rates fall. These fallout estimates are used to estimate the number of loans that the Company expects to be funded within the terms of the mortgage loan commitments and are updated periodically to reflect the most current data.
The Company estimates the fair value of a mortgage loan commitment based on the change in estimated fair value of the underlying mortgage loan and the probability that the mortgage loan will fund within the terms of the commitment. The change in fair value of the underlying mortgage loan is measured from the date the mortgage loan commitment is issued. Therefore, at the time of issuance, the estimated fair value is zero. Following issuance, the value of a mortgage loan commitment can be either positive or negative depending upon the change in value of the underlying mortgage loans. Fallout rates derived from the Company’s recent historical empirical data are used to estimate the quantity of mortgage loans that will fund within the terms of the commitments.
The Company utilizes forward loan sales commitments to economically hedge the price risk associated with its outstanding mortgage loan commitments. A forward loan sales commitment protects the Company from losses on sales of the loans arising from exercise of the loan commitments by securing the ultimate sales price and delivery date of the loans. Management expects these derivatives will experience changes in fair value opposite to changes in fair value of the derivative loan commitments, thereby reducing earnings volatility related to the recognition in earnings of changes in the values of the commitments.
Allowance for Doubtful Accounts and Loan Losses and Impaired Loans
The Company records an allowance and recognizes an expense for potential losses from mortgage loans, other loans and receivables in accordance with generally accepted accounting principles.
Receivables are the result of cemetery and mortuary operations, mortgage loan operations and life insurance operations. The allowance is based upon the Company’s historical experience for collectively evaluated impairment. Other allowances are based upon receivables individually evaluated for impairment. Collectability of the cemetery and mortuary receivables is significantly influenced by current economic conditions. The critical issues that impact recovery of mortgage loan operations are interest rate risk, loan underwriting, new regulations and the overall economy.
49
SECURITY NATIONAL FINANCIAL CORPORATION
AND SUBSIDIARIES
Notes to Consolidated Financial Statements
Years Ended December 31, 2014, 2013 and 2012
1)
Significant Accounting Policies
(Continued)
The Company provides allowances for losses on its mortgage loans held for investment through an allowance for loan losses. The allowance is comprised of two components. The first component is an allowance for collectively evaluated impairment that is based upon the Company’s historical experience in collecting similar receivables. The second component is based upon individual evaluation of loans that are determined to be impaired. Upon determining impairment the Company establishes an individual impairment allowance based upon an assessment of the fair value of the underlying collateral. See the schedules in Note 2 for additional information. In addition, when a mortgage loan is past due more than 90 days, the Company does not accrue any interest income. When a loan becomes delinquent, the Company proceeds to foreclose on the real estate and all expenses for foreclosure are expensed as incurred. Once foreclosed, an adjustment for the lower of cost or fair value is made, if necessary, and the amount is classified as other real estate owned held for investment or sale. The Company will rent the properties until it is deemed desirable to sell them.
The allowance for losses on mortgage loans held for investment could change based on changes in the value of the underlying collateral, the performance status of the loans, or the Company’s actual collection experience. The actual losses could change, in the near term, from the established allowance, based upon the occurrence or non-occurrence of these events.
Loan Loss Reserve
The mortgage loan loss reserve is an estimate of probable losses at the balance sheet date that the Company will realize in the future on mortgage loans sold to third party investors.
The loan loss reserve analysis involves mortgage loans that have been sold to third party investors where the Company has received a demand from the investor. There are generally three types of demands: make whole, repurchase, or indemnification. These types of demands are more particularly described as follows:
Make whole demand
– A make whole demand occurs when an investor forecloses on a property and then sells the property. The make whole amount is calculated as the difference between the original unpaid principal balance, accrued interest and fees, less the sale proceeds.
Repurchase demand
– A repurchase demand usually occurs when there is a significant payment default, error in underwriting or detected loan fraud.
Indemnification demand
– On certain loans the Company has negotiated a set fee that is to be paid in lieu of repurchase. The fee varies by investor and by loan product type.
Additional information related to the Loan Loss Reserve is included in Note 2.
Future Life, Annuity and Other Policy Benefits
Future policy benefit reserves for traditional life insurance are computed using a net level method, including assumptions as to investment yields, mortality, morbidity, withdrawals, and other assumptions based on the life insurance subsidiaries’ experience, modified as necessary to give effect to anticipated trends and to include provisions for possible unfavorable deviations. Such liabilities are, for some plans, graded to equal statutory values or cash values at or prior to maturity. The range of assumed interest rates for all traditional life insurance policy reserves was 4.5% to 10%. Benefit reserves for traditional limited-payment life insurance policies include the deferred portion of the premiums received during the premium-paying period. Deferred premiums are recognized as income over the life of the policies. Policy benefit claims are charged to expense in the period the claims are incurred. Increases in future policy benefits are charged to expense.
Future policy benefit reserves for interest-sensitive insurance products are computed under a retrospective deposit method and represent policy account balances before applicable surrender charges. Policy benefits and claims that are charged to expense include benefit claims incurred in the period in excess of related policy account balances. Interest crediting rates for interest-sensitive insurance products ranged from 3% to 6.5%.
50
SECURITY NATIONAL FINANCIAL CORPORATION
AND SUBSIDIARIES
Notes to Consolidated Financial Statements
Years Ended December 31, 2014, 2013 and 2012
1)
Significant Accounting Policies
(Continued)
Participating Insurance
Participating business constituted 2%, 2%, and 2% of insurance in force for 2014, 2013 and 2012, respectively. The provision for policyholders’ dividends included in policyholder obligations is based on dividend scales anticipated by management. Amounts to be paid are determined by the Board of Directors.
Reinsurance
The Company follows the procedure of reinsuring risks in excess of $100,000 to provide for greater diversification of business to allow management to control exposure to potential losses arising from large risks, and provide additional capacity for growth. The Company remains liable for amounts ceded in the event the reinsurers are unable to meet their obligations.
The Company entered into coinsurance agreements with unaffiliated insurance companies under which the Company assumed 100% of the risk for certain life insurance policies and certain other policy-related liabilities of the insurance company.
Reinsurance premiums, commissions, expense reimbursements, and reserves related to reinsured business are accounted for on a basis consistent with those used in accounting for the original policies issued and the terms of the reinsurance contracts. Expense allowances received in connection with reinsurance ceded are accounted for as a reduction of the related policy acquisition costs and are deferred and amortized accordingly.
Pre-need Sales and Costs
Pre-need contract sales of funeral services and caskets - revenue and costs associated with the sales of pre-need funeral services and caskets are deferred until the services are performed or the caskets are delivered.
Sales of cemetery interment rights (cemetery burial property) - revenue and costs associated with the sale of cemetery interment rights are recognized in accordance with the retail land sales provisions based on accounting principles generally accepted in the United States of America. Under accounting principles generally accepted in the United States of America, recognition of revenue and associated costs from constructed cemetery property must be deferred until a minimum percentage of the sales price has been collected.
Pre-need contract sales of cemetery merchandise (primarily markers and vaults) - revenue and costs associated with the sale of pre-need cemetery merchandise is deferred until the merchandise is delivered. Pre-need contract sales of cemetery services (primarily merchandise delivery, installation fees and burial opening and closing fees) - revenue and costs associated with the sales of pre-need cemetery services are deferred until the services are performed.
Prearranged funeral and pre-need cemetery customer acquisition costs - costs incurred related to obtaining new pre-need contract cemetery and prearranged funeral services are accounted for under the guidance of the provisions based on accounting principles generally accepted in the United States of America. Obtaining costs, which include only costs that vary with and are primarily related to the acquisition of new pre-need cemetery and prearranged funeral services, are deferred until the merchandise is delivered or services are performed.
Revenues and costs for at-need sales are recorded when a valid contract exists, the services are performed, collection is reasonably assured and there are no significant obligations remaining.
The Company, through its cemetery and mortuary operations, provides guaranteed funeral arrangements wherein a prospective customer can receive future goods and services at guaranteed prices. To accomplish this, the Company, through its life insurance operations, sells to the customer an increasing benefit life insurance policy that is assigned to the mortuaries. If, at the time of need, the policyholder/potential mortuary customer utilizes one of the Company’s facilities, the guaranteed funeral arrangement contract that has been assigned will provide the funeral goods and services at the contracted price. The increasing life insurance policy will cover the difference between the original contract prices and current prices. Risks may arise if the difference cannot be fully met by the life insurance policy. However, management believes that given current inflation rates and related price increases of goods and services, the risk of exposure is minimal.
51
SECURITY NATIONAL FINANCIAL CORPORATION
AND SUBSIDIARIES
Notes to Consolidated Financial Statements
Years Ended December 31, 2014, 2013 and 2012
1)
Significant Accounting Policies
(Continued)
Mortgage Fee Income
Mortgage fee income consists of origination fees, processing fees and certain other income related to the origination and sale of mortgage loans. For mortgage loans sold to third party investors, mortgage fee income and related expenses are recognized pursuant to generally accepted accounting principles at the time the sales of mortgage loans comply with the sales criteria for the transfer of financial assets, which are: (i) the transferred assets have been isolated from the Company and its creditors, (ii) the transferee has the right to pledge or exchange the mortgage, and (iii) the Company does not maintain effective control over the transferred mortgage. The Company must determine that all three criteria are met at the time a loan is funded. All rights and title to the mortgage loans are assigned to unrelated financial institution investors, including investor commitments for the loans, prior to warehouse banks purchasing the loans under the purchase commitments.
The Company, through its mortgage subsidiaries, sells all mortgage loans to third party investors without recourse. However, it may be required to repurchase a loan or pay a fee instead of repurchase under certain events, which include the following:
|
·
|
Failure to deliver original documents specified by the investor,
|
|
·
|
The existence of misrepresentation or fraud in the origination of the loan,
|
|
·
|
The loan becomes delinquent due to nonpayment during the first several months after it is sold,
|
|
·
|
Early pay-off of a loan, as defined by the agreements,
|
|
·
|
Excessive time to settle a loan,
|
|
·
|
Investor declines purchase, and
|
|
·
|
Discontinued product and expired commitment.
|
Loan purchase commitments generally specify a date 30 to 45 days after delivery upon which the underlying loans should be settled. Depending on market conditions, these commitment settlement dates can be extended at a cost to the Company. Generally, a ten day extension will cost .125% (12.5 basis points) of the loan amount. The Company’s historical data shows that 99% of all loans originated by its mortgage subsidiaries are generally settled by the investors as agreed within 16 days after delivery. There are situations, however, when the Company determines that it is unable to enforce the settlement of loans rejected by the third-party investors and that it is in its best interest to repurchase those loans from the warehouse banks.
It is the Company's policy to cure any documentation problems regarding such loans at a minimal cost for up to a six-month time period and to pursue efforts to enforce loan purchase commitments from third-party investors concerning the loans. The Company believes that six months allows adequate time to remedy any documentation issues, to enforce purchase commitments, and to exhaust other alternatives. Remedial methods include the following:
|
·
|
Research reasons for rejection,
|
|
·
|
Provide additional documents,
|
|
·
|
Request investor exceptions,
|
|
·
|
Appeal rejection decision to purchase committee, and
|
|
·
|
Commit to secondary investors.
|
Once purchase commitments have expired and other alternatives to remedy are exhausted, which could be earlier than the six month time period, the loans are repurchased and transferred to the long term investment portfolio at the lower of cost or fair value and previously recorded sales revenue is reversed. Any loan that later becomes delinquent is evaluated by the Company at that time and any impairment is adjusted accordingly.
52
SECURITY NATIONAL FINANCIAL CORPORATION
AND SUBSIDIARIES
Notes to Consolidated Financial Statements
Years Ended December 31, 2014, 2013 and 2012
1)
Significant Accounting Policies
(Continued)
Determining Lower of Cost or Market
Cost is equal to the amount paid to the warehouse bank and the amount originally funded by the Company. Market value is often difficult to determine, but is based on the following:
|
·
|
For loans that have an active market the Company uses the market price on the repurchased date.
|
|
·
|
For loans where there is no market but there is a similar product, the Company uses the market value for the similar product on the repurchased date.
|
|
·
|
For loans where no active market exists on the repurchased date, the Company determines that the unpaid principal balance best approximates the market value on the repurchased date, after considering the fair value of the underlying real estate collateral and estimated future cash flows.
|
The appraised value of the real estate underlying the original mortgage loan adds support to the Company’s determination of fair value because if the loan becomes delinquent, the Company has sufficient value to collect the unpaid principal balance or the carrying value of the loan. In determining the market value on the date of repurchase, the Company considers the total value of all of the loans because any sale of loans would be made as a pool.
For mortgages originated and held for investment, mortgage fee income and related expenses are recognized when the loan is originated.
The Company provides an allowance for loan losses on its mortgage loans held for investment. The allowance is comprised of two components. The first component is an allowance for collectively evaluated impairment that is based upon the Company’s historical experience in collecting similar receivables. The second component is based upon individual evaluation of loans that are determined to be impaired.
Commercial Loans
Each quarter, management reviews the current commercial loans and determines if an allowance is required based on the Company’s actual experience of losses on impaired commercial loans. To date, the Company has not incurred any significant losses. The carrying value of all commercial loans is supported by appraisals and cash flow analysis of revenue received. Also, the Company has not accrued any interest income or capitalized any of the foreclosure costs on the impaired commercial loans.
Residential and Construction Loans
The Company believes that in an orderly market fair value will approximate the replacement cost of a home and the rental income provides a cash flow stream for investment analysis. The Company believes the highest and best use of the properties are as income producing assets since it is the Company’s intent to hold the properties as rental properties, matching the income from the investment in rental properties with the funds required for future estimated policy claims. Accordingly, the fair value determination will be weighted more heavily toward the rental analysis.
It should be noted that for replacement cost, when determining the fair value of mortgage properties, the Company uses Marshall and Swift, a provider of building cost information to the real estate construction industry. For the investment analysis, the Company used market data based upon its real estate operation experience and projected the present value of the net rental income over seven years. The Company used 60% of the projected cash flow analysis and 40% of the replacement cost to approximate fair value of the collateral.
Each quarter the Company also analyzes its current loan portfolio and determines the level of allowance needed for loans that are listed as current in the portfolio. The basis of the analysis places a higher weight on loans with high loan to value ratios, those that lack mortgage insurance, and certain loan types that have a higher percentage of default based on the Company’s experience.
Each quarter the Company makes further analysis of the foreclosed properties to determine if any additional allowances are necessary by comparing national indexes of loan to value ratios by region to the Company’s loan to value ratios. Based upon the above procedures, the Company’s management believes that residential and residential construction loans are reflected in the Company’s financial statements at the lower of cost or market in accordance with GAAP requirements.
53
SECURITY NATIONAL FINANCIAL CORPORATION
AND SUBSIDIARIES
Notes to Consolidated Financial Statements
Years Ended December 31, 2014, 2013 and 2012
1)
Significant Accounting Policies
(Continued)
Goodwill
Previous acquisitions have been accounted for as purchases under which assets acquired and liabilities assumed were recorded at their fair values with the excess purchase price recognized as goodwill. The Company evaluates annually or when changes in circumstances warrant the recoverability of goodwill and if there is a decrease in value, the related impairment is recognized as a charge against income. No impairment of goodwill has been recognized in the accompanying financial statements.
Long-lived Assets
Long-lived assets to be held and used are reviewed for impairment whenever events or changes in circumstances indicate that the related carrying amount may not be recoverable. When required, impairment losses on assets to be held and used are recognized based on the fair value of the asset, and long-lived assets to be disposed of are reported at the lower of carrying amount or fair value less costs to sell. No impairment of long-lived assets has been recognized in the accompanying financial statements.
Income Taxes
Income taxes include taxes currently payable plus deferred taxes. Deferred tax assets and liabilities are recognized for the future tax consequences attributable to the temporary differences in the financial reporting basis and tax basis of assets and liabilities and operating loss carry-forwards. Deferred tax assets are measured using enacted tax rates expected to apply to taxable income in the years in which these temporary differences are expected to be recovered or settled.
Liabilities are established for uncertain tax positions expected to be taken in income tax returns when such positions are judged to meet the “more-likely-than-not” threshold based on the technical merits of the positions. Estimated interest and penalties related to uncertain tax penalties are included as a component of other expenses.
Earnings Per Common Share
The Company computes earnings per share in accordance with accounting principles generally accepted in the United States of America which requires presentation of basic and diluted earnings per share. Basic earnings per equivalent Class A common share are computed by dividing net earnings by the weighted-average number of Class A common shares outstanding during each year presented, after the effect of the assumed conversion of Class C common stock to Class A common stock. Diluted earnings per share is computed by dividing net earnings by the weighted-average number of common shares outstanding during the year used to compute basic earnings per share plus dilutive potential incremental shares. Basic and diluted earnings per share amounts have been adjusted retroactively for the effect of annual stock dividends.
Stock Based Compensation
The cost of employee services received in exchange for an award of equity instruments is recognized in the financial statements and is measured based on the fair value on the grant date of the award. The fair value of stock options is calculated using the Black Scholes method. Stock option compensation expense is recognized over the period during which an employee is required to provide service in exchange for the award.
54
SECURITY NATIONAL FINANCIAL CORPORATION
AND SUBSIDIARIES
Notes to Consolidated Financial Statements
Years Ended December 31, 2014, 2013 and 2012
1)
Significant Accounting Policies
(Continued)
Concentration of Credit Risk
The Company maintains its cash in bank deposit accounts, which at times exceed federally insured limits. The Company has not experienced any losses in such accounts and believes it is not exposed to any significant credit risk on cash and cash equivalents.
Advertising
The Company expenses advertising costs as incurred.
Recent Accounting Pronouncements
Accounting Standards Update (“ASU”) No. 2014-17: “Business Combinations (Topic 805) – Pushdown Accounting”
– Issued in November 2014, ASU 2014-17 provides guidance for determining whether and at what threshold an acquiree (acquired entity) that is a business or nonprofit activity can reflect the acquirer’s accounting and reporting basis (pushdown accounting) in its separate financial statements. The amendments in this Update provide that an acquired entity may elect to apply pushdown accounting in its separate financial statements upon a change-in-control event in which an acquirer obtains control of the acquired entity. The amendments in this Update are effective November 18, 2014. This new guidance did not have a significant impact on the Company’s results of operations or financial position.
Accounting Standards Update (“ASU”) No. 2014-11: "Transfers and Servicing - Repurchase to Maturity Transactions, Repurchase Financings, and Disclosures (Topic 860)"
– Issued in June 2014, ASU 2014-11 aligns the accounting for repurchase to maturity transactions and repurchase agreements executed as a repurchase financing with the accounting for other typical repurchase agreements. Going forward, these transactions would all be accounted for as secured borrowings. The new authoritative guidance is effective for the first interim or annual period beginning after December 15, 2014. In addition the disclosure of certain transactions accounted for as a sale is effective for the first interim or annual period beginning on or after December 15, 2014, and the disclosure for transactions accounted for as secured borrowings is required for annual periods beginning after December 15, 2014, and interim periods beginning after March 15, 2015. Early adoption is prohibited. This new guidance will not have a significant impact on the Company’s results of operations or financial position.
ASU No. 2014-09: “Revenue from Contracts with Customers (Topic 606)”
- Issued in May 2014, ASU 2014-09 supersedes the revenue recognition requirements in ASC Topic 605, “Revenue Recognition”, and requires entities to recognize revenue in a way that depicts the transfer of promised goods or services to customers in an amount that reflects the consideration to which the entity expects to be entitled in exchange for those goods or services. Insurance contracts are excluded from the scope of this new guidance. The new authoritative guidance is effective for interim and annual periods beginning after December 15, 2016. The Company is in the process of evaluating the potential impact of this standard, which is not expected to be material to the Company’s results of operations or financial position.
ASU No. 2014-14: “Receivables – Troubled Debt Restructurings by Creditors (Subtopic 310-40)”
- In January 2014, ASU No. 2014-14 amended ASC Topic 310, "Receivables" to reduce diversity by clarifying when an in substance repossession or foreclosure occurs, that is, when a creditor should be considered to have received physical possession of residential real estate property collateralizing a consumer mortgage loan such that the loan receivable should be derecognized and the real estate property recognized. The new authoritative guidance is effective for interim and annual periods beginning after December 15, 2014 and will not have a significant impact on the Company’s results of operations or financial position.
The Company has reviewed other recent accounting pronouncements and has determined that they will not significantly impact the Company’s results of operations or financial position.
55
SECURITY NATIONAL FINANCIAL CORPORATION
AND SUBSIDIARIES
Notes to Consolidated Financial Statements
Years Ended December 31, 2014, 2013 and 2012
2)
Investments
The Company’s investments in fixed maturity securities held to maturity and equity securities available for sale as of December 31, 2014 are summarized as follows:
|
Amortized
Cost
|
Gross
Unrealized
Gains
|
Gross
Unrealized
Losses
|
Estimated
Fair Value
|
|||||||||||||
|
December 31, 2014
:
|
||||||||||||||||
|
Fixed maturity securities held to maturity carried at amortized cost:
|
||||||||||||||||
|
U.S. Treasury securities and obligations of U.S. Government agencies
|
$ | 1,873,146 | $ | 345,715 | $ | - | $ | 2,218,861 | ||||||||
|
|
||||||||||||||||
|
Obligations of states and political subdivisions
|
1,736,489 | 221,893 | (5,278 | ) | 1,953,104 | |||||||||||
|
Corporate securities including public utilities
|
126,533,483 | 15,841,536 | (980,357 | ) | 141,394,662 | |||||||||||
|
Mortgage-backed securities
|
4,263,206 | 305,381 | (11,894 | ) | 4,556,693 | |||||||||||
|
Redeemable preferred stock
|
612,023 | 22,032 | - | 634,055 | ||||||||||||
|
Total fixed maturity securities held to maturity
|
$ | 135,018,347 | $ | 16,736,557 | $ | (997,529 | ) | $ | 150,757,375 | |||||||
56
SECURITY NATIONAL FINANCIAL CORPORATION
AND SUBSIDIARIES
Notes to Consolidated Financial Statements
Years Ended December 31, 2014, 2013 and 2012
2)
Investments
(Continued)
|
Amortized
Cost
|
Gross
Unrealized
Gains
|
Gross
Unrealized
Losses
|
Estimated
Fair Value
|
|||||||||||||
|
December 31, 2014
:
|
||||||||||||||||
|
Equity securities available for sale at estimated fair value:
|
||||||||||||||||
|
Common stock:
|
||||||||||||||||
|
Industrial, miscellaneous and all other
|
$ | 7,179,010 | $ | 393,873 | $ | (820,133 | ) | $ | 6,752,750 | |||||||
|
Total securities available for sale carried at estimated fair value
|
$ | 7,179,010 | $ | 393,873 | $ | (820,133 | ) | $ | 6,752,750 | |||||||
|
Mortgage loans on real estate and construction loans held for investment at amortized cost:
|
||||||||||||||||
|
Residential
|
$ | 53,592,433 | ||||||||||||||
|
Residential construction
|
33,071,938 | |||||||||||||||
|
Commercial
|
35,388,756 | |||||||||||||||
|
Less: Allowance for loan losses
|
(2,003,055 | ) | ||||||||||||||
|
Total mortgage loans on real estate and construction loans held for investment
|
$ | 120,050,072 | ||||||||||||||
|
Real estate held for investment - net of depreciation
|
$ | 111,411,351 | ||||||||||||||
|
Policy and other loans at amortized cost:
|
||||||||||||||||
|
Policy loans
|
$ | 7,011,012 | ||||||||||||||
|
Other loans
|
27,807,829 | |||||||||||||||
|
Less: Allowance for doubtful accounts
|
(693,413 | ) | ||||||||||||||
|
Total policy and other loans at amortized cost
|
$ | 34,125,428 | ||||||||||||||
|
Short-term investments at amortized cost
|
$ | 27,059,495 | ||||||||||||||
57
SECURITY NATIONAL FINANCIAL CORPORATION
AND SUBSIDIARIES
Notes to Consolidated Financial Statements
Years Ended December 31, 2014, 2013 and 2012
2)
Investments
(Continued)
The Company’s investments in fixed maturity securities held to maturity and equity securities available for sale as of December 31, 2013 are summarized as follows:
|
Amortized
Cost
|
Gross
Unrealized
Gains
|
Gross
Unrealized
Losses
|
Estimated
Fair Value
|
|||||||||||||
|
December 31, 2013
:
|
||||||||||||||||
|
Fixed maturity securities held to maturity carried at amortized cost:
|
||||||||||||||||
|
U.S. Treasury securities and obligations of U.S. Government agencies
|
$ | 2,284,261 | $ | 298,901 | $ | - | $ | 2,583,162 | ||||||||
|
|
||||||||||||||||
|
Obligations of states and political subdivisions
|
1,790,661 | 197,340 | (9,404 | ) | 1,978,597 | |||||||||||
|
Corporate securities including public utilities
|
134,257,468 | 10,513,448 | (1,394,919 | ) | 143,375,997 | |||||||||||
|
Mortgage-backed securities
|
4,522,081 | 206,617 | (11,351 | ) | 4,717,347 | |||||||||||
|
Redeemable preferred stock
|
612,023 | 12,994 | (5,900 | ) | 619,117 | |||||||||||
|
Total fixed maturity securities held to maturity
|
$ | 143,466,494 | $ | 11,229,300 | $ | (1,421,574 | ) | $ | 153,274,220 | |||||||
58
SECURITY NATIONAL FINANCIAL CORPORATION
AND SUBSIDIARIES
Notes to Consolidated Financial Statements
Years Ended December 31, 2014, 2013 and 2012
2)
Investments
(Continued)
|
Amortized
Cost
|
Gross
Unrealized
Gains
|
Gross
Unrealized
Losses
|
Estimated
Fair Value
|
|||||||||||||
|
December 31, 2013
:
|
||||||||||||||||
|
Equity securities available for sale at estimated fair value:
|
||||||||||||||||
|
Common stock:
|
||||||||||||||||
|
Industrial, miscellaneous and all other
|
$ | 4,783,936 | $ | 240,206 | $ | (525,386 | ) | $ | 4,498,756 | |||||||
|
Total securities available for sale carried at estimated fair value
|
$ | 4,783,936 | $ | 240,206 | $ | (525,386 | ) | $ | 4,498,756 | |||||||
|
Mortgage loans on real estate and construction loans held for investment at amortized cost:
|
||||||||||||||||
|
Residential
|
$ | 49,868,486 | ||||||||||||||
|
Residential construction
|
12,912,473 | |||||||||||||||
|
Commercial
|
41,653,009 | |||||||||||||||
|
Less: Allowance for loan losses
|
(1,652,090 | ) | ||||||||||||||
|
Total mortgage loans on real estate and construction loans held for investment
|
$ | 102,781,878 | ||||||||||||||
|
Real estate held for investment - net of depreciation
|
$ | 99,760,475 | ||||||||||||||
|
Policy and other loans at amortized cost:
|
||||||||||||||||
|
Policy loans
|
$ | 7,520,376 | ||||||||||||||
|
Other loans
|
12,472,805 | |||||||||||||||
|
Less: Allowance for doubtful accounts
|
(269,175 | ) | ||||||||||||||
|
Total policy and other loans at amortized cost
|
$ | 19,724,006 | ||||||||||||||
|
Short-term investments at amortized cost
|
$ | 12,135,719 | ||||||||||||||
59
SECURITY NATIONAL FINANCIAL CORPORATION
AND SUBSIDIARIES
Notes to Consolidated Financial Statements
Years Ended December 31, 2014, 2013 and 2012
2)
Investments
(Continued)
Fixed Maturity Securities
The following tables summarize unrealized losses on fixed maturities securities, which are carried at amortized cost, at December 31, 2014 and 2013. The unrealized losses were primarily related to interest rate fluctuations. The tables set forth unrealized losses by duration and number of investment positions, together with the fair value of the related fixed maturity securities:
|
Unrealized
Losses for
Less than
Twelve
Months
|
No. of
Investment
Positions
|
Unrealized
Losses for
More than
Twelve Months
|
No. o
f
Investment
Positions
|
Total
Unrealized
Loss
|
||||||||||||||||
|
At December 31, 2014
|
||||||||||||||||||||
|
Redeemable Preferred Stock
|
$ | - | 0 | $ | - | 0 | $ | - | ||||||||||||
|
Obligations of States and
|
||||||||||||||||||||
|
Political Subdivisions
|
- | 0 | 5,278 | 1 | 5,278 | |||||||||||||||
|
Corporate Securities
|
548,310 | 21 | 432,047 | 11 | 980,357 | |||||||||||||||
|
Mortgage and other
|
||||||||||||||||||||
|
asset-backed securities
|
3,966 | 1 | 7,928 | 0 | 11,894 | |||||||||||||||
|
Total unrealized losses
|
$ | 552,276 | 22 | $ | 445,253 | 12 | $ | 997,529 | ||||||||||||
|
Fair Value
|
$ | 7,081,352 | $ | 2,777,587 | $ | 9,858,939 | ||||||||||||||
|
At December 31, 2013
|
||||||||||||||||||||
|
Redeemable Preferred Stock
|
$ | 5,900 | 1 | $ | - | 0 | $ | 5,900 | ||||||||||||
|
Obligations of States and
|
||||||||||||||||||||
|
Political Subdivisions
|
7,131 | 1 | 2,273 | 1 | 9,404 | |||||||||||||||
|
Corporate Securities
|
1,134,415 | 72 | 260,504 | 10 | 1,394,919 | |||||||||||||||
|
Mortgage and other
|
||||||||||||||||||||
|
asset-backed securities
|
3,109 | 1 | 8,242 | 1 | 11,351 | |||||||||||||||
|
Total unrealized losses
|
$ | 1,150,555 | 75 | $ | 271,019 | 12 | $ | 1,421,574 | ||||||||||||
|
Fair Value
|
$ | 22,002,277 | $ | 2,308,464 | $ | 24,310,741 | ||||||||||||||
As of December 31, 2014, the average market value of the related fixed maturities was 90.8% of amortized cost and the average market value was 94.5% of amortized cost as of December 31, 2013. During 2014, 2013 and 2012, an other than temporary decline in market value resulted in the recognition of credit losses on fixed maturity securities of $120,000, $120,000 and $165,000, respectively.
On a quarterly basis, the Company reviews its available for sale fixed investment securities related to corporate securities and other public utilities, consisting of bonds and preferred stocks that are in a loss position. The review involves an analysis of the securities in relation to historical values, and projected earnings and revenue growth rates. Based on the analysis, a determination is made whether a security will likely recover from the loss position within a reasonable period of time. If it is unlikely that the investment will recover from the loss position, the loss is considered to be other-than-temporary, the security is written down to the impaired value and an impairment loss is recognized.
60
SECURITY NATIONAL FINANCIAL CORPORATION
AND SUBSIDIARIES
Notes to Consolidated Financial Statements
Years Ended December 31, 2014, 2013 and 2012
2)
Investments
(Continued)
Equity Securities
The following tables summarize unrealized losses on equity securities that were carried at estimated fair value based on quoted trading prices at December 31, 2014 and 2013. The unrealized losses were primarily the result of decreases in market value due to overall equity market declines. The tables set forth unrealized losses by duration and number of investment positions, together with the fair value of the related equity securities available for sale in a loss position:
|
Unrealized
Losses for
Less than
Twelve
Months
|
No. of
Investment
Positions
|
Unrealized
Losses for
More than
Twelve Months
|
No. of
Investment
Positions
|
Total
Unrealized
Losses
|
||||||||||||||||
|
At December 31, 2014
|
||||||||||||||||||||
|
Industrial, miscellaneous and all other
|
$ | 327,389 | 138 | $ | 492,744 | 27 | $ | 820,133 | ||||||||||||
|
Total unrealized losses
|
$ | 327,389 | 138 | $ | 492,744 | 27 | $ | 820,133 | ||||||||||||
|
Fair Value
|
$ | 2,162,425 | $ | 676,706 | $ | 2,839,131 | ||||||||||||||
|
At December 31, 2013
|
||||||||||||||||||||
|
Industrial, miscellaneous and all other
|
$ | 119,449 | 28 | $ | 405,936 | 28 | $ | 525,385 | ||||||||||||
|
Total unrealized losses
|
$ | 119,449 | 28 | $ | 405,936 | 28 | $ | 525,385 | ||||||||||||
|
Fair Value
|
$ | 993,612 | $ | 772,345 | $ | 1,765,957 | ||||||||||||||
As of December 31, 2014, the average market value of the equity securities available for sale was 77.6% of the original investment and the average market value was 77.1% of the original investment as of December 31, 2013. The intent of the Company is to retain equity securities for a period of time sufficient to allow for the recovery in fair value. However, the Company may sell equity securities during a period in which the fair value has declined below the amount of the original investment. In certain situations, new factors, including changes in the business environment, can change the Company’s previous intent to continue holding a security. During 2014, 2013, and 2012, an other than temporary decline in the market value resulted in the recognition of an impairment loss on equity securities of $44,240, $100,304, and $247,317, respectively.
On a quarterly basis, the Company reviews its investment in industrial, miscellaneous and all other equity securities that are in a loss position. The review involves an analysis of the securities in relation to historical values, price earnings ratios, projected earnings and revenue growth rates. Based on the analysis a determination is made whether a security will likely recover from the loss position within a reasonable period of time. If it is unlikely that the investment will recover from the loss position, the loss is considered to be other than temporary, the security is written down to the impaired value and an impairment loss is recognized.
The fair values of fixed maturity securities are based on quoted market prices, when available. For fixed maturity securities not actively traded, fair values are estimated using values obtained from independent pricing services, or in the case of private placements, are estimated by discounting expected future cash flows using a current market value applicable to the coupon rate, credit and maturity of the investments. The fair values for equity securities are based on quoted market prices.
61
SECURITY NATIONAL FINANCIAL CORPORATION
AND SUBSIDIARIES
Notes to Consolidated Financial Statements
Years Ended December 31, 2014, 2013 and 2012
2)
Investments
(Continued)
The amortized cost and estimated fair value of fixed maturity securities at December 31, 2014, by contractual maturity, are shown below. Expected maturities may differ from contractual maturities because certain borrowers may have the right to call or prepay obligations with or without call or prepayment penalties.
|
Amortized
|
Estimated Fair
|
|||||||
|
Cost
|
Value
|
|||||||
|
Held to Maturity:
|
||||||||
|
Due in 2015
|
$ | 4,961,596 | $ | 5,075,769 | ||||
|
Due in 2016 through 2019
|
33,920,182 | 37,561,840 | ||||||
|
Due in 2020 through 2024
|
25,074,149 | 27,690,447 | ||||||
|
Due after 2024
|
66,187,191 | 75,238,571 | ||||||
|
Mortgage-backed securities
|
4,263,206 | 4,556,693 | ||||||
|
Redeemable preferred stock
|
612,023 | 634,055 | ||||||
|
Total held to maturity
|
$ | 135,018,347 | $ | 150,757,375 | ||||
The cost and estimated fair value of available for sale securities at December 31, 2014, by contractual maturity, are shown below. Expected maturities may differ from contractual maturities because certain borrowers may have the right to call or prepay obligations with or without call or prepayment penalties. Equities are valued using the specific identification method.
|
Estimated Fair
|
||||||||
|
Cost
|
Value
|
|||||||
|
Available for Sale:
|
||||||||
|
Common stock
|
$ | 7,179,010 | $ | 6,752,750 | ||||
|
Total available for sale
|
$ | 7,179,010 | $ | 6,752,750 | ||||
62
SECURITY NATIONAL FINANCIAL CORPORATION
AND SUBSIDIARIES
Notes to Consolidated Financial Statements
Years Ended December 31, 2014, 2013 and 2012
2)
Investments
(Continued)
The Company’s realized gains and losses and other than temporary impairments from investments and other assets are summarized as follows:
|
2014
|
2013
|
2012
|
||||||||||
|
Fixed maturity securities held
to maturity:
|
||||||||||||
|
Gross realized gains
|
$ | 390,203 | $ | 97,238 | $ | 470,874 | ||||||
|
Gross realized losses
|
(71,800 | ) | (41,164 | ) | (3,875 | ) | ||||||
|
Other than temporary impairments
|
(120,000 | ) | (120,000 | ) | (165,000 | ) | ||||||
|
Securities available for sale:
|
||||||||||||
|
Gross realized gains
|
349,207 | 540,990 | 392,033 | |||||||||
|
Gross realized losses
|
(55,222 | ) | (2,678 | ) | (5,705 | ) | ||||||
|
Other than temporary impairments
|
(44,240 | ) | (100,304 | ) | (247,317 | ) | ||||||
|
Other assets:
|
||||||||||||
|
Gross realized gains
|
1,445,596 | 824,203 | 794,346 | |||||||||
|
Gross realized losses
|
(139,808 | ) | (538 | ) | (223,163 | ) | ||||||
|
Other than temporary impairments
|
- | (115,922 | ) | (795,315 | ) | |||||||
|
Total
|
$ | 1,753,936 | $ | 1,081,825 | $ | 216,878 | ||||||
The net carrying amount for sales of securities classified as held to maturity was $2,840,709, $1,455,835 and $2,174,300, for the years ended December 31, 2014, 2013 and 2012, respectively. The net realized gain related to these sales was $20,722, $12,533 and $271,364, for the years ended December 31, 2014, 2013 and 2012, respectively. Certain circumstances lead to these decisions to sell.
There were no investments, aggregated by issuer, in excess of 10% of shareholders’ equity (before net unrealized gains and losses on available-for-sale securities) at December 31, 2014, other than investments issued or guaranteed by the United States Government.
Major categories of net investment income are as follows:
|
2014
|
2013
|
2012
|
||||||||||
|
Fixed maturity securities
|
$ | 8,229,451 | $ | 8,265,949 | $ | 7,731,051 | ||||||
|
Equity securities
|
212,917 | 210,491 | 264,063 | |||||||||
|
Mortgage loans on real estate
|
7,550,110 | 4,666,910 | 5,543,777 | |||||||||
|
Real estate
|
8,433,895 | 6,658,185 | 4,927,128 | |||||||||
|
Policy, student and other loans
|
741,220 | 799,703 | 830,683 | |||||||||
|
Short-term investments, principally gains on
sale of mortgage loans
|
12,397,382 | 8,952,584 | 8,716,257 | |||||||||
|
Gross investment income
|
37,564,975 | 29,553,822 | 28,012,959 | |||||||||
|
Investment expenses
|
(9,261,235 | ) | (9,199,820 | ) | (6,097,382 | ) | ||||||
|
Net investment income
|
$ | 28,303,740 | $ | 20,354,002 | $ | 21,915,577 | ||||||
Net investment income includes net investment income earned by the restricted assets of the cemeteries and mortuaries of $356,369, $341,430 and $352,488 for 2014, 2013 and 2012, respectively.
Net investment income on real estate consists primarily of rental revenue received under short-term leases.
Investment expenses consist primarily of depreciation, property taxes, operating expenses of real estate and an estimated portion of administrative expenses relating to investment activities.
63
SECURITY NATIONAL FINANCIAL CORPORATION
AND SUBSIDIARIES
Notes to Consolidated Financial Statements
Years Ended December 31, 2014, 2013 and 2012
2)
Investments
(Continued)
Securities on deposit for regulatory authorities as required by law amounted to $8,886,001 at December 31, 2014 and $9,215,222 at December 31, 2013. The restricted securities are included in various assets under investments on the accompanying consolidated balance sheets.
Mortgage Loans
Mortgage loans consist of first and second mortgages. The mortgage loans bear interest at rates ranging from 2.0 % to 10.5%, maturity dates range from three months to 30 years and are secured by real estate. Concentrations of credit risk arise when a number of mortgage loan debtors have similar economic characteristics that would cause their ability to meet contractual obligations to be similarly affected by changes in economic conditions. Although the Company has a diversified mortgage loan portfolio consisting of residential mortgages, commercial loans and residential construction loans and requires collateral on all real estate exposures, a substantial portion of its debtors’ ability to honor obligations is reliant on the economic stability of the geographic region in which the debtors do business. At December 31, 2014, the Company has 44%, 17%, 13% and 8% of its mortgage loans from borrowers located in the states of Utah, California, Texas and Florida, respectively. The mortgage loans on real estate balances on the consolidated balance sheet are reflected net of an allowance for loan losses of $2,003,055 and $1,652,090 at December 31, 2014 and 2013, respectively.
The Company establishes a valuation allowance for credit losses in its portfolio.
64
SECURITY NATIONAL FINANCIAL CORPORATION
AND SUBSIDIARIES
Notes to Consolidated Financial Statements
Years Ended December 31, 2014, 2013 and 2012
2)
Investments
(Continued)
The following is a summary of the allowance for loan losses as a contra-asset account for the periods presented:
|
Allowance for Credit Losses and Recorded Investment in Mortgage Loans
|
||||||||||||||||
|
For the Years Ended December 31, 2014, and 2013
|
||||||||||||||||
|
Commercial
|
Residential
|
Residential
Construction
|
Total
|
|||||||||||||
|
2014
|
||||||||||||||||
|
Allowance for credit losses:
|
||||||||||||||||
|
Beginning balance
|
$ | 187,129 | $ | 1,364,847 | $ | 100,114 | $ | 1,652,090 | ||||||||
|
Charge-offs
|
- | (38,444 | ) | - | (38,444 | ) | ||||||||||
|
Provision
|
- | 389,409 | - | 389,409 | ||||||||||||
|
Ending balance
|
$ | 187,129 | $ | 1,715,812 | $ | 100,114 | $ | 2,003,055 | ||||||||
|
Ending balance: individually evaluated for impairment
|
$ | - | $ | 153,446 | $ | - | $ | 153,446 | ||||||||
|
Ending balance: collectively evaluated for impairment
|
$ | 187,129 | $ | 1,562,366 | $ | 100,114 | $ | 1,849,609 | ||||||||
|
Ending balance: loans acquired with deteriorated credit quality
|
$ | - | $ | - | $ | - | $ | - | ||||||||
|
Mortgage loans:
|
||||||||||||||||
|
Ending balance
|
$ | 35,388,756 | $ | 53,592,433 | $ | 33,071,938 | $ | 122,053,127 | ||||||||
|
Ending balance: individually evaluated for impairment
|
$ | - | $ | 1,556,182 | $ | 414,499 | $ | 1,970,681 | ||||||||
|
Ending balance: collectively evaluated for impairment
|
$ | 35,388,756 | $ | 52,036,251 | $ | 32,657,439 | $ | 120,082,446 | ||||||||
|
Ending balance: loans acquired with deteriorated credit quality
|
$ | - | $ | - | $ | - | $ | - | ||||||||
|
2013
|
||||||||||||||||
|
Allowance for credit losses:
|
||||||||||||||||
|
Beginning balance
|
$ | - | $ | 4,193,674 | $ | 46,187 | $ | 4,239,861 | ||||||||
|
Charge-offs
|
- | (2,670,794 | ) | (137,629 | ) | (2,808,423 | ) | |||||||||
|
Provision
|
187,129 | (158,033 | ) | 191,556 | 220,652 | |||||||||||
|
Ending balance
|
$ | 187,129 | $ | 1,364,847 | $ | 100,114 | $ | 1,652,090 | ||||||||
|
Ending balance: individually evaluated for impairment
|
$ | - | $ | 152,745 | $ | - | $ | 152,745 | ||||||||
|
Ending balance: collectively evaluated for impairment
|
$ | 187,129 | $ | 1,212,102 | $ | 100,114 | $ | 1,499,345 | ||||||||
|
Ending balance: loans acquired with deteriorated credit quality
|
$ | - | $ | - | $ | - | $ | - | ||||||||
|
Mortgage loans:
|
||||||||||||||||
|
Ending balance
|
$ | 41,653,009 | $ | 49,868,486 | $ | 12,912,473 | $ | 104,433,968 | ||||||||
|
Ending balance: individually evaluated for impairment
|
$ | - | $ | 1,518,327 | $ | - | $ | 1,518,327 | ||||||||
|
Ending balance: collectively evaluated for impairment
|
$ | 41,653,009 | $ | 48,350,159 | $ | 12,912,473 | $ | 102,915,641 | ||||||||
|
Ending balance: loans acquired with deteriorated credit quality
|
$ | - | $ | - | $ | - | $ | - | ||||||||
65
SECURITY NATIONAL FINANCIAL CORPORATION
AND SUBSIDIARIES
Notes to Consolidated Financial Statements
Years Ended December 31, 2014, 2013 and 2012
2)
Investments
(Continued)
The following is a summary of the aging of mortgage loans for the periods presented.
|
Age Analysis of Past Due Mortgage Loans
|
||||||||||||||||||||||||||||||||||||
|
Years Ended December 31, 2014 and 2013
|
||||||||||||||||||||||||||||||||||||
|
30-59 Days
Past Due
|
60-89 Days
Past Due
|
Greater Than
90 Days 1)
|
In
Foreclosure 1)
|
Total Past Due
|
Current
|
Total
Mortgage
Loans
|
Allowance
for Loan
Losses
|
Net
Mortgage
Loans
|
||||||||||||||||||||||||||||
|
2014
|
||||||||||||||||||||||||||||||||||||
|
Commercial
|
$ | - | $ | - | $ | - | $ | - | $ | - | $ | 35,388,756 | $ | 35,388,756 | $ | (187,129 | ) | $ | 35,201,627 | |||||||||||||||||
|
Residential
|
1,631,142 | 1,174,516 | 5,464,901 | 1,556,182 | 9,826,741 | 43,765,692 | 53,592,433 | (1,715,812 | ) | 51,876,621 | ||||||||||||||||||||||||||
|
Residential
Construction
|
- | - | 64,895 | 414,499 | 479,394 | 32,592,544 | 33,071,938 | (100,114 | ) | 32,971,824 | ||||||||||||||||||||||||||
|
Total
|
$ | 1,631,142 | $ | 1,174,516 | $ | 5,529,796 | $ | 1,970,681 | $ | 10,306,135 | $ | 111,746,992 | $ | 122,053,127 | $ | (2,003,055 | ) | $ | 120,050,072 | |||||||||||||||||
|
2013
|
||||||||||||||||||||||||||||||||||||
|
Commercial
|
$ | - | $ | - | $ | - | $ | 4,973,745 | $ | 4,973,745 | $ | 36,679,264 | $ | 41,653,009 | $ | (187,129 | ) | $ | 41,465,880 | |||||||||||||||||
|
Residential
|
1,646,953 | 1,604,847 | 5,867,501 | 1,518,327 | 10,637,628 | 39,230,858 | 49,868,486 | (1,364,847 | ) | 48,503,639 | ||||||||||||||||||||||||||
|
Residential
Construction
|
- | - | 64,895 | - | 64,895 | 12,847,578 | 12,912,473 | (100,114 | ) | 12,812,359 | ||||||||||||||||||||||||||
|
Total
|
$ | 1,646,953 | $ | 1,604,847 | $ | 5,932,396 | $ | 6,492,072 | $ | 15,676,268 | $ | 88,757,700 | $ | 104,433,968 | $ | (1,652,090 | ) | $ | 102,781,878 | |||||||||||||||||
|
1) There was not any interest income recognized on loans past due greater than 90 days or in foreclosure.
|
|||||||||
66
SECURITY NATIONAL FINANCIAL CORPORATION
AND SUBSIDIARIES
Notes to Consolidated Financial Statements
Years Ended December 31, 2014, 2013 and 2012
2)
Investments
(Continued)
Impaired Mortgage Loans
Impaired mortgage loans include loans with a related specific valuation allowance or loans whose carrying amount has been reduced to the expected collectible amount because the impairment has been considered other than temporary. The recorded investment in and unpaid principal balance of impaired loans along with the related loan specific allowance for losses, if
any, for each reporting period and the average recorded investment and interest income recognized during the time the loans were impaired were as follows:
|
Impaired Loans
|
||||||||||||||||||||
|
For the Years Ended December 31, 2014, and 2013
|
||||||||||||||||||||
|
Recorded
Investment
|
Unpaid
Principal
Balance
|
Related
Allowance
|
Average
Recorded
Investment
|
Interest
Income
Recognized
|
||||||||||||||||
|
2014
|
||||||||||||||||||||
|
With no related allowance recorded:
|
||||||||||||||||||||
|
Commercial
|
$ | - | $ | - | $ | - | $ | - | $ | - | ||||||||||
|
Residential
|
- | - | - | - | - | |||||||||||||||
|
Residential construction
|
414,499 | 414,499 | - | 414,499 | - | |||||||||||||||
|
With an allowance recorded:
|
||||||||||||||||||||
|
Commercial
|
$ | - | $ | - | $ | - | $ | - | $ | - | ||||||||||
|
Residential
|
1,556,182 | 1,556,182 | 153,446 | 1,556,182 | - | |||||||||||||||
|
Residential construction
|
- | - | - | - | - | |||||||||||||||
|
Total:
|
||||||||||||||||||||
|
Commercial
|
$ | - | $ | - | $ | - | $ | - | $ | - | ||||||||||
|
Residential
|
1,556,182 | 1,556,182 | 153,446 | 1,556,182 | - | |||||||||||||||
|
Residential construction
|
414,499 | 414,499 | - | 414,499 | - | |||||||||||||||
|
2013
|
||||||||||||||||||||
|
With no related allowance recorded:
|
||||||||||||||||||||
|
Commercial
|
$ | - | $ | - | $ | - | $ | - | $ | - | ||||||||||
|
Residential
|
- | - | - | - | - | |||||||||||||||
|
Residential construction
|
- | - | - | - | - | |||||||||||||||
|
With an allowance recorded:
|
||||||||||||||||||||
|
Commercial
|
$ | - | $ | - | $ | - | $ | - | $ | - | ||||||||||
|
Residential
|
1,518,327 | 1,518,327 | 152,745 | 1,518,327 | - | |||||||||||||||
|
Residential construction
|
- | - | - | - | - | |||||||||||||||
|
Total:
|
||||||||||||||||||||
|
Commercial
|
$ | - | $ | - | $ | - | $ | - | $ | - | ||||||||||
|
Residential
|
1,518,327 | 1,518,327 | 152,745 | 1,518,327 | - | |||||||||||||||
|
Residential construction
|
- | - | - | - | - | |||||||||||||||
67
SECURITY NATIONAL FINANCIAL CORPORATION
AND SUBSIDIARIES
Notes to Consolidated Financial Statements
Years Ended December 31, 2014, 2013 and 2012
2)
Investments
(Continued)
Credit Risk Profile Based on Performance Status
The Company’s mortgage loan portfolio is monitored based on performance of the loans. Monitoring a mortgage loan increases when the loan is delinquent or earlier if there is an indication of impairment. The Company defines non-performing mortgage loans as loans 90 days or greater delinquent or on non-accrual status.
The Company’s performing and non-performing mortgage loans were as follows:
|
Mortgage Loan Credit Exposure
|
||||||||||||||||||||||||||||||||
|
Credit Risk Profile Based on Payment Activity
|
||||||||||||||||||||||||||||||||
|
As of December 31, 2014, and 2013
|
||||||||||||||||||||||||||||||||
|
Commercial
|
Residential
|
Residential Construction
|
Total
|
|||||||||||||||||||||||||||||
|
2014
|
2013
|
2014
|
2013
|
2014
|
2013
|
2014
|
2013
|
|||||||||||||||||||||||||
|
Performing
|
$ | 35,388,756 | $ | 36,679,264 | $ | 46,571,350 | $ | 42,482,658 | $ | 32,592,544 | $ | 12,847,578 | $ | 114,552,650 | $ | 92,009,500 | ||||||||||||||||
|
Non-performing
|
- | 4,973,745 | 7,021,083 | 7,385,828 | 479,394 | 64,895 | 7,500,477 | 12,424,468 | ||||||||||||||||||||||||
|
Total
|
$ | 35,388,756 | $ | 41,653,009 | $ | 53,592,433 | $ | 49,868,486 | $ | 33,071,938 | $ | 12,912,473 | $ | 122,053,127 | $ | 104,433,968 | ||||||||||||||||
Non-Accrual Mortgage Loans
Once a loan is past due 90 days, it is the policy of the Company to end the accrual of interest income on the loan and write off any income that had been accrued. Interest not accrued on these loans totals $535,000 and $678,000 as of December 31, 2014 and 2013, respectively.
The following is a summary of mortgage loans on a non-accrual status for the periods presented.
|
Mortgage Loans on Non-accrual Status
|
||||||||
|
As of December 31, 2014, and 2013
|
||||||||
|
2014
|
2013
|
|||||||
|
Commercial
|
$ | - | $ | 4,973,745 | ||||
|
Residential
|
7,021,083 | 7,385,828 | ||||||
|
Residential construction
|
479,394 | 64,895 | ||||||
|
Total
|
$ | 7,500,477 | $ | 12,424,468 | ||||
Principal Amounts Due
The amortized cost and contractual payments on mortgage loans on real estate and construction loans held for investment by category as of December 31, 2014 are shown below. Expected principal payments may differ from contractual obligations because certain borrowers may elect to pay off mortgage obligations with or without early payment penalties.
|
Principal
|
Principal
|
Principal
|
||||||||||||||
|
Amounts
|
Amounts
|
Amounts
|
||||||||||||||
|
Due in
|
Due in
|
Due
|
||||||||||||||
|
Total
|
2015
|
2016-2019 |
Thereafter
|
|||||||||||||
|
Residential
|
$ | 53,592,433 | $ | 3,748,893 | $ | 17,225,255 | $ | 32,618,285 | ||||||||
|
Residential Construction
|
33,071,938 | 32,648,470 | 423,468 | - | ||||||||||||
|
Commercial
|
35,388,756 | 18,652,738 | 13,279,688 | 3,456,330 | ||||||||||||
|
Total
|
$ | 122,053,127 | $ | 55,050,101 | $ | 30,928,411 | $ | 36,074,615 | ||||||||
68
SECURITY NATIONAL FINANCIAL CORPORATION
AND SUBSIDIARIES
Notes to Consolidated Financial Statements
Years Ended December 31, 2014, 2013 and 2012
2)
Investments
(Continued)
Loan Loss Reserve
When a repurchase demand is received from a third party investor, the relevant data is reviewed and captured so that an estimated future loss can be calculated. The key factors that are used in the estimated loss calculation are as follows: (i) lien position, (ii) payment status, (iii) claim type, (iv) unpaid principal balance, (v) interest rate, and (vi) validity of the demand. Other data is captured and is useful for management purposes; the actual estimated loss is generally based on these key factors. The Company conducts its own review upon the receipt of a repurchase demand. In many instances, the Company is able to resolve the issues relating to the repurchase demand by the third party investor without having to make any payments to the investor.
The following is a summary of the loan loss reserve which is included in other liabilities and accrued expenses:
|
Years Ended December 31
|
||||||||
|
2014
|
2013
|
|||||||
|
Balance, beginning of period
|
$ | 5,506,532 | $ | 6,035,295 | ||||
|
Provisions for losses
|
3,053,403 | 1,846,285 | ||||||
|
Charge-offs and settlements
|
(6,841,785 | ) | (2,375,048 | ) | ||||
|
Balance, at December 31
|
$ | 1,718,150 | $ | 5,506,532 | ||||
The Company believes the loan loss reserve represents probable loan losses incurred as of the balance sheet date. Actual loan loss experience could change, in the near-term, from the established reserve based upon claims that could be asserted by third party investors. SecurityNational Mortgage believes there is potential to resolve any alleged claims by third party investors on acceptable terms. If SecurityNational Mortgage is unable to resolve such claims on acceptable terms, legal action may ensue. In the event of legal action by any third party investor, SecurityNational Mortgage believes it has significant defenses to any such action and intends to vigorously defend itself against such action.
3)
Receivables
Receivables consist of the following:
|
Years Ended December 31
|
||||||||
|
2014
|
2013
|
|||||||
|
Trade contracts
|
$ | 12,166,838 | $ | 9,993,755 | ||||
|
Receivables from sales agents
|
1,951,677 | 994,056 | ||||||
|
Held in Escrow – Southern Security
|
278,331 | 312,167 | ||||||
|
Other
|
1,428,106 | 1,601,227 | ||||||
|
Total receivables
|
15,824,952 | 12,901,205 | ||||||
|
Allowance for doubtful accounts
|
(1,280,859 | ) | (1,248,633 | ) | ||||
|
Net receivables
|
$ | 14,544,093 | $ | 11,652,572 | ||||
69
SECURITY NATIONAL FINANCIAL CORPORATION
AND SUBSIDIARIES
Notes to Consolidated Financial Statements
Years Ended December 31, 2014, 2013 and 2012
4)
Value of Business Acquired
Information with regard to value of business acquired is as follows:
|
December 31
|
||||||||||||
|
2014
|
2013
|
2012
|
||||||||||
|
Balance at beginning of year
|
$ | 8,680,845 | $ | 9,829,082 | $ | 10,996,050 | ||||||
|
Value of business acquired
|
1,169,428 | 192,035 | 48,190 | |||||||||
|
Imputed interest at 7%
|
591,412 | 647,848 | 728,880 | |||||||||
|
Amortization
|
(1,894,058 | ) | (1,988,120 | ) | (1,944,038 | ) | ||||||
|
Net amortization charged to income
|
(1,302,646 | ) | (1,340,272 | ) | (1,215,158 | ) | ||||||
|
Balance at end of year
|
$ | 8,547,627 | $ | 8,680,845 | $ | 9,829,082 | ||||||
Presuming no additional acquisitions, net amortization charged to income is expected to approximate $1,113,000, $1,031,000, $958,000, $852,000, and $790,000 for the years 2015 through 2019. Actual amortization may vary based on changes in assumptions or experience. As of December 31, 2014, value of business acquired is being amortized over a weighted average life of 6.6 years.
5)
Property and Equipment
The cost of property and equipment is summarized below:
|
December 31
|
||||||||
|
2014
|
2013
|
|||||||
|
Land and buildings
|
$ | 11,904,100 | $ | 12,482,082 | ||||
|
Furniture and equipment
|
15,822,957 | 14,301,713 | ||||||
| 27,727,057 | 26,783,795 | |||||||
|
Less accumulated depreciation
|
(16,419,343 | ) | (15,260,635 | ) | ||||
|
Total
|
$ | 11,307,714 | $ | 11,523,160 | ||||
Depreciation expense for the years ended December 31, 2014, 2013 and 2012 was $2,177,165, $1,621,069 and $1,258,097 respectively.
70
SECURITY NATIONAL FINANCIAL CORPORATION
AND SUBSIDIARIES
Notes to Consolidated Financial Statements
Years Ended December 31, 2014, 2013 and 2012
6)
Bank and Other Loans Payable
Bank loans payable are summarized as follows:
|
December 31
|
||||||||
|
2014
|
2013
|
|||||||
|
6.34% note payable in monthly installments of $13,556
including principal and interest, collateralized by real
property with a book value of approximately $498,000,
due November 2017.
|
$ | 466,937 | $ | 612,068 | ||||
|
5.75% note payable in monthly installments of $28,271 including
principal and interest, collateralized by real property with a book
value of approximately $5,890,000 due March 2015.
|
3,398,099 | 3,509,944 | ||||||
|
Mark to market of interest rate swaps (discussed below) adjustment
|
31,370 | 58,310 | ||||||
|
3.85% note payable in monthly installments of $79,468 including
principal and interest, collateralized by shares of Security National
Life Insurance Company stock, due June 2015.
|
461,889 | 1,377,925 | ||||||
|
3.85% note payable in monthly installments of $86,059 including
principal and interest, collateralized by shares of Security National
Life Insurance Company stock, due December 2017.
|
2,994,999 | 3,891,926 | ||||||
|
4.40% note payable in monthly installments of $46,825 including
principal and interest, collateralized by real property with a book
value of approximately $12,450,000 due January 2026.
|
8,333,550 | 8,500,000 | ||||||
|
2.75% above the 90-day LIBOR rate (3.0052% at December 31, 2014) constructon and term loan payable, collateralized by real property with a book vaue of approximately $22,855,000 due July 2017.
|
13,085,189 | - | ||||||
|
Other collateralized bank loans payable
|
247,384 | 338,304 | ||||||
|
Other notes payable
|
961 | 961 | ||||||
|
Total bank and other loans
|
29,020,378 | 18,289,438 | ||||||
|
Less current installments
|
5,248,043 | 5,849,926 | ||||||
|
Bank and other loans, excluding current installments
|
$ | 23,772,335 | $ | 12,439,512 | ||||
During 2001, the Company entered into an interest rate swap instrument that effectively fixed the interest rate on the note payable at 6.34% per annum. Management considers the interest rate swap instrument an effective cash flow hedge against the variable interest rate on the bank note since the interest rate swap mirrors the term of the note payable and expires on the maturity date of the bank loan it hedges. The interest rate swap is a derivative financial instrument carried at its fair value.
In the event the swap is terminated, any resulting gain or loss would be deferred and amortized to interest expense over the remaining life of the bank loan it hedged. In the event of early extinguishment of the hedged bank loan, any realized or unrealized gain or loss from the hedging swap would be recognized in income coincident with the extinguishment.
71
SECURITY NATIONAL FINANCIAL CORPORATION
AND SUBSIDIARIES
Notes to Consolidated Financial Statements
Years Ended December 31, 2014, 2013 and 2012
6)
Bank and Other Loans Payable
At December 31, 2014 and 2013, the fair value of the interest rate swap was an unrealized loss of $31,370 and $58,310, respectively, and was computed based on the underlying variable Libor rate plus 1.65%, or 2.65% per annum. The unrealized loss resulted in a derivative liability of $31,370 and $58,310 and has been reflected in accumulated other comprehensive income. The change in accumulated other comprehensive income from the interest rate swap in 2014 and 2013 was $26,940 and 32,262, respectively. The fair value of the interest rate swap was derived from a proprietary model of the bank from whom the interest rate swap was purchased and to whom the note is payable.
The Company has a $2,000,000 revolving line-of-credit with a bank with interest payable at the prime rate minus .75% (2.50% at December 31, 2014), secured by the capital stock of Security National Life and maturing June 30, 2015, renewable annually. At December 31, 2014, the Company was contingently liable under a standby letter of credit aggregating $699,671, to be used as collateral to cover any contingency related to additional risk assessments pertaining to the Company's captive insurance program. The Company does not expect any material losses to result from the issuance of the standby letter of credit because claims are not expected to exceed premiums paid. As of December 31, 2014, there were no amounts outstanding under the revolving line-of-credit.
The Company has a $15,000,000 revolving line-of-credit with a bank with interest payable at the variable overnight Libor rate plus 2% (2.1146% at December 31, 2014), secured by bond investments of the Company and maturing June 30, 2015. At December 31, 2014, the Company was contingently liable under two standby letters of credit aggregating $139,220, issued as security deposits to guarantee payment of final bills for electric and gas utility services for a commercial real estate property owned by the Company in Wichita, Kansas. As of December 31, 2014, there were no amounts outstanding under the revolving line-of-credit.
The Company has a $2,150,000 revolving line-of-credit with a bank with interest payable at the prime rate plus 1.25% (4.50% at December 31, 2014), secured by the capital stock of Security National Life and maturing June 30, 2015. At December 31, 2014, SecurityNational Mortgage was contingently liable under a standby letter of credit aggregating $1,250,000, to be used as collateral to cover any contingency relating to claims filed in states where SecurityNational Mortgage is licensed. The Company does not expect any material losses to result from the issuance of the standby letter of credit. As of December 31, 2014, there were no amounts outstanding under the revolving line-of-credit.
The Company has entered into a Construction and Term Loan Agreement (“Agreement”) between Zions First National Bank, a national banking association, and Dry Creek Property Development, Inc., the Company’s wholly owned subsidiary. Under the terms of this Agreement the Company promises to pay Zions First National Bank the principal sum of $27,500,000 plus interest. These funds will be used for the construction of a 282-unit multifamily development in Sandy City, Utah. As of December 31, 2014, the amount outstanding under this agreement was $13,085,189.
The following tabulation shows the combined maturities of bank loans payable, lines of credit and notes and contracts payable:
|
2015
|
$ | 5,248,043 | ||
|
2016
|
1,395,942 | |||
|
2017
|
14,586,183 | |||
|
2018
|
246,769 | |||
|
2019
|
246,336 | |||
|
Thereafter
|
7,297,105 | |||
|
Total
|
$ | 29,020,378 |
Interest paid approximated interest expense in 2014, 2013 and 2012, which was $2,994,429, $2,853,701 and $3,744,293, respectively.
72
SECURITY NATIONAL FINANCIAL CORPORATION
AND SUBSIDIARIES
Notes to Consolidated Financial Statements
Years Ended December 31, 2014, 2013 and 2012
7)
Cemetery and Mortuary Endowment Care and Pre-need Merchandise Funds
The Company is required by state law to pay into perpetual care trusts a portion of the proceeds from the sale of cemetery property interment rights. The related cemetery perpetual care trusts are defined as variable interest entities pursuant to generally accepted accounting principles. Also, management has determined that the Company is the primary beneficiary of these trusts, as it absorbs both a majority of the losses and returns associated with the trusts. The Company has consolidated cemetery perpetual care trust investments with a corresponding amount recorded as Cemetery Perpetual Care Obligation in the accompanying consolidated balance sheets
.
The components of the cemetery perpetual care obligation are as follows:
|
December 31
|
||||||||
|
2014
|
2013
|
|||||||
|
Trust investments, at market value
|
$ | 2,645,423 | $ | 2,414,883 | ||||
|
Note receivables from Cottonwood Mortuary
|
||||||||
|
Singing Hills Cemetery and Memorial Estates - Pinehill
eliminated in consolidation
|
1,847,892 | 1,881,565 | ||||||
|
Total trust assets
|
4,493,315 | 4,296,448 | ||||||
|
Cemetery perpetual care obligation
|
(3,406,718 | ) | (3,266,131 | ) | ||||
|
Fair value of trust assets in excess of trust obligations
|
$ | 1,086,597 | $ | 1,030,317 | ||||
The Company has established and maintains certain restricted trust investments to provide for future merchandise and service obligations incurred in connection with its pre-need sales. Also included in cash and cash equivalents are escrows held for borrowers under servicing agreements relating to mortgage loans, funds held by warehouse banks in accordance with loan purchase agreements and funds held in escrow for the construction of a 282-unit multifamily development in Sandy City, Utah.
Assets in the restricted asset account are summarized as follows:
|
December 31
|
||||||||
|
2014
|
2013
|
|||||||
|
Cash and cash equivalents
|
$ | 7,274,685 | $ | 4,746,417 | ||||
|
Mutual funds
|
627,154 | 582,163 | ||||||
|
Fixed maturity securities
|
8,775 | 8,775 | ||||||
|
Equity securities
|
88,048 | 84,986 | ||||||
|
Participating in mortgage loans with Security National Life
|
1,349,135 | 1,248,639 | ||||||
|
Total
|
$ | 9,347,797 | $ | 6,670,980 | ||||
A surplus note receivable and interest, at December 31, 2014 and December 31, 2013 in the amount of $4,000,000 from Security National Life was eliminated in consolidation.
73
SECURITY NATIONAL FINANCIAL CORPORATION
AND SUBSIDIARIES
Notes to Consolidated Financial Statements
Years Ended December 31, 2014, 2013 and 2012
8)
Income Taxes
The Company’s income tax liability (benefit) at December 31 is summarized as follows:
|
December 31
|
December 31
|
|||||||
|
2014
|
2013
|
|||||||
|
Current
|
$ | (333,350 | ) | $ | (1,578,071 | ) | ||
|
Deferred
|
20,755,117 | 17,529,919 | ||||||
|
Total
|
$ | 20,421,767 | $ | 15,951,848 | ||||
Significant components of the Company’s deferred tax (assets) and liabilities at December 31 are approximately as follows:
|
December 31
|
||||||||
|
2014
|
2013
|
|||||||
|
Assets
|
||||||||
|
Future policy benefits
|
$ | (6,856,001 | ) | $ | (5,381,385 | ) | ||
|
Loan loss reserve
|
(670,078 | ) | (2,147,547 | ) | ||||
|
Unearned premium
|
(1,687,059 | ) | (1,759,087 | ) | ||||
|
Available for sale securities
|
(125,797 | ) | (566,316 | ) | ||||
|
Net operating loss
|
(1,738,137 | ) | (873,412 | ) | ||||
|
Deferred compensation
|
(1,279,860 | ) | (1,057,551 | ) | ||||
|
Deposit obligations
|
(1,018,313 | ) | (1,043,964 | ) | ||||
|
Other
|
(1,398,152 | ) | (1,287,773 | ) | ||||
|
Less: Valuation allowance
|
5,276,431 | 5,593,063 | ||||||
|
Total deferred tax assets
|
(9,496,966 | ) | (8,523,972 | ) | ||||
|
Liabilities
|
||||||||
|
Deferred policy acquisition costs
|
12,271,954 | 10,914,618 | ||||||
|
Basis difference in property and equipment
|
7,049,551 | 6,242,266 | ||||||
|
Value of business acquired
|
2,906,193 | 2,951,487 | ||||||
|
Deferred gains
|
5,472,003 | 3,545,692 | ||||||
|
Trusts
|
1,599,657 | 1,599,657 | ||||||
|
Tax on unrealized appreciation
|
952,725 | 800,171 | ||||||
|
Total deferred tax liabilities
|
30,252,083 | 26,053,891 | ||||||
|
Net deferred tax liability
|
$ | 20,755,117 | $ | 17,529,919 | ||||
The valuation allowance relates to differences between recorded deferred tax assets and liabilities and ultimate anticipated realization.
The valuation allowance decreased $316,632 during 2014 and $735,868 during 2013.
The Company paid $408,939, $4,009,598 and $1,900,000 in income taxes for 2014, 2013 and 2012, respectively.
The Company’s income tax expense (benefit) is summarized as follows for the years ended December 31:
74
SECURITY NATIONAL FINANCIAL CORPORATION
AND SUBSIDIARIES
Notes to Consolidated Financial Statements
Years Ended December 31, 2014, 2013 and 2012
8)
Income Taxes
|
2014
|
2013
|
2012
|
||||||||||
|
Current
|
$ | 1,653,663 | $ | 1,821,539 | $ | 2,707,962 | ||||||
|
Deferred
|
3,072,642 | 416,267 | 1,930,813 | |||||||||
|
Total
|
$ | 4,726,305 | $ | 2,237,806 | $ | 4,638,775 | ||||||
The reconciliation of income tax expense at the U.S. federal statutory rates is as follows:
|
2014
|
2013
|
2012
|
||||||||||
|
Computed expense at statutory rate
|
$ | 4,243,524 | $ | 3,340,067 | $ | 7,472,953 | ||||||
|
Tax audit settlements
|
- | 20,371 | - | |||||||||
|
Other, net
|
482,781 | (1,122,632 | ) | (2,834,178 | ) | |||||||
|
Tax expense (benefit)
|
$ | 4,726,305 | $ | 2,237,806 | $ | 4,638,775 | ||||||
At December 31, 2014, the Company had no significant unrecognized tax benefits. As of December 31, 2014, the Company does not expect any material changes to the estimated amount of unrecognized tax benefits in the next twelve months. Federal and state income tax returns for 2011 through 2014 are subject to examination by taxing authorities. An examination of the Company’s 2012 federal income tax return is in process.
9)
Reinsurance, Commitments and Contingencies
Reinsurance
The Company follows the procedure of reinsuring risks in excess of a specified limit, which ranged from $25,000 to $100,000 during the years 2014 and 2013. The Company is liable for these amounts in the event such reinsurers are unable to pay their portion of the claims. The Company has also assumed insurance from other companies having insurance in force amounting to approximately $1,462,340,000 (unaudited) at December 31, 2014 and approximately $1,566,336,000 (unaudited) at December 31, 2013.
Reinsurance Agreement with American Republic Insurance Company
On February 11, 2015, the Company signed a coinsurance agreement to reinsure certain life insurance policies from American Republic Insurance Company (“American Republic”). The policies were previously reinsured by North America Life under a coinsurance agreement between World Insurance Company (“World Insurance”) and North America Life entered into on July 22, 2009 which was commuted. World Insurance was subsequently purchased by and merged into American Republic. The current coinsurance agreement is between the Company and American Republic and became effective on January 1, 2015. As part of the coinsurance agreement, American Republic transferred all contractual obligations and risks to the Company and the Company took control of $15,004,771 of assets in a trust account held by Texas Capital Bank as the trustee.
Reinsurance Agreement with LJA Insurance Company
On December 19, 2014, the Company entered into a Coinsurance Funds Withheld Reinsurance Agreement with LJA Insurance Company (“LJA Insurance”), a Republic of the Marshall Islands domiciled insurance company. This agreement was effective November 1, 2014. Under the terms of the funds withheld agreement, the Company ceded to LJA Insurance 100% of three blocks of deferred annuities in the amount of $4,337,000 and retained the assets and recorded a funds held under coinsurance liability for the same amount. LJA Insurance agreed to pay the Company an initial ceding commission of $60,000 and an asset management fee of $16,000 per quarter to administer the policies. The Company will also receive a 90% experience refund for any profits from the business. The Company has the right to recapture the business by giving LJA Insurance 90 days written notice, or it may be terminated by mutual consent of both parties.
75
SECURITY NATIONAL FINANCIAL CORPORATION
AND SUBSIDIARIES
Notes to Consolidated Financial Statements
Years Ended December 31, 2014, 2013 and 2012
9)
Reinsurance, Commitments and Contingencies
Reinsurance Terminated with North America Life Insurance Company
On December 1, 2013, in accordance with the terms of the Coinsurance Agreement, Security National Life, through Trans-western Life Insurance Company (“Trans-Western Life”), recaptured additional policies of Trans-Western Life from North American Life Insurance Company (“North American Life”). On December 10, 2013, pursuant to the Coinsurance Agreement, North America Life paid $2,500,000, less a ceding commission of $34,000 to Security National Life. On February 13, 2014, in accordance with the terms of the Coinsurance Agreement, Security National Life, through Trans-Western Life, recaptured the remaining policies of Trans-Western Life from North American Life. Pursuant to the Coinsurance Agreement, North America Life paid $4,684,000 less a ceding commission of $57,000 to Security National Life, and the Reinsurance Agreement between Trans Western Life and North America Life was terminated.
Mortgage Loan Loss Settlements
The mortgage industry has seen potential loan losses increase. Future loan losses are extremely difficult to estimate, especially in the current market. However, management believes that the Company’s reserve methodology and its current practice of property preservation allow it to estimate its losses on loans sold. The amounts accrued for loan losses in years ended December 31, 2014 and 2013 were $3,053,000 and $1,846,000, respectively. The estimated liability for indemnification losses is included in other liabilities and accrued expenses and, as of December 31, 2014 and 2013, the balances were $1,718,000 and $5,507,000, respectively.
Final Settlement with Wells Fargo
On April 7, 2011, SecurityNational Mortgage Company ("SecurityNational Mortgage"), a wholly owned subsidiary of Security National Financial Corporation, entered into the Settlement Agreement and Release (the "Settlement Agreement") with Wells Fargo Funding, Inc. ("Wells Fargo Funding"). On December 4, 2014, SecurityNational Mortgage and Wells Fargo Bank (which was assigned Wells Fargo Funding's interest in the Settlement Agreement) entered into a Second Addendum (the "Addendum") to the Settlement Agreement, in which SecurityNational Mortgage agreed to make a final payment to Wells Fargo Bank by December 30, 2014, to satisfy and terminate its remaining payment obligations under the Settlement Agreement. On December 29, 2014, SecurityNational Mortgage made the final payment to Wells Fargo Bank pursuant to the terms of the Addendum from its loan loss reserve, thereby satisfying in full its payment obligations under the Settlement Agreement.
Settlement with Bank of America, N.A. and Countrywide Home Loans, Inc.
On December 23, 2014, SecurityNational Mortgage entered into a Settlement Agreement (the “Settlement Agreement”) with Countrywide Home Loans, Inc. (“Countrywide Home Loans”), Bank of America, N.A. (“Bank of America”), successor-in-interest by the April 27, 2009 de jure merger to Countrywide Bank, FSB. Under the terms of the Settlement Agreement, SecurityNational Mortgage is required to pay a settlement amount to Bank of America and Countrywide Home Loans, jointly as settlement purchasers. On December 23, 2014, SecurityNational Mortgage made the full and final settlement payment from its mortgage loan loss reserve to Bank of America and Countrywide Home Loans by wire transfer.
The payment of the settlement amount is in full and final settlement of the claims and disputes between Bank of America and Countrywide Home Loans, and SecurityNational Mortgage under certain loan purchase agreements. Bank of America, Countrywide Home Loans and SecurityNational Mortgage are parties to the Loan Purchase Agreement, originally entered into between Countrywide Funding Corporation and SecurityNational Mortgage, dated September 27, 1994; and Countrywide Home Loans and SecurityNational Mortgage are parties to the Home Equity Loan Purchase Agreement, dated January 15, 1997, including any amendments or modifications to such agreements (collectively, the “Loan Purchase Agreements”).
76
SECURITY NATIONAL FINANCIAL CORPORATION
AND SUBSIDIARIES
Notes to Consolidated Financial Statements
Years Ended December 31, 2014, 2013 and 2012
9)
Reinsurance, Commitments and Contingencies
Under the terms of the Settlement Agreement, SecurityNational Mortgage, Bank of America and Countrywide Home Loans agreed to full, complete and general mutual releases with respect to the alleged claims and disputes. In particular, Bank of America and Countrywide Home Loans, as settlement purchasers, and SecurityNational Mortgage Company, as settlement seller, and their respective parent and subsidiary entities, predecessors, successors and affiliates agree to fully, finally and completely release and forever discharge each other and their respective parent and subsidiary entities, predecessors, successors, affiliates, assigns and their respective current and past directors, officers, employees, representatives and agents from any and all claims and disputes under the Loan Purchase Agreements. The settlement agreement is subject to an exception for pervasive or system-wide fraud.
Mortgage Loan Loss Demands
Third Party Investors
There have been assertions in third party investor correspondence that SecurityNational Mortgage sold mortgage loans that allegedly contained borrower misrepresentations or experienced early payment defaults, or that were otherwise allegedly defective or not in compliance with agreements between SecurityNational Mortgage and the third party investors consisting principally of financial institutions. As a result of these claims, third party investors have made demands that SecurityNational Mortgage repurchase certain alleged defective mortgage loans that were sold to such investors or indemnify them against any losses related to such loans.
The total amount of potential claims by third party investors is difficult to determine. The Company has reserved and accrued $1,702,000 as of December 31, 2014 to settle all such investor related claims. The Company believes that the reserve for mortgage loan loss, which includes provisions for probable losses and indemnification on mortgage loans sold to investors, is reasonable based on available information. Moreover, the Company has successfully negotiated acceptable settlement terms with other third party investors that asserted claims for mortgage loan losses against SecurityNational Mortgage.
77
SECURITY NATIONAL FINANCIAL CORPORATION
AND SUBSIDIARIES
Notes to Consolidated Financial Statements
Years Ended December 31, 2014, 2013 and 2012
9)
Reinsurance, Commitments and Contingencies
SecurityNational Mortgage disagrees with the repurchase demands and notices of potential claims from third party investors. Furthermore, SecurityNational Mortgage believes there is potential to resolve the alleged claims by the third party investors on acceptable terms. If SecurityNational Mortgage is unable to resolve such claims on acceptable terms, legal action may ensue. In the event of legal action by any third party investor, SecurityNational Mortgage believes it has significant defenses to any such action and intends to vigorously defend itself against such action.
JP Morgan Chase Indemnification Demand
The Company and its wholly owned subsidiary, SecurityNational Mortgage, received a notice of claim for indemnification dated December 21, 2011, from JP Morgan Chase & Co. (“JP Morgan Chase”) on behalf of EMC Mortgage, LLC (“EMC Mortgage”), relating to 21 mortgage loans that EMC Mortgage allegedly purchased as a third party investor from SecurityNational Mortgage. The notice also referenced a guaranty agreement, dated February 23, 2006, by the Company for the benefit of EMC Mortgage. The indemnification notice additionally stated that EMC Mortgage had been named in a lawsuit by the Bear Stearns Mortgage Funding Trust 2007-AR2 (the “Trust”), which was filed on September 13, 2011 in the Delaware Court of Chancery.
The lawsuit the Trust brought against EMC Mortgage contends that more than 800 residential mortgage loans that EMC Mortgage sold to the Trust (including the 21 loans allegedly originated by SecurityNational Mortgage) contained breaches of representations and warranties with respect to the mortgage loans, as well as defaults and foreclosures in many of such loans. As a result of the alleged breaches of representations and warranties by EMC Mortgage, the complaint requests that EMC Mortgage be ordered to repurchase from the Trust any loans for which it breached its representations and warranties, in the amount of the mortgage loans’ outstanding principal balance and all accrued but unpaid interest.
The indemnification notice from JP Morgan Chase further alleged that the Company and SecurityNational Mortgage are required to indemnify EMC Mortgage for any of its losses arising from the lawsuit that the Trust brought against EMC based upon allegedly untrue statements of material fact related to information that was provided by SecurityNational Mortgage. To the extent the claims in the complaint relate to the 21 mortgage loans that SecurityNational Mortgage allegedly sold to EMC Mortgage, the Company believes it has significant defenses to such claims. The Company intends to vigorously defend itself and SecurityNational Mortgage in the event that JP Morgan Chase were to bring any legal action to require the Company or SecurityNational Mortgage to indemnify it for any loss, liability or expense in connection with the lawsuit that the Trust brought against EMC Mortgage.
Mortgage Loan Loss Litigation
Lehman Brothers - Aurora Loan Services Litigation
On April 15, 2005, SecurityNational Mortgage entered into a loan purchase agreement with Lehman Brothers Bank, FSB (“Lehman Bank”). Under the terms of the loan purchase agreement, Lehman Bank agreed to purchase mortgage loans from time to time from SecurityNational Mortgage. During 2007, Lehman Bank and its wholly owned subsidiary, Aurora Loan Services LLC (“Aurora Loan Services”), purchased a total of 1,490 mortgage loans in the aggregate amount of $352,774,000 from SecurityNational Mortgage. Lehman Bank asserted that certain of the mortgage loans that it purchased from SecurityNational Mortgage during 2007 contained alleged misrepresentations and early payment defaults. As a result of these alleged issues with the mortgage loans, Lehman Bank contended it had the right to require SecurityNational Mortgage to repurchase certain loans or be liable for losses related to such loans under the loan purchase agreement. SecurityNational Mortgage disagrees with these claims.
78
SECURITY NATIONAL FINANCIAL CORPORATION
AND SUBSIDIARIES
Notes to Consolidated Financial Statements
Years Ended December 31, 2014, 2013 and 2012
9)
Reinsurance, Commitments and Contingencies
On December 17, 2007, SecurityNational Mortgage entered into an Indemnification Agreement with Lehman Bank and Aurora Loan Services. Under the terms of the Indemnification Agreement, SecurityNational Mortgage agreed to indemnify Lehman Bank and Aurora Loan Services for 75% of all losses that Lehman Bank and Aurora Loan Services may
incur relative to breaches by mortgagors pertaining to 55 mortgage loans that were purchased from SecurityNational Mortgage. SecurityNational Mortgage was released from any obligation to pay the remaining 25% of such losses. The Indemnification Agreement also required SecurityNational Mortgage to indemnify Lehman Bank and Aurora Loan Services for 100% of any future losses incurred on mortgage loans with breaches that were not among the 55 mortgage loans.
Pursuant to the Indemnification Agreement, SecurityNational Mortgage paid $395,000 to Aurora Loan Services as a deposit into a reserve account, to secure any obligations of SecurityNational Mortgage under the Indemnification Agreement. This deposit was in addition to a $250,000 deposit that SecurityNational Mortgage previously made into the reserve account for a total of $645,000. Losses from mortgage loans with alleged breaches were payable from the reserve account. Lehman Bank and Aurora Loan Services were not to apply any funds from the reserve account to a particular mortgage loan, however, until an actual loss had occurred. Under the Indemnification Agreement SecurityNational Mortgage was to pay to Aurora Loan Services each calendar month the difference between the reserve account balance and $645,000, but in no event would SecurityNational Mortgage be required to make payments into the reserve account in excess of $125,000 for any calendar month.
Since the time the reserve account was established, SecurityNational Mortgage paid a total of $4,281,000 from the reserve account to indemnify Lehman Brothers Bank and Aurora Loan Services for alleged losses from 31 mortgage loans that were among 55 mortgage loans with alleged breaches that were covered by the Indemnification Agreement and ten other mortgage loans with alleged breaches. In the last monthly billing statement dated April 24, 2011 to SecurityNational Mortgage, Lehman Brothers Holdings Inc. (“Lehman Holdings”) claimed that SecurityNational Mortgage owed approximately $3,745,000 for mortgage loan losses under the Indemnification Agreement.
During 2010 and 2011, the Company recognized alleged losses of $1,289,000 and $-0-, respectively. Management cannot fully determine the total losses, however, because there could be potential claims for losses that have not yet been determined. As of December 31, 2014, the Company had not accrued for any losses under the Indemnification Agreement. SecurityNational Mortgage was involved in discussions with Lehman Bank and Lehman Holdings concerning issues under the Indemnification Agreement. During the discussion period, monthly payments for December 2010 and January, February, March and April of 2011 totaling $625,000 were abated or deferred.
On May 11, 2011, SecurityNational Mortgage filed a complaint against Aurora Bank FSB, formerly known as Lehman Bank, and Aurora Loan Services in the United States District Court for the District of Utah because it had been unable to resolve certain issues under the Indemnification Agreement with Lehman Bank and Aurora Loan Services. The complaint alleges, among other claims, material breach of the Indemnification Agreement, including a claim that neither Lehman Bank nor Aurora Loan Services owned the mortgage loans that SecurityNational Mortgage sold so as to justify the amount of payments demanded from, and made by, SecurityNational Mortgage. As a result, SecurityNational Mortgage claims it is entitled to judgment of approximately $4,000,000 against Lehman Bank, as well as Aurora Loan Services to the extent of its involvement and complicity with Lehman Bank. The complaint also alleges a second claim for material breach of a section of the Indemnification Agreement that contains an alleged “sunset” provision and that the amount of the requested payments made was not justified under the “sunset” provision.
On June 8, 2011, Lehman Holdings, which had filed for bankruptcy in September 2008, filed a complaint against SecurityNational Mortgage in the United States District Court for the District of Utah. A subsidiary of Lehman Holdings owns Lehman Bank. The complaint alleges that SecurityNational Mortgage sold loans to Lehman Bank, which were then sold to Lehman Holdings. The complaint additionally alleges that Lehman Bank and Aurora Loan Services assigned their rights and remedies under the loan purchase agreement, as well as the Indemnification Agreement, to Lehman Holdings, which latter assignment purportedly took place on March 28, 2011. Lehman Holdings declared in a letter dated June 2, 2011 that the Indemnification Agreement was null and void except as to losses previously released and discharged, which is disputed by SecurityNational Mortgage.
79
SECURITY NATIONAL FINANCIAL CORPORATION
AND SUBSIDIARIES
Notes to Consolidated Financial Statements
Years Ended December 31, 2014, 2013 and 2012
9)
Reinsurance, Commitments and Contingencies
Lehman Holdings’ alleged claims are for damages for breach of contract and breach of warranty pursuant to a loan purchase agreement and Seller’s Guide. Based on claiming that the Indemnification Agreement is null and void pursuant to its lawsuit, Lehman Holdings has initially claimed damages in excess of $5,000,000. Prior to declaring the Indemnification Agreement null and void, Lehman Holdings claimed in a then recent billing statement under the terms of the Indemnification Agreement, that SecurityNational Mortgage owed approximately $3,745,000 for mortgage loan losses under the Indemnification Agreement. SecurityNational Mortgage strongly disagrees with the position of Lehman Holdings and, as set forth in its May 11, 2011 complaint, seeks affirmative relief of approximately $4,000,000 from Lehman Bank and Aurora Loan Services. Lehman Bank is a subsidiary of a company owned by Lehman Holdings, and Aurora Loan Services is a subsidiary of Lehman Bank.
On September 4, 2012, SecurityNational Mortgage filed a motion for summary judgment in its action against Lehman Bank and Aurora Loan Services on certain material issues, as well as against Lehman Holdings regarding its claims against SecurityNational Mortgage. Lehman Bank and Aurora Loan Services filed a cross motion for summary judgment as to the issues in SecurityNational Mortgage’s motion and, in the Lehman Holdings case, Lehman Holdings has requested that the Court allow a cross motion on the issues which are the subject of SecurityNational Mortgage’s September 4, 2012 motion. The cases are before two different federal judges.
On February 27, 2013, SecurityNational Mortgage’s motion for summary judgment against Lehman Bank and Aurora Loan Services and the related cross motion were heard by Judge David Nuffer of the United States District Court for the District of Utah. After an extensive hearing, Judge Nuffer requested that the parties prepare findings of fact in accordance with the Court’s earlier promulgated findings as modified at the hearing, and that each party submit proposed conclusions of law related to the motions. The motion and cross motion were taken under advisement. SecurityNational Mortgage’s motion in the Lehman Holdings case was heard on April 22, 2014 before Judge Ted Stewart of the United States District Court for the District of Utah, and is under advisement.
On May 6, 2014, Judge Nuffer issued his summary of facts, conclusions of law and order granting SecurityNational Mortgage’s motion for summary judgment and denying the cross motion of Lehman Bank and Aurora Loan Services. On May 27, 2014, Lehman Bank and Aurora Loan Services filed a motion to reconsider Judge Nuffer’s summary judgment ruling. On June 2, 2014, a hearing was held before Judge Nuffer to determine the amount owing to SecurityNational Mortgage pursuant to the summary judgment ruling. On December 23, 2014, Judge Nuffer issued an order denying Lehman Bank’s and Aurora Loan Services’ motion for reconsideration of his summary judgment ruling in favor of SecurityNational Mortgage.
On December 24, 2014, Judge Nuffer issued an amended order granting SecurityNational Mortgage’s motion for summary judgment. The amended order provided that the amount of monies previously paid by SecurityNational Mortgage that were wrongfully applied by Lehman Bank to losses on loans actually owed by Lehman Holdings, as established at the June 2, 2014 hearing, was $3,892,974. The amended order also provided for prejudgment interest at 9% per annum to SecurityNational Mortgage. The total amount of prejudgment interest awarded is $1,674,240 through May 31, 2014, with a per diem of $960 for each day after May 31, 2014 until judgment. The court also commented that further replenishment of the indemnification fund under the Indemnification Agreement appears to be barred by language in the assignment effecting a waiver, but that this issue had not been briefed before the June 2, 2014 hearing. In addition, the court stated that the offset that Lehman Bank and Aurora Loan Services pled as an affirmative defense had not yet been adjudicated by the court. Finally, the court ordered the parties to meet and confer by January 16, 2015, and to file a motion to schedule the disposition of the remaining issues in the case. The motion is to clarify whether any issues other than the offset remain to be resolved.
80
SECURITY NATIONAL FINANCIAL CORPORATION
AND SUBSIDIARIES
Notes to Consolidated Financial Statements
Years Ended December 31, 2014, 2013 and 2012
9)
Reinsurance, Commitments and Contingencies
On May 7, 2014, Judge Stewart issued an order for the parties to submit supplemental briefs as to the effect of Judge Nuffer’s summary judgment order on SecurityNational Mortgage’s motion for summary judgment in the Lehman Holdings case. The supplemental briefing was continued until January 16, 2015. Judge Stewart also granted leave for SecurityNational Mortgage to file an additional motion for summary judgment in the Lehman Holdings case on the basis that the claims of Lehman Holdings are barred by the statute of limitations. The motion was also to be filed by January 16, 2015. The August 11, 2014 trial setting before Judge Stewart in the Lehman Holdings case was stricken without providing a new trial date.
On January 16, 2015, SecurityNational Mortgage and Lehman Holdings filed briefs with Judge Stewart concerning the effect of the rulings in Judge Nuffer’s case on the case before Judge Stewart, and on the same date SecurityNational Mortgage filed a motion for summary judgment in the Lehman Holdings case based on the statute of limitations. A hearing concerning SecurityNational Mortgage’s summary judgment motion based on the statute of limitations is scheduled before Judge Stuart on April 14, 2015. On February 28, 2015, Lehman Bank and Aurora Loan Services filed a partial summary judgment motion before Judge Nuffer asserting that the Indemnification Agreement security fund should be replenished, and for a right to offset alleged losses of approximately $8.6 million, based on more than 100 loans retained by Lehman Bank, against the amount owing to SecurityNational per Judge Nuffer’s summary judgment order. Lehman Bank and Aurora Loan Services asserts that another 124 loans are not analyzed yet for potential breaches.
SecurityNational Mortgage had until March 30, 2015 to respond to the motion of Lehman Bank and Aurora Loan Services, and to file a motion if so determined by SecurityNational Mortgage. SecurityNational Mortgage asserts that Lehman Bank and Aurora Loan Services have no rights to a replenishment of the Indemnification Agreement reserve account, or for any offset against the liability of Lehman Bank and Aurora Loan Services to SecurityNational Mortgage, including the assertion that Lehman Bank and Aurora Loan Services executed an assignment to Lehman Holdings containing a waiver and release of rights and remedies which affect the foregoing asserted replenishment and offset matters. On March 30, 2015, SecurityNational Mortgage filed a response in opposition to the partial summary judgement motion of Lehman Bank and Aurora Loan Services and also filed its own partial summary judgment motion on the same issue against Lehman Bank and Aurora Loan Services.
The Company is not a party to any other material legal proceedings outside the ordinary course of business or to any other legal proceedings, which if adversely determined, would have a material adverse effect on its financial condition or results of operation.
Non-Cancelable Leases
The Company leases office space and equipment under various non-cancelable agreements, with remaining terms up to five years. Minimum lease payments under these non-cancelable operating leases as of December 31, 2014, are approximately as follows:
|
Years Ending
|
||||
|
December 31
|
||||
|
2015
|
$ | 4,299,185 | ||
|
2016
|
3,610,599 | |||
|
2017
|
2,835,947 | |||
|
2018
|
1,188,581 | |||
|
2019
|
563,956 | |||
|
Total
|
$ | 12,498,268 | ||
Total rent expense related to non-cancelable operating leases for the years ended December 31, 2014, 2013, and 2012 was approximately $5,589,000, $4,307,000 and $3,425,000, respectively.
81
SECURITY NATIONAL FINANCIAL CORPORATION
AND SUBSIDIARIES
Notes to Consolidated Financial Statements
Years Ended December 31, 2014, 2013 and 2012
9)
Reinsurance, Commitments and Contingencies
Other Contingencies and Commitments
The Company has entered into commitments to fund new residential construction loans. As of December 31, 2014, the Company’s commitments were $49,307,000, for these loans of which $33,072,000 had been funded. The Company will advance funds once the work has been completed and an independent inspection is made. The maximum loan commitment ranges between 50% and 80% of appraised value. The Company receives fees from the borrowers and the interest rate is generally 2% to 6.75% over the bank prime rate (3.25% as of December 31, 2014). Maturities range between six and twelve months.
The Company belongs to a captive insurance group for certain casualty insurance, worker compensation and liability programs. Insurance reserves are maintained relative to these programs. The level of exposure from catastrophic events is limited by the purchase of stop-loss and aggregate liability reinsurance coverage. When estimating the insurance liabilities and related reserves, the captive insurance management considers a number of factors, which include historical claims experience, demographic factors, severity factors and valuations provided by independent third-party actuaries. If actual claims or adverse development of loss reserves occurs and exceed these estimates, additional reserves may be required. The estimation process contains uncertainty since captive insurance management must use judgment to estimate the ultimate cost that will be incurred to settle reported claims and unreported claims for incidents incurred but not reported as of the balance sheet date. At December 31, 2014, $929,417 of reserves was established related to such insurance programs versus $524,034 at December 31, 2013.
The Company is a defendant in various other legal actions arising from the normal conduct of business. Management believes that none of the actions will have a material effect on the Company’s financial position or results of operations. Based on management’s assessment and legal counsel’s representations concerning the likelihood of unfavorable outcomes, no amounts have been accrued for the above claims in the consolidated financial statements.
The Company is not a party to any other material legal proceedings outside the ordinary course of business or to any other legal proceedings, which, if adversely determined, would have a material adverse effect on its financial condition or results of operations.
10)
Retirement Plans
The Company and its subsidiaries have a noncontributory Employee Stock Ownership Plan (ESOP) for all eligible employees. Eligible employees are primarily those with more than one year of service, who work in excess of 1,000 hours per year. Contributions, which may be in cash or stock of the Company, are determined annually by the Board of Directors.
The Company’s contributions are allocated to eligible employees based on the ratio of each eligible employee’s compensation to total compensation for all eligible employees during each year. The Company did not make any contributions for 2014, 2013 and 2012. At December 31, 2014, the ESOP held 579,918 shares of Class A and 252,974 shares of Class C common stock of the Company. All shares held by the ESOP have been allocated to the participating employees and all shares held by the ESOP are considered outstanding for purposes of computing earnings per share.
The Company has three 401(k) savings plans covering all eligible employees, as defined above, which includes employer participation in accordance with the provisions of Section 401(k) of the Internal Revenue Code. The plans allow participants to make pretax contributions up to a maximum of $17,500, $17,500 and $17,000 for the years 2014, 2013 and 2012, respectively or the statutory limits.
Beginning January 1, 2008, the Company elected to be a “Safe Harbor” Plan for its matching 401(k) contributions. The Company matched 100% of up to 3% of an employee’s total annual compensation and matched 50% of 4% to 5% of an employee’s annual compensation. The match was in Company stock. The
Company’s contribution for 2014, 2013 and 2012 was $808,572, $749,898 and $222,719, respectively under the “Safe Harbor” plan.
82
SECURITY NATIONAL FINANCIAL CORPORATION
AND SUBSIDIARIES
Notes to Consolidated Financial Statements
Years Ended December 31, 2014, 2013 and 2012
10)
Retirement Plans
(Continued)
In 2001, the Company’s Board of Directors adopted a Deferred Compensation Plan. Under the terms of the Plan, the Company will provide deferred compensation for a select group of management or highly compensated employees, within the meaning of Sections 201(2), 301(a)(3) and 401(a)(1) of the Employee Retirement Income Security Act of 1974, as amended. The Board has appointed a Committee of the Company to be the Plan Administrator and to determine the employees who are eligible to participate in the plan. The employees who participate may elect to defer a portion of their compensation into the plan. The Company may contribute into the plan at the discretion of the Company’s Board of Directors. The Company did not make any contributions for 2014, 2013 and 2012.
The Company had a deferred compensation agreement with its past Chief Executive Officer. The deferred compensation was payable on the retirement or death of this individual either in annual installments over 10 years or in a lump sum settlement, if approved by the Board of Directors. The amount to be paid was $60,000 per year with cost of living adjustments each anniversary. The compensation agreement also provided that any remaining balance would be paid to his heirs in the event of his death. In 2014, the Board of Directors approved a lump sum for the payment of $598,426, which represented a full and final payment
On July 16, 2004, the Company entered into an employment agreement with Scott M. Quist, the Chairman of the Board, President and Chief Executive Officer. The agreement is effective as of December 4, 2003 and has a five-year term, but the Company has agreed to renew the agreement on December 4, 2008 and 2013 for additional five-year terms, provided Mr. Quist performs his duties with usual and customary care and diligence. Under the terms of the agreement, Mr. Quist is to devote his full time to the Company serving as its Chairman of the Board, President, and Chief Executive Officer at not less than his current salary and benefits. The Company also agrees to maintain a group term life insurance policy of not less than $1,000,000 on Mr. Quist’s life and a whole life insurance policy in the amount of $500,000 on Mr. Quist’s life. In the event of disability, Mr. Quist’s salary would be continued for up to five years at 75% of its current level.
On In the event of a sale or merger of the Company and Mr. Quist is not retained in his current position, the Company would be obligated to continue Mr. Quist’s current compensation and benefits for seven years following the merger or sale. The agreement further provides that Mr. Quist is entitled to receive annual retirement benefits beginning (i) one month from the date of his retirement (to commence no sooner than age 65), (ii) five years following complete disability, or (iii) upon termination of his employment without cause. These retirement benefits are to be paid for a period of twenty years in annual installments in the amount equal to 75% of his then current rate of compensation. However, in the event that Mr. Quist dies prior to receiving all retirement benefits there under, the remaining benefits are to be paid to his heirs. The Company expensed $833,183 and $264,000 in fiscal 2014 and 2013, respectively, to cover the present value of anticipated retirement benefits under the employment agreement. The liability accrued is $2,270,425 and $1,437,242 as of December 31, 2014 and 2013, respectively.
On December 4, 2003, the Company, through its subsidiary SecurityNational Mortgage Company, entered into an employment agreement with J. Lynn Beckstead, Jr., Vice President of Mortgage Operations and President of SecurityNational Mortgage Company. The agreement has a five-year term, but the Company has agreed to renew the agreement on December 4, 2008 and 2013 for additional five-year terms, provided Mr. Beckstead performs his duties with usual and customary care and diligence. Under the terms of the agreement, Mr. Beckstead is to devote his full time to the Company serving as President of SecurityNational Mortgage Company at not less than his current salary and benefits, and to include $350,000 of life insurance protection. In the event of disability, Mr. Beckstead’s salary would be continued for up to five years at 50% of its current level.
83
SECURITY NATIONAL FINANCIAL CORPORATION
AND SUBSIDIARIES
Notes to Consolidated Financial Statements
Years Ended December 31, 2014, 2013 and 2012
10)
Retirement Plans
(Continued)
In the event of a sale or merger of the Company and Mr. Beckstead is not retained in his current position, the Company would be obligated to continue Mr. Beckstead’s current compensation and benefits for five years following the merger or sale. The agreement further provides that Mr. Beckstead is entitled to receive annual retirement benefits beginning (i) one month from the date of his retirement (to commence no sooner than age 62½) (ii) five years following complete disability, or (iii) upon termination of his employment without cause. These retirement benefits are to be paid for a period of ten years in annual installments in the amount equal to one-half of his then current annual salary. However, in the event that Mr. Beckstead dies prior to receiving all retirement benefits there under, the remaining benefits are to be paid to his heirs. The Company expensed $154,817 and $-0- in fiscal 2014 and 2013, respectively, to cover the present value of the retirement benefit of the agreement. The liability accrued is $768,220 and $613,403, as of December 31, 2014 and 2013, respectively.
In the event of a sale or merger of the Company and Mr. Quist is not retained in his current position, the Company would be obligated to continue Mr. Quist’s current compensation and benefits for seven years following the merger or sale. The agreement further provides that Mr. Quist is entitled to receive annual retirement benefits beginning (i) one month from the date of his retirement (to commence no sooner than age 65), (ii) five years following complete disability, or (iii) upon termination of his employment without cause. These retirement benefits are to be paid for a period of twenty years in annual installments in the amount equal to 75% of his then current rate of compensation. However, in the event that Mr. Quist dies prior to receiving all retirement benefits there under, the remaining benefits are to be paid to his heirs. The Company expensed $833,183 and $264,000 in fiscal 2014 and 2013, respectively, to cover the present value of anticipated retirement benefits under the employment agreement. The liability accrued is $2,270,425 and $1,437,242 as of December 31, 2014 and 2013, respectively.
On December 4, 2003, the Company, through its subsidiary SecurityNational Mortgage Company, entered into an employment agreement with J. Lynn Beckstead, Jr., Vice President of Mortgage Operations and President of SecurityNational Mortgage Company. The agreement has a five-year term, but the Company has agreed to renew the agreement on December 4, 2008 and 2013 for additional five-year terms, provided Mr. Beckstead performs his duties with usual and customary care and diligence. Under the terms of the agreement, Mr. Beckstead is to devote his full time to the Company serving as President of SecurityNational Mortgage Company at not less than his current salary and benefits, and to include $350,000 of life insurance protection. In the event of disability, Mr. Beckstead’s salary would be continued for up to five years at 50% of its current level.
In the event of a sale or merger of the Company and Mr. Beckstead is not retained in his current position, the Company would be obligated to continue Mr. Beckstead’s current compensation and benefits for five years following the merger or sale. The agreement further provides that Mr. Beckstead is entitled to receive annual retirement benefits beginning (i) one month from the date of his retirement (to commence no sooner than age 62½) (ii) five years following complete disability, or (iii) upon termination of his employment without cause. These retirement benefits are to be paid for a period of ten years in annual installments in the amount equal to one-half of his then current annual salary. However, in the event that Mr. Beckstead dies prior to receiving all retirement benefits there under, the remaining benefits are to be paid to his heirs. The Company expensed $154,817 and $-0- in fiscal 2014 and 2013, respectively, to cover the present value of the retirement benefit of the agreement. The liability accrued is $768,220 and $613,403, as of December 31, 2014 and 2013, respectively.
11)
Capital Stock
The Company has two classes of common stock with shares outstanding, Class A common shares and Class C common shares. Class C shares have 10 votes per share on all matters except for the election of one third of the directors who are elected solely by the Class A shares. Class C shares are convertible into Class A shares at any time on a one to one ratio. The decrease in treasury stock was the result of treasury stock being used to fund the company’s 401(k) and Deferred Compensation Plans.
84
SECURITY NATIONAL FINANCIAL CORPORATION
AND SUBSIDIARIES
Notes to Consolidated Financial Statements
Years Ended December 31, 2014, 2013 and 2012
11)
Capital Stock
(Continued)
Stockholders of both classes of common stock have received 5% stock dividends in the years 1990 through 2014, as authorized by the Company’s Board of Directors.
The Company has Class B common stock of $1.00 par value, 5,000,000 shares authorized, of which none are issued. Class B shares are non-voting stock except to any proposed amendment to the Articles of Incorporation which would affect Class B common stock.
On July 2, 2014, the stockholders approved a 1-for-10 reverse stock split of the Company’s Class C common stock at the Annual Meeting of Stockholders. Concurrently with the approval of the reverse stock split, the stockholders also approved amendments to Article V of the Company’s Articles of Incorporation to provide that each share of Class C common stock will have weighted voting of ten votes per share and that each share of Class C common stock may be converted into one share of Class A common stock. The Board of Directors had previously approved the reverse stock split and weighted voting of Class C common stock. Prior to the approval of the reverse stock split and weighted voting of Class C shares, the Company’s Articles of Incorporation provided that each share of Class C common stock had one vote per share and that Class C common shares were convertible into Class A common shares at a conversion ratio of ten shares of Class C common stock for one share of Class A common stock.
The reverse stock split and weighted voting of the Company's Class C common stock became effective on August 1, 2014, when the Articles of Restatement and Amendment to the Company's Articles of Incorporation were filed with the Utah Division of Corporations and Commercial Code. The reverse stock split will affect all of the holders of the Company's Class C common stock uniformly but will not affect any Class C stockholder's percentage ownership interest in the Company or proportionate voting power, except for insignificant changes that will result from the rounding up of fractional shares. Additionally, the reverse stock split will not impact the existing shares of Class A common stock.
The following table summarizes the activity in shares of capital stock for the three-year period ended December 31, 2014:
|
Class A
|
Class C (1)
|
|||||||
|
Balance at December 31, 2011
|
9,638,798 | 1,013,598 | ||||||
|
Exercise of stock options
|
685,753 | 31,891 | ||||||
|
Stock dividends
|
518,702 | 52,244 | ||||||
|
Conversion of Class C to Class A
|
323 | (323 | ) | |||||
|
Balance at December 31, 2012
|
10,843,576 | 1,097,410 | ||||||
|
Exercise of stock options
|
359,786 | 211,211 | ||||||
|
Stock dividends
|
562,152 | 63,342 | ||||||
|
Conversion of Class C to Class A
|
41,773 | (41,773 | ) | |||||
|
Balance at December 31, 2013
|
11,807,287 | 1,330,191 | ||||||
|
Exercise of stock options
|
54,412 | - | ||||||
|
Stock dividends
|
595,020 | 66,384 | ||||||
|
Reverse stock split true up
|
15 | |||||||
|
Conversion of Class C to Class A
|
2,521 | (2,521 | ) | |||||
|
Balance at December 31, 2014
|
12,459,240 | 1,394,069 | ||||||
(1) Class C shares have been retroactively adjusted for the effect of the 1-for-10 reverse stock split that was approved by the stockholders in 2014.
85
SECURITY NATIONAL FINANCIAL CORPORATION
AND SUBSIDIARIES
Notes to Consolidated Financial Statements
Years Ended December 31, 2014, 2013 and 2012
11)
Capital Stock
(Continued)
Earnings per share amounts have been retroactively adjusted for the effect of annual stock dividends. In accordance with accounting principles generally accepted in the United States of America, the basic and diluted earnings per share amounts were calculated as follows:
|
2014
|
2013
|
2012
|
||||||||||
|
Numerator:
|
||||||||||||
|
Net earnings
|
$ | 7,754,648 | $ | 7,585,921 | $ | 16,712,518 | ||||||
|
Denominator:
|
||||||||||||
|
Denominator for basic earnings
per share-weighted-average shares
|
12,518,743 | 12,366,029 | 11,427,568 | |||||||||
|
Effect of dilutive securities
|
||||||||||||
|
Employee stock options
|
409,266 | 615,547 | 599,281 | |||||||||
|
Dilutive potential common shares
|
409,266 | 615,547 | 599,281 | |||||||||
|
Denominator for diluted earnings (loss)
per share-adjusted weighted-average
shares and assumed conversions
|
12,928,009 | 12,981,576 | 12,026,849 | |||||||||
|
Basic earnings per share
|
$ | 0.62 | $ | 0.61 | $ | 1.46 | ||||||
|
Diluted earnings per share
|
$ | 0.60 | $ | 0.58 | $ | 1.39 | ||||||
12)
Stock Compensation Plans
The Company has four fixed option plans (the “2003 Plan”, the “2006 Director Plan”, the “2013 Plan” and the “2014 Director Plan”). Compensation expense for options issued of $391,220, $88,369 and $251,031 has been recognized under these plans for 2014, 2013 and 2012, respectively. As of December 31, 2014, the total unrecognized compensation expense related to the options issued in December 2014 and July 2014 were $280,287 and $86,924, respectively, which is expected to be recognized over the vesting period of one year.
The weighted-average fair value of each option granted in 2014 under the 2013 Plan, is estimated at $1.74 for the July 2, 2014 options as of the grant date using the Black Scholes Option Pricing Model with the following assumptions: dividend yield of 5%, volatility of 57.77%, risk-free interest rate of 1.79%, and an expected term of 5.32 years.
The weighted-average fair value of each option granted in 2014 under the 2013 Plan and the 2014 Director Plan, is estimated at $1.56 for the December 5, 2014 options as of the grant date using the Black Scholes Option Pricing Model with the following assumptions: dividend yield of 5%, volatility of 52.31%, risk-free interest rate of 1.69%, and an expected term of 5.31 years.
The weighted-average fair value of each option granted in 2014 under the 2014 Director Plan, is estimated at $1.56 for the December 7, 2014 options as of the grant date using the Black Scholes Option Pricing Model with the following assumptions: dividend yield of 5%, volatility of 52.27%, risk-free interest rate of 1.76%, and an expected term of 5.31 years.
The weighted-average fair value of each option granted in 2013 under the 2013 Plan and the 2006 Director Plan, is estimated at $1.96 for the December 6, 2013 and December 7, 2013 options as of the grant date using the Black Scholes Option Pricing Model with the following assumptions: dividend yield of 5%, volatility of 67.93%, risk-free interest rate of 1.68%, and an expected term of 5.31 years.
86
SECURITY NATIONAL FINANCIAL CORPORATION
AND SUBSIDIARIES
Notes to Consolidated Financial Statements
Years Ended December 31, 2014, 2013 and 2012
12)
Stock Compensation Plans
(Continued)
The weighted-average fair value of each option granted in 2012 under the 2006 Director Plan, is estimated at $3.18 for the December 7, 2012 options as of the grant date using the Black Scholes Option Pricing Model with the following weighted-average assumptions: dividend yield of 5%, volatility of 73.89%, risk-free interest rate of 0.70%, and an expected term of 5.31 years.
The weighted-average fair value of each option granted in 2012 under the 2003 Plan and the 2006 Director Plan, is estimated at $0.64 and $0.66, respectively for the April 13, 2012 options as of the grant date using the Black Scholes Option Pricing Model with the following weighted-average assumptions: dividend yield of 5% and 5%, volatility of
70.26% and 72.58%, risk-free interest rate of 0.84% and 1.04%, and an expected term of 4.53 to 5.32 years, respectively.
The Company generally estimates the expected life of the options based upon the contractual term of the options adjusted for actual experience.
Future volatility is estimated based upon the weighted historical volatility of the Company’s Class A common stock and three peer company stocks over a period equal to the estimated life of the options.
Common stock issued upon exercise of stock options are generally new share issuances rather than from treasury shares.
87
SECURITY NATIONAL FINANCIAL CORPORATION
AND SUBSIDIARIES
Notes to Consolidated Financial Statements
Years Ended December 31, 2014, 2013 and 2012
12)
Stock Compensation Plans
(Continued)
|
Activity of the stock option plans is summarized as follows:
|
||||||||||||||||
|
Number of
Class A
Shares
|
Weighted
Average
Exercise
Price
|
Number of
Class C
Shares
|
Weighted
Average
Exercise
Price
|
|||||||||||||
|
Outstanding at December 31, 2011
|
1,996,543 | $ | 2.40 | 361,028 | $ | 2.38 | ||||||||||
|
Adjustment for the effect of stock dividends
|
43,928 | 24,515 | ||||||||||||||
|
Granted
|
347,000 | - | ||||||||||||||
|
Exercised
|
(1,041,276 | ) | (52,500 | ) | ||||||||||||
|
Cancelled
|
(123,134 | ) | - | |||||||||||||
|
Reclass from A to C
|
(250,808 | ) | 250,808 | |||||||||||||
|
Outstanding at December 31, 2012
|
972,253 | $ | 2.07 | 583,851 | $ | 2.18 | ||||||||||
|
Adjustment for the effect of stock dividends
|
17,962 | 24,222 | ||||||||||||||
|
Granted
|
81,960 | 50,000 | ||||||||||||||
|
Exercised
|
(485,366 | ) | (190,602 | ) | ||||||||||||
|
Cancelled
|
(76,676 | ) | (63,814 | ) | ||||||||||||
|
Reclass from A to C
|
(105,000 | ) | 105,000 | |||||||||||||
|
Outstanding at December 31, 2013
|
405,133 | $ | 2.41 | 508,657 | $ | 2.00 | ||||||||||
|
Adjustment for the effect of stock dividends
|
24,446 | 32,934 | ||||||||||||||
|
Granted
|
173,500 | 150,000 | ||||||||||||||
|
Exercised
|
(59,713 | ) | - | |||||||||||||
|
Cancelled
|
(30,571 | ) | - | |||||||||||||
|
Outstanding at December 31, 2014
|
512,795 | $ | 3.20 | 691,591 | $ | 2.54 | ||||||||||
|
Exercisable at end of year
|
343,987 | $ | 2.50 | 547,216 | $ | 2.00 | ||||||||||
|
Available options for future grant
|
265,198 | - | ||||||||||||||
|
Weighted average contractual term of options
outstanding at December 31, 2014
|
7.70 years
|
3.42 years
|
||||||||||||||
|
Weighted average contractual term of options
exercisable at December 31, 2014
|
6.65 years
|
1.79 years
|
||||||||||||||
|
Aggregated intrinsic value of options outstanding
at December 31, 2014 (1)
|
$ | 1,042,682 | $ | 1,856,886 | ||||||||||||
|
Aggregated intrinsic value of options exercisable
at December 31, 2014 (1)
|
$ | 940,079 | $ | 1,780,498 | ||||||||||||
|
(1) The Company used a stock price of $5.22 as of December 31, 2014 to derive intrinsic value.
|
|||||||||
The total intrinsic value (which is the amount by which the fair value of the underlying stock exceeds the exercise price of an option on the exercise date) of stock options exercised during the years ended December 31, 2014 and 2013 was $173,650 and $2,179,393, respectively.
88
SECURITY NATIONAL FINANCIAL CORPORATION
AND SUBSIDIARIES
Notes to Consolidated Financial Statements
Years Ended December 31, 2014, 2013 and 2012
13)
Statutory Financial Information and Dividend Limitations
The Company’s insurance subsidiaries prepare their statutory-basis financial statements in conformity with accounting practices prescribed or permitted by the insurance department of the applicable state of domicile. Prescribed statutory accounting practices include a variety of publications of the National Association of Insurance Commissioners (“NAIC”), as well as state laws, regulations and general administrative rules. Permitted statutory accounting practices encompass all accounting practices not so prescribed.
All states require domiciled insurance companies to prepare statutory-basis financial statements in conformity with the NAIC Accounting Practices and Procedures Manual, subject to any deviations prescribed or permitted by the applicable insurance commissioner and/or director. Statutory accounting practices differ from GAAP primarily since they require charging policy acquisition and certain sales inducement costs to expense as incurred, establishing life insurance reserves based on different actuarial assumptions, and valuing certain investments and establishing deferred taxes on a different basis.
Statutory net income and capital and surplus of the Company’s insurance subsidiaries, determined in accordance with statutory accounting practices prescribed or permitted by insurance regulatory authorities are as follows:
|
Net Income
|
Capital and Surplus
|
|||||||||||||||||||
|
2014
|
2013
|
2012
|
2014
|
2013
|
||||||||||||||||
|
Amounts by insurance subsidiary:
|
||||||||||||||||||||
|
Security National Life Insurance
Company
|
$ | 5,137,208 | $ | 1,283,311 | $ | 391,533 | $ | 34,356,157 | $ | 29,597,289 | ||||||||||
|
Memorial Insurance Company of
America
|
415 | 237 | 159 | 1,082,587 | 1,083,237 | |||||||||||||||
|
Southern Security Life Insurance
Company, Inc.
|
467 | 1,288 | 184 | 1,590,424 | 1,586,832 | |||||||||||||||
|
Trans-Western Life Insurance
Company
|
1,304 | 1,906 | 2,113 | 499,182 | 497,878 | |||||||||||||||
|
Total
|
$ | 5,139,394 | $ | 1,286,742 | $ | 393,989 | $ | 37,528,350 | $ | 32,765,236 | ||||||||||
The Utah, Arkansas, Mississippi and Texas Insurance Departments impose minimum risk-based capital requirements (“RBC”) that were developed by the NAIC on insurance enterprises. The formulas for determining the RBC specify various factors that are applied to financial balances or various levels of activity based on the perceived degree of risk. Regulatory compliance is determined by a ratio (the “Ratio”) of the enterprise’s regulatory total adjusted capital, as defined by the NAIC, to its authorized control level, as defined by the NAIC. Enterprises below specific trigger points or ratios are classified within certain levels, each of which requires specified corrective action. The life insurance subsidiaries have a combined weighted Ratio that is greater than the first level of regulatory action as of December 31, 2014.
Generally, the net assets of the life insurance subsidiaries available for transfer to the Company are limited to the amounts of the life insurance subsidiaries net assets, as determined in accordance with statutory accounting practices, which were $37,528,350 at December 31, 2014, exceed minimum statutory capital requirements; however, payments of such amounts as dividends are subject to approval by regulatory authorities.
89
SECURITY NATIONAL FINANCIAL CORPORATION
AND SUBSIDIARIES
Notes to Consolidated Financial Statements
Years Ended December 31, 2014, 2013 and 2012
14)
Business Segment Information
Description of Products and Services by Segment
The Company has three reportable business segments: life insurance, cemetery and mortuary, and mortgage. The Company’s life insurance segment consists of life insurance premiums and operating expenses from the sale of insurance products sold by the Company’s independent agency force and net investment income derived from investing policyholder and segment surplus funds. The Company’s cemetery and mortuary segment consists of revenues and operating expenses from the sale of at-need cemetery and mortuary merchandise and services at its mortuaries and cemeteries, pre-need sales of cemetery spaces after collection of 10% or more of the purchase price and the net investment income from investing segment surplus funds. The Company’s mortgage loan segment consists of loan originations fee income and expenses from the originations of residential mortgage loans and interest earned and interest expenses from warehousing pre-sold loans before the funds are received from financial institutional investors.
Measurement of Segment Profit or Loss and Segment Assets
The accounting policies of the reportable segments are the same as those described in the Significant Accounting Principles. Intersegment revenues are recorded at cost plus an agreed upon intercompany profit, and are eliminated upon consolidation.
Factors Management Used to Identify the Enterprise’s Reportable Segments
The Company’s reportable segments are business units that offer different products and are managed separately due to the different products and the need to report to the various regulatory jurisdictions.
90
SECURITY NATIONAL FINANCIAL CORPORATION
AND SUBSIDIARIES
Notes to Consolidated Financial Statements
Years Ended December 31, 2014, 2013 and 2012
14)
Business Segment Information
(Continued)
| 2014 | ||||||||||||||||||||
|
Life
|
Cemetery/
|
|
Reconciling
|
|
||||||||||||||||
|
Insurance
|
Mortuary
|
Mortgage
|
Items
|
Consolidated
|
||||||||||||||||
|
Revenues:
|
||||||||||||||||||||
|
From external sources:
|
||||||||||||||||||||
|
Revenue from customers
|
$ | 57,037,623 | $ | 11,426,308 | $ | 124,668,054 | $ | - | $ | 193,131,985 | ||||||||||
|
Net investment income
|
23,008,489 | 275,324 | 5,019,927 | - | 28,303,740 | |||||||||||||||
|
Realized gains (losses) on
|
||||||||||||||||||||
|
investments and other assets
|
1,208,391 | 585,543 | 124,242 | - | 1,918,176 | |||||||||||||||
|
Other than temporary impairments
|
(164,240 | ) | - | - | - | (164,240 | ) | |||||||||||||
|
Other revenues
|
682,682 | 169,464 | 2,894,867 | - | 3,747,013 | |||||||||||||||
|
Intersegment revenues:
|
||||||||||||||||||||
|
Net investment income
|
6,128,389 | 1,288,856 | 642,880 | (8,060,125 | ) | - | ||||||||||||||
|
Total revenues
|
87,901,334 | 13,745,495 | 133,349,970 | (8,060,125 | ) | 226,936,674 | ||||||||||||||
|
Expenses:
|
||||||||||||||||||||
|
Death and other policy benefits
|
29,789,964 | - | - | - | 29,789,964 | |||||||||||||||
|
Increase in future policy benefits
|
18,060,151 | - | - | - | 18,060,151 | |||||||||||||||
|
Amortization of deferred policy
and preneed acquisition costs and
value of business acquired
|
6,561,589 | 331,389 | - | - | 6,892,978 | |||||||||||||||
|
Depreciation
|
644,510 | 436,390 | 1,096,265 | - | 2,177,165 | |||||||||||||||
|
General, administrative and
other costs:
|
||||||||||||||||||||
|
Intersegment
|
24,000 | 166,079 | 208,513 | (398,592 | ) | - | ||||||||||||||
|
Provision for loan losses
|
- | - | 3,053,403 | - | 3,053,403 | |||||||||||||||
|
Costs related to funding mortgage
|
||||||||||||||||||||
|
loans
|
- | - | 6,877,069 | - | 6,877,069 | |||||||||||||||
|
Other
|
23,045,928 | 10,245,144 | 111,319,492 | (2 | ) | 144,610,562 | ||||||||||||||
|
Interest expense:
|
||||||||||||||||||||
|
Intersegment
|
725,354 | 1,481,317 | 5,454,860 | (7,661,531 | ) | - | ||||||||||||||
|
Other
|
578,083 | 421,920 | 1,994,426 | - | 2,994,429 | |||||||||||||||
|
Total benefits and expenses
|
79,429,579 | 13,082,239 | 130,004,028 | (8,060,125 | ) | 214,455,721 | ||||||||||||||
|
Earnings before income
taxes
|
$ | 8,471,755 | $ | 663,256 | $ | 3,345,942 | $ | - | $ | 12,480,953 | ||||||||||
|
Income tax expense
|
(3,427,254 | ) | - | (1,299,051 | ) | - | (4,726,305 | ) | ||||||||||||
|
Net earnings
|
$ | 5,044,501 | $ | 663,256 | $ | 2,046,891 | $ | - | $ | 7,754,648 | ||||||||||
|
Identifiable assets
|
$ | 652,348,803 | $ | 109,114,226 | $ | 52,349,204 | $ | (142,742,671 | ) | $ | 671,069,562 | |||||||||
|
Goodwill
|
$ | 2,765,570 | $ | - | $ | - | $ | - | $ | 2,765,570 | ||||||||||
|
Expenditures for long-lived assets
|
$ | 1,420,950 | $ | 121,677 | $ | 737,936 | $ | - | $ | 2,280,563 | ||||||||||
91
SECURITY NATIONAL FINANCIAL CORPORATION
AND SUBSIDIARIES
Notes to Consolidated Financial Statements
Years Ended December 31, 2014, 2013 and 2012
14)
Business Segment Information
(Continued)
|
2013
|
||||||||||||||||||||
|
Life
|
Cemetery/
|
|
Reconciling
|
|
||||||||||||||||
|
Insurance
|
Mortuary
|
Mortgage
|
Items
|
Consolidated
|
||||||||||||||||
|
Revenues:
|
||||||||||||||||||||
|
From external sources:
|
||||||||||||||||||||
|
Revenue from customers
|
$ | 51,322,567 | $ | 12,000,375 | $ | 127,950,021 | $ | - | $ | 191,272,963 | ||||||||||
|
Net investment income
|
15,877,784 | 268,923 | 4,207,295 | - | 20,354,002 | |||||||||||||||
|
Realized gains (losses) on
investments and other assets
|
1,402,352 | 15,699 | - | - | 1,418,051 | |||||||||||||||
|
Other than temporary impairments
|
(336,226 | ) | - | - | - | (336,226 | ) | |||||||||||||
|
Other revenues
|
538,009 | 94,703 | 1,973,518 | - | 2,606,230 | |||||||||||||||
|
Intersegment revenues:
|
||||||||||||||||||||
|
Net investment income
|
7,220,282 | 1,356,825 | 262,074 | (8,839,181 | ) | - | ||||||||||||||
|
Total revenues
|
76,024,768 | 13,736,525 | 134,392,908 | (8,839,181 | ) | 215,315,020 | ||||||||||||||
|
Expenses:
|
||||||||||||||||||||
|
Death and other policy benefits
|
28,534,936 | - | - | - | 28,534,936 | |||||||||||||||
|
Increase in future policy benefits
|
19,594,890 | - | - | - | 19,594,890 | |||||||||||||||
|
Amortization of deferred policy
and preneed acquisition costs and
value of business acquired
|
4,811,300 | 370,537 | - | - | 5,181,837 | |||||||||||||||
|
Depreciation
|
401,893 | 426,641 | 792,535 | - | 1,621,069 | |||||||||||||||
|
General, administrative and
other costs:
|
||||||||||||||||||||
|
Intersegment
|
24,000 | 141,367 | 199,193 | (364,560 | ) | - | ||||||||||||||
|
Provision for loan losses
|
- | - | 1,751,472 | - | 1,751,472 | |||||||||||||||
|
Costs related to funding mortgage
|
||||||||||||||||||||
|
loans
|
- | - | 6,635,290 | - | 6,635,290 | |||||||||||||||
|
Other
|
18,753,753 | 10,467,717 | 110,096,627 | 1 | 139,318,098 | |||||||||||||||
|
Interest expense:
|
||||||||||||||||||||
|
Intersegment
|
802,352 | 1,664,096 | 6,008,174 | (8,474,622 | ) | - | ||||||||||||||
|
Other
|
233,343 | 443,133 | 2,177,225 | - | 2,853,701 | |||||||||||||||
|
Total benefits and expenses
|
73,156,467 | 13,513,491 | 127,660,516 | (8,839,181 | ) | 205,491,293 | ||||||||||||||
|
Earnings before income
taxes
|
$ | 2,868,301 | $ | 223,034 | $ | 6,732,392 | $ | - | $ | 9,823,727 | ||||||||||
|
Income tax (expense) benefit
|
399,304 | - | (2,637,110 | ) | - | (2,237,806 | ) | |||||||||||||
|
Net earnings
|
$ | 3,267,605 | $ | 223,034 | $ | 4,095,282 | $ | - | $ | 7,585,921 | ||||||||||
|
Identifiable assets
|
$ | 591,465,834 | $ | 114,454,631 | $ | 50,250,677 | $ | (137,413,688 | ) | $ | 618,757,454 | |||||||||
|
Goodwill
|
$ | 391,848 | $ | 285,191 | $ | - | $ | - | $ | 677,039 | ||||||||||
|
Expenditures for long-lived assets
|
$ | 659,259 | $ | 1,100,195 | $ | 1,810,879 | $ | - | $ | 3,570,333 | ||||||||||
92
SECURITY NATIONAL FINANCIAL CORPORATION
AND SUBSIDIARIES
Notes to Consolidated Financial Statements
Years Ended December 31, 2014, 2013 and 2012
14)
Business Segment Information
(Continued)
|
2012
|
||||||||||||||||||||
|
Life
|
Cemetery/
|
|
Reconciling
|
|
||||||||||||||||
|
Insurance
|
Mortuary
|
Mortgage
|
Items
|
Consolidated
|
||||||||||||||||
|
Revenues:
|
||||||||||||||||||||
|
From external sources:
|
||||||||||||||||||||
|
Revenue from customers
|
$ | 49,550,904 | $ | 10,864,497 | $ | 150,553,261 | $ | - | $ | 210,968,662 | ||||||||||
|
Net investment income
|
16,616,541 | 333,625 | 4,965,411 | - | 21,915,577 | |||||||||||||||
|
Realized gains (losses) on
investments and other assets
|
1,415,556 | 8,954 | - | - | 1,424,510 | |||||||||||||||
|
Other than temporary impairments
|
(1,207,632 | ) | - | - | - | (1,207,632 | ) | |||||||||||||
|
Other revenues
|
482,325 | 136,189 | 540,538 | - | 1,159,052 | |||||||||||||||
|
Intersegment revenues:
|
||||||||||||||||||||
|
Net investment income
|
7,570,979 | 1,435,891 | 294,980 | (9,301,850 | ) | - | ||||||||||||||
|
Total revenues
|
74,428,673 | 12,779,156 | 156,354,190 | (9,301,850 | ) | 234,260,169 | ||||||||||||||
|
Expenses:
|
||||||||||||||||||||
|
Death and other policy benefits
|
24,246,088 | - | - | - | 24,246,088 | |||||||||||||||
|
Increase in future policy benefits
|
21,435,191 | - | - | - | 21,435,191 | |||||||||||||||
|
Amortization of deferred policy
and preneed acquisition costs and
value of business acquired
|
5,137,586 | 311,843 | - | - | 5,449,429 | |||||||||||||||
|
Depreciation
|
315,960 | 426,006 | 516,131 | - | 1,258,097 | |||||||||||||||
|
General, administrative and
other costs:
|
||||||||||||||||||||
|
Intersegment
|
24,000 | 102,726 | 137,696 | (264,422 | ) | - | ||||||||||||||
|
Provision for loan losses
|
- | - | 4,239,418 | - | 4,239,418 | |||||||||||||||
|
Costs related to funding mortgage
|
||||||||||||||||||||
|
loans
|
- | - | 6,931,045 | - | 6,931,045 | |||||||||||||||
|
Other
|
17,824,800 | 9,582,499 | 118,198,014 | 2 | 145,605,315 | |||||||||||||||
|
Interest expense:
|
||||||||||||||||||||
|
Intersegment
|
694,442 | 1,681,987 | 6,661,001 | (9,037,430 | ) | - | ||||||||||||||
|
Other
|
159,659 | 455,449 | 3,129,185 | - | 3,744,293 | |||||||||||||||
|
Total benefits and expenses
|
69,837,726 | 12,560,510 | 139,812,490 | (9,301,850 | ) | 212,908,876 | ||||||||||||||
|
Earnings before income
taxes
|
$ | 4,590,947 | $ | 218,646 | $ | 16,541,700 | $ | - | $ | 21,351,293 | ||||||||||
|
Income tax (expense) benefit
|
1,755,258 | - | (6,394,033 | ) | - | (4,638,775 | ) | |||||||||||||
|
Net earnings
|
$ | 6,346,205 | $ | 218,646 | $ | 10,147,667 | $ | - | $ | 16,712,518 | ||||||||||
|
Identifiable assets
|
$ | 558,845,424 | $ | 116,368,747 | $ | 55,613,678 | $ | (133,611,226 | ) | $ | 597,216,623 | |||||||||
|
Goodwill
|
$ | 391,848 | $ | 285,191 | $ | - | $ | - | $ | 677,039 | ||||||||||
|
Expenditures for long-lived assets
|
$ | 400,605 | $ | 689,154 | $ | 2,131,861 | $ | - | $ | 3,221,620 | ||||||||||
93
SECURITY NATIONAL FINANCIAL CORPORATION
AND SUBSIDIARIES
Notes to Consolidated Financial Statements
Years Ended December 31, 2014, 2013 and 2012
15)
Related Party Transactions
The Company’s Board of Directors has a written procedure, which requires disclosure to the Board of any material interest or any affiliation on the part of any of its officers, directors or employees that is in conflict or may be in conflict with the interests of the Company.
16)
Fair Value of Financial Instruments
Generally accepted accounting principles (GAAP) defines fair value as the exchange price that would be received for an asset or paid to transfer a liability (an exit price) in the principal or most advantageous market for the asset or liability in an orderly transaction between market participants. GAAP also specifies a fair value hierarchy based upon the observability of inputs used in valuation techniques. Observable inputs (highest level) reflect market data obtained from independent sources, while unobservable inputs (lowest level) reflect internally developed market assumptions. Fair value measurements are classified under the following hierarchy:
Level 1:
Financial assets and financial liabilities whose values are based on unadjusted quoted prices for identical assets or liabilities in an active market that we can access.
|
|
Level 2:
Financial assets and financial liabilities whose values are based on the following:
|
|
a)
|
Quoted prices for similar assets or liabilities in active markets;
|
|
|
b)
|
Quoted prices for identical or similar assets or liabilities in non-active markets; or
|
|
|
c)
|
Valuation models whose inputs are observable, directly or indirectly, for substantially the full term of the asset or liability.
|
Level 3:
Financial assets and financial liabilities whose values are based on prices or valuation techniques that require inputs that are both unobservable and significant to the overall fair value measurement. These inputs may reflect our estimates of the assumptions that market participants would use in valuing the financial assets and financial liabilities.
The Company utilizes a combination of third party valuation service providers, brokers, and internal valuation models to determine fair value.
The following methods and assumptions were used by the Company in estimating the fair value disclosures related to other significant financial instruments:
The items shown under Level 1 and Level 2 are valued as follows:
Securities Available for Sale and Held to Maturity
:
The fair values of investments in fixed maturity and equity securities along with methods used to estimate such values are disclosed in Note 2 of the Notes to Consolidated Statements.
Restricted Assets
:
A portion of these assets include mutual funds and equity securities that have quoted market prices. Also included are cash and cash equivalents and participations in mortgage loans. The carrying amounts reported in the accompanying consolidated balance sheet for these financial instruments approximate their fair values.
Cemetery Perpetual Care Trust Investments
:
A portion of these assets include equity securities that have quoted market prices. Also included are cash and cash equivalents. The carrying amounts reported in the accompanying consolidated balance sheet for these financial instruments approximate their fair values.
Call and Put Options
:
The Company uses quoted market prices to value its call and put options.
94
SECURITY NATIONAL FINANCIAL CORPORATION
AND SUBSIDIARIES
Notes to Consolidated Financial Statements
Years Ended December 31, 2014, 2013 and 2012
16)
Fair Value of Financial Instruments
(Continued)
The items shown under Level 3 are valued as follows:
Policyholder Account Balances and Future Policy Benefits-Annuities
:
Future policy benefit reserves for interest-sensitive insurance products are computed under a retrospective deposit method and represent policy account balances before applicable surrender charges. Policy benefits and claims that are charged to expense include benefit claims incurred in the period in excess of related policy account balances. Interest crediting rates for interest-sensitive insurance products ranged from 4% to 6.5%. The fair values for the Company’s liabilities under investment-type insurance contracts (disclosed as policyholder account balances and future policy benefits – annuities) are estimated based on the contracts’ cash surrender values.
The fair values for the Company’s insurance contracts other than investment-type contracts are not required to be disclosed. However, the fair values of liabilities under all insurance contracts are taken into consideration in the Company’s overall management of interest rate risk, such that the Company’s exposure to changing interest rates is minimized through the matching of investment maturities with amounts due under insurance contracts.
Interest Rate Lock Commitments
: The Company’s mortgage banking activities enters into interest rate lock commitments with potential borrowers and forward commitments to sell loans to third-party investors. The Company also implements a hedging strategy for these transactions. A mortgage loan commitment binds the Company to lend funds to a qualified borrower at a specified interest rate and within a specified period of time, generally up to 30 days after inception of the mortgage loan commitment. Mortgage loan commitments are defined to be derivatives under generally accepted accounting principles and are recognized at fair value on the consolidated balance sheet with changes in their fair values recorded as part of other comprehensive income from mortgage banking operations.
The Company estimates the fair value of a mortgage loan commitment based on the change in estimated fair value of the underlying mortgage loan and the probability that the mortgage loan will fund within the terms of the commitment. The change in fair value of the underlying mortgage loan is measured from the date the mortgage loan commitment is issued. Therefore, at the time of issuance, the estimated fair value is zero. Following issuance, the value of a mortgage loan commitment can be either positive or negative depending upon the change in value of the underlying mortgage loans. Fallout rates derived from the Company’s recent historical empirical data are used to estimate the quantity of mortgage loans that will fund within the terms of the commitments.
Bank Loan Interest Rate Swaps
: Management considers the interest rate swap instruments to be an effective cash flow hedge against the variable interest rate on bank borrowings since the interest rate swap mirrors the term of the note payable and expires on the maturity date of the bank loan it hedges. The interest rate swaps are a derivative financial instruments carried at its fair value. The fair value of the interest rate swap was derived from a proprietary model of the bank from whom the interest rate swap was purchased and to whom the note is payable.
Mortgage Loans on Real Estate
:
The fair values are estimated using interest rates currently being offered for similar loans to borrowers with similar credit ratings. Loans with similar characteristics are aggregated for purposes of the calculations. The carrying amounts reported in the accompanying consolidated balance sheet for these financial instruments approximate their fair values.
Real Estate Held for Investment
: The Company believes that in an orderly market fair value will approximate the replacement cost of a home and the rental income provides a cash flow stream for investment analysis. The Company believes the highest and best use of the properties are as income producing assets since it is the Company’s intent to hold the properties as rental properties, matching the income from the investment in rental properties with the funds required for future estimated policy claims. Accordingly, the fair value determination will be weighted more heavily toward the rental analysis.
It should be noted that for replacement cost, when determining the fair value of mortgage properties, the Company uses Marshall and Swift, a provider of building cost information to the real estate construction industry. For the investment analysis, the Company used market data based upon its real estate operation experience and projected the present value of the net rental income over seven years. The Company used 60% of the projected cash flow analysis and 40% of the replacement cost to approximate fair value of the collateral.
In addition to this analysis performed by the Company, the Company depreciates Other Real Estate Held for Investment. This depreciation reduces the book value of these properties and lessens the exposure to the Company from further deterioration in real estate values.
95
SECURITY NATIONAL FINANCIAL CORPORATION
AND SUBSIDIARIES
Notes to Consolidated Financial Statements
Years Ended December 31, 2014, 2013 and 2012
16)
Fair Value of Financial Instruments
(Continued)
Mortgage Servicing Rights
: The Company initially recognizes MSRs at their estimated fair values derived from the net cash flows associated with the servicing contracts, where the Company assumes the obligation to service the loan in the sale transaction. The precise fair value of MSRs cannot be readily determined because MSRs are not actively traded in stand-alone markets. Considerable judgment is required to estimate the fair values of these assets and the exercise of such judgment can significantly affect the Company’s earnings.
The Company’s subsequent accounting for MSRs is based on the class of MSRs. The Company has identified two classes of MSRs: MSRs backed by mortgage loans with initial term of 30 years and MSRs backed by mortgage loans with initial term of 15 years. The Company distinguishes between these classes of MSRs due to their differing sensitivities to change in value as the result of changes in market. After being initially recorded at fair value, MSRs backed by mortgage loans are accounted for using the amortization method. MSR amortization is determined by amortizing the balance straight-line over an estimated nine year life.
The Company periodically assesses MSRs for impairment. Impairment occurs when the current fair value of the MSR falls below the asset’s carrying value (carrying value is the amortized cost reduced by any related valuation allowance). If MSRs are impaired, the impairment is recognized in current-period earnings and the carrying value of the MSRs is adjusted through a valuation allowance.
Management periodically reviews the various loan strata to determine whether the value of the MSRs in a given stratum is impaired and likely to recover. When management deems recovery of the value to be unlikely in the foreseeable future, a write-down of the cost of the MSRs for that stratum to its estimated recoverable value is charged to the valuation allowance.
96
SECURITY NATIONAL FINANCIAL CORPORATION
AND SUBSIDIARIES
Notes to Consolidated Financial Statements
Years Ended December 31, 2014, 2013 and 2012
16)
Fair Value of Financial Instruments
(Continued)
The following table summarizes Level 1, 2 and 3 financial assets and financial liabilities measured at fair value on a recurring basis by their classification in the consolidated balance sheet at December 31, 2014.
|
Total
|
Quoted Prices
in Active
Markets for
Identical Assets
(Level 1)
|
Significant
Observable
Inputs
(Level 2)
|
Significant
Unobservable
Inputs
(Level 3)
|
|||||||||||||
|
Assets accounted for at fair value on a
recurring basis
|
||||||||||||||||
|
Common stock
|
$ | 6,752,750 | $ | 6,752,750 | $ | - | $ | - | ||||||||
|
Total securities available for sale
|
6,752,750 | 6,752,750 | - | - | ||||||||||||
|
Restricted assets of cemeteries and mortuaries
|
715,202 | 715,202 | - | - | ||||||||||||
|
Cemetery perpetual care trust investments
|
695,235 | 695,235 | - | - | ||||||||||||
|
Derivatives - interest rate lock commitments
|
2,111,529 | - | - | 2,111,529 | ||||||||||||
|
Total assets accounted for at fair value on a
recurring basis
|
$ | 10,274,716 | $ | 8,163,187 | $ | - | $ | 2,111,529 | ||||||||
|
Liabilities accounted for at fair value on a
recurring basis
|
||||||||||||||||
|
Policyholder account balances
|
$ | (45,310,699 | ) | $ | - | $ | - | $ | (45,310,699 | ) | ||||||
|
Future policy benefits - annuities
|
(65,540,985 | ) | - | - | (65,540,985 | ) | ||||||||||
|
Derivatives - bank loan interest rate swaps
|
(31,370 | ) | - | - | (31,370 | ) | ||||||||||
|
- call options
|
(116,036 | ) | (116,036 | ) | - | - | ||||||||||
|
- put options
|
(11,867 | ) | (11,867 | ) | ||||||||||||
|
- interest rate lock commitments
|
(181,678 | ) | - | - | (181,678 | ) | ||||||||||
|
Total liabilities accounted for at fair value
on a recurring basis
|
$ | (111,192,635 | ) | $ | (127,903 | ) | $ | - | $ | (111,064,732 | ) | |||||
97
SECURITY NATIONAL FINANCIAL CORPORATION
AND SUBSIDIARIES
Notes to Consolidated Financial Statements
Years Ended December 31, 2014, 2013 and 2012
16)
Fair Value of Financial Instruments
(Continued)
Following is a summary of changes in the consolidated balance sheet line items measured using level 3 inputs:
|
Policyholder
Account
Balances
|
Future
Policy
Benefits -
Annuities
|
Interest
Rate Lock
Commitments
|
Bank Loan
Interest
Rate
Swaps
|
|||||||||||||
|
Balance - December 31, 2013
|
$ | (48,000,668 | ) | $ | (65,052,928 | ) | $ | 1,487,908 | $ | (58,310 | ) | |||||
|
Total Losses (Gains):
|
||||||||||||||||
|
Included in earnings
|
2,689,969 | (488,057 | ) | - | - | |||||||||||
|
Included in other
comprehensive income (loss)
|
- | - | 441,943 | 26,940 | ||||||||||||
|
Balance - December 31, 2014
|
$ | (45,310,699 | ) | $ | (65,540,985 | ) | $ | 1,929,851 | $ | (31,370 | ) | |||||
The following tables summarize Level 1, 2 and 3 financial assets and financial liabilities measured at fair value on a nonrecurring basis by their classification in the consolidated balance sheet at December 31, 2014.
|
Total
|
Quoted
Prices in
Active Markets
for Identical
Assets
(Level 1)
|
Significant
Observable
Inputs
(Level 2)
|
Significant
Unobservable
Inputs
(Level 3)
|
|||||||||||||
|
Assets accounted for at fair value on a
nonrecurring basis
|
||||||||||||||||
|
Mortgage servicing rights
|
$ | 3,741,381 | $ | - | $ | - | $ | 3,741,381 | ||||||||
|
Real estate held for investment
|
53,500 | - | - | 53,500 | ||||||||||||
|
Total assets accounted for at fair value on
a nonrecurring basis
|
$ | 3,794,881 | $ | - | $ | - | $ | 3,794,881 | ||||||||
98
SECURITY NATIONAL FINANCIAL CORPORATION
AND SUBSIDIARIES
Notes to Consolidated Financial Statements
Years Ended December 31, 2014, 2013 and 2012
16)
Fair Value of Financial Instruments
(Continued)
The following table summarizes Level 1, 2 and 3 financial assets and financial liabilities measured at fair value on a recurring basis by their classification in the consolidated balance sheet at December 31, 2013.
|
Total
|
Quoted
Prices in
Active
Markets for
Identical
Assets
(Level 1)
|
Significant
Observable
Inputs
(Level 2)
|
Significant
Unobservable
Inputs
(Level 3)
|
|||||||||||||
|
Assets accounted for at fair value on a
recurring basis
|
||||||||||||||||
|
Non-redeemable preferred stock
|
||||||||||||||||
|
Common stock
|
$ | 4,498,756 | $ | 4,498,756 | $ | - | $ | - | ||||||||
|
Total securities available for sale
|
4,498,756 | 4,498,756 | - | - | ||||||||||||
|
Restricted assets of cemeteries and mortuaries
|
667,149 | 667,149 | - | - | ||||||||||||
|
Cemetery perpetual care trust investments
|
695,616 | 695,616 | - | - | ||||||||||||
|
Derivatives - interest rate lock commitments
|
1,511,111 | - | - | 1,511,111 | ||||||||||||
|
Total assets accounted for at fair value on a
recurring basis
|
$ | 7,372,632 | $ | 5,861,521 | $ | - | $ | 1,511,111 | ||||||||
|
Liabilities accounted for at fair value on a
recurring basis
|
||||||||||||||||
|
Policyholder account balances
|
$ | (48,000,668 | ) | $ | - | $ | - | $ | (48,000,668 | ) | ||||||
|
Future policy benefits - annuities
|
(65,052,928 | ) | - | - | (65,052,928 | ) | ||||||||||
|
Derivatives - bank loan interest rate swaps
|
(58,310 | ) | - | - | (58,310 | ) | ||||||||||
|
- call options
|
(124,174 | ) | (124,174 | ) | - | - | ||||||||||
|
- interest rate lock commitments
|
(23,203 | ) | - | - | (23,203 | ) | ||||||||||
|
Total liabilities accounted for at fair value
on a recurring basis
|
$ | (113,259,283 | ) | $ | (124,174 | ) | $ | - | $ | (113,135,109 | ) | |||||
Following is a summary of changes in the consolidated balance sheet line items measured using level 3 inputs:
|
Policyholder
Account
Balances
|
Future
Policy
Benefits -
Annuities
|
Interest
Rate
Lock
Commitments
|
Bank
Loan
Interest
Rate Swaps
|
|||||||||||||
|
Balance - December 31, 2012
|
$ | (49,746,337 | ) | $ | (65,171,687 | ) | $ | 2,961,465 | $ | (93,572 | ) | |||||
|
Total Losses (Gains):
|
||||||||||||||||
|
Included in earnings
|
1,745,669 | 118,759 | - | - | ||||||||||||
|
Included in other
comprehensive income (loss)
|
- | - | (1,473,557 | ) | 35,262 | |||||||||||
|
Balance - December 31, 2013
|
$ | (48,000,668 | ) | $ | (65,052,928 | ) | $ | 1,487,908 | $ | (58,310 | ) | |||||
99
SECURITY NATIONAL FINANCIAL CORPORATION
AND SUBSIDIARIES
Notes to Consolidated Financial Statements
Years Ended December 31, 2014, 2013 and 2012
16)
Fair Value of Financial Instruments
(Continued)
The following tables summarize Level 1, 2 and 3 financial assets and financial liabilities measured at fair value on a nonrecurring basis by their classification in the consolidated balance sheet at December 31, 2013.
|
Total
|
Quoted
Prices in
Active
Markets for
Identical
Assets
(Level 1)
|
Significant
Observable
Inputs
(Level 2)
|
Significant
Unobservable
Inputs
(Level 3)
|
|||||||||||||
|
Assets accounted for at fair value on a
nonrecurring basis
|
||||||||||||||||
|
Mortgage servicing rights
|
$ | 2,494,254 | $ | - | $ | - | $ | 2,494,254 | ||||||||
|
Mortgage loans on real estate
|
89,000 | - | - | 89,000 | ||||||||||||
|
Real estate held for investment
|
660,784 | - | - | 660,784 | ||||||||||||
|
Total assets accounted for at fair value on
a nonrecurring basis
|
$ | 3,244,038 | $ | - | $ | - | $ | 3,244,038 | ||||||||
Fair Value of Financial Instruments Carried at Other Than Fair Value
ASC 825, Financial Instruments, requires disclosure of fair value information about financial instruments, whether or not recognized in the balance sheet, for which it is practicable to estimate that value.
Management uses its best judgment in estimating the fair value of the Company’s financial instruments; however, there are inherent limitations in any estimation technique. Therefore, for substantially all financial instruments, the fair value estimates presented herein are not necessarily indicative of the amounts the Company could have realized in a sales transaction at December 31, 2014. The estimated fair value amounts for December 31, 2014 have been measured as of period-end, and have not been reevaluated or updated for purposes of these Consolidated Financial Statements subsequent to those dates. As such, the estimated fair values of these financial instruments subsequent to the reporting date may be different than the amounts reported at period-end.
The carrying values and estimated fair values for such financial instruments, and their corresponding placement in the fair value hierarchy, are summarized as follows as of December 31, 2014:
|
Carrying Value
|
Level 1
|
Level 2
|
Level 3
|
Total Estimated Fair Value
|
||||||||||||||||
|
Assets
|
||||||||||||||||||||
|
Mortgage loans:
|
||||||||||||||||||||
|
Residential
|
$ | 51,876,621 | $ | - | $ | - | $ | 55,247,638 | $ | 55,247,638 | ||||||||||
|
Residential construction
|
32,971,824 | - | - | 32,971,824 | 32,971,824 | |||||||||||||||
|
Commercial
|
35,201,627 | - | - | 36,829,266 | 36,829,266 | |||||||||||||||
|
Mortgage loans, net
|
$ | 120,050,072 | $ | - | $ | - | $ | 125,048,728 | $ | 125,048,728 | ||||||||||
|
Policy loans
|
7,011,012 | - | - | 7,011,012 | 7,011,012 | |||||||||||||||
|
Other loans
|
27,114,416 | - | - | 27,114,416 | 27,114,416 | |||||||||||||||
|
Short-term investments
|
27,059,495 | - | - | 27,059,495 | 27,059,495 | |||||||||||||||
|
Liabilities
|
||||||||||||||||||||
|
Bank and other loans payable
|
$ | (28,989,008 | ) | $ | - | $ | - | $ | (28,989,008 | ) | $ | (28,989,008 | ) | |||||||
100
SECURITY NATIONAL FINANCIAL CORPORATION
AND SUBSIDIARIES
Notes to Consolidated Financial Statements
Years Ended December 31, 2014, 2013 and 2012
16)
Fair Value of Financial Instruments
(Continued)
The carrying values and estimated fair values for such financial instruments, and their corresponding placement in the fair value hierarchy, are summarized as follows as of December 31, 2013:
|
Carrying Value
|
Level 1
|
Level 2
|
Level 3
|
Total
Estimated
Fair
Value
|
||||||||||||||||
|
Assets
|
||||||||||||||||||||
|
Mortgage loans:
|
||||||||||||||||||||
|
Residential
|
$ | 48,503,639 | $ | - | $ | - | $ | 51,537,154 | $ | 51,537,154 | ||||||||||
|
Residential construction
|
12,812,359 | - | - | 12,812,359 | 12,812,359 | |||||||||||||||
|
Commercial
|
41,465,880 | - | - | 42,441,268 | 42,441,268 | |||||||||||||||
|
Mortgage loans, net
|
$ | 102,781,878 | $ | - | $ | - | $ | 106,790,781 | $ | 106,790,781 | ||||||||||
|
Policy loans
|
7,520,376 | - | - | 7,520,376 | 7,520,376 | |||||||||||||||
|
Other loans
|
12,203,630 | - | - | 12,203,630 | 12,203,630 | |||||||||||||||
|
Short-term investments
|
12,135,719 | - | - | 12,135,719 | 12,135,719 | |||||||||||||||
|
Liabilities
|
||||||||||||||||||||
|
Bank and other loans payable
|
$ | (18,231,128 | ) | $ | - | $ | - | $ | (18,231,128 | ) | $ | (18,231,128 | ) | |||||||
The methods, assumptions and significant valuation techniques and inputs used to estimate the fair value of financial instruments are summarized as follows:
Mortgage Loans on Real Estate
: The estimated fair value of the Company’s mortgage loans is determined using various methods. The Company’s mortgage loans are grouped into three categories: Residential, Residential Construction and Commercial. When estimating the expected future cash flows, it is assumed that all loans will be held to maturity, and any loans that are non-performing are evaluated individually for impairment.
Residential – The estimated fair value of mortgage loans originated prior to 2013 is determined by estimating expected future cash flows of interest payments and discounting them using current interest rates from single family mortgages. The estimated fair value of mortgage loans originated in 2013 and 2014 is determined from pricing of similar loans that were sold in 2013 and 2014.
Residential Construction – These loans are primarily short in maturity (4-6 months) accordingly, the estimated fair value is determined to be the net book value.
Commercial – The estimated fair value is determined by estimating expected future cash flows of interest payments and discounting them using current interest rates for commercial mortgages.
Policy and Other Loans
: The carrying amounts reported in the accompanying consolidated balance sheet for these financial instruments approximate their fair values.
Short-Term Investments
: The carrying amounts reported in the accompanying consolidated balance sheet for these financial instruments approximate their fair values.
Bank and Other Loans Payable
: The carrying amounts reported in the accompanying consolidated balance sheet for these financial instruments approximate their fair values.
101
SECURITY NATIONAL FINANCIAL CORPORATION
AND SUBSIDIARIES
Notes to Consolidated Financial Statements
Years Ended December 31, 2014, 2013 and 2012
17)
Accumulated Other Comprehensive Income
The following summarizes the changes in accumulated other comprehensive income:
|
December 31
|
||||||||
|
2014
|
2013
|
|||||||
|
Unrealized losses on available for-sale securities
|
$ | (390,143 | ) | $ | (12,299 | ) | ||
|
Reclassification adjustment for net realized gains in net
income
|
293,985 | 538,311 | ||||||
|
Net unrealized gains (losses) before taxes
|
(96,158 | ) | 526,012 | |||||
|
Tax (expense) benefit
|
30,310 | (221,221 | ) | |||||
|
Net
|
(65,848 | ) | 304,791 | |||||
|
Potential unrealized gains for derivative bank loans
(interest rate swaps) before taxes
|
26,940 | 35,262 | ||||||
|
Tax expense
|
(10,507 | ) | (9,073 | ) | ||||
|
Net
|
16,433 | 26,189 | ||||||
|
Potential unrealized gains (losses) for derivative mortgage
loans before taxes
|
441,943 | (1,473,557 | ) | |||||
|
Tax (expense) benefit
|
(172,358 | ) | 426,614 | |||||
|
Net
|
269,585 | (1,046,943 | ) | |||||
|
Other comprehensive income (loss) changes
|
$ | 220,170 | $ | (715,963 | ) | |||
The following is the accumulated balances of other comprehensive income as of December 31, 2014:
|
Beginning
Balance
December 31,
2013
|
Change for
the period
|
Ending
Balance
December 31,
2014
|
||||||||||
|
Unrealized net gains on available-for-sale
securities and trust investments
|
$ | 346,341 | $ | (65,848 | ) | $ | 280,493 | |||||
|
Unrealized gains (losses) on derivative mortgage
loans
|
907,624 | 269,585 | 1,177,209 | |||||||||
|
Unrealized gains (losses) on derivative
bank loan interest rate swaps
|
(35,569 | ) | 16,433 | (19,136 | ) | |||||||
|
Other comprehensive income
|
$ | 1,218,396 | $ | 220,170 | $ | 1,438,566 | ||||||
The following is the accumulated balances of other comprehensive income as of December 31, 2013:
|
Beginning
Balance
December 31,
2012
|
Change for
the period
|
Ending
Balance
December 31,
2013
|
||||||||||
|
Unrealized net gains on available-for-sale
securities and trust investments
|
$ | 41,550 | $ | 304,791 | $ | 346,341 | ||||||
|
Unrealized gains (losses) on derivative mortgage
loans
|
1,954,567 | (1,046,943 | ) | 907,624 | ||||||||
|
Unrealized gains (losses) on derivative
bank loan interest rate swaps
|
(61,758 | ) | 26,189 | (35,569 | ) | |||||||
|
Other comprehensive income
|
$ | 1,934,359 | $ | (715,963 | ) | $ | 1,218,396 | |||||
102
SECURITY NATIONAL FINANCIAL CORPORATION
AND SUBSIDIARIES
Notes to Consolidated Financial Statements
Years Ended December 31, 2014, 2013 and 2012
18)
Derivative Commitments
The Company has adopted a strategy of selling “out of the money” call options on its available for sale equity securities as a source of revenue. The options give the purchaser the right to buy from the Company specified equity securities at a set price up to a pre-determined date in the future. The Company has adopted the selling of put options as a means of generating cash or purchasing equity securities at lower than current market prices. The Company receives an immediate payment of cash for the value of the option and establishes a liability for the market value of the option. The liability for options is adjusted to market value at each reporting date. The market value of outstanding options as of December 31, 2014 and December 31, 2013 was $127,903 and $124,174, respectively. In the event a call option is exercised, the Company recognizes a gain on the sale of the equity security and a gain from the sale of the option. If the option expires unexercised, the Company recognizes a gain from the sale of the option.
The following table shows the fair value of derivatives as of December 31, 2014 and December 31, 2013.
|
Fair Value of Derivative Instruments
|
||||||||||||||||||||
|
Asset Derivatives
|
Liability Derivatives
|
|||||||||||||||||||
|
December 31, 2014
|
December 31, 2013
|
December 31, 2014
|
December 31, 2013
|
|||||||||||||||||
|
Balance Sheet
Location
|
Fair Value
|
Balance Sheet Location
|
Fair Value
|
Balance Sheet
Location
|
Fair Value
|
Balance Sheet
Location
|
Fair Value
|
|||||||||||||
|
Derivatives designated as hedging instruments:
|
||||||||||||||||||||
|
Interest rate lock and forward sales commitments
|
other assets
|
$ | 2,111,529 |
other assets
|
$ | 1,511,111 |
Other liabilities
|
$ | 181,678 |
Other liabilities
|
$ | 23,203 | ||||||||
|
Call Options
|
- | - |
Other liabilities
|
116,036 |
Other liabilities
|
124,174 | ||||||||||||||
|
Put Options
|
- | - |
Other liabilities
|
11,867 |
Other liabilities
|
- | ||||||||||||||
|
Interest rate swaps
|
- | - |
Bank loans payable
|
31,370 |
Bank loans payable
|
58,310 | ||||||||||||||
|
Total
|
$ | 2,111,529 | $ | 1,511,111 | $ | 340,951 | $ | 205,687 | ||||||||||||
The following table shows the gain (loss) on derivatives for the periods presented. There were no gains or losses reclassified from accumulated other comprehensive income (OCI) into income or gains or losses recognized in income on derivatives ineffective portion or any amounts excluded from effective testing.
|
Net Amount Gain (Loss) Recognized in OCI
|
||||||||
|
Years ended December 31
|
||||||||
|
Derivative - Cash Flow Hedging Relationships:
|
2014
|
2013
|
||||||
|
Interest Rate Lock Commitments
|
$ | 441,943 | $ | (1,473,557 | ) | |||
|
Interest Rate Swaps
|
26,940 | 35,262 | ||||||
|
Sub Total
|
468,883 | (1,438,295 | ) | |||||
|
Tax Effect
|
182,865 | (417,541 | ) | |||||
|
Total
|
$ | 286,018 | $ | (1,020,754 | ) | |||
103
SECURITY NATIONAL FINANCIAL CORPORATION
AND SUBSIDIARIES
Notes to Consolidated Financial Statements
Years Ended December 31, 2014, 2013 and 2012
19)
Acquisitions
Acquisition of American Funeral Financial
On June 4, 2014, the Company, through its wholly owned subsidiary, SNFC Subsidiary, LLC (“SNFC Subsidiary”), completed a purchase transaction with American Funeral Financial, LLC, a South Carolina limited liability company (“American Funeral Financial”) and Hypershop, LLC, a North Carolina limited liability company (“Hypershop”), the sole owner of all the limited liability company interests of American Funeral Financial, to purchase all of the outstanding limited liability company interests, or membership units, of American Funeral Financial. American Funeral Financial is engaged in the operation of a factoring business with the principal purpose of providing funding for funeral homes and mortuaries.
Under the terms of the transaction, as set forth in the Unit Purchase Agreement dated June 4, 2014 (the “Purchase Agreement”), among the Company, SNFC Subsidiary, American Funeral Financial and Hypershop, the Company paid Hypershop purchase consideration equal to (i) $3,000,000 in cash, of which $175,000 was deposited into an interest bearing escrow account to be held for a period of twelve months from the closing date to pay off the indebtedness and other liabilities of American Funeral Financial, plus (ii) $12,011,183, representing the amount of the good standing receivables of American Funeral Financial, plus (iii) earn-out payments equal to .0042 of the aggregate amount of life insurance assignments funded by American Funeral Financial during the three year period following the closing date of the transaction. This earn-out liability was estimated to be $1,368,000. The purchase consideration was to be used to pay off the indebtedness that American Funeral Financial owed to Security Finance Corporation of Spartanburg, as well as to pay off all other indebtedness and liabilities of American Funeral Financial.
The estimated fair values of
the assets acquired and the liabilities assumed
at the date of
acquisition were as follows:
|
Other loans, net
|
$ | 11,866,193 | ||
|
Property and equipment
|
760,120 | |||
|
Goodwill
|
2,373,722 | |||
|
Other
|
1,379,158 | |||
|
Total assets acquired
|
16,379,193 | |||
|
Other liabilities and accrued expenses
|
(1,368,000 | ) | ||
|
Total liabilities assumed
|
(1,368,000 | ) | ||
|
Fair value of net assets acquired
|
$ | 15,011,193 |
The estimated fair value of the acquisition is based on market assumptions of the future value of the business acquired, the collectability of receivables, the current value of equipment purchased and the useful life of proprietary software. Based on the unobservable nature of certain of these assumptions, the valuation is considered Level 3 under the fair value hierarchy.
The following unaudited pro forma information has been prepared to present the results of operations of the Company assuming the acquisition of American Funeral Financial had occurred at the beginning of the years ended December 31, 2014, 2013 and 2012, respectively. This pro forma information is supplemental and does not necessarily present the operations of the Company that would have occurred had the acquisition occurred on those dates and may not reflect the operations that will occur in the future:
104
SECURITY NATIONAL FINANCIAL CORPORATION
AND SUBSIDIARIES
Notes to Consolidated Financial Statements
Years Ended December 31, 2014, 2013 and 2012
19)
Acquisitions
(Continued)
|
For the Year Ended December 31 (unaudited)
|
||||||||||||
|
2014
|
2013
|
2012
|
||||||||||
|
Total revenues
|
$ | 229,268,653 | $ | 220,011,370 | $ | 236,854,910 | ||||||
|
Net earnings
|
$ | 7,996,405 | $ | 7,963,589 | $ | 16,576,647 | ||||||
|
Net earnings per Class A equivalent common share
|
$ | 0.64 | $ | 0.64 | $ | 1.45 | ||||||
|
Net earnings per Class A equivalent common share
|
||||||||||||
|
assuming dilution
|
$ | 0.62 | $ | 0.61 | $ | 1.38 | ||||||
20)
Mortgage Servicing Rights
The following table presents the MSR activity for 2014 and 2013.
|
December 31
2013
|
||||||||
|
2014
|
2013
|
|||||||
|
Amortized cost:
|
||||||||
|
Balance before valuation allowance at beginning of year
|
$ | 4,844,101 | $ | 2,797,470 | ||||
|
MSRs received as proceeds from loan sales
|
3,741,381 | 2,494,254 | ||||||
|
Amortization
|
(750,735 | ) | (447,623 | ) | ||||
|
Application of valuation allowance to write down MSRs
with other than temporary impairment
|
- | - | ||||||
|
Balance before valuation allowance at year end
|
$ | 7,834,747 | $ | 4,844,101 | ||||
|
Valuation allowance for impairment of MSRs:
|
||||||||
|
Balance at beginning of year
|
$ | - | $ | - | ||||
|
Additions
|
- | - | ||||||
|
Application of valuation allowance to write down MSRs
with other than temporary impairment
|
- | - | ||||||
|
Balance at year end
|
$ | - | $ | - | ||||
|
Mortgage servicing rights, net
|
$ | 7,834,747 | $ | 4,844,101 | ||||
|
Estimated fair value of MSRs at year end
|
$ | 8,485,570 | $ | 5,491,270 | ||||
105
SECURITY NATIONAL FINANCIAL CORPORATION
AND SUBSIDIARIES
Notes to Consolidated Financial Statements
Years Ended December 31, 2014, 2013 and 2012
20)
Mortgage Servicing Rights
(Continued)
The Company reports these MSRs pursuant to the accounting policy discussed in Note 1 of the Notes to Consolidated Financial Statements. The following table summarizes the Company’s estimate of future amortization of its existing MSRs carried at amortized cost. This projection was developed using the assumptions made by management in its December 31, 2014 valuation of MSRs. The assumptions underlying the following estimate will change as market conditions and portfolio composition and behavior change, causing both actual and projected amortization levels to change over time. Therefore, the following estimates will change in a manner and amount not presently determinable by management.
|
Estimated
MSR
Amortization
|
||||
|
2015
|
$ | 870,527 | ||
|
2016
|
870,527 | |||
|
2017
|
870,527 | |||
|
2018
|
870,527 | |||
|
2019
|
870,527 | |||
|
Thereafter
|
3,482,112 | |||
|
Total
|
$ | 7,834,747 | ||
106
SECURITY NATIONAL FINANCIAL CORPORATION
AND SUBSIDIARIES
Notes to Consolidated Financial Statements
Years Ended December 31, 2014, 2013 and 2012
21)
Quarterly Financial Data (Unaudited)
|
2014
|
||||||||||||||||
|
Three Months Ended
|
||||||||||||||||
|
March 31
|
June 30
|
September 30
|
December 31
|
|||||||||||||
|
Revenues
|
$ | 45,053,276 | $ | 59,411,730 | $ | 61,725,792 | $ | 60,745,876 | ||||||||
|
Benefits and expenses
|
44,887,289 | 55,224,633 | 58,348,652 | 55,995,147 | ||||||||||||
|
Earnings before income taxes
|
165,987 | 4,187,097 | 3,377,140 | 4,750,729 | ||||||||||||
|
Income tax expense
|
(27,139 | ) | (1,563,034 | ) | (1,239,318 | ) | (1,896,814 | ) | ||||||||
|
Net earnings
|
138,848 | 2,624,063 | 2,137,822 | 2,853,915 | ||||||||||||
|
Net earnings per common share (1)
|
$ | 0.01 | $ | 0.21 | $ | 0.17 | $ | 0.23 | ||||||||
|
Net earnings per common share
assuming dilution (1)
|
$ | 0.01 | $ | 0.20 | $ | 0.17 | $ | 0.22 | ||||||||
|
2013
|
||||||||||||||||
|
Three Months Ended
|
||||||||||||||||
|
March 31
|
June 30
|
September 30
|
December 31
|
|||||||||||||
|
Revenues
|
$ | 54,852,234 | $ | 61,332,289 | $ | 50,552,791 | $ | 48,577,706 | ||||||||
|
Benefits and expenses
|
51,624,611 | 56,862,769 | 48,588,507 | 48,415,406 | ||||||||||||
|
Earnings before income taxes
|
3,227,623 | 4,469,520 | 1,964,284 | 162,300 | ||||||||||||
|
Income tax benefit (expense)
|
(1,194,357 | ) | (1,670,275 | ) | (697,793 | ) | 1,324,619 | |||||||||
|
Net earnings
|
2,033,266 | 2,799,245 | 1,266,491 | 1,486,919 | ||||||||||||
|
Net earnings per common share (1)
|
$ | 0.17 | $ | 0.23 | $ | 0.10 | $ | 0.12 | ||||||||
|
Net earnings per common share
assuming dilution (1)
|
$ | 0.15 | $ | 0.21 | $ | 0.10 | $ | 0.11 | ||||||||
|
2012
|
||||||||||||||||
|
Three Months Ended
|
||||||||||||||||
|
March 31
|
June 30
|
September 30
|
December 31
|
|||||||||||||
|
Revenues
|
$ | 47,323,223 | $ | 56,528,210 | $ | 63,747,903 | $ | 66,660,833 | ||||||||
|
Benefits and expenses
|
44,994,631 | 51,491,833 | 57,615,608 | 58,806,804 | ||||||||||||
|
Earnings before income taxes
|
2,328,592 | 5,036,377 | 6,132,295 | 7,854,029 | ||||||||||||
|
Income tax expense
|
(666,409 | ) | (1,443,345 | ) | (2,142,249 | ) | (386,772 | ) | ||||||||
|
Net earnings
|
1,662,183 | 3,593,032 | 3,990,046 | 7,467,257 | ||||||||||||
|
Net earnings per common share (1)
|
$ | 0.16 | $ | 0.34 | $ | 0.37 | $ | 0.67 | ||||||||
|
Net earnings per common share
assuming dilution (1)
|
$ | 0.15 | $ | 0.32 | $ | 0.34 | $ | 0.61 | ||||||||
(1) Earnings per share amounts have been adjusted retroactively for the effect of annual stock dividends.
107
None
Under the supervision and with the participation of the Company’s management, including the Chief Executive Officer and Chief Financial Officer, the Company has evaluated the effectiveness of its disclosure controls and procedures as required by Exchange Act Rule 13a-15(b) as of the end of the period covered by this report. Based on that evaluation, the Chief Executive Officer and Chief Financial Officer have concluded that these disclosure controls and procedures are effective.
(a) Management’s annual report on internal control over financial reporting.
Management is responsible for establishing and maintaining adequate internal control over financial reporting. The Company's internal control over financial reporting is a process that is designed to provide reasonable assurance regarding the reliability of financial reporting and the preparation of financial statements for external purposes in accordance with generally accepted accounting principles, and includes those policies and procedures that:
|
·
|
Pertain to the maintenance of records that, in reasonable detail, accurately and fairly reflect the transactions and dispositions of assets of the Company,
|
|
·
|
Provide reasonable assurance that transactions are recorded as necessary to permit preparation of financial statements in accordance with generally accepted accounting principles, and that receipts and expenditures are being made only in accordance with authorizations of management and the Board of Directors of the Company, and
|
|
·
|
Provide reasonable assurance regarding prevention or timely detection of unauthorized acquisition, use, or disposition of the Company's assets that could have a material effect on the financial statements.
|
Because of its inherent limitations, internal control over financial reporting may not prevent or detect misstatements. Also, projections of any evaluation of effectiveness to future periods are subject to the risk that controls may become inadequate because of changes in conditions, or that the degree of compliance with the policies and procedures may deteriorate.
Management performed an assessment of the effectiveness of the Company's internal control over financial reporting as of December 31, 2014 based on the framework in
Internal Control-Integrated Framework
issued by the Committee of Sponsoring Organizations of the Treadway Commission in 1992. The objective of this assessment was to determine whether the Company's internal control over financial reporting was effective as of December 31, 2014. Based on that assessment the Company believes that, at December 31, 2014, its internal control over financial reporting was effective.
This annual report on internal control over financial reporting does not include an attestation report of the Company’s registered public accounting firm regarding internal control over financial reporting. Management’s report was not subject to attestation by the Company’s registered public accounting firm pursuant to rules of the Securities Exchange Commission that permit the Company to provide only management’s report in this annual report.
(b) Changes in internal control over financial reporting.
There was no change in our internal control over financial reporting that occurred in the fourth quarter of 2014 that has materially affected, or is reasonably likely to materially affect, our internal control over financial reporting.
Approval of Reverse Stock Split and Weighted Voting of Class C Common Stock
On July 2, 2014, the stockholders approved a 1-for-10 reverse stock split of the Company’s Class C common stock at the Annual Meeting of Stockholders. Concurrently with the approval of the reverse stock split, the stockholders also approved amendments to Article V of the Company’s Articles of Incorporation to provide that each share of Class C common stock will have weighted voting of ten votes per share and that each share of Class C common stock may be converted into one share of Class A common stock. The Board of Directors had previously approved the reverse stock split and weighted voting of Class C common stock. Prior to the approval of the reverse stock split and weighted voting of Class C shares, the Company’s Articles of Incorporation provided that each share of Class C common stock had one vote per share and that Class C common shares were convertible into Class A common shares at a conversion ratio of ten shares of Class C common stock for one share of Class A common stock.
108
The Board of Directors believes the 1-for-10 reverse stock split and the weighted voting of the shares of Class C common stock are in the Company’s best interest. The Company’s per share net income or loss and net book value have often been misreported and understated by the financial community due to a misunderstanding of the conversion and other rights of the Company’s Class C common stock. As a result, the Company’s per share net income or loss and net book value have often been understated because the financial community would often convert Class C common shares to Class A common shares at a one-to-one conversion ratio rather than a ten-to-one ratio when reporting per share net income or loss and net book value. The Company believes that the amendments to the Articles of Incorporation, which were approved by the Board of Directors and stockholders of the Company, will help correct this problem.
The reverse stock split and weighted voting of the Company's Class C common stock became effective on August 1, 2014, when the Articles of Restatement and Amendment to the Company's Articles of Incorporation were filed with the Utah Division of Corporations and Commercial Code. The reverse stock split will affect all of the holders of the Company's Class C common stock uniformly but will not affect any Class C stockholder's percentage ownership interest in the Company or proportionate voting power, except for insignificant changes that will result from the rounding up of fractional shares. Additionally, the reverse stock split will not impact the existing shares of Class A common stock.
109
The Company’s Board of Directors consists of nine persons, five of whom are not employees of the Company. There are no family relationships between or among any of the directors and executive officers, except that Scott M. Quist and Christie Q. Overbaugh are brother and sister, Jason G. Overbaugh is the son of Ms. Christie Q. Overbaugh, and S. Andrew Quist is the son of Scott M. Quist. The following table sets forth certain information with respect to the directors and executive officers of the Company.
|
Name
|
Age
|
Position with the Company
|
||
| Scott M. Quist | 61 | Chairman of the Board, President, Chief Executive Officer and Director | ||
|
Garrett S. Sill
|
44
|
Chief Financial Officer and Treasurer
|
||
|
J. Lynn Beckstead, Jr.
|
61
|
Vice President Mortgage Operations and Director
|
||
|
Christie Q. Overbaugh
|
66
|
Senior Vice President of Internal Operations
|
||
| Jason G. Overbaugh | 40 | Vice President, Assistant Secretary, National Marketing Director of Life Insurance and Director | ||
|
Jeffrey R. Stephens
|
61
|
General Counsel and Corporate Secretary
|
||
|
S. Andrew Quist
|
34
|
Vice President, Associate General Counsel and Director
|
||
|
John L. Cook
|
60
|
Director
|
||
|
Gilbert A. Fuller
|
74
|
Director
|
||
|
Robert G. Hunter
|
55
|
Director
|
||
|
H. Craig Moody
|
63
|
Director
|
||
|
Norman G. Wilbur
|
76
|
Director
|
Directors
The following is a description of the business experience of each of the Company’s directors.
Scott M. Quist
has served as Chairman of the Board and Chief Executive Officer of the Company since September 2012. Mr. Quist also serves as the Company’s President, a position he has held since 2002. He has also served as a director of the Company since 1986. Mr. Quist served as First Vice President of the Company from 1986 to 2002. From 1980 to 1982, Mr. Quist was a tax specialist with Peat, Marwick, Mitchell, & Co., in Dallas, Texas. From 1986 to 1991, he was Treasurer and a director of The National Association of Life Companies, a trade association of 642 insurance companies until its merger with the American Council of Life Companies. Mr. Quist has been a member of the Board of Governors of the Forum 500 Section (representing small insurance companies) of the American Council of Life Insurance. He has also served as a regional director of Key Bank of Utah since November 1993. Mr. Quist is currently a director and a past president of the National Alliance of Life Companies, a trade association of over 200 life companies. Mr. Quist holds a B.S. degree in Accounting from Brigham Young University and also received his law degree from Brigham Young University. Mr. Quist’s significant expertise and deep understanding of the technical, organizational and strategic business aspects of the insurance industry, his management expertise, his thirteen year tenure as President of the Company and 28 year tenure as a director, and his years of business and leadership experience led the Board of Directors to conclude that he should be appointed as Chairman of the Board and Chief Executive Officer of the Company.
J. Lynn Beckstead, Jr.
has served as Vice President of Mortgage Operations and a director of the Company since 2002. In addition, Mr. Beckstead is President of SecurityNational Mortgage, a wholly owned subsidiary of the Company, having served in this position since 1993. From 1990 to 1993, Mr. Beckstead was Vice President and a director of Republic Mortgage Corporation. From 1983 to 1990, Mr. Beckstead was Vice President and a director of Richards Woodbury Mortgage Corporation. From 1980 to 1983, he was a principal broker for Boardwalk Properties. From 1978 to 1980, Mr. Beckstead was a residential loan officer for Medallion Mortgage Company. From 1977 to 1978, he was a residential construction loan manager for Citizens Bank. Mr. Beckstead’s expertise in real estate, his 21 year tenure serving as President of SecurityNational Mortgage Company, and his business and leadership experience led the Board of Directors to conclude that he should serve as a director.
110
Jason G. Overbaugh
has served as Vice President and Assistant Secretary of the Company since 2002. He has also served as a director of the Company since July 2013. Mr. Overbaugh has additionally served as a Vice President and National Marketing Director of Security National Life Insurance Company, a wholly owned subsidiary of the Company, since 2006. From 2003 to 2006, he served as a Vice President of Security National Life Insurance Company with responsibilities as an investment manager over construction lending and commercial real estate investments. From 2000 to 2003, he served as a Vice President of Memorial Estates, Inc., a wholly owned subsidiary of the Company, with responsibilities over operations and sales. In addition, Mr. Overbaugh has served since 2007 as a director of the LOMA Life Insurance Council, a trade association of life insurance companies. He is also a member of the NFDA Trade Association. Mr. Overbaugh received a B.S. degree in Finance from the University of Utah. Mr. Overbaugh’s expertise in insurance and marketing, and his 18 years of experience with the Company in its insurance, real estate, and mortuary and cemetery operations, led the Board of Directors to conclude that he should serve as a director.
S. Andrew Quist
has served as Vice President of the Company since 2010. He has also served as a director of the Company since July 2013. Mr. Quist has additionally served as the Company’s Associate General Counsel since 2007, where his responsibilities have included the Company’s regulatory matters and acquisitions. In addition, Mr. Quist has been Vice President and Chief Operating Officer since 2010, and Vice President from 2008 to 2010, of C&J Financial, LLC, a wholly owned subsidiary of the Company, which funds the purchase of funeral and burial policies from funeral homes after the death of the insureds. Mr. Quist has also served since 2013 as a director of the National Alliance of Life Companies (NALC), a national trade association of over 200 life insurance companies, where he also serves as Vice President and Treasurer. Mr. Quist further serves as President of the Utah Life Convention, a consortium of Utah domestic life insurers. Mr. Quist holds a B.S. degree in Accounting from Brigham Young University and received his law degree from the University of Southern California. Mr. Quist’s expertise in insurance, legal, and regulatory matters led the Board of Directors to conclude that he should serve as a director.
John L. Cook
has served as a director of the Company since December 2013. Mr. Cook has served since 1982 as co-owner and operator of Cook Brothers Painting, Inc., a painting company that provides painting services for contractors and builders of residential and commercial properties. In addition, Mr. Cook attended the University of Utah. Mr. Cook’s years of experience with the construction industry and construction projects led the Board of Directors to conclude that Mr. Cook should serve as a director. As a director Mr. Cook advises the Board regarding the Company’s investments in commercial and residential real estate projects, including Dry Creek at East Village, a 282 unit multifamily development in Sandy City, Utah. Moreover, Mr. Cook’s extensive background in construction and building is important as the Company continues to acquire new real estate holdings and develop its current portfolio of undeveloped land into future developments that could provide additional long term revenues for the Company.
Gilbert A. Fuller
has served as a director of the Company since December 2012. From 2006 until his retirement in 2008, Mr. Fuller served as Executive Vice President, Chief Financial Officer and Secretary of USANA Health Sciences, Inc., a multinational manufacturer and direct seller of nutritional supplements. Mr. Fuller joined USANA in 1996 as the Vice President of Finance and served in that role until 1999 when he was appointed as its Senior Vice President. Mr. Fuller has served as a member of the Board of Directors of USANA since 2008. Before joining USANA, Mr. Fuller served in various executive positions for several different companies. Mr. Fuller served as Chief Administrative Officer and Treasurer of Melaleuca, Inc., a manufacturer and direct seller of personal care products. He was also the Vice President and Treasurer of Norton Company, a multinational manufacturer of ceramics and abrasives. Mr. Fuller obtained his certified public accountant license in 1970 and kept it current until his career path developed into corporate finance. Mr. Fuller received a B.S. degree in Accounting and an M.B.A. degree from the University of Utah. Mr. Fuller’s accounting, finance and corporate strategy expertise and his years of financial, accounting and business experience in public and private companies, including USANA Health Sciences, Inc., which is listed on the New York Stock Exchange, where he served as an executive officer and continues to serve as a director, led the Board of Directors to conclude that he should serve as a director.
111
Robert G. Hunter, M.D.
has served as a director of the Company since 1998. Dr. Hunter is currently a practicing physician in private practice. Dr. Hunter created the statewide E.N.T. Organization (Rocky Mountain E.N.T., Inc.) where he is currently a member of the Executive Committee. Dr. Hunter is Department Head of Otolaryngology, Head and Neck Surgery at Intermountain Medical Center and a past President of the medical staff of the Intermountain Medical Center. He is also a delegate to the Utah Medical Association and has served as a delegate representing the State of Utah to the American Medical Association, and a member of several medical advisory boards. Dr. Hunter holds a B.S. degree in Microbiology from the University of Utah and received his medical degree from the University of Utah College of Medicine. Dr. Hunter’s medical expertise and experience, and his administrative and leadership experience from serving in a number of administrative positions in the medical profession led the Board of Directors to conclude that he should serve as a director.
H. Craig Moody
has served as a director of the Company since 1995. Mr. Moody is owner of Moody & Associates, a political consulting and real estate company. He is a former Speaker and House Majority Leader of the House of Representatives of the State of Utah. Mr. Moody holds a B.S. degree in Political Science from the University of Utah. Mr. Moody’s real estate and governmental affairs expertise and years of business and leadership experience led the Board of Directors to conclude that he should serve as a director.
Norman G. Wilbur
has served as a director of the Company since 1998. Mr. Wilbur worked for J.C. Penny's regional offices in budget and analysis. His final position was Manager of Planning and Reporting for J.C. Penny's stores. After 36 years with J.C. Penny's, Mr. Wilbur opted for early retirement in 1997. Mr. Wilbur holds a B.S. degree in Accounting from the University of Utah. Mr. Wilbur is a past executive director of the Dallas area Habitat for Humanity. Mr. Wilbur’s financial expertise and business experience from a successful career at JC Penny’s led the Board of Directors to conclude that he should serve as a director. In addition, the Board of Directors’ determination that Mr. Wilbur is the Audit Committee “financial expert” lends further support to his financial acumen and qualification for serving as a director.
The Board of Directors, Board Committees and Meetings
The Company's Bylaws provide that the Board of Directors shall consist of not less than five or more than twelve members. The term of office of each director is for a period of one year or until the election and qualification of his successor. A director is not required to be a resident of the State of Utah or a stockholder of the Company. The Board of Directors held a total of five meetings during the fiscal year ended December 31, 2014. Each of the directors attended 75% or more of the meetings of the Board of Directors during the 2014 fiscal year.
The size of the Board of Directors of the Company for the coming year is nine members. A majority of the Board of Directors must qualify as "independent" as that term is defined in Rule 4200 of the listing standards of the Nasdaq Stock Market. The Board of Directors has affirmatively determined that five of the nine members of the Board of Directors, Messrs. John L. Cook, Gilbert A. Fuller, Robert G. Hunter, M.D., H. Craig Moody and Norman G. Wilbur, are independent under the listing standards of the Nasdaq Stock Market.
There are four committees of the Board of Directors, which meet periodically during the year: the Audit Committee, the Compensation Committee, the Executive Committee, and the Nominating and Corporate Governance Committee.
The Audit Committee directs the auditing activities of the Company's internal auditors and outside public accounting firm and approves the services of the outside public accounting firm. The Audit Committee consists of Messrs. Gilbert A. Fuller, H. Craig Moody and Norman G. Wilbur (Chairman of the committee). During 2014, the Audit Committee met on three occasions.
The Compensation Committee is responsible for recommending to the Board of Directors for approval the annual compensation of each executive officer of the Company and the executive officers of the Company's subsidiaries, developing policy in the areas of compensation and fringe benefits, contributions under the Employee Stock Ownership Plan, contributions under the 401(k) Retirement Savings Plans, Deferred Compensation Plan, granting of options under the stock option plans, and creating other employee compensation plans. The Compensation Committee consists of Messrs. Gilbert A. Fuller, Robert G. Hunter, M.D., H. Craig Moody and Norman G. Wilbur (Chairman of the committee). During 2014, the Compensation Committee met on three occasions.
The Executive Committee reviews Company policy, major investment activities and other pertinent transactions of the Company. The Executive Committee consists of Messrs. Gilbert A. Fuller, H. Craig Moody, S. Andrew Quist and Scott M. Quist (Chairman of the committee). During 2014, the Executive Committee met on one occasion.
112
The Nominating and Corporate Governance Committee identifies individuals qualified to become board members consistent with criteria approved by the board, recommends to the board the persons to be nominated by the board for election as directors at a meeting of stockholders, and develops and recommends to the board a set of corporate governance principles. The Nominating and Corporate Governance Committee consists of Messrs. John L. Cook, Gilbert A. Fuller, Robert G. Hunter, M.D., H. Craig Moody (Chairman of the committee), and Norman G. Wilbur. The Nominating and Corporate Governance Committee is composed solely of independent directors, as defined in the listing standards of the Nasdaq Stock Market. During 2014, the Nominating and Corporate Governance Committee met on three occasions.
Director Nominating Process
The process for identifying and evaluating nominees for directors include the following steps: (1) the Nominating and Corporate Governance Committee, Chairman of the Board or other board members identify a need to fill vacancies or add newly created directorships; (2) the Chairman of the Nominating and Corporate Governance Committee initiates a search and seeks input from board members and senior management and, if necessary, obtains advice from legal or other advisors (but does not hire an outside search firm); (3) director candidates, including any candidates properly proposed by stockholders in accordance with the Company's Bylaws, are identified and presented to the Nominating and Corporate Governance Committee; (4) initial interviews with candidates are conducted by the Chairman of the Nominating and Corporate Governance Committee; (5) the Nominating and Corporate Governance Committee meets to consider and approve final candidate(s) and conduct further interviews as necessary; and (6) the Nominating and Corporate Governance Committee makes recommendations to the board for inclusion in the slate of directors at the annual meeting. The evaluation process will be the same whether the nominee is recommended by a stockholder or by a member of the Board of Directors.
Meetings of Non-Management Directors
The Company's independent directors meet regularly in executive session without management. The Board of Directors has designated a lead director to preside at executive sessions of independent directors. Mr. H. Craig Moody is currently the lead director.
Executive Officers
Garrett S. Sill
has served as Chief Financial Officer and Treasurer since July 2013. From January 2013 to July 2013, Mr. Sill served as Acting Chief Financial Officer and Acting Treasurer. From 2011 to January 2013, Mr. Sill served as Vice President and Assistant Treasurer of Security National Life Insurance Company, a wholly owned subsidiary of the Company. From 2002 to 2011, Mr. Sill was Chief Financial Officer and Treasurer of SecurityNational Mortgage Company, a wholly owned subsidiary of the Company. From 1997 to 2002, Mr. Sill was Vice President and Controller of SecurityNational Mortgage Company. Mr. Sill is a certified public accountant, having been licensed since 2002. He holds a B.A. degree in Accounting from Weber State University and an M.B.A. degree in Business Administration from the University of Utah. Mr. Sill also serves as a member of the Advisory Council of the School of Accounting and Taxation at Weber State University.
Christie Q. Overbaugh
has been Senior Vice President of Internal Operations of the Company since June 2006, and a Vice President of the Company from 1998 to June 2006. Ms. Overbaugh has also served as Vice President of Underwriting for Security National Life Insurance Company since 1998. From 1986 to 1991, she was Chief Underwriter for Investors Equity Life Insurance Company of Hawaii and Security National Life Insurance Company. From 1990 to 1991, Ms. Overbaugh was President of the Utah Home Office Underwriters Association. Ms. Overbaugh is currently a member of the Utah Home Office Underwriters Association and an Associate Member of LOMA (Life Office Management Association).
Jeffrey R. Stephens
was appointed General Counsel and Corporate Secretary of the Company in December 2008. Mr. Stephens had served as General Counsel for the Company from November 2006 to December 2008. He was in private practice from 1981 to 2006 in the states of Washington and Utah. Mr. Stephens holds a B.S. degree in Geography from the University of Utah and received his law degree from Brigham Young University. He is a member of the Utah State Bar and the Washington State Bar Association.
The Board of Directors of the Company has a written procedure, which requires disclosure to the board of any material interest or any affiliation on the part of any of its officers, directors or employees that is in conflict or may be in conflict with the Company’s interests.
All directors of the Company hold office until the next Annual Meeting of Stockholders and until their successors have been elected and qualified.
113
Corporate Governance
Corporate Governance Guidelines
. The Board of Directors has adopted the Security National Financial Corporation Corporate Governance Guidelines. These guidelines outline the functions of the board, director qualifications and responsibilities, and various processes and procedures designed to insure effective and responsive governance. The Board of Directors has also adopted a written committee charter for its Audit Committee and Compensation Committee. The guidelines and committee charters are reviewed from time to time in response to regulatory requirements and best practices and are revised accordingly. The full text of the guidelines and the committee charters are available on the Company’s website at
www.securitynational.com.
A copy of the Corporate Governance Guidelines may also be obtained at no charge by written request to the attention of Jeffrey R. Stephens, Secretary, Security National Financial Corporation, 5300 South 360 West, Suite 250, Salt Lake City, Utah 84123.
Code of Business Conduct
. All of the Company’s officers, employees and directors are required to comply with the Company’s Code of Business Conduct and Ethics to help insure that the Company’s business is conducted in accordance with appropriate standards of ethical behavior. The Company’s Code of Business Conduct and Ethics covers all areas of professional conduct, including customer relationships, conflicts of interest, insider trading, financial disclosures, intellectual property and confidential information, as well as requiring adherence to all laws and regulations applicable to the Company’s business. Employees are required to report any violations or suspected violations of the Code. The Code includes an anti-retaliation statement. The full text of the Code of Business Conduct and Ethics is available on the Company’s website at
www.securitynational.com
. A copy of the Code of Business Conduct and Ethics may also be obtained at no charge by written request to the attention of Jeffrey R. Stephens, Secretary, Security National Financial Corporation, 5300 South 360 West, Suite 250, Salt Lake City, Utah 84123.
114
The following table sets forth, for each of the last three fiscal years, the compensation received by the Company’s Chief Executive Officer, the Company’s Chief Financial Officer, and the Company’s three other most highly compensated executive officers who were serving as executive officers at the end of 2014 (collectively, the “Named Executive Officers”).
SUMMARY COMPENSATION TABLE
|
Name and
Principal Position
|
Year
|
Salary
($)
|
Bonus ($)
|
Options
Awards
($)
|
Non-Equity
Incentive
Plan Compen-
sation
($)
|
Change in
Pension Value
Non-qualified
Deferred
Compensation
Earnings (1)
($)
|
All Other
Compen-
sation (2)
($)
|
Total
($)
|
|||||||||||||||||||||
|
Scott M. Quist
Chairman of the Board,
President and Chief
Executive Officer
|
2014
|
$ | 429,400 | $ | 21,200 | -- | -- | -- | $ | 40,066 | $ | 490,666 | |||||||||||||||||
|
2013
|
427,525 | 121,200 | -- | -- | -- | 39,381 | 588,106 | ||||||||||||||||||||||
|
2012
|
384,400 | 193,950 | -- | -- | -- | 41,330 | 619,680 | ||||||||||||||||||||||
|
Garrett S. Sill
Chief Financial
Officer and Treasurer
|
2014
|
$ | 173,903 | $ | 13,250 | -- | -- | -- | $ | 16,180 | $ | 203,333 | |||||||||||||||||
|
2013
|
161,273 | 7,370 | -- | -- | -- | 17,499 | 186,142 | ||||||||||||||||||||||
|
2012
|
143,342 | 12,030 | -- | -- | -- | 19,120 | 174,492 | ||||||||||||||||||||||
|
J. Lynn Beckstead, Jr.
Vice President of Mortgage
Operations
|
2014
|
$ | 267,622 | $ | 81,826 | -- | -- | -- | $ | 30,299 | $ | 379,747 | |||||||||||||||||
|
2013
|
265,997 | 117,277 | -- | -- | -- | 31,098 | 414,372 | ||||||||||||||||||||||
|
2012
|
255,667 | 144,916 | -- | -- | -- | 23,996 | 424,579 | ||||||||||||||||||||||
|
Jeffrey R. Stephens
General Counsel and
Corporate Secretary
|
2014
|
$ | 167,957 | $ | 12,350 | -- | -- | -- | $ | 19,788 | $ | 200,095 | |||||||||||||||||
|
2013
|
164,123 | 8,100 | -- | -- | -- | 17,663 | 189,886 | ||||||||||||||||||||||
|
2012
|
156,833 | 16,850 | -- | -- | -- | 19,926 | 193,609 | ||||||||||||||||||||||
|
S. Andrew Quist
Vice President and Associate
General Counsel
|
2014
|
$ | 166,388 | $ | 54,325 | -- | -- | -- | $ | 21,771 | $ | 242,484 | |||||||||||||||||
|
2013
|
154,186 | 7,725 | -- | -- | -- | 19,889 | 181,800 | ||||||||||||||||||||||
|
2012
|
138,267 | 42,955 | -- | -- | -- | 19,080 | 200,302 | ||||||||||||||||||||||
|
(1)
|
The amounts indicated under “Change in Pension Value and Non-qualified Deferred Compensation Earnings” consist of amounts contributed by the Company into a trust for the benefit of the Named Executive Officers under the Company’s Deferred Compensation Plan.
|
|
(2)
|
The amounts indicated under “All Other Compensation” consist of the following amounts paid by the Company for the benefit of the Named Executive Officers:
|
|
a)
|
payments related to the operation of automobiles were for Scott M. Quist ($7,200 for each of the years 2014, 2013 and 2012); Garrett S. Sill ($-0- for each of the years 2014, 2013 and 2012); J. Lynn Beckstead Jr. ($-0- for each of the years 2014, 2013 and 2012); Jeffrey R. Stephens ($-0- for each of the years 2014, 2013 and 2012) and S. Andrew Quist ($-0- for each of the years 2014, 2013 and 2012). However, such payments do not include the furnishing of an automobile by the Company to Scott M. Quist and J. Lynn Beckstead Jr., nor the payment of insurance and property taxes with respect to the automobiles operated by the such executive officers;
|
|
b)
|
group life insurance premiums paid by the Company to a group life insurance plan for Scott M. Quist and J. Lynn Beckstead Jr. ($191 for 2014, $191 for 2013, and $207 for 2012); Garrett S. Sill ($191 for 2014, $191 for 2013, and $262 for 2012); Jeffrey R. Stephens ($191 for 2014, $191 for 2013, and $207 for 2012) and S. Andrew Quist ($191 for 2014, $191 for 2013, and $202 for 2012);
|
|
c)
|
life insurance premiums paid by the Company for the benefit of Scott M. Quist ($12,390 for 2014, $12,390 for 2013, and $15,016 for 2012); Garrett S. Sill ($-0- for each of the years 2014, 2013 and 2012, respectively); J. Lynn Beckstead Jr. ($4,200 for 2014, $4,200 2013, and $4,500 for 2012); Jeffrey R. Stephens ($-0- for each of the years 2014, 2013 and 2012, respectively); and S. Andrew Quist ($-0- for each of the years 2014, 2013 and 2012, respectively);
|
|
d)
|
medical insurance premiums paid by the Company to a medical insurance plan: Scott M. Quist ($9,625 for 2014, $9,140 for 2013, and $8,644 for 2012); Garrett S. Sill ($7,243 for 2014, $10,302 for 2013, and $12,441 for 2012); J. Lynn Beckstead Jr. ($7,243 for 2014, $10,302 for 2013, and $12,441 for 2012); Jeffrey R. Stephens ($11,725 for 2014, $10,323 for 2013, and $12,510 for 2012); and S. Andrew Quist ($13,850 for 2014, $13,154 for 2013, and $12,441 for 2012);
|
|
e)
|
long term disability insurance paid by the Company to a provider of such insurance; Scott M. Quist, Garrett S. Sill, J. Lynn Beckstead Jr., Jeffrey R. Stephens, and S. Andrew Quist ($260 for 2014, $260 for 2013 and $262 for 2012);
|
|
f)
|
membership dues paid by the Company to Alpine Country Club for the benefit of J. Lynn Beckstead Jr. ($7,605 for 2014, $5,945 for 2013, and $6,586 for 2012);
|
|
g)
|
contributions to defined contribution plans paid by the Company; Scott M. Quist ($10,400 for 2014, $10,200 for 2013, and $10,000 for 2012); Garrett S. Sill ($7,486 for 2014, $6,746 for 2013, and $6,215 for 2012); J. Lynn Beckstead Jr. ($10,400 for 2014, $10,200 for 2013, and $-0- for 2012); Jeffrey R. Stephens ($7,212 for 2014, $6,889 for 2013, and $6,947 for 2012); and S. Andrew Quist ($7,470 for 2014, $6,284 for 2013, and $6,175 for 2012);
|
|
h)
|
contributions to health savings accounts paid by the Company: Scott M. Quist ($-0- for each of the years 2014, 2013 and 2012); Garrett S. Sill ($1,000 for 2014, $1,400 for 2013, and $-0- for 2012); J. Lynn Beckstead Jr. ($400 for 2014, $1,400 for 2013, and $-0- for 2012); Jeffrey R. Stephens ($400 for 2014, $1,400 for 2013, and $-0- for 2012); and S. Andrew Quist ($-0- for each of the years 2014, 2013 and 2012)
|
115
SUPPLEMENTAL ALL OTHER COMPENSATION TABLE
The following table sets forth all other compensation provided the Named Executive Officers for fiscal years 2014, 2013 and 2012.
|
Name of Executive Officer
|
Year
|
Perks and
Other
Personal
Benefits
|
Tax
Reimburse-
ments
|
Discounted
Securities
Purchases
|
Payments/
Accruals on
Termination
Plans
|
Registrant
Contributions
to Defined
Contribution
Plans
|
Insurance
Premiums
|
Dividends or
Earnings on
Stock or
Option
Awards
|
Other (1)
|
||||||||||||||||||||||||
|
Scott M. Quist
|
2014
|
$ | 7,200 | -- | -- | -- | $ | 10,400 | $ | 22,466 | -- | -- | |||||||||||||||||||||
|
2013
|
7,200 | -- | -- | -- | 10,200 | 21,981 | -- | -- | |||||||||||||||||||||||||
|
2012
|
7,200 | -- | -- | -- | 10,000 | 24,130 | -- | -- | |||||||||||||||||||||||||
|
Garrett S. Sill
|
2014
|
$ | - | -- | -- | -- | $ | 7,486 | $ | 8,694 | -- | -- | |||||||||||||||||||||
|
2013
|
- | -- | -- | -- | 6,746 | 10,753 | -- | -- | |||||||||||||||||||||||||
|
2012
|
- | -- | -- | -- | 6,215 | 12,905 | -- | -- | |||||||||||||||||||||||||
|
J. Lynn Beckstead Jr.
|
2014
|
$ | 7,605 | -- | -- | -- | $ | 10,400 | $ | 12,294 | -- | -- | |||||||||||||||||||||
|
2013
|
5,945 | -- | -- | -- | 10,200 | 14,953 | -- | -- | |||||||||||||||||||||||||
|
2012
|
6,586 | -- | -- | -- | - | 17,410 | -- | -- | |||||||||||||||||||||||||
|
Jeffrey R. Stephens
|
2014
|
$ | - | -- | -- | -- | $ | 7,212 | $ | 12,576 | -- | -- | |||||||||||||||||||||
|
2013
|
- | -- | -- | -- | 6,889 | 10,774 | -- | -- | |||||||||||||||||||||||||
|
2012
|
- | -- | -- | -- | 6,947 | 12,979 | -- | -- | |||||||||||||||||||||||||
|
S. Andrew Quist
|
2014
|
$ | - | -- | -- | -- | $ | 7,470 | $ | 14,301 | -- | -- | |||||||||||||||||||||
|
2013
|
- | -- | -- | -- | 6,284 | 13,605 | -- | -- | |||||||||||||||||||||||||
|
2012
|
- | -- | -- | -- | 6,175 | 12,905 | -- | -- | |||||||||||||||||||||||||
116
GRANTS OF PLAN-BASED AWARDS
The following table sets forth certain information regarding options granted to the named Executive Officers during the fiscal year ended December 31, 2014.
|
Estimated Future Payouts Under Equity Incentive Plan Awards
|
|||||||||||||||||||||||||||||||
|
Name of Executive Officer
|
Grant Date
|
Threshold
($)
|
Target
($)
|
Maximum
($)
|
All Other
Awards:
Number of
Securities
Underlying
Options
(#)
|
Exercise or
Base Price
of Option
Awards
($/Sh) (2)
|
Closing
Price on
Grant Date
($/Sh) (2)
|
Grant Date
Fair Value
of Stock
and Option
Awards
($)
|
|||||||||||||||||||||||
|
Scott M. Quist
|
7/2/14
|
-- | -- | -- | 52,500 | (1 | ) | 4.480 | 4.080 | 103,014 | |||||||||||||||||||||
|
Garrett S. Sill
|
7/2/14
|
-- | -- | -- | 4,200 | (1 | ) | 4.080 | 4.080 | 6,161 | |||||||||||||||||||||
|
J. Lynn Beckstead, Jr.
|
7/2/14
|
-- | -- | -- | 1,575 | (1 | ) | 4.080 | 4.080 | 2,309 | |||||||||||||||||||||
|
Jeffrey R. Stephens
|
7/2/14
|
-- | -- | -- | 2,625 | (1 | ) | 4.080 | 4.080 | 3,850 | |||||||||||||||||||||
|
S. Andrew Quist
|
7/2/14
|
-- | -- | -- | 10,500 | (1 | ) | 4.080 | 4.080 | 15,401 | |||||||||||||||||||||
|
Scott M. Quist
|
12/5/14
|
-- | -- | -- | 105,000 | (1 | ) | 5.247 | 4.770 | 162,530 | |||||||||||||||||||||
|
Garrett S. Sill
|
12/5/14
|
-- | -- | -- | 8,400 | (1 | ) | 4.770 | 4.770 | 13,252 | |||||||||||||||||||||
|
J. Lynn Beckstead, Jr.
|
12/5/14
|
-- | -- | -- | 3,150 | (1 | ) | 4.770 | 4.770 | 4,876 | |||||||||||||||||||||
|
Jeffrey R. Stephens
|
12/5/14
|
-- | -- | -- | 5,250 | (1 | ) | 4.770 | 4.770 | 8,127 | |||||||||||||||||||||
|
S. Andrew Quist
|
12/5/14
|
-- | -- | -- | 21,000 | (1 | ) | 4.770 | 4.770 | 32,506 | |||||||||||||||||||||
|
|
(1)
|
The stock options have been adjusted for the 5% annual stock dividend declared December 5, 2014.
|
|
|
(2)
|
Prices have been adjusted for the effect of the 5% annual stock dividend declared December 5, 2014.
|
117
OUTSTANDING EQUITY AWARDS
The following table sets forth information concerning outstanding equity awards held by Named Executive Officers at December 31, 2014.
|
Option Awards
|
Stock Awards
|
|||||||||||||||||||||||||||||||||||||
|
Name of
Executive
Officer
|
Option
Grant Date
|
Number of
Securities Underlying Unexercised
Options
Exercisable (1)
(#)
|
Number of
Securities
Underlying
Unexercised
Options
Unexercisable
(#)
|
Option Exercise Price (11)
($)
|
Option
Expiration
Date
|
Stock
Award
Grant
Date
|
Number of
Shares or
Units of
Stock That
Have Not
Vested
(#)
|
Market Value
of Shares
or Units
of Stock
That Have
Not Vested
($)
|
Equity
Incentive
Plan
Awards:
Number of
Unearned
Shares,
Units or
Other Rights
That Have
Not Vested
(#)
|
Equity
Incentive
Plan Awards: Market or Payout
Value of Unearned Shares,
Units or Other Rights That Have Not
Vested
($)
|
||||||||||||||||||||||||||||
|
Scott M. Quist
|
3/25/05
|
114,023 | (2 | ) | -- | $ | 2.14 |
03/25/15
|
-- | -- | -- | -- | -- | |||||||||||||||||||||||||
|
12/03/10
|
127,629 | (3 | ) | -- | 1.55 |
12/03/15
|
-- | -- | -- | -- | -- | |||||||||||||||||||||||||||
|
12/02/11
|
121,551 | (4 | ) | -- | 1.18 |
12/02/16
|
-- | -- | -- | -- | -- | |||||||||||||||||||||||||||
|
4/13/12
|
115,763 | (5 | ) | -- | 1.45 |
04/13/17
|
-- | -- | -- | -- | -- | |||||||||||||||||||||||||||
|
12/6/13
|
55,125 | (7 | ) | -- | 4.79 |
12/06/18
|
-- | -- | -- | -- | -- | |||||||||||||||||||||||||||
|
7/2/14
|
13,125 | (8 | ) (9) | 39,375 | (9 | ) | 4.48 |
07/02/19
|
||||||||||||||||||||||||||||||
|
12/5/14
|
-- | 105,000 | (10 | ) | 5.25 |
12/05/19
|
||||||||||||||||||||||||||||||||
|
Garrett S. Sill
|
12/6/13
|
4,410 | -- | $ | 4.38 |
12/06/23
|
-- | -- | -- | -- | -- | |||||||||||||||||||||||||||
|
7/2/14
|
1,050 | (9 | ) | 3,150 | (9 | ) | 4.08 |
07/02/24
|
-- | -- | -- | -- | -- | |||||||||||||||||||||||||
|
12/5/14
|
-- | 8,400 | (10 | ) | 4.77 |
12/05/24
|
||||||||||||||||||||||||||||||||
|
J. Lynn Beckstead Jr.
|
12/02/11
|
5,469 | -- | $ | 1.06 |
12/02/21
|
-- | -- | -- | -- | -- | |||||||||||||||||||||||||||
|
4/13/12
|
10,419 | -- | 1.34 |
04/13/22
|
-- | -- | -- | -- | -- | |||||||||||||||||||||||||||||
|
12/6/13
|
1,654 | -- | 4.38 |
12/06/23
|
-- | -- | -- | -- | -- | |||||||||||||||||||||||||||||
|
7/2/14
|
394 | (9 | ) | 1,181 | (9 | ) | 4.08 |
07/02/24
|
||||||||||||||||||||||||||||||
|
12/5/14
|
-- | 3,150 | (10 | ) | 4.77 |
12/05/24
|
||||||||||||||||||||||||||||||||
|
Jeffrey R. Stephens
|
4/13/12
|
2,894 | -- | $ | 1.34 |
04/13/22
|
-- | -- | -- | -- | -- | |||||||||||||||||||||||||||
|
12/6/13
|
2,756 | -- | 4.38 |
12/06/23
|
-- | -- | -- | -- | -- | |||||||||||||||||||||||||||||
|
7/2/14
|
656 | (9 | ) | 1,969 | (9 | ) | 4.08 |
07/02/24
|
||||||||||||||||||||||||||||||
|
12/5/14
|
-- | 5,250 | (10 | ) | 4.77 |
12/05/24
|
||||||||||||||||||||||||||||||||
|
S. Andrew Quist
|
12/2/11
|
18,233 | -- | $ | 1.06 |
12/02/21
|
-- | -- | -- | -- | -- | |||||||||||||||||||||||||||
|
4/13/12
|
17,365 | -- | 1.34 |
04/13/22
|
-- | -- | -- | -- | -- | |||||||||||||||||||||||||||||
|
12/6/13
|
11,025 | -- | 4.38 |
12/06/23
|
-- | -- | -- | -- | -- | |||||||||||||||||||||||||||||
|
7/2/14
|
2,625 | (9 | ) | 7,875 | (9 | ) | 4.08 |
07/02/24
|
||||||||||||||||||||||||||||||
|
12/5/14
|
-- | 21,000 | (10 | ) | 4.77 |
12/05/24
|
||||||||||||||||||||||||||||||||
|
(1)
|
Except for options granted to Scott M. Quist after May 31, 2007, which have a five year term, such grants have ten year terms. The vesting of any unvested shares is subject to the recipient’s continuous employment. This reflects the equivalent of Class A common shares.
|
|
(2)
|
On March 25, 2005, Scott Quist was granted stock options to purchase either 70,000 shares of Class A common stock at an exercise price of $2.14 per share or 70,000 shares of Class C common stock at an exercise price of $2.14 per share, or any combination thereof.
|
|
(3)
|
On December 3, 2010, Scott Quist was granted stock options to purchase 100,000 shares of Class A common stock at an exercise price of $1.55 per share or 100,000 shares of Class C common stock at an exercise price of $1.55 per share, or any combination thereof.
|
|
(4)
|
On December 2, 2011, Scott Quist was granted stock options to purchase 100,000 shares of Class A common stock at an exercise price of $1.18 per share or 100,000 shares of Class C common stock at an exercise price of $1.18 per share, or any combination thereof.
|
|
(5)
|
On April 13, 2012 Scott Quist was granted stock options to purchase 100,000 shares of Class A common stock at an exercise price of $1.45 per share or 100,000 shares of Class C common stock at an exercise price of $1.45 per share, or any combination thereof.
|
|
(6)
|
On December 6, 2013 Scott Quist was granted stock options to purchase 50,000 shares of Class A common stock at an exercise price of $4.79 per share or 50,000 shares of Class C common stock at an exercise price of $4.79 per share, or any combination thereof.
|
|
(7)
|
On July 2, 2014 Scott Quist was granted stock options to purchase 50,000 shares of Class A common stock at an exercise price of $4.48 per share or 50,000 shares of Class C common stock at an exercise price of $4.48 per share, or any combination thereof.
|
|
(8)
|
On December 5, 2014 Scott Quist was granted stock options to purchase 100,000 shares of Class A common stock at an exercise price of $5.25 per share or 100,000 shares of Class C common stock at an exercise price of $5.25 per share, or any combination thereof.
|
|
(9)
|
Stock options vested at the rate of 25% of the total number of shares subject to the options on October 2, 2014 and 25% of the total number of shares on the last day of each three month period thereafter.
|
|
(10)
|
Stock options vest at the rate of 25% of the total number of shares subject to the options on March 5, 2015 and 25% of the total number of shares on the last day of each three month period thereafter.
|
|
(11)
|
Exercise prices have been adjusted for the effect of annual stock dividends.
|
118
OPTION AWARDS VESTING SCHEDULE
The following table sets forth the vesting schedule of unexercisable options reported in the “Number of Securities Underlying Unexercised Options – Unexercisable” column of the table above.
|
Grant Date
|
Vesting
|
|
|
3/25/05
|
These options vested on the grant date.
|
|
|
12/03/10
|
These options vested 25% per quarter over a one year period after the grant date.
|
|
|
12/02/11
|
These options vested 25% per quarter over a one year period after the grant date.
|
|
|
4/13/12
|
These options vested 25% per quarter over a one year period after the grant date.
|
|
|
12/06/13
|
These options vested 25% per quarter over a one year period after the grant date.
|
|
|
07/02/14
|
These options vest 25% per quarter over a one year period after the grant date.
|
|
|
12/05/14
|
These options vest 25% per quarter over a one year period after the grant date.
|
OPTION EXERCISES AND STOCK VESTED
The following table sets forth all stock options exercised and value received upon exercise, and all stock awards vested and value realized upon vesting, by the Named Executive Officers during the year ended December 31, 2014.
|
Option Awards
|
Stock Awards
|
|||||||||||||||
|
Number of
Shares Acquired
on Exercise
|
Value Realized
on Exercise
|
Number of
Shares Acquired
on Vesting
|
Value
Realized on
Vesting
|
|||||||||||||
|
Name of Executive Officer
|
(#) |
($)
|
(#) |
($)
|
||||||||||||
|
Scott M. Quist
|
-- | -- | -- | -- | ||||||||||||
|
Garrett S. Sill
|
28,877 | 96,880 | -- | -- | ||||||||||||
|
J. Lynn Beckstead, Jr.
|
-- | -- | -- | -- | ||||||||||||
|
Jeffrey R. Stephens
|
-- | -- | -- | -- | ||||||||||||
|
S. Andrew Quist
|
-- | -- | -- | -- | ||||||||||||
119
PENSION BENEFITS
The following table sets forth the present value as of December 31, 2014 of the benefit of the Named Executive Officers under the defined benefit pension plan.
|
Name of
Executive Officer
|
Plan Name
|
Number of
Years Credited
Service
(#)
|
Present Value
of Accumulated
Benefit
($)
|
Payments
During Las
t Fiscal Year
($)
|
|||||||||
|
Scott M. Quist
|
None
|
-- | -- | -- | |||||||||
|
Garrett S. Sill
|
None
|
-- | -- | -- | |||||||||
|
J. Lynn Beckstead, Jr.
|
None
|
-- | -- | -- | |||||||||
|
Jeffrey R.Stephens
|
None
|
-- | -- | -- | |||||||||
|
S. Andrew Quist
|
None
|
-- | -- | -- | |||||||||
EQUITY COMPENSATION PLAN INFORMATION
The following table sets forth certain information as of December 31, 2014 with respect to compensation plans (including individual compensation arrangements) under which the Company’s equity securities are authorized for issuance, aggregated as follows:
|
·
|
All compensation plans previously approved by security holders; and
|
|
·
|
All compensation plans not previously approved by security holders.
|
| A | B | C | ||||||||||
|
Plan Category
|
Number of
Securities to
be Issued
upon Exercise
of Outstanding
Options, Warrants
and Rights
|
Weighted Average
Exercise Price
of Outstanding
Options,
Warrants
and Rights
|
Number of
Securities
Remaining
Available for
Future Issuance
under
Equity
Compensation
Plans (Excluding
Securities
Reflected in
Column A)
|
|||||||||
|
Equity compensation plans approved by stockholders
[1]
|
1,204,386 |
$3.20
[2}
|
265,198 | [3] | ||||||||
|
Equity compensation plans not approved by stockholders
|
0 | - | 0 | |||||||||
|
[1]
This reflects the the 2003 Stock Option Plan (the “2003 Plan”), the 2006 Director Stock Option Plan (the “2006 Director Plan”), the 2013 Stock Option Plan (the "2013 Plan") and the 2014 Director Stock Option Plan (the "2014 Director Plan"). The 2003 Plan was approved by stockholders at the annual stockholders meeting held on July 11, 2003, which reserved 500,000 shares of Class A common stock and 1,000,000 shares of Class C common stock for issuance thereunder. The 2006 Director Plan was approved by stockholders at the annual stockholders meeting held on December 7, 2006, which reserved 100,000 shares of Class A common stock for issuance thereunder. The 2013 Plan was approved by stockholders at the annual stockholders meeting held on July 12, 2013, which reserved 450,000 shares of Class A common stock of which 150,000 shares of Class A common stock could be issued in place of up to 1,500,000 shares of Class C common stock for issuance thereunder. The 2014 Director Plan was approved by stockholders at the annual stockholders meeting held on July 2, 2014, which reserved 150,000 shares of Class A common stock for issuance thereunder. As a result of the stockholder approval of the 2013 Plan, the Company terminated the 2003 Plan.
|
||||
|
[2]
The weighted average exercise prices reflect solely the shares of Class A common stock that will be issued upon exercise of outstanding options.
|
||||
|
[3]
This number includes 135,213 shares of Class A common stock available for future issuance under the 2013 Plan, 2,485 shares of Class A common stock available for future issuance under the 2006 Director Plan, and 127,500 shares of Class A common stock available for future issuance under the 2014 Director Plan.
|
120
Retirement Plans
On December 8, 1988, the Company entered into a deferred compensation plan with George R. Quist, the former Chairman and Chief Executive Officer of the Company. The plan was later amended on three occasions with the third amendment effective February 1, 2001. Under the terms of the plan as amended, upon the retirement of Mr. Quist, the Company is required to pay him ten annual installments in the amount of $60,000. The $60,000 annual payments were adjusted for inflation in accordance with the United States Consumer Price Index each year.
The plan also provided that the Board of Directors may, in its discretion, pay the amounts due under the plan in a single, lump-sum payment. The Company accrued $-0- and $-0- in fiscal 2014 and 2013, respectively, to cover the present value of anticipated retirement benefits under the employment agreement of $598,426 as of December 31, 2014. Mr. Quist passed away on September 6, 2012, pursuant to the plan, the $598,426 was paid to his estate on December 31, 2014.
Employment Agreements
On July 16, 2004, the Company entered into an employment agreement with Scott M. Quist, its Chairman of the Board, President and Chief Executive Officer. The agreement is effective as of December 4, 2003 and has a five-year term, but the Company has agreed to renew the agreement on December 4, 2008 and 2013 for additional five-year terms, provided Mr. Quist performs his duties with usual and customary care and diligence. Under the terms of the agreement, Mr. Quist is to devote his full time to the Company serving as its Chairman of the Board, President, and Chief Executive Officer at not less than his current salary and benefits. The Company also agrees to maintain a group term life insurance policy of not less than $1,000,000 on Mr. Quist’s life and a whole life insurance policy in the amount of $500,000 on Mr. Quist’s life. In the event of disability, Mr. Quist’s salary would be continued for up to five years at 75% of its current level.
In the event of a sale or merger of the Company and Mr. Quist is not retained in his current position, the Company would be obligated to continue paying Mr. Quist’s current compensation and benefits for seven years following the merger or sale. The agreement further provides that Mr. Quist is entitled to receive annual retirement benefits beginning (i) one month from the date of his retirement (to commence no sooner than age 65), (ii) five years following complete disability, or (iii) upon termination of his employment without cause. These retirement benefits are to be paid for a period of twenty years in annual installments in the amount equal to 75% of his then current rate of compensation. However, in the event that Mr. Quist dies prior to receiving all retirement benefits thereunder, the remaining benefits are to be paid to his heirs. The Company expensed $833,183 and $264,000 in fiscal 2014 and 2013, respectively, to cover the present value of anticipated retirement benefits under the employment agreement. The liability accrued is $2,270,425 and $1,437,242 as of December 31, 2014 and 2013, respectively.
On December 4, 2003, the Company, through its subsidiary SecurityNational Mortgage Company, entered into an employment agreement with J. Lynn Beckstead, Jr., Vice President of Mortgage Operations and President of SecurityNational Mortgage Company. The agreement has a five-year term, but the Company has agreed to renew the agreement on December 4, 2008 and 2013 for additional five-year terms, provided Mr. Beckstead performs his duties with usual and customary care and diligence. Under the terms of the agreement, Mr. Beckstead is to devote his full time to the Company serving as President of SecurityNational Mortgage Company at not less than his current salary and benefits, and to include $350,000 of life insurance protection. In the event of disability, Mr. Beckstead’s salary would be continued for up to five years at 50% of its current level.
In the event of a sale or merger of the Company, and Mr. Beckstead was not retained in his current position, the Company would be obligated to continue paying Mr. Beckstead’s current compensation and benefits for five years following the merger or sale. The agreement further provides that Mr. Beckstead is entitled to receive annual retirement benefits beginning (i) one month from the date of his retirement (to commence no sooner than age 62½) (ii) five years following complete disability, or (iii) upon termination of his employment without cause. These retirement benefits are to be paid for a period of ten years in annual installments in the amount equal to one-half of his then current annual salary. However, in the event that Mr. Beckstead dies prior to receiving all retirement benefits thereunder, the remaining benefits are to be paid to his heirs. The Company expensed $154,817 and $-0- in fiscal 2014 and 2013, respectively, to cover the present value of the retirement benefit of the agreement. The liability accrued is $768,220 and $613,403 as of December 31, 2014 and 2013, respectively.
121
Director Compensation
Directors of the Company (but not including directors who are employees) are currently paid a director’s fee of $16,800 per year by the Company for their services and are reimbursed for their expenses in attending board and committee meetings. An additional fee of $750 is paid to each audit committee member for each audit committee meeting attended. Each director is provided with an annual grant of stock options to purchase 1,000 shares of Class A common stock, which occurred under the 2000 Director Stock Option Plan for years 2000 to 2005, under the 2006 Director Stock Option Plan and under the 2014 Director Plan for years 2006 to 2014. During 2014 and 2013 each director was granted additional stock options to purchase 5,000 shares and 4,842 shares, respectively, of Class A common stock.
DIRECTOR COMPENSATION
The following table sets forth the compensation of the Company’s non-employee directors for fiscal 2014.
|
Name
|
Fees Earned
or Paid in Cash
($)
|
Stock
Awards
($)
|
Option Awards
($)
|
Non-Equity
Incentive Plan
Compensation
($)
|
Change in
Pension Value
and Nonqualified
Deferred
Compensation
Earnings
|
All Other
Compensation
($)
|
Total
($)
|
|||||||||||||||||||||
|
John L. Cook (1)
|
$ | 16,800 | -- | $ | 9,757 | -- | -- | -- | $ | 26,557 | ||||||||||||||||||
|
Robert G. Hunter (2)
|
16,800 | -- | 9,757 | -- | -- | -- | 26,557 | |||||||||||||||||||||
|
Gilbert A. Fuller (3)
|
19,050 | -- | 9,757 | -- | -- | -- | 28,807 | |||||||||||||||||||||
|
H. Craig Moody (4)
|
19,050 | -- | 9,757 | -- | -- | -- | 28,807 | |||||||||||||||||||||
|
Norman G. Wilbur (5)
|
19,050 | -- | 9,757 | -- | -- | -- | 28,807 | |||||||||||||||||||||
|
(1)
|
John L. Cook has 12,741 options to purchase the Company stock.
|
|
|
(2)
|
Robert G. Hunter has 57,676 options to purchase the Company stock.
|
|
|
(3)
|
Gilbert A. Fuller has 13,899 options to purchase the Company stock.
|
|
|
(4)
|
H. Craig Moody has 57,676 options to purchase the Company stock.
|
|
|
(5)
|
Norman G. Wilbur has 28,490 options to purchase the Company stock.
|
Employee 401(k) Retirement Savings Plan
In 1995, the Company’s Board of Directors adopted a 401(k) Retirement Savings Plan. Under the terms of the 401(k) plan, effective as of January 1, 1995, the Company made discretionary employer matching contributions to its employees who choose to participate in the plan. The plan allowed the board to determine the amount of the contribution at the end of each year. During the period from January 1, 1995 to December 31, 2007 the Board had adopted a contribution formula specifying that such discretionary employer matching contributions would equal 50% of the participating employee’s contribution to the plan to purchase the Company’s stock up to a maximum discretionary employee contribution of 1/2 of 1% of participating employees’ compensation, as defined by the plan.
All persons who have completed at least one year’s service with the Company and satisfy other plan requirements are eligible to participate in the 401(k) plan. All Company matching contributions are invested in the Company’s Class A common stock. Also, the Company may contribute at the discretion of the Company’s Board of Directors an Employer Profit Sharing Contribution to the 401(k) plan. The Employer Profit Sharing Contribution is to be divided among three different classes of participants in the plan based upon the participant’s title in the Company. All amounts contributed to the plan are deposited into a trust fund administered by an independent trustee.
Beginning January 1, 2008, the Company elected to be a “Safe Harbor” Plan for its matching 401(k) contributions. The Company will match 100% of up to 3% of an employee’s total annual compensation and 50% of 4% to 5% of an employee’s annual compensation. The match is in shares of the Company’s Class A common stock. The Company’s contribution for 2014, 2013 and 2012 was $808,572, $749,898 and $222,719, respectively, under the “Safe Harbor” plan.
122
Employee Stock Ownership Plan
Effective January 1, 1980, the Company adopted an employee stock ownership plan (the “ESOP Plan”) for the benefit of career employees of the Company and its subsidiaries. The following is a description of the ESOP Plan, and is qualified in its entirety by the ESOP Plan, a copy of which is available for inspection at the Company’s offices.
Under the ESOP Plan, the Company has discretionary power to make contributions on behalf of all eligible employees into a trust created under the ESOP Plan. Employees become eligible to participate in the ESOP Plan when they have attained the age of 19 and have completed one year of service (a twelve-month period in which the Employee completes at least 1,040 hours of service). The Company’s contributions under the ESOP Plan are allocated to eligible employees on the same ratio that each eligible employee’s compensation bears to total compensation for all eligible employees during each year. To date, the ESOP Plan has approximately 314 participants and had $-0- contributions payable to the Plan in 2014. Benefits under the ESOP Plan vest as follows: 20% after the second year of eligible service by an employee, an additional 20% in the third, fourth, fifth and sixth years of eligible service by an employee.
Benefits under the ESOP Plan will be paid out in one lump sum or in installments in the event the employee becomes disabled, reaches the age of 65, or is terminated by the Company and demonstrates financial hardship. The ESOP Plan Committee, however, retains discretion to determine the final method of payment. Finally, the Company reserves the right to amend or terminate the ESOP Plan at any time. The trustees of the trust fund under the ESOP Plan are Scott M. Quist (Chairman), S. Andrew Quist, and Robert G. Hunter, who each serve as a director of the Company.
Deferred Compensation Plan
In 2001, the Company’s Board of Directors adopted a Deferred Compensation Plan. Under the terms of the Deferred Compensation Plan, the Company will provide deferred compensation for a select group of management or highly compensated employees, within the meaning of Sections 201(2), 301(a)(3) and 401(a)(1) of the Employee Retirement Income Security Act of 1974, as amended. The board has appointed a committee of the Company to be the plan administrator and to determine the employees who are eligible to participate in the plan. The employees who participate may elect to defer a portion of their compensation into the plan. The Company may contribute into the plan at the discretion of the Company’s Board of Directors. The Company did not make any contributions for 2014, 2013 and 2012.
NON-QUALIFIED DEFERRED COMPENSATION
The following table sets forth contributions to the deferred compensation account of the Named Executive Officers in fiscal 2014 and the aggregate balance of deferred compensation of the Named Executive Officers at December 31, 2014.
|
Executive
|
Registrant
|
Aggregate
|
Aggregate
|
Aggregate
|
||||||||||||||||
|
Contributions
|
Contributions
|
Earnings
|
Withdrawals
|
Balance
|
||||||||||||||||
|
In Last FY
|
In Last FY
|
in last FY
|
Distributions
|
at last FYE
|
||||||||||||||||
|
Name
|
($)
|
($)
|
($)
|
($)
|
($)
|
|||||||||||||||
|
Scott M. Quist
|
-- | -- | -- | -- | $ | 415,773 | ||||||||||||||
|
Garrett S. Sill
|
-- | -- | -- | -- | -- | |||||||||||||||
|
J. Lynn Beckstead, Jr.
|
-- | -- | -- | -- | $ | 210,418 | ||||||||||||||
|
Jeffrey R. Stephens
|
-- | -- | -- | -- | -- | |||||||||||||||
|
S. Andrew Quist
|
-- | -- | -- | -- | -- | |||||||||||||||
2006 Director Stock Option Plan
On December 7, 2006, the Company adopted the 2006 Director Stock Option Plan (the “2006 Director Plan”) effective December 7, 2006. The 2006 Director Plan provides for the grant by the Company of options to purchase up to an aggregate of 100,000 shares of Class A common stock for issuance there under. The 2006 Director Plan provides that each member of the Company’s Board of Directors who is not an employee or paid consultant of the Company is automatically eligible to receive options to purchase the Company’s Class A common stock under the 2006 Director Plan.
123
Effective as of December 7, 2006, and on each anniversary date thereof during the term of the 2006 Director Plan, each outside director shall automatically receive an option to purchase 1,000 shares of Class A common stock. In addition, each new outside director who shall first join the Board after the effective date shall be granted an option to purchase 1,000 shares upon the date which such person first becomes an outside director and an annual grant of an option to purchase 1,000 shares on each anniversary date thereof during the term of the 2006 Director Plan. The options granted to outside directors shall vest in four equal quarterly installments over a one year period from the date of grant, until such shares are fully vested. The primary purposes of the 2006 Director Plan are to enhance the Company’s ability to attract and retain well-qualified persons for service as directors and to provide incentives to such directors to continue their association with the Company.
In the event of a merger of the Company with or into another company, or a consolidation, acquisition of stock or assets or other change in control transaction involving the Company, each option becomes exercisable in full, unless such option is assumed by the successor corporation. In the event the transaction is not approved by a majority of the “Continuing Directors” (as defined in the 2006 Director Plan), each option becomes fully vested and exercisable in full immediately prior to the consummation of such transaction, whether or not assumed by the successor corporation.
2013 Stock Option Plan
On August 24, 2013, the Company adopted the Security National Financial Corporation 2013 Stock Option Plan (the “2013 Plan”), which reserved 450,000 shares of Class A common stock to be made available for issuance thereunder, of which up to 1,500,000 shares of Class C common stock could be issued in place of up to 150,000 shares of Class A common stock. The 2013 Plan provides for the grant of options and the award or sale of stock to officers, directors, and employees of the Company. Both “incentive stock options”, as defined under Section 422A of the Internal Revenue Code of 1986 and “non-qualified options” may be granted under the 2013 Plan.
The 2013 Plan is to be administered by the Board of Directors or by a committee designated by the Board. The terms of options granted or stock awards or sales affected under the 2013 Plan are to be determined by the Board of Directors or its committee. No options may be exercised for a term of more than ten years from the date of the grant. Options intended as incentive stock options may be issued only to employees, and must meet certain conditions imposed by the Internal Revenue Code, including a requirement that the option exercise price be no less than the fair market value of the option shares on the date of grant. The 2013 Plan provides that the exercise price for non-qualified options will not be less than at least 50% of the fair market value of the stock subject to such option as of the date of grant of such options, as determined by the Company’s Board of Directors.
The 2013 Plan has a term of ten years. The Board of Directors may amend or terminate the 2013 Plan at any time, from time to time, subject to approval of certain modifications to the 2013 Plan by the stockholders of the Company as may be required by law or the 2013 Plan.
2014 Director Stock Option Plan
On May 16, 2014, the Company adopted the 2014 Director Stock Option Plan (the “2014 Director Plan”) effective May 16, 2014. The 2014 Director Plan provides for the grant by the Company of options to purchase up to an aggregate of 150,000 shares of Class A common stock for issuance there under. The 2014 Director Plan provides that each member of the Company’s Board of Directors who is not an employee or paid consultant of the Company is automatically eligible to receive options to purchase the Company’s Class A common stock under the 2014 Director Plan.
Effective as of December 7, 2014, and on each anniversary date thereof during the term of the 2014 Director Plan, each outside director shall automatically receive an option to purchase 1,000 shares of Class A common stock. In addition, each new outside director who shall first join the Board after the effective date shall be granted an option to purchase 1,000 shares upon the date which such person first becomes an outside director and an annual grant of an option to purchase 1,000 shares on each anniversary date thereof during the term of the 2014 Director Plan. The options granted to outside directors shall vest in four equal quarterly installments over a one year period from the date of grant, until such shares are fully vested. The primary purposes of the 2014 Director Plan are to enhance the Company’s ability to attract and retain well-qualified persons for service as directors and to provide incentives to such directors to continue their association with the Company.
In the event of a merger of the Company with or into another company, or a consolidation, acquisition of stock or assets or other change in control transaction involving the Company, each option becomes exercisable in full, unless such option is assumed by the successor corporation. In the event the transaction is not approved by a majority of the “Continuing Directors” (as defined in the 2014 Director Plan), each option becomes fully vested and exercisable in full immediately prior to the consummation of such transaction, whether or not assumed by the successor corporation.
124
Compliance with Section 16(a) of the Securities Exchange Act of 1934
Section 16(a) of the Securities Exchange Act of 1934, as amended, requires the Company’s executive officers, directors and persons who own more than 10% of a registered class of the Company’s equity securities to file reports of ownership and periodic changes in ownership of the Company’s common stock with the Securities and Exchange Commission. Such persons are also required to furnish the Company with copies of all Section 16(a) reports they file.
Based solely on its review of the copies of stock reports received by it with respect to fiscal 2014, or written representations from certain reporting persons, the Company believes that its directors, executive officers and greater than 10% beneficial owners complied with all Section 16(a) filing requirements applicable to them, except that each of the Company’s executive officers and directors, through an oversight, filed two late Form 4 reports reporting the granting of stock options on July 2, 2014 and December 5, 2014.
The following table sets forth security ownership information of the Company’s Class A and Class C common stock as of March 31, 2015, (i) for persons who own beneficially more than 5% of the Company’s outstanding Class A or Class C common stock, (ii) each director of the Company, and (iii) for all executive officers, and directors of the Company as a group.
|
Class A
Common Stock
|
Class C
Common Stock
|
Class A and
Class C
Common Stock
|
||||||||||||||||||||||
|
Amount
|
Percent
|
Amount
|
Percent
|
Amount
|
Percent
|
|||||||||||||||||||
|
Beneficially
|
of
|
Beneficially
|
of
|
Beneficially
|
of
|
|||||||||||||||||||
|
Name and Address
(1)
|
Owned
|
Class
|
Owned
|
Class
|
Owned
|
Class
|
||||||||||||||||||
|
George R. and Shirley C. Quist
Family Partnership, Ltd.
(2)
|
1,062,719 | 9.2 | % | 547,097 | 39.3 | % | 1,609,816 | 12.5 | % | |||||||||||||||
|
Scott M. Quist
(3)(5)(6)(7)(8)
|
401,114 | 3.5 | % | 1,104,012 | 55.8 | % | 1,505,126 | 11.2 | % | |||||||||||||||
|
401(k) Retirement Savings Plan
(11)
|
1,343,906 | 11.7 | % | - | - | 1,343,906 | 10.4 | % | ||||||||||||||||
| Employee Stock Ownership Plan (ESOP) (4) | 579,918 | 5.0 | % | 252,974 | 18.2 | % | 832,892 | 6.5 | % | |||||||||||||||
|
Non-Qualified Deferred
Compensation Plan
(10)
|
723,942 | 6.3 | % | - | - | 723,942 | 5.6 | % | ||||||||||||||||
|
Estate of George R. Quist
|
522,076 | 4.5 | % | 63,535 | 4.6 | % | 585,611 | 4.5 | % | |||||||||||||||
|
Christie Q. Overbaugh
(12)
|
230,105 | 2.0 | % | 18,452 | 1.3 | % | 248,557 | 1.9 | % | |||||||||||||||
|
J. Lynn Beckstead, Jr.
(6)(7)(13)
|
230,054 | 2.0 | % | - | - | 230,054 | 1.8 | % | ||||||||||||||||
|
Associated Investors
(9)
|
66,334 | * | 106,792 | 7.7 | % | 173,126 | 1.3 | % | ||||||||||||||||
|
Jason G. Overbaugh
(14)
|
170,557 | 1.5 | % | - | - | 170,557 | 1.3 | % | ||||||||||||||||
|
S. Andrew Quist
(3)(15)
|
107,039 | * | - | - | 107,039 | * | ||||||||||||||||||
|
Jeffrey R. Stephens
(16)
|
70,122 | * | - | - | 70,122 | * | ||||||||||||||||||
|
Robert G. Hunter, M.D.
(3)(17)
|
61,104 | * | - | - | 61,104 | * | ||||||||||||||||||
|
H. Craig Moody
(18)
|
59,437 | * | - | - | 59,437 | * | ||||||||||||||||||
|
Garrett S. Sill
(6)(7)(19)
|
51,728 | * | - | - | 51,728 | * | ||||||||||||||||||
|
Norman G. Wilbur
(20)
|
27,437 | * | - | - | 27,437 | * | ||||||||||||||||||
|
Gilbert A. Fuller
(21)
|
9,725 | * | - | - | 9,725 | * | ||||||||||||||||||
|
John L. Cook
(22)
|
8,016 | * | - | - | 8,016 | * | ||||||||||||||||||
|
All directors and executive officers
(12 persons)
(3)(5)(6)(7)
|
1,426,438 | 12.1 | % | 1,122,464 | 56.7 | % | 2,548,902 | 18.5 | % | |||||||||||||||
* Less than 1%
125
|
(1)
|
Unless otherwise indicated, the address of each listed stockholder is c/o Security National Financial Corporation, 5300 South 360 West, Suite 250, Salt Lake City, Utah 84123.
|
|
(2)
|
This stock is owned by the George R. and Shirley C. Quist Family Partnership, Ltd., of which Scott M. Quist is the managing general partner and, accordingly, exercises sole voting and investment powers with respect to such shares.
|
|
(3)
|
Does not include 579,918 shares of Class A common stock and 252,974 shares of Class C common stock owned by the Company’s Employee Stock Ownership Plan (ESOP), of which Scott M. Quist, S. Andrew Quist and Robert G. Hunter are the trustees and accordingly, exercise shared voting and investment powers with respect to such shares.
|
|
(4)
|
The trustees of the Employee Stock Ownership Plan (ESOP) consist of Scott M. Quist, S. Andrew Quist and Robert G. Hunter who exercise shared voting and investment powers.
|
|
(5)
|
Does not include 66,334 shares of Class A common stock and 106,792 shares of Class C common stock owned by Associated Investors, a Utah general partnership, of which Scott M. Quist is the managing partner and, accordingly, exercises sole voting and investment powers with respect to such shares.
|
|
(6)
|
Does not include 1,343,906 shares of Class A common stock owned by the Company’s 401(k) Retirement Savings Plan, of which Scott M. Quist, J. Lynn Beckstead and Garrett S. Sill are members of the investment committee and, accordingly, exercise shared voting and investment powers with respect to such shares.
|
|
(7)
|
Does not include 723,942 shares of Class A common stock owned by the Company’s Deferred Compensation Plan, of which Scott M. Quist, J. Lynn Beckstead and Garrett S. Sill are members of the investment committee and, accordingly, exercise shared voting and investment powers with respect to such shares.
|
|
(8)
|
Includes options to purchase 585,966 shares of Class C common stock granted to Scott M. Quist that are currently exercisable, or will become exercisable within 60 days of March 31, 2015.
|
|
(9)
|
The managing partner of Associated Investors is Scott M. Quist, who exercises sole voting and investment powers.
|
|
(10)
|
The investment committee of the Company’s Non-Qualified Deferred Compensation Plan consists of Scott M. Quist, J. Lynn Beckstead and Garrett S. Sill and, accordingly, exercised shared voting and investment powers with respect to such shares.
|
|
(11)
|
The investment committee of the Company’s 401(k) retirement savings plan consists of Scott Quist, J. Lynn Beckstead Jr. and Garrett S. Sill and, accordingly, exercise shared voting and investment powers with respect to such shares.
|
|
(12)
|
Includes options to purchase 16,489 shares of Class A common stock granted to Ms. Overbaugh that are currently exercisable, or will become exercisable within 60 days of March 31, 2015.
|
|
(13)
|
Includes options to purchase 19,097 shares of Class A common stock granted to Mr. Beckstead that are currently exercisable, or will become exercisable within 60 days of March 31, 2015.
|
|
(14)
|
Includes options to purchase 30,082 shares of Class A common stock granted to Mr. Overbaugh that are currently exercisable, or will become exercisable within 60 days of March 31, 2015.
|
|
(15)
|
Includes options to purchase 56,998 shares of Class A common stock granted to Mr. Andrew Quist that are currently exercisable, or will become exercisable within 60 days of March 31, 2015.
|
|
(16)
|
Includes options to purchase 8,243 shares of Class A common stock granted to Mr. Stephens that are currently exercisable, or will become exercisable within 60 days of March 31, 2015.
|
|
(17)
|
Includes options to purchase 52,951 shares of Class A common stock granted to Mr. Hunter that are currently exercisable, or will become exercisable within 60 days of March 31, 2015.
|
|
(18)
|
Includes options to purchase 52,951 shares of Class A common stock granted to Mr. Moody that are currently exercisable, or will become exercisable within 60 days of March 31, 2015.
|
|
(19)
|
Includes options to purchase 8,560 shares of Class A common stock granted to Mr. Sill that are currently exercisable, or will become exercisable within 60 days of March 31, 2015.
|
|
(20)
|
Includes options to purchase 23,765 shares of Class A common stock granted to Mr. Wilbur that are currently exercisable, or will become exercisable within 60 days of March 31, 2015.
|
|
(21)
|
Includes options to purchase 9,174 shares of Class A common stock granted to Mr. Fuller that are currently exercisable, or will become exercisable within 60 days of March 31, 2015.
|
|
(22)
|
Includes options to purchase 8,016 shares of Class A common stock granted to Mr. Cook that are currently exercisable, or will become exercisable within 60 days of March 31, 2015.
|
The Company’s executive officers and directors, as a group, own beneficially approximately 18.5% of the outstanding shares of the Company’s Class A and Class C common stock. At the Annual Meeting of Stockholders that was held on July 2, 2014, the stockholders approved resolutions providing for a 1-for-10 reverse stock split of the Company’s Class C common stock and for weighted voting of the Class C common stock. As a result, each share of Class C common stock has weighted voting of ten votes per share and may be converted into one share of Class A common stock.
126
The Company’s Board of Directors has a written procedure, which requires disclosure to the Board of any material interest or any affiliation on the part of any of its officers, directors or employees that is in conflict or may be in conflict with the interests of the Company.
On December 19, 2013, Mr. and Mrs. Scott M. Quist and Security National Life jointly purchased a house in St. George, Utah, pursuant to the terms of the Amendment to the Use and Buy Sale Agreement, dated February 15, 2007 (the “Agreement”), among Security National Life and Mr. and Mrs. Quist. The Amendment is dated December 6, 2013. Mr. Quist is the Company’s Chairman, President and Chief Executive Officer. The house is to be used in place of the St. George condominium, which was purchased in 2007, for the entertainment of the Company’s executive officers, employees, outside vendors and prospective customers.
The purchase price of the house was $695,000. Mr. Quist paid $185,000 of the purchase price plus closing costs, Security National Life paid $100,000, and Mr. Quist and his wife signed a note for $410,000, which is secured by a first trust deed on the property. The St. George condominium has been sold and the proceeds from the sale were applied toward the purchase price of the St. George house.
The other terms of the Agreement are to remain the same. Accordingly, Security National Life and Mr. and Mrs. Quist will continue to have the right to use the house in proportion to their respective contributions toward the purchase price, including furnishings and fixtures. Mr. Quist will be responsible for the care and maintenance of the house. The payment of taxes, insurance, utilities and homeowners’ fees will be divided among Security National Life and Mr. and Mrs. Quist according to their respective ownership percentages in the house.
Upon the death, disability or retirement of Mr. Quist or his separation from employment with the Company, Mr. Quist or his estate will have the right to purchase Security National Life’s share of the house at a purchase price equal to Security National Life’s contribution to the purchase price of the house or the fair market value of its interest in the house, whichever is less. Security National Life’s contribution to the purchase price of the house is equal to the amount of the accrued but unpaid bonus owed to Mr. Quist for fiscal year 2013, which he agreed to defer for the option to purchase Security National Life’s interest in the house upon his death, disability or retirement or his separation from employment with the Company.
The following table summarizes the fees of the Company’s current independent auditors, billed to the Company for each of the last two fiscal years for audit and other services. All of these fees were reviewed and approved by the Audit Committee of the Board of Directors:
|
Fee Category
|
2014
|
2013
|
||||||
|
Audit Fees (1)
|
$ | 296,631 | $ | 309,027 | ||||
|
Audit-Related Fees (2)
|
30,217 | 29,000 | ||||||
|
Tax Fees (3)
|
94,008 | 91,028 | ||||||
|
All Other Fees (4)
|
2,717 | 13,375 | ||||||
| $ | 423,573 | $ | 442,430 | |||||
|
(1)
|
Audit fees consist of aggregate fees billed for professional services rendered for the audit of the Company’s annual financial statements and review of the interim financial statements included in quarterly reports or services that are normally provided by the independent auditor in connection with statutory and regulatory filings for the years ended December 31, 2014 and 2013.
|
|
(2)
|
Audit related fees consist of aggregate fees billed for assurance and related services that are reasonably related to the performance of the audit or review of the Company’s financial statements and are not reported under “Audit Fees”. These fees include review of registration statements, and audits of the Company’s ESOP and 401(k) Plans.
|
|
(3)
|
Tax fees consist of aggregate fees billed for professional services for tax compliance, tax advice, and tax planning.
|
|
(4)
|
All other fees consist of aggregate fees billed for products and services by the independent auditors, other than those disclosed above.
|
127
(a)(1)
Financial Statements
See “Index to Consolidated Financial Statements” under Item 8 above.
(a)(2)
Financial Statement Schedules
II. Condensed Balance Sheets as of December 31, 2014 and 2013 and Condensed
Statement of Earnings and Cash Flows for the years ended 2014, 2013 and 2012
IV. Reinsurance
V. Valuation and Qualifying Accounts
All other schedules to the consolidated financial statements required by Article 7 of Regulation S-X are not required under the related instructions or are inapplicable and therefore have been omitted.
(a)(3)
Exhibits
The following Exhibits are filed herewith pursuant to Rule 601 of Regulation S-K or are incorporated by reference to previous filings.
|
3.1
|
Articles of Restatement of Articles of Incorporation (3)
|
|
3.2
|
Amended Bylaws (5)
|
|
4.1
|
Specimen Class A Stock Certificate (1) |
|
4.2
|
Specimen Class C Stock Certificate (1) |
|
4.3
|
Specimen Preferred Stock Certificate and Certificate of Designation of Preferred Stock (1) |
|
10.1
|
Restated and Amended Employee Stock Ownership Plan and Trust Agreement (1)
|
|
10.2
|
2003 Stock Option Plan (4)
|
|
10.3
|
2006 Director Stock Option Plan (8)
|
|
10.4
|
2013 Stock Option Plan (11)
|
|
10.5
|
2014 Director Stock Option Plan (13)
|
|
10.6
|
Deferred Compensation Plan (2)
|
|
10.7
|
Employment agreement with J. Lynn Beckstead, Jr. (6)
|
|
10.8
|
Employment agreement with Scott M. Quist (7)
|
| 10.9 | Indemnification Agreement among SecurityNational Mortgage Company, Lehman Brothers Bank, and Aurora Loan Services (9) |
|
10.10
|
Agreement and Plan of Reorganization among Security National Financial Corporation and certain subsidiaries (10) |
|
10.11
|
Purchase Agreement among Security National Financial Corporation, SNFC Subsidiary, LLC, American Funeral Financial, LLC, and Hypershop, LLC (12)
|
128
|
21
|
Subsidiaries of the Registrant
|
|
31.1
|
Certification pursuant to 18 U.S.C. Section 1350, as enacted by Section 302 of the Sarbanes-Oxley Act of 2002
|
|
31.2
|
Certification pursuant to 18 U.S.C. Section 1350, as enacted by Section 302 of the Sarbanes-Oxley Act of 2002
|
| 32.1 | Certification pursuant to 18 U.S.C. Section 1350, as adopted pursuant to Section 906 of the Sarbanes-Oxley Act of 2002 |
|
32.2
|
Certification pursuant to 18 U.S.C. Section 1350, as adopted pursuant to Section 906 of the Sarbanes-Oxley Act of 2002
|
|
101 INS
|
XBRL Instance Document*
|
|
101 SCH
|
XBRL Schema Document*
|
|
101 CAL
|
XBRL Calculation Linkbase Document*
|
|
101 DEF
|
XBRL Definition Linkbase Document*
|
|
101 LAB
|
XBRL Labels Linkbase Document*
|
|
101 PRE
|
XBRL Presentation Linkbase Document*
|
* The XBRL related information in Exhibit 101 shall not be deemed “filed” for purposes of Section 18 of the Securities Exchange Act of 1934, as amended, or otherwise subject to liability of that section and shall not be incorporated by reference into any filing or other document pursuant to the Securities Act of 1933, as amended, except as shall be expressly set forth by specific reference in such filing or document.
|
(1)
|
Incorporated by reference from Registration Statement on Form S-1, as filed on September 29, 1987
|
|
(2)
|
Incorporated by reference from Annual Report on Form 10-K, as filed on April 3, 2002
|
|
(3)
|
Incorporated by reference from Report on Form 8-K/A, as filed on January 8, 2003
|
|
(4)
|
Incorporated by reference from Schedule 14A Definitive Proxy Statement, as filed on September 5, 2003, relating to the Company’s Annual Meeting of Stockholders
|
|
(5)
|
Incorporated by reference from Report on Form 10-Q, as filed on November 14, 2003
|
|
(6)
|
Incorporated by reference from Report on Form 10-K, as filed on March 30, 2004
|
|
(7)
|
Incorporated by reference from Report on Form 10-Q, as filed on August 13, 2004
|
|
(8)
|
Incorporated by reference from Schedule 14A Definitive Proxy Statement, as filed on June 1, 2007, relating to the Company’s Annual Meeting of Stockholders
|
|
(9)
|
Incorporated by reference from Report on Form 10-K, as filed on March 31, 2009
|
|
(10)
|
Incorporated by reference from Report on Form 10-Q, as filed on May 15, 2013
|
|
(11)
|
Incorporated by reference from Schedule 14A Definitive Proxy Statement, as filed on June 5, 2013, relating to the Company’s Annual Meeting of Stockholders
|
|
(12)
|
Incorporated by reference from Report on Form 8-K, as filed on June 13, 2014
|
|
(13)
|
Incorporated by reference from Schedule 14A Definitive Proxy Statement, as filed on June 2, 2014, related to Company’s Annual Meeting of Stockholders
|
129
SIGNATURES
Pursuant to the requirements of Section 13 or 15(d) of the Securities Exchange Act of 1934, the Registrant has duly caused this report to be signed on its behalf by the undersigned, thereunto duly authorized.
|
SECURITY NATIONAL FINANCIAL CORPORATION
|
||
|
Dated: March 31, 2015
|
By:
|
/s/ Scott M. Quist
|
|
Scott M. Quist
|
||
|
Chairman of the Board, President and Chief Executive Officer
|
Pursuant to the requirements of the Securities Exchange Act of 1934, this report has been signed below by the following persons on behalf of the Registrant and in the capacities and on the dates indicated:
| SIGNATURE |
TITLE
|
DATE
|
|
/s/ Scott M. Quist
|
Chairman of the Board, President
|
|
|
Scott M. Quist
|
and Chief Executive Officer
|
|
| (Principal Executive Officer) | March 31, 2015 | |
| /s/ Garrett S. Sill | Chief Financial Officer and | |
|
Garrett S. Sill
|
Treasurer (Principal Financial | |
| and Accounting Officer) | March 31, 2015 | |
|
/s/ J. Lynn Beckstead, Jr.
|
Vice President and Director
|
March 31, 2015
|
|
J. Lynn Beckstead, Jr.
|
||
|
/s/ Jason G. Overbaugh
|
Vice President and Director
|
March 31, 2015
|
|
Jason G. Overbaugh
|
||
|
/s/ S. Andrew Quist
|
Vice President and Director
|
March 31, 2015
|
|
S. Andrew Quist
|
||
|
/s/ John L. Cook
|
Director
|
March 31, 2015
|
|
John L. Cook
|
||
|
/s/ Gilbert A. Fuller
|
Director
|
March 31, 2015
|
|
Gilbert A. Fuller
|
||
|
/s/ H. Craig Moody
|
Director
|
March 31, 2015
|
|
H. Craig Moody
|
||
|
/s/ Norman G. Wilbur
|
Director
|
March 31, 2015
|
|
Norman G. Wilbur
|
||
|
/s/ Robert G. Hunter
|
Director
|
March 31, 2015
|
|
Robert G. Hunter
|
130
Schedule II
SECURITY NATIONAL FINANCIAL CORPORATION
(Parent Company Only)
Condensed Financial Information
Condensed Balance Sheets
|
December 31
|
||||||||
|
2014
|
2013
|
|||||||
|
Assets
|
||||||||
|
Cash
|
$ | (135,523 | ) | $ | 3,439,321 | |||
|
Investment in subsidiaries (equity method)
|
111,293,649 | 97,478,606 | ||||||
|
Receivables:
|
||||||||
|
Receivable from affiliates
|
11,339,690 | 9,507,403 | ||||||
|
Total receivables
|
11,339,690 | 9,507,403 | ||||||
|
Property and equipment, at cost,
net of accumulated depreciation
of $1,663,396 for 2014 and
$1,663,087 for 2013.
|
- | 309 | ||||||
|
Other assets
|
2,802 | 16,098 | ||||||
|
Total assets
|
$ | 122,500,618 | $ | 110,441,737 | ||||
See accompanying notes to condensed financial statements.
131
Schedule II (Continued)
SECURITY NATIONAL FINANCIAL CORPORATION
(Parent Company Only)
Condensed Financial Information
Condensed Balance Sheets (Continued)
|
December 31
|
||||||||
|
2014
|
2013
|
|||||||
|
Liabilities and Stockholders’ Equity Liabilities
|
||||||||
|
Bank and other loans payable:
|
||||||||
|
Current installments
|
$ | 1,394,915 | $ | 1,891,728 | ||||
|
Long-term
|
2,062,934 | 3,378,124 | ||||||
|
Advances from affiliated companies
|
9,060,918 | 9,147,653 | ||||||
|
Other liabilities and accrued expenses
|
1,070,462 | 1,269,514 | ||||||
|
Income taxes
|
11,820,288 | 7,002,568 | ||||||
|
Total liabilities
|
25,409,517 | 22,689,587 | ||||||
|
Stockholders’ Equity
|
||||||||
|
Class A common stock $2.00 par value;
20,000,000 shares authorized;
issued 12,459,240 shares in 2014
11,807,287 shares in 2013
|
24,918,480 | 23,614,574 | ||||||
|
Class B non-voting common stock-$1.00 par value;
5,000,000 shares authorized; none issued or
outstanding
|
-- | -- | ||||||
|
Class C convertible common stock, $2.00 par value;
2,000,000 shares authorized; issued 1,394,069
shares in 2014 and 1,330,191 shares in 2013
|
2,788,138 | 2,660,382 | ||||||
|
Additional paid-in capital
|
25,931,119 | 23,215,875 | ||||||
|
Accumulated other comprehensive income
|
1,438,566 | 1,218,396 | ||||||
|
Retained Earnings
|
44,101,252 | 39,666,587 | ||||||
|
Treasury stock at cost - (986,264 Class A shares
and -0- Class C shares in 2014; 1,141,021
Class A shares and -0- Class C shares
in 2013, held by affiliated companies)
|
(2,086,454 | ) | (2,624,625 | ) | ||||
|
Total stockholders’ equity
|
97,091,101 | 87,751,189 | ||||||
|
Total Liabilities and Stockholders’ Equity
|
$ | 122,500,618 | $ | 110,440,776 | ||||
See accompanying notes to condensed financial statements.
132
Schedule II (Continued)
SECURITY NATIONAL FINANCIAL CORPORATION
(Parent Company Only)
Condensed Financial Information
Condensed Statements of Earnings
|
Year Ended December 31
|
||||||||||||
|
2014
|
2013
|
2012
|
||||||||||
|
Revenue
|
||||||||||||
|
Net investment income
|
$ | 91,748 | $ | 11,658 | $ | 18,607 | ||||||
|
Fees from affiliates
|
1,009,552 | 1,120,109 | 925,496 | |||||||||
|
Other Income
|
- | 30,002 | 686 | |||||||||
|
Total revenue
|
1,101,300 | 1,161,769 | 944,789 | |||||||||
|
Benefits and Expenses:
|
||||||||||||
|
General and administrative expenses
|
728,929 | 516,360 | 560,426 | |||||||||
|
Interest expense
|
173,362 | 232,635 | 124,112 | |||||||||
|
Total benefits and expenses
|
902,291 | 748,995 | 684,538 | |||||||||
| Earnings before income taxes, and earnings of subsidiaries | 199,009 | 412,774 | 260,251 | |||||||||
|
Income tax benefit (expense)
|
(3,519,697 | ) | 303,266 | 1,659,194 | ||||||||
|
Equity in earnings of subsidiaries
|
11,075,336 | 6,869,881 | 14,793,073 | |||||||||
|
Net earnings
|
$ | 7,754,648 | $ | 7,585,921 | $ | 16,712,518 | ||||||
See accompanying notes to condensed financial statements.
133
Schedule II (Continued)
SECURITY NATIONAL FINANCIAL CORPORATION
(Parent Company Only)
Condensed Financial Information
Condensed Statements of Cash Flow
|
Year Ended December 31
|
||||||||||||
|
2014
|
2013
|
2012
|
||||||||||
|
Cash flows from operating activities:
|
||||||||||||
|
Net earnings
|
$ | 7,754,648 | $ | 7,585,921 | $ | 16,712,518 | ||||||
|
Adjustments to reconcile net earnings to net cash provided by operating activities:
|
||||||||||||
|
Depreciation and amortization
|
309 | 1,910 | 11,351 | |||||||||
|
Undistributed earnings of affiliates
|
11,075,336 | 6,869,881 | 14,793,073 | |||||||||
|
Provision for income taxes
|
4,817,720 | 1,163,836 | (2,644,194 | ) | ||||||||
|
Receivables for mortgage loans held for sale
|
- | - | 2,986,110 | |||||||||
|
Stock based compensation expense
|
391,220 | 88,369 | 251,031 | |||||||||
|
Benefit plans funded with treasury stock
|
899,850 | 727,937 | 319,751 | |||||||||
|
Change in assets and liabilities:
|
||||||||||||
|
Accounts receivable
|
- | - | 177,509 | |||||||||
|
Other assets
|
13,296 | 72,346 | - | |||||||||
|
Other liabilities
|
(199,052 | ) | (66,945 | ) | (22,533 | ) | ||||||
|
Net cash provided by operating activities
|
24,753,327 | 16,443,255 | 32,584,616 | |||||||||
| - | - | - | ||||||||||
|
Cash flows from investing activities:
|
||||||||||||
|
Investment in subsidiaries
|
(21,670,209 | ) | (15,079,788 | ) | (29,586,144 | ) | ||||||
|
Cash paid for purchase of subsidiaries, net of cash acquired
|
(3,000,000 | ) | -- | -- | ||||||||
|
Net cash used in investing activities
|
(24,670,209 | ) | (15,079,788 | ) | (29,586,144 | ) | ||||||
|
Cash flows from financing activities:
|
||||||||||||
|
Advances from (to) affiliates
|
(1,919,022 | ) | 681,679 | (2,770,019 | ) | |||||||
|
Proceeds from stock options exercised
|
74,024 | 252,815 | 18,306 | |||||||||
|
Payments of notes and contracts payable
|
(1,812,964 | ) | (1,898,324 | ) | (1,146,997 | ) | ||||||
|
Proceeds from borrowings on notes and contracts payable
|
- | 4,684,208 | -- | |||||||||
|
Change in line of credit borrowings
|
- | (4,608,204 | ) | 3,208,204 | ||||||||
|
Net cash used in financing activities
|
(3,657,962 | ) | (887,826 | ) | (690,506 | ) | ||||||
|
Net change in cash
|
(3,574,844 | ) | 475,641 | 2,307,966 | ||||||||
|
Cash at beginning of year
|
3,439,321 | 2,963,680 | 655,714 | |||||||||
|
Cash at end of year
|
$ | (135,523 | ) | $ | 3,439,321 | $ | 2,963,680 | |||||
See accompanying notes to condensed financial statements.
134
Schedule II (Continued)
SECURITY NATIONAL FINANCIAL CORPORATION
(Parent Company Only)
Condensed Financial Information
Notes to Condensed Financial Statements
1)
Bank and Other Loans Payable
|
December 31
|
||||||||
|
2014
|
2013
|
|||||||
|
3.85% note payable in monthly installments of $79,468 including
principal and interest, collateralized by shares of Security National
Life Insurance Company stock, due June 2015.
|
$ | 461,889 | $ | 1,377,925 | ||||
|
3.85% note payable in monthly installments of $86,059 including
principal and interest, collateralized by shares of Security National
Life Insurance Company stock, due December 2017.
|
2,994,999 | 3,891,926 | ||||||
|
Other notes payable
|
961 | 961 | ||||||
|
Total bank and other loans
|
3,457,849 | 5,270,812 | ||||||
| - | - | |||||||
|
Less current installments
|
1,394,915 | 1,891,728 | ||||||
|
Bank and other loans, excluding current installments
|
$ | 2,062,934 | $ | 3,379,084 | ||||
The Company has a $2,000,000 revolving line-of-credit with a bank with interest payable at the prime rate minus .75% (2.50% at December 31, 2014), secured by the capital stock of Security National Life and maturing June 30, 2015, renewable annually. As of December 31, 2014, $699,671, was reserved for an outstanding letter of credit. As of December 31, 2014, there were no amounts outstanding under the revolving line-of-credit.
The following tabulation shows the combined maturities of bank and other loans payable:
|
2015
|
$ | 1,394,915 | ||
|
2016
|
969,216 | |||
|
2017
|
1,093,718 | |||
|
2018
|
- | |||
|
2019
|
- | |||
|
Thereafter
|
- | |||
|
Total
|
$ | 3,457,849 |
2)
Advances from Affiliated Companies
|
December 31
|
||||||||
|
2014
|
2013
|
|||||||
|
Non-interest bearing advances from affiliates:
|
||||||||
|
Cemetery and Mortuary
subsidiary
|
$ | 1,459,841 | $ | 1,459,841 | ||||
|
Life insurance subsidiaries
|
7,601,077 | 7,687,812 | ||||||
| $ | 9,060,918 | $ | 9,147,653 | |||||
3)
Dividends and Capital Contributions
In 2014, 2013 and 2012, SecurityNational Mortgage Company, a wholly owned subsidiary of the Registrant, paid to the registrant cash dividends of $480,461, $1,309,712, and $1,500,000, respectively.
In 2014, 2013 and 2012 the Registrant made a capital contribution to Security National Life Insurance Company, a wholly owned subsidiary of the Registrant, in the amount of $-0-, $-0-, and $4,684,204, respectively.
In 2014, 2013 and 2012 the Registrant made capital contributions to Green Street Mortgage Services, Inc., a wholly owned subsidiary of the Registrant, in the amount of $-0-, $2,649,735, and $1,500,000, respectively.
135
Schedule IV
SECURITY NATIONAL FINANCIAL CORPORATION
AND SUBSIDIARIES
|
Reinsurance
|
||||||||||||||||||||
|
Direct
Amount
|
Ceded to
Other
Companies
|
Assumed
from other
Companies
|
Net
Amount
|
Percentage
of Amount
Assumed to
Net
|
||||||||||||||||
|
2014
|
||||||||||||||||||||
|
Life Insurance in force ($000)
|
$ | 1,301,156 | $ | 63,457 | $ | 1,462,340 | $ | 2,700,039 |
54.2%
|
|||||||||||
|
Premiums:
|
||||||||||||||||||||
|
Life Insurance
|
$ | 51,938,012 | $ | 855,266 | $ | 1,792,910 | $ | 52,875,656 |
3.4%
|
|||||||||||
|
Accident and Health Insurance
|
133,002 | - | 21 | 133,023 |
0.0%
|
|||||||||||||||
|
Total premiums
|
$ | 52,071,014 | $ | 855,266 | $ | 1,792,931 | $ | 53,008,679 |
3.4%
|
|||||||||||
|
2013
|
||||||||||||||||||||
|
Life Insurance in force ($000)
|
$ | 1,262,134 | $ | 75,181 | $ | 1,566,336 | $ | 2,753,289 |
56.9%
|
|||||||||||
|
Premiums:
|
||||||||||||||||||||
|
Life Insurance
l
|
$ | 49,421,429 | $ | 1,028,150 | $ | 1,935,376 | $ | 50,328,655 |
3.8%
|
|||||||||||
|
Accident and Health Insurance
|
142,972 | - | 31 | 143,003 |
0.0%
|
|||||||||||||||
|
Total premiums
|
$ | 49,564,401 | $ | 1,028,150 | $ | 1,935,407 | $ | 50,471,658 |
3.8%
|
|||||||||||
|
2012
|
||||||||||||||||||||
|
Life Insurance in force ($000)
|
$ | 1,248,846 | $ | 87,684 | $ | 1,664,573 | $ | 2,825,735 |
58.9%
|
|||||||||||
| Premiums: | ||||||||||||||||||||
| Life Insurance | $ | 47,121,650 | $ | 1,409,325 | $ | 2,345,324 | $ | 48,057,649 |
4.9%
|
|||||||||||
|
Accident and Health Insurance
|
158,648 | - | 30 | 158,678 |
0.0%
|
|||||||||||||||
|
Total premiums
|
$ | 47,280,298 | $ | 1,409,325 | $ | 2,345,354 | $ | 48,216,327 |
4.9%
|
|||||||||||
136
Schedule V
SECURITY NATIONAL FINANCIAL CORPORATION
AND SUBSIDIARIES
Valuation and Qualifying Accounts
|
Additions
|
Deductions
|
|||||||||||||||
|
Balance at
|
Charged to
|
Disposals
|
Balance
|
|||||||||||||
|
Beginning
|
Costs and
|
and
|
at End of
|
|||||||||||||
|
of Year
|
Expenses
|
Write-offs
|
Year
|
|||||||||||||
|
For the Year Ended December 31, 2014
|
||||||||||||||||
|
Accumulated depreciation on real estate
|
$ | 9,658,599 | $ | 2,009,521 | $ | (792,701 | ) | $ | 10,875,419 | |||||||
|
Allowance for losses on mortgage loans
on real estate and construction loans
held for investment.
|
1,652,090 | 389,409 | (38,444 | ) | 2,003,055 | |||||||||||
|
Accumulated depreciation
on property and equipment
|
15,260,635 | 2,177,165 | (1,018,457 | ) | 16,419,343 | |||||||||||
|
Allowance for doubtful accounts
on receivables
|
1,248,633 | 403,146 | (370,920 | ) | 1,280,859 | |||||||||||
|
Allowance for doubtful accounts
on collateral loans
|
269,175 | 524,192 | (99,954 | ) | 693,413 | |||||||||||
|
For the Year Ended December 31, 2013
|
||||||||||||||||
|
Accumulated depreciation on real estate
|
$ | 7,441,418 | $ | 2,539,691 | $ | (322,510 | ) | $ | 9,658,599 | |||||||
|
Allowance for losses on mortgage loans
on real estate and construction loans
held for investment.
|
4,239,861 | 220,652 | (2,808,423 | ) | 1,652,090 | |||||||||||
|
Accumulated depreciation
on property and equipment
|
16,974,898 | 1,621,069 | (3,335,332 | ) | 15,260,635 | |||||||||||
|
Allowance for doubtful accounts
on receivables
|
1,190,592 | 261,911 | (203,870 | ) | 1,248,633 | |||||||||||
|
Allowance for doubtful accounts
on collateral loans
|
505,030 | 207,616 | (443,471 | ) | 269,175 | |||||||||||
|
For the Year Ended December 31, 2012
|
||||||||||||||||
|
Accumulated depreciation on real estate
|
$ | 5,999,879 | $ | 1,619,646 | $ | (178,107 | ) | $ | 7,441,418 | |||||||
|
Allowance for losses on mortgage loans
on real estate and construction loans
held for investment.
|
4,881,173 | 433,829 | (1,075,141 | ) | 4,239,861 | |||||||||||
|
Accumulated depreciation
on property and equipment
|
16,103,305 | 1,258,097 | (386,504 | ) | 16,974,898 | |||||||||||
|
Allowance for doubtful accounts
on receivables
|
2,278,969 | 208,472 | (1,296,849 | ) | 1,190,592 | |||||||||||
|
Allowance for doubtful accounts
on collateral loans
|
427,136 | 232,081 | (154,187 | ) | 505,030 | |||||||||||
137
TABLE OF CONTENTS
Part IItem 1. Business 3Item 2. Properties 11Item 3. Legal Proceedings 14Item 4. Mine Safety Disclosures 17Part IIItem 5. Market For Registrant S Common Equity, Related Stockholder Matters and Issuer Purchases Of Equity Securities 17Item 6. Selected Financial Data 19Item 7. Management S Discussion and Analysis Of Financial Condition and Results Of Operations 20Item 7A. Quantitative and Qualitative Disclosures About Market Risk 36Item 8. Financial Statements and Supplementary Data 36Item 9. Changes in and Disagreements with Accountants on Accounting and Financial Disclosure 108Item 9A. Controls and Procedures 108Item 9B. Other Information 108Part IIIItem 10. Directors, Executive Officers and Corporate Governance 110Item 11. Executive Compensation 115Item 12. Security Ownership Of Certain Beneficial Owners and Management and Related Stockholder Matters 125Item 13. Certain Relationships and Related Transactions and Director Independence 127Item 14. Principal Accounting Fees and Services 127Part IVItem 15. Exhibits and Financial Statement Schedules 128Item 1. BusinessItem 2. PropertiesItem 2. Properties (continued)Item 3. Legal ProceedingsItem 4. Mine Safety DisclosuresItem 5. Market For The Registrant S Common Stock, Related Security Holder Matters, and Issuer Purchases Of Equity SecuritiesItem 6. Selected Financial Data - The Company and Subsidiaries (consolidated)Item 7. Management S Discussion and Analysis Of Financial Condition and Results Of OperationsItem 7A. Quantitative and Qualitative Disclosures About Market RiskItem 8. Financial Statements and Supplementary DataItem 9. Changes in and Disagreements with Accountants on Accounting and Financial DisclosureItem 9A. Controls and ProceduresItem 9B. Other InformationItem 10. Directors, Executive Officers and Corporate GovernanceItem 11. Executive CompensationItem 12 - Security Ownership Of Certain Beneficial Owners and Management and Related Stockholder MattersItem 13. Certain Relationships and Related Transactions and Director IndependenceItem 14. Principal Accounting Fees and ServicesItem 15. Exhibits, Financial Statement Schedules