SOUTHERN CO
10-Ks and 10-Qs
|
|
|
|
|
|
|
|
|
|
|
|
|
|
|
|
|
|
|
|
|
|
|
|
|
|
|
|
|
|
|
|
|
|
|
|
|
|
|
|
|
|
|
|
|
|
|
|
|
|
|
|
|
|
|
|
|
|
|
UNITED STATES
SECURITIES AND EXCHANGE COMMISSION
Washington, D.C. 20549
FORM 10-K
|
þ
|
ANNUAL REPORT PURSUANT TO SECTION 13 OR 15(d) OF THE SECURITIES EXCHANGE ACT OF 1934
|
|
For the Fiscal Year Ended December 31, 2013
OR
|
|
|
¨
|
TRANSITION REPORT PURSUANT TO SECTION 13 OR 15(d) OF THE SECURITIES EXCHANGE ACT OF 1934
|
|
For the Transition Period from to
|
|
|
Commission
File Number
|
Registrant, State of Incorporation,
Address and Telephone Number
|
I.R.S. Employer
Identification No.
|
||
|
1-3526
|
The Southern Company
|
58-0690070
|
||
|
(A Delaware Corporation)
|
||||
|
30 Ivan Allen Jr. Boulevard, N.W.
|
||||
|
Atlanta, Georgia 30308
|
||||
|
(404) 506-5000
|
||||
|
1-3164
|
Alabama Power Company
|
63-0004250
|
||
|
(An Alabama Corporation)
|
||||
|
600 North 18th Street
|
||||
|
Birmingham, Alabama 35291
|
||||
|
(205) 257-1000
|
||||
|
1-6468
|
Georgia Power Company
|
58-0257110
|
||
|
(A Georgia Corporation)
|
||||
|
241 Ralph McGill Boulevard, N.E.
|
||||
|
Atlanta, Georgia 30308
|
||||
|
(404) 506-6526
|
||||
|
001-31737
|
Gulf Power Company
|
59-0276810
|
||
|
(A Florida Corporation)
|
||||
|
One Energy Place
|
||||
|
Pensacola, Florida 32520
|
||||
|
(850) 444-6111
|
||||
|
001-11229
|
Mississippi Power Company
|
64-0205820
|
||
|
(A Mississippi Corporation)
|
||||
|
2992 West Beach Boulevard
|
||||
|
Gulfport, Mississippi 39501
|
||||
|
(228) 864-1211
|
||||
|
333-98553
|
Southern Power Company
|
58-2598670
|
||
|
(A Delaware Corporation)
|
||||
|
30 Ivan Allen Jr. Boulevard, N.W.
|
||||
|
Atlanta, Georgia 30308
|
||||
|
(404) 506-5000
|
||||
Securities registered pursuant to Section 12(b) of the Act:
1
Each of the following classes or series of securities registered pursuant to Section 12(b) of the Act is listed on the New York Stock Exchange.
|
Title of each class
|
Registrant
|
|||
|
Common Stock, $5 par value
|
The Southern Company
|
|||
|
Class A preferred, cumulative, $25 stated capital
|
Alabama Power Company
|
|||
|
5.20% Series 5.83% Series
|
||||
|
5.30% Series
|
||||
|
Class A Preferred Stock, non-cumulative,
Par value $25 per share
|
Georgia Power Company
|
|||
|
6 1/8% Series
|
||||
|
Senior Notes
|
Gulf Power Company
|
|||
|
5.75% Series 2011A
|
||||
|
Mississippi Power Company
|
||||
|
Depositary preferred shares, each representing one-fourth of a share of preferred stock, cumulative, $100 par value
|
||||
|
5.25% Series
|
||||
|
Securities registered pursuant to Section 12(g) of the Act:
1
|
||||
|
Title of each class
|
Registrant
|
|||
|
Preferred stock, cumulative, $100 par value
|
Alabama Power Company
|
|||
|
4.20% Series 4.60% Series
|
4.72% Series
|
|||
|
4.52% Series 4.64% Series
|
4.92% Series
|
|||
|
Preferred stock, cumulative, $100 par value
|
Mississippi Power Company
|
|||
|
4.40% Series 4.60% Series
|
||||
|
4.72% Series
|
||||
|
1
|
As of December 31, 2013.
|
Indicate by check mark if the registrant is a well-known seasoned issuer, as defined in Rule 405 of the Securities Act.
|
Registrant
|
Yes
|
No
|
|
The Southern Company
|
X
|
|
|
Alabama Power Company
|
X
|
|
|
Georgia Power Company
|
X
|
|
|
Gulf Power Company
|
X
|
|
|
Mississippi Power Company
|
X
|
|
|
Southern Power Company
|
X
|
|
Indicate by check mark if the registrant is not required to file reports pursuant to Section 13 or Section 15(d) of the Act. Yes
¨
No
x
(Response applicable to all registrants.)
Indicate by check mark whether the registrants (1) have filed all reports required to be filed by Section 13 or 15(d) of the Securities Exchange Act of 1934 during the preceding 12 months (or for such shorter period that the registrants were required to file such reports), and (2) have been subject to such filing requirements for the past 90 days. Yes
x
No
¨
Indicate by check mark whether the registrants have submitted electronically and posted on their corporate web site, if any, every Interactive Data File required to be submitted and posted pursuant to Rule 405 of Regulation S-T during the preceding 12 months (or for such shorter period that the registrants were required to submit and post such files). Yes
x
No
¨
Indicate by check mark if disclosure of delinquent filers pursuant to Item 405 of Regulation S-K is not contained herein, and will not be contained, to the best of registrants' knowledge, in definitive proxy or information statements incorporated by reference in Part III of this Form 10-K or any amendment to this Form 10-K.
¨
Indicate by check mark whether the registrant is a large accelerated filer, an accelerated filer, a non-accelerated filer, or a smaller reporting company. See the definitions of "large accelerated filer," "accelerated filer" and "smaller reporting company" in Rule 12b-2 of the Exchange Act. (Check one):
|
Registrant
|
Large
Accelerated
Filer
|
Accelerated
Filer
|
Non-accelerated
Filer
|
Smaller
Reporting
Company
|
|
The Southern Company
|
X
|
|||
|
Alabama Power Company
|
X
|
|||
|
Georgia Power Company
|
X
|
|||
|
Gulf Power Company
|
X
|
|||
|
Mississippi Power Company
|
X
|
|||
|
Southern Power Company
|
X
|
|||
Indicate by check mark whether the registrant is a shell company (as defined in Rule 12b-2 of the Exchange Act). Yes
¨
No
x
(Response applicable to all registrants.)
Aggregate market value of The Southern Company's common stock held by non-affiliates of The Southern Company at June 30, 2013: $38.6 billion. All of the common stock of the other registrants is held by The Southern Company. A description of each registrant's common stock follows:
|
Registrant
|
Description of
Common Stock
|
Shares Outstanding
at January 31, 2014
|
|||
|
The Southern Company
|
Par Value $5 Per Share
|
887,940,630
|
|
||
|
Alabama Power Company
|
Par Value $40 Per Share
|
30,537,500
|
|
||
|
Georgia Power Company
|
Without Par Value
|
9,261,500
|
|
||
|
Gulf Power Company
|
Without Par Value
|
5,442,717
|
|
||
|
Mississippi Power Company
|
Without Par Value
|
1,121,000
|
|
||
|
Southern Power Company
|
Par Value $0.01 Per Share
|
1,000
|
|
||
Documents incorporated by reference: specified portions of The Southern Company's Definitive Proxy Statement on Schedule 14A relating to the 2014 Annual Meeting of Stockholders are incorporated by reference into PART III. In addition, specified portions of the Definitive Information Statements on Schedule 14C of Alabama Power Company, Georgia Power Company, and Mississippi Power Company relating to each of their respective 2014 Annual Meetings of Shareholders are incorporated by reference into PART III.
Southern Power Company meets the conditions set forth in General Instructions I(1)(a) and (b) of Form 10-K and is therefore filing this Form 10-K with the reduced disclosure format specified in General Instructions I(2)(b), (c), and (d) of Form 10-K.
This combined Form 10-K is separately filed by The Southern Company, Alabama Power Company, Georgia Power Company, Gulf Power Company, Mississippi Power Company, and Southern Power Company. Information contained herein relating to any individual company is filed by such company on its own behalf. Each company makes no representation as to information relating to the other companies.
Table of Contents
|
Page
|
||
i
DEFINITIONS
When used in Items 1 through 5 and Items 9A through 15, the following terms will have the meanings indicated.
|
Term
|
Meaning
|
|
2010 ARP
|
Alternative Rate Plan approved by the Georgia PSC for Georgia Power for the years 2011 through 2013
|
|
2013 ARP
|
Alternative Rate Plan approved by the Georgia PSC for Georgia Power for the years 2014 through 2016
|
|
Alabama Power
|
Alabama Power Company
|
|
Clean Air Act
|
Clean Air Act Amendments of 1990
|
|
Code
|
Internal Revenue Code of 1986, as amended
|
|
CPCN
|
Certificate of Public Convenience and Necessity
|
|
CWIP
|
Construction Work in Progress
|
|
Dalton
|
City of Dalton, Georgia, acting by and through its Board of Water, Light, and Sinking Fund Commissioners
|
|
DOE
|
United States Department of Energy
|
|
Duke Energy Florida
|
Duke Energy Florida, Inc.
|
|
EPA
|
United States Environmental Protection Agency
|
|
FERC
|
Federal Energy Regulatory Commission
|
|
FMPA
|
Florida Municipal Power Agency
|
|
Georgia Power
|
Georgia Power Company
|
|
Gulf Power
|
Gulf Power Company
|
|
IBEW
|
International Brotherhood of Electrical Workers
|
|
IGCC
|
Integrated coal gasification combined cycle
|
|
IIC
|
Intercompany Interchange Contract
|
|
IPP
|
Independent Power Producer
|
|
IRP
|
Integrated Resource Plan
|
|
Kemper IGCC
|
IGCC facility under construction in Kemper County, Mississippi
|
|
KUA
|
Kissimmee Utility Authority
|
|
KW
|
Kilowatt
|
|
KWH
|
Kilowatt-hour
|
|
MATS rule
|
Mercury and Air Toxics Standards rule
|
|
MEAG Power
|
Municipal Electric Authority of Georgia
|
|
Mississippi Power
|
Mississippi Power Company
|
|
MW
|
Megawatt
|
|
NRC
|
U.S. Nuclear Regulatory Commission
|
|
OPC
|
Oglethorpe Power Corporation
|
|
OUC
|
Orlando Utilities Commission
|
|
Plant Vogtle Units 3 and 4
|
Two new nuclear generating units under construction at Plant Vogtle
|
|
power pool
|
The operating arrangement whereby the integrated generating resources of the traditional operating companies and Southern Power Company are subject to joint commitment and dispatch in order to serve their combined load obligations
|
|
PowerSouth
|
PowerSouth Energy Cooperative
|
|
PPA
|
Power Purchase Agreement
|
ii
DEFINITIONS
(continued)
|
Term
|
Meaning
|
|
PSC
|
Public Service Commission
|
|
registrants
|
Southern Company, Alabama Power, Georgia Power, Gulf Power, Mississippi Power, and Southern Power Company
|
|
RUS
|
Rural Utilities Service
|
|
SCS
|
Southern Company Services, Inc. (the system service company)
|
|
SEC
|
Securities and Exchange Commission
|
|
SEGCO
|
Southern Electric Generating Company
|
|
SEPA
|
Southeastern Power Administration
|
|
SERC
|
Southeastern Electric Reliability Council
|
|
SMEPA
|
South Mississippi Electric Power Association
|
|
Southern Company
|
The Southern Company
|
|
Southern Company system
|
Southern Company, the traditional operating companies, Southern Power, SEGCO, Southern Nuclear, SCS, SouthernLINC Wireless, and other subsidiaries
|
|
Southern Holdings
|
Southern Company Holdings, Inc.
|
|
SouthernLINC Wireless
|
Southern Communications Services, Inc.
|
|
Southern Nuclear
|
Southern Nuclear Operating Company, Inc.
|
|
Southern Power
|
Southern Power Company and its subsidiaries
|
|
traditional operating companies
|
Alabama Power, Georgia Power, Gulf Power, and Mississippi Power
|
iii
CAUTIONARY STATEMENT REGARDING
FORWARD-LOOKING INFORMATION
This Annual Report on Form 10-K contains forward-looking statements. Forward-looking statements include, among other things, statements concerning retail sales, retail rates, the strategic goals for the wholesale business, customer growth, economic recovery, fuel and environmental cost recovery and other rate actions, current and proposed environmental regulations and related estimated expenditures, access to sources of capital, projections for the qualified pension plan, postretirement benefit plan, and nuclear decommissioning trust fund contributions, financing activities, completion dates of construction projects, plans and estimated costs for new generation resources, filings with state and federal regulatory authorities, impact of the American Taxpayer Relief Act of 2012, estimated sales and purchases under new power sale and purchase agreements, and estimated construction and other expenditures. In some cases, forward-looking statements can be identified by terminology such as "may," "will," "could," "should," "expects," "plans," "anticipates," "believes," "estimates," "projects," "predicts," "potential," or "continue" or the negative of these terms or other similar terminology. There are various factors that could cause actual results to differ materially from those suggested by the forward-looking statements; accordingly, there can be no assurance that such indicated results will be realized. These factors include:
|
•
|
the impact of recent and future federal and state regulatory changes, including legislative and regulatory initiatives regarding deregulation and restructuring of the electric utility industry, environmental laws including regulation of water, coal combustion residuals, and emissions of sulfur, nitrogen, carbon, soot, particulate matter, hazardous air pollutants, including mercury, and other substances, and also changes in tax and other laws and regulations to which Southern Company and its subsidiaries are subject, as well as changes in application of existing laws and regulations;
|
|
•
|
current and future litigation, regulatory investigations, proceedings, or inquiries, including the pending EPA civil actions against certain Southern Company subsidiaries, FERC matters, and Internal Revenue Service and state tax audits;
|
|
•
|
the effects, extent, and timing of the entry of additional competition in the markets in which Southern Company's subsidiaries operate;
|
|
•
|
variations in demand for electricity, including those relating to weather, the general economy and recovery from the recent recession, population and business growth (and declines), the effects of energy conservation measures, including from the development and deployment of alternative energy sources such as self-generation and distributed generation technologies, and any potential economic impacts resulting from federal fiscal decisions;
|
|
•
|
available sources and costs of fuels;
|
|
•
|
effects of inflation;
|
|
•
|
ability to control costs and avoid cost overruns during the development and construction of facilities, which include the development and construction of facilities with designs that have not been finalized or previously constructed, including changes in labor costs and productivity factors, adverse weather conditions, shortages and inconsistent quality of equipment, materials, and labor, contractor or supplier delay or non-performance under construction or other agreements, delays associated with start-up activities, including major equipment failure, system integration, and operations, and/or unforeseen engineering problems;
|
|
•
|
ability to construct facilities in accordance with the requirements of permits and licenses and to satisfy any operational and environmental performance standards, including the requirements of tax credits and other incentives;
|
|
•
|
investment performance of Southern Company's employee and retiree benefit plans and the Southern Company system's nuclear decommissioning trust funds;
|
|
•
|
advances in technology;
|
|
•
|
state and federal rate regulations and the impact of pending and future rate cases and negotiations, including rate actions relating to fuel and other cost recovery mechanisms;
|
|
•
|
regulatory approvals and actions related to Plant Vogtle Units 3 and 4, including Georgia PSC approvals, and NRC actions;
|
|
•
|
actions related to cost recovery for the Kemper IGCC, including actions relating to proposed securitization, Mississippi PSC approval of Mississippi Power's proposed rate recovery plan, as ultimately amended, which includes the ability to complete the proposed sale of an interest in the Kemper IGCC to SMEPA, the ability to utilize bonus depreciation, which currently requires that the Kemper IGCC be placed in service in 2014, and satisfaction of requirements to utilize investment tax credits and grants;
|
iv
|
•
|
Mississippi PSC review of the prudence of Kemper IGCC costs;
|
|
•
|
the outcome of any legal or regulatory proceedings regarding the Mississippi PSC's issuance of the CPCN for the Kemper IGCC, the settlement agreement between Mississippi Power and the Mississippi PSC, or the State of Mississippi legislation designed to enhance the Mississippi PSC's authority to facilitate development and construction of baseload generation in the State of Mississippi;
|
|
•
|
the inherent risks involved in operating and constructing nuclear generating facilities, including environmental, health, regulatory, natural disaster, terrorism, or financial risks;
|
|
•
|
the performance of projects undertaken by the non-utility businesses and the success of efforts to invest in and develop new opportunities;
|
|
•
|
internal restructuring or other restructuring options that may be pursued;
|
|
•
|
potential business strategies, including acquisitions or dispositions of assets or businesses, which cannot be assured to be completed or beneficial to Southern Company or its subsidiaries;
|
|
•
|
the ability of counterparties of Southern Company and its subsidiaries to make payments as and when due and to perform as required;
|
|
•
|
the ability to obtain new short- and long-term contracts with wholesale customers;
|
|
•
|
the direct or indirect effect on the Southern Company system's business resulting from terrorist incidents and the threat of terrorist incidents, including cyber intrusion;
|
|
•
|
interest rate fluctuations and financial market conditions and the results of financing efforts, including Southern Company's and its subsidiaries' credit ratings;
|
|
•
|
the impacts of any potential U.S. credit rating downgrade or other sovereign financial issues, including impacts on interest rates, access to capital markets, impacts on currency exchange rates, counterparty performance, and the economy in general, as well as potential impacts on the benefits of the DOE loan guarantees;
|
|
•
|
the ability of Southern Company and its subsidiaries to obtain additional generating capacity at competitive prices;
|
|
•
|
catastrophic events such as fires, earthquakes, explosions, floods, hurricanes, droughts, pandemic health events such as influenzas, or other similar occurrences;
|
|
•
|
the direct or indirect effects on the Southern Company system's business resulting from incidents affecting the U.S. electric grid or operation of generating resources;
|
|
•
|
the effect of accounting pronouncements issued periodically by standard setting bodies; and
|
|
•
|
other factors discussed elsewhere herein and in other reports filed by the registrants from time to time with the SEC.
|
The registrants expressly disclaim any obligation to update any forward-looking statements.
v
|
Item 1.
|
BUSINESS
|
Southern Company was incorporated under the laws of Delaware on November 9, 1945. Southern Company is registered and qualified to do business under the laws of Georgia and is qualified to do business as a foreign corporation under the laws of Alabama. Southern Company owns all of the outstanding common stock of Alabama Power, Georgia Power, Gulf Power, and Mississippi Power, each of which is an operating public utility company. The traditional operating companies supply electric service in the states of Alabama, Georgia, Florida, and Mississippi. More particular information relating to each of the traditional operating companies is as follows:
Alabama Power
is a corporation organized under the laws of the State of Alabama on November 10, 1927, by the consolidation of a predecessor Alabama Power Company, Gulf Electric Company, and Houston Power Company. The predecessor Alabama Power Company had been in continuous existence since its incorporation in 1906.
Georgia Power
was incorporated under the laws of the State of Georgia on June 26, 1930 and was admitted to do business in Alabama on September 15, 1948 and in Florida on October 13, 1997.
Gulf Power
is a Florida corporation that has had a continuous existence since it was originally organized under the laws of the State of Maine on November 2, 1925. Gulf Power was admitted to do business in Florida on January 15, 1926, in Mississippi on October 25, 1976, and in Georgia on November 20, 1984. Gulf Power became a Florida corporation after being domesticated under the laws of the State of Florida on November 2, 2005.
Mississippi Power
was incorporated under the laws of the State of Mississippi on July 12, 1972, was admitted to do business in Alabama on November 28, 1972, and effective December 21, 1972, by the merger into it of the predecessor Mississippi Power Company, succeeded to the business and properties of the latter company. The predecessor Mississippi Power Company was incorporated under the laws of the State of Maine on November 24, 1924 and was admitted to do business in Mississippi on December 23, 1924 and in Alabama on December 7, 1962.
In addition, Southern Company owns all of the common stock of Southern Power Company, which is also an operating public utility company. Southern Power constructs, acquires, owns, and manages generation assets, including renewable energy projects, and sells electricity at market-based rates in the wholesale market. Southern Power Company is a corporation organized under the laws of Delaware on January 8, 2001 and was admitted to do business in the States of Alabama, Florida, and Georgia on January 10, 2001, in the State of Mississippi on January 30, 2001, in the State of North Carolina on February 19, 2007, and in the State of South Carolina on March 31, 2009. Certain of Southern Power Company's subsidiaries are also admitted to do business in the States of California, Nevada, New Mexico, and Texas.
Southern Company also owns all of the outstanding common stock or membership interests of SouthernLINC Wireless, Southern Nuclear, SCS, Southern Holdings, and other direct and indirect subsidiaries. SouthernLINC Wireless provides digital wireless communications for use by Southern Company and its subsidiary companies and markets these services to the public and also provides wholesale fiber optic solutions to telecommunication providers in the Southeast. Southern Nuclear operates and provides services to Alabama Power's and Georgia Power's nuclear plants and is currently developing Plant Vogtle Units 3 and 4, which are co-owned by Georgia Power. SCS is the system service company providing, at cost, specialized services to Southern Company and its subsidiary companies. Southern Holdings is an intermediate holding subsidiary, primarily for Southern Company's investments in leveraged leases.
Alabama Power and Georgia Power each own 50% of the outstanding common stock of SEGCO. SEGCO is an operating public utility company that owns electric generating units with an aggregate capacity of 1,019,680 KWs at Plant Gaston on the Coosa River near Wilsonville, Alabama. Alabama Power and Georgia Power are each entitled to one-half of SEGCO's capacity and energy. Alabama Power acts as SEGCO's agent in the operation of SEGCO's units and furnishes fuel to SEGCO for its units. SEGCO also owns one 230,000 volt transmission line extending from Plant Gaston to the Georgia state line at which point connection is made with the Georgia Power transmission line system.
Southern Company's segment information is included in Note 12 to the financial statements of Southern Company in Item 8 herein.
The registrants' Annual Reports on Form 10-K, Quarterly Reports on Form 10-Q, Current Reports on Form 8-K, and all amendments to those reports are made available on Southern Company's website, free of charge, as soon as reasonably practicable after such material is electronically filed with or furnished to the SEC. Southern Company's internet address is www.southerncompany.com.
I-1
The Southern Company System
Traditional Operating Companies
The traditional operating companies own generation, transmission, and distribution facilities. See PROPERTIES in Item 2 herein for additional information on the traditional operating companies' generating facilities. Each company's transmission facilities are connected to the respective company's own generating plants and other sources of power (including certain generating plants owned by Southern Power) and are interconnected with the transmission facilities of the other traditional operating companies and SEGCO. For information on the State of Georgia's integrated transmission system, see "Territory Served by the Traditional Operating Companies and Southern Power" herein.
Agreements in effect with principal neighboring utility systems provide for capacity and energy transactions that may be entered into from time to time for reasons related to reliability or economics. Additionally, the traditional operating companies have entered into voluntary reliability agreements with the subsidiaries of Entergy Corporation, Florida Electric Power Coordinating Group, and Tennessee Valley Authority and with Duke Energy Progress, Inc., Duke Energy Carolinas, LLC, South Carolina Electric & Gas Company, and Virginia Electric and Power Company, each of which provides for the establishment and periodic review of principles and procedures for planning and operation of generation and transmission facilities, maintenance schedules, load retention programs, emergency operations, and other matters affecting the reliability of bulk power supply. The traditional operating companies have joined with other utilities in the Southeast (including some of those referred to above) to form the SERC to augment further the reliability and adequacy of bulk power supply. Through the SERC, the traditional operating companies are represented on the National Electric Reliability Council.
The utility assets of the traditional operating companies and certain utility assets of Southern Power are operated as a single integrated electric system, or power pool, pursuant to the IIC. Activities under the IIC are administered by SCS, which acts as agent for the traditional operating companies and Southern Power Company. The fundamental purpose of the power pool is to provide for the coordinated operation of the electric facilities in an effort to achieve the maximum possible economies consistent with the highest practicable reliability of service. Subject to service requirements and other operating limitations, system resources are committed and controlled through the application of centralized economic dispatch. Under the IIC, each traditional operating company and Southern Power Company retains its lowest cost energy resources for the benefit of its own customers and delivers any excess energy to the power pool for use in serving customers of other traditional operating companies or Southern Power Company or for sale by the power pool to third parties. The IIC provides for the recovery of specified costs associated with the affiliated operations thereunder, as well as the proportionate sharing of costs and revenues resulting from power pool transactions with third parties.
Southern Company, each traditional operating company, Southern Power Company, Southern Nuclear, SEGCO, and other subsidiaries have contracted with SCS to furnish, at direct or allocated cost and upon request, the following services: general and design engineering, operations, purchasing, accounting, finance and treasury, tax, information technology, marketing, auditing, insurance and pension administration, human resources, systems and procedures, digital wireless communications, and other services with respect to business and operations, construction management, and power pool transactions. Southern Power Company and SouthernLINC Wireless have also secured from the traditional operating companies certain services which are furnished at cost and, in the case of Southern Power Company, which are subject to FERC regulations.
Alabama Power and Georgia Power each have a contract with Southern Nuclear to operate the Southern Company system's existing nuclear plants, Plants Farley, Hatch, and Vogtle. In addition, Georgia Power has a contract with Southern Nuclear to develop, license, construct, and operate Plant Vogtle Units 3 and 4. See "Regulation – Nuclear Regulation" herein for additional information.
Southern Power
Southern Power Company is an electric wholesale generation subsidiary with market-based rate authority from the FERC. Southern Power constructs, acquires, owns, and manages generation assets, including renewable energy projects, and sells electricity at market-based rates in the wholesale market. Southern Power continually seeks opportunities to execute its strategy to create value through various transactions, including acquisitions and sales of assets, construction of new power plants, and entry into PPAs primarily with investor owned utilities, independent power producers, municipalities, and electric cooperatives. Southern Power Company's business activities are not subject to traditional state regulation like the traditional operating companies but are subject to regulation by the FERC. Southern Power has attempted to insulate itself from significant fuel supply, fuel transportation, and electric transmission risks by generally making such risks the responsibility of the counterparties to its PPAs. However, Southern Power's future earnings will depend on the parameters of the wholesale market and the efficient operation of its wholesale generating assets. For additional information on Southern Power's business activities, see MANAGEMENT'S DISCUSSION AND ANALYSIS – OVERVIEW – "Business Activities" of Southern Power in Item 7 herein.
I-2
In June 2012, Southern Power completed construction of Plant Nacogdoches, a biomass generating plant near Sacul, Texas with a nameplate capacity of approximately 116 MWs. Nacogdoches Power, LLC, a wholly-owned subsidiary of Southern Power Company, has a PPA covering the entire output of the plant from 2012 through 2032.
In December 2012, Southern Power completed construction of Plant Cleveland Units 1 through 4, a combustion turbine natural gas generating plant, in Cleveland County, North Carolina. The plant has a nameplate capacity of 720 MWs. Southern Power has long-term PPAs for 540 MWs of the generating capacity of the plant (180 MWs through 2031 and 360 MWs through 2036).
In 2012, Southern Power and Turner Renewable Energy, Inc. (TRE), through Southern Turner Renewable Energy LLC (STR), a jointly-owned subsidiary owned 90% by a subsidiary of Southern Power Company, acquired all of the outstanding membership interests of Apex Nevada Solar, LLC (Apex), Spectrum Nevada Solar, LLC (Spectrum), and Granville Solar, LLC (Granville). Apex owns a 20-MW solar photovoltaic facility in North Las Vegas, Nevada, which began commercial operation in July 2012. Apex has a PPA covering the entire output of the plant from 2012 through 2037. Granville owns a 2.5-MW solar photovoltaic facility in Oxford, North Carolina, which began commercial operation in October 2012. Granville has a PPA covering the entire output of the plant from 2012 through 2032. Spectrum owns a 30-MW solar photovoltaic facility in North Las Vegas, Nevada, which began commercial operation on September 23, 2013. Spectrum has a PPA covering the entire output of the plant from 2013 through 2038.
On April 23, 2013, Southern Power and TRE, through STR, acquired all of the outstanding membership interests of Campo Verde Solar, LLC (Campo Verde). Campo Verde owns an approximately 139-MW solar facility in Southern California, which began commercial operation on October 25, 2013. The output of the plant is contracted under a 20-year PPA with San Diego Gas & Electric Company, a subsidiary of Sempra Energy.
On August 27, 2013, Southern Power and TRE, through STR, entered into a purchase agreement with Sun Edison, LLC, the developer of the project, which provides for the acquisition of all of the outstanding membership interests of Adobe Solar, LLC (Adobe) by STR. Adobe is constructing an approximately 20-MW solar generating facility in Kern County, California. The solar facility is expected to begin commercial operation in spring 2014. Southern Power's purchase of Adobe for approximately $100 million is expected to occur in spring 2014. The output of the plant is contracted under a 20-year PPA with Southern California Edison.
As of December 31, 2013, Southern Power had 8,924 MWs of nameplate capacity in commercial operation.
See MANAGEMENT'S DISCUSSION AND ANALYSIS – FUTURE EARNINGS POTENTIAL – "Power Sales Agreements" and "Acquisitions" of Southern Power in Item 7 herein and Note 2 to the financial statements of Southern Power in Item 8 herein for additional information.
Other Businesses
Southern Holdings is an intermediate holding subsidiary, primarily for Southern Company's investments in leveraged leases.
SouthernLINC Wireless provides digital wireless communications for use by Southern Company and its subsidiary companies and markets its services to non-affiliates within the Southeast. SouthernLINC Wireless delivers multiple wireless communication options including push to talk, cellular service, text messaging, wireless internet access, and wireless data. Its system covers approximately 127,000 square miles in the Southeast. SouthernLINC Wireless also provides wholesale fiber optic solutions to telecommunication providers in the Southeast under the name Southern Telecom.
These efforts to invest in and develop new business opportunities offer potential returns exceeding those of rate-regulated operations. However, these activities also involve a higher degree of risk.
I-3
Construction Programs
The subsidiary companies of Southern Company are engaged in continuous construction programs to accommodate existing and estimated future loads on their respective systems. For estimated construction and environmental expenditures for the periods 2014 through 2016, see MANAGEMENT'S DISCUSSION AND ANALYSIS – FINANCIAL CONDITION AND LIQUIDITY – "Capital Requirements and Contractual Obligations" of Southern Company, each traditional operating company, and Southern Power in Item 7 herein. The Southern Company system's construction program consists of capital investment and capital expenditures to comply with environmental statutes and regulations. In 2014, the construction program is expected to be apportioned approximately as follows:
|
Southern
Company
system *
|
Alabama
Power
|
Georgia
Power
|
Gulf
Power
|
Mississippi
Power
|
|||||||||||
|
(in millions)
|
|||||||||||||||
|
New Generation
|
$
|
1,148
|
|
$
|
—
|
|
$
|
658
|
|
$
|
—
|
|
$
|
490
|
|
|
Environmental **
|
1,457
|
|
505
|
|
543
|
|
255
|
|
154
|
|
|||||
|
Transmission & Distribution Growth
|
412
|
|
121
|
|
254
|
|
22
|
|
15
|
|
|||||
|
Maintenance (Generation, Transmission, and Distribution)
|
1,858
|
|
870
|
|
792
|
|
108
|
|
88
|
|
|||||
|
Nuclear Fuel
|
325
|
|
141
|
|
184
|
|
—
|
|
—
|
|
|||||
|
General Plant
|
222
|
|
97
|
|
106
|
|
9
|
|
10
|
|
|||||
|
5,422
|
|
1,734
|
|
2,537
|
|
394
|
|
757
|
|
||||||
|
Southern Power
|
477
|
|
—
|
|
—
|
|
—
|
|
—
|
|
|||||
|
Other subsidiaries
|
163
|
|
—
|
|
—
|
|
—
|
|
—
|
|
|||||
|
Total
|
$
|
6,062
|
|
$
|
1,734
|
|
$
|
2,537
|
|
$
|
394
|
|
$
|
757
|
|
|
*
|
These amounts include the amounts for the traditional operating companies (as detailed in the table above) as well as the amounts for Southern Power and the other subsidiaries. See "Other Businesses" herein for additional information.
|
|
**
|
Reflects cost estimates for environmental regulations. The Southern Company system continues to monitor the development of the EPA's proposed water and coal combustion residuals rules and to evaluate compliance options. See MANAGEMENT'S DISCUSSION AND ANALYSIS – FUTURE EARNINGS POTENTIAL – "Environmental Matters – Environmental Statutes and Regulations" and FINANCIAL CONDITION AND LIQUIDITY – "Capital Requirements and Contractual Obligations" of Southern Company and each traditional operating company in Item 7 herein for additional information.
|
The construction programs are subject to periodic review and revision, and actual construction costs may vary from these estimates because of numerous factors. These factors include: changes in business conditions; changes in load projections; changes in the expected environmental compliance program; changes in environmental statutes and regulations; the outcome of any legal challenges to the environmental rules; changes in generating plants, including unit retirements and replacements and adding or changing fuel sources at existing units, to meet regulatory requirements; changes in FERC rules and regulations; PSC approvals; changes in legislation; the cost and efficiency of construction labor, equipment, and materials; project scope and design changes; storm impacts; and the cost of capital. In addition, there can be no assurance that costs related to capital expenditures will be fully recovered.
In addition, the construction program includes the development and construction of new generating facilities with designs that have not been finalized or previously constructed, including “first-of-its-kind” technology which may result in revised estimates during construction. The ability to control costs and avoid cost overruns during the development and construction of new facilities is subject to a number of factors, including changes in labor costs and productivity factors, adverse weather conditions, shortages and inconsistent quality of equipment, materials, and labor, contractor or supplier delay or non-performance under construction or other agreements, delays associated with start-up activities, including major equipment failure, system integration, and operations, and/or unforeseen engineering problems.
See "Regulation – Environmental Statutes and Regulations" herein for additional information with respect to certain existing and proposed environmental requirements and PROPERTIES – "Jointly-Owned Facilities" in Item 2 herein for additional
I-4
information concerning Alabama Power's, Georgia Power's, and Southern Power's joint ownership of certain generating units and related facilities with certain non-affiliated utilities. See Note 3 to the financial statements of Southern Company and Georgia Power under "Retail Regulatory Matters – Georgia Power – Nuclear Construction" and "Retail Regulatory Matters – Nuclear Construction," respectively, for additional information regarding Georgia Power’s construction of Plant Vogtle Units 3 and 4. Also see Note 3 to the financial statements of Southern Company and Mississippi Power under "Integrated Coal Gasification Combined Cycle" for additional information regarding Mississippi Power’s construction of the Kemper IGCC.
Financing Programs
See each of the registrant's MANAGEMENT'S DISCUSSION AND ANALYSIS – FINANCIAL CONDITION AND LIQUIDITY in Item 7 herein and Note 6 to the financial statements of each registrant in Item 8 herein for information concerning financing programs.
Fuel Supply
The traditional operating companies' and SEGCO's supply of electricity is primarily fueled by natural gas and coal. Southern Power's supply of electricity is primarily fueled by natural gas. See MANAGEMENT'S DISCUSSION AND ANALYSIS – RESULTS OF OPERATION – "Electricity Business – Fuel and Purchased Power Expenses" of Southern Company and MANAGEMENT'S DISCUSSION AND ANALYSIS – RESULTS OF OPERATION – "Fuel and Purchased Power Expenses" of each traditional operating company in Item 7 herein for information regarding the electricity generated and the average cost of fuel in cents per net KWH generated for the years 2011 through 2013.
The traditional operating companies have agreements in place from which they expect to receive substantially all of their coal burn requirements in 2014. These agreements have terms ranging between one and eight years. In 2013, the weighted average sulfur content of all coal burned by the traditional operating companies was 0.75% sulfur. This sulfur level, along with banked and purchased sulfur dioxide allowances, allowed the traditional operating companies to remain within limits set by Phase I of the Clean Air Interstate Rule (CAIR) under the Clean Air Act. In 2013, the Southern Company system did not purchase any sulfur dioxide allowances, annual nitrogen oxide emission allowances, or seasonal nitrogen oxide emission allowances from the market. As any additional environmental regulations are proposed that impact the utilization of coal, the traditional operating companies' fuel mix will be monitored to help ensure that the traditional operating companies remain in compliance with applicable laws and regulations. Additionally, Southern Company and the traditional operating companies will continue to evaluate the need to purchase additional emissions allowances, the timing of capital expenditures for emissions control equipment, and potential unit retirements and replacements. See MANAGEMENT'S DISCUSSION AND ANALYSIS – FUTURE EARNINGS POTENTIAL – "Environmental Matters" of Southern Company, each traditional operating company, and Southern Power in Item 7 herein for additional information on environmental matters.
SCS, acting on behalf of the traditional operating companies and Southern Power Company, has agreements in place for the natural gas burn requirements of the Southern Company system. For 2014, SCS has contracted for 431 billion cubic feet of natural gas supply under agreements with remaining terms up to seven years. In addition to natural gas supply, SCS has contracts in place for both firm natural gas transportation and storage. Management believes these contracts provide sufficient natural gas supplies, transportation, and storage to ensure normal operations of the Southern Company system's natural gas generating units.
Alabama Power and Georgia Power have numerous contracts covering a portion of their nuclear fuel needs for uranium, conversion services, enrichment services, and fuel fabrication. These contracts have varying expiration dates and most of them are for less than 10 years. Management believes sufficient capacity for nuclear fuel supplies and processing exists to preclude the impairment of normal operations of the Southern Company system's nuclear generating units.
Changes in fuel prices to the traditional operating companies are generally reflected in fuel adjustment clauses contained in rate schedules. See "Rate Matters – Rate Structure and Cost Recovery Plans" herein for additional information. Southern Power's PPAs generally provide that the counterparty is responsible for substantially all of the cost of fuel.
Alabama Power and Georgia Power have contracts with the United States, acting through the DOE, that provide for the permanent disposal of spent nuclear fuel. The DOE failed to begin disposing of spent fuel in 1998, as required by the contracts, and Alabama Power and Georgia Power have pursued and are pursuing legal remedies against the government for breach of contract. See Note 3 to the financial statements of Southern Company, Alabama Power, and Georgia Power under "Nuclear Fuel Disposal Costs" in Item 8 herein for additional information.
Territory Served by the Traditional Operating Companies and Southern Power
The territory in which the traditional operating companies provide electric service comprises most of the states of Alabama and Georgia together with the northwestern portion of Florida and southeastern Mississippi. In this territory there are non-affiliated electric distribution systems that obtain some or all of their power requirements either directly or indirectly from the traditional
I-5
operating companies. The territory has an area of approximately 120,000 square miles and an estimated population of approximately 16 million. Southern Power sells electricity at market-based rates in the wholesale market primarily to investor-owned utilities, IPPs, municipalities, and electric cooperatives.
Alabama Power is engaged, within the State of Alabama, in the generation and purchase of electricity and the transmission, distribution, and sale of such electricity, at retail in approximately 400 cities and towns (including Anniston, Birmingham, Gadsden, Mobile, Montgomery, and Tuscaloosa), as well as in rural areas, and at wholesale to 14 municipally-owned electric distribution systems, 11 of which are served indirectly through sales to Alabama Municipal Electric Authority, and two rural distributing cooperative associations. Alabama Power owns coal reserves near its Plant Gorgas and uses the output of coal from the reserves in its generating plants. Alabama Power also sells, and cooperates with dealers in promoting the sale of, electric appliances.
Georgia Power is engaged in the generation and purchase of electricity and the transmission, distribution, and sale of such electricity within the State of Georgia, at retail in over 600 communities (including Athens, Atlanta, Augusta, Columbus, Macon, Rome, and Savannah), as well as in rural areas, and at wholesale currently to OPC, MEAG Power, Dalton, various electric membership corporations, and non-affiliated utilities.
Gulf Power is engaged, within the northwestern portion of Florida, in the generation and purchase of electricity and the transmission, distribution, and sale of such electricity, at retail in 71 communities (including Pensacola, Panama City, and Fort Walton Beach), as well as in rural areas, and at wholesale to a non-affiliated utility.
Mississippi Power is engaged in the generation and purchase of electricity and the transmission, distribution, and sale of such electricity within 23 counties in southeastern Mississippi, at retail in 123 communities (including Biloxi, Gulfport, Hattiesburg, Laurel, Meridian, and Pascagoula), as well as in rural areas, and at wholesale to one municipality, six rural electric distribution cooperative associations, and one generating and transmitting cooperative.
For information relating to KWH sales by customer classification for the traditional operating companies, see MANAGEMENT'S DISCUSSION AND ANALYSIS – RESULTS OF OPERATIONS of each traditional operating company in Item 7 herein. Also, for information relating to the sources of revenues for Southern Company, each traditional operating company, and Southern Power, reference is made to Item 7 herein.
The RUS has authority to make loans to cooperative associations or corporations to enable them to provide electric service to customers in rural sections of the country. There are 71 electric cooperative organizations operating in the territory in which the traditional operating companies provide electric service at retail or wholesale.
One of these organizations, PowerSouth, is a generating and transmitting cooperative selling power to several distributing cooperatives, municipal systems, and other customers in south Alabama and northwest Florida. PowerSouth owns generating units with approximately 2,027 MWs of nameplate capacity, including an undivided 8.16% ownership interest in Alabama Power's Plant Miller Units 1 and 2. PowerSouth's facilities were financed with RUS loans secured by long-term contracts requiring distributing cooperatives to take their requirements from PowerSouth to the extent such energy is available. See PROPERTIES – "Jointly-Owned Facilities" in Item 2 herein for details of Alabama Power's joint-ownership with PowerSouth of a portion of Plant Miller.
Alabama Power and Gulf Power have entered into separate agreements with PowerSouth involving interconnection between their respective systems. The delivery of capacity and energy from PowerSouth to certain distributing cooperatives in the service territories of Alabama Power and Gulf Power is governed by the Southern Company/PowerSouth Network Transmission Service Agreement. The rates for this service to PowerSouth are on file with the FERC.
Four electric cooperative associations, financed by the RUS, operate within Gulf Power's service territory. These cooperatives purchase their full requirements from PowerSouth and SEPA (a federal power marketing agency). A non-affiliated utility also operates within Gulf Power's service territory and purchases its full requirements from Gulf Power.
Mississippi Power has an interchange agreement with SMEPA, a generating and transmitting cooperative, pursuant to which various services are provided. In 2010, Mississippi Power and SMEPA entered into an asset purchase agreement whereby SMEPA agreed to purchase a 17.5% undivided interest in the Kemper IGCC. In February 2012, the Mississippi PSC approved the sale and transfer of 17.5% of the Kemper IGCC to SMEPA. In June 2012, Mississippi Power and SMEPA signed an amendment to the asset purchase agreement whereby SMEPA reduced its purchase commitment percentage from a 17.5% to a 15% undivided interest in the Kemper IGCC, subject to approval by the Mississippi PSC. On March 29, 2013, Mississippi Power and SMEPA signed an amendment to the asset purchase agreement whereby Mississippi Power and SMEPA agreed to amend the PPA entered into by the parties in April 2011 to reduce the capacity amounts to be received by SMEPA by half (approximately 75 MWs) effective with the sale and transfer of an undivided interest in the Kemper IGCC to SMEPA. On December 24, 2013, Mississippi Power and SMEPA agreed to extend SMEPA's option to purchase through December 31, 2014. The sale and transfer of an interest in the Kemper IGCC to SMEPA is subject to approval by the Mississippi PSC. The closing
I-6
of this transaction is conditioned upon execution of a joint ownership and operating agreement, receipt of all construction permits, appropriate regulatory approvals, financing, and other conditions.
There are also 65 municipally-owned electric distribution systems operating in the territory in which the traditional operating companies provide electric service at retail or wholesale.
Forty-eight municipally-owned electric distribution systems and one county-owned system receive their requirements through MEAG Power, which was established by a Georgia state statute in 1975. MEAG Power serves these requirements from self-owned generation facilities, some of which are jointly-owned with Georgia Power, and purchases from other resources. MEAG Power also has a pseudo scheduling and services agreement with Georgia Power. Dalton serves its requirements from self-owned generation facilities, some of which are jointly-owned with Georgia Power, and through purchases from Georgia Power and Southern Power through a service agreement. See PROPERTIES – "Jointly-Owned Facilities" in Item 2 herein for additional information.
Georgia Power has entered into substantially similar agreements with Georgia Transmission Corporation, MEAG Power, and Dalton providing for the establishment of an integrated transmission system to carry the power and energy of all parties. The agreements require an investment by each party in the integrated transmission system in proportion to its respective share of the aggregate system load. See PROPERTIES – "Jointly-Owned Facilities" in Item 2 herein for additional information.
Southern Power has PPAs with some of the traditional operating companies and with other investor-owned utilities, IPPs, municipalities, electric cooperatives, and an energy marketing firm. See MANAGEMENT'S DISCUSSION AND ANALYSIS – FUTURE EARNINGS POTENTIAL – "Power Sales Agreements" of Southern Power in Item 7 herein for additional information concerning Southern Power's PPAs.
SCS, acting on behalf of the traditional operating companies, also has a contract with SEPA providing for the use of the traditional operating companies' facilities at government expense to deliver to certain cooperatives and municipalities, entitled by federal statute to preference in the purchase of power from SEPA, quantities of power equivalent to the amounts of power allocated to them by SEPA from certain United States government hydroelectric projects.
Pursuant to the 1956 Utility Act, the Mississippi PSC issued "Grandfather Certificates" of public convenience and necessity to Mississippi Power and to six distribution rural cooperatives operating in southeastern Mississippi, then served in whole or in part by Mississippi Power, authorizing them to distribute electricity in certain specified geographically described areas of the state. The six cooperatives serve approximately 325,000 retail customers in a certificated area of approximately 10,300 square miles. In areas included in a "Grandfather Certificate," the utility holding such certificate may, without further certification, extend its lines up to five miles; other extensions within that area by such utility, or by other utilities, may not be made except upon a showing of, and a grant of a certificate of, public convenience and necessity. Areas included in such a certificate which are subsequently annexed to municipalities may continue to be served by the holder of the certificate, irrespective of whether it has a franchise in the annexing municipality. On the other hand, the holder of the municipal franchise may not extend service into such newly annexed area without authorization by the Mississippi PSC.
Competition
The electric utility industry in the United States is continuing to evolve as a result of regulatory and competitive factors. Among the early primary agents of change was the Energy Policy Act of 1992 which allowed IPPs to access a utility's transmission network in order to sell electricity to other utilities.
The competition for retail energy sales among competing suppliers of energy is influenced by various factors, including price, availability, technological advancements, service, and reliability. These factors are, in turn, affected by, among other influences, regulatory, political, and environmental considerations, taxation, and supply.
The retail service rights of all electric suppliers in the State of Georgia are regulated by the Territorial Electric Service Act of 1973. Pursuant to the provisions of this Act, all areas within existing municipal limits were assigned to the primary electric supplier therein. Areas outside of such municipal limits were either to be assigned or to be declared open for customer choice of supplier by action of the Georgia PSC pursuant to standards set forth in this Act. Consistent with such standards, the Georgia PSC has assigned substantially all of the land area in the state to a supplier. Notwithstanding such assignments, this Act provides that any new customer locating outside of 1973 municipal limits and having a connected load of at least 900 KWs may exercise a one-time choice for the life of the premises to receive electric service from the supplier of its choice.
Generally, the traditional operating companies have experienced, and expect to continue to experience, competition in their respective retail service territories in varying degrees from the development and deployment of alternative energy sources such as self-generation (as described below) and distributed generation technologies, as well as other factors.
Southern Power competes with investor owned utilities, IPPs, and others for wholesale energy sales primarily in the Southeastern U.S. wholesale market. The needs of this market are driven by the demands of end users in the Southeast and the
I-7
generation available. Southern Power's success in wholesale energy sales is influenced by various factors including reliability and availability of Southern Power's plants, availability of transmission to serve the demand, price, and Southern Power's ability to contain costs.
Alabama Power currently has cogeneration contracts in effect with 12 industrial customers. Under the terms of these contracts, Alabama Power purchases excess energy generated by such companies. During 2013, Alabama Power purchased approximately 151 million KWHs from such companies at a cost of $5.0 million.
Georgia Power currently has contracts in effect with 25 small power producers whereby Georgia Power purchases their excess generation. During 2013, Georgia Power purchased 393 million KWHs from such companies at a cost of $25 million. Georgia Power also has a PPA for electricity with one cogeneration facility. Payments are subject to reductions for failure to meet minimum capacity output. During 2013, Georgia Power purchased 73 million KWHs at a cost of $16 million from this facility.
Also during 2013, Georgia Power purchased energy from four customer-owned generating facilities. These customers provide only energy to Georgia Power and make no capacity commitment and are not dispatched by Georgia Power. During 2013, Georgia Power purchased a total of 34 million KWHs from the four customers at a cost of approximately $1 million.
Gulf Power currently has agreements in effect with various industrial, commercial, and qualifying facilities pursuant to which Gulf Power purchases "as available" energy from customer-owned generation. During 2013, Gulf Power purchased 266 million KWHs from such companies for approximately $10.2 million.
Mississippi Power currently has a cogeneration agreement in effect with one of its industrial customers. Under the terms of this contract, Mississippi Power purchases any excess generation. During 2013, Mississippi Power did not purchase any excess generation from this customer.
Seasonality
The demand for electric power generation is affected by seasonal differences in the weather. At the traditional operating companies and Southern Power, the demand for power peaks during the summer months, with market prices reflecting the demand of power and available generating resources at that time. Power demand peaks can also be recorded during the winter. As a result, the overall operating results of Southern Company, the traditional operating companies, and Southern Power in the future may fluctuate substantially on a seasonal basis. In addition, Southern Company, the traditional operating companies, and Southern Power have historically sold less power when weather conditions are milder.
Regulation
State Commissions
The traditional operating companies are subject to the jurisdiction of their respective state PSCs. The PSCs have broad powers of supervision and regulation over public utilities operating in the respective states, including their rates, service regulations, sales of securities (except for the Mississippi PSC), and, in the cases of the Georgia PSC and the Mississippi PSC, in part, retail service territories. See "Territory Served by the Traditional Operating Companies and Southern Power" and "Rate Matters" herein for additional information.
Federal Power Act
The traditional operating companies, Southern Power Company and certain of its generation subsidiaries, and SEGCO are all public utilities engaged in wholesale sales of energy in interstate commerce and therefore are subject to the rate, financial, and accounting jurisdiction of the FERC under the Federal Power Act. The FERC must approve certain financings and allows an "at cost standard" for services rendered by system service companies such as SCS and Southern Nuclear. The FERC is also authorized to establish regional reliability organizations which enforce reliability standards, address impediments to the construction of transmission, and prohibit manipulative energy trading practices.
Alabama Power and Georgia Power are also subject to the provisions of the Federal Power Act or the earlier Federal Water Power Act applicable to licensees with respect to their hydroelectric developments. Among the hydroelectric projects subject to licensing by the FERC are 14 existing Alabama Power generating stations having an aggregate installed capacity of 1,662,400 KWs and 18 existing Georgia Power generating stations having an aggregate installed capacity of 1,087,296 KWs.
In 2005, Alabama Power filed two applications with the FERC for new 50-year licenses for its seven hydroelectric developments on the Coosa River (Weiss, Henry, Logan Martin, Lay, Mitchell, Jordan, and Bouldin) and for the Lewis Smith and Bankhead developments on the Warrior River. The FERC licenses for all of these nine projects expired in 2007. Since the FERC did not act on Alabama Power's new license applications prior to the expiration of the existing licenses, the FERC is required by law to issue annual licenses to Alabama Power, under the terms and conditions of the existing licenses, until action is taken on the new license applications.
I-8
The FERC issued annual licenses for the Coosa developments and the Warrior River developments in 2007. These annual licenses are automatically renewed each year without further action by the FERC to allow Alabama Power to continue operation of the projects under the terms of the previous license while the FERC completes review of the applications for new licenses. Though the Coosa application remains pending before the FERC, in 2010, the FERC issued a new 30 year license to Alabama Power for the Warrior River developments. In 2010, the Smith Lake Improvement and Stakeholders' Association filed a request for rehearing of the FERC order granting the new Warrior license. Following the FERC's denials of the requests for rehearings, on March 18, 2013, the Smith Lake Improvement and Stakeholders' Association filed an appeal to the U.S. Court of Appeals for the District of Columbia Circuit regarding the FERC's orders related to the Warrior River relicensing proceedings.
In 2011, Alabama Power filed an application with the FERC to relicense the Martin Dam project located on the Tallapoosa River. The Martin license expired on June 8, 2013. Since the FERC did not act on Alabama Power's license application prior to the expiration of the existing license, the FERC issued an annual license to Alabama Power for the Martin Dam project on June 18, 2013.
On August 16, 2013, Alabama Power filed an application with the FERC to relicense the Holt hydroelectric project located on the Warrior River. The current Holt license will expire on August 31, 2015.
In December 2012, Georgia Power filed an application with the FERC to relicense the Bartlett's Ferry project located on the Chattahoochee River near Columbus, Georgia. The current Bartlett's Ferry license will expire on December 14, 2014.
The ultimate outcome of these matters cannot be determined at this time. See MANAGEMENT'S DISCUSSION AND ANALYSIS – FUTURE EARNINGS POTENTIAL – "FERC Matters" of Alabama Power in Item 7 herein for additional information.
Georgia Power and OPC also have a license, expiring in 2027, for the Rocky Mountain Plant, a pure pumped storage facility of 847,800 KW capacity. See PROPERTIES – "Jointly-Owned Facilities" in Item 2 herein for additional information.
Licenses for all projects, excluding those discussed above, expire in the period 2023-2034 in the case of Alabama Power's projects and in the period 2020-2039 in the case of Georgia Power's projects.
Upon or after the expiration of each license, the U.S. Government, by act of Congress, may take over the project or the FERC may relicense the project either to the original licensee or to a new licensee. In the event of takeover or relicensing to another, the original licensee is to be compensated in accordance with the provisions of the Federal Power Act, such compensation to reflect the net investment of the licensee in the project, not in excess of the fair value of the property, plus reasonable damages to other property of the licensee resulting from the severance therefrom of the property.
Nuclear Regulation
Alabama Power, Georgia Power, and Southern Nuclear are subject to regulation by the NRC. The NRC is responsible for licensing and regulating nuclear facilities and materials and for conducting research in support of the licensing and regulatory process, as mandated by the Atomic Energy Act of 1954, as amended; the Energy Reorganization Act of 1974, as amended; and the Nuclear Nonproliferation Act of 1978; and in accordance with the National Environmental Policy Act of 1969, as amended, and other applicable statutes. These responsibilities also include protecting public health and safety, protecting the environment, protecting and safeguarding nuclear materials and nuclear power plants in the interest of national security, and assuring conformity with antitrust laws.
The NRC licenses for Georgia Power's Plant Hatch Units 1 and 2 expire in 2034 and 2038, respectively. The NRC licenses for Alabama Power's Plant Farley Units 1 and 2 expire in 2037 and 2041, respectively. The NRC licenses for Plant Vogtle Units 1 and 2 expire in 2047 and 2049, respectively.
In February 2012, the NRC issued combined construction and operating licenses (COLs) for Plant Vogtle Units 3 and 4. Receipt of the COLs allowed full construction to begin. See MANAGEMENT'S DISCUSSION AND ANALYSIS – FUTURE EARNINGS POTENTIAL – "PSC Matters – Nuclear Construction" of Georgia Power in Item 7 herein and Note 3 to the financial statements of Southern Company under "Retail Regulatory Matters – Georgia Power – Nuclear Construction" and Georgia Power under "Retail Regulatory Matters – Nuclear Construction" in Item 8 herein for additional information.
See Notes 1 and 9 to the financial statements of Southern Company, Alabama Power, and Georgia Power in Item 8 herein for information on nuclear decommissioning costs and nuclear insurance.
Environmental Statutes and Regulations
The Southern Company system's operations are subject to extensive regulation by state and federal environmental agencies under a variety of statutes and regulations governing environmental media, including air, water, and land resources. Compliance with these existing environmental requirements involves significant capital and operating costs, a major portion of which is expected to be recovered through existing ratemaking provisions or long-term wholesale agreements for the traditional
I-9
operating companies or market-based rates for Southern Power. There is no assurance, however, that all such costs will be recovered.
Compliance with the federal Clean Air Act and resulting regulations has been, and will continue to be, a significant focus for Southern Company, each traditional operating company, Southern Power, and SEGCO. In addition, existing environmental laws and regulations may be changed or new laws and regulations may be adopted or otherwise become applicable to the Southern Company system, including laws and regulations designed to address air quality, water, management of waste materials and coal combustion residuals, global climate change, or other environmental and health concerns. See MANAGEMENT'S DISCUSSION AND ANALYSIS – FUTURE EARNINGS POTENTIAL – "Environmental Matters" of Southern Company and each of the traditional operating companies in Item 7 herein for additional information about the Clean Air Act and other environmental issues, including, but not limited to, the litigation brought by the EPA under the New Source Review provisions of the Clean Air Act, proposed and final regulations related to air quality, water, greenhouse gases, and coal combustion residuals. Also see MANAGEMENT'S DISCUSSION AND ANALYSIS – FUTURE EARNINGS POTENTIAL – "Environmental Matters" of Southern Power in Item 7 herein for additional information about environmental issues and climate change regulation.
The Southern Company system's ultimate environmental compliance strategy, including potential unit retirement and replacement decisions, and future environmental capital expenditures will be affected by the final requirements of new or revised environmental regulations and regulations relating to global climate change that are promulgated, including the proposed environmental regulations; the outcome of any legal challenges to the environmental rules; the cost, availability, and existing inventory of emissions allowances; and the fuel mix of the electric utilities. Compliance costs may arise from existing unit retirements, installation of additional environmental controls, upgrades to the transmission system, and adding or changing fuel sources for certain existing units. Also see MANAGEMENT'S DISCUSSION AND ANALYSIS – FUTURE EARNINGS POTENTIAL – "Environmental Matters" of Southern Company, each of the traditional operating companies, and Southern Power in Item 7 herein for additional information. The ultimate outcome of these matters cannot be determined at this time.
SEGCO is jointly owned by Alabama Power and Georgia Power. As part of its environmental compliance strategy, SEGCO plans to add natural gas as the primary fuel source for its generating units in 2015. The capacity of SEGCO's units is sold equally to Alabama Power and Georgia Power through a PPA. If such compliance costs cannot continue to be recovered by Alabama Power or Georgia Power through retail rates, they could have a material financial impact on the financial statements of Southern Company and the applicable traditional operating company. See Note 4 to the financial statements of Alabama Power and Georgia Power for additional information.
Compliance with any new federal or state legislation or regulations relating to air quality, water, coal combustion residuals, global climate change, or other environmental and health concerns could significantly affect the Southern Company system. Although new or revised environmental legislation or regulations could affect many areas of the electric utilities' operations, the full impact of any such changes cannot be determined at this time. Additionally, many of the electric utilities' commercial and industrial customers may also be affected by existing and future environmental requirements, which for some may have the potential to ultimately affect their demand for electricity. See "Construction Program" herein for additional information.
Rate Matters
Rate Structure and Cost Recovery Plans
The rates and service regulations of the traditional operating companies are uniform for each class of service throughout their respective service territories. Rates for residential electric service are generally of the block type based upon KWHs used and include minimum charges. Residential and other rates contain separate customer charges. Rates for commercial service are presently of the block type and, for large customers, the billing demand is generally used to determine capacity and minimum bill charges. These large customers' rates are generally based upon usage by the customer and include rates with special features to encourage off-peak usage. Additionally, Alabama Power, Gulf Power, and Mississippi Power are generally allowed by their respective state PSCs to negotiate the terms and cost of service to large customers. Such terms and cost of service, however, are subject to final state PSC approval.
The traditional operating companies recover their respective costs through a variety of forward-looking, cost-based rate mechanisms. Fuel and net purchased energy costs are recovered through specific fuel cost recovery provisions. These fuel cost recovery provisions are adjusted to reflect increases or decreases in such costs as needed or on schedules as required by the respective PSCs. Approved environmental compliance, storm damage, and certain other costs are recovered at Alabama Power, Gulf Power, and Mississippi Power through specific cost recovery mechanisms approved by their respective PSCs. Certain similar costs at Georgia Power are recovered through various base rate tariffs as approved by the Georgia PSC. Costs not recovered through specific cost recovery mechanisms are recovered at Alabama Power and Mississippi Power through annual, formulaic cost recovery proceedings and at Georgia Power and Gulf Power through base rate proceedings.
I-10
See MANAGEMENT'S DISCUSSION AND ANALYSIS – FUTURE EARNINGS POTENTIAL – "PSC Matters" of Southern Company and each of the traditional operating companies in Item 7 herein and Note 3 to the financial statements of Southern Company and each of the traditional operating companies under "Retail Regulatory Matters" in Item 8 herein for a discussion of rate matters and certain cost recovery mechanisms. Also, see Note 1 to the financial statements of Southern Company and each of the traditional operating companies in Item 8 herein for a discussion of recovery of fuel costs, storm damage costs, and environmental compliance costs through rate mechanisms.
See "Integrated Resource Planning" herein for a discussion of Georgia PSC certification of new demand-side or supply-side resources and decertification of existing supply-side resources for Georgia Power. In addition, see MANAGEMENT'S DISCUSSION AND ANALYSIS – FUTURE EARNINGS POTENTIAL – "PSC Matters – Nuclear Construction" of Georgia Power in Item 7 herein and Note 3 to the financial statements of Southern Company under "Retail Regulatory Matters – Georgia Power – Nuclear Construction" and Georgia Power under "Retail Regulatory Matters – Nuclear Construction" in Item 8 herein for a discussion of the Georgia Nuclear Energy Financing Act and the Georgia PSC certification of Plant Vogtle Units 3 and 4, which have allowed Georgia Power to recover financing costs for construction of Plant Vogtle Units 3 and 4 during the construction period beginning in 2011.
See Note 3 to the financial statements of Southern Company and Mississippi Power under "Integrated Coal Gasification Combined Cycle" in Item 8 herein and MANAGEMENT'S DISCUSSION AND ANALYSIS – FUTURE EARNINGS POTENTIAL – "Integrated Coal Gasification Combined Cycle – Rate Recovery of Kemper IGCC Costs" of Mississippi Power in Item 7 herein for information on cost recovery plans and a settlement agreement between Mississippi Power and the Mississippi PSC with respect to the Kemper IGCC.
The traditional operating companies and Southern Power Company and certain of its generation subsidiaries are authorized by the FERC to sell power to non-affiliates, including short-term opportunity sales, at market-based prices. Specific FERC approval must be obtained with respect to a market-based contract with an affiliate.
Mississippi Power serves long-term contracts with rural electric cooperative associations and municipalities located in southeastern Mississippi under cost-based electric tariffs which are subject to regulation by the FERC. The contracts with these wholesale customers represented 22% of Mississippi Power's operating revenues in 2013 and are largely subject to rolling 10-year cancellation notices.
Integrated Resource Planning
Each of the traditional operating companies continually evaluates its electric generating resources in order to ensure that it maintains a cost-effective and reliable mix of resources to meet the existing and future demand requirements of its customers. See "Environmental Statutes and Regulations" above for a discussion of existing and potential environmental regulations that may impact the future generating resource needs of the traditional operating companies.
Certain of the traditional operating companies periodically file IRPs with their respective state PSC as discussed below.
Georgia Power
Triennially, Georgia Power must file an IRP with the Georgia PSC that specifies how it intends to meet the future electrical needs of its customers through a combination of demand-side and supply-side resources. The Georgia PSC, under state law, must certify any new demand-side or supply-side resources for Georgia Power to get cost recovery. Once certified, the lesser of actual or certified construction costs and purchased power costs is recoverable through rates. Certified costs may be excluded from recovery only on the basis of fraud, concealment, failure to disclose a material fact, imprudence, or criminal misconduct.
See MANAGEMENT'S DISCUSSION AND ANALYSIS – FUTURE EARNINGS POTENTIAL – "PSC Matters – Georgia Power – Rate Plans" of Southern Company and Note 3 to the financial statements of Southern Company under "Georgia Power – Nuclear Construction" and MANAGEMENT'S DISCUSSION AND ANALYSIS – FUTURE EARNINGS POTENTIAL – "PSC Matters – Integrated Resource Plans," "– Renewables Development," and "– Nuclear Construction" of Georgia Power in Item 7 herein for additional information.
Gulf Power
Annually by April 1, Gulf Power must file a 10-year site plan with the Florida PSC containing Gulf Power's estimate of its power-generating needs in the period and the general location of its proposed power plant sites. The 10-year site plans submitted by the state's electric utilities are reviewed by the Florida PSC and subsequently classified as either "suitable" or "unsuitable." The Florida PSC then reports its findings along with any suggested revisions to the Florida Department of Environmental Protection for its consideration at any subsequent electrical power plant site certification proceedings. Under Florida law, any 10-year site plans submitted by an electric utility are considered tentative information for planning purposes only and may be amended at any time at the discretion of the utility with written notification to the Florida PSC.
I-11
Gulf Power's most recent 10-year site plan was classified by the Florida PSC as "suitable" in October 2013. Gulf Power's most recent 10-year site plan and environmental compliance plan identify environmental regulations and potential legislation or regulation that would impose mandatory restrictions on greenhouse gas emissions. See MANAGEMENT'S DISCUSSION AND ANALYSIS – FUTURE EARNINGS POTENTIAL – "Environmental Matters – Environmental Statutes and Regulations – Air Quality," "Environmental Matters – Environmental Statutes and Regulations – Coal Combustion Residuals," and "Environmental Matters – Global Climate Issues" of Gulf Power in Item 7 herein. Gulf Power continues to evaluate the economics of various potential planning scenarios for units at certain Gulf Power coal-fired generating plants as EPA and other regulations develop.
At least every five years, the Florida PSC must conduct proceedings to establish numerical goals for all investor-owned electric utilities and certain municipal or cooperative electric utilities in the state to reduce the growth rates of weather-sensitive peak demand, to reduce and control the growth rates of electric consumption, and to increase the conservation of expensive resources, such as petroleum fuels. Overall residential KWs and KWH goals and overall commercial/industrial KWs and KWH goals for each utility are set by the Florida PSC for each year over a 10-year period. The goals are to be based on an estimate of the total cost effective KWs and KWH savings reasonably achievable through demand-side management in each utility's service territory over a 10-year period. Once goals have been set, each affected utility must develop and submit plans and programs to meet the overall goals within its service territory to the Florida PSC for review and approval. Once approved, the utilities are required to submit periodic reports which the Florida PSC then uses to prepare its annual report to the Florida Governor and legislature of the goals that have been established and the progress towards meeting those goals.
In 2009, the Florida PSC adopted new numerical conservation goals for Gulf Power along with other electric utilities in the state. Gulf Power's plans and programs to meet the new goals were approved by the Florida PSC. The costs of implementing Gulf Power's conservation plans and programs are recovered through specific conservation recovery rates set annually by the Florida PSC.
The ultimate outcome of these matters cannot be determined at this time.
Mississippi Power
Mississippi Power's 2010 IRP indicated that Mississippi Power plans to construct the Kemper IGCC to meet its identified needs, to add environmental controls at Plant Daniel Units 1 and 2, to defer environmental controls at Plant Watson Units 4 and 5, and to continue operation of the combined cycle Plant Daniel Units 3 and 4. See MANAGEMENT'S DISCUSSION AND ANALYSIS – FUTURE EARNINGS POTENTIAL – "Environmental Matters – Environmental Statutes and Regulations – Air Quality" and "Environmental Matters – Global Climate Issues" of Mississippi Power in Item 7 herein. Depending on the final requirements in the anticipated EPA regulations and any legislation or regulation relating to greenhouse gas emissions, as well as estimates of long-term fuel prices, Mississippi Power may conclude that it is more economical to discontinue burning coal at certain coal-fired generating units than to install the required controls. The ultimate outcome of these matters cannot be determined at this time.
Mississippi Baseload Act
In the 2008 regular session of the Mississippi legislature, a bill was passed and signed by the Governor to enhance the Mississippi PSC's authority to facilitate development and construction of base load generation in the State of Mississippi (Baseload Act). The Baseload Act authorizes, but does not require, the Mississippi PSC to adopt a cost recovery mechanism that includes in retail base rates, prior to and during construction, all or a portion of the prudently incurred pre-construction and construction costs incurred by a utility in constructing a base load electric generating plant. Prior to the passage of the Baseload Act, such costs would traditionally be recovered only after the plant was placed in service. The Baseload Act also provides for periodic prudence reviews by the Mississippi PSC and prohibits the cancellation of any such generating plant without the approval of the Mississippi PSC. In the event of cancellation of the construction of the plant without approval of the Mississippi PSC, the Baseload Act authorizes the Mississippi PSC to make a public interest determination as to whether and to what extent the utility will be afforded rate recovery for costs incurred in connection with such cancelled generating plant. There are legal challenges to the constitutionality of the Baseload Act currently pending before the Mississippi Supreme Court. The ultimate impact of this legislation on Southern Company and Mississippi Power will depend on the outcome of any legal challenges and cannot be determined at this time.
For information regarding Mississippi Power's construction of the Kemper IGCC, see MANAGEMENT'S DISCUSSION AND ANALYSIS – FUTURE EARNINGS POTENTIAL – "Integrated Coal Gasification Combined Cycle" of Mississippi Power in Item 7 herein and Note 3 to the financial statements of Southern Company and Mississippi Power under "Integrated Coal Gasification Combined Cycle" in Item 8 herein.
I-12
For information regarding certain legal challenges to the Baseload Act, see Note 3 to the financial statements of Southern Company under "Integrated Coal Gasification Combined Cycle – Baseload Act" and Note 3 to the financial statements of Mississippi Power under "Retail Regulatory Matters - Baseload Act" in Item 8 herein.
The ultimate outcome of these matters cannot be determined at this time.
Employee Relations
The Southern Company system had a total of 26,300 employees on its payroll at December 31, 2013.
|
Employees at December 31, 2013
|
||
|
Alabama Power
|
6,896
|
|
|
Georgia Power
|
7,886
|
|
|
Gulf Power
|
1,410
|
|
|
Mississippi Power
|
1,344
|
|
|
SCS
|
4,459
|
|
|
Southern Nuclear
|
4,049
|
|
|
Southern Power*
|
0
|
|
|
Other
|
256
|
|
|
Total
|
26,300
|
|
|
*
|
Southern Power has no employees. Southern Power has agreements with SCS and the traditional operating companies whereby employee services are rendered at amounts in compliance with FERC regulations.
|
The traditional operating companies have separate agreements with local unions of the IBEW generally covering wages, working conditions, and procedures for handling grievances and arbitration. These agreements apply with certain exceptions to operating, maintenance, and construction employees.
Alabama Power has agreements with the IBEW in effect through August 15, 2014. Upon notice given at least 60 days prior to that date, negotiations may be initiated with respect to agreement terms to be effective after such date.
Georgia Power has an agreement with the IBEW covering wages and working conditions, which is in effect through June 30, 2016.
Gulf Power has an agreement with the IBEW covering wages and working conditions, which is in effect through September 14, 2014. Upon notice given at least 60 days prior to that date, negotiations may be initiated with respect to agreement terms to be effective after such date.
Mississippi Power has an agreement with the IBEW covering wages and working conditions, which is in effect through May 1, 2019. On February 11, 2013, Mississippi Power signed a separate agreement with the IBEW related solely to the Kemper IGCC, which is in effect through March 15, 2016.
Southern Nuclear has an agreement with the IBEW covering certain employees at Plants Hatch and Vogtle which is in effect through June 30, 2016. A five-year agreement between Southern Nuclear and the IBEW representing certain employees at Plant Farley is in effect through August 15, 2014. Upon notice given at least 60 days prior to that date, negotiations may be initiated with respect to agreement terms to be effective after such date.
The agreements also make the terms of the pension plans for the companies discussed above subject to collective bargaining with the unions at either a five-year or a 10-year cycle, depending upon union and company actions.
I-13
In addition to the other information in this Form 10-K, including
MANAGEMENT'S DISCUSSION AND ANALYSIS – FUTURE EARNINGS POTENTIAL in Item 7 of
each registrant, and other documents filed by Southern Company and/or its
subsidiaries with the SEC from time to time, the following factors should be
carefully considered in evaluating Southern Company and its subsidiaries. Such
factors could affect actual results and cause results to differ materially from
those expressed in any forward-looking statements made by, or on behalf of, Southern
Company and/or its subsidiaries.
UTILITY REGULATORY, LEGISLATIVE, AND LITIGATION RISKS
Southern Company and its subsidiaries are subject to substantial governmental
regulation. Compliance with current and future regulatory requirements and
procurement of necessary approvals, permits, and certificates may result in
substantial costs to Southern Company and its subsidiaries.
Southern Company and its subsidiaries, including the traditional operating companies and Southern Power, are subject to substantial regulation from federal, state, and local regulatory agencies. Southern Company and its subsidiaries are required to comply with numerous laws and regulations and to obtain numerous permits, approvals, and certificates from the governmental agencies that regulate various aspects of their businesses, including rates and charges, service regulations, retail service territories, sales of securities, asset acquisitions and sales, accounting policies and practices, and the operation of fossil-fuel, nuclear, hydroelectric, solar, and biomass generating facilities, as well as transmission and distribution facilities. For example, the rates charged to wholesale customers by the traditional operating companies and by Southern Power Company must be approved by the FERC. These wholesale rates could be affected absent the ability to conduct business pursuant to FERC market-based rate authority. Additionally, the respective state PSCs must approve the traditional operating companies' requested rates for retail customers. While the retail rates of the traditional operating companies are designed to provide for the full recovery of costs (including a reasonable return on invested capital), there can be no assurance that a state PSC, in a future rate proceeding, will not attempt to alter the timing or amount of certain costs for which recovery is sought or to modify the current authorized rate of return.
Southern Company and its subsidiaries believe the necessary permits, approvals, and certificates have been obtained for their respective existing operations and that their respective businesses are conducted in accordance with applicable laws; however, the impact of any future revision or changes in interpretations of existing regulations or the adoption of new laws and regulations applicable to Southern Company or any of its subsidiaries cannot now be predicted. Changes in regulation or the imposition of additional regulations could influence the operating environment of Southern Company and its subsidiaries and may result in substantial costs.
The Southern Company system's costs of compliance with environmental laws are significant. The costs of compliance with current and future environmental laws, including laws and regulations designed to address air quality, water, coal combustion residuals, global climate change, renewable energy standards, and other matters and the incurrence of environmental liabilities could negatively impact the net income, cash flows, and financial condition of Southern Company, the traditional operating companies, and/or Southern Power.
The Southern Company system is subject to extensive federal, state, and local environmental requirements which, among other things, regulate air emissions, water usage and discharges, and the management of hazardous and solid waste in order to adequately protect the environment. Compliance with these environmental requirements requires the traditional operating companies and Southern Power to commit significant expenditures for installation of pollution control equipment, environmental monitoring, emissions fees, and permits at substantially all of their respective facilities. These expenditures are significant and Southern Company, the traditional operating companies, and Southern Power expect that they will continue to be significant in the future. Through 2013, the traditional operating companies had invested approximately $9.4 billion in environmental capital retrofit projects to comply with these requirements. The EPA has adopted and is in the process of implementing regulations governing the emission of nitrogen oxide, sulfur dioxide, fine particulate matter, mercury, and other air pollutants under the Clean Air Act through the national ambient air quality standards, CAIR, the MATS rule, and other air quality regulations and is in the process of considering additional revisions. In addition, the EPA has proposed additional regulations governing cooling water intake structures and has proposed revisions to the effluent guidelines for steam electric generating plants under the Clean Water Act. The EPA is also evaluating whether additional regulation of coal combustion
I-14
residuals (including coal ash and gypsum) is merited under federal solid and hazardous waste laws.
Existing environmental laws and regulations may be revised or new laws and regulations related to air quality, water, coal combustion residuals, global climate change, or other environmental and health concerns may be adopted or become applicable to the traditional operating companies and/or Southern Power.
In addition, the EPA currently regulates emissions of carbon dioxide (CO
2
) and other greenhouse gases under the Prevention of Significant Deterioration preconstruction permit program and the Title V operating permit program of the Clean Air Act, which both apply to power plants and other commercial and industrial facilities. On January 8, 2014, the EPA published re-proposed regulations to establish standards of performance for greenhouse gas emissions from new fossil fuel steam electric generating units and is expected to propose standards of performance for modified, reconstructed, and existing units during 2014.
The Southern Company system's ultimate environmental compliance strategy, including potential unit retirement and replacement decisions, and future environmental capital expenditures will be affected by the final requirements of new or revised environmental regulations ; the outcome of any legal challenges to the environmental rules; the cost, availability, and existing inventory of emissions allowances; and the fuel mix of the electric utilities. Compliance costs may arise from existing unit retirements, installation of additional environmental controls, upgrades to the transmission system, and adding or changing fuel sources for certain existing units. Additionally, if Southern Company, any traditional operating company, or Southern Power fails to comply with environmental laws and regulations, even if caused by factors beyond its control, that failure may result in the assessment of civil or criminal penalties and fines. The EPA has filed civil actions against Alabama Power and Georgia Power and issued notices of violation to Gulf Power and Mississippi Power alleging violations of the new source review provisions of the Clean Air Act. An adverse outcome in any of these matters could require substantial capital expenditures that cannot be determined at this time and could possibly require payment of substantial penalties.
Compliance costs related to federal and state environmental statutes and regulations could affect earnings if such costs cannot continue to be fully recovered on a timely basis. Environmental compliance spending over the next several years may differ materially from the amounts estimated. The timing, specific requirements, and estimated costs could change as environmental statutes and regulations are adopted or modified. Such expenditures could affect unit retirement and replacement decisions and results of operations, cash flows, and financial condition if such costs are not recovered through regulated rates or long-term wholesale agreements for the traditional operating companies or market-based rates for Southern Power. Further, higher costs that are recovered through regulated rates could contribute to reduced demand for electricity, which could negatively affect results of operations, cash flows, and financial condition.
Litigation over environmental issues and claims of various types, including property damage, personal injury, common law nuisance, and citizen enforcement of environmental requirements such as air quality and water standards, has increased generally throughout the U.S. In particular, personal injury, property damage, and other claims for damages alleged to have been caused by CO
2
and other emissions, coal combustion residuals, and alleged exposure to hazardous materials, and/or requests for injunctive relief in connection with such matters, have become more frequent.
The ultimate cost impact of proposed and final legislation and regulations and litigation are likely to result in significant and additional costs and could result in additional operating restrictions.
The net income of Southern Company, the traditional operating companies, and Southern Power could be negatively impacted by changes in regulations related to transmission planning processes and competition in the wholesale electric markets.
The traditional operating companies currently own and operate transmission facilities as part of a vertically integrated utility. A small percentage of transmission revenues are collected through the wholesale electric tariff but the majority of transmission revenues are collected through retail rates. New FERC rules pertaining to regional transmission planning and cost allocation present challenges to transmission planning and the wholesale market structure in the Southeast. The key impacts of these new rules include:
|
•
|
possible disruption of the integrated resource planning processes within the states in the Southern Company system's service territory;
|
|
•
|
delays and additional processes for developing transmission plans; and
|
|
•
|
possible impacts on state jurisdiction of approving, certifying, and pricing of new transmission facilities.
|
The FERC rules related to transmission are intended to spur the development of new transmission infrastructure to promote and
I-15
encourage the integration of renewable sources of supply as well as facilitate competition in the wholesale market by providing more choices to wholesale power customers. In addition to the impacts on transactions contemplating physical delivery of energy, financial laws and regulations also impact power hedging and trading based on futures contracts and derivatives that are traded on various commodities exchanges as well as over-the-counter. Finally, technology changes in the power and fuel industries continue to create significant impacts to wholesale transaction cost structures. Southern Company, the traditional operating companies, and Southern Power cannot predict the impact of these and other such developments, nor can they predict the effect of changes in levels of wholesale supply and demand, which are typically driven by factors beyond their control. The financial condition, net income, and cash flows of Southern Company, the traditional operating companies, and Southern Power could be adversely affected by these and other changes.
The traditional operating companies and Southern Power could be subject to higher costs as a result of implementing and maintaining compliance with the North American Electric Reliability Corporation mandatory reliability standards along with possible associated penalties for non-compliance.
Owners and operators of bulk power systems, including the traditional operating companies, are subject to mandatory reliability standards enacted by the North American Electric Reliability Corporation and enforced by the FERC. Compliance with the mandatory reliability standards may subject the traditional operating companies, Southern Power, and Southern Company to higher operating costs and increased capital expenditures. If any traditional operating company or Southern Power is found to be in noncompliance with the mandatory reliability standards, such traditional operating company or Southern Power could be subject to sanctions, including substantial monetary penalties.
OPERATIONAL RISKS
The financial performance of Southern Company and its subsidiaries may be adversely
affected if the subsidiaries are unable to successfully operate their facilities or perform certain corporate functions.
The financial performance of Southern Company and its subsidiaries depends on the successful operation of its subsidiaries' electric generating, transmission, and distribution facilities. Operating these facilities involves many risks, including:
|
•
|
operator error or failure of equipment or processes, particularly with older generating facilities;
|
|
•
|
operating limitations that may be imposed by environmental or other regulatory requirements;
|
|
•
|
labor disputes;
|
|
•
|
terrorist attacks;
|
|
•
|
fuel or material supply interruptions;
|
|
•
|
compliance with mandatory reliability standards, including mandatory cyber security standards;
|
|
•
|
implementation of technologies with which the Southern Company system is developing experience;
|
|
•
|
information technology system failure;
|
|
•
|
cyber intrusion; and
|
|
•
|
catastrophic events such as fires, earthquakes, explosions, floods, droughts, hurricanes, pandemic health events such as influenzas, or other similar occurrences.
|
A decrease or elimination of revenues from the electric generation, transmission, or distribution facilities or an increase in the cost of operating the facilities would reduce the net income and cash flows and could adversely impact the financial condition of the affected traditional operating company or Southern Power and of Southern Company. In addition, an investment in a subsidiary with such generation, transmission, or distribution facilities could be adversely impacted.
I-16
Operation of nuclear facilities involves inherent risks, including environmental,
health, regulatory, natural disasters, terrorism, and financial risks, that could result in fines or the
closure of the nuclear units owned by Alabama Power or Georgia Power
and which may present potential exposures in excess of insurance coverage.
Alabama Power owns, and contracts for the operation of, two nuclear units and Georgia Power holds undivided interests in, and contracts for the operation of, four existing nuclear units. The six existing units are operated by Southern Nuclear and represent approximately 3,680 MWs, or 8.1%, of the Southern Company system's generation capacity as of December 31, 2013. In addition, Southern Nuclear, on behalf of Georgia Power and the other co-owners, is overseeing the construction of Plant Vogtle Units 3 and 4. Due solely to the increase in nuclear generating capacity, the below risks are expected to increase incrementally once Plant Vogtle Units 3 and 4 are operational. Nuclear facilities are subject to environmental, health, and financial risks such as:
|
•
|
the potential harmful effects on the environment and human health resulting from a release of radioactive materials in connection with the operation of nuclear facilities and the storage, handling, and disposal of spent nuclear fuel;
|
|
•
|
uncertainties with respect to the on-site storage of and the ability to dispose of spent nuclear fuel;
|
|
•
|
uncertainties with respect to the technological and financial aspects of decommissioning nuclear plants at the end of licensed lives and the ability to maintain and anticipate adequate reserves for decommissioning;
|
|
•
|
limitations on the amounts and types of insurance commercially available to cover losses that might arise in connection with the nuclear operations of Alabama Power and Georgia Power or those of other commercial nuclear facility owners in the United States;
|
|
•
|
potential liabilities arising out of the operation of these facilities;
|
|
•
|
significant capital expenditures relating to maintenance, operation, security, and repair of these facilities, including repairs and upgrades required by the NRC;
|
|
•
|
the threat of a possible terrorist attack, including a potential cyber security attack; and
|
|
•
|
the potential impact of a natural disaster.
|
Alabama Power and Georgia Power maintain decommissioning trusts and external insurance coverage, including statutorily required nuclear incident insurance, to minimize the potential financial exposure to these risks; however, it is possible that damages could exceed the amount of insurance coverage.
The NRC has broad authority under federal law to impose licensing and safety-related requirements for the operation of nuclear generation facilities. In the event of non-compliance with NRC licensing and safety-related requirements, the NRC has the authority to impose fines and/or shut down any unit, depending upon its assessment of the severity of the situation, until compliance is achieved. As a result of the major earthquake and tsunami that struck Japan in March 2011 and caused substantial damage to the nuclear generating units at the Fukushima Daiichi generating plant, the NRC is performing additional operational and safety reviews of nuclear facilities in the U.S., which could potentially impact future operations and capital requirements. The final form and the resulting impact of any changes to safety requirements for nuclear reactors will be dependent on further review and action by the NRC and cannot be determined at this time. NRC orders or regulations related to increased security measures and any future safety requirements promulgated by the NRC could require Alabama Power and Georgia Power to make substantial operating and capital expenditures at their nuclear plants. In addition, although Alabama Power, Georgia Power, and Southern Company have no reason to anticipate a serious nuclear incident at the Southern Company system nuclear plants, if an incident did occur, it could result in substantial costs to Alabama Power or Georgia Power and Southern Company. A major incident at a nuclear facility anywhere in the world could cause the NRC to limit, prohibit, or require significant changes to the operation or licensing of any domestic nuclear unit that could result in substantial costs. Moreover, a major incident at any nuclear facility in the United States could require Alabama Power and Georgia Power to make material contributory payments.
In addition, potential terrorist threats and increased public scrutiny of utilities could result in increased nuclear licensing or compliance costs that are difficult to predict.
I-17
Physical or cyber attacks, both threatened and actual, could impact the ability of the traditional operating companies and Southern Power to operate and could adversely affect financial results and liquidity.
The traditional operating companies and Southern Power face the risk of physical and cyber attacks, both threatened and actual, against their respective generation facilities, the transmission and distribution infrastructure used to transport power, and their information technology systems and network infrastructure, which could negatively impact the ability of the traditional operating companies or Southern Power to generate, transport, and deliver power, or otherwise operate their respective facilities in the most efficient manner or at all.
The traditional operating companies and Southern Power operate in a highly regulated industry that requires the continued operation of sophisticated information technology systems and network infrastructure, which are part of an interconnected regional grid. In addition, in the ordinary course of business, the traditional operating companies and Southern Power collect and retain sensitive information including personal identification information about customers and employees and other confidential information. The traditional operating companies and Southern Power face on-going threats to their assets. Despite the implementation of robust security measures, all assets are potentially vulnerable to disability, failures, or unauthorized access due to human error or physical or cyber attacks. If the traditional operating companies' or Southern Power's assets were to fail, be physically damaged, or be breached and were not recovered in a timely way, the traditional operating companies or Southern Power may be unable to fulfill critical business functions, and sensitive and other data could be compromised. The theft, damage, or improper disclosure of sensitive electronic data may also subject the applicable traditional operating company or Southern Power to penalties and claims from third parties.
These events could negatively affect the financial results of Southern Company, the traditional operating companies, or Southern Power through lost revenues, costs to recover and repair damage, and costs associated with governmental actions in response to such attacks.
The traditional operating companies and Southern Power may not be able to obtain
adequate fuel supplies, which could limit their ability to operate their
facilities.
The traditional operating companies and Southern Power purchase fuel, including coal, natural gas, uranium, fuel oil, and biomass, from a number of suppliers. Disruption in the delivery of fuel, including disruptions as a result of, among other things, transportation delays, weather, labor relations, force majeure events, or environmental regulations affecting any of these fuel suppliers, could limit the ability of the traditional operating companies and Southern Power to operate their respective facilities, and thus reduce the net income of the affected traditional operating company or Southern Power and Southern Company.
The traditional operating companies are dependent on coal for a portion of their electric generating capacity. Each traditional operating company has coal supply contracts in place; however, there can be no assurance that the counterparties to these agreements will fulfill their obligations to supply coal to the traditional operating companies. The suppliers under these agreements may experience financial or technical problems which inhibit their ability to fulfill their obligations to the traditional operating companies. In addition, the suppliers under these agreements may not be required to supply coal to the traditional operating companies under certain circumstances, such as in the event of a natural disaster. If the traditional operating companies are unable to obtain their coal requirements under these contracts, the traditional operating companies may be required to purchase their coal requirements at higher prices, which may not be fully recoverable through rates.
In addition, the traditional operating companies and Southern Power to a greater extent have become more dependent on natural gas for a portion of their electric generating capacity. In many instances, the cost of purchased power for the traditional operating companies and Southern Power is influenced by natural gas prices. Historically, natural gas prices have been more volatile than prices of other fuels. In recent years, domestic natural gas prices have been depressed by robust supplies, including production from shale gas, as well as lower demand. These market conditions, together with additional regulation of coal-fired generating units, have increased the traditional operating companies' reliance on natural gas-fired generating units.
Natural gas supplies can be subject to disruption in the event production or distribution is curtailed, such as in the event of a hurricane or a pipeline failure. The availability of shale gas and potential regulations affecting its accessibility may have a material impact on the supply and cost of natural gas.
In addition, world market conditions for fuels can impact the cost and availability of natural gas, coal, and uranium.
I-18
The revenues of Southern Company, the traditional operating companies, and Southern
Power depend in
part on sales under PPAs. The failure of a counterparty to one of these PPAs to
perform its obligations, or the failure to renew the PPAs, could have a negative
impact on the net income and cash flows of the affected traditional operating company
or Southern Power and of Southern Company.
Most of Southern Power's generating capacity has been sold to purchasers under PPAs. In addition, the traditional operating companies enter into PPAs with non-affiliated parties. Revenues are dependent on the continued performance by the purchasers of their obligations under these PPAs. Even though Southern Power and the traditional operating companies have a rigorous credit evaluation process and contractual protections, the failure of one of the purchasers to perform its obligations could have a negative impact on the net income and cash flows of the affected traditional operating company or Southern Power and of Southern Company. Although these credit evaluations and contractual protections take into account the possibility of default by a purchaser, actual exposure to a default by a purchaser may be greater than predicted. Additionally, neither Southern Power nor any traditional operating company can predict whether the PPAs will be renewed at the end of their respective terms or on what terms any renewals may be made. If a PPA is not renewed, a replacement PPA cannot be assured.
Changes in technology may make Southern Company's electric generating facilities
owned by the traditional operating companies and Southern Power less competitive.
A key element of the business models of Southern Company, the traditional operating companies, and Southern Power is that generating power at central station power plants achieves economies of scale and produces power at a competitive cost. There are distributed generation technologies that produce power, including fuel cells, microturbines, wind turbines, and solar cells. Advances in technology could reduce the cost of alternative methods of producing power to a level that is competitive with that of most central station power electric production or result in smaller-scale, more fuel efficient, and/or more cost effective distributed generation. Broader use of distributed generation by retail electric customers may also result from customers’ changing perceptions of the merits of utilizing existing generation technology or tax or other economic incentives. Additionally, there can be no assurance that a state PSC or legislature will not attempt to modify certain aspects of the traditional operating companies’ business as a result of these advances in technology. If these technologies became cost competitive and achieved sufficient scale, the market share of the traditional operating companies and Southern Power could be eroded, and the value of their respective electric generating facilities could be reduced. It is also possible that rapid advances in central station power generation technology could reduce the value of the current electric generating facilities owned by the traditional operating companies and Southern Power. Changes in technology could also alter the channels through which electric customers buy or utilize power, which could reduce the revenues or increase the expenses of Southern Company, the traditional operating companies, or Southern Power. If state PSCs fail to adjust rates to reflect the impact of any changes in loads, increasing self-generation, and the growth of distributed generation, the financial condition, results of operations, and cash flows of Southern Company and the traditional operating companies could be materially adversely affected.
Acquisitions and dispositions may not result in anticipated benefits and may present risks not originally contemplated, which may have a material adverse effect on the liquidity, results of operations, and financial condition of Southern Company and its subsidiaries.
Southern Company and its subsidiaries have made significant acquisitions and dispositions in the past and may in the future make additional acquisitions and dispositions. Southern Power, in particular, continually seeks opportunities to create value through various transactions, including acquisitions or sales of assets.
These transactions are intended to, but may not, result in the generation of cash or income, the realization of savings, the creation of efficiencies, or the reduction of risk. These transactions may also affect the liquidity, results of operations, and financial condition of Southern Company and its subsidiaries.
These transactions also involve risks, and Southern Company and its subsidiaries cannot ensure that:
|
•
|
any acquisitions would result in an increase in income or provide an adequate return of capital or other anticipated benefits;
|
|
•
|
any acquisitions would be successfully integrated into the acquiring company’s operations and internal controls;
|
I-19
|
•
|
the due diligence conducted prior to an acquisition would uncover situations that could result in financial or legal exposure or that the acquiring company will appropriately quantify the exposure from known risks;
|
|
•
|
any disposition would not result in decreased earnings, revenue, or cash flow;
|
|
•
|
use of cash for acquisitions would not adversely affect cash available for capital expenditures and other uses; or
|
|
•
|
any dispositions, investments, or acquisitions would not have a material adverse effect on the liquidity, results of operations, or financial condition of Southern Company or its subsidiaries.
|
Failure to attract and retain an appropriately qualified workforce could negatively impact Southern Company's and its subsidiaries' results of operations.
Events such as an aging workforce without appropriate replacements, mismatch of skill sets to future needs, or unavailability of contract resources may lead to operating challenges such as lack of resources, loss of knowledge, and a lengthy time period associated with skill development, especially with the workforce needs associated with Plant Vogtle Units 3 and 4 and Kemper IGCC construction. The Southern Company system's costs, including costs for contractors to replace employees, productivity costs, and safety costs, may rise. Failure to hire and adequately obtain replacement employees, including the ability to transfer significant internal historical knowledge and expertise to the new employees, or the future availability and cost of contract labor may adversely affect Southern Company and its subsidiaries' ability to manage and operate their businesses. If Southern Company and its subsidiaries, including the traditional operating companies, are unable to successfully attract and retain an appropriately qualified workforce, results of operations could be negatively impacted.
CONSTRUCTION RISKS
Southern Company, the traditional operating companies, and/or Southern Power may incur
additional costs or delays in the construction of new plants or other facilities and may not be able to recover their investments. Also, existing facilities of
the traditional operating companies and Southern Power require
ongoing capital expenditures, including those to meet environmental standards.
General
The businesses of the registrants require substantial capital expenditures for investments in new facilities and capital improvements to transmission, distribution, and generation facilities, including those to meet environmental standards. Certain of the traditional operating companies and Southern Power are in the process of constructing new generating facilities and adding environmental controls equipment at existing generating facilities. The Southern Company system intends to continue its strategy of developing and constructing other new facilities, expanding existing facilities, and adding environmental control equipment. These types of projects are long-term in nature and in some cases include the development and construction of facilities with designs that have not been finalized or previously constructed. The completion of these types of projects without delays or significant cost overruns is subject to substantial risks, including:
|
•
|
shortages and inconsistent quality of equipment, materials, and labor;
|
|
•
|
labor costs;
|
|
•
|
varied productivity and production;
|
|
•
|
work stoppages;
|
|
•
|
contractor or supplier delay or non-performance under construction or other agreements or non-performance by other major participants in construction projects;
|
|
•
|
delays in or failure to receive necessary permits, approvals, and other regulatory authorizations;
|
|
•
|
delays associated with start-up activities, including major equipment failure, system integration, and operations, and/or unforeseen engineering problems;
|
I-20
|
•
|
impacts of new and existing laws and regulations, including environmental laws and regulations;
|
|
•
|
the outcome of legal challenges to regulatory approvals;
|
|
•
|
failure to construct in accordance with licensing requirements;
|
|
•
|
continued public and policymaker support for such projects;
|
|
•
|
adverse weather conditions;
|
|
•
|
other unforeseen engineering problems;
|
|
•
|
changes in project design or scope;
|
|
•
|
environmental and geological conditions;
|
|
•
|
delays or increased costs to interconnect facilities to transmission grids; and
|
|
•
|
unanticipated cost increases, including materials and labor, and increased financing costs as a result of changes in market interest rates or as a result of construction schedule delays.
|
In addition, with respect to the construction of Plant Vogtle Units 3 and 4 and the operation of existing nuclear units, a major incident at a nuclear facility anywhere in the world could cause the NRC to delay or prohibit construction of new nuclear units or require additional safety measures at new and existing units, including any which may be required as a result of the major earthquake and tsunami that struck Japan in March 2011 and caused substantial damage to the nuclear generating units at the Fukushima Daiichi generating plant, which could potentially impact future operations and capital requirements. The final form and the resulting impact of any changes to safety requirements for nuclear reactors will be dependent on further review and action by the NRC and cannot be determined at this time.
If a traditional operating company or Southern Power is unable to complete the development or construction of a facility or decides to delay or cancel construction of a facility, it may not be able to recover its investment in that facility and may incur substantial cancellation payments under equipment purchase orders or construction contracts. Even if a construction project is completed, the total costs may be higher than estimated and there is no assurance that the traditional operating company will be able to recover such expenditures through regulated rates. In addition, construction delays and contractor performance shortfalls can result in the loss of revenues and may, in turn, adversely affect the net income and financial position of a traditional operating company or Southern Power and of Southern Company.
Construction delays could result in the loss of otherwise available investment tax credits, production tax credits, and other tax incentives. Furthermore, if construction projects are not completed according to specification, a traditional operating company or Southern Power and Southern Company may incur liabilities and suffer reduced plant efficiency, higher operating costs, and reduced net income.
Once facilities come into commercial operation, ongoing capital expenditures are required to maintain reliable levels of operation. Significant portions of the traditional operating companies' existing facilities were constructed many years ago. Older generation equipment, even if maintained in accordance with good engineering practices, may require significant capital expenditures to maintain efficiency, to comply with changing environmental requirements, or to provide reliable operations.
The two largest construction projects currently underway in the Southern Company system are the construction of Plant Vogtle Units 3 and 4 and the Kemper IGCC.
I-21
Plant Vogtle Units 3 and 4 construction
Southern Nuclear, on behalf of Georgia Power and the other co-owners, is overseeing the construction of and will operate Plant Vogtle Units 3 and 4 (each, an approximately 1,100 MW AP1000 nuclear generating unit). Georgia Power owns 45.7% of the new units. The NRC certified the Westinghouse Electric Company LLC's Design Certification Document, as amended (DCD), for the AP1000 reactor design, effective December 30, 2011, and issued combined COLs in February 2012. Receipt of the COLs allowed full construction to begin. There have been technical and procedural challenges to the construction and licensing of Plant Vogtle Units 3 and 4 at the federal and state level, and additional challenges are expected as construction proceeds.
Georgia Power is required to file semi-annual Vogtle Construction Monitoring (VCM) reports with the Georgia PSC by February 28 and August 31 of each year. If the projected certified construction capital costs to be borne by Georgia Power increase by 5% or the projected in-service dates are significantly extended, Georgia Power is required to seek an amendment to the Plant Vogtle Units 3 and 4 certificate from the Georgia PSC. Accordingly, Georgia Power's eighth VCM report requested an amendment to the certificate to increase the estimated in-service capital cost of Plant Vogtle Units 3 and 4 from $4.4 billion to $4.8 billion and to extend the estimated in-service dates to fourth quarter 2017 and fourth quarter 2018 for Plant Vogtle Units 3 and 4, respectively.
On September 3, 2013, the Georgia PSC approved a stipulation entered into by Georgia Power and the Georgia PSC staff to waive the requirement to amend the Plant Vogtle Units 3 and 4 certificate, until the commercial operation date of Plant Vogtle Unit 3, or earlier if deemed appropriate by the Georgia PSC and Georgia Power. In accordance with the Georgia Integrated Resource Planning Act, any costs incurred by Georgia Power in excess of the certified amount will not be included in rate base, unless shown to be reasonable and prudent. In addition, financing costs on any excess construction-related costs potentially would be subject to recovery for allowance for funds used during construction instead of the Nuclear Construction Cost Recovery tariff.
Georgia Power, OPC, MEAG Power, and Dalton (collectively, the Owners) and Westinghouse Electric Company LLC (Westinghouse) and Stone & Webster, Inc. (Stone & Webster) (collectively, the Contractor) are involved in litigation regarding the costs associated with design changes to the DCD and delays in the timing of approval of the DCD and issuance of the COLs, including the assertion by the Contractor that the Owners are responsible for these costs and that the Contractor is entitled to further schedule extensions. The portion of the additional costs claimed by the Contractor that would be attributable to Georgia Power (based on Georgia Power's ownership interest) with respect to these issues is approximately $425 million (in 2008 dollars). Georgia Power has not agreed with either the proposed cost or schedule adjustments or that the Owners have any responsibility for costs related to these issues. While litigation has commenced and Georgia Power intends to vigorously defend its positions, Georgia Power also expects negotiations with the Contractor to continue with respect to costs and schedule during which negotiations the parties may reach a mutually acceptable compromise of their positions.
Processes are in place that are designed to assure compliance with the requirements specified in the DCD and COLs, including inspections by Southern Nuclear and the NRC that occur throughout construction. As a result of such compliance processes, certain license amendment requests have been filed and approved or are pending before the NRC. Various design and other licensed-based compliance issues are expected to arise as construction proceeds, which may result in additional license amendments or require other resolution. If any license amendment requests or other licensing-based compliance issues are not resolved in a timely manner, there may be delays in the project schedule that could result in increased costs either to the Owners, the Contractor, or both.
As construction continues, the risk remains that additional challenges in the fabrication, assembly, delivery, and installation of structural modules, delays in the receipt of the remaining permits necessary for the operation of Plant Vogtle Units 3 and 4, or other issues could arise and may further impact project schedule and cost. Additional claims by the Contractor or Georgia Power (on behalf of the Owners) are also likely to arise throughout construction. These claims may be resolved through formal and informal dispute resolution procedures under the engineering, procurement, and construction agreement for Plant Vogtle Units 3 and 4, but also may be resolved through litigation.
Kemper IGCC construction
In April 2012, the Mississippi PSC issued a detailed order confirming the CPCN originally approved by the Mississippi PSC in 2010 authorizing the acquisition, construction, and operation of the Kemper IGCC (2012 MPSC CPCN Order), which the Sierra Club appealed to the Chancery Court of Harrison County, Mississippi (Chancery Court). In December 2012, the Chancery Court affirmed the 2012 MPSC CPCN Order. On January 8, 2013, the Sierra Club filed an appeal of the Chancery
I-22
Court's ruling with the Mississippi Supreme Court. The ultimate outcome of the CPCN challenge cannot be determined at this time.
The certificated cost estimate of the Kemper IGCC included in the 2012 MPSC CPCN Order was $2.4 billion, net of $245 million of grants awarded to the project by the U.S. Department of Energy under the Clean Coal Power Initiative Round 2 (DOE Grants) and excluding the cost of the lignite mine and equipment, the cost of the CO
2
pipeline facilities, and allowance for funds used during construction (AFUDC) related to the Kemper IGCC. The 2012 MPSC CPCN Order approved a construction cost cap of up to $2.88 billion, with recovery of prudently-incurred costs subject to approval by the Mississippi PSC. Exceptions to the $2.88 billion cost cap include the cost of the lignite mine and equipment, the cost of the CO
2
pipeline facilities, AFUDC, and certain general exceptions, including change of law, force majeure, and beneficial capital (which exists when Mississippi Power demonstrates that the purpose and effect of the construction cost increase is to produce efficiencies that will result in a neutral or favorable effect on the ratepayers, relative to the original proposal for the CPCN) (Cost Cap Exceptions), as contemplated in the settlement agreement between Mississippi Power and the Mississippi PSC entered into on January 24, 2013 (Settlement Agreement) and the 2012 MPSC CPCN Order. Recovery of the Cost Cap Exception amounts remains subject to review and approval by the Mississippi PSC. The Kemper IGCC was originally scheduled to be placed in service in May 2014 and is currently scheduled to be placed in service in the fourth quarter 2014.
Mississippi Power does not intend to seek any rate recovery or joint owner contributions for any related costs that exceed the $2.88 billion cost cap, excluding the Cost Cap Exceptions and net of the DOE Grants. Through December 31, 2013, Southern Company and Mississippi Power have recorded pre-tax charges to income for revisions to the cost estimate of $1.2 billion ($729 million after tax). The revised cost estimates through December 31, 2013 reflect increased labor costs, piping and other material costs, start-up costs, decreases in construction labor productivity, the change in the in-service date, and an increase in the contingency for risks associated with start-up activities.
Mississippi Power could experience further construction cost increases and/or schedule extensions with respect to the Kemper IGCC as a result of factors including, but not limited to, labor costs and productivity, adverse weather conditions, shortages and inconsistent quality of equipment, materials, and labor, contractor or supplier delay, or non-performance under construction or other agreements. Furthermore, Mississippi Power could also experience further schedule extensions associated with start-up activities for this "first-of-its-kind" technology, including major equipment failure, system integration, and operations, and/or unforeseen engineering problems, which would result in further cost increases and could result in the loss of certain tax benefits related to bonus depreciation. In subsequent periods, any further changes in the estimated costs to complete construction of the Kemper IGCC subject to the $2.88 billion cost cap will be reflected in Southern Company’s and Mississippi Power’s statements of income and these changes could be material.
On January 24, 2013, Mississippi Power entered into the Settlement Agreement with the Mississippi PSC that, among other things, establishes the process for resolving matters regarding cost recovery related to the Kemper IGCC. Under the Settlement Agreement, Mississippi Power agreed to limit the portion of prudently-incurred Kemper IGCC costs to be included in retail rate base to the $2.4 billion certificated cost estimate, plus the Cost Cap Exceptions, but excluding AFUDC, and any other costs permitted or determined to be excluded from the $2.88 billion cost cap by the Mississippi PSC. The Settlement Agreement also allows Mississippi Power to secure alternate financing for costs that are not otherwise recovered in any Mississippi PSC rate proceedings contemplated by the Settlement Agreement.
Legislation to authorize a multi-year rate plan and legislation to provide for alternate financing through securitization of up to $1.0 billion of prudently-incurred costs was enacted into law on February 26, 2013. Mississippi Power intends to securitize (1) prudently-incurred costs in excess of the certificated cost estimate and up to the $2.88 billion cost cap, net of the DOE Grants and excluding the Cost Cap Exceptions, (2) accrued AFUDC, and (3) other prudently-incurred costs as approved by the Mississippi PSC. The rate recovery necessary to recover the annual costs of securitization is expected to be filed and become effective after the Kemper IGCC is placed in service and following completion of the Mississippi PSC's final prudence review of costs for the Kemper IGCC.
The Settlement Agreement provides that Mississippi Power may terminate the Settlement Agreement if certain conditions are not met, if Mississippi Power is unable to secure alternate financing for any prudently-incurred Kemper IGCC costs not otherwise recovered in any Mississippi PSC rate proceeding contemplated by the Settlement Agreement, or if the Mississippi PSC fails to comply with the requirements of the Settlement Agreement. Mississippi Power continues to work with the Mississippi PSC and the Mississippi Public Utilities Staff to implement the procedural schedules set forth in the Settlement Agreement and additional variations to the schedule are likely.
I-23
Consistent with the Settlement Agreement, on March 5, 2013, the Mississippi PSC issued an order (2013 MPSC Rate Order), approving retail rate increases of 15% effective March 19, 2013 and 3% effective January 1, 2014, which collectively are designed to collect $156 million annually beginning in 2014. Amounts collected through these rates are being recorded as a regulatory liability to be used to mitigate customer rate impacts after the Kemper IGCC is placed in service. On March 21, 2013, a legal challenge to the 2013 MPSC Rate Order was filed by Thomas A. Blanton with the Mississippi Supreme Court, which remains pending against Mississippi Power and the Mississippi PSC.
Also consistent with the Settlement Agreement, on February 26, 2013, Mississippi Power filed with the Mississippi PSC a rate recovery plan for the Kemper IGCC for the first seven years of its operation, along with a proposed revenue requirement under such plan for 2014 through 2020 (Seven-Year Rate Plan). On March 22, 2013, Mississippi Power, in compliance with the 2013 MPSC Rate Order, filed a revision to the Seven-Year Rate Plan with the Mississippi PSC for the Kemper IGCC for cost recovery through 2020, which is still under review by the Mississippi PSC. The revenue requirements set forth in the Seven-Year Rate Plan assume the sale of a 15% undivided interest in the Kemper IGCC to SMEPA and utilization of bonus depreciation as provided by the American Taxpayer Relief Act of 2012, which currently requires that the Kemper IGCC be placed in service in 2014.
In 2014, Mississippi Power plans to amend the Seven-Year Rate Plan to reflect changes including the revised in-service date, the change in expected benefits relating to tax credits, various other revenue requirement items, and other tax matters, which include ensuring compliance with the normalization requirements of the Internal Revenue Code. The impact of these revisions for the average annual retail revenue requirement is estimated to be approximately $35 million through 2020. The amendment to the Seven-Year Rate Plan is also expected to reflect rate mitigation options identified by Mississippi Power that, if approved by the Mississippi PSC, would result in no change to the total customer rate impacts contemplated in the original Seven-Year Rate Plan.
Further cost increases and/or schedule extensions with respect to the Kemper IGCC could have an adverse impact on the Seven-Year Rate Plan, such as the inability to recover items considered as Cost Cap Exceptions, potential costs subject to securitization financing in excess of $1.0 billion, and the loss of certain tax benefits related to bonus depreciation. While the Kemper IGCC is scheduled to be placed in service in the fourth quarter 2014, any schedule extension beyond 2014 would result in the loss of tax benefits related to bonus depreciation. The estimated value of the bonus depreciation tax benefits to retail customers is approximately $200 million. Loss of these tax benefits would require further adjustment to the Seven-Year Rate Plan and approval by the Mississippi PSC to ensure compliance with the normalization requirements of the Internal Revenue Code. In the event that the Mississippi PSC does not approve or Mississippi Power withdraws the Seven-Year Rate Plan, Mississippi Power would seek rate recovery through an alternate means, which could include a traditional rate case.
The Mississippi PSC’s prudence review of Kemper IGCC costs incurred through March 31, 2013, as provided for in the Settlement Agreement, is expected to occur in the second quarter 2014. A final review of all costs incurred after March 31, 2013 is expected to be completed within six months of the Kemper IGCC’s in-service date. Furthermore, regardless of any prudence determinations made during the construction and start-up period, the Mississippi PSC has the right to make a final prudence determination after the Kemper IGCC has been placed in service.
The ultimate outcome of these matters, including the resolution of legal challenges, determinations of prudency, and the specific manner of recovery of prudently-incurred costs, is subject to further regulatory actions and cannot be determined at this time.
FINANCIAL, ECONOMIC, AND MARKET RISKS
The generation operations and energy marketing operations of Southern Company, the traditional
operating companies, and Southern Power are subject to risks, many of which are beyond
their control, including changes in power prices and fuel costs, that may reduce
Southern Company's, the traditional operating companies', and/or Southern Power's
revenues and increase costs.
The generation operations and energy marketing operations of the Southern Company system are subject to changes in power prices and fuel costs, which could increase the cost of producing power or decrease the amount received from the sale of power. The market prices for these commodities may fluctuate significantly over relatively short periods of time. The Southern Company system attempts to mitigate risks associated with fluctuating fuel costs by passing these costs on to customers through the traditional operating companies' fuel cost recovery clauses or through PPAs. Among the factors that could influence power prices and fuel costs are:
|
•
|
prevailing market prices for coal, natural gas, uranium, fuel oil, biomass, and other fuels used in the generation facilities of the traditional operating companies and Southern Power, including associated transportation costs, and
|
I-24
supplies of such commodities;
|
•
|
demand for energy and the extent of additional supplies of energy available from current or new competitors;
|
|
•
|
liquidity in the general wholesale electricity market;
|
|
•
|
weather conditions impacting demand for electricity;
|
|
•
|
seasonality;
|
|
•
|
transmission or transportation constraints or inefficiencies;
|
|
•
|
availability of competitively priced alternative energy sources;
|
|
•
|
forced or unscheduled plant outages for the Southern Company system, its competitors, or third party providers;
|
|
•
|
the financial condition of market participants;
|
|
•
|
the economy in the service territory, the nation, and worldwide, including the impact of economic conditions on demand for electricity and the demand for fuels;
|
|
•
|
natural disasters, wars, embargos, acts of terrorism, and other catastrophic events; and
|
|
•
|
federal, state, and foreign energy and environmental regulation and legislation.
|
Certain of these factors could increase the expenses of the traditional operating companies or Southern Power and Southern Company. For the traditional operating companies, such increases may not be fully recoverable through rates. Other of these factors could reduce the revenues of the traditional operating companies or Southern Power and Southern Company.
Historically, the traditional operating companies from time to time have experienced underrecovered fuel cost balances and deficits in their storm cost recovery reserve balances and may experience such balances and deficits in the future. While the traditional operating companies are generally authorized to recover underrecovered fuel costs through fuel cost recovery clauses and storm recovery costs through special rate provisions administered by the respective PSCs, recovery may be denied if costs are deemed to be imprudently incurred, and delays in the authorization of such recovery could negatively impact the cash flows of the affected traditional operating company and Southern Company.
Southern Company, the traditional operating companies, and Southern Power are subject to risks associated with a changing economic environment, customer behaviors, and adoption patterns of technologies by the customers of the traditional operating companies and Southern Power.
The consumption and use of energy are fundamentally linked to economic activity. This relationship is affected over time by changes in the economy, customer behaviors, and technologies. Any economic downturn or disruption of financial markets, both nationally and internationally, could negatively affect the financial stability of customers and counterparties of the traditional operating companies and Southern Power. Additionally, any economic downturn could negatively impact customer growth and usage per customer, thus reducing the sales of electricity and revenues.
Outside of economic disruptions, changes in customer behaviors in response to changing conditions and preferences or changes in the adoption of technologies could affect the relationship of economic activity to the consumption of electricity. On the customer behavior side, federal and state programs exist to influence how customers use energy, and several of the traditional operating companies have PSC mandates to promote energy efficiency. The adoption of technology by customers can have both positive and negative impacts on sales. Many new technologies utilize less energy than in the past. However, new electric technologies such as electric vehicles can create additional demand. The Southern Company system's planning processes incorporate estimates of the impacts of changes in customer behavior, state and federal programs, PSC mandates, and technology, but upside and downside risks remain.
All of the factors discussed above could adversely affect Southern Company's, the traditional operating companies', and/or Southern Power's results of operations, financial condition, and liquidity.
I-25
The operating results of Southern Company, the traditional operating companies, and
Southern Power are affected by weather conditions and may fluctuate on a seasonal and
quarterly basis. In addition, significant weather events, such as hurricanes, tornadoes, floods, droughts, and winter storms, could result in substantial damage to or limit the operation of the properties of the traditional operating companies and/or Southern Power and could negatively impact results of operation, financial condition, and liquidity.
Electric power supply is generally a seasonal business. In many parts of the country, demand for power peaks during the summer months, with market prices also peaking at that time. In other areas, power demand peaks during the winter. As a result, the overall operating results of Southern Company, the traditional operating companies, and Southern Power may fluctuate substantially on a seasonal basis. In addition, the traditional operating companies and Southern Power have historically sold less power when weather conditions are milder. Unusually mild weather in the future could reduce the revenues, net income, available cash, and borrowing ability of Southern Company, the traditional operating companies, and/or Southern Power.
In addition, volatile or significant weather events could result in substantial damage to the transmission and distribution lines of the traditional operating companies and the generating facilities of the traditional operating companies and Southern Power. The traditional operating companies and Southern Power have significant investments in the Atlantic and Gulf Coast regions which could be subject to major storm activity. Further, severe drought conditions can reduce the availability of water and restrict or prevent the operation of certain generating facilities.
Each traditional operating company maintains a reserve for property damage to cover the cost of damages from weather events to its transmission and distribution lines and the cost of uninsured damages to its generating facilities and other property. In the event a traditional operating company experiences any of these weather events or any natural disaster or other catastrophic event, recovery of costs in excess of reserves and insurance coverage is subject to the approval of its state PSC. While the traditional operating companies generally are entitled to recover prudently-incurred costs incurred in connection with such an event, any denial by the applicable state PSC or delay in recovery of any portion of such costs could have a material negative impact on a traditional operating company's and Southern Company's results of operations, financial condition, and liquidity.
In addition, damages resulting from significant weather events within the service territory of any traditional operating company or affecting Southern Power's customers may result in the loss of customers and reduced demand for electricity for extended periods. Any significant loss of customers or reduction in demand for electricity could have a material negative impact on a traditional operating company's or Southern Power's and Southern Company's results of operations, financial condition, and liquidity.
Southern Company may be unable to meet its ongoing and future financial obligations
and to pay dividends on its common stock if its subsidiaries are unable to pay
upstream dividends or repay funds to Southern Company.
Southern Company is a holding company and, as such, Southern Company has no operations of its own. Substantially all of Southern Company's consolidated assets are held by subsidiaries. Southern Company's ability to meet its financial obligations and to pay dividends on its common stock is primarily dependent on the net income and cash flows of its subsidiaries and their ability to pay upstream dividends or to repay funds to Southern Company. Prior to funding Southern Company, Southern Company's subsidiaries have regulatory restrictions and financial obligations that must be satisfied, including among others, debt service and preferred and preference stock dividends. Southern Company's subsidiaries are separate legal entities and have no obligation to provide Southern Company with funds.
A downgrade in the credit ratings of Southern Company, the traditional operating companies, or Southern Power Company could negatively affect their ability to access capital at reasonable costs and/or could require Southern Company, the traditional operating companies, or Southern Power Company to post collateral or replace certain indebtedness.
There are a number of factors that rating agencies evaluate to arrive at credit ratings for Southern Company, the traditional operating companies, and Southern Power Company, including capital structure, regulatory environment, the ability to cover liquidity requirements, and other commitments for capital. Southern Company, the traditional operating companies, and Southern Power Company could experience a downgrade in their ratings if any rating agency concludes that the level of business or financial risk of the industry or Southern Company, the traditional operating companies, or Southern Power Company has deteriorated. Changes in ratings methodologies by the agencies could also have a negative impact on credit ratings. If one or more rating agencies downgrade Southern Company, the traditional operating companies, or Southern Power
I-26
Company, borrowing costs would increase, the pool of investors and funding sources would likely decrease, and, particularly for any downgrade to below investment grade, significant collateral requirements may be triggered in a number of contracts.
The use of derivative contracts by Southern Company and its subsidiaries in the
normal course of business could result in financial losses that negatively impact the
net income of Southern Company and its subsidiaries.
Southern Company and its subsidiaries, including the traditional operating companies and Southern Power, use derivative instruments, such as swaps, options, futures, and forwards, to manage their commodity and interest rate exposures and, to a lesser extent, engage in limited trading activities. Southern Company and its subsidiaries could recognize financial losses as a result of volatility in the market values of these contracts or if a counterparty fails to perform. These risks are managed through risk management policies, limits, and procedures. These risk management policies, limits, and procedures might not work as planned and cannot entirely eliminate the risks associated with these activities. In addition, derivative contracts entered for hedging purposes might not off-set the underlying exposure being hedged as expected, resulting in financial losses. In the absence of actively quoted market prices and pricing information from external sources, the valuation of these financial instruments can involve management's judgment or use of estimates. The factors used in the valuation of these instruments become more difficult to predict and the calculations become less reliable the further into the future these estimates are made. As a result, changes in the underlying assumptions or use of alternative valuation methods could affect the value of the reported fair value of these contracts.
Demand for power could decrease or fail to grow at expected rates, resulting in stagnant or reduced revenues, limited growth opportunities, and potentially stranded generation assets.
Southern Company, the traditional operating companies, and Southern Power each engage in a long-term planning process to determine the optimal mix and timing of new generation assets required to serve future load obligations. This planning process must look many years into the future in order to accommodate the long lead times associated with the permitting and construction of new generation facilities. Inherent risk exists in predicting demand this far into the future as these future loads are dependent on many uncertain factors, including regional economic conditions, customer usage patterns, efficiency programs, and customer technology adoption. Because regulators may not permit the traditional operating companies to adjust rates to recover the costs of new generation assets while such assets are being constructed, the traditional operating companies may not be able to fully recover these costs or may have exposure to regulatory lag associated with the time between the incurrence of costs of additional capacity and the traditional operating companies' recovery in customers' rates. Under Southern Power's model of selling capacity and energy at negotiated market-based rates under long-term PPAs, Southern Power might not be able to fully execute its business plan if market prices drop below original forecasts. Southern Power and/or the traditional operating companies may not be able to extend existing PPAs or to find new buyers for existing generation assets as existing PPAs expire, or it may be forced to market these assets at prices lower than originally intended. These situations could have negative impacts on net income and cash flows for the affected traditional operating company or Southern Power and for Southern Company.
Demand for power could exceed supply capacity, resulting in increased costs for
purchasing capacity in the open market or building additional generation and transmission
facilities.
The traditional operating companies and Southern Power are currently obligated to supply power to retail customers and wholesale customers under long-term PPAs. At peak times, the demand for power required to meet this obligation could exceed the Southern Company system's available generation capacity. Market or competitive forces may require that the traditional operating companies or Southern Power purchase capacity on the open market or build additional generation and transmission facilities. Because regulators may not permit the traditional operating companies to pass all of these purchase or construction costs on to their customers, the traditional operating companies may not be able to recover some or all of these costs or may have exposure to regulatory lag associated with the time between the incurrence of costs of purchased or constructed capacity and the traditional operating companies' recovery in customers' rates. Under Southern Power's long-term fixed price PPAs, Southern Power would not have the ability to recover any of these costs. These situations could have negative impacts on net income and cash flows for the affected traditional operating company or Southern Power and for Southern Company.
Energy conservation and energy price increases could negatively impact financial results.
Customers could voluntarily reduce their consumption of electricity in response to decreases in their disposable income, increases in energy price, or individual conservation efforts, which could negatively impact the results of operations of Southern Company, the traditional operating companies, and Southern Power. In addition, a number of regulatory and
I-27
legislative bodies have proposed or introduced requirements and/or incentives to reduce energy consumption by certain dates. Conservation programs could impact the financial results of Southern Company, the traditional operating companies, and Southern Power in different ways. For example, if any traditional operating company is required to invest in conservation measures that result in reduced sales from effective conservation, regulatory lag in adjusting rates for the impact of these measures could have a negative financial impact on such traditional operating company and Southern Company.
Certain of the traditional operating companies actively promote energy conservation programs, which have been approved by their respective state PSCs. For certain of such traditional operating companies, regulatory mechanisms have been established that provide for the recovery of costs related to such programs and lost revenues as a result of such programs. However, to the extent conservation results in reduced energy demand or significantly slows the growth in demand beyond what is anticipated, the value of generation assets of the traditional operating companies and/or Southern Power and other unregulated business activities could be adversely impacted and the traditional operating companies could be negatively impacted depending on the regulatory treatment of the associated impacts. In addition, the failure of those traditional operating companies who actively promote energy conservation programs to achieve the energy conservation targets established by their respective state PSCs could negatively impact such traditional operating company's ability to recover costs and lost revenues as a result of such progress and ability to receive certain benefits related to such programs.
Southern Company, the traditional operating companies, and Southern Power are unable to determine what impact, if any, conservation and increases in energy prices will have on their respective financial condition or results of operations.
The businesses of Southern Company, the traditional operating companies, and Southern
Power are dependent on their ability to successfully access funds through capital markets and financial institutions. The
inability of Southern Company, any traditional operating company, or Southern Power to
access funds may limit its ability to execute its business plan by impacting its ability to fund capital investments or acquisitions that Southern Company, the traditional operating
companies, or Southern Power may otherwise rely on to achieve future earnings and cash flows.
Southern Company, the traditional operating companies, and Southern Power rely on access to both short-term money markets and longer-term capital markets as a significant source of liquidity for capital requirements not satisfied by the cash flow from their respective operations. If Southern Company, any traditional operating company, or Southern Power is not able to access capital at competitive rates, its ability to implement its business plan will be limited by impacting its ability to fund capital investments or acquisitions that Southern Company, the traditional operating companies, or Southern Power may otherwise rely on to achieve future earnings and cash flows. In addition, Southern Company, the traditional operating companies, and Southern Power rely on committed bank lending agreements as back-up liquidity which allows them to access low cost money markets. Each of Southern Company, the traditional operating companies, and Southern Power believes that it will maintain sufficient access to these financial markets based upon current credit ratings. However, certain events or market disruptions may increase the cost of borrowing or adversely affect the ability to raise capital through the issuance of securities or other borrowing arrangements or the ability to secure committed bank lending agreements used as back-up sources of capital. Such disruptions could include:
|
•
|
an economic downturn or uncertainty;
|
|
•
|
bankruptcy or financial distress at an unrelated energy company, financial institution, or sovereign entity;
|
|
•
|
capital markets volatility and disruption, either nationally or internationally;
|
|
•
|
changes in tax policy such as dividend tax rates;
|
|
•
|
market prices for electricity and gas;
|
|
•
|
terrorist attacks or threatened attacks on Southern Company's facilities or unrelated energy companies' facilities;
|
|
•
|
war or threat of war; or
|
|
•
|
the overall health of the utility and financial institution industries.
|
In addition, Georgia Power’s ability to make future borrowings through its term loan credit facility with the Federal Financing Bank is subject to the satisfaction of customary conditions, as well as certification of compliance with the requirements of the
I-28
loan guarantee program under Title XVII of the Energy Policy Act of 2005, including accuracy of project-related representations and warranties, delivery of updated project-related information and evidence of compliance with the prevailing wage requirements of the Davis-Bacon Act of 1931, as amended, compliance with the Cargo Preference Act of 1954, and certification from the DOE’s consulting engineer that proceeds of the advances are used to reimburse certain costs of construction relating to Plant Vogtle Units 3 and 4 that are eligible for financing under the Title XVII Loan Guarantee Program.
Market performance and other changes may decrease the value of benefit plans and nuclear decommissioning trust assets or may increase plan costs, which then could require significant additional funding.
The performance of the capital markets affects the values of the assets held in trust under Southern Company's pension and postretirement benefit plans and the assets held in trust to satisfy obligations to decommission Alabama Power's and Georgia Power's nuclear plants. The Southern Company system has significant obligations related to pension and postretirement benefit plans. Alabama Power and Georgia Power each hold significant assets in the nuclear decommissioning trusts. These assets are subject to market fluctuations and will yield uncertain returns, which may fall below projected return rates. A decline in the market value of these assets may increase the funding requirements relating to benefit plan liabilities of the Southern Company system and Alabama Power's and Georgia Power's nuclear decommissioning obligations. Additionally, changes in interest rates affect the liabilities under pension and postretirement benefit plans of the Southern Company system; as interest rates decrease, the liabilities increase, potentially requiring additional funding. Further, changes in demographics, including an increased number of retirements or changes in life expectancy assumptions, may also increase the funding requirements of the obligations related to the pension benefit plans. Southern Company and its subsidiaries are also facing rising medical benefit costs, including the current costs for active and retired employees. It is possible that these costs may increase at a rate that is significantly higher than anticipated. If the Southern Company system is unable to successfully manage benefit plan assets and medical benefit costs and Alabama Power and Georgia Power are unable to successfully manage the nuclear decommissioning trust funds, results of operations and financial position could be negatively affected.
Southern Company may be unable to recover its investment in its leveraged leases if a lessee fails to profitably operate the leased assets.
Southern Company has several leveraged lease agreements, with terms ranging up to 45 years, which relate to international and domestic energy generation, distribution, and transportation assets. Southern Company receives federal income tax deductions for depreciation and amortization, as well as interest on long-term debt related to these investments. Southern Company reviews all important lease assumptions at least annually, or more frequently if events or changes in circumstances indicate that a change in assumptions has occurred or may occur. With respect to Southern Company's investments in leveraged leases, the recovery of its investment is dependent on the profitable operation of the leased assets by the respective lessees. A significant deterioration in the performance of the leased asset could result in the impairment of the related lease receivable.
Southern Company, the traditional operating companies, and Southern Power are subject
to risks associated with their ability to
obtain adequate insurance.
The financial condition of some insurance companies, the threat of terrorism, and natural disasters, among other things, could have disruptive effects on insurance markets. The availability of insurance covering risks that Southern Company, the traditional operating companies, Southern Power, and their respective competitors typically insure against may decrease, and the insurance that Southern Company, the traditional operating companies, and Southern Power are able to obtain may have higher deductibles, higher premiums, and more restrictive policy terms. Further, while Southern Company, the traditional operating companies, and Southern Power maintain an amount of insurance protection that they consider adequate, there is no guarantee that the insurance policies selected by them will cover all of the potential exposures or the actual amount of loss incurred.
Any losses not covered by insurance could adversely affect the results of operations, cash flows, or financial condition of Southern Company, the traditional operating companies, or Southern Power.
|
Item 1B.
|
UNRESOLVED STAFF COMMENTS.
|
None.
I-29
Electric Properties
The traditional operating companies, Southern Power, and SEGCO, at December 31, 2013, owned and/or operated 33 hydroelectric generating stations, 32 fossil fuel generating stations, three nuclear generating stations, and 13 combined cycle/cogeneration stations, six solar facilities, one biomass facility, and one landfill gas facility. The amounts of capacity for each company are shown in the table below.
|
Generating Station
|
Location
|
Nameplate
Capacity (1)
|
|
||
|
(KWs)
|
|
||||
|
FOSSIL STEAM
|
|||||
|
Gadsden
|
Gadsden, AL
|
120,000
|
|
||
|
Gorgas
|
Jasper, AL
|
1,221,250
|
|
||
|
Barry
|
Mobile, AL
|
1,525,000
|
|
||
|
Greene County
|
Demopolis, AL
|
300,000
|
|
(2
|
)
|
|
Gaston Unit 5
|
Wilsonville, AL
|
880,000
|
|
||
|
Miller
|
Birmingham, AL
|
2,532,288
|
|
(3
|
)
|
|
Alabama Power Total
|
6,578,538
|
|
|||
|
Bowen
|
Cartersville, GA
|
3,160,000
|
|
||
|
Branch
|
Milledgeville, GA
|
1,220,700
|
|
(4
|
)
|
|
Hammond
|
Rome, GA
|
800,000
|
|
||
|
Kraft
|
Port Wentworth, GA
|
281,136
|
|
(4
|
)
|
|
McIntosh
|
Effingham County, GA
|
163,117
|
|
(4
|
)
|
|
McManus
|
Brunswick, GA
|
115,000
|
|
(4
|
)
|
|
Mitchell
|
Albany, GA
|
125,000
|
|
(4
|
)
|
|
Scherer
|
Macon, GA
|
750,924
|
|
(5
|
)
|
|
Wansley
|
Carrollton, GA
|
925,550
|
|
(6
|
)
|
|
Yates
|
Newnan, GA
|
1,250,000
|
|
(4
|
)
|
|
Georgia Power Total
|
8,791,427
|
|
|||
|
Crist
|
Pensacola, FL
|
970,000
|
|
||
|
Daniel
|
Pascagoula, MS
|
500,000
|
|
(7
|
)
|
|
Lansing Smith
|
Panama City, FL
|
305,000
|
|
||
|
Scholz
|
Chattahoochee, FL
|
80,000
|
|
(16
|
)
|
|
Scherer Unit 3
|
Macon, GA
|
204,500
|
|
(5
|
)
|
|
Gulf Power Total
|
2,059,500
|
|
|||
|
Daniel
|
Pascagoula, MS
|
500,000
|
|
(7
|
)
|
|
Greene County
|
Demopolis, AL
|
200,000
|
|
(2
|
)
|
|
Sweatt
|
Meridian, MS
|
80,000
|
|
||
|
Watson
|
Gulfport, MS
|
1,012,000
|
|
||
|
Mississippi Power Total
|
1,792,000
|
|
|||
|
Gaston Units 1-4
|
Wilsonville, AL
|
||||
|
SEGCO Total
|
1,000,000
|
|
(4)(8)
|
|
|
|
Total Fossil Steam
|
20,221,465
|
|
|||
I-30
|
Generating Station
|
Location
|
Nameplate
Capacity (1)
|
|
||
|
NUCLEAR STEAM
|
|||||
|
Farley
|
Dothan, AL
|
||||
|
Alabama Power Total
|
1,720,000
|
|
|||
|
Hatch
|
Baxley, GA
|
899,612
|
|
(9
|
)
|
|
Vogtle
|
Augusta, GA
|
1,060,240
|
|
(10
|
)
|
|
Georgia Power Total
|
1,959,852
|
|
|||
|
Total Nuclear Steam
|
3,679,852
|
|
|||
|
COMBUSTION TURBINES
|
|||||
|
Greene County
|
Demopolis, AL
|
||||
|
Alabama Power Total
|
720,000
|
|
|||
|
Boulevard
|
Savannah, GA
|
19,700
|
|
(4)
|
|
|
Intercession City
|
Intercession City, FL
|
47,667
|
|
(11
|
)
|
|
Kraft
|
Port Wentworth, GA
|
22,000
|
|
||
|
McDonough Unit 3
|
Atlanta, GA
|
78,800
|
|
||
|
McIntosh Units 1 through 8
|
Effingham County, GA
|
640,000
|
|
||
|
McManus
|
Brunswick, GA
|
481,700
|
|
||
|
Mitchell
|
Albany, GA
|
78,800
|
|
||
|
Robins
|
Warner Robins, GA
|
158,400
|
|
||
|
Wansley
|
Carrollton, GA
|
26,322
|
|
(6
|
)
|
|
Wilson
|
Augusta, GA
|
354,100
|
|
||
|
Georgia Power Total
|
1,907,489
|
|
|||
|
Lansing Smith Unit A
|
Panama City, FL
|
39,400
|
|
||
|
Pea Ridge Units 1 through 3
|
Pea Ridge, FL
|
15,000
|
|
||
|
Gulf Power Total
|
54,400
|
|
|||
|
Chevron Cogenerating Station
|
Pascagoula, MS
|
147,292
|
|
(12
|
)
|
|
Sweatt
|
Meridian, MS
|
39,400
|
|
||
|
Watson
|
Gulfport, MS
|
39,360
|
|
||
|
Mississippi Power Total
|
226,052
|
|
|||
|
Cleveland County
|
Cleveland County, NC
|
720,000
|
|
||
|
Dahlberg
|
Jackson County, GA
|
756,000
|
|
||
|
Oleander
|
Cocoa, FL
|
791,301
|
|
||
|
Rowan
|
Salisbury, NC
|
455,250
|
|
||
|
West Georgia
|
Thomaston, GA
|
668,800
|
|
||
|
Southern Power Total
|
3,391,351
|
|
|||
|
Gaston
(SEGCO)
|
Wilsonville, AL
|
19,680
|
|
(8)
|
|
|
Total Combustion Turbines
|
6,318,972
|
|
|||
|
COGENERATION
|
|||||
|
Washington County
|
Washington County, AL
|
123,428
|
|
||
|
GE Plastics Project
|
Burkeville, AL
|
104,800
|
|
||
|
Theodore
|
Theodore, AL
|
236,418
|
|
||
|
Total Cogeneration
|
464,646
|
|
|||
I-31
|
Generating Station
|
Location
|
Nameplate
Capacity (1)
|
|
||
|
COMBINED CYCLE
|
|||||
|
Barry
|
Mobile, AL
|
||||
|
Alabama Power Total
|
1,070,424
|
|
|||
|
McIntosh Units 10&11
|
Effingham County, GA
|
1,318,920
|
|
||
|
McDonough-Atkinson Units 4 through 6
|
Atlanta, GA
|
2,520,000
|
|
||
|
Georgia Power Total
|
3,838,920
|
|
|||
|
Smith
|
Lynn Haven, FL
|
||||
|
Gulf Power Total
|
545,500
|
|
|||
|
Daniel
|
Pascagoula, MS
|
||||
|
Mississippi Power Total
|
1,070,424
|
|
|||
|
Franklin
|
Smiths, AL
|
1,857,820
|
|
||
|
Harris
|
Autaugaville, AL
|
1,318,920
|
|
||
|
Rowan
|
Salisbury, NC
|
530,550
|
|
||
|
Stanton Unit A
|
Orlando, FL
|
428,649
|
|
(13)
|
|
|
Wansley
|
Carrollton, GA
|
1,073,000
|
|
||
|
Southern Power Total
|
5,208,939
|
|
|||
|
Total Combined Cycle
|
11,734,207
|
|
|||
|
HYDROELECTRIC FACILITIES
|
|||||
|
Bankhead
|
Holt, AL
|
53,985
|
|
||
|
Bouldin
|
Wetumpka, AL
|
225,000
|
|
||
|
Harris
|
Wedowee, AL
|
132,000
|
|
||
|
Henry
|
Ohatchee, AL
|
72,900
|
|
||
|
Holt
|
Holt, AL
|
46,944
|
|
||
|
Jordan
|
Wetumpka, AL
|
100,000
|
|
||
|
Lay
|
Clanton, AL
|
177,000
|
|
||
|
Lewis Smith
|
Jasper, AL
|
157,500
|
|
||
|
Logan Martin
|
Vincent, AL
|
135,000
|
|
||
|
Martin
|
Dadeville, AL
|
182,000
|
|
||
|
Mitchell
|
Verbena, AL
|
170,000
|
|
||
|
Thurlow
|
Tallassee, AL
|
81,000
|
|
||
|
Weiss
|
Leesburg, AL
|
87,750
|
|
||
|
Yates
|
Tallassee, AL
|
47,000
|
|
||
|
Alabama Power Total
|
1,668,079
|
|
|||
|
Bartletts Ferry
|
Columbus, GA
|
173,000
|
|
||
|
Goat Rock
|
Columbus, GA
|
38,600
|
|
||
|
Lloyd Shoals
|
Jackson, GA
|
14,400
|
|
||
|
Morgan Falls
|
Atlanta, GA
|
16,800
|
|
||
|
North Highlands
|
Columbus, GA
|
29,600
|
|
||
|
Oliver Dam
|
Columbus, GA
|
60,000
|
|
||
|
Rocky Mountain
|
Rome, GA
|
215,256
|
|
(14)
|
|
|
Sinclair Dam
|
Milledgeville, GA
|
45,000
|
|
||
|
Tallulah Falls
|
Clayton, GA
|
72,000
|
|
||
|
Terrora
|
Clayton, GA
|
16,000
|
|
||
|
Tugalo
|
Clayton, GA
|
45,000
|
|
||
I-32
|
Generating Station
|
Location
|
Nameplate
Capacity (1)
|
|
||
|
Wallace Dam
|
Eatonton, GA
|
321,300
|
|
||
|
Yonah
|
Toccoa, GA
|
22,500
|
|
||
|
6 Other Plants
|
Various Georgia Cities
|
18,080
|
|
||
|
Georgia Power Total
|
1,087,536
|
|
|||
|
Total Hydroelectric Facilities
|
2,755,615
|
|
|||
|
RENEWABLE SOURCES:
|
|||||
|
SOLAR FACILITIES
|
|||||
|
Dalton
|
Dalton, GA
|
||||
|
Georgia Power Total
|
705
|
|
|||
|
Apex
|
North Las Vegas, NV
|
18,000
|
|
||
|
Cimarron
|
Springer, NM
|
27,576
|
|
||
|
Granville
|
Oxford, NC
|
2,250
|
|
||
|
Spectrum
|
Clark County, NV
|
27,216
|
|
||
|
Campo Verde
|
Imperial County, CA
|
132,678
|
|
||
|
Southern Power Total
|
207,720
|
|
(15)
|
|
|
|
Total Solar
|
208,425
|
|
|||
|
LANDFILL GAS FACILITY
|
|||||
|
Perdido
|
Escambia County, FL
|
||||
|
Gulf Power Total
|
3,200
|
|
|||
|
BIOMASS FACILITY
|
|||||
|
Nacogdoches
|
Sacul, Texas
|
||||
|
Southern Power Total
|
115,500
|
|
|||
|
Total Generating Capacity
|
45,501,882
|
|
|||
I-33
Notes:
|
(1)
|
See "Jointly-Owned Facilities" herein for additional information.
|
|
(2)
|
Owned by Alabama Power and Mississippi Power as tenants in common in the proportions of 60% and 40%, respectively.
|
|
(3)
|
Capacity shown is Alabama Power's portion (91.84%) of total plant capacity.
|
|
(4)
|
Georgia Power's Plant Bowen Unit 6 (39,400 KWs) was retired on April 25, 2013. Georgia Power's Plant Boulevard Units 2 and 3 (39,400 KWs) were retired on July 17, 2013. Georgia Power's Plant Branch Unit 2 (319,000 KWs) was retired on September 30, 2013. See MANAGEMENT'S DISCUSSION AND ANALYSIS – FUTURE EARNINGS POTENTIAL – "PSC Matters – Georgia Power – Integrated Resource Plans" of Southern Company and MANAGEMENT'S DISCUSSION AND ANALYSIS – FUTURE EARNINGS POTENTIAL – "PSC Matters – Integrated Resource Plans" of Georgia Power in Item 7 herein. See also, Note 3 to the financial statements of Southern Company and Georgia Power under "Retail Regulatory Matters – Georgia Power – Integrated Resource Plans" and "Retail Regulatory Matters – Integrated Resource Plans," respectively, in Item 8 herein for information on plant retirements, fuel switching, and conversions.
|
|
(5)
|
Capacity shown for Georgia Power is 8.4% of Units 1 and 2 and 75% of Unit 3. Capacity shown for Gulf Power is 25% of Unit 3.
|
|
(6)
|
Capacity shown is Georgia Power's portion (53.5%) of total plant capacity.
|
|
(7)
|
Represents 50% of the plant which is owned as tenants in common by Gulf Power and Mississippi Power.
|
|
(8)
|
SEGCO is jointly-owned by Alabama Power and Georgia Power. See BUSINESS in Item 1 herein for additional information. See MANAGEMENT'S DISCUSSION AND ANALYSIS – FUTURE EARNINGS POTENTIAL – "PSC Matters – Georgia Power – Integrated Resource Plans" of Southern Company and MANAGEMENT'S DISCUSSION AND ANALYSIS – FUTURE EARNINGS POTENTIAL – "PSC Matters – Integrated Resource Plans" of Georgia Power in Item 7 herein. See also, Note 3 to the financial statements of Southern Company and Georgia Power under "Retail Regulatory Matters – Georgia Power – Integrated Resource Plans" and "Retail Regulatory Matters – Integrated Resource Plans," respectively, in Item 8 herein for information on fuel switching at Plant Gaston.
|
|
(9)
|
Capacity shown is Georgia Power's portion (50.1%) of total plant capacity.
|
|
(10)
|
Capacity shown is Georgia Power's portion (45.7%) of total plant capacity.
|
|
(11)
|
Capacity shown represents 33 1/3% of total plant capacity. Georgia Power owns a 1/3 interest in the unit with 100% use of the unit from June through September. Duke Energy Florida operates the unit.
|
|
(12)
|
Generation is dedicated to a single industrial customer.
|
|
(13)
|
Capacity shown is Southern Power's portion (65%) of total plant capacity.
|
|
(14)
|
Capacity shown is Georgia Power's portion (25.4%) of total plant capacity. OPC operates the plant.
|
|
(15)
|
Capacity shown is Southern Power's portion (90%) of the total plant capacity.
|
|
(16)
|
See MANAGEMENT'S DISCUSSION AND ANALYSIS – FUTURE EARNINGS POTENTIAL – "Environmental Matters" of Gulf Power in Item 7 herein for information on a scheduled plant retirement in 2015.
|
Except as discussed below under "Titles to Property," the principal plants and other important units of the traditional operating companies, Southern Power, and SEGCO are owned in fee by the respective companies. It is the opinion of management of each such company that its operating properties are adequately maintained and are substantially in good operating condition.
Mississippi Power owns a 79-mile length of 500-kilovolt transmission line which is leased to Entergy Gulf States Louisiana, LLC. The line, completed in 1984, extends from Plant Daniel to the Louisiana state line. Entergy Gulf States Louisiana, LLC is paying a use fee over a 40-year period covering all expenses and the amortization of the original $57 million cost of the line. At December 31, 2013, the unamortized portion of this cost was approximately $15.5 million.
In conjunction with the Kemper IGCC, Mississippi Power owns a lignite mine and equipment and has acquired and will continue to acquire mineral reserves located around the Kemper IGCC site in Kemper County. The mine, operated by North American Coal Corporation, started commercial operation on June 5, 2013. The estimated capital cost of the mine and equipment is approximately $233.1 million, of which $227.6 million has been incurred through December 31, 2013. See MANAGEMENT'S DISCUSSION AND ANALYSIS – FUTURE EARNINGS POTENTIAL – "Integrated Coal Gasification Combined Cycle – Lignite Mine and CO
2
Pipeline Facilities" of Mississippi Power in Item 7 herein and Note 3 to the financial statements of Southern Company and Mississippi Power under "Integrated Coal Gasification Combined Cycle – Lignite Mine and CO
2
Pipeline Facilities" in Item 8 herein for additional information on the lignite mine.
In 2013, the maximum demand on the traditional operating companies, Southern Power, and SEGCO was 33,557,000 KWs and occurred on June 13, 2013. The all-time maximum demand of 38,777,000 KWs on the traditional operating companies, Southern Power, and SEGCO occurred on August 22, 2007. These amounts exclude demand served by capacity retained by
I-34
MEAG Power, OPC, and SEPA. The reserve margin for the traditional operating companies, Southern Power, and SEGCO in 2013 was 21.5%. See SELECTED FINANCIAL DATA in Item 6 herein for additional information on peak demands for each registrant.
Jointly-Owned Facilities
Alabama Power, Georgia Power, and Southern Power have undivided interests in certain generating plants and other related facilities to or from non-affiliated parties. The percentages of ownership are as follows:
|
Percentage Ownership
|
||||||||||||||||||||||||||||||||||||
|
Total
Capacity
|
Alabama
Power
|
Power
South
|
Georgia
Power
|
OPC
|
MEAG
Power
|
Dalton
|
Duke
Energy
Florida
|
Southern
Power
|
OUC
|
FMPA
|
KUA
|
|||||||||||||||||||||||||
|
(MWs)
|
||||||||||||||||||||||||||||||||||||
|
Plant Miller Units 1 and 2
|
1,320
|
|
91.8
|
%
|
8.2
|
%
|
—
|
%
|
—
|
%
|
—
|
%
|
—
|
%
|
—
|
%
|
—
|
%
|
—
|
%
|
—
|
%
|
—
|
%
|
||||||||||||
|
Plant Hatch
|
1,796
|
|
—
|
|
—
|
|
50.1
|
|
30.0
|
|
17.7
|
|
2.2
|
|
—
|
|
—
|
|
—
|
|
—
|
|
—
|
|
||||||||||||
|
Plant Vogtle
Units 1 and 2
|
2,320
|
|
—
|
|
—
|
|
45.7
|
|
30.0
|
|
22.7
|
|
1.6
|
|
—
|
|
—
|
|
—
|
|
—
|
|
—
|
|
||||||||||||
|
Plant Scherer Units 1 and 2
|
1,636
|
|
—
|
|
—
|
|
8.4
|
|
60.0
|
|
30.2
|
|
1.4
|
|
—
|
|
—
|
|
—
|
|
—
|
|
—
|
|
||||||||||||
|
Plant Wansley
|
1,779
|
|
—
|
|
—
|
|
53.5
|
|
30.0
|
|
15.1
|
|
1.4
|
|
—
|
|
—
|
|
—
|
|
—
|
|
—
|
|
||||||||||||
|
Rocky Mountain
|
848
|
|
—
|
|
—
|
|
25.4
|
|
74.6
|
|
—
|
|
—
|
|
—
|
|
—
|
|
—
|
|
—
|
|
—
|
|
||||||||||||
|
Intercession City, FL
|
143
|
|
—
|
|
—
|
|
33.3
|
|
—
|
|
—
|
|
—
|
|
66.7
|
|
—
|
|
—
|
|
—
|
|
—
|
|
||||||||||||
|
Plant Stanton A
|
660
|
|
—
|
|
—
|
|
—
|
|
—
|
|
—
|
|
—
|
|
—
|
|
65
|
%
|
28
|
%
|
3.5
|
%
|
3.5
|
%
|
||||||||||||
Alabama Power and Georgia Power have contracted to operate and maintain the respective units in which each has an interest (other than Rocky Mountain and Intercession City) as agent for the joint owners. SCS provides operation and maintenance services for Plant Stanton A.
In addition, Georgia Power has commitments regarding a portion of a 5% interest in Plant Vogtle Units 1 and 2 owned by MEAG Power that are in effect until the later of retirement of the plant or the latest stated maturity date of MEAG Power's bonds issued to finance such ownership interest. The payments for capacity are required whether any capacity is available. The energy cost is a function of each unit's variable operating costs. Except for the portion of the capacity payments related to the Georgia PSC's disallowances of Plant Vogtle Units 1 and 2 costs, the cost of such capacity and energy is included in purchased power from non-affiliates in Georgia Power's statements of income in Item 8 herein. Also see Note 7 to the financial statements of Georgia Power under "Commitments — Purchased Power Commitments" in Item 8 herein for additional information.
Georgia Power is currently constructing Plant Vogtle Unts 3 and 4 which will be jointly owned by Georgia Power, Dalton, OPC, and MEAG Power. In addition, Mississippi Power is constructing the Kemper IGCC and expects to sell a 15% ownership interest in the Kemper IGCC to SMEPA. See Note 3 to the financial statements of Southern Company and Georgia Power under "Retail Regulatory Matters - Georgia Power - Nuclear Construction" and "Retail Regulatory Matters - Nuclear Construction," respectively. Also see Note 3 to the financial statements of each of Southern Company and Mississippi Power under "Integrated Coal Gasification Combined Cycle" for additional information.
Titles to Property
The traditional operating companies', Southern Power's, and SEGCO's interests in the principal plants (other than certain pollution control facilities and the land on which five combustion turbine generators of Mississippi Power are located, which is held by easement) and other important units of the respective companies are owned in fee by such companies, subject only to the liens pursuant to pollution control revenue bonds of Alabama Power and Gulf Power on specific pollution control facilities and liens pursuant to the assumption of debt obligations by Mississippi Power in connection with the acquisition of Plant Daniel Units 3 and 4. See Note 6 to the financial statements of Southern Company, Alabama Power, Gulf Power, and Mississippi Power under "Assets Subject to Lien" in Item 8 herein for additional information. The traditional operating companies own the fee interests in certain of their principal plants as tenants in common. See "Jointly-Owned Facilities" herein for additional information. Properties such as electric transmission and distribution lines, steam heating mains, and gas pipelines are constructed principally on rights-of-way which are maintained under franchise or are held by easement only. A substantial portion of lands submerged by reservoirs is held under flood right easements.
Subsequent to December 31, 2013, Georgia Power made borrowings through the Federal Financing Bank that were guaranteed by the DOE. Georgia Power's reimbursement obligations to the DOE under the loan guarantee are secured by a first priority lien on (i) Georgia Power's 45.7% undivided ownership interest in Plant Vogtle Units 3 and 4 and (ii) Georgia Power's rights and obligations under the principal contracts relating to Plant Vogtle Units 3 and 4. See Note 6 to the financial statements of each of Southern Company and Georgia Power under “DOE Loan Guarantee Borrowings” for additional information.
I-35
|
Item 3.
|
LEGAL PROCEEDINGS
|
(1) United States of America v. Alabama Power
(United States District Court for the Northern District of Alabama)
United States of America v. Georgia Power
(United States District Court for the Northern District of Georgia)
See Note 3 to the financial statements of Southern Company and each traditional operating company under "Environmental Matters – New Source Review Actions" in Item 8 herein for information.
(2) Georgia Power et al. v. Westinghouse and Stone & Webster
(United States District Court for the Southern District of Georgia Augusta Division)
Stone & Webster and Westinghouse v. Georgia Power et al.
(United States District Court for the District of Columbia)
See Note 3 to the financial statements of Southern Company and Georgia Power under "Georgia Power – Nuclear Construction" and "Retail Regulatory Matters – Nuclear Construction," respectively, in Item 8 herein for information.
(3) Environmental Remediation
See Note 3 to the financial statements of Southern Company, Georgia Power, Gulf Power, and Mississippi Power under "Environmental Matters – Environmental Remediation" in Item 8 herein for information related to environmental remediation.
See Note 3 to the financial statements of each registrant in Item 8 herein for descriptions of additional legal and administrative proceedings discussed therein.
|
Item 4.
|
MINE SAFETY DISCLOSURES
|
Not applicable.
I-36
EXECUTIVE OFFICERS OF SOUTHERN COMPANY
(Identification of executive officers of Southern Company is inserted in Part I in accordance with Regulation S-K, Item 401(b), Instruction 3.) The ages of the officers set forth below are as of December 31, 2013.
Thomas A. Fanning
Chairman, President, Chief Executive Officer, and Director
Age 56
Elected in 2003. Chairman and Chief Executive Officer since December 2010 and President since August 2010. Previously served as Executive Vice President and Chief Operating Officer from February 2008 through July 2010.
Art P. Beattie
Executive Vice President and Chief Financial Officer
Age 59
Elected in 2010. Executive Vice President and Chief Financial Officer since August 2010. Previously served as Executive Vice President, Chief Financial Officer, and Treasurer of Alabama Power from February 2005 through August 2010.
W. Paul Bowers
Executive Vice President
Age 57
Elected in 2001. Executive Vice President since February 2008 and Chief Executive Officer, President, and Director of Georgia Power since January 2011 and Chief Operating Officer of Georgia Power from August 2010 to December 2010. He previously served as Executive Vice President and Chief Financial Officer of Southern Company from February 2008 to August 2010.
S. W. Connally, Jr.
President and Chief Executive Officer of Gulf Power
Age 44
Elected in 2012. President, Chief Executive Officer, and Director of Gulf Power since July 2012. Previously served as Senior Vice President and Chief Production Officer of Georgia Power from August 2010 through June 2012 and Manager of Alabama Power's Plant Barry from August 2007 through July 2010.
Mark A. Crosswhite (1)
Executive Vice President and Chief Operating Officer
Age 51
Elected in 2010. Executive Vice President and Chief Operating Officer since July 2012. Previously served as President, Chief Executive Officer, and Director of Gulf Power from January 2011 through June 2012 and Executive Vice President of External Affairs at Alabama Power from February 2008 through December 2010.
Kimberly S. Greene (2)
Executive Vice President
Age 47
Elected in 2013. President and Chief Executive Officer of SCS since April 2013. Before rejoining Southern Company, Ms. Greene previously served at Tennessee Valley Authority in a number of positions, most recently as Executive Vice President and Chief Generation Officer from 2011 through April 2013, Group President of Strategy and External Relations from 2010 through 2011, and Chief Financial Officer and Executive Vice President of Financial Services from 2007 through 2009.
G. Edison Holland, Jr.
Executive Vice President
Age 61
Elected in 2001. President, Chief Executive Officer, and Director of Mississippi Power since May 2013 and Executive Vice President of Southern Company since April 2001. Previously served as Corporate Secretary of Southern Company from April 2005 until May 2013 and General Counsel of Southern Company from April 2001 until May 2013.
Stephen E. Kuczynski
President and Chief Executive Officer of Southern Nuclear
Age 51
Elected in 2011. President and Chief Executive Officer of Southern Nuclear since July 2011. Before joining Southern Company, Mr. Kuczynski served at Exelon Corporation as the Senior Vice President of Engineering and Technical Services for Exelon Nuclear from February 2006 to June 2011.
I-37
Charles D. McCrary (3)
Executive Vice President
Age 62
Elected in 1998. Executive Vice President since February 2002 and President, Chief Executive Officer, and Director of Alabama Power since October 2001.
Christopher C. Womack
Executive Vice President
Age 55
Elected in 2008. Executive Vice President and President of External Affairs since January 2009.
The officers of Southern Company were elected for a term running from the first meeting of the directors following the last annual meeting (May 22, 2013) for one year or until their successors are elected and have qualified.
(1) On February 10, 2014, Mr. Crosswhite was elected President and Chief Executive Officer of Alabama Power effective March 1, 2014. Mr. Crosswhite will resign from his role as Chief Operating Officer of Southern Company effective February 28, 2014. He will continue to serve as an Executive Vice President of Southern Company.
(2) On February 10, 2014, Ms. Greene was elected Chief Operating Officer of Southern Company effective March 1, 2014.
(3) On February 10, 2014, Mr. McCrary resigned the roles of President and Chief Executive Officer of Alabama Power effective March 1, 2014 and was elected by the Alabama Power Board of Directors as Chairman until his retirement on May 1, 2014.
I-38
EXECUTIVE OFFICERS OF ALABAMA POWER
(Identification of executive officers of Alabama Power is inserted in Part I in accordance with Regulation S-K, Item 401(b), Instruction 3.) The ages of the officers set forth below are as of December 31, 2013.
Charles D. McCrary (1)
President, Chief Executive Officer, and Director
Age 62
Elected in 2001. President, Chief Executive Officer, and Director since October 2001. Since February 2002, he has also served as Executive Vice President of Southern Company.
Philip C. Raymond
Executive Vice President, Chief Financial Officer, and Treasurer
Age 54
Elected in 2010. Executive Vice President, Chief Financial Officer, and Treasurer since August 2010. Previously served as Vice President and Chief Financial Officer of Gulf Power from May 2008 to August 2010.
Zeke W. Smith
Executive Vice President
Age 54
Elected in 2010. Executive Vice President of External Affairs since November 2010. Previously served as Vice President of Regulatory Services and Financial Planning from February 2005 to November 2010.
Steven R. Spencer
Executive Vice President
Age 58
Elected in 2001. Executive Vice President of the Customer Service Organization since February 2008.
James P. Heilbron
Senior Vice President and Senior Production Officer
Age 42
Elected in 2013. Senior Vice President and Senior Production Officer since March 2013. Previously served as Senior Vice President and Senior Production Officer of Southern Power Company from July 2010 to February 2013 and Plant Manager of Georgia Power's Plant Wansley from March 2006 to July 2010.
The officers of Alabama Power were elected for a term running from the meeting of the directors held on May 3, 2013 for one year or until their successors are elected and have qualified.
(1) On February 10, 2014, Mr. McCrary resigned the roles of President and Chief Executive Officer of Alabama Power effective March 1, 2014 and was elected by the Alabama Power Board of Directors as Chairman until his retirement on May 1, 2014. Mr. Mark A. Crosswhite was elected President and Chief Executive Officer of Alabama Power effective March 1, 2014.
I-39
EXECUTIVE OFFICERS OF GEORGIA POWER
(Identification of executive officers of Georgia Power is inserted in Part I in accordance with Regulation S-K, Item 401(b), Instruction 3.) The ages of the officers set forth below are as of December 31, 2013.
W. Paul Bowers
President, Chief Executive Officer, and Director
Age 57
Elected in 2010. Chief Executive Officer, President, and Director since December 2010 and Chief Operating Officer of Georgia Power from August 2010 to December 2010. He previously served as Executive Vice President and Chief Financial Officer of Southern Company from February 2008 to August 2010.
W. Craig Barrs
Executive Vice President
Age 56
Elected in 2008. Executive Vice President of External Affairs since January 2010. Previously served as Senior Vice President of External Affairs from January 2009 to January 2010.
W. Ron Hinson
Executive Vice President, Chief Financial Officer, and Treasurer
Age 57
Elected in 2013. Executive Vice President, Chief Financial Officer, and Treasurer since March 2013. Also, served as Comptroller from March 2013 until January 2014. Previously served as Comptroller and Chief Accounting Officer of Southern Company, as well as Senior Vice President and Comptroller of SCS from March 2006 to March 2013.
Joseph A. Miller
Executive Vice President
Age 52
Elected in 2009. Executive Vice President of Nuclear Development since May 2009. He also has served as Executive Vice President of Nuclear Development at Southern Nuclear since February 2006.
Anthony L. Wilson
Executive Vice President
Age 49
Elected in 2011. Executive Vice President of Customer Service and Operations since January 2012. Previously served as Vice President of Transmission from November 2009 to December 2011 and Vice President of Distribution from February 2007 to November 2009.
Thomas P. Bishop
Senior Vice President, Chief Compliance Officer, General Counsel, and Corporate Secretary
Age 53
Elected in 2008. Corporate Secretary since April 2011 and Senior Vice President, Chief Compliance Officer, and General Counsel since September 2008.
John L. Pemberton
Senior Vice President and Senior Production Officer
Age 43
Elected in 2012. Senior Vice President and Senior Production Officer since July 2012. Previously served as Senior Vice President and General Counsel for SCS and Southern Nuclear from June 2010 to July 2012 and Vice President of Governmental Affairs for SCS from August 2006 to June 2010.
The officers of Georgia Power were elected for a term running from the meeting of the directors held on May 15, 2013 for one year or until their successors are elected and have qualified.
I-40
EXECUTIVE OFFICERS OF MISSISSIPPI POWER
(Identification of executive officers of Mississippi Power is inserted in Part I in accordance with Regulation S-K, Item 401(b), Instruction 3.) The ages of the officers set forth below are as of December 31, 2013.
G. Edison Holland, Jr.
President, Chief Executive Officer, and Director
Age 61
Elected in 2013. President, Chief Executive Officer, and Director since May 2013 and Executive Vice President of Southern Company since April 2001. Previously served as Corporate Secretary of Southern Company from April 2005 until May 2013 and General Counsel of Southern Company from April 2001 until May 2013.
John W. Atherton
Vice President
Age 53
Elected in 2004. Vice President of Corporate Services and Community Relations since October 2012. Previously served as Vice President of External Affairs from January 2005 until October 2012.
John C. Huggins
Vice President
Age 62
Elected in 2013. Vice President of Generation Development since June 2013. Previously served as General Manager for the Kemper IGCC Startup, Engineering, and Construction Services from July 2010 to June 2013 and General Manager of Environmental Compliance Implementation from July 2005 to July 2010.
Moses H. Feagin
Vice President, Treasurer, and Chief Financial Officer
Age 49
Elected in 2010. Vice President, Treasurer, and Chief Financial Officer since August 2010. Previously served as Vice President and Comptroller of Alabama Power from May 2008 to August 2010.
Jeff G. Franklin
Vice President
Age 46
Elected in 2011. Vice President of Customer Services Organization since August 2011. Previously served as Georgia Power's Vice President of Governmental and Legislative Affairs from January 2011 to July 2011, Vice President of Governmental and Regulatory Affairs from March 2009 to January 2011, and Vice President of Sales from July 2008 to April 2009.
R. Allen Reaves
Vice President
Age 54
Elected
in 2010. Vice President and Senior Production Officer since August 2010. Previously served as Manager of Mississippi Power's Plant Daniel from September 2007 through July 2010.
Billy F. Thornton
Vice President
Age 53
Elected in 2012. Vice President of Legislative and Regulatory Affairs since October 2012. Previously served as Director of External Affairs from October 2011 until October 2012, Director of Marketing from March 2011 through October 2011, and Major Account Sales Manager from June 2006 to March 2011.
The officers of Mississippi Power were elected for a term running from the meeting of the directors held on April 23, 2013 for one year or until their successors are elected and have qualified, except for Messrs. Holland and Huggins, whose elections were effective on May 20, 2013 and June 8, 2013, respectively.
I-41
|
Item 5.
|
MARKET FOR REGISTRANTS' COMMON EQUITY, RELATED STOCKHOLDER MATTERS AND ISSUER PURCHASES OF EQUITY SECURITIES
|
(a)(1) The common stock of Southern Company is listed and traded on the New York Stock Exchange. The common stock is also traded on regional exchanges across the United States. The high and low stock prices as reported on the New York Stock Exchange for each quarter of the past two years were as follows:
|
|
High
|
Low
|
||||||
|
2013
|
||||||||
|
First Quarter
|
$
|
46.95
|
|
$
|
42.82
|
|
||
|
Second Quarter
|
48.74
|
|
42.32
|
|
||||
|
Third Quarter
|
45.75
|
|
40.63
|
|
||||
|
Fourth Quarter
|
42.94
|
|
40.03
|
|
||||
|
2012
|
||||||||
|
First Quarter
|
$
|
46.06
|
|
$
|
43.71
|
|
||
|
Second Quarter
|
48.45
|
|
44.22
|
|
||||
|
Third Quarter
|
48.59
|
|
44.64
|
|
||||
|
Fourth Quarter
|
47.09
|
|
41.75
|
|
||||
There is no market for the other registrants' common stock, all of which is owned by Southern Company.
(a)(2) Number of Southern Company's common stockholders of record at January 31, 2014: 143,317
Each of the other registrants have one common stockholder, Southern Company.
(a)(3) Dividends on each registrant's common stock are payable at the discretion of their respective board of directors. The dividends on common stock declared by Southern Company and the traditional operating companies to their stockholder(s) for the past two years were as follows:
|
Registrant
|
Quarter
|
2013
|
2012
|
|||||||
|
|
|
(in thousands)
|
||||||||
|
Southern Company
|
First
|
$
|
426,110
|
|
$
|
410,040
|
|
|||
|
Second
|
443,684
|
|
426,891
|
|
||||||
|
Third
|
443,963
|
|
429,711
|
|
||||||
|
Fourth
|
448,073
|
|
426,450
|
|
||||||
|
Alabama Power
|
First
|
132,290
|
|
134,763
|
|
|||||
|
Second
|
132,290
|
|
134,762
|
|
||||||
|
Third
|
132,290
|
|
134,763
|
|
||||||
|
Fourth
|
247,290
|
|
279,762
|
|
||||||
|
Georgia Power
|
First
|
226,750
|
|
227,075
|
|
|||||
|
Second
|
226,750
|
|
227,075
|
|
||||||
|
Third
|
226,750
|
|
227,075
|
|
||||||
|
Fourth
|
226,750
|
|
302,075
|
|
||||||
|
Gulf Power
|
First
|
28,850
|
|
28,950
|
|
|||||
|
Second
|
28,850
|
|
28,950
|
|
||||||
|
Third
|
28,950
|
|
28,950
|
|
||||||
|
Fourth
|
28,750
|
|
28,950
|
|
||||||
|
Mississippi Power
|
First
|
44,190
|
|
26,700
|
|
|||||
|
Second
|
44,190
|
|
26,700
|
|
||||||
|
Third
|
44,190
|
|
26,700
|
|
||||||
|
Fourth
|
44,190
|
|
26,700
|
|
||||||
II-1
In 2013 and 2012, Southern Power Company paid dividends to Southern Company as follows:
|
Registrant
|
Quarter
|
2013
|
2012
|
|||||||
|
|
|
(in thousands)
|
||||||||
|
Southern Power Company
|
First
|
$
|
32,280
|
|
$
|
31,750
|
|
|||
|
Second
|
32,280
|
|
31,750
|
|
||||||
|
Third
|
32,280
|
|
31,750
|
|
||||||
|
Fourth
|
32,280
|
|
31,750
|
|
||||||
The dividend paid per share of Southern Company's common stock was 49¢ for the first quarter 2013 and 50.75¢ each for the second, third, and fourth quarters of 2013. In 2012, Southern Company paid a dividend per share of 47.25¢ for the first quarter and 49¢ each for the second, third, and fourth quarters.
The traditional operating companies and Southern Power Company can only pay dividends to Southern Company out of retained earnings or paid-in-capital.
Southern Power Company's senior note indenture contains potential limitations on the payment of common stock dividends. At December 31, 2013, Southern Power Company was in compliance with the conditions of this senior note indenture and thus had no restrictions on its ability to pay common stock dividends. See Note 8 to the financial statements of Southern Company under "Common Stock Dividend Restrictions" and Note 6 to the financial statements of Southern Power under "Dividend Restrictions" in Item 8 herein for additional information regarding these restrictions.
(a)(4) Securities authorized for issuance under equity compensation plans.
See Part III, Item 12. Security Ownership of Certain Beneficial Owners and Management and Related Stockholder Matters under the heading "Equity Compensation Plan Information" herein.
(b) Use of Proceeds
Not applicable.
(c) Issuer Purchases of Equity Securities
None.
|
Item 6.
|
SELECTED FINANCIAL DATA
|
|
Page
|
|
II-2
|
Item 7.
|
MANAGEMENT'S DISCUSSION AND ANALYSIS OF FINANCIAL CONDITION AND RESULTS OF OPERATIONS
|
|
Page
|
|
|
Item 7A.
|
QUANTITATIVE AND QUALITATIVE DISCLOSURES ABOUT MARKET RISK
|
See MANAGEMENT'S DISCUSSION AND ANALYSIS – FINANCIAL CONDITION AND LIQUIDITY – "Market Price Risk" of each of the registrants in Item 7 herein and Note 1 of each of the registrant's financial statements under "Financial Instruments" in Item 8 herein. See also Note 10 to the financial statements of Southern Company, Alabama Power, and Georgia Power, Note 9 to the financial statements of Gulf Power and Mississippi Power, and Note 8 to the financial statements of Southern Power in Item 8 herein.
II-3
|
Item 8.
|
FINANCIAL STATEMENTS AND SUPPLEMENTARY DATA
|
INDEX TO 2013 FINANCIAL STATEMENTS
|
|
Page
|
II-4
|
Page
|
|
II-5
|
Item 9.
|
CHANGES IN AND DISAGREEMENTS WITH ACCOUNTANTS ON ACCOUNTING AND FINANCIAL DISCLOSURE
|
None.
|
Item 9A.
|
CONTROLS AND PROCEDURES
|
Disclosure Controls And Procedures.
As of the end of the period covered by this annual report, Southern Company, Alabama Power, Georgia Power, Gulf Power, and Southern Power Company conducted separate evaluations under the supervision and with the participation of each company's management, including the Chief Executive Officer and Chief Financial Officer, of the effectiveness of the design and operation of the disclosure controls and procedures (as defined in Rules 13a-15(e) and 15d-15(e) of the Securities Exchange Act of 1934). Based upon these evaluations, the Chief Executive Officer and the Chief Financial Officer, in each case, concluded that the disclosure controls and procedures are effective.
Mississippi Power reported in Item 9A of its Annual Report on Form 10-K/A for the year ended December 31, 2012 that management determined that Mississippi Power's failure to maintain sufficient evidence supporting certain estimated amounts included in the Kemper IGCC cost estimate and to fully communicate the related effects in the development of the Kemper IGCC cost estimate constituted a material weakness in internal control over financial reporting under the standards adopted by the Public Company Accounting Oversight Board. Mississippi Power's management completed the following actions in the second and third quarters of 2013 to remediate the material weakness in internal control over financial reporting:
|
•
|
established a new governance team focused on accounting, legal, and regulatory affairs that meets regularly with the Kemper IGCC project and construction teams and provides further oversight around disclosures of the Kemper IGCC cost estimating process and schedule;
|
|
•
|
re-emphasized and enhanced communication across functional areas and departments; and
|
|
•
|
applied appropriate performance management actions.
|
In the fourth quarter 2013, Mississippi Power's management completed the actions to remediate the material weakness in internal control over financial reporting by refining and enhancing the Kemper IGCC project cost and schedule estimation methodologies and related documentation in addition to the items completed in the second and third quarters of 2013 noted above.
As of the end of the period covered by this annual report, Mississippi Power conducted an evaluation under the supervision and with the participation of management, including the Chief Executive Officer and the Chief Financial Officer, of the effectiveness of the design and operation of the disclosure controls and procedures (as defined in Sections 13a-15(e) and 15d-15(e) of the Securities Exchange Act of 1934). As part of this evaluation, Mississippi Power’s management has determined that the remediation actions discussed above were effectively designed and demonstrated operating effectiveness for a sufficient period of time to enable Mississippi Power to conclude that the material weakness regarding its internal controls related to the Kemper IGCC cost estimate has been remediated as of December 31, 2013. Therefore, the Chief Executive Officer and the Chief Financial Officer concluded that the disclosure controls and procedures for this period were effective.
Internal Control Over Financial Reporting.
(a) Management's Annual Report on Internal Control Over Financial Reporting.
Southern Company's Management's Report on Internal Control Over Financial Reporting is included on page II-9 of this Form 10-K.
Alabama Power's Management's Report on Internal Control Over Financial Reporting is included on page II-118 of this
Form 10-K.
Georgia Power's Management's Report on Internal Control Over Financial Reporting is included on page II-196 of this
Form 10-K.
Gulf Power's Management's Report on Internal Control Over Financial Reporting is included on page II-281 of this Form 10-K.
Mississippi Power's Management's Report on Internal Control Over Financial Reporting is included on page II-350 of this Form 10-K.
Southern Power's Management's Report on Internal Control Over Financial Reporting is included on page II-437 of this
Form 10-K.
II-6
(b) Attestation Report of the Registered Public Accounting Firm.
The report of Deloitte & Touche LLP, Southern Company's independent registered public accounting firm, regarding Southern Company's internal control over financial reporting is included on page II-
10
of this Form 10-K.
Not applicable to Alabama Power, Georgia Power, Gulf Power, Mississippi Power, and Southern Power Company because these companies are not accelerated filers or large accelerated filers.
(c) Changes in internal controls.
There have been no changes in Southern Company's, Alabama Power's, Georgia Power's, Gulf Power's, or Southern Power Company's internal control over financial reporting (as such term is defined in Rules 13a-15(f) and 15d-15(f) under the Securities Exchange Act of 1934) during the fourth quarter 2013 that have materially affected or are reasonably likely to materially affect Southern Company's, Alabama Power's, Georgia Power's, Gulf Power's, or Southern Power Company's internal control over financial reporting.
Other than the implementation of the actions described above under Item 9A, there have been no changes in Mississippi Power's internal control over financial reporting (as such term is defined in Rules 13a-15(f) and 15d-15(f) under the Securities Exchange Act of 1934) during the fourth quarter 2013 that have materially affected or are reasonably likely to materially affect Mississippi Power's internal control over financial reporting.
|
Item 9B.
|
OTHER INFORMATION
|
None.
II-7
THE SOUTHERN COMPANY
AND SUBSIDIARY COMPANIES
FINANCIAL SECTION
II-8
MANAGEMENT'S REPORT ON INTERNAL CONTROL OVER FINANCIAL REPORTING
Southern Company and Subsidiary Companies
2013
Annual Report
The management of The Southern Company (Southern Company) is responsible for establishing and maintaining an adequate system of internal control over financial reporting as required by the Sarbanes-Oxley Act of 2002 and as defined in Exchange Act Rule 13a-15(f). A control system can provide only reasonable, not absolute, assurance that the objectives of the control system are met.
Under management's supervision, an evaluation of the design and effectiveness of Southern Company's internal control over financial reporting was conducted based on the framework in
Internal Control—Integrated Framework
(1992)
issued by the Committee of Sponsoring Organizations of the Treadway Commission. Based on this evaluation, management concluded that Southern Company's internal control over financial reporting was effective as of
December 31, 2013
.
Deloitte & Touche LLP, an independent registered public accounting firm, as auditors of Southern Company's financial statements, has issued an attestation report on the effectiveness of Southern Company's internal control over financial reporting as of
December 31, 2013
. Deloitte & Touche LLP's report on Southern Company's internal control over financial reporting is included herein.
/s/ Thomas A. Fanning
Thomas A. Fanning
Chairman, President, and Chief Executive Officer
/s/ Art P. Beattie
Art P. Beattie
Executive Vice President and Chief Financial Officer
February 27, 2014
II-9
REPORT OF INDEPENDENT REGISTERED PUBLIC ACCOUNTING FIRM
To the Board of Directors and Stockholders of
The Southern Company
We have audited the accompanying consolidated balance sheets and consolidated statements of capitalization of The Southern Company and Subsidiary Companies (the Company) as of
December 31, 2013
and
2012
, and the related consolidated statements of income, comprehensive income, stockholders' equity, and cash flows for each of the three years in the period ended
December 31, 2013
. We also have audited the Company's internal control over financial reporting as of
December 31, 2013
, based on criteria established in
Internal Control - Integrated Framework (1992)
issued by the Committee of Sponsoring Organizations of the Treadway Commission. The Company's management is responsible for these financial statements, for maintaining effective internal control over financial reporting, and for its assessment of the effectiveness of internal control over financial reporting, included in the accompanying Management's Report on Internal Control Over Financial Reporting (page II-9). Our responsibility is to express an opinion on these financial statements and an opinion on the Company's internal control over financial reporting based on our audits.
We conducted our audits in accordance with the standards of the Public Company Accounting Oversight Board (United States). Those standards require that we plan and perform the audit to obtain reasonable assurance about whether the financial statements are free of material misstatement and whether effective internal control over financial reporting was maintained in all material respects. Our audits of the financial statements included examining, on a test basis, evidence supporting the amounts and disclosures in the financial statements, assessing the accounting principles used and significant estimates made by management, and evaluating the overall financial statement presentation. Our audit of internal control over financial reporting included obtaining an understanding of internal control over financial reporting, assessing the risk that a material weakness exists, and testing and evaluating the design and operating effectiveness of internal control based on the assessed risk. Our audits also included performing such other procedures as we considered necessary in the circumstances. We believe that our audits provide a reasonable basis for our opinions.
A company's internal control over financial reporting is a process designed by, or under the supervision of, the company's principal executive and principal financial officers, or persons performing similar functions, and effected by the company's board of directors, management, and other personnel to provide reasonable assurance regarding the reliability of financial reporting and the preparation of financial statements for external purposes in accordance with generally accepted accounting principles. A company's internal control over financial reporting includes those policies and procedures that (1) pertain to the maintenance of records that, in reasonable detail, accurately and fairly reflect the transactions and dispositions of the assets of the company; (2) provide reasonable assurance that transactions are recorded as necessary to permit preparation of financial statements in accordance with generally accepted accounting principles, and that receipts and expenditures of the company are being made only in accordance with authorizations of management and directors of the company; and (3) provide reasonable assurance regarding prevention or timely detection of unauthorized acquisition, use, or disposition of the company's assets that could have a material effect on the financial statements.
Because of the inherent limitations of internal control over financial reporting, including the possibility of collusion or improper management override of controls, material misstatements due to error or fraud may not be prevented or detected on a timely basis. Also, projections of any evaluation of the effectiveness of the internal control over financial reporting to future periods are subject to the risk that the controls may become inadequate because of changes in conditions, or that the degree of compliance with the policies or procedures may deteriorate.
In our opinion, the consolidated financial statemen
ts (pages II-46 to II-113) re
ferred to above present fairly, in all material respects, the financial position of Southern Company and Subsidiary Companies as of
December 31, 2013
and
2012
, and the results of their operations and their cash flows for each of the three years in the period ended
December 31, 2013
, in conformity with accounting principles generally accepted in the United States of America. Also, in our opinion, the Company maintained, in all material respects, effective internal control over financial reporting as of
December 31, 2013
, based on the criteria established in
Internal Control - Integrated Framework (1992)
issued by the Committee of Sponsoring Organizations of the Treadway Commission
.
/s/ Deloitte & Touche LLP
Atlanta, Georgia
February 27, 2014
II-10
MANAGEMENT'S DISCUSSION AND ANALYSIS OF FINANCIAL CONDITION AND RESULTS OF OPERATIONS
Southern Company and Subsidiary Companies
2013
Annual Report
OVERVIEW
Business Activities
The Southern Company (Southern Company or the Company) is a holding company that owns all of the common stock of the traditional operating companies – Alabama Power Company (Alabama Power), Georgia Power Company (Georgia Power), Gulf Power Company (Gulf Power), and Mississippi Power Company (Mississippi Power) – and Southern Power Company (Southern Power), and other direct and indirect subsidiaries (together, the Southern Company system). The primary business of the Southern Company system is electricity sales by the traditional operating companies and Southern Power. The four traditional operating companies are vertically integrated utilities providing electric service in four Southeastern states. Southern Power constructs, acquires, owns, and manages generation assets, including renewable energy projects, and sells electricity at market-based rates in the wholesale market.
Many factors affect the opportunities, challenges, and risks of the Southern Company system's electricity business. These factors include the traditional operating companies' ability to maintain a constructive regulatory environment, to maintain and grow energy sales given economic conditions, and to effectively manage and secure timely recovery of costs. These costs include those related to projected long-term demand growth, increasingly stringent environmental standards, reliability, fuel, capital expenditures, including new plants, and restoration following major storms. Subsidiaries of Southern Company are constructing two new nuclear generating units at Plant Vogtle (Plant Vogtle Units 3 and 4) (45.7% ownership interest by Georgia Power in two units, each with approximately 1,100 megawatts (MWs)) and the 582-MW integrated coal gasification combined cycle facility under construction in Kemper County, Mississippi (Kemper IGCC) (in which Mississippi Power is ultimately expected to hold an 85% ownership interest).
Each of the traditional operating companies has various regulatory mechanisms that operate to address cost recovery. Appropriately balancing required costs and capital expenditures with customer prices will continue to challenge the Southern Company system for the foreseeable future. In 2013, each of the traditional operating companies completed significant rate proceedings. See Note 3 to the financial statements under "Retail Regulatory Matters" and "Integrated Coal Gasification Combined Cycle" for additional information.
Another major factor is the profitability of the competitive market-based wholesale generating business. Southern Power continues to execute its strategy through a combination of acquiring, constructing, and selling power plants, including renewable energy projects, and by entering into power purchase agreements (PPAs) primarily with investor-owned utilities, independent power producers, municipalities, and electric cooperatives.
Southern Company's other business activities include investments in leveraged lease projects and telecommunications. Management continues to evaluate the contribution of each of these activities to total shareholder return and may pursue acquisitions and dispositions accordingly.
Key Performance Indicators
In striving to achieve superior risk-adjusted returns while providing cost-effective energy to more than four million customers, the Southern Company system continues to focus on several key performance indicators. These indicators include customer satisfaction, plant availability, system reliability, execution of major construction projects, and earnings per share (EPS). Southern Company's financial success is directly tied to customer satisfaction. Key elements of ensuring customer satisfaction include outstanding service, high reliability, and competitive prices. Management uses customer satisfaction surveys and reliability indicators to evaluate the results of the Southern Company system.
Peak season equivalent forced outage rate (Peak Season EFOR) is an indicator of fossil/hydro plant availability and efficient generation fleet operations during the months when generation needs are greatest. The rate is calculated by dividing the number of hours of forced outages by total generation hours. The fossil/hydro
2013
Peak Season EFOR was slightly better than the target; however, see FUTURE EARNINGS POTENTIAL – "Other Matters" herein for information regarding an explosion at Plant Bowen in April 2013 that negatively impacted the fossil/hydro 2013 Peak Season EFOR. Transmission and distribution system reliability performance is measured by the frequency and duration of outages. Performance targets for reliability are set internally based on historical performance. The performance for
2013
was better than the target for these reliability measures. Primarily as a result of charges for estimated probable losses related to construction of the Kemper IGCC, Southern Company's EPS for 2013 did not meet the target on a generally accepted accounting principles (GAAP) basis. See RESULTS OF OPERATIONS – "Estimated Loss on Kemper IGCC" and Note 3 to the financial statements under "Integrated Coal Gasification Combined Cycle" for additional information.
II-11
MANAGEMENT'S DISCUSSION AND ANALYSIS (continued)
Southern Company and Subsidiary Companies 2013 Annual Report
Excluding
t
he charges for estimated probable losses related to construction of the Kemper IGCC and the restructuring of a leveraged lease, as well as proceeds from an insurance settlement, Southern Company's
2013
results compared with its targets for some of these key indicators are reflected in the following chart:
|
Key Performance Indicator
|
2013 Target
Performance
|
2013 Actual
Performance
|
||
|
System Customer Satisfaction
|
Top quartile in
customer surveys
|
Top quartile
|
||
|
Peak Season System EFOR — fossil/hydro
|
5.86% or less
|
5.82%
|
||
|
Basic EPS — As Reported
|
$2.68-$2.80
|
$1.88
|
||
|
Estimated Loss on Kemper IGCC
(1)
|
$0.83
|
|||
|
Leveraged Lease Restructure
(2)
|
$0.02
|
|||
|
MC Asset Recovery Insurance Settlement
(3)
|
$(0.02)
|
|||
|
EPS, excluding items*
|
$2.71
|
|||
*The following three items are excluded from the EPS calculation:
|
1.
|
The estimated probable losses of $729 million after-tax, or $0.83 per share, relating to Mississippi Power's construction of the Kemper IGCC. See RESULTS OF OPERATIONS – "Estimated Loss on Kemper IGCC" and Note 3 to the financial statements under "Integrated Coal Gasification Combined Cycle" for additional information.
|
|
2.
|
The $16 million after-tax, or $0.02 per share, charge related to the restructuring of a leveraged lease investment that was completed on March 1, 2013. See RESULTS OF OPERATIONS – "Other Business Activities – Other Income (Expense), Net" for additional information.
|
|
3.
|
Insurance settlement proceeds of $12 million after-tax, or $0.02 per share, related to the March 2009 litigation settlement with MC Asset Recovery, LLC. See RESULTS OF OPERATIONS – "Other Business Activities – Other Operations and Maintenance Expenses" and Note 3 to the financial statements under "Insurance Recovery" for additional information.
|
Does not reflect EPS as calculated in accordance with GAAP. Southern Company management uses the non-GAAP measure of EPS, excluding items described above, to evaluate the performance of Southern Company's ongoing business activities. Southern Company believes the presentation of this non-GAAP measure of earnings is useful for investors because it provides earnings information that is consistent with the historical and ongoing business activities of the Company. The presentation of this information is not meant to be considered a substitute for financial measures prepared in accordance with GAAP.
See RESULTS OF OPERATIONS herein for additional information on the Company's financial performance.
Earnings
Southern Company's net income after dividends on preferred and preference stock of subsidiaries was
$1.6 billion
in 2013, a decrease of
$706 million
, or
30.0%
, from the prior year. The decrease was primarily the result of $1.2 billion in pre-tax charges ($729 million after-tax) for revisions of estimated costs expected to be incurred on Mississippi Power's construction of the Kemper IGCC above the $2.88 billion cost cap established by the Mississippi Public Service Commission (PSC), net of $245 million of grants awarded to the project by the U.S. Department of Energy (DOE) under the Clean Coal Power Initiative Round 2 (DOE Grants) and excluding the cost of the lignite mine and equipment, the cost of the carbon dioxide (CO
2
) pipeline facilities, allowance for funds used during construction (AFUDC), and certain general exceptions, including change of law, force majeure, and beneficial capital (which exists when Mississippi Power demonstrates that the purpose and effect of the construction cost increase is to produce efficiencies that will result in a neutral or favorable effect on customers relative to the original proposal for the certificate of public convenience and necessity (CPCN)) (Cost Cap Exceptions). Also contributing to the decrease in net income were increases in depreciation and amortization and other operations and maintenance expenses, partially offset by increases in retail revenues and AFUDC.
Southern Company's net income after dividends on preferred and preference stock of subsidiaries was
$2.4 billion
in 2012, an increase of
$147 million
, or
6.7%
, from the prior year. The increase was primarily the result of lower operations and maintenance expenses resulting from cost containment efforts in 2012, increases in revenues associated with the elimination of a tax-related adjustment under Alabama Power's rate structure, an increase related to retail revenue rate effects at Georgia Power, and an increase in revenues due to increases in retail base rates at Gulf Power. Also contributing to the increase were higher capacity revenues and an increase in retail sales growth. The increases were partially offset by milder weather and an increase in depreciation on additional plant in service related to new generation, transmission, distribution, and environmental projects.
Basic EPS was
$1.88
in 2013,
$2.70
in 2012, and
$2.57
in 2011. Diluted EPS, which factors in additional shares related to stock-based compensation, was
$1.87
in 2013,
$2.67
in 2012, and
$2.55
in 2011. EPS for
2013
was negatively impacted by $0.02 per share as a result of an increase in the average shares outstanding. See FINANCIAL CONDITION AND LIQUIDITY – "Financing Activities" herein for additional information.
II-12
MANAGEMENT'S DISCUSSION AND ANALYSIS (continued)
Southern Company and Subsidiary Companies 2013 Annual Report
Dividends
Southern Company has paid dividends on its common stock since 1948. Dividends paid per share of common stock were $2.0125 in
2013
, $1.9425 in
2012
, and $1.8725 in
2011
. In January
2014
, Southern Company declared a quarterly dividend of 50.75 cents per share. This is the 265th consecutive quarter that Southern Company has paid a dividend equal to or higher than the previous quarter. For
2013
, the actual payout ratio was 107%, while the payout ratio of net income excluding charges for estimated probable losses relating to Mississippi Power's construction of the Kemper IGCC and the restructuring of a leveraged lease investment as well as proceeds from the MC Asset Recovery insurance settlement was 74%.
RESULTS OF OPERATIONS
Discussion of the results of operations is divided into two parts – the Southern Company system's primary business of electricity sales and its other business activities.
|
Amount
|
|||||||||||
|
2013
|
2012
|
2011
|
|||||||||
|
(in millions)
|
|||||||||||
|
Electricity business
|
$
|
1,652
|
|
$
|
2,321
|
|
$
|
2,214
|
|
||
|
Other business activities
|
(8
|
)
|
29
|
|
(11
|
)
|
|||||
|
Net income
|
$
|
1,644
|
|
$
|
2,350
|
|
$
|
2,203
|
|
||
Electricity Business
Southern Company's electric utilities generate and sell electricity to retail and wholesale customers in the Southeast.
A condensed statement of income for the electricity business follows:
|
|
Amount
|
|
Increase (Decrease)
from Prior Year
|
||||||||
|
|
2013
|
2013
|
2012
|
||||||||
|
|
(in millions)
|
||||||||||
|
Electric operating revenues
|
$
|
17,035
|
|
$
|
557
|
|
$
|
(1,109
|
)
|
||
|
Fuel
|
5,510
|
|
453
|
|
(1,205
|
)
|
|||||
|
Purchased power
|
461
|
|
(83
|
)
|
(64
|
)
|
|||||
|
Other operations and maintenance
|
3,778
|
|
83
|
|
(147
|
)
|
|||||
|
Depreciation and amortization
|
1,886
|
|
114
|
|
72
|
|
|||||
|
Taxes other than income taxes
|
932
|
|
20
|
|
13
|
|
|||||
|
Estimated loss on Kemper IGCC
|
1,180
|
|
1,180
|
|
—
|
|
|||||
|
Total electric operating expenses
|
13,747
|
|
1,767
|
|
(1,331
|
)
|
|||||
|
Operating income
|
3,288
|
|
(1,210
|
)
|
222
|
|
|||||
|
Allowance for equity funds used during construction
|
190
|
|
47
|
|
(10
|
)
|
|||||
|
Interest income
|
18
|
|
(4
|
)
|
3
|
|
|||||
|
Interest expense, net of amounts capitalized
|
788
|
|
(32
|
)
|
17
|
|
|||||
|
Other income (expense), net
|
(55
|
)
|
2
|
|
16
|
|
|||||
|
Income taxes
|
935
|
|
(465
|
)
|
107
|
|
|||||
|
Net income
|
1,718
|
|
(668
|
)
|
107
|
|
|||||
|
Dividends on preferred and preference stock of subsidiaries
|
66
|
|
1
|
|
—
|
|
|||||
|
Net income after dividends on preferred and preference stock of subsidiaries
|
$
|
1,652
|
|
$
|
(669
|
)
|
$
|
107
|
|
||
II-13
MANAGEMENT'S DISCUSSION AND ANALYSIS (continued)
Southern Company and Subsidiary Companies 2013 Annual Report
Electric Operating Revenues
Electric operating revenues for 2013 were
$17.0 billion
, reflecting a
$557 million
increase from 2012. Details of electric operating revenues were as follows:
|
|
Amount
|
||||||
|
|
2013
|
2012
|
|||||
|
|
(in millions)
|
||||||
|
Retail — prior year
|
$
|
14,187
|
|
$
|
15,071
|
|
|
|
Estimated change resulting from —
|
|
||||||
|
Rates and pricing
|
137
|
|
296
|
|
|||
|
Sales growth (decline)
|
(2
|
)
|
39
|
|
|||
|
Weather
|
(40
|
)
|
(282
|
)
|
|||
|
Fuel and other cost recovery
|
259
|
|
(937
|
)
|
|||
|
Retail — current year
|
14,541
|
|
14,187
|
|
|||
|
Wholesale revenues
|
1,855
|
|
1,675
|
|
|||
|
Other electric operating revenues
|
639
|
|
616
|
|
|||
|
Electric operating revenues
|
$
|
17,035
|
|
$
|
16,478
|
|
|
|
Percent change
|
3.4
|
%
|
(6.3
|
)%
|
|||
Retail revenues increased
$354 million
, or
2.5%
, in 2013 as compared to the prior year. The significant factors driving this change are shown in the preceding table. The increase in rates and pricing in 2013 was primarily due to base tariff increases at Georgia Power effective April 1, 2012 and January 1, 2013, as approved by the Georgia PSC, related to placing new generating units at Plant McDonough-Atkinson in service and collecting financing costs related to the construction of Plant Vogtle Units 3 and 4 through the Nuclear Construction Cost Recovery (NCCR) tariff, as well as higher contributions from market-driven rates from commercial and industrial customers.
Retail revenues decreased
$884 million
, or
5.9%
, in 2012 as compared to the prior year. The significant factors driving this change are shown in the preceding table. The increase in rates and pricing in 2012 was primarily due to increases in retail revenues at Georgia Power due to base tariff increases effective April 1, 2012 related to placing Plant McDonough-Atkinson Units 4 and 5 in service, collecting financing costs related to the construction of Plant Vogtle Units 3 and 4 through the NCCR tariff, and demand-side management programs effective January 1, 2012, as approved by the Georgia PSC, as well as the rate pricing effect of decreased customer usage. Also contributing to the increase were the elimination of a tax-related adjustment under Alabama Power's rate structure that was effective with October 2011 billings and higher revenues due to increases in retail base rates at Gulf Power. These increases were partially offset by lower contributions from market-driven rates from commercial and industrial customers at Georgia Power and decreased revenues under rate certificated new plant environmental (Rate CNP Environmental) at Alabama Power.
See FUTURE EARNINGS POTENTIAL – "PSC Matters – Alabama Power – Retail Rate Adjustments" and "PSC Matters – Georgia Power – Rate Plans" herein for additional information. Also see "Energy Sales" below for a discussion of changes in the volume of energy sold, including changes related to sales growth (decline) and weather.
Electric rates for the traditional operating companies include provisions to adjust billings for fluctuations in fuel costs, including the energy component of purchased power costs. Under these provisions, fuel revenues generally equal fuel expenses, including the energy component of purchased power costs, and do not affect net income. The traditional operating companies may also have one or more regulatory mechanisms to recover other costs such as environmental, storm damage, new plants, and PPAs.
Wholesale revenues consist of PPAs with investor-owned utilities and electric cooperatives and short-term opportunity sales. Wholesale revenues from PPAs have both capacity and energy components. Capacity revenues reflect the recovery of fixed costs and a return on investment. Energy revenues will vary depending on fuel prices, the market prices of wholesale energy compared to the Southern Company system's generation, demand for energy within the Southern Company system's service territory, and the availability of the Southern Company system's generation. Increases and decreases in energy revenues that are driven by fuel prices are accompanied by an increase or decrease in fuel costs and do not have a significant impact on net income. Short-term opportunity sales are made at market-based rates that generally provide a margin above the Southern Company system's variable cost to produce the energy.
II-14
MANAGEMENT'S DISCUSSION AND ANALYSIS (continued)
Southern Company and Subsidiary Companies 2013 Annual Report
Wholesale revenues from power sales were as follows:
|
2013
|
2012
|
2011
|
|||||||||
|
|
(in millions)
|
||||||||||
|
Capacity and other
|
$
|
955
|
|
$
|
882
|
|
$
|
820
|
|
||
|
Energy
|
900
|
|
793
|
|
1,085
|
|
|||||
|
Total
|
$
|
1,855
|
|
$
|
1,675
|
|
$
|
1,905
|
|
||
In 2013, wholesale revenues increased
$180 million
, or
10.7%
, as compared to the prior year due to a
$107 million
increase in energy revenues and a
$73 million
increase in capacity revenues. The increase in energy revenues was primarily related to an increase in the average price of energy and new solar contracts served by Southern Power's Plants Campo Verde and Spectrum, which began in 2013, partially offset by a decrease in volume related to milder weather as compared to the prior year. The increase in capacity revenues was primarily due to a new PPA served by Southern Power's Plant Nacogdoches, which began in June 2012, and an increase in capacity amounts under existing PPAs.
In 2012, wholesale revenues decreased
$230 million
, or
12.1%
, as compared to the prior year due to a
$292 million
decrease in energy sales primarily due to a reduction in the average price of energy and lower customer demand, partially offset by a
$62 million
increase in capacity revenues.
Other Electric Revenues
Other electric revenues increased
$23 million
, or
3.7%
, and
$5 million
, or
0.8%
, in 2013 and 2012, respectively, as compared to the prior years. The 2013 increase in other electric revenues was primarily a result of increases in transmission revenues related to the open access transmission tariff and rents from electric property related to pole attachments. Other electric revenues increased in 2012 primarily due to an increase in rents from electric property.
Energy Sales
Changes in revenues are influenced heavily by the change in the volume of energy sold from year to year. Kilowatt-hour (KWH) sales for 2013 and the percent change by year were as follows:
|
|
Total
KWHs
|
Total KWH
Percent Change
|
Weather-Adjusted
Percent Change
|
|||||||||||
|
|
2013
|
2013
|
2012
|
2013*
|
2012
|
|||||||||
|
|
(in billions)
|
|
|
|
|
|||||||||
|
Residential
|
50.6
|
|
0.2
|
%
|
(5.4
|
)%
|
(0.3
|
)%
|
1.1
|
%
|
||||
|
Commercial
|
52.6
|
|
(0.9
|
)
|
(1.6
|
)
|
(0.1
|
)
|
(0.2
|
)
|
||||
|
Industrial
|
52.4
|
|
1.5
|
|
0.2
|
|
1.5
|
|
0.2
|
|
||||
|
Other
|
0.9
|
|
(1.8
|
)
|
(1.8
|
)
|
(1.9
|
)
|
(1.4
|
)
|
||||
|
Total retail
|
156.5
|
|
0.3
|
|
(2.3
|
)
|
0.4
|
%
|
0.4
|
%
|
||||
|
Wholesale
|
26.9
|
|
(2.2
|
)
|
(9.2
|
)
|
||||||||
|
Total energy sales
|
183.4
|
|
(0.1
|
)%
|
(3.4
|
)%
|
||||||||
|
*
|
In the first quarter 2012, Georgia Power began using new actual advanced meter data to compute unbilled revenues. The weather-adjusted KWH sales variances shown above reflect an adjustment to the estimated allocation of Georgia Power's unbilled January 2012 KWH sales among customer classes that is consistent with the actual allocation in 2013. Without this adjustment, 2013 weather-adjusted residential KWH sales decreased 0.5% as compared to 2012 while weather-adjusted commercial KWH sales increased 0.2% as compared
to 2012.
|
Changes in retail energy sales are comprised of changes in electricity usage by customers, changes in weather, and changes in the number of customers. Retail energy sales increased
403 million
KWHs in 2013 as compared to the prior year. This increase was primarily the result of customer growth, partially offset by milder weather and a decrease in customer usage. Weather-adjusted residential and commercial energy sales remained relatively flat compared to the prior year with a decrease in customer usage, offset by customer growth. The increase in industrial energy sales was primarily due to increased demand in the paper, primary metals, and stone, clay, and glass sectors.
Retail energy sales decreased
3.6 billion
KWHs in 2012 as compared to the prior year. This decrease was primarily the result of milder weather in 2012, partially offset by customer growth and an increase in customer usage primarily in the residential class.
II-15
MANAGEMENT'S DISCUSSION AND ANALYSIS (continued)
Southern Company and Subsidiary Companies 2013 Annual Report
Wholesale energy sales decreased
619 million
KWHs in 2013 and
2.8 billion
KWHs in 2012 as compared to the prior years. The decreases in wholesale energy sales were primarily related to lower customer demand resulting from milder weather as compared to the prior years.
Fuel and Purchased Power Expenses
Fuel costs constitute the single largest expense for the electric utilities. The mix of fuel sources for generation of electricity is determined primarily by demand, the unit cost of fuel consumed, and the availability of generating units. Additionally, the electric utilities purchase a portion of their electricity needs from the wholesale market.
Details of the Southern Company system's generation and purchased power were as follows:
|
2013
|
2012
|
2011
|
||||||
|
Total generation
(billions of KWHs)
|
179
|
|
175
|
|
186
|
|
||
|
Total purchased power
(billions of KWHs)
|
12
|
|
16
|
|
12
|
|
||
|
Sources of generation
(percent)
—
|
|
|||||||
|
Coal
|
39
|
|
38
|
|
52
|
|
||
|
Nuclear
|
17
|
|
18
|
|
16
|
|
||
|
Gas
|
40
|
|
42
|
|
30
|
|
||
|
Hydro
|
4
|
|
2
|
|
2
|
|
||
|
Cost of fuel, generated
(cents per net KWH)
—
|
|
|||||||
|
Coal
|
4.01
|
|
3.96
|
|
4.02
|
|
||
|
Nuclear
|
0.87
|
|
0.83
|
|
0.72
|
|
||
|
Gas
|
3.29
|
|
2.86
|
|
3.89
|
|
||
|
Average cost of fuel, generated
(cents per net KWH)
|
3.17
|
|
2.93
|
|
3.43
|
|
||
|
Average cost of purchased power
(cents per net KWH) *
|
5.27
|
|
4.45
|
|
6.32
|
|
||
|
*
|
Average cost of purchased power includes fuel purchased by the Southern Company system for tolling agreements where power is generated by the provider.
|
In 2013, total fuel and purchased power expenses were
$6.0 billion
, an increase of
$370 million
, or
6.6%
, as compared to the prior year. This increase was primarily the result of a $446 million increase in the average cost of fuel and purchased power primarily due to higher natural gas prices and a $113 million increase in the volume of KWHs generated, partially offset by a $189 million decrease in the volume of KWHs purchased as the marginal cost of generation available was lower than the market cost of available energy.
In 2012, total fuel and purchased power expenses were
$5.6 billion
, a decrease of
$1.3 billion
, or
18.5%
, as compared to the prior year. This decrease was primarily the result of a $1.0 billion decrease in the average cost of fuel and purchased power and a $519 million decrease in the volume of KWHs generated as a result of milder weather in 2012, partially offset by a $270 million increase in the volume of KWHs purchased.
Fuel and purchased power energy transactions at the traditional operating companies are generally offset by fuel revenues and do not have a significant impact on net income. See FUTURE EARNINGS POTENTIAL – "PSC Matters – Retail Fuel Cost Recovery" herein for additional information. Fuel expenses incurred under Southern Power's PPAs are generally the responsibility of the counterparties and do not significantly impact net income.
Fuel
In 2013, fuel expense was
$5.5 billion
, an increase of
$453 million
, or
9.0%
, as compared to the prior year. The increase was primarily due to a 15.0% increase in the average cost of natural gas per KWH generated, partially offset by a 125.9% increase in the volume of KWHs generated by hydro facilities resulting from greater rainfall.
In 2012, fuel expense was
$5.1 billion
, a decrease of
$1.2 billion
, or
19.2%
, as compared to the prior year. The decrease was primarily due to a 26.5% decrease in the average cost of natural gas per KWH generated, a higher percentage of generation from lower-cost natural gas-fired resources, and lower customer demand mainly due to milder weather in 2012.
II-16
MANAGEMENT'S DISCUSSION AND ANALYSIS (continued)
Southern Company and Subsidiary Companies 2013 Annual Report
Purchased Power
In 2013, purchased power expense was
$461 million
, a decrease of
$83 million
, or
15.3%
, as compared to the prior year. The decrease was due to a 25.9% decrease in the volume of KWHs purchased as the marginal cost of generation available was lower than the market cost of available energy, partially offset by an 18.4% increase in the average cost per KWH purchased.
In 2012, purchased power expense was
$544 million
, a decrease of
$64 million
, or
10.5%
, as compared to the prior year. The decrease was due to a 29.6% decrease in the average cost per KWH purchased, partially offset by a 35.1% increase in the volume of KWHs purchased as the market cost of available energy was lower than the marginal cost of generation available.
Energy purchases will vary depending on demand for energy within the Southern Company system's service territory, the market prices of wholesale energy as compared to the cost of the Southern Company system's generation, and the availability of the Southern Company system's generation.
Other Operations and Maintenance Expenses
Other operations and maintenance expenses increased
$83 million
, or
2.2%
, in 2013 and decreased
$147 million
, or
3.8%
, in 2012 as compared to the prior years. Other operations and maintenance expenses in 2013 and 2012 were significantly below normal levels as a result of cost containment efforts undertaken primarily at Georgia Power to offset the impact of significantly milder than normal weather conditions. Discussion of significant variances for components of other operations and maintenance expenses follows.
Other production expenses at fossil, hydro, and nuclear plants decreased
$7 million
and
$110 million
in 2013 and 2012, respectively, as compared to the prior years. Production expenses fluctuate from year to year due to variations in outage schedules and changes in the cost of labor and materials. The decrease in other production expenses in 2013 was not material. Other production expenses decreased in 2012 primarily due to a decrease in scheduled outage and maintenance costs and commodity and labor costs, which was primarily the result of cost containment efforts to offset the effect of milder weather in 2012. Also contributing to the decrease was a $35 million decrease at Mississippi Power related to the expiration of the operating lease for Plant Daniel Units 3 and 4, which was offset by a $35 million increase at Alabama Power primarily related to a change in the nuclear maintenance outage accounting process associated with routine refueling activities, as approved by the Alabama PSC in 2010. See FUTURE EARNINGS POTENTIAL – "PSC Matters – Alabama Power – Nuclear Outage Accounting Order" herein for additional information.
Transmission and distribution expenses increased
$27 million
in 2013 and decreased
$75 million
in 2012 as compared to the prior years. Transmission and distribution expenses fluctuate from year to year due to variations in maintenance schedules and normal changes in the cost of labor and materials. Transmission and distribution expenses increased in 2013 primarily due to increases at Georgia Power in transmission system load expense resulting from billing adjustments with integrated transmission system owners. Transmission and distribution expenses decreased in 2012 primarily due to cost containment efforts to offset the effects of the milder weather in 2012 and a reduction in accruals at Alabama Power to the natural disaster reserve (NDR). See FUTURE EARNINGS POTENTIAL – "PSC Matters – Alabama Power – Natural Disaster Reserve" herein for additional information.
Customer accounts, sales, and service expenses remained relatively flat in 2013 and decreased
$20 million
in 2012 as compared to the prior years primarily due to a decrease in uncollectible account expense at Georgia Power.
Administrative and general expenses increased
$63 million
and
$58 million
in 2013 and 2012, respectively, as compared to the prior years primarily as a result of an increase in pension costs.
Depreciation and Amortization
Depreciation and amortization increased
$114 million
, or
6.4%
, in 2013 as compared to the prior year primarily due to additional plant in service related to the completion of Georgia Power's Plant McDonough-Atkinson Units 5 and 6 in April 2012 and October 2012, respectively, and six Southern Power plants between June 2012 and October 2013, certain coal unit retirement decisions (with respect to the portion of such units dedicated to wholesale service) at Georgia Power, and additional transmission and distribution projects. See FUTURE EARNINGS POTENTIAL – "PSC Matters – Georgia Power – Integrated Resource Plan" for additional information on Georgia Power's unit retirement decisions. These increases were partially offset by a net reduction in amortization primarily related to amortization of a regulatory liability for state income tax credits at Georgia Power and by the deferral of certain expenses under an accounting order at Alabama Power. See Note 1 to the financial statements under "Regulatory Assets and Liabilities" for additional information on the state income tax credits regulatory liability. Also see FUTURE EARNINGS POTENTIAL – "PSC Matters – Alabama Power – Compliance and Pension Cost Accounting Order" herein and Note 3 to the financial statements under "Retail Regulatory Matters – Alabama Power – Compliance and Pension Cost Accounting Order" for additional information on Alabama Power's accounting order.
II-17
MANAGEMENT'S DISCUSSION AND ANALYSIS (continued)
Southern Company and Subsidiary Companies 2013 Annual Report
Depreciation and amortization increased
$72 million
, or
4.2%
, in 2012 as compared to the prior year primarily as a result of additional plant in service related to new generation at Georgia Power's Plant McDonough-Atkinson Units 4 and 5, additional plant in service at Southern Power, as well as transmission, distribution, and environmental projects, partially offset by amortization of a regulatory liability for state income tax credits at Georgia Power as authorized by the Georgia PSC.
See Note 1 to the financial statements under "Regulatory Assets and Liabilities" and "Depreciation and Amortization" for additional information.
Taxes Other Than Income Taxes
Taxes other than income taxes increased
$20 million
, or
2.2%
, in 2013 as compared to the prior year primarily due to increases in property taxes. Taxes other than income taxes increased
$13 million
, or
1.4%
, in 2012 as compared to the prior year primarily due to increases in property taxes, partially offset by a decrease in municipal franchise fees, which are based on revenues from energy sales.
Estimated Loss on Kemper IGCC
In 2013, estimated probable losses on the Kemper IGCC of $1.2 billion were recorded at Southern Company to reflect revisions of estimated costs expected to be incurred on Mississippi Power's construction of the Kemper IGCC in excess of the $2.88 billion cost cap established by the Mississippi PSC, net of the DOE Grants and excluding the Cost Cap Exceptions. See FUTURE EARNINGS POTENTIAL – "Construction Program" herein and Note 3 to the financial statements under "Integrated Coal Gasification Combined Cycle" for additional information.
Allowance for Equity Funds Used During Construction
AFUDC equity increased
$47 million
, or
32.9%
, in 2013 as compared to the prior year primarily due to an increase in construction work in progress (CWIP) related to the construction of Mississippi Power's Kemper IGCC and increased capital expenditures at Alabama Power, partially offset by the completion of Georgia Power's Plant McDonough-Atkinson Units 5 and 6 in 2012. See Note 3 to the financial statements under "Integrated Coal Gasification Combined Cycle" for additional information regarding the Kemper IGCC.
AFUDC equity decreased
$10 million
, or
6.5%
, in 2012 as compared to the prior year primarily due to the completion of Georgia Power's Plant McDonough-Atkinson Units 4, 5, and 6 in December 2011, April 2012, and October 2012, respectively, partially offset by increases in CWIP related to the construction of Mississippi Power's Kemper IGCC.
Interest Expense, Net of Amounts Capitalized
Total interest charges and other financing costs decreased
$32 million
, or
3.9%
, in 2013 as compared to the prior year primarily due to lower interest rates, the timing of issuances and redemptions of long-term debt, an increase in capitalized interest primarily resulting from AFUDC debt associated with Mississippi Power's Kemper IGCC, and an increase in capitalized interest associated with the construction of Southern Power's Plants Campo Verde and Spectrum. These decreases were partially offset by a decrease in capitalized interest resulting from the completion of Southern Power's Plants Nacogdoches and Cleveland, a reduction in AFUDC debt due to the completion of Georgia Power's Plant McDonough-Atkinson Units 5 and 6, and the conclusion of certain state and federal tax audits in 2012.
Total interest charges and other financing costs increased
$17 million
, or
2.1%
, in 2012 as compared to the prior year primarily due to a $23 million reduction in interest expense in 2011 at Georgia Power resulting from the settlement of litigation with the Georgia Department of Revenue, a decrease in AFUDC debt at Georgia Power due to the completion of Plant McDonough-Atkinson Units 4 and 5, and a net increase in interest expense related to senior notes and other long-term debt. The increases were partially offset by a decrease in interest expense on existing variable rate pollution control revenue bonds, an increase in capitalized interest primarily resulting from AFUDC debt associated with the Kemper IGCC at Mississippi Power, and a decrease related to the conclusion of certain state and federal income tax audits.
Other Income (Expense), Net
In 2013, the change in other income (expense), net was not material. Other income (expense), net increased
$16 million
, or
21.9%
, in 2012 as compared to the prior year primarily due to a make-whole premium payment in connection with the early redemption of senior notes at Southern Power in 2011.
II-18
MANAGEMENT'S DISCUSSION AND ANALYSIS (continued)
Southern Company and Subsidiary Companies 2013 Annual Report
Income Taxes
Income taxes decreased
$465 million
, or
33.2%
, in 2013 as compared to the prior year primarily due to lower pre-tax earnings, an increase in tax benefits recognized from investment tax credits at Southern Power, and a net increase in non-taxable AFUDC equity, partially offset by a decrease in state income tax credits, primarily at Georgia Power.
Income taxes increased
$107 million
, or
8.3%
, in 2012 as compared to the prior year primarily due to higher pre-tax earnings, an increase in non-deductible book depreciation, and a decrease in non-taxable AFUDC equity, partially offset by state income tax credits.
Other Business Activities
Southern Company's other business activities include the parent company (which does not allocate operating expenses to business units), investments in leveraged lease projects, and telecommunications. These businesses are classified in general categories and may comprise one or both of the following subsidiaries: Southern Company Holdings, Inc. (Southern Holdings) invests in various projects, including leveraged lease projects, and Southern Communications Services, Inc. (SouthernLINC Wireless) provides digital wireless communications for use by Southern Company and its subsidiary companies and also markets these services to the public and provides fiber cable services within the Southeast.
A condensed statement of income for Southern Company's other business activities follows:
|
|
Amount
|
Increase (Decrease)
from Prior Year
|
|||||||||
|
|
2013
|
2013
|
2012
|
||||||||
|
|
(in millions)
|
||||||||||
|
Operating revenues
|
$
|
52
|
|
$
|
(7
|
)
|
$
|
(11
|
)
|
||
|
Other operations and maintenance
|
68
|
|
(9
|
)
|
(19
|
)
|
|||||
|
Depreciation and amortization
|
15
|
|
—
|
|
(2
|
)
|
|||||
|
Taxes other than income taxes
|
2
|
|
—
|
|
—
|
|
|||||
|
Total operating expenses
|
85
|
|
(9
|
)
|
(21
|
)
|
|||||
|
Operating income (loss)
|
(33
|
)
|
2
|
|
10
|
|
|||||
|
Interest income
|
1
|
|
(17
|
)
|
16
|
|
|||||
|
Equity in income (losses) of unconsolidated subsidiaries
|
—
|
|
2
|
|
—
|
|
|||||
|
Other income (expense), net
|
(26
|
)
|
(47
|
)
|
7
|
|
|||||
|
Interest expense
|
36
|
|
(3
|
)
|
(15
|
)
|
|||||
|
Income taxes
|
(86
|
)
|
(20
|
)
|
8
|
|
|||||
|
Net income (loss)
|
$
|
(8
|
)
|
$
|
(37
|
)
|
$
|
40
|
|
||
Operating Revenues
Southern Company's non-electric operating revenues from these other business activities decreased
$7 million
, or
11.9%
, and
$11 million
, or
15.7%
, in 2013 and 2012, respectively, as compared to the prior years. The decreases were primarily the result of decreases in revenues at SouthernLINC Wireless related to lower average per subscriber revenue and fewer subscribers due to continued competition in the industry.
Other Operations and Maintenance Expenses
Other operations and maintenance expenses for these other businesses decreased
$9 million
, or
11.7%
, and
$19 million
, or
19.8%
, in 2013 and 2012, respectively, as compared to the prior years. The decrease in 2013 was primarily related to lower operating expenses at SouthernLINC Wireless and decreases in consulting and legal fees, partially offset by higher operating expenses at Southern Holdings and a decrease in the amount of insurance proceeds received in 2013 related to the litigation settlement with MC Asset Recovery, LLC as compared to the amount received in 2012. The decrease in 2012 was primarily related to the insurance proceeds received in 2012. See Note 3 to the financial statements under "Insurance Recovery" for additional information.
Interest Income
Interest income for these other businesses decreased
$17 million
in 2013 and increased
$16 million
in 2012 as compared to the prior years primarily due to the conclusion of certain federal income tax audits in 2012.
II-19
MANAGEMENT'S DISCUSSION AND ANALYSIS (continued)
Southern Company and Subsidiary Companies 2013 Annual Report
Other Income (Expense), Net
Other income (expense), net for these other businesses decreased
$47 million
in 2013 and increased
$7 million
in 2012 as compared to the prior years. The decrease in 2013 was primarily due to the restructuring of a leveraged lease investment and an increase in charitable contributions. The increase in 2012 was primarily due to a decrease in charitable contributions.
Southern Company has several leveraged lease agreements which relate to international and domestic energy generation, distribution, and transportation assets. Southern Company receives federal income tax deductions for depreciation and amortization, as well as interest on long-term debt related to these investments. See Note 1 under "Leveraged Leases" for additional information.
Interest Expense
Total interest charges and other financing costs for these other businesses decreased
$3 million
, or
7.7%
, and
$15 million
, or
27.8%
, in 2013 and 2012, respectively, as compared to the prior years. The decrease in 2013 was not material. The decrease in 2012 was primarily related to lower interest rates on existing debt.
Income Taxes
Income taxes for these other businesses decreased
$20 million
, or
30.3%
, in 2013 as compared to the prior year primarily as a result of higher pre-tax losses. Income taxes for these other businesses increased
$8 million
, or
10.8%
, in 2012 as compared to the prior year primarily as a result of lower pre-tax losses.
Effects of Inflation
The traditional operating companies are subject to rate regulation that is generally based on the recovery of historical and projected costs. The effects of inflation can create an economic loss since the recovery of costs could be in dollars that have less purchasing power. Southern Power is party to long-term contracts reflecting market-based rates, including inflation expectations. Any adverse effect of inflation on Southern Company's results of operations has not been substantial in recent years.
FUTURE EARNINGS POTENTIAL
General
The four traditional operating companies operate as vertically integrated utilities providing electricity to customers within their service areas in the Southeast. Prices for electricity provided to retail customers are set by state PSCs under cost-based regulatory principles. Prices for wholesale electricity sales, interconnecting transmission lines, and the exchange of electric power are regulated by the Federal Energy Regulatory Commission (FERC). Retail rates and earnings are reviewed and may be adjusted periodically within certain limitations. Southern Power continues to focus on long-term capacity contracts, optimized by limited energy trading activities. See ACCOUNTING POLICIES – "Application of Critical Accounting Policies and Estimates – Electric Utility Regulation" herein and Note 3 to the financial statements for additional information about regulatory matters.
The results of operations for the past three years are not necessarily indicative of future earnings potential. The level of Southern Company's future earnings depends on numerous factors that affect the opportunities, challenges, and risks of the Southern Company system's primary business of selling electricity. These factors include the traditional operating companies' ability to maintain a constructive regulatory environment that continues to allow for the timely recovery of prudently-incurred costs during a time of increasing costs and the successful completion of Plant Vogtle Units 3 and 4 and the Kemper IGCC as well as other ongoing construction projects. Another major factor is the profitability of the competitive wholesale supply business. Future earnings for the electricity business in the near term will depend, in part, upon maintaining energy sales which is subject to a number of factors. These factors include weather, competition, new energy contracts with other utilities and other wholesale customers, energy conservation practiced by customers, the price of electricity, the price elasticity of demand, and the rate of economic growth or decline in the service territory. In addition, the level of future earnings for the wholesale supply business also depends on numerous factors including creditworthiness of customers, total generating capacity available and related costs, future acquisitions and construction of generating facilities, and the successful remarketing of capacity as current contracts expire. Changes in regional and global economic conditions impact sales for the traditional operating companies and Southern Power, as the pace of the economic recovery remains uncertain. The timing and extent of the economic recovery will impact growth and may impact future earnings.
As part of its ongoing effort to adapt to changing market conditions, Southern Company continues to evaluate and consider a wide array of potential business strategies. These strategies may include business combinations, partnerships, and acquisitions involving other utility or non-utility businesses or properties, disposition of certain assets, internal restructuring, or some combination thereof. Furthermore, Southern Company may engage in new business ventures that arise from competitive and
II-20
MANAGEMENT'S DISCUSSION AND ANALYSIS (continued)
Southern Company and Subsidiary Companies 2013 Annual Report
regulatory changes in the utility industry. Pursuit of any of the above strategies, or any combination thereof, may significantly affect the business operations, risks, and financial condition of Southern Company.
Environmental Matters
Compliance costs related to federal and state environmental statutes and regulations could affect earnings if such costs cannot continue to be fully recovered in rates on a timely basis. Environmental compliance spending over the next several years may differ materially from the amounts estimated. The timing, specific requirements, and estimated costs could change as environmental statutes and regulations are adopted or modified. Further, higher costs that are recovered through regulated rates could contribute to reduced demand for electricity, which could negatively affect results of operations, cash flows, and financial condition. See Note 3 to the financial statements under "Environmental Matters" for additional information.
New Source Review Actions
As part of a nationwide enforcement initiative against the electric utility industry which began in 1999, the U.S. Environmental Protection Agency (EPA) brought civil enforcement actions in federal district court against Alabama Power and Georgia Power alleging violations of the New Source Review (NSR) provisions of the Clean Air Act at certain coal-fired electric generating units, including units co-owned by Gulf Power and Mississippi Power. These civil actions seek penalties and injunctive relief, including orders requiring installation of the best available control technologies at the affected units. The case against Georgia Power (including claims related to a unit co-owned by Gulf Power) has been administratively closed in the U.S. District Court for the Northern District of Georgia since 2001. The case against Alabama Power (including claims involving a unit co-owned by Mississippi Power) has been actively litigated in the U.S. District Court for the Northern District of Alabama, resulting in a settlement in 2006 of the alleged NSR violations at Plant Miller; voluntary dismissal of certain claims by the EPA; and a grant of summary judgment for Alabama Power on all remaining claims and dismissal of the case with prejudice in 2011. On September 19, 2013, the U.S. Court of Appeals for the Eleventh Circuit affirmed in part and reversed in part the 2011 judgment in favor of Alabama Power, and the case has been transferred back to the U.S. District Court for the Northern District of Alabama for further proceedings.
Southern Company believes the traditional operating companies complied with applicable laws and regulations in effect at the time the work in question took place. The Clean Air Act authorizes maximum civil penalties of $25,000 to $37,500 per day, per violation, depending on the date of the alleged violation. An adverse outcome could require substantial capital expenditures that cannot be determined at this time and could possibly require payment of substantial penalties. Such expenditures could affect future results of operations, cash flows, and financial condition if such costs are not recovered through regulated rates. The ultimate outcome of these matters cannot be determined at this time.
Environmental Statutes and Regulations
General
The electric utilities' operations are subject to extensive regulation by state and federal environmental agencies under a variety of statutes and regulations governing environmental media, including air, water, and land resources. Applicable statutes include the Clean Air Act; the Clean Water Act; the Comprehensive Environmental Response, Compensation, and Liability Act; the Resource Conservation and Recovery Act; the Toxic Substances Control Act; the Emergency Planning & Community Right-to-Know Act; the Endangered Species Act; and related federal and state regulations. Compliance with these environmental requirements involves significant capital and operating costs, a major portion of which is expected to be recovered through existing ratemaking provisions. Through
2013
, the traditional operating companies had invested approximately $9.4 billion in environmental capital retrofit projects to comply with these requirements, with annual totals of approximately $712 million, $340 million, and $300 million for
2013
,
2012
, and
2011
, respectively. The Southern Company system expects that capital expenditures to comply with environmental statutes and regulations will total approximately $3.2 billion from
2014
through
2016
, with annual totals of approximately $1.5 billion, $1.1 billion, and $600 million for
2014
,
2015
, and
2016
, respectively.
The Southern Company system continues to monitor the development of the EPA's proposed water and coal combustion residuals rules and to evaluate compliance options. Based on its preliminary analysis and an assumption that coal combustion residuals will continue to be regulated as non-hazardous solid waste under the proposed rule, the Southern Company system does not anticipate that material compliance costs with respect to these proposed rules will be required during the period of
2014
through
2016
. The ultimate capital expenditures and compliance costs with respect to these proposed rules, including additional expenditures required after
2016
, will be dependent on the requirements of the final rules and regulations adopted by the EPA and the outcome of any legal challenges to these rules. See "Water Quality" and "Coal Combustion Residuals" herein for additional information.
II-21
MANAGEMENT'S DISCUSSION AND ANALYSIS (continued)
Southern Company and Subsidiary Companies 2013 Annual Report
The Southern Company system's ultimate environmental compliance strategy, including potential unit retirement and replacement decisions, and future environmental capital expenditures will be affected by the final requirements of new or revised environmental regulations and regulations relating to global climate change that are promulgated, including the proposed environmental regulations described below; the outcome of any legal challenges to the environmental rules; the cost, availability, and existing inventory of emissions allowances; and the fuel mix of the electric utilities. Compliance costs may arise from existing unit retirements, installation of additional environmental controls, upgrades to the transmission system, and adding or changing fuel sources for certain existing units. The ultimate outcome of these matters cannot be determined at this time. See "PSC Matters – Georgia Power – Integrated Resource Plans" herein for additional information on planned unit retirements and fuel conversions at Georgia Power.
Southern Electric Generating Company (SEGCO) is jointly owned by Alabama Power and Georgia Power. As part of its environmental compliance strategy, SEGCO plans to add natural gas as the primary fuel source for its generating units in 2015. The capacity of SEGCO's units is sold equally to Alabama Power and Georgia Power through a PPA. If such compliance costs cannot continue to be recovered through retail rates, they could have a material financial impact on Southern Company's financial statements. See Note 4 to the financial statements for additional information.
Compliance with any new federal or state legislation or regulations relating to air quality, water, coal combustion residuals, global climate change, or other environmental and health concerns could significantly affect the Company. Although new or revised environmental legislation or regulations could affect many areas of the electric utilities' operations, the full impact of any such changes cannot be determined at this time. Additionally, many of the electric utilities' commercial and industrial customers may also be affected by existing and future environmental requirements, which for some may have the potential to ultimately affect their demand for electricity.
Air Quality
Compliance with the Clean Air Act and resulting regulations has been and will continue to be a significant focus for the Southern Company system. Since 1990, the electric utilities have spent approximately $8.0 billion in reducing and monitoring emissions pursuant to the Clean Air Act. Additional controls are currently planned or under consideration to further reduce air emissions, maintain compliance with existing regulations, and meet new requirements.
The EPA regulates ground level ozone concentrations through implementation of an eight-hour ozone National Ambient Air Quality Standard (NAAQS). In 2008, the EPA adopted a more stringent eight-hour ozone NAAQS, which it began to implement in 2011. In May 2012, the EPA published its final determination of nonattainment areas based on the 2008 eight-hour ozone NAAQS. The only area within the traditional operating companies' service territory designated as a nonattainment area is a 15-county area within metropolitan Atlanta.
The EPA regulates fine particulate matter concentrations on an annual and 24-hour average basis. All areas within the traditional operating companies' service territory have achieved attainment with the 1997 and 2006 particulate matter NAAQS, and the EPA has officially redesignated some former nonattainment areas within the service territory as attainment for these standards. Redesignation requests for certain areas designated as nonattainment in Georgia are still pending with the EPA. On January 15, 2013, the EPA published a final rule that increases the stringency of the annual fine particulate matter standard. The new standard could result in the designation of new nonattainment areas within the traditional operating companies' service territories.
Final revisions to the NAAQS for sulfur dioxide (SO
2
), which established a new one-hour standard, became effective in 2010. No areas within the Southern Company system's service territory have been designated as nonattainment under this rule. However, the EPA may designate additional areas as nonattainment in the future, which could include areas within the Southern Company system's service territory. Implementation of the revised SO
2
standard could require additional reductions in SO
2
emissions and increased compliance and operational costs.
On February 13, 2014, the EPA proposed to delete from the Alabama State Implementation Plan (SIP) the Alabama opacity rule that the EPA approved in 2008, which provides operational flexibility to affected units. On March 6, 2013, the U.S. Court of Appeals for the Eleventh Circuit ruled in favor of Alabama Power and vacated an earlier attempt by the EPA to rescind its 2008 approval. The EPA’s latest proposal characterizes the proposed deletion as an error correction within the meaning of the Clean Air Act. Alabama Power believes this interpretation of the Clean Air Act to be incorrect. If finalized, this proposed action could affect unit availability and result in increased operations and maintenance costs for affected units, including units owned by Alabama Power, units co-owned by Mississippi Power, and units owned by SEGCO.
Each of the states in which the Southern Company system has fossil generation is subject to the requirements of the Clean Air Interstate Rule (CAIR), which calls for phased reductions in SO
2
and nitrogen oxide (NO
x
) emissions from power plants in 28 eastern states. In 2008, the U.S. Court of Appeals for the District of Columbia Circuit issued decisions invalidating CAIR, but left CAIR compliance requirements in place while the EPA developed a new rule. In 2011, the EPA promulgated the Cross State Air
II-22
MANAGEMENT'S DISCUSSION AND ANALYSIS (continued)
Southern Company and Subsidiary Companies 2013 Annual Report
Pollution Rule (CSAPR) to replace CAIR. However, in August 2012, the U.S. Court of Appeals for the District of Columbia Circuit vacated CSAPR in its entirety and directed the EPA to continue to administer CAIR pending the EPA's development of a valid replacement. Review of the U.S. Court of Appeals for the District of Columbia Circuit's decision regarding CSAPR is currently pending before the U.S. Supreme Court.
The EPA finalized the Clean Air Visibility Rule (CAVR) in 2005, with a goal of restoring natural visibility conditions in certain areas (primarily national parks and wilderness areas) by 2064. The rule involves the application of best available retrofit technology to certain sources built between 1962 and 1977 and any additional emissions reductions necessary for each designated area to achieve reasonable progress toward the natural visibility conditions goal by 2018 and for each 10-year period thereafter.
In February 2012, the EPA finalized the Mercury and Air Toxics Standards (MATS) rule, which imposes stringent emissions limits for acid gases, mercury, and particulate matter on coal- and oil-fired electric utility steam generating units. Compliance for existing sources is required by April 16, 2015; however, states may authorize a compliance extension of up to one year to April 16, 2016. Compliance extensions have been granted for some of the affected units owned or operated by the traditional operating companies.
In August 2012, the EPA published proposed revisions to the New Source Performance Standard (NSPS) for Stationary Combustion Turbines (CTs). If finalized as proposed, the revisions would apply the NSPS to all new, reconstructed, and modified CTs (including CTs at combined cycle units), during all periods of operation, including startup and shutdown, and alter the criteria for determining when an existing CT has been reconstructed.
On February 12, 2013, the EPA proposed a rule that would require certain states to revise the provisions of their SIPs relating to the regulation of excess emissions at industrial facilities, including fossil fuel-fired generating facilities, during periods of startup, shut-down, or malfunction (SSM). The EPA proposes a determination that the SSM provisions in the SIPs for 36 states (including Alabama, Florida, Georgia, Mississippi, and North Carolina) do not meet the requirements of the Clean Air Act and must be revised within 18 months of the date on which the EPA publishes the final rule. The EPA has entered into a settlement agreement requiring it to finalize the rule by June 12, 2014.
The Southern Company system has developed and continually updates a comprehensive environmental compliance strategy to assess compliance obligations associated with the current and proposed environmental requirements discussed above. The impacts of the eight-hour ozone, fine particulate matter and SO
2
NAAQS, the Alabama opacity rule, CAIR and any future replacement rule, CAVR, the MATS rule, the NSPS for CTs, and the SSM rule on the Southern Company system cannot be determined at this time and will depend on the specific provisions of recently finalized and future rules, the resolution of pending and future legal challenges, and the development and implementation of rules at the state level. These regulations could result in significant additional compliance costs that could affect future unit retirement and replacement decisions and results of operations, cash flows, and financial condition if such costs are not recovered through regulated rates. Further, higher costs that are recovered through regulated rates could contribute to reduced demand for electricity, which could negatively impact results of operations, cash flows, and financial condition.
In addition to the federal air quality laws described above, Georgia Power is also subject to the requirements of the 2007 State of Georgia Multi-Pollutant Rule. The Multi-Pollutant Rule, as amended, is designed to reduce emissions of mercury, SO
2
, and NO
x
state-wide by requiring the installation of specified control technologies at certain coal-fired generating units by specific dates between December 31, 2008 and April 16, 2015. A companion rule requires a 95% reduction in SO
2
emissions from the controlled units on the same or similar timetable. Through December 31, 2013, Georgia Power had installed the required controls on 13 of its largest coal-fired generating units with projects on three additional units to be completed before the unit-specific installation deadlines.
Water Quality
In 2011, the EPA published a proposed rule that establishes standards for reducing effects on fish and other aquatic life caused by cooling water intake structures at existing power plants and manufacturing facilities. The rule also addresses cooling water intake structures for new units at existing facilities. Compliance with the proposed rule could require changes to existing cooling water intake structures at certain of the traditional operating companies' and Southern Power's generating facilities, and new generating units constructed at existing plants would be required to install closed cycle cooling towers. The EPA is required to issue a final rule by April 17, 2014.
On June 7, 2013, the EPA published a proposed rule which requested comments on a range of potential regulatory options for addressing certain wastestreams from steam electric power plants. These regulations could result in the installation of additional controls at certain of the facilities of the traditional operating companies and Southern Power, which could result in significant capital expenditures and compliance costs that could affect future unit retirement and replacement decisions, depending on the specific technology requirements of the final rule.
II-23
MANAGEMENT'S DISCUSSION AND ANALYSIS (continued)
Southern Company and Subsidiary Companies 2013 Annual Report
The impact of these proposed rules cannot be determined at this time and will depend on the specific provisions of the final rules and the outcome of any legal challenges. These regulations could result in significant additional capital expenditures and compliance costs that could affect future unit retirement and replacement decisions. Also, results of operations, cash flows, and financial condition could be significantly impacted if such costs are not recovered through regulated rates or through PPAs. Further, higher costs that are recovered through regulated rates could contribute to reduced demand for electricity, which could negatively impact results of operations, cash flows, and financial condition.
Coal Combustion Residuals
The traditional operating companies currently operate 22 electric generating plants with on-site coal combustion residuals storage facilities. In addition to on-site storage, the traditional operating companies also sell a portion of their coal combustion residuals to third parties for beneficial reuse. Historically, individual states have regulated coal combustion residuals and the states in the Southern Company system's service territory each have their own regulatory requirements. Each traditional operating company has a routine and robust inspection program in place to ensure the integrity of its coal ash surface impoundments and compliance with applicable regulations.
The EPA continues to evaluate the regulatory program for coal combustion residuals, including coal ash and gypsum, under federal solid and hazardous waste laws. In 2010, the EPA published a proposed rule
that requested comments on two potential regulatory options for the management and disposal of coal combustion residuals: regulation as a solid waste or regulation as if the materials technically constituted a hazardous waste. Adoption of either option could require closure of, or significant change to, existing storage facilities and construction of lined landfills, as well as additional waste management and groundwater monitoring requirements. Under both options, the EPA proposes to exempt the beneficial reuse of coal combustion residuals from regulation; however, a hazardous or other designation indicative of heightened risk could limit or eliminate beneficial reuse options. Environmental groups and other parties have filed lawsuits in the U.S. District Court for the District of Columbia seeking to require the EPA to complete its rulemaking process and issue final regulations pertaining to the regulation of coal combustion residuals. On September 30, 2013, the U.S. District Court for the District of Columbia issued an order granting partial summary judgment to the environmental groups and other parties, ruling that the EPA has a statutory obligation to review and revise, as necessary, the federal solid waste regulations applicable to coal combustion residuals. On January 29, 2014, the EPA filed a consent decree requiring the EPA to take final action regarding the proposed regulation of coal combustion residuals as solid waste by December 19, 2014
.
While the ultimate outcome of this matter cannot be determined at this time and will depend on the final form of any rules adopted and the outcome of any legal challenges, additional regulation of coal combustion residuals could have a material impact on the generation, management, beneficial use, and disposal of such residuals. Any material changes are likely to result in substantial additional compliance, operational, and capital costs that could affect future unit retirement and replacement decisions. Moreover, the traditional operating companies could incur additional material asset retirement obligations with respect to closing existing storage facilities. Southern Company's results of operations, cash flows, and financial condition could be significantly impacted if such costs are not recovered through regulated rates. Further, higher costs that are recovered through regulated rates could contribute to reduced demand for electricity, which could negatively impact results of operations, cash flows, and financial condition.
Environmental Remediation
The Southern Company system must comply with other environmental laws and regulations that cover the handling and disposal of waste and releases of hazardous substances. Under these various laws and regulations, the Southern Company system could incur substantial costs to clean up properties. The traditional operating companies conduct studies to determine the extent of any required cleanup and have recognized in their respective financial statements the costs to clean up known impacted sites. Amounts for cleanup and ongoing monitoring costs were not material for any year presented. The traditional operating companies have each received authority from their respective state PSCs to recover approved environmental compliance costs through regulatory mechanisms. These rates are adjusted annually or as necessary within limits approved by the state PSCs. The traditional operating companies may be liable for some or all required cleanup costs for additional sites that may require environmental remediation. See Note 3 to the financial statements under "Environmental Matters – Environmental Remediation" for additional information.
Global Climate Issues
The EPA currently regulates greenhouse gases under the Prevention of Significant Deterioration and Title V operating permit programs of the Clean Air Act. The legal basis for these regulations is currently being challenged in the U.S. Supreme Court. In addition, over the past several years, the U.S. Congress has considered many proposals to reduce greenhouse gas emissions,
II-24
MANAGEMENT'S DISCUSSION AND ANALYSIS (continued)
Southern Company and Subsidiary Companies 2013 Annual Report
mandate renewable or clean energy, and impose energy efficiency standards. Such proposals are expected to continue to be considered by the U.S. Congress. International climate change negotiations under the United Nations Framework Convention on Climate Change are also continuing.
On January 8, 2014, the EPA published re-proposed regulations to establish standards of performance for greenhouse gas emissions from new fossil fuel steam electric generating units. A Presidential memorandum issued on June 25, 2013 also directs the EPA to propose standards, regulations, or guidelines for addressing modified, reconstructed, and existing steam electric generating units by June 1, 2014.
Although the outcome of any federal, state, and international initiatives, including the EPA's proposed regulations and guidelines discussed above, will depend on the scope and specific requirements of the proposed and final rules and the outcome of any legal challenges and, therefore, cannot be determined at this time, additional restrictions on the Southern Company system's greenhouse gas emissions or requirements relating to renewable energy or energy efficiency at the federal or state level could result in significant additional compliance costs, including capital expenditures. These costs could affect future unit retirement and replacement decisions and could result in the retirement of additional coal-fired generating units. Also, additional compliance costs and costs related to unit retirements could affect results of operations, cash flows, and financial condition if such costs are not recovered through regulated rates or through market-based contracts. Further, higher costs that are recovered through regulated rates could contribute to reduced demand for electricity, which could negatively impact results of operations, cash flows, and financial condition.
The EPA's greenhouse gas reporting rule requires annual reporting of CO
2
equivalent emissions in metric tons for a company's operational control of facilities. Based on ownership or financial control of facilities, the Southern Company system's 2012 greenhouse gas emissions were approximately 99 million metric tons of CO
2
equivalent. The preliminary estimate of the Southern Company system's 2013 greenhouse gas emissions on the same basis is approximately 103 million metric tons of CO
2
equivalent. The level of greenhouse gas emissions from year to year will depend on the level of generation and mix of fuel sources and other factors.
PSC Matters
Alabama Power
Retail Rate Adjustments
In 2011, the Alabama PSC issued an order to eliminate a tax-related adjustment under Alabama Power's rate structure effective with October 2011 billings. The elimination of this adjustment resulted in additional revenues of approximately $31 million for 2011. In accordance with the order, Alabama Power made additional accruals to the NDR in the fourth quarter 2011 of an amount equal to such additional 2011 revenues. The NDR was impacted as a result of operations and maintenance expenses incurred in connection with the 2011 storms in Alabama. See "Natural Disaster Reserve" below for additional information. The elimination of this adjustment resulted in additional revenues of approximately $106 million for 2012.
Rate RSE
Alabama Power operates under a rate stabilization and equalization plan (Rate RSE) approved by the Alabama PSC. Alabama Power's Rate RSE adjustments are based on forward-looking information for the applicable upcoming calendar year. Rate adjustments for any two-year period, when averaged together, cannot exceed 4.0% and any annual adjustment is limited to 5.0%. If Alabama Power's actual retail return is above the allowed equity return range, customer refunds will be required; however, there is no provision for additional customer billings should the actual retail return fall below the allowed equity return range. Prior to 2014, retail rates remained unchanged when the retail return on common equity (ROE) was projected to be between 13.0% and 14.5%.
During 2013, the Alabama PSC held public proceedings regarding the operation and utilization of Rate RSE. On August 13, 2013, the Alabama PSC voted to issue a report on Rate RSE that found that Alabama Power's Rate RSE mechanism continues to be just and reasonable to customers and Alabama Power, but recommended Alabama Power modify Rate RSE as follows:
|
•
|
Eliminate the provision of Rate RSE establishing an allowed range of ROE.
|
|
•
|
Eliminate the provision of Rate RSE limiting Alabama Power's capital structure to an allowed equity ratio of 45%.
|
|
•
|
Replace these two provisions with a provision that establishes rates based upon an allowed weighted cost of equity (WCE) range of 5.75% to 6.21%, with an adjusting point of 5.98%. If calculated under the previous Rate RSE provisions, the resulting WCE would range from 5.85% to 6.53%, with an adjusting point of 6.19%.
|
II-25
MANAGEMENT'S DISCUSSION AND ANALYSIS (continued)
Southern Company and Subsidiary Companies 2013 Annual Report
|
•
|
Provide eligibility for a performance-based adder of seven basis points, or 0.07%, to the WCE adjusting point if Alabama Power (i) has an "A" credit rating equivalent with at least one of the recognized rating agencies or (ii) is in the top one-third of a designated customer value benchmark survey.
|
Substantially all other provisions of Rate RSE were unchanged.
On August 21, 2013, Alabama Power filed its consent to these recommendations with the Alabama PSC. The changes became effective for calendar year 2014. On November 27, 2013, Alabama Power made its Rate RSE submission to the Alabama PSC of projected data for calendar year 2014; projected earnings were within the specified WCE range and, therefore, retail rates under Rate RSE remained unchanged for 2014. In 2012 and 2013, retail rates under Rate RSE remained unchanged from 2011. Under the terms of Rate RSE, the maximum possible increase for 2015 is 5.00%.
Rate CNP
Alabama Power's retail rates, approved by the Alabama PSC, provide for adjustments to recognize the placing of new generating facilities into retail service under rate certificated new plant (Rate CNP). Alabama Power may also recover retail costs associated with certificated PPAs under rate certificated new plant (Rate CNP PPA). There was no adjustment to Rate CNP PPA in 2012. On March 5, 2013, the Alabama PSC issued a consent order that Alabama Power leave in effect the current Rate CNP PPA factor for billings for the period April 1, 2013 through March 31, 2014. It is anticipated that no adjustment will be made to Rate CNP PPA in 2014. As of December 31, 2013, Alabama Power had an under recovered certificated PPA balance of $18 million, all of which is included in deferred under recovered regulatory clause revenues in the balance sheet.
In 2011, the Alabama PSC approved and certificated a PPA of approximately 200 MWs of energy from wind-powered generating facilities which became operational in December 2012. In September 2012, the Alabama PSC approved and certificated a second wind PPA of approximately 200 MWs which became operational in January 2014. The terms of the wind PPAs permit Alabama Power to use the energy and retire the associated environmental attributes in service of its customers or to sell environmental attributes, separately or bundled with energy.
Alabama Power has elected the normal purchase normal sale (NPNS) scope exception under the derivative accounting rules for its two wind PPAs, which total approximately 400 MWs. The NPNS exception allows the PPAs to be recorded at a cost, rather than fair value, basis. The industry’s application of the NPNS exception to certain physical forward transactions in nodal markets is currently under review by the U.S. Securities and Exchange Commission (SEC) at the request of the electric utility industry. The outcome of the SEC’s review cannot now be determined. If Alabama Power is ultimately required to record these PPAs at fair value, an offsetting regulatory asset or regulatory liability will be recorded.
Rate CNP Environmental also allows for the recovery of Alabama Power's retail costs associated with environmental laws, regulations, or other such mandates. Rate CNP Environmental is based on forward-looking information and provides for the recovery of these costs pursuant to a factor that is calculated annually. Environmental costs to be recovered include operations and maintenance expenses, depreciation, and a return on certain invested capital. There was no adjustment to Rate CNP Environmental in 2012 or 2013. On August 13, 2013, the Alabama PSC approved Alabama Power's petition requesting a revision to Rate CNP Environmental that allows recovery of costs related to pre-2005 environmental assets previously being recovered through Rate RSE. The revenue impact as a result of this revision is estimated to be $58 million in 2014. On November 21, 2013, Alabama Power submitted calculations associated with its cost of complying with environmental mandates, as provided under Rate CNP Environmental. The filing reflected a projected unrecovered retail revenue requirement for environmental compliance of approximately $72 million, which is to be recovered in the billing months of January 2014 through December 2014. On December 3, 2013, the Alabama PSC issued a consent order that Alabama Power leave in effect for 2014 the factors associated with Alabama Power's environmental compliance costs for the year 2013. Any unrecovered amounts associated with 2014 will be reflected in the 2015 filing. As of December 31, 2013, Alabama Power had an under recovered environmental clause balance of $7 million which is included in deferred under recovered regulatory clause revenues in the balance sheet.
Environmental Accounting Order
Based on an order from the Alabama PSC, Alabama Power is allowed to establish a regulatory asset to record the unrecovered investment costs, including the unrecovered plant asset balance and the unrecovered costs associated with site removal and closure associated with future unit retirements caused by environmental regulations. These costs would be amortized over the affected unit's remaining useful life, as established prior to the decision regarding early retirement. See "Environmental Matters – Environmental Statutes and Regulations" herein for additional information regarding environmental regulations.
II-26
MANAGEMENT'S DISCUSSION AND ANALYSIS (continued)
Southern Company and Subsidiary Companies 2013 Annual Report
Compliance and Pension Cost Accounting Order
In November 2012, the Alabama PSC approved an accounting order to defer to a regulatory asset account certain compliance-related operations and maintenance expenditures for the years 2013 through 2017, as well as the incremental increase in operations expense related to pension cost for 2013. These deferred costs are to be amortized over a three-year period beginning in January 2015. The compliance related expenditures were related to (i) standards addressing Critical Infrastructure Protection issued by the North American Electric Reliability Corporation, (ii) cyber security requirements issued by the U.S. Nuclear Regulatory Commission (NRC), and (iii) NRC guidance addressing the readiness at nuclear facilities within the U.S. for severe events. The compliance-related expenses to be afforded regulatory asset treatment over the five-year period are currently estimated to be approximately $37 million. The amount of operations and maintenance expenses deferred to a regulatory asset in 2013 associated with compliance-related expenditures and pension cost was approximately $8 million and $12 million, respectively. Pursuant to the accounting order, Alabama Power has the ability to accelerate the amortization of the regulatory assets with notification to the Alabama PSC. See "Other Matters" herein for information regarding NRC actions as a result of the earthquake and tsunami that struck Japan in 2011.
Natural Disaster Reserve
Based on an order from the Alabama PSC, Alabama Power maintains a reserve for operations and maintenance expenses to cover the cost of damages from major storms to its transmission and distribution facilities. The order approves a separate monthly Rate Natural Disaster Reserve (Rate NDR) charge to customers consisting of two components. The first component is intended to establish and maintain a reserve balance for future storms and is an on-going part of customer billing. The second component of the Rate NDR charge is intended to allow recovery of any existing deferred storm-related operations and maintenance costs and any future reserve deficits over a 24-month period. The Alabama PSC order gives Alabama Power authority to record a deficit balance in the NDR when costs of storm damage exceed any established reserve balance. Absent further Alabama PSC approval, the maximum total Rate NDR charge consisting of both components is $10 per month per non-residential customer account and $5 per month per residential customer account. Alabama Power has the authority, based on an order from the Alabama PSC, to accrue certain additional amounts as circumstances warrant. The order allows for reliability-related expenditures to be charged against the additional accruals when the NDR balance exceeds $75 million. Alabama Power may designate a portion of the NDR to reliability-related expenditures as a part of an annual budget process for the following year or during the current year for identified unbudgeted reliability-related expenditures that are incurred. Accruals that have not been designated can be used to offset storm charges. Additional accruals to the NDR will enhance Alabama Power's ability to deal with the financial effects of future natural disasters, promote system reliability, and offset costs retail customers would otherwise bear.
As revenue from the Rate NDR charge is recognized, an equal amount of operations and maintenance expenses related to the NDR will also be recognized. As a result, the Rate NDR charge will not have an effect on net income but will impact operating cash flows.
In accordance with the order that was issued by the Alabama PSC in 2011 to eliminate a tax-related adjustment under Alabama Power's rate structure that resulted in additional revenues, Alabama Power made additional accruals to the NDR in the fourth quarter 2011 of an amount equal to the additional 2011 revenues, which were approximately $31 million.
The accumulated balances in the NDR for the years ended December 31, 2013 and December 31, 2012 were approximately $96 million and $103 million, respectively. Any accruals to the NDR are included in the balance sheets under other regulatory liabilities, deferred and are reflected as other operations and maintenance expenses in the statements of income.
Nuclear Outage Accounting Order
In accordance with a 2010 Alabama PSC order, nuclear outage operations and maintenance expenses for the two units at Plant Farley are deferred to a regulatory asset when the charges actually occur and are then amortized over the subsequent 18-month operational cycle.
Approximately $31 million of nuclear outage costs from the spring of 2012 was amortized to nuclear operations and maintenance expenses over the 18-month period ended in December 2013. During the spring of 2013, approximately $28 million of nuclear outage costs was deferred to a regulatory asset, and beginning in July 2013, these deferred costs are being amortized over an 18-month period. During the fall of 2013, approximately $32 million of nuclear outage costs associated with the second unit was deferred to a regulatory asset, and beginning in January 2014, these deferred costs are being amortized over an 18-month period. Alabama Power will continue the pattern of deferral of nuclear outage expenses as incurred and the recognition of expenses over a subsequent 18-month period pursuant to the Alabama PSC order.
II-27
MANAGEMENT'S DISCUSSION AND ANALYSIS (continued)
Southern Company and Subsidiary Companies 2013 Annual Report
Non-Nuclear Outage Accounting Order
On August 13, 2013, the Alabama PSC approved Alabama Power's petition requesting authorization to defer to a regulatory asset account certain operations and maintenance expenses associated with planned outages at non-nuclear generation facilities in 2014 and to amortize those expenses over a three-year period beginning in 2015. The 2014 outage expenditures to be deferred and amortized are estimated to total approximately $78 million.
Georgia Power
Rate Plans
In 2010, the Georgia PSC approved an Alternate Rate Plan for the years 2011 through 2013 (2010 ARP), which resulted in base rate increases of approximately $562 million, $17 million, $125 million, and $74 million effective January 1, 2011, January 1, 2012, April 1, 2012, and January 1, 2013, respectively.
On December 17, 2013, the Georgia PSC voted to approve the Alternate Rate Plan for Georgia Power which became effective January 1, 2014 and continues through December 31, 2016 (2013 ARP). The 2013 ARP reflects the settlement agreement among Georgia Power, the Georgia PSC’s Public Interest Advocacy Staff, and 11 of the 13 intervenors, which was filed with the Georgia PSC on November 18, 2013.
On January 1, 2014, in accordance with the 2013 ARP, Georgia Power increased its tariffs as follows: (1) traditional base tariff rates by approximately $80 million; (2) Environmental Compliance Cost Recovery (ECCR) tariff by an additional $25 million; (3) Demand-Side Management (DSM) tariffs by an additional $1 million; and (4) Municipal Franchise Fee (MFF) tariff by an additional $4 million, for a total increase in base revenues of approximately $110 million.
Under the 2013 ARP, the following additional rate adjustments will be made to Georgia Power’s tariffs in 2015 and 2016 based on annual compliance filings to be made at least 90 days prior to the effective date of the tariffs:
|
•
|
Effective January 1, 2015 and 2016, the traditional base tariff rates will increase by an estimated $101 million and $36 million, respectively, to recover additional generation capacity-related costs;
|
|
•
|
Effective January 1, 2015 and 2016, the ECCR tariff will increase by an estimated $76 million and $131 million, respectively, to recover additional environmental compliance costs;
|
|
•
|
Effective January 1, 2015, the DSM tariffs will increase by an estimated $6 million and decrease by an estimated $1 million effective January 1, 2016; and
|
|
•
|
The MFF tariff will increase consistent with these adjustments.
|
Georgia Power currently estimates these adjustments will result in base revenue increases of approximately $187 million in 2015 and $170 million in 2016. The estimated traditional base tariff rate increases for 2015 and 2016 do not include additional Qualifying Facility (QF) PPA expenses; however, compliance filings will include QF PPA expenses for those facilities that are projected to provide capacity to Georgia Power during the following year.
Under the 2013 ARP, Georgia Power’s retail ROE is set at 10.95%, and earnings are evaluated against a retail ROE range of 10.00% to 12.00%. Two-thirds of any earnings above 12.00% will be directly refunded to customers, with the remaining one-third retained by Georgia Power. There will be no recovery of any earnings shortfall below 10.00% on an actual basis. However, if at any time during the term of the 2013 ARP, Georgia Power projects that its retail earnings will be below 10.00% for any calendar year, it may petition the Georgia PSC for implementation of the Interim Cost Recovery (ICR) tariff that would be used to adjust Georgia Power’s earnings back to a 10.00% retail ROE. The Georgia PSC would have 90 days to rule on Georgia Power’s request. The ICR tariff will expire at the earlier of January 1, 2017 or the end of the calendar year in which the ICR tariff becomes effective. In lieu of requesting implementation of an ICR tariff, or if the Georgia PSC chooses not to implement the ICR tariff, Georgia Power may file a full rate case.
Except as provided above, Georgia Power will not file for a general base rate increase while the 2013 ARP is in effect. Georgia Power is required to file a general rate case by July 1, 2016, in response to which the Georgia PSC would be expected to determine whether the 2013 ARP should be continued, modified, or discontinued.
Integrated Resource Plans
See "Environmental Matters – Environmental Statutes and Regulations – Air Quality," "– Water Quality," and "– Coal Combustion Residuals" and "Rate Plans" herein for additional information regarding proposed and final EPA rules and regulations, including the MATS rule for coal- and oil-fired electric utility steam generating units, revisions to effluent limitations guidelines for steam electric power plants, and additional regulation of coal combustion residuals; the State of Georgia's Multi-Pollutant Rule; Georgia Power's analysis of the potential costs and benefits of installing the required controls on its fossil
II-28
MANAGEMENT'S DISCUSSION AND ANALYSIS (continued)
Southern Company and Subsidiary Companies 2013 Annual Report
generating units in light of these regulations; and Georgia Power's latest triennial Integrated Resource Plan as approved by the Georgia PSC (2013 IRP).
On January 31, 2013, Georgia Power filed its 2013 IRP. The filing included Georgia Power's request to decertify 16 coal- and oil-fired units totaling 2,093 MWs. Several factors, including the cost to comply with existing and future environmental regulations, recent and forecasted economic conditions, and lower natural gas prices, contributed to the decision to close these units.
On April 17, 2013, the Georgia PSC approved the decertification of Plant Bowen Unit 6 (32 MWs), which was retired on April 25, 2013. On September 30, 2013, Plant Branch Unit 2 (319 MWs) was retired as approved by the Georgia PSC in the 2011 Integrated Resource Plan Update (2011 IRP Update) in order to comply with the State of Georgia's Multi-Pollutant Rule.
On July 11, 2013, the Georgia PSC approved Georgia Power's request to decertify and retire Plant Boulevard Units 2 and 3 (28 MWs) effective July 17, 2013. Plant Branch Units 3 and 4 (1,016 MWs), Plant Yates Units 1 through 5 (579 MWs), and Plant McManus Units 1 and 2 (122 MWs) will be decertified and retired by April 16, 2015, the compliance date of the MATS rule. The decertification date of Plant Branch Unit 1 was extended from December 31, 2013 as specified in the final order in the 2011 IRP Update to coincide with the decertification date of Plant Branch Units 3 and 4. The decertification and retirement of Plant Kraft Units 1 through 4 (316 MWs) was also approved and will be effective by April 16, 2016, based on a one-year extension of the MATS rule compliance date that was approved by the State of Georgia Environmental Protection Division on September 10, 2013 to allow for necessary transmission system reliability improvements.
Additionally, the Georgia PSC approved Georgia Power's proposed MATS rule compliance plan for emissions controls necessary for the continued operation of Plants Bowen Units 1 through 4, Wansley Units 1 and 2, Scherer Units 1 through 3, and Hammond Units 1 through 4, the switch to natural gas as the primary fuel at Plant Yates Units 6 and 7 and SEGCO's Plant Gaston Units 1 through 4, as well as the fuel switch at Plant McIntosh Unit 1 to operate on Powder River Basin coal.
In the 2013 ARP, the Georgia PSC approved the amortization of the CWIP balances related to environmental projects that will not be completed at Plant Branch Units 1 through 4 and Plant Yates Units 6 and 7 over nine years beginning in January 2014 and the amortization of any remaining net book values of Plant Branch Unit 2 from October 2013 to December 2022, Plant Branch Unit 1 from May 2015 to December 2020, Plant Branch Unit 3 from May 2015 to December 2023, and Plant Branch Unit 4 from May 2015 to December 2024. The Georgia PSC deferred a decision regarding the appropriate recovery period for the costs associated with unusable materials and supplies remaining at the retiring plants to Georgia Power's next base rate case, which Georgia Power expects to file in 2016 (2016 Rate Case). In the 2013 IRP, the Georgia PSC also deferred decisions regarding the recovery of any fuel related costs that could be incurred in connection with the retirement units to be addressed in future fuel cases.
A request was filed with the Georgia PSC on January 10, 2014 to cancel the proposed biomass fuel conversion of Plant Mitchell Unit 3 (155 MWs) because it would not be cost effective for customers. The filing also notified the Georgia PSC of Georgia Power’s plans to seek decertification later this year. Plant Mitchell Unit 3 will continue to operate as a coal unit until April 2015 when it will be required to cease operation or install additional environmental controls to comply with the MATS rule. In connection with the retirement decision, Georgia Power reclassified the retail portion of the net carrying value of Plant Mitchell Unit 3 from plant in service, net of depreciation, to other utility plant, net.
The decertification of these units and fuel conversions are not expected to have a material impact on Southern Company's financial statements; however, the ultimate outcome depends on the Georgia PSC's order in the 2016 Rate Case and future fuel cases and cannot be determined at this time.
Renewables Development
On December 17, 2013, four PPAs totaling 50 MWs of utility scale solar generation under the Georgia Power Advanced Solar Initiative (GPASI) were approved by the Georgia PSC, with Georgia Power as the purchaser. These contracts will begin in 2015 and end in 2034. The resulting purchases will be for energy only and recovered through Georgia Power’s fuel cost recovery mechanism. Under the 2013 IRP, the Georgia PSC approved an additional 525 MWs of solar generation to be purchased by Georgia Power. The 525 MWs will be divided into 425 MWs of utility scale projects and 100 MWs of distributed generation.
On November 4, 2013, Georgia Power filed an application for the certification of two PPAs which were executed on April 22, 2013 for the purchase of energy from two wind farms in Oklahoma with capacity totaling 250 MWs that will begin in 2016 and end in 2035.
During 2013, Georgia Power executed four PPAs to purchase a total of 169 MWs of biomass capacity and energy from four facilities in Georgia that will begin in 2015 and end in 2035. On May 21, 2013, the Georgia PSC approved two of the biomass PPAs and the remaining two were approved on December 17, 2013. The four biomass PPAs are contingent upon the counterparty meeting specified contract dates for posting collateral and commercial operation. The ultimate outcome of this matter cannot be determined at this time.
II-29
MANAGEMENT'S DISCUSSION AND ANALYSIS (continued)
Southern Company and Subsidiary Companies 2013 Annual Report
Storm Damage Recovery
Georgia Power defers and recovers certain costs related to damages from major storms as mandated by the Georgia PSC. As of December 31, 2013, the balance in the regulatory asset related to storm damage was $37 million. As a result of this regulatory treatment, the costs related to storms are generally not expected to have a material impact on Southern Company's financial statements.
Retail Fuel Cost Recovery
The traditional operating companies each have established fuel cost recovery rates approved by their respective state PSCs. Fuel cost recovery revenues are adjusted for differences in actual recoverable fuel costs and amounts billed in current regulated rates. Accordingly, changes in the billing factor will not have a significant effect on Southern Company's revenues or net income, but will affect any cash flow. The traditional operating companies continuously monitor their under or over recovered fuel cost balances. At December 31, 2013, total over recovered fuel costs in the balance sheets of Alabama Power, Georgia Power, and Mississippi Power were approximately $115 million, and total under recovered fuel costs in the balance sheet of Gulf Power were approximately $21 million. The lower cost of natural gas resulted in total over recovered fuel costs in the balance sheets of Georgia Power, Gulf Power, and Mississippi Power of approximately $303 million at December 31, 2012. Total under recovered fuel costs were approximately $4 million in the balance sheet of Alabama Power at December 31, 2012.
See Note 1 to the financial statements under "Revenues" and Note 3 to the financial statements under "Retail Regulatory Matters – Alabama Power – Energy Cost Recovery" and "Retail Regulatory Matters – Georgia Power – Fuel Cost Recovery" for additional information.
Income Tax Matters
Bonus Depreciation
On January 2, 2013, the American Taxpayer Relief Act of 2012 (ATRA) was signed into law. The ATRA retroactively extended several tax credits through 2013 and extended 50% bonus depreciation for property placed in service in 2013 (and for certain long-term production-period projects to be placed in service in 2014, including the Kemper IGCC). The extension of 50% bonus depreciation had a positive impact on Southern Company's cash flows of approximately $440 million in 2013 and is expected to have a positive impact between $650 million and $720 million on the cash flows of Southern Company in 2014. See Note 3 under "Integrated Coal Gasification Combined Cycle" for additional information on factors which could result in changes to the scheduled in-service date of the Kemper IGCC and result in the loss of the tax benefits related to bonus depreciation.
Construction Program
The subsidiary companies of Southern Company are engaged in continuous construction programs to accommodate existing and estimated future loads on their respective systems. The Southern Company system intends to continue its strategy of developing and constructing new generating facilities, as well as adding or changing fuel sources for certain existing units, adding environmental control equipment, and expanding the transmission and distribution systems. For the traditional operating companies, major generation construction projects are subject to state PSC approvals in order to be included in retail rates. While Southern Power generally constructs and acquires generation assets covered by long-term PPAs, any uncontracted capacity could negatively affect future earnings. The construction programs of the traditional operating companies and Southern Power are currently estimated to include an investment of approximately $6.1 billion, $5.4 billion, and $4.5 billion for 2014, 2015, and 2016, respectively.
The two largest construction projects currently underway in the Southern Company system are Plant Vogtle Units 3 and 4 (45.7% ownership interest by Georgia Power in two units, each with approximately 1,100 MWs) and the 582-MW Kemper IGCC (in which Mississippi Power is ultimately expected to hold an 85% ownership interest). See Note 3 to the financial statements under "Retail Regulatory Matters – Georgia Power – Nuclear Construction" and "Integrated Coal Gasification Combined Cycle" for additional information.
In 2013, the Company incurred pre-tax charges of $1.2 billion ($729 million after-tax) for revisions of estimated costs expected to be incurred on Mississippi Power’s construction of the Kemper IGCC above the $2.88 billion cost cap established by the Mississippi PSC, net of the DOE Grants and excluding the Cost Cap Exceptions. In subsequent periods, any further changes in the estimated costs to complete construction of the Kemper IGCC subject to the $2.88 billion cost cap will be reflected in the Company’s statements of income and these changes could be material.
Additionally, there are certain risks associated with the construction program in general and certain risks associated with the licensing, construction, and operation of nuclear generating units in particular, including potential impacts that could result from a
II-30
MANAGEMENT'S DISCUSSION AND ANALYSIS (continued)
Southern Company and Subsidiary Companies 2013 Annual Report
major incident at a nuclear facility anywhere in the world. The ultimate outcome of these events cannot be determined at this time.
Other Matters
Southern Company and its subsidiaries are involved in various other matters being litigated and regulatory matters that could affect future earnings. In addition, Southern Company and its subsidiaries are subject to certain claims and legal actions arising in the ordinary course of business. The business activities of Southern Company's subsidiaries are subject to extensive governmental regulation related to public health and the environment, such as regulation of air emissions and water discharges. Litigation over environmental issues and claims of various types, including property damage, personal injury, common law nuisance, and citizen enforcement of environmental requirements, such as air quality and water standards, has increased generally throughout the U.S. In particular, personal injury, property damage, and other claims for damages alleged to have been caused by CO
2
and other emissions, coal combustion residuals, and alleged exposure to hazardous materials, and/or requests for injunctive relief in connection with such matters, have become more frequent.
The ultimate outcome of such pending or potential litigation against Southern Company and its subsidiaries cannot be predicted at this time; however, for current proceedings not specifically reported herein or in Note 3 to the financial statements, management does not anticipate that the ultimate liabilities, if any, arising from such current proceedings would have a material effect on Southern Company's financial statements. See Note 3 to the financial statements for a discussion of various other contingencies, regulatory matters, and other matters being litigated which may affect future earnings potential.
In 2011, a major earthquake and tsunami struck Japan and caused substantial damage to the nuclear generating units at the Fukushima Daiichi generating plant. The events in Japan have created uncertainties that may affect future costs for operating nuclear plants. Specifically, the NRC is performing additional operational and safety reviews of nuclear facilities in the U.S., which could potentially impact future operations and capital requirements. In addition, the NRC has issued a series of orders requiring safety-related changes to U.S. nuclear facilities and expects to issue orders in the future requiring additional upgrades. The final form and the resulting impact of any changes to safety requirements for nuclear reactors will be dependent on further review and action by the NRC and cannot be determined at this time; however, management does not currently anticipate that the compliance costs associated with these orders would have a material impact on Southern Company's financial statements.
See "PSC Matters – Alabama Power – Compliance and Pension Cost Accounting Order" herein for additional information on Alabama Power's PSC approved accounting order, which allows the deferral of certain compliance-related operations and maintenance expenditures related to compliance with the NRC guidance.
Additionally, there are certain risks associated with the licensing, construction, and operation of nuclear generating units, including potential impacts that could result from a major incident at a nuclear facility anywhere in the world. The ultimate outcome of these events cannot be determined at this time.
On April 4, 2013, an explosion occurred at Plant Bowen Unit 2 that resulted in substantial damage to the Plant Bowen Unit 2 generator, the Plant Bowen Units 1 and 2 control room and surrounding areas, and Plant Bowen's switchyard. Plant Bowen Unit 1 (approximately 700 MWs) was returned to service on August 4, 2013 and Plant Bowen Unit 2 (approximately 700 MWs) was returned to service on December 20, 2013. Georgia Power expects that any material repair costs related to the damage will be covered by property insurance.
On November 19, 2013, the U.S. District Court for the District of Columbia ordered the DOE to cease collecting spent fuel depositary fees from nuclear power plant operators until such time as the DOE either complies with the Nuclear Waste Policy Act of 1982 or until the U.S. Congress enacts an alternative waste management plan. In accordance with the court’s order, the DOE has submitted a proposal to the U.S. Congress to change the fee to zero. That proposal is pending before the U.S. Congress and will become effective after 90 days of legislative session from the time of submittal unless the U.S. Congress enacts legislation that impacts the proposed fee change. The DOE’s petition for rehearing of the November 2013 decision is currently pending and Alabama Power and Georgia Power are continuing to pay the fee of approximately $13 million and $15 million annually, respectively, based on their ownership interest. The ultimate outcome of this matter cannot be determined at this time.
ACCOUNTING POLICIES
Application of Critical Accounting Policies and Estimates
Southern Company prepares its consolidated financial statements in accordance with GAAP. Significant accounting policies are described in Note 1 to the financial statements. In the application of these policies, certain estimates are made that may have a material impact on Southern Company's results of operations and related disclosures. Different assumptions and measurements could produce estimates that are significantly different from those recorded in the financial statements. Senior management has
II-31
MANAGEMENT'S DISCUSSION AND ANALYSIS (continued)
Southern Company and Subsidiary Companies 2013 Annual Report
reviewed and discussed the following critical accounting policies and estimates with the Audit Committee of Southern Company's Board of Directors.
Electric Utility Regulation
Southern Company's traditional operating companies, which comprised approximately 94% of Southern Company's total operating revenues for
2013
, are subject to retail regulation by their respective state PSCs and wholesale regulation by the FERC. These regulatory agencies set the rates the traditional operating companies are permitted to charge customers based on allowable costs. As a result, the traditional operating companies apply accounting standards which require the financial statements to reflect the effects of rate regulation. Through the ratemaking process, the regulators may require the inclusion of costs or revenues in periods different than when they would be recognized by a non-regulated company. This treatment may result in the deferral of expenses and the recording of related regulatory assets based on anticipated future recovery through rates or the deferral of gains or creation of liabilities and the recording of related regulatory liabilities. The application of the accounting standards has a further effect on the Company's financial statements as a result of the estimates of allowable costs used in the ratemaking process. These estimates may differ from those actually incurred by the traditional operating companies; therefore, the accounting estimates inherent in specific costs such as depreciation, asset retirement obligations, and pension and postretirement benefits have less of a direct impact on the Company's results of operations and financial condition than they would on a non-regulated company.
As reflected in Note 1 to the financial statements, significant regulatory assets and liabilities have been recorded. Management reviews the ultimate recoverability of these regulatory assets and any requirement to refund these regulatory liabilities based on applicable regulatory guidelines and GAAP. However, adverse legislative, judicial, or regulatory actions could materially impact the amounts of such regulatory assets and liabilities and could adversely impact the Company's financial statements.
Contingent Obligations
Southern Company is subject to a number of federal and state laws and regulations, as well as other factors and conditions that subject it to environmental, litigation, and other risks. See FUTURE EARNINGS POTENTIAL herein and Note 3 to the financial statements for more information regarding certain of these contingencies. Southern Company periodically evaluates its exposure to such risks and, in accordance with GAAP, records reserves for those matters where a non-tax-related loss is considered probable and reasonably estimable. The adequacy of reserves can be significantly affected by external events or conditions that can be unpredictable; thus, the ultimate outcome of such matters could materially affect Southern Company's financial statements.
Pension and Other Postretirement Benefits
Southern Company's calculation of pension and other postretirement benefits expense is dependent on a number of assumptions. These assumptions include discount rates, healthcare cost trend rates, expected long-term return on plan assets, mortality rates, expected salary and wage increases, and other factors. Components of pension and other postretirement benefits expense include interest and service cost on the pension and other postretirement benefit plans, expected return on plan assets, and amortization of certain unrecognized costs and obligations. Actual results that differ from the assumptions utilized are accumulated and amortized over future periods and, therefore, generally affect recognized expense and the recorded obligation in future periods. While the Company believes that the assumptions used are appropriate, differences in actual experience or significant changes in assumptions would affect its pension and other postretirement benefits costs and obligations.
Key elements in determining Southern Company's pension and other postretirement benefit expense in accordance with GAAP are the expected long-term return on plan assets and the discount rate used to measure the benefit plan obligations and the periodic benefit plan expense for future periods. The expected long-term return on postretirement benefit plan assets is based on Southern Company's investment strategy, historical experience, and expectations for long-term rates of return that consider external actuarial advice. Southern Company determines the long-term return on plan assets by applying the long-term rate of expected returns on various asset classes to Southern Company's target asset allocation. Southern Company discounts the future cash flows related to its postretirement benefit plans using a single-point discount rate for each plan developed from the weighted average of market-observed yields for high quality fixed income securities with maturities that correspond to expected benefit payments.
II-32
MANAGEMENT'S DISCUSSION AND ANALYSIS (continued)
Southern Company and Subsidiary Companies 2013 Annual Report
The following table illustrates the sensitivity to changes in Southern Company's long-term assumptions with respect to the assumed discount rate, the assumed salaries, and the assumed long-term rate of return on plan assets:
|
Change in Assumption
|
Increase/(Decrease) in Total Benefit Expense for 2014
|
Increase/(Decrease) in Projected Obligation for Pension Plan at December 31, 2013
|
Increase/(Decrease) in Projected Obligation for Other Postretirement Benefit Plans at December 31, 2013
|
||
|
|
|
(in millions)
|
|
||
|
25 basis point change in discount rate
|
$27/$(26)
|
$296/$(281)
|
$49/$(47)
|
||
|
25 basis point change in salaries
|
$16/$(15)
|
$80/$(77)
|
$–/$–
|
||
|
25 basis point change in long-term return on plan assets
|
$22/$(22)
|
N/A
|
N/A
|
||
N/A – Not applicable
Kemper IGCC Estimated Construction Costs, Project Completion Date, and Rate Recovery
Mississippi Power estimates the scheduled in-service date for the Kemper IGCC to be the fourth quarter 2014 and has revised its cost estimate to complete construction above the $2.88 billion cost cap, net of the DOE Grants and excluding the Cost Cap Exceptions. Mississippi Power does not intend to seek rate recovery or any joint owner contributions for any related costs that exceed the $2.88 billion cost cap, net of the DOE Grants and excluding the Cost Cap Exceptions. As a result of the revisions to the cost estimate, Southern Company recorded pretax charges of $1.2 billion in 2013. In subsequent periods, any further changes in the estimated costs to complete construction of the Kemper IGCC subject to the $2.88 billion cost cap will be reflected in Southern Company's statements of income and these changes could be material. Mississippi Power could experience further construction cost increases and/or schedule extensions with respect to the Kemper IGCC as a result of factors including, but not limited to, labor costs and productivity, adverse weather conditions, shortages and inconsistent quality of equipment, materials, and labor, contractor or supplier delay, or non-performance under construction or other agreements. Furthermore, Mississippi Power could also experience further schedule extensions associated with start-up activities for this "first-of-a-kind" technology, including major equipment failure, system integration, and operations, and/or unforeseen engineering problems, which would result in further cost increases.
Given the significant judgment involved in estimating the future costs to complete construction, the project completion date, the ultimate rate recovery for the Kemper IGCC, and the potential impact on Southern Company's results of operations, Southern Company considers these items to be critical accounting estimates. See Note 3 to the financial statements under "Integrated Coal Gasification Combined Cycle" for additional information.
FINANCIAL CONDITION AND LIQUIDITY
Overview
Although earnings in 2013 were negatively affected by revisions to the cost estimate for the Kemper IGCC, Southern Company's financial condition remained stable at
December 31, 2013
. These charges for the year ended December 31, 2013 have resulted in cash expenditures of
$375.1 million
with no recovery as of December 31, 2013 and are expected to result in future cash expenditures (primarily in 2014) of approximately $805 million with no recovery. Southern Company's cash requirements primarily consist of funding ongoing operations, common stock dividends, capital expenditures, and debt maturities. The Southern Company system's capital expenditures and other investing activities include investments to meet projected long-term demand requirements, to comply with environmental regulations, and for restoration following major storms. Operating cash flows provide a substantial portion of the Southern Company system's cash needs. For the three-year period from
2014
through
2016
, Southern Company's projected common stock dividends, capital expenditures, and debt maturities are expected to exceed operating cash flows. The Southern Company system's projected capital expenditures in that period include investments to build new generation facilities, to maintain existing generation facilities, to add environmental equipment for existing generating units, and to expand and improve transmission and distribution facilities. Southern Company plans to finance future cash needs in excess of its operating cash flows primarily through debt and equity issuances. Southern Company intends to continue to monitor its access to short-term and long-term capital markets as well as its bank credit arrangements to meet future capital and liquidity needs. See "Sources of Capital," "Financing Activities," and "Capital Requirements and Contractual Obligations" herein for additional information.
Southern Company's investments in the qualified pension plan and the nuclear decommissioning trust funds increased in value as of
December 31, 2013
as compared to
December 31, 2012
. No contributions to the qualified pension plan were made for the year
II-33
MANAGEMENT'S DISCUSSION AND ANALYSIS (continued)
Southern Company and Subsidiary Companies 2013 Annual Report
ended December 31, 2013. No mandatory contributions to the qualified pension plan are anticipated for the year ending December 31, 2014.
Net cash provided from operating activities in
2013
totaled $6.1 billion, an increase of $1.2 billion from
2012
. The most significant change in operating cash flow for
2013
as compared to
2012
was a decrease in fossil fuel stock due to an increase in KWH generation. Net cash provided from operating activities in
2012
totaled $4.9 billion, a decrease of $1.0 billion from
2011
. Significant changes in operating cash flow for
2012
as compared to
2011
include an increase in fossil fuel stock and contributions to the qualified pension plan.
Net cash used for investing activities in
2013
,
2012
, and
2011
totaled $5.7 billion, $5.2 billion, and $4.2 billion, respectively. The cash used for investing activities for each of these years was primarily for property additions to utility plant.
Net cash used for financing activities totaled $324 million in
2013
due to redemptions of long-term debt and payments of common stock dividends, partially offset by issuances of long-term debt and common stock and an increase in notes payable. Net cash used for financing activities totaled $417 million in
2012
due to redemptions of long-term debt, the repurchase of common stock, and payments of common stock dividends, partially offset by issuances of long-term debt. Fluctuations in cash flow from financing activities vary from year to year based on capital needs and the maturity or redemption of securities.
Significant balance sheet changes in
2013
include an increase of $2.8 billion in total property, plant, and equipment for the installation of equipment to comply with environmental standards and construction of generation, transmission, and distribution facilities. Other significant changes include a decrease in other regulatory assets, deferred of $1.5 billion and a decrease in employee benefit obligations of $1.1 billion, both of which are primarily attributable to a positive return on assets and an increase in the discount rate associated with retirement benefit plans.
At the end of
2013
, the market price of Southern Company's common stock was $41.11 per share (based on the closing price as reported on the New York Stock Exchange) and the book value was $21.43 per share, representing a market-to-book value ratio of 192%, compared to $42.81, $21.09, and 203%, respectively, at the end of
2012
.
Sources of Capital
Southern Company intends to meet its future capital needs through internal cash flow and external security issuances. Equity capital can be provided from any combination of the Company's stock plans, private placements, or public offerings. The amount and timing of additional equity capital to be raised in 2014, as well as in subsequent years, will be contingent on Southern Company's investment opportunities and capital requirements.
Except as described herein, the traditional operating companies and Southern Power plan to obtain the funds required for construction and other purposes from sources similar to those used in the past, which were primarily from operating cash flows, security issuances, term loans, short-term borrowings, and equity contributions from Southern Company. However, the amount, type, and timing of any future financings, if needed, will depend upon prevailing market conditions, regulatory approval, and other factors.
On February 20, 2014, Georgia Power and the DOE entered into a loan guarantee agreement (Loan Guarantee Agreement), pursuant to which the DOE agreed to guarantee borrowings to be made by Georgia Power under a multi-advance credit facility (FFB Credit Facility) among Georgia Power, the DOE, and the Federal Financing Bank (FFB). Georgia Power's reimbursement obligations to the DOE are secured by a first priority lien on (i) Georgia Power's 45.7% undivided ownership interest in Plant Vogtle Units 3 and 4 and (ii) Georgia Power's rights and obligations under the principal contracts relating to Plant Vogtle Units 3 and 4. Under the FFB Credit Facility, Georgia Power may make term loan borrowings through the FFB. Proceeds of borrowings made under the FFB Credit Facility will be used to reimburse Georgia Power for a portion of certain costs of construction relating to Plant Vogtle Units 3 and 4 that are eligible for financing under the Loan Guarantee Agreement (Eligible Project Costs). Aggregate borrowings under the FFB Credit Facility may not exceed the lesser of (i) 70% of Eligible Project Costs or (ii) approximately $3.46 billion. See Note 6 to the financial statements for additional information.
In addition, Mississippi Power received $245 million of DOE Grants that were used for the construction of the Kemper IGCC. An additional $25 million of DOE Grants is expected to be received for the initial operation of the Kemper IGCC. See Note 3 to the financial statements under "Integrated Coal Gasification Combined Cycle" for information regarding legislation related to the securitization of certain costs of the Kemper IGCC.
The issuance of securities by the traditional operating companies is generally subject to the approval of the applicable state PSC. The issuance of all securities by Mississippi Power and Southern Power and short-term securities by Georgia Power is generally subject to regulatory approval by the FERC. Additionally, with respect to the public offering of securities, Southern Company and certain of its subsidiaries file registration statements with the SEC under the Securities Act of 1933, as amended (1933 Act). The
II-34
MANAGEMENT'S DISCUSSION AND ANALYSIS (continued)
Southern Company and Subsidiary Companies 2013 Annual Report
amounts of securities authorized by the appropriate regulatory authorities, as well as the securities registered under the 1933 Act, are continuously monitored and appropriate filings are made to ensure flexibility in the capital markets.
Southern Company, each traditional operating company, and Southern Power obtain financing separately without credit support from any affiliate. See Note 6 to the financial statements under "Bank Credit Arrangements" for additional information. The Southern Company system does not maintain a centralized cash or money pool. Therefore, funds of each company are not commingled with funds of any other company in the Southern Company system.
Southern Company's current liabilities frequently exceed current assets because of the continued use of short-term debt as a funding source to meet scheduled maturities of long-term debt, as well as cash needs, which can fluctuate significantly due to the seasonality of the business of the Southern Company system. To meet short-term cash needs and contingencies, Southern Company has substantial cash flow from operating activities and access to capital markets, including commercial paper programs which are backed by bank credit facilities.
At
December 31, 2013
, Southern Company and its subsidiaries had approximately $659 million of cash and cash equivalents. Committed credit arrangements with banks at
December 31, 2013
were as follows:
|
Expires
(a)
|
Executable Term Loans
|
Due Within One Year
|
||||||||||||||||||||||||||||||||||||||
|
Company
|
2014
|
2015
|
2016
|
2018
|
Total
|
Unused
|
One
Year
|
Two
Years
|
Term Out
|
No Term Out
|
||||||||||||||||||||||||||||||
|
|
(in millions)
|
(in millions)
|
(in millions)
|
(in millions)
|
||||||||||||||||||||||||||||||||||||
|
Southern Company
|
$
|
—
|
|
$
|
—
|
|
$
|
—
|
|
$
|
1,000
|
|
$
|
1,000
|
|
$
|
1,000
|
|
$
|
—
|
|
$
|
—
|
|
$
|
—
|
|
$
|
—
|
|
||||||||||
|
Alabama Power
|
238
|
|
35
|
|
—
|
|
1,030
|
|
1,303
|
|
1,303
|
|
53
|
|
—
|
|
53
|
|
185
|
|
||||||||||||||||||||
|
Georgia Power
|
—
|
|
—
|
|
150
|
|
1,600
|
|
1,750
|
|
1,736
|
|
—
|
|
—
|
|
—
|
|
—
|
|
||||||||||||||||||||
|
Gulf Power
|
110
|
|
—
|
|
165
|
|
—
|
|
275
|
|
275
|
|
45
|
|
—
|
|
45
|
|
65
|
|
||||||||||||||||||||
|
Mississippi Power
|
135
|
|
—
|
|
165
|
|
—
|
|
300
|
|
300
|
|
25
|
|
40
|
|
65
|
|
70
|
|
||||||||||||||||||||
|
Southern Power
|
—
|
|
—
|
|
—
|
|
500
|
|
500
|
|
500
|
|
—
|
|
—
|
|
—
|
|
—
|
|
||||||||||||||||||||
|
Other
|
75
|
|
25
|
|
—
|
|
—
|
|
100
|
|
100
|
|
25
|
|
—
|
|
25
|
|
50
|
|
||||||||||||||||||||
|
Total
|
$
|
558
|
|
$
|
60
|
|
$
|
480
|
|
$
|
4,130
|
|
$
|
5,228
|
|
$
|
5,214
|
|
$
|
148
|
|
$
|
40
|
|
$
|
188
|
|
$
|
370
|
|
||||||||||
|
(a)
|
No credit arrangements expire in 2017.
|
See Note 6 to the financial statements under "Bank Credit Arrangements" for additional information.
A portion of the unused credit with banks is allocated to provide liquidity support to the traditional operating companies' variable rate pollution control revenue bonds and commercial paper programs. The amount of variable rate pollution control revenue bonds outstanding requiring liquidity support as of
December 31, 2013
was approximately
$1.8 billion
. In addition, at December 31, 2013, the traditional operating companies had
$442 million
of fixed rate pollution control revenue bonds that will be required to be remarketed within the next 12 months.
Southern Company and its subsidiaries expect to renew their credit arrangements as needed, prior to expiration.
Most of these arrangements contain covenants that limit debt levels and contain cross default provisions to other indebtedness (including guarantee obligations) that are restricted only to the indebtedness of the individual company. Such cross default provisions to other indebtedness would trigger an event of default if the applicable borrower defaulted on indebtedness or guarantee obligations over a specified threshold. Southern Company, the traditional operating companies, and Southern Power are currently in compliance with all such covenants. None of the arrangements contain material adverse change clauses at the time of borrowings.
Southern Company, the traditional operating companies, and Southern Power make short-term borrowings primarily through commercial paper programs that have the liquidity support of committed bank credit arrangements. Southern Company, the traditional operating companies, and Southern Power may also borrow through various other arrangements with banks. Commercial paper and short-term bank loans are included in notes payable in the balance sheets.
II-35
MANAGEMENT'S DISCUSSION AND ANALYSIS (continued)
Southern Company and Subsidiary Companies 2013 Annual Report
Details of short-term borrowings were as follows:
|
Short-term Debt at the End of the Period(a)
|
Short-term Debt During the Period
(b)
|
||||||||||||||||
|
Amount Outstanding
|
Weighted Average Interest Rate
|
Average Outstanding
|
Weighted Average Interest Rate
|
Maximum Amount Outstanding
|
|||||||||||||
|
(in millions)
|
(in millions)
|
(in millions)
|
|||||||||||||||
|
December 31, 2013:
|
|||||||||||||||||
|
Commercial paper
|
$
|
1,082
|
|
0.2
|
%
|
$
|
993
|
|
0.3
|
%
|
$
|
1,616
|
|
||||
|
Short-term bank debt
|
400
|
|
0.9
|
%
|
107
|
|
0.9
|
%
|
400
|
|
|||||||
|
Total
|
$
|
1,482
|
|
0.4
|
%
|
$
|
1,100
|
|
0.3
|
%
|
|||||||
|
December 31, 2012:
|
|||||||||||||||||
|
Commercial paper
|
$
|
820
|
|
0.3
|
%
|
$
|
550
|
|
0.3
|
%
|
$
|
938
|
|
||||
|
Short-term bank debt
|
—
|
|
—
|
%
|
116
|
|
1.2
|
%
|
300
|
|
|||||||
|
Total
|
$
|
820
|
|
0.3
|
%
|
$
|
666
|
|
0.5
|
%
|
|||||||
|
December 31, 2011:
|
|||||||||||||||||
|
Commercial paper
|
$
|
654
|
|
0.3
|
%
|
$
|
697
|
|
0.3
|
%
|
$
|
1,586
|
|
||||
|
Short-term bank debt
|
200
|
|
1.2
|
%
|
14
|
|
1.2
|
%
|
200
|
|
|||||||
|
Total
|
$
|
854
|
|
0.5
|
%
|
$
|
711
|
|
0.3
|
%
|
|||||||
|
(a)
|
Excludes notes payable related to other energy service contracts of $
5 million
and $
6 million
at December 31, 2012 and
2011
, respectively.
|
|
(b)
|
Average and maximum amounts are based upon daily balances during the twelve-month periods ended December 31, 2013, 2012, and 2011.
|
Management believes that the need for working capital can be adequately met by utilizing commercial paper programs, lines of credit, and cash.
Financing Activities
During
2013
, Southern Company issued approximately
6.9 million
shares of common stock for approximately
$222.4 million
through the employee and director stock plans, of which
0.7 million
shares related to Southern Company's performance share plan.
During the first seven months of 2013, all sales under the Southern Investment Plan and the employee savings plan were funded with shares acquired on the open market by the independent plan administrators. Beginning in August 2013 and continuing through the fourth quarter 2013, Southern Company began using shares held in treasury to satisfy the requirements under the Southern Investment Plan and the employee savings plan, issuing a total of approximately
4.4 million
shares of common stock previously held in treasury for approximately
$183.6 million
.
In addition, during the last six months of 2013, Southern Company issued approximately
8.0 million
shares of common stock through at-the-market issuances pursuant to sales agency agreements related to Southern Company’s continuous equity offering program and received cash proceeds of approximately
$327.3 million
, net of
$2.8 million
in fees and commissions.
In June 2013, Gulf Power issued 500,000 shares of Series 2013A 5.60% Preference Stock and realized proceeds of $50 million. The proceeds from the sale of the Preference Stock, together with the proceeds from the issuance of the $90 million aggregate principal amount of Gulf Power's Series 2013A 5.00% Senior Notes reflected in the table below, were used to repay at maturity $60 million aggregate principal amount of Gulf Power's Series G 4.35% Senior Notes due July 15, 2013, to repay a portion of a 90-day floating rate bank loan in an aggregate principal amount outstanding of $125 million, for a portion of the redemption in July 2013 of $30 million aggregate principal amount outstanding of Gulf Power’s Series H 5.25% Senior Notes due July 15, 2033, and for general corporate purposes, including Gulf Power’s continuous construction program.
II-36
MANAGEMENT'S DISCUSSION AND ANALYSIS (continued)
Southern Company and Subsidiary Companies 2013 Annual Report
The following table outlines the long-term debt financing activities for Southern Company and its subsidiaries for the year ended
December 31, 2013:
|
Company
|
Senior Note Issuances
|
Senior Note Redemptions and Maturities
|
Revenue Bond Issuances
|
Revenue Bond Redemptions and Maturities
|
Other Long-Term Debt Issuances
|
Other Long-Term Debt Redemptions and Maturities
|
|||||||||||||||||
|
(in millions)
|
|||||||||||||||||||||||
|
Southern Company
|
$
|
500
|
|
$
|
—
|
|
$
|
—
|
|
$
|
—
|
|
$
|
—
|
|
$
|
—
|
|
|||||
|
Alabama Power
|
300
|
|
250
|
|
—
|
|
—
|
|
—
|
|
—
|
|
|||||||||||
|
Georgia Power
|
850
|
|
1,775
|
|
194
|
|
194
|
|
—
|
|
—
|
|
|||||||||||
|
Gulf Power
|
90
|
|
90
|
|
—
|
|
—
|
|
—
|
|
—
|
|
|||||||||||
|
Mississippi Power
|
—
|
|
50
|
|
—
|
|
—
|
|
517
|
|
208
|
|
|||||||||||
|
Southern Power
|
300
|
|
—
|
|
—
|
|
—
|
|
23
|
|
9
|
|
|||||||||||
|
Other
|
100
|
|
50
|
|
—
|
|
—
|
|
—
|
|
—
|
|
|||||||||||
|
Total
|
$
|
2,140
|
|
$
|
2,215
|
|
$
|
194
|
|
$
|
194
|
|
$
|
540
|
|
$
|
217
|
|
|||||
In August 2013, Southern Company issued $500 million aggregate principal amount of Series 2013A 2.45% Senior Notes due September 1, 2018. The proceeds were used to pay a portion of Southern Company’s outstanding short-term indebtedness and for other general corporate purposes.
Southern Company's subsidiaries used the proceeds of the debt issuances shown in the table above for the redemptions and maturities shown in the table above, to repay short-term indebtedness, and for general corporate purposes, including their respective continuous construction programs.
Mississippi Power's "Other Long-Term Debt Issuances" reflected in the table above include $11 million related to an agreement entered into by the Mississippi Business Finance Corporation (MBFC) in November 2013 for the issuances of up to $45 million of taxable revenue bonds for the benefit of Mississippi Power. During 2013, the MBFC issued $11 million of taxable revenue bonds under the agreement, the proceeds of which were used by Mississippi Power for the cost of the acquisition, construction, equipping, installation, and improvement of certain equipment and facilities for the lignite mining facility relating to the Kemper IGCC. Any future issuances under the agreement will be used for the same purposes.
In March 2013, Georgia Power entered into three 60-day floating rate bank loans bearing interest based on one-month London Interbank Offered Rate (LIBOR). Each of these short-term loans was for $100 million aggregate principal amount and the proceeds were used for working capital and other general corporate purposes, including Georgia Power's continuous construction program. These bank loans were repaid at maturity.
In June 2013, Gulf Power entered into a 90-day floating rate bank loan bearing interest based on one-month LIBOR. This short-term loan was for $125 million aggregate principal amount and the proceeds were used for working capital and other general corporate purposes, including Gulf Power’s continuous construction program. This bank loan was repaid in July 2013.
In November 2013, Georgia Power entered into
three
four
-month floating rate bank loans for an aggregate principal amount of
$400 million
, bearing interest based on
one-month
LIBOR. The proceeds of these short-term loans were used for working capital and other general corporate purposes, including Georgia Power's continuous construction program. Subsequent to December 31, 2013, Georgia Power repaid these bank term loans.
The bank loans and the MBFC taxable revenue bonds have covenants that limit debt levels to
65%
of total capitalization, as defined in the agreements. For purposes of these definitions, debt excludes the long-term debt payable to affiliated trusts and other hybrid securities and, for Mississippi Power, securitized debt relating to the securitization of certain costs of the Kemper IGCC. At
December 31, 2013
, Georgia Power and Mississippi Power were in compliance with their respective debt limits.
In addition, these bank loans and the MBFC taxable revenue bonds contain cross default provisions that would be triggered if the borrower defaulted on other indebtedness (including guarantee obligations) above a specified threshold. The cross default provisions are restricted to the indebtedness, including any guarantee obligations, of the company that has such bank loans. Georgia Power and Mississippi Power are currently in compliance with all such covenants.
Gulf Power purchased and held $42 million aggregate principal amount of Development Authority of Monroe County (Georgia) Pollution Control Revenue Bonds (Gulf Power Company Plant Scherer Project), First Series 2002 (First Series 2002 Bonds) and
II-37
MANAGEMENT'S DISCUSSION AND ANALYSIS (continued)
Southern Company and Subsidiary Companies 2013 Annual Report
$21 million aggregate principal amount of Development Authority of Monroe County (Georgia) Pollution Control Revenue Bonds (Gulf Power Company Plant Scherer Project), First Series 2010 (First Series 2010 Bonds) in May 2013 and June 2013, respectively. In June 2013, Gulf Power reoffered the First Series 2002 Bonds and the First Series 2010 Bonds to the public.
Also in November 2013, Georgia Power purchased and now holds $104.6 million aggregate principal amount of pollution control revenue bonds issued for its benefit in 2013. Georgia Power may reoffer these bonds to the public at a later date.
In December 2013, Gulf Power purchased and now holds $13 million aggregate principal amount of Mississippi Business Finance Corporation Solid Waste Disposal Facilities Revenue Refunding Bonds, Series 2012 (Gulf Power Company Project), which Gulf Power may reoffer to the public at a later date.
In September 2013, Mississippi Power entered into a nitrogen supply agreement for the air separation unit of the Kemper IGCC, which resulted in a capital lease obligation at inception of $83 million with an annual interest rate of 4.9%.
Subsequent to December 31, 2013, Mississippi Power entered into an 18-month floating rate bank loan bearing interest based on the one-month LIBOR. This term loan was for $250 million aggregate principal amount, and proceeds were used for working capital and other general corporate purposes, including Mississippi Power's continuous construction program.
Also subsequent to December 31, 2013, Mississippi Power received an additional $75 million interest-bearing refundable deposit from South Mississippi Electric Power Association (SMEPA) to be applied to the sale price for the pending sale of an undivided interest in the Kemper IGCC. See Note 3 to the financial statements under "Integrated Coal Gasification Combined Cycle – Proposed Sale of Undivided Interest to SMEPA" for additional information.
Subsequent to December 31, 2013, Georgia Power made initial borrowings under the FFB Credit Facility in an aggregate principal amount of $1.0 billion. The interest rate applicable to $500 million of the initial advance under the FFB Credit Facility is 3.860% for an interest period that extends to February 20, 2044 (the final maturity date) and the interest rate applicable to the remaining $500 million is 3.488% for an interest period that extends to February 20, 2029 and will be reset from time to time thereafter through the final maturity date. The final maturity date for all advances under the FFB Credit Facility is February 20, 2044. The proceeds of the initial borrowings under the FFB Credit Facility were used to reimburse Georgia Power for Eligible Project Costs relating to the construction of Plant Vogtle Units 3 and 4. Georgia Power's reimbursement obligations to the DOE are secured by a first priority lien on (i) Georgia Power's 45.7% undivided ownership interest in Plant Vogtle Units 3 and 4 and (ii) Georgia Power's rights and obligations under the principal contracts relating to Plant Vogtle Units 3 and 4. See Note 6 to the financial statements for additional information.
Under the Loan Guarantee Agreement, Georgia Power is subject to customary events of default, as well as cross-defaults to other indebtedness and events of default relating to any failure to make payments under the engineering, procurement, and construction contract, as amended, relating to Plant Vogtle Units 3 and 4 or certain other agreements providing intellectual property rights for Plant Vogtle Units 3 and 4. The Loan Guarantee Agreement also includes events of default specific to the DOE loan guarantee program, including the failure of Georgia Power or Southern Nuclear Operating Company, Inc. to comply with requirements of law or DOE loan guarantee program requirements. See Note 6 to the financial statements under "DOE Loan Guarantee Borrowings" for additional information.
In addition to any financings that may be necessary to meet capital requirements and contractual obligations, Southern Company and its subsidiaries plan to continue, when economically feasible, a program to retire higher-cost securities and replace these obligations with lower-cost capital if market conditions permit.
Credit Rating Risk
Southern Company and its subsidiaries do not have any credit arrangements that would require material changes in payment schedules or terminations as a result of a credit rating downgrade. There are certain contracts that could require collateral, but not accelerated payment, in the event of a credit rating change of certain subsidiaries to BBB and Baa2, or BBB- and/or Baa3 or below. These contracts are for physical electricity purchases and sales, fuel purchases, fuel transportation and storage, emissions allowances, energy price risk management, and construction of new generation.
II-38
MANAGEMENT'S DISCUSSION AND ANALYSIS (continued)
Southern Company and Subsidiary Companies 2013 Annual Report
The maximum potential collateral requirements under these contracts at
December 31, 2013
were as follows:
|
Credit Ratings
|
Maximum Potential Collateral Requirements
|
||
|
|
(in millions)
|
||
|
At BBB and Baa2
|
$
|
9
|
|
|
At BBB- and/or Baa3
|
470
|
|
|
|
Below BBB- and/or Baa3
|
2,313
|
|
|
In March 2012 and subsequent to December 31, 2013, Mississippi Power received $150 million and $75 million, respectively, of interest-bearing refundable deposits from SMEPA to be applied to the sale price for the pending sale of an undivided interest in the Kemper IGCC. Until the sale is closed, the deposits bear interest at Mississippi Power's AFUDC rate adjusted for income taxes, which was 9.932% per annum for 2013 and 9.967% per annum for 2012, and are refundable to SMEPA upon termination of the asset purchase agreement related to such purchase, within 60 days of a request by SMEPA for a full or partial refund, or within 15 days at SMEPA's discretion in the event that Mississippi Power is assigned a senior unsecured credit rating of BBB+ or lower by Standard and Poor's Rating Services, a division of The McGraw Hill Companies, Inc. (S&P) or Baa1 or lower by Moody's Investors Service, Inc. (Moody's) or ceases to be rated by either of these rating agencies. On July 18, 2013, Southern Company entered into an agreement with SMEPA under which Southern Company has agreed to guarantee the obligations of Mississippi Power with respect to any required refund of the deposits.
On May 24, 2013, S&P revised the ratings outlook for Southern Company and the traditional operating companies from stable to negative.
On August 6, 2013, Moody's downgraded the senior unsecured debt and preferred stock ratings of Mississippi Power to Baa1 from A3 and to Baa3 from Baa2, respectively. Moody's maintained the stable ratings outlook for Mississippi Power.
On August 6, 2013, Fitch Ratings, Inc. affirmed the senior unsecured debt and preferred stock ratings of Mississippi Power and revised the ratings outlook for Mississippi Power from stable to negative.
On January 31, 2014, Moody's upgraded the senior unsecured debt and preferred stock ratings of Alabama Power to A1 from A2 and A3 from Baa1, respectively. Also on January 31, 2014, Moody's upgraded the senior unsecured debt and preferred stock ratings of Gulf Power to A2 from A3 and to Baa1 from Baa2, respectively.
Moody's maintained the stable ratings outlook for Alabama Power and Gulf Power.
Generally, collateral may be provided by a Southern Company guaranty, letter of credit, or cash. Additionally, any credit rating downgrade could impact the ability of Southern Company and its subsidiaries to access capital markets, particularly the short-term debt market and the variable rate pollution control revenue bond market.
Market Price Risk
The Southern Company system is exposed to market risks, primarily commodity price risk and interest rate risk. The Southern Company system may also occasionally have limited exposure to foreign currency exchange rates. To manage the volatility attributable to these exposures, the applicable company nets the exposures, where possible, to take advantage of natural offsets and enters into various derivative transactions for the remaining exposures pursuant to the applicable company's policies in areas such as counterparty exposure and risk management practices. The Southern Company system's policy is that derivatives are to be used primarily for hedging purposes and mandates strict adherence to all applicable risk management policies. Derivative positions are monitored using techniques including, but not limited to, market valuation, value at risk, stress testing, and sensitivity analysis.
To mitigate future exposure to a change in interest rates, Southern Company and certain of its subsidiaries enter into derivatives that have been designated as hedges. Derivatives outstanding at
December 31, 2013
have a notional amount of $350 million and are related to fixed and floating rate obligations which expire in 2014. The weighted average interest rate on $3.3 billion of long-term and short-term variable interest rate exposure that has not been hedged at January 1,
2014
was 0.70%. If Southern Company sustained a 100 basis point change in interest rates for all unhedged variable rate long-term debt and short-term bank loans, the change would affect annualized interest expense by approximately $33 million at January 1,
2014
. See Note 1 to the financial statements under "Financial Instruments" and Note 11 to the financial statements for additional information.
Due to cost-based rate regulation and other various cost recovery mechanisms, the traditional operating companies continue to have limited exposure to market volatility in interest rates, foreign currency, commodity fuel prices, and prices of electricity. In addition, Southern Power's exposure to market volatility in commodity fuel prices and prices of electricity is limited because its
II-39
MANAGEMENT'S DISCUSSION AND ANALYSIS (continued)
Southern Company and Subsidiary Companies 2013 Annual Report
long-term sales contracts shift substantially all fuel cost responsibility to the purchaser. However, Southern Power has been and may continue to be exposed to market volatility in energy-related commodity prices as a result of uncontracted generating capacity. To mitigate residual risks relative to movements in electricity prices, the traditional operating companies enter into physical fixed-price contracts for the purchase and sale of electricity through the wholesale electricity market and, to a lesser extent, financial hedge contracts for natural gas purchases. The traditional operating companies continue to manage fuel-hedging programs implemented per the guidelines of their respective state PSCs. Southern Company had no material change in market risk exposure for the year ended
December 31, 2013
when compared to the
December 31, 2012
reporting period.
The changes in fair value of energy-related derivative contracts are substantially attributable to both the volume and the price of natural gas. For the years ended December 31, the changes in fair value of energy-related derivative contracts, the majority of which are composed of regulatory hedges, were as follows:
|
2013
Changes
|
2012
Changes
|
||||||
|
Fair Value
|
|||||||
|
(in millions)
|
|||||||
|
Contracts outstanding at the beginning of the period, assets (liabilities), net
|
$
|
(85
|
)
|
$
|
(231
|
)
|
|
|
Contracts realized or settled:
|
|||||||
|
Swaps realized or settled
|
43
|
|
167
|
|
|||
|
Options realized or settled
|
19
|
|
39
|
|
|||
|
Current period changes
(a)
:
|
|||||||
|
Swaps
|
2
|
|
(41
|
)
|
|||
|
Options
|
(11
|
)
|
(19
|
)
|
|||
|
Contracts outstanding at the end of the period, assets (liabilities), net
|
$
|
(32
|
)
|
$
|
(85
|
)
|
|
(a) Current period changes also include the changes in fair value of new contracts entered into during the period, if any.
The net hedge volumes of energy-related derivative contracts for the years ended December 31 were as follows:
|
2013
|
2012
|
|||
|
mmBtu* Volume
|
||||
|
(in millions)
|
||||
|
Commodity – Natural gas swaps
|
216
|
|
171
|
|
|
Commodity – Natural gas options
|
59
|
|
105
|
|
|
Total hedge volume
|
275
|
|
276
|
|
* million British thermal units (mmBtu)
The weighted average swap contract cost above market prices was approximately $0.10 per mmBtu as of
December 31, 2013
and $0.39 per mmBtu as of
December 31, 2012
. The change in option fair value is primarily attributable to the volatility of the market and the underlying change in the natural gas price. The majority of the natural gas hedge gains and losses are recovered through the traditional operating companies' fuel cost recovery clauses.
At December 31, 2013 and 2012, substantially all of the Southern Company system's energy-related derivative contracts were designated as regulatory hedges and are related to the applicable company's fuel-hedging program. Therefore, gains and losses are initially recorded as regulatory liabilities and assets, respectively, and then are included in fuel expense as they are recovered through the energy cost recovery clause. Certain other gains and losses on energy-related derivatives, designated as cash flow hedges, are initially deferred in other comprehensive income before being recognized in income in the same period as the hedged transaction. Gains and losses on energy-related derivative contracts that are not designated or fail to qualify as hedges are recognized in the statements of income as incurred and were not material for any year presented.
II-40
MANAGEMENT'S DISCUSSION AND ANALYSIS (continued)
Southern Company and Subsidiary Companies 2013 Annual Report
Southern Company uses over-the-counter contracts that are not exchange traded but are fair valued using prices which are market observable, and thus fall into Level 2. See Note 10 to the financial statements for further discussion of fair value measurements. The maturities of the energy-related derivative contracts, which are all Level 2 of the fair value hierarchy, at
December 31, 2013
were as follows:
|
Fair Value Measurements
|
|||||||||||||||
|
December 31, 2013
|
|||||||||||||||
|
Total
Fair Value
|
Maturity
|
||||||||||||||
|
Year 1
|
Years 2&3
|
Years 4&5
|
|||||||||||||
|
(in millions)
|
|||||||||||||||
|
Level 1
|
$
|
—
|
|
$
|
—
|
|
$
|
—
|
|
$
|
—
|
|
|||
|
Level 2
|
(32
|
)
|
(10
|
)
|
(18
|
)
|
(4
|
)
|
|||||||
|
Level 3
|
—
|
|
—
|
|
—
|
|
—
|
|
|||||||
|
Fair value of contracts outstanding at end of period
|
$
|
(32
|
)
|
$
|
(10
|
)
|
$
|
(18
|
)
|
$
|
(4
|
)
|
|||
Southern Company is exposed to market price risk in the event of nonperformance by counterparties to energy-related and interest rate derivative contracts. Southern Company only enters into agreements and material transactions with counterparties that have investment grade credit ratings by Moody's and S&P, or with counterparties who have posted collateral to cover potential credit exposure. Therefore, Southern Company does not anticipate market risk exposure from nonperformance by the counterparties. For additional information, see Note 1 to the financial statements under "Financial Instruments" and Note 11 to the financial statements.
Southern Company performs periodic reviews of its leveraged lease transactions, both domestic and international, and the creditworthiness of the lessees, including a review of the value of the underlying leased assets and the credit ratings of the lessees. Southern Company's domestic lease transactions generally do not have any credit enhancement mechanisms; however, the lessees in its international lease transactions have pledged various deposits as additional security to secure the obligations. The lessees in the Company's international lease transactions are also required to provide additional collateral in the event of a credit downgrade below a certain level.
Capital Requirements and Contractual Obligations
The Southern Company system's construction program is currently estimated to be $6.1 billion for
2014
, $5.4 billion for
2015
, and $4.5 billion for
2016
. Included in the estimated amount for 2014 are expenditures related to the construction of the Kemper IGCC of $490 million, which is net of SMEPA's 15% proposed ownership share of the Kemper IGCC of approximately $555 million in 2014 (including construction costs for all prior years relating to its proposed ownership interest). Capital expenditures to comply with environmental statutes and regulations included in these estimated amounts are $1.5 billion, $1.1 billion, and $600 million for
2014
,
2015
, and
2016
, respectively. These amounts include capital expenditures related to contractual purchase commitments for nuclear fuel and capital expenditures covered under long-term service agreements.
Southern Company anticipates that the Southern Company system's capital expenditure requirements will continue to decline through the middle of the decade, before rising again to meet additional requirements for environmental compliance and new generation.
See FUTURE EARNINGS POTENTIAL – "Environmental Matters – Environmental Statutes and Regulations" herein for additional information.
The construction programs are subject to periodic review and revision, and actual construction costs may vary from these estimates because of numerous factors. These factors include: changes in business conditions; changes in load projections; changes in the expected environmental compliance program; changes in environmental statutes and regulations; the outcome of any legal challenges to the environmental rules; changes in generating plants, including unit retirements and replacements and adding or changing fuel sources at existing units, to meet regulatory requirements; changes in FERC rules and regulations; PSC approvals; changes in legislation; the cost and efficiency of construction labor, equipment, and materials; project scope and design changes; storm impacts; and the cost of capital. In addition, there can be no assurance that costs related to capital expenditures will be fully recovered. See Note 3 to the financial statements under "Retail Regulatory Matters – Georgia Power – Nuclear Construction" and "Integrated Coal Gasification Combined Cycle" for additional information.
II-41
MANAGEMENT'S DISCUSSION AND ANALYSIS (continued)
Southern Company and Subsidiary Companies 2013 Annual Report
As a result of NRC requirements, Alabama Power and Georgia Power have external trust funds for nuclear decommissioning costs; however, Alabama Power currently has no additional funding requirements. For additional information, see Note 1 to the financial statements under "Nuclear Decommissioning."
In addition, as discussed in Note 2 to the financial statements, Southern Company provides postretirement benefits to substantially all employees and funds trusts to the extent required by the traditional operating companies' respective regulatory commissions.
Other funding requirements related to obligations associated with scheduled maturities of long-term debt, as well as the related interest, derivative obligations, preferred and preference stock dividends, leases, and other purchase commitments are detailed in the contractual obligations table that follows. See Notes 1, 2, 5, 6, 7, and 11 to the financial statements for additional information.
II-42
MANAGEMENT'S DISCUSSION AND ANALYSIS (continued)
Southern Company and Subsidiary Companies 2013 Annual Report
Contractual Obligations
|
2014
|
2015-
2016
|
2017-
2018
|
After
2018
|
Total
|
|||||||||||||||
|
|
|
|
(in millions)
|
|
|||||||||||||||
|
Long-term debt
(a)
—
|
|||||||||||||||||||
|
Principal
|
$
|
440
|
|
$
|
4,768
|
|
$
|
2,001
|
|
$
|
14,393
|
|
$
|
21,602
|
|
||||
|
Interest
|
805
|
|
1,509
|
|
1,297
|
|
10,235
|
|
13,846
|
|
|||||||||
|
Preferred and preference stock dividends
(b)
|
68
|
|
136
|
|
136
|
|
—
|
|
340
|
|
|||||||||
|
Financial derivative obligations
(c)
|
27
|
|
25
|
|
4
|
|
—
|
|
56
|
|
|||||||||
|
Operating leases
(d)
|
101
|
|
140
|
|
75
|
|
135
|
|
451
|
|
|||||||||
|
Capital leases
(d)
|
29
|
|
25
|
|
22
|
|
87
|
|
163
|
|
|||||||||
|
Unrecognized tax benefits
(e)
|
7
|
|
—
|
|
—
|
|
—
|
|
7
|
|
|||||||||
|
Purchase commitments
—
|
|
|
|||||||||||||||||
|
Capital
(f)
|
5,596
|
|
8,948
|
|
—
|
|
—
|
|
14,544
|
|
|||||||||
|
Fuel
(g)
|
4,227
|
|
5,635
|
|
3,263
|
|
6,925
|
|
20,050
|
|
|||||||||
|
Purchased power
(h)
|
295
|
|
740
|
|
788
|
|
4,163
|
|
5,986
|
|
|||||||||
|
Other
(i)
|
267
|
|
419
|
|
435
|
|
967
|
|
2,088
|
|
|||||||||
|
Trusts —
|
|
|
|||||||||||||||||
|
Nuclear decommissioning
(j)
|
2
|
|
11
|
|
11
|
|
115
|
|
139
|
|
|||||||||
|
Pension and other postretirement benefit plans
(k)
|
97
|
|
200
|
|
—
|
|
—
|
|
297
|
|
|||||||||
|
Total
|
$
|
11,961
|
|
$
|
22,556
|
|
$
|
8,032
|
|
$
|
37,020
|
|
$
|
79,569
|
|
||||
|
(a)
|
All amounts are reflected based on final maturity dates. Southern Company and its subsidiaries plan to continue to retire higher-cost securities and replace these obligations with lower-cost capital if market conditions permit. Variable rate interest obligations are estimated based on rates as of January 1,
2014
, as reflected in the statements of capitalization. Fixed rates include, where applicable, the effects of interest rate derivatives employed to manage interest rate risk. Long-term debt excludes capital lease amounts (shown separately).
|
|
(b)
|
Represents preferred and preference stock of subsidiaries. Preferred and preference stock do not mature; therefore, amounts are provided for the next five years only.
|
|
(c)
|
For additional information, see Notes 1 and 11 to the financial statements.
|
|
(d)
|
Excludes PPAs that are accounted for as leases and are included in purchased power.
|
|
(e)
|
See Note 5 to the financial statements under "Unrecognized Tax Benefits" for additional information.
|
|
(f)
|
The Southern Company system provides estimated capital expenditures for a three-year period, including capital expenditures and compliance costs associated with environmental regulations. Estimates reflect the proposed sale of 15% of the Kemper IGCC to SMEPA. See Note 3 to the financial statements under "Integrated Coal Gasification Combined Cycle" for additional information. These amounts exclude contractual purchase commitments for nuclear fuel and capital expenditures covered under long-term service agreements which are reflected separately. At December 31, 2013, significant purchase commitments were outstanding in connection with the construction program. See FUTURE EARNINGS POTENTIAL – "Environmental Matters – Environmental Statutes and Regulations" herein for additional information.
|
|
(g)
|
Primarily includes commitments to purchase coal, nuclear fuel, and natural gas, as well as the related transportation and storage. In most cases, these contracts contain provisions for price escalation, minimum purchase levels, and other financial commitments. Natural gas purchase commitments are based on various indices at the time of delivery. Amounts reflected for natural gas purchase commitments have been estimated based on the New York Mercantile Exchange future prices at
December 31, 2013
.
|
|
(h)
|
Estimated minimum long-term obligations for various PPA purchases from gas-fired, biomass, and wind-powered facilities. A total of $1.3 billion of biomass PPAs is contingent upon the counterparty meeting specified contract dates for posting collateral and commercial operation. See Note 3 to the financial statements under "Retail Regulatory Matters – Georgia Power – Renewables Development" for additional information.
|
|
(i)
|
Includes long-term service agreements and contracts for the procurement of limestone. Long-term service agreements include price escalation based on inflation indices.
|
|
(j)
|
Projections of nuclear decommissioning trust fund contributions are based on the 2010 ARP for 2014 and on the 2013 ARP thereafter for Georgia Power. See Note 1 to the financial statements under "Nuclear Decommissioning" for additional information.
|
|
(k)
|
The Southern Company system forecasts contributions to the pension and other postretirement benefit plans over a three-year period. Southern Company anticipates no mandatory contributions to the qualified pension plan during the next three years. Amounts presented represent estimated benefit payments for the nonqualified pension plans, estimated non-trust benefit payments for the other postretirement benefit plans, and estimated contributions to the other postretirement benefit plan trusts, all of which will be made from corporate assets of Southern Company's subsidiaries. See Note 2 to the financial statements for additional information related to the pension and other postretirement benefit plans, including estimated benefit payments. Certain benefit payments will be made through the related benefit plans. Other benefit payments will be made from corporate assets of Southern Company's subsidiaries.
|
II-43
MANAGEMENT'S DISCUSSION AND ANALYSIS (continued)
Southern Company and Subsidiary Companies 2013 Annual Report
Cautionary Statement Regarding Forward-Looking Statements
Southern Company's
2013
Annual Report contains forward-looking statements. Forward-looking statements include, among other things, statements concerning retail sales, retail rates, the strategic goals for the wholesale business, customer growth, economic recovery, fuel and environmental cost recovery and other rate actions, current and proposed environmental regulations and related estimated expenditures, access to sources of capital, projections for the qualified pension plan, postretirement benefit plan, and nuclear decommissioning trust fund contributions, financing activities, completion dates of construction projects, plans and estimated costs for new generation resources, filings with state and federal regulatory authorities, impact of the ATRA, estimated sales and purchases under new power sale and purchase agreements, and estimated construction and other expenditures. In some cases, forward-looking statements can be identified by terminology such as "may," "will," "could," "should," "expects," "plans," "anticipates," "believes," "estimates," "projects," "predicts," "potential," or "continue" or the negative of these terms or other similar terminology. There are various factors that could cause actual results to differ materially from those suggested by the forward-looking statements; accordingly, there can be no assurance that such indicated results will be realized. These factors include:
|
•
|
the impact of recent and future federal and state regulatory changes, including legislative and regulatory initiatives regarding deregulation and restructuring of the electric utility industry, environmental laws including regulation of water, coal combustion residuals, and emissions of sulfur, nitrogen, carbon, soot, particulate matter, hazardous air pollutants, including mercury, and other substances, and also changes in tax and other laws and regulations to which Southern Company and its subsidiaries are subject, as well as changes in application of existing laws and regulations;
|
|
•
|
current and future litigation, regulatory investigations, proceedings, or inquiries, including the pending EPA civil actions against certain Southern Company subsidiaries, FERC matters, and Internal Revenue Service and state tax audits;
|
|
•
|
the effects, extent, and timing of the entry of additional competition in the markets in which Southern Company's subsidiaries operate;
|
|
•
|
variations in demand for electricity, including those relating to weather, the general economy and recovery from the recent recession, population and business growth (and declines), the effects of energy conservation measures, including from the development and deployment of alternative energy sources such as self-generation and distributed generation technologies, and any potential economic impacts resulting from federal fiscal decisions;
|
|
•
|
available sources and costs of fuels;
|
|
•
|
effects of inflation;
|
|
•
|
ability to control costs and avoid cost overruns during the development and construction of facilities, which include the development and construction of facilities with designs that have not been finalized or previously constructed, including changes in labor costs and productivity factors, adverse weather conditions, shortages and inconsistent quality of equipment, materials, and labor, contractor or supplier delay or non-performance under construction or other agreements, delays associated with start-up activities, including major equipment failure, system integration, and operations, and/or unforeseen engineering problems;
|
|
•
|
ability to construct facilities in accordance with the requirements of permits and licenses and to satisfy any operational and environmental performance standards, including the requirements of tax credits and other incentives;
|
|
•
|
investment performance of Southern Company's employee and retiree benefit plans and the Southern Company system's nuclear decommissioning trust funds;
|
|
•
|
advances in technology;
|
|
•
|
state and federal rate regulations and the impact of pending and future rate cases and negotiations, including rate actions relating to fuel and other cost recovery mechanisms;
|
|
•
|
regulatory approvals and actions related to Plant Vogtle Units 3 and 4, including Georgia PSC approvals and NRC actions;
|
|
•
|
actions related to cost recovery for the Kemper IGCC, including actions relating to proposed securitization, Mississippi PSC approval of Mississippi Power's proposed rate recovery plan, as ultimately amended, which includes the ability to complete the proposed sale of an interest in the Kemper IGCC to SMEPA, the ability to utilize bonus depreciation, which currently requires that the Kemper IGCC be placed in service in 2014, and satisfaction of requirements to utilize investment tax credits and grants;
|
|
•
|
Mississippi PSC review of the prudence of Kemper IGCC costs;
|
|
•
|
the outcome of any legal or regulatory proceedings regarding the Mississippi PSC's issuance of the CPCN for the Kemper IGCC, the settlement agreement between Mississippi Power and the Mississippi PSC, or the State of Mississippi
|
II-44
MANAGEMENT'S DISCUSSION AND ANALYSIS (continued)
Southern Company and Subsidiary Companies 2013 Annual Report
legislation designed to enhance the Mississippi PSC's authority to facilitate development and construction of baseload generation in the State of Mississippi;
|
•
|
the inherent risks involved in operating and constructing nuclear generating facilities, including environmental, health, regulatory, natural disaster, terrorism, or financial risks;
|
|
•
|
the performance of projects undertaken by the non-utility businesses and the success of efforts to invest in and develop new opportunities;
|
|
•
|
internal restructuring or other restructuring options that may be pursued;
|
|
•
|
potential business strategies, including acquisitions or dispositions of assets or businesses, which cannot be assured to be completed or beneficial to Southern Company or its subsidiaries;
|
|
•
|
the ability of counterparties of Southern Company and its subsidiaries to make payments as and when due and to perform as required;
|
|
•
|
the ability to obtain new short- and long-term contracts with wholesale customers;
|
|
•
|
the direct or indirect effect on the Southern Company system's business resulting from terrorist incidents and the threat of terrorist incidents, including cyber intrusion;
|
|
•
|
interest rate fluctuations and financial market conditions and the results of financing efforts, including Southern Company's and its subsidiaries' credit ratings;
|
|
•
|
the impacts of any potential U.S. credit rating downgrade or other sovereign financial issues, including impacts on interest rates, access to capital markets, impacts on currency exchange rates, counterparty performance, and the economy in general, as well as potential impacts on the benefits of the DOE loan guarantees;
|
|
•
|
the ability of Southern Company and its subsidiaries to obtain additional generating capacity at competitive prices;
|
|
•
|
catastrophic events such as fires, earthquakes, explosions, floods, hurricanes, droughts, pandemic health events such as influenzas, or other similar occurrences;
|
|
•
|
the direct or indirect effects on the Southern Company system's business resulting from incidents affecting the U.S. electric grid or operation of generating resources;
|
|
•
|
the effect of accounting pronouncements issued periodically by standard setting bodies; and
|
|
•
|
other factors discussed elsewhere herein and in other reports (including the Form 10-K) filed by Southern Company from time to time with the SEC.
|
Southern Company expressly disclaims any obligation to update any forward-looking statements.
II-45
CONSOLIDATED STATEMENTS OF INCOME
For the Years Ended
December 31, 2013
,
2012
, and
2011
Southern Company and Subsidiary Companies
2013
Annual Report
|
|
2013
|
|
2012
|
|
2011
|
|
|||||
|
|
(in millions)
|
||||||||||
|
Operating Revenues:
|
|||||||||||
|
Retail revenues
|
$
|
14,541
|
|
$
|
14,187
|
|
$
|
15,071
|
|
||
|
Wholesale revenues
|
1,855
|
|
1,675
|
|
1,905
|
|
|||||
|
Other electric revenues
|
639
|
|
616
|
|
611
|
|
|||||
|
Other revenues
|
52
|
|
59
|
|
70
|
|
|||||
|
Total operating revenues
|
17,087
|
|
16,537
|
|
17,657
|
|
|||||
|
Operating Expenses:
|
|||||||||||
|
Fuel
|
5,510
|
|
5,057
|
|
6,262
|
|
|||||
|
Purchased power
|
461
|
|
544
|
|
608
|
|
|||||
|
Other operations and maintenance
|
3,846
|
|
3,772
|
|
3,938
|
|
|||||
|
Depreciation and amortization
|
1,901
|
|
1,787
|
|
1,717
|
|
|||||
|
Taxes other than income taxes
|
934
|
|
914
|
|
901
|
|
|||||
|
Estimated loss on Kemper IGCC
|
1,180
|
|
—
|
|
—
|
|
|||||
|
Total operating expenses
|
13,832
|
|
12,074
|
|
13,426
|
|
|||||
|
Operating Income
|
3,255
|
|
4,463
|
|
4,231
|
|
|||||
|
Other Income and (Expense):
|
|||||||||||
|
Allowance for equity funds used during construction
|
190
|
|
143
|
|
153
|
|
|||||
|
Interest income
|
19
|
|
40
|
|
21
|
|
|||||
|
Interest expense, net of amounts capitalized
|
(824
|
)
|
(859
|
)
|
(857
|
)
|
|||||
|
Other income (expense), net
|
(81
|
)
|
(38
|
)
|
(61
|
)
|
|||||
|
Total other income and (expense)
|
(696
|
)
|
(714
|
)
|
(744
|
)
|
|||||
|
Earnings Before Income Taxes
|
2,559
|
|
3,749
|
|
3,487
|
|
|||||
|
Income taxes
|
849
|
|
1,334
|
|
1,219
|
|
|||||
|
Consolidated Net Income
|
1,710
|
|
2,415
|
|
2,268
|
|
|||||
|
Dividends on Preferred and Preference Stock of Subsidiaries
|
66
|
|
65
|
|
65
|
|
|||||
|
Consolidated Net Income After Dividends on Preferred and Preference Stock of Subsidiaries
|
$
|
1,644
|
|
$
|
2,350
|
|
$
|
2,203
|
|
||
|
Common Stock Data:
|
|||||||||||
|
Earnings per share (EPS)—
|
|||||||||||
|
Basic EPS
|
$
|
1.88
|
|
$
|
2.70
|
|
$
|
2.57
|
|
||
|
Diluted EPS
|
1.87
|
|
2.67
|
|
2.55
|
|
|||||
|
Average number of shares of common stock outstanding — (in millions)
|
|||||||||||
|
Basic
|
877
|
|
871
|
|
857
|
|
|||||
|
Diluted
|
881
|
|
879
|
|
864
|
|
|||||
The accompanying notes are an integral part of these financial statements.
II-46
CONSOLIDATED STATEMENTS OF COMPREHENSIVE INCOME
For the Years Ended
December 31, 2013
,
2012
, and
2011
Southern Company and Subsidiary Companies
2013
Annual Report
|
|
2013
|
|
2012
|
|
2011
|
|
|||||
|
|
(in millions)
|
||||||||||
|
Consolidated Net Income
|
$
|
1,710
|
|
$
|
2,415
|
|
$
|
2,268
|
|
||
|
Other comprehensive income:
|
|||||||||||
|
Qualifying hedges:
|
|||||||||||
|
Changes in fair value, net of tax of $-, $(7), and $(10), respectively
|
—
|
|
(12
|
)
|
(18
|
)
|
|||||
|
Reclassification adjustment for amounts included in net
income, net of tax of $5, $7, and $6, respectively |
9
|
|
11
|
|
9
|
|
|||||
|
Marketable securities:
|
|||||||||||
|
Change in fair value, net of tax of $(2), $-, and $(2), respectively
|
(3
|
)
|
—
|
|
(4
|
)
|
|||||
|
Pension and other postretirement benefit plans:
|
|||||||||||
|
Benefit plan net gain (loss), net of tax of $22, $(2), and $(1),
respectively |
36
|
|
(3
|
)
|
(2
|
)
|
|||||
|
Reclassification adjustment for amounts included in net income, net of
tax of $4, $(4), and $(14), respectively |
6
|
|
(8
|
)
|
(26
|
)
|
|||||
|
Total other comprehensive income (loss)
|
48
|
|
(12
|
)
|
(41
|
)
|
|||||
|
Dividends on preferred and preference stock of subsidiaries
|
(66
|
)
|
(65
|
)
|
(65
|
)
|
|||||
|
Consolidated Comprehensive Income
|
$
|
1,692
|
|
$
|
2,338
|
|
$
|
2,162
|
|
||
The accompanying notes are an integral part of these financial statements.
II-47
For the Years Ended
December 31, 2013
,
2012
, and
2011
Southern Company and Subsidiary Companies
2013
Annual Report
|
|
2013
|
|
2012
|
|
2011
|
|
|||||
|
|
(in millions)
|
||||||||||
|
Operating Activities:
|
|||||||||||
|
Consolidated net income
|
$
|
1,710
|
|
$
|
2,415
|
|
$
|
2,268
|
|
||
|
Adjustments to reconcile consolidated net income to net cash provided from operating activities —
|
|||||||||||
|
Depreciation and amortization, total
|
2,298
|
|
2,145
|
|
2,048
|
|
|||||
|
Deferred income taxes
|
496
|
|
1,096
|
|
1,155
|
|
|||||
|
Investment tax credits
|
302
|
|
128
|
|
85
|
|
|||||
|
Allowance for equity funds used during construction
|
(190
|
)
|
(143
|
)
|
(153
|
)
|
|||||
|
Pension, postretirement, and other employee benefits
|
131
|
|
(398
|
)
|
(45
|
)
|
|||||
|
Stock based compensation expense
|
59
|
|
55
|
|
42
|
|
|||||
|
Estimated loss on Kemper IGCC
|
1,180
|
|
—
|
|
—
|
|
|||||
|
Retail fuel cost over recovery - long-term
|
(123
|
)
|
123
|
|
—
|
|
|||||
|
Other, net
|
82
|
|
(72
|
)
|
(70
|
)
|
|||||
|
Changes in certain current assets and liabilities —
|
|||||||||||
|
-Receivables
|
(153
|
)
|
234
|
|
362
|
|
|||||
|
-Fossil fuel stock
|
481
|
|
(452
|
)
|
(62
|
)
|
|||||
|
-Materials and supplies
|
36
|
|
(97
|
)
|
(60
|
)
|
|||||
|
-Other current assets
|
(11
|
)
|
(37
|
)
|
(17
|
)
|
|||||
|
-Accounts payable
|
72
|
|
(89
|
)
|
(5
|
)
|
|||||
|
-Accrued taxes
|
(85
|
)
|
(71
|
)
|
330
|
|
|||||
|
-Accrued compensation
|
(138
|
)
|
(28
|
)
|
10
|
|
|||||
|
-Retail fuel cost over recovery - short-term
|
(66
|
)
|
129
|
|
(3
|
)
|
|||||
|
-Other current liabilities
|
16
|
|
(40
|
)
|
18
|
|
|||||
|
Net cash provided from operating activities
|
6,097
|
|
4,898
|
|
5,903
|
|
|||||
|
Investing Activities:
|
|||||||||||
|
Property additions
|
(5,463
|
)
|
(4,809
|
)
|
(4,525
|
)
|
|||||
|
Investment in restricted cash
|
(149
|
)
|
(280
|
)
|
1
|
|
|||||
|
Distribution of restricted cash
|
96
|
|
284
|
|
63
|
|
|||||
|
Nuclear decommissioning trust fund purchases
|
(986
|
)
|
(1,046
|
)
|
(2,195
|
)
|
|||||
|
Nuclear decommissioning trust fund sales
|
984
|
|
1,043
|
|
2,190
|
|
|||||
|
Cost of removal, net of salvage
|
(131
|
)
|
(149
|
)
|
(93
|
)
|
|||||
|
Change in construction payables, net
|
(126
|
)
|
(84
|
)
|
198
|
|
|||||
|
Other investing activities
|
33
|
|
(127
|
)
|
178
|
|
|||||
|
Net cash used for investing activities
|
(5,742
|
)
|
(5,168
|
)
|
(4,183
|
)
|
|||||
|
Financing Activities:
|
|||||||||||
|
Increase (decrease) in notes payable, net
|
662
|
|
(30
|
)
|
(438
|
)
|
|||||
|
Proceeds —
|
|||||||||||
|
Long-term debt issuances
|
2,938
|
|
4,404
|
|
3,719
|
|
|||||
|
Interest-bearing refundable deposit related to asset sale
|
—
|
|
150
|
|
—
|
|
|||||
|
Preference stock
|
50
|
|
—
|
|
—
|
|
|||||
|
Common stock issuances
|
695
|
|
397
|
|
723
|
|
|||||
|
Redemptions and repurchases —
|
|||||||||||
|
Long-term debt
|
(2,830
|
)
|
(3,169
|
)
|
(3,170
|
)
|
|||||
|
Common stock repurchased
|
(20
|
)
|
(430
|
)
|
—
|
|
|||||
|
Payment of common stock dividends
|
(1,762
|
)
|
(1,693
|
)
|
(1,601
|
)
|
|||||
|
Payment of dividends on preferred and preference stock of subsidiaries
|
(66
|
)
|
(65
|
)
|
(65
|
)
|
|||||
|
Other financing activities
|
9
|
|
19
|
|
(20
|
)
|
|||||
|
Net cash used for financing activities
|
(324
|
)
|
(417
|
)
|
(852
|
)
|
|||||
|
Net Change in Cash and Cash Equivalents
|
31
|
|
(687
|
)
|
868
|
|
|||||
|
Cash and Cash Equivalents at Beginning of Year
|
628
|
|
1,315
|
|
447
|
|
|||||
|
Cash and Cash Equivalents at End of Year
|
$
|
659
|
|
$
|
628
|
|
$
|
1,315
|
|
||
The accompanying notes are an integral part of these financial statements.
II-48
At
December 31, 2013
and
2012
Southern Company and Subsidiary Companies
2013
Annual Report
|
Assets
|
2013
|
|
2012
|
|
|||
|
|
(in millions)
|
||||||
|
Current Assets:
|
|||||||
|
Cash and cash equivalents
|
$
|
659
|
|
$
|
628
|
|
|
|
Restricted cash and cash equivalents
|
—
|
|
7
|
|
|||
|
Receivables —
|
|||||||
|
Customer accounts receivable
|
1,027
|
|
961
|
|
|||
|
Unbilled revenues
|
448
|
|
441
|
|
|||
|
Under recovered regulatory clause revenues
|
58
|
|
29
|
|
|||
|
Other accounts and notes receivable
|
304
|
|
235
|
|
|||
|
Accumulated provision for uncollectible accounts
|
(18
|
)
|
(17
|
)
|
|||
|
Fossil fuel stock, at average cost
|
1,339
|
|
1,819
|
|
|||
|
Materials and supplies, at average cost
|
959
|
|
1,000
|
|
|||
|
Vacation pay
|
171
|
|
165
|
|
|||
|
Prepaid expenses
|
489
|
|
657
|
|
|||
|
Other regulatory assets, current
|
124
|
|
163
|
|
|||
|
Other current assets
|
39
|
|
74
|
|
|||
|
Total current assets
|
5,599
|
|
6,162
|
|
|||
|
Property, Plant, and Equipment:
|
|||||||
|
In service
|
66,021
|
|
63,251
|
|
|||
|
Less accumulated depreciation
|
23,059
|
|
21,964
|
|
|||
|
Plant in service, net of depreciation
|
42,962
|
|
41,287
|
|
|||
|
Other utility plant, net
|
240
|
|
263
|
|
|||
|
Nuclear fuel, at amortized cost
|
855
|
|
851
|
|
|||
|
Construction work in progress
|
7,151
|
|
5,989
|
|
|||
|
Total property, plant, and equipment
|
51,208
|
|
48,390
|
|
|||
|
Other Property and Investments:
|
|||||||
|
Nuclear decommissioning trusts, at fair value
|
1,465
|
|
1,303
|
|
|||
|
Leveraged leases
|
665
|
|
670
|
|
|||
|
Miscellaneous property and investments
|
218
|
|
216
|
|
|||
|
Total other property and investments
|
2,348
|
|
2,189
|
|
|||
|
Deferred Charges and Other Assets:
|
|||||||
|
Deferred charges related to income taxes
|
1,432
|
|
1,385
|
|
|||
|
Prepaid pension costs
|
419
|
|
—
|
|
|||
|
Unamortized debt issuance expense
|
139
|
|
133
|
|
|||
|
Unamortized loss on reacquired debt
|
293
|
|
309
|
|
|||
|
Other regulatory assets, deferred
|
2,557
|
|
4,032
|
|
|||
|
Other deferred charges and assets
|
551
|
|
549
|
|
|||
|
Total deferred charges and other assets
|
5,391
|
|
6,408
|
|
|||
|
Total Assets
|
$
|
64,546
|
|
$
|
63,149
|
|
|
The accompanying notes are an integral part of these financial statements.
II-49
CONSOLIDATED BALANCE SHEETS
At
December 31, 2013
and
2012
Southern Company and Subsidiary Companies
2013
Annual Report
|
Liabilities and Stockholders' Equity
|
2013
|
|
2012
|
|
|||
|
|
(in millions)
|
||||||
|
Current Liabilities:
|
|||||||
|
Securities due within one year
|
$
|
469
|
|
$
|
2,335
|
|
|
|
Interest-bearing refundable deposit related to asset sale
|
150
|
|
150
|
|
|||
|
Notes payable
|
1,482
|
|
825
|
|
|||
|
Accounts payable
|
1,376
|
|
1,387
|
|
|||
|
Customer deposits
|
380
|
|
370
|
|
|||
|
Accrued taxes —
|
|||||||
|
Accrued income taxes
|
13
|
|
10
|
|
|||
|
Other accrued taxes
|
456
|
|
391
|
|
|||
|
Accrued interest
|
251
|
|
237
|
|
|||
|
Accrued vacation pay
|
217
|
|
212
|
|
|||
|
Accrued compensation
|
303
|
|
433
|
|
|||
|
Other regulatory liabilities, current
|
92
|
|
107
|
|
|||
|
Other current liabilities
|
347
|
|
557
|
|
|||
|
Total current liabilities
|
5,536
|
|
7,014
|
|
|||
|
Long-Term Debt
(
See accompanying statements
)
|
21,344
|
|
19,274
|
|
|||
|
Deferred Credits and Other Liabilities:
|
|||||||
|
Accumulated deferred income taxes
|
10,563
|
|
9,938
|
|
|||
|
Deferred credits related to income taxes
|
202
|
|
211
|
|
|||
|
Accumulated deferred investment tax credits
|
966
|
|
894
|
|
|||
|
Employee benefit obligations
|
1,461
|
|
2,540
|
|
|||
|
Asset retirement obligations
|
2,006
|
|
1,748
|
|
|||
|
Other cost of removal obligations
|
1,270
|
|
1,194
|
|
|||
|
Other regulatory liabilities, deferred
|
475
|
|
289
|
|
|||
|
Other deferred credits and liabilities
|
584
|
|
668
|
|
|||
|
Total deferred credits and other liabilities
|
17,527
|
|
17,482
|
|
|||
|
Total Liabilities
|
44,407
|
|
43,770
|
|
|||
|
Redeemable Preferred Stock of Subsidiaries
(
See accompanying statements
)
|
375
|
|
375
|
|
|||
|
Total Stockholders' Equity
(
See accompanying statements
)
|
19,764
|
|
19,004
|
|
|||
|
Total Liabilities and Stockholders' Equity
|
$
|
64,546
|
|
$
|
63,149
|
|
|
|
Commitments and Contingent Matters
(
See notes
)
|
|
|
|||||
The accompanying notes are an integral part of these financial statements.
II-50
CONSOLIDATED STATEMENTS OF CAPITALIZATION
At
December 31, 2013
and
2012
Southern Company and Subsidiary Companies
2013
Annual Report
|
|
|
2013
|
|
2012
|
|
2013
|
|
2012
|
|
||||||
|
|
|
(in millions)
|
(percent of total)
|
||||||||||||
|
Long-Term Debt:
|
|||||||||||||||
|
Long-term debt payable to affiliated trusts —
|
|||||||||||||||
|
Maturity
|
|||||||||||||||
|
Variable rate (3.35% at 1/1/14) due 2042
|
$
|
206
|
|
$
|
206
|
|
|||||||||
|
Total long-term debt payable to affiliated trusts
|
206
|
|
206
|
|
|||||||||||
|
Long-term senior notes and debt —
|
|||||||||||||||
|
Maturity
|
Interest Rates
|
||||||||||||||
|
2013
|
1.30% to 6.00%
|
—
|
|
1,436
|
|
||||||||||
|
2014
|
3.25% to 4.90%
|
428
|
|
434
|
|
||||||||||
|
2015
|
0.55% to 5.25%
|
2,375
|
|
2,375
|
|
||||||||||
|
2016
|
1.95% to 5.30%
|
1,360
|
|
1,360
|
|
||||||||||
|
2017
|
5.50% to 5.90%
|
1,095
|
|
1,095
|
|
||||||||||
|
2018
|
2.20% to 5.40%
|
850
|
|
250
|
|
||||||||||
|
2019 through 2051
|
1.63% to 8.20%
|
10,798
|
|
9,823
|
|
||||||||||
|
Variable rates (0.58% to 1.21% at 1/1/13) due 2013
|
—
|
|
876
|
|
|||||||||||
|
Variable rate (1.29% at 1/1/14) due 2014
|
11
|
|
—
|
|
|||||||||||
|
Variable rates (0.77% to 0.97% at 1/1/14) due 2015
|
525
|
|
—
|
|
|||||||||||
|
Variable rates (0.57% to 0.65% at 1/1/14) due 2016
|
450
|
|
—
|
|
|||||||||||
|
Total long-term senior notes and debt
|
17,892
|
|
17,649
|
|
|||||||||||
|
Other long-term debt —
|
|||||||||||||||
|
Pollution control revenue bonds —
|
|||||||||||||||
|
Maturity
|
Interest Rates
|
||||||||||||||
|
2019 through 2049
|
0.40% to 6.00%
|
1,478
|
|
1,593
|
|
||||||||||
|
Variable rate (0.04% at 1/1/14) due 2015
|
54
|
|
54
|
|
|||||||||||
|
Variable rate (0.06% at 1/1/14) due 2016
|
4
|
|
4
|
|
|||||||||||
|
Variable rate (0.09% to 0.10% at 1/1/14) due 2017
|
36
|
|
36
|
|
|||||||||||
|
Variable rate (0.04% at 1/1/14) due 2018
|
19
|
|
19
|
|
|||||||||||
|
Variable rates (0.02% to 0.13% at 1/1/14) due 2020 to 2052
|
1,642
|
|
1,645
|
|
|||||||||||
|
Plant Daniel revenue bonds (7.13%) due 2021
|
270
|
|
270
|
|
|||||||||||
|
Total other long-term debt
|
3,503
|
|
3,621
|
|
|||||||||||
|
Capitalized lease obligations
|
163
|
|
80
|
|
|||||||||||
|
Unamortized debt premium (related to plant acquisition)
|
79
|
|
88
|
|
|||||||||||
|
Unamortized debt discount
|
(30
|
)
|
(35
|
)
|
|||||||||||
|
Total long-term debt (annual interest requirement — $805 million)
|
21,813
|
|
21,609
|
|
|||||||||||
|
Less amount due within one year
|
469
|
|
2,335
|
|
|||||||||||
|
Long-term debt excluding amount due within one year
|
21,344
|
|
19,274
|
|
51.5
|
%
|
49.9
|
%
|
|||||||
II-51
|
CONSOLIDATED STATEMENTS OF CAPITALIZATION (continued)
At December 31, 2013 and 2012 Southern Company and Subsidiary Companies 2013 Annual Report |
|||||||||||||||
|
|
2013
|
|
2012
|
|
2013
|
|
2012
|
|
|||||||
|
|
(in millions)
|
(percent of total)
|
|||||||||||||
|
Redeemable Preferred Stock of Subsidiaries:
|
|||||||||||||||
|
Cumulative preferred stock
|
|||||||||||||||
|
$100 par or stated value — 4.20% to 5.44%
|
|||||||||||||||
|
Authorized — 20 million shares
|
|||||||||||||||
|
Outstanding — 1 million shares
|
81
|
|
81
|
|
|||||||||||
|
$1 par value — 5.20% to 5.83%
|
|||||||||||||||
|
Authorized — 28 million shares
|
|||||||||||||||
|
Outstanding — 12 million shares: $25 stated value
|
294
|
|
294
|
|
|||||||||||
|
Total redeemable preferred stock of subsidiaries
(annual dividend requirement — $20 million) |
375
|
|
375
|
|
0.9
|
|
1.0
|
|
|||||||
|
Common Stockholders' Equity:
|
|||||||||||||||
|
Common stock, par value $5 per share —
|
4,461
|
|
4,389
|
|
|||||||||||
|
Authorized — 1.5 billion shares
|
|||||||||||||||
|
Issued — 2013: 893 million shares
|
|||||||||||||||
|
— 2012: 878 million shares
|
|||||||||||||||
|
Treasury — 2013: 5.7 million shares
|
|||||||||||||||
|
— 2012: 10.0 million shares
|
|||||||||||||||
|
Paid-in capital
|
5,362
|
|
4,855
|
|
|||||||||||
|
Treasury, at cost
|
(250
|
)
|
(450
|
)
|
|||||||||||
|
Retained earnings
|
9,510
|
|
9,626
|
|
|||||||||||
|
Accumulated other comprehensive income (loss)
|
(75
|
)
|
(123
|
)
|
|||||||||||
|
Total common stockholders' equity
|
19,008
|
|
18,297
|
|
45.8
|
|
47.3
|
|
|||||||
|
Preferred and Preference Stock of Subsidiaries:
|
|||||||||||||||
|
Non-cumulative preferred stock
|
|||||||||||||||
|
$25 par value — 6.00% to 6.13%
|
|||||||||||||||
|
Authorized — 60 million shares
|
|||||||||||||||
|
Outstanding — 2 million shares
|
45
|
|
45
|
|
|||||||||||
|
Preference stock
|
|||||||||||||||
|
Authorized — 65 million shares
|
|||||||||||||||
|
Outstanding—$1 par value
|
343
|
|
343
|
|
|||||||||||
|
— 5.63% to 6.50% — 14 million shares (non-cumulative)
|
|||||||||||||||
|
Outstanding — $100 par or stated value
|
368
|
|
319
|
|
|||||||||||
|
— 5.60% to 6.50% — 2013: 4 million shares (non-cumulative)
|
|||||||||||||||
|
— 2012: 3 million shares (non-cumulative)
|
|||||||||||||||
|
Total preferred and preference stock of subsidiaries
(annual dividend requirement — $48 million) |
756
|
|
707
|
|
1.8
|
|
1.8
|
|
|||||||
|
Total stockholders' equity
|
19,764
|
|
19,004
|
|
|||||||||||
|
Total Capitalization
|
$
|
41,483
|
|
$
|
38,653
|
|
100.0
|
%
|
100.0
|
%
|
|||||
The accompanying notes are an integral part of these financial statements.
II-52
CONSOLIDATED STATEMENTS OF STOCKHOLDERS' EQUITY
For the Years Ended
December 31, 2013
,
2012
, and
2011
Southern Company and Subsidiary Companies
2013
Annual Report
|
|
Number of Common Shares
|
Common Stock
|
Accumulated
Other Comprehensive Income
(Loss) |
Preferred
and Preference Stock of Subsidiaries
|
|
|||||||||||||||||||||||||||
|
|
Issued
|
Treasury
|
Par Value
|
Paid-In Capital
|
Treasury
|
Retained Earnings
|
Total
|
|||||||||||||||||||||||||
|
|
(in thousands)
|
(in millions)
|
||||||||||||||||||||||||||||||
|
Balance at
December 31, 2010 |
843,814
|
|
(474)
|
$
|
4,219
|
|
$
|
3,702
|
|
$
|
(15
|
)
|
$
|
8,366
|
|
$
|
(70
|
)
|
$
|
707
|
|
$
|
16,909
|
|
||||||||
|
Net income after dividends on
preferred and preference stock of
subsidiaries
|
—
|
|
—
|
—
|
|
—
|
|
—
|
|
2,203
|
|
—
|
|
—
|
|
2,203
|
|
|||||||||||||||
|
Other comprehensive income (loss)
|
—
|
|
—
|
—
|
|
—
|
|
—
|
|
—
|
|
(41
|
)
|
—
|
|
(41
|
)
|
|||||||||||||||
|
Stock issued
|
21,850
|
|
—
|
109
|
|
616
|
|
—
|
|
—
|
|
—
|
|
—
|
|
725
|
|
|||||||||||||||
|
Stock-based compensation
|
—
|
|
—
|
—
|
|
89
|
|
—
|
|
—
|
|
—
|
|
—
|
|
89
|
|
|||||||||||||||
|
Cash dividends
|
—
|
|
—
|
—
|
|
—
|
|
—
|
|
(1,601
|
)
|
—
|
|
—
|
|
(1,601
|
)
|
|||||||||||||||
|
Other
|
—
|
|
(65)
|
—
|
|
3
|
|
(2
|
)
|
—
|
|
—
|
|
—
|
|
1
|
|
|||||||||||||||
|
Balance at
December 31, 2011 |
865,664
|
|
(539)
|
4,328
|
|
4,410
|
|
(17
|
)
|
8,968
|
|
(111
|
)
|
707
|
|
18,285
|
|
|||||||||||||||
|
Net income after dividends on
preferred and preference stock of
subsidiaries
|
—
|
|
—
|
—
|
|
—
|
|
—
|
|
2,350
|
|
—
|
|
—
|
|
2,350
|
|
|||||||||||||||
|
Other comprehensive income (loss)
|
—
|
|
—
|
—
|
|
—
|
|
—
|
|
—
|
|
(12
|
)
|
—
|
|
(12
|
)
|
|||||||||||||||
|
Stock issued
|
12,139
|
|
—
|
61
|
|
336
|
|
—
|
|
—
|
|
—
|
|
—
|
|
397
|
|
|||||||||||||||
|
Stock repurchased, at cost
|
—
|
|
(9,440)
|
—
|
|
—
|
|
(430
|
)
|
—
|
|
—
|
|
—
|
|
(430
|
)
|
|||||||||||||||
|
Stock-based compensation
|
—
|
|
—
|
—
|
|
106
|
|
—
|
|
—
|
|
—
|
|
—
|
|
106
|
|
|||||||||||||||
|
Cash dividends
|
—
|
|
—
|
—
|
|
—
|
|
—
|
|
(1,693
|
)
|
—
|
|
—
|
|
(1,693
|
)
|
|||||||||||||||
|
Other
|
—
|
|
(56)
|
—
|
|
3
|
|
(3
|
)
|
1
|
|
—
|
|
—
|
|
1
|
|
|||||||||||||||
|
Balance at
December 31, 2012 |
877,803
|
|
(10,035)
|
4,389
|
|
4,855
|
|
(450
|
)
|
9,626
|
|
(123
|
)
|
707
|
|
19,004
|
|
|||||||||||||||
|
Net income after dividends on
preferred and preference stock of
subsidiaries
|
—
|
|
—
|
—
|
|
—
|
|
—
|
|
1,644
|
|
—
|
|
—
|
|
1,644
|
|
|||||||||||||||
|
Other comprehensive income (loss)
|
—
|
|
—
|
—
|
|
—
|
|
—
|
|
—
|
|
48
|
|
—
|
|
48
|
|
|||||||||||||||
|
Stock issued
|
14,930
|
|
4,443
|
72
|
|
441
|
|
203
|
|
—
|
|
—
|
|
49
|
|
765
|
|
|||||||||||||||
|
Stock-based compensation
|
—
|
|
—
|
—
|
|
65
|
|
—
|
|
—
|
|
—
|
|
—
|
|
65
|
|
|||||||||||||||
|
Cash dividends
|
—
|
|
—
|
—
|
|
—
|
|
—
|
|
(1,762
|
)
|
—
|
|
—
|
|
(1,762
|
)
|
|||||||||||||||
|
Other
|
—
|
|
(55)
|
—
|
|
1
|
|
(3
|
)
|
2
|
|
—
|
|
—
|
|
—
|
|
|||||||||||||||
|
Balance at
December 31, 2013 |
892,733
|
|
(5,647)
|
$
|
4,461
|
|
$
|
5,362
|
|
$
|
(250
|
)
|
$
|
9,510
|
|
$
|
(75
|
)
|
$
|
756
|
|
$
|
19,764
|
|
||||||||
The accompanying notes are an integral part of these financial statements.
II-53
NOTES TO FINANCIAL STATEMENTS
Southern Company and Subsidiary Companies
2013
Annual Report
Index to the Notes to Financial Statements
|
Note
|
Page
|
|
|
1
|
||
|
2
|
||
|
3
|
||
|
4
|
||
|
5
|
||
|
6
|
||
|
7
|
||
|
8
|
||
|
9
|
||
|
10
|
||
|
11
|
||
|
12
|
||
|
13
|
||
II-54
NOTES (continued)
Southern Company and Subsidiary Companies 2013 Annual Report
1. SUMMARY OF SIGNIFICANT ACCOUNTING POLICIES
General
The Southern Company (Southern Company or the Company) is the parent company of four traditional operating companies, Southern Power Company (Southern Power), Southern Company Services, Inc. (SCS), Southern Communications Services, Inc. (SouthernLINC Wireless), Southern Company Holdings, Inc. (Southern Holdings), Southern Nuclear Operating Company, Inc. (Southern Nuclear), and other direct and indirect subsidiaries. The traditional operating companies – Alabama Power Company (Alabama Power), Georgia Power Company (Georgia Power), Gulf Power Company (Gulf Power), and Mississippi Power Company (Mississippi Power) – are vertically integrated utilities providing electric service in four Southeastern states. Southern Power constructs, acquires, owns, and manages generation assets, including renewable energy projects, and sells electricity at market-based rates in the wholesale market. SCS, the system service company, provides, at cost, specialized services to Southern Company and its subsidiary companies. SouthernLINC Wireless provides digital wireless communications for use by Southern Company and its subsidiary companies and also markets these services to the public and provides fiber cable services within the Southeast. Southern Holdings is an intermediate holding company subsidiary, primarily for Southern Company's investments in leveraged leases. Southern Nuclear operates and provides services to the Southern Company system's nuclear power plants.
The financial statements reflect Southern Company's investments in the subsidiaries on a consolidated basis. The equity method is used for entities in which the Company has significant influence but does not control and for variable interest entities (VIEs) where the Company has an equity investment, but is not the primary beneficiary. All material intercompany transactions have been eliminated in consolidation. Certain prior years' data presented in the financial statements have been reclassified to conform to the current year presentation.
The traditional operating companies, Southern Power, and certain of their subsidiaries are subject to regulation by the Federal Energy Regulatory Commission (FERC), and the traditional operating companies are also subject to regulation by their respective state public service commissions (PSC). The companies follow generally accepted accounting principles (GAAP) in the U.S. and comply with the accounting policies and practices prescribed by their respective commissions. The preparation of financial statements in conformity with GAAP requires the use of estimates, and the actual results may differ from those estimates.
Regulatory Assets and Liabilities
The traditional operating companies are subject to the provisions of the Financial Accounting Standards Board in accounting for the effects of rate regulation. Regulatory assets represent probable future revenues associated with certain costs that are expected to be recovered from customers through the ratemaking process. Regulatory liabilities represent probable future reductions in revenues associated with amounts that are expected to be credited to customers through the ratemaking process.
II-55
NOTES (continued)
Southern Company and Subsidiary Companies 2013 Annual Report
Regulatory assets and (liabilities) reflected in the balance sheets at December 31 relate to:
|
2013
|
|
2012
|
|
Note
|
|||||
|
(in millions)
|
|||||||||
|
Deferred income tax charges
|
$
|
1,376
|
|
$
|
1,318
|
|
(a)
|
||
|
Deferred income tax charges — Medicare subsidy
|
65
|
|
72
|
|
(j)
|
||||
|
Asset retirement obligations-asset
|
145
|
|
141
|
|
(a,h)
|
||||
|
Asset retirement obligations-liability
|
(139
|
)
|
(71
|
)
|
(a,h)
|
||||
|
Other cost of removal obligations
|
(1,289
|
)
|
(1,225
|
)
|
(a)
|
||||
|
Deferred income tax credits
|
(203
|
)
|
(212
|
)
|
(a)
|
||||
|
Loss on reacquired debt
|
293
|
|
309
|
|
(b)
|
||||
|
Vacation pay
|
171
|
|
165
|
|
(c,h)
|
||||
|
Under recovered regulatory clause revenues
|
70
|
|
38
|
|
(d)
|
||||
|
Property damage reserves
|
(191
|
)
|
(193
|
)
|
(g)
|
||||
|
Cancelled construction projects
|
70
|
|
65
|
|
(m)
|
||||
|
Power purchase agreement charges
|
180
|
|
138
|
|
(h,n)
|
||||
|
Fuel-hedging-asset
|
58
|
|
118
|
|
(h,o)
|
||||
|
Other regulatory assets
|
337
|
|
276
|
|
(f)
|
||||
|
Environmental remediation-asset
|
62
|
|
74
|
|
(g,h)
|
||||
|
Other regulatory liabilities
|
(126
|
)
|
(100
|
)
|
(b,l,i)
|
||||
|
Kemper IGCC* regulatory assets
|
76
|
|
36
|
|
(k)
|
||||
|
Kemper regulatory deferral
|
(91
|
)
|
—
|
|
(k)
|
||||
|
Retiree benefit plans
|
1,760
|
|
3,373
|
|
(e,h)
|
||||
|
Total regulatory assets (liabilities), net
|
$
|
2,624
|
|
$
|
4,322
|
|
|||
|
*
|
Integrated coal gasification combined cycle electric generating plant located in Kemper County, Mississippi (Kemper IGCC).
|
Note: The recovery and amortization periods for these regulatory assets and (liabilities) are as follows:
|
(a)
|
Asset retirement and removal assets and liabilities are recorded, deferred income tax assets are recovered, and deferred income tax liabilities are amortized over the related property lives, which may range up to
70 years
. Asset retirement and removal assets and liabilities will be settled and trued up following completion of the related activities. At
December 31, 2013
, other cost of removal obligations included
$43 million
that will be amortized over the
three
-year period from January 2014 through December 2016 in accordance with Georgia Power's Alternate Rate Plan for the years 2014 through 2016 (2013 ARP). See Note 3 under "Retail Regulatory Matters" for additional information.
|
|
(b)
|
Recovered over either the remaining life of the original issue or, if refinanced, over the remaining life of the new issue, which may range up to
50 years
.
|
|
(c)
|
Recorded as earned by employees and recovered as paid, generally within
one year
. This includes both vacation and banked holiday pay.
|
|
(d)
|
Recorded and recovered or amortized as approved or accepted by the appropriate state PSCs over periods generally not exceeding
10 years
.
|
|
(e)
|
Recovered and amortized over the average remaining service period which may range up to
15 years
. See Note 2 for additional information.
|
|
(f)
|
Comprised of numerous immaterial components including storm damage reserves, nuclear and generating plant outage costs, property taxes, post-retirement benefits, generation site selection/evaluation costs, power purchase agreement (PPA) capacity, demand side management cost deferrals, regulatory deferrals, building leases, net book value of retired generating units, Plant Daniel Units 3 and 4 regulatory assets, and other miscellaneous assets. These costs are recorded and recovered or amortized as approved by the appropriate state PSC over periods generally not exceeding, as applicable,
10 years
or over the remaining life of the asset but not beyond 2031.
|
|
(g)
|
Recovered as storm restoration and potential reliability-related expenses or environmental remediation expenses are incurred as approved by the appropriate state PSCs.
|
|
(h)
|
Not earning a return as offset in rate base by a corresponding asset or liability.
|
|
(i)
|
Recovered and amortized as approved or accepted by the appropriate state PSC over the life of the contract.
|
|
(j)
|
Recovered and amortized as approved by the appropriate state PSCs over periods not exceeding
15 years
.
|
|
(k)
|
For additional information, See Note 3 under "Integrated Coal Gasification Combined Cycle."
|
|
(l)
|
Comprised of immaterial components including over recovered regulatory clause revenues, state income tax credits, fuel-hedging liabilities, mine reclamation and remediation liabilities, PPA credits, and other liabilities that are recorded and recovered or amortized as approved by the appropriate state PSCs generally over periods not exceeding
10 years
, except for PPA credits that are recovered over the life of the PPA for periods up to
14 years
.
|
|
(m)
|
Costs associated with construction of environmental controls that will not be completed as a result of unit retirements and amortized over
nine years
in accordance with the 2013 ARP.
|
|
(n)
|
Recovered over the life of the PPA for periods up to
14 years
.
|
|
(o)
|
Recorded over the life of the underlying hedged purchase contracts, which generally do not exceed
five years
. Upon final settlement, actual costs incurred are recovered through the energy cost recovery clause.
|
In the event that a portion of a traditional operating company's operations is no longer subject to applicable accounting rules for rate regulation, such company would be required to write off to income or reclassify to accumulated other comprehensive income (OCI) related regulatory assets and liabilities that are not specifically recoverable through regulated rates. In addition, the
II-56
NOTES (continued)
Southern Company and Subsidiary Companies 2013 Annual Report
traditional operating company would be required to determine if any impairment to other assets, including plant, exists and write down the assets, if impaired, to their fair values. All regulatory assets and liabilities are to be reflected in rates. See Note 3 under "Retail Regulatory Matters – Alabama Power," "Retail Regulatory Matters – Georgia Power," and "Integrated Coal Gasification Combined Cycle" for additional information.
Revenues
Wholesale capacity revenues are generally recognized on a levelized basis over the appropriate contract period. Energy and other revenues are recognized as services are provided. Unbilled revenues related to retail sales are accrued at the end of each fiscal period. Electric rates for the traditional operating companies include provisions to adjust billings for fluctuations in fuel costs, fuel hedging, the energy component of purchased power costs, and certain other costs. Revenues are adjusted for differences between these actual costs and amounts billed in current regulated rates. Under or over recovered regulatory clause revenues are recorded in the balance sheets and are recovered or returned to customers through adjustments to the billing factors.
Southern Company's electric utility subsidiaries have a diversified base of customers. No single customer or industry comprises
10%
or more of revenues. For all periods presented, uncollectible accounts averaged less than
1%
of revenues.
Fuel Costs
Fuel costs are expensed as the fuel is used. Fuel expense generally includes fuel transportation costs and the cost of purchased emissions allowances as they are used. Fuel expense also includes the amortization of the cost of nuclear fuel and a charge, based on nuclear generation, for the permanent disposal of spent nuclear fuel. See Note 3 under "Nuclear Fuel Disposal Costs" for additional information.
Income and Other Taxes
Southern Company uses the liability method of accounting for deferred income taxes and provides deferred income taxes for all significant income tax temporary differences. Taxes that are collected from customers on behalf of governmental agencies to be remitted to these agencies are presented net on the statements of income.
In accordance with regulatory requirements, deferred federal investment tax credits (ITCs) for the traditional operating companies are amortized over the lives of the related property with such amortization normally applied as a credit to reduce depreciation in the statements of income. Credits amortized in this manner amounted to
$16 million
in
2013
,
$23 million
in
2012
, and
$19 million
in
2011
. At
December 31, 2013
, all ITCs available to reduce federal income taxes payable had not been utilized. The remaining ITCs will be carried forward and utilized in future years. Additionally, several subsidiaries have state ITCs, which are recognized in the period in which the credit is claimed on the state income tax return. A portion of the state ITCs available to reduce state income taxes payable was not utilized currently and will be carried forward and utilized in future years.
Under the American Recovery and Reinvestment Act of 2009, certain projects at Southern Power are eligible for ITCs or cash grants. Southern Power has elected to receive ITCs. The credits are recorded as a deferred credit, and are amortized to income tax expense over the life of the asset. Credits amortized in this manner amounted to
$5.5 million
and
$2.6 million
in
2013
and
2012
, respectively. Furthermore, the tax basis of the asset is reduced by
50%
of the credits received, resulting in a net deferred tax asset. Southern Power has elected to recognize the tax benefit of this basis difference as a reduction to income tax expense as costs are incurred during the construction period.
In accordance with accounting standards related to the uncertainty in income taxes, Southern Company recognizes tax positions that are "more likely than not" of being sustained upon examination by the appropriate taxing authorities. See Note 5 under "Unrecognized Tax Benefits" for additional information.
Property, Plant, and Equipment
Property, plant, and equipment is stated at original cost less any regulatory disallowances and impairments. Original cost includes: materials; labor; minor items of property; appropriate administrative and general costs; payroll-related costs such as taxes, pensions, and other benefits; and the interest capitalized and cost of equity funds used during construction.
II-57
NOTES (continued)
Southern Company and Subsidiary Companies 2013 Annual Report
The Southern Company system's property, plant, and equipment in service consisted of the following at December 31:
|
2013
|
2012
|
||||||
|
|
(in millions)
|
||||||
|
Generation
|
$
|
35,360
|
|
$
|
33,444
|
|
|
|
Transmission
|
9,289
|
|
8,747
|
|
|||
|
Distribution
|
16,499
|
|
15,958
|
|
|||
|
General
|
3,958
|
|
4,208
|
|
|||
|
Plant acquisition adjustment
|
123
|
|
124
|
|
|||
|
Utility plant in service
|
65,229
|
|
62,481
|
|
|||
|
Information technology equipment and software
|
242
|
|
230
|
|
|||
|
Communications equipment
|
437
|
|
430
|
|
|||
|
Other
|
113
|
|
110
|
|
|||
|
Other plant in service
|
792
|
|
770
|
|
|||
|
Total plant in service
|
$
|
66,021
|
|
$
|
63,251
|
|
|
The cost of replacements of property, exclusive of minor items of property, is capitalized. The cost of maintenance, repairs, and replacement of minor items of property is charged to other operations and maintenance expenses as incurred or performed with the exception of nuclear refueling costs, which are recorded in accordance with specific state PSC orders. Alabama Power and Georgia Power defer and amortize nuclear refueling costs over the unit's operating cycle. The refueling cycles for Alabama Power and Georgia Power range from
18
to
24 months
for each unit. In accordance with a Georgia PSC order, Georgia Power deferred the costs of certain significant inspection costs for the combustion turbine units at Plant McIntosh and amortized such costs over
10 years
, which approximated the expected maintenance cycle of the units. All inspection costs were fully amortized in 2013.
Assets acquired under a capital lease are included in property, plant, and equipment and are further detailed in the table below:
|
Asset Balances at
December 31,
|
|||||||
|
2013
|
2012
|
||||||
|
(in millions)
|
|||||||
|
Office building
|
$
|
61
|
|
$
|
61
|
|
|
|
Nitrogen plant
|
83
|
|
—
|
|
|||
|
Computer-related equipment
|
62
|
|
58
|
|
|||
|
Gas pipeline
|
6
|
|
—
|
|
|||
|
Less: Accumulated amortization
|
(48
|
)
|
(39
|
)
|
|||
|
Balance, net of amortization
|
$
|
164
|
|
$
|
80
|
|
|
The amount of non-cash property additions recognized for the years ended
December 31, 2013
,
2012
, and
2011
was
$411 million
,
$524 million
, and
$929 million
, respectively. These amounts are comprised of construction-related accounts payable outstanding at each year end. Also, the amount of non-cash property additions associated with capitalized leases for the years ended December 31, 2013, 2012, and 2011 were
$107 million
,
$14 million
, and
$21 million
, respectively.
Acquisitions
Southern Power acquires generation assets as part of its overall growth strategy. Southern Power accounts for business acquisitions from non-affiliates as business combinations. Accordingly, Southern Power has included these operations in the consolidated financial statements from the respective date of acquisition. The purchase price, including contingent consideration, if any, of each acquisition was allocated based on the fair value of the identifiable assets and liabilities. Assets acquired that do not meet the definition of a business in accordance with GAAP are accounted for as asset acquisitions. The purchase price of each asset acquisition was allocated based on the relative fair value of assets acquired. Any due diligence or transition costs incurred by Southern Power for successful or potential acquisitions have been expensed as incurred.
II-58
NOTES (continued)
Southern Company and Subsidiary Companies 2013 Annual Report
Acquisitions entered into or made by Southern Power and Turner Renewable Energy through Southern Turner Renewable Energy, LLC during 2013 and 2012 are detailed in the table below:
|
MW Capacity*
|
Year of Operation
|
Party Under PPA Contract for Plant Output
|
PPA Contract Period
|
Purchase Price
|
||
|
(millions)
|
||||||
|
Adobe Solar, LLC
(a)
|
20
|
|
2014
|
Southern California Edison Company
|
20 years
|
$100.0
|
|
Campo Verde Solar, LLC
(b)
|
139
|
|
2013
|
San Diego Gas & Electric Company
|
20 years
|
$136.6
|
|
Spectrum Nevada Solar, LLC
(c)
|
30
|
|
2013
|
Nevada Power Company
|
25 years
|
$17.6
|
|
Apex Nevada Solar, LLC
|
20
|
|
2012
|
Nevada Power Company
|
25 years
|
$102.0
|
* megawatt (MW)
(a) This acquisition is expected to occur in spring 2014, and the purchase price is expected to be
$100 million
.
(b) Under an engineering, procurement, and construction agreement, an additional
$355.5 million
was paid to a subsidiary of First Solar Inc. to complete the construction of the solar facility.
(c) Under an engineering, procurement, and construction agreement, an additional
$104 million
was paid to a subsidiary of Sun Edison, LLC to complete the construction of the solar facility.
Depreciation and Amortization
Depreciation of the original cost of utility plant in service is provided primarily by using composite straight-line rates, which approximated
3.3%
in
2013
,
3.2%
in
2012
, and
3.2%
in
2011
. Depreciation studies are conducted periodically to update the composite rates. These studies are filed with the respective state PSC and the FERC for the traditional operating companies. Accumulated depreciation for utility plant in service totaled
$22.5 billion
and
$21.5 billion
at
December 31, 2013
and
2012
, respectively. When property subject to composite depreciation is retired or otherwise disposed of in the normal course of business, its original cost, together with the cost of removal, less salvage, is charged to accumulated depreciation. For other property dispositions, the applicable cost and accumulated depreciation are removed from the balance sheet accounts, and a gain or loss is recognized. Minor items of property included in the original cost of the plant are retired when the related property unit is retired.
In 2009, the Georgia PSC approved an accounting order allowing Georgia Power to amortize a portion of its regulatory liability related to other cost of removal obligations. Under the terms of Georgia Power's Alternate Rate Plan for the years 2011 through 2013 (2010 ARP), Georgia Power amortized approximately
$31 million
annually of the remaining regulatory liability related to other cost of removal obligations over the
three years
ended December 31, 2013. Under the terms of the 2013 ARP, an additional
$43 million
will be amortized ratably over the
three years
ending December 31, 2016. See Note 3 under "Retail Regulatory Matters – Georgia Power – Rate Plans" for additional information.
Depreciation of the original cost of other plant in service is provided primarily on a straight-line basis over estimated useful lives ranging from
three
to
25 years
. Accumulated depreciation for other plant in service totaled
$513 million
and
$479 million
at
December 31, 2013
and
2012
, respectively.
Asset Retirement Obligations and Other Costs of Removal
Asset retirement obligations (ARO) are computed as the present value of the ultimate costs for an asset's future retirement and are recorded in the period in which the liability is incurred. The costs are capitalized as part of the related long-lived asset and depreciated over the asset's useful life. Each traditional operating company has received accounting guidance from the various state PSCs allowing the continued accrual of other future retirement costs for long-lived assets that it does not have a legal obligation to retire. Accordingly, the accumulated removal costs for these obligations are reflected in the balance sheets as a regulatory liability.
The liability for asset retirement obligations primarily relates to the decommissioning of the Southern Company system's nuclear facilities, Plants Farley, Hatch, and Vogtle. In addition, the Southern Company system has retirement obligations related to various landfill sites, ash ponds, asbestos removal, mine reclamation, and disposal of polychlorinated biphenyls in certain transformers. The Southern Company system also has identified retirement obligations related to certain transmission and distribution facilities, certain wireless communication towers, property associated with the Southern Company system's rail lines and natural gas pipelines, and certain structures authorized by the U.S. Army Corps of Engineers. However, liabilities for the removal of these assets have not been recorded because the settlement timing for the retirement obligations related to these assets is indeterminable and, therefore, the fair value of the retirement obligations cannot be reasonably estimated. A liability for these
II-59
NOTES (continued)
Southern Company and Subsidiary Companies 2013 Annual Report
asset retirement obligations will be recognized when sufficient information becomes available to support a reasonable estimation of the asset retirement obligation. The Company will continue to recognize in the statements of income allowed removal costs in accordance with regulatory treatment. Any differences between costs recognized in accordance with accounting standards related to asset retirement and environmental obligations and those reflected in rates are recognized as either a regulatory asset or liability, as ordered by the various state PSCs, and are reflected in the balance sheets. See "Nuclear Decommissioning" herein for additional information on amounts included in rates.
Details of the asset retirement obligations included in the balance sheets are as follows:
|
2013
|
2012
|
||||||
|
(in millions)
|
|||||||
|
Balance at beginning of year
|
$
|
1,757
|
|
$
|
1,344
|
|
|
|
Liabilities incurred
|
6
|
|
45
|
|
|||
|
Liabilities settled
|
(16
|
)
|
(16
|
)
|
|||
|
Accretion
|
97
|
|
112
|
|
|||
|
Cash flow revisions
|
174
|
|
272
|
|
|||
|
Balance at end of year
|
$
|
2,018
|
|
$
|
1,757
|
|
|
The increase in cash flow revisions in 2013 related to revisions to the nuclear decommissioning ARO based on Alabama Power's updated decommissioning study and Georgia Power's updated estimates for ash ponds in connection with the retirement of certain coal-fired generating units. The increase in cash flow revisions in 2012 related to updated estimates for some of the Southern Company system's ash ponds in connection with the retirement of certain coal-fired units and revisions to the nuclear decommissioning ARO based on Georgia Power's updated decommissioning study.
Nuclear Decommissioning
The U.S. Nuclear Regulatory Commission (NRC) requires licensees of commercial nuclear power reactors to establish a plan for providing reasonable assurance of funds for future decommissioning. Alabama Power and Georgia Power have external trust funds (Funds) to comply with the NRC's regulations. Use of the Funds is restricted to nuclear decommissioning activities. The Funds are managed and invested in accordance with applicable requirements of various regulatory bodies, including the NRC, the FERC, and state PSCs, as well as the Internal Revenue Service (IRS). The Funds are required to be held by one or more trustees with an individual net worth of at least
$100 million
. The FERC requires the Funds' managers to exercise the standard of care in investing that a "prudent investor" would use in the same circumstances. The FERC regulations also require that the Funds' managers may not invest in any securities of the utility for which it manages funds or its affiliates, except for investments tied to market indices or other mutual funds. While Southern Company is allowed to prescribe an overall investment policy to the Funds' managers, neither Southern Company nor its subsidiaries or affiliates are allowed to engage in the day-to-day management of the Funds or to mandate individual investment decisions. Day-to-day management of the investments in the Funds is delegated to unrelated third party managers with oversight by the management of Southern Company, Alabama Power, and Georgia Power. The Funds' managers are authorized, within certain investment guidelines, to actively buy and sell securities at their own discretion in order to maximize the return on the Funds' investments. The Funds are invested in a tax-efficient manner in a diversified mix of equity and fixed income securities and are reported as trading securities.
Southern Company records the investment securities held in the Funds at fair value, as disclosed in Note 10, as management believes that fair value best represents the nature of the Funds. Gains and losses, whether realized or unrealized, are recorded in the regulatory liability for asset retirement obligations in the balance sheets and are not included in net income or OCI. Fair value adjustments and realized gains and losses are determined on a specific identification basis.
The Funds at Georgia Power participate in a securities lending program through the managers of the Funds. Under this program, the Funds' investment securities are loaned to institutional investors for a fee. Securities so loaned are fully collateralized by cash, letters of credit, and securities issued or guaranteed by the U.S. government, its agencies, and the instrumentalities. As of
December 31, 2013
and
2012
, approximately
$32 million
and
$91 million
, respectively, of the fair market value of the Funds' securities were on loan and pledged to creditors under the Funds' managers' securities lending program. The fair value of the collateral received was approximately
$33 million
and
$93 million
at
December 31, 2013
and
2012
, respectively, and can only be sold by the borrower upon the return of the loaned securities. The collateral received is treated as a non-cash item in the statements of cash flows.
At
December 31, 2013
, investment securities in the Funds totaled
$1.5 billion
, consisting of equity securities of
$896 million
, debt securities of
$528 million
, and
$40 million
of other securities. At
December 31, 2012
, investment securities in the Funds
II-60
NOTES (continued)
Southern Company and Subsidiary Companies 2013 Annual Report
totaled
$1.3 billion
, consisting of equity securities of
$718 million
, debt securities of
$564 million
, and
$20 million
of other securities. These amounts include the investment securities pledged to creditors and collateral received and exclude receivables related to investment income and pending investment sales and payables related to pending investment purchases and the lending pool.
Sales of the securities held in the Funds resulted in cash proceeds of
$1.0 billion
,
$1.0 billion
, and
$2.2 billion
in
2013
,
2012
, and
2011
, respectively, all of which were reinvested. For
2013
, fair value increases, including reinvested interest and dividends and excluding the Funds' expenses, were
$181 million
, of which
$5 million
related to realized gains and
$119 million
related to unrealized gains related to securities held in the Funds at
December 31, 2013
. For
2012
, fair value increases, including reinvested interest and dividends and excluding the Funds' expenses, were
$137 million
, of which
$4 million
related to realized gains and
$75 million
related to unrealized gains related to securities held in the Funds at
December 31, 2012
. For
2011
, fair value increases, including reinvested interest and dividends and excluding the Funds' expenses, were
$29 million
, of which
$41 million
related to realized gains and
$60 million
related to unrealized losses related to securities held in the Funds at
December 31, 2011
. While the investment securities held in the Funds are reported as trading securities, the Funds continue to be managed with a long-term focus. Accordingly, all purchases and sales within the Funds are presented separately in the statements of cash flows as investing cash flows, consistent with the nature of and purpose for which the securities were acquired.
For Alabama Power, amounts previously recorded in internal reserves are being transferred into the Funds over periods approved by the Alabama PSC. The NRC's minimum external funding requirements are based on a generic estimate of the cost to decommission only the radioactive portions of a nuclear unit based on the size and type of reactor. Alabama Power and Georgia Power have filed plans with the NRC designed to ensure that, over time, the deposits and earnings of the Funds will provide the minimum funding amounts prescribed by the NRC.
At
December 31, 2013
and
2012
, the accumulated provisions for decommissioning were as follows:
|
External Trust Funds
|
Internal Reserves
|
Total
|
|||||||||||||||||||
|
2013
|
|
2012
|
|
2013
|
|
2012
|
|
2013
|
|
2012
|
|
||||||||||
|
|
(in millions)
|
||||||||||||||||||||
|
Plant Farley
|
$
|
713
|
|
$
|
604
|
|
$
|
21
|
|
$
|
22
|
|
$
|
734
|
|
$
|
626
|
|
|||
|
Plant Hatch
|
469
|
|
435
|
|
—
|
|
—
|
|
469
|
|
435
|
|
|||||||||
|
Plant Vogtle Units 1 and 2
|
277
|
|
256
|
|
—
|
|
—
|
|
277
|
|
256
|
|
|||||||||
Site study cost is the estimate to decommission a specific facility as of the site study year. The decommissioning cost estimates are based on prompt dismantlement and removal of the plant from service. The actual decommissioning costs may vary from these estimates because of changes in the assumed date of decommissioning, changes in NRC requirements, or changes in the assumptions used in making these estimates. The estimated costs of decommissioning as of
December 31, 2013
based on the most current studies, which were performed in 2013 for Alabama Power's Plant Farley and in 2012 for the Georgia Power plants, were as follows for Alabama Power's Plant Farley and Georgia Power's ownership interests in Plant Hatch and Plant Vogtle Units 1 and 2:
|
Plant Farley
|
Plant Hatch
|
Plant Vogtle
Units 1 and 2
|
|||||||||
|
Decommissioning periods:
|
|||||||||||
|
Beginning year
|
2037
|
|
2034
|
|
2047
|
|
|||||
|
Completion year
|
2076
|
|
2068
|
|
2072
|
|
|||||
|
|
(in millions)
|
||||||||||
|
Site study costs:
|
|||||||||||
|
Radiated structures
|
$
|
1,362
|
|
$
|
680
|
|
$
|
568
|
|
||
|
Non-radiated structures
|
80
|
|
51
|
|
76
|
|
|||||
|
Total site study costs
|
$
|
1,442
|
|
$
|
731
|
|
$
|
644
|
|
||
For ratemaking purposes, Alabama Power's decommissioning costs are based on the site study, and Georgia Power's decommissioning costs are based on the NRC generic estimate to decommission the radioactive portion of the facilities and the site study estimate for spent fuel management as of 2012. The Georgia PSC approved annual decommissioning cost for ratemaking of
$2 million
for Plant Hatch for 2011 through 2013. Under the 2013 ARP, the annual decommissioning cost through 2016 for ratemaking is
$4 million
and
$2 million
for Plant Hatch and Plant Vogtle Units 1 and 2, respectively. Georgia Power
II-61
NOTES (continued)
Southern Company and Subsidiary Companies 2013 Annual Report
expects the Georgia PSC to periodically review and adjust, if necessary, the amounts collected in rates for nuclear decommissioning costs. Significant assumptions used to determine these costs for ratemaking were an inflation rate of
4.5%
and
2.4%
for Alabama Power and Georgia Power, respectively, and a trust earnings rate of
7.0%
and
4.4%
for Alabama Power and Georgia Power, respectively.
Amounts previously contributed to the Funds for Plant Farley are currently projected to be adequate to meet the decommissioning obligations. Alabama Power will continue to provide site specific estimates of the decommissioning costs and related projections of funds in the external trust to the Alabama PSC and, if necessary, would seek the Alabama PSC's approval to address any changes in a manner consistent with NRC and other applicable requirements.
Allowance for Funds Used During Construction and Interest Capitalized
In accordance with regulatory treatment, the traditional operating companies record allowance for funds used during construction (AFUDC), which represents the estimated debt and equity costs of capital funds that are necessary to finance the construction of new regulated facilities. While cash is not realized currently from such allowance, AFUDC increases the revenue requirement and is recovered over the service life of the plant through a higher rate base and higher depreciation. The equity component of AFUDC is not included in calculating taxable income. Interest related to the construction of new facilities not included in the traditional operating companies' regulated rates is capitalized in accordance with standard interest capitalization requirements. AFUDC and interest capitalized, net of income taxes were
15.0%
,
8.2%
, and
9.1%
of net income for
2013
,
2012
, and
2011
, respectively.
Cash payments for interest totaled
$759 million
,
$803 million
, and
$832 million
in
2013
,
2012
, and
2011
, respectively, net of amounts capitalized of
$92 million
,
$83 million
, and
$78 million
, respectively.
Impairment of Long-Lived Assets and Intangibles
Southern Company evaluates long-lived assets for impairment when events or changes in circumstances indicate that the carrying value of such assets may not be recoverable. The determination of whether an impairment has occurred is based on either a specific regulatory disallowance or an estimate of undiscounted future cash flows attributable to the assets, as compared with the carrying value of the assets. If an impairment has occurred, the amount of the impairment recognized is determined by either the amount of regulatory disallowance or by estimating the fair value of the assets and recording a loss if the carrying value is greater than the fair value. For assets identified as held for sale, the carrying value is compared to the estimated fair value less the cost to sell in order to determine if an impairment loss is required. Until the assets are disposed of, their estimated fair value is re-evaluated when circumstances or events change.
Storm Damage Reserves
Each traditional operating company maintains a reserve to cover the cost of damages from major storms to its transmission and distribution lines and generally the cost of uninsured damages to its generation facilities and other property. In accordance with their respective state PSC orders, the traditional operating companies accrued
$28 million
in
2013
and
2012
. Alabama Power, Gulf Power, and Mississippi Power also have authority based on orders from their state PSCs to accrue certain additional amounts as circumstances warrant. In
2013
and
2012
, there were no such additional accruals. See Note 3 under "Retail Regulatory Matters – Alabama Power – Natural Disaster Reserve" for additional information regarding Alabama Power's natural disaster reserve.
Leveraged Leases
Southern Company has several leveraged lease agreements, with original terms ranging up to
45 years
, which relate to international and domestic energy generation, distribution, and transportation assets. Southern Company receives federal income tax deductions for depreciation and amortization, as well as interest on long-term debt related to these investments. The Company reviews all important lease assumptions at least annually, or more frequently if events or changes in circumstances indicate that a change in assumptions has occurred or may occur. These assumptions include the effective tax rate, the residual value, the credit quality of the lessees, and the timing of expected tax cash flows.
II-62
NOTES (continued)
Southern Company and Subsidiary Companies 2013 Annual Report
Southern Company's net investment in domestic and international leveraged leases consists of the following at December 31:
|
2013
|
|
2012
|
|
||||
|
|
(in millions)
|
||||||
|
Net rentals receivable
|
$
|
1,440
|
|
$
|
1,214
|
|
|
|
Unearned income
|
(775
|
)
|
(544
|
)
|
|||
|
Investment in leveraged leases
|
665
|
|
670
|
|
|||
|
Deferred taxes from leveraged leases
|
(287
|
)
|
(278
|
)
|
|||
|
Net investment in leveraged leases
|
$
|
378
|
|
$
|
392
|
|
|
A summary of the components of income from the leveraged leases follows:
|
2013
|
|
2012
|
|
2011
|
|
||||||
|
|
(in millions)
|
||||||||||
|
Pretax leveraged lease income (loss)
|
$
|
(5
|
)
|
$
|
21
|
|
$
|
25
|
|
||
|
Income tax expense
|
2
|
|
(8
|
)
|
(9
|
)
|
|||||
|
Net leveraged lease income (loss)
|
$
|
(3
|
)
|
$
|
13
|
|
$
|
16
|
|
||
Cash and Cash Equivalents
For purposes of the financial statements, temporary cash investments are considered cash equivalents. Temporary cash investments are securities with original maturities of
90 days
or less.
Materials and Supplies
Generally, materials and supplies include the average cost of transmission, distribution, and generating plant materials. Materials are charged to inventory when purchased and then expensed or capitalized to plant, as appropriate, at weighted average cost when installed.
Fuel Inventory
Fuel inventory includes the average cost of coal, natural gas, oil, transportation, and emissions allowances. Fuel is charged to inventory when purchased and then expensed, at weighted average cost, as used and recovered by the traditional operating companies through fuel cost recovery rates approved by each state PSC. Emissions allowances granted by the U.S. Environmental Protection Agency (EPA) are included in inventory at zero cost.
Financial Instruments
Southern Company and its subsidiaries use derivative financial instruments to limit exposure to fluctuations in interest rates, the prices of certain fuel purchases, electricity purchases and sales, and occasionally foreign currency exchange rates. All derivative financial instruments are recognized as either assets or liabilities (included in "Other" or shown separately as "Risk Management Activities") and are measured at fair value. See Note 10 for additional information. Substantially all of the Southern Company system's bulk energy purchases and sales contracts that meet the definition of a derivative are excluded from fair value accounting requirements because they qualify for the "normal" scope exception, and are accounted for under the accrual method. Other derivative contracts qualify as cash flow hedges of anticipated transactions or are recoverable through the traditional operating companies' fuel-hedging programs. This results in the deferral of related gains and losses in OCI or regulatory assets and liabilities, respectively, until the hedged transactions occur. Any ineffectiveness arising from cash flow hedges is recognized currently in net income. Other derivative contracts are marked to market through current period income and are recorded on a net basis in the statements of income. See Note 11 for additional information.
The Company does not offset fair value amounts recognized for multiple derivative instruments executed with the same counterparty under a master netting arrangement. At
December 31, 2013
, the amount included in accounts payable in the balance sheets that the Company has recognized for the obligation to return cash collateral arising from derivative instruments was immaterial.
Southern Company is exposed to losses related to financial instruments in the event of counterparties' nonperformance. The Company has established controls to determine and monitor the creditworthiness of counterparties in order to mitigate the Company's exposure to counterparty credit risk.
II-63
NOTES (continued)
Southern Company and Subsidiary Companies 2013 Annual Report
Comprehensive Income
The objective of comprehensive income is to report a measure of all changes in common stock equity of an enterprise that result from transactions and other economic events of the period other than transactions with owners. Comprehensive income consists of net income, changes in the fair value of qualifying cash flow hedges and marketable securities, certain changes in pension and other postretirement benefit plans, reclassifications for amounts included in net income, and dividends on preferred and preference stock of subsidiaries.
Accumulated OCI (loss) balances, net of tax effects, were as follows:
|
Qualifying
Hedges
|
Marketable
Securities
|
Pension and Other
Postretirement
Benefit Plans
|
Accumulated Other
Comprehensive
Income (Loss)
|
||||||||||||
|
|
(in millions)
|
||||||||||||||
|
Balance at December 31, 2012
|
$
|
(45
|
)
|
$
|
3
|
|
$
|
(81
|
)
|
$
|
(123
|
)
|
|||
|
Current period change
|
9
|
|
(3
|
)
|
42
|
|
48
|
|
|||||||
|
Balance at December 31, 2013
|
$
|
(36
|
)
|
$
|
—
|
|
$
|
(39
|
)
|
$
|
(75
|
)
|
|||
2. RETIREMENT BENEFITS
Southern Company has a defined benefit, trusteed, pension plan covering substantially all employees. This qualified pension plan is funded in accordance with requirements of the Employee Retirement Income Security Act of 1974, as amended (ERISA). No contributions were made to the qualified pension plan during 2013.
No
mandatory contributions to the qualified pension plan are anticipated for the year ending December 31, 2014. Southern Company also provides certain defined benefit pension plans for a selected group of management and highly compensated employees. Benefits under these non-qualified pension plans are funded on a cash basis. In addition, Southern Company provides certain medical care and life insurance benefits for retired employees through other postretirement benefit plans. The traditional operating companies fund related other postretirement trusts to the extent required by their respective regulatory commissions. For the year ending December 31, 2014, other postretirement trust contributions are expected to total approximately
$13 million
.
Actuarial Assumptions
The weighted average rates assumed in the actuarial calculations used to determine both the benefit obligations as of the measurement date and the net periodic costs for the pension and other postretirement benefit plans for the following year are presented below. Net periodic benefit costs were calculated i
n 2010 for the 2011 plan year using discount rates for the pension plans and the other postretirement benefit plans of
5.52%
and
5.40%
, respectively, and an annual salary increase of
3.84%
.
|
2013
|
2012
|
2011
|
||||||
|
Discount rate:
|
||||||||
|
Pension plans
|
5.02
|
%
|
4.26
|
%
|
4.98
|
%
|
||
|
Other postretirement benefit plans
|
4.85
|
|
4.05
|
|
4.88
|
|
||
|
Annual salary increase
|
3.59
|
|
3.59
|
|
3.84
|
|
||
|
Long-term return on plan assets:
|
||||||||
|
Pension plans
|
8.20
|
|
8.20
|
|
8.45
|
|
||
|
Other postretirement benefit plans
|
7.13
|
|
7.29
|
|
7.39
|
|
||
The Company estimates the expected rate of return on pension plan and other postretirement benefit plan assets using a financial model to project the expected return on each current investment portfolio. The analysis projects an expected rate of return on each of seven different asset classes in order to arrive at the expected return on the entire portfolio relying on each trust's target asset allocation and reasonable capital market assumptions. The financial model is based on four key inputs: anticipated returns by asset class (based in part on historical returns), each trust's target asset allocation, an anticipated inflation rate, and the projected impact of a periodic rebalancing of each trust's portfolio.
II-64
NOTES (continued)
Southern Company and Subsidiary Companies 2013 Annual Report
An additional assumption used in measuring the accumulated other postretirement benefit obligations (APBO) was a weighted average medical care cost trend rate of
7.00%
for 2014, decreasing gradually to
5.00%
through the year
2021
and remaining at that level thereafter. An annual increase or decrease in the assumed medical care cost trend rate of
1%
would affect the APBO and the service and interest cost components at
December 31, 2013
as follows:
|
1 Percent
Increase
|
1 Percent
Decrease
|
||||||
|
|
(in millions)
|
||||||
|
Benefit obligation
|
$
|
103
|
|
$
|
(88
|
)
|
|
|
Service and interest costs
|
5
|
|
(4
|
)
|
|||
Pension Plans
The total accumulated benefit obligation for the pension plans was
$8.1 billion
at
December 31, 2013
and
$8.5 billion
at
December 31, 2012
. Changes in the projected benefit obligations and the fair value of plan assets during the plan years ended
December 31, 2013
and
2012
were as follows:
|
2013
|
2012
|
||||||
|
(in millions)
|
|||||||
|
Change in benefit obligation
|
|||||||
|
Benefit obligation at beginning of year
|
$
|
9,302
|
|
$
|
8,079
|
|
|
|
Service cost
|
232
|
|
198
|
|
|||
|
Interest cost
|
389
|
|
393
|
|
|||
|
Benefits paid
|
(357
|
)
|
(336
|
)
|
|||
|
Actuarial (gain) loss
|
(703
|
)
|
968
|
|
|||
|
Balance at end of year
|
8,863
|
|
9,302
|
|
|||
|
Change in plan assets
|
|||||||
|
Fair value of plan assets at beginning of year
|
7,953
|
|
6,800
|
|
|||
|
Actual return on plan assets
|
1,098
|
|
1,010
|
|
|||
|
Employer contributions
|
39
|
|
479
|
|
|||
|
Benefits paid
|
(357
|
)
|
(336
|
)
|
|||
|
Fair value of plan assets at end of year
|
8,733
|
|
7,953
|
|
|||
|
Accrued liability
|
$
|
(130
|
)
|
$
|
(1,349
|
)
|
|
At
December 31, 2013
, the projected benefit obligations for the qualified and non-qualified pension plans were
$8.3 billion
and
$549 million
, respectively. All pension plan assets are related to the qualified pension plan.
Amounts recognized in the balance sheets at
December 31, 2013
and
2012
related to the Company's pension plans consist of the following:
|
2013
|
2012
|
||||||
|
(in millions)
|
|||||||
|
Prepaid pension costs
|
$
|
419
|
|
$
|
—
|
|
|
|
Other regulatory assets, deferred
|
1,651
|
|
3,013
|
|
|||
|
Other current liabilities
|
(40
|
)
|
(37
|
)
|
|||
|
Employee benefit obligations
|
(509
|
)
|
(1,312
|
)
|
|||
|
Accumulated OCI
|
64
|
|
125
|
|
|||
II-65
NOTES (continued)
Southern Company and Subsidiary Companies 2013 Annual Report
Presented below are the amounts included in accumulated OCI and regulatory assets at
December 31, 2013
and
2012
related to the defined benefit pension plans that had not yet been recognized in net periodic pension cost along with the estimated amortization of such amounts for
2014
.
|
Prior Service Cost
|
Net (Gain) Loss
|
||||||
|
(in millions)
|
|||||||
|
Balance at December 31, 2013:
|
|||||||
|
Accumulated OCI
|
$
|
5
|
|
$
|
59
|
|
|
|
Regulatory assets
|
75
|
|
1,575
|
|
|||
|
Total
|
$
|
80
|
|
$
|
1,634
|
|
|
|
Balance at December 31, 2012:
|
|||||||
|
Accumulated OCI
|
$
|
7
|
|
$
|
118
|
|
|
|
Regulatory assets
|
100
|
|
2,913
|
|
|||
|
Total
|
$
|
107
|
|
$
|
3,031
|
|
|
|
Estimated amortization in net periodic pension cost in 2014:
|
|||||||
|
Accumulated OCI
|
$
|
1
|
|
$
|
4
|
|
|
|
Regulatory assets
|
25
|
|
106
|
|
|||
|
Total
|
$
|
26
|
|
$
|
110
|
|
|
The components of OCI and the changes in the balance of regulatory assets related to the defined benefit pension plans for the years ended
December 31, 2013
and
2012
are presented in the following table:
|
Accumulated
OCI
|
Regulatory Assets
|
||||||
|
(in millions)
|
|||||||
|
Balance at December 31, 2011
|
$
|
109
|
|
$
|
2,614
|
|
|
|
Net loss
|
21
|
|
519
|
|
|||
|
Reclassification adjustments:
|
|||||||
|
Amortization of prior service costs
|
(1
|
)
|
(29
|
)
|
|||
|
Amortization of net gain (loss)
|
(4
|
)
|
(91
|
)
|
|||
|
Total reclassification adjustments
|
(5
|
)
|
(120
|
)
|
|||
|
Total change
|
16
|
|
399
|
|
|||
|
Balance at December 31, 2012
|
$
|
125
|
|
$
|
3,013
|
|
|
|
Net gain
|
(52
|
)
|
(1,145
|
)
|
|||
|
Change in prior service costs
|
—
|
|
1
|
|
|||
|
Reclassification adjustments:
|
|||||||
|
Amortization of prior service costs
|
(1
|
)
|
(26
|
)
|
|||
|
Amortization of net gain (loss)
|
(8
|
)
|
(192
|
)
|
|||
|
Total reclassification adjustments
|
(9
|
)
|
(218
|
)
|
|||
|
Total change
|
(61
|
)
|
(1,362
|
)
|
|||
|
Balance at December 31, 2013
|
$
|
64
|
|
$
|
1,651
|
|
|
II-66
NOTES (continued)
Southern Company and Subsidiary Companies 2013 Annual Report
Components of net periodic pension cost were as follows:
|
2013
|
2012
|
2011
|
|||||||||
|
(in millions)
|
|||||||||||
|
Service cost
|
$
|
232
|
|
$
|
198
|
|
$
|
184
|
|
||
|
Interest cost
|
389
|
|
393
|
|
389
|
|
|||||
|
Expected return on plan assets
|
(603
|
)
|
(581
|
)
|
(607
|
)
|
|||||
|
Recognized net loss
|
200
|
|
95
|
|
21
|
|
|||||
|
Net amortization
|
27
|
|
30
|
|
32
|
|
|||||
|
Net periodic pension cost
|
$
|
245
|
|
$
|
135
|
|
$
|
19
|
|
||
Net periodic pension cost is the sum of service cost, interest cost, and other costs netted against the expected return on plan assets. The expected return on plan assets is determined by multiplying the expected rate of return on plan assets and the market-related value of plan assets. In determining the market-related value of plan assets, the Company has elected to amortize changes in the market value of all plan assets over
five
years rather than recognize the changes immediately. As a result, the accounting value of plan assets that is used to calculate the expected return on plan assets differs from the current fair value of the plan assets.
Future benefit payments reflect expected future service and are estimated based on assumptions used to measure the projected benefit obligation for the pension plans. At
December 31, 2013
, estimated benefit payments were as follows:
|
Benefit Payments
|
|||
|
(in millions)
|
|||
|
2014
|
$
|
399
|
|
|
2015
|
422
|
|
|
|
2016
|
446
|
|
|
|
2017
|
471
|
|
|
|
2018
|
492
|
|
|
|
2019 to 2023
|
2,795
|
|
|
Other Postretirement Benefits
Changes in the APBO and in the fair value of plan assets during the plan years ended
December 31, 2013
and
2012
were as follows:
|
2013
|
2012
|
||||||
|
(in millions)
|
|||||||
|
Change in benefit obligation
|
|||||||
|
Benefit obligation at beginning of year
|
$
|
1,872
|
|
$
|
1,787
|
|
|
|
Service cost
|
24
|
|
21
|
|
|||
|
Interest cost
|
74
|
|
85
|
|
|||
|
Benefits paid
|
(94
|
)
|
(99
|
)
|
|||
|
Actuarial (gain) loss
|
(200
|
)
|
71
|
|
|||
|
Retiree drug subsidy
|
6
|
|
7
|
|
|||
|
Balance at end of year
|
1,682
|
|
1,872
|
|
|||
|
Change in plan assets
|
|||||||
|
Fair value of plan assets at beginning of year
|
821
|
|
765
|
|
|||
|
Actual return on plan assets
|
129
|
|
93
|
|
|||
|
Employer contributions
|
39
|
|
55
|
|
|||
|
Benefits paid
|
(88
|
)
|
(92
|
)
|
|||
|
Fair value of plan assets at end of year
|
901
|
|
821
|
|
|||
|
Accrued liability
|
$
|
(781
|
)
|
$
|
(1,051
|
)
|
|
II-67
NOTES (continued)
Southern Company and Subsidiary Companies 2013 Annual Report
Amounts recognized in the balance sheets at
December 31, 2013
and
2012
related to the Company's other postretirement benefit plans consist of the following:
|
2013
|
2012
|
||||||
|
(in millions)
|
|||||||
|
Other regulatory assets, deferred
|
$
|
109
|
|
$
|
360
|
|
|
|
Other current liabilities
|
(4
|
)
|
(3
|
)
|
|||
|
Employee benefit obligations
|
(777
|
)
|
(1,048
|
)
|
|||
|
Other regulatory liabilities, deferred
|
(36
|
)
|
—
|
|
|||
|
Accumulated OCI
|
1
|
|
7
|
|
|||
Presented below are the amounts included in accumulated OCI and net regulatory assets (liabilities) at
December 31, 2013
and
2012
related to the other postretirement benefit plans that had not yet been recognized in net periodic other postretirement benefit cost along with the estimated amortization of such amounts for
2014
.
|
Prior Service
Cost
|
Net (Gain)
Loss
|
Transition
Obligation
|
|||||||||
|
(in millions)
|
|||||||||||
|
Balance at December 31, 2013:
|
|||||||||||
|
Accumulated OCI
|
$
|
—
|
|
$
|
1
|
|
$
|
—
|
|
||
|
Net regulatory assets (liabilities)
|
9
|
|
64
|
|
—
|
|
|||||
|
Total
|
$
|
9
|
|
$
|
65
|
|
$
|
—
|
|
||
|
Balance at December 31, 2012:
|
|||||||||||
|
Accumulated OCI
|
$
|
—
|
|
$
|
7
|
|
$
|
—
|
|
||
|
Net regulatory assets (liabilities)
|
13
|
|
342
|
|
5
|
|
|||||
|
Total
|
$
|
13
|
|
$
|
349
|
|
$
|
5
|
|
||
|
Estimated amortization as net periodic postretirement benefit cost in 2014:
|
|||||||||||
|
Accumulated OCI
|
$
|
—
|
|
$
|
—
|
|
$
|
—
|
|
||
|
Net regulatory assets (liabilities)
|
4
|
|
2
|
|
—
|
|
|||||
|
Total
|
$
|
4
|
|
$
|
2
|
|
$
|
—
|
|
||
II-68
NOTES (continued)
Southern Company and Subsidiary Companies 2013 Annual Report
The components of OCI, along with the changes in the balance of net regulatory assets (liabilities), related to the other postretirement benefit plans for the plan years ended
December 31, 2013
and
2012
are presented in the following table:
|
Accumulated
OCI
|
Net Regulatory
Assets (Liabilities)
|
||||||
|
(in millions)
|
|||||||
|
Balance at December 31, 2011
|
$
|
6
|
|
$
|
345
|
|
|
|
Net loss
|
1
|
|
35
|
|
|||
|
Reclassification adjustments:
|
|||||||
|
Amortization of transition obligation
|
—
|
|
(10
|
)
|
|||
|
Amortization of prior service costs
|
—
|
|
(4
|
)
|
|||
|
Amortization of net gain (loss)
|
—
|
|
(6
|
)
|
|||
|
Total reclassification adjustments
|
—
|
|
(20
|
)
|
|||
|
Total change
|
1
|
|
15
|
|
|||
|
Balance at December 31, 2012
|
$
|
7
|
|
$
|
360
|
|
|
|
Net gain
|
(6
|
)
|
(266
|
)
|
|||
|
Reclassification adjustments:
|
|||||||
|
Amortization of transition obligation
|
—
|
|
(5
|
)
|
|||
|
Amortization of prior service costs
|
—
|
|
(4
|
)
|
|||
|
Amortization of net gain (loss)
|
—
|
|
(12
|
)
|
|||
|
Total reclassification adjustments
|
—
|
|
(21
|
)
|
|||
|
Total change
|
(6
|
)
|
(287
|
)
|
|||
|
Balance at December 31, 2013
|
$
|
1
|
|
$
|
73
|
|
|
Components of the other postretirement benefit plans' net periodic cost were as follows:
|
2013
|
2012
|
2011
|
|||||||||
|
(in millions)
|
|||||||||||
|
Service cost
|
$
|
24
|
|
$
|
21
|
|
$
|
21
|
|
||
|
Interest cost
|
74
|
|
85
|
|
92
|
|
|||||
|
Expected return on plan assets
|
(56
|
)
|
(60
|
)
|
(64
|
)
|
|||||
|
Net amortization
|
21
|
|
20
|
|
20
|
|
|||||
|
Net periodic postretirement benefit cost
|
$
|
63
|
|
$
|
66
|
|
$
|
69
|
|
||
Future benefit payments, including prescription drug benefits, reflect expected future service and are estimated based on assumptions used to measure the APBO for the other postretirement benefit plans. Estimated benefit payments are reduced by drug subsidy receipts expected as a result of the Medicare Prescription Drug, Improvement, and Modernization Act of 2003 as follows:
|
Benefit Payments
|
Subsidy Receipts
|
Total
|
|||||||||
|
|
(in millions)
|
||||||||||
|
2014
|
$
|
110
|
|
$
|
(9
|
)
|
$
|
101
|
|
||
|
2015
|
115
|
|
(10
|
)
|
105
|
|
|||||
|
2016
|
120
|
|
(11
|
)
|
109
|
|
|||||
|
2017
|
124
|
|
(13
|
)
|
111
|
|
|||||
|
2018
|
130
|
|
(14
|
)
|
116
|
|
|||||
|
2019 to 2023
|
654
|
|
(75
|
)
|
579
|
|
|||||
II-69
NOTES (continued)
Southern Company and Subsidiary Companies 2013 Annual Report
Benefit Plan Assets
Pension plan and other postretirement benefit plan assets are managed and invested in accordance with all applicable requirements, including ERISA and the Internal Revenue Code of 1986, as amended (Internal Revenue Code). The Company's investment policies for both the pension plan and the other postretirement benefit plans cover a diversified mix of assets, including equity and fixed income securities, real estate, and private equity. Derivative instruments are used primarily to gain efficient exposure to the various asset classes and as hedging tools. The Company minimizes the risk of large losses primarily through diversification but also monitors and manages other aspects of risk.
The composition of the Company's pension plan and other postretirement benefit plan assets as of
December 31, 2013
and
2012
, along with the targeted mix of assets for each plan, is presented below:
|
Target
|
2013
|
2012
|
||||||
|
Pension plan assets:
|
||||||||
|
Domestic equity
|
26
|
%
|
31
|
%
|
28
|
%
|
||
|
International equity
|
25
|
|
25
|
|
24
|
|
||
|
Fixed income
|
23
|
|
23
|
|
27
|
|
||
|
Special situations
|
3
|
|
1
|
|
1
|
|
||
|
Real estate investments
|
14
|
|
14
|
|
13
|
|
||
|
Private equity
|
9
|
|
6
|
|
7
|
|
||
|
Total
|
100
|
%
|
100
|
%
|
100
|
%
|
||
|
Other postretirement benefit plan assets:
|
||||||||
|
Domestic equity
|
40
|
%
|
40
|
%
|
38
|
%
|
||
|
International equity
|
21
|
|
25
|
|
24
|
|
||
|
Domestic fixed income
|
25
|
|
24
|
|
28
|
|
||
|
Global fixed income
|
4
|
|
4
|
|
3
|
|
||
|
Special situations
|
1
|
|
—
|
|
—
|
|
||
|
Real estate investments
|
6
|
|
5
|
|
5
|
|
||
|
Private equity
|
3
|
|
2
|
|
2
|
|
||
|
Total
|
100
|
%
|
100
|
%
|
100
|
%
|
||
The investment strategy for plan assets related to the Company's qualified pension plan is to be broadly diversified across major asset classes. The asset allocation is established after consideration of various factors that affect the assets and liabilities of the pension plan including, but not limited to, historical and expected returns and interest rates, volatility, correlations of asset classes, the current level of assets and liabilities, and the assumed growth in assets and liabilities. Because a significant portion of the liability of the pension plan is long-term in nature, the assets are invested consistent with long-term investment expectations for return and risk. To manage the actual asset class exposures relative to the target asset allocation, the Company employs a formal rebalancing program. As additional risk management, external investment managers and service providers are subject to written guidelines to ensure appropriate and prudent investment practices.
Investment Strategies
Detailed below is a description of the investment strategies for each major asset category for the pension and other postretirement benefit plans disclosed above:
|
•
|
Domestic equity.
A mix of large and small capitalization stocks with generally an equal distribution of value and growth attributes, managed both actively and through passive index approaches.
|
|
•
|
International equity.
A mix of growth stocks and value stocks with both developed and emerging market exposure, managed both actively and through passive index approaches.
|
|
•
|
Fixed income.
A mix of domestic and international bonds.
|
|
•
|
Trust-owned life insurance (TOLI).
Investments of the Company's taxable trusts aimed at minimizing the impact of taxes on the portfolio.
|
|
•
|
Special situations.
Investments in opportunistic strategies with the objective of diversifying and enhancing returns and exploiting short-term inefficiencies as well as investments in promising new strategies of a longer-term nature.
|
II-70
NOTES (continued)
Southern Company and Subsidiary Companies 2013 Annual Report
|
•
|
Real estate investments.
Investments in traditional private market, equity-oriented investments in real properties (indirectly through pooled funds or partnerships) and in publicly traded real estate securities.
|
|
•
|
Private equity.
Investments in private partnerships that invest in private or public securities typically through privately-negotiated and/or structured transactions, including leveraged buyouts, venture capital, and distressed debt.
|
Benefit Plan Asset Fair Values
Following are the fair value measurements for the pension plan and the other postretirement benefit plan assets as of
December 31, 2013
and
2012
. The fair values presented are prepared in accordance with GAAP. For purposes of determining the fair value of the pension plan and other postretirement benefit plan assets and the appropriate level designation, management relies on information provided by the plan's trustee. This information is reviewed and evaluated by management with changes made to the trustee information as appropriate.
Valuation methods of the primary fair value measurements disclosed in the following tables are as follows:
|
•
|
Domestic and international equity.
Investments in equity securities such as common stocks, American depositary receipts, and real estate investment trusts that trade on a public exchange are classified as Level 1 investments and are valued at the closing price in the active market. Equity investments with unpublished prices (i.e. pooled funds) are valued as Level 2, when the underlying holdings used to value the investment are comprised of Level 1 or Level 2 equity securities.
|
|
•
|
Fixed income.
Investments in fixed income securities are generally classified as Level 2 investments and are valued based on prices reported in the market place. Additionally, the value of fixed income securities takes into consideration certain items such as broker quotes, spreads, yield curves, interest rates, and discount rates that apply to the term of a specific instrument.
|
|
•
|
TOLI.
Investments in TOLI policies are classified as Level 2 investments and are valued based on the underlying investments held in the policy's separate account. The underlying assets are equity and fixed income pooled funds that are comprised of Level 1 and Level 2 securities.
|
|
•
|
Real estate investments and private equity.
Investments in private equity and real estate are generally classified as Level 3 as the underlying assets typically do not have observable inputs. The fund manager values the assets using various inputs and techniques depending on the nature of the underlying investments. In the case of private equity, techniques may include purchase multiples for comparable transactions, comparable public company trading multiples, and discounted cash flow analysis. Real estate managers generally use prevailing market capitalization rates, recent sales of comparable investments, and independent third-party appraisals to value underlying real estate investments. The fair value of partnerships is determined by aggregating the value of the underlying assets.
|
II-71
NOTES (continued)
Southern Company and Subsidiary Companies 2013 Annual Report
The fair values of pension plan assets as of
December 31, 2013
and
2012
are presented below. These fair value measurements exclude cash, receivables related to investment income, pending investments sales, and payables related to pending investment purchases. Assets that are considered special situations investments, primarily real estate investments and private equities, are presented in the tables below based on the nature of the investment.
|
Fair Value Measurements Using
|
|||||||||||||||
|
Quoted Prices in Active Markets for Identical Assets
|
Significant
Other
Observable
Inputs
|
Significant
Unobservable
Inputs
|
|||||||||||||
|
As of December 31, 2013:
|
(Level 1)
|
(Level 2)
|
(Level 3)
|
Total
|
|||||||||||
|
(in millions)
|
|||||||||||||||
|
Assets:
|
|||||||||||||||
|
Domestic equity*
|
$
|
1,433
|
|
$
|
839
|
|
$
|
—
|
|
$
|
2,272
|
|
|||
|
International equity*
|
1,101
|
|
1,018
|
|
—
|
|
2,119
|
|
|||||||
|
Fixed income:
|
|||||||||||||||
|
U.S. Treasury, government, and agency bonds
|
—
|
|
599
|
|
—
|
|
599
|
|
|||||||
|
Mortgage- and asset-backed securities
|
—
|
|
156
|
|
—
|
|
156
|
|
|||||||
|
Corporate bonds
|
—
|
|
978
|
|
—
|
|
978
|
|
|||||||
|
Pooled funds
|
—
|
|
471
|
|
—
|
|
471
|
|
|||||||
|
Cash equivalents and other
|
1
|
|
223
|
|
—
|
|
224
|
|
|||||||
|
Real estate investments
|
260
|
|
—
|
|
1,000
|
|
1,260
|
|
|||||||
|
Private equity
|
—
|
|
—
|
|
571
|
|
571
|
|
|||||||
|
Total
|
$
|
2,795
|
|
$
|
4,284
|
|
$
|
1,571
|
|
$
|
8,650
|
|
|||
|
Liabilities:
|
|||||||||||||||
|
Derivatives
|
—
|
|
(3
|
)
|
—
|
|
(3
|
)
|
|||||||
|
Total
|
$
|
2,795
|
|
$
|
4,281
|
|
$
|
1,571
|
|
$
|
8,647
|
|
|||
|
*
|
Level 1 securities consist of actively traded stocks while Level 2 securities consist of pooled funds. Management believes that the portfolio is well-diversified with no significant concentrations of risk.
|
II-72
NOTES (continued)
Southern Company and Subsidiary Companies 2013 Annual Report
|
Fair Value Measurements Using
|
|||||||||||||||
|
Quoted Prices in Active Markets for Identical Assets
|
Significant
Other
Observable
Inputs
|
Significant
Unobservable
Inputs
|
|||||||||||||
|
As of December 31, 2012:
|
(Level 1)
|
(Level 2)
|
(Level 3)
|
Total
|
|||||||||||
|
|
(in millions)
|
||||||||||||||
|
Assets:
|
|||||||||||||||
|
Domestic equity*
|
$
|
1,163
|
|
$
|
670
|
|
$
|
—
|
|
$
|
1,833
|
|
|||
|
International equity*
|
912
|
|
979
|
|
—
|
|
1,891
|
|
|||||||
|
Fixed income:
|
|||||||||||||||
|
U.S. Treasury, government, and agency bonds
|
—
|
|
516
|
|
—
|
|
516
|
|
|||||||
|
Mortgage- and asset-backed securities
|
—
|
|
127
|
|
—
|
|
127
|
|
|||||||
|
Corporate bonds
|
—
|
|
876
|
|
3
|
|
879
|
|
|||||||
|
Pooled funds
|
—
|
|
399
|
|
—
|
|
399
|
|
|||||||
|
Cash equivalents and other
|
5
|
|
548
|
|
—
|
|
553
|
|
|||||||
|
Real estate investments
|
258
|
|
—
|
|
841
|
|
1,099
|
|
|||||||
|
Private equity
|
—
|
|
—
|
|
593
|
|
593
|
|
|||||||
|
Total
|
$
|
2,338
|
|
$
|
4,115
|
|
$
|
1,437
|
|
$
|
7,890
|
|
|||
|
*
|
Level 1 securities consist of actively traded stocks while Level 2 securities consist of pooled funds. Management believes that the portfolio is well-diversified with no significant concentrations of risk.
|
Changes in the fair value measurement of the Level 3 items in the pension plan assets valued using significant unobservable inputs for the years ended
December 31, 2013
and
2012
were as follows:
|
2013
|
2012
|
||||||||||||||
|
Real Estate Investments
|
Private Equity
|
Real Estate Investments
|
Private Equity
|
||||||||||||
|
(in millions)
|
|||||||||||||||
|
Beginning balance
|
$
|
841
|
|
$
|
593
|
|
$
|
782
|
|
$
|
582
|
|
|||
|
Actual return on investments:
|
|||||||||||||||
|
Related to investments held at year end
|
74
|
|
8
|
|
56
|
|
1
|
|
|||||||
|
Related to investments sold during the year
|
30
|
|
51
|
|
3
|
|
41
|
|
|||||||
|
Total return on investments
|
104
|
|
59
|
|
59
|
|
42
|
|
|||||||
|
Purchases, sales, and settlements
|
55
|
|
(81
|
)
|
—
|
|
(31
|
)
|
|||||||
|
Ending balance
|
$
|
1,000
|
|
$
|
571
|
|
$
|
841
|
|
$
|
593
|
|
|||
II-73
NOTES (continued)
Southern Company and Subsidiary Companies 2013 Annual Report
The fair values of other postretirement benefit plan assets as of
December 31, 2013
and
2012
are presented below. These fair value measurements exclude cash, receivables related to investment income, pending investments sales, and payables related to pending investment purchases. Assets that are considered special situations investments, primarily real estate investments and private equities, are presented in the tables below based on the nature of the investment.
|
Fair Value Measurements Using
|
|||||||||||||||
|
Quoted Prices in Active Markets for Identical Assets
|
Significant
Other
Observable
Inputs
|
Significant
Unobservable
Inputs
|
Total
|
||||||||||||
|
As of December 31, 2013:
|
(Level 1)
|
(Level 2)
|
(Level 3)
|
||||||||||||
|
(in millions)
|
|||||||||||||||
|
Assets:
|
|||||||||||||||
|
Domestic equity*
|
$
|
157
|
|
$
|
45
|
|
$
|
—
|
|
$
|
202
|
|
|||
|
International equity*
|
39
|
|
82
|
|
—
|
|
121
|
|
|||||||
|
Fixed income:
|
|||||||||||||||
|
U.S. Treasury, government, and agency bonds
|
—
|
|
34
|
|
—
|
|
34
|
|
|||||||
|
Mortgage- and asset-backed securities
|
—
|
|
6
|
|
—
|
|
6
|
|
|||||||
|
Corporate bonds
|
—
|
|
35
|
|
—
|
|
35
|
|
|||||||
|
Pooled funds
|
—
|
|
46
|
|
—
|
|
46
|
|
|||||||
|
Cash equivalents and other
|
—
|
|
19
|
|
—
|
|
19
|
|
|||||||
|
Trust-owned life insurance
|
—
|
|
369
|
|
—
|
|
369
|
|
|||||||
|
Real estate investments
|
10
|
|
—
|
|
36
|
|
46
|
|
|||||||
|
Private equity
|
—
|
|
—
|
|
20
|
|
20
|
|
|||||||
|
Total
|
$
|
206
|
|
$
|
636
|
|
$
|
56
|
|
$
|
898
|
|
|||
|
*
|
Level 1 securities consist of actively traded stocks while Level 2 securities consist of pooled funds. Management believes that the portfolio is well-diversified with no significant concentrations of risk.
|
II-74
NOTES (continued)
Southern Company and Subsidiary Companies 2013 Annual Report
|
Fair Value Measurements Using
|
|||||||||||||||
|
Quoted Prices in Active Markets for Identical Assets
|
Significant
Other
Observable
Inputs
|
Significant
Unobservable
Inputs
|
|||||||||||||
|
As of December 31, 2012:
|
(Level 1)
|
(Level 2)
|
(Level 3)
|
Total
|
|||||||||||
|
(in millions)
|
|||||||||||||||
|
Assets:
|
|||||||||||||||
|
Domestic equity*
|
$
|
140
|
|
$
|
43
|
|
$
|
—
|
|
$
|
183
|
|
|||
|
International equity*
|
33
|
|
75
|
|
—
|
|
108
|
|
|||||||
|
Fixed income:
|
|||||||||||||||
|
U.S. Treasury, government, and agency bonds
|
—
|
|
24
|
|
—
|
|
24
|
|
|||||||
|
Mortgage- and asset-backed securities
|
—
|
|
4
|
|
—
|
|
4
|
|
|||||||
|
Corporate bonds
|
—
|
|
31
|
|
—
|
|
31
|
|
|||||||
|
Pooled funds
|
—
|
|
42
|
|
—
|
|
42
|
|
|||||||
|
Cash equivalents and other
|
—
|
|
44
|
|
—
|
|
44
|
|
|||||||
|
Trust-owned life insurance
|
—
|
|
320
|
|
—
|
|
320
|
|
|||||||
|
Real estate investments
|
10
|
|
—
|
|
30
|
|
40
|
|
|||||||
|
Private equity
|
—
|
|
—
|
|
21
|
|
21
|
|
|||||||
|
Total
|
$
|
183
|
|
$
|
583
|
|
$
|
51
|
|
$
|
817
|
|
|||
|
*
|
Level 1 securities consist of actively traded stocks while Level 2 securities consist of pooled funds. Management believes that the portfolio is well-diversified with no significant concentrations of risk.
|
Changes in the fair value measurement of the Level 3 items in the other postretirement benefit plan assets valued using significant unobservable inputs for the years ended
December 31, 2013
and
2012
were as follows:
|
2013
|
2012
|
||||||||||||||
|
Real Estate Investments
|
Private Equity
|
Real Estate Investments
|
Private Equity
|
||||||||||||
|
(in millions)
|
|||||||||||||||
|
Beginning balance
|
$
|
30
|
|
$
|
21
|
|
$
|
30
|
|
$
|
23
|
|
|||
|
Actual return on investments:
|
|||||||||||||||
|
Related to investments held at year end
|
3
|
|
—
|
|
—
|
|
—
|
|
|||||||
|
Related to investments sold during the year
|
1
|
|
2
|
|
—
|
|
1
|
|
|||||||
|
Total return on investments
|
4
|
|
2
|
|
—
|
|
1
|
|
|||||||
|
Purchases, sales, and settlements
|
2
|
|
(3
|
)
|
—
|
|
(3
|
)
|
|||||||
|
Ending balance
|
$
|
36
|
|
$
|
20
|
|
$
|
30
|
|
$
|
21
|
|
|||
Employee Savings Plan
Southern Company also sponsors a 401(k) defined contribution plan covering substantially all employees. The Company provides an
85%
matching contribution on up to
6%
of an employee's base salary. Total matching contributions made to the plan for
2013
,
2012
, and
2011
were
$84 million
,
$82 million
, and
$78 million
, respectively.
3. CONTINGENCIES AND REGULATORY MATTERS
General Litigation Matters
Southern Company and its subsidiaries are subject to certain claims and legal actions arising in the ordinary course of business. In addition, the business activities of Southern Company's subsidiaries are subject to extensive governmental regulation related to public health and the environment, such as regulation of air emissions and water discharges. Litigation over environmental issues and claims of various types, including property damage, personal injury, common law nuisance, and citizen enforcement of
II-75
NOTES (continued)
Southern Company and Subsidiary Companies 2013 Annual Report
environmental requirements such as air quality and water standards, has increased generally throughout the U.S. In particular, personal injury, property damage, and other claims for damages alleged to have been caused by carbon dioxide (CO
2
) and other emissions, coal combustion residuals, and alleged exposure to hazardous materials, and/or requests for injunctive relief in connection with such matters, have become more frequent. The ultimate outcome of such pending or potential litigation against Southern Company and its subsidiaries cannot be predicted at this time; however, for current proceedings not specifically reported herein, management does not anticipate that the ultimate liabilities, if any, arising from such current proceedings would have a material effect on Southern Company's financial statements.
I
nsurance Recovery
Mirant Corporation (Mirant) was an energy company with businesses that included independent power projects and energy trading and risk management companies in the U.S. and other countries. Mirant was a wholly-owned subsidiary of Southern Company until its initial public offering in 2000. In 2001, Southern Company completed a spin-off to its stockholders of its remaining ownership, and Mirant became an independent corporate entity.
In 2003, Mirant and certain of its affiliates filed voluntary petitions for relief under Chapter 11 of the Bankruptcy Code. In 2005, Mirant, as a debtor in possession, and the unsecured creditors' committee filed a complaint against Southern Company. Later in 2005, this complaint was transferred to MC Asset Recovery, LLC (MC Asset Recovery) as part of Mirant's plan of reorganization.
In 2009, Southern Company entered into a settlement agreement with MC Asset Recovery to resolve this action. The settlement included an agreement where Southern Company paid MC Asset Recovery
$202 million
. Southern Company filed an insurance claim in 2009 to recover a portion of this settlement and received payments from its insurance provider of
$25 million
in June 2012 and
$15 million
on December 10, 2013. Additionally, legal fees related to these insurance settlements totaled approximately
$6 million
in 2012 and
$4 million
in 2013. As a result, the net reduction to expense presented as MC Asset Recovery insurance settlement in the statement of income was approximately
$19 million
in 2012 and
$11 million
in 2013.
Environmental Matters
New Source Review Actions
As part of a nationwide enforcement initiative against the electric utility industry which began in 1999, the EPA brought civil enforcement actions in federal district court against Alabama Power and Georgia Power alleging violations of the New Source Review (NSR) provisions of the Clean Air Act at certain coal-fired electric generating units, including units co-owned by Gulf Power and Mississippi Power. These civil actions seek penalties and injunctive relief, including orders requiring installation of the best available control technologies at the affected units. The case against Georgia Power (including claims related to a unit co-owned by Gulf Power) has been administratively closed in the U.S. District Court for the Northern District of Georgia since 2001. The case against Alabama Power (including claims involving a unit co-owned by Mississippi Power) has been actively litigated in the U.S. District Court for the Northern District of Alabama, resulting in a settlement in 2006 of the alleged NSR violations at Plant Miller; voluntary dismissal of certain claims by the EPA; and a grant of summary judgment for Alabama Power on all remaining claims and dismissal of the case with prejudice in 2011. On September 19, 2013, the U.S. Court of Appeals for the Eleventh Circuit affirmed in part and reversed in part the 2011 judgment in favor of Alabama Power, and the case has been transferred back to the U.S. District Court for the Northern District of Alabama for further proceedings.
Southern Company believes the traditional operating companies complied with applicable laws and regulations in effect at the time the work in question took place. The Clean Air Act authorizes maximum civil penalties of
$25,000
to
$37,500
per day, per violation, depending on the date of the alleged violation. An adverse outcome could require substantial capital expenditures that cannot be determined at this time and could possibly require payment of substantial penalties. Such expenditures could affect future results of operations, cash flows, and financial condition if such costs are not recovered through regulated rates. The ultimate outcome of these matters cannot be determined at this time.
Environmental Remediation
The Southern Company system must comply with environmental laws and regulations that cover the handling and disposal of waste and releases of hazardous substances. Under these various laws and regulations, the Southern Company system could incur substantial costs to clean up properties. The traditional operating companies have each received authority from their respective state PSCs to recover approved environmental compliance costs through regulatory mechanisms. These rates are adjusted annually or as necessary within limits approved by the state PSCs.
Georgia Power's environmental remediation liability as of
December 31, 2013
was
$18 million
. Georgia Power has been designated or identified as a potentially responsible party (PRP) at sites governed by the Georgia Hazardous Site Response Act and/or by the federal Comprehensive Environmental Response, Compensation, and Liability Act (CERCLA), including a site in
II-76
NOTES (continued)
Southern Company and Subsidiary Companies 2013 Annual Report
Brunswick, Georgia on the CERCLA National Priorities List (NPL). The parties have completed the removal of wastes from the Brunswick site as ordered by the EPA. Additional cleanup and claims for recovery of natural resource damages at this site or for the assessment and potential cleanup of other sites are anticipated.
Georgia Power and numerous other entities have been designated by the EPA as PRPs at the Ward Transformer Superfund site located in Raleigh, North Carolina. In 2011, the EPA issued a Unilateral Administrative Order (UAO) to Georgia Power and 22 other parties, ordering specific remedial action of certain areas at the site. Later in 2011, Georgia Power filed a response with the EPA stating it has sufficient cause to believe it is not a liable party under CERCLA. The EPA notified Georgia Power in 2011 that it is considering enforcement options against Georgia Power and other non-complying UAO recipients. If the EPA pursues enforcement actions and the court determines that a respondent failed to comply with the UAO without sufficient cause, the EPA may also seek civil penalties of up to
$37,500
per day for the violation and punitive damages of up to
three
times the costs incurred by the EPA as a result of the party's failure to comply with the UAO.
In addition to the EPA's action at this site, Georgia Power, along with many other parties, was sued in a private action by several existing PRPs for cost recovery related to the removal action. On February 1, 2013, the U.S. District Court for the Eastern District of North Carolina Western Division granted Georgia Power's summary judgment motion, ruling that Georgia Power has no liability in the private action. On May 10, 2013, the plaintiffs appealed the U.S. District Court for the Eastern District of North Carolina Western Division's order to the U.S. Court of Appeals for the Fourth Circuit.
The ultimate outcome of these matters will depend upon the success of defenses asserted, the ultimate number of PRPs participating in the cleanup, and numerous other factors and cannot be determined at this time; however, as a result of the regulatory recovery mechanisms, these matters are not expected to have a material impact on Southern Company's financial statements.
Gulf Power's environmental remediation liability includes estimated costs of environmental remediation projects of approximately
$50 million
as of
December 31, 2013
. These estimated costs relate to site closure criteria by the Florida Department of Environmental Protection (FDEP) for potential impacts to soil and groundwater from herbicide applications at Gulf Power substations. The schedule for completion of the remediation projects will be subject to FDEP approval. The projects have been approved by the Florida PSC for recovery through Gulf Power's environmental cost recovery clause; therefore, there was no impact on net income as a result of these liabilities.
The final outcome of these matters cannot be determined at this time. However, based on the currently known conditions at these sites and the nature and extent of activities relating to these sites, management does not believe that additional liabilities, if any, at these sites would be material to the financial statements
.
Nuclear Fuel Disposal Costs
Acting through the U.S. Department of Energy (DOE) and pursuant to the Nuclear Waste Policy Act of 1982, the U.S. government entered into contracts with Alabama Power and Georgia Power that require the DOE to dispose of spent nuclear fuel and high level radioactive waste generated at Plants Hatch and Farley and Plant Vogtle Units 1 and 2. The DOE failed to timely perform and has yet to commence the performance of its contractual and statutory obligation to dispose of spent nuclear fuel beginning no later than January 31, 1998. Consequently, Alabama Power and Georgia Power have pursued and continue to pursue legal remedies against the U.S. government for its partial breach of contract.
As a result of the first lawsuit, Georgia Power recovered approximately
$27 million
, based on its ownership interests, and Alabama Power recovered approximately
$17 million
, representing the vast majority of the Southern Company system's direct costs of the expansion of spent nuclear fuel storage facilities at Plants Farley and Hatch and Plant Vogtle Units 1 and 2 from 1998 through 2004. In April 2012, Alabama Power credited the award to cost of service for the benefit of customers. In July 2012, Georgia Power credited the award to accounts where the original costs were charged and used it to reduce rate base, fuel, and cost of service for the benefit of customers.
In 2008, Alabama Power and Georgia Power filed a second lawsuit against the U.S. government for the costs of continuing to store spent nuclear fuel at Plants Farley and Hatch and Plant Vogtle Units 1 and 2. Damages are being sought for the period from January 1, 2005 through December 31, 2010. Damages will continue to accumulate until the issue is resolved or storage is provided. No amounts have been recognized in the financial statements as of
December 31, 2013
for any potential recoveries from the second lawsuit. The final outcome of these matters cannot be determined at this time; however, no material impact on Southern Company's net income is expected.
An on-site dry storage facility at Plant Vogtle Units 1 and 2 began operation in October 2013. At Plants Hatch and Farley, on-site dry spent fuel storage facilities are also operational. Facilities at all plants can be expanded to accommodate spent fuel through the expected life of each plant.
II-77
NOTES (continued)
Southern Company and Subsidiary Companies 2013 Annual Report
Retail Regulatory Matters
Alabama Power
Retail Rate Adjustments
In 2011, the Alabama PSC issued an order to eliminate a tax-related adjustment under Alabama Power's rate structure effective with October 2011 billings. The elimination of this adjustment resulted in additional revenues of approximately
$31 million
for 2011. In accordance with the order, Alabama Power made additional accruals to the natural disaster reserve (NDR) in the fourth quarter 2011 of an amount equal to such additional 2011 revenues. The NDR was impacted as a result of operations and maintenance expenses incurred in connection with the 2011 storms in Alabama. See "Natural Disaster Reserve" below for additional information. The elimination of this adjustment resulted in additional revenues of approximately
$106 million
for
2012
.
Rate RSE
Alabama Power operates under a rate stabilization and equalization plan (Rate RSE) approved by the Alabama PSC. Alabama Power's Rate RSE adjustments are based on forward-looking information for the applicable upcoming calendar year. Rate adjustments for any
two
-year period, when averaged together, cannot exceed
4.0%
and any annual adjustment is limited to
5.0%
. If Alabama Power's actual retail return is above the allowed equity return range, customer refunds will be required; however, there is no provision for additional customer billings should the actual retail return fall below the allowed equity return range. Prior to 2014, retail rates remained unchanged when the retail return on common equity (ROE) was projected to be between
13.0%
and
14.5%
.
During 2013, the Alabama PSC held public proceedings regarding the operation and utilization of Rate RSE. On August 13, 2013, the Alabama PSC voted to issue a report on Rate RSE that found that Alabama Power's Rate RSE mechanism continues to be just and reasonable to customers and Alabama Power, but recommended Alabama Power modify Rate RSE as follows:
|
•
|
Eliminate the provision of Rate RSE establishing an allowed range of ROE.
|
|
•
|
Eliminate the provision of Rate RSE limiting Alabama Power's capital structure to an allowed equity ratio of
45%
.
|
|
•
|
Replace these
two
provisions with a provision that establishes rates based upon an allowed weighted cost of equity (WCE) range of
5.75%
to
6.21%
, with an adjusting point of
5.98%
. If calculated under the previous Rate RSE provisions, the resulting WCE would range from
5.85%
to
6.53%
, with an adjusting point of
6.19%
.
|
|
•
|
Provide eligibility for a performance-based adder of seven basis points, or
0.07%
, to the WCE adjusting point if Alabama Power (i) has an "A" credit rating equivalent with at least one of the recognized rating agencies or (ii) is in the top one-third of a designated customer value benchmark survey.
|
Substantially all other provisions of Rate RSE were unchanged.
On August 21, 2013, Alabama Power filed its consent to these recommendations with the Alabama PSC. The changes became effective for calendar year 2014. On November 27, 2013, Alabama Power made its Rate RSE submission to the Alabama PSC of projected data for calendar year 2014; projected earnings were within the specified WCE range and, therefore, retail rates under Rate RSE remained unchanged for 2014. In 2012 and 2013, retail rates under Rate RSE remained unchanged from 2011. Under the terms of Rate RSE, the maximum possible increase for 2015 is
5.00%
.
Rate CNP
Alabama Power's retail rates, approved by the Alabama PSC, provide for adjustments to recognize the placing of new generating facilities into retail service under rate certificated new plant (Rate CNP). Alabama Power may also recover retail costs associated with certificated PPAs under rate certificated new plant (Rate CNP PPA). There was no adjustment to Rate CNP PPA in 2012. On March 5, 2013, the Alabama PSC issued a consent order that Alabama Power leave in effect the current Rate CNP PPA factor for billings for the period April 1, 2013 through March 31, 2014. It is anticipated that no adjustment will be made to Rate CNP PPA in 2014. As of
December 31, 2013
, Alabama Power had an under recovered certificated PPA balance of
$18 million
, all of which is included in deferred under recovered regulatory clause revenues in the balance sheet.
In 2011, the Alabama PSC approved and certificated a PPA of approximately
200
MWs of energy from wind-powered generating facilities which became operational in December 2012. In September 2012, the Alabama PSC approved and certificated a second wind PPA of approximately
200
MWs which became operational in January 2014. The terms of the wind PPAs permit Alabama Power to use the energy and retire the associated environmental attributes in service of its customers or to sell environmental attributes, separately or bundled with energy.
Alabama Power has elected the normal purchase normal sale (NPNS) scope exception under the derivative accounting rules for its
two
wind PPAs, which total approximately
400
MWs. The NPNS
II-78
NOTES (continued)
Southern Company and Subsidiary Companies 2013 Annual Report
exception allows the PPAs to be recorded at a cost, rather than fair value, basis. The industry’s application of the NPNS exception to certain physical forward transactions in nodal markets is currently under review by the U.S. Securities and Exchange Commission (SEC) at the request of the electric utility industry. The outcome of the SEC’s review cannot now be determined. If Alabama Power is ultimately required to record these PPAs at fair value, an offsetting regulatory asset or regulatory liability will be recorded.
Alabama Power's retail rates, approved by the Alabama PSC also allows for the recovery of Alabama Power's retail costs associated with environmental laws, regulations, or other such mandates (Rate CNP Environmental). Rate CNP Environmental is based on forward-looking information and provides for the recovery of these costs pursuant to a factor that is calculated annually. Environmental costs to be recovered include operations and maintenance expenses, depreciation, and a return on certain invested capital. There was no adjustment to Rate CNP Environmental in 2012 or 2013. On August 13, 2013, the Alabama PSC approved Alabama Power's petition requesting a revision to Rate CNP Environmental that allows recovery of costs related to pre-2005 environmental assets previously being recovered through Rate RSE. The revenue impact as a result of this revision is estimated to be
$58 million
in 2014. On November 21, 2013, Alabama Power submitted calculations associated with its cost of complying with environmental mandates, as provided under Rate CNP Environmental. The filing reflected a projected unrecovered retail revenue requirement for environmental compliance of approximately
$72 million
, which is to be recovered in the billing months of January 2014 through December 2014. On December 3, 2013, the Alabama PSC issued a consent order that Alabama Power leave in effect for 2014 the factors associated with Alabama Power's environmental compliance costs for the year 2013. Any unrecovered amounts associated with 2014 will be reflected in the 2015 filing. As of December 31, 2013, Alabama Power had an under recovered environmental clause balance of
$7 million
which is included in deferred under recovered regulatory clause revenues in the balance sheet.
Environmental Accounting Order
Based on an order from the Alabama PSC, Alabama Power is allowed to establish a regulatory asset to record the unrecovered investment costs, including the unrecovered plant asset balance and the unrecovered costs associated with site removal and closure associated with future unit retirements caused by environmental regulations. These costs would be amortized over the affected unit's remaining useful life, as established prior to the decision regarding early retirement.
Compliance and Pension Cost Accounting Order
In November 2012, the Alabama PSC approved an accounting order to defer to a regulatory asset account certain compliance-related operations and maintenance expenditures for the years 2013 through 2017, as well as the incremental increase in operations expense related to pension cost for 2013. These deferred costs are to be amortized over a
three
-year period beginning in January 2015. The compliance related expenditures were related to (i) standards addressing Critical Infrastructure Protection issued by the North American Electric Reliability Corporation, (ii) cyber security requirements issued by the NRC, and (iii) NRC guidance addressing the readiness at nuclear facilities within the U.S. for severe events. The compliance-related expenses to be afforded regulatory asset treatment over the
five
-year period are currently estimated to be approximately
$37 million
. The amount of operations and maintenance expenses deferred to a regulatory asset in 2013 associated with compliance-related expenditures and pension cost was approximately
$8 million
and
$12 million
, respectively. Pursuant to the accounting order, Alabama Power has the ability to accelerate the amortization of the regulatory assets with notification to the Alabama PSC.
Retail Energy Cost Recovery
Alabama Power has established energy cost recovery rates under Alabama Power's energy cost recovery rate (Rate ECR) as approved by the Alabama PSC. Rates are based on an estimate of future energy costs and the current over or under recovered balance. Revenues recognized under Rate ECR and recorded on the financial statements are adjusted for the difference in actual recoverable fuel costs and amounts billed in current regulated rates. The difference in the recoverable fuel costs and amounts billed give rise to the over or under recovered amounts recorded as regulatory assets or liabilities. Alabama Power, along with the Alabama PSC, continually monitors the over or under recovered cost balance to determine whether an adjustment to billing rates is required. Changes in the Rate ECR factor have no significant effect on net income, but will impact operating cash flows. Currently, the Alabama PSC may approve billing rates under Rate ECR of up to
5.910
cents per kilowatt hour (KWH). On December 3, 2013, the Alabama PSC issued a consent order that Alabama Power leave in effect the energy cost recovery rates which began in April 2011 for 2014. Therefore, the Rate ECR factor as of January 1, 2014 remained at
2.681
cents per KWH. Effective with billings beginning in January 2015, the Rate ECR factor will be
5.910
cents per KWH, absent a further order from the Alabama PSC.
Alabama Power's over recovered fuel costs at
December 31, 2013
totaled
$42 million
as compared to under recovered fuel costs of
$4 million
at December 31, 2012. At December 31, 2013,
$27 million
is included in other regulatory liabilities, current and
$15
II-79
NOTES (continued)
Southern Company and Subsidiary Companies 2013 Annual Report
million
is included in deferred over recovered regulatory clause revenues. The under recovered fuel costs at December 31, 2012 are included in deferred under recovered regulatory clause revenues in the balance sheets. These classifications are based on estimates, which include such factors as weather, generation availability, energy demand, and the price of energy. A change in any of these factors could have a material impact on the timing of any recovery of the under recovered fuel costs.
Natural Disaster Reserve
Based on an order from the Alabama PSC, Alabama Power maintains a reserve for operations and maintenance expenses to cover the cost of damages from major storms to its transmission and distribution facilities. The order approves a separate monthly Rate Natural Disaster Reserve (Rate NDR) charge to customers consisting of two components. The first component is intended to establish and maintain a reserve balance for future storms and is an on-going part of customer billing. The second component of the Rate NDR charge is intended to allow recovery of any existing deferred storm-related operations and maintenance costs and any future reserve deficits over a
24
-month period. The Alabama PSC order gives Alabama Power authority to record a deficit balance in the NDR when costs of storm damage exceed any established reserve balance. Absent further Alabama PSC approval, the maximum total Rate NDR charge consisting of both components is
$10
per month per non-residential customer account and
$5
per month per residential customer account. Alabama Power has the authority, based on an order from the Alabama PSC, to accrue certain additional amounts as circumstances warrant. The order allows for reliability-related expenditures to be charged against the additional accruals when the NDR balance exceeds
$75 million
. Alabama Power may designate a portion of the NDR to reliability-related expenditures as a part of an annual budget process for the following year or during the current year for identified unbudgeted reliability-related expenditures that are incurred. Accruals that have not been designated can be used to offset storm charges. Additional accruals to the NDR will enhance Alabama Power's ability to deal with the financial effects of future natural disasters, promote system reliability, and offset costs retail customers would otherwise bear.
As revenue from the Rate NDR charge is recognized, an equal amount of operations and maintenance expenses related to the NDR will also be recognized. As a result, the Rate NDR charge will not have an effect on net income but will impact operating cash flows.
In accordance with the order that was issued by the Alabama PSC in 2011 to eliminate a tax-related adjustment under Alabama Power's rate structure that resulted in additional revenues, Alabama Power made additional accruals to the NDR in the fourth quarter 2011 of an amount equal to the additional 2011 revenues, which were approximately
$31 million
.
The accumulated balances in the NDR for the years ended December 31, 2013 and December 31, 2012 were approximately
$96 million
and
$103 million
, respectively. Any accruals to the NDR are included in the balance sheets under other regulatory liabilities, deferred and are reflected as other operations and maintenance expenses in the statements of income.
Nuclear Outage Accounting Order
In accordance with a 2010 Alabama PSC order, nuclear outage operations and maintenance expenses for the
two
units at Plant Farley are deferred to a regulatory asset when the charges actually occur and are then amortized over the subsequent
18
-month operational cycle.
Approximately
$31 million
of nuclear outage costs from the spring of 2012 was amortized to nuclear operations and maintenance expenses over the
18
-month period ended in December 2013. During the spring of 2013, approximately
$28 million
of nuclear outage costs was deferred to a regulatory asset, and beginning in July 2013, these deferred costs are being amortized over an
18
-month period. During the fall of 2013, approximately
$32 million
of nuclear outage costs associated with the second unit was deferred to a regulatory asset, and beginning in January 2014, these deferred costs are being amortized over an
18
-month period. Alabama Power will continue the pattern of deferral of nuclear outage expenses as incurred and the recognition of expenses over a subsequent
18
-month period pursuant to the Alabama PSC order.
Non-Nuclear Outage Accounting Order
On August 13, 2013, the Alabama PSC approved Alabama Power's petition requesting authorization to defer to a regulatory asset account certain operations and maintenance expenses associated with planned outages at non-nuclear generation facilities in 2014 and to amortize those expenses over a
three
-year period beginning in 2015. The 2014 outage expenditures to be deferred and amortized are estimated to total approximately
$78 million
.
II-80
NOTES (continued)
Southern Company and Subsidiary Companies 2013 Annual Report
Georgia Power
Rate Plans
In 2010, the Georgia PSC approved the 2010 ARP, which resulted in base rate increases of approximately
$562 million
,
$17 million
,
$125 million
, and
$74 million
effective January 1, 2011, January 1, 2012, April 1, 2012, and January 1, 2013, respectively.
On December 17, 2013, the Georgia PSC voted to approve the 2013 ARP. The 2013 ARP reflects the settlement agreement among Georgia Power, the Georgia PSC’s Public Interest Advocacy Staff, and
11
of the
13
intervenors, which was filed with the Georgia PSC on November 18, 2013.
On January 1, 2014, in accordance with the 2013 ARP, Georgia Power increased its tariffs as follows: (1) traditional base tariff rates by approximately
$80 million
; (2) Environmental Compliance Cost Recovery (ECCR) tariff by an additional
$25 million
; (3) Demand-Side Management (DSM) tariffs by an additional
$1 million
; and (4) Municipal Franchise Fee (MFF) tariff by an additional
$4 million
, for a total increase in base revenues of approximately
$110 million
.
Under the 2013 ARP, the following additional rate adjustments will be made to Georgia Power’s tariffs in 2015 and 2016 based on annual compliance filings to be made at least
90 days
prior to the effective date of the tariffs:
|
•
|
Effective January 1, 2015 and 2016, the traditional base tariff rates will increase by an estimated
$101 million
and
$36 million
, respectively, to recover additional generation capacity-related costs;
|
|
•
|
Effective January 1, 2015 and 2016, the ECCR tariff will increase by an estimated
$76 million
and
$131 million
, respectively, to recover additional environmental compliance costs;
|
|
•
|
Effective January 1, 2015, the DSM tariffs will increase by an estimated
$6 million
and decrease by an estimated
$1 million
effective January 1, 2016; and
|
|
•
|
The MFF tariff will increase consistent with these adjustments.
|
Georgia Power currently estimates these adjustments will result in base revenue increases of approximately
$187 million
in 2015 and
$170 million
in 2016. The estimated traditional base tariff rate increases for 2015 and 2016 do not include additional Qualifying Facility (QF) PPA expenses; however, compliance filings will include QF PPA expenses for those facilities that are projected to provide capacity to Georgia Power during the following year.
Under the 2013 ARP, Georgia Power’s retail ROE is set at
10.95%
, and earnings are evaluated against a retail ROE range of
10.00%
to
12.00%
. Two-thirds of any earnings above
12.00%
will be directly refunded to customers, with the remaining one-third retained by Georgia Power. There will be no recovery of any earnings shortfall below
10.00%
on an actual basis. However, if at any time during the term of the 2013 ARP, Georgia Power projects that its retail earnings will be below
10.00%
for any calendar year, it may petition the Georgia PSC for implementation of the Interim Cost Recovery (ICR) tariff that would be used to adjust Georgia Power’s earnings back to a
10.00%
retail ROE. The Georgia PSC would have
90 days
to rule on Georgia Power’s request. The ICR tariff will expire at the earlier of January 1, 2017 or the end of the calendar year in which the ICR tariff becomes effective. In lieu of requesting implementation of an ICR tariff, or if the Georgia PSC chooses not to implement the ICR tariff, Georgia Power may file a full rate case.
Except as provided above, Georgia Power will not file for a general base rate increase while the 2013 ARP is in effect. Georgia Power is required to file a general rate case by July 1, 2016, in response to which the Georgia PSC would be expected to determine whether the 2013 ARP should be continued, modified, or discontinued.
Integrated Resource Plans
On January 31, 2013, Georgia Power filed its triennial IRP (2013 IRP). The filing included Georgia Power's request to decertify
16
coal- and oil-fired units totaling
2,093
MWs. Several factors, including the cost to comply with existing and future environmental regulations, recent and forecasted economic conditions, and lower natural gas prices, contributed to the decision to close these units.
On April 17, 2013, the Georgia PSC approved the decertification of Plant Bowen Unit 6 (
32
MWs), which was retired on April 25, 2013. On September 30, 2013, Plant Branch Unit 2 (
319
MWs) was retired as approved by the Georgia PSC in the 2011 Integrated Resource Plan Update (2011 IRP Update) in order to comply with the State of Georgia's Multi-Pollutant Rule.
On July 11, 2013, the Georgia PSC approved Georgia Power's request to decertify and retire Plant Boulevard Units 2 and 3 (
28
MWs) effective July 17, 2013. Plant Branch Units 3 and 4 (
1,016
MWs), Plant Yates Units 1 through 5 (
579
MWs), and Plant McManus Units 1 and 2 (
122
MWs) will be decertified and retired by April 16, 2015, the compliance date of the Mercury and Air Toxics Standards (MATS) rule. The decertification date of Plant Branch Unit 1 was extended from December 31, 2013 as
II-81
NOTES (continued)
Southern Company and Subsidiary Companies 2013 Annual Report
specified in the final order in the 2011 IRP Update to coincide with the decertification date of Plant Branch Units 3 and 4. The decertification and retirement of Plant Kraft Units 1 through 4 (
316
MWs) was also approved and will be effective by April 16, 2016, based on a
one
-year extension of the MATS rule compliance date that was approved by the State of Georgia Environmental Protection Division on September 10, 2013 to allow for necessary transmission system reliability improvements.
Additionally, the Georgia PSC approved Georgia Power's proposed MATS rule compliance plan for emissions controls necessary for the continued operation of Plants Bowen Units 1 through 4, Wansley Units 1 and 2, Scherer Units 1 through 3, and Hammond Units 1 through 4, the switch to natural gas as the primary fuel at Plant Yates Units 6 and 7 and Southern Electric Generating Company's (SEGCO) Plant Gaston Units 1 through 4, as well as the fuel switch at Plant McIntosh Unit 1 to operate on Powder River Basin coal.
In the 2013 ARP, the Georgia PSC approved the amortization of the construction work in progress (CWIP) balances related to environmental projects that will not be completed at Plant Branch Units 1 through 4 and Plant Yates Units 6 and 7 over
nine
years beginning in January 2014 and the amortization of any remaining net book values of Plant Branch Unit 2 from October 2013 to December 2022, Plant Branch Unit 1 from May 2015 to December 2020, Plant Branch Unit 3 from May 2015 to December 2023, and Plant Branch Unit 4 from May 2015 to December 2024. The Georgia PSC deferred a decision regarding the appropriate recovery period for the costs associated with unusable materials and supplies remaining at the retiring plants to Georgia Power's next base rate case, which Georgia Power expects to file in 2016 (2016 Rate Case). In the 2013 IRP, the Georgia PSC also deferred decisions regarding the recovery of any fuel related costs that could be incurred in connection with the retirement units to be addressed in future fuel cases.
A request was filed with the Georgia PSC on January 10, 2014 to cancel the proposed biomass fuel conversion of Plant Mitchell Unit 3 (
155
MWs) because it would not be cost effective for customers. The filing also notified the Georgia PSC of Georgia Power’s plans to seek decertification later this year. Plant Mitchell Unit 3 will continue to operate as a coal unit until April 2015 when it will be required to cease operation or install additional environmental controls to comply with the MATS rule. In connection with the retirement decision, Georgia Power reclassified the retail portion of the net carrying value of Plant Mitchell Unit 3 from plant in service, net of depreciation, to other utility plant, net.
The decertification of these units and fuel conversions are not expected to have a material impact on Southern Company's financial statements; however, the ultimate outcome depends on the Georgia PSC's order in the 2016 Rate Case and future fuel cases and cannot be determined at this time.
Renewables Development
On December 17, 2013,
four
PPAs totaling
50
MWs of utility scale solar generation under the Georgia Power Advanced Solar Initiative (GPASI) were approved by the Georgia PSC, with Georgia Power as the purchaser. These contracts will begin in 2015 and end in 2034. The resulting purchases will be for energy only and recovered through Georgia Power’s fuel cost recovery mechanism. Under the 2013 IRP, the Georgia PSC approved an additional
525
MWs of solar generation to be purchased by Georgia Power. The
525
MWs will be divided into
425
MWs of utility scale projects and
100
MWs of distributed generation.
On November 4, 2013, Georgia Power filed an application for the certification of
two
PPAs which were executed on April 22, 2013 for the purchase of energy from
two
wind farms in Oklahoma with capacity totaling
250
MWs that will begin in 2016 and end in 2035.
During 2013, Georgia Power executed
four
PPAs to purchase a total of
169
MWs of biomass capacity and energy from
four
facilities in Georgia that will begin in 2015 and end in 2035. On May 21, 2013, the Georgia PSC approved
two
of the biomass PPAs and the remaining
two
were approved on December 17, 2013. The
four
biomass PPAs are contingent upon the counterparty meeting specified contract dates for posting collateral and commercial operation. The ultimate outcome of this matter cannot be determined at this time.
Fuel Cost Recovery
Georgia Power has established fuel cost recovery rates approved by the Georgia PSC. The Georgia PSC approved reductions in Georgia Power's total annual billings of approximately
$43 million
effective June 1, 2011,
$567 million
effective June 1, 2012, and
$122 million
effective January 1, 2013. The 2013 reduction was due to the Georgia PSC authorizing an Interim Fuel Rider, which is set to expire June 1, 2014. Georgia Power continues to be allowed to adjust its fuel cost recovery rates prior to the next fuel case if the under or over recovered fuel balance exceeds
$200 million
. Georgia Power's fuel cost recovery includes costs associated with a natural gas hedging program as revised and approved by the Georgia PSC on February 7, 2013, requiring it to use options and hedges within a
24
-month time horizon. On February 18, 2014, the Georgia PSC approved the deferral of Georgia Power's next fuel case, which is now expected to be filed by March 1, 2015.
II-82
NOTES (continued)
Southern Company and Subsidiary Companies 2013 Annual Report
Georgia Power's over recovered fuel balance totaled approximately
$58 million
and
$230 million
at
December 31, 2013
and
2012
, respectively, and is included in current liabilities and other deferred credits and liabilities.
Fuel cost recovery revenues as recorded on the financial statements are adjusted for differences in actual recoverable fuel costs and amounts billed in current regulated rates. Accordingly, changes in the billing factor will not have a significant effect on Southern Company's revenues or net income, but will affect cash flow.
Storm Damage Recovery
Georgia Power defers and recovers certain costs related to damages from major storms as mandated by the Georgia PSC. As of December 31, 2013, the balance in the regulatory asset related to storm damage was
$37 million
. As a result of this regulatory treatment, the costs related to storms are generally not expected to have a material impact on Southern Company's financial statements.
Nuclear Construction
In 2008, Georgia Power, acting for itself and as agent for Oglethorpe Power Corporation (OPC), the Municipal Electric Authority of Georgia (MEAG Power), and the City of Dalton, Georgia (Dalton), acting by and through its Board of Water, Light, and Sinking Fund Commissioners (collectively, Owners), entered into an agreement with a consortium consisting of Westinghouse Electric Company LLC (Westinghouse) and Stone & Webster, Inc. (collectively, Contractor), pursuant to which the Contractor agreed to design, engineer, procure, construct, and test two AP1000 nuclear units (with electric generating capacity of approximately
1,100
MWs each) and related facilities at Plant Vogtle (Vogtle 3 and 4 Agreement). Under the terms of the Vogtle 3 and 4 Agreement, the Owners agreed to pay a purchase price that is subject to certain price escalations and adjustments, including fixed escalation amounts and index-based adjustments, as well as adjustments for change orders, and performance bonuses for early completion and unit performance. Each Owner is severally (and not jointly) liable for its proportionate share, based on its ownership interest, of all amounts owed to the Contractor under the Vogtle 3 and 4 Agreement. Georgia Power's proportionate share is
45.7%
. The Vogtle 3 and 4 Agreement provides for liquidated damages upon the Contractor's failure to fulfill the schedule and performance guarantees. The Contractor's liability to the Owners for schedule and performance liquidated damages and warranty claims is subject to a cap.
Certain payment obligations of Westinghouse and Stone & Webster, Inc. under the Vogtle 3 and 4 Agreement are guaranteed by Toshiba Corporation and The Shaw Group, Inc., respectively. In the event of certain credit rating downgrades of any Owner, such Owner will be required to provide a letter of credit or other credit enhancement. The Owners may terminate the Vogtle 3 and 4 Agreement at any time for their convenience, provided that the Owners will be required to pay certain termination costs. The Contractor may terminate the Vogtle 3 and 4 Agreement under certain circumstances, including certain Owner suspension or delays of work, action by a governmental authority to permanently stop work, certain breaches of the Vogtle 3 and 4 Agreement by the Owners, Owner insolvency, and certain other events.
In 2009, the NRC issued an Early Site Permit and Limited Work Authorization which allowed limited work to begin on Plant Vogtle Units 3 and 4. The NRC certified the Westinghouse Design Control Document, as amended (DCD), for the AP1000 nuclear reactor design, effective December 30, 2011, and issued combined construction and operating licenses (COLs) in February 2012. Receipt of the COLs allowed full construction to begin. There have been technical and procedural challenges to the construction and licensing of Plant Vogtle Units 3 and 4, at the federal and state level, and additional challenges are expected as construction proceeds.
In 2009, the Georgia PSC approved inclusion of the construction of
two
new nuclear generating units at Plant Vogtle (Plant Vogtle Units 3 and 4) related CWIP accounts in rate base, and the State of Georgia enacted the Georgia Nuclear Energy Financing Act, which allows Georgia Power to recover financing costs for nuclear construction projects certified by the Georgia PSC. Financing costs are recovered on all applicable certified costs through annual adjustments to the Nuclear Construction Cost Recovery (NCCR) tariff by including the related CWIP accounts in rate base during the construction period. The Georgia PSC approved increases to the NCCR tariff of approximately
$223 million
,
$35 million
,
$50 million
, and
$60 million
, effective January 1, 2011, 2012, 2013, and 2014, respectively. Through the NCCR tariff, Georgia Power is collecting and amortizing to earnings approximately
$91 million
of financing costs, capitalized in 2009 and 2010, over the
five
-year period ending December 31, 2015, in addition to the ongoing financing costs. At December 31, 2013, approximately
$37 million
of these 2009 and 2010 costs remained unamortized in CWIP.
Georgia Power is required to file semi-annual Vogtle Construction Monitoring (VCM) reports with the Georgia PSC by February 28 and August 31 each year. If the projected certified construction capital costs to be borne by Georgia Power increase by
5%
or the projected in-service dates are significantly extended, Georgia Power is required to seek an amendment to the Plant Vogtle Units 3 and 4 certificate from the Georgia PSC. Accordingly, Georgia Power's eighth VCM report requested an amendment to the
II-83
NOTES (continued)
Southern Company and Subsidiary Companies 2013 Annual Report
certificate to increase the estimated in-service capital cost of Plant Vogtle Units 3 and 4 from
$4.4 billion
to
$4.8 billion
and to extend the estimated in-service dates to the fourth quarter 2017 and the fourth quarter 2018 for Plant Vogtle Units 3 and 4, respectively.
On September 3, 2013, the Georgia PSC approved a stipulation entered into by Georgia Power and the Georgia PSC staff to waive the requirement to amend the Plant Vogtle Units 3 and 4 certificate, until the commercial operation date of Plant Vogtle Unit 3, or earlier if deemed appropriate by the Georgia PSC and Georgia Power. In accordance with the Georgia Integrated Resource Planning Act, any costs incurred by Georgia Power in excess of the certified amount will not be included in rate base, unless shown to be reasonable and prudent. In addition, financing costs on any excess construction-related costs potentially would be subject to recovery through AFUDC instead of the NCCR tariff. As required by the stipulation, Georgia Power filed an abbreviated status update with the Georgia PSC on September 3, 2013, which reflected approximately
$2.4 billion
of total construction capital costs incurred through June 30, 2013. On October 15, 2013, the Georgia PSC voted to approve Georgia Power's eighth VCM report, reflecting construction capital costs incurred, which through December 31, 2012 totaled approximately
$2.2 billion
. Also in accordance with the stipulation, Georgia Power will file with the Georgia PSC on February 28, 2014 a combined ninth and tenth VCM report covering the period from January 1 through December 31, 2013 (Ninth/Tenth VCM report), which will request approval for an additional
$0.4 billion
of construction capital costs. The Ninth/Tenth VCM report will reflect estimated in-service construction capital costs of
$4.8 billion
and associated financing costs during the construction period, which are estimated to total approximately
$2.0 billion
. Georgia Power expects to resume filing semi-annual VCM reports in August 2014.
In July 2012, the Owners and the Contractor began negotiations regarding the costs associated with design changes to the DCD and the delays in the timing of approval of the DCD and issuance of the COLs, including the assertion by the Contractor that the Owners are responsible for these costs under the terms of the Vogtle 3 and 4 Agreement. The portion of the additional costs claimed by the Contractor that would be attributable to Georgia Power (based on Georgia Power's ownership interest) with respect to these issues is approximately
$425 million
(in 2008 dollars). The Contractor also has asserted it is entitled to further schedule extensions. Georgia Power has not agreed with either the proposed cost or schedule adjustments or that the Owners have any responsibility for costs related to these issues. In November 2012, Georgia Power and the other Owners filed suit against the Contractor in the U.S. District Court for the Southern District of Georgia seeking a declaratory judgment that the Owners are not responsible for these costs. Also in November 2012, the Contractor filed suit against Georgia Power and the other Owners in the U.S. District Court for the District of Columbia alleging the Owners are responsible for these costs. On August 30, 2013, the U.S. District Court for the District of Columbia dismissed the Contractor's suit, ruling that the proper venue is the U.S. District Court for the Southern District of Georgia. The Contractor appealed the decision to the U.S. Court of Appeals for the District of Columbia Circuit on September 27, 2013. While litigation has commenced and Georgia Power intends to vigorously defend its positions, Georgia Power also expects negotiations with the Contractor to continue with respect to cost and schedule during which negotiations the parties may reach a mutually acceptable compromise of their positions.
Processes are in place that are designed to assure compliance with the requirements specified in the DCD and the COLs, including inspections by Southern Nuclear and the NRC that occur throughout construction. As a result of such compliance processes, certain license amendment requests have been filed and approved or are pending before the NRC. Various design and other licensing-based compliance issues are expected to arise as construction proceeds, which may result in additional license amendments or require other resolution. If any license amendment requests or other licensing-based compliance issues are not resolved in a timely manner, there may be delays in the project schedule that could result in increased costs either to the Owners, the Contractor, or both.
As construction continues, the risk remains that additional challenges in the fabrication, assembly, delivery, and installation of structural modules, delays in the receipt of the remaining permits necessary for the operation of Plant Vogtle Units 3 and 4, or other issues could arise and may further impact project schedule and cost. Additional claims by the Contractor or Georgia Power (on behalf of the Owners) are also likely to arise throughout construction. These claims may be resolved through formal and informal dispute resolution procedures under the Vogtle 3 and 4 Agreement, but also may be resolved through litigation.
The ultimate outcome of these matters cannot be determined at this time.
Gulf Power
Retail Base Rate Case
On December 3, 2013, the Florida PSC voted to approve the Settlement Agreement (Gulf Power Settlement Agreement) among Gulf Power and all of the intervenors to the docketed proceeding with respect to Gulf Power's request to increase retail base rates. Under the terms of the Gulf Power Settlement Agreement, Gulf Power (1) increased base rates designed to produce an additional
$35 million
in annual revenues effective January 2014 and will increase base rates designed to produce an additional
$20 million
II-84
NOTES (continued)
Southern Company and Subsidiary Companies 2013 Annual Report
in annual revenues effective January 2015; (2) continued its current authorized retail ROE midpoint and range; and (3) will accrue a return similar to AFUDC on certain transmission system upgrades that go into service after January 2014 until Gulf Power's next retail rate case or January 1, 2017, whichever comes first.
The Gulf Power Settlement Agreement also includes a self-executing adjustment mechanism that will increase the authorized ROE midpoint and range by 25 basis points in the event the
30
-year treasury yield rate increases by an average of at least 75 basis points above
3.7947%
for a consecutive
six
-month period.
The Gulf Power Settlement Agreement also provides that Gulf Power may reduce depreciation expense and record a regulatory asset that will be included as an offset to the other cost of removal regulatory liability in an amount up to
$62.5 million
between January 2014 and June 2017. In any given month, such depreciation expense reduction may not exceed the amount necessary for the ROE, as reported to the Florida PSC monthly, to reach the midpoint of the authorized ROE range then in effect. Recovery of the regulatory asset will occur over a period to be determined by the Florida PSC in Gulf Power’s next base rate case or next depreciation and dismantlement study proceeding, whichever comes first.
The Gulf Power Settlement Agreement also provides for recovery of costs associated with any tropical systems named by the National Hurricane Center through the initiation of a storm surcharge. The storm surcharge will begin, on an interim basis,
60
days following the filing of a cost recovery petition. The storm surcharge generally may not exceed
$4.00
/
1,000
KWHs on monthly residential bills in aggregate for a calendar year. This limitation does not apply if Gulf Power incurs in excess of
$100 million
in storm recovery costs that qualify for recovery in a given calendar year. This threshold amount is inclusive of the amount necessary to replenish the storm reserve to the level that existed as of
December 31, 2013
.
Pursuant to the Gulf Power Settlement Agreement, Gulf Power may not request an increase in its retail base rates to be effective until after June 2017, unless Gulf Power's actual retail ROE falls below the authorized ROE range.
Integrated Coal Gasification Combined Cycle
Kemper IGCC Overview
Construction of Mississippi Power's Kemper IGCC is nearing completion and start-up activities will continue until the Kemper IGCC is placed in service. The Kemper IGCC will utilize an integrated coal gasification combined cycle technology with an output capacity of
582
MWs. The Kemper IGCC will be fueled by locally mined lignite (an abundant, lower heating value coal) from a mine owned by Mississippi Power and situated adjacent to the Kemper IGCC. The mine, operated by North American Coal Corporation, started commercial operation on June 5, 2013. In connection with the Kemper IGCC, Mississippi Power constructed and plans to operate approximately
61
miles of CO
2
pipeline infrastructure for the planned transport of captured CO
2
for use in enhanced oil recovery.
Kemper IGCC Project Approval
In April 2012, the Mississippi PSC issued a detailed order confirming the certificate of public convenience and necessity (CPCN) originally approved by the Mississippi PSC in 2010 authorizing the acquisition, construction, and operation of the Kemper IGCC (2012 MPSC CPCN Order), which the Sierra Club appealed to the Chancery Court of Harrison County, Mississippi (Chancery Court). In December 2012, the Chancery Court affirmed the 2012 MPSC CPCN Order. On January 8, 2013, the Sierra Club filed an appeal of the Chancery Court's ruling with the Mississippi Supreme Court. The ultimate outcome of the CPCN challenge cannot be determined at this time.
Kemper IGCC Schedule and Cost Estimate
The certificated cost estimate of the Kemper IGCC included in the 2012 MPSC CPCN Order was
$2.4 billion
, net of
$245 million
of grants awarded to the project by the DOE under the Clean Coal Power Initiative Round 2 (DOE Grants) and excluding the cost of the lignite mine and equipment, the cost of the CO
2
pipeline facilities, and AFUDC related to the Kemper IGCC. The 2012 MPSC CPCN Order approved a construction cost cap of up to
$2.88 billion
, with recovery of prudently-incurred costs subject to approval by the Mississippi PSC. Exceptions to the
$2.88 billion
cost cap include the cost of the lignite mine and equipment, the cost of the CO
2
pipeline facilities, AFUDC, and certain general exceptions, including change of law, force majeure, and beneficial capital (which exists when Mississippi Power demonstrates that the purpose and effect of the construction cost increase is to produce efficiencies that will result in a neutral or favorable effect on the ratepayers, relative to the original proposal for the CPCN) (Cost Cap Exceptions), as contemplated in the settlement agreement between Mississippi Power and the Mississippi PSC entered into on January 24, 2013 (Settlement Agreement) and the 2012 MPSC CPCN Order. Recovery of the Cost Cap Exception amounts remains subject to review and approval by the Mississippi PSC. The Kemper IGCC was originally scheduled to be placed in service in May 2014 and is currently scheduled to be placed in service in the fourth quarter 2014.
II-85
NOTES (continued)
Southern Company and Subsidiary Companies 2013 Annual Report
Mississippi Power’s 2010 project estimate, current cost estimate, and actual costs incurred as of December 31, 2013 for the Kemper IGCC are as follows:
|
Cost Category
|
2010 Project Estimate
(d)
|
Current Estimate
|
Actual Costs at 12/31/2013
|
||||||
|
(in billions)
|
|||||||||
|
Plant Subject to Cost Cap
(a)
|
$
|
2.40
|
|
$
|
4.06
|
|
$
|
3.25
|
|
|
Lignite Mine and Equipment
|
0.21
|
0.23
|
0.23
|
||||||
|
CO
2
Pipeline Facilities
|
0.14
|
0.11
|
0.09
|
||||||
|
AFUDC
(b)
|
0.17
|
0.45
|
0.28
|
||||||
|
General Exceptions
|
0.05
|
0.10
|
0.07
|
||||||
|
Regulatory Asset
(c)
|
—
|
|
0.09
|
0.07
|
|||||
|
Total Kemper IGCC
(a)
|
$
|
2.97
|
|
$
|
5.04
|
|
$
|
3.99
|
|
|
(a)
|
The 2012 MPSC CPCN Order approved a construction cost cap of up to
$2.88 billion
, net of the DOE Grants and excluding the Cost Cap Exceptions.
|
|
(b)
|
Mississippi Power’s original estimate included recovery of financing costs during construction which was not approved by the Mississippi PSC in June 2012 as described in "Rate Recovery of Kemper IGCC Costs."
|
|
(c)
|
The 2012 MPSC CPCN Order approved deferral of non-capital Kemper IGCC-related costs during construction as described in "Rate Recovery of Kemper IGCC Costs – Regulatory Assets."
|
|
(d)
|
The 2010 Project Estimate is the certificated cost estimate adjusted to include the certificated estimate for the CO
2
pipeline facilities which was approved in 2011 by the Mississippi PSC.
|
Of the total costs incurred as of December 31, 2013,
$2.74 billion
was included in CWIP (which is net of the DOE Grants and estimated probable losses of
$1.18 billion
),
$70.5 million
in other regulatory assets, and
$3.9 million
in other deferred charges and assets in the balance sheet, and
$1.0 million
was previously expensed.
Mississippi Power does not intend to seek any rate recovery or joint owner contributions for any related costs that exceed the
$2.88 billion
cost cap, excluding the Cost Cap Exceptions and net of the DOE Grants. Southern Company recorded pre-tax charges to income for revisions to the cost estimate of
$1.2 billion
(
$729 million
after-tax) in
2013
. The revised cost estimates reflect increased labor costs, piping and other material costs, start-up costs, decreases in construction labor productivity, the change in the in-service date, and an increase in the contingency for risks associated with start-up activities.
Mississippi Power could experience further construction cost increases and/or schedule extensions with respect to the Kemper IGCC as a result of factors including, but not limited to, labor costs and productivity, adverse weather conditions, shortages and inconsistent quality of equipment, materials, and labor, contractor or supplier delay, or non-performance under construction or other agreements. Furthermore, Mississippi Power could also experience further schedule extensions associated with start-up activities for this "first-of-a-kind" technology, including major equipment failure, system integration, and operations, and/or unforeseen engineering problems, which would result in further cost increases and could result in the loss of certain tax benefits related to bonus depreciation. In subsequent periods, any further changes in the estimated costs to complete construction of the Kemper IGCC subject to the
$2.88 billion
cost cap will be reflected in Southern Company's statements of income and these changes could be material.
Rate Recovery of Kemper IGCC Costs
The ultimate outcome of the rate recovery matters discussed herein, including the resolution of legal challenges, determinations of prudency, and the specific manner of recovery of prudently-incurred costs, cannot be determined at this time, but could have a material impact on the Company’s results of operations, financial condition, and liquidity.
2012 MPSC CPCN Order
The 2012 MPSC CPCN Order included provisions relating to both Mississippi Power's recovery of financing costs during the course of construction of the Kemper IGCC and Mississippi Power's recovery of costs following the date the Kemper IGCC is placed in service. With respect to recovery of costs following the in-service date of the Kemper IGCC, the 2012 MPSC CPCN Order provided for the establishment of operational cost and revenue parameters based upon assumptions in Mississippi Power's petition for the CPCN.
II-86
NOTES (continued)
Southern Company and Subsidiary Companies 2013 Annual Report
In June 2012, the Mississippi PSC denied Mississippi Power's proposed rate schedule for recovery of financing costs during construction, pending a final ruling from the Mississippi Supreme Court regarding the Sierra Club's appeal of the Mississippi PSC's issuance of the CPCN for the Kemper IGCC (2012 MPSC CWIP Order).
In July 2012, Mississippi Power appealed the Mississippi PSC's June 2012 decision to the Mississippi Supreme Court and requested interim rates under bond. In July 2012, the Mississippi Supreme Court denied Mississippi Power's request for interim rates under bond.
Settlement Agreement
On January 24, 2013, Mississippi Power entered into the Settlement Agreement with the Mississippi PSC that, among other things, establishes the process for resolving matters regarding cost recovery related to the Kemper IGCC and dismissed Mississippi Power's appeal of the 2012 MPSC CWIP Order. Under the Settlement Agreement, Mississippi Power agreed to limit the portion of prudently-incurred Kemper IGCC costs to be included in retail rate base to the
$2.4 billion
certificated cost estimate, plus the Cost Cap Exceptions, but excluding AFUDC, and any other costs permitted or determined to be excluded from the
$2.88 billion
cost cap by the Mississippi PSC. The Settlement Agreement also allows Mississippi Power to secure alternate financing for costs that are not otherwise recovered in any Mississippi PSC rate proceedings contemplated by the Settlement Agreement. Legislation to authorize a multi-year rate plan and legislation to provide for alternate financing through securitization of up to
$1.0 billion
of prudently-incurred costs was enacted into law on February 26, 2013. Mississippi Power intends to securitize (1) prudently-incurred costs in excess of the certificated cost estimate and up to the
$2.88 billion
cost cap, net of the DOE Grants and excluding the Cost Cap Exceptions, (2) accrued AFUDC, and (3) other prudently-incurred costs as approved by the Mississippi PSC. The rate recovery necessary to recover the annual costs of securitization is expected to be filed and become effective after the Kemper IGCC is placed in service and following completion of the Mississippi PSC's final prudence review of costs for the Kemper IGCC.
The Settlement Agreement provides that Mississippi Power may terminate the Settlement Agreement if certain conditions are not met, if Mississippi Power is unable to secure alternate financing for any prudently-incurred Kemper IGCC costs not otherwise recovered in any Mississippi PSC rate proceeding contemplated by the Settlement Agreement, or if the Mississippi PSC fails to comply with the requirements of the Settlement Agreement. Mississippi Power continues to work with the Mississippi PSC and the Mississippi Public Utilities Staff to implement the procedural schedules set forth in the Settlement Agreement and variations to the schedule are likely.
2013 MPSC Rate Order
Consistent with the terms of the Settlement Agreement, on January 25, 2013, Mississippi Power filed a new request to increase retail rates in 2013 by
$172 million
annually, based on projected investment for 2013, to be recorded to a regulatory liability to be used to mitigate rate impacts when the Kemper IGCC is placed in service.
On March 5, 2013, the Mississippi PSC issued an order (2013 MPSC Rate Order) approving retail rate increases of
15%
effective March 19, 2013 and
3%
effective January 1, 2014, which collectively are designed to collect
$156 million
annually beginning in 2014. Amounts collected through these rates are being recorded as a regulatory liability to be used to mitigate customer rate impacts after the Kemper IGCC is placed in service. As of December 31, 2013,
$98.1 million
had been collected, with
$10.3 million
recognized in retail revenues in the statement of income and the remainder deferred in other regulatory liabilities and included in the balance sheet.
Because the 2013 MPSC Rate Order did not provide for the inclusion of CWIP in rate base as permitted by legislation designed to enhance the Mississippi PSC's authority to facilitate development and construction of baseload generation in the State of Mississippi (Baseload Act), Mississippi Power continues to record AFUDC on the Kemper IGCC during the construction period. Mississippi Power will not record AFUDC on any additional costs of the Kemper IGCC that exceed the
$2.88 billion
cost cap, except for Cost Cap Exception amounts. Mississippi Power will continue to comply with the 2013 MPSC Rate Order by collecting and deferring the approved rates during the construction period unless directed to do otherwise by the Mississippi PSC. On March 21, 2013, a legal challenge to the 2013 MPSC Rate Order was filed by Thomas A. Blanton with the Mississippi Supreme Court, which remains pending against Mississippi Power and the Mississippi PSC.
Seven-Year Rate Plan
Also consistent with the Settlement Agreement, on February 26, 2013, Mississippi Power filed with the Mississippi PSC a rate recovery plan for the Kemper IGCC for the first
seven years
of its operation, along with a proposed revenue requirement under such plan for 2014 through 2020 (
Seven
-Year Rate Plan).
II-87
NOTES (continued)
Southern Company and Subsidiary Companies 2013 Annual Report
On March 22, 2013, Mississippi Power, in compliance with the 2013 MPSC Rate Order, filed a revision to the
Seven
-Year Rate Plan with the Mississippi PSC for the Kemper IGCC for cost recovery through 2020, which is still under review by the Mississippi PSC. In the
Seven
-Year Rate Plan, Mississippi Power proposed recovery of an annual revenue requirement of approximately
$156 million
of Kemper IGCC-related operational costs and rate base amounts, including plant costs equal to the
$2.4 billion
certificated cost estimate. The 2013 MPSC Rate Order, which increased rates beginning on March 19, 2013, is integral to the
Seven
-Year Rate Plan, which contemplates amortization of the regulatory liability balance at the in-service date to be used to mitigate customer rate impacts through 2020, based on a fixed amortization schedule that requires approval by the Mississippi PSC. Under the
Seven
-Year Rate Plan filing, Mississippi Power proposed annual rate recovery to remain the same from 2014 through 2020. At the time of the filing of the
Seven
-Year Rate Plan, the proposed revenue requirement approximated the forecasted cost of service for the period 2014 through 2020. Under Mississippi Power's proposal, to the extent that the actual annual cost of service differs from the forecast approved in the
Seven
-Year Rate Plan, the difference would be deferred as a regulatory asset or liability, subject to accrual of carrying costs, and would be included in the next year's rate recovery calculation. If any deferred balance remains at the end of the
Seven
-Year Rate Plan term, the Mississippi PSC will review the amount and determine the appropriate method and period of disposition.
The revenue requirements set forth in the
Seven
-Year Rate Plan assume the sale of a
15%
undivided interest in the Kemper IGCC to South Mississippi Electric Power Association (SMEPA) and utilization of bonus depreciation as provided by the American Taxpayer Relief Act of 2012 (ATRA), which currently requires that the Kemper IGCC be placed in service in 2014. See "Investment Tax Credits and Bonus Depreciation" herein for additional information regarding bonus depreciation.
In 2014, Mississippi Power plans to amend the
Seven
-Year Rate Plan to reflect changes including the revised in-service date, the change in expected benefits relating to tax credits, various other revenue requirement items, and other tax matters, which include ensuring compliance with the normalization requirements of the Internal Revenue Code. The impact of these revisions for the average annual retail revenue requirement is estimated to be approximately
$35 million
through 2020. The amendment to the
Seven
-Year Rate Plan is also expected to reflect rate mitigation options identified by Mississippi Power that, if approved by the Mississippi PSC, would result in no change to the total customer rate impacts contemplated in the original
Seven
-Year Rate Plan.
Further cost increases and/or schedule extensions with respect to the Kemper IGCC could have an adverse impact on the
Seven
-Year Rate Plan, such as the inability to recover items considered as Cost Cap Exceptions, potential costs subject to securitization financing in excess of
$1.0 billion
, and the loss of certain tax benefits related to bonus depreciation. While the Kemper IGCC is scheduled to be placed in service in the fourth quarter 2014, any schedule extension beyond 2014 would result in the loss of the tax benefits related to bonus depreciation. The estimated value of the bonus depreciation tax benefits to retail customers is approximately
$200 million
. Loss of these tax benefits would require further adjustment to the
Seven
-Year Rate Plan and approval by the Mississippi PSC to ensure compliance with the normalization requirements of the Internal Revenue Code. In the event that the Mississippi PSC does not approve or Mississippi Power withdraws the
Seven
-Year Rate Plan, Mississippi Power would seek rate recovery through an alternate means, which could include a traditional rate case.
Prudence Reviews
The Mississippi PSC’s prudence review of Kemper IGCC costs incurred through March 31, 2013, as provided for in the Settlement Agreement, is expected to occur in the second quarter 2014. A final review of all costs incurred after March 31, 2013 is expected to be completed within
six months
of the Kemper IGCC’s in-service date. Furthermore, regardless of any prudence determinations made during the construction and start-up period, the Mississippi PSC has the right to make a final prudence determination after the Kemper IGCC has been placed in service.
Regulatory Assets
Consistent with the treatment of non-capital costs incurred during the pre-construction period, the Mississippi PSC granted Mississippi Power the authority to defer all non-capital Kemper IGCC-related costs to a regulatory asset during the construction period, subject to review of such costs by the Mississippi PSC. The amortization period for any such costs approved for recovery will be determined by the Mississippi PSC at a later date. In addition, Mississippi Power is authorized to accrue carrying costs on the unamortized balance of such regulatory assets at a rate and in a manner to be determined by the Mississippi PSC in future cost recovery mechanism proceedings.
Lignite Mine and CO
2
Pipeline Facilities
In conjunction with the Kemper IGCC, Mississippi Power will own the lignite mine and equipment and has acquired and will continue to acquire mineral reserves located around the Kemper IGCC site. The mine started commercial operation on June 5, 2013.
II-88
NOTES (continued)
Southern Company and Subsidiary Companies 2013 Annual Report
In 2010, Mississippi Power executed a
40
-year management fee contract with Liberty Fuels Company, LLC, a wholly-owned subsidiary of The North American Coal Corporation (Liberty Fuels), which will develop, construct, and manage the mining operations. The contract with Liberty Fuels is effective through the end of the mine reclamation. As the mining permit holder, Liberty Fuels has a legal obligation to perform mine reclamation and Mississippi Power has a contractual obligation to fund all reclamation activities. In addition to the obligation to fund the reclamation activities, Mississippi Power currently provides working capital support to Liberty Fuels through cash advances for capital purchases, payroll, and other operating expenses. See Note 1 under "Asset Retirement Obligations and Other Costs of Removal" for additional information.
In addition, Mississippi Power will acquire, construct, and operate the CO
2
pipeline for the planned transport of captured CO
2
for use in enhanced oil recovery. Mississippi Power has entered into agreements with Denbury Onshore (Denbury), a subsidiary of Denbury Resources Inc., and Treetop Midstream Services, LLC (Treetop), an affiliate of Tellus Operating Group, LLC and a subsidiary of Tengrys, LLC, pursuant to which Denbury will purchase
70%
of the CO
2
captured from the Kemper IGCC and Treetop will purchase
30%
of the CO
2
captured from the Kemper IGCC.
The ultimate outcome of these matters cannot be determined at this time.
Proposed Sale of Undivided Interest to SMEPA
In 2010, Mississippi Power and SMEPA entered into an asset purchase agreement whereby SMEPA agreed to purchase a
17.5%
undivided interest in the Kemper IGCC. In February 2012, the Mississippi PSC approved the sale and transfer of
17.5%
of the Kemper IGCC to SMEPA. In June 2012, Mississippi Power and SMEPA signed an amendment to the asset purchase agreement whereby SMEPA reduced its purchase commitment percentage from a
17.5%
to a
15%
undivided interest in the Kemper IGCC. On March 29, 2013, Mississippi Power and SMEPA signed an amendment to the asset purchase agreement whereby Mississippi Power and SMEPA agreed to amend the power supply agreement entered into by the parties in April 2011 to reduce the capacity amounts to be received by SMEPA by half (approximately
75
MWs) at the sale and transfer of the undivided interest in the Kemper IGCC to SMEPA. Capacity revenues under the April 2011 power supply agreement were
$17.5 million
in 2013. On December 24, 2013, Mississippi Power and SMEPA agreed to extend SMEPA's option to purchase through December 31, 2014. The sale and transfer of an interest in the Kemper IGCC to SMEPA is subject to approval by the Mississippi PSC.
The closing of this transaction is conditioned upon execution of a joint ownership and operating agreement, receipt of all construction permits, appropriate regulatory approvals, financing, and other conditions. In September 2012, SMEPA received a conditional loan commitment from Rural Utilities Service to provide funding for SMEPA's undivided interest in the Kemper IGCC.
In March 2012 and subsequent to December 31, 2013, Mississippi Power received
$150 million
and
$75 million
, respectively, of interest-bearing refundable deposits from SMEPA to be applied to the purchase. While the expectation is that these amounts will be applied to the purchase price at closing, Mississippi Power would be required to refund the deposits upon the termination of the asset purchase agreement, within
60
days of a request by SMEPA for a full or partial refund, or within
15
days at SMEPA's discretion in the event that Mississippi Power is assigned a senior unsecured credit rating of BBB+ or lower by Standard and Poor's Ratings Services, a division of The McGraw Hill Companies, Inc. (S&P) or Baa1 or lower by Moody's Investors Service, Inc. (Moody's) or ceases to be rated by either of these rating agencies. Given the interest-bearing nature of the deposit and SMEPA's ability to request a refund, the March 2012 deposit has been presented as a current liability in the balance sheet and as financing proceeds in the statement of cash flow. On July 18, 2013, Southern Company entered into an agreement with SMEPA under which Southern Company has agreed to guarantee the obligations of Mississippi Power with respect to any required refund of the deposits.
The ultimate outcome of these matters cannot be determined at this time.
Baseload Act
In 2008, the Baseload Act was signed by the Governor of Mississippi. The Baseload Act authorizes, but does not require, the Mississippi PSC to adopt a cost recovery mechanism that includes in retail base rates, prior to and during construction, all or a portion of the prudently-incurred pre-construction and construction costs incurred by a utility in constructing a base load electric generating plant. Prior to the passage of the Baseload Act, such costs would traditionally be recovered only after the plant was placed in service. The Baseload Act also provides for periodic prudence reviews by the Mississippi PSC and prohibits the cancellation of any such generating plant without the approval of the Mississippi PSC. In the event of cancellation of the construction of the plant without approval of the Mississippi PSC, the Baseload Act authorizes the Mississippi PSC to make a public interest determination as to whether and to what extent the utility will be afforded rate recovery for costs incurred in connection with such cancelled generating plant. There are legal challenges to the constitutionality of the Baseload Act currently
II-89
NOTES (continued)
Southern Company and Subsidiary Companies 2013 Annual Report
pending before the Mississippi Supreme Court. The ultimate outcome of any legal challenges to this legislation cannot be determined at this time. See "Rate Recovery of Kemper IGCC Costs" herein for additional information.
Investment Tax Credits and Bonus Depreciation
The IRS allocated
$133 million
(Phase I) and
$279 million
(Phase II) of Internal Revenue Code Section 48A tax credits to Mississippi Power in connection with the Kemper IGCC. On May 15, 2013, the IRS notified Mississippi Power that no additional tax credits under the Internal Revenue Code Section 48A Phase III were allocated to the Kemper IGCC. As a result of the schedule extension for the Kemper IGCC, the Phase I credits have been recaptured. Through December 31, 2013, Mississippi Power had recorded tax benefits totaling
$276.4 million
for the remaining Phase II credits, which will be amortized as a reduction to depreciation and amortization over the life of the Kemper IGCC and are dependent upon meeting the IRS certification requirements, including an in-service date no later than April 19, 2016 and the capture and sequestration (via enhanced oil recovery) of at least
65%
of the CO
2
produced by the Kemper IGCC during operations in accordance with the Internal Revenue Code. A portion of the Phase II tax credits will be subject to recapture upon successful completion of SMEPA's purchase of an undivided interest in the Kemper IGCC as described above.
On January 2, 2013, the ATRA was signed into law. The ATRA retroactively extended several tax credits through 2013 and extended
50%
bonus depreciation for property placed in service in 2013 (and for certain long-term production-period projects to be placed in service in 2014), which is expected to apply to the Kemper IGCC and have a positive impact on the future cash flows of Mississippi Power of between
$560 million
and
$620 million
in 2014. These estimated positive cash flow impacts are dependent upon placing the Kemper IGCC in service in 2014. See "Rate Recovery of Kemper IGCC Costs – Seven-Year Rate Plan" herein for additional information.
The ultimate outcome of these matters cannot be determined at this time.
4. JOINT OWNERSHIP AGREEMENTS
Alabama Power owns an undivided interest in Units 1 and 2 at Plant Miller and related facilities jointly with PowerSouth Energy Cooperative, Inc. Georgia Power owns undivided interests in Plants Vogtle, Hatch, Wansley, and Scherer in varying amounts jointly with one or more of the following entities: OPC, MEAG Power, the City of Dalton, Georgia, Florida Power & Light Company, and Jacksonville Electric Authority. In addition, Georgia Power has joint ownership agreements with OPC for the Rocky Mountain facilities and with Duke Energy Florida, Inc. for a combustion turbine unit at Intercession City, Florida. Southern Power owns an undivided interest in Plant Stanton Unit A and related facilities jointly with the Orlando Utilities Commission, Kissimmee Utility Authority, and Florida Municipal Power Agency.
At
December 31, 2013
, Alabama Power's, Georgia Power's, and Southern Power's percentage ownership and investment (exclusive of nuclear fuel) in jointly-owned facilities in commercial operation with the above entities were as follows:
|
Facility (Type)
|
Percent
Ownership
|
Plant in Service
|
Accumulated
Depreciation
|
CWIP
|
||||||||||
|
(in millions)
|
||||||||||||||
|
Plant Vogtle (nuclear) Units 1 and 2
|
45.7
|
%
|
$
|
3,375
|
|
$
|
2,028
|
|
$
|
53
|
|
|||
|
Plant Hatch (nuclear)
|
50.1
|
|
1,092
|
|
551
|
|
52
|
|
||||||
|
Plant Miller (coal) Units 1 and 2
|
91.8
|
|
1,410
|
|
575
|
|
89
|
|
||||||
|
Plant Scherer (coal) Units 1 and 2
|
8.4
|
|
209
|
|
80
|
|
24
|
|
||||||
|
Plant Wansley (coal)
|
53.5
|
|
800
|
|
260
|
|
36
|
|
||||||
|
Rocky Mountain (pumped storage)
|
25.4
|
|
182
|
|
120
|
|
—
|
|
||||||
|
Intercession City (combustion turbine)
|
33.3
|
|
14
|
|
4
|
|
—
|
|
||||||
|
Plant Stanton (combined cycle) Unit A
|
65.0
|
|
156
|
|
42
|
|
—
|
|
||||||
Georgia Power also owns
45.7%
of Plant Vogtle Units 3 and 4 that are currently under construction. See Note 3 under "Retail Regulatory Matters – Georgia Power – Nuclear Construction" for additional information.
Alabama Power, Georgia Power, and Southern Power have contracted to operate and maintain the jointly-owned facilities, except for Rocky Mountain and Intercession City, as agents for their respective co-owners. The companies' proportionate share of their plant operating expenses is included in the corresponding operating expenses in the statements of income and each company is responsible for providing its own financing.
II-90
NOTES (continued)
Southern Company and Subsidiary Companies 2013 Annual Report
5. INCOME TAXES
Southern Company files a consolidated federal income tax return, combined state income tax returns for the States of Alabama, Georgia, and Mississippi, and unitary income tax returns for the States of California, North Carolina, and Texas. Under a joint consolidated income tax allocation agreement, each Southern Company subsidiary's current and deferred tax expense is computed on a stand-alone basis and no subsidiary is allocated more current expense than would be paid if it filed a separate income tax return. In accordance with IRS regulations, each company is jointly and severally liable for the federal tax liability.
Current and Deferred Income Taxes
Details of income tax provisions are as follows:
|
2013
|
2012
|
2011
|
|||||||||
|
(in millions)
|
|||||||||||
|
Federal —
|
|||||||||||
|
Current
|
$
|
363
|
|
$
|
177
|
|
$
|
57
|
|
||
|
Deferred
|
386
|
|
1,011
|
|
1,035
|
|
|||||
|
749
|
|
1,188
|
|
1,092
|
|
||||||
|
State —
|
|||||||||||
|
Current
|
(10
|
)
|
61
|
|
8
|
|
|||||
|
Deferred
|
110
|
|
85
|
|
119
|
|
|||||
|
100
|
|
146
|
|
127
|
|
||||||
|
Total
|
$
|
849
|
|
$
|
1,334
|
|
$
|
1,219
|
|
||
Net cash payments/(refunds) for income taxes in
2013
,
2012
, and
2011
were
$139 million
,
$38 million
, and
$(401) million
, respectively.
II-91
NOTES (continued)
Southern Company and Subsidiary Companies 2013 Annual Report
The tax effects of temporary differences between the carrying amounts of assets and liabilities in the financial statements and their respective tax bases, which give rise to deferred tax assets and liabilities, are as follows:
|
2013
|
2012
|
||||||
|
(in millions)
|
|||||||
|
Deferred tax liabilities —
|
|||||||
|
Accelerated depreciation
|
$
|
9,710
|
|
$
|
9,022
|
|
|
|
Property basis differences
|
1,515
|
|
1,254
|
|
|||
|
Leveraged lease basis differences
|
287
|
|
278
|
|
|||
|
Employee benefit obligations
|
491
|
|
536
|
|
|||
|
Premium on reacquired debt
|
113
|
|
84
|
|
|||
|
Regulatory assets associated with employee benefit obligations
|
705
|
|
988
|
|
|||
|
Regulatory assets associated with asset retirement obligations
|
824
|
|
1,108
|
|
|||
|
Other
|
350
|
|
349
|
|
|||
|
Total
|
13,995
|
|
13,619
|
|
|||
|
Deferred tax assets —
|
|||||||
|
Federal effect of state deferred taxes
|
421
|
|
394
|
|
|||
|
Employee benefit obligations
|
1,048
|
|
1,678
|
|
|||
|
Over recovered fuel clause
|
30
|
|
135
|
|
|||
|
Other property basis differences
|
157
|
|
134
|
|
|||
|
Deferred costs
|
84
|
|
39
|
|
|||
|
ITC carryforward
|
121
|
|
256
|
|
|||
|
Unbilled revenue
|
116
|
|
101
|
|
|||
|
Other comprehensive losses
|
54
|
|
84
|
|
|||
|
Asset retirement obligations
|
824
|
|
720
|
|
|||
|
Estimated Loss on Kemper IGCC
|
472
|
|
—
|
|
|||
|
Deferred state tax assets
|
77
|
|
68
|
|
|||
|
Other
|
220
|
|
363
|
|
|||
|
Total
|
3,624
|
|
3,972
|
|
|||
|
Valuation allowance
|
(49
|
)
|
(54
|
)
|
|||
|
Total deferred tax assets
|
3,575
|
|
3,918
|
|
|||
|
Total deferred tax liabilities, net
|
10,420
|
|
9,701
|
|
|||
|
Portion included in prepaid expenses (accrued income taxes), net
|
143
|
|
237
|
|
|||
|
Accumulated deferred income taxes
|
$
|
10,563
|
|
$
|
9,938
|
|
|
At
December 31, 2013
, Southern Company had subsidiaries with State of Georgia net operating loss (NOL) carryforwards totaling
$707 million
, which could result in net state income tax benefits of
$41 million
, if utilized. However, the subsidiaries have established a valuation allowance for the potential
$41 million
tax benefit due to the remote likelihood that the tax benefit will be realized. These NOLs expire between 2018 and 2021. Beginning in 2002, the State of Georgia allowed Southern Company to file a combined return, which has prevented the creation of any additional NOL carryforwards.
At
December 31, 2013
, Southern Company had an ITC carryforward which is expected to result in
$28 million
of federal income tax benefit. The ITC carryforward expires in 2023, but is expected to be utilized in 2014. Additionally, Southern Company had a state ITC carryforward of
$118 million
, which will expire between 2020 and 2024.
At
December 31, 2013
, the tax-related regulatory assets to be recovered from customers were
$1.4 billion
. These assets are primarily attributable to tax benefits flowed through to customers in prior years, deferred taxes previously recognized at rates lower than the current enacted tax law, and taxes applicable to capitalized interest.
II-92
NOTES (continued)
Southern Company and Subsidiary Companies 2013 Annual Report
At
December 31, 2013
, the tax-related regulatory liabilities to be credited to customers were
$202 million
. These liabilities are primarily attributable to deferred taxes previously recognized at rates higher than the current enacted tax law and to unamortized ITCs.
In accordance with regulatory requirements, deferred federal ITCs are amortized over the life of the related property with such amortization normally applied as a credit to reduce depreciation in the statements of income. Credits amortized in this manner amounted to
$16 million
in
2013
,
$23 million
in
2012
, and
$19 million
in
2011
. At
December 31, 2013
, all ITCs available to reduce federal income taxes payable had not been utilized. The remaining ITCs will be carried forward and utilized in future years.
In 2010, the Tax Relief, Unemployment Insurance Reauthorization, and Job Creation Act of 2010 (Tax Relief Act) was signed into law. Major tax incentives in the Tax Relief Act include
100%
bonus depreciation for property placed in service after September 8, 2010 and through 2011 (and for certain long-term production-period projects placed in service in 2012) and
50%
bonus depreciation for property placed in service in 2012 (and for certain long-term production-period projects placed in service in 2013).
On January 2, 2013, ATRA was signed into law. The ATRA retroactively extended several tax credits through 2013 and extended
50%
bonus depreciation for property placed in service in 2013 (and for certain long-term production-period projects to be placed in service in 2014, including the Kemper IGCC, which is scheduled for completion in 2014).
The application of the bonus depreciation provisions in these laws significantly increased deferred tax liabilities related to accelerated depreciation in 2013, 2012, and 2011.
Effective Tax Rate
A reconciliation of the federal statutory income tax rate to the effective income tax rate is as follows:
|
2013
|
2012
|
2011
|
||||||
|
Federal statutory rate
|
35.0
|
%
|
35.0
|
%
|
35.0
|
%
|
||
|
State income tax, net of federal deduction
|
2.5
|
|
2.5
|
|
2.4
|
|
||
|
Employee stock plans dividend deduction
|
(1.6
|
)
|
(1.0
|
)
|
(1.1
|
)
|
||
|
Non-deductible book depreciation
|
1.5
|
|
0.9
|
|
0.7
|
|
||
|
AFUDC-Equity
|
(2.6
|
)
|
(1.3
|
)
|
(1.5
|
)
|
||
|
ITC basis difference
|
(1.2
|
)
|
(0.3
|
)
|
(0.2
|
)
|
||
|
Other
|
(0.5
|
)
|
(0.2
|
)
|
(0.3
|
)
|
||
|
Effective income tax rate
|
33.1
|
%
|
35.6
|
%
|
35.0
|
%
|
||
Southern Company's effective tax rate is typically lower than the statutory rate due to its employee stock plans' dividend deduction and non-taxable AFUDC equity. Additionally, the 2013 effective rate decrease, as compared to 2012, is primarily due to an increase in non-taxable AFUDC equity. No material change occurred in the effective tax rate from 2011 to 2012.
Unrecognized Tax Benefits
Changes during the year in unrecognized tax benefits were as follows:
|
2013
|
2012
|
2011
|
|||||||||
|
(in millions)
|
|||||||||||
|
Unrecognized tax benefits at beginning of year
|
$
|
70
|
|
$
|
120
|
|
$
|
296
|
|
||
|
Tax positions from current periods
|
3
|
|
13
|
|
46
|
|
|||||
|
Tax positions increase from prior periods
|
—
|
|
7
|
|
1
|
|
|||||
|
Tax positions decrease from prior periods
|
(66
|
)
|
(56
|
)
|
(111
|
)
|
|||||
|
Reductions due to settlements
|
—
|
|
(10
|
)
|
(112
|
)
|
|||||
|
Reductions due to expired statute of limitations
|
—
|
|
(4
|
)
|
—
|
|
|||||
|
Balance at end of year
|
$
|
7
|
|
$
|
70
|
|
$
|
120
|
|
||
The tax positions decrease from prior periods for 2013 relate primarily to the tax accounting method change for repairs-generation assets. See "Tax Method of Accounting for Repairs" herein for additional information.
II-93
NOTES (continued)
Southern Company and Subsidiary Companies 2013 Annual Report
The impact on Southern Company's effective tax rate, if recognized, is as follows:
|
2013
|
2012
|
2011
|
|||||||||
|
(in millions)
|
|||||||||||
|
Tax positions impacting the effective tax rate
|
$
|
7
|
|
$
|
5
|
|
$
|
69
|
|
||
|
Tax positions not impacting the effective tax rate
|
—
|
|
65
|
|
51
|
|
|||||
|
Balance of unrecognized tax benefits
|
$
|
7
|
|
$
|
70
|
|
$
|
120
|
|
||
The tax positions impacting the effective tax rate for 2013 primarily relate to state income tax credits. These amounts are presented on a gross basis without considering the related federal or state income tax impact.
Accrued interest for unrecognized tax benefits was as follows:
|
2013
|
2012
|
2011
|
|||||||||
|
(in millions)
|
|||||||||||
|
Interest accrued at beginning of year
|
$
|
1
|
|
$
|
10
|
|
$
|
29
|
|
||
|
Interest reclassified due to settlements
|
—
|
|
(9
|
)
|
(24
|
)
|
|||||
|
Interest accrued during the year
|
—
|
|
—
|
|
5
|
|
|||||
|
Balance at end of year
|
$
|
1
|
|
$
|
1
|
|
$
|
10
|
|
||
Southern Company classifies interest on tax uncertainties as interest expense. Southern Company did not accrue any penalties on uncertain tax positions.
It is reasonably possible that the amount of the unrecognized tax benefits could change within
12 months
. The settlement of federal and state audits could impact the balances significantly. At this time, an estimate of the range of reasonably possible outcomes cannot be determined.
The IRS has finalized its audits of Southern Company's consolidated federal income tax returns through 2011. Southern Company has filed its 2012 federal income tax return and has received a full acceptance letter from the IRS; however, the IRS has not finalized its audit. For tax years 2012 and 2013, Southern Company was a participant in the Compliance Assurance Process of the IRS. The audits for Southern Company's state income tax returns have either been concluded, or the statute of limitations has expired, for years prior to 2007.
Tax Method of Accounting for Repairs
In 2011, the IRS published regulations on the deduction and capitalization of expenditures related to tangible property that generally apply for tax years beginning on or after January 1, 2014. Additionally, on April 30, 2013, the IRS issued Revenue Procedure 2013-24, which provides guidance for taxpayers related to the deductibility of repair costs associated with generation assets. Based on a review of the regulations, Southern Company incorporated provisions related to repair costs for generation assets into its consolidated 2012 federal income tax return and reversed all related unrecognized tax positions. On September 19, 2013, the IRS issued Treasury Decision 9636, "Guidance Regarding Deduction and Capitalization of Expenditures Related to Tangible Property," which are final tangible property regulations applicable to taxable years beginning on or after January 1, 2014. Southern Company is currently reviewing this new guidance. The ultimate outcome of this matter cannot be determined at this time; however, these regulations are not expected to have a material impact on the Company's financial statements.
6. FINANCING
Alabama Power has formed a wholly-owned trust subsidiary for the purpose of issuing preferred securities. The proceeds of the related equity investments and preferred security sales were loaned back to Alabama Power through the issuance of junior subordinated notes totaling
$206 million
as of
December 31, 2013
and
2012
, which constitute substantially all of the assets of this trust and are reflected in the balance sheets as long-term debt payable. Alabama Power considers that the mechanisms and obligations relating to the preferred securities issued for its benefit, taken together, constitute a full and unconditional guarantee by it of the trust's payment obligations with respect to these securities. At each of
December 31, 2013
and
2012
, trust preferred securities of
$200 million
were outstanding.
II-94
NOTES (continued)
Southern Company and Subsidiary Companies 2013 Annual Report
Securities Due Within One Year
A summary of scheduled maturities and redemptions of securities due within one year at December 31 was as follows:
|
2013
|
2012
|
||||||
|
(in millions)
|
|||||||
|
Senior notes
|
$
|
428
|
|
$
|
2,085
|
|
|
|
Other long-term debt
|
12
|
|
227
|
|
|||
|
Capitalized leases
|
29
|
|
23
|
|
|||
|
Total
|
$
|
469
|
|
$
|
2,335
|
|
|
Maturities through 2018 applicable to total long-term debt are as follows:
$469 million
in 2014;
$2.97 billion
in 2015;
$1.83 billion
in 2016;
$1.14 billion
in 2017; and
$880 million
in 2018.
Bank Term Loans
Certain of the traditional operating companies have entered into various floating rate bank term loan agreements for loans bearing interest based on
one-month
London Interbank Offered Rate (LIBOR). At
December 31, 2013
, Georgia Power had outstanding bank term loans totaling
$400 million
, which are reflected in notes payable on the balance sheets. Also at
December 31, 2013
, Mississippi Power had outstanding bank term loans totaling
$525 million
, which are reflected in the statements of capitalization as long-term debt. At
December 31, 2012
, Mississippi Power had outstanding bank term loans totaling
$175 million
.
During 2013, the traditional operating companies repaid approximately
$550 million
of floating rate bank notes bearing interest based on
one-month
LIBOR.
During
2012
, Mississippi Power entered into a
366
-day
$100 million
aggregate principal amount floating rate bank loan bearing interest based on
one-month
LIBOR. The first advance in the amount of
$50 million
was made in November 2012. In January 2013, the second advance in the amount of
$50 million
was made. In September 2013, Mississippi Power amended the bank loan, which extended the maturity date to 2015. The proceeds of this loan were used for working capital and for other general corporate purposes, including Mississippi Power's continuous construction program.
In March 2013, Mississippi Power entered into
four
two
-year floating rate bank loans bearing interest based on
one-month
LIBOR. These term loans were for an aggregate principal amount of
$300 million
and proceeds were used for working capital and other general corporate purposes, including Mississippi Power's continuous construction program.
In September 2013, Mississippi Power entered into a
two
-year floating rate bank loan bearing interest based on
one-month
LIBOR. The term loan was for
$125 million
aggregate principal amount and proceeds were used to repay at maturity a
two
-year floating rate bank loan in the aggregate principal amount of
$125 million
.
In November 2013, Georgia Power entered into
three
four
-month floating rate bank loans for an aggregate principal amount of
$400 million
, bearing interest based on
one-month
LIBOR. The proceeds of these short-term loans were used for working capital and other general corporate purposes, including Georgia Power's continuous construction program. Subsequent to December 31, 2013, Georgia Power repaid these bank term loans.
Subsequent to December 31, 2013, Mississippi Power entered into an
18
-month floating rate bank loan bearing interest based on
one-month
LIBOR. The term loan was for
$250 million
aggregate principal amount and proceeds were used for working capital and other general corporate purposes, including Mississippi Power’s continuous construction program.
These bank loans have covenants that limit debt levels to
65%
of total capitalization, as defined in the agreements. For purposes of these definitions, debt excludes the long-term debt payable to affiliated trusts and other hybrid securities and, for Mississippi Power, securitized debt relating to the securitization of certain costs of the Kemper IGCC. At
December 31, 2013
, Georgia Power and Mississippi Power were in compliance with their respective debt limits.
DOE Loan Guarantee Borrowings
Pursuant to the loan guarantee program established under Title XVII of the Energy Policy Act of 2005 (Title XVII Loan Guarantee Program), Georgia Power and the DOE entered into a loan guarantee agreement (Loan Guarantee Agreement) on February 20, 2014, under which the DOE agreed to guarantee the obligations of Georgia Power under a note purchase agreement (FFB Note Purchase Agreement) among the DOE, Georgia Power, and the Federal Financing Bank (FFB) and a related promissory note (FFB Promissory Note). The FFB Note Purchase Agreement and the FFB Promissory Note provide for a multi-advance term loan facility (FFB Credit Facility), under which Georgia Power may make term loan borrowings through the FFB.
II-95
NOTES (continued)
Southern Company and Subsidiary Companies 2013 Annual Report
Proceeds of advances made under the FFB Credit Facility will be used to reimburse Georgia Power for a portion of certain costs of construction relating to Plant Vogtle Units 3 and 4 that are eligible for financing under the Title XVII Loan Guarantee Program (Eligible Project Costs). Aggregate borrowings under the FFB Credit Facility may not exceed the lesser of (i)
70%
of Eligible Project Costs or (ii) approximately
$3.46 billion
.
All borrowings under the FFB Credit Facility are full recourse to Georgia Power, and Georgia Power is obligated to reimburse the DOE in the event the DOE is required to make any payments to FFB under the DOE guarantee. Georgia Power's reimbursement obligations to the DOE are secured by a first priority lien on (i) Georgia Power's
45.7%
undivided ownership interest in Plant Vogtle Units 3 and 4 and (ii) Georgia Power's rights and obligations under the principal contracts relating to Plant Vogtle Units 3 and 4. There are no restrictions on Georgia Power's ability to grant liens on other property.
Advances may be requested under the FFB Credit Facility on a quarterly basis through December 31, 2020. The final maturity date for each advance under the FFB Credit Facility is February 20, 2044. Interest is payable quarterly and principal payments will begin on February 20, 2020. Borrowings under the FFB Credit Facility will bear interest at the applicable U.S. Treasury rate plus a spread equal to
0.375%
.
On February 20, 2014, Georgia Power made initial borrowings under the FFB Credit Facility in an aggregate principal amount of
$1.0 billion
. The interest rate applicable to
$500 million
of the initial advance under the FFB Credit Facility is
3.860%
for an interest period that extends to February 20, 2044 (the final maturity date) and the interest rate applicable to the remaining
$500 million
is
3.488%
for an interest period that extends to February 20, 2029, and will be reset from time to time thereafter through the final maturity date. In connection with its entry into the Loan Guarantee Agreement, the FFB Note Purchase Agreement, and the FFB Promissory Note, Georgia Power incurred issuance costs of approximately
$67 million
, which will be amortized over the life of the borrowings under the FFB Credit Facility.
Future advances are subject to satisfaction of customary conditions, as well as certification of compliance with the requirements of the Title XVII Loan Guarantee Program, including accuracy of project-related representations and warranties, delivery of updated project-related information, and evidence of compliance with the prevailing wage requirements of the Davis-Bacon Act of 1931, as amended, compliance with the Cargo Preference Act of 1954, and certification from the DOE's consulting engineer that proceeds of the advances are used to reimburse Eligible Project Costs.
Under the Loan Guarantee Agreement, Georgia Power is subject to customary borrower affirmative and negative covenants and events of default. In addition, Georgia Power is subject to project-related reporting requirements and other project-specific covenants and events of default.
In the event certain mandatory prepayment events occur, the FFB’s commitment to make further advances under the FFB Credit Facility will terminate and Georgia Power will be required to prepay the outstanding principal amount of all borrowings under the FFB Credit Facility over a period of
five years
(with level principal amortization). Under certain circumstances, insurance proceeds and any proceeds from an event of taking must be applied to immediately prepay outstanding borrowings under the FFB Credit Facility. Georgia Power also may voluntarily prepay outstanding borrowings under the FFB Credit Facility. Under the FFB Promissory Note, any prepayment (whether mandatory or optional) will be made with a make-whole premium or discount, as applicable.
In connection with any cancellation of Plant Vogtle Units 3 and 4 that results in a mandatory prepayment event, the DOE may elect to continue construction of Plant Vogtle Units 3 and 4. In such an event, the DOE will have the right to assume Georgia Power’s rights and obligations under the principal agreements relating to Plant Vogtle Units 3 and 4 and to acquire all or a portion of Georgia Power’s ownership interest in Plant Vogtle Units 3 and 4.
Senior Notes
Southern Company and its subsidiaries issued a total of
$2.1 billion
of senior notes in
2013
. Southern Company issued
$500 million
and its subsidiaries issued a total of
$1.6 billion
. The proceeds of these issuances were used to repay long-term indebtedness, to repay short-term indebtedness, and for other general corporate purposes, including the applicable subsidiaries' continuous construction programs.
At
December 31, 2013
and
2012
, Southern Company and its subsidiaries had a total of
$17.3 billion
and
$17.4 billion
, respectively, of senior notes outstanding. At
December 31, 2013
and
2012
, Southern Company had a total of
$1.8 billion
and
$1.3 billion
, respectively, of senior notes outstanding.
Since Southern Company is a holding company, the right of Southern Company and, hence, the right of creditors of Southern Company (including holders of Southern Company senior notes) to participate in any distribution of the assets of any subsidiary of Southern Company, whether upon liquidation, reorganization or otherwise, is subject to prior claims of creditors and preferred and preference stockholders of such subsidiary.
II-96
NOTES (continued)
Southern Company and Subsidiary Companies 2013 Annual Report
Pollution Control Revenue Bonds
Pollution control obligations represent loans to the traditional operating companies from public authorities of funds derived from sales by such authorities of revenue bonds issued to finance pollution control and solid waste disposal facilities. In some cases, the pollution control obligations represent obligations under installment sales agreements with respect to facilities constructed with the proceeds of pollution control bonds issued by public authorities. The traditional operating companies had
$3.2 billion
and
$3.4 billion
of outstanding pollution control revenue bonds at
December 31, 2013
and
2012
, respectively. The traditional operating companies are required to make payments sufficient for the authorities to meet principal and interest requirements of such bonds. Proceeds from certain issuances are restricted until qualifying expenditures are incurred.
Plant Daniel Revenue Bonds
In 2011, in connection with Mississippi Power's election under its operating lease of Plant Daniel Units 3 and 4 to purchase the assets, Mississippi Power assumed the obligations of the lessor related to
$270 million
aggregate principal amount of Mississippi Business Finance Corporation Taxable Revenue Bonds,
7.13%
Series 1999A due October 21, 2021, issued for the benefit of the lessor. See "Assets Subject to Lien" herein for additional information.
Other Revenue Bonds
Other revenue bond obligations represent loans to Mississippi Power from a public authority of funds derived from the sale by such authority of revenue bonds issued to finance a portion of the costs of constructing the Kemper IGCC and related facilities.
In March 2013 and July 2013, the Mississippi Business Finance Corporation (MBFC) issued
$15.8 million
and
$15.3 million
, respectively, aggregate principal amount of MBFC Taxable Revenue Bonds (Mississippi Power Company Project), Series 2012A. The proceeds were used to reimburse Mississippi Power for the cost of the acquisition, construction, equipping, installation, and improvement of certain equipment and facilities for the lignite mining facility related to the Kemper IGCC. In September 2013, the MBFC Taxable Revenue Bonds (Mississippi Power Company Project), Series 2012A of
$40.07 million
, Series 2012B of
$21.25 million
, and Series 2012C of
$21.25 million
were paid at maturity.
In November 2013, the MBFC entered into an agreement to issue up to
$33.75 million
aggregate principal amount of MBFC Taxable Revenue Bonds, Series 2013A (Mississippi Power Company Project) and up to
$11.25 million
aggregate principal amount of MBFC Taxable Revenue Bonds, Series 2013B (Mississippi Power Company Project) for the benefit of Mississippi Power. In November 2013, the MBFC issued
$11.25 million
aggregate principal amount of MBFC Taxable Revenue Bonds (Mississippi Power Company Project), Series 2013B for the benefit of Mississippi Power. The proceeds were used to reimburse Mississippi Power for the cost of the acquisition, construction, equipping, installation, and improvement of certain equipment and facilities for the lignite mining facility related to the Kemper IGCC. Any future issuances of the Series 2013A bonds will be used for this same purpose.
Mississippi Power had
$50.0 million
of such obligations outstanding related to tax-exempt revenue bonds at
December 31, 2013
and
2012
and
$11.3 million
and
$51.5 million
of such obligations related to taxable revenue bonds outstanding at December 31, 2013 and 2012, respectively. Such amounts are reflected in the statements of capitalization as long-term senior notes and debt.
Capital Leases
In September 2013, Mississippi Power entered into a nitrogen supply agreement for the air separation unit of the Kemper IGCC, which resulted in a capital lease obligation at
December 31, 2013
of approximately
$83 million
with an annual interest rate of
4.9%
. Assets acquired under capital leases are recorded on the balance sheet as utility plant in service and the related obligations are classified as long-term debt.
At
December 31, 2013
and
2012
, the capitalized lease obligations for Georgia Power were
$45 million
and
$50 million
, respectively, with an interest rate of
7.9%
for both years.
At December 31, 2013, Alabama Power had a capitalized lease obligation of
$5 million
for a natural gas pipeline with an annual interest rate of
6.9%
.
At
December 31, 2013
and
2012
, a subsidiary of Southern Company had capital lease obligations of approximately
$30 million
in each period for certain computer equipment including desktops, laptops, servers, printers, and storage devices with interest rates that range from
1.4%
to
3.2%
.
Other Obligations
In March 2012 and subsequent to December 31, 2013, Mississippi Power received
$150 million
and
$75 million
, respectively, interest-bearing refundable deposits from SMEPA to be applied to the sale price for the pending sale of an undivided interest in
II-97
NOTES (continued)
Southern Company and Subsidiary Companies 2013 Annual Report
the Kemper IGCC. Until the sale is closed, the deposits bear interest at Mississippi Power's AFUDC rate adjusted for income taxes, which was
9.932%
per annum for 2013 and
9.967%
per annum for 2012, and are refundable to SMEPA upon termination of the asset purchase agreement related to such purchase, within
60
days of a request by SMEPA for a full or partial refund, or within
15
days at SMEPA's discretion in the event that Mississippi Power is assigned a senior unsecured credit rating of BBB+ or lower by S&P or Baa1 or lower by Moody's or ceases to be rated by either of these rating agencies. On July 18, 2013, Southern Company entered into an agreement with SMEPA under which Southern Company has agreed to guarantee the obligations of Mississippi Power with respect to any required refund of the deposits.
Assets Subject to Lien
Each of Southern Company's subsidiaries is organized as a legal entity, separate and apart from Southern Company and its other subsidiaries. Alabama Power and Gulf Power have granted one or more liens on certain of their respective property in connection with the issuance of certain series of pollution control revenue bonds with an outstanding principal amount of
$194 million
as of
December 31, 2013
. There are no agreements or other arrangements among the Southern Company system companies under which the assets of one company have been pledged or otherwise made available to satisfy obligations of Southern Company or any of its other subsidiaries.
In 2011, Mississippi Power purchased Plant Daniel Units 3 and 4 for approximately
$85 million
in cash and the assumption of
$270 million
face value (with a fair value on the assumption date of
$346 million
) of debt obligations of the lessor related to Plant Daniel Units 3 and 4, which mature in 2021 and bear interest at a fixed stated interest rate of
7.13%
per annum. These obligations are secured by Plant Daniel Units 3 and 4 and certain personal property.
See "DOE Loan Guarantee Borrowings" for information regarding additional secured borrowings incurred by Georgia Power subsequent to December 31, 2013.
Bank Credit Arrangements
At
December 31, 2013
, committed credit arrangements with banks were as follows:
|
Expires
(a)
|
Executable Term Loans
|
Due Within
One Year
|
|||||||||||||||||||||||||||||||||||||
|
Company
|
2014
|
2015
|
2016
|
2018
|
Total
|
Unused
|
One
Year
|
Two
Years
|
Term Out
|
No Term Out
|
|||||||||||||||||||||||||||||
|
(in millions)
|
(in millions)
|
(in millions)
|
(in millions)
|
||||||||||||||||||||||||||||||||||||
|
Southern Company
|
$
|
—
|
|
$
|
—
|
|
$
|
—
|
|
$
|
1,000
|
|
$
|
1,000
|
|
$
|
1,000
|
|
$
|
—
|
|
$
|
—
|
|
$
|
—
|
|
$
|
—
|
|
|||||||||
|
Alabama Power
|
238
|
|
35
|
|
—
|
|
1,030
|
|
1,303
|
|
1,303
|
|
53
|
|
—
|
|
53
|
|
185
|
|
|||||||||||||||||||
|
Georgia Power
|
—
|
|
—
|
|
150
|
|
1,600
|
|
1,750
|
|
1,736
|
|
—
|
|
—
|
|
—
|
|
—
|
|
|||||||||||||||||||
|
Gulf Power
|
110
|
|
—
|
|
165
|
|
—
|
|
275
|
|
275
|
|
45
|
|
—
|
|
45
|
|
65
|
|
|||||||||||||||||||
|
Mississippi Power
|
135
|
|
—
|
|
165
|
|
—
|
|
300
|
|
300
|
|
25
|
|
40
|
|
65
|
|
70
|
|
|||||||||||||||||||
|
Southern Power
|
—
|
|
—
|
|
—
|
|
500
|
|
500
|
|
500
|
|
—
|
|
—
|
|
—
|
|
—
|
|
|||||||||||||||||||
|
Other
|
75
|
|
25
|
|
—
|
|
—
|
|
100
|
|
100
|
|
25
|
|
—
|
|
25
|
|
50
|
|
|||||||||||||||||||
|
Total
|
$
|
558
|
|
$
|
60
|
|
$
|
480
|
|
$
|
4,130
|
|
$
|
5,228
|
|
$
|
5,214
|
|
$
|
148
|
|
$
|
40
|
|
$
|
188
|
|
$
|
370
|
|
|||||||||
|
(a)
|
No credit arrangements expire in 2017.
|
Most of the credit arrangements require payment of commitment fees based on the unused portion of the commitments or the maintenance of compensating balances with the banks. Commitment fees average less than
1
/
4
of 1% for Southern Company, the traditional operating companies, and Southern Power. Compensating balances are not legally restricted from withdrawal.
Southern Company and its subsidiaries expect to renew their credit arrangements as needed, prior to expiration.
Most of the credit arrangements with banks have covenants that limit debt levels to
65%
of total capitalization, as defined in the agreements. For purposes of these definitions, debt excludes the long-term debt payable to affiliated trusts and, in certain arrangements, other hybrid securities and, for Mississippi Power, securitized debt relating to the securitization of certain costs of the Kemper IGCC. At
December 31, 2013
, Southern Company, the traditional operating companies, and Southern Power were each in compliance with their respective debt limit covenants.
A portion of the
$5.2 billion
unused credit arrangements with banks is allocated to provide liquidity support to the traditional operating companies' variable rate pollution control revenue bonds and commercial paper programs. The amount of variable rate
II-98
NOTES (continued)
Southern Company and Subsidiary Companies 2013 Annual Report
pollution control revenue bonds requiring liquidity support as of
December 31, 2013
was approximately
$1.8 billion
. In addition, at December 31, 2013, the traditional operating companies had
$442 million
of fixed rate pollution control revenue bonds that will be required to be remarketed within the next 12 months.
Southern Company, the traditional operating companies, and Southern Power make short-term borrowings primarily through commercial paper programs that have the liquidity support of committed bank credit arrangements. Southern Company, the traditional operating companies, and Southern Power may also borrow through various other arrangements with banks. Commercial paper and short-term bank loans are included in notes payable in the balance sheets.
Details of short-term borrowings were as follows:
|
Short-term Debt at the End of the Period
(a)
|
||||||
|
Amount Outstanding
|
Weighted Average Interest Rate
|
|||||
|
(in millions)
|
||||||
|
December 31, 2013:
|
||||||
|
Commercial paper
|
$
|
1,082
|
|
0.2
|
%
|
|
|
Short-term bank debt
|
400
|
|
0.9
|
%
|
||
|
Total
|
$
|
1,482
|
|
0.4
|
%
|
|
|
December 31, 2012:
|
||||||
|
Commercial paper
|
$
|
820
|
|
0.3
|
%
|
|
|
Short-term bank debt
|
—
|
|
—
|
%
|
||
|
Total
|
$
|
820
|
|
0.3
|
%
|
|
(a) Excludes notes payable related to other energy service contracts of
$5 million
at December 31, 2012.
Redeemable Preferred Stock of Subsidiaries
Each of the traditional operating companies has issued preferred and/or preference stock. The preferred stock of Alabama Power and Mississippi Power contains a feature that allows the holders to elect a majority of such subsidiary's board of directors if dividends are not paid for four consecutive quarters. Because such a potential redemption-triggering event is not solely within the control of Alabama Power and Mississippi Power, this preferred stock is presented as "Redeemable Preferred Stock of Subsidiaries" in a manner consistent with temporary equity under applicable accounting standards. The preferred and preference stock at Georgia Power and the preference stock at Alabama Power and Gulf Power do not contain such a provision that would allow the holders to elect a majority of such subsidiary's board. As a result, under applicable accounting standards, the preferred and preference stock at Georgia Power and the preference stock at Alabama Power and Gulf Power are required to be shown as "noncontrolling interest," separately presented as a component of "Stockholders' Equity" on Southern Company's balance sheets, statements of capitalization, and statements of stockholders' equity.
There were no changes for the years ended
December 31, 2013
and
2012
in redeemable preferred stock of subsidiaries for Southern Company.
7. COMMITMENTS
Fuel and Purchased Power Agreements
To supply a portion of the fuel requirements of the generating plants, the Southern Company system has entered into various long-term commitments for the procurement and delivery of fossil and nuclear fuel which are not recognized on the balance sheets. In 2013, 2012, and 2011, the traditional operating companies and Southern Power incurred fuel expense of
$5.5 billion
,
$5.1 billion
, and
$6.3 billion
, respectively, the majority of which was purchased under long-term commitments. Southern Company expects that a substantial amount of the Southern Company system's future fuel needs will continue to be purchased under long-term commitments. In addition, the Southern Company system has entered into various long-term commitments for the purchase of capacity and electricity, some of which are accounted for as operating leases or have been used by a third party to secure financing. Total capacity expense under PPAs accounted for as operating leases was
$157 million
,
$171 million
, and
$199 million
for 2013, 2012, and 2011, respectively.
II-99
NOTES (continued)
Southern Company and Subsidiary Companies 2013 Annual Report
Estimated total obligations under these commitments at December 31, 2013 were as follows:
|
Capital Leases
(4)
|
Operating Leases
|
Other
|
|||||||
|
(in millions)
|
|||||||||
|
2014
|
$
|
—
|
|
$
|
201
|
|
$
|
21
|
|
|
2015
|
20
|
|
244
|
|
13
|
|
|||
|
2016
|
26
|
|
260
|
|
11
|
|
|||
|
2017
|
27
|
|
263
|
|
8
|
|
|||
|
2018
|
27
|
|
266
|
|
7
|
|
|||
|
2019 and thereafter
|
541
|
|
2,104
|
|
58
|
|
|||
|
Total
|
$
|
641
|
|
$
|
3,338
|
|
$
|
118
|
|
|
Less: amounts representing executory costs
(1)
|
142
|
|
|||||||
|
Net minimum lease payments
|
499
|
|
|||||||
|
Less: amounts representing interest
(2)
|
166
|
|
|||||||
|
Present value of net minimum lease payments
(3)
|
$
|
333
|
|
||||||
|
(1)
|
Executory costs such as taxes, maintenance, and insurance (including the estimated profit thereon)
a
re estimated and included in total minimum lease payments.
|
|
(2)
|
Calculated Georgia Power's incremental borrowing rate at the inception of the leases.
|
|
(3)
|
When the PPAs with non-affiliates begin in 2015, Georgia Power will recognize capital lease assets and capital lease obligations totaling
$333 million
, equal to the lesser of the present value of the net minimum lease payments or the estimated fair value of the leased property.
|
|
(4)
|
A total of
$1.3 billion
of biomass PPAs included under the non-affiliate capital and operating leases is contingent upon the counterparty meeting specified contract dates for posting collateral and commercial operation.
|
Operating Leases
The Southern Company system has operating lease agreements with various terms and expiration dates. Total rent expense was
$123 million
,
$155 million
, and
$176 million
for
2013
,
2012
, and
2011
, respectively. Southern Company includes any step rents, escalations, and lease concessions in its computation of minimum lease payments, which are recognized on a straight-line basis over the minimum lease term.
As of December 31, 2013, estimated minimum lease payments under operating leases were as follows:
|
Minimum Lease Payments
|
|||||||||
|
Barges & Railcars
|
Other
|
Total
|
|||||||
|
(in millions)
|
|||||||||
|
2014
|
$
|
56
|
|
$
|
45
|
|
$
|
101
|
|
|
2015
|
35
|
|
40
|
|
75
|
|
|||
|
2016
|
30
|
|
35
|
|
65
|
|
|||
|
2017
|
12
|
|
32
|
|
44
|
|
|||
|
2018
|
6
|
|
25
|
|
31
|
|
|||
|
2019 and thereafter
|
15
|
|
120
|
|
135
|
|
|||
|
Total
|
$
|
154
|
|
$
|
297
|
|
$
|
451
|
|
For the traditional operating companies, a majority of the barge and railcar lease expenses are recoverable through fuel cost recovery provisions. In addition to the above rental commitments, Alabama Power and Georgia Power have obligations upon expiration of certain leases with respect to the residual value of the leased property. These leases have terms expiring through 2023 with maximum obligations under these leases of
$59 million
. At the termination of the leases, the lessee may either exercise its purchase option, or the property can be sold to a third party. Alabama Power and Georgia Power expect that the fair market value of the leased property would substantially reduce or eliminate the payments under the residual value obligations.
II-100
NOTES (continued)
Southern Company and Subsidiary Companies 2013 Annual Report
Guarantees
As discussed above under "Operating Leases," Alabama Power and Georgia Power have entered into certain residual value guarantees.
8. COMMON STOCK
Stock Issued
During 2013, Southern Company issued approximately
6.9 million
shares of common stock for
$222.4 million
through the employee and director stock plans, of which
0.7 million
shares related to Southern Company's performance share plan.
During the first seven months of 2013, all sales under the Southern Investment Plan and the employee savings plan were funded with shares acquired on the open market by the independent plan administrators. Beginning in August 2013 and continuing through the fourth quarter 2013, Southern Company began using shares held in treasury to satisfy the requirements under the Southern Investment Plan and the employee savings plan, issuing a total of approximately
4.4 million
shares of common stock previously held in treasury for approximately
$183.6 million
.
In addition, during the last six months of 2013, Southern Company issued approximately
8.0 million
shares of common stock through at-the-market issuances pursuant to sales agency agreements related to Southern Company’s continuous equity offering program and received cash proceeds of approximately
$327.3 million
, net of
$2.8 million
in fees and commissions.
In 2012, Southern Company raised
$397 million
from the issuance of
12.1 million
new common shares through the employee and director stock plans.
Stock Repurchased
In July 2012, Southern Company announced a program to repurchase shares to partially offset the incremental shares issued under its employee and director stock plans. There were no repurchases under this program in 2013 and no further repurchases under the program are anticipated.
Shares Reserved
At
December 31, 2013
, a total of
116 million
shares were reserved for issuance pursuant to the Southern Investment Plan, the Employee Savings Plan, the Outside Directors Stock Plan, and the Omnibus Incentive Compensation Plan (which includes stock options and performance shares units as discussed below). Of the total
116 million
shares reserved, there were
28 million
shares of common stock remaining available for awards under the Omnibus Incentive Compensation Plan as of
December 31, 2013
.
Stock Options
Southern Company provides non-qualified stock options through its Omnibus Incentive Compensation Plan to a large segment of Southern Company system employees ranging from line management to executives. As of
December 31, 2013
, there were
5,776
current and former employees participating in the stock option program. The prices of options were at the fair market value of the shares on the dates of grant. These options become exercisable pro rata over a maximum period of
three
years from the date of grant. Southern Company generally recognizes stock option expense on a straight-line basis over the vesting period which equates to the requisite service period; however, for employees who are eligible for retirement, the total cost is expensed at the grant date. Options outstanding will expire no later than
10 years
after the date of grant, unless terminated earlier by the Southern Company Board of Directors in accordance with the Omnibus Incentive Compensation Plan. Stock options held by employees of a company undergoing a change in control vest upon the change in control.
The estimated fair values of stock options granted were derived using the Black-Scholes stock option pricing model. Expected volatility was based on historical volatility of Southern Company's stock over a period equal to the expected term. Southern Company used historical exercise data to estimate the expected term that represents the period of time that options granted to employees are expected to be outstanding. The risk-free rate was based on the U.S. Treasury yield curve in effect at the time of grant that covers the expected term of the stock options.
II-101
NOTES (continued)
Southern Company and Subsidiary Companies 2013 Annual Report
The following table shows the assumptions used in the pricing model and the weighted average grant-date fair value of stock options granted:
|
Year Ended December 31
|
2013
|
2012
|
2011
|
||
|
Expected volatility
|
16.6%
|
17.7%
|
17.5%
|
||
|
Expected term
(in years)
|
5.0
|
5.0
|
5.0
|
||
|
Interest rate
|
0.9%
|
0.9%
|
2.3%
|
||
|
Dividend yield
|
4.4%
|
4.2%
|
4.8%
|
||
|
Weighted average grant-date fair value
|
$2.93
|
$3.39
|
$3.23
|
||
Southern Company's activity in the stock option program for
2013
is summarized below:
|
Shares Subject to Option
|
Weighted Average Exercise Price
|
|||||
|
Outstanding at December 31, 2012
|
35,916,303
|
|
$
|
36.37
|
|
|
|
Granted
|
9,152,716
|
|
44.17
|
|
||
|
Exercised
|
(6,078,735
|
)
|
33.39
|
|
||
|
Cancelled
|
(170,918
|
)
|
43.30
|
|
||
|
Outstanding at December 31, 2013
|
38,819,366
|
|
$
|
38.64
|
|
|
|
Exercisable at December 31, 2013
|
24,150,442
|
|
$
|
35.70
|
|
|
The number of stock options vested, and expected to vest in the future, as of
December 31, 2013
was not significantly different from the number of stock options outstanding at
December 31, 2013
as stated above. As of
December 31, 2013
, the weighted average remaining contractual term for the options outstanding and options exercisable was approximately
six years
and
five years
, respectively, and the aggregate intrinsic value for the options outstanding and options exercisable was
$147 million
and
$142 million
, respectively.
As of
December 31, 2013
, there was
$9 million
of total unrecognized compensation cost related to stock option awards not yet vested. That cost is expected to be recognized over a weighted-average period of approximately
11 months
.
For the years ended
December 31, 2013
,
2012
, and
2011
, total compensation cost for stock option awards recognized in income was
$25 million
,
$23 million
, and
$22 million
, respectively, with the related tax benefit also recognized in income of
$10 million
,
$9 million
, and
$8 million
, respectively.
The total intrinsic value of options exercised during the years ended
December 31, 2013
,
2012
, and
2011
was
$77 million
,
$162 million
, and
$155 million
, respectively. The actual tax benefit realized by the Company for the tax deductions from stock option exercises totaled
$30 million
,
$62 million
, and
$60 million
for the years ended
December 31, 2013
,
2012
, and
2011
, respectively.
Southern Company has a policy of issuing shares to satisfy share option exercises. Cash received from issuances related to option exercises under the share-based payment arrangements for the years ended
December 31, 2013
,
2012
, and
2011
was
$204 million
,
$397 million
, and
$528 million
, respectively.
Performance Shares
Southern Company provides performance share award units through its Omnibus Incentive Compensation Plan to a large segment of Southern Company system employees ranging from line management to executives. The performance share units granted under the plan vest at the end of a
three
-year performance period which equates to the requisite service period. Employees that retire prior to the end of the
three
-year period receive a pro rata number of shares, issued at the end of the performance period, based on actual months of service prior to retirement. The value of the award units is based on Southern Company's total shareholder return (TSR) over the
three
-year performance period which measures Southern Company's relative performance against a group of industry peers. The performance shares are delivered in common stock following the end of the performance period based on Southern Company's actual TSR and may range from
0%
to
200%
of the original target performance share amount.
The fair value of performance share awards is determined as of the grant date using a Monte Carlo simulation model to estimate the TSR of Southern Company's stock among the industry peers over the performance period. Southern Company recognizes compensation expense on a straight-line basis over the
three
-year performance period without remeasurement. Compensation expense for awards where the service condition is met is recognized regardless of the actual number of shares issued. The
II-102
NOTES (continued)
Southern Company and Subsidiary Companies 2013 Annual Report
expected volatility was based on the historical volatility of Southern Company's stock over a period equal to the performance period. The risk-free rate was based on the U.S. Treasury yield curve in effect at the time of grant that covers the performance period of the award units.
The following table shows the assumptions used in the pricing model and the weighted average grant-date fair value of performance share award units granted:
|
Year Ended December 31
|
2013
|
2012
|
2011
|
||
|
Expected volatility
|
12.0%
|
16.0%
|
19.2%
|
||
|
Expected term
(in years)
|
3.0
|
3.0
|
3.0
|
||
|
Interest rate
|
0.4%
|
0.4%
|
1.4%
|
||
|
Annualized dividend rate
|
$1.96
|
$1.89
|
$1.82
|
||
|
Weighted average grant-date fair value
|
$40.50
|
$41.99
|
$35.97
|
||
Total unvested performance share units outstanding as of
December 31, 2012
were
1,633,156
. During
2013
,
929,653
performance share units were granted,
807,702
performance share units were vested, and
111,348
performance share units were forfeited, resulting in
1,643,759
unvested units outstanding at
December 31, 2013
. In January 2014, the vested performance share award units were converted into
240,980
shares outstanding at a share price of
$41.27
for the
three
-year performance and vesting period ended December 31, 2013.
For the years ended
December 31, 2013
,
2012
, and
2011
, total compensation cost for performance share units recognized in income was
$31 million
,
$28 million
, and
$18 million
, respectively, with the related tax benefit also recognized in income of
$12 million
,
$11 million
, and
$7 million
, respectively. As of
December 31, 2013
, there was
$35 million
of total unrecognized compensation cost related to performance share award units that will be recognized over a weighted-average period of approximately
11 months
.
Diluted Earnings Per Share
For Southern Company, the only difference in computing basic and diluted earnings per share is attributable to awards outstanding under the stock option and performance share plans. The effect of both stock options and performance share award units were determined using the treasury stock method. Shares used to compute diluted earnings per share were as follows:
|
|
Average Common Stock Shares
|
|||||||
|
|
2013
|
2012
|
2011
|
|||||
|
|
(in millions)
|
|||||||
|
As reported shares
|
877
|
|
871
|
|
857
|
|
||
|
Effect of options and performance share award units
|
4
|
|
8
|
|
7
|
|
||
|
Diluted shares
|
881
|
|
879
|
|
864
|
|
||
Stock options and performance share award units that were not included in the diluted earnings per share calculation because they were anti-dilutive were
$16 million
and were immaterial as of
December 31, 2013
and
2012
, respectively.
Common Stock Dividend Restrictions
The income of Southern Company is derived primarily from equity in earnings of its subsidiaries. At
December 31, 2013
, consolidated retained earnings included
$6.1 billion
of undistributed retained earnings of the subsidiaries.
9. NUCLEAR INSURANCE
Under the Price-Anderson Amendments Act (Act), Alabama Power and Georgia Power maintain agreements of indemnity with the NRC that, together with private insurance, cover third-party liability arising from any nuclear incident occurring at the companies' nuclear power plants. The Act provides funds up to
$13.6 billion
for public liability claims that could arise from a single nuclear incident. Each nuclear plant is insured against this liability to a maximum of
$375 million
by American Nuclear Insurers (ANI), with the remaining coverage provided by a mandatory program of deferred premiums that could be assessed, after a nuclear incident, against all owners of commercial nuclear reactors. A company could be assessed up to
$127 million
per incident for each licensed reactor it operates but not more than an aggregate of
$19 million
per incident to be paid in a calendar year for each reactor. Such maximum assessment, excluding any applicable state premium taxes, for Alabama Power and Georgia Power, based on its ownership and buyback interests in all licensed reactors, is
$255 million
and
$252 million
, respectively, per
II-103
NOTES (continued)
Southern Company and Subsidiary Companies 2013 Annual Report
incident, but not more than an aggregate of
$38 million
and
$37 million
, respectively, per company to be paid for each incident in any one year. Both the maximum assessment per reactor and the maximum yearly assessment are adjusted for inflation at least every
five years
. The next scheduled adjustment is due no later than September 10, 2018. See Note 4 to the financial statements herein for additional information on joint ownership agreements.
Alabama Power and Georgia Power are members of Nuclear Electric Insurance Limited (NEIL), a mutual insurer established to provide property damage insurance in an amount up to
$500 million
for members' operating nuclear generating facilities. Additionally, both companies have NEIL policies that currently provide decontamination, excess property insurance, and premature decommissioning coverage up to
$2.25 billion
for nuclear losses in excess of the
$500 million
primary coverage. These policies have a sublimit of
$1.7 billion
for non-nuclear losses.
NEIL also covers the additional costs that would be incurred in obtaining replacement power during a prolonged accidental outage at a member's nuclear plant. Members can purchase this coverage, subject to a deductible waiting period of up to
26 weeks
, with a maximum per occurrence per unit limit of
$490 million
. After the deductible period, weekly indemnity payments would be received until either the unit is operational or until the limit is exhausted in approximately
three
years. Alabama Power and Georgia Power each purchase limits based on the projected full replacement power, subject to ownership limitations. Each facility has elected a
12-week
deductible waiting period.
A builders' risk property insurance policy has been purchased from NEIL for the construction of Plant Vogtle Units 3 and 4. This policy provides the Owners up to
$2.75 billion
for accidental property damage occurring during construction.
Under each of the NEIL policies, members are subject to assessments each year if losses exceed the accumulated funds available to the insurer. The current maximum annual assessments for Alabama Power and Georgia Power under the NEIL policies would be
$43 million
and
$65 million
, respectively.
Claims resulting from terrorist acts are covered under both the ANI and NEIL policies (subject to normal policy limits). The aggregate, however, that NEIL will pay for all claims resulting from terrorist acts in any
12-month
period is
$3.2 billion
plus such additional amounts NEIL can recover through reinsurance, indemnity, or other sources.
For all on-site property damage insurance policies for commercial nuclear power plants, the NRC requires that the proceeds of such policies shall be dedicated first for the sole purpose of placing the reactor in a safe and stable condition after an accident. Any remaining proceeds are to be applied next toward the costs of decontamination and debris removal operations ordered by the NRC, and any further remaining proceeds are to be paid either to the Company or to its debt trustees as may be appropriate under the policies and applicable trust indentures. In the event of a loss, the amount of insurance available might not be adequate to cover property damage and other expenses incurred. Uninsured losses and other expenses, to the extent not recovered from customers, would be borne by Alabama Power or Georgia Power, as applicable, and could have a material effect on Southern Company's financial condition and results of operations.
All retrospective assessments, whether generated for liability, property, or replacement power, may be subject to applicable state premium taxes.
10. FAIR VALUE MEASUREMENTS
Fair value measurements are based on inputs of observable and unobservable market data that a market participant would use in pricing the asset or liability. The use of observable inputs is maximized where available and the use of unobservable inputs is minimized for fair value measurement and reflects a three-tier fair value hierarchy that prioritizes inputs to valuation techniques used for fair value measurement.
|
•
|
Level 1 consists of observable market data in an active market for identical assets or liabilities.
|
|
•
|
Level 2 consists of observable market data, other than that included in Level 1, that is either directly or indirectly observable.
|
|
•
|
Level 3 consists of unobservable market data. The input may reflect the assumptions of the Company of what a market participant would use in pricing an asset or liability. If there is little available market data, then the Company's own assumptions are the best available information.
|
In the case of multiple inputs being used in a fair value measurement, the lowest level input that is significant to the fair value measurement represents the level in the fair value hierarchy in which the fair value measurement is reported.
II-104
NOTES (continued)
Southern Company and Subsidiary Companies 2013 Annual Report
As of
December 31, 2013
, assets and liabilities measured at fair value on a recurring basis during the period, together with the level of the fair value hierarchy in which they fall, were as follows:
|
Fair Value Measurements Using
|
|||||||||||||||
|
Quoted Prices in Active Markets for Identical Assets
|
Significant Other Observable Inputs
|
Significant Unobservable Inputs
|
|||||||||||||
|
As of December 31, 2013:
|
(Level 1)
|
(Level 2)
|
(Level 3)
|
Total
|
|||||||||||
|
(in millions)
|
|||||||||||||||
|
Assets:
|
|||||||||||||||
|
Energy-related derivatives
|
$
|
—
|
|
$
|
24
|
|
$
|
—
|
|
$
|
24
|
|
|||
|
Interest rate derivatives
|
—
|
|
3
|
|
—
|
|
3
|
|
|||||||
|
Nuclear decommissioning trusts:
(a)
|
|||||||||||||||
|
Domestic equity
|
589
|
|
75
|
|
—
|
|
664
|
|
|||||||
|
Foreign equity
|
35
|
|
196
|
|
—
|
|
231
|
|
|||||||
|
U.S. Treasury and government agency securities
|
—
|
|
103
|
|
—
|
|
103
|
|
|||||||
|
Municipal bonds
|
—
|
|
64
|
|
—
|
|
64
|
|
|||||||
|
Corporate bonds
|
—
|
|
229
|
|
—
|
|
229
|
|
|||||||
|
Mortgage and asset backed securities
|
—
|
|
132
|
|
—
|
|
132
|
|
|||||||
|
Other investments
|
—
|
|
37
|
|
3
|
|
40
|
|
|||||||
|
Cash equivalents
|
491
|
|
—
|
|
—
|
|
491
|
|
|||||||
|
Other investments
|
9
|
|
—
|
|
4
|
|
13
|
|
|||||||
|
Total
|
$
|
1,124
|
|
$
|
863
|
|
$
|
7
|
|
$
|
1,994
|
|
|||
|
Liabilities:
|
|||||||||||||||
|
Energy-related derivatives
|
$
|
—
|
|
$
|
56
|
|
$
|
—
|
|
$
|
56
|
|
|||
|
(a)
|
Includes the investment securities pledged to creditors and collateral received, and excludes receivables related to investment income, pending investment sales, and payables related to pending investment purchases and the lending pool. See Note 1 under "Nuclear Decommissioning" for additional information.
|
II-105
NOTES (continued)
Southern Company and Subsidiary Companies 2013 Annual Report
As of
December 31, 2012
, assets and liabilities measured at fair value on a recurring basis during the period, together with the level of the fair value hierarchy in which they fall, were as follows:
|
Fair Value Measurements Using
|
|||||||||||||||
|
Quoted Prices in Active Markets for Identical Assets
|
Significant Other Observable Inputs
|
Significant Unobservable Inputs
|
|||||||||||||
|
As of December 31, 2012:
|
(Level 1)
|
(Level 2)
|
(Level 3)
|
Total
|
|||||||||||
|
(in millions)
|
|||||||||||||||
|
Assets:
|
|||||||||||||||
|
Energy-related derivatives
|
$
|
—
|
|
$
|
26
|
|
$
|
—
|
|
$
|
26
|
|
|||
|
Interest rate derivatives
|
—
|
|
10
|
|
—
|
|
10
|
|
|||||||
|
Nuclear decommissioning trusts:
(a)
|
|||||||||||||||
|
Domestic equity
|
453
|
|
65
|
|
—
|
|
518
|
|
|||||||
|
Foreign equity
|
28
|
|
172
|
|
—
|
|
200
|
|
|||||||
|
U.S. Treasury and government agency securities
|
—
|
|
134
|
|
—
|
|
134
|
|
|||||||
|
Municipal bonds
|
—
|
|
55
|
|
—
|
|
55
|
|
|||||||
|
Corporate bonds
|
—
|
|
234
|
|
—
|
|
234
|
|
|||||||
|
Mortgage and asset backed securities
|
—
|
|
141
|
|
—
|
|
141
|
|
|||||||
|
Other investments
|
—
|
|
20
|
|
—
|
|
20
|
|
|||||||
|
Cash equivalents
|
384
|
|
—
|
|
—
|
|
384
|
|
|||||||
|
Other investments
|
9
|
|
—
|
|
15
|
|
24
|
|
|||||||
|
Total
|
$
|
874
|
|
$
|
857
|
|
$
|
15
|
|
$
|
1,746
|
|
|||
|
Liabilities:
|
|||||||||||||||
|
Energy-related derivatives
|
$
|
—
|
|
$
|
111
|
|
$
|
—
|
|
$
|
111
|
|
|||
|
(a)
|
Includes the investment securities pledged to creditors and collateral received, and excludes receivables related to investment income, pending investment sales, and payables related to pending investment purchases and the lending pool. See Note 1 under "Nuclear Decommissioning" for additional information.
|
Valuation Methodologies
The energy-related derivatives primarily consist of over-the-counter financial products for natural gas and physical power products including, from time to time, basis swaps. These are standard products used within the energy industry and are valued using the market approach. The inputs used are mainly from observable market sources, such as forward natural gas prices, power prices, implied volatility, and Overnight Index Swap interest rates. Interest rate derivatives are also standard over-the-counter financial products valued using the market approach. Inputs for interest rate derivatives include LIBOR interest rates, interest rate futures contracts, and occasionally implied volatility of interest rate options. See Note 11 for additional information on how these derivatives are used.
For fair value measurements of investments within the nuclear decommissioning trusts, specifically the fixed income assets using significant other observable inputs and unobservable inputs, the primary valuation technique used is the market approach. External pricing vendors are designated for each of the asset classes in the nuclear decommissioning trusts with each security discriminately assigned a primary pricing source, based on similar characteristics.
A market price secured from the primary source vendor is then evaluated by management in its valuation of the assets within the trusts. As a general approach, market pricing vendors gather market data (including indices and market research reports) and integrate relative credit information, observed market movements, and sector news into proprietary pricing models, pricing systems, and mathematical tools. Dealer quotes and other market information including live trading levels and pricing analysts' judgment are also obtained when available.
"Other investments" include investments in funds that are valued using the market approach and income approach. Securities that are traded in the open market are valued at the closing price on their principal exchange as of the measurement date. Discounts are applied in accordance with GAAP when certain trading restrictions exist. For investments that are not traded in the open
II-106
NOTES (continued)
Southern Company and Subsidiary Companies 2013 Annual Report
market, the price paid will have been determined based on market factors including comparable multiples and the expectations regarding cash flows and business plan execution. As the investments mature or if market conditions change materially, further analysis of the fair market value of the investment is performed. This analysis is typically based on a metric, such as multiple of earnings, revenues, earnings before interest and income taxes, or earnings adjusted for certain cash changes. These multiples are based on comparable multiples for publicly traded companies or other relevant prior transactions.
As of
December 31, 2013
and
2012
, the fair value measurements of investments calculated at net asset value per share (or its equivalent), as well as the nature and risks of those investments, were as follows:
|
Fair
Value
|
Unfunded
Commitments
|
Redemption
Frequency
|
Redemption
Notice Period
|
||||||
|
As of December 31, 2013:
|
(in millions)
|
||||||||
|
Nuclear decommissioning trusts:
|
|||||||||
|
Foreign equity funds
|
$
|
131
|
|
None
|
Monthly
|
5 days
|
|||
|
Corporate bonds – commingled funds
|
8
|
|
None
|
Daily
|
Not applicable
|
||||
|
Equity – commingled funds
|
65
|
|
None
|
Daily/Monthly
|
Daily/7 days
|
||||
|
Other – commingled funds
|
24
|
|
None
|
Daily
|
Not applicable
|
||||
|
Trust-owned life insurance
|
110
|
|
None
|
Daily
|
15 days
|
||||
|
Cash equivalents:
|
|||||||||
|
Money market funds
|
491
|
|
None
|
Daily
|
Not applicable
|
||||
|
As of December 31, 2012:
|
|||||||||
|
Nuclear decommissioning trusts:
|
|||||||||
|
Foreign equity funds
|
$
|
117
|
|
None
|
Monthly
|
5 days
|
|||
|
Corporate bonds – commingled funds
|
9
|
|
None
|
Daily
|
Not applicable
|
||||
|
Equity – commingled funds
|
55
|
|
None
|
Daily/Monthly
|
Daily/7 days
|
||||
|
Other – commingled funds
|
10
|
|
None
|
Daily
|
Not applicable
|
||||
|
Trust-owned life insurance
|
96
|
|
None
|
Daily
|
15 days
|
||||
|
Cash equivalents:
|
|||||||||
|
Money market funds
|
384
|
|
None
|
Daily
|
Not applicable
|
||||
The NRC requires licensees of commissioned nuclear power reactors to establish a plan for providing reasonable assurance of funds for future decommissioning. Alabama Power and Georgia Power have the Funds to comply with the NRC's regulations. The foreign equity fund in Georgia Power's nuclear decommissioning trusts seeks to provide long-term capital appreciation. In pursuing this investment objective, the foreign equity fund primarily invests in a diversified portfolio of equity securities of foreign companies, including those in emerging markets
.
These equity securities may include, but are not limited to, common stocks, preferred stocks, real estate investment trusts, convertible securities and depositary receipts, including American depositary receipts, European depositary receipts and global depositary receipts, and rights and warrants to buy common stocks. Georgia Power may withdraw all or a portion of its investment on the last business day of each month subject to a minimum withdrawal of
$1 million
, provided that a minimum investment of
$10 million
remains. If notices of withdrawal exceed
20%
of the aggregate value of the foreign equity fund, then the foreign equity fund's board may refuse to permit the withdrawal of all such investments and may scale down the amounts to be withdrawn pro rata and may further determine that any withdrawal that has been postponed will have priority on the subsequent withdrawal date.
The commingled funds in Georgia Power's nuclear decommissioning trusts are invested primarily in a diversified portfolio including, but not limited to, commercial paper, notes, repurchase agreements, and other evidences of indebtedness with a maturity not exceeding
13 months
from the date of purchase. The commingled funds will, however, generally maintain a dollar-weighted average portfolio maturity of
90 days
or less. The assets may be longer term investment grade fixed income obligations with maturity shortening provisions. The primary objective for the commingled funds is a high level of current income consistent with stability of principal and liquidity. The commingled funds included within corporate bonds represent the investment of cash collateral received under the Funds' managers' securities lending program that can only be sold upon the return of the loaned securities. See Note 1 under "Nuclear Decommissioning" for additional information.
II-107
NOTES (continued)
Southern Company and Subsidiary Companies 2013 Annual Report
Alabama Power's nuclear decommissioning trust includes investments in TOLI. The taxable nuclear decommissioning trust invests in the TOLI in order to minimize the impact of taxes on the portfolio and can draw on the value of the TOLI through death proceeds, loans against the cash surrender value, and/or the cash surrender value, subject to legal restrictions. The amounts reported in the table above reflect the fair value of investments the insurer has made in relation to the TOLI agreements. The nuclear decommissioning trust does not own the underlying investments, but the fair value of the investments approximates the cash surrender value of the TOLI policies. The investments made by the insurer are in commingled funds. The commingled funds primarily include investments in domestic and international equity securities and predominantly high-quality fixed income securities. These fixed income securities may include U.S. Treasury and government agency fixed income securities, non-U.S. government and agency fixed income securities, domestic and foreign corporate fixed income securities, and, to some degree, mortgage and asset backed securities. The passively managed funds seek to replicate the performance of a related index. The actively managed funds seek to exceed the performance of a related index through security analysis and selection.
The money market funds are short-term investments of excess funds in various money market mutual funds, which are portfolios of short-term debt securities. The money market funds are regulated by the Securities and Exchange Commission and typically receive the highest rating from credit rating agencies. Regulatory and rating agency requirements for money market funds include minimum credit ratings and maximum maturities for individual securities and a maximum weighted average portfolio maturity. Redemptions are available on a same day basis up to the full amount of the Company's investment in the money market funds.
As of
December 31, 2013
and
2012
, other financial instruments for which the carrying amount did not equal fair value were as follows:
|
Carrying Amount
|
Fair Value
|
||||||
|
(in millions)
|
|||||||
|
Long-term debt:
|
|||||||
|
2013
|
$
|
21,650
|
|
$
|
22,197
|
|
|
|
2012
|
$
|
21,530
|
|
$
|
23,480
|
|
|
The fair values are determined using Level 2 measurements and are based on quoted market prices for the same or similar issues or on the current rates offered to Southern Company, Alabama Power, Georgia Power, Gulf Power, Mississippi Power, and Southern Power.
11. DERIVATIVES
Southern Company, the traditional operating companies, and Southern Power are exposed to market risks, primarily commodity price risk, interest rate risk, and occasionally foreign currency risk. To manage the volatility attributable to these exposures, each company nets its exposures, where possible, to take advantage of natural offsets and enters into various derivative transactions for the remaining exposures pursuant to each company's policies in areas such as counterparty exposure and risk management practices. Each company's policy is that derivatives are to be used primarily for hedging purposes and mandates strict adherence to all applicable risk management policies. Derivative positions are monitored using techniques including, but not limited to, market valuation, value at risk, stress testing, and sensitivity analysis. Derivative instruments are recognized at fair value in the balance sheets as either assets or liabilities and are presented on a gross basis. In the statements of cash flows, the cash impacts of settled energy-related and interest rate derivatives are recorded as operating activities and the cash impacts of settled foreign currency derivatives are recorded as investing activities.
Energy-Related Derivatives
The traditional operating companies and Southern Power enter into energy-related derivatives to hedge exposures to electricity, gas, and other fuel price changes. However, due to cost-based rate regulations and other various cost recovery mechanisms, the traditional operating companies have limited exposure to market volatility in commodity fuel prices and prices of electricity. Each of the traditional operating companies manages fuel-hedging programs, implemented per the guidelines of their respective state PSCs, through the use of financial derivative contracts, which is expected to continue to mitigate price volatility. Southern Power has limited exposure to market volatility in commodity fuel prices and prices of electricity because its long-term sales contracts shift substantially all fuel cost responsibility to the purchaser. However, Southern Power has been and may continue to be exposed to market volatility in energy-related commodity prices as a result of uncontracted generating capacity.
To mitigate residual risks relative to movements in electricity prices, the traditional operating companies and Southern Power may enter into physical fixed-price contracts for the purchase and sale of electricity through the wholesale electricity market. To mitigate residual risks relative to movements in gas prices, the traditional operating companies and Southern Power may enter into fixed-price contracts for natural gas purchases; however, a significant portion of contracts are priced at market.
II-108
NOTES (continued)
Southern Company and Subsidiary Companies 2013 Annual Report
Energy-related derivative contracts are accounted for in one of three methods:
|
•
|
Regulatory Hedges
– Energy-related derivative contracts which are designated as regulatory hedges relate primarily to the traditional operating companies' fuel-hedging programs, where gains and losses are initially recorded as regulatory liabilities and assets, respectively, and then are included in fuel expense as the underlying fuel is used in operations and ultimately recovered through the respective fuel cost recovery clauses.
|
|
•
|
Cash Flow Hedges
– Gains and losses on energy-related derivatives designated as cash flow hedges which are mainly used to hedge anticipated purchases and sales and are initially deferred in OCI before being recognized in the statements of income in the same period as the hedged transactions are reflected in earnings.
|
|
•
|
Not Designated
– Gains and losses on energy-related derivative contracts that are not designated or fail to qualify as hedges are recognized in the statements of income as incurred.
|
Some energy-related derivative contracts require physical delivery as opposed to financial settlement, and this type of derivative is both common and prevalent within the electric industry. When an energy-related derivative contract is settled physically, any cumulative unrealized gain or loss is reversed and the contract price is recognized in the respective line item representing the actual price of the underlying goods being delivered.
At
December 31, 2013
, the net volume of energy-related derivative contracts for natural gas positions totaled
275 million
mmBtu (million British thermal units) for the Southern Company system, with the longest hedge date of
2018
over which the respective entity is hedging its exposure to the variability in future cash flows for forecasted transactions and the longest non-hedge date of
2017
for derivatives not designated as hedges.
In addition to the volumes discussed above, the traditional operating companies and Southern Power enter into physical natural gas supply contracts that provide the option to sell back excess gas due to operational constraints. The maximum expected volume of natural gas subject to such a feature is
9 million
mmBtu.
For cash flow hedges, the amounts expected to be reclassified from accumulated OCI to revenue and fuel expense for the next 12-month period ending
December 31, 2014
are immaterial for Southern Company.
Interest Rate Derivatives
Southern Company and certain subsidiaries may also enter into interest rate derivatives to hedge exposure to changes in interest rates. The derivatives employed as hedging instruments are structured to minimize ineffectiveness. Derivatives related to existing variable rate securities or forecasted transactions are accounted for as cash flow hedges where the effective portion of the derivatives' fair value gains or losses is recorded in OCI and is reclassified into earnings at the same time the hedged transactions affect earnings, with any ineffectiveness recorded directly to earnings. Derivatives related to existing fixed rate securities are accounted for as fair value hedges, where the derivatives' fair value gains or losses and hedged items' fair value gains or losses are both recorded directly to earnings, providing an offset, with any difference representing ineffectiveness.
At
December 31, 2013
, the following interest rate derivatives were outstanding:
|
Notional
Amount
|
Interest Rate
Received
|
Weighted Average Interest
Rate Paid
|
Hedge
Maturity Date
|
Fair Value
Gain (Loss)
December 31,
2013
|
|||||||||
|
|
(in millions)
|
|
|
|
(in millions)
|
||||||||
|
Fair value hedges of existing debt
|
|||||||||||||
|
$
|
350
|
|
4.15%
|
3-month LIBOR + 1.96%
|
May 2014
|
$
|
3
|
|
|||||
The estimated pre-tax losses that will be reclassified from accumulated OCI to interest expense for the next 12-month period ending
December 31, 2014
are immaterial. The Company has deferred gains and losses that are expected to be amortized into earnings through 2037.
Foreign Currency Derivatives
Southern Company and certain subsidiaries may enter into foreign currency derivatives to hedge exposure to changes in foreign currency exchange rates arising from purchases of equipment denominated in a currency other than U.S. dollars. Derivatives related to a firm commitment in a foreign currency transaction are accounted for as a fair value hedge where the derivatives' fair value gains or losses and the hedged items' fair value gains or losses are both recorded directly to earnings. Derivatives related to a forecasted transaction are accounted for as a cash flow hedge where the effective portion of the derivatives' fair value gains or
II-109
NOTES (continued)
Southern Company and Subsidiary Companies 2013 Annual Report
losses is recorded in OCI and is reclassified into earnings at the same time the hedged transactions affect earnings. Any ineffectiveness is recorded directly to earnings; however, Mississippi Power has regulatory approval allowing it to defer any ineffectiveness associated with firm commitments related to the Kemper IGCC to a regulatory asset. The derivatives employed as hedging instruments are structured to minimize ineffectiveness. At
December 31, 2013
, the fair value of the foreign currency derivative outstanding was immaterial.
Derivative Financial Statement Presentation and Amounts
At
December 31, 2013
and
2012
, the fair value of energy-related derivatives and interest rate derivatives was reflected in the balance sheets as follows:
|
Asset Derivatives
|
Liability Derivatives
|
||||||||||||||||||
|
Derivative Category
|
Balance Sheet
Location
|
2013
|
2012
|
Balance Sheet
Location
|
2013
|
2012
|
|||||||||||||
|
(in millions)
|
(in millions)
|
||||||||||||||||||
|
Derivatives designated as hedging instruments for regulatory purposes
|
|||||||||||||||||||
|
Energy-related derivatives:
|
Other current assets
|
$
|
16
|
|
$
|
10
|
|
Liabilities from risk management activities
|
$
|
26
|
|
$
|
74
|
|
|||||
|
Other deferred charges and assets
|
7
|
|
13
|
|
Other deferred credits and liabilities
|
29
|
|
35
|
|
||||||||||
|
Total derivatives designated as hedging instruments for regulatory purposes
|
$
|
23
|
|
$
|
23
|
|
$
|
55
|
|
$
|
109
|
|
|||||||
|
Derivatives designated as hedging instruments in cash flow and fair value hedges
|
|||||||||||||||||||
|
Interest rate derivatives:
|
Other current assets
|
$
|
3
|
|
$
|
7
|
|
Liabilities from risk management activities
|
$
|
—
|
|
$
|
—
|
|
|||||
|
Other deferred charges and assets
|
—
|
|
3
|
|
Other deferred credits and liabilities
|
—
|
|
—
|
|
||||||||||
|
Total derivatives designated as hedging instruments in cash flow and fair value hedges
|
$
|
3
|
|
$
|
10
|
|
$
|
—
|
|
$
|
—
|
|
|||||||
|
Derivatives not designated as hedging instruments
|
|||||||||||||||||||
|
Energy-related derivatives:
|
Other current assets
|
$
|
—
|
|
$
|
1
|
|
Liabilities from risk management activities
|
$
|
1
|
|
$
|
1
|
|
|||||
|
Other deferred charges and assets
|
1
|
|
2
|
|
Other deferred credits and liabilities
|
—
|
|
1
|
|
||||||||||
|
Total derivatives not designated as hedging instruments
|
$
|
1
|
|
$
|
3
|
|
$
|
1
|
|
$
|
2
|
|
|||||||
|
Total
|
$
|
27
|
|
$
|
36
|
|
$
|
56
|
|
$
|
111
|
|
|||||||
All derivative instruments are measured at fair value. See Note 10 for additional information.
II-110
NOTES (continued)
Southern Company and Subsidiary Companies 2013 Annual Report
The Company's derivative contracts are not subject to master netting arrangements or similar agreements and are reported gross on the Company's financial statements. Some of these energy-related and interest rate derivative contracts contain certain provisions that permit intra-contract netting of derivative receivables and payables for routine billing and offsets related to events of default and settlements. Amounts related to energy-related derivative contracts at
December 31, 2013
and
2012
are presented in the following tables. Interest rate derivatives presented in the tables above do not have amounts available for offset and are therefore excluded from the offsetting disclosure tables below.
|
Fair Value
|
||||||||||||||||||
|
Assets
|
|
2013
|
|
2012
|
|
Liabilities
|
|
2013
|
|
2012
|
||||||||
|
(in millions)
|
(in millions)
|
|||||||||||||||||
|
Energy-related derivatives presented in the Balance Sheet
(a)
|
|
$
|
24
|
|
|
$
|
26
|
|
|
Energy-related derivatives presented in the Balance Sheet
(a)
|
|
$
|
56
|
|
|
$
|
111
|
|
|
Gross amounts not offset in the Balance Sheet
(b)
|
|
(22
|
)
|
|
(23
|
)
|
|
Gross amounts not offset in the Balance Sheet
(b)
|
|
(22
|
)
|
|
(23
|
)
|
||||
|
Net-energy related derivative assets
|
|
$
|
2
|
|
|
$
|
3
|
|
|
Net-energy related derivative liabilities
|
|
$
|
34
|
|
|
$
|
88
|
|
(a) The Company does not offset fair value amounts for multiple derivative instruments executed with the same counterparty on the balance sheets; therefore, gross and net amounts of derivative assets and liabilities presented on the balance sheets are the same.
(b) Includes gross amounts subject to netting terms that are not offset on the balance sheets and any cash/financial collateral pledged or received.
At
December 31, 2013
and
2012
, the pre-tax effects of unrealized derivative gains (losses) arising from energy-related derivative instruments designated as regulatory hedging instruments and deferred on the balance sheets were as follows:
|
|
Unrealized Losses
|
Unrealized Gains
|
|||||||||||||||||
|
Derivative Category
|
Balance Sheet Location
|
2013
|
2012
|
Balance Sheet Location
|
2013
|
2012
|
|||||||||||||
|
|
|
(in millions)
|
|
(in millions)
|
|||||||||||||||
|
Energy-related derivatives:
|
Other regulatory assets, current
|
$
|
(26
|
)
|
$
|
(74
|
)
|
Other regulatory liabilities, current
|
$
|
16
|
|
$
|
10
|
|
|||||
|
Other regulatory assets, deferred
|
(29
|
)
|
(35
|
)
|
Other regulatory liabilities, deferred
|
7
|
|
13
|
|
||||||||||
|
Total energy-related derivative gains (losses)
|
$
|
(55
|
)
|
$
|
(109
|
)
|
$
|
23
|
|
$
|
23
|
|
|||||||
For the years ended
December 31, 2013
,
2012
, and
2011
, the pre-tax effects of interest rate and foreign currency derivatives designated as fair value hedging instruments on the statements of income were immaterial on a gross basis for Southern Company. Furthermore, the pre-tax effects of interest rate derivatives designated as fair value hedging instruments on Southern Company's statements of income were offset by changes to the carrying value of long-term debt and the pre-tax effects of foreign currency derivatives designated as fair value hedging instruments on Southern Company's statements of income were offset by changes in the fair value of the purchase commitment related to equipment purchases.
For the years ended
December 31, 2013
,
2012
, and
2011
, the pre-tax effects of energy-related derivatives and interest rate derivatives designated as cash flow hedging instruments recorded in OCI and reclassified into earnings were immaterial for Southern Company.
There was no material ineffectiveness recorded in earnings for any period presented.
For the Southern Company system's energy-related derivatives not designated as hedging instruments, a portion of the pre-tax realized and unrealized gains and losses is associated with hedging fuel price risk of certain PPA customers and has no impact on net income or on fuel expense as presented in the Company's statements of income. As a result, the pre-tax effects of energy-related derivatives not designated as hedging instruments on the Company's statements of income were immaterial for any year presented. This third party hedging activity has been discontinued.
Contingent Features
The Company does not have any credit arrangements that would require material changes in payment schedules or terminations as a result of a credit rating downgrade. There are certain derivatives that could require collateral, but not accelerated payment, in the event of various credit rating changes of certain Southern Company subsidiaries. At
December 31, 2013
, the fair value of derivative liabilities with contingent features was
$9 million
.
II-111
NOTES (continued)
Southern Company and Subsidiary Companies 2013 Annual Report
At
December 31, 2013
, Southern Company's collateral posted with its derivative counterparties was immaterial. The maximum potential collateral requirements arising from the credit-risk-related contingent features, at a rating below BBB- and/or Baa3, were
$9 million
and include certain agreements that could require collateral in the event that one or more Southern Company system power pool participants has a credit rating change to below investment grade.
Generally, collateral may be provided by a Southern Company guaranty, letter of credit, or cash. If collateral is required, fair value amounts recognized for the right to reclaim cash collateral or the obligation to return cash collateral are not offset against fair value amounts recognized for derivatives executed with the same counterparty.
Southern Company, the traditional operating companies, and Southern Power are exposed to losses related to financial instruments in the event of counterparties' nonperformance. Southern Company, the traditional operating companies, and Southern Power only enter into agreements and material transactions with counterparties that have investment grade credit ratings by Moody's and S&P or with counterparties who have posted collateral to cover potential credit exposure. Southern Company, the traditional operating companies, and Southern Power have also established risk management policies and controls to determine and monitor the creditworthiness of counterparties in order to mitigate Southern Company's, the traditional operating companies', and Southern Power's exposure to counterparty credit risk. Therefore, Southern Company, the traditional operating companies, and Southern Power do not anticipate a material adverse effect on the financial statements as a result of counterparty nonperformance.
12. SEGMENT AND RELATED INFORMATION
The primary business of the Southern Company system is electricity sales by the traditional operating companies and Southern Power. The four traditional operating companies – Alabama Power, Georgia Power, Gulf Power and Mississippi Power – are vertically integrated utilities providing electric service in four Southeastern states. Southern Power constructs, acquires, owns, and manages generation assets, including renewable energy projects, and sells electricity at market-based rates in the wholesale market.
Southern Company's reportable business segments are the sale of electricity by the
four
traditional operating companies and Southern Power. Revenues from sales by Southern Power to the traditional operating companies were
$346 million
,
$425 million
, and
$359 million
in
2013
,
2012
, and
2011
, respectively. The "All Other" column includes parent Southern Company, which does not allocate operating expenses to business segments. Also, this category includes segments below the quantitative threshold for separate disclosure. These segments include investments in telecommunications and leveraged lease projects. All other inter-segment revenues are not material. Financial data for business segments and products and services for the years ended December 31,
2013
,
2012
, and
2011
was as follows:
II-112
NOTES (continued)
Southern Company and Subsidiary Companies 2013 Annual Report
|
Electric Utilities
|
|||||||||||||||||||||||||||
|
Traditional
Operating
Companies
|
Southern
Power
|
Eliminations
|
Total
|
All
Other
|
Eliminations
|
Consolidated
|
|||||||||||||||||||||
|
(in millions)
|
|||||||||||||||||||||||||||
|
2013
|
|||||||||||||||||||||||||||
|
Operating revenues
|
$
|
16,136
|
|
$
|
1,275
|
|
$
|
(376
|
)
|
$
|
17,035
|
|
$
|
139
|
|
$
|
(87
|
)
|
$
|
17,087
|
|
||||||
|
Depreciation and amortization
|
1,711
|
|
175
|
|
—
|
|
1,886
|
|
15
|
|
—
|
|
1,901
|
|
|||||||||||||
|
Interest income
|
17
|
|
1
|
|
—
|
|
18
|
|
2
|
|
(1
|
)
|
19
|
|
|||||||||||||
|
Interest expense
|
714
|
|
74
|
|
—
|
|
788
|
|
36
|
|
—
|
|
824
|
|
|||||||||||||
|
Income taxes
|
889
|
|
46
|
|
—
|
|
935
|
|
(85
|
)
|
(1
|
)
|
849
|
|
|||||||||||||
|
Segment net income (loss)
(a) (b)
|
1,486
|
|
166
|
|
—
|
|
1,652
|
|
(10
|
)
|
2
|
|
1,644
|
|
|||||||||||||
|
Total assets
|
59,447
|
|
4,429
|
|
(101
|
)
|
63,775
|
|
1,077
|
|
(306
|
)
|
64,546
|
|
|||||||||||||
|
Gross property additions
|
5,226
|
|
633
|
|
—
|
|
5,859
|
|
9
|
|
—
|
|
5,868
|
|
|||||||||||||
|
2012
|
|||||||||||||||||||||||||||
|
Operating revenues
|
$
|
15,730
|
|
$
|
1,186
|
|
$
|
(438
|
)
|
$
|
16,478
|
|
$
|
141
|
|
$
|
(82
|
)
|
$
|
16,537
|
|
||||||
|
Depreciation and amortization
|
1,629
|
|
143
|
|
—
|
|
1,772
|
|
15
|
|
—
|
|
1,787
|
|
|||||||||||||
|
Interest income
|
21
|
|
1
|
|
—
|
|
22
|
|
19
|
|
(1
|
)
|
40
|
|
|||||||||||||
|
Interest expense
|
757
|
|
63
|
|
—
|
|
820
|
|
39
|
|
—
|
|
859
|
|
|||||||||||||
|
Income taxes
|
1,307
|
|
93
|
|
—
|
|
1,400
|
|
(66
|
)
|
—
|
|
1,334
|
|
|||||||||||||
|
Segment net income (loss)
(a)
|
2,145
|
|
175
|
|
1
|
|
2,321
|
|
33
|
|
(4
|
)
|
2,350
|
|
|||||||||||||
|
Total assets
|
58,600
|
|
3,780
|
|
(129
|
)
|
62,251
|
|
1,116
|
|
(218
|
)
|
63,149
|
|
|||||||||||||
|
Gross property additions
|
4,813
|
|
241
|
|
—
|
|
5,054
|
|
5
|
|
—
|
|
5,059
|
|
|||||||||||||
|
2011
|
|||||||||||||||||||||||||||
|
Operating revenues
|
$
|
16,763
|
|
$
|
1,236
|
|
$
|
(412
|
)
|
$
|
17,587
|
|
$
|
149
|
|
$
|
(79
|
)
|
$
|
17,657
|
|
||||||
|
Depreciation and amortization
|
1,576
|
|
124
|
|
—
|
|
1,700
|
|
16
|
|
1
|
|
1,717
|
|
|||||||||||||
|
Interest income
|
18
|
|
1
|
|
—
|
|
19
|
|
3
|
|
(1
|
)
|
21
|
|
|||||||||||||
|
Interest expense
|
726
|
|
77
|
|
—
|
|
803
|
|
54
|
|
—
|
|
857
|
|
|||||||||||||
|
Income taxes
|
1,217
|
|
76
|
|
—
|
|
1,293
|
|
(74
|
)
|
—
|
|
1,219
|
|
|||||||||||||
|
Segment net income (loss)
(a)
|
2,052
|
|
162
|
|
—
|
|
2,214
|
|
(8
|
)
|
(3
|
)
|
2,203
|
|
|||||||||||||
|
Total assets
|
54,622
|
|
3,581
|
|
(127
|
)
|
58,076
|
|
1,592
|
|
(401
|
)
|
59,267
|
|
|||||||||||||
|
Gross property additions
|
4,589
|
|
255
|
|
—
|
|
4,844
|
|
9
|
|
—
|
|
4,853
|
|
|||||||||||||
(a) After dividends on preferred and preference stock of subsidiaries.
(b) Segment net income (loss) in 2013 includes
$1.2 billion
in pre-tax charges (
$729 million
after tax) for estimated probable losses on the Kemper IGCC.
See Note (3) under "Integrated Coal Gasification Combined Cycle – Kemper IGCC Construction Schedule and Cost Estimate" for additional information.
Products and Services
|
Electric Utilities' Revenues
|
||||||||||||||||
|
Year
|
Retail
|
Wholesale
|
Other
|
Total
|
||||||||||||
|
|
(in millions)
|
|||||||||||||||
|
2013
|
$
|
14,541
|
|
$
|
1,855
|
|
$
|
639
|
|
$
|
17,035
|
|
||||
|
2012
|
14,187
|
|
1,675
|
|
616
|
|
16,478
|
|
||||||||
|
2011
|
15,071
|
|
1,905
|
|
611
|
|
17,587
|
|
||||||||
II-113
NOTES (continued)
Southern Company and Subsidiary Companies 2013 Annual Report
13. QUARTERLY FINANCIAL INFORMATION (UNAUDITED)
Summarized quarterly financial information for
2013
and
2012
is as follows:
|
Consolidated Net Income After Dividends on Preferred and Preference Stock of Subsidiaries
|
Per Common Share
|
||||||||||||||||||||||||||||||
|
Operating
Revenues
|
Operating
Income
|
Basic
Earnings
|
Diluted Earnings
|
Trading
Price Range
|
|||||||||||||||||||||||||||
|
Quarter Ended
|
Dividends
|
High
|
Low
|
||||||||||||||||||||||||||||
|
(in millions)
|
|||||||||||||||||||||||||||||||
|
March 2013
|
$
|
3,897
|
|
$
|
325
|
|
$
|
81
|
|
$
|
0.09
|
|
$
|
0.09
|
|
$
|
0.4900
|
|
$
|
46.95
|
|
$
|
42.82
|
|
|||||||
|
June 2013
|
4,246
|
|
640
|
|
297
|
|
0.34
|
|
0.34
|
|
0.5075
|
|
48.74
|
|
42.32
|
|
|||||||||||||||
|
September 2013
|
5,017
|
|
1,491
|
|
852
|
|
0.97
|
|
0.97
|
|
0.5075
|
|
45.75
|
|
40.63
|
|
|||||||||||||||
|
December 2013
|
3,927
|
|
799
|
|
414
|
|
0.47
|
|
0.47
|
|
0.5075
|
|
42.94
|
|
40.03
|
|
|||||||||||||||
|
March 2012
|
$
|
3,604
|
|
$
|
766
|
|
$
|
368
|
|
$
|
0.42
|
|
$
|
0.42
|
|
$
|
0.4725
|
|
$
|
46.06
|
|
$
|
43.71
|
|
|||||||
|
June 2012
|
4,181
|
|
1,143
|
|
623
|
|
0.71
|
|
0.71
|
|
0.4900
|
|
48.45
|
|
44.22
|
|
|||||||||||||||
|
September 2012
|
5,049
|
|
1,740
|
|
976
|
|
1.11
|
|
1.11
|
|
0.4900
|
|
48.59
|
|
44.64
|
|
|||||||||||||||
|
December 2012
|
3,703
|
|
814
|
|
383
|
|
0.44
|
|
0.44
|
|
0.4900
|
|
47.09
|
|
41.75
|
|
|||||||||||||||
The Southern Company system's business is influenced by seasonal weather conditions.
II-114
SELECTED CONSOLIDATED FINANCIAL AND OPERATING DATA
For the Periods Ended December
2009
through
2013
Southern Company and Subsidiary Companies
2013
Annual Report
|
|
2013
|
|
2012
|
|
2011
|
|
2010
|
|
2009
|
|
|||||||||
|
Operating Revenues (
in millions
)
|
$
|
17,087
|
|
$
|
16,537
|
|
$
|
17,657
|
|
$
|
17,456
|
|
$
|
15,743
|
|
||||
|
Total Assets (
in millions
)
|
$
|
64,546
|
|
$
|
63,149
|
|
$
|
59,267
|
|
$
|
55,032
|
|
$
|
52,046
|
|
||||
|
Gross Property Additions (
in millions
)
|
$
|
5,868
|
|
$
|
5,059
|
|
$
|
4,853
|
|
$
|
4,443
|
|
$
|
4,913
|
|
||||
|
Return on Average Common Equity (
percent
)
|
8.82
|
|
13.10
|
|
13.04
|
|
12.71
|
|
11.67
|
|
|||||||||
|
Cash Dividends Paid Per Share of
Common Stock
|
$
|
2.0125
|
|
$
|
1.9425
|
|
$
|
1.8725
|
|
$
|
1.8025
|
|
$
|
1.7325
|
|
||||
|
Consolidated Net Income After
Dividends on Preferred and Preference
Stock of Subsidiaries (
in millions
)
|
$
|
1,644
|
|
$
|
2,350
|
|
$
|
2,203
|
|
$
|
1,975
|
|
$
|
1,643
|
|
||||
|
Earnings Per Share —
|
|||||||||||||||||||
|
Basic
|
$
|
1.88
|
|
$
|
2.70
|
|
$
|
2.57
|
|
$
|
2.37
|
|
$
|
2.07
|
|
||||
|
Diluted
|
1.87
|
|
2.67
|
|
2.55
|
|
2.36
|
|
2.06
|
|
|||||||||
|
Capitalization (
in millions
):
|
|||||||||||||||||||
|
Common stock equity
|
$
|
19,008
|
|
$
|
18,297
|
|
$
|
17,578
|
|
$
|
16,202
|
|
$
|
14,878
|
|
||||
|
Preferred and preference stock of subsidiaries
|
756
|
|
707
|
|
707
|
|
707
|
|
707
|
|
|||||||||
|
Redeemable preferred stock of subsidiaries
|
375
|
|
375
|
|
375
|
|
375
|
|
375
|
|
|||||||||
|
Long-term debt
|
21,344
|
|
19,274
|
|
18,647
|
|
18,154
|
|
18,131
|
|
|||||||||
|
Total (
excluding amounts due within one year
)
|
$
|
41,483
|
|
$
|
38,653
|
|
$
|
37,307
|
|
$
|
35,438
|
|
$
|
34,091
|
|
||||
|
Capitalization Ratios (
percent
):
|
|||||||||||||||||||
|
Common stock equity
|
45.8
|
|
47.3
|
|
47.1
|
|
45.7
|
|
43.6
|
|
|||||||||
|
Preferred and preference stock of subsidiaries
|
1.8
|
|
1.8
|
|
1.9
|
|
2.0
|
|
2.1
|
|
|||||||||
|
Redeemable preferred stock of subsidiaries
|
0.9
|
|
1.0
|
|
1.0
|
|
1.1
|
|
1.1
|
|
|||||||||
|
Long-term debt
|
51.5
|
|
49.9
|
|
50.0
|
|
51.2
|
|
53.2
|
|
|||||||||
|
Total (
excluding amounts due within one year
)
|
100.0
|
|
100.0
|
|
100.0
|
|
100.0
|
|
100.0
|
|
|||||||||
|
Other Common Stock Data:
|
|||||||||||||||||||
|
Book value per share
|
$
|
21.43
|
|
$
|
21.09
|
|
$
|
20.32
|
|
$
|
19.21
|
|
$
|
18.15
|
|
||||
|
Market price per share:
|
|||||||||||||||||||
|
High
|
$
|
48.74
|
|
$
|
48.59
|
|
$
|
46.69
|
|
$
|
38.62
|
|
$
|
37.62
|
|
||||
|
Low
|
40.03
|
|
41.75
|
|
35.73
|
|
30.85
|
|
26.48
|
|
|||||||||
|
Close (
year-end
)
|
41.11
|
|
42.81
|
|
46.29
|
|
38.23
|
|
33.32
|
|
|||||||||
|
Market-to-book ratio (
year-end
) (
percent
)
|
191.8
|
|
203.0
|
|
227.8
|
|
199.0
|
|
183.6
|
|
|||||||||
|
Price-earnings ratio (
year-end
) (
times
)
|
21.9
|
|
15.9
|
|
18.0
|
|
16.1
|
|
16.1
|
|
|||||||||
|
Dividends paid (
in millions
)
|
$
|
1,762
|
|
$
|
1,693
|
|
$
|
1,601
|
|
$
|
1,496
|
|
$
|
1,369
|
|
||||
|
Dividend yield (
year-end
) (
percent
)
|
4.9
|
|
4.5
|
|
4.0
|
|
4.7
|
|
5.2
|
|
|||||||||
|
Dividend payout ratio (
percent
)
|
107.1
|
|
72.0
|
|
72.7
|
|
75.7
|
|
83.3
|
|
|||||||||
|
Shares outstanding (
in thousands
):
|
|||||||||||||||||||
|
Average
|
876,755
|
|
871,388
|
|
856,898
|
|
832,189
|
|
794,795
|
|
|||||||||
|
Year-end
|
887,086
|
|
867,768
|
|
865,125
|
|
843,340
|
|
819,647
|
|
|||||||||
|
Stockholders of record (
year-end
)
|
143,800
|
|
149,628
|
|
155,198
|
|
160,426
|
|
*
|
92,799
|
|
||||||||
|
Traditional Operating Company Customers (
year-end
) (
in thousands
):
|
|||||||||||||||||||
|
Residential
|
3,859
|
|
3,832
|
|
3,809
|
|
3,813
|
|
3,798
|
|
|||||||||
|
Commercial
|
583
|
|
580
|
|
579
|
|
580
|
|
580
|
|
|||||||||
|
Industrial
|
15
|
|
15
|
|
15
|
|
15
|
|
15
|
|
|||||||||
|
Other
|
10
|
|
9
|
|
9
|
|
9
|
|
9
|
|
|||||||||
|
Total
|
4,467
|
|
4,436
|
|
4,412
|
|
4,417
|
|
4,402
|
|
|||||||||
|
Employees (
year-end
)
|
26,300
|
|
26,439
|
|
26,377
|
|
25,940
|
|
26,112
|
|
|||||||||
|
*
|
In July 2010, Southern Company changed its transfer agent from Southern Company Services, Inc. to Mellon Investor Services LLC (n/k/a Computershare Inc.). The change in the number of stockholders of record is primarily attributed to the calculation methodology used by Mellon Investor Services LLC.
|
II-115
SELECTED CONSOLIDATED FINANCIAL AND OPERATING DATA
For the Periods Ended December
2009
through
2013
Southern Company and Subsidiary Companies
2013
Annual Report
|
|
2013
|
|
2012
|
|
2011
|
|
2010
|
|
2009
|
|
|||||||||
|
Operating Revenues (
in millions
):
|
|||||||||||||||||||
|
Residential
|
$
|
6,011
|
|
$
|
5,891
|
|
$
|
6,268
|
|
$
|
6,319
|
|
$
|
5,481
|
|
||||
|
Commercial
|
5,214
|
|
5,097
|
|
5,384
|
|
5,252
|
|
4,901
|
|
|||||||||
|
Industrial
|
3,188
|
|
3,071
|
|
3,287
|
|
3,097
|
|
2,806
|
|
|||||||||
|
Other
|
128
|
|
128
|
|
132
|
|
123
|
|
119
|
|
|||||||||
|
Total retail
|
14,541
|
|
14,187
|
|
15,071
|
|
14,791
|
|
13,307
|
|
|||||||||
|
Wholesale
|
1,855
|
|
1,675
|
|
1,905
|
|
1,994
|
|
1,802
|
|
|||||||||
|
Total revenues from sales of electricity
|
16,396
|
|
15,862
|
|
16,976
|
|
16,785
|
|
15,109
|
|
|||||||||
|
Other revenues
|
691
|
|
675
|
|
681
|
|
671
|
|
634
|
|
|||||||||
|
Total
|
$
|
17,087
|
|
$
|
16,537
|
|
$
|
17,657
|
|
$
|
17,456
|
|
$
|
15,743
|
|
||||
|
Kilowatt-Hour Sales (
in millions
):
|
|||||||||||||||||||
|
Residential
|
50,575
|
|
50,454
|
|
53,341
|
|
57,798
|
|
51,690
|
|
|||||||||
|
Commercial
|
52,551
|
|
53,007
|
|
53,855
|
|
55,492
|
|
53,526
|
|
|||||||||
|
Industrial
|
52,429
|
|
51,674
|
|
51,570
|
|
49,984
|
|
46,422
|
|
|||||||||
|
Other
|
902
|
|
919
|
|
936
|
|
943
|
|
953
|
|
|||||||||
|
Total retail
|
156,457
|
|
156,054
|
|
159,702
|
|
164,217
|
|
152,591
|
|
|||||||||
|
Wholesale sales
|
26,944
|
|
27,563
|
|
30,345
|
|
32,570
|
|
33,503
|
|
|||||||||
|
Total
|
183,401
|
|
183,617
|
|
190,047
|
|
196,787
|
|
186,094
|
|
|||||||||
|
Average Revenue Per Kilowatt-Hour (
cents
):
|
|||||||||||||||||||
|
Residential
|
11.89
|
|
11.68
|
|
11.75
|
|
10.93
|
|
10.60
|
|
|||||||||
|
Commercial
|
9.92
|
|
9.62
|
|
10.00
|
|
9.46
|
|
9.16
|
|
|||||||||
|
Industrial
|
6.08
|
|
5.94
|
|
6.37
|
|
6.20
|
|
6.04
|
|
|||||||||
|
Total retail
|
9.29
|
|
9.09
|
|
9.44
|
|
9.01
|
|
8.72
|
|
|||||||||
|
Wholesale
|
6.88
|
|
6.08
|
|
6.28
|
|
6.12
|
|
5.38
|
|
|||||||||
|
Total sales
|
8.94
|
|
8.64
|
|
8.93
|
|
8.53
|
|
8.12
|
|
|||||||||
|
Average Annual Kilowatt-Hour
|
|||||||||||||||||||
|
Use Per Residential Customer
|
13,144
|
|
13,187
|
|
13,997
|
|
15,176
|
|
13,607
|
|
|||||||||
|
Average Annual Revenue
|
|||||||||||||||||||
|
Per Residential Customer
|
$
|
1,562
|
|
$
|
1,540
|
|
$
|
1,645
|
|
$
|
1,659
|
|
$
|
1,443
|
|
||||
|
Plant Nameplate Capacity
|
|||||||||||||||||||
|
Ratings (
year-end
) (
megawatts
)
|
45,502
|
|
45,740
|
|
43,555
|
|
42,961
|
|
42,932
|
|
|||||||||
|
Maximum Peak-Hour Demand (
megawatts
):
|
|||||||||||||||||||
|
Winter
|
27,555
|
|
31,705
|
|
34,617
|
|
35,593
|
|
33,519
|
|
|||||||||
|
Summer
|
33,557
|
|
35,479
|
|
36,956
|
|
36,321
|
|
34,471
|
|
|||||||||
|
System Reserve Margin (
at peak
) (
percent
)
|
21.5
|
|
20.8
|
|
19.2
|
|
23.3
|
|
26.4
|
|
|||||||||
|
Annual Load Factor (
percent
)
|
63.2
|
|
59.5
|
|
59.0
|
|
62.2
|
|
60.6
|
|
|||||||||
|
Plant Availability (
percent
)*:
|
|||||||||||||||||||
|
Fossil-steam
|
87.7
|
|
89.4
|
|
88.1
|
|
91.4
|
|
91.3
|
|
|||||||||
|
Nuclear
|
91.5
|
|
94.2
|
|
93.0
|
|
92.1
|
|
90.1
|
|
|||||||||
|
Source of Energy Supply (
percent
):
|
|||||||||||||||||||
|
Coal
|
36.9
|
|
35.2
|
|
48.7
|
|
55.0
|
|
54.7
|
|
|||||||||
|
Nuclear
|
15.5
|
|
16.2
|
|
15.0
|
|
14.1
|
|
14.9
|
|
|||||||||
|
Hydro
|
3.9
|
|
1.7
|
|
2.1
|
|
2.5
|
|
3.9
|
|
|||||||||
|
Oil and gas
|
37.3
|
|
38.3
|
|
28.0
|
|
23.7
|
|
22.5
|
|
|||||||||
|
Purchased power
|
6.4
|
|
8.6
|
|
6.2
|
|
4.7
|
|
4.0
|
|
|||||||||
|
Total
|
100.0
|
|
100.0
|
|
100.0
|
|
100.0
|
|
100.0
|
|
|||||||||
|
*
|
Beginning in 2012, plant availability is calculated as a weighted equivalent availability.
|
II-116
ALABAMA POWER COMPANY
FINANCIAL SECTION
II-117
MANAGEMENT'S REPORT ON INTERNAL CONTROL OVER FINANCIAL REPORTING
Alabama Power Company
2013
Annual Report
The management of Alabama Power Company (the Company) is responsible for establishing and maintaining an adequate system of internal control over financial reporting as required by the Sarbanes-Oxley Act of 2002 and as defined in Exchange Act Rule 13a-15(f). A control system can provide only reasonable, not absolute, assurance that the objectives of the control system are met.
Under management's supervision, an evaluation of the design and effectiveness of the Company's internal control over financial reporting was conducted based on the framework in
Internal Control—Integrated Framework (1992)
issued by the Committee of Sponsoring Organizations of the Treadway Commission. Based on this evaluation, management concluded that the Company's internal control over financial reporting was effective as of
December 31, 2013
.
/s/ Charles D. McCrary
Charles D. McCrary
President and Chief Executive Officer
/s/ Philip C. Raymond
Philip C. Raymond
Executive Vice President, Chief Financial Officer, and Treasurer
February 27, 2014
II-118
REPORT OF INDEPENDENT REGISTERED PUBLIC ACCOUNTING FIRM
To the Board of Directors of
Alabama Power Company
We have audited the accompanying balance sheets and statements of capitalization of Alabama Power Company (the Company) (a wholly owned subsidiary of The Southern Company) as of
December 31, 2013
and
2012
, and the related statements of income, comprehensive income, common stockholder's equity, and cash flows for each of the three years in the period ended
December 31, 2013
. These financial statements are the responsibility of the Company's management. Our responsibility is to express an opinion on these financial statements based on our audits.
We conducted our audits in accordance with the standards of the Public Company Accounting Oversight Board (United States). Those standards require that we plan and perform the audit to obtain reasonable assurance about whether the financial statements are free of material misstatement. The Company is not required to have, nor were we engaged to perform, an audit of its internal control over financial reporting. Our audits included consideration of internal control over financial reporting as a basis for designing audit procedures that are appropriate in the circumstances, but not for the purpose of expressing an opinion on the effectiveness of the Company's internal control over financial reporting. Accordingly, we express no such opinion. An audit also includes examining, on a test basis, evidence supporting the amounts and disclosures in the financial statements, assessing the accounting principles used and significant estimates made by management, as well as evaluating the overall financial statement presentation. We believe that our audits provide a reasonable basis for our opinion.
In our opinion, such financial statement
s (pages II-144 to II-191)
present fairly, in all material respects, the financial position of Alabama Power Company as of
December 31, 2013
and
2012
, and the results of its operations and its cash flows for each of the three years in the period ended
December 31, 2013
, in conformity with accounting principles generally accepted in the United States of America.
/s/ Deloitte & Touche LLP
Birmingham, Alabama
February 27, 2014
II-119
MANAGEMENT'S DISCUSSION AND ANALYSIS OF FINANCIAL CONDITION AND RESULTS OF OPERATIONS
Alabama Power Company
2013
Annual Report
OVERVIEW
Business Activities
Alabama Power Company (the Company) operates as a vertically integrated utility providing electricity to retail and wholesale customers within its traditional service territory located in the State of Alabama in addition to wholesale customers in the Southeast.
Many factors affect the opportunities, challenges, and risks of the Company's business of selling electricity. These factors include the ability to maintain a constructive regulatory environment, to maintain and grow energy sales given economic conditions, and to effectively manage and secure timely recovery of costs. These costs include those related to projected long-term demand growth, increasingly stringent environmental standards, reliability, fuel, capital expenditures, and restoration following major storms. Appropriately balancing required costs and capital expenditures with customer prices will continue to challenge the Company for the foreseeable future.
Key Performance Indicators
The Company continues to focus on several key performance indicators. These indicators include customer satisfaction, plant availability, system reliability, and net income after dividends on preferred and preference stock. The Company's financial success is directly tied to customer satisfaction. Key elements of ensuring customer satisfaction include outstanding service, high reliability, and competitive prices. Management uses customer satisfaction surveys and reliability indicators to evaluate the Company's results.
Peak season equivalent forced outage rate (Peak Season EFOR) is an indicator of fossil/hydro plant availability and efficient generation fleet operations during the months when generation needs are greatest. The rate is calculated by dividing the number of hours of forced outages by total generation hours. The fossil/hydro 2013 Peak Season EFOR was better than the target. Transmission and distribution system reliability performance is measured by the frequency and duration of outages. Performance targets for reliability are set internally based on historical performance. The performance for 2013 was better than the target for these reliability measures.
Net income after dividends on preferred and preference stock is the primary measure of the Company's financial performance. The Company's 2013 results compared to its targets for some of these key indicators are reflected in the following chart:
|
Key Performance Indicator
|
2013
Target
Performance
|
2013
Actual
Performance
|
|
|
Customer Satisfaction
|
Top quartile in
customer surveys
|
Top quartile
|
|
|
Peak Season EFOR — fossil/hydro
|
5.86% or less
|
3.27%
|
|
|
Net Income After Dividends on Preferred and Preference Stock
|
$694 million
|
$712 million
|
|
See RESULTS OF OPERATIONS herein for additional information on the Company's financial performance.
Earnings
The Company's 2013 net income after dividends on preferred and preference stock of $712 million increased $8 million (1.1%) from the prior year. The increase in net income was due primarily to more favorable weather-related revenues in 2013 compared to 2012, an increase in allowance for funds used during construction (AFUDC) resulting from increased capital expenditures, and a decrease in interest expense resulting from lower interest rates. The factors increasing net income were partially offset by a decrease in revenues related to net investment under rate certificated new plant environmental (Rate CNP Environmental) and a decrease in wholesale revenues to municipalities.
The Company's 2012 net income after dividends on preferred and preference stock of $704 million decreased $4 million (0.6%) from the prior year. The decrease was due to decreases in weather-related revenues due to milder weather in 2012 compared to 2011 and an increase in other operations and maintenance expenses. The factors decreasing net income were partially offset by increases in revenues associated with the elimination of a tax-related adjustment under the Company's rate structure effective in the fourth quarter 2011 and an increase in retail sales growth.
II-120
MANAGEMENT'S DISCUSSION AND ANALYSIS (continued)
Alabama Power Company 2013 Annual Report
RESULTS OF OPERATIONS
A condensed income statement for the Company follows:
|
Amount
|
Increase (Decrease)
from Prior Year
|
||||||||||
|
2013
|
2013
|
2012
|
|||||||||
|
(in millions)
|
|||||||||||
|
Operating revenues
|
$
|
5,618
|
|
$
|
98
|
|
$
|
(182
|
)
|
||
|
Fuel
|
1,631
|
|
128
|
|
(176
|
)
|
|||||
|
Purchased power
|
229
|
|
(26
|
)
|
(16
|
)
|
|||||
|
Other operations and maintenance
|
1,289
|
|
2
|
|
25
|
|
|||||
|
Depreciation and amortization
|
645
|
|
6
|
|
2
|
|
|||||
|
Taxes other than income taxes
|
348
|
|
8
|
|
1
|
|
|||||
|
Total operating expenses
|
4,142
|
|
118
|
|
(164
|
)
|
|||||
|
Operating income
|
1,476
|
|
(20
|
)
|
(18
|
)
|
|||||
|
Allowance for equity funds used during construction
|
32
|
|
13
|
|
(3
|
)
|
|||||
|
Interest income
|
16
|
|
—
|
|
(2
|
)
|
|||||
|
Interest expense, net of amounts capitalized
|
259
|
|
(28
|
)
|
(12
|
)
|
|||||
|
Other income (expense), net
|
(36
|
)
|
(12
|
)
|
6
|
|
|||||
|
Income taxes
|
478
|
|
1
|
|
(1
|
)
|
|||||
|
Net income
|
751
|
|
8
|
|
(4
|
)
|
|||||
|
Dividends on preferred and preference stock
|
39
|
|
—
|
|
—
|
|
|||||
|
Net income after dividends on preferred and preference stock
|
$
|
712
|
|
$
|
8
|
|
$
|
(4
|
)
|
||
Operating Revenues
Operating revenues for 2013 were $5.6 billion, reflecting a $98 million increase from 2012. Details of operating revenues were as follows:
|
Amount
|
|||||||
|
2013
|
2012
|
||||||
|
(in millions)
|
|||||||
|
Retail — prior year
|
$
|
4,933
|
|
$
|
4,972
|
|
|
|
Estimated change resulting from —
|
|||||||
|
Rates and pricing
|
(18
|
)
|
69
|
|
|||
|
Sales growth
|
4
|
|
61
|
|
|||
|
Weather
|
21
|
|
(115
|
)
|
|||
|
Fuel and other cost recovery
|
12
|
|
(54
|
)
|
|||
|
Retail — current year
|
4,952
|
|
4,933
|
|
|||
|
Wholesale revenues —
|
|||||||
|
Non-affiliates
|
248
|
|
277
|
|
|||
|
Affiliates
|
212
|
|
111
|
|
|||
|
Total wholesale revenues
|
460
|
|
388
|
|
|||
|
Other operating revenues
|
206
|
|
199
|
|
|||
|
Total operating revenues
|
$
|
5,618
|
|
$
|
5,520
|
|
|
|
Percent change
|
1.8
|
%
|
(3.2
|
)%
|
|||
Retail revenues in 2013 were $5.0 billion. These revenues increased $19 million (0.4%) in 2013 and decreased $39 million (0.8%) in 2012, each as compared to the prior year. The increase in 2013 was due to more favorable weather, increased fuel revenues and
II-121
MANAGEMENT'S DISCUSSION AND ANALYSIS (continued)
Alabama Power Company 2013 Annual Report
increased revenues associated with rate certificated new plant (Rate CNP PPA). The increase in 2013 was partially offset by a reduction in revenues related to net investments under Rate CNP Environmental. The decrease in 2012 was due to milder weather, a reduction in revenues related to net investments under Rate CNP Environmental, and a reduction in fuel revenues when compared to 2011. The decrease in 2012 was partially offset by increased revenues associated with the elimination of a tax-related adjustment under the Company's rate structure and weather adjusted sales growth due to higher demand. See FUTURE EARNINGS POTENTIAL – "PSC Matters" herein and Note 3 to the financial statements under "Retail Regulatory Matters" for additional information. See "Energy Sales" for a discussion of changes in the volume of energy sold, including changes related to sales growth (decline) and weather.
Fuel rates billed to customers are designed to fully recover fluctuating fuel and purchased power costs over a period of time. Fuel revenues generally have no effect on net income because they represent the recording of revenues to offset fuel and purchased power expenses. See FUTURE EARNINGS POTENTIAL – "PSC Matters – Retail Energy Cost Recovery" herein and Note 3 to the financial statements under "Retail Regulatory Matters – Retail Energy Cost Recovery" for additional information.
Wholesale revenues from power sales to non-affiliated utilities were as follows:
|
2013
|
2012
|
2011
|
|||||||||
|
(in millions)
|
|||||||||||
|
Capacity and other
|
$
|
128
|
|
$
|
143
|
|
$
|
148
|
|
||
|
Energy
|
120
|
|
134
|
|
139
|
|
|||||
|
Total non-affiliated
|
$
|
248
|
|
$
|
277
|
|
|
$
|
287
|
|
|
Wholesale revenues from sales to non-affiliates will vary depending on the market prices of available wholesale energy compared to the cost of the Company's and the Southern Company system's generation, demand for energy within the Southern Company system's service territory, and availability of the Southern Company system's generation. Increases and decreases in energy revenues that are driven by fuel prices are accompanied by an increase or decrease in fuel costs and do not have a significant impact on net income.
In 2013, wholesale revenues from sales to non-affiliates decreased $29 million (10.5%) reflecting a $15 million decrease in capacity revenues and a $14 million decrease in revenues from energy sales. In 2013, kilowatt-hour (KWH) sales decreased 11.3% primarily from decreased sales to municipalities, partially offset by an 0.8% increase in the price of energy. In 2012, wholesale revenues from sales to non-affiliates decreased $10 million (3.5%) reflecting a $5 million decrease in revenue from energy sales and a $5 million decrease in capacity revenues. In 2012, the price of energy decreased 5.2%, partially offset by a 1.8% increase in KWH sales. Short-term opportunity energy sales are also included in wholesale energy sales to non-affiliates. These opportunity sales are made at market-based rates that generally provide a margin above the Company's variable cost to produce the energy.
Wholesale revenues from sales to affiliated companies will vary depending on demand and the availability and cost of generating resources at each company. These affiliate sales and purchases are made in accordance with the Intercompany Interchange Contract (IIC), as approved by the Federal Energy Regulatory Commission (FERC). These transactions do not have a significant impact on earnings since this energy is generally sold at marginal cost and energy purchases are generally offset by energy revenues through the Company's energy cost recovery clauses.
In 2013, wholesale revenues from sales to affiliates increased $101 million (91.0%) primarily due to a $103 million increase in energy sales, partially offset by a $2 million decrease in capacity revenues. In 2013, KWH sales increased 88.9% and there was a 1.3% increase in the price of energy. In 2012, wholesale revenues from sales to affiliates decreased $133 million (54.5%) primarily due to a $6 million decrease in capacity revenues and a $127 million decrease in energy sales. In 2012, KWH sales decreased 45% and there was a 17.6% decrease in the price of energy.
In 2013, other operating revenues were $206 million compared to $199 million in 2012. The increase from prior year revenues was not material.
Energy Sales
Changes in revenues are influenced heavily by the change in the volume of energy sold from year to year. KWH sales for 2013 and the percent change by year were as follows:
II-122
MANAGEMENT'S DISCUSSION AND ANALYSIS (continued)
Alabama Power Company 2013 Annual Report
|
Total
KWHs
|
Total KWH
Percent Change
|
Weather-Adjusted
Percent Change
|
||||||||||||
|
2013
|
2013
|
2012
|
2013
|
2012
|
||||||||||
|
(in billions)
|
||||||||||||||
|
Residential
|
17.9
|
|
1.7
|
%
|
(5.6
|
)%
|
(1.1
|
)%
|
2.6
|
%
|
||||
|
Commercial
|
13.9
|
|
(0.5
|
)
|
(1.5
|
)
|
0.5
|
|
0.6
|
|
||||
|
Industrial
|
22.9
|
|
3.4
|
|
2.3
|
|
3.4
|
|
2.3
|
|
||||
|
Other
|
0.2
|
|
(1.4
|
)
|
—
|
|
(1.4
|
)
|
—
|
|
||||
|
Total retail
|
54.9
|
|
1.8
|
|
(1.4
|
)
|
1.1
|
%
|
1.9
|
%
|
||||
|
Wholesale —
|
||||||||||||||
|
Non-affiliates
|
4.1
|
|
(10.8
|
)
|
0.6
|
|
||||||||
|
Affiliates
|
7.3
|
|
88.9
|
|
(44.9
|
)
|
||||||||
|
Total wholesale
|
11.4
|
|
34.5
|
|
(26.9
|
)
|
||||||||
|
Total energy sales
|
66.3
|
|
6.3
|
%
|
(5.9
|
)%
|
||||||||
Changes in retail energy sales are comprised of changes in electricity usage by customers, changes in weather, and changes in the number of customers. Retail energy sales in 2013 were 1.8% more than in 2012. Residential sales increased 1.7%, due primarily to more favorable weather in 2013. Weather-adjusted residential sales decreased 1.1%, primarily due to a decrease in customer demand. Commercial sales and weather-adjusted commercial sales remained relatively flat in 2013. Industrial sales increased 3.4% in 2013 as a result of an increase in demand resulting from changes in production levels primarily in the chemicals, the primary metals, and the stone, clay, and glass sectors.
Retail energy sales in 2012 were 1.4% less than in 2011. Residential and commercial sales decreased 5.6% and 1.5%, respectively, due primarily to milder weather in 2012. Weather-adjusted residential sales increased 2.6%, primarily due to an increase in customer demand. Industrial sales increased 2.3% in 2012 as a result of increased customer demand, primarily in the pipelines, primary metals, chemicals, and automotive and plastics sectors, due to a recovering economy, partially offset by decreases in the textiles and stone, clay, and glass sectors.
See "Operating Revenues" above for a discussion of significant changes in wholesale revenues from sales to non-affiliates and wholesale revenues from sales to affiliated companies as related to changes in price and KWH sales.
Fuel and Purchased Power Expenses
Fuel costs constitute the single largest expense for the Company. The mix of fuel sources for generation of electricity is determined primarily by demand, the unit cost of fuel consumed, and the availability of generating units. Additionally, the Company purchases a portion of its electricity needs from the wholesale market.
II-123
MANAGEMENT'S DISCUSSION AND ANALYSIS (continued)
Alabama Power Company 2013 Annual Report
Details of the Company's generation and purchased power were as follows:
|
2013
|
2012
|
2011
|
||||||
|
Total generation
(billions of KWHs)
|
65.3
|
|
59.9
|
|
64.8
|
|
||
|
Total purchased power
(billions of KWHs)
|
4.0
|
|
5.4
|
|
4.7
|
|
||
|
Sources of generation
(percent) —
|
||||||||
|
Coal
|
53
|
|
53
|
|
56
|
|
||
|
Nuclear
|
21
|
|
25
|
|
22
|
|
||
|
Gas
|
17
|
|
18
|
|
17
|
|
||
|
Hydro
|
9
|
|
4
|
|
5
|
|
||
|
Cost of fuel, generated
(cents per net KWH)
—
|
||||||||
|
Coal
|
3.29
|
|
3.30
|
|
3.16
|
|
||
|
Nuclear
|
0.84
|
|
0.80
|
|
0.66
|
|
||
|
Gas
|
3.38
|
|
3.06
|
|
3.92
|
|
||
|
Average cost of fuel, generated
(cents per net KWH)
*
|
2.73
|
|
2.61
|
|
2.70
|
|
||
|
Average cost of purchased power
(cents per net KWH)
**
|
5.76
|
|
4.86
|
|
6.04
|
|
||
|
*
|
KWHs generated by hydro are excluded from the average cost of fuel, generated.
|
|
**
|
Average cost of purchased power includes fuel purchased by the Company for tolling agreements where power is generated by the provider.
|
Fuel and purchased power expenses were $1.9 billion in 2013, an increase of $102 million (5.8%) compared to 2012. The increase was primarily due to a $95 million increase in the volume of KWHs generated, a $38 million increase in the average cost of fuel, and a $37 million increase in the average cost of purchased power. These increases were partially offset by a $68 million decrease related to the volume of KWHs purchased.
Fuel and purchased power expenses were $1.8 billion in 2012, a decrease of $192 million (9.8%) compared to 2011. The decrease was primarily due to a $143 million decrease related to lower KWHs generated due to milder weather in 2012 compared to 2011 and a $92 million decrease in the cost of natural gas and the average cost of purchased power, partially offset by increases in the cost of coal and nuclear fuel.
Fuel and purchased power energy transactions do not have a significant impact on earnings, since energy expenses are generally offset by energy revenues through the Company's energy cost recovery rate mechanism (Rate ECR). The Company, along with the Alabama Public Service Commission (PSC), continuously monitors the under/over recovered balance to determine whether adjustments to billing rates are required. See FUTURE EARNINGS POTENTIAL – "PSC Matters – Retail Energy Cost Recovery" herein and Note 3 to the financial statements under "Retail Regulatory Matters – Retail Energy Cost Recovery" for additional information.
Fuel
Fuel expenses were $1.6 billion in 2013, an increase of $128 million (8.5%) compared to 2012. This increase was primarily due to a 10.5% increase in the average cost of KWHs generated by natural gas, which excludes tolling agreements, and a 9.9% increase in KWHs generated by coal. This was partially offset by a 110.9% increase in the volume of KWHs generated by hydro facilities resulting from greater rainfall. Fuel expenses were $1.5 billion in 2012, a decrease of $176 million (10.5%) compared to 2011. This decrease was primarily due to a 21.9% decrease in the average cost of KWHs generated by natural gas, which excludes fuel associated with tolling agreements, and a 13.7% decrease in KWHs generated by coal, partially offset by 20.2% and 4.6% increases in the average cost of KWHs generated by nuclear fuel and coal, respectively.
Purchased Power
–
Non-Affiliates
In 2013, purchased power expense from non-affiliates was $100 million, an increase of $27 million (37.0%) compared to 2012. The increase over the prior year was primarily due to a 52.6% increase in the amount of energy purchased, partially offset by a 17.2% decrease in the average cost per KWH. In 2012 and 2011, purchased power expense from non-affiliates was $73 million.
Energy purchases from non-affiliates will vary depending on the market prices of wholesale energy as compared to the cost of the Southern Company system's generation, demand for energy within the Southern Company system's service territory, and the availability of the Southern Company system's generation.
II-124
MANAGEMENT'S DISCUSSION AND ANALYSIS (continued)
Alabama Power Company 2013 Annual Report
Purchased Power
–
Affiliates
Purchased power expense from affiliates was $129 million in 2013, a decrease of $53 million (29.1%) compared to 2012. This decrease was primarily due to a 50.4% decrease in the amount of energy purchased, partially offset by a 42.5% increase in the average cost per KWH. Purchased power expense from affiliates was $182 million in 2012, a decrease of $16 million (8.1%) compared to 2011. This decrease was primarily due to a 9.6% decrease in the average cost per KWH, partially offset by a 1.7% increase in the amount of energy purchased.
Energy purchases from affiliates will vary depending on demand for energy and the availability and cost of generating resources at each company within the Southern Company system. These purchases are made in accordance with the IIC or other contractual agreements, as approved by the FERC.
Other Operations and Maintenance Expenses
In 2013, other operations and maintenance expenses increased $2 million (0.22%) as compared to the prior year. The increase was not material.
In 2012, other operations and maintenance expenses increased $25 million (2.0%) as compared to the prior year. Administrative and general expenses increased $45 million primarily related to pension and other benefit-related expenses and injuries and damages expenses. Nuclear production expenses increased $23 million primarily related to the amortization of nuclear outage expenses of $35 million due to a change in the nuclear maintenance outage accounting process associated with routine refueling activities, as approved by the Alabama PSC in 2010. See FUTURE EARNINGS POTENTIAL – "PSC Matters – Nuclear Outage Accounting Order" herein for additional information. The increase in nuclear production expenses was partially offset by a decrease in operations costs related to labor expense. Other power generation expenses increased $6 million primarily related to scheduled outage costs and maintenance costs related to increases in labor and materials expenses. Transmission and distribution expenses decreased $32 million primarily related to a reduction in accruals to the natural disaster reserve (NDR). Steam production expenses decreased $22 million primarily related to a change in scheduled outage maintenance. See FUTURE EARNINGS POTENTIAL – "PSC Matters – Natural Disaster Reserve" herein for additional information.
Depreciation and Amortization
Depreciation and amortization increased $6 million (0.9%) in 2013 and $2 million (0.3%) in 2012, each as compared to the prior year. The increase in 2013 was primarily due to an increase in depreciation related to environmental assets, additions to property, plant, and equipment related to distribution and transmission projects, as well as the amortization of software. The increase related to environmental assets was offset by revenues under Rate CNP Environmental. These increases were partially offset by the deferral of certain expenses under an accounting order. See FUTURE EARNINGS POTENTIAL – "PSC Matters – Compliance and Pension Cost Accounting Order" herein and Note 3 to the financial statements under "Compliance and Pension Cost Accounting Order" for additional information. The increase in 2012 was not material.
Taxes Other Than Income Taxes
Taxes other than income taxes increased $8 million (2.4%) in 2013 and $1 million (0.3%) in 2012, each as compared to the prior year. The increase in 2013 was primarily due to property taxes, state use tax, and increases in municipal public utility license tax bases. The increase in 2012 was not material.
Allowance for Funds Used During Construction Equity
AFUDC equity increased $13 million (68.4%) in 2013 as compared to the prior year primarily due to increased capital expenditures associated with environmental, steam and nuclear generating facilities, and transmission. AFUDC equity decreased $3 million (13.6%) in 2012 as compared to the prior year primarily due to a decrease in capital expenditures associated with general plant projects and nuclear-related fuel and facilities. These decreases were primarily offset by increases in transmission and hydro generating facilities. See Note 1 to financial statements under "Allowance for Funds Used During Construction" for additional information.
Interest Expense, Net of Amounts Capitalized
Interest expense, net of amounts capitalized decreased $28 million (9.8%) in 2013 and $12 million (4.0%) in 2012, each as compared to the prior year. The decreases in 2013 and 2012 were primarily due to a decrease in interest rates and the timing of issuances and redemptions of long-term debt.
II-125
MANAGEMENT'S DISCUSSION AND ANALYSIS (continued)
Alabama Power Company 2013 Annual Report
Other Income (Expense), Net
Other income (expense), net decreased $12 million (50.0%) in 2013 as compared to the prior year primarily due to increases in donations, partially offset by increases in non-operating income related to gains on sales of non-utility property. Other income (expense), net increased $6 million (20.0%) in 2012 as compared to the prior year primarily due to an increase in non-operating income of $3 million, an increase in sales of property of $2 million, and a decrease in other deductions of $1 million.
Effects of Inflation
The Company is subject to rate regulation that is generally based on the recovery of historical and projected costs. The effects of inflation can create an economic loss since the recovery of costs could be in dollars that have less purchasing power. Any adverse effect of inflation on the Company's results of operations has not been substantial in recent years. See Note 3 to financial statements under "Retail Regulatory Matters – Rate RSE" for additional information.
FUTURE EARNINGS POTENTIAL
General
The Company operates as a vertically integrated utility providing electricity to retail and wholesale customers within its traditional service area located in the State of Alabama in addition to wholesale customers in the Southeast. Prices for electricity provided by the Company to retail customers are set by the Alabama PSC under cost-based regulatory principles. Prices for wholesale electricity sales, interconnecting transmission lines, and the exchange of electric power are regulated by the FERC. Retail rates and earnings are reviewed and may be adjusted periodically within certain limitations. See ACCOUNTING POLICIES – "Application of Critical Accounting Policies and Estimates – Electric Utility Regulation" and "FERC Matters" herein and Note 3 to the financial statements under "Retail Regulatory Matters" for additional information about regulatory matters.
The results of operations for the past three years are not necessarily indicative of future earnings potential. The level of the Company's future earnings depends on numerous factors that affect the opportunities, challenges, and risks of the Company's primary business of selling electricity. These factors include the Company's ability to maintain a constructive regulatory environment that continues to allow for the timely recovery of prudently-incurred costs during a time of increasing costs. Future earnings in the near term will depend, in part, upon maintaining energy sales which is subject to a number of factors. These factors include weather, competition, new energy contracts with other utilities, energy conservation practiced by customers, the price of electricity, the price elasticity of demand, and the rate of economic growth or decline in the Company's service territory. Changes in regional and global economic conditions impact sales for the Company, as the pace of the economic recovery remains uncertain. The timing and extent of the economic recovery will impact growth and may impact future earnings.
Environmental Matters
Compliance costs related to federal and state environmental statutes and regulations could affect earnings if such costs cannot continue to be fully recovered in rates on a timely basis. Environmental compliance spending over the next several years may differ materially from the amounts estimated. The timing, specific requirements, and estimated costs could change as environmental statutes and regulations are adopted or modified. Further, higher costs that are recovered through regulated rates could contribute to reduced demand for electricity, which could negatively affect results of operations, cash flows, and financial condition. See Note 3 to the financial statements under "Environmental Matters" for additional information.
New Source Review Actions
As part of a nationwide enforcement initiative against the electric utility industry which began in 1999, the U.S. Environmental Protection Agency (EPA) brought civil enforcement actions in federal district court against the Company alleging violations of the New Source Review (NSR) provisions of the Clean Air Act at certain coal-fired electric generating units, including a unit co-owned by Mississippi Power. These civil actions seek penalties and injunctive relief, including orders requiring installation of the best available control technologies at the affected units. The case against the Company (including claims involving a unit co-owned by Mississippi Power) has been actively litigated in the U.S. District Court for the Northern District of Alabama, resulting in a settlement in 2006 of the alleged NSR violations at Plant Miller; voluntary dismissal of certain claims by the EPA; and a grant of summary judgment for the Company on all remaining claims and dismissal of the case with prejudice in 2011. On September 19, 2013, the U.S. Court of Appeals for the Eleventh Circuit affirmed in part and reversed in part the 2011 judgment in favor of the Company, and the case has been transferred back to the U.S. District Court for the Northern District of Alabama for further proceedings.
II-126
MANAGEMENT'S DISCUSSION AND ANALYSIS (continued)
Alabama Power Company 2013 Annual Report
The Company believes it complied with applicable laws and regulations in effect at the time the work in question took place. The Clean Air Act authorizes maximum civil penalties of $25,000 to $37,500 per day, per violation, depending on the date of the alleged violation. An adverse outcome could require substantial capital expenditures that cannot be determined at this time and could possibly require payment of substantial penalties. Such expenditures could affect future results of operations, cash flows, and financial condition if such costs are not recovered through regulated rates. The ultimate outcome of this matter cannot be determined at this time.
Environmental Statutes and Regulations
General
The Company's operations are subject to extensive regulation by state and federal environmental agencies under a variety of statutes and regulations governing environmental media, including air, water, and land resources. Applicable statutes include the Clean Air Act; the Clean Water Act; the Comprehensive Environmental Response, Compensation, and Liability Act; the Resource Conservation and Recovery Act; the Toxic Substances Control Act; the Emergency Planning & Community Right-to-Know Act; the Endangered Species Act; and related federal and state regulations. Compliance with these environmental requirements involves significant capital and operating costs, a major portion of which is expected to be recovered through existing ratemaking provisions. Through 2013, the Company had invested approximately $3.2 billion in environmental capital retrofit projects to comply with these requirements, with annual totals of approximately $184 million, $62 million, and $34 million for 2013, 2012, and 2011, respectively. The Company expects that base level capital expenditures to comply with existing statutes and regulations will total approximately $1.1 billion from 2014 through 2016, with annual totals of approximately $502 million, $443 million, and $166 million for 2014, 2015, and 2016, respectively.
The Company continues to monitor the development of the EPA's proposed water and coal combustion residuals rules and to evaluate compliance options. See FINANCIAL CONDITION AND LIQUIDITY – "Capital Requirements and Contractual Obligations" herein for the Company's anticipated incremental compliance costs related to the proposed water and coal combustion residuals rules for 2014 through 2016. The ultimate capital expenditures and compliance costs with respect to these proposed rules, including additional expenditures required after 2016, will be dependent on the requirements of the final rules and regulations adopted by the EPA and the outcome of any legal challenges to these rules. See "Water Quality" and "Coal Combustion Residuals" herein for additional information.
The Company's ultimate environmental compliance strategy, including potential unit retirement and replacement decisions, and future environmental capital expenditures will be affected by the final requirements of new or revised environmental regulations and regulations relating to global climate change that are promulgated, including the proposed environmental regulations described below; the outcome of any legal challenges to the environmental rules; the cost, availability, and existing inventory of emissions allowances; and the Company's fuel mix. Compliance costs may arise from existing unit retirements, installation of additional environmental controls, upgrades to the transmission system, and adding or changing fuel sources for certain existing units. The ultimate outcome of these matters cannot be determined at this time.
Southern Electric Generating Company (SEGCO), a subsidiary of the Company, is jointly owned with Georgia Power. As part of its environmental compliance strategy, SEGCO plans to add natural gas as the primary fuel source for its generating units in 2015. The capacity of SEGCO's units is sold equally to the Company and Georgia Power through a power purchase agreement (PPA). If such compliance costs cannot continue to be recovered through retail rates, they could have a material financial impact on the Company's financial statements. See Note 4 to the financial statements for additional information.
Compliance with any new federal or state legislation or regulations relating to air quality, water, coal combustion residuals, global climate change, or other environmental and health concerns could significantly affect the Company. Although new or revised environmental legislation or regulations could affect many areas of the Company's operations, the full impact of any such changes cannot be determined at this time. Additionally, many of the Company's commercial and industrial customers may also be affected by existing and future environmental requirements, which for some may have the potential to ultimately affect their demand for electricity.
Air Quality
Compliance with the Clean Air Act and resulting regulations has been and will continue to be a significant focus for the Company. Since 1990, the Company has spent approximately $2.7 billion in reducing and monitoring emissions pursuant to the Clean Air Act. Additional controls are currently planned or under consideration to further reduce air emissions, maintain compliance with existing regulations, and meet new requirements.
II-127
MANAGEMENT'S DISCUSSION AND ANALYSIS (continued)
Alabama Power Company 2013 Annual Report
The EPA regulates ground level ozone concentrations through implementation of an eight-hour ozone National Ambient Air Quality Standard (NAAQS). In 2008, the EPA adopted a more stringent eight-hour ozone NAAQS, which it began to implement in 2011. In May 2012, the EPA published its final determination of nonattainment areas based on the 2008 eight-hour ozone NAAQS. All areas within the Company's service territory have achieved attainment of this standard.
The EPA regulates fine particulate matter concentrations on an annual and 24-hour average basis. All areas within the Company's service territory have achieved attainment with the 1997 and 2006 particulate matter NAAQS, and the EPA has officially redesignated some former nonattainment areas within the service territory as attainment for these standards. On January 15, 2013, the EPA published a final rule that increases the stringency of the annual fine particulate matter standard. The new standard could result in the designation of new nonattainment areas within the Company's service territory.
Final revisions to the NAAQS for sulfur dioxide (SO
2
), which established a new one-hour standard, became effective in 2010. No areas within the Company's service territory have been designated as nonattainment under this rule. However, the EPA may designate additional areas as nonattainment in the future, which could include areas within the Company's service territory. Implementation of the revised SO
2
standard could require additional reductions in SO
2
emissions and increased compliance and operational costs.
On February 13, 2014, the EPA proposed to delete from the Alabama State Implementation Plan (SIP) the Alabama opacity rule that the EPA approved in 2008, which provides operational flexibility to affected units. On March 6, 2013, the U.S. Court of Appeals for the Eleventh Circuit ruled in favor of the Company and vacated an earlier attempt by the EPA to rescind its 2008 approval. The EPA’s latest proposal characterizes the proposed deletion as an error correction within the meaning of the Clean Air Act. The Company believes this interpretation of the Clean Air Act to be incorrect. If finalized, this proposed action could affect unit availability and result in increased operations and maintenance costs for affected units, including units co-owned by Mississippi Power and units owned by SEGCO.
The Company's service territory is subject to the requirements of the Clean Air Interstate Rule (CAIR), which calls for phased reductions in SO
2
and nitrogen oxide (NO
x
) emissions from power plants in 28 eastern states. In 2008, the U.S. Court of Appeals for the District of Columbia Circuit issued decisions invalidating CAIR, but left CAIR compliance requirements in place while the EPA developed a new rule. In 2011, the EPA promulgated the Cross State Air Pollution Rule (CSAPR) to replace CAIR. However, in August 2012, the U.S. Court of Appeals for the District of Columbia Circuit vacated CSAPR in its entirety and directed the EPA to continue to administer CAIR pending the EPA's development of a valid replacement. Review of the U.S. Court of Appeals for the District of Columbia Circuit's decision regarding CSAPR is currently pending before the U.S. Supreme Court.
The EPA finalized the Clean Air Visibility Rule (CAVR) in 2005, with a goal of restoring natural visibility conditions in certain areas (primarily national parks and wilderness areas) by 2064. The rule involves the application of best available retrofit technology to certain sources built between 1962 and 1977 and any additional emissions reductions necessary for each designated area to achieve reasonable progress toward the natural visibility conditions goal by 2018 and for each 10-year period thereafter.
In February 2012, the EPA finalized the Mercury and Air Toxics Standards (MATS) rule, which imposes stringent emissions limits for acid gases, mercury, and particulate matter on coal- and oil-fired electric utility steam generating units. Compliance for existing sources is required by April 16, 2015; however, states may authorize a compliance extension of up to one year to April 16, 2016.
In August 2012, the EPA published proposed revisions to the New Source Performance Standard (NSPS) for Stationary Combustion Turbines (CTs). If finalized as proposed, the revisions would apply the NSPS to all new, reconstructed, and modified CTs (including CTs at combined cycle units), during all periods of operation, including startup and shutdown, and alter the criteria for determining when an existing CT has been reconstructed.
On February 12, 2013, the EPA proposed a rule that would require certain states to revise the provisions of their SIPs relating to the regulation of excess emissions at industrial facilities, including fossil-fuel fired generating facilities, during periods of startup, shut-down, or malfunction (SSM). The EPA proposes a determination that the SSM provisions in the SIPs for 36 states, including Alabama, do not meet the requirements of the Clean Air Act and must be revised within 18 months of the date on which the EPA publishes the final rule. The EPA has entered into a settlement agreement requiring it to finalize the rule by June 12, 2014.
The Company has developed and continually updates a comprehensive environmental compliance strategy to assess compliance obligations associated with the current and proposed environmental requirements discussed above. As part of this strategy, the Company has developed a compliance plan for the MATS rule which includes the construction of baghouses to provide an additional level of control on the emissions of mercury and particulates from certain generating units, the use of additives or other injection technology, and the use of existing or additional natural gas capability. Additionally, certain transmission system upgrades may be required. SEGCO, jointly owned by the Company and Georgia Power, plans to add natural gas capability.
II-128
MANAGEMENT'S DISCUSSION AND ANALYSIS (continued)
Alabama Power Company 2013 Annual Report
The impacts of the eight-hour ozone, fine particulate matter and SO
2
NAAQS, the Alabama opacity rule, CAIR and any future replacement rule, CAVR, the MATS rule, the NSPS for CTs, and the SSM rule on the Company cannot be determined at this time and will depend on the specific provisions of recently finalized and future rules, the resolution of pending and future legal challenges, and the development and implementation of rules at the state level. These regulations could result in significant additional compliance costs that could affect future unit retirement and replacement decisions and results of operations, cash flows, and financial condition if such costs are not recovered through regulated rates. Further, higher costs that are recovered through regulated rates could contribute to reduced demand for electricity, which could negatively impact results of operations, cash flows, and financial condition.
Water Quality
In 2011, the EPA published a proposed rule that establishes standards for reducing effects on fish and other aquatic life caused by cooling water intake structures at existing power plants and manufacturing facilities. The rule also addresses cooling water intake structures for new units at existing facilities. Compliance with the proposed rule could require changes to existing cooling water intake structures at certain of the Company's generating facilities, and new generating units constructed at existing plants would be required to install closed cycle cooling towers. The EPA is required to issue a final rule by April 17, 2014.
On June 7, 2013, the EPA published a proposed rule which requested comments on a range of potential regulatory options for addressing certain wastestreams from steam electric power plants. These regulations could result in the installation of additional controls at certain of the facilities of the Company, which could result in significant capital expenditures and compliance costs that could affect future unit retirement and replacement decisions, depending on the specific technology requirements of the final rule. See FINANCIAL CONDITION AND LIQUIDITY – "Capital Requirements and Contractual Obligations" for additional information regarding estimated compliance costs for 2014 through 2016.
The impact of these proposed rules cannot be determined at this time and will depend on the specific provisions of the final rules and the outcome of any legal challenges. These regulations could result in significant additional capital expenditures and compliance costs that could affect future unit retirement and replacement decisions. Also, results of operations, cash flows, and financial condition could be significantly impacted if such costs are not recovered through regulated rates. Further, higher costs that are recovered through regulated rates could contribute to reduced demand for electricity, which could negatively impact results of operations, cash flows, and financial condition.
Coal Combustion Residuals
The Company currently operates six electric generating plants with on-site coal combustion residuals storage facilities. In addition to on-site storage, the Company also sells a portion of its coal combustion residuals to third parties for beneficial reuse. Historically, individual states have regulated coal combustion residuals and the State of Alabama has its own regulatory requirements. The Company has a routine and robust inspection program in place to ensure the integrity of its coal ash surface impoundments and compliance with applicable regulations.
The EPA continues to evaluate the regulatory program for coal combustion residuals, including coal ash and gypsum, under federal solid and hazardous waste laws. In 2010, the EPA published a proposed rule that requested comments on two potential regulatory options for the management and disposal of coal combustion residuals: regulation as a solid waste or regulation as if the materials technically constituted a hazardous waste. Adoption of either option could require closure of, or significant change to, existing storage facilities and construction of lined landfills, as well as additional waste management and groundwater monitoring requirements. Under both options, the EPA proposes to exempt the beneficial reuse of coal combustion residuals from regulation; however, a hazardous or other designation indicative of heightened risk could limit or eliminate beneficial reuse options. Environmental groups and other parties have filed lawsuits in the U.S. District Court for the District of Columbia seeking to require the EPA to complete its rulemaking process and issue final regulations pertaining to the regulation of coal combustion residuals. On September 30, 2013, the U.S. District Court for the District of Columbia issued an order granting partial summary judgment to the environmental groups and other parties, ruling that the EPA has a statutory obligation to review and revise, as necessary, the federal solid waste regulations applicable to coal combustion residuals. On January 29, 2014, the EPA filed a consent decree requiring the EPA to take final action regarding the proposed regulation of coal combustion residuals as solid waste by December 19, 2014
.
While the ultimate outcome of this matter cannot be determined at this time and will depend on the final form of any rules adopted and the outcome of any legal challenges, additional regulation of coal combustion residuals could have a material impact on the generation, management, beneficial use, and disposal of such residuals. Any material changes are likely to result in substantial additional compliance, operational, and capital costs that could affect future unit retirement and replacement decisions. Moreover, the Company could incur additional material asset retirement obligations with respect to closing existing storage facilities. The Company's results of operations, cash flows, and financial condition could be significantly impacted if such costs
II-129
MANAGEMENT'S DISCUSSION AND ANALYSIS (continued)
Alabama Power Company 2013 Annual Report
are not recovered through regulated rates. Further, higher costs that are recovered through regulated rates could contribute to reduced demand for electricity, which could negatively impact results of operations, cash flows, and financial condition. See FINANCIAL CONDITION AND LIQUIDITY – "Capital Requirements and Contractual Obligations" for additional information regarding estimated compliance costs for 2014 through 2016.
Global Climate Issues
The EPA currently regulates greenhouse gases under the Prevention of Significant Deterioration and Title V operating permit programs of the Clean Air Act. The legal basis for these regulations is currently being challenged in the U.S. Supreme Court. In addition, over the past several years, the U.S. Congress has considered many proposals to reduce greenhouse gas emissions, mandate renewable or clean energy, and impose energy efficiency standards. Such proposals are expected to continue to be considered by the U.S. Congress. International climate change negotiations under the United Nations Framework Convention on Climate Change are also continuing.
On January 8, 2014, the EPA published re-proposed regulations to establish standards of performance for greenhouse gas emissions from new fossil fuel steam electric generating units. A Presidential memorandum issued on June 25, 2013 also directs the EPA to propose standards, regulations, or guidelines for addressing modified, reconstructed, and existing steam electric generating units by June 1, 2014.
Although the outcome of any federal, state, and international initiatives, including the EPA's proposed regulations and guidelines discussed above, will depend on the scope and specific requirements of the proposed and final rules and the outcome of any legal challenges and, therefore, cannot be determined at this time, additional restrictions on the Company's greenhouse gas emissions or requirements relating to renewable energy or energy efficiency at the federal or state level could result in significant additional compliance costs, including capital expenditures. These costs could affect future unit retirement and replacement decisions and could result in the retirement of coal-fired generating units. Also, additional compliance costs and costs related to unit retirements could affect results of operations, cash flows, and financial condition if such costs are not recovered through regulated rates. Further, higher costs that are recovered through regulated rates could contribute to reduced demand for electricity, which could negatively impact results of operations, cash flows, and financial condition.
The EPA's greenhouse gas reporting rule requires annual reporting of carbon dioxide equivalent emissions in metric tons for a company's operational control of facilities. Based on ownership or financial control of facilities, the Company's 2012 greenhouse gas emissions were approximately 37 million metric tons of carbon dioxide equivalent. The preliminary estimate of the Company's 2013 greenhouse gas emissions on the same basis is approximately 41 million metric tons of carbon dioxide equivalent. The level of greenhouse gas emissions from year to year will depend on the level of generation and mix of fuel sources and other factors.
FERC Matters
In 2005, the Company filed two applications with the FERC for new 50-year licenses for the Company's seven hydroelectric developments on the Coosa River (Weiss, Henry, Logan Martin, Lay, Mitchell, Jordan, and Bouldin) and for the Lewis Smith and Bankhead developments on the Warrior River. The FERC licenses for all of these nine projects expired in 2007. Since the FERC did not act on the Company's new license applications prior to the expiration of the existing licenses, the FERC is required by law to issue annual licenses to the Company, under the terms and conditions of the existing license, until action is taken on the new license applications. The FERC issued annual licenses for the Coosa River developments and the Warrior River developments in 2007. These annual licenses are automatically renewed each year without further action by the FERC to allow the Company to continue operation of the projects under the terms of the previous license while the FERC completes review of the applications for new licenses. In 2010, the FERC issued a new 30-year license to the Company for the Warrior River developments. On March 18, 2013, following the FERC's denials of their requests for rehearing, the Smith Lake Improvement and Stakeholders' Association filed an appeal to the U.S. Court of Appeals for the District of Columbia Circuit regarding the FERC's orders related to the Warrior River relicensing proceedings.
On June 20, 2013, the FERC entered an order granting the Company's application for relicensing of the Company's seven hydroelectric developments on the Coosa River for 30 years. On July 22, 2013, the Company filed a petition requesting rehearing of the FERC order granting the relicense seeking revisions to several conditions of the license. The Alabama Rivers Alliance, American Rivers, the Georgia Environmental Protection Division, and the Atlanta Regional Commission have also filed petitions for rehearing of the FERC order.
In 2011, the Company filed an application with the FERC to relicense the Martin Dam Project. The current Martin license expired on June 8, 2013. Since the FERC did not act on the Company's licenses application prior to the expiration of the existing license, the FERC issued an annual license to the Company for the Martin Dam Project on June 18, 2013.
II-130
MANAGEMENT'S DISCUSSION AND ANALYSIS (continued)
Alabama Power Company 2013 Annual Report
On August 16, 2013, the Company filed an application with the FERC to relicense the Holt Hydroelectric Project. The current Holt license will expire on August 31, 2015.
Upon or after the expiration of each license, the U.S. Government, by act of Congress, may take over the project or the FERC may relicense the project either to the original licensee or to a new licensee. The FERC may grant relicenses subject to certain requirements that could result in additional costs to the Company. The timing and final outcome of the Company's relicense applications cannot be determined at this time.
PSC Matters
Retail Rate Adjustments
In 2011, the Alabama PSC issued an order to eliminate a tax-related adjustment under the Company's rate structure effective with October 2011 billings. The elimination of this adjustment resulted in additional revenues of approximately $31 million for 2011. In accordance with the order, the Company made additional accruals to the NDR in the fourth quarter 2011 of an amount equal to such additional 2011 revenues. The NDR was impacted as a result of operations and maintenance expenses incurred in connection with the 2011 storms in Alabama. See "Natural Disaster Reserve" below for additional information. The elimination of this adjustment resulted in additional revenues of approximately $106 million for 2012.
Rate RSE
Rate stabilization and equalization plan (Rate RSE) adjustments are based on forward-looking information for the applicable upcoming calendar year. Rate adjustments for any two-year period, when averaged together, cannot exceed 4.0% and any annual adjustment is limited to 5.0%. If the Company's actual retail return is above the allowed equity return range, customer refunds will be required; however, there is no provision for additional customer billings should the actual retail return fall below the allowed equity return range. Prior to 2014, retail rates remained unchanged when the retail return on common equity (ROE) was projected to be between 13.0% and 14.5%.
During 2013, the Alabama PSC held public proceedings regarding the operation and utilization of Rate RSE. On August 13, 2013 the Alabama PSC voted to issue a report on Rate RSE that found that the Company's Rate RSE mechanism continues to be just and reasonable to customers and the Company, but recommended the Company modify Rate RSE as follows:
|
•
|
Eliminate the provision of Rate RSE establishing an allowed range of ROE.
|
|
•
|
Eliminate the provision of Rate RSE limiting the Company's capital structure to an allowed equity ratio of 45%.
|
|
•
|
Replace these two provisions with a provision that establishes rates based upon an allowed weighted cost of equity (WCE) range of 5.75% to 6.21%, with an adjusting point of 5.98%. If calculated under the previous Rate RSE provisions, the resulting WCE would range from 5.85% to 6.53%, with an adjusting point of 6.19%.
|
|
•
|
Provide eligibility for a performance-based adder of seven basis points, or 0.07%, to the WCE adjusting point if the Company (i) has an "A" credit rating equivalent with at least one of the recognized rating agencies or (ii) is in the top one-third of a designated customer value benchmark survey.
|
Substantially all other provisions of Rate RSE were unchanged.
On August 21, 2013, the Company filed its consent to these recommendations with the Alabama PSC. The changes became effective for calendar year 2014. On November 27, 2013, the Company made its Rate RSE submission to the Alabama PSC of projected data for calendar year 2014; projected earnings were within the specified WCE range and, therefore, retail rates under Rate RSE remained unchanged for 2014. In 2012 and 2013, retail rates under Rate RSE remained unchanged from 2011. Under the terms of Rate RSE, the maximum possible increase for 2015 is 5.00%.
Rate CNP
The Company's retail rates, approved by the Alabama PSC, provide for adjustments to recognize the placing of new generating facilities into retail service under rate certificated new plant (Rate CNP). The Company may also recover retail costs associated with certificated PPAs under Rate CNP PPA. There was no adjustment to Rate CNP PPA in 2012. On March 5, 2013, the Alabama PSC issued a consent order that the Company leave in effect the current Rate CNP PPA factor for billings for the period April 1, 2013 through March 31, 2014. It is anticipated that no adjustment will be made to Rate CNP PPA in 2014. As of December 31, 2013, the Company had an under recovered certificated PPA balance of $18 million, all of which is included in deferred under recovered regulatory clause revenues in the balance sheet.
In 2011, the Alabama PSC approved and certificated a PPA of approximately 200 megawatts (MWs) of energy from wind-powered generating facilities which became operational in December 2012. In September 2012, the Alabama PSC approved and
II-131
MANAGEMENT'S DISCUSSION AND ANALYSIS (continued)
Alabama Power Company 2013 Annual Report
certificated a second wind PPA of approximately 200 MWs which became operational in January 2014. The terms of the wind PPAs permit the Company to use the energy and retire the associated environmental attributes in service of its customers or to sell environmental attributes, separately or bundled with energy. The Company has elected the normal purchase normal sale (NPNS) scope exception under the derivative accounting rules for its two wind PPAs, which total approximately 400 MWs. The NPNS exception allows the PPAs to be recorded at a cost, rather than fair value, basis. The industry’s application of the NPNS exception to certain physical forward transactions in nodal markets is currently under review by the U.S. Securities and Exchange Commission (SEC) at the request of the electric utility industry. The outcome of the SEC’s review cannot now be determined. If the Company is ultimately required to record these PPAs at fair value, an offsetting regulatory asset or regulatory liability will be recorded.
Rate CNP Environmental also allows for the recovery of the Company's retail costs associated with environmental laws, regulations, or other such mandates. Rate CNP Environmental is based on forward-looking information and provides for the recovery of these costs pursuant to a factor that is calculated annually. Environmental costs to be recovered include operations and maintenance expenses, depreciation, and a return on certain invested capital. There was no adjustment to Rate CNP Environmental in 2012 or 2013. On August 13, 2013, the Alabama PSC approved the Company's petition requesting a revision to Rate CNP Environmental that allows recovery of costs related to pre-2005 environmental assets previously being recovered through Rate RSE. The revenue impact as a result of this revision is estimated to be $58 million in 2014. On November 21, 2013, the Company submitted calculations associated with its cost of complying with environmental mandates, as provided under Rate CNP Environmental. The filing reflected a projected unrecovered retail revenue requirement for environmental compliance of approximately $72 million, which is to be recovered in the billing months of January 2014 through December 2014. On December 3, 2013, the Alabama PSC issued a consent order that the Company leave in effect for 2014 the factors associated with the Company's environmental compliance costs for the year 2013. Any unrecovered amounts associated with 2014 will be reflected in the 2015 filing. As of December 31, 2013, the Company had an under recovered environmental clause balance of $7 million which is included in deferred under recovered regulatory clause revenues in the balance sheet.
Environmental Accounting Order
Based on an order from the Alabama PSC, the Company is allowed to establish a regulatory asset to record the unrecovered investment costs, including the unrecovered plant asset balance and the unrecovered costs associated with site removal and closure associated with future unit retirements caused by environmental regulations. These costs would be amortized over the affected unit's remaining useful life, as established prior to the decision regarding early retirement. See "Environmental Matters – Environmental Statutes and Regulations" herein for additional information regarding environmental regulations.
Compliance and Pension Cost Accounting Order
In November 2012, the Alabama PSC approved an accounting order to defer to a regulatory asset account certain compliance-related operations and maintenance expenditures for the years 2013 through 2017, as well as the incremental increase in operations expense related to pension cost for 2013. These deferred costs are to be amortized over a three-year period beginning in January 2015. The compliance related expenditures were related to (i) standards addressing Critical Infrastructure Protection issued by the North American Electric Reliability Corporation, (ii) cyber security requirements issued by the U.S. Nuclear Regulatory Commission (NRC), and (iii) NRC guidance addressing the readiness at nuclear facilities within the U.S. for severe events. The compliance-related expenses to be afforded regulatory asset treatment over the five-year period are currently estimated to be approximately $37 million. The amount of operations and maintenance expenses deferred to a regulatory asset in 2013 associated with compliance-related expenditures and pension cost was approximately $8 million and $12 million, respectively. Pursuant to the accounting order, the Company has the ability to accelerate the amortization of the regulatory assets with notification to the Alabama PSC. See "Other Matters" herein for information regarding NRC actions as a result of the earthquake and tsunami that struck Japan in 2011.
Retail Energy Cost Recovery
The Company has established energy cost recovery rates under Rate ECR as approved by the Alabama PSC. Rates are based on an estimate of future energy costs and the current over or under recovered balance. Revenues recognized under Rate ECR and recorded on the financial statements are adjusted for the difference in actual recoverable fuel costs and amounts billed in current regulated rates. The difference in the recoverable fuel costs and amounts billed give rise to the over or under recovered amounts recorded as regulatory assets or liabilities. The Company, along with the Alabama PSC, continually monitors the over or under recovered cost balance to determine whether an adjustment to billing rates is required. Changes in the Rate ECR factor have no significant effect on the Company's net income, but will impact operating cash flows. Currently, the Alabama PSC may approve billing rates under Rate ECR of up to 5.910 cents per KWH. On December 3, 2013, the Alabama PSC issued a consent order that the Company leave in effect the energy cost recovery rates which began in April 2011 for 2014. Therefore, the Rate ECR factor as
II-132
MANAGEMENT'S DISCUSSION AND ANALYSIS (continued)
Alabama Power Company 2013 Annual Report
of January 1, 2014 remained at 2.681 cents per KWH. Effective with billings beginning in January 2015, the Rate ECR factor will be 5.910 cents per KWH, absent a further order from the Alabama PSC.
The Company’s over recovered fuel costs at December 31, 2013 totaled $42 million as compared to under recovered fuel costs of $4 million at December 31, 2012. At December 31, 2013, $27 million is included in other regulatory liabilities, current and $15 million is included in deferred over recovered regulatory clause revenues. The under recovered fuel costs at December 31, 2012 are included in deferred under recovered regulatory clause revenues. These classifications are based on estimates, which include such factors as weather, generation availability, energy demand, and the price of energy. A change in any of these factors could have a material impact on the timing of any recovery of the under recovered fuel costs.
Natural Disaster Reserve
Based on an order from the Alabama PSC, the Company maintains a reserve for operations and maintenance expenses to cover the cost of damages from major storms to its transmission and distribution facilities. The order approves a separate monthly Rate Natural Disaster Reserve (Rate NDR) charge to customers consisting of two components. The first component is intended to establish and maintain a reserve balance for future storms and is an on-going part of customer billing. The second component of the Rate NDR charge is intended to allow recovery of any existing deferred storm-related operations and maintenance costs and any future reserve deficits over a 24-month period. The Alabama PSC order gives the Company authority to record a deficit balance in the NDR when costs of storm damage exceed any established reserve balance. Absent further Alabama PSC approval, the maximum total Rate NDR charge consisting of both components is $10 per month per non-residential customer account and $5 per month per residential customer account. The Company has the authority, based on an order from the Alabama PSC, to accrue certain additional amounts as circumstances warrant. The order allows for reliability-related expenditures to be charged against the additional accruals when the NDR balance exceeds $75 million. The Company may designate a portion of the NDR to reliability-related expenditures as a part of an annual budget process for the following year or during the current year for identified unbudgeted reliability-related expenditures that are incurred. Accruals that have not been designated can be used to offset storm charges. Additional accruals to the NDR will enhance the Company's ability to deal with the financial effects of future natural disasters, promote system reliability, and offset costs retail customers would otherwise bear.
As revenue from the Rate NDR charge is recognized, an equal amount of operations and maintenance expenses related to the NDR will also be recognized. As a result, the Rate NDR charge will not have an effect on net income but will impact operating cash flows.
In accordance with the order that was issued by the Alabama PSC in 2011 to eliminate a tax-related adjustment under the Company's rate structure that resulted in additional revenues, the Company made additional accruals to the NDR in the fourth quarter 2011 of an amount equal to the additional 2011 revenues, which were approximately $31 million.
The accumulated balances in the NDR for the years ended December 31, 2013 and December 31, 2012 were approximately $96 million and $103 million, respectively. Any accruals to the NDR are included in the balance sheets under other regulatory liabilities, deferred and are reflected as other operations and maintenance expenses in the statements of income.
Nuclear Outage Accounting Order
In accordance with a 2010 Alabama PSC order, nuclear outage operations and maintenance expenses for the two units at Plant Farley are deferred to a regulatory asset when the charges actually occur and are then amortized over the subsequent 18-month operational cycle.
Approximately $31 million of nuclear outage costs from the spring of 2012 was amortized to nuclear operations and maintenance expenses over the 18-month period ended in December 2013. During the spring of 2013, approximately $28 million of nuclear outage costs was deferred to a regulatory asset, and beginning in July 2013, these deferred costs are being amortized over an 18-month period. During the fall of 2013, approximately $32 million of nuclear outage costs associated with the second unit was deferred to a regulatory asset, and beginning in January 2014, these deferred costs are being amortized over an 18-month period. The Company will continue the pattern of deferral of nuclear outage expenses as incurred and the recognition of expenses over a subsequent 18-month period pursuant to the Alabama PSC order.
Non-Nuclear Outage Accounting Order
On August 13, 2013, the Alabama PSC approved the Company's petition requesting authorization to defer to a regulatory asset account certain operations and maintenance expenses associated with planned outages at non-nuclear generation facilities in 2014 and to amortize those expenses over a three-year period beginning in 2015. The 2014 outage expenditures to be deferred and amortized are estimated to total approximately $78 million.
II-133
MANAGEMENT'S DISCUSSION AND ANALYSIS (continued)
Alabama Power Company 2013 Annual Report
Income Tax Matters
Bonus Depreciation
On January 2, 2013, the American Taxpayer Relief Act of 2012 (ATRA) was signed into law. The ATRA retroactively extended several tax credits through 2013 and extended 50% bonus depreciation for property placed in service in 2013 (and for certain long-term production-period projects to be placed in service in 2014). The extension of 50% bonus depreciation had a positive impact on the Company's cash flows of approximately $74 million in 2013 and is expected to have a positive impact between $40 million and $45 million on the Company's 2014 cash flows.
Other Matters
In accordance with accounting standards related to employers' accounting for pensions, the Company recorded pension costs of $47 million in 2013 and $6 million in 2012 and recorded non-cash pre-tax pension income of $21 million in 2011. Postretirement benefit costs for the Company were $7 million, $10 million, and $11 million in 2013, 2012, and 2011, respectively. Such amounts are dependent on several factors including trust earnings and changes to the plans. A portion of pension and postretirement benefit costs is capitalized based on construction-related labor charges. Pension and postretirement benefit costs are a component of the regulated rates and generally do not have a long-term effect on net income. For more information regarding pension and postretirement benefits, see Note 2 to the financial statements.
The Company is involved in various other matters being litigated and regulatory matters that could affect future earnings. In addition, the Company is subject to certain claims and legal actions arising in the ordinary course of business. The Company's business activities are subject to extensive governmental regulation related to public health and the environment, such as regulation of air emissions and water discharges. Litigation over environmental issues and claims of various types, including property damage, personal injury, common law nuisance, and citizen enforcement of environmental requirements such as air quality and water standards, has increased generally throughout the U.S. In particular, personal injury, property damage, and other claims for damages alleged to have been caused by carbon dioxide and other emissions, coal combustion residuals, and alleged exposure to hazardous materials, and/or requests for injunctive relief in connection with such matters, have become more frequent.
The ultimate outcome of such pending or potential litigation against the Company cannot be predicted at this time; however, for current proceedings not specifically reported herein or in Note 3 to the financial statements, management does not anticipate that the ultimate liabilities, if any, arising from such current proceedings would have a material effect on the Company's financial statements. See Note 3 to the financial statements for a discussion of various other contingencies, regulatory matters, and other matters being litigated which may affect future earnings potential.
In 2011, a major earthquake and tsunami struck Japan and caused substantial damage to the nuclear generating units at the Fukushima Daiichi generating plant. The events in Japan have created uncertainties that may affect future costs for operating nuclear plants. Specifically, the NRC is performing additional operational and safety reviews of nuclear facilities in the U.S., which could potentially impact future operations and capital requirements. In addition, the NRC has issued a series of orders requiring safety-related changes to U.S. nuclear facilities and expects to issue orders in the future requiring additional upgrades. The final form and the resulting impact of any changes to safety requirements for nuclear reactors will be dependent on further review and action by the NRC. See "PSC Matters – Compliance and Pension Cost Accounting Order" herein and Note 3 to the financial statements under "Retail Regulatory Matters – Compliance and Pension Cost Accounting Order" for additional information on the Company's PSC approved accounting order, which allows the deferral of certain compliance-related operations and maintenance expenditures related to compliance with the NRC guidance.
Additionally, there are certain risks associated with the operation of nuclear generating units, including potential impacts that could result from a major incident at a nuclear facility anywhere in the world. The ultimate outcome of these events cannot be determined at this time.
On November 19, 2013, the U.S. District Court for the District of Columbia ordered the DOE to cease collecting spent fuel depositary fees from nuclear power plant operators until such time as the DOE either complies with the Nuclear Waste Policy Act of 1982 or until the U.S. Congress enacts an alternative waste management plan. In accordance with the court’s order, the DOE has submitted a proposal to the U.S. Congress to change the fee to zero. That proposal is pending before the U.S. Congress and will become effective after 90 days of legislative session from the time of submittal unless the U.S. Congress enacts legislation that impacts the proposed fee change. The DOE’s petition for rehearing of the November 2013 decision is currently pending and the Company is continuing to pay the fee of approximately $13 million annually. The ultimate outcome of this matter cannot be determined at this time.
II-134
MANAGEMENT'S DISCUSSION AND ANALYSIS (continued)
Alabama Power Company 2013 Annual Report
ACCOUNTING POLICIES
Application of Critical Accounting Policies and Estimates
The Company prepares its financial statements in accordance with generally accepted accounting principles (GAAP). Significant accounting policies are described in Note 1 to the financial statements. In the application of these policies, certain estimates are made that may have a material impact on the Company's results of operations and related disclosures. Different assumptions and measurements could produce estimates that are significantly different from those recorded in the financial statements. Senior management has reviewed and discussed the following critical accounting policies and estimates with the Audit Committee of Southern Company's Board of Directors.
Electric Utility Regulation
The Company is subject to retail regulation by the Alabama PSC and wholesale regulation by the FERC. As a result, the Company applies accounting standards which require the financial statements to reflect the effects of rate regulation. Through the ratemaking process, the regulators may require the inclusion of costs or revenues in periods different than when they would be recognized by a non-regulated company. This treatment may result in the deferral of expenses and the recording of related regulatory assets based on anticipated future recovery through rates or the deferral of gains or creation of liabilities and the recording of related regulatory liabilities. The application of the accounting standards has a further effect on the Company's financial statements as a result of the estimates of allowable costs used in the ratemaking process. These estimates may differ from those actually incurred by the Company; therefore, the accounting estimates inherent in specific costs such as depreciation, asset retirement obligations, and pension and postretirement benefits have less of a direct impact on the Company's results of operations and financial condition than they would on a non-regulated company.
As reflected in Note 1 to the financial statements, significant regulatory assets and liabilities have been recorded. Management reviews the ultimate recoverability of these regulatory assets and any requirement to refund these regulatory liabilities based on applicable regulatory guidelines and GAAP. However, adverse legislative, judicial, or regulatory actions could materially impact the amounts of such regulatory assets and liabilities and could adversely impact the Company's financial statements.
Contingent Obligations
The Company is subject to a number of federal and state laws and regulations, as well as other factors and conditions that subject it to environmental, litigation, and other risks. See FUTURE EARNINGS POTENTIAL herein and Note 3 to the financial statements for more information regarding certain of these contingencies. The Company periodically evaluates its exposure to such risks and, in accordance with GAAP, records reserves for those matters where a non-tax-related loss is considered probable and reasonably estimable. The adequacy of reserves can be significantly affected by external events or conditions that can be unpredictable; thus, the ultimate outcome of such matters could materially affect the Company's financial statements.
Pension and Other Postretirement Benefits
The Company's calculation of pension and other postretirement benefits expense is dependent on a number of assumptions. These assumptions include discount rates, healthcare cost trend rates, expected long-term return on plan assets, mortality rates, expected salary and wage increases, and other factors. Components of pension and other postretirement benefits expense include interest and service cost on the pension and other postretirement benefit plans, expected return on plan assets, and amortization of certain unrecognized costs and obligations. Actual results that differ from the assumptions utilized are accumulated and amortized over future periods and, therefore, generally affect recognized expense and the recorded obligation in future periods. While the Company believes that the assumptions used are appropriate, differences in actual experience or significant changes in assumptions would affect its pension and other postretirement benefits costs and obligations.
Key elements in determining the Company's pension and other postretirement benefit expense in accordance with GAAP are the expected long-term return on plan assets and the discount rate used to measure the benefit plan obligations and the periodic benefit plan expense for future periods. The expected long-term return on postretirement benefit plan assets is based on the Company's investment strategy, historical experience, and expectations for long-term rates of return that consider external actuarial advice. The Company determines the long-term return on plan assets by applying the long-term rate of expected returns on various asset classes to the Company's target asset allocation. The Company discounts the future cash flows related to its postretirement benefit plans using a single-point discount rate developed from the weighted average of market-observed yields for high quality fixed income securities with maturities that correspond to expected benefit payments.
A 25 basis point change in any significant assumption (discount rate, salaries, or long-term return on plan assets) would result in a $6 million or less change in total annual benefit expense and an $82 million or less change in projected obligations.
II-135
MANAGEMENT'S DISCUSSION AND ANALYSIS (continued)
Alabama Power Company 2013 Annual Report
FINANCIAL CONDITION AND LIQUIDITY
Overview
The Company's financial condition remained stable at December 31, 2013. The Company's cash requirements primarily consist of funding ongoing operations, common stock dividends, capital expenditures, and debt maturities. Capital expenditures and other investing activities include investments to comply with environmental regulations and for restoration following major storms. Operating cash flows provide a substantial portion of the Company's cash needs. For the three-year period from 2014 through 2016, the Company's projected common stock dividends, capital expenditures, and debt maturities are expected to exceed operating cash flows. Projected capital expenditures in that period include investments to maintain existing generation facilities, to add environmental equipment for existing generating units, and to expand and improve transmission and distribution facilities. The Company plans to finance future cash needs in excess of its operating cash flows primarily through debt and equity issuances. The Company intends to continue to monitor its access to short-term and long-term capital markets as well as its bank credit arrangements to meet future capital and liquidity needs. See "Sources of Capital," "Financing Activities," and "Capital Requirements and Contractual Obligations" herein for additional information.
The Company's investments in the qualified pension plan and the nuclear decommissioning trust funds increased in value as of December 31, 2013 as compared to December 31, 2012. No contributions to the qualified pension plan were made for the year ended December 31, 2013. The Company's funding obligations for the nuclear decommissioning trust fund are based on the site study, and the next study is expected to be conducted in 2018.
Net cash provided from operating activities totaled $1.9 billion for 2013, an increase of $538 million as compared to 2012. The increase in cash provided from operating activities was primarily due to changes in timing of fossil fuel stock purchases and payment of accounts payable, and collection of fuel cost recovery revenues. Net cash provided from operating activities totaled $1.4 billion for 2012, a decrease of $672 million as compared to 2011. The decrease in cash provided from operating activities was primarily due to an increase in fossil fuel stock, a decrease in deferred income taxes, and the timing of income tax payments and refunds associated with bonus depreciation.
Net cash used for investing activities totaled $1.1 billion for 2013, $0.9 billion for 2012, and $1.0 billion for 2011. In 2013, these additions were primarily due to gross property additions related to steam generation, distribution, and transmission equipment. In 2012, these additions were primarily due to gross property additions related to nuclear fuel and transmission, distribution, and steam generating equipment. In the prior years, gross property additions were primarily related to environmental mandates, construction of transmission and distribution facilities, replacement of steam generation equipment, and purchases of nuclear fuel.
Net cash used for financing activities totaled $614 million in 2013 primarily due to the payment of common stock dividends, and the issuance and a maturity of senior notes. Net cash used for financing activities totaled $649 million in 2012 primarily due to issuances, redemptions, and a maturity of senior notes, and payment of common stock dividends to Southern Company. Net cash used for financing activities totaled $869 million in 2011 primarily due to issuances, redemptions, and a maturity of debt securities and payment of higher common stock dividends. Fluctuations in cash flow from financing activities vary from year to year based on capital needs and the maturity or redemption of securities.
Significant balance sheet changes for 2013 include an increase of $620 million in property, plant, and equipment primarily due to additions to steam, distribution, and transmission facilities. Other significant changes include an increase of $276 million in prepaid pension costs and a decrease of $391 million in other regulatory assets, deferred, both of which are primarily attributable to a positive return on assets and an increase in the discount rate associated with retirement benefit plans.
The Company's ratio of common equity to total capitalization, including short-term debt, was 44.3% in 2013 and 44.0% in 2012. See Note 6 to the financial statements for additional information.
Sources of Capital
The Company plans to obtain the funds required for construction and other purposes from sources similar to those used in the past. The Company has primarily utilized funds from operating cash flows, short-term debt, security issuances, and equity contributions from Southern Company. However, the amount, type, and timing of any future financings, if needed, will depend upon prevailing market conditions, regulatory approval, and other factors.
Security issuances are subject to regulatory approval by the Alabama PSC. Additionally, with respect to the public offering of securities, the Company files registration statements with the SEC under the Securities Act of 1933, as amended. The amounts of securities authorized by the Alabama PSC are continuously monitored and appropriate filings are made to ensure flexibility in the capital markets.
II-136
MANAGEMENT'S DISCUSSION AND ANALYSIS (continued)
Alabama Power Company 2013 Annual Report
The Company obtains financing separately without credit support from any affiliate. See Note 6 to the financial statements under "Bank Credit Arrangements" for additional information. The Southern Company system does not maintain a centralized cash or money pool. Therefore, funds of the Company are not commingled with funds of any other company in the Southern Company system.
The Company's current liabilities sometimes exceed current assets because of the Company's debt due within one year and the periodic use of short-term debt as a funding source primarily to meet scheduled maturities of long-term debt, as well as cash needs, which can fluctuate significantly due to the seasonality of the business.
At December 31, 2013, the Company had approximately $295 million of cash and cash equivalents. Committed credit arrangements with banks at December 31, 2013 were as follows:
|
Expires
(a)
|
Executable
Term-Loans
|
Due Within One Year
|
||||||||||||||||||||||||||||||||
|
2014
|
2015
|
2018
|
Total
|
Unused
|
One
Year
|
Two Years
|
Term Out
|
Not Term Out
|
||||||||||||||||||||||||||
|
(in millions)
|
|
|||||||||||||||||||||||||||||||||
|
$
|
238
|
|
$
|
35
|
|
$
|
1,030
|
|
$
|
1,303
|
|
$
|
1,303
|
|
$
|
53
|
|
$
|
—
|
|
$
|
53
|
|
$
|
185
|
|
||||||||
|
(a)
|
No credit arrangements expire in 2016 or 2017.
|
See Note 6 to the financial statements under "Bank Credit Arrangements" for additional information.
Most of these arrangements contain covenants that limit debt levels and contain cross default provisions to other indebtedness (including guarantee obligations) of the Company. Such cross default provisions to other indebtedness would trigger an event of default if the Company defaulted on indebtedness or guarantee obligations over a specified threshold. The Company is currently in compliance with all such covenants. None of the arrangements contain material adverse change clauses at the time of borrowings. The Company expects to renew its credit arrangements as needed, prior to expiration.
In addition, the Company has substantial cash flow from operating activities and access to the capital markets, including a commercial paper program, to meet liquidity needs. A portion of the unused credit with banks is allocated to provide liquidity support to the Company's variable rate pollution control revenue bonds and commercial paper borrowings. As of December 31, 2013, the Company had $793 million of outstanding variable rate pollution control revenue bonds requiring liquidity support. In addition, at December 31, 2013, the Company had $200 million of fixed rate pollution control revenue bonds that will be required to be remarketed within the next 12 months.
The Company may meet short-term cash needs through its commercial paper program. The Company may also meet short-term cash needs through a Southern Company subsidiary organized to issue and sell commercial paper at the request and for the benefit of the Company and the other traditional operating companies. Proceeds from such issuances for the benefit of the Company are loaned directly to the Company. The obligations of each company under these arrangements are several and there is no cross-affiliate credit support.
Details of short-term borrowings were as follows:
|
Short-term Debt at the End of the Period
|
Short-term Debt During the Period
(a)
|
||||||||
|
Amount
Outstanding
|
Weighted
Average
Interest
Rate
|
Average
Outstanding
|
Weighted
Average
Interest
Rate
|
Maximum
Amount
Outstanding
|
|||||
|
(in millions)
|
(in millions)
|
(in millions)
|
|||||||
|
December 31, 2013:
|
|||||||||
|
Commercial paper
|
$—
|
—%
|
$11
|
0.2%
|
$90
|
||||
|
December 31, 2012:
|
|||||||||
|
Commercial paper
|
$—
|
—%
|
$6
|
0.2%
|
$57
|
||||
|
December 31, 2011:
|
|||||||||
|
Commercial paper
|
$—
|
—%
|
$20
|
0.2%
|
$255
|
||||
|
(a)
|
Average and maximum amounts are based upon daily balances during the twelve-month periods ended December 31, 2013, 2012, and 2011.
|
Management believes that the need for working capital can be adequately met by utilizing commercial paper programs, lines of credit, and cash.
II-137
MANAGEMENT'S DISCUSSION AND ANALYSIS (continued)
Alabama Power Company 2013 Annual Report
Financing Activities
In November 2013, the Company's $250 million aggregate principal amount of its Series 2008B 5.80% Senior Notes due November 15, 2013 matured.
In December 2013, the Company issued $300 million aggregate principal amount of its Series 2013A 3.55% Senior Notes due December 1, 2023. The proceeds were used for general corporate purposes, including the Company's continuous construction program.
In addition to any financings that may be necessary to meet capital requirements and contractual obligations, the Company plans to continue, when economically feasible, a program to retire higher-cost securities and replace these obligations with lower-cost capital if market conditions permit.
Credit Rating Risk
The Company does not have any credit arrangements that would require material changes in payment schedules or terminations as a result of a credit rating downgrade. There are certain contracts that could require collateral, but not accelerated payment, in the event of a credit rating change to below BBB- and/or Baa3. These contracts are primarily for physical electricity purchases, fuel purchases, fuel transportation and storage, and energy price risk management. At December 31, 2013, the maximum potential collateral requirements under these contracts at a rating below BBB- and/or Baa3 were approximately $268 million. Included in these amounts are certain agreements that could require collateral in the event that one or more Southern Company system power pool participants has a credit rating change to below investment grade. Generally, collateral may be provided by a Southern Company guaranty, letter of credit, or cash. Additionally, any credit rating downgrade could impact the Company's ability to access capital markets, particularly the short-term debt market and the variable rate pollution control revenue bond market.
On May 24, 2013, Standard and Poor's Rating Services, a division of the McGraw Hill Companies Inc. (S&P), revised the ratings outlook for Southern Company and the traditional operating companies, including the Company, from stable to negative.
On January 31, 2014, Moody's Investors Service, Inc. (Moody's) upgraded the senior unsecured debt and preferred stock ratings of the Company to A1 from A2 and A3 from Baa1, respectively.
Moody's maintained the stable ratings outlook for the Company.
Market Price Risk
Due to cost-based rate regulation and other various cost recovery mechanisms, the Company continues to have limited exposure to market volatility in interest rates, commodity fuel prices, and prices of electricity. To manage the volatility attributable to these exposures, the Company nets the exposures, where possible, to take advantage of natural offsets and enters into various derivative transactions for the remaining exposures pursuant to the Company's policies in areas such as counterparty exposure and risk management practices. The Company's policy is that derivatives are to be used primarily for hedging purposes and mandates strict adherence to all applicable risk management policies. Derivative positions are monitored using techniques including, but not limited to, market valuation, value at risk, stress testing, and sensitivity analysis.
To mitigate future exposure to changes in interest rates, the Company enters into derivatives that have been designated as hedges. The weighted average interest rate on $984 million of long-term variable interest rate exposure that has not been hedged at January 1, 2014 was 0.72%. If the Company sustained a 100 basis point change in interest rates for all unhedged variable rate long-term debt, the change would affect annualized interest expense by approximately $10 million at January 1, 2014. See Note 1 to the financial statements under "Financial Instruments" and Note 11 to the financial statements for additional information.
To mitigate residual risks relative to movements in electricity prices, the Company enters into physical fixed-price contracts for the purchase and sale of electricity through the wholesale electricity market and, to a lesser extent, financial hedge contracts for natural gas purchases. The Company continues to manage a retail fuel-hedging program implemented per the guidelines of the Alabama PSC. The Company had no material change in market risk exposure for the year ended December 31, 2013 when compared to the December 31, 2012 reporting period.
In addition, Rate ECR allows the recovery of specific costs associated with the sales of natural gas that become necessary due to operating considerations at the Company's electric generating facilities. Rate ECR also allows recovery of the cost of financial instruments used for hedging market price risk up to 75% of the budgeted annual amount of natural gas purchases. The Company may not engage in natural gas hedging activities that extend beyond a rolling 42-month window. Also, the premiums paid for natural gas financial options may not exceed 5% of the Company's natural gas budget for that year.
II-138
MANAGEMENT'S DISCUSSION AND ANALYSIS (continued)
Alabama Power Company 2013 Annual Report
The changes in fair value of energy-related derivative contracts are substantially attributable to both the volume and the price of natural gas. For the years ended December 31, the changes in fair value of energy-related derivative contracts, the majority of which are composed of regulatory hedges, were as follows:
|
2013
Changes
|
2012
Changes
|
||||||
|
Fair Value
|
|||||||
|
(in millions)
|
|||||||
|
Contracts outstanding at the beginning of the period, assets (liabilities), net
|
$
|
(13
|
)
|
$
|
(48
|
)
|
|
|
Contracts realized or settled
|
10
|
|
46
|
|
|||
|
Current period changes
(a)
|
2
|
|
(11
|
)
|
|||
|
Contracts outstanding at the end of the period, assets (liabilities), net
|
$
|
(1
|
)
|
$
|
(13
|
)
|
|
|
(a)
|
Current period changes also include the changes in fair value of new contracts entered into during the period, if any.
|
The net hedge volumes of energy-related derivative contracts, for the years ended December 31 were as follows:
|
2013
|
2012
|
|||
|
mmBtu* Volume
|
||||
|
(in millions)
|
||||
|
Commodity – Natural gas swaps
|
64
|
|
45
|
|
|
Commodity – Natural gas options
|
5
|
|
12
|
|
|
Total hedge volume
|
69
|
|
57
|
|
* million British thermal units (mmBtu)
The weighted average swap contract cost above market prices was approximately $0.02 per mmBtu as of December 31, 2013 and $0.30 per mmBtu as of December 31, 2012. The change in option fair value is primarily attributable to the volatility of the market and the underlying change in the natural gas price. The majority of the natural gas hedge gains and losses are recovered through the Company's retail energy cost recovery clause.
At December 31, 2013 and 2012, substantially all of the Company's energy-related derivative contracts were designated as regulatory hedges and are related to the Company's fuel-hedging program. Therefore, gains and losses are initially recorded as regulatory liabilities and assets, respectively, and then are included in fuel expense as they are recovered through the energy cost recovery clause. Certain other gains and losses on energy-related derivatives, designated as cash flow hedges, are initially deferred in other comprehensive income before being recognized in income in the same period as the hedged transaction. Gains and losses on energy-related derivative contracts that are not designated or fail to qualify as hedges are recognized in the statements of income as incurred and were not material for any year presented.
The Company uses over-the-counter contracts that are not exchange traded but are fair valued using prices which are market observable, and thus fall into Level 2. See Note 10 to the financial statements for further discussion of fair value measurements. The maturities of the energy-related derivative contracts, which are all Level 2 of the fair value hierarchy, at December 31, 2013 were as follows:
|
Fair Value Measurements
|
|||||||||||
|
December 31, 2013
|
|||||||||||
|
Total
|
Maturity
|
||||||||||
|
Fair Value
|
Year 1
|
Years 2&3
|
|||||||||
|
(in millions)
|
|||||||||||
|
Level 1
|
$
|
—
|
|
$
|
—
|
|
$
|
—
|
|
||
|
Level 2
|
(1
|
)
|
2
|
|
(3
|
)
|
|||||
|
Level 3
|
—
|
|
—
|
|
—
|
|
|||||
|
Fair value of contracts outstanding at end of period
|
$
|
(1
|
)
|
$
|
2
|
|
$
|
(3
|
)
|
||
The Company is exposed to market price risk in the event of nonperformance by counterparties to energy-related and interest rate derivative contracts. The Company only enters into agreements and material transactions with counterparties that have investment
II-139
MANAGEMENT'S DISCUSSION AND ANALYSIS (continued)
Alabama Power Company 2013 Annual Report
grade credit ratings by Moody's and S&P, or with counterparties who have posted collateral to cover potential credit exposure. Therefore, the Company does not anticipate market risk exposure from nonperformance by the counterparties. For additional information, see Note 1 to the financial statements under "Financial Instruments" and Note 11 to the financial statements.
Capital Requirements and Contractual Obligations
The Company's construction program consists of a base level capital investment and capital expenditures to comply with existing environmental statutes and regulations. Over the next three years, the Company estimates spending, as part of its base level capital investment, $575 million on Plant Farley (including nuclear fuel), $930 million on distribution facilities, and $654 million on transmission additions. These base level capital investment amounts also include capital expenditures related to contractual purchase commitments for nuclear fuel and capital expenditures covered under long-term service agreements. Proposed water and coal combustion residuals rules are not included in the construction program base level capital investment. The Company's base level construction program investments including investments to comply with existing environmental statutes and regulations and the estimated incremental compliance costs related to the proposed water and coal combustion residuals rules over the 2014 through 2016 three-year period, based on the assumption that coal combustion residuals will continue to be regulated as non-hazardous solid waste under the proposed rule, are estimated as follows:
|
2014
|
2015
|
2016
|
|||||||||
|
Construction program:
|
(in millions)
|
||||||||||
|
Base capital
|
$
|
1,229
|
|
$
|
1,210
|
|
$
|
911
|
|
||
|
Existing environmental statutes and regulations
|
502
|
|
443
|
|
166
|
|
|||||
|
Total construction program base level capital investment
|
$
|
1,731
|
|
$
|
1,653
|
|
$
|
1,077
|
|
||
|
Potential incremental environmental compliance investments:
|
|||||||||||
|
Proposed water and coal combustion residuals rules
|
$
|
3
|
|
$
|
9
|
|
$
|
143
|
|
||
See FUTURE EARNINGS POTENTIAL – "Environmental Matters – Environmental Statutes and Regulations" for additional information.
The construction program is subject to periodic review and revision, and actual construction costs may vary from these estimates because of numerous factors. These factors include: changes in business conditions; changes in load projections; changes in environmental statutes and regulations; the outcome of any legal challenges to the environmental rules; changes in generating plants, including unit retirements and replacements and adding or changing fuel sources at existing units, to meet regulatory requirements; changes in the expected environmental compliance program; changes in FERC rules and regulations; Alabama PSC approvals; changes in legislation; the cost and efficiency of construction labor, equipment, and materials; project scope and design changes; storm impacts; and the cost of capital. In addition, there can be no assurance that costs related to capital expenditures will be fully recovered.
In addition to the funds required for the Company's construction program, approximately $654 million will be required by the end of 2016 for maturities of long-term debt. The Company plans to continue, when economically feasible, to retire higher cost securities and replace these obligations with lower cost capital if market conditions permit.
As a result of NRC requirements, the Company has external trust funds for nuclear decommissioning costs; however, the Company currently has no additional funding requirements. For additional information, see Note 1 to the financial statements under "Nuclear Decommissioning." The Company has also established an external trust fund for postretirement benefits as ordered by the Alabama PSC. The cumulative effect of funding these items over an extended period will diminish internally funded capital for other purposes and may require the Company to seek capital from other sources. See Note 2 to the financial statements for additional information.
Other funding requirements related to obligations associated with scheduled maturities of long-term debt, as well as the related interest, derivative obligations, preferred and preference stock dividends, leases, and other purchase commitments are detailed in the contractual obligations table that follows. See Notes 1, 2, 6, 7, and 11 to the financial statements for additional information.
II-140
MANAGEMENT'S DISCUSSION AND ANALYSIS (continued)
Alabama Power Company 2013 Annual Report
Contractual Obligations
|
2014
|
2015-
2016
|
2017-
2018
|
After
2018
|
Total
|
|||||||||||||||
|
(in millions)
|
|||||||||||||||||||
|
Long-term debt
(a)
—
|
|||||||||||||||||||
|
Principal
|
$
|
—
|
|
$
|
654
|
|
$
|
561
|
|
$
|
5,018
|
|
$
|
6,233
|
|
||||
|
Interest
|
243
|
|
484
|
|
431
|
|
3,225
|
|
4,383
|
|
|||||||||
|
Preferred and preference stock dividends
(b)
|
39
|
|
79
|
|
79
|
|
—
|
|
197
|
|
|||||||||
|
Financial derivative obligations
(c)
|
3
|
|
5
|
|
—
|
|
—
|
|
8
|
|
|||||||||
|
Operating leases
(d)
|
15
|
|
24
|
|
10
|
|
15
|
|
64
|
|
|||||||||
|
Capital Lease
|
—
|
|
1
|
|
1
|
|
3
|
|
5
|
|
|||||||||
|
Purchase commitments —
|
|||||||||||||||||||
|
Capital
(e)
|
1,590
|
|
2,563
|
|
—
|
|
—
|
|
4,153
|
|
|||||||||
|
Fuel
(f)
|
1,351
|
|
1,787
|
|
854
|
|
804
|
|
4,796
|
|
|||||||||
|
Purchased power
(g)
|
58
|
|
121
|
|
128
|
|
570
|
|
877
|
|
|||||||||
|
Other
(h)
|
45
|
|
63
|
|
45
|
|
14
|
|
167
|
|
|||||||||
|
Pension and other postretirement benefit plans
(i)
|
17
|
|
33
|
|
—
|
|
—
|
|
50
|
|
|||||||||
|
Total
|
$
|
3,361
|
|
$
|
5,814
|
|
$
|
2,109
|
|
$
|
9,649
|
|
$
|
20,933
|
|
||||
|
(a)
|
All amounts are reflected based on final maturity dates. The Company plans to continue to retire higher-cost securities and replace these obligations with lower-cost capital if market conditions permit. Variable rate interest obligations are estimated based on rates as of January 1, 2014, as reflected in the statements of capitalization. Fixed rates include, where applicable, the effects of interest rate derivatives employed to manage interest rate risk.
|
|
(b)
|
Preferred and preference stock do not mature; therefore, amounts are provided for the next five years only.
|
|
(c)
|
For additional information, see Notes 1 and 11 to the financial statements.
|
|
(d)
|
Excludes PPAs that are accounted for as leases and are included in purchased power.
|
|
(e)
|
The Company provides estimated capital expenditures for a three-year period, including capital expenditures and compliance costs associated with existing environmental regulations. Such amounts exclude the Company's estimates of potential incremental environmental compliance investment to comply with proposed water and coal combustion residuals rules, which are approximately $3 million, $9 million, and $143 million for 2014, 2015, and 2016, respectively. These amounts also exclude contractual purchase commitments for nuclear fuel and capital expenditures covered under long-term service agreements, which are reflected separately. At December 31, 2013, significant purchase commitments were outstanding in connection with the construction program. See FUTURE EARNINGS POTENTIAL – "Environmental Matters – Environmental Statutes and Regulations" for additional information.
|
|
(f)
|
Includes commitments to purchase coal, nuclear fuel, and natural gas, as well as the related transportation and storage. In most cases, these contracts contain provisions for price escalation, minimum purchase levels, and other financial commitments. Natural gas purchase commitments are based on various indices at the time of delivery. Amounts reflected for natural gas purchase commitments have been estimated based on the New York Mercantile Exchange future prices at December 31, 2013.
|
|
(g)
|
Estimated minimum long-term obligations for various long-term commitments for the purchase of capacity and energy. Amounts are related to the Company's certificated PPAs which include MWs purchased from gas-fired and wind-powered facilities.
|
|
(h)
|
Includes long-term service agreements and contracts for the procurement of limestone. Long-term service agreements include price escalation based on inflation indices.
|
|
(i)
|
The Company forecasts contributions to the pension and other postretirement benefit plans over a three-year period. The Company anticipates no mandatory contributions to the qualified pension plan during the next three years. Amounts presented represent estimated benefit payments for the nonqualified pension plans, estimated non-trust benefit payments for the other postretirement benefit plans, and estimated contributions to the other postretirement benefit plan trusts, all of which will be made from the Company's corporate assets. See Note 2 to the financial statements for additional information related to the pension and other postretirement benefit plans, including estimated benefit payments. Certain benefit payments will be made through the related benefit plans. Other benefit payments will be made from the Company's corporate assets.
|
II-141
MANAGEMENT'S DISCUSSION AND ANALYSIS (continued)
Alabama Power Company 2013 Annual Report
Cautionary Statement Regarding Forward Looking Statements
The Company's 2013 Annual Report contains forward-looking statements. Forward-looking statements include, among other things, statements concerning retail sales, retail rates, customer growth, economic recovery, fuel and environmental cost recovery and other rate actions, current and proposed environmental regulations and related estimated expenditures, access to sources of capital, projections for the qualified pension plan, postretirement benefit plan, and nuclear decommissioning trust fund contributions, financing activities, filings with state and federal regulatory authorities, impact of the ATRA, estimated sales and purchases under new power sale and purchase agreements, and estimated construction and other expenditures. In some cases, forward-looking statements can be identified by terminology such as "may," "will," "could," "should," "expects," "plans," "anticipates," "believes," "estimates," "projects," "predicts," "potential," or "continue" or the negative of these terms or other similar terminology. There are various factors that could cause actual results to differ materially from those suggested by the forward-looking statements; accordingly, there can be no assurance that such indicated results will be realized. These factors include:
|
•
|
the impact of recent and future federal and state regulatory changes, including legislative and regulatory initiatives regarding deregulation and restructuring of the electric utility industry, environmental laws including regulation of water, coal combustion residuals, and emissions of sulfur, nitrogen, carbon, soot, particulate matter, hazardous air pollutants, including mercury, and other substances, and also changes in tax and other laws and regulations to which the Company is subject, as well as changes in application of existing laws and regulations;
|
|
•
|
current and future litigation, regulatory investigations, proceedings, or inquiries, including FERC matters, pending EPA civil action against the Company, and Internal Revenue Service and state tax audits;
|
|
•
|
the effects, extent, and timing of the entry of additional competition in the markets in which the Company operates;
|
|
•
|
variations in demand for electricity, including those relating to weather, the general economy and recovery from the recent recession, population and business growth (and declines), the effects of energy conservation measures, including from the development and deployment of alternative energy sources such as self-generation and distributed generation technologies, and any potential economic impacts resulting from federal fiscal decisions;
|
|
•
|
available sources and costs of fuels;
|
|
•
|
effects of inflation;
|
|
•
|
ability to control costs and avoid cost overruns during the development and construction of facilities, to construct facilities in accordance with the requirements of permits and licenses, and to satisfy any operational and environmental performance standards;
|
|
•
|
investment performance of the Company's employee and retiree benefit plans and nuclear decommissioning trust funds;
|
|
•
|
advances in technology;
|
|
•
|
state and federal rate regulations and the impact of pending and future rate cases and negotiations, including rate actions relating to fuel and other cost recovery mechanisms;
|
|
•
|
the inherent risks involved in operating nuclear generating facilities, including environmental, health, regulatory, natural disaster, terrorism, or financial risks;
|
|
•
|
internal restructuring or other restructuring options that may be pursued;
|
|
•
|
potential business strategies, including acquisitions or dispositions of assets or businesses, which cannot be assured to be completed or beneficial to the Company;
|
|
•
|
the ability of counterparties of the Company to make payments as and when due and to perform as required;
|
|
•
|
the ability to obtain new short- and long-term contracts with wholesale customers;
|
|
•
|
the direct or indirect effect on the Company's business resulting from terrorist incidents and the threat of terrorist incidents, including cyber intrusion;
|
|
•
|
interest rate fluctuations and financial market conditions and the results of financing efforts, including the Company's credit ratings;
|
|
•
|
the impacts of any potential U.S. credit rating downgrade or other sovereign financial issues, including impacts on interest rates, access to capital markets, impacts on currency exchange rates, counterparty performance, and the economy in general;
|
|
•
|
the ability of the Company to obtain additional generating capacity at competitive prices;
|
|
•
|
catastrophic events such as fires, earthquakes, explosions, floods, tornadoes, hurricanes, droughts, pandemic health events such as influenzas, or other similar occurrences;
|
II-142
MANAGEMENT'S DISCUSSION AND ANALYSIS (continued)
Alabama Power Company 2013 Annual Report
|
•
|
the direct or indirect effects on the Company's business resulting from incidents affecting the U.S. electric grid or operation of generating resources;
|
|
•
|
the effect of accounting pronouncements issued periodically by standard setting bodies; and
|
|
•
|
other factors discussed elsewhere herein and in other reports (including the Form 10-K) filed by the Company from time to time with the SEC.
|
The Company expressly disclaims any obligation to update any forward-looking statements.
II-143
STATEMENTS OF INCOME
For the Years Ended
December 31, 2013
,
2012
, and
2011
Alabama Power Company
2013
Annual Report
|
|
2013
|
|
2012
|
|
2011
|
|
|||||
|
|
(in millions)
|
||||||||||
|
Operating Revenues:
|
|||||||||||
|
Retail revenues
|
$
|
4,952
|
|
$
|
4,933
|
|
$
|
4,972
|
|
||
|
Wholesale revenues, non-affiliates
|
248
|
|
277
|
|
287
|
|
|||||
|
Wholesale revenues, affiliates
|
212
|
|
111
|
|
244
|
|
|||||
|
Other revenues
|
206
|
|
199
|
|
199
|
|
|||||
|
Total operating revenues
|
5,618
|
|
5,520
|
|
5,702
|
|
|||||
|
Operating Expenses:
|
|||||||||||
|
Fuel
|
1,631
|
|
1,503
|
|
1,679
|
|
|||||
|
Purchased power, non-affiliates
|
100
|
|
73
|
|
73
|
|
|||||
|
Purchased power, affiliates
|
129
|
|
182
|
|
198
|
|
|||||
|
Other operations and maintenance
|
1,289
|
|
1,287
|
|
1,262
|
|
|||||
|
Depreciation and amortization
|
645
|
|
639
|
|
637
|
|
|||||
|
Taxes other than income taxes
|
348
|
|
340
|
|
339
|
|
|||||
|
Total operating expenses
|
4,142
|
|
4,024
|
|
4,188
|
|
|||||
|
Operating Income
|
1,476
|
|
1,496
|
|
1,514
|
|
|||||
|
Other Income and (Expense):
|
|||||||||||
|
Allowance for equity funds used during construction
|
32
|
|
19
|
|
22
|
|
|||||
|
Interest income
|
16
|
|
16
|
|
18
|
|
|||||
|
Interest expense, net of amounts capitalized
|
(259
|
)
|
(287
|
)
|
(299
|
)
|
|||||
|
Other income (expense), net
|
(36
|
)
|
(24
|
)
|
(30
|
)
|
|||||
|
Total other income and (expense)
|
(247
|
)
|
(276
|
)
|
(289
|
)
|
|||||
|
Earnings Before Income Taxes
|
1,229
|
|
1,220
|
|
1,225
|
|
|||||
|
Income taxes
|
478
|
|
477
|
|
478
|
|
|||||
|
Net Income
|
751
|
|
743
|
|
747
|
|
|||||
|
Dividends on Preferred and Preference Stock
|
39
|
|
39
|
|
39
|
|
|||||
|
Net Income After Dividends on Preferred and Preference Stock
|
$
|
712
|
|
$
|
704
|
|
$
|
708
|
|
||
The accompanying notes are an integral part of these financial statements.
II-144
STATEMENTS OF COMPREHENSIVE INCOME
For the Years Ended
December 31, 2013
,
2012
, and
2011
Alabama Power Company
2013
Annual Report
|
|
2013
|
|
2012
|
|
2011
|
|
|||||
|
|
(in millions)
|
||||||||||
|
Net Income
|
$
|
751
|
|
$
|
743
|
|
$
|
747
|
|
||
|
Other comprehensive income (loss):
|
|||||||||||
|
Qualifying hedges:
|
|||||||||||
|
Changes in fair value, net of tax of $-, $(7), and $(5), respectively
|
—
|
|
(11
|
)
|
(9
|
)
|
|||||
|
Reclassification adjustment for amounts included in net income, net of tax of $1, $1, and $(1), respectively
|
1
|
|
2
|
|
(2
|
)
|
|||||
|
Total other comprehensive income (loss)
|
1
|
|
(9
|
)
|
(11
|
)
|
|||||
|
Comprehensive Income
|
$
|
752
|
|
$
|
734
|
|
$
|
736
|
|
||
The accompanying notes are an integral part of these financial statements.
II-145
STATEMENTS OF CASH FLOWS
For the Years Ended
December 31, 2013
,
2012
, and
2011
Alabama Power Company
2013
Annual Report
|
|
2013
|
|
2012
|
|
2011
|
|
|||||
|
|
(in millions)
|
||||||||||
|
Operating Activities:
|
|||||||||||
|
Net income
|
$
|
751
|
|
$
|
743
|
|
$
|
747
|
|
||
|
Adjustments to reconcile net income
to net cash provided from operating activities —
|
|||||||||||
|
Depreciation and amortization, total
|
816
|
|
767
|
|
749
|
|
|||||
|
Deferred income taxes
|
198
|
|
164
|
|
459
|
|
|||||
|
Allowance for equity funds used during construction
|
(32
|
)
|
(19
|
)
|
(22
|
)
|
|||||
|
Pension, postretirement, and other employee benefits
|
9
|
|
(21
|
)
|
(41
|
)
|
|||||
|
Stock based compensation expense
|
10
|
|
9
|
|
6
|
|
|||||
|
Natural disaster reserve
|
3
|
|
3
|
|
34
|
|
|||||
|
Other, net
|
(41
|
)
|
(27
|
)
|
(41
|
)
|
|||||
|
Changes in certain current assets and liabilities —
|
|||||||||||
|
-Receivables
|
2
|
|
23
|
|
18
|
|
|||||
|
-Fossil fuel stock
|
146
|
|
(132
|
)
|
47
|
|
|||||
|
-Materials and supplies
|
19
|
|
(21
|
)
|
(33
|
)
|
|||||
|
-Other current assets
|
5
|
|
(4
|
)
|
(6
|
)
|
|||||
|
-Accounts payable
|
35
|
|
(77
|
)
|
11
|
|
|||||
|
-Accrued taxes
|
(23
|
)
|
(12
|
)
|
157
|
|
|||||
|
-Accrued compensation
|
(23
|
)
|
(3
|
)
|
(12
|
)
|
|||||
|
-Retail fuel cost over recovery
|
42
|
|
1
|
|
—
|
|
|||||
|
-Other current liabilities
|
(3
|
)
|
(18
|
)
|
(25
|
)
|
|||||
|
Net cash provided from operating activities
|
1,914
|
|
1,376
|
|
2,048
|
|
|||||
|
Investing Activities:
|
|||||||||||
|
Property additions
|
(1,107
|
)
|
(867
|
)
|
(977
|
)
|
|||||
|
Investment in restricted cash from pollution control bonds
|
—
|
|
1
|
|
4
|
|
|||||
|
Distribution of restricted cash from pollution control bonds
|
—
|
|
—
|
|
13
|
|
|||||
|
Nuclear decommissioning trust fund purchases
|
(280
|
)
|
(194
|
)
|
(350
|
)
|
|||||
|
Nuclear decommissioning trust fund sales
|
279
|
|
193
|
|
349
|
|
|||||
|
Cost of removal net of salvage
|
(47
|
)
|
(33
|
)
|
(28
|
)
|
|||||
|
Change in construction payables
|
(13
|
)
|
12
|
|
(9
|
)
|
|||||
|
Other investing activities
|
26
|
|
(46
|
)
|
9
|
|
|||||
|
Net cash used for investing activities
|
(1,142
|
)
|
(934
|
)
|
(989
|
)
|
|||||
|
Financing Activities:
|
|||||||||||
|
Proceeds —
|
|||||||||||
|
Capital contributions from parent company
|
24
|
|
27
|
|
12
|
|
|||||
|
Senior notes issuances
|
300
|
|
1,000
|
|
700
|
|
|||||
|
Redemptions —
|
|||||||||||
|
Pollution control revenue bonds
|
—
|
|
(1
|
)
|
(4
|
)
|
|||||
|
Senior notes
|
(250
|
)
|
(950
|
)
|
(750
|
)
|
|||||
|
Payment of preferred and preference stock dividends
|
(39
|
)
|
(39
|
)
|
(39
|
)
|
|||||
|
Payment of common stock dividends
|
(644
|
)
|
(684
|
)
|
(774
|
)
|
|||||
|
Other financing activities
|
(5
|
)
|
(2
|
)
|
(14
|
)
|
|||||
|
Net cash used for financing activities
|
(614
|
)
|
(649
|
)
|
(869
|
)
|
|||||
|
Net Change in Cash and Cash Equivalents
|
158
|
|
(207
|
)
|
190
|
|
|||||
|
Cash and Cash Equivalents at Beginning of Year
|
137
|
|
344
|
|
154
|
|
|||||
|
Cash and Cash Equivalents at End of Year
|
$
|
295
|
|
$
|
137
|
|
$
|
344
|
|
||
|
Supplemental Cash Flow Information:
|
|||||||||||
|
Cash paid during the period for —
|
|||||||||||
|
Interest (net of $11, $7 and $9 capitalized, respectively)
|
$
|
243
|
|
$
|
273
|
|
$
|
286
|
|
||
|
Income taxes (net of refunds)
|
296
|
|
309
|
|
(139
|
)
|
|||||
|
Noncash transactions - accrued property additions at year-end
|
18
|
|
31
|
|
19
|
|
|||||
The accompanying notes are an integral part of these financial statements.
II-146
BALANCE SHEETS
At
December 31, 2013
and
2012
Alabama Power Company
2013
Annual Report
|
Assets
|
2013
|
|
2012
|
|
|||
|
|
(in millions)
|
||||||
|
Current Assets:
|
|||||||
|
Cash and cash equivalents
|
$
|
295
|
|
$
|
137
|
|
|
|
Receivables —
|
|||||||
|
Customer accounts receivable
|
341
|
|
321
|
|
|||
|
Unbilled revenues
|
142
|
|
138
|
|
|||
|
Under recovered regulatory clause revenues
|
—
|
|
23
|
|
|||
|
Other accounts and notes receivable
|
30
|
|
42
|
|
|||
|
Affiliated companies
|
54
|
|
55
|
|
|||
|
Accumulated provision for uncollectible accounts
|
(8
|
)
|
(8
|
)
|
|||
|
Fossil fuel stock, at average cost
|
329
|
|
475
|
|
|||
|
Materials and supplies, at average cost
|
375
|
|
395
|
|
|||
|
Vacation pay
|
63
|
|
61
|
|
|||
|
Prepaid expenses
|
57
|
|
81
|
|
|||
|
Other regulatory assets, current
|
7
|
|
24
|
|
|||
|
Other current assets
|
6
|
|
13
|
|
|||
|
Total current assets
|
1,691
|
|
1,757
|
|
|||
|
Property, Plant, and Equipment:
|
|||||||
|
In service
|
22,092
|
|
21,407
|
|
|||
|
Less accumulated provision for depreciation
|
8,114
|
|
7,761
|
|
|||
|
Plant in service, net of depreciation
|
13,978
|
|
13,646
|
|
|||
|
Nuclear fuel, at amortized cost
|
332
|
|
354
|
|
|||
|
Construction work in progress
|
748
|
|
438
|
|
|||
|
Total property, plant, and equipment
|
15,058
|
|
14,438
|
|
|||
|
Other Property and Investments:
|
|||||||
|
Equity investments in unconsolidated subsidiaries
|
54
|
|
53
|
|
|||
|
Nuclear decommissioning trusts, at fair value
|
714
|
|
605
|
|
|||
|
Miscellaneous property and investments
|
80
|
|
78
|
|
|||
|
Total other property and investments
|
848
|
|
736
|
|
|||
|
Deferred Charges and Other Assets:
|
|||||||
|
Deferred charges related to income taxes
|
519
|
|
525
|
|
|||
|
Prepaid pension costs
|
276
|
|
—
|
|
|||
|
Deferred under recovered regulatory clause revenues
|
25
|
|
11
|
|
|||
|
Other regulatory assets, deferred
|
692
|
|
1,083
|
|
|||
|
Other deferred charges and assets
|
142
|
|
162
|
|
|||
|
Total deferred charges and other assets
|
1,654
|
|
1,781
|
|
|||
|
Total Assets
|
$
|
19,251
|
|
$
|
18,712
|
|
|
The accompanying notes are an integral part of these financial statements.
II-147
BALANCE SHEETS
At
December 31, 2013
and
2012
Alabama Power Company
2013
Annual Report
|
Liabilities and Stockholder's Equity
|
2013
|
|
2012
|
|
|||
|
|
(in millions)
|
||||||
|
Current Liabilities:
|
|||||||
|
Securities due within one year
|
$
|
—
|
|
$
|
250
|
|
|
|
Accounts payable —
|
|||||||
|
Affiliated
|
198
|
|
191
|
|
|||
|
Other
|
339
|
|
318
|
|
|||
|
Customer deposits
|
85
|
|
85
|
|
|||
|
Accrued taxes —
|
|||||||
|
Accrued income taxes
|
11
|
|
5
|
|
|||
|
Other accrued taxes
|
33
|
|
33
|
|
|||
|
Accrued interest
|
61
|
|
62
|
|
|||
|
Accrued vacation pay
|
53
|
|
50
|
|
|||
|
Accrued compensation
|
74
|
|
94
|
|
|||
|
Other regulatory liabilities, current
|
37
|
|
3
|
|
|||
|
Other current liabilities
|
41
|
|
52
|
|
|||
|
Total current liabilities
|
932
|
|
1,143
|
|
|||
|
Long-Term Debt
(
See accompanying statements
)
|
6,233
|
|
5,929
|
|
|||
|
Deferred Credits and Other Liabilities:
|
|||||||
|
Accumulated deferred income taxes
|
3,603
|
|
3,404
|
|
|||
|
Deferred credits related to income taxes
|
75
|
|
79
|
|
|||
|
Accumulated deferred investment tax credits
|
133
|
|
141
|
|
|||
|
Employee benefit obligations
|
195
|
|
321
|
|
|||
|
Asset retirement obligations
|
730
|
|
589
|
|
|||
|
Other cost of removal obligations
|
828
|
|
759
|
|
|||
|
Other regulatory liabilities, deferred
|
259
|
|
183
|
|
|||
|
Deferred over recovered regulatory clause revenues
|
15
|
|
—
|
|
|||
|
Other deferred credits and liabilities
|
61
|
|
81
|
|
|||
|
Total deferred credits and other liabilities
|
5,899
|
|
5,557
|
|
|||
|
Total Liabilities
|
13,064
|
|
12,629
|
|
|||
|
Redeemable Preferred Stock
(
See accompanying statements
)
|
342
|
|
342
|
|
|||
|
Preference Stock
(
See accompanying statements
)
|
343
|
|
343
|
|
|||
|
Common Stockholder's Equity
(
See accompanying statements
)
|
5,502
|
|
5,398
|
|
|||
|
Total Liabilities and Stockholder's Equity
|
$
|
19,251
|
|
$
|
18,712
|
|
|
|
Commitments and Contingent Matters
(
See notes
)
|
|
|
|||||
The accompanying notes are an integral part of these financial statements.
II-148
STATEMENTS OF CAPITALIZATION
At
December 31, 2013
and
2012
Alabama Power Company
2013
Annual Report
|
2013
|
|
2012
|
|
2013
|
|
2012
|
|
||||||
|
|
(in millions)
|
(percent of total)
|
|||||||||||
|
Long-Term Debt:
|
|||||||||||||
|
Long-term debt payable to affiliated trusts —
|
|||||||||||||
|
Variable rate (3.35% at 1/1/14) due 2042
|
$
|
206
|
|
$
|
206
|
|
|||||||
|
Long-term notes payable —
|
|||||||||||||
|
5.80% due 2013
|
—
|
|
250
|
|
|||||||||
|
0.55% due 2015
|
400
|
|
400
|
|
|||||||||
|
5.20% due 2016
|
200
|
|
200
|
|
|||||||||
|
5.50% to 5.55% due 2017
|
525
|
|
525
|
|
|||||||||
|
3.375% to 6.125% due 2019-2042
|
3,750
|
|
3,450
|
|
|||||||||
|
Total long-term notes payable
|
4,875
|
|
4,825
|
|
|||||||||
|
Other long-term debt —
|
|||||||||||||
|
Pollution control revenue bonds —
|
|||||||||||||
|
0.40% to 5.00% due 2034
|
367
|
|
367
|
|
|||||||||
|
Variable rate (0.04% at 1/1/14) due 2015
|
54
|
|
54
|
|
|||||||||
|
Variable rates (0.09% to 0.10% at 1/1/14) due 2017
|
36
|
|
36
|
|
|||||||||
|
Variable rates (0.02% to 0.13% at 1/1/14) due 2021-2038
|
694
|
|
694
|
|
|||||||||
|
Total other long-term debt
|
1,151
|
|
1,151
|
|
|||||||||
|
Capitalized lease obligations
|
5
|
|
—
|
|
|||||||||
|
Unamortized debt premium (discount), net
|
(4
|
)
|
(3
|
)
|
|||||||||
|
Total long-term debt (annual interest requirement — $243 million)
|
6,233
|
|
6,179
|
|
|||||||||
|
Less amount due within one year
|
—
|
|
250
|
|
|||||||||
|
Long-term debt excluding amount due within one year
|
6,233
|
|
5,929
|
|
50.2
|
%
|
49.4
|
%
|
|||||
II-149
|
STATEMENTS OF CAPITALIZATION (continued)
At December 31, 2013 and 2012 Alabama Power Company 2013 Annual Report |
|||||||||||||
|
2013
|
|
2012
|
|
2013
|
|
2012
|
|
||||||
|
|
(in millions)
|
(percent of total)
|
|||||||||||
|
Redeemable Preferred Stock:
|
|||||||||||||
|
Cumulative redeemable preferred stock
|
|||||||||||||
|
$100 par or stated value — 4.20% to 4.92%
|
|||||||||||||
|
Authorized — 3,850,000 shares
|
|||||||||||||
|
Outstanding — 475,115 shares
|
48
|
|
48
|
|
|||||||||
|
$1 par value — 5.20% to 5.83%
|
|||||||||||||
|
Authorized — 27,500,000 shares
|
|||||||||||||
|
Outstanding — 12,000,000 shares: $25 stated value
|
|||||||||||||
|
(annual dividend requirement — $18 million)
|
294
|
|
294
|
|
|||||||||
|
Total redeemable preferred stock
|
342
|
|
342
|
|
2.7
|
|
2.8
|
|
|||||
|
Preference Stock:
|
|||||||||||||
|
Authorized — 40,000,000 shares
|
|||||||||||||
|
Outstanding — $1 par value — 5.63% to 6.50%
|
|||||||||||||
|
— 14,000,000 shares
|
|||||||||||||
|
(non-cumulative) $25 stated value
|
|||||||||||||
|
(annual dividend requirement — $21 million)
|
343
|
|
343
|
|
2.8
|
|
2.9
|
|
|||||
|
Common Stockholder's Equity:
|
|||||||||||||
|
Common stock, par value $40 per share —
|
|||||||||||||
|
Authorized: 40,000,000 shares
|
|||||||||||||
|
Outstanding: 30,537,500 shares
|
1,222
|
|
1,222
|
|
|||||||||
|
Paid-in capital
|
2,262
|
|
2,227
|
|
|||||||||
|
Retained earnings
|
2,044
|
|
1,976
|
|
|||||||||
|
Accumulated other comprehensive income (loss)
|
(26
|
)
|
(27
|
)
|
|||||||||
|
Total common stockholder's equity
|
5,502
|
|
5,398
|
|
44.3
|
|
44.9
|
|
|||||
|
Total Capitalization
|
$
|
12,420
|
|
$
|
12,012
|
|
100.0
|
%
|
100.0
|
%
|
|||
The accompanying notes are an integral part of these financial statements.
II-150
STATEMENTS OF COMMON STOCKHOLDER'S EQUITY
For the Years Ended
December 31, 2013
,
2012
, and
2011
Alabama Power Company
2013
Annual Report
|
|
Number of
Common
Shares
Issued
|
Common
Stock
|
Paid-In
Capital
|
Retained
Earnings
|
Accumulated
Other
Comprehensive
Income (Loss)
|
Total
|
||||||||||||||||
|
|
(in millions)
|
|||||||||||||||||||||
|
Balance at December 31, 2010
|
31
|
|
$
|
1,222
|
|
$
|
2,156
|
|
$
|
2,022
|
|
$
|
(7
|
)
|
$
|
5,393
|
|
|||||
|
Net income after dividends on preferred
and preference stock
|
—
|
|
—
|
|
—
|
|
708
|
|
—
|
|
708
|
|
||||||||||
|
Capital contributions from parent company
|
—
|
|
—
|
|
26
|
|
—
|
|
—
|
|
26
|
|
||||||||||
|
Other comprehensive income (loss)
|
—
|
|
—
|
|
—
|
|
—
|
|
(11
|
)
|
(11
|
)
|
||||||||||
|
Cash dividends on common stock
|
—
|
|
—
|
|
—
|
|
(774
|
)
|
—
|
|
(774
|
)
|
||||||||||
|
Balance at December 31, 2011
|
31
|
|
1,222
|
|
2,182
|
|
1,956
|
|
(18
|
)
|
5,342
|
|
||||||||||
|
Net income after dividends on preferred
and preference stock
|
—
|
|
—
|
|
—
|
|
704
|
|
—
|
|
704
|
|
||||||||||
|
Capital contributions from parent company
|
—
|
|
—
|
|
45
|
|
—
|
|
—
|
|
45
|
|
||||||||||
|
Other comprehensive income (loss)
|
—
|
|
—
|
|
—
|
|
—
|
|
(9
|
)
|
(9
|
)
|
||||||||||
|
Cash dividends on common stock
|
—
|
|
—
|
|
—
|
|
(684
|
)
|
—
|
|
(684
|
)
|
||||||||||
|
Balance at December 31, 2012
|
31
|
|
1,222
|
|
2,227
|
|
1,976
|
|
(27
|
)
|
5,398
|
|
||||||||||
|
Net income after dividends on preferred
and preference stock
|
—
|
|
—
|
|
—
|
|
712
|
|
—
|
|
712
|
|
||||||||||
|
Capital contributions from parent company
|
—
|
|
—
|
|
35
|
|
—
|
|
—
|
|
35
|
|
||||||||||
|
Other comprehensive income (loss)
|
—
|
|
—
|
|
—
|
|
—
|
|
1
|
|
1
|
|
||||||||||
|
Cash dividends on common stock
|
—
|
|
—
|
|
—
|
|
(644
|
)
|
—
|
|
(644
|
)
|
||||||||||
|
Balance at December 31, 2013
|
31
|
|
$
|
1,222
|
|
$
|
2,262
|
|
$
|
2,044
|
|
$
|
(26
|
)
|
$
|
5,502
|
|
|||||
The accompanying notes are an integral part of these financial statements.
II-151
NOTES TO FINANCIAL STATEMENTS
Alabama Power Company
2013
Annual Report
Index to the Notes to Financial Statements
|
Note
|
Page
|
|
|
1
|
||
|
2
|
||
|
3
|
||
|
4
|
||
|
5
|
||
|
6
|
||
|
7
|
||
|
8
|
||
|
9
|
||
|
10
|
||
|
11
|
||
|
12
|
||
II-152
NOTES (continued)
Alabama Power Company 2013 Annual Report
1. SUMMARY OF SIGNIFICANT ACCOUNTING POLICIES
General
Alabama Power Company (the Company) is a wholly owned subsidiary of The Southern Company (Southern Company), which is the parent company of four traditional operating companies, Southern Power Company (Southern Power), Southern Company Services, Inc. (SCS), Southern Communications Services, Inc. (SouthernLINC Wireless), Southern Company Holdings, Inc. (Southern Holdings), Southern Nuclear Operating Company, Inc. (Southern Nuclear), and other direct and indirect subsidiaries. The traditional operating companies – the Company, Georgia Power Company (Georgia Power), Gulf Power Company (Gulf Power), and Mississippi Power Company (Mississippi Power) – are vertically integrated utilities providing electric service in four Southeastern states. The Company operates as a vertically integrated utility providing electricity to retail and wholesale customers within its traditional service territory located in the State of Alabama in addition to wholesale customers in the Southeast. Southern Power constructs, acquires, owns, and manages generation assets, including renewable energy projects, and sells electricity at market-based rates in the wholesale market. SCS, the system service company, provides, at cost, specialized services to Southern Company and its subsidiary companies. SouthernLINC Wireless provides digital wireless communications for use by Southern Company and its subsidiary companies and also markets these services to the public and provides fiber cable services within the Southeast. Southern Holdings is an intermediate holding company subsidiary primarily for Southern Company's investments in leveraged leases. Southern Nuclear operates and provides services to the Southern Company system's nuclear power plants, including the Company's Plant Farley.
The equity method is used for subsidiaries in which the Company has significant influence but does not control and for variable interest entities (VIEs) where the Company has an equity investment, but is not the primary beneficiary.
The Company is subject to regulation by the Federal Energy Regulatory Commission (FERC) and the Alabama Public Service Commission (PSC). The Company follows generally accepted accounting principles (GAAP) in the U.S. and complies with the accounting policies and practices prescribed by its regulatory commissions. The preparation of financial statements in conformity with GAAP requires the use of estimates, and the actual results may differ from those estimates. Certain prior years' data presented in the financial statements have been reclassified to conform to the current year presentation.
Affiliate Transactions
The Company has an agreement with SCS under which the following services are rendered to the Company at direct or allocated cost: general and design engineering, operations, purchasing, accounting, finance and treasury, tax, information technology, marketing, auditing, insurance and pension administration, human resources, systems and procedures, digital wireless communications, and other services with respect to business and operations, construction management, and power pool transactions. Costs for these services amounted to
$340 million
,
$340 million
, and
$347 million
during
2013
,
2012
, and
2011
, respectively. Cost allocation methodologies used by SCS prior to the repeal of the Public Utility Holding Company Act of 1935, as amended, were approved by the U.S. Securities and Exchange Commission (SEC). Subsequently, additional cost allocation methodologies have been reported to the FERC and management believes they are reasonable. The FERC permits services to be rendered at cost by system service companies.
The Company has an agreement with Southern Nuclear under which the following nuclear-related services are rendered to the Company at cost: general executive and advisory services, general operations, management and technical services, administrative services including procurement, accounting, employee relations, systems and procedures services, strategic planning and budgeting services, and other services with respect to business and operations. Costs for these services amounted to
$211 million
,
$218 million
, and
$215 million
during
2013
,
2012
, and
2011
, respectively.
The Company jointly owns Plant Greene County with Mississippi Power. The Company has an agreement with Mississippi Power under which the Company operates Plant Greene County, and Mississippi Power reimburses the Company for its proportionate share of non-fuel expenses, which were
$13 million
in
2013
,
$12 million
in
2012
, and
$12 million
in
2011
. Also, Mississippi Power reimburses the Company for any direct fuel purchases delivered from one of the Company's transfer facilities, which were
$27 million
in 2013,
$28 million
in 2012, and
$21 million
in 2011. See Note 4 for additional information.
The Company has an agreement with Gulf Power under which the Company will make transmission system upgrades to ensure firm delivery of energy under a non-affiliate PPA. In 2009, Gulf Power entered into a PPA for the capacity and energy from a combined cycle plant located in Autauga County, Alabama. The total cost committed by the Company related to the upgrades is approximately
$22 million
in
2013
and
$31 million
in
2014
. The Company expects to recover a majority of these costs through a tariff with Gulf Power until
2023
. The remainder of these costs will be recovered through normal rate mechanisms.
II-153
NOTES (continued)
Alabama Power Company 2013 Annual Report
The Company provides incidental services to and receives such services from other Southern Company subsidiaries which are generally minor in duration and amount. Except as described herein, the Company neither provided nor received any material services to or from affiliates in
2013
,
2012
, or
2011
.
Also, see Note 4 for information regarding the Company's ownership in, a PPA, and a gas pipeline ownership agreement with Southern Electric Generating Company (SEGCO).
The traditional operating companies, including the Company and Southern Power, may jointly enter into various types of wholesale energy, natural gas, and certain other contracts, either directly or through SCS as agent. Each participating company may be jointly and severally liable for the obligations incurred under these agreements. See Note 7 under "Fuel and Purchased Power Agreements" for additional information.
II-154
NOTES (continued)
Alabama Power Company 2013 Annual Report
Regulatory Assets and Liabilities
The Company is subject to the provisions of the Financial Accounting Standards Board in accounting for the effects of rate regulation. Regulatory assets represent probable future revenues associated with certain costs that are expected to be recovered from customers through the ratemaking process. Regulatory liabilities represent probable future reductions in revenues associated with amounts that are expected to be credited to customers through the ratemaking process.
Regulatory assets and (liabilities) reflected in the balance sheets at December 31 relate to:
|
2013
|
|
2012
|
|
Note
|
|||||
|
(in millions)
|
|||||||||
|
Deferred income tax charges
|
$
|
519
|
|
$
|
525
|
|
(a,k)
|
||
|
Loss on reacquired debt
|
86
|
|
93
|
|
(b)
|
||||
|
Vacation pay
|
63
|
|
61
|
|
(c,j)
|
||||
|
Under/(over) recovered regulatory clause revenues
|
(18
|
)
|
34
|
|
(d)
|
||||
|
Fuel-hedging (realized and unrealized) losses
|
8
|
|
18
|
|
(e)
|
||||
|
Other regulatory assets
|
52
|
|
51
|
|
(f)
|
||||
|
Asset retirement obligations
|
(132
|
)
|
(64
|
)
|
(a)
|
||||
|
Other cost of removal obligations
|
(828
|
)
|
(759
|
)
|
(a)
|
||||
|
Deferred income tax credits
|
(75
|
)
|
(79
|
)
|
(a)
|
||||
|
Fuel-hedging (realized and unrealized) gains
|
(8
|
)
|
(5
|
)
|
(e)
|
||||
|
Nuclear outage
|
51
|
|
33
|
|
(d)
|
||||
|
Natural disaster reserve
|
(96
|
)
|
(103
|
)
|
(h)
|
||||
|
Other regulatory liabilities
|
(11
|
)
|
(13
|
)
|
(d,g)
|
||||
|
Retiree benefit plans
|
461
|
|
911
|
|
(i,j)
|
||||
|
Regulatory deferrals
|
20
|
|
—
|
|
(l)
|
||||
|
Total regulatory assets (liabilities), net
|
$
|
92
|
|
$
|
703
|
|
|||
Note: The recovery and amortization periods for these regulatory assets and (liabilities) are as follows:
|
(a)
|
Asset retirement and removal assets and liabilities are recorded, deferred income tax assets are recovered, and deferred income tax liabilities are amortized over the related property lives, which may range up to
50 years
. Asset retirement and removal assets and liabilities will be settled and trued up following completion of the related activities.
|
|
(b)
|
Recovered over the remaining life of the original issue, which may range up to
50 years
.
|
|
(c)
|
Recorded as earned by employees and recovered as paid, generally within
one year
. This includes both vacation and banked holiday pay.
|
|
(d)
|
Recorded and recovered or amortized as approved or accepted by the Alabama PSC over periods not exceeding
ten years
.
|
|
(e)
|
Fuel-hedging assets and liabilities are recorded over the life of the underlying hedged purchase contracts, which generally do not exceed three years. Upon final settlement, actual costs incurred are recovered through the energy cost recovery clause.
|
|
(f)
|
Comprised of components including generation site selection/evaluation costs, PPA capacity, and other miscellaneous assets. Recorded as accepted by the Alabama PSC. Capitalized upon initialization of related construction projects, if applicable.
|
|
(g)
|
Comprised of components including mine reclamation and remediation liabilities and other liabilities. Recorded as accepted by the Alabama PSC. Mine reclamation and remediation liabilities will be settled following completion of the related activities.
|
|
(h)
|
Utilized as storm restoration and potential reliability-related expenses are incurred, as approved by the Alabama PSC.
|
|
(i)
|
Recovered and amortized over the average remaining service period which may range up to
15 years
. See Note 2 for additional information.
|
|
(j)
|
Not earning a return as offset in rate base by a corresponding asset or liability.
|
|
(k)
|
Included in the deferred income tax charges are
$20 million
for 2013 and
$21 million
for 2012 for the retiree Medicare drug subsidy, which is recovered and amortized, as approved by the Alabama PSC, over the average remaining service period which may range up to
15 years
.
|
|
(l)
|
Recorded and amortized as approved by the Alabama PSC for 2015 through 2017.
|
In the event that a portion of the Company's operations is no longer subject to applicable accounting rules for rate regulation, the Company would be required to write off to income or reclassify to accumulated other comprehensive income (OCI) related regulatory assets and liabilities that are not specifically recoverable through regulated rates. In addition, the Company would be required to determine if any impairment to other assets, including plant, exists and write down the assets, if impaired, to their fair values. All regulatory assets and liabilities are to be reflected in rates. See Note 3 under "Retail Regulatory Matters" for additional information.
II-155
NOTES (continued)
Alabama Power Company 2013 Annual Report
Revenues
Wholesale capacity revenues are generally recognized on a levelized basis over the appropriate contract period. Energy and other revenues are recognized as services are provided. Unbilled revenues related to retail sales are accrued at the end of each fiscal period. Electric rates for the Company include provisions to adjust billings for fluctuations in fuel costs, fuel hedging, the energy component of purchased power costs, and certain other costs. Revenues are adjusted for differences between these actual costs and amounts billed in current regulated rates. Under or over recovered regulatory clause revenues are recorded in the balance sheets and are recovered or returned to customers through adjustments to the billing factors. The Company continuously monitors the under/over recovered balances and files for revised rates as required or when management deems appropriate, depending on the rate. See Note 3 under "Retail Regulatory Matters – Energy Cost Recovery" and "Retail Regulatory Matters – Rate CNP" for additional information.
The Company has a diversified base of customers. No single customer or industry comprises
10%
or more of revenues. For all periods presented, uncollectible accounts averaged less than
1%
of revenues.
Fuel Costs
Fuel costs are expensed as the fuel is used. Fuel expense generally includes fuel transportation costs and the cost of purchased emissions allowances as they are used. Fuel expense also includes the amortization of the cost of nuclear fuel and a charge, based on nuclear generation, for the permanent disposal of spent nuclear fuel. See Note 3 under "Nuclear Fuel Disposal Costs" for additional information.
Income and Other Taxes
The Company uses the liability method of accounting for deferred income taxes and provides deferred income taxes for all significant income tax temporary differences. Investment tax credits (ITCs) utilized are deferred and amortized to income over the average life of the related property. Taxes that are collected from customers on behalf of governmental agencies to be remitted to these agencies are presented net on the statements of income.
In accordance with accounting standards related to the uncertainty in income taxes, the Company recognizes tax positions that are "more likely than not" of being sustained upon examination by the appropriate taxing authorities. See Note 5 under "Unrecognized Tax Benefits" for additional information.
Property, Plant, and Equipment
Property, plant, and equipment is stated at original cost less any regulatory disallowances and impairments. Original cost includes: materials; labor; minor items of property; appropriate administrative and general costs; payroll-related costs such as taxes, pensions, and other benefits; and the interest capitalized and cost of equity funds used during construction.
The Company's property, plant, and equipment in service consisted of the following at December 31:
|
2013
|
2012
|
||||||
|
(in millions)
|
|||||||
|
Generation
|
$
|
11,314
|
|
$
|
11,110
|
|
|
|
Transmission
|
3,287
|
|
3,137
|
|
|||
|
Distribution
|
5,934
|
|
5,714
|
|
|||
|
General
|
1,545
|
|
1,434
|
|
|||
|
Plant acquisition adjustment
|
12
|
|
12
|
|
|||
|
Total plant in service
|
$
|
22,092
|
|
$
|
21,407
|
|
|
The cost of replacements of property, exclusive of minor items of property, is capitalized. The cost of maintenance, repairs, and replacement of minor items of property is charged to other operations and maintenance expenses as incurred or performed with the exception of nuclear refueling costs, which are recorded in accordance with specific Alabama PSC orders.
In 2010, the Alabama PSC approved the Company's request to stop accruing for nuclear refueling outage costs in advance of the refueling outages when the most recent
18
-month amortization cycle ended in December 2010 and to begin deferring nuclear outage expenses. The amortization will begin after each outage has occurred and the associated outage expenses are known.
During 2011, the Company deferred
$38 million
of nuclear outage expenses associated with the fall 2011 outage and began the first
18
-month amortization cycle for expenses in January 2012. These expenses were fully amortized in June 2013. The
II-156
NOTES (continued)
Alabama Power Company 2013 Annual Report
Company deferred an additional
$31 million
of nuclear outage expenses associated with the spring 2012 outage and began the
second amortization cycle in July 2012. These expenses were fully amortized in December 2013.
During 2013, the Company deferred
$28 million
of nuclear outage expenses associated with the spring 2013 outage and began the
18
-month amortization cycle for expenses in July 2013. The Company deferred an additional
$32 million
of nuclear outage expenses associated with the fall 2013 outage and began the
18
-month amortization cycle for expenses in January 2014.
The total unamortized deferred nuclear outage expense balance of
$51 million
is included in the 2013 balance sheet as a regulatory asset.
Depreciation and Amortization
Depreciation of the original cost of utility plant in service is provided primarily by using composite straight-line rates, which approximated
3.2%
in
2013
and
2012
, and
3.3%
in
2011
. Depreciation studies are conducted periodically to update the composite rates and the information is provided to the Alabama PSC and the FERC. When property subject to composite depreciation is retired or otherwise disposed of in the normal course of business, its original cost, together with the cost of removal, less salvage, is charged to accumulated depreciation. For other property dispositions, the applicable cost and accumulated depreciation are removed from the balance sheet accounts, and a gain or loss is recognized. Minor items of property included in the original cost of the plant are retired when the related property unit is retired.
In 2011, the Company submitted a depreciation study to the FERC and received authorization to use the recommended rates beginning January 2012. The study was also provided to the Alabama PSC.
Asset Retirement Obligations and Other Costs of Removal
Asset retirement obligations are computed as the present value of the ultimate costs for an asset's future retirement and are recorded in the period in which the liability is incurred. The costs are capitalized as part of the related long-lived asset and depreciated over the asset's useful life. The Company has received accounting guidance from the Alabama PSC allowing the continued accrual of other future retirement costs for long-lived assets that the Company does not have a legal obligation to retire. Accordingly, the accumulated removal costs for these obligations are reflected in the balance sheets as a regulatory liability.
The liability for asset retirement obligations primarily relates to the decommissioning of the Company's nuclear facility, Plant Farley. In addition, the Company has retirement obligations related to various landfill sites, underground storage tanks, asbestos removal, and disposal of polychlorinated biphenyls in certain transformers. The Company also has identified retirement obligations related to certain transmission and distribution facilities and certain wireless communication towers. However, liabilities for the removal of these assets have not been recorded because the settlement timing for the retirement obligations related to these assets are indeterminable and, therefore, the fair value of the retirement obligations cannot be reasonably estimated. A liability for these asset retirement obligations will be recognized when sufficient information becomes available to support a reasonable estimation of the asset retirement obligation. The Company will continue to recognize in the statements of income allowed removal costs in accordance with its regulatory treatment. Any differences between costs recognized in accordance with accounting standards related to asset retirement and environmental obligations and those reflected in rates are recognized as either a regulatory asset or liability, as ordered by the Alabama PSC, and are reflected in the balance sheets. See "Nuclear Decommissioning" herein for additional information on amounts included in rates.
Details of the asset retirement obligations included in the balance sheets are as follows:
|
2013
|
2012
|
||||||
|
(in millions)
|
|||||||
|
Balance at beginning of year
|
$
|
589
|
|
$
|
553
|
|
|
|
Liabilities incurred
|
—
|
|
—
|
|
|||
|
Liabilities settled
|
(1
|
)
|
(1
|
)
|
|||
|
Accretion
|
40
|
|
37
|
|
|||
|
Cash flow revisions
(a)
|
102
|
|
—
|
|
|||
|
Balance at end of year
|
$
|
730
|
|
$
|
589
|
|
|
(a) Updated based on results from the 2013 nuclear decommissioning study
II-157
NOTES (continued)
Alabama Power Company 2013 Annual Report
Nuclear Decommissioning
The U.S. Nuclear Regulatory Commission (NRC) requires licensees of commercial nuclear power reactors to establish a plan for providing reasonable assurance of funds for future decommissioning. The Company has external trust funds (Funds) to comply with the NRC's regulations. Use of the Funds is restricted to nuclear decommissioning activities. The Funds are managed and invested in accordance with applicable requirements of various regulatory bodies, including the NRC, the FERC, and the Alabama PSC, as well as the Internal Revenue Service (IRS). The Funds are required to be held by one or more trustees with an individual net worth of at least
$100 million
. The FERC requires the Funds' managers to exercise the standard of care in investing that a "prudent investor" would use in the same circumstances. The FERC regulations also require that the Funds' managers may not invest in any securities of the utility for which it manages funds or its affiliates, except for investments tied to market indices or other mutual funds. While the Company is allowed to prescribe an overall investment policy to the Funds' managers, the Company and its affiliates are not allowed to engage in the day-to-day management of the Funds or to mandate individual investment decisions. Day-to-day management of the investments in the Funds is delegated to unrelated third party managers with oversight by the management of the Company. The Funds' managers are authorized, within certain investment guidelines, to actively buy and sell securities at their own discretion in order to maximize the return on the Funds' investments. The Funds are invested in a tax-efficient manner in a diversified mix of equity and fixed income securities and are reported as trading securities.
The Company records the investment securities held in the Funds at fair value, as disclosed in Note 10, as management believes that fair value best represents the nature of the Funds. Gains and losses, whether realized or unrealized, are recorded in the regulatory liability for asset retirement obligations in the balance sheets and are not included in net income or OCI. Fair value adjustments and realized gains and losses are determined on a specific identification basis.
At
December 31, 2013
, investment securities in the Funds totaled
$713 million
, consisting of equity securities of
$566 million
, debt securities of
$131 million
, and
$16 million
of other securities. At
December 31, 2012
, investment securities in the Funds totaled
$604 million
, consisting of equity securities of
$438 million
, debt securities of
$156 million
, and
$10 million
of other securities. These amounts exclude receivables related to investment income and pending investment sales and payables related to pending investment purchases.
Sales of the securities held in the Funds resulted in cash proceeds of
$279 million
,
$193 million
, and
$349 million
in
2013
,
2012
, and
2011
, respectively, all of which were reinvested. For
2013
, fair value increases, including reinvested interest and dividends and excluding the Funds' expenses, were
$120 million
, of which
$5 million
related to realized gains and
$85 million
related to unrealized gains related to securities held in the Funds at
December 31, 2013
. For
2012
, fair value increases, including reinvested interest and dividends and excluding the Funds' expenses, were
$70 million
, of which
$4 million
related to realized gains and
$50 million
related to unrealized gains related to securities held in the Funds at
December 31, 2012
. For
2011
, fair value increases, including reinvested interest and dividends and excluding the Funds' expenses, were
$6 million
, of which
$41 million
related to realized gains and
$51 million
related to unrealized losses related to securities held in the Funds at
December 31, 2011
. While the investment securities held in the Funds are reported as trading securities, the Funds continue to be managed with a long-term focus. Accordingly, all purchases and sales within the Funds are presented separately in the statements of cash flows as investing cash flows, consistent with the nature of and purpose for which the securities were acquired.
Amounts previously recorded in internal reserves are being transferred into the Funds over periods approved by the Alabama PSC. The NRC's minimum external funding requirements are based on a generic estimate of the cost to decommission only the radioactive portions of a nuclear unit based on the size and type of reactor. The Company has filed a plan with the NRC designed to ensure that, over time, the deposits and earnings of the Funds will provide the minimum funding amounts prescribed by the NRC.
At December 31, the accumulated provisions for decommissioning were as follows:
|
2013
|
2012
|
||||||
|
(in millions)
|
|||||||
|
External trust funds
|
$
|
713
|
|
$
|
604
|
|
|
|
Internal reserves
|
21
|
|
22
|
|
|||
|
Total
|
$
|
734
|
|
$
|
626
|
|
|
II-158
NOTES (continued)
Alabama Power Company 2013 Annual Report
Site study costs is the estimate to decommission a facility as of the site study year. The estimated costs of decommissioning as of December 31, 2013 based on the most current study performed in 2013 for Plant Farley are as follows:
|
Decommissioning periods:
|
|||
|
Beginning year
|
2037
|
|
|
|
Completion year
|
2076
|
|
|
|
(in millions)
|
|||
|
Site study costs:
|
|||
|
Radiated structures
|
$
|
1,362
|
|
|
Non-radiated structures
|
80
|
|
|
|
Total site study costs
|
$
|
1,442
|
|
The decommissioning cost estimates are based on prompt dismantlement and removal of the plant from service. The actual decommissioning costs may vary from the above estimates because of changes in the assumed date of decommissioning, changes in NRC requirements, or changes in the assumptions used in making these estimates.
For ratemaking purposes, the Company's decommissioning costs are based on the site study. Significant assumptions used to determine these costs for ratemaking were an inflation rate of
4.5%
and a trust earnings rate of
7.0%
. The next site study is expected to be conducted in 2018.
Amounts previously contributed to the Funds are currently projected to be adequate to meet the decommissioning obligations. The Company will continue to provide site specific estimates of the decommissioning costs and related projections of funds in the external trust to the Alabama PSC and, if necessary, would seek the Alabama PSC's approval to address any changes in a manner consistent with the NRC and other applicable requirements.
Allowance for Funds Used During Construction
In accordance with regulatory treatment, the Company records allowance for funds used during construction (AFUDC), which represents the estimated debt and equity costs of capital funds that are necessary to finance the construction of new regulated facilities. While cash is not realized currently from such allowance, AFUDC increases the revenue requirement and is recovered over the service life of the plant through a higher rate base and higher depreciation. The equity component of AFUDC is not included in calculating taxable income. All current construction costs are included in retail rates. The composite rate used to determine the amount of AFUDC was
9.1%
in
2013
,
9.4%
in
2012
, and
9.2%
in
2011
. AFUDC, net of income taxes, as a percent of net income after dividends on preferred and preference stock was
5.4%
in
2013
,
3.3%
in
2012
, and
3.9%
in
2011
.
Impairment of Long-Lived Assets and Intangibles
The Company evaluates long-lived assets for impairment when events or changes in circumstances indicate that the carrying value of such assets may not be recoverable. The determination of whether an impairment has occurred is based on either a specific regulatory disallowance or an estimate of undiscounted future cash flows attributable to the assets, as compared with the carrying value of the assets. If an impairment has occurred, the amount of the impairment recognized is determined by either the amount of regulatory disallowance or by estimating the fair value of the assets and recording a loss if the carrying value is greater than the fair value. For assets identified as held for sale, the carrying value is compared to the estimated fair value less the cost to sell in order to determine if an impairment loss is required. Until the assets are disposed of, their estimated fair value is re-evaluated when circumstances or events change.
Natural Disaster Reserve
Based on an order from the Alabama PSC, the Company maintains a reserve for operations and maintenance expenses to cover the cost of damages from major storms to its transmission and distribution facilities. The order approves a separate monthly Rate Natural Disaster Reserve (Rate NDR) charge to customers consisting of two components. The first component is intended to establish and maintain a reserve balance for future storms and is an on-going part of customer billing. The second component of the Rate NDR charge is intended to allow recovery of any existing deferred storm-related operations and maintenance costs and any future reserve deficits over a
24
-month period. The Alabama PSC order gives the Company authority to record a deficit balance in the Natural Disaster Reserve (NDR) when costs of storm damage exceed any established reserve balance. Absent further Alabama PSC approval, the maximum total Rate NDR charge consisting of both components is
$10
per month per non-residential customer account and
$5
per month per residential customer account. The Company has the authority, based on an order from the Alabama PSC, to accrue certain additional amounts as circumstances warrant. The order allows for reliability-
II-159
NOTES (continued)
Alabama Power Company 2013 Annual Report
related expenditures to be charged against the additional accruals when the NDR balance exceeds
$75 million
. The Company may designate a portion of the NDR to reliability-related expenditures as a part of an annual budget process for the following year or during the current year for identified unbudgeted reliability-related expenditures that are incurred. Accruals that have not been designated can be used to offset storm charges. Additional accruals to the NDR will enhance the Company's ability to deal with the financial effects of future natural disasters, promote system reliability, and offset costs retail customers would otherwise bear.
As revenue from the Rate NDR charge is recognized, an equal amount of operations and maintenance expenses related to the NDR will also be recognized. As a result, the Rate NDR charge will not have an effect on net income but will impact operating cash flows. See Note 3 under "Retail Regulatory Matters – Natural Disaster Reserve" herein for additional information.
Cash and Cash Equivalents
For purposes of the financial statements, temporary cash investments are considered cash equivalents. Temporary cash investments are securities with original maturities of
90 days
or less.
Materials and Supplies
Generally, materials and supplies include the average cost of transmission, distribution, and generating plant materials. Materials are charged to inventory when purchased and then expensed or capitalized to plant, as appropriate, at weighted average cost when installed.
Fuel Inventory
Fuel inventory includes the average cost of coal, natural gas, oil, transportation, and emissions allowances. Fuel is charged to inventory when purchased and then expensed, at weighted average cost, as used and recovered by the Company through energy cost recovery rates approved by the Alabama PSC. Emissions allowances granted by the U.S. Environmental Protection Agency (EPA) are included in inventory at zero cost.
Financial Instruments
The Company uses derivative financial instruments to limit exposure to fluctuations in interest rates, the prices of certain fuel purchases, and electricity purchases and sales. All derivative financial instruments are recognized as either assets or liabilities (included in "Other" or shown separately as "Risk Management Activities") and are measured at fair value. See Note 10 for additional information. Substantially all of the Company's bulk energy purchases and sales contracts that meet the definition of a derivative are excluded from fair value accounting requirements because they qualify for the "normal" scope exception, and are accounted for under the accrual method. Other derivative contracts qualify as cash flow hedges of anticipated transactions or are recoverable through the Alabama PSC-approved fuel-hedging program. This results in the deferral of related gains and losses in OCI or regulatory assets and liabilities, respectively, until the hedged transactions occur. If any, immaterial ineffectiveness arising from cash flow hedges is recognized currently in net income. Other derivative contracts are marked to market through current period income and are recorded on a net basis in the statements of income. See Note 11 for additional information.
The Company does not offset fair value amounts recognized for multiple derivative instruments executed with the same counterparty under a master netting arrangement. Additionally, the Company had no outstanding collateral repayment obligations and had immaterial reclaim collateral arising from derivative instruments recognized at
December 31, 2013
.
The Company is exposed to losses related to financial instruments in the event of counterparties' nonperformance. The Company has established controls to determine and monitor the creditworthiness of counterparties in order to mitigate the Company's exposure to counterparty credit risk.
Comprehensive Income
The objective of comprehensive income is to report a measure of all changes in common stock equity of an enterprise that result from transactions and other economic events of the period other than transactions with owners. Comprehensive income consists of net income, changes in the fair value of qualifying cash flow hedges, and reclassifications for amounts included in net income.
Variable Interest Entities
The primary beneficiary of a VIE is required to consolidate the VIE when it has both the power to direct the activities of the VIE that most significantly impact the VIE's economic performance and the obligation to absorb losses or the right to receive benefits from the VIE that could potentially be significant to the VIE.
The Company has established a wholly-owned trust to issue preferred securities. See Note 6 under "Long-Term Debt Payable to an Affiliated Trust" for additional information. However, the Company is not considered the primary beneficiary of the trust.
II-160
NOTES (continued)
Alabama Power Company 2013 Annual Report
Therefore, the investment in the trust is reflected as other investments, and the related loan from the trust is reflected as long-term debt in the balance sheets.
2. RETIREMENT BENEFITS
The Company has a defined benefit, trusteed, pension plan covering substantially all employees. This qualified pension plan is funded in accordance with requirements of the Employee Retirement Income Security Act of 1974, as amended (ERISA).
No
contributions were made to the qualified pension plan during
2013
.
No
mandatory contributions to the qualified pension plan are anticipated for the year ending December 31, 2014. The Company also provides certain defined benefit pension plans for a selected group of management and highly compensated employees. Benefits under these non-qualified pension plans are funded on a cash basis. In addition, the Company provides certain medical care and life insurance benefits for retired employees through other postretirement benefit plans. The Company funds its other postretirement trusts to the extent required by the Alabama PSC and the FERC. No contributions to the other postretirement trusts are expected during the year ending December 31, 2014.
Actuarial Assumptions
The weighted average rates assumed in the actuarial calculations used to determine both the benefit obligations as of the measurement date and the net periodic costs for the pension and other postretirement benefit plans for the following year are presented below. Net periodic benefit costs were calculated in 2010 for the 2011 plan year using discount rates for the pension plans and the other postretirement benefit plans of
5.52%
and
5.41%
, respectively, and an annual salary increase of
3.84%
.
|
2013
|
2012
|
2011
|
||||||
|
Discount rate:
|
||||||||
|
Pension plans
|
5.02
|
%
|
4.27
|
%
|
4.98
|
%
|
||
|
Other postretirement benefit plans
|
4.86
|
|
4.06
|
|
4.88
|
|
||
|
Annual salary increase
|
3.59
|
|
3.59
|
|
3.84
|
|
||
|
Long-term return on plan assets:
|
||||||||
|
Pension plans
|
8.20
|
|
8.20
|
|
8.45
|
|
||
|
Other postretirement benefit plans
|
7.36
|
|
7.19
|
|
7.39
|
|
||
The Company estimates the expected rate of return on pension plan and other postretirement benefit plan assets using a financial model to project the expected return on each current investment portfolio. The analysis projects an expected rate of return on each of seven different asset classes in order to arrive at the expected return on the entire portfolio relying on each trust's target asset allocation and reasonable capital market assumptions. The financial model is based on four key inputs: anticipated returns by asset class (based in part on historical returns), each trust's target asset allocation, an anticipated inflation rate, and the projected impact of a periodic rebalancing of each trust's portfolio.
An additional assumption used in measuring the accumulated other postretirement benefit obligations (APBO) was a weighted average medical care cost trend rate of
7.00%
for 2014, decreasing gradually to
5.00%
through the year
2021
and remaining at that level thereafter. An annual increase or decrease in the assumed medical care cost trend rate of
1%
would affect the APBO and the service and interest cost components at
December 31, 2013
as follows:
|
1 Percent
Increase
|
1 Percent
Decrease
|
||||||
|
(in millions)
|
|||||||
|
Benefit obligation
|
$
|
26
|
|
$
|
(22
|
)
|
|
|
Service and interest costs
|
1
|
|
(1
|
)
|
|||
II-161
NOTES (continued)
Alabama Power Company 2013 Annual Report
Pension Plans
The total accumulated benefit obligation for the pension plans was
$1.9 billion
at
December 31, 2013
and
$2.0 billion
at
December 31, 2012
. Changes in the projected benefit obligations and the fair value of plan assets during the plan years ended
December 31, 2013
and
2012
were as follows:
|
2013
|
2012
|
||||||
|
(in millions)
|
|||||||
|
Change in benefit obligation
|
|||||||
|
Benefit obligation at beginning of year
|
$
|
2,218
|
|
$
|
1,932
|
|
|
|
Service cost
|
52
|
|
44
|
|
|||
|
Interest cost
|
93
|
|
94
|
|
|||
|
Benefits paid
|
(93
|
)
|
(90
|
)
|
|||
|
Actuarial (gain) loss
|
(158
|
)
|
238
|
|
|||
|
Balance at end of year
|
2,112
|
|
2,218
|
|
|||
|
Change in plan assets
|
|||||||
|
Fair value of plan assets at beginning of year
|
2,077
|
|
1,885
|
|
|||
|
Actual return on plan assets
|
285
|
|
274
|
|
|||
|
Employer contributions
|
9
|
|
8
|
|
|||
|
Benefits paid
|
(93
|
)
|
(90
|
)
|
|||
|
Fair value of plan assets at end of year
|
2,278
|
|
2,077
|
|
|||
|
Prepaid pension costs (accrued liability)
|
$
|
166
|
|
$
|
(141
|
)
|
|
At
December 31, 2013
, the projected benefit obligations for the qualified and non-qualified pension plans were
$2.0 billion
and
$110 million
, respectively. All pension plan assets are related to the qualified pension plan.
Amounts recognized in the balance sheets at
December 31, 2013
and
2012
related to the Company's pension plans consist of the following:
|
2013
|
2012
|
||||||
|
(in millions)
|
|||||||
|
Prepaid pension costs
|
$
|
276
|
|
$
|
—
|
|
|
|
Other regulatory assets, deferred
|
476
|
|
822
|
|
|||
|
Other current liabilities
|
(9
|
)
|
(8
|
)
|
|||
|
Employee benefit obligations
|
(101
|
)
|
(133
|
)
|
|||
Presented below are the amounts included in regulatory assets at
December 31, 2013
and
2012
related to the defined benefit pension plans that had not yet been recognized in net periodic pension cost along with the estimated amortization of such amounts for
2014
.
|
2013
|
2012
|
Estimated
Amortization
in 2014
|
|||||||||
|
(in millions)
|
|||||||||||
|
Prior service cost
|
$
|
19
|
|
$
|
26
|
|
$
|
7
|
|
||
|
Net (gain) loss
|
457
|
|
796
|
|
31
|
|
|||||
|
Regulatory assets
|
$
|
476
|
|
$
|
822
|
|
|||||
II-162
NOTES (continued)
Alabama Power Company 2013 Annual Report
The changes in the balance of regulatory assets related to the defined benefit pension plans for the years ended
December 31, 2013
and
2012
are presented in the following table:
|
|
2013
|
2012
|
||||
|
|
(in millions)
|
|||||
|
Regulatory assets:
|
|
|
|
|
||
|
Beginning balance
|
$
|
822
|
|
$
|
727
|
|
|
Net (gain) loss
|
(287
|
)
|
125
|
|
||
|
Reclassification adjustments:
|
|
|
||||
|
Amortization of prior service costs
|
(7
|
)
|
(7
|
)
|
||
|
Amortization of net gain (loss)
|
(52
|
)
|
(23
|
)
|
||
|
Total reclassification adjustments
|
(59
|
)
|
(30
|
)
|
||
|
Total change
|
(346
|
)
|
95
|
|
||
|
Ending balance
|
$
|
476
|
|
$
|
822
|
|
Components of net periodic pension cost (income) were as follows:
|
2013
|
2012
|
2011
|
|||||||||
|
(in millions)
|
|||||||||||
|
Service cost
|
$
|
52
|
|
$
|
44
|
|
$
|
43
|
|
||
|
Interest cost
|
93
|
|
94
|
|
96
|
|
|||||
|
Expected return on plan assets
|
(157
|
)
|
(162
|
)
|
(173
|
)
|
|||||
|
Recognized net (gain) loss
|
52
|
|
23
|
|
4
|
|
|||||
|
Net amortization
|
7
|
|
7
|
|
9
|
|
|||||
|
Net periodic pension cost (income)
|
$
|
47
|
|
$
|
6
|
|
$
|
(21
|
)
|
||
Net periodic pension cost (income) is the sum of service cost, interest cost, and other costs netted against the expected return on plan assets. The expected return on plan assets is determined by multiplying the expected rate of return on plan assets and the market-related value of plan assets. In determining the market-related value of plan assets, the Company has elected to amortize changes in the market value of all plan assets over
five years
rather than recognize the changes immediately. As a result, the accounting value of plan assets that is used to calculate the expected return on plan assets differs from the current fair value of the plan assets.
Future benefit payments reflect expected future service and are estimated based on assumptions used to measure the projected benefit obligation for the pension plans. At
December 31, 2013
, estimated benefit payments were as follows:
|
Benefit Payments
|
|||
|
(in millions)
|
|||
|
2014
|
$
|
104
|
|
|
2015
|
108
|
|
|
|
2016
|
113
|
|
|
|
2017
|
118
|
|
|
|
2018
|
122
|
|
|
|
2019 to 2023
|
669
|
|
|
II-163
NOTES (continued)
Alabama Power Company 2013 Annual Report
Other Postretirement Benefits
Changes in the APBO and in the fair value of plan assets during the plan years ended
December 31, 2013
and
2012
were as follows:
|
2013
|
2012
|
||||||
|
(in millions)
|
|||||||
|
Change in benefit obligation
|
|||||||
|
Benefit obligation at beginning of year
|
$
|
490
|
|
$
|
470
|
|
|
|
Service cost
|
6
|
|
5
|
|
|||
|
Interest cost
|
19
|
|
22
|
|
|||
|
Benefits paid
|
(24
|
)
|
(24
|
)
|
|||
|
Actuarial (gain) loss
|
(62
|
)
|
15
|
|
|||
|
Retiree drug subsidy
|
2
|
|
2
|
|
|||
|
Balance at end of year
|
431
|
|
490
|
|
|||
|
Change in plan assets
|
|||||||
|
Fair value of plan assets at beginning of year
|
343
|
|
315
|
|
|||
|
Actual return on plan assets
|
61
|
|
39
|
|
|||
|
Employer contributions
|
7
|
|
11
|
|
|||
|
Benefits paid
|
(22
|
)
|
(22
|
)
|
|||
|
Fair value of plan assets at end of year
|
389
|
|
343
|
|
|||
|
Accrued liability
|
$
|
(42
|
)
|
$
|
(147
|
)
|
|
Amounts recognized in the balance sheets at
December 31, 2013
and
2012
related to the Company's other postretirement benefit plans consist of the following:
|
2013
|
2012
|
||||||
|
(in millions)
|
|||||||
|
Other regulatory assets, deferred
|
$
|
6
|
|
$
|
89
|
|
|
|
Other regulatory liabilities, deferred
|
(21
|
)
|
—
|
|
|||
|
Employee benefit obligations
|
(42
|
)
|
(147
|
)
|
|||
II-164
NOTES (continued)
Alabama Power Company 2013 Annual Report
Presented below are the amounts included in net regulatory assets (liabilities) at
December 31, 2013
and
2012
related to the other postretirement benefit plans that had not yet been recognized in net periodic other postretirement benefit cost along with the estimated amortization of such amounts for 2014.
|
2013
|
2012
|
Estimated
Amortization
in 2014
|
|||||||||
|
(in millions)
|
|||||||||||
|
Prior service cost
|
$
|
19
|
|
$
|
22
|
|
$
|
4
|
|
||
|
Net (gain) loss
|
(34
|
)
|
67
|
|
—
|
|
|||||
|
Net regulatory assets (liabilities)
|
$
|
(15
|
)
|
$
|
89
|
|
|||||
The changes in the balance of net regulatory assets (liabilities) related to the other postretirement benefit plans for the plan years ended
December 31, 2013
and
2012
are presented in the following table:
|
|
2013
|
2012
|
||||
|
|
(in millions)
|
|||||
|
Net regulatory assets (liabilities):
|
|
|
|
|||
|
Beginning balance
|
$
|
89
|
|
$
|
96
|
|
|
Net gain
|
(99
|
)
|
(1
|
)
|
||
|
Reclassification adjustments:
|
|
|
||||
|
Amortization of transition obligation
|
—
|
|
(2
|
)
|
||
|
Amortization of prior service costs
|
(3
|
)
|
(4
|
)
|
||
|
Amortization of net gain (loss)
|
(2
|
)
|
—
|
|
||
|
Total reclassification adjustments
|
(5
|
)
|
(6
|
)
|
||
|
Total change
|
(104
|
)
|
(7
|
)
|
||
|
Ending balance
|
$
|
(15
|
)
|
$
|
89
|
|
Components of the other postretirement benefit plans' net periodic cost were as follows:
|
2013
|
2012
|
2011
|
|||||||||
|
(in millions)
|
|||||||||||
|
Service cost
|
$
|
6
|
|
$
|
5
|
|
$
|
5
|
|
||
|
Interest cost
|
19
|
|
22
|
|
24
|
|
|||||
|
Expected return on plan assets
|
(23
|
)
|
(23
|
)
|
(25
|
)
|
|||||
|
Net amortization
|
5
|
|
6
|
|
7
|
|
|||||
|
Net periodic postretirement benefit cost
|
$
|
7
|
|
$
|
10
|
|
$
|
11
|
|
||
Future benefit payments, including prescription drug benefits, reflect expected future service and are estimated based on assumptions used to measure the APBO for the other postretirement benefit plans. Estimated benefit payments are reduced by drug subsidy receipts expected as a result of the Medicare Prescription Drug, Improvement, and Modernization Act of 2003 as follows:
|
Benefit Payments
|
Subsidy Receipts
|
Total
|
|||||||||
|
(in millions)
|
|||||||||||
|
2014
|
$
|
30
|
|
$
|
(3
|
)
|
$
|
27
|
|
||
|
2015
|
31
|
|
(3
|
)
|
28
|
|
|||||
|
2016
|
31
|
|
(3
|
)
|
28
|
|
|||||
|
2017
|
33
|
|
(4
|
)
|
29
|
|
|||||
|
2018
|
33
|
|
(4
|
)
|
29
|
|
|||||
|
2019 to 2023
|
164
|
|
(22
|
)
|
142
|
|
|||||
II-165
NOTES (continued)
Alabama Power Company 2013 Annual Report
Benefit Plan Assets
Pension plan and other postretirement benefit plan assets are managed and invested in accordance with all applicable requirements, including ERISA and the Internal Revenue Code of 1986, as amended (Internal Revenue Code). The Company's investment policies for both the pension plan and the other postretirement benefit plans cover a diversified mix of assets, including equity and fixed income securities, real estate, and private equity. Derivative instruments are used primarily to gain efficient exposure to the various asset classes and as hedging tools. The Company minimizes the risk of large losses primarily through diversification but also monitors and manages other aspects of risk.
The composition of the Company's pension plan and other postretirement benefit plan assets as of
December 31, 2013
and
2012
, along with the targeted mix of assets for each plan, is presented below:
|
Target
|
2013
|
2012
|
||||||
|
Pension plan assets:
|
||||||||
|
Domestic equity
|
26
|
%
|
31
|
%
|
28
|
%
|
||
|
International equity
|
25
|
|
25
|
|
24
|
|
||
|
Fixed income
|
23
|
|
23
|
|
27
|
|
||
|
Special situations
|
3
|
|
1
|
|
1
|
|
||
|
Real estate investments
|
14
|
|
14
|
|
13
|
|
||
|
Private equity
|
9
|
|
6
|
|
7
|
|
||
|
Total
|
100
|
%
|
100
|
%
|
100
|
%
|
||
|
Other postretirement benefit plan assets:
|
||||||||
|
Domestic equity
|
44
|
%
|
47
|
%
|
46
|
%
|
||
|
International equity
|
20
|
|
20
|
|
20
|
|
||
|
Domestic fixed income
|
24
|
|
27
|
|
28
|
|
||
|
Special situations
|
1
|
|
—
|
|
—
|
|
||
|
Real estate investments
|
8
|
|
4
|
|
4
|
|
||
|
Private equity
|
3
|
|
2
|
|
2
|
|
||
|
Total
|
100
|
%
|
100
|
%
|
100
|
%
|
||
The investment strategy for plan assets related to the Company's qualified pension plan is to be broadly diversified across major asset classes. The asset allocation is established after consideration of various factors that affect the assets and liabilities of the pension plan including, but not limited to, historical and expected returns and interest rates, volatility, correlations of asset classes, the current level of assets and liabilities, and the assumed growth in assets and liabilities. Because a significant portion of the liability of the pension plan is long-term in nature, the assets are invested consistent with long-term investment expectations for return and risk. To manage the actual asset class exposures relative to the target asset allocation, the Company employs a formal rebalancing program. As additional risk management, external investment managers and service providers are subject to written guidelines to ensure appropriate and prudent investment practices.
Investment Strategies
Detailed below is a description of the investment strategies for each major asset category for the pension and other postretirement benefit plans disclosed above:
|
•
|
Domestic equity.
A mix of large and small capitalization stocks with generally an equal distribution of value and growth attributes, managed both actively and through passive index approaches.
|
|
•
|
International equity.
A mix of growth stocks and value stocks with both developed and emerging market exposure, managed both actively and through passive index approaches.
|
|
•
|
Fixed income.
A mix of domestic and international bonds.
|
|
•
|
Trust-owned life insurance (TOLI).
Investments of the Company's taxable trusts aimed at minimizing the impact of taxes on the portfolio.
|
|
•
|
Special situations.
Investments in opportunistic strategies with the objective of diversifying and enhancing returns and exploiting short-term inefficiencies as well as investments in promising new strategies of a longer-term nature.
|
II-166
NOTES (continued)
Alabama Power Company 2013 Annual Report
|
•
|
Real estate investments.
Investments in traditional private market, equity-oriented investments in real properties (indirectly through pooled funds or partnerships) and in publicly traded real estate securities.
|
|
•
|
Private equity.
Investments in private partnerships that invest in private or public securities typically through privately-negotiated and/or structured transactions, including leveraged buyouts, venture capital, and distressed debt.
|
Benefit Plan Asset Fair Values
Following are the fair value measurements for the pension plan and the other postretirement benefit plan assets as of
December 31, 2013
and
2012
. The fair values presented are prepared in accordance with GAAP. For purposes of determining the fair value of the pension plan and other postretirement benefit plan assets and the appropriate level designation, management relies on information provided by the plan's trustee. This information is reviewed and evaluated by management with changes made to the trustee information as appropriate.
Valuation methods of the primary fair value measurements disclosed in the following tables are as follows:
|
•
|
Domestic and international equity.
Investments in equity securities such as common stocks, American depositary receipts, and real estate investment trusts that trade on a public exchange are classified as Level 1 investments and are valued at the closing price in the active market. Equity investments with unpublished prices (i.e. pooled funds) are valued as Level 2, when the underlying holdings used to value the investment are comprised of Level 1 or Level 2 equity securities.
|
|
•
|
Fixed income.
Investments in fixed income securities are generally classified as Level 2 investments and are valued based on prices reported in the market place. Additionally, the value of fixed income securities takes into consideration certain items such as broker quotes, spreads, yield curves, interest rates, and discount rates that apply to the term of a specific instrument.
|
|
•
|
TOLI.
Investments in TOLI policies are classified as Level 2 investments and are valued based on the underlying investments held in the policy's separate account. The underlying assets are equity and fixed income pooled funds that are comprised of Level 1 and Level 2 securities.
|
|
•
|
Real estate investments and private equity.
Investments in private equity and real estate are generally classified as Level 3 as the underlying assets typically do not have observable inputs. The fund manager values the assets using various inputs and techniques depending on the nature of the underlying investments. In the case of private equity, techniques may include purchase multiples for comparable transactions, comparable public company trading multiples, and discounted cash flow analysis. Real estate managers generally use prevailing market capitalization rates, recent sales of comparable investments, and independent third-party appraisals to value underlying real estate investments. The fair value of partnerships is determined by aggregating the value of the underlying assets.
|
II-167
NOTES (continued)
Alabama Power Company 2013 Annual Report
The fair values of pension plan assets as of
December 31, 2013
and
2012
are presented below. These fair value measurements exclude cash, receivables related to investment income, pending investments sales, and payables related to pending investment purchases. Assets that are considered special situations investments, primarily real estate investments and private equities, are presented in the tables below based on the nature of the investment.
|
Fair Value Measurements Using
|
|||||||||||||||
|
Quoted Prices in Active Markets for Identical Assets
|
Significant Other Observable Inputs
|
Significant Unobservable Inputs
|
|||||||||||||
|
As of December 31, 2013:
|
(Level 1)
|
(Level 2)
|
(Level 3)
|
Total
|
|||||||||||
|
(in millions)
|
|||||||||||||||
|
Assets:
|
|||||||||||||||
|
Domestic equity*
|
$
|
374
|
|
$
|
219
|
|
$
|
—
|
|
$
|
593
|
|
|||
|
International equity*
|
287
|
|
265
|
|
—
|
|
552
|
|
|||||||
|
Fixed income:
|
|||||||||||||||
|
U.S. Treasury, government, and agency bonds
|
—
|
|
156
|
|
—
|
|
156
|
|
|||||||
|
Mortgage- and asset-backed securities
|
—
|
|
41
|
|
—
|
|
41
|
|
|||||||
|
Corporate bonds
|
—
|
|
255
|
|
—
|
|
255
|
|
|||||||
|
Pooled funds
|
—
|
|
123
|
|
—
|
|
123
|
|
|||||||
|
Cash equivalents and other
|
—
|
|
58
|
|
—
|
|
58
|
|
|||||||
|
Real estate investments
|
68
|
|
—
|
|
261
|
|
329
|
|
|||||||
|
Private equity
|
—
|
|
—
|
|
149
|
|
149
|
|
|||||||
|
Total
|
$
|
729
|
|
$
|
1,117
|
|
$
|
410
|
|
$
|
2,256
|
|
|||
|
Liabilities:
|
|||||||||||||||
|
Derivatives
|
—
|
|
(1
|
)
|
—
|
|
(1
|
)
|
|||||||
|
Total
|
$
|
729
|
|
$
|
1,116
|
|
$
|
410
|
|
$
|
2,255
|
|
|||
|
*
|
Level 1 securities consist of actively traded stocks while Level 2 securities consist of pooled funds. Management believes that the portfolio is well-diversified with no significant concentrations of risk.
|
II-168
NOTES (continued)
Alabama Power Company 2013 Annual Report
|
Fair Value Measurements Using
|
|||||||||||||||
|
Quoted Prices in Active Markets for Identical Assets
|
Significant Other Observable Inputs
|
Significant Unobservable Inputs
|
|||||||||||||
|
As of December 31, 2012:
|
(Level 1)
|
(Level 2)
|
(Level 3)
|
Total
|
|||||||||||
|
(in millions)
|
|||||||||||||||
|
Assets:
|
|||||||||||||||
|
Domestic equity*
|
$
|
304
|
|
$
|
175
|
|
$
|
—
|
|
$
|
479
|
|
|||
|
International equity*
|
238
|
|
256
|
|
—
|
|
494
|
|
|||||||
|
Fixed income:
|
|||||||||||||||
|
U.S. Treasury, government, and agency bonds
|
—
|
|
135
|
|
—
|
|
135
|
|
|||||||
|
Mortgage- and asset-backed securities
|
—
|
|
33
|
|
—
|
|
33
|
|
|||||||
|
Corporate bonds
|
—
|
|
230
|
|
1
|
|
231
|
|
|||||||
|
Pooled funds
|
—
|
|
104
|
|
—
|
|
104
|
|
|||||||
|
Cash equivalents and other
|
1
|
|
143
|
|
—
|
|
144
|
|
|||||||
|
Real estate investments
|
67
|
|
—
|
|
220
|
|
287
|
|
|||||||
|
Private equity
|
—
|
|
—
|
|
155
|
|
155
|
|
|||||||
|
Total
|
$
|
610
|
|
$
|
1,076
|
|
$
|
376
|
|
$
|
2,062
|
|
|||
|
*
|
Level 1 securities consist of actively traded stocks while Level 2 securities consist of pooled funds. Management believes that the portfolio is well-diversified with no significant concentrations of risk.
|
Changes in the fair value measurement of the Level 3 items in the pension plan assets valued using significant unobservable inputs for the years ended
December 31, 2013
and
2012
were as follows:
|
2013
|
2012
|
||||||||||||||
|
Real Estate Investments
|
Private Equity
|
Real Estate Investments
|
Private Equity
|
||||||||||||
|
(in millions)
|
|||||||||||||||
|
Beginning balance
|
$
|
220
|
|
$
|
155
|
|
$
|
217
|
|
$
|
161
|
|
|||
|
Actual return on investments:
|
|||||||||||||||
|
Related to investments held at year end
|
19
|
|
2
|
|
2
|
|
—
|
|
|||||||
|
Related to investments sold during the year
|
8
|
|
13
|
|
1
|
|
2
|
|
|||||||
|
Total return on investments
|
27
|
|
15
|
|
3
|
|
2
|
|
|||||||
|
Purchases, sales, and settlements
|
14
|
|
(21
|
)
|
—
|
|
(8
|
)
|
|||||||
|
Ending balance
|
$
|
261
|
|
$
|
149
|
|
$
|
220
|
|
$
|
155
|
|
|||
The fair values of other postretirement benefit plan assets as of
December 31, 2013
and
2012
are presented below. These fair value measurements exclude cash, receivables related to investment income, pending investments sales, and payables related to pending investment purchases. Assets that are considered special situations investments, primarily real estate investments and private equities, are presented in the tables below based on the nature of the investment.
II-169
NOTES (continued)
Alabama Power Company 2013 Annual Report
|
Fair Value Measurements Using
|
|||||||||||||||
|
Quoted Prices in Active Markets for Identical Assets
|
Significant Other Observable Inputs
|
Significant Unobservable Inputs
|
|||||||||||||
|
As of December 31, 2013:
|
(Level 1)
|
(Level 2)
|
(Level 3)
|
Total
|
|||||||||||
|
(in millions)
|
|||||||||||||||
|
Assets:
|
|||||||||||||||
|
Domestic equity*
|
$
|
67
|
|
$
|
11
|
|
$
|
—
|
|
$
|
78
|
|
|||
|
International equity*
|
14
|
|
13
|
|
—
|
|
27
|
|
|||||||
|
Fixed income:
|
|||||||||||||||
|
U.S. Treasury, government, and agency bonds
|
—
|
|
17
|
|
—
|
|
17
|
|
|||||||
|
Mortgage- and asset-backed securities
|
—
|
|
2
|
|
—
|
|
2
|
|
|||||||
|
Corporate bonds
|
—
|
|
12
|
|
—
|
|
12
|
|
|||||||
|
Pooled funds
|
—
|
|
6
|
|
—
|
|
6
|
|
|||||||
|
Cash equivalents and other
|
—
|
|
10
|
|
—
|
|
10
|
|
|||||||
|
Trust-owned life insurance
|
—
|
|
211
|
|
—
|
|
211
|
|
|||||||
|
Real estate investments
|
4
|
|
—
|
|
13
|
|
17
|
|
|||||||
|
Private equity
|
—
|
|
—
|
|
7
|
|
7
|
|
|||||||
|
Total
|
$
|
85
|
|
$
|
282
|
|
$
|
20
|
|
$
|
387
|
|
|||
|
*
|
Level 1 securities consist of actively traded stocks while Level 2 securities consist of pooled funds. Management believes that the portfolio is well-diversified with no significant concentrations of risk.
|
|
Fair Value Measurements Using
|
|||||||||||||||
|
Quoted Prices in Active Markets for Identical Assets
|
Significant Other Observable Inputs
|
Significant Unobservable Inputs
|
|||||||||||||
|
As of December 31, 2012:
|
(Level 1)
|
(Level 2)
|
(Level 3)
|
Total
|
|||||||||||
|
(in millions)
|
|||||||||||||||
|
Assets:
|
|||||||||||||||
|
Domestic equity*
|
$
|
62
|
|
$
|
9
|
|
$
|
—
|
|
$
|
71
|
|
|||
|
International equity*
|
12
|
|
13
|
|
—
|
|
25
|
|
|||||||
|
Fixed income:
|
|||||||||||||||
|
U.S. Treasury, government, and agency bonds
|
—
|
|
7
|
|
—
|
|
7
|
|
|||||||
|
Mortgage- and asset-backed securities
|
—
|
|
2
|
|
—
|
|
2
|
|
|||||||
|
Corporate bonds
|
—
|
|
11
|
|
—
|
|
11
|
|
|||||||
|
Pooled funds
|
—
|
|
5
|
|
—
|
|
5
|
|
|||||||
|
Cash equivalents and other
|
—
|
|
19
|
|
—
|
|
19
|
|
|||||||
|
Trust-owned life insurance
|
—
|
|
178
|
|
—
|
|
178
|
|
|||||||
|
Real estate investments
|
4
|
|
—
|
|
11
|
|
15
|
|
|||||||
|
Private equity
|
—
|
|
—
|
|
8
|
|
8
|
|
|||||||
|
Total
|
$
|
78
|
|
$
|
244
|
|
$
|
19
|
|
$
|
341
|
|
|||
|
*
|
Level 1 securities consist of actively traded stocks while Level 2 securities consist of pooled funds. Management believes that the portfolio is well-diversified with no significant concentrations of risk.
|
II-170
NOTES (continued)
Alabama Power Company 2013 Annual Report
Changes in the fair value measurement of the Level 3 items in the other postretirement benefit plan assets valued using significant unobservable inputs for the years ended
December 31, 2013
and
2012
were as follows:
|
2013
|
2012
|
||||||||||||||
|
Real Estate Investments
|
Private Equity
|
Real Estate Investments
|
Private Equity
|
||||||||||||
|
(in millions)
|
|||||||||||||||
|
Beginning balance
|
$
|
11
|
|
$
|
8
|
|
$
|
11
|
|
$
|
8
|
|
|||
|
Actual return on investments:
|
|||||||||||||||
|
Related to investments held at year end
|
1
|
|
—
|
|
—
|
|
—
|
|
|||||||
|
Related to investments sold during the year
|
—
|
|
—
|
|
—
|
|
—
|
|
|||||||
|
Total return on investments
|
1
|
|
—
|
|
—
|
|
—
|
|
|||||||
|
Purchases, sales, and settlements
|
1
|
|
(1
|
)
|
—
|
|
—
|
|
|||||||
|
Ending balance
|
$
|
13
|
|
$
|
7
|
|
$
|
11
|
|
$
|
8
|
|
|||
Employee Savings Plan
The Company also sponsors a 401(k) defined contribution plan covering substantially all employees. The Company provides an
85%
matching contribution on up to
6%
of an employee's base salary. Total matching contributions made to the plan for
2013
,
2012
, and
2011
were
$20 million
,
$19 million
, and
$18 million
, respectively.
3. CONTINGENCIES AND REGULATORY MATTERS
General Litigation Matters
The Company is subject to certain claims and legal actions arising in the ordinary course of business. In addition, the Company's business activities are subject to extensive governmental regulation related to public health and the environment, such as regulation of air emissions and water discharges. Litigation over environmental issues and claims of various types, including property damage, personal injury, common law nuisance, and citizen enforcement of environmental requirements such as air quality and water standards, has increased generally throughout the U.S. In particular, personal injury, property damage, and other claims for damages alleged to have been caused by carbon dioxide and other emissions, coal combustion residuals, and alleged exposure to hazardous materials, and/or requests for injunctive relief in connection with such matters, have become more frequent. The ultimate outcome of such pending or potential litigation against the Company cannot be predicted at this time; however, for current proceedings not specifically reported herein, management does not anticipate that the ultimate liabilities, if any, arising from such current proceedings would have a material effect on the Company's financial statements.
Environmental Matters
New Source Review Actions
As part of a nationwide enforcement initiative against the electric utility industry which began in 1999, the EPA brought civil enforcement actions in federal district court against the Company alleging violations of the New Source Review (NSR) provisions of the Clean Air Act at certain coal-fired electric generating units, including a unit co-owned by Mississippi Power. These civil actions seek penalties and injunctive relief, including orders requiring installation of the best available control technologies at the affected units. The case against the Company (including claims involving a unit co-owned by Mississippi Power) has been actively litigated in the U.S. District Court for the Northern District of Alabama, resulting in a settlement in 2006 of the alleged NSR violations at Plant Miller; voluntary dismissal of certain claims by the EPA; and a grant of summary judgment for the Company on all remaining claims and dismissal of the case with prejudice in 2011. On September 19, 2013, the U.S. Court of Appeals for the Eleventh Circuit affirmed in part and reversed in part the 2011 judgment in favor of the Company, and the case has been transferred back to the U.S. District Court for the Northern District of Alabama for further proceedings.
The Company believes it complied with applicable laws and regulations in effect at the time the work in question took place. The Clean Air Act authorizes maximum civil penalties of
$25,000
to
$37,500
per day, per violation, depending on the date of the alleged violation. An adverse outcome could require substantial capital expenditures that cannot be determined at this time and could possibly require payment of substantial penalties. Such expenditures could affect future results of operations, cash flows, and financial condition if such costs are not recovered through regulated rates. The ultimate outcome of this matter cannot be determined at this time.
II-171
NOTES (continued)
Alabama Power Company 2013 Annual Report
Environmental Remediation
The Company must comply with environmental laws and regulations that cover the handling and disposal of waste and releases of hazardous substances. Under these various laws and regulations, the Company could incur substantial costs to clean up properties. The Company conducts studies to determine the extent of any required cleanup and has recognized in its financial statements the costs to clean up known sites. Amounts for cleanup and ongoing monitoring costs were not material for any year presented. The Company may be liable for some or all required cleanup costs for additional sites that may require environmental remediation.
Nuclear Fuel Disposal Costs
Acting through the U.S. Department of Energy (DOE) and pursuant to the Nuclear Waste Policy Act of 1982, the U.S. government entered into a contract with the Company that requires the DOE to dispose of spent nuclear fuel and high level radioactive waste generated at Plant Farley. The DOE failed to timely perform and has yet to commence the performance of its contractual and statutory obligation to dispose of spent nuclear fuel beginning no later than January 31, 1998. Consequently, the Company has pursued and continues to pursue legal remedies against the U.S. government for its partial breach of contract.
As a result of the first lawsuit, the Company recovered approximately
$17 million
, representing the vast majority of the Company's direct costs of the expansion of spent nuclear fuel storage facilities at Plant Farley from 1998 through 2004. In April 2012, the award was credited to cost of service for the benefit of customers.
In 2008, the Company filed a second lawsuit against the U.S. government for the costs of continuing to store spent nuclear fuel at Plant Farley. Damages are being sought for the period from January 1, 2005 through December 31, 2010. Damages will continue to accumulate until the issue is resolved or storage is provided. No amounts have been recognized in the financial statements as of
December 31, 2013
for any potential recoveries from the second lawsuit. The final outcome of this matter cannot be determined at this time; however, no material impact on the Company's net income is expected.
At Plant Farley, on-site dry spent fuel storage facilities are operational and can be expanded to accommodate spent fuel through the expected life of the plant.
Retail Regulatory Matters
Retail Rate Adjustments
In 2011, the Alabama PSC issued an order to eliminate a tax-related adjustment under the Company's rate structure effective with October 2011 billings. The elimination of this adjustment resulted in additional revenues of approximately
$31 million
for 2011. In accordance with the order, the Company made additional accruals to the NDR in the fourth quarter 2011 of an amount equal to such additional 2011 revenues. The NDR was impacted as a result of operations and maintenance expenses incurred in connection with the 2011 storms in Alabama. See "Natural Disaster Reserve" below for additional information. The elimination of this adjustment resulted in additional revenues of approximately
$106 million
for 2012.
Rate RSE
Rate stabilization and equalization plan (Rate RSE) adjustments are based on forward-looking information for the applicable upcoming calendar year. Rate adjustments for any
two
-year period, when averaged together, cannot exceed
4.0%
and any annual adjustment is limited to
5.0%
. If the Company's actual retail return is above the allowed equity return range, customer refunds will be required; however, there is no provision for additional customer billings should the actual retail return fall below the allowed equity return range. Prior to 2014, retail rates remained unchanged when the retail return on common equity (ROE) was projected to be between
13.0%
and
14.5%
.
During 2013, the Alabama PSC held public proceedings regarding the operation and utilization of Rate RSE. On August 13, 2013, the Alabama PSC voted to issue a report on Rate RSE that found that the Company's Rate RSE mechanism continues to be just and reasonable to customers and the Company, but recommended the Company modify Rate RSE as follows:
|
•
|
Eliminate the provision of Rate RSE establishing an allowed range of ROE.
|
|
•
|
Eliminate the provision of Rate RSE limiting the Company's capital structure to an allowed equity ratio of
45%
.
|
|
•
|
Replace these
two
provisions with a provision that establishes rates based upon an allowed weighted cost of equity (WCE) range of
5.75%
to
6.21%
, with an adjusting point of
5.98%
. If calculated under the previous Rate RSE provisions, the resulting WCE would range from
5.85%
to
6.53%
, with an adjusting point of
6.19%
.
|
II-172
NOTES (continued)
Alabama Power Company 2013 Annual Report
|
•
|
Provide eligibility for a performance-based adder of seven basis points, or
0.07%
, to the WCE adjusting point if the Company (i) has an "A" credit rating equivalent with at least one of the recognized rating agencies or (ii) is in the top one-third of a designated customer value benchmark survey.
|
Substantially all other provisions of Rate RSE were unchanged.
On August 21, 2013, the Company filed its consent to these recommendations with the Alabama PSC. The changes became effective for calendar year 2014. On November 27, 2013, the Company made its Rate RSE submission to the Alabama PSC of projected data for calendar year 2014; projected earnings were within the specified WCE range and, therefore, retail rates under Rate RSE remained unchanged for 2014. In 2012 and 2013, retail rates under Rate RSE remained unchanged from 2011. Under the terms of Rate RSE, the maximum possible increase for 2015 is
5.00%
.
Rate CNP
The Company's retail rates, approved by the Alabama PSC, provide for adjustments to recognize the placing of new generating facilities into retail service under rate certificated new plant (Rate CNP). The Company may also recover retail costs associated with certificated PPAs under rate certificated new plant (Rate CNP PPA). There was no adjustment to Rate CNP PPA in 2012. On March 5, 2013, the Alabama PSC issued a consent order that the Company leave in effect the current Rate CNP PPA factor for billings for the period April 1, 2013 through March 31, 2014. It is anticipated that no adjustment will be made to Rate CNP PPA in 2014. As of
December 31, 2013
, the Company had an under recovered certificated PPA balance of
$18 million
, all of which is included in deferred under recovered regulatory clause revenues in the balance sheet.
In 2011, the Alabama PSC approved and certificated a PPA of approximately
200
megawatts (MWs) of energy from wind-powered generating facilities which became operational in December 2012. In September 2012, the Alabama PSC approved and certificated a second wind PPA of approximately
200
MWs which became operational in January 2014. The terms of the wind PPAs permit the Company to use the energy and retire the associated environmental attributes in service of its customers or to sell environmental attributes, separately or bundled with energy. The Company has elected the normal purchase normal sale (NPNS) scope exception under the derivative accounting rules for its
two
wind PPAs, which total approximately
400
MWs. The NPNS exception allows the PPAs to be recorded at a cost, rather than fair value, basis. The industry's application of the NPNS exception to certain physical forward transactions in nodal markets is currently under review by the SEC at the request of the electric utility industry. The outcome of the SEC's review cannot now be determined. If the Company is ultimately required to record these PPAs at fair value, an offsetting regulatory asset or regulatory liability will be recorded.
Rate certificated new plant environmental (Rate CNP Environmental) also allows for the recovery of the Company's retail costs associated with environmental laws, regulations, or other such mandates. Rate CNP Environmental is based on forward-looking information and provides for the recovery of these costs pursuant to a factor that is calculated annually. Environmental costs to be recovered include operations and maintenance expenses, depreciation, and a return on certain invested capital. There was no adjustment to Rate CNP Environmental in 2012 or 2013. On August 13, 2013, the Alabama PSC approved the Company's petition requesting a revision to Rate CNP Environmental that allows recovery of costs related to pre-2005 environmental assets previously being recovered through Rate RSE. The revenue impact as a result of this revision is estimated to be
$58 million
in 2014. On November 21, 2013, the Company submitted calculations associated with its cost of complying with environmental mandates, as provided under Rate CNP Environmental. The filing reflected a projected unrecovered retail revenue requirement for environmental compliance of approximately
$72 million
, which is to be recovered in the billing months of January 2014 through December 2014. On December 3, 2013, the Alabama PSC issued a consent order that the Company leave in effect for 2014 the factors associated with the Company's environmental compliance costs for the year 2013. Any unrecovered amounts associated with 2014 will be reflected in the 2015 filing. As of
December 31, 2013
, the Company had an under recovered environmental clause balance of
$7 million
which is included in deferred under recovered regulatory clause revenues in the balance sheet.
Environmental Accounting Order
Based on an order from the Alabama PSC, the Company is allowed to establish a regulatory asset to record the unrecovered investment costs, including the unrecovered plant asset balance and the unrecovered costs associated with site removal and closure associated with future unit retirements caused by environmental regulations. These costs would be amortized over the affected unit's remaining useful life, as established prior to the decision regarding early retirement.
Compliance and Pension Cost Accounting Order
In November 2012, the Alabama PSC approved an accounting order to defer to a regulatory asset account certain compliance-related operations and maintenance expenditures for the years 2013 through 2017, as well as the incremental increase in
II-173
NOTES (continued)
Alabama Power Company 2013 Annual Report
operations expense related to pension cost for 2013. These deferred costs are to be amortized over a
three
-year period beginning in January 2015. The compliance related expenditures were related to (i) standards addressing Critical Infrastructure Protection issued by the North American Electric Reliability Corporation, (ii) cyber security requirements issued by the NRC, and (iii) NRC guidance addressing the readiness at nuclear facilities within the U.S. for severe events. The compliance-related expenses to be afforded regulatory asset treatment over the
five
-year period are currently estimated to be approximately
$37 million
. The amount of operations and maintenance expenses deferred to a regulatory asset in 2013 associated with compliance-related expenditures and pension cost was approximately
$8 million
and
$12 million
, respectively. Pursuant to the accounting order, the Company has the ability to accelerate the amortization of the regulatory assets with notification to the Alabama PSC.
Retail Energy Cost Recovery
The Company has established energy cost recovery rates under the Company's energy cost recovery rate (Rate ECR) as approved by the Alabama PSC. Rates are based on an estimate of future energy costs and the current over or under recovered balance. Revenues recognized under Rate ECR and recorded on the financial statements are adjusted for the difference in actual recoverable fuel costs and amounts billed in current regulated rates. The difference in the recoverable fuel costs and amounts billed give rise to the over or under recovered amounts recorded as regulatory assets or liabilities. The Company, along with the Alabama PSC, continually monitors the over or under recovered cost balance to determine whether an adjustment to billing rates is required. Changes in the Rate ECR factor have no significant effect on the Company's net income, but will impact operating cash flows. Currently, the Alabama PSC may approve billing rates under Rate ECR of up to
5.910
cents per kilowatt hour (KWH). On December 3, 2013, the Alabama PSC issued a consent order that the Company leave in effect the energy cost recovery rates which began in April 2011 for 2014. Therefore, the Rate ECR factor as of January 1, 2014 remained at
2.681
cents per KWH. Effective with billings beginning in January 2015, the Rate ECR factor will be
5.910
cents per KWH, absent a further order from the Alabama PSC.
The Company's over recovered fuel costs at
December 31, 2013
totaled
$42 million
as compared to under recovered fuel costs of
$4 million
at December 31, 2012. At December 31, 2013,
$27 million
is included in other regulatory liabilities, current and
$15 million
is included in deferred over recovered regulatory clause revenues. The under recovered fuel costs at December 31, 2012 are included in deferred under recovered regulatory clause revenues in the balance sheets. These classifications are based on estimates, which include such factors as weather, generation availability, energy demand, and the price of energy. A change in any of these factors could have a material impact on the timing of any recovery of the under recovered fuel costs.
Natural Disaster Reserve
Based on an order from the Alabama PSC, the Company maintains a reserve for operations and maintenance expenses to cover the cost of damages from major storms to its transmission and distribution facilities. The order approves a separate monthly Rate NDR charge to customers consisting of two components. The first component is intended to establish and maintain a reserve balance for future storms and is an on-going part of customer billing. The second component of the Rate NDR charge is intended to allow recovery of any existing deferred storm-related operations and maintenance costs and any future reserve deficits over a
24
-month period. The Alabama PSC order gives the Company authority to record a deficit balance in the NDR when costs of storm damage exceed any established reserve balance. Absent further Alabama PSC approval, the maximum total Rate NDR charge consisting of both components is
$10
per month per non-residential customer account and
$5
per month per residential customer account. The Company has the authority, based on an order from the Alabama PSC, to accrue certain additional amounts as circumstances warrant. The order allows for reliability-related expenditures to be charged against the additional accruals when the NDR balance exceeds
$75 million
. The Company may designate a portion of the NDR to reliability-related expenditures as a part of an annual budget process for the following year or during the current year for identified unbudgeted reliability-related expenditures that are incurred. Accruals that have not been designated can be used to offset storm charges. Additional accruals to the NDR will enhance the Company's ability to deal with the financial effects of future natural disasters, promote system reliability, and offset costs retail customers would otherwise bear.
As revenue from the Rate NDR charge is recognized, an equal amount of operations and maintenance expenses related to the NDR will also be recognized. As a result, the Rate NDR charge will not have an effect on net income but will impact operating cash flows.
In accordance with the order that was issued by the Alabama PSC in 2011 to eliminate a tax-related adjustment under the Company's rate structure that resulted in additional revenues, the Company made additional accruals to the NDR in the fourth quarter 2011 of an amount equal to the additional 2011 revenues, which were approximately
$31 million
.
The accumulated balances in the NDR for the years ended
December 31, 2013
and
December 31, 2012
were approximately
$96 million
and
$103 million
, respectively. Any accruals to the NDR are included in the balance sheets under other regulatory liabilities, deferred and are reflected as other operations and maintenance expenses in the statements of income.
II-174
NOTES (continued)
Alabama Power Company 2013 Annual Report
Nuclear Outage Accounting Order
In accordance with a 2010 Alabama PSC order, nuclear outage operations and maintenance expenses for the
two
units at Plant Farley are deferred to a regulatory asset when the charges actually occur and are then amortized over the subsequent
18
-month operational cycle.
Approximately
$31 million
of nuclear outage costs from the spring of 2012 was amortized to nuclear operations and maintenance expenses over the
18
-month period ended in December 2013. During the spring of 2013, approximately
$28 million
of nuclear outage costs was deferred to a regulatory asset, and beginning in July 2013, these deferred costs are being amortized over an
18
-month period. During the fall of 2013, approximately
$32 million
of nuclear outage costs associated with the second unit was deferred to a regulatory asset, and beginning in January 2014, these deferred costs are being amortized over an
18
-month period. The Company will continue the pattern of deferral of nuclear outage expenses as incurred and the recognition of expenses over a subsequent
18
-month period pursuant to the Alabama PSC order.
Non-Nuclear Outage Accounting Order
On August 13, 2013, the Alabama PSC approved the Company's petition requesting authorization to defer to a regulatory asset account certain operations and maintenance expenses associated with planned outages at non-nuclear generation facilities in 2014 and to amortize those expenses over a
three
-year period beginning in 2015. The 2014 outage expenditures to be deferred and amortized are estimated to total approximately
$78 million
.
4. JOINT OWNERSHIP AGREEMENTS
The Company and Georgia Power own equally all of the outstanding capital stock of SEGCO, which owns electric generating units with a total rated capacity of
1,020
MWs, as well as associated transmission facilities. The capacity of these units is sold equally to the Company and Georgia Power under a power contract. The Company and Georgia Power make payments sufficient to provide for the operating expenses, taxes, interest expense, and ROE. The Company's share of purchased power totaled
$88 million
in
2013
,
$109 million
in
2012
, and
$142 million
in
2011
and is included in "Purchased power from affiliates" in the statements of income. The Company accounts for SEGCO using the equity method.
In addition, the Company has guaranteed unconditionally the obligation of SEGCO under an installment sale agreement for the purchase of certain pollution control facilities at SEGCO's generating units, pursuant to which
$25 million
principal amount of pollution control revenue bonds are outstanding. The Company has guaranteed
$100 million
principal amount of unsecured senior notes issued by SEGCO for general corporate purposes. These senior notes mature on December 1, 2018. The Company had guaranteed
$50 million
principal amount of unsecured senior notes issued by SEGCO for general corporate purposes, which matured on May 15, 2013. Georgia Power has agreed to reimburse the Company for the pro rata portion of such obligations corresponding to its then proportionate ownership of stock of SEGCO if the Company is called upon to make such payment under its guarantee.
At
December 31, 2013
, the capitalization of SEGCO consisted of
$84 million
of equity and
$125 million
of long-term debt on which the annual interest requirement is
$3 million
. SEGCO paid dividends of
$7 million
in
2013
,
$14 million
in
2012
, and
$15 million
in
2011
, of which one-half of each was paid to the Company. In addition, the Company recognizes
50%
of SEGCO's net income.
SEGCO plans to add natural gas as the primary fuel source in
2015
for
1,000
MWs of its generating capacity. It is currently planning, developing, and constructing the necessary natural gas pipeline. The Company, which owns and operates a generating unit adjacent to the SEGCO generating units, has entered into a joint ownership agreement with SEGCO for the ownership of the gas pipeline. The Company will own
14%
of the pipeline with the remaining
86%
owned by SEGCO. At
December 31, 2013
, the Company's portion of the construction work in progress associated with the pipeline is
$1 million
.
II-175
NOTES (continued)
Alabama Power Company 2013 Annual Report
In addition to the Company's ownership of SEGCO and joint ownership of the natural gas pipeline, the Company's percentage ownership and investment in jointly-owned coal-fired generating plants at
December 31, 2013
were as follows:
|
Facility
|
Total Megawatt Capacity
|
Company Ownership
|
Plant in Service
|
Accumulated Depreciation
|
Construction Work in Progress
|
|||||||||||||
|
(in millions)
|
||||||||||||||||||
|
Greene County
|
500
|
|
60.00
|
%
|
(1)
|
$
|
157
|
|
$
|
91
|
|
$
|
5
|
|
||||
|
Plant Miller
|
||||||||||||||||||
|
Units 1 and 2
|
1,320
|
|
91.84
|
%
|
(2)
|
1,410
|
|
575
|
|
89
|
|
|||||||
|
(1)
|
Jointly owned with an affiliate, Mississippi Power.
|
|
(2)
|
Jointly owned with PowerSouth Energy Cooperative, Inc.
|
The Company has contracted to operate and maintain the jointly-owned facilities as agent for their co-owners. The Company's proportionate share of its plant operating expenses is included in operating expenses in the statements of income and the Company is responsible for providing its own financing.
5. INCOME TAXES
On behalf of the Company, Southern Company files a consolidated federal income tax return and combined state income tax returns for the States of Alabama, Georgia, and Mississippi. In addition, the Company files a separate company income tax return for the State of Tennessee. Under a joint consolidated income tax allocation agreement, each Southern Company subsidiary's current and deferred tax expense is computed on a stand-alone basis and no subsidiary is allocated more current expense than would be paid if it filed a separate income tax return. In accordance with IRS regulations, each company is jointly and severally liable for the federal tax liability.
Current and Deferred Income Taxes
Details of income tax provisions are as follows:
|
2013
|
2012
|
2011
|
|||||||||
|
(in millions)
|
|||||||||||
|
Federal —
|
|||||||||||
|
Current
|
$
|
243
|
|
$
|
262
|
|
$
|
20
|
|
||
|
Deferred
|
160
|
|
137
|
|
377
|
|
|||||
|
403
|
|
399
|
|
397
|
|
||||||
|
State —
|
|||||||||||
|
Current
|
36
|
|
51
|
|
(1
|
)
|
|||||
|
Deferred
|
39
|
|
27
|
|
82
|
|
|||||
|
75
|
|
78
|
|
81
|
|
||||||
|
Total
|
$
|
478
|
|
$
|
477
|
|
$
|
478
|
|
||
II-176
NOTES (continued)
Alabama Power Company 2013 Annual Report
The tax effects of temporary differences between the carrying amounts of assets and liabilities in the financial statements and their respective tax bases, which give rise to deferred tax assets and liabilities, are as follows:
|
2013
|
2012
|
||||||
|
(in millions)
|
|||||||
|
Deferred tax liabilities —
|
|||||||
|
Accelerated depreciation
|
$
|
3,187
|
|
$
|
2,989
|
|
|
|
Property basis differences
|
458
|
|
420
|
|
|||
|
Premium on reacquired debt
|
33
|
|
36
|
|
|||
|
Employee benefit obligations
|
209
|
|
218
|
|
|||
|
Under recovered energy clause
|
—
|
|
16
|
|
|||
|
Regulatory assets associated with employee benefit obligations
|
198
|
|
378
|
|
|||
|
Asset retirement obligations
|
38
|
|
—
|
|
|||
|
Regulatory assets associated with asset retirement obligations
|
265
|
|
248
|
|
|||
|
Other
|
128
|
|
114
|
|
|||
|
Total
|
4,516
|
|
4,419
|
|
|||
|
Deferred tax assets —
|
|||||||
|
Federal effect of state deferred taxes
|
205
|
|
194
|
|
|||
|
Unbilled fuel revenue
|
41
|
|
39
|
|
|||
|
Storm reserve
|
32
|
|
34
|
|
|||
|
Employee benefit obligations
|
231
|
|
408
|
|
|||
|
Other comprehensive losses
|
18
|
|
19
|
|
|||
|
Asset retirement obligations
|
303
|
|
248
|
|
|||
|
Other
|
108
|
|
98
|
|
|||
|
Total
|
938
|
|
1,040
|
|
|||
|
Total deferred tax liabilities, net
|
3,578
|
|
3,379
|
|
|||
|
Portion included in prepaid expenses (accrued income taxes)
|
25
|
|
25
|
|
|||
|
Accumulated deferred income taxes
|
$
|
3,603
|
|
$
|
3,404
|
|
|
At
December 31, 2013
, the Company's tax-related regulatory assets to be recovered from customers were
$519 million
. These assets are primarily attributable to tax benefits that flowed through to customers in prior years, to deferred taxes previously recognized at rates lower than the current enacted tax law, and to taxes applicable to capitalized interest.
At
December 31, 2013
, the Company's tax-related regulatory liabilities to be credited to customers were
$75 million
. These liabilities are primarily attributable to unamortized ITCs.
In accordance with regulatory requirements, deferred ITCs are amortized over the life of the related property with such amortization normally applied as a credit to reduce depreciation in the statements of income. Credits amortized in this manner amounted to
$8 million
in each of
2013
,
2012
, and
2011
. At
December 31, 2013
, all ITCs available to reduce federal income taxes payable had been utilized.
In 2010, the Tax Relief, Unemployment Insurance Reauthorization, and Job Creation Act of 2010 (Tax Relief Act) was signed into law. Major tax incentives in the Tax Relief Act include
100%
bonus depreciation for property placed in service after September 8, 2010 and through 2011 (and for certain long-term production-period projects placed in service in 2012) and
50%
bonus depreciation for property placed in service in 2012 (and for certain long-term production-period projects placed in service in 2013).
On January 2, 2013, the American Taxpayer Relief Act of 2012 (ATRA) was signed into law. The ATRA retroactively extended several tax credits through 2013 and extended
50%
bonus depreciation for property placed in service in 2013 (and for certain long-term production-period projects to be placed in service in 2014).
The application of the bonus depreciation provisions in these laws significantly increased deferred tax liabilities related to accelerated depreciation in 2013, 2012, and 2011.
II-177
NOTES (continued)
Alabama Power Company 2013 Annual Report
Effective Tax Rate
A reconciliation of the federal statutory income tax rate to the effective income tax rate is as follows:
|
2013
|
2012
|
2011
|
||||||
|
Federal statutory rate
|
35.0
|
%
|
35.0
|
%
|
35.0
|
%
|
||
|
State income tax, net of federal deduction
|
4.0
|
|
4.1
|
|
4.3
|
|
||
|
Non-deductible book depreciation
|
1.0
|
|
0.9
|
|
0.8
|
|
||
|
Differences in prior years' deferred and current tax rates
|
(0.1
|
)
|
(0.1
|
)
|
(0.1
|
)
|
||
|
AFUDC equity
|
(0.9
|
)
|
(0.5
|
)
|
(0.6
|
)
|
||
|
Other
|
(0.1
|
)
|
(0.3
|
)
|
(0.4
|
)
|
||
|
Effective income tax rate
|
38.9
|
%
|
39.1
|
%
|
39.0
|
%
|
||
The changes in the Company's 2013 and 2012 effective tax rates were not material.
Unrecognized Tax Benefits
Changes during the year in unrecognized tax benefits were as follows:
|
2013
|
2012
|
2011
|
|||||||||
|
(in millions)
|
|||||||||||
|
Unrecognized tax benefits at beginning of year
|
$
|
31
|
|
$
|
32
|
|
$
|
43
|
|
||
|
Tax positions from current periods
|
—
|
|
5
|
|
6
|
|
|||||
|
Tax positions from prior periods
|
(31
|
)
|
(4
|
)
|
(17
|
)
|
|||||
|
Reductions due to settlements
|
—
|
|
(2
|
)
|
—
|
|
|||||
|
Balance at end of year
|
$
|
—
|
|
$
|
31
|
|
$
|
32
|
|
||
The tax positions decrease from prior periods for
2013
relates primarily to the tax accounting method change for repairs-generation assets. See "Tax Method of Accounting for Repairs" herein for additional information.
The impact on the Company's effective tax rate, if recognized, is as follows:
|
2013
|
2012
|
2011
|
|||||||||
|
(in millions)
|
|||||||||||
|
Tax positions impacting the effective tax rate
|
$
|
—
|
|
$
|
—
|
|
$
|
5
|
|
||
|
Tax positions not impacting the effective tax rate
|
—
|
|
31
|
|
27
|
|
|||||
|
Balance of unrecognized tax benefits
|
$
|
—
|
|
$
|
31
|
|
$
|
32
|
|
||
The tax positions not impacting the effective tax rate for 2012 relate to the timing difference associated with the tax accounting method change for repairs-generation assets. See "Tax Method of Accounting for Repairs" herein for additional information. These amounts are presented on a gross basis without considering the related federal or state income tax impact.
Accrued interest for unrecognized tax benefits is as follows:
|
2013
|
2012
|
2011
|
|||||||||
|
(in millions)
|
|||||||||||
|
Interest accrued at beginning of year
|
$
|
—
|
|
$
|
1.9
|
|
$
|
1.5
|
|
||
|
Interest reclassified due to settlements
|
—
|
|
(1.9
|
)
|
—
|
|
|||||
|
Interest accrued during the year
|
—
|
|
—
|
|
0.4
|
|
|||||
|
Balance at end of year
|
$
|
—
|
|
$
|
—
|
|
$
|
1.9
|
|
||
The Company classifies interest on tax uncertainties as interest expense. The Company did not accrue any penalties on uncertain tax positions.
II-178
NOTES (continued)
Alabama Power Company 2013 Annual Report
It is reasonably possible that the amount of the unrecognized tax benefits could change within
12 months
. The settlement of federal and state audits could impact the balances significantly. At this time, an estimate of the range of reasonably possible outcomes cannot be determined.
The IRS has finalized its audits of Southern Company's consolidated federal income tax returns through 2011. Southern Company has filed its 2012 federal income tax return and has received a full acceptance letter from the IRS; however, the IRS has not finalized its audit. For tax years 2012 and 2013, Southern Company was a participant in the Compliance Assurance Process of the IRS. The audits for the Company's state income tax returns have either been concluded, or the statute of limitations has expired, for years prior to 2007.
Tax Method of Accounting for Repairs
In 2011, the IRS published regulations on the deduction and capitalization of expenditures related to tangible property that generally apply for tax years beginning on or after January 1, 2014. Additionally, on April 30, 2013, the IRS issued Revenue Procedure 2013-24, which provides guidance for taxpayers related to the deductibility of repair costs associated with generation assets. Based on a review of the regulations, Southern Company incorporated provisions related to repair costs for generation assets into its consolidated 2012 federal income tax return and reversed all related unrecognized tax positions. On September 19, 2013, the IRS issued Treasury Decision 9636, "Guidance Regarding Deduction and Capitalization of Expenditures Related to Tangible Property," which are final tangible property regulations applicable to taxable years beginning on or after January 1, 2014. Southern Company is currently reviewing this new guidance. The ultimate outcome of this matter cannot be determined at this time; however, these regulations are not expected to have a material impact on the Company's financial statements.
6. FINANCING
Long-Term Debt Payable to an Affiliated Trust
The Company has formed a wholly-owned trust subsidiary for the purpose of issuing preferred securities. The proceeds of the related equity investments and preferred security sales were loaned back to the Company through the issuance of junior subordinated notes totaling
$206 million
as of
December 31, 2013
and 2012, which constitute substantially all of the assets of this trust and are reflected in the balance sheets as long-term debt payable. The Company considers that the mechanisms and obligations relating to the preferred securities issued for its benefit, taken together, constitute a full and unconditional guarantee by it of the trust's payment obligations with respect to these securities. At each of
December 31, 2013
and
2012
, trust preferred securities of
$200 million
were outstanding. See Note 1 under "Variable Interest Entities" for additional information on the accounting treatment for this trust and the related securities.
Securities Due Within One Year
At
December 31, 2013
, the Company had no scheduled maturities of senior notes due within one year. At December 31,
2012
, the Company had
$250 million
of senior notes due within one year.
Maturities of senior notes and pollution control revenue bonds through 2018 applicable to total long-term debt are as follows:
$454 million
in 2015;
$200 million
in 2016; and
$561 million
in 2017. There are
no
scheduled maturities in 2014 and 2018.
Pollution Control Revenue Bonds
Pollution control obligations represent loans to the Company from public authorities of funds or installment purchases of pollution control and solid waste disposal facilities financed by funds derived from sales by public authorities of revenue bonds. The Company is required to make payments sufficient for the authorities to meet principal and interest requirements of such bonds. The Company incurred no obligations related to the issuance of pollution control revenue bonds in
2013
. The amount of tax-exempt pollution control revenue bonds outstanding at each of
December 31, 2013
and
2012
was
$1.2 billion
, respectively.
Senior Notes
In December 2013, the Company issued
$300 million
aggregate principal amount of its Series 2013A 3.55% Senior Notes due December 1, 2023. The proceeds of these issuances were used for general corporate purposes, including the Company's continuous construction program.
In November 2013, the Company's
$250 million
aggregate principal amount of its Series 2008B 5.80% Senior Notes due November 15, 2013 matured.
II-179
NOTES (continued)
Alabama Power Company 2013 Annual Report
At
December 31, 2013
and
2012
, the Company had
$4.9 billion
and
$4.8 billion
of senior notes outstanding, respectively. These senior notes are effectively subordinated to all secured debt of the Company which amounted to approximately
$153 million
at December 31, 2013.
Outstanding Classes of Capital Stock
The Company currently has preferred stock, Class A preferred stock, preference stock, and common stock authorized and outstanding. The Company's preferred stock and Class A preferred stock, without preference between classes, rank senior to the Company's preference stock and common stock with respect to payment of dividends and voluntary and involuntary dissolution. The preferred stock and Class A preferred stock of the Company contain a feature that allows the holders to elect a majority of the Company's board of directors if dividends are not paid for four consecutive quarters. Because such a potential redemption-triggering event is not solely within the control of the Company, the preferred stock and Class A preferred stock is presented as "Redeemable Preferred Stock" in a manner consistent with temporary equity under applicable accounting standards. The preference stock does not contain such a provision that would allow the holders to elect a majority of the Company's board. The Company's preference stock ranks senior to the common stock with respect to the payment of dividends and voluntary or involuntary dissolution.
The Company's preferred stock is subject to redemption at a price equal to the par value plus a premium. The Company's Class A preferred stock is subject to redemption at a price equal to the stated capital. Certain series of the Company's preference stock are subject to redemption at a price equal to the stated capital plus a make-whole premium based on the present value of the liquidation amount and future dividends to the first stated capital redemption date and the other series of preference stock are subject to redemption at a price equal to the stated capital. Certain series of the Company's preferred stock are subject to redemption at the option of the Company on or after a specified date. Information for each outstanding series is in the table below:
|
Preferred/Preference Stock
|
Par Value/Stated Capital Per Share
|
Shares Outstanding
|
First Call Date
|
Redemption Price Per Share
|
||||
|
4.92% Preferred Stock
|
$100
|
80,000
|
|
*
|
$103.23
|
|||
|
4.72% Preferred Stock
|
$100
|
50,000
|
|
*
|
$102.18
|
|||
|
4.64% Preferred Stock
|
$100
|
60,000
|
|
*
|
$103.14
|
|||
|
4.60% Preferred Stock
|
$100
|
100,000
|
|
*
|
$104.20
|
|||
|
4.52% Preferred Stock
|
$100
|
50,000
|
|
*
|
$102.93
|
|||
|
4.20% Preferred Stock
|
$100
|
135,115
|
|
*
|
$105.00
|
|||
|
5.83% Class A Preferred Stock
|
$25
|
1,520,000
|
|
8/1/2008
|
Stated Capital
|
|||
|
5.20% Class A Preferred Stock
|
$25
|
6,480,000
|
|
8/1/2008
|
Stated Capital
|
|||
|
5.30% Class A Preferred Stock
|
$25
|
4,000,000
|
|
4/1/2009
|
Stated Capital
|
|||
|
5.625% Preference Stock
|
$25
|
6,000,000
|
|
1/1/2012
|
Stated Capital
|
|||
|
6.450% Preference Stock
|
$25
|
6,000,000
|
|
*
|
**
|
|||
|
6.500% Preference Stock
|
$25
|
2,000,000
|
|
*
|
**
|
|||
* Redemption permitted any time after issuance
** Prior to 10/01/2017: Stated Value Plus Make-Whole Premium; after 10/01/2017: Stated Capital
Dividend Restrictions
The Company can only pay dividends to Southern Company out of retained earnings or paid-in-capital.
Assets Subject to Lien
The Company has granted liens on certain property in connection with the issuance of certain series of pollution control revenue bonds with an outstanding principal amount of
$153 million
as of
December 31, 2013
. There are
no
agreements or other arrangements among the Southern Company system companies under which the assets of one company have been pledged or otherwise made available to satisfy obligations of Southern Company or any of its other subsidiaries.
II-180
NOTES (continued)
Alabama Power Company 2013 Annual Report
Bank Credit Arrangements
At
December 31, 2013
, committed credit arrangements with banks were as follows:
|
Expires
(a)
|
Executable
Term-Loans
|
Due Within One Year
|
||||||||||||||||||||||||||||||||
|
2014
|
2015
|
2018
|
Total
|
Unused
|
One
Year
|
Two
Years
|
Term Out
|
No Term Out
|
||||||||||||||||||||||||||
|
(in millions)
|
|
|||||||||||||||||||||||||||||||||
|
$
|
238
|
|
$
|
35
|
|
$
|
1,030
|
|
$
|
1,303
|
|
$
|
1,303
|
|
$
|
53
|
|
$
|
—
|
|
$
|
53
|
|
$
|
185
|
|
||||||||
|
(a)
|
No credit arrangements expire in 2016 or 2017.
|
The Company expects to renew its credit agreements as needed, prior to expiration. Most of the credit arrangements require payment of a commitment fee based on the unused portion of the commitments or the maintenance of compensating balances with the banks. Commitment fees average less than
1
/
4
of 1% for the Company. Compensating balances are not legally restricted from withdrawal.
Most of the Company's credit arrangements with banks have covenants that limit the Company's debt to
65%
of total capitalization, as defined in the arrangements. For purposes of calculating these covenants, long-term notes payable to affiliated trusts are excluded from debt but included in capitalization. Exceeding this debt level would result in a default under the credit arrangements. At
December 31, 2013
, the Company was in compliance with the debt limit covenants.
A portion of the unused credit with banks is allocated to provide liquidity support to the Company's variable rate pollution control revenue bonds and commercial paper program. The amount of variable rate pollution control revenue bonds requiring liquidity support was
$793 million
as of
December 31, 2013
. In addition, at December 31, 2013, the Company had
$200 million
of fixed rate pollution control revenue bonds that will be required to be remarketed within the next 12 months.
The Company borrows through commercial paper programs that have the liquidity support of committed bank credit arrangements. The Company may also make short-term borrowings through various other arrangements with banks. At
December 31, 2013
and
2012
, there was no short-term debt outstanding. At
December 31, 2013
, the Company had regulatory approval to have outstanding up to
$2 billion
of short-term borrowings.
7. COMMITMENTS
Fuel and Purchased Power Agreements
To supply a portion of the fuel requirements of its generating plants, the Company has entered into various long-term commitments for the procurement and delivery of fossil and nuclear fuel which are not recognized on the balance sheets. In 2013, 2012, and 2011, the Company incurred fuel expense of
$1.6 billion
,
$1.5 billion
, and
$1.7 billion
, respectively, the majority of which was purchased under long-term commitments. The Company expects that a substantial amount of its future fuel needs will continue to be purchased under long-term commitments.
In addition, the Company has entered into various long-term commitments for the purchase of capacity and electricity, some of which are accounted for as operating leases. Total capacity expense under PPAs accounted for as operating leases was
$30 million
,
$33 million
, and
$33 million
for 2013, 2012, and 2011, respectively. Total estimated minimum long-term obligations at December 31, 2013 were as follows:
|
Operating Lease PPAs
|
|||
|
(in millions)
|
|||
|
2014
|
$
|
36
|
|
|
2015
|
38
|
|
|
|
2016
|
39
|
|
|
|
2017
|
40
|
|
|
|
2018
|
42
|
|
|
|
2019 and thereafter
|
182
|
|
|
|
Total commitments
|
$
|
377
|
|
SCS may enter into various types of wholesale energy and natural gas contracts acting as an agent for the Company and all of the other Southern Company traditional operating companies and Southern Power. Under these agreements, each of the traditional operating companies and Southern Power may be jointly and severally liable. Accordingly, Southern Company has entered into
II-181
NOTES (continued)
Alabama Power Company 2013 Annual Report
keep-well agreements with the Company and each of the other traditional operating companies to ensure the Company will not subsidize or be responsible for any costs, losses, liabilities, or damages resulting from the inclusion of Southern Power as a contracting party under these agreements.
Operating Leases
The Company has entered into rental agreements for coal railcars, vehicles, and other equipment with various terms and expiration dates. Total rent expense was
$21 million
in
2013
,
$24 million
in
2012
, and
$23 million
in
2011
. Of these amounts,
$18 million
,
$19 million
, and
$18 million
for 2013, 2012, and 2011, respectively, relate to the railcar leases and are recoverable through the Company's Rate ECR. As of December 31, 2013, estimated minimum lease payments under operating leases were as follows:
|
|
Minimum Lease Payments
|
||||||||
|
|
Railcars
|
Vehicles & Other
|
Total
|
||||||
|
(in millions)
|
|||||||||
|
2014
|
$
|
12
|
|
$
|
3
|
|
$
|
15
|
|
|
2015
|
10
|
|
2
|
|
12
|
|
|||
|
2016
|
11
|
|
1
|
|
12
|
|
|||
|
2017
|
6
|
|
—
|
|
6
|
|
|||
|
2018
|
4
|
|
—
|
|
4
|
|
|||
|
2019 and thereafter
|
15
|
|
—
|
|
15
|
|
|||
|
Total
|
$
|
58
|
|
$
|
6
|
|
$
|
64
|
|
In addition to the above rental commitments payments, the Company has potential obligations upon expiration of certain leases with respect to the residual value of the leased property. These leases have terms expiring through 2023 with maximum obligations under these leases of
$8 million
in 2014,
$5 million
in 2015,
$4 million
in 2016, and
$12 million
in 2019 and thereafter. There are no maximum obligations under these leases in 2017 and 2018. At the termination of the leases, the lessee may either exercise its purchase option, or the property can be sold to a third party. The Company expects that the fair market value of the leased property would substantially reduce or eliminate the Company's payments under the residual value obligations.
Guarantees
The Company has guaranteed the obligation of SEGCO for
$25 million
of pollution control revenue bonds issued in 2001, which mature in June 2019, and also
$100 million
of senior notes issued in November 2013, which mature in December 2018. Georgia Power has agreed to reimburse the Company for the pro rata portion of such obligations corresponding to Georgia Power's then proportionate ownership of SEGCO's stock if the Company is called upon to make such payment under its guarantee. See Note 4 for additional information.
8. STOCK COMPENSATION
Stock Options
Southern Company provides non-qualified stock options through its Omnibus Incentive Compensation Plan to a large segment of the Company's employees ranging from line management to executives. As of
December 31, 2013
, there were approximately
1,000
current and former employees of the Company participating in the stock option program, and there were
28 million
shares of Southern Company common stock remaining available for awards under the Omnibus Incentive Compensation Plan. The prices of options were at the fair market value of the shares on the dates of grant. These options become exercisable pro rata over a maximum period of
three years
from the date of grant. The Company generally recognizes stock option expense on a straight-line basis over the vesting period which equates to the requisite service period; however, for employees who are eligible for retirement, the total cost is expensed at the grant date. Options outstanding will expire no later than
10 years
after the date of grant, unless terminated earlier by the Southern Company Board of Directors in accordance with the Omnibus Incentive Compensation Plan. Stock options held by employees of a company undergoing a change in control vest upon the change in control.
II-182
NOTES (continued)
Alabama Power Company 2013 Annual Report
The estimated fair values of stock options granted were derived using the Black-Scholes stock option pricing model. Expected volatility was based on historical volatility of Southern Company's stock over a period equal to the expected term. Southern Company used historical exercise data to estimate the expected term that represents the period of time that options granted to employees are expected to be outstanding. The risk-free rate was based on the U.S. Treasury yield curve in effect at the time of grant that covers the expected term of the stock options.
The following table shows the assumptions used in the pricing model and the weighted average grant-date fair value of stock options granted:
|
Year Ended December 31
|
2013
|
2012
|
2011
|
||
|
Expected volatility
|
16.6%
|
17.7%
|
17.5%
|
||
|
Expected term
(in years)
|
5.0
|
5.0
|
5.0
|
||
|
Interest rate
|
0.9%
|
0.9%
|
2.3%
|
||
|
Dividend yield
|
4.4%
|
4.2%
|
4.8%
|
||
|
Weighted average grant-date fair value
|
$2.93
|
$3.39
|
$3.23
|
||
The Company's activity in the stock option program for
2013
is summarized below:
|
Shares Subject to Option
|
Weighted Average Exercise Price
|
|||||
|
Outstanding at December 31, 2012
|
6,060,552
|
|
$
|
36.02
|
|
|
|
Granted
|
1,319,038
|
|
44.07
|
|
||
|
Exercised
|
(1,035,611
|
)
|
32.74
|
|
||
|
Cancelled
|
(4,271
|
)
|
42.88
|
|
||
|
Outstanding at December 31, 2013
|
6,339,708
|
|
$
|
38.23
|
|
|
|
Exercisable at December 31, 2013
|
4,021,541
|
|
$
|
35.29
|
|
|
The number of stock options vested, and expected to vest in the future, as of
December 31, 2013
was not significantly different from the number of stock options outstanding at
December 31, 2013
as stated above. As of
December 31, 2013
, the weighted average remaining contractual term for the options outstanding and options exercisable was approximately
six
years and
five years
, respectively, and the aggregate intrinsic value for the options outstanding and options exercisable was
$26 million
and
$25 million
, respectively.
As of
December 31, 2013
, there was
$1 million
of total unrecognized compensation cost related to stock option awards not yet vested. That cost is expected to be recognized over a weighted-average period of approximately
11 months
.
For the years ended
December 31, 2013
,
2012
, and
2011
, total compensation cost for stock option awards recognized in income was
$4 million
,
$4 million
, and
$3 million
, respectively, with the related tax benefit also recognized in income of
$2 million
,
$1 million
, and
$1 million
, respectively.
The compensation cost and tax benefits related to the grant and exercise of Southern Company stock options to the Company's employees are recognized in the Company's financial statements with a corresponding credit to equity, representing a capital contribution from Southern Company.
The total intrinsic value of options exercised during the years ended
December 31, 2013
,
2012
, and
2011
was
$11 million
,
$28 million
, and
$23 million
, respectively. The actual tax benefit realized by the Company for the tax deductions from stock option exercises totaled
$4 million
,
$11 million
, and
$9 million
for the years ended
December 31, 2013
,
2012
, and
2011
, respectively.
Performance Shares
Southern Company provides performance share award units through its Omnibus Incentive Compensation Plan to a large segment of the Company's employees ranging from line management to executives. The performance share units granted under the plan vest at the end of a
three
-year performance period which equates to the requisite service period. Employees that retire prior to the end of the
three
-year period receive a pro rata number of shares, issued at the end of the performance period, based on actual months of service prior to retirement. The value of the award units is based on Southern Company's total shareholder return (TSR) over the
three
-year performance period which measures Southern Company's relative performance against a group of industry peers. The performance shares are delivered in common stock following the end of the performance period based on Southern Company's actual TSR and may range from
0%
to
200%
of the original target performance share amount.
II-183
NOTES (continued)
Alabama Power Company 2013 Annual Report
The fair value of performance share awards is determined as of the grant date using a Monte Carlo simulation model to estimate the TSR of Southern Company's stock among the industry peers over the performance period. The Company recognizes compensation expense on a straight-line basis over the
three
-year performance period without remeasurement. Compensation expense for awards where the service condition is met is recognized regardless of the actual number of shares issued. The expected volatility was based on the historical volatility of Southern Company's stock over a period equal to the performance period. The risk-free rate was based on the U.S. Treasury yield curve in effect at the time of grant that covers the performance period of the award units.
The following table shows the assumptions used in the pricing model and the weighted average grant-date fair value of performance share award units granted:
|
Year Ended December 31
|
2013
|
2012
|
2011
|
||
|
Expected volatility
|
12.0%
|
16%
|
19.2%
|
||
|
Expected term
(in years)
|
3.0
|
3.0
|
3.0
|
||
|
Interest rate
|
0.4%
|
0.4%
|
1.4%
|
||
|
Annualized dividend rate
|
$1.96
|
$1.89
|
$1.82
|
||
|
Weighted average grant-date fair value
|
$40.50
|
$41.99
|
$35.97
|
||
Total unvested performance share units outstanding as of
December 31, 2012
were
280,536
. During
2013
,
141,355
performance share units were granted,
131,581
performance share units were vested, and
5,484
performance share units were forfeited resulting in
284,826
unvested units outstanding at December 31, 2013. In January 2014, the vested performance share award units were converted into
39,258
shares outstanding at a share price of
$41.27
for the
three
-year performance and vesting period ended December 31, 2013.
For the years ended
December 31, 2013
,
2012
, and 2011, total compensation cost for performance share units recognized in income was
$5 million
,
$5 million
, and
$3 million
, respectively, with the related tax benefit also recognized in income of
$2 million
,
$2 million
, and
$1 million
, respectively. As of
December 31, 2013
, there was
$6 million
of total unrecognized compensation cost related to performance share award units that will be recognized over a weighted-average period of approximately
11 months
.
9. NUCLEAR INSURANCE
Under the Price-Anderson Amendments Act (Act), the Company maintains agreements of indemnity with the NRC that, together with private insurance, cover third-party liability arising from any nuclear incident occurring at Plant Farley. The Act provides funds up to
$13.6 billion
for public liability claims that could arise from a single nuclear incident. Plant Farley is insured against this liability to a maximum of
$375 million
by American Nuclear Insurers (ANI), with the remaining coverage provided by a mandatory program of deferred premiums that could be assessed, after a nuclear incident, against all owners of commercial nuclear reactors. The Company could be assessed up to
$127 million
per incident for each licensed reactor it operates but not more than an aggregate of
$19 million
per incident to be paid in a calendar year for each reactor. Such maximum assessment, excluding any applicable state premium taxes, for the Company is
$255 million
per incident but not more than an aggregate of
$38 million
to be paid for each incident in any one year. Both the maximum assessment per reactor and the maximum yearly assessment are adjusted for inflation at least every
five years
. The next scheduled adjustment is due no later than September 10, 2018.
The Company is a member of Nuclear Electric Insurance Limited (NEIL), a mutual insurer established to provide property damage insurance in an amount up to
$500 million
for members' operating nuclear generating facilities. Additionally, the Company has NEIL policies that currently provide decontamination, excess property insurance, and premature decommissioning coverage up to
$2.25 billion
for nuclear losses in excess of the
$500 million
primary coverage. These policies have a sublimit of
$1.7 billion
for non-nuclear losses.
NEIL also covers the additional costs that would be incurred in obtaining replacement power during a prolonged accidental outage at a member's nuclear plant. Members can purchase this coverage, subject to a deductible waiting period of up to
26 weeks
, with a maximum per occurrence per unit limit of
$490 million
. After the deductible period, weekly indemnity payments would be received until either the unit is operational or until the limit is exhausted in approximately
three years
. The Company purchases limits based on the projected full cost of replacement power and has elected a
12-week
deductible waiting period.
Under each of the NEIL policies, members are subject to assessments each year if losses exceed the accumulated funds available to the insurer. The current maximum annual assessments for the Company under the NEIL policies would be
$43 million
.
II-184
NOTES (continued)
Alabama Power Company 2013 Annual Report
Claims resulting from terrorist acts are covered under both the ANI and NEIL policies (subject to normal policy limits). The aggregate, however, that NEIL will pay for all claims resulting from terrorist acts in any 12-month period is
$3.2 billion
plus such additional amounts NEIL can recover through reinsurance, indemnity, or other sources.
For all on-site property damage insurance policies for commercial nuclear power plants, the NRC requires that the proceeds of such policies shall be dedicated first for the sole purpose of placing the reactor in a safe and stable condition after an accident. Any remaining proceeds are to be applied next toward the costs of decontamination and debris removal operations ordered by the NRC, and any further remaining proceeds are to be paid either to the Company or to its debt trustees as may be appropriate under the policies and applicable trust indentures. In the event of a loss, the amount of insurance available might not be adequate to cover property damage and other expenses incurred. Uninsured losses and other expenses, to the extent not recovered from customers, would be borne by the Company and could have a material effect on the Company's financial condition and results of operations.
All retrospective assessments, whether generated for liability, property, or replacement power, may be subject to applicable state premium taxes.
10. FAIR VALUE MEASUREMENTS
Fair value measurements are based on inputs of observable and unobservable market data that a market participant would use in pricing the asset or liability. The use of observable inputs is maximized where available and the use of unobservable inputs is minimized for fair value measurement and reflects a three-tier fair value hierarchy that prioritizes inputs to valuation techniques used for fair value measurement.
|
•
|
Level 1 consists of observable market data in an active market for identical assets or liabilities.
|
|
•
|
Level 2 consists of observable market data, other than that included in Level 1, that is either directly or indirectly observable.
|
|
•
|
Level 3 consists of unobservable market data. The input may reflect the assumptions of the Company of what a market participant would use in pricing an asset or liability. If there is little available market data, then the Company's own assumptions are the best available information.
|
In the case of multiple inputs being used in a fair value measurement, the lowest level input that is significant to the fair value measurement represents the level in the fair value hierarchy in which the fair value measurement is reported.
II-185
NOTES (continued)
Alabama Power Company 2013 Annual Report
As of December 31, 2013, assets and liabilities measured at fair value on a recurring basis during the period, together with the level of the fair value hierarchy in which they fall, were as follows:
|
Fair Value Measurements Using
|
|||||||||||||||
|
Quoted Prices in Active Markets for Identical Assets
|
Significant Other Observable Inputs
|
Significant Unobservable Inputs
|
|||||||||||||
|
As of December 31, 2013:
|
(Level 1)
|
(Level 2)
|
(Level 3)
|
Total
|
|||||||||||
|
(in millions)
|
|||||||||||||||
|
Assets:
|
|||||||||||||||
|
Energy-related derivatives
|
$
|
—
|
|
$
|
7
|
|
$
|
—
|
|
$
|
7
|
|
|||
|
Nuclear decommissioning trusts:
(a)
|
|||||||||||||||
|
Domestic equity
|
392
|
|
74
|
|
—
|
|
466
|
|
|||||||
|
Foreign equity
|
35
|
|
65
|
|
—
|
|
100
|
|
|||||||
|
U.S. Treasury and government agency securities
|
—
|
|
24
|
|
—
|
|
24
|
|
|||||||
|
Corporate bonds
|
—
|
|
89
|
|
—
|
|
89
|
|
|||||||
|
Mortgage and asset backed securities
|
—
|
|
18
|
|
—
|
|
18
|
|
|||||||
|
Other investments
|
—
|
|
13
|
|
3
|
|
16
|
|
|||||||
|
Cash equivalents
|
236
|
|
—
|
|
—
|
|
236
|
|
|||||||
|
Total
|
$
|
663
|
|
$
|
290
|
|
$
|
3
|
|
$
|
956
|
|
|||
|
Liabilities:
|
|||||||||||||||
|
Energy-related derivatives
|
$
|
—
|
|
$
|
8
|
|
$
|
—
|
|
$
|
8
|
|
|||
|
(a)
|
Excludes receivables related to investment income, pending investment sales, and payables related to pending investment purchases. See Note 1 under "Nuclear Decommissioning" for additional information.
|
As of
December 31, 2012
, assets and liabilities measured at fair value on a recurring basis during the period, together with the level of the fair value hierarchy in which they fall, were as follows:
|
Fair Value Measurements Using
|
|||||||||||||||
|
Quoted Prices in Active Markets for Identical Assets
|
Significant Other Observable Inputs
|
Significant Unobservable Inputs
|
|||||||||||||
|
As of December 31, 2012:
|
(Level 1)
|
(Level 2)
|
(Level 3)
|
Total
|
|||||||||||
|
(in millions)
|
|||||||||||||||
|
Assets:
|
|||||||||||||||
|
Energy-related derivatives
|
$
|
—
|
|
$
|
5
|
|
$
|
—
|
|
$
|
5
|
|
|||
|
Nuclear decommissioning trusts:
(a)
|
|
|
|
|
|
|
|
|
|||||||
|
Domestic equity
|
291
|
|
64
|
|
—
|
|
355
|
|
|||||||
|
Foreign equity
|
28
|
|
55
|
|
—
|
|
83
|
|
|||||||
|
U.S. Treasury and government agency securities
|
—
|
|
29
|
|
—
|
|
29
|
|
|||||||
|
Corporate bonds
|
—
|
|
101
|
|
—
|
|
101
|
|
|||||||
|
Mortgage and asset backed securities
|
—
|
|
26
|
|
—
|
|
26
|
|
|||||||
|
Other investments
|
—
|
|
10
|
|
—
|
|
10
|
|
|||||||
|
Total
|
$
|
319
|
|
$
|
290
|
|
$
|
—
|
|
$
|
609
|
|
|||
|
Liabilities:
|
|||||||||||||||
|
Energy-related derivatives
|
$
|
—
|
|
$
|
18
|
|
$
|
—
|
|
$
|
18
|
|
|||
|
(a)
|
Excludes receivables related to investment income, pending investment sales, and payables related to pending investment purchases.
|
II-186
NOTES (continued)
Alabama Power Company 2013 Annual Report
Valuation Methodologies
The energy-related derivatives primarily consist of over-the-counter financial products for natural gas and physical power products including, from time to time, basis swaps. These are standard products used within the energy industry and are valued using the market approach. The inputs used are mainly from observable market sources, such as forward natural gas prices, power prices, implied volatility, and Overnight Index Swap interest rates. Interest rate derivatives are also standard over-the-counter financial products valued using the market approach. Inputs for interest rate derivatives include LIBOR interest rates, interest rate futures contracts, and occasionally implied volatility of interest rate options. See Note 11 for additional information on how these derivatives are used.
For fair value measurements of investments within the nuclear decommissioning trusts, specifically the fixed income assets using significant other observable inputs and unobservable inputs, the primary valuation technique used is the market approach. External pricing vendors are designated for each of the asset classes in the nuclear decommissioning trusts with each security discriminately assigned a primary pricing source, based on similar characteristics. Other investments in private equity and real estate are generally classified as Level 3, as the underlying assets typically do not have observable inputs. The fund manager values these assets using various inputs and techniques depending on the nature of the underlying investments. The fair value of partnerships is determined by aggregating the value of the underlying assets.
A market price secured from the primary source vendor is evaluated by management in its valuation of the assets within the trusts. As a general approach, market pricing vendors gather market data (including indices and market research reports) and integrate relative credit information, observed market movements, and sector news into proprietary pricing models, pricing systems, and mathematical tools. Dealer quotes and other market information including live trading levels and pricing analysts' judgment are also obtained when available.
As of
December 31, 2013
and
2012
, the fair value measurements of investments calculated at net asset value per share (or its equivalent), as well as the nature and risks of those investments, were as follows:
|
Fair Value
|
Unfunded
Commitments
|
Redemption Frequency
|
Redemption
Notice Period
|
||||
|
As of December 31, 2013:
|
(in millions)
|
|
|||||
|
Nuclear decommissioning trusts:
|
|||||||
|
Equity-commingled funds
|
$65
|
None
|
Daily/Monthly
|
Daily/7 Days
|
|||
|
Trust-owned life insurance
|
110
|
None
|
Daily
|
15 days
|
|||
|
Cash equivalents:
|
|||||||
|
Money market funds
|
236
|
None
|
Daily
|
Not applicable
|
|||
|
As of December 31, 2012:
|
|||||||
|
Nuclear decommissioning trusts:
|
|||||||
|
Equity-commingled funds
|
$55
|
None
|
Daily/Monthly
|
Daily/7 days
|
|||
|
Trust-owned life insurance
|
96
|
None
|
Daily
|
15 days
|
|||
The nuclear decommissioning trust includes investments in TOLI. The taxable nuclear decommissioning trust invests in the TOLI in order to minimize the impact of taxes on the portfolio and can draw on the value of the TOLI through death proceeds, loans against the cash surrender value, and/or the cash surrender value, subject to legal restrictions. The amounts reported in the table above reflect the fair value of investments the insurer has made in relation to the TOLI agreements. The nuclear decommissioning trust does not own the underlying investments, but the fair value of the investments approximates the cash surrender value of the TOLI policies. The investments made by the insurer are in commingled funds. The commingled funds primarily include investments in domestic and international equity securities and predominantly high-quality fixed income securities. These fixed income securities may include U.S. Treasury and government agency fixed income securities, non-U.S. government and agency fixed income securities, domestic and foreign corporate fixed income securities, and, to some degree, mortgage and asset backed securities. The passively managed funds seek to replicate the performance of a related index. The actively managed funds seek to exceed the performance of a related index through security analysis and selection.
The money market funds are short-term investments of excess funds in various money market mutual funds, which are portfolios of short-term debt securities. The money market funds are regulated by the SEC and typically receive the highest rating from credit rating agencies. Regulatory and rating agency requirements for money market funds include minimum credit ratings and maximum maturities for individual securities and a maximum weighted average portfolio maturity. Redemptions are available on a same day basis, up to the full amount of the Company's investment in the money market funds.
II-187
NOTES (continued)
Alabama Power Company 2013 Annual Report
As of
December 31, 2013
and
2012
, other financial instruments for which the carrying amount did not equal fair value were as follows:
|
Carrying Amount
|
Fair Value
|
||||||
|
(in millions)
|
|||||||
|
Long-term debt:
|
|||||||
|
2013
|
$
|
6,228
|
|
$
|
6,534
|
|
|
|
2012
|
$
|
6,179
|
|
$
|
6,899
|
|
|
The fair values are determined using Level 2 measurements and are based on quoted market prices for the same or similar issues or on the current rates offered to the Company.
11. DERIVATIVES
The Company is exposed to market risks, primarily commodity price risk and interest rate risk. To manage the volatility attributable to these exposures, the Company nets its exposures, where possible, to take advantage of natural offsets and enters into various derivative transactions for the remaining exposures pursuant to the Company's policies in areas such as counterparty exposure and risk management practices. The Company's policy is that derivatives are to be used primarily for hedging purposes and mandates strict adherence to all applicable risk management policies. Derivative positions are monitored using techniques including, but not limited to, market valuation, value at risk, stress testing, and sensitivity analysis. Derivative instruments are recognized at fair value in the balance sheets as either assets or liabilities and are presented on a gross basis. In the statements of cash flows, the cash impacts of settled energy-related and interest rate derivatives are recorded as operating activities.
Energy-Related Derivatives
The Company enters into energy-related derivatives to hedge exposures to electricity, gas, and other fuel price changes. However, due to cost-based rate regulations and other various cost recovery mechanisms, the Company has limited exposure to market volatility in commodity fuel prices and prices of electricity. The Company manages fuel-hedging programs, implemented per the guidelines of the Alabama PSC, through the use of financial derivative contracts, which is expected to continue to mitigate price volatility.
To mitigate residual risks relative to movements in electricity prices, the Company may enter into physical fixed-price contracts for the purchase and sale of electricity through the wholesale electricity market. To mitigate residual risks relative to movements in gas prices, the Company may enter into fixed-price contracts for natural gas purchases; however, a significant portion of contracts are priced at market.
Energy-related derivative contracts are accounted for in one of three methods:
|
•
|
Regulatory Hedges
– Energy-related derivative contracts which are designated as regulatory hedges relate primarily to the Company's fuel-hedging programs, where gains and losses are initially recorded as regulatory liabilities and assets, respectively, and then are included in fuel expense as the underlying fuel is used in operations and ultimately recovered through the energy cost recovery clause.
|
|
•
|
Cash Flow Hedges
– Gains and losses on energy-related derivatives designated as cash flow hedges which are mainly used to hedge anticipated purchases and sales and are initially deferred in OCI before being recognized in the statements of income in the same period as the hedged transactions are reflected in earnings.
|
|
•
|
Not Designated
– Gains and losses on energy-related derivative contracts that are not designated or fail to qualify as hedges are recognized in the statements of income as incurred.
|
Some energy-related derivative contracts require physical delivery as opposed to financial settlement, and this type of derivative is both common and prevalent within the electric industry. When an energy-related derivative contract is settled physically, any cumulative unrealized gain or loss is reversed and the contract price is recognized in the respective line item representing the actual price of the underlying goods being delivered.
II-188
NOTES (continued)
Alabama Power Company 2013 Annual Report
At
December 31, 2013
, the net volume of energy-related derivative contracts for natural gas positions for the Company, together with the longest hedge date over which it is hedging its exposure to the variability in future cash flows for forecasted transactions and the longest date for derivatives not designated as hedges, were as follows:
|
Net Purchased
mmBtu*
|
Longest Hedge
Date
|
Longest Non-Hedge
Date
|
||
|
(in millions)
|
||||
|
69
|
2017
|
—
|
||
|
*
|
million British thermal units (mmBtu)
|
For cash flow hedges, the amounts expected to be reclassified from accumulated OCI to revenue and fuel expense for the 12-month period ending
December 31, 2014
are immaterial.
Interest Rate Derivatives
The Company may also enter into interest rate derivatives to hedge exposure to changes in interest rates. Derivatives related to existing variable rate securities or forecasted transactions are accounted for as cash flow hedges where the effective portion of the derivatives' fair value gains or losses is recorded in OCI and is reclassified into earnings at the same time the hedged transactions affect earnings. The derivatives employed as hedging instruments are structured to minimize ineffectiveness, which is recorded directly to earnings.
At
December 31, 2013
, there were no interest rate derivatives outstanding.
The estimated pre-tax losses that will be reclassified from accumulated OCI to interest expense for the 12-month period ending
December 31, 2014
are
$3 million
. The Company has deferred gains and losses that are expected to be amortized into earnings through 2035.
Derivative Financial Statement Presentation and Amounts
At
December 31, 2013
and
2012
, the fair value of energy-related derivatives was reflected in the balance sheets as follows:
|
|
Asset Derivatives
|
Liability Derivatives
|
|||||||||||||||||
|
Derivative Category
|
Balance Sheet Location
|
2013
|
2012
|
Balance Sheet Location
|
2013
|
2012
|
|||||||||||||
|
(in millions)
|
(in millions)
|
||||||||||||||||||
|
Derivatives designated as hedging instruments for regulatory purposes
|
|||||||||||||||||||
|
Energy-related derivatives:
|
Other current assets
|
$
|
5
|
|
$
|
2
|
|
Liabilities from risk management activities
|
$
|
3
|
|
$
|
14
|
|
|||||
|
Other deferred charges and assets
|
2
|
|
3
|
|
Other deferred credits and liabilities
|
5
|
|
4
|
|
||||||||||
|
Total derivatives designated as hedging instruments for regulatory purposes
|
$
|
7
|
|
$
|
5
|
|
$
|
8
|
|
$
|
18
|
|
|||||||
|
Total
|
$
|
7
|
|
$
|
5
|
|
$
|
8
|
|
$
|
18
|
|
|||||||
All derivative instruments are measured at fair value. See Note 10 for additional information.
II-189
NOTES (continued)
Alabama Power Company 2013 Annual Report
The derivative contracts of the Company are not subject to master netting arrangements or similar agreements and are reported gross on the Company's financial statements. Some of these energy-related and interest rate derivative contracts contain certain provisions that permit intra-contract netting of derivative receivables and payables for routine billing and offsets related to events of default and settlements. Amounts related to energy-related derivative contracts at
December 31, 2013
and
2012
are presented in the following tables.
|
Fair Value
|
||||||||||||||||||
|
Assets
|
2013
|
|
2012
|
|
Liabilities
|
2013
|
|
2012
|
|
|||||||||
|
(in millions)
|
(in millions)
|
|||||||||||||||||
|
Energy-related derivatives presented in the Balance Sheet
(a)
|
$
|
7
|
|
$
|
5
|
|
Energy-related derivatives presented in the Balance Sheet
(a)
|
$
|
8
|
|
$
|
18
|
|
|||||
|
Gross amounts not offset in the Balance Sheet
(b)
|
(5
|
)
|
(4
|
)
|
Gross amounts not offset in the Balance Sheet
(b)
|
(5
|
)
|
(4
|
)
|
|||||||||
|
Net-energy related derivative assets
|
$
|
2
|
|
$
|
1
|
|
Net-energy related derivative liabilities
|
$
|
3
|
|
$
|
14
|
|
|||||
(a) The Company does not offset fair value amounts for multiple derivative instruments executed with the same counterparty on the balance sheets; therefore, gross and net amounts of derivative assets and liabilities presented on the balance sheets are the same.
(b) Includes gross amounts subject to netting terms that are not offset on the balance sheets and any cash/financial collateral pledged or received.
At
December 31, 2013
and
2012
, the pre-tax effect of unrealized derivative gains (losses) arising from energy-related derivative instruments designated as regulatory hedging instruments and deferred on the balance sheets was as follows:
|
Unrealized Losses
|
Unrealized Gains
|
||||||||||||||||||
|
Derivative Category
|
Balance Sheet
Location
|
2013
|
2012
|
Balance Sheet
Location
|
2013
|
2012
|
|||||||||||||
|
(in millions)
|
(in millions)
|
||||||||||||||||||
|
Energy-related derivatives:
|
Other regulatory assets, current
|
$
|
(3
|
)
|
$
|
(14
|
)
|
Other current liabilities
|
$
|
5
|
|
$
|
2
|
|
|||||
|
Other regulatory assets, deferred
|
(5
|
)
|
(4
|
)
|
Other regulatory liabilities, deferred
|
2
|
|
3
|
|
||||||||||
|
Total energy-related derivative gains (losses)
|
$
|
(8
|
)
|
$
|
(18
|
)
|
$
|
7
|
|
$
|
5
|
|
|||||||
For the years ended
December 31, 2013
,
2012
, and
2011
, the pre-tax effect of interest rate derivatives designated as cash flow hedging instruments on the statements of income was as follows:
|
Derivatives in Cash Flow Hedging Relationships
|
Gain (Loss) Recognized in
OCI on Derivative
(Effective Portion)
|
Gain (Loss) Reclassified from Accumulated OCI into Income
(Effective Portion)
|
||||||||||||||||||||||||
|
Amount
|
||||||||||||||||||||||||||
|
Derivative Category
|
2013
|
|
2012
|
|
2011
|
|
Statements of Income
Location
|
2013
|
|
2012
|
2011
|
|
||||||||||||||
|
|
(in millions)
|
|
(in millions)
|
|||||||||||||||||||||||
|
Interest rate derivatives
|
$
|
—
|
|
$
|
(18
|
)
|
$
|
(14
|
)
|
Interest expense, net of amounts capitalized
|
$
|
(3
|
)
|
$
|
(3
|
)
|
$
|
3
|
|
|||||||
There was no material ineffectiveness recorded in earnings for any period presented.
For the years ended
December 31, 2013
,
2012
, and
2011
, the pre-tax effect of energy-related derivatives not designated as hedging instruments on the statements of income was not material.
Contingent Features
The Company does not have any credit arrangements that would require material changes in payment schedules or terminations as a result of a credit rating downgrade. There are certain derivatives that could require collateral, but not accelerated payment, in the event of various credit rating changes of certain affiliated companies. At
December 31, 2013
, the fair value of derivative liabilities with contingent features was
$1 million
.
II-190
NOTES (continued)
Alabama Power Company 2013 Annual Report
The Company's collateral posted with its derivative counterparties at
December 31, 2013
was not material. However, because of the joint and several liability features underlying these derivatives, the maximum potential collateral requirements arising from the credit-risk-related contingent features, at a rating below BBB- and/or Baa3, were
$9 million
. If collateral is required, fair value amounts recognized for the right to reclaim cash collateral or the obligation to return cash collateral are not offset against fair value amounts recognized for derivatives executed with the same counterparty.
Generally, collateral may be provided by a Southern Company guaranty, letter of credit, or cash. The Company participates in certain agreements that could require collateral in the event that one or more Southern Company system power pool participants has a credit rating change to below investment grade.
The Company is exposed to losses related to financial instruments in the event of counterparties' nonperformance. The Company only enters into agreements and material transactions with counterparties that have investment grade credit ratings by Moody's Investors Services, Inc. and Standard and Poor's Ratings Services, a division of The McGraw Hill Companies, Inc. or with counterparties who have posted collateral to cover potential credit exposure. The Company has also established risk management policies and controls to determine and monitor the creditworthiness of counterparties in order to mitigate the Company's exposure to counterparty credit risk. Therefore, the Company does not anticipate a material adverse effect on the financial statements as a result of counterparty nonperformance.
II-191
NOTES (continued)
Alabama Power Company 2013 Annual Report
12. QUARTERLY FINANCIAL INFORMATION (UNAUDITED)
Summarized quarterly financial information for
2013
and
2012
is as follows:
|
Quarter Ended
|
Operating
Revenues
|
Operating
Income
|
Net Income After Dividends on Preferred and Preference Stock
|
||||||||
|
(in millions)
|
|||||||||||
|
March 2013
|
$
|
1,308
|
|
$
|
307
|
|
$
|
141
|
|
||
|
June 2013
|
1,392
|
|
357
|
|
173
|
|
|||||
|
September 2013
|
1,604
|
|
500
|
|
258
|
|
|||||
|
December 2013
|
1,314
|
|
312
|
|
140
|
|
|||||
|
March 2012
|
$
|
1,216
|
|
$
|
291
|
|
$
|
126
|
|
||
|
June 2012
|
1,377
|
|
390
|
|
185
|
|
|||||
|
September 2012
|
1,637
|
|
544
|
|
280
|
|
|||||
|
December 2012
|
1,290
|
|
271
|
|
113
|
|
|||||
The Company's business is influenced by seasonal weather conditions.
II-192
SELECTED FINANCIAL AND OPERATING DATA
2009
-
2013
Alabama Power Company
2013
Annual Report
|
2013
|
|
2012
|
|
2011
|
|
2010
|
|
2009
|
|
||||||||||
|
Operating Revenues (
in millions
)
|
$
|
5,618
|
|
$
|
5,520
|
|
$
|
5,702
|
|
$
|
5,976
|
|
$
|
5,529
|
|
||||
|
Net Income After Dividends
on Preferred and Preference Stock (
in millions
)
|
$
|
712
|
|
$
|
704
|
|
$
|
708
|
|
$
|
707
|
|
$
|
670
|
|
||||
|
Cash Dividends on Common Stock (
in millions
)
|
$
|
644
|
|
$
|
684
|
|
$
|
774
|
|
$
|
586
|
|
$
|
523
|
|
||||
|
Return on Average Common Equity (
percent
)
|
13.07
|
|
13.10
|
|
13.19
|
|
13.31
|
|
13.27
|
|
|||||||||
|
Total Assets (i
n millions
)
|
$
|
19,251
|
|
$
|
18,712
|
|
$
|
18,477
|
|
$
|
17,994
|
|
$
|
17,524
|
|
||||
|
Gross Property Additions (
in millions
)
|
$
|
1,204
|
|
$
|
940
|
|
$
|
1,016
|
|
$
|
956
|
|
$
|
1,323
|
|
||||
|
Capitalization (
in millions
):
|
|||||||||||||||||||
|
Common stock equity
|
$
|
5,502
|
|
$
|
5,398
|
|
$
|
5,342
|
|
$
|
5,393
|
|
$
|
5,237
|
|
||||
|
Preference stock
|
343
|
|
343
|
|
343
|
|
343
|
|
343
|
|
|||||||||
|
Redeemable preferred stock
|
342
|
|
342
|
|
342
|
|
342
|
|
342
|
|
|||||||||
|
Long-term debt
|
6,233
|
|
5,929
|
|
5,632
|
|
5,987
|
|
6,082
|
|
|||||||||
|
Total (
excluding amounts due within one year
)
|
$
|
12,420
|
|
$
|
12,012
|
|
$
|
11,659
|
|
$
|
12,065
|
|
$
|
12,004
|
|
||||
|
Capitalization Ratios (
percent
):
|
|||||||||||||||||||
|
Common stock equity
|
44.3
|
|
44.9
|
|
45.8
|
|
44.7
|
|
43.6
|
|
|||||||||
|
Preference stock
|
2.8
|
|
2.9
|
|
2.9
|
|
2.9
|
|
2.9
|
|
|||||||||
|
Redeemable preferred stock
|
2.7
|
|
2.8
|
|
2.9
|
|
2.8
|
|
2.8
|
|
|||||||||
|
Long-term debt
|
50.2
|
|
49.4
|
|
48.4
|
|
49.6
|
|
50.7
|
|
|||||||||
|
Total (
excluding amounts due within one year
)
|
100.0
|
|
100.0
|
|
100.0
|
|
100.0
|
|
100.0
|
|
|||||||||
|
Customers (
year-end
):
|
|||||||||||||||||||
|
Residential
|
1,241,998
|
|
1,237,730
|
|
1,231,574
|
|
1,235,128
|
|
1,229,134
|
|
|||||||||
|
Commercial
|
196,209
|
|
196,177
|
|
196,270
|
|
197,336
|
|
198,642
|
|
|||||||||
|
Industrial
|
5,851
|
|
5,839
|
|
5,844
|
|
5,770
|
|
5,912
|
|
|||||||||
|
Other
|
751
|
|
748
|
|
746
|
|
782
|
|
780
|
|
|||||||||
|
Total
|
1,444,809
|
|
1,440,494
|
|
1,434,434
|
|
1,439,016
|
|
1,434,468
|
|
|||||||||
|
Employees (
year-end
)
|
6,896
|
|
6,778
|
|
6,632
|
|
6,552
|
|
6,842
|
|
|||||||||
II-193
SELECTED FINANCIAL AND OPERATING DATA
2009
-
2013
(continued)
Alabama Power Company
2013
Annual Report
|
2013
|
|
2012
|
|
2011
|
|
2010
|
|
2009
|
|
||||||||||
|
Operating Revenues (
in millions
):
|
|||||||||||||||||||
|
Residential
|
$
|
2,079
|
|
$
|
2,068
|
|
$
|
2,144
|
|
$
|
2,283
|
|
$
|
1,962
|
|
||||
|
Commercial
|
1,477
|
|
1,491
|
|
1,495
|
|
1,535
|
|
1,430
|
|
|||||||||
|
Industrial
|
1,369
|
|
1,346
|
|
1,306
|
|
1,231
|
|
1,080
|
|
|||||||||
|
Other
|
27
|
|
28
|
|
27
|
|
27
|
|
25
|
|
|||||||||
|
Total retail
|
4,952
|
|
4,933
|
|
4,972
|
|
5,076
|
|
4,497
|
|
|||||||||
|
Wholesale — non-affiliates
|
248
|
|
277
|
|
287
|
|
465
|
|
620
|
|
|||||||||
|
Wholesale — affiliates
|
212
|
|
111
|
|
244
|
|
236
|
|
237
|
|
|||||||||
|
Total revenues from sales of electricity
|
5,412
|
|
5,321
|
|
5,503
|
|
5,777
|
|
5,354
|
|
|||||||||
|
Other revenues
|
206
|
|
199
|
|
199
|
|
199
|
|
175
|
|
|||||||||
|
Total
|
$
|
5,618
|
|
$
|
5,520
|
|
$
|
5,702
|
|
$
|
5,976
|
|
$
|
5,529
|
|
||||
|
Kilowatt-Hour Sales (
in millions
):
|
|||||||||||||||||||
|
Residential
|
17,920
|
|
17,612
|
|
18,650
|
|
20,417
|
|
18,071
|
|
|||||||||
|
Commercial
|
13,892
|
|
13,963
|
|
14,173
|
|
14,719
|
|
14,186
|
|
|||||||||
|
Industrial
|
22,904
|
|
22,158
|
|
21,666
|
|
20,622
|
|
18,555
|
|
|||||||||
|
Other
|
211
|
|
214
|
|
214
|
|
216
|
|
218
|
|
|||||||||
|
Total retail
|
54,927
|
|
53,947
|
|
54,703
|
|
55,974
|
|
51,030
|
|
|||||||||
|
Wholesale — non-affiliates
|
3,711
|
|
4,196
|
|
4,330
|
|
8,655
|
|
14,317
|
|
|||||||||
|
Wholesale — affiliates
|
7,672
|
|
4,279
|
|
7,211
|
|
6,074
|
|
6,473
|
|
|||||||||
|
Total
|
66,310
|
|
62,422
|
|
66,244
|
|
70,703
|
|
71,820
|
|
|||||||||
|
Average Revenue Per Kilowatt-Hour (
cents
):
|
|||||||||||||||||||
|
Residential
|
11.60
|
|
11.74
|
|
11.50
|
|
11.18
|
|
10.86
|
|
|||||||||
|
Commercial
|
10.63
|
|
10.68
|
|
10.55
|
|
10.43
|
|
10.08
|
|
|||||||||
|
Industrial
|
5.98
|
|
6.07
|
|
6.03
|
|
5.97
|
|
5.82
|
|
|||||||||
|
Total retail
|
9.02
|
|
9.14
|
|
9.09
|
|
9.07
|
|
8.81
|
|
|||||||||
|
Wholesale
|
4.04
|
|
4.58
|
|
4.60
|
|
4.76
|
|
4.12
|
|
|||||||||
|
Total sales
|
8.16
|
|
8.52
|
|
8.31
|
|
8.17
|
|
7.45
|
|
|||||||||
|
Residential Average Annual
Kilowatt-Hour Use Per Customer
|
14,451
|
|
14,252
|
|
15,138
|
|
16,570
|
|
14,716
|
|
|||||||||
|
Residential Average Annual
Revenue Per Customer
|
$
|
1,676
|
|
$
|
1,674
|
|
$
|
1,740
|
|
$
|
1,853
|
|
$
|
1,597
|
|
||||
|
Plant Nameplate Capacity
Ratings (
year-end
) (
megawatts
)
|
12,222
|
|
12,222
|
|
12,222
|
|
12,222
|
|
12,222
|
|
|||||||||
|
Maximum Peak-Hour Demand (
megawatts
):
|
|||||||||||||||||||
|
Winter
|
9,347
|
|
10,285
|
|
11,553
|
|
11,349
|
|
10,701
|
|
|||||||||
|
Summer
|
10,692
|
|
11,096
|
|
11,500
|
|
11,488
|
|
10,870
|
|
|||||||||
|
Annual Load Factor (
percent
)
|
64.9
|
|
61.3
|
|
60.6
|
|
62.6
|
|
59.8
|
|
|||||||||
|
Plant Availability (
percent
)*:
|
|||||||||||||||||||
|
Fossil-steam
|
87.3
|
|
88.6
|
|
88.7
|
|
92.9
|
|
88.5
|
|
|||||||||
|
Nuclear
|
90.7
|
|
94.5
|
|
94.7
|
|
88.4
|
|
93.3
|
|
|||||||||
|
Source of Energy Supply (
percent
):
|
|||||||||||||||||||
|
Coal
|
50.0
|
|
48.2
|
|
52.5
|
|
56.6
|
|
53.4
|
|
|||||||||
|
Nuclear
|
20.3
|
|
22.6
|
|
20.8
|
|
17.7
|
|
18.6
|
|
|||||||||
|
Hydro
|
8.1
|
|
4.1
|
|
4.6
|
|
5.0
|
|
7.9
|
|
|||||||||
|
Gas
|
15.7
|
|
16.8
|
|
15.3
|
|
14.0
|
|
11.8
|
|
|||||||||
|
Purchased power —
|
|||||||||||||||||||
|
From non-affiliates
|
2.9
|
|
2.0
|
|
0.9
|
|
1.6
|
|
2.0
|
|
|||||||||
|
From affiliates
|
3.0
|
|
6.3
|
|
5.9
|
|
5.1
|
|
6.3
|
|
|||||||||
|
Total
|
100.0
|
|
100.0
|
|
100.0
|
|
100.0
|
|
100.0
|
|
|||||||||
|
*
|
Beginning in 2012, plant availability is calculated as a weighted equivalent availability.
|
II-194
GEORGIA POWER COMPANY
FINANCIAL SECTION
II-195
MANAGEMENT'S REPORT ON INTERNAL CONTROL OVER FINANCIAL REPORTING
Georgia Power Company
2013
Annual Report
The management of Georgia Power Company (the Company) is responsible for establishing and maintaining an adequate system of internal control over financial reporting as required by the Sarbanes-Oxley Act of 2002 and as defined in Exchange Act Rule 13a-15(f). A control system can provide only reasonable, not absolute, assurance that the objectives of the control system are met.
Under management's supervision, an evaluation of the design and effectiveness of the Company's internal control over financial reporting was conducted based on the framework in
Internal Control—Integrated Framework (1992)
issued by the Committee of Sponsoring Organizations of the Treadway Commission. Based on this evaluation, management concluded that the Company's internal control over financial reporting was effective as of
December 31, 2013
.
/s/ W. Paul Bowers
W. Paul Bowers
President and Chief Executive Officer
/s/ W. Ron Hinson
W. Ron Hinson
Executive Vice President, Chief Financial Officer, and Treasurer
February 27, 2014
II-196
REPORT OF INDEPENDENT REGISTERED PUBLIC ACCOUNTING FIRM
To the Board of Directors of
Georgia Power Company
We have audited the accompanying balance sheets and statements of capitalization of Georgia Power Company (the Company) (a wholly owned subsidiary of The Southern Company) as of
December 31, 2013
and
2012
, and the related statements of income, comprehensive income, common stockholder's equity, and cash flows for each of the three years in the period ended
December 31, 2013
. These financial statements are the responsibility of the Company's management. Our responsibility is to express an opinion on these financial statements based on our audits.
We conducted our audits in accordance with the standards of the Public Company Accounting Oversight Board (United States). Those standards require that we plan and perform the audit to obtain reasonable assurance about whether the financial statements are free of material misstatement. The Company is not required to have, nor were we engaged to perform, an audit of its internal control over financial reporting. Our audits included consideration of internal control over financial reporting as a basis for designing audit procedures that are appropriate in the circumstances, but not for the purpose of expressing an opinion on the effectiveness of the Company's internal control over financial reporting. Accordingly, we express no such opinion. An audit also includes examining, on a test basis, evidence supporting the amounts and disclosures in the financial statements, assessing the accounting principles used and significant estimates made by management, as well as evaluating the overall financial statement presentation. We believe that our audits provide a reasonable basis for our opinion.
In our opinion, such financial statement
s (pages II-226 to II-276) pr
esent fairly, in all material respects, the financial position of Georgia Power Company as of
December 31, 2013
and
2012
, and the results of its operations and its cash flows for each of the three years in the period ended
December 31, 2013
, in conformity with accounting principles generally accepted in the United States of America.
/s/ Deloitte & Touche LLP
Atlanta, Georgia
February 27, 2014
II-197
MANAGEMENT'S DISCUSSION AND ANALYSIS OF FINANCIAL CONDITION AND RESULTS OF OPERATIONS
Georgia Power Company 2013 Annual Report
OVERVIEW
Business Activities
Georgia Power Company (the Company) operates as a vertically integrated utility providing electricity to retail customers within its traditional service area located within the State of Georgia and to wholesale customers in the Southeast.
Many factors affect the opportunities, challenges, and risks of the Company's business of selling electricity. These factors include the ability to maintain a constructive regulatory environment, to maintain and grow energy sales given economic conditions, and to effectively manage and secure timely recovery of costs. These costs include those related to projected long-term demand growth, increasingly stringent environmental standards, reliability, and fuel. In addition, the Company is currently constructing two new nuclear generating units at Plant Vogtle (Plant Vogtle Units 3 and 4) to increase its generation diversity and meet future supply needs. Appropriately balancing required costs and capital expenditures with customer prices will continue to challenge the Company for the foreseeable future.
On December 17, 2013, the Georgia Public Service Commission (PSC) approved an Alternate Rate Plan for the years 2014 through 2016 (2013 ARP), including base rate increases of approximately $110 million, $187 million, and $170 million effective January 1, 2014, 2015, and 2016, respectively. The Company is scheduled to file its next base rate case by July 1, 2016. See FUTURE EARNINGS POTENTIAL – "PSC Matters – Rate Plans" herein for additional information.
Key Performance Indicators
The Company continues to focus on several key performance indicators. These indicators include customer satisfaction, plant availability, system reliability, the execution of major construction projects, and net income after dividends on preferred and preference stock. The Company's financial success is directly tied to customer satisfaction. Key elements of ensuring customer satisfaction include outstanding service, high reliability, and competitive prices. Management uses customer satisfaction surveys and reliability indicators to evaluate the Company's results.
Peak season equivalent forced outage rate (Peak Season EFOR) is an indicator of fossil/hydro plant availability and efficient generation fleet operations during the months when generation needs are greatest. The rate is calculated by dividing the number of hours of forced outages by total generation hours. The 2013 Peak Season EFOR did not meet the target due to an explosion at Plant Bowen in April 2013. See FUTURE EARNINGS POTENTIAL – "Other Matters" herein for additional information. Transmission and distribution system reliability performance is measured by the frequency and duration of outages, with performance targets set based on historical performance. The 2013 performance was better than the target for these reliability measures.
Net income after dividends on preferred and preference stock is the primary measure of the Company's financial performance. The Company's 2013 results compared to its targets for some of these key indicators are reflected in the following chart:
|
Key Performance Indicator
|
2013 Target Performance
|
2013 Actual Performance
|
|
|
Customer Satisfaction
|
Top quartile in customer surveys
|
Top quartile
|
|
|
Peak Season EFOR — fossil/hydro
|
5.86% or less
|
9.55%
|
|
|
Net Income After Dividends on Preferred and Preference Stock
|
$1.19 billion
|
$1.17 billion
|
|
See RESULTS OF OPERATIONS herein for additional information on the Company's financial performance. The 2013 net income after dividends on preferred and preference stock did not meet the target due to significantly milder than normal weather.
Earnings
The Company's 2013 net income after dividends on preferred and preference stock totaled $1.2 billion, representing a $6 million, or 0.5%, increase over the previous year. The increase was due primarily to an increase related to retail revenue rate effects, partially offset by milder weather in 2013, an increase in depreciation and amortization, and higher income taxes.
The Company's 2012 net income after dividends on preferred and preference stock totaled $1.2 billion representing a $23 million, or 2.0%, increase over the previous year. The increase was due primarily to lower operations and maintenance expenses resulting from cost containment efforts in 2012 and retail revenue rate effects as authorized by the Georgia PSC under the Alternate Rate Plan for the years 2011 through 2013 (2010 ARP). These increases were partially offset by lower operating revenues as a result of
II-198
MANAGEMENT'S DISCUSSION AND ANALYSIS (continued)
Georgia Power Company 2013 Annual Report
milder weather in 2012 and a decrease in customer usage, lower allowance for funds used during construction (AFUDC) equity, higher depreciation and amortization, primarily as a result of completing construction of Plant McDonough-Atkinson Units 4 and 5, higher income taxes, and higher interest expense reflecting a 2011 settlement of tax litigation with the Georgia Department of Revenue (DOR).
RESULTS OF OPERATIONS
A condensed income statement for the Company follows:
|
Amount
|
|
Increase (Decrease)
from Prior Year
|
|||||||||
|
2013
|
2013
|
2012
|
|||||||||
|
(in millions)
|
|||||||||||
|
Operating revenues
|
$
|
8,274
|
|
$
|
276
|
|
$
|
(802
|
)
|
||
|
Fuel
|
2,307
|
|
256
|
|
(738
|
)
|
|||||
|
Purchased power
|
884
|
|
(97
|
)
|
(122
|
)
|
|||||
|
Other operations and maintenance
|
1,654
|
|
10
|
|
(133
|
)
|
|||||
|
Depreciation and amortization
|
807
|
|
62
|
|
30
|
|
|||||
|
Taxes other than income taxes
|
382
|
|
8
|
|
5
|
|
|||||
|
Total operating expenses
|
6,034
|
|
239
|
|
(958
|
)
|
|||||
|
Operating income
|
2,240
|
|
37
|
|
156
|
|
|||||
|
Allowance for equity funds used during construction
|
30
|
|
(23
|
)
|
(43
|
)
|
|||||
|
Interest expense, net of amounts capitalized
|
361
|
|
(5
|
)
|
23
|
|
|||||
|
Other income (expense), net
|
5
|
|
22
|
|
(4
|
)
|
|||||
|
Income taxes
|
723
|
|
35
|
|
63
|
|
|||||
|
Net income
|
1,191
|
|
6
|
|
23
|
|
|||||
|
Dividends on preferred and preference stock
|
17
|
|
—
|
|
—
|
|
|||||
|
Net income after dividends on preferred and preference stock
|
$
|
1,174
|
|
$
|
6
|
|
$
|
23
|
|
||
II-199
MANAGEMENT'S DISCUSSION AND ANALYSIS (continued)
Georgia Power Company 2013 Annual Report
Operating Revenues
Operating revenues for 2013 were $8.3 billion, reflecting a $276 million increase from 2012. Details of operating revenues were as follows:
|
Amount
|
|||||||
|
2013
|
2012
|
||||||
|
(in millions)
|
|||||||
|
Retail — prior year
|
$
|
7,362
|
|
$
|
8,099
|
|
|
|
Estimated change resulting from —
|
|||||||
|
Rates and pricing
|
137
|
|
166
|
|
|||
|
Sales growth (decline)
|
(5
|
)
|
(26
|
)
|
|||
|
Weather
|
(61
|
)
|
(147
|
)
|
|||
|
Fuel cost recovery
|
187
|
|
(730
|
)
|
|||
|
Retail — current year
|
7,620
|
|
7,362
|
|
|||
|
Wholesale revenues —
|
|||||||
|
Non-affiliates
|
281
|
|
281
|
|
|||
|
Affiliates
|
20
|
|
20
|
|
|||
|
Total wholesale revenues
|
301
|
|
301
|
|
|||
|
Other operating revenues
|
353
|
|
335
|
|
|||
|
Total operating revenues
|
$
|
8,274
|
|
$
|
7,998
|
|
|
|
Percent change
|
3.5
|
%
|
(9.1
|
)%
|
|||
Retail base revenues of $4.9 billion in 2013 increased $71 million, or 1.5%, compared to 2012 primarily due to base tariff increases effective April 1, 2012 and January 1, 2013, as approved by the Georgia PSC, related to placing new generating units at Plant McDonough-Atkinson in service and collecting financing costs related to the construction of Plant Vogtle Units 3 and 4 through the Nuclear Construction Cost Recovery (NCCR) tariff, as well as higher contributions from market-driven rates from commercial and industrial customers. The increase was partially offset by milder weather in 2013 as compared to 2012. In 2013, residential base revenues decreased $3 million, or 0.1%, commercial base revenues increased $43 million, or 2.2%, and industrial base revenues increased $28 million, or 4.4%, compared to 2012. Residential usage continues to be impacted by economic uncertainty, modest economic growth, and energy efficiency efforts.
Retail base revenues of $4.8 billion in 2012 were flat compared to 2011 primarily due to milder weather in 2012, decreased customer usage, and lower contributions from market-driven rates from commercial and industrial customers, offset by base tariff increases effective April 1, 2012 related to placing Plant McDonough-Atkinson Units 4 and 5 in service, collecting financing costs related to the construction of Plant Vogtle Units 3 and 4 through the NCCR tariff, and demand-side management programs effective January 1, 2012, as approved by the Georgia PSC, as well as the rate pricing effect of decreased customer usage. In 2012, residential base revenues increased $17 million, or 0.8%, commercial base revenues increased $11 million, or 0.6%, and industrial base revenues decreased $36 million, or 5.4%, compared to 2011. Economic uncertainty impacted residential, commercial, and industrial base revenues.
See "Energy Sales" below for a discussion of changes in the volume of energy sold, including changes related to sales growth (decline) and weather.
Electric rates include provisions to adjust billings for fluctuations in fuel costs, including the energy component of purchased power costs. Under these fuel cost recovery provisions, fuel revenues generally equal fuel expenses and do not affect net income. The Company further lowered fuel rates effective January 1, 2013. See FUTURE EARNINGS POTENTIAL – "PSC Matters – Fuel Cost Recovery" herein for additional information.
II-200
MANAGEMENT'S DISCUSSION AND ANALYSIS (continued)
Georgia Power Company 2013 Annual Report
Wholesale revenues from power sales to non-affiliated utilities were as follows:
|
2013
|
2012
|
2011
|
|||||||||
|
(in millions)
|
|||||||||||
|
Capacity and other
|
$
|
174
|
|
$
|
177
|
|
$
|
177
|
|
||
|
Energy
|
107
|
|
104
|
|
164
|
|
|||||
|
Total non-affiliated
|
$
|
281
|
|
$
|
281
|
|
$
|
341
|
|
||
Wholesale revenues from sales to non-affiliates consist of power purchase agreements (PPA) and short-term opportunity sales. Capacity revenues reflect the recovery of fixed costs and a return on investment. Wholesale revenues from sales to non-affiliates will vary depending on fuel prices, the market prices of wholesale energy compared to the cost of the Company's and the Southern Company system's generation, demand for energy within the Southern Company system's service territory, and the availability of the Southern Company system's generation. Increases and decreases in energy revenues that are driven by fuel prices are accompanied by an increase or decrease in fuel costs and do not have a significant impact on net income. Short-term opportunity sales are made at market-based rates that generally provide a margin above the Company's variable cost of energy.
Revenues from other non-affiliated sales were flat in 2013 and decreased $60 million, or 17.6%, in 2012. The decrease in 2012 was primarily due to a 24.9% decrease in kilowatt-hour (KWH) sales due to lower demand resulting from milder weather and the availability of market energy at a lower cost than Company-owned generation.
Wholesale revenues from sales to affiliated companies will vary depending on demand and the availability and cost of generating resources at each company. These affiliate sales are made in accordance with the Intercompany Interchange Contract (IIC), as approved by the Federal Energy Regulatory Commission (FERC). These transactions do not have a significant impact on earnings since this energy is generally sold at marginal cost. In 2013, wholesale revenues from sales to affiliates remained flat and decreased $12 million in 2012 due to a decrease of 4.2% in KWH sales as a result of lower demand because the market cost of available energy was lower than the cost of Company-owned generation. In 2012, lower demand also resulted from the milder weather.
Other operating revenues increased $18 million, or 5.4%, in 2013 from the prior year primarily due to higher revenues from transmission, pole attachments, and outdoor lighting. Other operating revenues increased $7 million, or 2.1%, in 2012 from the prior year primarily due to higher revenues from outdoor lighting and pole attachments.
II-201
MANAGEMENT'S DISCUSSION AND ANALYSIS (continued)
Georgia Power Company 2013 Annual Report
Energy Sales
Changes in revenues are influenced heavily by the change in the volume of energy sold from year to year. KWH sales for 2013 and the percent change by year were as follows:
|
Total
KWHs
|
Total KWH
Percent Change
|
Weather-Adjusted
Percent Change
|
||||||||||||
|
2013
|
2013
|
2012
|
2013*
|
2012
|
||||||||||
|
(in billions)
|
||||||||||||||
|
Residential
|
25.5
|
|
(1.0
|
)%
|
(5.4
|
)%
|
0.1
|
%
|
0.3
|
%
|
||||
|
Commercial
|
32.0
|
|
(0.9
|
)
|
(1.9
|
)
|
(0.2
|
)
|
(0.6
|
)
|
||||
|
Industrial
|
23.1
|
|
—
|
|
(1.8
|
)
|
0.7
|
|
(1.2
|
)
|
||||
|
Other
|
0.6
|
|
(1.8
|
)
|
(2.5
|
)
|
(1.8
|
)
|
(2.0
|
)
|
||||
|
Total retail
|
81.2
|
|
(0.7
|
)
|
(3.0
|
)
|
0.1
|
%
|
(0.5
|
)%
|
||||
|
Wholesale
|
||||||||||||||
|
Non-affiliates
|
3.0
|
|
3.3
|
|
(24.9
|
)
|
||||||||
|
Affiliates
|
0.5
|
|
(17.4
|
)
|
(4.2
|
)
|
||||||||
|
Total wholesale
|
3.5
|
|
(0.2
|
)
|
(22.0
|
)
|
||||||||
|
Total energy sales
|
84.7
|
|
(0.7
|
)%
|
(4.0
|
)%
|
||||||||
|
*
|
In the first quarter 2012, the Company began using new actual advanced meter data to compute unbilled revenues. The weather-adjusted KWH sales variances shown above reflect an adjustment to the estimated allocation of the Company's unbilled January 2012 KWH sales among customer classes that is consistent with the actual allocation in 2013. Without this adjustment, 2013 weather-adjusted residential KWH sales decreased 0.4% as compared to 2012 while weather-adjusted commercial KWH sales increased 0.2% as compared to 2012.
|
Changes in retail energy sales are comprised of changes in electricity usage by customers, changes in weather, and changes in the number of customers.
In 2013, KWH sales for residential and commercial customer classes decreased compared to 2012 primarily due to milder weather in 2013. Industrial sales were flat in 2013 compared to 2012. Increased demand in the paper, textiles, and stone, clay, and glass sectors were the main contributors to the increase in weather-adjusted industrial sales.
In 2012, KWH sales for all customer classes decreased compared to 2011 primarily due to milder weather in 2012. Economic uncertainty continues to impact sales for all customer classes as well; however, an increase of approximately 15,000 new residential customers in 2012 contributed to a slight increase in weather-adjusted residential KWH sales.
See "Operating Revenues" above for a discussion of significant changes in wholesale sales to non-affiliates and affiliated companies.
Fuel and Purchased Power Expenses
Fuel costs constitute the single largest expense for the Company. The mix of fuel sources for generation of electricity is determined primarily by demand, the unit cost of fuel consumed, and the availability of generating units. Additionally, the Company purchases a portion of its electricity needs from the wholesale market.
II-202
MANAGEMENT'S DISCUSSION AND ANALYSIS (continued)
Georgia Power Company 2013 Annual Report
Details of the Company's generation and purchased power were as follows:
|
2013
|
2012
|
2011
|
||||||
|
Total generation
(billions of KWHs)
|
66.8
|
|
59.8
|
|
65.5
|
|
||
|
Total purchased power
(billions of KWHs)
|
21.4
|
|
28.7
|
|
26.8
|
|
||
|
Sources of generation
(percent) -
|
||||||||
|
Coal
|
35
|
|
39
|
|
62
|
|
||
|
Nuclear
|
23
|
|
27
|
|
23
|
|
||
|
Gas
|
39
|
|
33
|
|
13
|
|
||
|
Hydro
|
3
|
|
1
|
|
2
|
|
||
|
Cost of fuel, generated
(cents per net KWH) -
|
||||||||
|
Coal
|
4.92
|
|
4.63
|
|
4.70
|
|
||
|
Nuclear
|
0.91
|
|
0.87
|
|
0.78
|
|
||
|
Gas
|
3.33
|
|
3.02
|
|
4.92
|
|
||
|
Average cost of fuel, generated
(cents per net KWH)
|
3.32
|
|
3.07
|
|
3.80
|
|
||
|
Average cost of purchased power
(cents per net KWH) *
|
4.83
|
|
4.24
|
|
5.38
|
|
||
|
*
|
Average cost of purchased power includes fuel purchased by the Company for tolling agreements where power is generated by the provider.
|
Fuel and purchased power expenses were $3.2 billion in 2013, an increase of $159 million, or 5.2%, compared to 2012. The increase was primarily due to a $284 million increase in the average cost of fuel and purchased power primarily due to higher natural gas prices and a $185 million increase due to an increase in the volume of KWHs generated, partially offset by a $310 million decrease due to a decrease in the volume of KWHs purchased, as the cost of Company-owned generation was lower than the market cost of available energy.
Fuel and purchased power expenses were $3.0 billion in 2012, a decrease of $860 million, or 22.1%, compared to 2011. The decrease was primarily due to a $703 million decrease in the average cost of fuel and purchased power primarily due to lower natural gas prices and a $259 million decrease due to a decrease in the volume of KWHs generated as a result of lower customer demand from milder weather in 2012. These decreases were partially offset by a $102 million increase due to an increase in the volume of KWHs purchased, as the market cost of available energy was lower than the additional Company-owned generation available.
Fuel and purchased power energy transactions do not have a significant impact on earnings since these fuel expenses are generally offset by fuel revenues through the Company's fuel cost recovery mechanism. See FUTURE EARNINGS POTENTIAL – "PSC Matters – Fuel Cost Recovery" herein for additional information.
Fuel
Fuel expense was $2.3 billion in 2013, an increase of $256 million, or 12.5%, compared to 2012. The increase was primarily due to a 9.9% increase in the volume of KWHs generated as a result of higher prices for purchased power and an 8.1% increase in the average cost of fuel per KWH generated for all types of fuel generation, partially offset by a 191.0% increase in the volume of KWHs generated by hydro facilities resulting from greater rainfall. Fuel expense was $2.1 billion in 2012, a decrease of $738 million, or 26.5%, compared to 2011. The decrease was primarily due to an 8.4% decrease in KWHs generated as a result of lower demand and a 19.2% decrease in the average cost of fuel per KWH generated primarily due to lower natural gas prices. In addition, the Company's fuel mix for generation changed from 62% coal and 13% natural gas in 2011 to 39% coal and 33% natural gas in 2012 primarily due to the completion of the Plant McDonough-Atkinson combined cycle units.
Purchased Power - Non-Affiliates
Purchased power expense from non-affiliates was $224 million in 2013, a decrease of $91 million, or 28.9%, compared to 2012. The decrease was primarily due to a 52.0% decrease in the volume of KWHs purchased as the cost of Company-owned generation was lower than the market cost of available energy, partially offset by an increase of 41.5% in the average cost per KWH purchased primarily due to higher fuel prices. Purchased power expense from non-affiliates was $315 million in 2012, a decrease of $75 million, or 19.2%, compared to 2011. The decrease was due to a 23.8% decrease in the average cost per KWH purchased primarily due to lower natural gas prices, partially offset by a 7.0% increase in the volume of KWHs purchased, as the market cost of available energy was lower than the cost of additional Company-owned generation.
II-203
MANAGEMENT'S DISCUSSION AND ANALYSIS (continued)
Georgia Power Company 2013 Annual Report
Energy purchases from non-affiliates will vary depending on the market prices of wholesale energy as compared to the cost of the Southern Company system's generation, demand for energy within the Southern Company system's service territory, and the availability of the Southern Company system's generation.
Purchased Power - Affiliates
Purchased power expense from affiliates was $660 million in 2013, a decrease of $6 million, or 0.9%, compared to 2012. The decrease was primarily due to an 18.4% decrease in the volume of KWHs purchased as the Company’s units generally dispatched at a lower cost than other Southern Company system resources, partially offset by a 12.6% increase in the average cost per KWH purchased reflecting higher fuel prices. Purchased power expense from affiliates was $666 million in 2012, a decrease of $47 million, or 6.6%, compared to 2011. The decrease was primarily due to a 20.2% decrease in the average cost per KWH purchased, reflecting lower natural gas prices, partially offset by a 7.1% increase in the volume of KWHs purchased as the cost of the available energy was lower than the cost of Company-owned generation available.
Energy purchases from affiliates will vary depending on the demand and the availability and cost of generating resources at each company within the Southern Company system. These purchases are made in accordance with the IIC or other contractual agreements, all as approved by the FERC.
Other Operations and Maintenance Expenses
In 2013, other operations and maintenance expenses increased $10 million, or 0.6%, compared to 2012. The increase was primarily due to an increase of $33 million in pension and other employee benefit-related expenses and $13 million in transmission system load expense resulting from billing adjustments with integrated transmission system owners, partially offset by a decrease of $38 million in fossil generating expenses due to cost containment and outage timing to offset milder weather in 2013 as compared to 2012 and the effect of economic uncertainty.
In 2012, other operations and maintenance expenses decreased $133 million, or 7.5%, compared to 2011. The decrease was primarily due to the timing of planned generation outages and decreases in transmission and distribution maintenance as a result of cost containment efforts to offset the effects of milder weather in 2012 and a decrease in uncollectible account expense of $24 million, as a result of lower revenues, a slightly improving economy, and a change in the customer deposit policy, partially offset by a net increase in pension and other employee benefit-related expenses of $14 million.
Depreciation and Amortization
Depreciation and amortization increased $62 million, or 8.3%, in 2013 compared to 2012. The increase was primarily due to an increase of $64 million in depreciation on additional plant in service due to the completion of Plant McDonough-Atkinson Units 5 and 6 in April 2012 and October 2012, respectively, and depreciation and amortization resulting from certain coal unit retirement decisions (with respect to the portion of such units dedicated to wholesale service). The increase was partially offset by a net reduction in amortization primarily related to amortization of the regulatory liability previously established for state income tax credits, as authorized by the Georgia PSC. See Note 1 to the financial statements under "Regulatory Assets and Liabilities" for additional information on the state income tax credits regulatory liability.
Depreciation and amortization increased $30 million, or 4.2%, in 2012 compared to 2011. The increase was primarily due to an increase of $50 million in depreciation on additional plant in service primarily related to new generation at Plant McDonough-Atkinson Units 4 and 5, partially offset by $27 million in amortization of the regulatory liability for state income tax credits as authorized by the Georgia PSC. See Note 1 to the financial statements under "Regulatory Assets and Liabilities" for additional information.
See Note 1 to the financial statements under "Depreciation and Amortization" for additional information.
Taxes Other Than Income Taxes
In 2013, taxes other than income taxes increased $8 million, or 2.1%, compared to 2012. The increase was primarily due to an increase in property taxes.
In 2012, taxes other than income taxes increased $5 million, or 1.4%, compared to 2011. The increase was primarily due to a $20 million increase in property taxes, partially offset by a $12 million decrease in municipal franchise fees resulting from lower retail revenues in 2012.
Allowance for Funds Used During Construction Equity
AFUDC equity decreased $23 million, or 43.4%, in 2013 compared to the prior year primarily due to the completion of Plant McDonough-Atkinson Units 5 and 6 in April 2012 and October 2012, respectively.
II-204
MANAGEMENT'S DISCUSSION AND ANALYSIS (continued)
Georgia Power Company 2013 Annual Report
AFUDC equity decreased $43 million, or 44.8%, in 2012 compared to the prior year primarily due to the completion of Plant McDonough-Atkinson Units 4, 5, and 6 in December 2011, April 2012, and October 2012, respectively.
Interest Expense, Net of Amounts Capitalized
In 2013, interest expense, net of amounts capitalized decreased $5 million, or 1.4%, from the prior year. The decrease was primarily due to a $21 million decrease in interest on long-term debt as a result of refinancing activity, partially offset by an $8 million decrease in AFUDC debt primarily due to the completion of Plant McDonough Units 5 and 6 discussed previously and a $9 million increase resulting from the conclusion of certain state and federal income tax audits that reduced interest expense in 2012.
In 2012, interest expense, net of amounts capitalized increased $23 million, or 6.7%, from the prior year primarily due to a $23 million reduction in interest expense in 2011 resulting from the settlement of litigation with the Georgia DOR, a $16 million decrease in AFUDC debt in 2012 primarily due to the completion of Plant McDonough-Atkinson Units 4 and 5 discussed previously, and a net increase of $18 million in interest expense related to outstanding senior notes. The increase was partially offset by reductions in expense related to pollution control revenue bonds, the redemption of all trust preferred securities in September 2011, and the conclusion of certain state and federal income tax audits in 2012 of $13 million, $9 million, and $9 million, respectively.
Other Income (Expense), net
In 2013, other income (expense), net increased $22 million, or 129.4%, from the prior year primarily due to an $8 million increase in wholesale operating fees and a $9 million decrease in donations.
In 2012, other income (expense), net decreased $4 million, or 30.8%, from the prior year. The decrease was not material.
Income Taxes
Income taxes increased $35 million, or 5.1%, in 2013 compared to the prior year primarily due to a decrease in state income tax credits, higher pre-tax earnings, and a decrease in non-taxable AFUDC equity, partially offset by a decrease in non-deductible book depreciation.
Income taxes increased $63 million, or 10.1%, in 2012 compared to the prior year primarily due to higher pre-tax earnings, an increase in non-deductible book depreciation, and a decrease in non-taxable AFUDC equity, partially offset by state income tax credits.
See "Allowance for Funds Used During Construction Equity" herein for additional information.
Effects of Inflation
The Company is subject to rate regulation that is generally based on the recovery of historical and projected costs. The effects of inflation can create an economic loss since the recovery of costs could be in dollars that have less purchasing power. Any adverse effect of inflation on the Company's results of operations has not been substantial in recent years.
FUTURE EARNINGS POTENTIAL
General
The Company operates as a vertically integrated utility providing electricity to retail customers within its traditional service area located within the State of Georgia and to wholesale customers in the Southeast. Prices for electricity provided by the Company to retail customers are set by the Georgia PSC under cost-based regulatory principles. Prices for wholesale electricity sales, interconnecting transmission lines, and the exchange of electric power are regulated by the FERC. Retail rates and earnings are reviewed and may be adjusted periodically within certain limitations. See ACCOUNTING POLICIES – "Application of Critical Accounting Policies and Estimates – Electric Utility Regulation" herein and Note 3 to the financial statements under "Retail Regulatory Matters" for additional information about regulatory matters.
The results of operations for the past three years are not necessarily indicative of future earnings potential. The level of the Company's future earnings depends on numerous factors that affect the opportunities, challenges, and risks of the Company's business of selling electricity. These factors include the Company's ability to maintain a constructive regulatory environment that continues to allow for the timely recovery of prudently-incurred costs during a time of increasing costs and the successful completion of ongoing construction projects, including the construction of Plant Vogtle Units 3 and 4. Future earnings in the near term will depend, in part, upon maintaining energy sales which is subject to a number of factors. These factors include weather, competition, new energy contracts with other utilities, energy conservation practiced by customers, the price of electricity, the
II-205
MANAGEMENT'S DISCUSSION AND ANALYSIS (continued)
Georgia Power Company 2013 Annual Report
price elasticity of demand, and the rate of economic growth or decline in the Company's service territory. Changes in regional and global economic conditions impact sales for the Company, as the pace of the economic recovery remains uncertain. The timing and extent of the economic recovery will impact growth and may impact future earnings.
In 2013, the Company's generating capacity decreased 398 megawatts (MWs) due to the retirements of Plant Bowen Unit 6 on April 25, 2013, Plant Boulevard Units 2 and 3 on July 17, 2013, and Plant Branch Unit 2 on September 30, 2013. New generating capacity and retirements are approved by the Georgia PSC through the Integrated Resource Plan (IRP) process. See "PSC Matters – Integrated Resource Plans" herein and Note 3 to the financial statements under "Retail Regulatory Matters – Integrated Resource Plans" for additional information.
Environmental Matters
Compliance costs related to federal and state environmental statutes and regulations could affect earnings if such costs cannot continue to be fully recovered in rates on a timely basis. Environmental compliance spending over the next several years may differ materially from the amounts estimated. The timing, specific requirements, and estimated costs could change as environmental statutes and regulations are adopted or modified. The Company's Environmental Compliance Cost Recovery (ECCR) tariff allows for the recovery of capital and operations and maintenance costs related to environmental controls mandated by state and federal regulations. Further, higher costs that are recovered through regulated rates could contribute to reduced demand for electricity, which could negatively affect results of operations, cash flows, and financial condition. See Note 3 to the financial statements under "Environmental Matters" for additional information.
New Source Review Actions
As part of a nationwide enforcement initiative against the electric utility industry which began in 1999, the U.S. Environmental Protection Agency (EPA) brought civil enforcement actions in federal district court against the Company alleging violations of the New Source Review (NSR) provisions of the Clean Air Act at certain coal-fired electric generating units, including a unit co-owned by Gulf Power Company (Gulf Power). These civil actions seek penalties and injunctive relief, including orders requiring installation of the best available control technologies at the affected units. The case against the Company (including claims related to a unit co-owned by Gulf Power) has been administratively closed in the U.S. District Court for the Northern District of Georgia since 2001.
The Company believes it complied with applicable laws and regulations in effect at the time the work in question took place. The Clean Air Act authorizes maximum civil penalties of $25,000 to $37,500 per day, per violation, depending on the date of the alleged violation. An adverse outcome could require substantial capital expenditures that cannot be determined at this time and could possibly require payment of substantial penalties. Such expenditures could affect future results of operations, cash flows, and financial condition if such costs are not recovered through regulated rates. The ultimate outcome of this matter cannot be determined at this time.
Environmental Statutes and Regulations
General
The Company's operations are subject to extensive regulation by state and federal environmental agencies under a variety of statutes and regulations governing environmental media, including air, water, and land resources. Applicable statutes include the Clean Air Act; the Clean Water Act; the Comprehensive Environmental Response, Compensation, and Liability Act; the Resource Conservation and Recovery Act; the Toxic Substances Control Act; the Emergency Planning & Community Right-to-Know Act; the Endangered Species Act; and related federal and state regulations. Compliance with these environmental requirements involves significant capital and operating costs, a major portion of which is expected to be recovered through existing ratemaking provisions. Through 2013, the Company had invested approximately $4.3 billion in environmental capital retrofit projects to comply with these requirements, with annual totals of approximately $309 million, $152 million, and $113 million in 2013, 2012, and 2011, respectively. The Company expects that capital expenditures to comply with environmental statutes and regulations will total approximately $1.1 billion from 2014 through 2016, with annual totals of approximately $543 million, $366 million, and $202 million for 2014, 2015, and 2016, respectively.
The Company continues to monitor the development of the EPA's proposed water and coal combustion residuals rules and to evaluate compliance options. Based on its preliminary analysis and an assumption that coal combustion residuals will continue to be regulated as non-hazardous solid waste under the proposed rule, the Company does not anticipate that material compliance costs with respect to these proposed rules will be required during the period of 2014 through 2016. The ultimate capital expenditures and compliance costs with respect to these proposed rules, including additional expenditures required after 2016,
II-206
MANAGEMENT'S DISCUSSION AND ANALYSIS (continued)
Georgia Power Company 2013 Annual Report
will be dependent on the requirements of the final rules and regulations adopted by the EPA and the outcome of any legal challenges to these rules. See "Water Quality" and "Coal Combustion Residuals" herein for additional information.
The Company's ultimate environmental compliance strategy, including potential unit retirement and replacement decisions, and future environmental capital expenditures will be affected by the final requirements of new or revised environmental regulations and regulations relating to global climate change that are promulgated, including the proposed environmental regulations described below; the outcome of any legal challenges to the environmental rules; the cost, availability, and existing inventory of emissions allowances; and the Company's fuel mix. Compliance costs may arise from existing unit retirements, installation of additional environmental controls, upgrades to the transmission system, and adding or changing fuel sources for certain existing units. The ultimate outcome of these matters cannot be determined at this time. See "PSC Matters – Integrated Resource Plans" herein for additional information on planned unit retirements and fuel conversions.
Southern Electric Generating Company (SEGCO), a subsidiary of the Company, is jointly owned with Alabama Power. As part of its environmental compliance strategy, SEGCO plans to add natural gas as the primary fuel source for its generating units in 2015. The capacity of SEGCO's units is sold equally to the Company and Alabama Power through a PPA. If such compliance costs cannot continue to be recovered through retail rates, they could have a material financial impact on the Company's financial statements. See Note 4 to the Company's financial statements for additional information.
Compliance with any new federal or state legislation or regulations relating to air quality, water, coal combustion residuals, global climate change, or other environmental and health concerns could significantly affect the Company. Although new or revised environmental legislation or regulations could affect many areas of the Company's operations, the full impact of any such changes cannot be determined at this time. Additionally, many of the Company's commercial and industrial customers may also be affected by existing and future environmental requirements, which for some may have the potential to ultimately affect their demand for electricity.
Air Quality
Compliance with the Clean Air Act and resulting regulations has been and will continue to be a significant focus for the Company. Since 1990, the Company has spent approximately $3.9 billion in reducing and monitoring emissions pursuant to the Clean Air Act. Additional controls are currently planned or under consideration to further reduce air emissions, maintain compliance with existing regulations, and meet new requirements.
The EPA regulates ground level ozone concentrations through implementation of an eight-hour ozone National Ambient Air Quality Standard (NAAQS). In 2008, the EPA adopted a more stringent eight-hour ozone NAAQS, which it began to implement in 2011. In May 2012, the EPA published its final determination of nonattainment areas based on the 2008 eight-hour ozone NAAQS. The only area within the Company's service territory designated as a nonattainment area is a 15-county area within metropolitan Atlanta.
The EPA regulates fine particulate matter concentrations on an annual and 24-hour average basis. All areas within the Company's service territory have achieved attainment with the 1997 and 2006 particulate matter NAAQS, and the EPA has officially redesignated some former nonattainment areas within the service territory as attainment for these standards. Redesignation requests for certain areas designated as nonattainment in Georgia are still pending with the EPA. On January 15, 2013, the EPA published a final rule that increases the stringency of the annual fine particulate matter standard. The new standard could result in the designation of new nonattainment areas within the Company's service territory.
Final revisions to the NAAQS for sulfur dioxide (SO
2
)
,
which established a new one-hour standard, became effective in 2010. No areas within the Company's service territory have been designated as nonattainment under this rule. However, the EPA may designate additional areas as nonattainment in the future, which could include areas within the Company's service territory. Implementation of the revised SO
2
standard could require additional reductions in SO
2
emissions and increased compliance and operational costs.
The Company's service territory is subject to the requirements of the Clean Air Interstate Rule (CAIR), which calls for phased reductions in SO
2
and nitrogen oxide (NO
x
) emissions from power plants in 28 eastern states. In 2008, the U.S. Court of Appeals for the District of Columbia Circuit issued decisions invalidating CAIR, but left CAIR compliance requirements in place while the EPA developed a new rule. In 2011, the EPA promulgated the Cross State Air Pollution Rule (CSAPR) to replace CAIR. However, in August 2012, the U.S. Court of Appeals for the District of Columbia Circuit vacated CSAPR in its entirety and directed the EPA to continue to administer CAIR pending the EPA's development of a valid replacement. Review of the U.S. Court of Appeals for the District of Columbia Circuit's decision regarding CSAPR is currently pending before the U.S. Supreme Court.
II-207
MANAGEMENT'S DISCUSSION AND ANALYSIS (continued)
Georgia Power Company 2013 Annual Report
The EPA finalized the Clean Air Visibility Rule (CAVR) in 2005, with a goal of restoring natural visibility conditions in certain areas (primarily national parks and wilderness areas) by 2064. The rule involves the application of best available retrofit technology to certain sources built between 1962 and 1977 and any additional emissions reductions necessary for each designated area to achieve reasonable progress toward the natural visibility conditions goal by 2018 and for each 10-year period thereafter.
In February 2012, the EPA finalized the Mercury and Air Toxics Standards (MATS) rule, which imposes stringent emissions limits for acid gases, mercury, and particulate matter on coal- and oil-fired electric utility steam generating units. Compliance for existing sources is required by April 16, 2015; however, states may authorize a compliance extension of up to one year to April 16, 2016. Compliance extensions have been granted for some of the Company's affected units.
In August 2012, the EPA published proposed revisions to the New Source Performance Standard (NSPS) for Stationary Combustion Turbines (CTs). If finalized as proposed, the revisions would apply the NSPS to all new, reconstructed, and modified CTs (including CTs at combined cycle units), during all periods of operation, including startup and shutdown, and alter the criteria for determining when an existing CT has been reconstructed.
On February 12, 2013, the EPA proposed a rule that would require certain states to revise the provisions of their State Implementation Plans (SIPs) relating to the regulation of excess emissions at industrial facilities, including fossil fuel-fired generating facilities, during periods of startup, shut-down, or malfunction (SSM). The EPA proposes a determination that the SSM provisions in the SIPs for 36 states, including Georgia, Alabama, and Florida, do not meet the requirements of the Clean Air Act and must be revised within 18 months of the date on which the EPA publishes the final rule. The EPA has entered into a settlement agreement requiring it to finalize the rule by June 12, 2014.
The Company has developed and continually updates a comprehensive environmental compliance strategy to assess compliance obligations associated with the current and proposed environmental requirements discussed above. The impacts of the eight-hour ozone, fine particulate matter and SO
2
NAAQS, CAIR and any future replacement rule, CAVR, the MATS rule, the NSPS for CTs, and the SSM rule on the Company cannot be determined at this time and will depend on the specific provisions of recently finalized and future rules, the resolution of pending and future legal challenges, and the development and implementation of rules at the state level. These regulations could result in significant additional compliance costs that could affect future unit retirement and replacement decisions and results of operations, cash flows, and financial condition if such costs are not recovered through regulated rates. Further, higher costs that are recovered through regulated rates could contribute to reduced demand for electricity, which could negatively impact results of operations, cash flows, and financial condition.
In addition to the federal air quality laws described above, the Company is also subject to the requirements of the 2007 State of Georgia Multi-Pollutant Rule. The Multi-Pollutant Rule, as amended, is designed to reduce emissions of mercury, SO
2
, and NO
x
state-wide by requiring the installation of specified control technologies at certain coal-fired generating units by specific dates between December 31, 2008 and April 16, 2015. A companion rule requires a 95% reduction in SO
2
emissions from the controlled units on the same or similar timetable. Through December 31, 2013, the Company had installed the required controls on 13 of its largest coal-fired generating units with projects on three additional units to be completed before the unit-specific installation deadlines.
Water Quality
In 2011, the EPA published a proposed rule that establishes standards for reducing effects on fish and other aquatic life caused by cooling water intake structures at existing power plants and manufacturing facilities. The rule also addresses cooling water intake structures for new units at existing facilities. Compliance with the proposed rule could require changes to existing cooling water intake structures at certain of the Company's generating facilities, and new generating units constructed at existing plants would be required to install closed cycle cooling towers. The EPA is required to issue a final rule by April 17, 2014.
On June 7, 2013, the EPA published a proposed rule which requested comments on a range of potential regulatory options for addressing certain wastestreams from steam electric power plants. These regulations could result in the installation of additional controls at certain of the facilities of the Company, which could result in significant capital expenditures and compliance costs that could affect future unit retirement and replacement decisions, depending on the specific technology requirements of the final rule.
The impact of these proposed rules cannot be determined at this time and will depend on the specific provisions of the final rules and the outcome of any legal challenges. These regulations could result in significant additional capital expenditures and compliance costs that could affect future unit retirement and replacement decisions. Also, results of operations, cash flows, and financial condition could be significantly impacted if such costs are not recovered through regulated rates. Further, higher costs that are recovered through regulated rates could contribute to reduced demand for electricity, which could negatively impact results of operations, cash flows, and financial condition.
II-208
MANAGEMENT'S DISCUSSION AND ANALYSIS (continued)
Georgia Power Company 2013 Annual Report
Coal Combustion Residuals
The Company currently operates 11 electric generating plants with on-site coal combustion residuals, including coal ash and gypsum storage facilities. In addition to on-site storage, the Company also sells a portion of its coal combustion residuals to third parties for beneficial reuse. Historically, individual states have regulated coal combustion residuals and the States of Georgia and Alabama have their own separate regulatory requirements. The Company has a routine and robust inspection program in place to ensure the integrity of its coal ash surface impoundments and compliance with applicable regulations.
The EPA continues to evaluate the regulatory program for coal combustion residuals, including coal ash and gypsum, under federal solid and hazardous waste laws. In 2010, the EPA published a proposed rule that requested comments on two potential regulatory options for the management and disposal of coal combustion residuals: regulation as a solid waste or regulation as if the materials technically constituted a hazardous waste. Adoption of either option could require closure of, or significant change to, existing storage facilities and construction of lined landfills, as well as additional waste management and groundwater monitoring requirements. Under both options, the EPA proposes to exempt the beneficial reuse of coal combustion residuals from regulation; however, a hazardous or other designation indicative of heightened risk could limit or eliminate beneficial reuse options. Environmental groups and other parties have filed lawsuits in the U.S. District Court for the District of Columbia seeking to require the EPA to complete its rulemaking process and issue final regulations pertaining to the regulation of coal combustion residuals. On September 30, 2013, the U.S. District Court for the District of Columbia issued an order granting partial summary judgment to the environmental groups and other parties, ruling that the EPA has a statutory obligation to review and revise, as necessary, the federal solid waste regulations applicable to coal combustion residuals. On January 29, 2014, the EPA filed a consent decree requiring the EPA to take final action regarding the proposed regulation of coal combustion residuals as solid waste by December 19, 2014
.
While the ultimate outcome of this matter cannot be determined at this time and will depend on the final form of any rules adopted and the outcome of any legal challenges, additional regulation of coal combustion residuals could have a material impact on the generation, management, beneficial use, and disposal of such residuals. Any material changes are likely to result in substantial additional compliance, operational, and capital costs that could affect future unit retirement and replacement decisions. Moreover, the Company could incur additional material asset retirement obligations with respect to closing existing storage facilities. The Company's results of operations, cash flows, and financial condition could be significantly impacted if such costs are not recovered through regulated rates. Further, higher costs that are recovered through regulated rates could contribute to reduced demand for electricity, which could negatively impact results of operations, cash flows, and financial condition.
Environmental Remediation
The Company must comply with other environmental laws and regulations that cover the handling and disposal of waste and releases of hazardous substances. Under these various laws and regulations, the Company may also incur substantial costs to clean up properties. The Company conducts studies to determine the extent of any required cleanup and has recognized in its financial statements the costs to clean up known impacted sites. Amounts for cleanup and ongoing monitoring costs were not material for any year presented. The Company may be liable for some or all required cleanup costs for additional sites that may require environmental remediation. See Notes 1 and 3 to the financial statements under "Environmental Remediation Recovery" and "Environmental Matters – Environmental Remediation," respectively, for additional information.
Global Climate Issues
The EPA currently regulates greenhouse gases under the Prevention of Significant Deterioration and Title V operating permit programs of the Clean Air Act. The legal basis for these regulations is currently being challenged in the U.S. Supreme Court. In addition, over the past several years, the U.S. Congress has considered many proposals to reduce greenhouse gas emissions, mandate renewable or clean energy, and impose energy efficiency standards. Such proposals are expected to continue to be considered by the U.S. Congress. International climate change negotiations under the United Nations Framework Convention on Climate Change are also continuing.
On January 8, 2014, the EPA published re-proposed regulations to establish standards of performance for greenhouse gas emissions from new fossil fuel steam electric generating units. A Presidential memorandum issued on June 25, 2013 also directs the EPA to propose standards, regulations, or guidelines for addressing modified, reconstructed, and existing steam electric generating units by June 1, 2014.
Although the outcome of any federal, state, and international initiatives, including the EPA's proposed regulations and guidelines discussed above, will depend on the scope and specific requirements of the proposed and final rules and the outcome of any legal challenges and, therefore, cannot be determined at this time, additional restrictions on the Company's greenhouse gas emissions or requirements relating to renewable energy or energy efficiency at the federal or state level could result in significant additional
II-209
MANAGEMENT'S DISCUSSION AND ANALYSIS (continued)
Georgia Power Company 2013 Annual Report
compliance costs, including capital expenditures. These costs could affect future unit retirement and replacement decisions and could result in the retirement of additional coal-fired generating units. Also, additional compliance costs and costs related to unit retirements could affect results of operations, cash flows, and financial condition if such costs are not recovered through regulated rates. Further, higher costs that are recovered through regulated rates could contribute to reduced demand for electricity, which could negatively impact results of operations, cash flows, and financial condition.
The EPA's greenhouse gas reporting rule requires annual reporting of carbon dioxide equivalent emissions in metric tons for a company's operational control of facilities. Based on ownership or financial control of facilities, the Company's 2012 greenhouse gas emissions were approximately 32 million metric tons of carbon dioxide equivalent. The preliminary estimate of the Company's 2013 greenhouse gas emissions on the same basis is approximately 33 million metric tons of carbon dioxide equivalent. The level of greenhouse gas emissions from year to year will depend on the level of generation and mix of fuel sources and other factors.
PSC Matters
Rate Plans
In 2010, the Georgia PSC approved the 2010 ARP, which resulted in base rate increases of approximately $562 million, $17 million, $125 million, and $74 million effective January 1, 2011, January 1, 2012, April 1, 2012, and January 1, 2013, respectively.
On December 17, 2013, the Georgia PSC voted to approve the 2013 ARP. The 2013 ARP reflects the settlement agreement among the Company, the Georgia PSC’s Public Interest Advocacy Staff, and 11 of the 13 intervenors, which was filed with the Georgia PSC on November 18, 2013.
On January 1, 2014, in accordance with the 2013 ARP, the Company increased its tariffs as follows: (1) traditional base tariff rates by approximately $80 million; (2) ECCR tariff by an additional $25 million; (3) Demand-Side Management (DSM) tariffs by an additional $1 million; and (4) Municipal Franchise Fee (MFF) tariff by an additional $4 million, for a total increase in base revenues of approximately $110 million.
Under the 2013 ARP, the following additional rate adjustments will be made to the Company’s tariffs in 2015 and 2016 based on annual compliance filings to be made at least 90 days prior to the effective date of the tariffs:
|
•
|
Effective January 1, 2015 and 2016, the traditional base tariff rates will increase by an estimated $101 million and $36 million, respectively, to recover additional generation capacity-related costs;
|
|
•
|
Effective January 1, 2015 and 2016, the ECCR tariff will increase by an estimated $76 million and $131 million, respectively, to recover additional environmental compliance costs;
|
|
•
|
Effective January 1, 2015, the DSM tariffs will increase by an estimated $6 million and decrease by an estimated $1 million effective January 1, 2016; and
|
|
•
|
The MFF tariff will increase consistent with these adjustments.
|
The Company currently estimates these adjustments will result in base revenue increases of approximately $187 million in 2015 and $170 million in 2016. The estimated traditional base tariff rate increases for 2015 and 2016 do not include additional Qualifying Facility (QF) PPA expenses; however, compliance filings will include QF PPA expenses for those facilities that are projected to provide capacity to the Company during the following year.
Under the 2013 ARP, the Company’s retail return on common equity (ROE) is set at 10.95%, and earnings are evaluated against a retail ROE range of 10.00% to 12.00%. Two-thirds of any earnings above 12.00% will be directly refunded to customers, with the remaining one-third retained by the Company. There will be no recovery of any earnings shortfall below 10.00% on an actual basis. However, if at any time during the term of the 2013 ARP, the Company projects that its retail earnings will be below 10.00% for any calendar year, it may petition the Georgia PSC for implementation of the Interim Cost Recovery (ICR) tariff that would be used to adjust the Company’s earnings back to a 10.00% retail ROE. The Georgia PSC would have 90 days to rule on the Company’s request. The ICR tariff will expire at the earlier of January 1, 2017 or the end of the calendar year in which the ICR tariff becomes effective. In lieu of requesting implementation of an ICR tariff, or if the Georgia PSC chooses not to implement the ICR tariff, the Company may file a full rate case.
Except as provided above, the Company will not file for a general base rate increase while the 2013 ARP is in effect. The Company is required to file a general rate case by July 1, 2016, in response to which the Georgia PSC would be expected to determine whether the 2013 ARP should be continued, modified, or discontinued.
II-210
MANAGEMENT'S DISCUSSION AND ANALYSIS (continued)
Georgia Power Company 2013 Annual Report
Integrated Resource Plans
See "Environmental Matters – Environmental Statutes and Regulations – Air Quality," "– Water Quality," and "– Coal Combustion Residuals" and "Rate Plans" herein for additional information regarding proposed and final EPA rules and regulations, including the MATS rule for coal- and oil-fired electric utility steam generating units, revisions to effluent limitations guidelines for steam electric power plants, and additional regulation of coal combustion residuals; the State of Georgia's Multi-Pollutant Rule; the Company's analysis of the potential costs and benefits of installing the required controls on its fossil generating units in light of these regulations; and the Company's latest triennial IRP as approved by the Georgia PSC (2013 IRP).
On January 31, 2013, the Company filed its 2013 IRP. The filing included the Company's request to decertify 16 coal- and oil-fired units totaling 2,093 MWs. Several factors, including the cost to comply with existing and future environmental regulations, recent and forecasted economic conditions, and lower natural gas prices, contributed to the decision to close these units.
On April 17, 2013, the Georgia PSC approved the decertification of Plant Bowen Unit 6 (32 MWs), which was retired on April 25, 2013. On September 30, 2013, Plant Branch Unit 2 (319 MWs) was retired as approved by the Georgia PSC in the 2011 IRP Update (2011 IRP Update) in order to comply with the State of Georgia's Multi-Pollutant Rule.
On July 11, 2013, the Georgia PSC approved the Company's request to decertify and retire Plant Boulevard Units 2 and 3 (28 MWs) effective July 17, 2013. Plant Branch Units 3 and 4 (1,016 MWs), Plant Yates Units 1 through 5 (579 MWs), and Plant McManus Units 1 and 2 (122 MWs) will be decertified and retired by April 16, 2015, the compliance date of the MATS rule. The decertification date of Plant Branch Unit 1 was extended from December 31, 2013 as specified in the final order in the 2011 IRP Update to coincide with the decertification date of Plant Branch Units 3 and 4. The decertification and retirement of Plant Kraft Units 1 through 4 (316 MWs) was also approved and will be effective by April 16, 2016, based on a one-year extension of the MATS rule compliance date that was approved by the State of Georgia Environmental Protection Division on September 10, 2013 to allow for necessary transmission system reliability improvements.
Additionally, the Georgia PSC approved the Company's proposed MATS rule compliance plan for emissions controls necessary for the continued operation of Plants Bowen Units 1 through 4, Wansley Units 1 and 2, Scherer Units 1 through 3, and Hammond Units 1 through 4, the switch to natural gas as the primary fuel at Plant Yates Units 6 and 7 and SEGCO's Plant Gaston Units 1 through 4, as well as the fuel switch at Plant McIntosh Unit 1 to operate on Powder River Basin coal. See Note 1 to the financial statements under "Affiliate Transactions" for additional information regarding the fuel switch at SEGCO's generating units.
In the 2013 ARP, the Georgia PSC approved the amortization of the construction work in progress (CWIP) balances related to environmental projects that will not be completed at Plant Branch Units 1 through 4 and Plant Yates Units 6 and 7 over nine years beginning in January 2014 and the amortization of any remaining net book values of Plant Branch Unit 2 from October 2013 to December 2022, Plant Branch Unit 1 from May 2015 to December 2020, Plant Branch Unit 3 from May 2015 to December 2023, and Plant Branch Unit 4 from May 2015 to December 2024. The Georgia PSC deferred a decision regarding the appropriate recovery period for the costs associated with unusable materials and supplies remaining at the retiring plants to the Company's next base rate case, which the Company expects to file in 2016 (2016 Rate Case). In the 2013 IRP, the Georgia PSC also deferred decisions regarding the recovery of any fuel related costs that could be incurred in connection with the retirement units to be addressed in future fuel cases.
A request was filed with the Georgia PSC on January 10, 2014 to cancel the proposed biomass fuel conversion of Plant Mitchell Unit 3 (155 MWs) because it would not be cost effective for customers. The filing also notified the Georgia PSC of the Company’s plans to seek decertification later this year. Plant Mitchell Unit 3 will continue to operate as a coal unit until April 2015 when it will be required to cease operation or install additional environmental controls to comply with the MATS rule. In connection with the retirement decision, the Company reclassified the retail portion of the net carrying value of Plant Mitchell Unit 3 from plant in service, net of depreciation, to other utility plant, net.
The decertification of these units and fuel conversions are not expected to have a material impact on the Company's financial statements; however, the ultimate outcome depends on the Georgia PSC's order in the 2016 Rate Case and future fuel cases and cannot be determined at this time.
Renewables Development
On December 17, 2013, four PPAs totaling 50 MWs of utility scale solar generation under the Georgia Power Advanced Solar Initiative (GPASI) were approved by the Georgia PSC, with the Company as the purchaser. These contracts will begin in 2015 and end in 2034. The resulting purchases will be for energy only and recovered through the Company’s fuel cost recovery mechanism. Under the 2013 IRP, the Georgia PSC approved an additional 525 MWs of solar generation to be purchased by the Company. The 525 MWs will be divided into 425 MWs of utility scale projects and 100 MWs of distributed generation.
II-211
MANAGEMENT'S DISCUSSION AND ANALYSIS (continued)
Georgia Power Company 2013 Annual Report
On November 4, 2013, the Company filed an application for the certification of two PPAs which were executed on April 22, 2013 for the purchase of energy from two wind farms in Oklahoma with capacity totaling 250 MWs that will begin in 2016 and end in 2035.
During 2013, the Company executed four PPAs to purchase a total of 169 MWs of biomass capacity and energy from four facilities in Georgia that will begin in 2015 and end in 2035. On May 21, 2013, the Georgia PSC approved two of the biomass PPAs and the remaining two were approved on December 17, 2013. The four biomass PPAs are contingent upon the counterparty meeting specified contract dates for posting collateral and commercial operation. The ultimate outcome of this matter cannot be determined at this time.
Fuel Cost Recovery
The Company has established fuel cost recovery rates approved by the Georgia PSC. The Georgia PSC approved reductions in the Company's total annual billings of approximately $43 million effective June 1, 2011, $567 million effective June 1, 2012, and $122 million effective January 1, 2013. The 2013 reduction was due to the Georgia PSC authorizing an Interim Fuel Rider, which is set to expire June 1, 2014. The Company continues to be allowed to adjust its fuel cost recovery rates prior to the next fuel case if the under or over recovered fuel balance exceeds $200 million. The Company's fuel cost recovery includes costs associated with a natural gas hedging program as revised and approved by the Georgia PSC on February 7, 2013. See FINANCIAL CONDITION AND LIQUIDITY – "Market Price Risk" herein and Note 11 to the financial statements under "Energy-Related Derivatives" for additional information. On February 18, 2014, the Georgia PSC approved the deferral of the Company's next fuel case, which is now expected to be filed by March 1, 2015.
The Company's over recovered fuel balance totaled approximately $58 million and $230 million at December 31, 2013 and December 31, 2012, respectively, and is included in current liabilities and other deferred credits and liabilities.
Fuel cost recovery revenues as recorded on the financial statements are adjusted for differences in actual recoverable fuel costs and amounts billed in current regulated rates. Accordingly, changes in the billing factor will not have a significant effect on the Company's revenues or net income, but will affect cash flow. See Note 3 to the financial statements under "Retail Regulatory Matters – Fuel Cost Recovery" for additional information.
Storm Damage Recovery
The Company defers and recovers certain costs related to damages from major storms as mandated by the Georgia PSC. As of December 31, 2013, the balance in the regulatory asset related to storm damage was $37 million. As a result of this regulatory treatment, the costs related to storms are generally not expected to have a material impact on the Company's financial statements. See Note 1 to the financial statements under "Storm Damage Recovery" for additional information.
Nuclear Construction
In 2008, the Company, acting for itself and as agent for Oglethorpe Power Corporation (OPC), the Municipal Electric Authority of Georgia (MEAG Power), and the City of Dalton, Georgia (Dalton), acting by and through its Board of Water, Light, and Sinking Fund Commissioners (collectively, Owners), entered into an agreement with a consortium consisting of Westinghouse Electric Company LLC (Westinghouse) and Stone & Webster, Inc. (collectively, Contractor), pursuant to which the Contractor agreed to design, engineer, procure, construct, and test two AP1000 nuclear units (with electric generating capacity of approximately 1,100 MWs each) and related facilities at Plant Vogtle (Vogtle 3 and 4 Agreement). Under the terms of the Vogtle 3 and 4 Agreement, the Owners agreed to pay a purchase price that is subject to certain price escalations and adjustments, including fixed escalation amounts and index-based adjustments, as well as adjustments for change orders, and performance bonuses for early completion and unit performance. Each Owner is severally (and not jointly) liable for its proportionate share, based on its ownership interest, of all amounts owed to the Contractor under the Vogtle 3 and 4 Agreement. The Company's proportionate share is 45.7%. The Vogtle 3 and 4 Agreement provides for liquidated damages upon the Contractor's failure to fulfill the schedule and performance guarantees. The Contractor's liability to the Owners for schedule and performance liquidated damages and warranty claims is subject to a cap.
Certain payment obligations of Westinghouse and Stone & Webster, Inc. under the Vogtle 3 and 4 Agreement are guaranteed by Toshiba Corporation and The Shaw Group, Inc., respectively. In the event of certain credit rating downgrades of any Owner, such Owner will be required to provide a letter of credit or other credit enhancement. The Owners may terminate the Vogtle 3 and 4 Agreement at any time for their convenience, provided that the Owners will be required to pay certain termination costs. The Contractor may terminate the Vogtle 3 and 4 Agreement under certain circumstances, including certain Owner suspension or delays of work, action by a governmental authority to permanently stop work, certain breaches of the Vogtle 3 and 4 Agreement by the Owners, Owner insolvency, and certain other events.
II-212
MANAGEMENT'S DISCUSSION AND ANALYSIS (continued)
Georgia Power Company 2013 Annual Report
In 2009, the U.S. Nuclear Regulatory Commission (NRC) issued an Early Site Permit and Limited Work Authorization which allowed limited work to begin on Plant Vogtle Units 3 and 4. The NRC certified the Westinghouse Design Control Document, as amended (DCD), for the AP1000 nuclear reactor design, effective December 30, 2011, and issued combined construction and operating licenses (COLs) in February 2012. Receipt of the COLs allowed full construction to begin. There have been technical and procedural challenges to the construction and licensing of Plant Vogtle Units 3 and 4, at the federal and state level, and additional challenges are expected as construction proceeds.
In 2009, the Georgia PSC approved inclusion of the Plant Vogtle Units 3 and 4 related CWIP accounts in rate base, and the State of Georgia enacted the Georgia Nuclear Energy Financing Act, which allows the Company to recover financing costs for nuclear construction projects certified by the Georgia PSC. Financing costs are recovered on all applicable certified costs through annual adjustments to the NCCR tariff by including the related CWIP accounts in rate base during the construction period. The Georgia PSC approved increases to the NCCR tariff of approximately $223 million, $35 million, $50 million, and $60 million, effective January 1, 2011, 2012, 2013, and 2014, respectively. Through the NCCR tariff, the Company is collecting and amortizing to earnings approximately $91 million of financing costs, capitalized in 2009 and 2010, over the five-year period ending December 31, 2015, in addition to the ongoing financing costs. At December 31, 2013, approximately $37 million of these 2009 and 2010 costs remained unamortized in CWIP.
The Company is required to file semi-annual Vogtle Construction Monitoring (VCM) reports with the Georgia PSC by February 28 and August 31 each year. If the projected certified construction capital costs to be borne by the Company increase by 5% or the projected in-service dates are significantly extended, the Company is required to seek an amendment to the Plant Vogtle Units 3 and 4 certificate from the Georgia PSC. Accordingly, the Company's eighth VCM report requested an amendment to the certificate to increase the estimated in-service capital cost of Plant Vogtle Units 3 and 4 from $4.4 billion to $4.8 billion and to extend the estimated in-service dates to the fourth quarter 2017 and the fourth quarter 2018 for Plant Vogtle Units 3 and 4, respectively.
On September 3, 2013, the Georgia PSC approved a stipulation entered into by the Company and the Georgia PSC staff to waive the requirement to amend the Plant Vogtle Units 3 and 4 certificate, until the commercial operation date of Plant Vogtle Unit 3, or earlier if deemed appropriate by the Georgia PSC and the Company. In accordance with the Georgia Integrated Resource Planning Act, any costs incurred by the Company in excess of the certified amount will not be included in rate base, unless shown to be reasonable and prudent. In addition, financing costs on any excess construction-related costs potentially would be subject to recovery through AFUDC instead of the NCCR tariff. As required by the stipulation, the Company filed an abbreviated status update with the Georgia PSC on September 3, 2013, which reflected approximately $2.4 billion of total construction capital costs incurred through June 30, 2013. On October 15, 2013, the Georgia PSC voted to approve the Company's eighth VCM report, reflecting construction capital costs incurred, which through December 31, 2012 totaled approximately $2.2 billion. Also in accordance with the stipulation, the Company will file with the Georgia PSC on February 28, 2014 a combined ninth and tenth VCM report covering the period from January 1 through December 31, 2013 (Ninth/Tenth VCM report), which will request approval for an additional $0.4 billion of construction capital costs. The Ninth/Tenth VCM report will reflect estimated in-service construction capital costs of $4.8 billion and associated financing costs during the construction period, which are estimated to total approximately $2.0 billion. The Company expects to resume filing semi-annual VCM reports in August 2014.
In July 2012, the Owners and the Contractor began negotiations regarding the costs associated with design changes to the DCD and the delays in the timing of approval of the DCD and issuance of the COLs, including the assertion by the Contractor that the Owners are responsible for these costs under the terms of the Vogtle 3 and 4 Agreement. The portion of the additional costs claimed by the Contractor that would be attributable to the Company (based on the Company's ownership interest) with respect to these issues is approximately $425 million (in 2008 dollars). The Contractor also has asserted it is entitled to further schedule extensions. The Company has not agreed with either the proposed cost or schedule adjustments or that the Owners have any responsibility for costs related to these issues. In November 2012, the Company and the other Owners filed suit against the Contractor in the U.S. District Court for the Southern District of Georgia seeking a declaratory judgment that the Owners are not responsible for these costs. Also in November 2012, the Contractor filed suit against the Company and the other Owners in the U.S. District Court for the District of Columbia alleging the Owners are responsible for these costs. On August 30, 2013, the U.S. District Court for the District of Columbia dismissed the Contractor's suit, ruling that the proper venue is the U.S. District Court for the Southern District of Georgia. The Contractor appealed the decision to the U.S. Court of Appeals for the District of Columbia Circuit on September 27, 2013. While litigation has commenced and the Company intends to vigorously defend its positions, the Company also expects negotiations with the Contractor to continue with respect to cost and schedule during which negotiations the parties may reach a mutually acceptable compromise of their positions.
Processes are in place that are designed to assure compliance with the requirements specified in the DCD and the COLs, including inspections by Southern Nuclear and the NRC that occur throughout construction. As a result of such compliance processes, certain license amendment requests have been filed and approved or are pending before the NRC. Various design and other
II-213
MANAGEMENT'S DISCUSSION AND ANALYSIS (continued)
Georgia Power Company 2013 Annual Report
licensing-based compliance issues are expected to arise as construction proceeds, which may result in additional license amendments or require other resolution. If any license amendment requests or other licensing-based compliance issues are not resolved in a timely manner, there may be delays in the project schedule that could result in increased costs either to the Owners, the Contractor, or both.
As construction continues, the risk remains that additional challenges in the fabrication, assembly, delivery, and installation of structural modules, delays in the receipt of the remaining permits necessary for the operation of Plant Vogtle Units 3 and 4, or other issues could arise and may further impact project schedule and cost. Additional claims by the Contractor or the Company (on behalf of the Owners) are also likely to arise throughout construction. These claims may be resolved through formal and informal dispute resolution procedures under the Vogtle 3 and 4 Agreement, but also may be resolved through litigation.
The ultimate outcome of these matters cannot be determined at this time.
Income Tax Matters
Bonus Depreciation
On January 2, 2013, the American Taxpayer Relief Act of 2012 (ATRA) was signed into law. The ATRA retroactively extended several tax credits through 2013 and extended 50% bonus depreciation for property placed in service in 2013 (and for certain long-term production-period projects to be placed in service in 2014). The extension of 50% bonus depreciation had a positive impact on the Company's cash flows of approximately $150 million in 2013 and is expected to have a positive impact between $40 million and $50 million on the cash flows of the Company in 2014.
Other Matters
The Company is involved in various other matters being litigated and regulatory matters that could affect future earnings. In addition, the Company is subject to certain claims and legal actions arising in the ordinary course of business. The Company's business activities are subject to extensive governmental regulation related to public health and the environment, such as regulation of air emissions and water discharges. Litigation over environmental issues and claims of various types, including property damage, personal injury, common law nuisance, and citizen enforcement of environmental requirements such as air quality and water standards, has increased generally throughout the U.S. In particular, personal injury, property damage, and other claims for damages alleged to have been caused by carbon dioxide and other emissions, coal combustion residuals, and alleged exposure to hazardous materials, and/or requests for injunctive relief in connection with such matters, have become more frequent.
The ultimate outcome of such pending or potential litigation against the Company cannot be predicted at this time; however, for current proceedings not specifically reported herein or in Note 3 to the financial statements, management does not anticipate that the ultimate liabilities, if any, arising from such current proceedings would have a material effect on the Company's financial statements. See Note 3 to the financial statements for a discussion of various other contingencies, regulatory matters, and other matters being litigated which may affect future earnings potential.
In 2011, a major earthquake and tsunami struck Japan and caused substantial damage to the nuclear generating units at the Fukushima Daiichi generating plant. The events in Japan have created uncertainties that may affect future costs for operating nuclear plants. Specifically, the NRC is performing additional operational and safety reviews of nuclear facilities in the U.S., which could potentially impact future operations and capital requirements. In addition, the NRC has issued a series of orders requiring safety-related changes to U.S. nuclear facilities and expects to issue orders in the future requiring additional upgrades. The final form and the resulting impact of any changes to safety requirements for nuclear reactors will be dependent on further review and action by the NRC and cannot be determined at this time; however, management does not currently anticipate that the compliance costs associated with these orders would have a material impact on the Company's financial statements.
Additionally, there are certain risks associated with the operation of nuclear generating units, including potential impacts that could result from a major incident at a nuclear facility anywhere in the world. The ultimate outcome of these events cannot be determined at this time.
On April 4, 2013, an explosion occurred at Plant Bowen Unit 2 that resulted in substantial damage to the Plant Bowen Unit 2 generator, the Plant Bowen Units 1 and 2 control room and surrounding areas, and Plant Bowen's switchyard. Plant Bowen Unit 1 (approximately 700 MWs) was returned to service on August 4, 2013 and Plant Bowen Unit 2 (approximately 700 MWs) was returned to service on December 20, 2013. The Company expects that any material repair costs related to the damage will be covered by property insurance.
On November 19, 2013, the U.S. District Court for the District of Columbia ordered the U.S. Department of Energy (DOE) to cease collecting spent fuel depositary fees from nuclear power plant operators until such time as the DOE either complies with the
II-214
MANAGEMENT'S DISCUSSION AND ANALYSIS (continued)
Georgia Power Company 2013 Annual Report
Nuclear Waste Policy Act of 1982 or until the U.S. Congress enacts an alternative waste management plan. In accordance with the court’s order, the DOE has submitted a proposal to the U.S. Congress to change the fee to zero. That proposal is pending before the U.S. Congress and will become effective after 90 days of legislative session from the time of submittal unless the U.S. Congress enacts legislation that impacts the proposed fee change. The DOE’s petition for rehearing of the November 2013 decision is currently pending and the Company is continuing to pay the fee of approximately $15 million annually based on its ownership interest. The ultimate outcome of this matter cannot be determined at this time.
ACCOUNTING POLICIES
Application of Critical Accounting Policies and Estimates
The Company prepares its financial statements in accordance with generally accepted accounting principles (GAAP). Significant accounting policies are described in Note 1 to the financial statements. In the application of these policies, certain estimates are made that may have a material impact on the Company's results of operations and related disclosures. Different assumptions and measurements could produce estimates that are significantly different from those recorded in the financial statements. Senior management has reviewed and discussed the following critical accounting policies and estimates with the Audit Committee of Southern Company's Board of Directors.
Electric Utility Regulation
The Company is subject to retail regulation by the Georgia PSC and wholesale regulation by the FERC. These regulatory agencies set the rates the Company is permitted to charge customers based on allowable costs. As a result, the Company applies accounting standards which require the financial statements to reflect the effects of rate regulation. Through the ratemaking process, the regulators may require the inclusion of costs or revenues in periods different than when they would be recognized by a non-regulated company. This treatment may result in the deferral of expenses and the recording of related regulatory assets based on anticipated future recovery through rates or the deferral of gains or creation of liabilities and the recording of related regulatory liabilities. The application of the accounting standards has a further effect on the Company's financial statements as a result of the estimates of allowable costs used in the ratemaking process. These estimates may differ from those actually incurred by the Company; therefore, the accounting estimates inherent in specific costs such as depreciation, asset retirement obligations, and pension and postretirement benefits have less of a direct impact on the Company's results of operations and financial condition than they would on a non-regulated company.
As reflected in Note 1 to the financial statements, significant regulatory assets and liabilities have been recorded. Management reviews the ultimate recoverability of these regulatory assets and any requirement to refund these regulatory liabilities based on applicable regulatory guidelines and GAAP. However, adverse legislative, judicial, or regulatory actions could materially impact the amounts of such regulatory assets and liabilities and could adversely impact the Company's financial statements.
Contingent Obligations
The Company is subject to a number of federal and state laws and regulations, as well as other factors and conditions that subject it to environmental, litigation, and other risks. See FUTURE EARNINGS POTENTIAL herein and Note 3 to the financial statements for more information regarding certain of these contingencies. The Company periodically evaluates its exposure to such risks and, in accordance with GAAP, records reserves for those matters where a non-tax-related loss is considered probable and reasonably estimable. The adequacy of reserves can be significantly affected by external events or conditions that can be unpredictable; thus, the ultimate outcome of such matters could materially affect the Company's financial statements.
Pension and Other Postretirement Benefits
The Company's calculation of pension and other postretirement benefits expense is dependent on a number of assumptions. These assumptions include discount rates, healthcare cost trend rates, expected long-term return on plan assets, mortality rates, expected salary and wage increases, and other factors. Components of pension and other postretirement benefits expense include interest and service cost on the pension and other postretirement benefit plans, expected return on plan assets, and amortization of certain unrecognized costs and obligations. Actual results that differ from the assumptions utilized are accumulated and amortized over future periods and, therefore, generally affect recognized expense and the recorded obligation in future periods. While the Company believes that the assumptions used are appropriate, differences in actual experience or significant changes in assumptions would affect its pension and other postretirement benefits costs and obligations.
Key elements in determining the Company's pension and other postretirement benefit expense in accordance with GAAP are the expected long-term return on plan assets and the discount rate used to measure the benefit plan obligations and the periodic benefit plan expense for future periods. The expected long-term return on postretirement benefit plan assets is based on the
II-215
MANAGEMENT'S DISCUSSION AND ANALYSIS (continued)
Georgia Power Company 2013 Annual Report
Company's investment strategy, historical experience, and expectations for long-term rates of return that consider external actuarial advice. The Company determines the long-term return on plan assets by applying the long-term rate of expected returns on various asset classes to the Company's target asset allocation. The Company discounts the future cash flows related to its postretirement benefit plans using a single-point discount rate developed from the weighted average of market-observed yields for high quality fixed income securities with maturities that correspond to expected benefit payments.
A 25 basis point change in any significant assumption (discount rate, salaries, or long-term return on plan assets) would result in an $8 million or less change in total annual benefit expense and a $121 million or less change in projected obligations.
FINANCIAL CONDITION AND LIQUIDITY
Overview
The Company's financial condition remained stable at December 31, 2013. The Company's cash requirements primarily consist of funding ongoing operations, common stock dividends, capital expenditures, and debt maturities. Capital expenditures and other investing activities include investments to meet projected long-term demand requirements, to comply with environmental regulations, and for restoration following major storms. Operating cash flows provide a substantial portion of the Company's cash needs. For the three-year period from 2014 through 2016, the Company's projected common stock dividends, capital expenditures, and debt maturities are expected to exceed operating cash flows. Projected capital expenditures in that period include investments to build new generation facilities, including Plant Vogtle Units 3 and 4, to maintain existing generation facilities, to add environmental equipment for existing generating units, and to expand and improve transmission and distribution facilities. The Company plans to finance future cash needs in excess of its operating cash flows primarily through debt issuances and capital contributions from Southern Company. The Company intends to continue to monitor its access to short-term and long-term capital markets as well as its bank credit arrangements to meet future capital and liquidity needs. See "Sources of Capital," "Financing Activities," and "Capital Requirements and Contractual Obligations" herein for additional information.
The Company's investments in the qualified pension plan and the nuclear decommissioning trust funds increased in value as of December 31, 2013 as compared to December 31, 2012. No contributions to the qualified pension plan were made in 2013. The Company funded approximately $2 million to its nuclear decommissioning trust funds in 2013. See "Contractual Obligations" herein for additional information.
Net cash provided from operating activities totaled $2.8 billion in 2013, an increase of $471 million from 2012, primarily due to higher retail operating revenues, lower fuel inventory additions, and settlement of affiliated payables related to pension funding in 2012, partially offset by fuel cost recovery. Net cash provided from operating activities totaled $2.3 billion in 2012, a decrease of $337 million from 2011, primarily due to higher fuel inventory additions in 2012 and lower deferred taxes due to the effect of bonus depreciation in 2011, partially offset by higher recovery of retail fuel costs.
Net cash used for investing activities totaled $1.9 billion, $2.0 billion, and $1.8 billion in 2013, 2012, and 2011, respectively, due to gross property additions primarily related to installation of equipment to comply with environmental standards; construction of generation, transmission, and distribution facilities; and purchase of nuclear fuel. The majority of funds needed for gross property additions for the last several years has been provided from operating activities, capital contributions from Southern Company, and the issuance of debt.
Net cash used for financing activities totaled $891 million, $290 million, and $836 million for 2013, 2012, and 2011, respectively. The increase in cash used in 2013 compared to 2012 was primarily due to lower net issuances of long-term debt in 2013, partially offset by an increase in net short-term borrowings. The decrease in cash used in 2012 compared to 2011 was primarily due to additional debt issuances in 2012 to support the ongoing construction program. See "Financing Activities" herein for additional information. Fluctuations in cash flow from financing activities vary from year to year based on capital needs and the maturity or redemption of securities.
Significant balance sheet changes in 2013 include an increase of $959 million in total property, plant, and equipment, a decrease of $250 million in fossil fuel stock, and a decrease in other regulatory assets, deferred of $646 million related to pension and other postretirement benefits.
The Company's ratio of common equity to total capitalization, including short-term debt, was 49.1% in 2013 and 48.3% in 2012. See Note 6 to the financial statements for additional information.
Sources of Capital
Except as described below with respect to the DOE loan guarantees, the Company plans to obtain the funds required for construction and other purposes from sources similar to those used in the past, which were primarily from operating cash flows,
II-216
MANAGEMENT'S DISCUSSION AND ANALYSIS (continued)
Georgia Power Company 2013 Annual Report
short-term debt, security issuances, term loans, and equity contributions from Southern Company. However, the amount, type, and timing of any future financings, if needed, will depend upon regulatory approvals, prevailing market conditions, and other factors.
On February 20, 2014, the Company and the DOE entered into a loan guarantee agreement (Loan Guarantee Agreement), pursuant to which the DOE agreed to guarantee borrowings to be made by the Company under a multi-advance credit facility (FFB Credit Facility) among the Company, the DOE, and the Federal Financing Bank (FFB). The Company's reimbursement obligations to the DOE are secured by a first priority lien on (i) the Company's 45.7% undivided ownership interest in Plant Vogtle Units 3 and 4 and (ii) the Company's rights and obligations under the principal contracts relating to Plant Vogtle Units 3 and 4. Under the FFB Credit Facility, the Company may make term loan borrowings through the FFB. Proceeds of borrowings made under the FFB Credit Facility will be used to reimburse the Company for a portion of certain costs of construction relating to Plant Vogtle Units 3 and 4 that are eligible for financing under the Loan Guarantee Agreement (Eligible Project Costs). Aggregate borrowings under the FFB Credit Facility may not exceed the lesser of (i) 70% of Eligible Project Costs or (ii) approximately $3.46 billion. See Note 6 to the financial statements for additional information.
The issuance of long-term securities by the Company is subject to the approval of the Georgia PSC. In addition, the issuance of short-term debt securities by the Company is subject to regulatory approval by the FERC. Additionally, with respect to the public offering of securities, the Company files registration statements with the U.S. Securities and Exchange Commission (SEC) under the Securities Act of 1933, as amended. The amounts of securities authorized by the Georgia PSC and the FERC are continuously monitored and appropriate filings are made to ensure flexibility in the capital markets.
The Company obtains financing separately without credit support from any affiliate. See Note 6 to the financial statements under "Bank Credit Arrangements" for additional information. The Southern Company system does not maintain a centralized cash or money pool. Therefore, funds of the Company are not commingled with funds of any other company in the Southern Company system.
The Company's current liabilities frequently exceed current assets because of the continued use of short-term debt as a funding source to meet scheduled maturities of long-term debt, as well as cash needs, which can fluctuate significantly due to the seasonality of the Company's business. The Company has substantial cash flow from operating activities and access to the capital markets to meet liquidity needs. At December 31, 2013, the Company had approximately $30 million of cash and cash equivalents. Committed credit arrangements with banks at December 31, 2013 were as follows:
|
Expires
(a)
|
||||||
|
2016
|
2018
|
Total
|
Unused
|
|||
|
|
(in millions)
|
|||||
|
$150
|
$1,600
|
$1,750
|
$1,736
|
|||
|
(a)
|
No credit arrangements expire in 2014, 2015, or 2017.
|
See Note 6 to the financial statements under "Bank Credit Arrangements" for additional information.
A portion of the unused credit with banks is allocated to provide liquidity support to the Company's variable rate pollution control revenue bonds and commercial paper borrowings. The amount of variable rate pollution control revenue bonds outstanding requiring liquidity support as of December 31, 2013 was approximately $862 million. In addition, at December 31, 2013, the Company had $242 million of fixed rate pollution control revenue bonds that will be required to be remarketed within the next 12 months.
These arrangements contain covenants that limit debt levels and contain cross default provisions to other indebtedness (including guarantee obligations) of the Company. Such cross default provisions to other indebtedness would trigger an event of default if the Company defaulted on indebtedness or guarantee obligations over a specified threshold. The Company is currently in compliance with all such covenants. None of the arrangements contain material adverse change clauses at the time of borrowings. The Company expects to renew its credit arrangements, as needed, prior to expiration.
The Company may also meet short-term cash needs through a Southern Company subsidiary organized to issue and sell commercial paper at the request and for the benefit of the Company and the other traditional operating companies. Proceeds from such issuances for the benefit of the Company are loaned directly to the Company. The obligations of each company under these arrangements are several and there is no cross affiliate credit support.
II-217
MANAGEMENT'S DISCUSSION AND ANALYSIS (continued)
Georgia Power Company 2013 Annual Report
Details of short-term borrowings were as follows:
|
Short-term Debt at the End of the Period
(a)
|
Short-term Debt During the Period
(b)
|
||||||||||||||||
|
Amount Outstanding
|
Weighted Average Interest Rate
|
Average Outstanding
|
Weighted Average Interest Rate
|
Maximum Amount Outstanding
|
|||||||||||||
|
(in millions)
|
(in millions)
|
(in millions)
|
|||||||||||||||
|
December 31, 2013:
|
|||||||||||||||||
|
Commercial paper
|
$
|
647
|
|
0.2
|
%
|
$
|
166
|
|
0.2
|
%
|
$
|
702
|
|
||||
|
Short-term bank debt
|
400
|
|
0.9
|
%
|
96
|
|
0.9
|
%
|
400
|
|
|||||||
|
Total
|
$
|
1,047
|
|
0.5
|
%
|
$
|
262
|
|
0.5
|
%
|
|||||||
|
December 31, 2012:
|
|||||||||||||||||
|
Commercial paper
|
$
|
—
|
|
—
|
%
|
$
|
78
|
|
0.2
|
%
|
$
|
517
|
|
||||
|
Short-term bank debt
|
—
|
|
—
|
%
|
116
|
|
1.2
|
%
|
300
|
|
|||||||
|
Total
|
$
|
—
|
|
—
|
%
|
$
|
194
|
|
0.8
|
%
|
|||||||
|
December 31, 2011:
|
|||||||||||||||||
|
Commercial paper
|
$
|
313
|
|
0.2
|
%
|
$
|
208
|
|
0.3
|
%
|
$
|
681
|
|
||||
|
Short-term bank debt
|
200
|
|
1.2
|
%
|
9
|
|
1.2
|
%
|
200
|
|
|||||||
|
Total
|
$
|
513
|
|
0.5
|
%
|
$
|
217
|
|
0.3
|
%
|
|||||||
|
(a)
|
Excludes notes payable related to other energy service contracts of $2 million in 2012 and 2011.
|
|
(b)
|
Average and maximum amounts are based upon daily balances during the twelve-month periods ended December 31, 2013, 2012, and 2011.
|
Management believes that the need for working capital can be adequately met by utilizing commercial paper programs, lines of credit, and cash.
Financing Activities
In addition to any financings that may be necessary to meet capital requirements and contractual obligations, the Company plans to continue, when economically feasible, a program to retire higher-cost securities and replace these obligations with lower-cost capital if market conditions permit.
Pollution Control Revenue Bonds
In March 2013, the Development Authority of Monroe County issued $17.5 million aggregate principal amount of Pollution Control Revenue Bonds (Georgia Power Company Plant Scherer Project), First Series 2013 due April 1, 2043 for the benefit of the Company. The proceeds were used to redeem, in April 2013, $17.5 million aggregate principal amount of Development Authority of Monroe County (Georgia) Pollution Control Revenue Bonds (Georgia Power Company Plant Scherer Project), Second Series 1997.
In August 2013, the Development Authority of Bartow County issued $71.7 million aggregate principal amount of Pollution Control Revenue Bonds (Georgia Power Company Plant Bowen Project), First Series 2013 due August 1, 2043 for the benefit of the Company. The proceeds were used to redeem, in September 2013, $24.9 million and $46.8 million aggregate principal amount of Development Authority of Bartow County (Georgia) Pollution Control Revenue Bonds (Georgia Power Company Plant Bowen Project), First Series 1996 and 1998, respectively.
In November 2013, the Development Authority of Burke County issued $104.6 million aggregate principal amount of Development Authority of Burke County (Georgia) Pollution Control Revenue Bonds (Georgia Power Company Plant Vogtle Project), First Series 2013 due November 1, 2053 for the benefit of the Company. The proceeds were used to redeem, in November 2013, $55 million and $49.6 million aggregate principal amount of Development Authority of Burke County (Georgia) Pollution Control Revenue Bonds (Georgia Power Company Plant Vogtle Project), Third Series 1994 and First Series 1997, respectively. Also in November 2013, the Company purchased and now holds $104.6 million aggregate principal amount of pollution control revenue bonds issued for its benefit in 2013. The Company may reoffer these bonds to the public at a later date.
II-218
MANAGEMENT'S DISCUSSION AND ANALYSIS (continued)
Georgia Power Company 2013 Annual Report
Senior Notes
In January 2013, the Company's $300 million aggregate principal amount of Series 2011A Floating Rate Senior Notes was paid at maturity.
In March 2013, the Company issued $400 million aggregate principal amount of Series 2013A 4.30% Senior Notes due March 15, 2043. Also in March 2013, the Company issued $250 million aggregate principal amount of Series 2013B Floating Rate Senior Notes due March 15, 2016. The proceeds from these sales were used to repay at maturity $350 million aggregate principal amount of the Company's Series 2010A Floating Rate Senior Notes due March 15, 2013, to repay a portion of its outstanding short-term indebtedness, and for general corporate purposes, including the Company's continuous construction program.
In August 2013, the Company issued $200 million aggregate principal amount of Series 2013C Floating Rate Senior Notes due August 15, 2016. The proceeds were used to repay at maturity a portion of $100 million aggregate principal amount outstanding of the Company's Series Q 4.90% Senior Notes and a portion of $500 million aggregate principal amount outstanding of the Company's Series 2010D 1.30% Senior Notes, both due September 15, 2013.
In November 2013, the Company redeemed $100 million aggregate principal amount of its Series 2008C 8.20% Senior Notes due November 1, 2048. In November and December 2013, the Company’s $400 million aggregate principal amount of 2008D 6.00% Senior Notes and $25 million aggregate principal amount of Series E 4.90% Senior Notes, respectively, were paid at maturity.
Other
In March 2013, the Company entered into three 60-day floating rate bank loans bearing interest based on one-month London Interbank Offered Rate (LIBOR). Each of these short-term loans was for $100 million aggregate principal amount, and the proceeds were used for working capital and other general corporate purposes, including the Company's continuous construction program. These bank loans were repaid at maturity.
In November 2013, the Company entered into three four-month floating rate bank loans for an aggregate principal amount of $400 million, bearing interest based on one-month LIBOR. The proceeds of these short-term loans were used for working capital and other general corporate purposes, including the Company's continuous construction program. Subsequent to December 31, 2013, the Company repaid these bank term loans.
These bank loans have covenants that limit debt levels to
65%
of total capitalization, as defined in the agreements. For purposes of these definitions, debt excludes the long-term debt payable to affiliated trusts and other hybrid securities. At
December 31, 2013
, the Company was in compliance with its debt limits.
In addition, these bank loans contain cross default provisions to other indebtedness (including guarantee obligations) that would be triggered if the Company defaulted on indebtedness above a specified threshold. The Company is currently in compliance with all such covenants.
DOE Loan Guarantee Borrowings
Subsequent to December 31, 2013, the Company made initial borrowings under the FFB Credit Facility in an aggregate principal amount of $1.0 billion. The interest rate applicable to $500 million of the initial advance under the FFB Credit Facility is 3.860% for an interest period that extends to February 20, 2044 (the final maturity date) and the interest rate applicable to the remaining $500 million is 3.488% for an interest period that extends to February 20, 2029 and will be reset from time to time thereafter through the final maturity date. The final maturity date for all advances under the FFB Credit Facility is February 20, 2044. The proceeds of the initial borrowings under the FFB Credit Facility were used to reimburse the Company for Eligible Project Costs relating to the construction of Plant Vogtle Units 3 and 4. The Company's reimbursement obligations to the DOE are secured by a first priority lien on (i) the Company's 45.7% undivided ownership interest in Plant Vogtle Units 3 and 4 and (ii) the Company's rights and obligations under the principal contracts relating to Plant Vogtle Units 3 and 4. Under the Loan Guarantee Agreement, Georgia Power is subject to customary events of default, as well as cross-defaults to other indebtedness and events of default relating to any failure to make payments under the Vogtle 3 and 4 Agreement or certain other agreements providing intellectual property rights for Plant Vogtle Units 3 and 4. The Loan Guarantee Agreement also includes events of default specific to the DOE loan guarantee program, including the failure of Georgia Power or Southern Nuclear to comply with requirements of law or DOE loan guarantee program requirements. See Note 6 to the financial statements for additional information.
Credit Rating Risk
The Company does not have any credit arrangements that would require material changes in payment schedules or terminations as a result of a credit rating downgrade. There are certain contracts that could require collateral, but not accelerated payment, in the event of a credit rating change to BBB- and/or Baa3 or below. These contracts are for physical electricity purchases and sales, fuel
II-219
MANAGEMENT'S DISCUSSION AND ANALYSIS (continued)
Georgia Power Company 2013 Annual Report
purchases, fuel transportation and storage, energy price risk management, and construction of new generation. The maximum potential collateral requirements under these contracts at December 31, 2013 were as follows:
|
Credit Ratings
|
Maximum Potential Collateral Requirements
|
||
|
(in millions)
|
|||
|
At BBB- and/or Baa3
|
$
|
88
|
|
|
Below BBB- and/or Baa3
|
1,318
|
|
|
Included in these amounts are certain agreements that could require collateral in the event that one or more Southern Company system power pool participants has a credit rating change to below investment grade. Generally, collateral may be provided by a Southern Company guaranty, letter of credit, or cash. Additionally, any credit rating downgrade could impact the Company's ability to access capital markets, particularly the short-term debt market and the variable rate pollution control revenue bond market.
On May 24, 2013, Standard and Poor's Ratings Services, a division of the McGraw Hill Companies, Inc. revised the ratings outlook for Southern Company and the traditional operating companies, including the Company, from stable to negative.
Market Price Risk
Due to cost-based rate regulation and other various cost recovery mechanisms, the Company continues to have limited exposure to market volatility in interest rates, commodity fuel prices, and prices of electricity. To manage the volatility attributable to these exposures, the Company nets the exposures, where possible, to take advantage of natural offsets and enters into various derivative transactions for the remaining exposures pursuant to the Company's policies in areas such as counterparty exposure and risk management practices. The Company's policy is that derivatives are to be used primarily for hedging purposes and mandates strict adherence to all applicable risk management policies. Derivative positions are monitored using techniques including, but not limited to, market valuation, value at risk, stress testing, and sensitivity analysis.
To mitigate future exposure to changes in interest rates, the Company may enter into derivatives designated as hedges. The weighted average interest rate on $1.3 billion of outstanding variable rate long-term debt at January 1, 2014 was 0.25%. If the Company sustained a 100 basis point change in interest rates for all unhedged variable rate long-term debt, the change would affect annualized interest expense by approximately $13 million at January 1, 2014. See Note 1 to the financial statements under "Financial Instruments" and Note 11 to the financial statements for additional information.
To mitigate residual risks relative to movements in electricity prices, the Company enters into physical fixed-price contracts for the purchase and sale of electricity through the wholesale electricity market and, to a lesser extent, financial hedge contracts for natural gas purchases. The Company continues to manage a fuel-hedging program implemented per the guidelines of the Georgia PSC. The Company had no material change in market risk exposure for the year ended December 31, 2013 when compared to the December 31, 2012 reporting period.
II-220
MANAGEMENT'S DISCUSSION AND ANALYSIS (continued)
Georgia Power Company 2013 Annual Report
The changes in fair value of energy-related derivative contracts are substantially attributable to both the volume and the price of natural gas. For the years ended December 31, the changes in fair value of energy-related derivative contracts, the majority of which are composed of regulatory hedges, were as follows:
|
2013
Changes
|
2012
Changes
|
||||||
|
Fair Value
|
|||||||
|
(in millions)
|
|||||||
|
Contracts outstanding at the beginning of the period, assets (liabilities), net
|
$
|
(34
|
)
|
$
|
(82
|
)
|
|
|
Contracts realized or settled:
|
|||||||
|
Swaps realized or settled
|
9
|
|
53
|
|
|||
|
Options realized or settled
|
20
|
|
18
|
|
|||
|
Current period changes
(a)
:
|
|||||||
|
Swaps
|
1
|
|
(9
|
)
|
|||
|
Options
|
(12
|
)
|
(14
|
)
|
|||
|
Contracts outstanding at the end of the period, assets (liabilities), net
|
$
|
(16
|
)
|
$
|
(34
|
)
|
|
|
(a)
|
Current period changes also include the changes in fair value of new contracts entered into during the period, if any.
|
The net hedge volumes of energy-related derivative contracts for the years ended December 31 were as follows:
|
2013
|
2012
|
|||
|
mmBtu* Volume
|
||||
|
(in millions)
|
||||
|
Commodity – Natural gas swaps
|
7
|
|
12
|
|
|
Commodity – Natural gas options
|
52
|
|
93
|
|
|
Total hedge volume
|
59
|
|
105
|
|
|
*million British thermal units (mmBtu)
|
||||
The weighted average swap contract cost above market prices was approximately $0.50 per mmBtu as of December 31, 2013 and $1.09 per mmBtu as of December 31, 2012. The change in option fair value is primarily attributable to the volatility of the market and the underlying change in the natural gas price. All natural gas hedge gains and losses are recovered through the Company's fuel cost recovery mechanism.
At December 31, 2013 and 2012, substantially all of the Company's energy-related derivative contracts were designated as regulatory hedges and are related to the Company's fuel-hedging program, which previously had a 48-month time horizon. In February 2013, the Georgia PSC approved changes to the Company's hedging program requiring it to use options and hedges within a 24-month time horizon. Hedging gains and losses are initially recorded as regulatory liabilities and assets, respectively, and then are included in fuel expense as they are recovered through the fuel cost recovery mechanism. Gains and losses on energy-related derivative contracts that are not designated or fail to qualify as hedges are recognized in the statements of income as incurred and were not material for any year presented.
II-221
MANAGEMENT'S DISCUSSION AND ANALYSIS (continued)
Georgia Power Company 2013 Annual Report
The Company uses over-the-counter contracts that are not exchange traded but are fair valued using prices which are market observable, and thus fall into Level 2. See Note 10 to the financial statements for further discussion of fair value measurements. The maturities of the energy-related derivative contracts, which are all Level 2 of the fair value hierarchy, at December 31, 2013 were as follows:
|
Fair Value Measurements
December 31, 2013
|
|||||||||||
|
Total
|
Maturity
|
||||||||||
|
Fair Value
|
Year 1
|
Years 2&3
|
|||||||||
|
(in millions)
|
|||||||||||
|
Level 1
|
$
|
—
|
|
$
|
—
|
|
$
|
—
|
|
||
|
Level 2
|
(16
|
)
|
(10
|
)
|
(6
|
)
|
|||||
|
Level 3
|
—
|
|
—
|
|
—
|
|
|||||
|
Fair value of contracts outstanding at end of period
|
$
|
(16
|
)
|
$
|
(10
|
)
|
$
|
(6
|
)
|
||
The Company is exposed to market price risk in the event of nonperformance by counterparties to the energy-related and interest rate derivative contracts. The Company only enters into agreements and material transactions with counterparties that have investment grade credit ratings by Moody's Investors Service, Inc. and Standard & Poor's Ratings Services, a division of The McGraw Hill Companies, Inc., or with counterparties who have posted collateral to cover potential credit exposure. Therefore, the Company does not anticipate market risk exposure from nonperformance by the counterparties. For additional information, see Note 1 to the financial statements under "Financial Instruments" and Note 11 to the financial statements.
Capital Requirements and Contractual Obligations
The construction program of the Company is currently estimated to be $2.5 billion for 2014, $2.4 billion for 2015, and $2.1 billion for 2016. Capital expenditures to comply with environmental statutes and regulations included in these estimated amounts are $543 million, $366 million, and $202 million for 2014, 2015, and 2016, respectively. These amounts include capital expenditures related to contractual purchase commitments for nuclear fuel and capital expenditures covered under long-term service agreements.
See FUTURE EARNINGS POTENTIAL – "Environmental Matters – Environmental Statutes and Regulations" for additional information.
The construction program is subject to periodic review and revision, and actual construction costs may vary from these estimates because of numerous factors. These factors include: changes in business conditions; changes in load projections; changes in environmental statutes and regulations; the outcome of any legal challenges to the environmental rules; changes in generating plants, including unit retirements and replacements and adding or changing fuel sources at existing units, to meet regulatory requirements; changes in FERC rules and regulations; Georgia PSC approvals; changes in the expected environmental compliance program; changes in legislation; the cost and efficiency of construction labor, equipment, and materials; project scope and design changes; storm impacts; and the cost of capital. In addition, there can be no assurance that costs related to capital expenditures will be fully recovered. See Note 3 to the financial statements under "Retail Regulatory Matters – Nuclear Construction" for additional information.
As a result of requirements by the NRC, the Company has established external trust funds for nuclear decommissioning costs. For additional information, see Note 1 to the financial statements under "Nuclear Decommissioning."
In addition, as discussed in Note 2 to the financial statements, the Company provides postretirement benefits to substantially all employees and funds trusts to the extent required by the Georgia PSC and the FERC.
Other funding requirements related to obligations associated with scheduled maturities of long-term debt, as well as the related interest, derivative obligations, preferred and preference stock dividends, leases, and other purchase commitments are detailed in the contractual obligations table that follows. See Notes 1, 2, 6, 7, and 11 to the financial statements for additional information.
II-222
MANAGEMENT'S DISCUSSION AND ANALYSIS (continued)
Georgia Power Company 2013 Annual Report
Contractual Obligations
|
2014
|
2015-
2016
|
2017-
2018
|
After
2018
|
Total
|
|||||||||||||||
|
(in millions)
|
|||||||||||||||||||
|
Long-term debt
(a)
—
|
|||||||||||||||||||
|
Principal
|
$
|
—
|
|
$
|
1,754
|
|
$
|
720
|
|
$
|
6,131
|
|
$
|
8,605
|
|
||||
|
Interest
|
298
|
|
577
|
|
510
|
|
4,280
|
|
5,665
|
|
|||||||||
|
Preferred and preference stock dividends
(b)
|
17
|
|
35
|
|
35
|
|
—
|
|
87
|
|
|||||||||
|
Financial derivative obligations
(c)
|
13
|
|
8
|
|
—
|
|
—
|
|
21
|
|
|||||||||
|
Operating leases
(d)
|
26
|
|
33
|
|
15
|
|
11
|
|
85
|
|
|||||||||
|
Capital leases
(d)
|
5
|
|
12
|
|
14
|
|
14
|
|
45
|
|
|||||||||
|
Purchase commitments —
|
|||||||||||||||||||
|
Capital
(e)
|
2,290
|
|
4,052
|
|
—
|
|
—
|
|
6,342
|
|
|||||||||
|
Fuel
(f)
|
1,713
|
|
2,486
|
|
1,535
|
|
5,373
|
|
11,107
|
|
|||||||||
|
Purchased power
(g)
|
242
|
|
712
|
|
710
|
|
4,080
|
|
5,744
|
|
|||||||||
|
Other
(h)
|
89
|
|
129
|
|
176
|
|
277
|
|
671
|
|
|||||||||
|
Trusts —
|
|||||||||||||||||||
|
Nuclear decommissioning
(i)
|
2
|
|
11
|
|
11
|
|
115
|
|
139
|
|
|||||||||
|
Pension and other postretirement benefit plans
(j)
|
34
|
|
65
|
|
—
|
|
—
|
|
99
|
|
|||||||||
|
Total
|
$
|
4,729
|
|
$
|
9,874
|
|
$
|
3,726
|
|
$
|
20,281
|
|
$
|
38,610
|
|
||||
|
(a)
|
All amounts are reflected based on final maturity dates. The Company plans to continue to retire higher-cost securities and replace these obligations with lower-cost capital if market conditions permit. Variable rate interest obligations are estimated based on rates as of January 1, 2014, as reflected in the statements of capitalization. Fixed rates include, where applicable, the effects of interest rate derivatives employed to manage interest rate risk. Long-term debt excludes capital lease amounts (shown separately).
|
|
(b)
|
Preferred and preference stock do not mature; therefore, amounts provided are for the next five years only.
|
|
(c)
|
For additional information, see Notes 1 and 11 to the financial statements.
|
|
(d)
|
Excludes PPAs that are accounted for as leases and are included in purchased power.
|
|
(e)
|
The Company provides estimated capital expenditures for a three-year period, including capital expenditures and compliance costs associated with environmental regulations. These amounts exclude contractual purchase commitments for nuclear fuel and capital expenditures covered under long-term service agreements which are reflected separately. At December 31, 2013, significant purchase commitments were outstanding in connection with the construction program. See FUTURE EARNINGS POTENTIAL – "Environmental Matters – Environmental Statutes and Regulations" herein for additional information.
|
|
(f)
|
Includes commitments to purchase coal, nuclear fuel, and natural gas, as well as the related transportation and storage. In most cases, these contracts contain provisions for price escalation, minimum purchase levels, and other financial commitments. Natural gas purchase commitments are based on various indices at the time of delivery. Amounts reflected for natural gas purchase commitments have been estimated based on the New York Mercantile Exchange future prices at December 31, 2013.
|
|
(g)
|
Estimated minimum long-term obligations for various PPA purchases from gas-fired, biomass, and wind-powered facilities. A total of $1.3 billion of biomass PPAs is contingent upon the counterparty meeting specified contract dates for posting collateral and commercial operation. See Note 3 to the financial statements under "Retail Regulatory Matters – Renewables Development" for additional information.
|
|
(h)
|
Includes long-term service agreements and contracts for the procurement of limestone. Long-term service agreements include price escalation based on inflation indices.
|
|
(i)
|
Projections of nuclear decommissioning trust fund contributions are based on the 2010 ARP for 2014 and on the 2013 ARP thereafter. See Note 1 to the financial statements under "Nuclear Decommissioning" for additional information.
|
|
(j)
|
The Company forecasts contributions to the pension and other postretirement benefit plans over a three-year period. The Company anticipates no mandatory contributions to the qualified pension plan during the next three years. Amounts presented represent estimated benefit payments for the nonqualified pension plans, estimated non-trust benefit payments for the other postretirement benefit plans, and estimated contributions to the other postretirement benefit plan trusts, all of which will be made from the Company's corporate assets. See Note 2 to the financial statements for additional information related to the pension and other postretirement benefit plans, including estimated benefit payments. Certain benefit payments will be made through the related benefit plans. Other benefit payments will be made from the Company's corporate assets.
|
II-223
MANAGEMENT'S DISCUSSION AND ANALYSIS (continued)
Georgia Power Company 2013 Annual Report
Cautionary Statement Regarding Forward-Looking Statements
The Company's
2013
Annual Report contains forward-looking statements. Forward-looking statements include, among other things, statements concerning retail sales, retail rates, customer growth, economic recovery, fuel and environmental cost recovery and other rate actions, current and proposed environmental regulations and related estimated expenditures, access to sources of capital, projections for the qualified pension plan, postretirement benefit plan, and nuclear decommissioning trust fund contributions, financing activities, plans and estimated costs for new generation resources, completion dates of construction projects, filings with state and federal regulatory authorities, impact of the ATRA, estimated sales and purchases under new power sale and purchase agreements, and estimated construction and other expenditures. In some cases, forward-looking statements can be identified by terminology such as "may," "will," "could," "should," "expects," "plans," "anticipates," "believes," "estimates," "projects," "predicts," "potential," or "continue" or the negative of these terms or other similar terminology. There are various factors that could cause actual results to differ materially from those suggested by the forward-looking statements; accordingly, there can be no assurance that such indicated results will be realized. These factors include:
|
•
|
the impact of recent and future federal and state regulatory changes, including legislative and regulatory initiatives regarding deregulation and restructuring of the electric utility industry, environmental laws including regulation of water, coal combustion residuals, and emissions of sulfur, nitrogen, carbon, soot, particulate matter, hazardous air pollutants, including mercury, and other substances, and also changes in tax and other laws and regulations to which the Company is subject, as well as changes in application of existing laws and regulations;
|
|
•
|
current and future litigation, regulatory investigations, proceedings, or inquiries, including the pending EPA civil action against the Company and Internal Revenue Service and state tax audits;
|
|
•
|
the effects, extent, and timing of the entry of additional competition in the markets in which the Company operates;
|
|
•
|
variations in demand for electricity, including those relating to weather, the general economy and recovery from the recent recession, population and business growth (and declines), the effects of energy conservation measures, including from the development and deployment of alternative energy sources such as self-generation and distributed generation technologies, and any potential economic impacts resulting from federal fiscal decisions;
|
|
•
|
available sources and costs of fuels;
|
|
•
|
effects of inflation;
|
|
•
|
ability to control costs and avoid cost overruns during the development and construction of facilities, which include the development and construction of facilities with designs that have not been finalized or previously constructed, including changes in labor costs and productivity factors, adverse weather conditions, shortages and inconsistent quality of equipment, materials, and labor, contractor or supplier delay or non-performance under construction or other agreements, delays associated with start-up activities, including major equipment failure, system integration, and operations, and/or unforeseen engineering problems
;
|
|
•
|
ability to construct facilities in accordance with the requirements of permits and licenses and to satisfy any operational and environmental performance standards, including the requirements of tax credits and other incentives;
|
|
•
|
investment performance of the Company's employee and retiree benefit plans and nuclear decommissioning trust funds;
|
|
•
|
advances in technology;
|
|
•
|
state and federal rate regulations and the impact of pending and future rate cases and negotiations, including rate cases related to fuel and other cost recovery mechanisms;
|
|
•
|
regulatory approvals and actions related to Plant Vogtle Units 3 and 4, including Georgia PSC approvals and NRC actions;
|
|
•
|
the inherent risks involved in operating and constructing nuclear generating facilities, including environmental, health, regulatory, natural disaster, terrorism, or financial risks;
|
|
•
|
internal restructuring or other restructuring options that may be pursued;
|
|
•
|
potential business strategies, including acquisitions or dispositions of assets or businesses, which cannot be assured to be completed or beneficial to the Company;
|
|
•
|
the ability of counterparties of the Company to make payments as and when due and to perform as required;
|
|
•
|
the ability to obtain new short- and long-term contracts with wholesale customers;
|
|
•
|
the direct or indirect effect on the Company's business resulting from terrorist incidents and the threat of terrorist incidents, including cyber intrusion;
|
II-224
MANAGEMENT'S DISCUSSION AND ANALYSIS (continued)
Georgia Power Company 2013 Annual Report
|
•
|
interest rate fluctuations and financial market conditions and the results of financing efforts, including the Company's credit ratings;
|
|
•
|
the impacts of any potential U.S. credit rating downgrade or other sovereign financial issues, including impacts on interest rates, access to capital markets, impacts on currency exchange rates, counterparty performance, and the economy in general, as well as potential impacts on benefits of the DOE loan guarantees;
|
|
•
|
the ability of the Company to obtain additional generating capacity at competitive prices;
|
|
•
|
catastrophic events such as fires, earthquakes, explosions, floods, hurricanes, droughts, pandemic health events such as influenzas, or other similar occurrences;
|
|
•
|
the direct or indirect effects on the Company's business resulting from incidents affecting the U.S. electric grid or operation of generating resources;
|
|
•
|
the effect of accounting pronouncements issued periodically by standard setting bodies; and
|
|
•
|
other factors discussed elsewhere herein and in other reports (including the Form 10-K) filed by the Company from time to time with the SEC.
|
The Company expressly disclaims any obligation to update any forward-looking statements.
II-225
STATEMENTS OF INCOME
For the Years Ended
December 31, 2013
,
2012
, and
2011
Georgia Power Company
2013
Annual Report
|
|
2013
|
|
2012
|
|
2011
|
|
|||||
|
|
(in millions)
|
||||||||||
|
Operating Revenues:
|
|||||||||||
|
Retail revenues
|
$
|
7,620
|
|
$
|
7,362
|
|
$
|
8,099
|
|
||
|
Wholesale revenues, non-affiliates
|
281
|
|
281
|
|
341
|
|
|||||
|
Wholesale revenues, affiliates
|
20
|
|
20
|
|
32
|
|
|||||
|
Other revenues
|
353
|
|
335
|
|
328
|
|
|||||
|
Total operating revenues
|
8,274
|
|
7,998
|
|
8,800
|
|
|||||
|
Operating Expenses:
|
|||||||||||
|
Fuel
|
2,307
|
|
2,051
|
|
2,789
|
|
|||||
|
Purchased power, non-affiliates
|
224
|
|
315
|
|
390
|
|
|||||
|
Purchased power, affiliates
|
660
|
|
666
|
|
713
|
|
|||||
|
Other operations and maintenance
|
1,654
|
|
1,644
|
|
1,777
|
|
|||||
|
Depreciation and amortization
|
807
|
|
745
|
|
715
|
|
|||||
|
Taxes other than income taxes
|
382
|
|
374
|
|
369
|
|
|||||
|
Total operating expenses
|
6,034
|
|
5,795
|
|
6,753
|
|
|||||
|
Operating Income
|
2,240
|
|
2,203
|
|
2,047
|
|
|||||
|
Other Income and (Expense):
|
|||||||||||
|
Allowance for equity funds used during construction
|
30
|
|
53
|
|
96
|
|
|||||
|
Interest expense, net of amounts capitalized
|
(361
|
)
|
(366
|
)
|
(343
|
)
|
|||||
|
Other income (expense), net
|
5
|
|
(17
|
)
|
(13
|
)
|
|||||
|
Total other income and (expense)
|
(326
|
)
|
(330
|
)
|
(260
|
)
|
|||||
|
Earnings Before Income Taxes
|
1,914
|
|
1,873
|
|
1,787
|
|
|||||
|
Income taxes
|
723
|
|
688
|
|
625
|
|
|||||
|
Net Income
|
1,191
|
|
1,185
|
|
1,162
|
|
|||||
|
Dividends on Preferred and Preference Stock
|
17
|
|
17
|
|
17
|
|
|||||
|
Net Income After Dividends on Preferred and Preference Stock
|
$
|
1,174
|
|
$
|
1,168
|
|
$
|
1,145
|
|
||
The accompanying notes are an integral part of these financial statements.
II-226
STATEMENTS OF COMPREHENSIVE INCOME
For the Years Ended
December 31, 2013
,
2012
, and
2011
Georgia Power Company
2013
Annual Report
|
|
2013
|
|
2012
|
|
2011
|
|
|||||
|
|
(in millions)
|
||||||||||
|
Net Income
|
$
|
1,191
|
|
$
|
1,185
|
|
$
|
1,162
|
|
||
|
Other comprehensive income (loss):
|
|||||||||||
|
Qualifying hedges:
|
|||||||||||
|
Reclassification adjustment for amounts included in net income,
net of tax of $1, $1, and $2, respectively |
2
|
|
2
|
|
2
|
|
|||||
|
Total other comprehensive income (loss)
|
2
|
|
2
|
|
2
|
|
|||||
|
Comprehensive Income
|
$
|
1,193
|
|
$
|
1,187
|
|
$
|
1,164
|
|
||
The accompanying notes are an integral part of these financial statements.
II-227
STATEMENTS OF CASH FLOWS
For the Years Ended
December 31, 2013
,
2012
, and
2011
Georgia Power Company
2013
Annual Report
|
|
2013
|
|
2012
|
|
2011
|
|
|||||
|
|
(in millions)
|
||||||||||
|
Operating Activities:
|
|||||||||||
|
Net income
|
$
|
1,191
|
|
$
|
1,185
|
|
$
|
1,162
|
|
||
|
Adjustments to reconcile net income
to net cash provided from operating activities —
|
|||||||||||
|
Depreciation and amortization, total
|
979
|
|
912
|
|
867
|
|
|||||
|
Deferred income taxes
|
476
|
|
377
|
|
500
|
|
|||||
|
Allowance for equity funds used during construction
|
(30
|
)
|
(53
|
)
|
(96
|
)
|
|||||
|
Retail fuel cost over recovery—long-term
|
(123
|
)
|
123
|
|
—
|
|
|||||
|
Pension, postretirement, and other employee benefits
|
59
|
|
9
|
|
(29
|
)
|
|||||
|
Other, net
|
37
|
|
(12
|
)
|
(23
|
)
|
|||||
|
Changes in certain current assets and liabilities —
|
|||||||||||
|
-Receivables
|
(58
|
)
|
205
|
|
235
|
|
|||||
|
-Fossil fuel stock
|
250
|
|
(269
|
)
|
(99
|
)
|
|||||
|
-Prepaid income taxes
|
(17
|
)
|
(7
|
)
|
72
|
|
|||||
|
-Other current assets
|
40
|
|
(53
|
)
|
(21
|
)
|
|||||
|
-Accounts payable
|
67
|
|
(165
|
)
|
44
|
|
|||||
|
-Accrued taxes
|
(14
|
)
|
(76
|
)
|
(36
|
)
|
|||||
|
-Accrued compensation
|
(37
|
)
|
(18
|
)
|
7
|
|
|||||
|
-Retail fuel cost over-recovery—short-term
|
(49
|
)
|
107
|
|
—
|
|
|||||
|
-Other current liabilities
|
(5
|
)
|
30
|
|
49
|
|
|||||
|
Net cash provided from operating activities
|
2,766
|
|
2,295
|
|
2,632
|
|
|||||
|
Investing Activities:
|
|||||||||||
|
Property additions
|
(1,743
|
)
|
(1,723
|
)
|
(1,861
|
)
|
|||||
|
Investment in restricted cash from pollution control bonds
|
(89
|
)
|
(284
|
)
|
—
|
|
|||||
|
Distribution of restricted cash from pollution control bonds
|
89
|
|
284
|
|
—
|
|
|||||
|
Nuclear decommissioning trust fund purchases
|
(706
|
)
|
(852
|
)
|
(1,845
|
)
|
|||||
|
Nuclear decommissioning trust fund sales
|
705
|
|
850
|
|
1,841
|
|
|||||
|
Cost of removal, net of salvage
|
(59
|
)
|
(82
|
)
|
(42
|
)
|
|||||
|
Change in construction payables, net of joint owner portion
|
(67
|
)
|
(149
|
)
|
123
|
|
|||||
|
Other investing activities
|
(20
|
)
|
(17
|
)
|
(7
|
)
|
|||||
|
Net cash used for investing activities
|
(1,890
|
)
|
(1,973
|
)
|
(1,791
|
)
|
|||||
|
Financing Activities:
|
|||||||||||
|
Increase (decrease) in notes payable, net
|
1,047
|
|
(513
|
)
|
(61
|
)
|
|||||
|
Proceeds —
|
|||||||||||
|
Capital contributions from parent company
|
37
|
|
42
|
|
214
|
|
|||||
|
Pollution control revenue bonds issuances and remarketings
|
194
|
|
284
|
|
604
|
|
|||||
|
Senior notes issuances
|
850
|
|
2,300
|
|
550
|
|
|||||
|
Other long-term debt issuances
|
—
|
|
—
|
|
250
|
|
|||||
|
Redemptions and repurchases —
|
|||||||||||
|
Pollution control revenue bonds
|
(298
|
)
|
(284
|
)
|
(339
|
)
|
|||||
|
Senior notes
|
(1,775
|
)
|
(850
|
)
|
(427
|
)
|
|||||
|
Other long-term debt
|
—
|
|
(250
|
)
|
(303
|
)
|
|||||
|
Long-term debt to affiliate trust
|
—
|
|
—
|
|
(206
|
)
|
|||||
|
Payment of preferred and preference stock dividends
|
(17
|
)
|
(17
|
)
|
(17
|
)
|
|||||
|
Payment of common stock dividends
|
(907
|
)
|
(983
|
)
|
(1,096
|
)
|
|||||
|
Other financing activities
|
(22
|
)
|
(19
|
)
|
(5
|
)
|
|||||
|
Net cash used for financing activities
|
(891
|
)
|
(290
|
)
|
(836
|
)
|
|||||
|
Net Change in Cash and Cash Equivalents
|
(15
|
)
|
32
|
|
5
|
|
|||||
|
Cash and Cash Equivalents at Beginning of Year
|
45
|
|
13
|
|
8
|
|
|||||
|
Cash and Cash Equivalents at End of Year
|
$
|
30
|
|
$
|
45
|
|
$
|
13
|
|
||
|
Supplemental Cash Flow Information:
|
|||||||||||
|
Cash paid during the period for —
|
|||||||||||
|
Interest (net of $14, $21 and $37 capitalized, respectively)
|
$
|
344
|
|
$
|
337
|
|
$
|
346
|
|
||
|
Income taxes (net of refunds)
|
298
|
|
312
|
|
54
|
|
|||||
|
Noncash transactions - accrued property additions at year-end
|
208
|
|
261
|
|
391
|
|
|||||
The accompanying notes are an integral part of these financial statements.
II-228
BALANCE SHEETS
At
December 31, 2013
and
2012
Georgia Power Company
2013
Annual Report
|
Assets
|
2013
|
|
2012
|
|
|||
|
|
(in millions)
|
||||||
|
Current Assets:
|
|||||||
|
Cash and cash equivalents
|
$
|
30
|
|
$
|
45
|
|
|
|
Receivables —
|
|||||||
|
Customer accounts receivable
|
512
|
|
484
|
|
|||
|
Unbilled revenues
|
209
|
|
217
|
|
|||
|
Joint owner accounts receivable
|
67
|
|
51
|
|
|||
|
Other accounts and notes receivable
|
117
|
|
68
|
|
|||
|
Affiliated companies
|
21
|
|
23
|
|
|||
|
Accumulated provision for uncollectible accounts
|
(5
|
)
|
(6
|
)
|
|||
|
Fossil fuel stock, at average cost
|
742
|
|
992
|
|
|||
|
Materials and supplies, at average cost
|
409
|
|
452
|
|
|||
|
Vacation pay
|
88
|
|
85
|
|
|||
|
Prepaid income taxes
|
97
|
|
164
|
|
|||
|
Other regulatory assets, current
|
66
|
|
72
|
|
|||
|
Other current assets
|
54
|
|
104
|
|
|||
|
Total current assets
|
2,407
|
|
2,751
|
|
|||
|
Property, Plant, and Equipment:
|
|||||||
|
In service
|
30,132
|
|
29,244
|
|
|||
|
Less accumulated provision for depreciation
|
10,970
|
|
10,431
|
|
|||
|
Plant in service, net of depreciation
|
19,162
|
|
18,813
|
|
|||
|
Other utility plant, net
|
240
|
|
263
|
|
|||
|
Nuclear fuel, at amortized cost
|
523
|
|
497
|
|
|||
|
Construction work in progress
|
3,500
|
|
2,893
|
|
|||
|
Total property, plant, and equipment
|
23,425
|
|
22,466
|
|
|||
|
Other Property and Investments:
|
|||||||
|
Equity investments in unconsolidated subsidiaries
|
46
|
|
45
|
|
|||
|
Nuclear decommissioning trusts, at fair value
|
751
|
|
698
|
|
|||
|
Miscellaneous property and investments
|
44
|
|
44
|
|
|||
|
Total other property and investments
|
841
|
|
787
|
|
|||
|
Deferred Charges and Other Assets:
|
|||||||
|
Deferred charges related to income taxes
|
718
|
|
733
|
|
|||
|
Prepaid pension costs
|
118
|
|
—
|
|
|||
|
Other regulatory assets, deferred
|
1,152
|
|
1,798
|
|
|||
|
Other deferred charges and assets
|
246
|
|
268
|
|
|||
|
Total deferred charges and other assets
|
2,234
|
|
2,799
|
|
|||
|
Total Assets
|
$
|
28,907
|
|
$
|
28,803
|
|
|
The accompanying notes are an integral part of these financial statements.
II-229
BALANCE SHEETS
At
December 31, 2013
and
2012
Georgia Power Company
2013
Annual Report
|
Liabilities and Stockholder's Equity
|
2013
|
|
2012
|
|
|||
|
|
(in millions)
|
||||||
|
Current Liabilities:
|
|||||||
|
Securities due within one year
|
$
|
5
|
|
$
|
1,680
|
|
|
|
Notes payable
|
1,047
|
|
2
|
|
|||
|
Accounts payable —
|
|||||||
|
Affiliated
|
417
|
|
417
|
|
|||
|
Other
|
472
|
|
436
|
|
|||
|
Customer deposits
|
246
|
|
237
|
|
|||
|
Accrued taxes —
|
|||||||
|
Accrued income taxes
|
—
|
|
6
|
|
|||
|
Other accrued taxes
|
321
|
|
260
|
|
|||
|
Accrued interest
|
91
|
|
100
|
|
|||
|
Accrued vacation pay
|
61
|
|
61
|
|
|||
|
Accrued compensation
|
80
|
|
113
|
|
|||
|
Liabilities from risk management activities
|
13
|
|
30
|
|
|||
|
Other regulatory liabilities, current
|
17
|
|
73
|
|
|||
|
Over recovered regulatory clause revenues, current
|
14
|
|
107
|
|
|||
|
Other current liabilities
|
122
|
|
146
|
|
|||
|
Total current liabilities
|
2,906
|
|
3,668
|
|
|||
|
Long-Term Debt
(
See accompanying statements
)
|
8,633
|
|
7,994
|
|
|||
|
Deferred Credits and Other Liabilities:
|
|||||||
|
Accumulated deferred income taxes
|
5,200
|
|
4,861
|
|
|||
|
Deferred credits related to income taxes
|
112
|
|
115
|
|
|||
|
Accumulated deferred investment tax credits
|
203
|
|
208
|
|
|||
|
Employee benefit obligations
|
542
|
|
950
|
|
|||
|
Asset retirement obligations
|
1,210
|
|
1,097
|
|
|||
|
Other cost of removal obligations
|
43
|
|
63
|
|
|||
|
Other deferred credits and liabilities
|
201
|
|
308
|
|
|||
|
Total deferred credits and other liabilities
|
7,511
|
|
7,602
|
|
|||
|
Total Liabilities
|
19,050
|
|
19,264
|
|
|||
|
Preferred Stock
(
See accompanying statements
)
|
45
|
|
45
|
|
|||
|
Preference Stock
(
See accompanying statements
)
|
221
|
|
221
|
|
|||
|
Common Stockholder's Equity
(
See accompanying statements
)
|
9,591
|
|
9,273
|
|
|||
|
Total Liabilities and Stockholder's Equity
|
$
|
28,907
|
|
$
|
28,803
|
|
|
|
Commitments and Contingent Matters
(
See notes
)
|
|
|
|||||
The accompanying notes are an integral part of these financial statements.
II-230
STATEMENTS OF CAPITALIZATION
At
December 31, 2013
and
2012
Georgia Power Company
2013
Annual Report
|
|
2013
|
|
2012
|
|
2013
|
|
2012
|
|
|||||
|
|
(in millions)
|
(percent of total)
|
|||||||||||
|
Long-Term Debt:
|
|||||||||||||
|
Long-term notes payable —
|
|||||||||||||
|
Variable rates (0.58% to 0.63% at 1/1/13) due 2013
|
$
|
—
|
|
$
|
650
|
|
|||||||
|
Variable rates (0.57% to 0.65% at 1/1/14) due 2016
|
450
|
|
—
|
|
|||||||||
|
1.30% to 6.00% due 2013
|
—
|
|
1,025
|
|
|||||||||
|
0.625% to 5.25% due 2015
|
1,050
|
|
1,050
|
|
|||||||||
|
3.00% due 2016
|
250
|
|
250
|
|
|||||||||
|
5.70% due 2017
|
450
|
|
450
|
|
|||||||||
|
5.40% due 2018
|
250
|
|
250
|
|
|||||||||
|
2.85% to 8.20% due 2019-2048
|
4,475
|
|
4,175
|
|
|||||||||
|
Total long-term notes payable
|
6,925
|
|
7,850
|
|
|||||||||
|
Other long-term debt —
|
|||||||||||||
|
Pollution control revenue bonds:
|
|||||||||||||
|
0.80% to 5.75% due 2022-2049
|
818
|
|
919
|
|
|||||||||
|
Variable rate (0.06% at 1/1/14) due 2016
|
4
|
|
4
|
|
|||||||||
|
Variable rate (0.04% at 1/1/14) due 2018
|
20
|
|
20
|
|
|||||||||
|
Variable rates (0.04% to 0.11% at 1/1/14)
due 2022-2052 |
838
|
|
841
|
|
|||||||||
|
Total other long-term debt
|
1,680
|
|
1,784
|
|
|||||||||
|
Capitalized lease obligations
|
45
|
|
50
|
|
|||||||||
|
Unamortized debt discount
|
(12
|
)
|
(10
|
)
|
|||||||||
|
Total long-term debt (annual interest requirement — $298 million)
|
8,638
|
|
9,674
|
|
|||||||||
|
Less amount due within one year
|
5
|
|
1,680
|
|
|||||||||
|
Long-term debt excluding amount due within one year
|
8,633
|
|
7,994
|
|
46.7
|
%
|
45.6
|
%
|
|||||
|
Preferred and Preference Stock:
|
|||||||||||||
|
Non-cumulative preferred stock
|
|||||||||||||
|
$25 par value — 6.125%
|
|||||||||||||
|
Authorized: 50,000,000 shares
|
|||||||||||||
|
Outstanding: 1,800,000 shares
|
45
|
|
45
|
|
|||||||||
|
Non-cumulative preference stock
|
|||||||||||||
|
$100 par value — 6.50%
|
|||||||||||||
|
Authorized: 15,000,000 shares
|
|||||||||||||
|
Outstanding: 2,250,000 shares
|
221
|
|
221
|
|
|||||||||
|
Total preferred and preference stock
(annual dividend requirement — $17 million) |
266
|
|
266
|
|
1.4
|
|
1.5
|
|
|||||
|
Common Stockholder's Equity:
|
|||||||||||||
|
Common stock, without par value —
|
|||||||||||||
|
Authorized: 20,000,000 shares
|
|
|
|||||||||||
|
Outstanding: 9,261,500 shares
|
398
|
|
398
|
|
|||||||||
|
Paid-in capital
|
5,633
|
|
5,585
|
|
|||||||||
|
Retained earnings
|
3,565
|
|
3,297
|
|
|||||||||
|
Accumulated other comprehensive loss
|
(5
|
)
|
(7
|
)
|
|||||||||
|
Total common stockholder's equity
|
9,591
|
|
9,273
|
|
51.9
|
|
52.9
|
|
|||||
|
Total Capitalization
|
$
|
18,490
|
|
$
|
17,533
|
|
100.0
|
%
|
100.0
|
%
|
|||
The accompanying notes are an integral part of these financial statements.
II-231
STATEMENTS OF COMMON STOCKHOLDER'S EQUITY
For the Years Ended
December 31, 2013
,
2012
, and
2011
Georgia Power Company
2013
Annual Report
|
|
Number of Common Shares Issued
|
Common Stock
|
Paid-In Capital
|
Retained Earnings
|
Accumulated Other Comprehensive Income (Loss)
|
Total
|
||||||||||||||||
|
|
(in millions)
|
|||||||||||||||||||||
|
Balance at December 31, 2010
|
9
|
|
$
|
398
|
|
$
|
5,291
|
|
$
|
3,063
|
|
$
|
(11
|
)
|
$
|
8,741
|
|
|||||
|
Net income after dividends on preferred
and preference stock
|
—
|
|
—
|
|
—
|
|
1,145
|
|
—
|
|
1,145
|
|
||||||||||
|
Capital contributions from parent company
|
—
|
|
—
|
|
231
|
|
—
|
|
—
|
|
231
|
|
||||||||||
|
Other comprehensive income (loss)
|
—
|
|
—
|
|
—
|
|
—
|
|
2
|
|
2
|
|
||||||||||
|
Cash dividends on common stock
|
—
|
|
—
|
|
—
|
|
(1,096
|
)
|
—
|
|
(1,096
|
)
|
||||||||||
|
Balance at December 31, 2011
|
9
|
|
398
|
|
5,522
|
|
3,112
|
|
(9
|
)
|
9,023
|
|
||||||||||
|
Net income after dividends on preferred
and preference stock
|
—
|
|
—
|
|
—
|
|
1,168
|
|
—
|
|
1,168
|
|
||||||||||
|
Capital contributions from parent company
|
—
|
|
—
|
|
63
|
|
—
|
|
—
|
|
63
|
|
||||||||||
|
Other comprehensive income (loss)
|
—
|
|
—
|
|
—
|
|
—
|
|
2
|
|
2
|
|
||||||||||
|
Cash dividends on common stock
|
—
|
|
—
|
|
—
|
|
(983
|
)
|
—
|
|
(983
|
)
|
||||||||||
|
Balance at December 31, 2012
|
9
|
|
398
|
|
5,585
|
|
3,297
|
|
(7
|
)
|
9,273
|
|
||||||||||
|
Net income after dividends on preferred
and preference stock
|
—
|
|
—
|
|
—
|
|
1,174
|
|
—
|
|
1,174
|
|
||||||||||
|
Capital contributions from parent company
|
—
|
|
—
|
|
48
|
|
—
|
|
—
|
|
48
|
|
||||||||||
|
Other comprehensive income (loss)
|
—
|
|
—
|
|
—
|
|
—
|
|
2
|
|
2
|
|
||||||||||
|
Cash dividends on common stock
|
—
|
|
—
|
|
—
|
|
(907
|
)
|
—
|
|
(907
|
)
|
||||||||||
|
Other
|
—
|
|
—
|
|
—
|
|
1
|
|
—
|
|
1
|
|
||||||||||
|
Balance at December 31, 2013
|
9
|
|
$
|
398
|
|
$
|
5,633
|
|
$
|
3,565
|
|
$
|
(5
|
)
|
$
|
9,591
|
|
|||||
The accompanying notes are an integral part of these financial statements.
II-232
NOTES TO FINANCIAL STATEMENTS
Georgia Power Company
2013
Annual Report
Index to the Notes to Financial Statements
|
Note
|
Page
|
|
|
1
|
||
|
2
|
||
|
3
|
||
|
4
|
||
|
5
|
||
|
6
|
||
|
7
|
||
|
8
|
||
|
9
|
||
|
10
|
||
|
11
|
||
|
12
|
||
II-233
NOTES (continued)
Georgia Power Company 2013 Annual Report
1. SUMMARY OF SIGNIFICANT ACCOUNTING POLICIES
General
Georgia Power Company (the Company) is a wholly-owned subsidiary of The Southern Company (Southern Company), which is the parent company of the Company and three other traditional operating companies, as well as Southern Power Company (Southern Power), Southern Company Services, Inc. (SCS), Southern Communications Services, Inc. (SouthernLINC Wireless), Southern Company Holdings, Inc. (Southern Holdings), Southern Nuclear Operating Company, Inc. (Southern Nuclear), and other direct and indirect subsidiaries. The traditional operating companies – the Company, Alabama Power Company (Alabama Power), Gulf Power Company (Gulf Power), and Mississippi Power Company – are vertically integrated utilities providing electric service in four Southeastern states. The Company operates as a vertically integrated utility providing electricity to retail customers within its traditional service area located within the State of Georgia and to wholesale customers in the Southeast. Southern Power constructs, acquires, owns, and manages generation assets, including renewable energy projects, and sells electricity at market-based rates in the wholesale market. SCS, the system service company, provides, at cost, specialized services to Southern Company and its subsidiary companies. SouthernLINC Wireless provides digital wireless communications for use by Southern Company and its subsidiary companies and also markets these services to the public, and provides fiber cable services within the Southeast. Southern Holdings is an intermediate holding company subsidiary, primarily for Southern Company's investments in leveraged leases. Southern Nuclear operates and provides services to the Southern Company system's nuclear power plants, including the Company's Plant Hatch and Plant Vogtle.
The equity method is used for subsidiaries in which the Company has significant influence but does not control.
The Company is subject to regulation by the Federal Energy Regulatory Commission (FERC) and the Georgia Public Service Commission (PSC). The Company follows generally accepted accounting principles (GAAP) in the U.S. and complies with the accounting policies and practices prescribed by its regulatory commissions. The preparation of financial statements in conformity with GAAP requires the use of estimates, and the actual results may differ from those estimates. Certain prior years' data presented in the financial statements have been reclassified to conform to the current year presentation.
Affiliate Transactions
The Company has an agreement with SCS under which the following services are rendered to the Company at direct or allocated cost: general and design engineering, operations, purchasing, accounting, finance and treasury, tax, information technology, marketing, auditing, insurance and pension administration, human resources, systems and procedures, digital wireless communications, and other services with respect to business and operations, construction management, and power pool transactions. Costs for these services amounted to
$504 million
in
2013
,
$540 million
in
2012
, and
$550 million
in
2011
. Cost allocation methodologies used by SCS prior to the repeal of the Public Utility Holding Company Act of 1935, as amended, were approved by the U.S. Securities and Exchange Commission (SEC). Subsequently, additional cost allocation methodologies have been reported to the FERC and management believes they are reasonable. The FERC permits services to be rendered at cost by system service companies.
The Company has an agreement with Southern Nuclear under which the following nuclear-related services are rendered to the Company at cost: general executive and advisory services, general operations, management and technical services, administrative services including procurement, accounting, employee relations, systems and procedures services, strategic planning and budgeting services, and other services with respect to business, operations, and construction management. Costs for these services amounted to
$555 million
in
2013
,
$574 million
in
2012
, and
$537 million
in
2011
.
The Company has entered into several power purchase agreements (PPA) with Southern Power for capacity and energy. Expenses associated with these PPAs were
$136 million
,
$147 million
, and
$171 million
in
2013
,
2012
, and
2011
, respectively. Additionally, the Company had
$15 million
of prepaid capacity expenses included in deferred charges and other assets in the balance sheets at
December 31, 2013
and
2012
. See Note 7 under "Fuel and Purchased Power Agreements" for additional information.
The Company has a joint ownership agreement with Gulf Power under which Gulf Power owns a
25%
portion of Plant Scherer Unit 3. Under this agreement, the Company operates Plant Scherer Unit 3 and Gulf Power reimburses the Company for its
25%
proportionate share of the related non-fuel expenses, which were
$10 million
in
2013
,
$7 million
in
2012
, and
$7 million
in
2011
. See Note 4 for additional information.
The Company provides incidental services to and receives such services from other Southern Company subsidiaries which are generally minor in duration and amount. Except as described herein, the Company neither provided nor received any material services to or from affiliates in
2013
,
2012
, or
2011
.
II-234
NOTES (continued)
Georgia Power Company 2013 Annual Report
See Note 4 for information regarding the Company's ownership in and a PPA with Southern Electric Generating Company (SEGCO). SEGCO plans to add natural gas as the primary fuel source for its generating units in
2015
. SEGCO has entered into a joint ownership agreement with Alabama Power, which owns and operates a generating unit adjacent to the SEGCO units, for the ownership of the gas pipeline. SEGCO will own
86%
of the pipeline with the remaining
14%
owned by Alabama Power.
The traditional operating companies, including the Company, and Southern Power may jointly enter into various types of wholesale energy, natural gas, and certain other contracts, either directly or through SCS as agent. Each participating company may be jointly and severally liable for the obligations incurred under these agreements. See Note 7 under "Fuel and Purchased Power Agreements" for additional information.
Regulatory Assets and Liabilities
The Company is subject to the provisions of the FASB in accounting for the effects of rate regulation. Regulatory assets represent probable future revenues associated with certain costs that are expected to be recovered from customers through the ratemaking process. Regulatory liabilities represent probable future reductions in revenues associated with amounts that are expected to be credited to customers through the ratemaking process.
II-235
NOTES (continued)
Georgia Power Company 2013 Annual Report
Regulatory assets and (liabilities) reflected in the balance sheets at December 31 relate to:
|
2013
|
|
2012
|
|
Note
|
|||||
|
(in millions)
|
|||||||||
|
Retiree benefit plans
|
$
|
691
|
|
$
|
1,331
|
|
(a, k)
|
||
|
Deferred income tax charges
|
684
|
|
695
|
|
(b)
|
||||
|
Deferred income tax charges — Medicare subsidy
|
38
|
|
43
|
|
(c)
|
||||
|
Loss on reacquired debt
|
181
|
|
190
|
|
(d)
|
||||
|
Asset retirement obligations
|
137
|
|
131
|
|
(b, k)
|
||||
|
Fuel-hedging (realized and unrealized) losses
|
22
|
|
49
|
|
(e)
|
||||
|
Vacation pay
|
88
|
|
85
|
|
(f, k)
|
||||
|
Building leases
|
37
|
|
40
|
|
(g)
|
||||
|
Cancelled construction projects
|
70
|
|
65
|
|
(h)
|
||||
|
Remaining net book value of retired units
|
28
|
|
—
|
|
(i)
|
||||
|
Other regulatory assets
|
86
|
|
100
|
|
(c)
|
||||
|
Other cost of removal obligations
|
(58
|
)
|
(94
|
)
|
(b)
|
||||
|
Deferred income tax credits
|
(112
|
)
|
(115
|
)
|
(b)
|
||||
|
State income tax credits
|
—
|
|
(36
|
)
|
(j)
|
||||
|
Other regulatory liabilities
|
(6
|
)
|
(13
|
)
|
(e)
|
||||
|
Total regulatory assets (liabilities), net
|
$
|
1,886
|
|
$
|
2,471
|
|
|||
Note: The recovery and amortization periods for these regulatory assets and (liabilities) are as follows:
|
(a)
|
Recovered and amortized over the average remaining service period which may range up to
14 years
. See Note 2 for additional information.
|
|
(b)
|
Asset retirement and other cost of removal obligations and deferred income tax assets are recovered, and deferred income tax liabilities are amortized over the related property lives, which may range up to
70 years
. Asset retirement and removal liabilities will be settled and trued up following completion of the related activities. At December 31, 2013, other cost of removal obligations included
$43 million
that will be amortized over the
three
-year period of January 2014 through December 2016 in accordance with the Company's Alternate Rate Plan for the years 2014 through 2016 (2013 ARP).
|
|
(c)
|
Recorded and recovered or amortized as approved by the Georgia PSC over periods generally not exceeding
nine years
.
|
|
(d)
|
Recovered over either the remaining life of the original issue or, if refinanced, over the remaining life of the new issue, which currently does not exceed
39 years
.
|
|
(e)
|
Fuel-hedging assets and liabilities are recorded over the life of the underlying hedged purchase contracts, which generally do not exceed
two
years. Upon final settlement, actual costs incurred are recovered through the Company's fuel cost recovery mechanism.
|
|
(f)
|
Recorded as earned by employees and recovered as paid, generally within
one year
. This includes both vacation and banked holiday pay.
|
|
(g)
|
See Note 6 under "Capital Leases." Recovered over the remaining lives of the buildings through 2026.
|
|
(h)
|
Costs associated with construction of environmental controls that will not be completed as a result of unit retirements and amortized over
nine years
in accordance with the 2013 ARP.
|
|
(i)
|
Amortization period over original remaining life beginning October 2013 through December 2022 as approved by the Georgia PSC in the 2013 ARP.
|
|
(j)
|
Additional tax benefits resulting from the Georgia state income tax credit settlement that were amortized over a
21
-month period that began in April 2012 and ended in December 2013, in accordance with a Georgia PSC order. See Note 5 under "Current and Deferred Income Taxes" for additional information.
|
|
(k)
|
Not earning a return as offset in rate base by a corresponding asset or liability
.
|
In the event that a portion of the Company's operations is no longer subject to applicable accounting rules for rate regulation, the Company would be required to write off to income or reclassify to accumulated other comprehensive income (OCI) related regulatory assets and liabilities that are not specifically recoverable through regulated rates. In addition, the Company would be required to determine if any impairment to other assets, including plant, exists and write down the assets, if impaired, to their fair values. All regulatory assets and liabilities are to be reflected in rates. See Note 3 under "Retail Regulatory Matters" for additional information.
Revenues
Wholesale capacity revenues are generally recognized on a levelized basis over the appropriate contract period. Energy and other revenues are recognized as services are provided. Unbilled revenues related to retail sales are accrued at the end of each fiscal period. Electric rates for the Company include provisions to adjust billings for fluctuations in fuel costs, the energy component of purchased power costs, and certain other costs. Revenues are adjusted for differences between the actual recoverable costs and amounts billed in current regulated rates.
II-236
NOTES (continued)
Georgia Power Company 2013 Annual Report
The Company has a diversified base of customers. No single customer or industry comprises
10%
or more of revenues. For all periods presented, uncollectible accounts averaged less than
1%
of revenues.
Fuel Costs
Fuel costs are expensed as the fuel is used. Fuel expense includes fuel transportation costs and the cost of purchased emissions allowances as they are used. Fuel expense also includes the amortization of the cost of nuclear fuel and a charge, based on nuclear generation, for the permanent disposal of spent nuclear fuel. See Note 3 under "Nuclear Fuel Disposal Costs" for additional information.
Income and Other Taxes
The Company uses the liability method of accounting for deferred income taxes and provides deferred income taxes for all significant income tax temporary differences. Taxes that are collected from customers on behalf of governmental agencies to be remitted to these agencies are presented net on the statements of income.
Federal investment tax credits (ITCs) utilized are deferred and amortized to income as a credit to reduce depreciation over the average life of the related property. State ITCs are recognized in the period in which the credits are claimed on the state income tax return. A portion of the ITCs available to reduce income taxes payable was not utilized currently and will be carried forward and utilized in future years.
In accordance with accounting standards related to the uncertainty in income taxes, the Company recognizes tax positions that are "more likely than not" of being sustained upon examination by the appropriate taxing authorities. See Note 5 under "Unrecognized Tax Benefits" for additional information.
Property, Plant, and Equipment
Property, plant, and equipment is stated at original cost less any regulatory disallowances and impairments. Original cost includes: materials; labor; minor items of property; appropriate administrative and general costs; payroll-related costs such as taxes, pensions, and other benefits; and the cost of equity and debt funds used during construction.
The Company's property, plant, and equipment in service consisted of the following at December 31:
|
2013
|
2012
|
||||||
|
(in millions)
|
|||||||
|
Generation
|
$
|
14,872
|
|
$
|
14,567
|
|
|
|
Transmission
|
4,859
|
|
4,581
|
|
|||
|
Distribution
|
8,620
|
|
8,373
|
|
|||
|
General
|
1,753
|
|
1,695
|
|
|||
|
Plant acquisition adjustment
|
28
|
|
28
|
|
|||
|
Total plant in service
|
$
|
30,132
|
|
$
|
29,244
|
|
|
The cost of replacements of property, exclusive of minor items of property, is capitalized. The cost of maintenance, repairs, and replacement of minor items of property is charged to other operations and maintenance expenses as incurred or performed with the exception of certain generating plant maintenance costs. As mandated by the Georgia PSC, the Company defers and amortizes nuclear refueling outage costs over the unit's operating cycle. The refueling cycles are
18
and
24 months
for Plant Vogtle Units 1 and 2 and Plant Hatch Units 1 and 2, respectively. Also, in accordance with a Georgia PSC order, the Company deferred the costs of certain significant inspection costs for the combustion turbine units at Plant McIntosh and amortized such costs over
10 years
, which approximated the expected maintenance cycle of the units. All inspection costs were fully amortized in 2013.
Depreciation and Amortization
Depreciation of the original cost of utility plant in service is provided primarily by using composite straight-line rates, which approximated
3.0%
in
2013
,
2.9%
in
2012
, and
2.8%
in
2011
. Depreciation studies are conducted periodically to update the composite rates that are approved by the Georgia PSC and the FERC. Effective January 1, 2014, the Company's depreciation rates were revised by the Georgia PSC in connection with the 2013 ARP. When property subject to depreciation is retired or otherwise disposed of in the normal course of business, its original cost, together with the cost of removal, less salvage, is charged to accumulated depreciation. For other property dispositions, the applicable cost and accumulated depreciation are removed from the balance sheet accounts, and a gain or loss is recognized. Minor items of property included in the original cost of the plant are retired when the related property unit is retired.
II-237
NOTES (continued)
Georgia Power Company 2013 Annual Report
In 2009, the Georgia PSC approved an accounting order allowing the Company to amortize a portion of its regulatory liability related to other cost of removal obligations. Under the terms of the Company's Alternate Rate Plan for the years 2011 through 2013 (2010 ARP), the Company amortized approximately
$31 million
annually of the remaining regulatory liability related to other cost of removal obligations over the
three years
ended December 31, 2013. Under the terms of the 2013 ARP, an additional
$43 million
will be amortized ratably over the
three years
ending December 31, 2016.
Asset Retirement Obligations and Other Costs of Removal
Asset retirement obligations are computed as the present value of the ultimate costs for an asset's future retirement and are recorded in the period in which the liability is incurred. The costs are capitalized as part of the related long-lived asset and depreciated over the asset's useful life. The Company has received accounting guidance from the Georgia PSC allowing the continued accrual of other future retirement costs for long-lived assets that the Company does not have a legal obligation to retire. Accordingly, the accumulated removal costs for these obligations are reflected in the balance sheets as a regulatory liability.
The asset retirement obligation liability relates to the decommissioning of the Company's nuclear facilities, which include the Company's ownership interests in Plant Hatch and Plant Vogtle Units 1 and 2, as well as various landfill sites, ash ponds, underground storage tanks, and asbestos removal. The Company also has identified retirement obligations related to certain transmission and distribution facilities, including the disposal of polychlorinated biphenyls in certain transformers; leasehold improvements; equipment on customer property; and property associated with the Company's rail lines and natural gas pipelines. However, liabilities for the removal of these assets have not been recorded because the settlement timing for the retirement obligations related to these assets is indeterminable and, therefore, the fair value of the retirement obligations cannot be reasonably estimated. A liability for these asset retirement obligations will be recognized when sufficient information becomes available to support a reasonable estimation of the asset retirement obligation. The Company will continue to recognize in the statements of income the allowed removal costs in accordance with its regulatory treatment. Any difference between costs recognized in accordance with accounting standards related to asset retirement and environmental obligations and those reflected in rates are recognized as either a regulatory asset or liability in the balance sheets as ordered by the Georgia PSC. See "Nuclear Decommissioning" herein for additional information on amounts included in rates.
Details of the asset retirement obligations included in the balance sheets are as follows:
|
2013
|
2012
|
||||||
|
(in millions)
|
|||||||
|
Balance at beginning of year
|
$
|
1,105
|
|
$
|
757
|
|
|
|
Liabilities incurred
|
2
|
|
24
|
|
|||
|
Liabilities settled
|
(13
|
)
|
(15
|
)
|
|||
|
Accretion
|
55
|
|
72
|
|
|||
|
Cash flow revisions
|
73
|
|
267
|
|
|||
|
Balance at end of year
|
$
|
1,222
|
|
$
|
1,105
|
|
|
The increase in cash flow revisions is related to updated estimates for ash ponds in connection with the retirement of certain coal-fired generating units and revisions to the nuclear decommissioning asset retirement obligations based on the latest decommissioning study.
Nuclear Decommissioning
The U.S. Nuclear Regulatory Commission (NRC) requires licensees of commercial nuclear power reactors to establish a plan for providing reasonable assurance of funds for future decommissioning. The Company has external trust funds (Funds) to comply with the NRC's regulations. Use of the Funds is restricted to nuclear decommissioning activities. The Funds are managed and invested in accordance with applicable requirements of various regulatory bodies, including the NRC, the FERC, and the Georgia PSC, as well as the Internal Revenue Service (IRS). The Funds are required to be held by one or more trustees with an individual net worth of at least
$100 million
. The FERC requires the Funds' managers to exercise the standard of care in investing that a "prudent investor" would use in the same circumstances. The FERC regulations also require that the Funds' managers may not invest in any securities of the utility for which it manages funds or its affiliates, except for investments tied to market indices or other mutual funds. While the Company is allowed to prescribe an overall investment policy to the Funds' managers, the Company and its affiliates are not allowed to engage in the day-to-day management of the Funds or to mandate individual investment decisions. Day-to-day management of the investments in the Funds is delegated to unrelated third party managers with oversight by the management of the Company. The Funds' managers are authorized, within certain investment guidelines, to
II-238
NOTES (continued)
Georgia Power Company 2013 Annual Report
actively buy and sell securities at their own discretion in order to maximize the return on the Funds' investments. The Funds are invested in a tax-efficient manner in a diversified mix of equity and fixed income securities and are reported as trading securities.
The Company records the investment securities held in the Funds at fair value, as discussed in Note 10, as management believes that fair value best represents the nature of the Funds. Gains and losses, whether realized or unrealized, are recorded in the regulatory liability for asset retirement obligations in the balance sheets and are not included in net income or OCI. Fair value adjustments and realized gains and losses are determined on a specific identification basis.
The Funds participate in a securities lending program through the managers of the Funds. Under this program, the Funds' investment securities are loaned to institutional investors for a fee. Securities so loaned are fully collateralized by cash, letters of credit, and securities issued or guaranteed by the U.S. government, its agencies, and the instrumentalities. As of
December 31, 2013
and
2012
, approximately
$32 million
and
$91 million
, respectively, of the fair market value of the Funds' securities were on loan and pledged to creditors under the Funds' managers' securities lending program. The fair value of the collateral received was approximately
$33 million
and
$93 million
at
December 31, 2013
and
2012
, respectively, and can only be sold by the borrower upon the return of the loaned securities. The collateral received is treated as a non-cash item in the statements of cash flows.
At
December 31, 2013
, investment securities in the Funds totaled
$751 million
, consisting of equity securities of
$330 million
, debt securities of
$397 million
, and
$24 million
of other securities. At
December 31, 2012
, investment securities in the Funds totaled
$698 million
, consisting of equity securities of
$280 million
, debt securities of
$408 million
, and
$10 million
of other securities. These amounts include the investment securities pledged to creditors and collateral received, and exclude receivables related to investment income and pending investment sales, and payables related to pending investment purchases and the lending pool.
Sales of the securities held in the Funds resulted in cash proceeds of
$705 million
,
$850 million
, and
$1.8 billion
in
2013
,
2012
, and
2011
, respectively, all of which were reinvested. For
2013
, fair value increases, including reinvested interest and dividends and excluding the Funds' expenses, were
$61 million
, of which
$34 million
related to unrealized gains on securities held in the Funds at
December 31, 2013
. For
2012
, fair value increases, including reinvested interest and dividends and excluding the Funds' expenses, were
$67 million
, of which
$25 million
related to unrealized gains on securities held in the Funds at
December 31, 2012
. For
2011
, fair value increases, including reinvested interest and dividends and excluding the Funds' expenses, were
$23 million
, of which
$9 million
related to unrealized losses on securities held in the Funds at
December 31, 2011
. While the investment securities held in the Funds are reported as trading securities, the Funds continue to be managed with a long-term focus. Accordingly, all purchases and sales within the Funds are presented separately in the statements of cash flows as investing cash flows, consistent with the nature of and purpose for which the securities were acquired.
The NRC's minimum external funding requirements are based on a generic estimate of the cost to decommission only the radioactive portions of a nuclear unit based on the size and type of reactor. The Company has filed plans with the NRC designed to ensure that, over time, the deposits and earnings of the Funds will provide the minimum funding amounts prescribed by the NRC.
II-239
NOTES (continued)
Georgia Power Company 2013 Annual Report
Site study cost is the estimate to decommission a specific facility as of the site study year. The decommissioning cost estimates are based on prompt dismantlement and removal of the plant from service. The actual decommissioning costs may vary from these estimates because of changes in the assumed date of decommissioning, changes in NRC requirements, or changes in the assumptions used in making these estimates. The estimated costs of decommissioning are based on the most current study performed in 2012. The site study costs and external trust funds for decommissioning as of
December 31, 2013
based on the Company's ownership interests were as follows:
|
Plant Hatch
|
Plant Vogtle
Units 1 and 2
|
||||||
|
Decommissioning periods:
|
|||||||
|
Beginning year
|
2034
|
|
2047
|
|
|||
|
Completion year
|
2068
|
|
2072
|
|
|||
|
(in millions)
|
|||||||
|
Site study costs:
|
|||||||
|
Radiated structures
|
$
|
549
|
|
$
|
453
|
|
|
|
Spent fuel management
|
131
|
|
115
|
|
|||
|
Non-radiated structures
|
51
|
|
76
|
|
|||
|
Total site study costs
|
$
|
731
|
|
$
|
644
|
|
|
|
External trust funds
|
$
|
469
|
|
$
|
277
|
|
|
For ratemaking purposes, the Company's decommissioning costs are based on the NRC generic estimate to decommission the radioactive portion of the facilities and the site study estimate for spent fuel management as of 2012. The Georgia PSC approved annual decommissioning costs for ratemaking of
$2 million
annually for Plant Hatch for 2011 through 2013. Under the 2013 ARP, the annual decommissioning cost through 2016 for ratemaking is
$4 million
and
$2 million
for Plant Hatch and Plant Vogtle Units 1 and 2, respectively. Significant assumptions used to determine the costs for ratemaking include an estimated inflation rate of
2.4%
and an estimated trust earnings rate of
4.4%
. The Company expects the Georgia PSC to periodically review and adjust, if necessary, the amounts collected in rates for nuclear decommissioning costs.
Allowance for Funds Used During Construction
In accordance with regulatory treatment, the Company records allowance for funds used during construction
(
AFUDC), which represents the estimated debt and equity costs of capital funds that are necessary to finance the construction of new regulated facilities. While cash is not realized currently from such allowance, AFUDC increases the revenue requirement and is recovered over the service life of the plant through a higher rate base and higher depreciation. The equity component of AFUDC is not included in calculating taxable income. For the years
2013
,
2012
, and
2011
, the average AFUDC rates were
5.3%
,
6.8%
, and
7.5%
, respectively, and AFUDC capitalized was
$44 million
,
$75 million
, and
$134 million
, respectively. AFUDC, net of income taxes, was
3.3%
,
5.7%
, and
10.4%
of net income after dividends on preferred and preference stock for
2013
,
2012
, and
2011
, respectively. See Note 3 under "Retail Regulatory Matters – Nuclear Construction" for additional information on the inclusion of construction costs related to the construction of two new nuclear generating units at Plant Vogtle (Plant Vogtle Units 3 and 4) in rate base effective January 1, 2011.
Impairment of Long-Lived Assets and Intangibles
The Company evaluates long-lived assets for impairment when events or changes in circumstances indicate that the carrying value of such assets may not be recoverable. The determination of whether an impairment has occurred is based on either a specific regulatory disallowance or an estimate of undiscounted future cash flows attributable to the assets, as compared with the carrying value of the assets. If an impairment has occurred, the amount of the impairment recognized is determined by either the amount of regulatory disallowance or by estimating the fair value of the assets and recording a loss if the carrying value is greater than the fair value. For assets identified as held for sale, the carrying value is compared to the estimated fair value less the cost to sell in order to determine if an impairment loss is required. Until the assets are disposed of, their estimated fair value is re-evaluated when circumstances or events change.
Storm Damage Recovery
The Company defers and recovers certain costs related to damages from major storms as mandated by the Georgia PSC. Under the 2010 ARP, the Company accrued
$18 million
annually that was recoverable through base rates. At
December 31, 2013
, the Company's regulatory asset related to storm damage was
$37 million
, with approximately
$30 million
included in other
II-240
NOTES (continued)
Georgia Power Company 2013 Annual Report
regulatory assets, current and approximately
$7 million
included as other regulatory assets, deferred. Beginning January 1, 2014, the Company is accruing
$30 million
annually under the 2013 ARP. The Company expects the Georgia PSC to periodically review and adjust, if necessary, the amounts collected in rates for storm damage costs.
Environmental Remediation Recovery
The Company maintains a reserve for environmental remediation as mandated by the Georgia PSC. On December 17, 2013, the Georgia PSC approved the 2013 ARP including the recovery of approximately
$2 million
annually through the environmental compliance cost recovery (ECCR) tariff from 2014 through 2016. The Company recovered approximately
$3 million
annually through the ECCR tariff from 2011 through 2013 under the 2010 ARP. The Company recognizes a liability for environmental remediation costs only when it determines a loss is probable and reduces the reserve as expenditures are incurred. Any difference between the liabilities accrued and cost recovered through rates is deferred as a regulatory asset or liability. The annual recovery amount is expected to be reviewed by the Georgia PSC and adjusted in future regulatory proceedings. As a result of this regulatory treatment, environmental remediation liabilities generally are not expected to have a material impact on the Company's financial statements. As of
December 31, 2013
, the balance of the environmental remediation liability was
$18 million
, with approximately
$2 million
included in other regulatory assets, current and approximately
$9 million
included as other regulatory assets, deferred. See Note 3 under "Environmental Matters – Environmental Remediation" for additional information.
Cash and Cash Equivalents
For purposes of the financial statements, temporary cash investments are considered cash equivalents. Temporary cash investments are securities with original maturities of
90 days
or less.
Materials and Supplies
Generally, materials and supplies include the average cost of transmission, distribution, and generating plant materials. Materials are charged to inventory when purchased and then expensed or capitalized to plant, as appropriate, at weighted average cost when installed.
Fuel Inventory
Fuel inventory includes the average cost of coal, natural gas, and oil, as well as transportation and emissions allowances. Fuel is charged to inventory when purchased and then expensed, at weighted average cost, as used and recovered by the Company through fuel cost recovery rates approved by the Georgia PSC. Emissions allowances granted by the U.S. Environmental Protection Agency (EPA) are included in inventory at zero cost.
Financial Instruments
The Company uses derivative financial instruments to limit exposure to fluctuations in interest rates, the prices of certain fuel purchases, and electricity purchases and sales. All derivative financial instruments are recognized as either assets or liabilities (included in "Other" or shown separately as "Risk Management Activities") and are measured at fair value. See Note 10 for additional information. Substantially all of the Company's bulk energy purchases and sales contracts that meet the definition of a derivative are excluded from fair value accounting requirements because they qualify for the "normal" scope exception, and are accounted for under the accrual method. Other derivative contracts qualify as cash flow hedges of anticipated transactions or are recoverable through the Georgia PSC-approved fuel-hedging program. This results in the deferral of related gains and losses in OCI or regulatory assets and liabilities, respectively, until the hedged transactions occur. Any ineffectiveness arising from cash flow hedges is recognized currently in net income. Other derivative contracts are marked to market through current period income and are recorded on a net basis in the statements of income. See Note 11 for additional information.
The Company does not offset fair value amounts recognized for multiple derivative instruments executed with the same counterparty under a master netting arrangement. Additionally, the Company had no outstanding collateral repayment obligations or rights to reclaim collateral arising from derivative instruments recognized at
December 31, 2013
.
The Company is exposed to losses related to financial instruments in the event of counterparties' nonperformance. The Company has established controls to determine and monitor the creditworthiness of counterparties in order to mitigate the Company's exposure to counterparty credit risk.
Comprehensive Income
The objective of comprehensive income is to report a measure of all changes in common stock equity of an enterprise that result from transactions and other economic events of the period other than transactions with owners. Comprehensive income consists of net income, changes in the fair value of qualifying cash flow hedges, and reclassifications for amounts included in net income.
II-241
NOTES (continued)
Georgia Power Company 2013 Annual Report
2. RETIREMENT BENEFITS
The Company has a defined benefit, trusteed, pension plan covering substantially all employees. This qualified pension plan is funded in accordance with requirements of the Employee Retirement Income Security Act of 1974, as amended (ERISA).
No
contributions to the qualified pension plan were made during
2013
.
No
mandatory contributions to the qualified pension plan are anticipated for the year ending December 31, 2014. The Company also provides certain defined benefit pension plans for a selected group of management and highly compensated employees. Benefits under these non-qualified pension plans are funded on a cash basis. In addition, the Company provides certain medical care and life insurance benefits for retired employees through other postretirement benefit plans. The Company funds its other postretirement trusts to the extent required by the Georgia PSC and the FERC. For the year ending December 31, 2014, other postretirement trust contributions are expected to total approximately
$13 million
.
Actuarial Assumptions
The weighted average rates assumed in the actuarial calculations used to determine both the benefit obligations as of the measurement date and the net periodic costs for the pension and other postretirement benefit plans for the following year are presented below. Net periodic benefit costs were calculated in 2010 for the 2011 plan year using discount rates for the pension plans and the other postretirement benefit plans of
5.52%
and
5.40%
, respectively, and an annual salary increase of
3.84%
.
|
2013
|
2012
|
2011
|
||||||
|
Discount rate:
|
||||||||
|
Pension plans
|
5.02
|
%
|
4.27
|
%
|
4.98
|
%
|
||
|
Other postretirement benefit plans
|
4.85
|
|
4.04
|
|
4.87
|
|
||
|
Annual salary increase
|
3.59
|
|
3.59
|
|
3.84
|
|
||
|
Long-term return on plan assets:
|
||||||||
|
Pension plans
|
8.20
|
|
8.20
|
|
8.45
|
|
||
|
Other postretirement benefit plans
|
6.74
|
|
7.24
|
|
7.25
|
|
||
The Company estimates the expected rate of return on pension plan and other postretirement benefit plan assets using a financial model to project the expected return on each current investment portfolio. The analysis projects an expected rate of return on each of seven different asset classes in order to arrive at the expected return on the entire portfolio relying on each trust's target asset allocation and reasonable capital market assumptions. The financial model is based on four key inputs: anticipated returns by asset class (based in part on historical returns), each trust's target asset allocation, an anticipated inflation rate, and the projected impact of a periodic rebalancing of each trust's portfolio.
An additional assumption used in measuring the accumulated other postretirement benefit obligations (APBO) was a weighted average medical care cost trend rate of
7.00%
for 2014, decreasing gradually to
5.00%
through the year
2021
and remaining at that level thereafter. An annual increase or decrease in the assumed medical care cost trend rate of
1%
would affect the APBO and the service and interest cost components at
December 31, 2013
as follows:
|
1 Percent
Increase
|
1 Percent
Decrease
|
||||||
|
(in millions)
|
|||||||
|
Benefit obligation
|
$
|
51
|
|
$
|
(43
|
)
|
|
|
Service and interest costs
|
2
|
|
(2
|
)
|
|||
II-242
NOTES (continued)
Georgia Power Company 2013 Annual Report
Pension Plans
The total accumulated benefit obligation for the pension plans was
$2.9 billion
at
December 31, 2013
and
$3.1 billion
at
December 31, 2012
. Changes in the projected benefit obligations and the fair value of plan assets during the plan years ended
December 31, 2013
and
2012
were as follows:
|
2013
|
2012
|
||||||
|
(in millions)
|
|||||||
|
Change in benefit obligation
|
|||||||
|
Benefit obligation at beginning of year
|
$
|
3,312
|
|
$
|
2,909
|
|
|
|
Service cost
|
69
|
|
60
|
|
|||
|
Interest cost
|
138
|
|
141
|
|
|||
|
Benefits paid
|
(141
|
)
|
(136
|
)
|
|||
|
Actuarial (gain) loss
|
(262
|
)
|
338
|
|
|||
|
Balance at end of year
|
3,116
|
|
3,312
|
|
|||
|
Change in plan assets
|
|||||||
|
Fair value of plan assets at beginning of year
|
2,827
|
|
2,575
|
|
|||
|
Actual return on plan assets
|
387
|
|
377
|
|
|||
|
Employer contributions
|
12
|
|
11
|
|
|||
|
Benefits paid
|
(141
|
)
|
(136
|
)
|
|||
|
Fair value of plan assets at end of year
|
3,085
|
|
2,827
|
|
|||
|
Accrued liability
|
$
|
(31
|
)
|
$
|
(485
|
)
|
|
At
December 31, 2013
, the projected benefit obligations for the qualified and non-qualified pension plans were
$3.0 billion
and
$148 million
, respectively. All pension plan assets are related to the qualified pension plan.
Amounts recognized in the balance sheets at
December 31, 2013
and
2012
related to the Company's pension plans consist of the following:
|
2013
|
2012
|
||||||
|
(in millions)
|
|||||||
|
Prepaid pension costs
|
$
|
118
|
|
$
|
—
|
|
|
|
Other regulatory assets, deferred
|
610
|
|
1,132
|
|
|||
|
Current liabilities, other
|
(12
|
)
|
(11
|
)
|
|||
|
Employee benefit obligations
|
(137
|
)
|
(474
|
)
|
|||
Presented below are the amounts included in regulatory assets at
December 31, 2013
and
2012
related to the defined benefit pension plans that had not yet been recognized in net periodic pension cost along with the estimated amortization of such amounts for
2014
.
|
2013
|
2012
|
Estimated
Amortization
in 2014
|
|||||||||
|
(in millions)
|
|||||||||||
|
Prior service cost
|
$
|
26
|
|
$
|
37
|
|
$
|
10
|
|
||
|
Net (gain) loss
|
584
|
|
1,095
|
|
41
|
|
|||||
|
Regulatory assets
|
$
|
610
|
|
$
|
1,132
|
|
|||||
II-243
NOTES (continued)
Georgia Power Company 2013 Annual Report
The changes in the balance of regulatory assets related to the defined benefit pension plans for the years ended
December 31, 2013
and
2012
are presented in the following table:
|
2013
|
2012
|
|||||
|
(in millions)
|
||||||
|
Regulatory assets:
|
||||||
|
Beginning balance
|
$
|
1,132
|
|
$
|
995
|
|
|
Net (gain) loss
|
(438
|
)
|
182
|
|
||
|
Reclassification adjustments:
|
||||||
|
Amortization of prior service costs
|
(10
|
)
|
(12
|
)
|
||
|
Amortization of net gain (loss)
|
(74
|
)
|
(33
|
)
|
||
|
Total reclassification adjustments
|
(84
|
)
|
(45
|
)
|
||
|
Total change
|
(522
|
)
|
137
|
|
||
|
Ending balance
|
$
|
610
|
|
$
|
1,132
|
|
Components of net periodic pension cost (income) were as follows:
|
2013
|
|
2012
|
|
2011
|
|
||||||
|
(in millions)
|
|||||||||||
|
Service cost
|
$
|
69
|
|
$
|
60
|
|
$
|
57
|
|
||
|
Interest cost
|
138
|
|
141
|
|
144
|
|
|||||
|
Expected return on plan assets
|
(212
|
)
|
(221
|
)
|
(234
|
)
|
|||||
|
Recognized net loss
|
74
|
|
33
|
|
6
|
|
|||||
|
Net amortization
|
10
|
|
12
|
|
12
|
|
|||||
|
Net periodic pension cost (income)
|
$
|
79
|
|
$
|
25
|
|
$
|
(15
|
)
|
||
Net periodic pension cost (income) is the sum of service cost, interest cost, and other costs netted against the expected return on plan assets. The expected return on plan assets is determined by multiplying the expected rate of return on plan assets and the market-related value of plan assets. In determining the market-related value of plan assets, the Company has elected to amortize changes in the market value of all plan assets over
five years
rather than recognize the changes immediately. As a result, the accounting value of plan assets that is used to calculate the expected return on plan assets differs from the current fair value of the plan assets.
Future benefit payments reflect expected future service and are estimated based on assumptions used to measure the projected benefit obligation for the pension plans. At
December 31, 2013
, estimated benefit payments were as follows:
|
Benefit Payments
|
|||
|
(in millions)
|
|||
|
2014
|
$
|
154
|
|
|
2015
|
161
|
|
|
|
2016
|
167
|
|
|
|
2017
|
175
|
|
|
|
2018
|
181
|
|
|
|
2019 to 2023
|
995
|
|
|
II-244
NOTES (continued)
Georgia Power Company 2013 Annual Report
Other Postretirement Benefits
Changes in the APBO and in the fair value of plan assets during the plan years ended
December 31, 2013
and
2012
were as follows:
|
2013
|
2012
|
||||||
|
(in millions)
|
|||||||
|
Change in benefit obligation
|
|||||||
|
Benefit obligation at beginning of year
|
$
|
800
|
|
$
|
774
|
|
|
|
Service cost
|
7
|
|
7
|
|
|||
|
Interest cost
|
31
|
|
37
|
|
|||
|
Benefits paid
|
(45
|
)
|
(46
|
)
|
|||
|
Actuarial (gain) loss
|
(73
|
)
|
25
|
|
|||
|
Retiree drug subsidy
|
3
|
|
3
|
|
|||
|
Balance at end of year
|
723
|
|
800
|
|
|||
|
Change in plan assets
|
|||||||
|
Fair value of plan assets at beginning of year
|
382
|
|
365
|
|
|||
|
Actual return on plan assets
|
56
|
|
43
|
|
|||
|
Employer contributions
|
11
|
|
17
|
|
|||
|
Benefits paid
|
(42
|
)
|
(43
|
)
|
|||
|
Fair value of plan assets at end of year
|
407
|
|
382
|
|
|||
|
Accrued liability
|
$
|
(316
|
)
|
$
|
(418
|
)
|
|
Amounts recognized in the balance sheets at
December 31, 2013
and
2012
related to the Company's other postretirement benefit plans consist of the following:
|
2013
|
2012
|
||||||
|
(in millions)
|
|||||||
|
Other regulatory assets, deferred
|
$
|
69
|
|
$
|
187
|
|
|
|
Employee benefit obligations
|
(316
|
)
|
(418
|
)
|
|||
Presented below are the amounts included in regulatory assets at
December 31, 2013
and
2012
related to the other postretirement benefit plans that had not yet been recognized in net periodic other postretirement benefit cost along with the estimated amortization of such amounts for
2014
.
|
2013
|
2012
|
Estimated
Amortization
in 2014
|
|||||||||
|
(in millions)
|
|||||||||||
|
Prior service cost
|
$
|
(4
|
)
|
$
|
(4
|
)
|
$
|
—
|
|
||
|
Net (gain) loss
|
73
|
|
186
|
|
2
|
|
|||||
|
Transition obligation
|
—
|
|
5
|
|
—
|
|
|||||
|
Regulatory assets
|
$
|
69
|
|
$
|
187
|
|
|||||
II-245
NOTES (continued)
Georgia Power Company 2013 Annual Report
The changes in the balance of regulatory assets related to the other postretirement benefit plans for the plan years ended
December 31, 2013
and
2012
are presented in the following table:
|
2013
|
2012
|
|||||
|
(in millions)
|
||||||
|
Regulatory assets:
|
||||||
|
Beginning balance
|
$
|
187
|
|
$
|
186
|
|
|
Net (gain) loss
|
(106
|
)
|
11
|
|
||
|
Reclassification adjustments:
|
||||||
|
Amortization of transition obligation
|
(4
|
)
|
(6
|
)
|
||
|
Amortization of prior service costs
|
—
|
|
—
|
|
||
|
Amortization of net gain (loss)
|
(8
|
)
|
(4
|
)
|
||
|
Total reclassification adjustments
|
(12
|
)
|
(10
|
)
|
||
|
Total change
|
(118
|
)
|
1
|
|
||
|
Ending balance
|
$
|
69
|
|
$
|
187
|
|
Components of the other postretirement benefit plans' net periodic cost were as follows:
|
2013
|
|
2012
|
|
2011
|
|
||||||
|
(in millions)
|
|||||||||||
|
Service cost
|
$
|
7
|
|
$
|
7
|
|
$
|
7
|
|
||
|
Interest cost
|
31
|
|
37
|
|
41
|
|
|||||
|
Expected return on plan assets
|
(24
|
)
|
(29
|
)
|
(30
|
)
|
|||||
|
Net amortization
|
12
|
|
10
|
|
11
|
|
|||||
|
Net periodic postretirement benefit cost
|
$
|
26
|
|
$
|
25
|
|
$
|
29
|
|
||
Future benefit payments, including prescription drug benefits, reflect expected future service and are estimated based on assumptions used to measure the APBO for the other postretirement benefit plans. Estimated benefit payments are reduced by drug subsidy receipts expected as a result of the Medicare Prescription Drug, Improvement, and Modernization Act of 2003 as follows:
|
Benefit Payments
|
Subsidy Receipts
|
Total
|
|||||||||
|
(in millions)
|
|||||||||||
|
2014
|
$
|
49
|
|
$
|
(4
|
)
|
$
|
45
|
|
||
|
2015
|
50
|
|
(4
|
)
|
46
|
|
|||||
|
2016
|
53
|
|
(5
|
)
|
48
|
|
|||||
|
2017
|
54
|
|
(5
|
)
|
49
|
|
|||||
|
2018
|
58
|
|
(6
|
)
|
52
|
|
|||||
|
2019 to 2023
|
287
|
|
(30
|
)
|
257
|
|
|||||
Benefit Plan Assets
Pension plan and other postretirement benefit plan assets are managed and invested in accordance with all applicable requirements, including ERISA and the Internal Revenue Code of 1986, as amended (Internal Revenue Code). The Company's investment policies for both the pension plan and the other postretirement benefit plans cover a diversified mix of assets, including equity and fixed income securities, real estate, and private equity. Derivative instruments are used primarily to gain efficient exposure to the various asset classes and as hedging tools. The Company minimizes the risk of large losses primarily through diversification but also monitors and manages other aspects of risk.
II-246
NOTES (continued)
Georgia Power Company 2013 Annual Report
The composition of the Company's pension plan and other postretirement benefit plan assets as of
December 31, 2013
and
2012
, along with the targeted mix of assets for each plan, is presented below:
|
Target
|
2013
|
2012
|
||||||
|
Pension plan assets:
|
||||||||
|
Domestic equity
|
26
|
%
|
31
|
%
|
28
|
%
|
||
|
International equity
|
25
|
|
25
|
|
24
|
|
||
|
Fixed income
|
23
|
|
23
|
|
27
|
|
||
|
Special situations
|
3
|
|
1
|
|
1
|
|
||
|
Real estate investments
|
14
|
|
14
|
|
13
|
|
||
|
Private equity
|
9
|
|
6
|
|
7
|
|
||
|
Total
|
100
|
%
|
100
|
%
|
100
|
%
|
||
|
Other postretirement benefit plan assets:
|
||||||||
|
Domestic equity
|
41
|
%
|
36
|
%
|
34
|
%
|
||
|
International equity
|
21
|
|
30
|
|
27
|
|
||
|
Domestic fixed income
|
24
|
|
21
|
|
27
|
|
||
|
Global fixed income
|
8
|
|
8
|
|
7
|
|
||
|
Special situations
|
1
|
|
—
|
|
—
|
|
||
|
Real estate investments
|
3
|
|
3
|
|
3
|
|
||
|
Private equity
|
2
|
|
2
|
|
2
|
|
||
|
Total
|
100
|
%
|
100
|
%
|
100
|
%
|
||
The investment strategy for plan assets related to the Company's qualified pension plan is to be broadly diversified across major asset classes. The asset allocation is established after consideration of various factors that affect the assets and liabilities of the pension plan including, but not limited to, historical and expected returns and interest rates, volatility, correlations of asset classes, the current level of assets and liabilities, and the assumed growth in assets and liabilities. Because a significant portion of the liability of the pension plan is long-term in nature, the assets are invested consistent with long-term investment expectations for return and risk. To manage the actual asset class exposures relative to the target asset allocation, the Company employs a formal rebalancing program. As additional risk management, external investment managers and service providers are subject to written guidelines to ensure appropriate and prudent investment practices.
Investment Strategies
Detailed below is a description of the investment strategies for each major asset category for the pension and other postretirement benefit plans disclosed above:
|
•
|
Domestic equity.
A mix of large and small capitalization stocks with generally an equal distribution of value and growth attributes, managed both actively and through passive index approaches.
|
|
•
|
International equity.
A mix of growth stocks and value stocks with both developed and emerging market exposure, managed both actively and through passive index approaches.
|
|
•
|
Fixed income.
A mix of domestic and international bonds.
|
|
•
|
Trust-owned life insurance (TOLI).
Investments of the Company's taxable trusts aimed at minimizing the impact of taxes on the portfolio.
|
|
•
|
Special situations.
Investments in opportunistic strategies with the objective of diversifying and enhancing returns and exploiting short-term inefficiencies as well as investments in promising new strategies of a longer-term nature.
|
|
•
|
Real estate investments.
Investments in traditional private market, equity-oriented investments in real properties (indirectly through pooled funds or partnerships) and in publicly traded real estate securities.
|
|
•
|
Private equity.
Investments in private partnerships that invest in private or public securities typically through privately-negotiated and/or structured transactions, including leveraged buyouts, venture capital, and distressed debt.
|
II-247
NOTES (continued)
Georgia Power Company 2013 Annual Report
Benefit Plan Asset Fair Values
Following are the fair value measurements for the pension plan and the other postretirement benefit plan assets as of
December 31, 2013
and
2012
. The fair values presented are prepared in accordance with GAAP. For purposes of determining the fair value of the pension plan and other postretirement benefit plan assets and the appropriate level designation, management relies on information provided by the plan's trustee. This information is reviewed and evaluated by management with changes made to the trustee information as appropriate.
Valuation methods of the primary fair value measurements disclosed in the following tables are as follows:
|
•
|
Domestic and international equity.
Investments in equity securities such as common stocks, American depositary receipts, and real estate investment trusts that trade on a public exchange are classified as Level 1 investments and are valued at the closing price in the active market. Equity investments with unpublished prices (i.e. pooled funds) are valued as Level 2, when the underlying holdings used to value the investment are comprised of Level 1 or Level 2 equity securities.
|
|
•
|
Fixed income.
Investments in fixed income securities are generally classified as Level 2 investments and are valued based on prices reported in the market place. Additionally, the value of fixed income securities takes into consideration certain items such as broker quotes, spreads, yield curves, interest rates, and discount rates that apply to the term of a specific instrument.
|
|
•
|
TOLI.
Investments in TOLI policies are classified as Level 2 investments and are valued based on the underlying investments held in the policy's separate account. The underlying assets are equity and fixed income pooled funds that are comprised of Level 1 and Level 2 securities.
|
|
•
|
Real estate investments and private equity.
Investments in private equity and real estate are generally classified as Level 3 as the underlying assets typically do not have observable inputs. The fund manager values the assets using various inputs and techniques depending on the nature of the underlying investments. In the case of private equity, techniques may include purchase multiples for comparable transactions, comparable public company trading multiples, and discounted cash flow analysis. Real estate managers generally use prevailing market capitalization rates, recent sales of comparable investments, and independent third-party appraisals to value underlying real estate investments. The fair value of partnerships is determined by aggregating the value of the underlying assets.
|
II-248
NOTES (continued)
Georgia Power Company 2013 Annual Report
The fair values of pension plan assets as of
December 31, 2013
and
2012
are presented below. These fair value measurements exclude cash, receivables related to investment income, pending investments sales, and payables related to pending investment purchases. Assets that are considered special situations investments, primarily real estate investments and private equities, are presented in the tables below based on the nature of the investment.
|
Fair Value Measurements Using
|
|||||||||||||||
|
Quoted Prices in Active Markets for Identical Assets
|
Significant Other Observable Inputs
|
Significant Unobservable Inputs
|
|||||||||||||
|
As of December 31, 2013:
|
(Level 1)
|
(Level 2)
|
(Level 3)
|
Total
|
|||||||||||
|
(in millions)
|
|||||||||||||||
|
Assets:
|
|||||||||||||||
|
Domestic equity*
|
$
|
506
|
|
$
|
296
|
|
$
|
—
|
|
$
|
802
|
|
|||
|
International equity*
|
389
|
|
359
|
|
—
|
|
748
|
|
|||||||
|
Fixed income:
|
|||||||||||||||
|
U.S. Treasury, government, and agency bonds
|
—
|
|
212
|
|
—
|
|
212
|
|
|||||||
|
Mortgage- and asset-backed securities
|
—
|
|
55
|
|
—
|
|
55
|
|
|||||||
|
Corporate bonds
|
—
|
|
346
|
|
—
|
|
346
|
|
|||||||
|
Pooled funds
|
—
|
|
166
|
|
—
|
|
166
|
|
|||||||
|
Cash equivalents and other
|
—
|
|
79
|
|
—
|
|
79
|
|
|||||||
|
Real estate investments
|
92
|
|
—
|
|
353
|
|
445
|
|
|||||||
|
Private equity
|
—
|
|
—
|
|
202
|
|
202
|
|
|||||||
|
Total
|
$
|
987
|
|
$
|
1,513
|
|
$
|
555
|
|
$
|
3,055
|
|
|||
|
Liabilities:
|
|||||||||||||||
|
Derivatives
|
—
|
|
(1
|
)
|
—
|
|
(1
|
)
|
|||||||
|
Total
|
$
|
987
|
|
$
|
1,512
|
|
$
|
555
|
|
$
|
3,054
|
|
|||
|
*
|
Level 1 securities consist of actively traded stocks while Level 2 securities consist of pooled funds. Management believes that the portfolio is well-diversified with no significant concentrations of risk.
|
II-249
NOTES (continued)
Georgia Power Company 2013 Annual Report
|
Fair Value Measurements Using
|
|||||||||||||||
|
Quoted Prices in Active Markets for Identical Assets
|
Significant Other Observable Inputs
|
Significant Unobservable Inputs
|
|||||||||||||
|
As of December 31, 2012:
|
(Level 1)
|
(Level 2)
|
(Level 3)
|
Total
|
|||||||||||
|
(in millions)
|
|||||||||||||||
|
Assets:
|
|||||||||||||||
|
Domestic equity*
|
$
|
413
|
|
$
|
238
|
|
$
|
—
|
|
$
|
651
|
|
|||
|
International equity*
|
324
|
|
348
|
|
—
|
|
672
|
|
|||||||
|
Fixed income:
|
|||||||||||||||
|
U.S. Treasury, government, and agency bonds
|
—
|
|
183
|
|
—
|
|
183
|
|
|||||||
|
Mortgage- and asset-backed securities
|
—
|
|
45
|
|
—
|
|
45
|
|
|||||||
|
Corporate bonds
|
—
|
|
312
|
|
1
|
|
313
|
|
|||||||
|
Pooled funds
|
—
|
|
142
|
|
—
|
|
142
|
|
|||||||
|
Cash equivalents and other
|
2
|
|
195
|
|
—
|
|
197
|
|
|||||||
|
Real estate investments
|
92
|
|
—
|
|
299
|
|
391
|
|
|||||||
|
Private equity
|
—
|
|
—
|
|
211
|
|
211
|
|
|||||||
|
Total
|
$
|
831
|
|
$
|
1,463
|
|
$
|
511
|
|
$
|
2,805
|
|
|||
|
*
|
Level 1 securities consist of actively traded stocks while Level 2 securities consist of pooled funds. Management believes that the portfolio is well-diversified with no significant concentrations of risk.
|
Changes in the fair value measurement of the Level 3 items in the pension plan assets valued using significant unobservable inputs for the years ended
December 31, 2013
and
2012
were as follows:
|
2013
|
2012
|
||||||||||||||
|
Real Estate Investments
|
Private Equity
|
Real Estate Investments
|
Private Equity
|
||||||||||||
|
(in millions)
|
|||||||||||||||
|
Beginning balance
|
$
|
299
|
|
$
|
211
|
|
$
|
296
|
|
$
|
220
|
|
|||
|
Actual return on investments:
|
|||||||||||||||
|
Related to investments held at year end
|
25
|
|
3
|
|
2
|
|
—
|
|
|||||||
|
Related to investments sold during the year
|
10
|
|
17
|
|
1
|
|
2
|
|
|||||||
|
Total return on investments
|
35
|
|
20
|
|
3
|
|
2
|
|
|||||||
|
Purchases, sales, and settlements
|
19
|
|
(29
|
)
|
—
|
|
(11
|
)
|
|||||||
|
Ending balance
|
$
|
353
|
|
$
|
202
|
|
$
|
299
|
|
$
|
211
|
|
|||
II-250
NOTES (continued)
Georgia Power Company 2013 Annual Report
The fair values of other postretirement benefit plan assets as of
December 31, 2013
and
2012
are presented below. These fair value measurements exclude cash, receivables related to investment income, pending investments sales, and payables related to pending investment purchases. Assets that are considered special situations investments, primarily real estate investments and private equities, are presented in the tables below based on the nature of the investment.
|
Fair Value Measurements Using
|
|||||||||||||||
|
Quoted Prices in Active Markets for Identical Assets
|
Significant Other Observable Inputs
|
Significant Unobservable Inputs
|
|||||||||||||
|
As of December 31, 2013:
|
(Level 1)
|
(Level 2)
|
(Level 3)
|
Total
|
|||||||||||
|
(in millions)
|
|||||||||||||||
|
Assets:
|
|||||||||||||||
|
Domestic equity*
|
$
|
74
|
|
$
|
25
|
|
$
|
—
|
|
$
|
99
|
|
|||
|
International equity*
|
12
|
|
57
|
|
—
|
|
69
|
|
|||||||
|
Fixed income:
|
|||||||||||||||
|
U.S. Treasury, government, and agency bonds
|
—
|
|
7
|
|
—
|
|
7
|
|
|||||||
|
Mortgage- and asset-backed securities
|
—
|
|
2
|
|
—
|
|
2
|
|
|||||||
|
Corporate bonds
|
—
|
|
11
|
|
—
|
|
11
|
|
|||||||
|
Pooled funds
|
—
|
|
34
|
|
—
|
|
34
|
|
|||||||
|
Cash equivalents and other
|
—
|
|
6
|
|
—
|
|
6
|
|
|||||||
|
Trust-owned life insurance
|
—
|
|
158
|
|
—
|
|
158
|
|
|||||||
|
Real estate investments
|
3
|
|
—
|
|
11
|
|
14
|
|
|||||||
|
Private equity
|
—
|
|
—
|
|
6
|
|
6
|
|
|||||||
|
Total
|
$
|
89
|
|
$
|
300
|
|
$
|
17
|
|
$
|
406
|
|
|||
|
*
|
Level 1 securities consist of actively traded stocks while Level 2 securities consist of pooled funds. Management believes that the portfolio is well-diversified with no significant concentrations of risk.
|
II-251
NOTES (continued)
Georgia Power Company 2013 Annual Report
|
Fair Value Measurements Using
|
|||||||||||||||
|
Quoted Prices in Active Markets for Identical Assets
|
Significant Other Observable Inputs
|
Significant Unobservable Inputs
|
|||||||||||||
|
As of December 31, 2012:
|
(Level 1)
|
(Level 2)
|
(Level 3)
|
Total
|
|||||||||||
|
(in millions)
|
|||||||||||||||
|
Assets:
|
|||||||||||||||
|
Domestic equity*
|
$
|
65
|
|
$
|
27
|
|
$
|
—
|
|
$
|
92
|
|
|||
|
International equity*
|
10
|
|
51
|
|
—
|
|
61
|
|
|||||||
|
Fixed income:
|
|||||||||||||||
|
U.S. Treasury, government, and agency bonds
|
—
|
|
6
|
|
—
|
|
6
|
|
|||||||
|
Mortgage- and asset-backed securities
|
—
|
|
1
|
|
—
|
|
1
|
|
|||||||
|
Corporate bonds
|
—
|
|
10
|
|
—
|
|
10
|
|
|||||||
|
Pooled funds
|
—
|
|
32
|
|
—
|
|
32
|
|
|||||||
|
Cash equivalents and other
|
—
|
|
18
|
|
—
|
|
18
|
|
|||||||
|
Trust-owned life insurance
|
—
|
|
142
|
|
—
|
|
142
|
|
|||||||
|
Real estate investments
|
3
|
|
—
|
|
10
|
|
13
|
|
|||||||
|
Private equity
|
—
|
|
—
|
|
7
|
|
7
|
|
|||||||
|
Total
|
$
|
78
|
|
$
|
287
|
|
$
|
17
|
|
$
|
382
|
|
|||
|
*
|
Level 1 securities consist of actively traded stocks while Level 2 securities consist of pooled funds. Management believes that the portfolio is well-diversified with no significant concentrations of risk.
|
Changes in the fair value measurement of the Level 3 items in the other postretirement benefit plan assets valued using significant unobservable inputs for the years ended
December 31, 2013
and
2012
were as follows:
|
2013
|
2012
|
||||||||||||||
|
Real Estate Investments
|
Private Equity
|
Real Estate Investments
|
Private Equity
|
||||||||||||
|
(in millions)
|
|||||||||||||||
|
Beginning balance
|
$
|
10
|
|
$
|
7
|
|
$
|
9
|
|
$
|
7
|
|
|||
|
Actual return on investments:
|
|||||||||||||||
|
Related to investments held at year end
|
1
|
|
—
|
|
1
|
|
—
|
|
|||||||
|
Related to investments sold during the year
|
—
|
|
—
|
|
—
|
|
—
|
|
|||||||
|
Total return on investments
|
1
|
|
—
|
|
1
|
|
—
|
|
|||||||
|
Purchases, sales, and settlements
|
—
|
|
(1
|
)
|
—
|
|
—
|
|
|||||||
|
Ending balance
|
$
|
11
|
|
$
|
6
|
|
$
|
10
|
|
$
|
7
|
|
|||
Employee Savings Plan
The Company also sponsors a 401(k) defined contribution plan covering substantially all employees. The Company provides an
85%
matching contribution on up to
6%
of an employee's base salary. Total matching contributions made to the plan for
2013
,
2012
, and
2011
were
$24 million
,
$24 million
, and
$24 million
, respectively.
3. CONTINGENCIES AND REGULATORY MATTERS
General Litigation Matters
The Company is subject to certain claims and legal actions arising in the ordinary course of business. In addition, the Company's business activities are subject to extensive governmental regulation related to public health and the environment, such as regulation of air emissions and water discharges. Litigation over environmental issues and claims of various types, including property damage, personal injury, common law nuisance, and citizen enforcement of environmental requirements such as air quality and water standards, has increased generally throughout the U.S. In particular, personal injury, property damage, and other
II-252
NOTES (continued)
Georgia Power Company 2013 Annual Report
claims for damages alleged to have been caused by carbon dioxide and other emissions, coal combustion residuals, and alleged exposure to hazardous materials, and/or requests for injunctive relief in connection with such matters, have become more frequent. The ultimate outcome of such pending or potential litigation against the Company cannot be predicted at this time; however, for current proceedings not specifically reported herein, management does not anticipate that the ultimate liabilities, if any, arising from such current proceedings would have a material effect on the Company's financial statements.
Environmental Matters
New Source Review Actions
As part of a nationwide enforcement initiative against the electric utility industry which began in 1999, the EPA brought civil enforcement actions in federal district court against the Company alleging violations of the New Source Review provisions of the Clean Air Act at certain coal-fired electric generating units, including a unit co-owned by Gulf Power. These civil actions seek penalties and injunctive relief, including orders requiring installation of the best available control technologies at the affected units. The case against the Company (including claims related to a unit co-owned by Gulf Power) has been administratively closed in the U.S. District Court for the Northern District of Georgia since 2001.
The Company believes it complied with applicable laws and regulations in effect at the time the work in question took place. The Clean Air Act authorizes maximum civil penalties of
$25,000
to
$37,500
per day, per violation, depending on the date of the alleged violation. An adverse outcome could require substantial capital expenditures that cannot be determined at this time and could possibly require payment of substantial penalties. Such expenditures could affect future results of operations, cash flows, and financial condition if such costs are not recovered through regulated rates. The ultimate outcome of this matter cannot be determined at this time.
Environmental Remediation
The Company must comply with environmental laws and regulations that cover the handling and disposal of waste and releases of hazardous substances. Under these various laws and regulations, the Company may also incur substantial costs to clean up properties. See Note 1 under "Environmental Remediation Recovery" for additional information.
The Company has been designated or identified as a potentially responsible party (PRP) at sites governed by the Georgia Hazardous Site Response Act and/or by the federal Comprehensive Environmental Response, Compensation, and Liability Act (CERCLA), including a site in Brunswick, Georgia on the CERCLA National Priorities List (NPL). The parties have completed the removal of wastes from the Brunswick site as ordered by the EPA. Additional cleanup and claims for recovery of natural resource damages at this site or for the assessment and potential cleanup of other sites are anticipated.
The Company and numerous other entities have been designated by the EPA as PRPs at the Ward Transformer Superfund site located in Raleigh, North Carolina. In 2011, the EPA issued a Unilateral Administrative Order (UAO) to the Company and 22 other parties, ordering specific remedial action of certain areas at the site. Later in 2011, the Company filed a response with the EPA stating it has sufficient cause to believe it is not a liable party under CERCLA. The EPA notified the Company in 2011 that it is considering enforcement options against the Company and other non-complying UAO recipients. If the EPA pursues enforcement actions and the court determines that a respondent failed to comply with the UAO without sufficient cause, the EPA may also seek civil penalties of up to
$37,500
per day for the violation and punitive damages of up to
three
times the costs incurred by the EPA as a result of the party's failure to comply with the UAO.
In addition to the EPA's action at this site, the Company, along with many other parties, was sued in a private action by several existing PRPs for cost recovery related to the removal action. On February 1, 2013, the U.S. District Court for the Eastern District of North Carolina Western Division granted the Company's summary judgment motion, ruling that the Company has no liability in the private action. On May 10, 2013, the plaintiffs appealed the U.S. District Court for the Eastern District of North Carolina Western Division's order to the U.S. Court of Appeals for the Fourth Circuit.
The ultimate outcome of these matters will depend upon the success of defenses asserted, the ultimate number of PRPs participating in the cleanup, and numerous other factors and cannot be determined at this time; however, as a result of the regulatory recovery mechanisms described in Note 1 under "Environmental Remediation Recovery," these matters are not expected to have a material impact on the Company's financial statements.
Nuclear Fuel Disposal Costs
Acting through the U.S. Department of Energy (DOE) and pursuant to the Nuclear Waste Policy Act of 1982, the U.S. government entered into contracts with the Company that require the DOE to dispose of spent nuclear fuel and high level radioactive waste generated at Plant Hatch and Plant Vogtle Units 1 and 2. The DOE failed to timely perform and has yet to
II-253
NOTES (continued)
Georgia Power Company 2013 Annual Report
commence the performance of its contractual and statutory obligation to dispose of spent nuclear fuel beginning no later than January 31, 1998. Consequently, the Company has pursued and continues to pursue legal remedies against the U.S. government for its partial breach of contract.
As a result of its first lawsuit, the Company recovered approximately
$27 million
, based on its ownership interests, representing the vast majority of the Company's direct costs of the expansion of spent nuclear fuel storage facilities at Plant Hatch and Plant Vogtle Units 1 and 2 from 1998 through 2004. The proceeds were received in July 2012 and credited to the Company accounts where the original costs were charged and were used to reduce rate base, fuel, and cost of service for the benefit of customers.
In 2008, the Company filed a second lawsuit against the U.S. government for the costs of continuing to store spent nuclear fuel at Plant Hatch and Plant Vogtle Units 1 and 2. Damages are being sought for the period from January 1, 2005 through December 31, 2010. Damages will continue to accumulate until the issue is resolved or storage is provided. No amounts have been recognized in the financial statements as of
December 31, 2013
for any potential recoveries from the second lawsuit. The final outcome of this matter cannot be determined at this time; however, no material impact on the Company's net income is expected as a significant portion of any damage amounts collected from the government is expected to be credited to the Company accounts where the original costs were charged and used to reduce rate base, fuel, and cost of service for the benefit of customers.
An on-site dry storage facility at Plant Vogtle Units 1 and 2 began operation in October 2013. At Plant Hatch, an on-site dry spent fuel storage facility is also operational. Facilities at both plants can be expanded to accommodate spent fuel through the expected life of each plant.
Retail Regulatory Matters
Rate Plans
In 2010, the Georgia PSC approved the 2010 ARP, which resulted in base rate increases of approximately
$562 million
,
$17 million
,
$125 million
, and
$74 million
effective January 1, 2011, January 1, 2012, April 1, 2012, and January 1, 2013, respectively.
On December 17, 2013, the Georgia PSC voted to approve the 2013 ARP. The 2013 ARP reflects the settlement agreement among the Company, the Georgia PSC’s Public Interest Advocacy Staff, and
11
of the
13
intervenors, which was filed with the Georgia PSC on November 18, 2013.
On January 1, 2014, in accordance with the 2013 ARP, the Company increased its tariffs as follows: (1) traditional base tariff rates by approximately
$80 million
; (2) ECCR tariff by an additional
$25 million
; (3) Demand-Side Management (DSM) tariffs by an additional
$1 million
; and (4) Municipal Franchise Fee (MFF) tariff by an additional
$4 million
, for a total increase in base revenues of approximately
$110 million
.
Under the 2013 ARP, the following additional rate adjustments will be made to the Company’s tariffs in 2015 and 2016 based on annual compliance filings to be made at least
90 days
prior to the effective date of the tariffs:
|
•
|
Effective January 1, 2015 and 2016, the traditional base tariff rates will increase by an estimated
$101 million
and
$36 million
, respectively, to recover additional generation capacity-related costs;
|
|
•
|
Effective January 1, 2015 and 2016, the ECCR tariff will increase by an estimated
$76 million
and
$131 million
, respectively, to recover additional environmental compliance costs;
|
|
•
|
Effective January 1, 2015, the DSM tariffs will increase by an estimated
$6 million
and decrease by an estimated
$1 million
effective January 1, 2016; and
|
|
•
|
The MFF tariff will increase consistent with these adjustments.
|
The Company currently estimates these adjustments will result in base revenue increases of approximately
$187 million
in 2015 and
$170 million
in 2016. The estimated traditional base tariff rate increases for 2015 and 2016 do not include additional Qualifying Facility (QF) PPA expenses; however, compliance filings will include QF PPA expenses for those facilities that are projected to provide capacity to the Company during the following year.
Under the 2013 ARP, the Company’s retail return on common equity (ROE) is set at
10.95%
, and earnings are evaluated against a retail ROE range of
10.00%
to
12.00%
. Two-thirds of any earnings above
12.00%
will be directly refunded to customers, with the remaining one-third retained by the Company. There will be no recovery of any earnings shortfall below
10.00%
on an actual basis. However, if at any time during the term of the 2013 ARP, the Company projects that its retail earnings will be below
10.00%
for any calendar year, it may petition the Georgia PSC for implementation of the Interim Cost Recovery (ICR) tariff that would be used to adjust the Company’s earnings back to a
10.00%
retail ROE. The Georgia PSC would have
90 days
to rule on the Company’s request. The ICR tariff will expire at the earlier of January 1, 2017 or the end of the calendar year in which the
II-254
NOTES (continued)
Georgia Power Company 2013 Annual Report
ICR tariff becomes effective. In lieu of requesting implementation of an ICR tariff, or if the Georgia PSC chooses not to implement the ICR tariff, the Company may file a full rate case.
Except as provided above, the Company will not file for a general base rate increase while the 2013 ARP is in effect. The Company is required to file a general rate case by July 1, 2016, in response to which the Georgia PSC would be expected to determine whether the 2013 ARP should be continued, modified, or discontinued.
Integrated Resource Plans
On January 31, 2013, the Company filed its triennial Integrated Resource Plan (2013 IRP). The filing included the Company's request to decertify
16
coal- and oil-fired units totaling
2,093
megawatts (MWs). Several factors, including the cost to comply with existing and future environmental regulations, recent and forecasted economic conditions, and lower natural gas prices, contributed to the decision to close these units.
On April 17, 2013, the Georgia PSC approved the decertification of Plant Bowen Unit 6 (
32
MWs), which was retired on April 25, 2013. On September 30, 2013, Plant Branch Unit 2 (
319
MWs) was retired as approved by the Georgia PSC in the 2011 Integrated Resource Plan Update (2011 IRP Update) in order to comply with the State of Georgia's Multi-Pollutant Rule.
On July 11, 2013, the Georgia PSC approved the Company's request to decertify and retire Plant Boulevard Units 2 and 3 (
28
MWs) effective July 17, 2013. Plant Branch Units 3 and 4 (
1,016
MWs), Plant Yates Units 1 through 5 (
579
MWs), and Plant McManus Units 1 and 2 (
122
MWs) will be decertified and retired by April 16, 2015, the compliance date of the Mercury and Air Toxics Standards (MATS) rule. The decertification date of Plant Branch Unit 1 was extended from December 31, 2013 as specified in the final order in the 2011 IRP Update to coincide with the decertification date of Plant Branch Units 3 and 4. The decertification and retirement of Plant Kraft Units 1 through 4 (
316
MWs) was also approved and will be effective by April 16, 2016, based on a
one
-year extension of the MATS rule compliance date that was approved by the State of Georgia Environmental Protection Division on September 10, 2013 to allow for necessary transmission system reliability improvements.
Additionally, the Georgia PSC approved the Company's proposed MATS rule compliance plan for emissions controls necessary for the continued operation of Plants Bowen Units 1 through 4, Wansley Units 1 and 2, Scherer Units 1 through 3, and Hammond Units 1 through 4, the switch to natural gas as the primary fuel at Plant Yates Units 6 and 7 and SEGCO's Plant Gaston Units 1 through 4, as well as the fuel switch at Plant McIntosh Unit 1 to operate on Powder River Basin coal. See Note 1 under "Affiliate Transactions" herein for additional information regarding the fuel switch at SEGCO's generating units.
In the 2013 ARP, the Georgia PSC approved the amortization of the construction work in progress (CWIP) balances related to environmental projects that will not be completed at Plant Branch Units 1 through 4 and Plant Yates Units 6 and 7 over
nine
years beginning in January 2014 and the amortization of any remaining net book values of Plant Branch Unit 2 from October 2013 to December 2022, Plant Branch Unit 1 from May 2015 to December 2020, Plant Branch Unit 3 from May 2015 to December 2023, and Plant Branch Unit 4 from May 2015 to December 2024. The Georgia PSC deferred a decision regarding the appropriate recovery period for the costs associated with unusable materials and supplies remaining at the retiring plants to the Company's next base rate case, which the Company expects to file in 2016 (2016 Rate Case). In the 2013 IRP, the Georgia PSC also deferred decisions regarding the recovery of any fuel related costs that could be incurred in connection with the retirement units to be addressed in future fuel cases.
A request was filed with the Georgia PSC on January 10, 2014 to cancel the proposed biomass fuel conversion of Plant Mitchell Unit 3 (
155
MWs) because it would not be cost effective for customers. The filing also notified the Georgia PSC of the Company’s plans to seek decertification later this year. Plant Mitchell Unit 3 will continue to operate as a coal unit until April 2015 when it will be required to cease operation or install additional environmental controls to comply with the MATS rule. In connection with the retirement decision, the Company reclassified the retail portion of the net carrying value of Plant Mitchell Unit 3 from plant in service, net of depreciation, to other utility plant, net.
The decertification of these units and fuel conversions are not expected to have a material impact on the Company's financial statements; however, the ultimate outcome depends on the Georgia PSC's order in the 2016 Rate Case and future fuel cases and cannot be determined at this time.
Renewables Development
On December 17, 2013,
four
PPAs totaling
50
MWs of utility scale solar generation under the Georgia Power Advanced Solar Initiative (GPASI) were approved by the Georgia PSC, with the Company as the purchaser. These contracts will begin in 2015 and end in 2034. The resulting purchases will be for energy only and recovered through the Company’s fuel cost recovery mechanism. Under the 2013 IRP, the Georgia PSC approved an additional
525
MWs of solar generation to be purchased by the Company. The
525
MWs will be divided into
425
MWs of utility scale projects and
100
MWs of distributed generation.
II-255
NOTES (continued)
Georgia Power Company 2013 Annual Report
On November 4, 2013, the Company filed an application for the certification of
two
PPAs which were executed on April 22, 2013 for the purchase of energy from
two
wind farms in Oklahoma with capacity totaling
250
MWs that will begin in 2016 and end in 2035.
During 2013, the Company executed
four
PPAs to purchase a total of
169
MWs of biomass capacity and energy from
four
facilities in Georgia that will begin in 2015 and end in 2035. On May 21, 2013, the Georgia PSC approved
two
of the biomass PPAs and the remaining
two
were approved on December 17, 2013. The
four
biomass PPAs are contingent upon the counterparty meeting specified contract dates for posting collateral and commercial operation. The ultimate outcome of this matter cannot be determined at this time.
Fuel Cost Recovery
The Company has established fuel cost recovery rates approved by the Georgia PSC. The Georgia PSC approved reductions in the Company's total annual billings of approximately
$43 million
effective June 1, 2011,
$567 million
effective June 1, 2012, and
$122 million
effective January 1, 2013. The 2013 reduction was due to the Georgia PSC authorizing an Interim Fuel Rider, which is set to expire June 1, 2014. The Company continues to be allowed to adjust its fuel cost recovery rates prior to the next fuel case if the under or over recovered fuel balance exceeds
$200 million
. The Company's fuel cost recovery includes costs associated with a natural gas hedging program as revised and approved by the Georgia PSC on February 7, 2013, requiring it to use options and hedges within a
24
-month time horizon. See Note 11 under "Energy-Related Derivatives" for additional information. On February 18, 2014, the Georgia PSC approved the deferral of the Company's next fuel case, which is now expected to be filed by March 1, 2015.
The Company's over recovered fuel balance totaled approximately
$58 million
and
$230 million
at
December 31, 2013
and
2012
, respectively, and is included in current liabilities and other deferred credits and liabilities.
Fuel cost recovery revenues as recorded on the financial statements are adjusted for differences in actual recoverable fuel costs and amounts billed in current regulated rates. Accordingly, changes in the billing factor will not have a significant effect on the Company's revenues or net income, but will affect cash flow.
Nuclear Construction
In 2008, the Company, acting for itself and as agent for Oglethorpe Power Corporation (OPC), the Municipal Electric Authority of Georgia (MEAG Power), and the City of Dalton, Georgia (Dalton), acting by and through its Board of Water, Light, and Sinking Fund Commissioners (collectively, Owners), entered into an agreement with a consortium consisting of Westinghouse Electric Company LLC (Westinghouse) and Stone & Webster, Inc. (collectively, Contractor), pursuant to which the Contractor agreed to design, engineer, procure, construct, and test two AP1000 nuclear units (with electric generating capacity of approximately
1,100
MWs each) and related facilities at Plant Vogtle (Vogtle 3 and 4 Agreement). Under the terms of the Vogtle 3 and 4 Agreement, the Owners agreed to pay a purchase price that is subject to certain price escalations and adjustments, including fixed escalation amounts and index-based adjustments, as well as adjustments for change orders, and performance bonuses for early completion and unit performance. Each Owner is severally (and not jointly) liable for its proportionate share, based on its ownership interest, of all amounts owed to the Contractor under the Vogtle 3 and 4 Agreement. The Company's proportionate share is
45.7%
. The Vogtle 3 and 4 Agreement provides for liquidated damages upon the Contractor's failure to fulfill the schedule and performance guarantees. The Contractor's liability to the Owners for schedule and performance liquidated damages and warranty claims is subject to a cap.
Certain payment obligations of Westinghouse and Stone & Webster, Inc. under the Vogtle 3 and 4 Agreement are guaranteed by Toshiba Corporation and The Shaw Group, Inc., respectively. In the event of certain credit rating downgrades of any Owner, such Owner will be required to provide a letter of credit or other credit enhancement. The Owners may terminate the Vogtle 3 and 4 Agreement at any time for their convenience, provided that the Owners will be required to pay certain termination costs. The Contractor may terminate the Vogtle 3 and 4 Agreement under certain circumstances, including certain Owner suspension or delays of work, action by a governmental authority to permanently stop work, certain breaches of the Vogtle 3 and 4 Agreement by the Owners, Owner insolvency, and certain other events.
In 2009, the NRC issued an Early Site Permit and Limited Work Authorization which allowed limited work to begin on Plant Vogtle Units 3 and 4. The NRC certified the Westinghouse Design Control Document, as amended (DCD), for the AP1000 nuclear reactor design, effective December 30, 2011, and issued combined construction and operating licenses (COLs) in February 2012. Receipt of the COLs allowed full construction to begin. There have been technical and procedural challenges to the construction and licensing of Plant Vogtle Units 3 and 4, at the federal and state level, and additional challenges are expected as construction proceeds.
II-256
NOTES (continued)
Georgia Power Company 2013 Annual Report
In 2009, the Georgia PSC approved inclusion of the Plant Vogtle Units 3 and 4 related CWIP accounts in rate base, and the State of Georgia enacted the Georgia Nuclear Energy Financing Act, which allows the Company to recover financing costs for nuclear construction projects certified by the Georgia PSC. Financing costs are recovered on all applicable certified costs through annual adjustments to the Nuclear Construction Cost Recovery (NCCR) tariff by including the related CWIP accounts in rate base during the construction period. The Georgia PSC approved increases to the NCCR tariff of approximately
$223 million
,
$35 million
,
$50 million
, and
$60 million
, effective January 1, 2011, 2012, 2013, and 2014, respectively. Through the NCCR tariff, the Company is collecting and amortizing to earnings approximately
$91 million
of financing costs, capitalized in 2009 and 2010, over the
five
-year period ending December 31, 2015, in addition to the ongoing financing costs. At December 31, 2013, approximately
$37 million
of these 2009 and 2010 costs remained unamortized in CWIP.
The Company is required to file semi-annual Vogtle Construction Monitoring (VCM) reports with the Georgia PSC by February 28 and August 31 each year. If the projected certified construction capital costs to be borne by the Company increase by
5%
or the projected in-service dates are significantly extended, the Company is required to seek an amendment to the Plant Vogtle Units 3 and 4 certificate from the Georgia PSC. Accordingly, the Company's eighth VCM report requested an amendment to the certificate to increase the estimated in-service capital cost of Plant Vogtle Units 3 and 4 from
$4.4 billion
to
$4.8 billion
and to extend the estimated in-service dates to the fourth quarter 2017 and the fourth quarter 2018 for Plant Vogtle Units 3 and 4, respectively.
On September 3, 2013, the Georgia PSC approved a stipulation entered into by the Company and the Georgia PSC staff to waive the requirement to amend the Plant Vogtle Units 3 and 4 certificate, until the commercial operation date of Plant Vogtle Unit 3, or earlier if deemed appropriate by the Georgia PSC and the Company. In accordance with the Georgia Integrated Resource Planning Act, any costs incurred by the Company in excess of the certified amount will not be included in rate base, unless shown to be reasonable and prudent. In addition, financing costs on any excess construction-related costs potentially would be subject to recovery through AFUDC instead of the NCCR tariff. As required by the stipulation, the Company filed an abbreviated status update with the Georgia PSC on September 3, 2013, which reflected approximately
$2.4 billion
of total construction capital costs incurred through June 30, 2013. On October 15, 2013, the Georgia PSC voted to approve the Company's eighth VCM report, reflecting construction capital costs incurred, which through December 31, 2012 totaled approximately
$2.2 billion
. Also in accordance with the stipulation, the Company will file with the Georgia PSC on February 28, 2014 a combined ninth and tenth VCM report covering the period from January 1 through December 31, 2013 (Ninth/Tenth VCM report), which will request approval for an additional
$0.4 billion
of construction capital costs. The Ninth/Tenth VCM report will reflect estimated in-service construction capital costs of
$4.8 billion
and associated financing costs during the construction period, which are estimated to total approximately
$2.0 billion
. The Company expects to resume filing semi-annual VCM reports in August 2014.
In July 2012, the Owners and the Contractor began negotiations regarding the costs associated with design changes to the DCD and the delays in the timing of approval of the DCD and issuance of the COLs, including the assertion by the Contractor that the Owners are responsible for these costs under the terms of the Vogtle 3 and 4 Agreement. The portion of the additional costs claimed by the Contractor that would be attributable to the Company (based on the Company's ownership interest) with respect to these issues is approximately
$425 million
(in 2008 dollars). The Contractor also has asserted it is entitled to further schedule extensions. The Company has not agreed with either the proposed cost or schedule adjustments or that the Owners have any responsibility for costs related to these issues. In November 2012, the Company and the other Owners filed suit against the Contractor in the U.S. District Court for the Southern District of Georgia seeking a declaratory judgment that the Owners are not responsible for these costs. Also in November 2012, the Contractor filed suit against the Company and the other Owners in the U.S. District Court for the District of Columbia alleging the Owners are responsible for these costs. On August 30, 2013, the U.S. District Court for the District of Columbia dismissed the Contractor's suit, ruling that the proper venue is the U.S. District Court for the Southern District of Georgia. The Contractor appealed the decision to the U.S. Court of Appeals for the District of Columbia Circuit on September 27, 2013. While litigation has commenced and the Company intends to vigorously defend its positions, the Company also expects negotiations with the Contractor to continue with respect to cost and schedule during which negotiations the parties may reach a mutually acceptable compromise of their positions.
Processes are in place that are designed to assure compliance with the requirements specified in the DCD and the COLs, including inspections by Southern Nuclear and the NRC that occur throughout construction. As a result of such compliance processes, certain license amendment requests have been filed and approved or are pending before the NRC. Various design and other licensing-based compliance issues are expected to arise as construction proceeds, which may result in additional license amendments or require other resolution. If any license amendment requests or other licensing-based compliance issues are not resolved in a timely manner, there may be delays in the project schedule that could result in increased costs either to the Owners, the Contractor, or both.
As construction continues, the risk remains that additional challenges in the fabrication, assembly, delivery, and installation of structural modules, delays in the receipt of the remaining permits necessary for the operation of Plant Vogtle Units 3 and 4, or
II-257
NOTES (continued)
Georgia Power Company 2013 Annual Report
other issues could arise and may further impact project schedule and cost. Additional claims by the Contractor or the Company (on behalf of the Owners) are also likely to arise throughout construction. These claims may be resolved through formal and informal dispute resolution procedures under the Vogtle 3 and 4 Agreement, but also may be resolved through litigation.
The ultimate outcome of these matters cannot be determined at this time.
4. JOINT OWNERSHIP AGREEMENTS
The Company and Alabama Power own equally all of the outstanding capital stock of SEGCO, which owns electric generating units with a total rated capacity of
1,020
MWs, as well as associated transmission facilities. The capacity of these units is sold equally to the Company and Alabama Power under a power contract. The Company and Alabama Power make payments sufficient to provide for the operating expenses, taxes, interest expense, and a return on equity. The Company's share of purchased power totaled
$91 million
in
2013
,
$107 million
in
2012
, and
$141 million
in
2011
and is included in purchased power, affiliates in the statements of income. The Company accounts for SEGCO using the equity method.
The Company owns undivided interests in Plants Vogtle, Hatch, Wansley, and Scherer in varying amounts jointly with one or more of the following entities: OPC, MEAG Power, Dalton, Florida Power & Light Company, Jacksonville Electric Authority, and Gulf Power. Under these agreements, the Company has been contracted to operate and maintain the plants as agent for the co-owners and is jointly and severally liable for third party claims related to these plants. In addition, the Company jointly owns the Rocky Mountain pumped storage hydroelectric plant with OPC who is the operator of the plant. The Company and Duke Energy Florida, Inc. jointly own a combustion turbine unit (Intercession City) operated by Duke Energy Florida, Inc.
At
December 31, 2013
, the Company's percentage ownership and investment (exclusive of nuclear fuel) in jointly-owned facilities in commercial operation with the above entities were as follows:
|
Facility (Type)
|
Company Ownership
|
Plant in Service
|
Accumulated Depreciation
|
CWIP
|
||||||||
|
(in millions)
|
||||||||||||
|
Plant Vogtle (nuclear)
|
||||||||||||
|
Units 1 and 2
|
45.7%
|
$
|
3,375
|
|
$
|
2,028
|
|
$
|
53
|
|
||
|
Plant Hatch (nuclear)
|
50.1
|
1,092
|
|
551
|
|
52
|
|
|||||
|
Plant Wansley (coal)
|
53.5
|
800
|
|
260
|
|
36
|
|
|||||
|
Plant Scherer (coal)
|
||||||||||||
|
Units 1 and 2
|
8.4
|
209
|
|
80
|
|
24
|
|
|||||
|
Unit 3
|
75.0
|
1,155
|
|
398
|
|
19
|
|
|||||
|
Rocky Mountain (pumped storage)
|
25.4
|
182
|
|
120
|
|
—
|
|
|||||
|
Intercession City (combustion-turbine)
|
33.3
|
14
|
|
4
|
|
—
|
|
|||||
The Company's proportionate share of its plant operating expenses is included in the corresponding operating expenses in the statements of income and the Company is responsible for providing its own financing.
The Company also owns
45.7%
of Plant Vogtle Units 3 and 4 that are currently under construction. See Note 3 under "Retail Regulatory Matters – Nuclear Construction" for additional information.
5. INCOME TAXES
On behalf of the Company, Southern Company files a consolidated federal income tax return and combined state income tax returns for the States of Alabama, Georgia, and Mississippi. Under a joint consolidated income tax allocation agreement, each Southern Company subsidiary's current and deferred tax expense is computed on a stand-alone basis and no subsidiary is allocated more current expense than would be paid if it filed a separate income tax return. In accordance with IRS regulations, each company is jointly and severally liable for the federal tax liability.
II-258
NOTES (continued)
Georgia Power Company 2013 Annual Report
Current and Deferred Income Taxes
Details of income tax provisions are as follows:
|
2013
|
2012
|
2011
|
|||||||||
|
(in millions)
|
|||||||||||
|
Federal –
|
|||||||||||
|
Current
|
$
|
277
|
|
$
|
273
|
|
$
|
106
|
|
||
|
Deferred
|
374
|
|
370
|
|
479
|
|
|||||
|
651
|
|
643
|
|
585
|
|
||||||
|
State –
|
|||||||||||
|
Current
|
(30
|
)
|
38
|
|
19
|
|
|||||
|
Deferred
|
102
|
|
7
|
|
21
|
|
|||||
|
72
|
|
45
|
|
40
|
|
||||||
|
Total
|
$
|
723
|
|
$
|
688
|
|
$
|
625
|
|
||
The tax effects of temporary differences between the carrying amounts of assets and liabilities in the financial statements and their respective tax bases, which give rise to deferred tax assets and liabilities, are as follows:
|
2013
|
2012
|
||||||
|
|
(in millions)
|
||||||
|
Deferred tax liabilities –
|
|||||||
|
Accelerated depreciation
|
$
|
4,479
|
|
$
|
4,201
|
|
|
|
Property basis differences
|
873
|
|
757
|
|
|||
|
Employee benefit obligations
|
232
|
|
255
|
|
|||
|
Premium on reacquired debt
|
73
|
|
77
|
|
|||
|
Regulatory assets associated with employee benefit obligations
|
276
|
|
536
|
|
|||
|
Asset retirement obligations
|
495
|
|
446
|
|
|||
|
Other
|
168
|
|
93
|
|
|||
|
Total
|
6,596
|
|
6,365
|
|
|||
|
Deferred tax assets –
|
|||||||
|
Federal effect of state deferred taxes
|
159
|
|
142
|
|
|||
|
Employee benefit obligations
|
388
|
|
644
|
|
|||
|
Other property basis differences
|
93
|
|
100
|
|
|||
|
Other deferred costs
|
84
|
|
39
|
|
|||
|
Cost of removal obligations
|
17
|
|
29
|
|
|||
|
State tax credit carry forward
|
118
|
|
86
|
|
|||
|
Federal tax credit carry forward
|
3
|
|
—
|
|
|||
|
Over-recovered fuel costs
|
22
|
|
89
|
|
|||
|
Unbilled fuel revenue
|
53
|
|
39
|
|
|||
|
Asset retirement obligations
|
495
|
|
446
|
|
|||
|
Other
|
32
|
|
42
|
|
|||
|
Total
|
1,464
|
|
1,656
|
|
|||
|
Total deferred tax liabilities, net
|
5,132
|
|
4,709
|
|
|||
|
Portion included in current assets/(liabilities), net
|
68
|
|
152
|
|
|||
|
Accumulated deferred income taxes
|
$
|
5,200
|
|
$
|
4,861
|
|
|
II-259
NOTES (continued)
Georgia Power Company 2013 Annual Report
At
December 31, 2013
, tax-related regulatory assets were
$722 million
. These assets are primarily attributable to tax benefits flowed through to customers in prior years, deferred taxes previously recognized at rates lower than the current enacted tax law, and taxes applicable to capitalized interest.
At
December 31, 2013
, tax-related regulatory liabilities to be credited to customers were
$112 million
. These liabilities are primarily attributable to deferred taxes previously recognized at rates higher than current enacted tax law and to unamortized ITCs. In 2011, the Company recorded a regulatory liability of
$62 million
related to a settlement with the Georgia Department of Revenue resolving claims for certain tax credits in 2005 through 2009. Amortization of the regulatory liability occurred ratably over the period from April 2012 through December 2013.
In accordance with regulatory requirements, deferred federal ITCs are amortized over the life of the related property with such amortization normally applied as a credit to reduce depreciation in the statements of income. Credits amortized in this manner amounted to
$5 million
in
2013
,
$13 million
in
2012
, and
$9 million
in
2011
. State ITCs are recognized in the period in which the credits are claimed on the state income tax return and totaled
$27 million
in 2013,
$36 million
in 2012, and
$53 million
in 2011. At
December 31, 2013
, the Company had
$3 million
in federal tax credit carry forwards that will expire by 2032 and
$118 million
in state ITC carry forwards that will expire between 2020 and 2024.
In 2010, the Tax Relief, Unemployment Insurance Reauthorization, and Job Creation Act of 2010 (Tax Relief Act) was signed into law. Major tax incentives in the Tax Relief Act include
100%
bonus depreciation for property placed in service after September 8, 2010 and through 2011 (and for certain long-term production-period projects placed in service in 2012) and
50%
bonus depreciation for property placed in service in 2012 (and for certain long-term production-period projects placed in service in 2013).
On January 2, 2013, the American Taxpayer Relief Act of 2012 (ATRA) was signed into law. The ATRA retroactively extended several tax credits through 2013 and extended
50%
bonus depreciation for property placed in service in 2013 (and for certain long-term production-period projects to be placed in service in 2014).
The application of the bonus depreciation provisions in these laws significantly increased deferred tax liabilities related to accelerated depreciation in 2013, 2012, and 2011.
Effective Tax Rate
A reconciliation of the federal statutory income tax rate to the effective income tax rate is as follows:
|
2013
|
2012
|
2011
|
||||||
|
Federal statutory rate
|
35.0
|
%
|
35.0
|
%
|
35.0
|
%
|
||
|
State income tax, net of federal deduction
|
2.5
|
|
1.6
|
|
1.5
|
|
||
|
Non-deductible book depreciation
|
1.3
|
|
1.2
|
|
0.8
|
|
||
|
AFUDC equity
|
(0.6
|
)
|
(1.0
|
)
|
(1.9
|
)
|
||
|
Other
|
(0.4
|
)
|
(0.1
|
)
|
(0.5
|
)
|
||
|
Effective income tax rate
|
37.8
|
%
|
36.7
|
%
|
34.9
|
%
|
||
The increase in the Company's 2013 effective tax rate is primarily the result of a decrease in state income tax credits and non-taxable AFUDC equity. The increase in the Company's 2012 effective tax rate is primarily the result of an increase in non-deductible book depreciation and a decrease in non-taxable AFUDC equity.
II-260
NOTES (continued)
Georgia Power Company 2013 Annual Report
Unrecognized Tax Benefits
Changes during the year in unrecognized tax benefits were as follows:
|
2013
|
2012
|
2011
|
|||||||||
|
(in millions)
|
|||||||||||
|
Unrecognized tax benefits at beginning of year
|
$
|
23
|
|
$
|
47
|
|
$
|
237
|
|
||
|
Tax positions from current periods
|
—
|
|
3
|
|
9
|
|
|||||
|
Tax positions increase from prior periods
|
—
|
|
3
|
|
—
|
|
|||||
|
Tax positions decrease from prior periods
|
(23
|
)
|
(19
|
)
|
(87
|
)
|
|||||
|
Reductions due to settlements
|
—
|
|
(8
|
)
|
(112
|
)
|
|||||
|
Reductions due to expired statute of limitations
|
—
|
|
(3
|
)
|
—
|
|
|||||
|
Balance at end of year
|
$
|
—
|
|
$
|
23
|
|
$
|
47
|
|
||
The tax positions decrease from prior periods for 2013 relates primarily to the tax accounting method change for repairs-generation assets. See "Tax Method of Accounting for Repairs" herein for additional information.
In addition, the tax reductions due to expired statute of limitations for 2012 relate to the Georgia jobs and retraining tax credits and the Georgia manufacturer's ITCs.
The impact on the Company's effective tax rate, if recognized, is as follows:
|
2013
|
2012
|
2011
|
|||||||||
|
(in millions)
|
|||||||||||
|
Tax positions impacting the effective tax rate
|
$
|
—
|
|
$
|
—
|
|
$
|
28
|
|
||
|
Tax positions not impacting the effective tax rate
|
—
|
|
23
|
|
19
|
|
|||||
|
Balance of unrecognized tax benefits
|
$
|
—
|
|
$
|
23
|
|
$
|
47
|
|
||
The tax positions not impacting the effective tax rate for 2012 relate to the timing difference associated with the tax accounting method change for repairs-generation assets. See "Tax Method of Accounting for Repairs" herein for additional information. These amounts are presented on a gross basis without considering the related federal or state income tax impact.
Accrued interest for unrecognized tax benefits was as follows:
|
2013
|
2012
|
2011
|
|||||||||
|
(in millions)
|
|||||||||||
|
Interest accrued at beginning of year
|
$
|
—
|
|
$
|
6
|
|
$
|
27
|
|
||
|
Interest reclassified due to settlements
|
—
|
|
(6
|
)
|
(24
|
)
|
|||||
|
Interest accrued during the year
|
—
|
|
—
|
|
3
|
|
|||||
|
Balance at end of year
|
$
|
—
|
|
$
|
—
|
|
$
|
6
|
|
||
The Company classifies interest on tax uncertainties as interest expense. The Company did not accrue any penalties on uncertain tax positions.
It is reasonably possible that the amount of the unrecognized tax benefits could change within
12 months
. The settlement of federal and state audits could impact the balances significantly. At this time, an estimate of the range of reasonably possible outcomes cannot be determined.
The IRS has finalized its audits of Southern Company's consolidated federal income tax returns through 2011. Southern Company has filed its 2012 federal income tax return and has received a full acceptance letter from the IRS; however, the IRS has not finalized its audit. For tax years 2012 and 2013, Southern Company was a participant in the Compliance Assurance Process of the IRS. The audits for the Company's state income tax returns have either been concluded, or the statute of limitations has expired, for years prior to 2007.
Tax Method of Accounting for Repairs
In 2011, the IRS published regulations on the deduction and capitalization of expenditures related to tangible property that generally apply for tax years beginning on or after January 1, 2014. Additionally, on April 30, 2013, the IRS issued Revenue
II-261
NOTES (continued)
Georgia Power Company 2013 Annual Report
Procedure 2013-24, which provides guidance for taxpayers related to the deductibility of repair costs associated with generation assets. Based on a review of the regulations, Southern Company incorporated provisions related to repair costs for generation assets into its consolidated 2012 federal income tax return and reversed all related unrecognized tax positions. On September 19, 2013, the IRS issued Treasury Decision 9636, "Guidance Regarding Deduction and Capitalization of Expenditures Related to Tangible Property," which are final tangible property regulations applicable to taxable years beginning on or after January 1, 2014. Southern Company is currently reviewing this new guidance. The ultimate outcome of this matter cannot be determined at this time; however, these regulations are not expected to have a material impact on the Company's financial statements.
6. FINANCING
Securities Due Within One Year
A summary of scheduled maturities of long-term debt due within one year at December 31 was as follows:
|
2013
|
2012
|
||||||
|
(in millions)
|
|||||||
|
Senior notes
|
$
|
—
|
|
$
|
1,675
|
|
|
|
Capital lease
|
5
|
|
5
|
|
|||
|
Total
|
$
|
5
|
|
$
|
1,680
|
|
|
Maturities through 2018 applicable to total long-term debt are as follows:
$5 million
in
2014
;
$1.1 billion
in
2015
;
$710 million
in
2016
;
$457 million
in
2017
; and
$277 million
in
2018
.
Senior Notes
The Company issued
$850 million
aggregate principal amount of unsecured senior notes in
2013
. The proceeds of these issuances were used to fund a portion of the Company's repayment of
$1.8 billion
of unsecured senior notes and
$300 million
of an unsecured bank term loan, to repay a portion of the Company's short-term indebtedness, and for general corporate purposes, including the Company's continuous construction program.
At
December 31, 2013
and
2012
, the Company had
$6.9 billion
and
$7.9 billion
of senior notes outstanding, respectively. These senior notes are effectively subordinated to all secured debt of the Company, which aggregated
$45 million
and
$50 million
at
December 31, 2013
and
2012
, respectively. As of December 31, 2013 and 2012, the Company's secured debt was related to capital lease obligations.
See "DOE Loan Guarantee Borrowings" for information regarding additional secured borrowings incurred by the Company subsequent to December 31, 2013.
Pollution Control Revenue Bonds
Pollution control obligations represent loans to the Company from public authorities of funds derived from sales by such authorities of revenue bonds issued to finance pollution control and solid waste disposal facilities. The Company is required to make payments sufficient for the authorities to meet principal and interest requirements of such bonds. The amount of tax-exempt pollution control revenue bonds outstanding at
December 31, 2013
and
2012
was
$1.7 billion
and
$1.8 billion
, respectively. Proceeds from certain issuances are restricted until qualifying expenditures are incurred.
In
2013
, the Company incurred obligations in connection with issuance by public authorities of an aggregate of
$194 million
of pollution control revenue bonds. The proceeds of these issuances were used to redeem
$194 million
of outstanding pollution control bonds. Also in November 2013, the Company purchased and now holds
$104.6 million
aggregate principal amount of pollution control revenue bonds issued for its benefit in 2013.
Bank Term Loans
In March 2013, the Company entered into
three
60
-day floating rate bank loans bearing interest based on
one-month
London Interbank Offered Rate (LIBOR). Each of these short-term loans was for
$100 million
aggregate principal amount, and the proceeds were used for working capital and other general corporate purposes, including the Company's continuous construction program. These bank loans were repaid at maturity.
In November 2013, the Company entered into
three
four
-month floating rate bank loans for an aggregate principal amount of
$400 million
, bearing interest based on
one-month
LIBOR. The proceeds of these short-term loans were used for working capital and other general corporate purposes, including the Company's continuous construction program. At
December 31, 2013
, these
II-262
NOTES (continued)
Georgia Power Company 2013 Annual Report
bank term loans are included in notes payable on the balance sheets. Subsequent to December 31, 2013, the Company repaid these bank term loans. There were no bank term loans outstanding at December 31, 2012.
These bank loans have covenants that limit debt levels to
65%
of total capitalization, as defined in the agreements. For purposes of these definitions, debt excludes long-term debt payable to affiliated trusts and other hybrid securities. At
December 31, 2013
, the Company was in compliance with its debt limits.
DOE Loan Guarantee Borrowings
Pursuant to the loan guarantee program established under Title XVII of the Energy Policy Act of 2005 (Title XVII Loan Guarantee Program), the Company and the DOE entered into a loan guarantee agreement (Loan Guarantee Agreement) on February 20, 2014, under which the DOE agreed to guarantee the obligations of the Company under a note purchase agreement (FFB Note Purchase Agreement) among the DOE, the Company, and the Federal Financing Bank (FFB) and a related promissory note (FFB Promissory Note). The FFB Note Purchase Agreement and the FFB Promissory Note provide for a multi-advance term loan facility (FFB Credit Facility), under which the Company may make term loan borrowings through the FFB.
Proceeds of advances made under the FFB Credit Facility will be used to reimburse the Company for a portion of certain costs of construction relating to Plant Vogtle Units 3 and 4 that are eligible for financing under the Title XVII Loan Guarantee Program (Eligible Project Costs). Aggregate borrowings under the FFB Credit Facility may not exceed the lesser of (i)
70%
of Eligible Project Costs or (ii) approximately
$3.46 billion
.
All borrowings under the FFB Credit Facility are full recourse to the Company, and the Company is obligated to reimburse the DOE in the event the DOE is required to make any payments to FFB under the DOE guarantee. The Company's reimbursement obligations to the DOE are secured by a first priority lien on (i) the Company's
45.7%
undivided ownership interest in Plant Vogtle Units 3 and 4 and (ii) the Company's rights and obligations under the principal contracts relating to Plant Vogtle Units 3 and 4. There are no restrictions on the Company's ability to grant liens on other property.
Advances may be requested under the FFB Credit Facility on a quarterly basis through December 31, 2020. The final maturity date for each advance under the FFB Credit Facility is February 20, 2044. Interest is payable quarterly and principal payments will begin on February 20, 2020. Borrowings under the FFB Credit Facility will bear interest at the applicable U.S. Treasury rate plus a spread equal to
0.375%
.
On February 20, 2014, the Company made initial borrowings under the FFB Credit Facility in an aggregate principal amount of
$1.0 billion
. The interest rate applicable to
$500 million
of the initial advance under the FFB Credit Facility is
3.860%
for an interest period that extends to February 20, 2044 (the final maturity date) and the interest rate applicable to the remaining
$500 million
is
3.488%
for an interest period that extends to February 20, 2029, and will be reset from time to time thereafter through the final maturity date. In connection with its entry into the Loan Guarantee Agreement, the FFB Note Purchase Agreement, and the FFB Promissory Note, the Company incurred issuance costs of approximately
$67 million
, which will be amortized over the life of the borrowings under the FFB Credit Facility.
Future advances are subject to satisfaction of customary conditions, as well as certification of compliance with the requirements of the Title XVII Loan Guarantee Program, including accuracy of project-related representations and warranties, delivery of updated project-related information, and evidence of compliance with the prevailing wage requirements of the Davis-Bacon Act of 1931, as amended, compliance with the Cargo Preference Act of 1954, and certification from the DOE's consulting engineer that proceeds of the advances are used to reimburse Eligible Project Costs.
Under the Loan Guarantee Agreement, the Company is subject to customary borrower affirmative and negative covenants and events of default. In addition, the Company is subject to project-related reporting requirements and other project-specific covenants and events of default.
In the event certain mandatory prepayment events occur, the FFB’s commitment to make further advances under the FFB Credit Facility will terminate and the Company will be required to prepay the outstanding principal amount of all borrowings under the FFB Credit Facility over a period of
five years
(with level principal amortization). Under certain circumstances, insurance proceeds and any proceeds from an event of taking must be applied to immediately prepay outstanding borrowings under the FFB Credit Facility. The Company also may voluntarily prepay outstanding borrowings under the FFB Credit Facility. Under the FFB Promissory Note, any prepayment (whether mandatory or optional) will be made with a make-whole premium or discount, as applicable.
In connection with any cancellation of Plant Vogtle Units 3 and 4 that results in a mandatory prepayment event, the DOE may elect to continue construction of Plant Vogtle Units 3 and 4. In such an event, the DOE will have the right to assume the Company’s rights and obligations under the principal agreements relating to Plant Vogtle Units 3 and 4 and to acquire all or a portion of the Company’s ownership interest in Plant Vogtle Units 3 and 4.
II-263
NOTES (continued)
Georgia Power Company 2013 Annual Report
Capital Leases
Assets acquired under capital leases are recorded in the balance sheets as utility plant in service, and the related obligations are classified as long-term debt. At December 31, 2013 and 2012, the Company had a capital lease asset for its corporate headquarters building of
$61 million
, with accumulated depreciation at December 31, 2013 and 2012 of
$16 million
and
$11 million
, respectively. At
December 31, 2013
and
2012
, the capitalized lease obligation was
$45 million
and
$50 million
, respectively, with an interest rate of
7.9%
for both years. For ratemaking purposes, the Georgia PSC has allowed only the lease payments in cost of service. The difference between the accrued expense and the lease payments allowed for ratemaking purposes has been deferred and is being amortized to expense as ordered by the Georgia PSC. The annual expense incurred for all capital leases was not material for any year presented. See Note 7 under "Fuel and Purchased Power Agreements" for additional information on capital lease PPAs that become effective in 2015.
Outstanding Classes of Capital Stock
The Company currently has preferred stock, Class A preferred stock, preference stock, and common stock authorized. The Company has shares of its Class A preferred stock, preference stock, and common stock outstanding. The Company's Class A preferred stock ranks senior to the Company's preference stock and common stock with respect to payment of dividends and voluntary or involuntary dissolution. The Company's preference stock ranks senior to the common stock with respect to the payment of dividends and voluntary or involuntary dissolution. The outstanding series of the Class A preferred stock is subject to redemption at the option of the Company at any time at a redemption price equal to
100%
of the par value. In addition, on or after October 1, 2017, the Company may redeem the outstanding series of the preference stock at a redemption price equal to
100%
of the par value. With respect to any redemption of the preference stock prior to October 1, 2017, the redemption price includes a make-whole premium based on the present value of the liquidation amount and future dividends through the first par redemption date.
Dividend Restrictions
The Company can only pay dividends to Southern Company out of retained earnings or paid-in-capital.
Bank Credit Arrangements
At
December 31, 2013
, committed credit arrangements with banks were as follows:
|
Expires
(a)
|
||||||
|
2016
|
2018
|
Total
|
Unused
|
|||
|
(in millions)
|
||||||
|
$150
|
$1,600
|
$1,750
|
$1,736
|
|||
|
(a)
|
No credit arrangements expire in 2014, 2015, or 2017.
|
The Company expects to renew its credit arrangements, as needed, prior to expiration. All the credit arrangements require payment of commitment fees based on the unused portion of the commitments. Commitment fees average less than
1
/
4
of 1% for the Company.
The credit arrangements have covenants that limit the Company's debt levels to
65%
of total capitalization, as defined in the agreements. For purposes of these definitions, debt excludes certain hybrid securities.
A portion of the
$1.7 billion
of unused credit arrangements with banks is allocated to provide liquidity support to the Company's variable rate pollution control revenue bonds and its commercial paper borrowings. The amount of variable rate pollution control revenue bonds outstanding requiring liquidity support as of
December 31, 2013
was
$862 million
. In addition, at December 31, 2013, the Company had
$242 million
of fixed rate pollution control revenue bonds that will be required to be remarketed within the next 12 months.
The Company makes short-term borrowings primarily through a commercial paper program that has the liquidity support of the Company's committed bank credit arrangements. The Company may also borrow through various other arrangements with banks. Commercial paper and short-term bank term loans are included in notes payable on the balance sheets.
II-264
NOTES (continued)
Georgia Power Company 2013 Annual Report
The Company had
$1.0 billion
of short-term debt outstanding at December 31, 2013. The Company had no short-term debt outstanding at December 31, 2012, excluding
$2 million
of notes payable related to other energy service contracts. Details of short-term borrowings outstanding at December 31, 2013 were as follows:
|
Short-term Debt at the End of the Period
|
||||||
|
Amount Outstanding
|
Weighted Average Interest Rate
|
|||||
|
(in millions)
|
||||||
|
December 31, 2013:
|
||||||
|
Commercial paper
|
$
|
647
|
|
0.2
|
%
|
|
|
Short-term bank debt
|
400
|
|
0.9
|
%
|
||
|
Total
|
$
|
1,047
|
|
0.5
|
%
|
|
7. COMMITMENTS
Fuel and Purchased Power Agreements
To supply a portion of the fuel requirements of its generating plants, the Company has entered into various long-term commitments for the procurement and delivery of fossil and nuclear fuel which are not recognized on the balance sheets. In 2013, 2012, and 2011, the Company incurred fuel expense of
$2.3 billion
,
$2.1 billion
, and
$2.8 billion
, respectively, the majority of which was purchased under long-term commitments. The Company expects that a substantial amount of its future fuel needs will continue to be purchased under long-term commitments.
The Company has commitments regarding a portion of a
5%
interest in the original cost of Plant Vogtle Units 1 and 2 owned by MEAG Power that are in effect until the latter of the retirement of the plant or the latest stated maturity date of MEAG Power's bonds issued to finance such ownership interest. The payments for capacity are required whether or not any capacity is available. The energy cost is a function of each unit's variable operating costs. Portions of the capacity payments relate to costs in excess of MEAG Power's Plant Vogtle Unit 1 and 2 allowed investment for ratemaking purposes. The present value of these portions at the time of the disallowance was written off. Generally, the cost of such capacity and energy is included in purchased power, non-affiliates in the statements of income. Capacity payments totaled
$27 million
,
$50 million
, and
$52 million
in 2013, 2012, and 2011, respectively.
II-265
NOTES (continued)
Georgia Power Company 2013 Annual Report
The Company has also entered into various long-term PPAs, some of which are accounted for as capital or operating leases. Total capacity expense under PPAs accounted for as operating leases was
$162 million
,
$169 million
, and
$216 million
for 2013, 2012, and 2011, respectively. Estimated total long-term obligations at December 31, 2013 were as follows:
|
Affiliate Capital Leases
|
Non-Affiliate Capital Leases
(4)
|
Affiliate Operating Leases
|
Non-Affiliate Operating Leases
(4)
|
Vogtle Units 1 and 2 Capacity Payments
|
Total ($)
|
|||||||||||||
|
(in millions)
|
||||||||||||||||||
|
2014
|
$
|
—
|
|
$
|
—
|
|
$
|
55
|
|
$
|
112
|
|
$
|
21
|
|
$
|
188
|
|
|
2015
|
22
|
|
20
|
|
89
|
|
127
|
|
13
|
|
271
|
|
||||||
|
2016
|
22
|
|
26
|
|
99
|
|
142
|
|
11
|
|
300
|
|
||||||
|
2017
|
23
|
|
27
|
|
71
|
|
144
|
|
8
|
|
273
|
|
||||||
|
2018
|
23
|
|
27
|
|
62
|
|
145
|
|
7
|
|
264
|
|
||||||
|
2019 and thereafter
|
278
|
|
541
|
|
669
|
|
1,573
|
|
58
|
|
3,119
|
|
||||||
|
Total
|
$
|
368
|
|
$
|
641
|
|
$
|
1,045
|
|
$
|
2,243
|
|
$
|
118
|
|
$
|
4,415
|
|
|
Less: amounts representing executory costs
(1)
|
55
|
|
142
|
|
||||||||||||||
|
Net minimum lease payments
|
313
|
|
499
|
|
||||||||||||||
|
Less: amounts representing interest
(2)
|
85
|
|
166
|
|
||||||||||||||
|
Present value of net minimum lease payments
(3)
|
$
|
228
|
|
$
|
333
|
|
||||||||||||
|
(1)
|
Executory costs such as taxes, maintenance, and insurance (including the estimated profit thereon)
a
re estimated and included in total minimum lease payments.
|
|
(2)
|
Calculated at the Company's incremental borrowing rate at the inception of the leases.
|
|
(3)
|
When the PPAs begin in 2015, the Company will recognize capital lease assets and capital lease obligations totaling
$482 million
, equal to the lesser of the present value of the net minimum lease payments or the estimated fair value of the leased property.
|
|
(4)
|
A total of
$1.3 billion
of biomass PPAs included under the non-affiliate capital and operating leases is contingent upon the counterparty meeting specified contract dates for posting collateral and commercial operation.
|
SCS may enter into various types of wholesale energy and natural gas contracts acting as an agent for the Company and all of the other Southern Company traditional operating companies and Southern Power. Under these agreements, each of the traditional operating companies and Southern Power may be jointly and severally liable. Accordingly, Southern Company has entered into keep-well agreements with the Company and each of the other traditional operating companies to ensure the Company will not subsidize or be responsible for any costs, losses, liabilities, or damages resulting from the inclusion of Southern Power as a contracting party under these agreements.
Operating Leases
In addition to the PPA operating leases discussed above, the Company has other operating lease agreements with various terms and expiration dates. Total rent expense was
$32 million
for
2013
,
$34 million
for
2012
, and
$33 million
for
2011
. The Company includes any step rents, fixed escalations, and lease concessions in its computation of minimum lease payments.
II-266
NOTES (continued)
Georgia Power Company 2013 Annual Report
As of December 31, 2013, estimated minimum lease payments under operating leases were as follows:
|
Minimum Lease Payments
|
|||||||||
|
Railcars
|
Other
|
Total
|
|||||||
|
(in millions)
|
|||||||||
|
2014
|
$
|
20
|
|
$
|
6
|
|
$
|
26
|
|
|
2015
|
14
|
|
6
|
|
20
|
|
|||
|
2016
|
8
|
|
5
|
|
13
|
|
|||
|
2017
|
5
|
|
4
|
|
9
|
|
|||
|
2018
|
2
|
|
4
|
|
6
|
|
|||
|
2019 and thereafter
|
—
|
|
11
|
|
11
|
|
|||
|
Total
|
$
|
49
|
|
$
|
36
|
|
$
|
85
|
|
Railcar minimum lease payments are disclosed at
100%
of railcar lease obligations; however, a portion of these obligations is shared with the joint owners of Plants Scherer and Wansley. A majority of the rental expenses related to the railcar leases are recoverable through the fuel cost recovery clause as ordered by the Georgia PSC and the remaining portion is recovered through base rates.
In addition to the above rental commitments, the Company has obligations upon expiration of certain railcar leases with respect to the residual value of the leased property. These leases have terms expiring through 2018 with maximum obligations under these leases of
$30 million
. At the termination of the leases, the lessee may either exercise its purchase option or the property can be sold to a third party. The Company expects that the fair market value of the leased property would substantially reduce or eliminate the Company's payments under the residual value obligations.
Guarantees
Alabama Power has guaranteed the obligations of SEGCO for
$25 million
of pollution control revenue bonds issued in 2001, which mature in June 2019 and also
$100 million
of senior notes issued in November 2013, which mature in December 2018. The Company has agreed to reimburse Alabama Power for the pro rata portion of such obligations corresponding to the Company's then proportionate ownership of SEGCO's stock if Alabama Power is called upon to make such payment under its guarantee. See Note 4 for additional information.
In addition, subsequent to December 31, 2013, the Company entered into an agreement that requires the Company to guarantee certain payments of a gas supplier for Plant McIntosh for a period up to
15 years
. The guarantee is expected to be terminated if certain events occur within
one year
of the initial gas deliveries in 2017. In the event the gas supplier defaults on payments, the maximum potential exposure under the guarantee is approximately
$43 million
.
As discussed earlier in this Note under "Operating Leases," the Company has entered into certain residual value guarantees related to railcar leases.
8. STOCK COMPENSATION
Stock Options
Southern Company provides non-qualified stock options through its Omnibus Incentive Compensation Plan to a large segment of the Company's employees ranging from line management to executives. As of
December 31, 2013
, there were
1,265
current and former employees of the Company participating in the stock option program, and there were
28 million
shares of Southern Company common stock remaining available for awards under the Omnibus Incentive Compensation Plan. The prices of options were at the fair market value of the shares on the dates of grant. These options become exercisable pro rata over a maximum period of
three years
from the date of grant. The Company generally recognizes stock option expense on a straight-line basis over the vesting period which equates to the requisite service period; however, for employees who are eligible for retirement, the total cost is expensed at the grant date. Options outstanding will expire no later than
10
years after the date of grant, unless terminated earlier by the Southern Company Board of Directors in accordance with the Omnibus Incentive Compensation Plan. Stock options held by employees of a company undergoing a change in control vest upon the change in control.
The estimated fair values of stock options granted were derived using the Black-Scholes stock option pricing model. Expected volatility was based on historical volatility of Southern Company's stock over a period equal to the expected term. Southern Company used historical exercise data to estimate the expected term that represents the period of time that options granted to
II-267
NOTES (continued)
Georgia Power Company 2013 Annual Report
employees are expected to be outstanding. The risk-free rate was based on the U.S. Treasury yield curve in effect at the time of grant that covers the expected term of the stock options.
The following table shows the assumptions used in the pricing model and the weighted average grant-date fair value of stock options granted:
|
Year Ended December 31
|
2013
|
2012
|
2011
|
||
|
Expected volatility
|
16.6%
|
17.7%
|
17.5%
|
||
|
Expected term
(in years)
|
5.0
|
5.0
|
5.0
|
||
|
Interest rate
|
0.9%
|
0.9%
|
2.3%
|
||
|
Dividend yield
|
4.4%
|
4.2%
|
4.8%
|
||
|
Weighted average grant-date fair value
|
$2.93
|
$3.39
|
$3.23
|
||
The Company's activity in the stock option program for
2013
is summarized below:
|
Shares Subject to Option
|
Weighted Average Exercise Price
|
|||||
|
Outstanding at December 31, 2012
|
6,547,498
|
|
$
|
36.18
|
|
|
|
Granted
|
1,509,662
|
|
44.09
|
|
||
|
Exercised
|
(1,196,585
|
)
|
33.38
|
|
||
|
Cancelled
|
(11,421
|
)
|
40.99
|
|
||
|
Outstanding at December 31, 2013
|
6,849,154
|
|
$
|
38.41
|
|
|
|
Exercisable at December 31, 2013
|
4,321,853
|
|
$
|
35.51
|
|
|
The number of stock options vested, and expected to vest in the future, as of
December 31, 2013
was not significantly different from the number of stock options outstanding at
December 31, 2013
as stated above. As of
December 31, 2013
, the weighted average remaining contractual term for the options outstanding and options exercisable was approximately
six
years and
five
years, respectively, and the aggregate intrinsic value for the options outstanding and options exercisable was
$27 million
and
$26 million
, respectively.
As of December 31, 2013, the amount of unrecognized compensation cost related to stock option awards not yet vested was immaterial.
The compensation cost and tax benefits related to the grant and exercise of Southern Company stock options to the Company's employees are recognized in the Company's financial statements with a corresponding credit to equity, representing a capital contribution from Southern Company. The amounts were not material for any year presented.
The total intrinsic value of options exercised during the years ended
December 31, 2013
,
2012
, and
2011
was
$16 million
,
$34 million
, and
$32 million
, respectively. The actual tax benefit realized by the Company for the tax deductions from stock option exercises totaled
$6 million
,
$13 million
, and
$12 million
for the years ended
December 31, 2013
,
2012
, and
2011
, respectively.
Performance Shares
Southern Company provides performance share award units through its Omnibus Incentive Compensation Plan to a large segment of the Company's employees ranging from line management to executives. The performance share units granted under the plan vest at the end of a
three
-year performance period which equates to the requisite service period. Employees that retire prior to the end of the
three
-year period receive a pro rata number of shares, issued at the end of the performance period, based on actual months of service prior to retirement. The value of the award units is based on Southern Company's total shareholder return (TSR) over the
three
-year performance period which measures Southern Company's relative performance against a group of industry peers. The performance shares are delivered in common stock following the end of the performance period based on Southern Company's actual TSR and may range from
0%
to
200%
of the original target performance share amount.
The fair value of performance share awards is determined as of the grant date using a Monte Carlo simulation model to estimate the TSR of Southern Company's stock among the industry peers over the performance period. The Company recognizes compensation expense on a straight-line basis over the
three
-year performance period without remeasurement. Compensation expense for awards where the service condition is met is recognized regardless of the actual number of shares issued. The expected volatility was based on the historical volatility of Southern Company's stock over a period equal to the performance
II-268
NOTES (continued)
Georgia Power Company 2013 Annual Report
period. The risk-free rate was based on the U.S. Treasury yield curve in effect at the time of grant that covers the performance period of the award units.
The following table shows the assumptions used in the pricing model and the weighted average grant-date fair value of performance share award units granted:
|
Year Ended December 31
|
2013
|
2012
|
2011
|
||
|
Expected volatility
|
12.0%
|
16.0%
|
19.2%
|
||
|
Expected term
(in years)
|
3.0
|
3.0
|
3.0
|
||
|
Interest rate
|
0.4%
|
0.4%
|
1.4%
|
||
|
Annualized dividend rate
|
$1.96
|
$1.89
|
$1.82
|
||
|
Weighted average grant-date fair value
|
$40.50
|
$41.99
|
$35.97
|
||
Total unvested performance share units outstanding as of
December 31, 2012
were
280,000
. During
2013
,
161,240
performance share units were granted,
151,769
performance shares were vested, and
16,371
performance share units were forfeited, resulting in
273,100
unvested units outstanding at
December 31, 2013
. In January 2014, the vested performance share award units were converted into
45,239
shares outstanding at a share price of
$41.27
for the
three
-year performance and vesting period ended December 31, 2013.
For the years ended
December 31, 2013
,
2012
, and
2011
, total compensation cost for performance share units recognized in income was
$6 million
,
$6 million
, and
$4 million
, respectively, with the related tax benefit also recognized in income of
$2 million
,
$2 million
and
$1 million
, respectively. As of
December 31, 2013
, there was
$6 million
of total unrecognized compensation cost related to performance share award units that will be recognized over a weighted-average period of approximately
11 months
.
9. NUCLEAR INSURANCE
Under the Price-Anderson Amendments Act (Act), the Company maintains agreements of indemnity with the NRC that, together with private insurance, cover third-party liability arising from any nuclear incident occurring at Plant Hatch and Plant Vogtle Units 1 and 2. The Act provides funds up to
$13.6 billion
for public liability claims that could arise from a single nuclear incident. Each nuclear plant is insured against this liability to a maximum of
$375 million
by American Nuclear Insurers (ANI), with the remaining coverage provided by a mandatory program of deferred premiums that could be assessed, after a nuclear incident, against all owners of commercial nuclear reactors. The Company could be assessed up to
$127 million
per incident for each licensed reactor it operates but not more than an aggregate of
$19 million
per incident to be paid in a calendar year for each reactor. Such maximum assessment, excluding any applicable state premium taxes, for the Company, based on its ownership and buyback interests in all licensed reactors, is
$252 million
, per incident, but not more than an aggregate of
$37 million
to be paid for each incident in any one year. Both the maximum assessment per reactor and the maximum yearly assessment are adjusted for inflation at least every
five years
. The next scheduled adjustment is due no later than September 10, 2018.
See Note 4 to the financial statements herein for additional information on joint ownership agreements.
The Company is a member of Nuclear Electric Insurance Limited (NEIL), a mutual insurer established to provide property damage insurance in an amount up to
$500 million
for members' operating nuclear generating facilities. Additionally, the Company has NEIL policies that currently provide decontamination, excess property insurance, and premature decommissioning coverage up to
$2.25 billion
for nuclear losses in excess of the
$500 million
primary coverage. These policies have a sublimit of
$1.7 billion
for non-nuclear losses.
NEIL also covers the additional costs that would be incurred in obtaining replacement power during a prolonged accidental outage at a member's nuclear plant. Members can purchase this coverage, subject to a deductible waiting period of up to
26 weeks
, with a maximum per occurrence per unit limit of
$490 million
. After the deductible period, weekly indemnity payments would be received until either the unit is operational or until the limit is exhausted in approximately
three years
. The Company purchases limits based on the projected full replacement power, subject to ownership limitations. Each facility has elected a
12-week
deductible waiting period.
A builders' risk property insurance policy has been purchased from NEIL for the construction of Plant Vogtle Units 3 and 4. This policy provides the Owners up to
$2.75 billion
for accidental property damage occurring during construction.
Under each of the NEIL policies, members are subject to assessments each year if losses exceed the accumulated funds available to the insurer. The current maximum annual assessments for the Company under the NEIL policies would be
$65 million
.
II-269
NOTES (continued)
Georgia Power Company 2013 Annual Report
Claims resulting from terrorist acts are covered under both the ANI and NEIL policies (subject to normal policy limits). The aggregate, however, that NEIL will pay for all claims resulting from terrorist acts in any
12
-month period is
$3.2 billion
plus such additional amounts NEIL can recover through reinsurance, indemnity, or other sources.
For all on-site property damage insurance policies for commercial nuclear power plants, the NRC requires that the proceeds of such policies shall be dedicated first for the sole purpose of placing the reactor in a safe and stable condition after an accident. Any remaining proceeds are to be applied next toward the costs of decontamination and debris removal operations ordered by the NRC, and any further remaining proceeds are to be paid either to the Company or to its debt trustees as may be appropriate under the policies and applicable trust indentures. In the event of a loss, the amount of insurance available might not be adequate to cover property damage and other expenses incurred. Uninsured losses and other expenses, to the extent not recovered from customers, would be borne by the Company and could have a material effect on the Company's financial condition and results of operations.
All retrospective assessments, whether generated for liability, property, or replacement power, may be subject to applicable state premium taxes.
10. FAIR VALUE MEASUREMENTS
Fair value measurements are based on inputs of observable and unobservable market data that a market participant would use in pricing the asset or liability. The use of observable inputs is maximized where available and the use of unobservable inputs is minimized for fair value measurement and reflects a three-tier fair value hierarchy that prioritizes inputs to valuation techniques used for fair value measurement.
|
•
|
Level 1 consists of observable market data in an active market for identical assets or liabilities.
|
|
•
|
Level 2 consists of observable market data, other than that included in Level 1, that is either directly or indirectly observable.
|
|
•
|
Level 3 consists of unobservable market data. The input may reflect the assumptions of the Company of what a market participant would use in pricing an asset or liability. If there is little available market data, then the Company's own assumptions are the best available information.
|
In the case of multiple inputs being used in a fair value measurement, the lowest level input that is significant to the fair value measurement represents the level in the fair value hierarchy in which the fair value measurement is reported.
II-270
NOTES (continued)
Georgia Power Company 2013 Annual Report
As of
December 31, 2013
, assets and liabilities measured at fair value on a recurring basis during the period, together with the level of the fair value hierarchy in which they fall, were as follows:
|
Fair Value Measurements Using
|
|||||||||||||||
|
Quoted Prices in Active Markets for Identical Assets
|
Significant Other Observable Inputs
|
Significant Unobservable Inputs
|
|||||||||||||
|
As of December 31, 2013:
|
(Level 1)
|
(Level 2)
|
(Level 3)
|
Total
|
|||||||||||
|
(in millions)
|
|||||||||||||||
|
Assets:
|
|||||||||||||||
|
Energy-related derivatives
|
$
|
—
|
|
$
|
5
|
|
$
|
—
|
|
$
|
5
|
|
|||
|
Nuclear decommissioning trusts:
(a)
|
|||||||||||||||
|
Domestic equity
|
197
|
|
1
|
|
—
|
|
198
|
|
|||||||
|
Foreign equity
|
—
|
|
131
|
|
—
|
|
131
|
|
|||||||
|
U.S. Treasury and government agency securities
|
—
|
|
79
|
|
—
|
|
79
|
|
|||||||
|
Municipal bonds
|
—
|
|
64
|
|
—
|
|
64
|
|
|||||||
|
Corporate bonds
|
—
|
|
140
|
|
—
|
|
140
|
|
|||||||
|
Mortgage and asset backed securities
|
—
|
|
114
|
|
—
|
|
114
|
|
|||||||
|
Other investments
|
—
|
|
24
|
|
—
|
|
24
|
|
|||||||
|
Total
|
$
|
197
|
|
$
|
558
|
|
$
|
—
|
|
$
|
755
|
|
|||
|
Liabilities:
|
|||||||||||||||
|
Energy-related derivatives
|
$
|
—
|
|
$
|
21
|
|
$
|
—
|
|
$
|
21
|
|
|||
|
(a)
|
Includes the investment securities pledged to creditors and collateral received, and excludes receivables related to investment income, pending investment sales, and payables related to pending investment purchases and the lending pool. See Note 1 under "Nuclear Decommissioning" for additional information.
|
II-271
NOTES (continued)
Georgia Power Company 2013 Annual Report
As of
December 31, 2012
, assets and liabilities measured at fair value on a recurring basis during the period, together with the level of the fair value hierarchy in which they fall, were as follows:
|
Fair Value Measurements Using
|
|||||||||||||||
|
Quoted Prices in Active Markets for Identical Assets
|
Significant Other Observable Inputs
|
Significant Unobservable Inputs
|
|||||||||||||
|
As of December 31, 2012:
|
(Level 1)
|
(Level 2)
|
(Level 3)
|
Total
|
|||||||||||
|
(in millions)
|
|||||||||||||||
|
Assets:
|
|||||||||||||||
|
Energy-related derivatives
|
$
|
—
|
|
$
|
11
|
|
$
|
—
|
|
$
|
11
|
|
|||
|
Nuclear decommissioning trusts:
(a)
|
|||||||||||||||
|
Domestic equity
|
162
|
|
1
|
|
—
|
|
163
|
|
|||||||
|
Foreign equity
|
—
|
|
117
|
|
|
—
|
|
117
|
|
||||||
|
U.S. Treasury and government agency securities
|
—
|
|
105
|
|
—
|
|
105
|
|
|||||||
|
Municipal bonds
|
—
|
|
55
|
|
—
|
|
55
|
|
|||||||
|
Corporate bonds
|
—
|
|
133
|
|
—
|
|
133
|
|
|||||||
|
Mortgage and asset backed securities
|
—
|
|
115
|
|
—
|
|
115
|
|
|||||||
|
Other investments
|
—
|
|
10
|
|
—
|
|
10
|
|
|||||||
|
Cash equivalents
|
15
|
|
—
|
|
—
|
|
15
|
|
|||||||
|
Total
|
$
|
177
|
|
$
|
547
|
|
$
|
—
|
|
$
|
724
|
|
|||
|
Liabilities:
|
|||||||||||||||
|
Energy-related derivatives
|
$
|
—
|
|
$
|
45
|
|
$
|
—
|
|
$
|
45
|
|
|||
|
(a)
|
Includes the investment securities pledged to creditors and collateral received, and excludes receivables related to investment income, pending investment sales, and payables related to pending investment purchases and the lending pool. See Note 1 under "Nuclear Decommissioning" for additional information.
|
Valuation Methodologies
The energy-related derivatives primarily consist of over-the-counter financial products for natural gas, including, from time to time, basis swaps. These are standard products used within the energy industry and are valued using the market approach. The inputs used are mainly from observable market sources, such as forward natural gas prices, implied volatility, and Overnight Index Swap interest rates. See Note 11 for additional information on how these derivatives are used.
For fair value measurements of investments within the nuclear decommissioning trusts, specifically the fixed income assets using significant other observable inputs and unobservable inputs, the primary valuation technique used is the market approach. External pricing vendors are designated for each of the asset classes in the nuclear decommissioning trusts with each security discriminately assigned a primary pricing source, based on similar characteristics.
A market price secured from the primary source vendor is then evaluated by management in its valuation of the assets within the trusts. As a general approach, market pricing vendors gather market data (including indices and market research reports) and integrate relative credit information, observed market movements, and sector news into proprietary pricing models, pricing systems, and mathematical tools. Dealer quotes and other market information including live trading levels and pricing analysts' judgment are also obtained when available.
II-272
NOTES (continued)
Georgia Power Company 2013 Annual Report
As of
December 31, 2013
and
2012
, the fair value measurements of investments calculated at net asset value per share (or its equivalent), as well as the nature and risks of those investments, were as follows:
|
Fair Value
|
Unfunded
Commitments
|
Redemption
Frequency
|
Redemption
Notice Period
|
||||||
|
As of December 31, 2013:
|
(in millions)
|
||||||||
|
Nuclear decommissioning trusts:
|
|||||||||
|
Foreign equity fund
|
$
|
131
|
|
None
|
Daily
|
5 days
|
|||
|
Corporate bonds — commingled funds
|
8
|
|
None
|
Daily
|
Not applicable
|
||||
|
Other — commingled funds
|
24
|
|
None
|
Daily
|
Not applicable
|
||||
|
As of December 31, 2012:
|
|||||||||
|
Nuclear decommissioning trusts:
|
|||||||||
|
Foreign equity fund
|
$
|
117
|
|
None
|
Daily
|
5 days
|
|||
|
Corporate bonds — commingled funds
|
9
|
|
None
|
Daily
|
Not applicable
|
||||
|
Other — commingled funds
|
10
|
|
None
|
Daily
|
Not applicable
|
||||
|
Cash equivalents:
|
|
|
|
|
|||||
|
Money market funds
|
15
|
|
None
|
Daily
|
Not applicable
|
||||
The NRC requires licensees of commissioned nuclear power reactors to establish a plan for providing reasonable assurance of funds for future decommissioning. The foreign equity fund in the nuclear decommissioning trusts seeks to provide long-term capital appreciation. In pursuing this investment objective, the foreign equity fund primarily invests in a diversified portfolio of equity securities of foreign companies, including those in emerging markets. These equity securities may include, but are not limited to, common stocks, preferred stocks, real estate investment trusts, convertible securities and depositary receipts, including American depositary receipts, European depositary receipts and global depositary receipts, and rights and warrants to buy common stocks. The Company may withdraw all or a portion of its investment on the last business day of each month subject to a minimum withdrawal of
$1 million
, provided that a minimum investment of
$10 million
remains. If notices of withdrawal exceed
20%
of the aggregate value of the foreign equity fund, then the foreign equity fund's board may refuse to permit the withdrawal of all such investments and may scale down the amounts to be withdrawn pro rata and may further determine that any withdrawal that has been postponed will have priority on the subsequent withdrawal date.
The commingled funds in the nuclear decommissioning trusts are invested primarily in a diversified portfolio including, but not limited to, commercial paper, notes, repurchase agreements, and other evidences of indebtedness with a maturity not exceeding
13 months
from the date of purchase. The commingled funds will, however, generally maintain a dollar-weighted average portfolio maturity of
90
days or less. The assets may be longer term investment grade fixed income obligations with maturity shortening provisions. The primary objective for the commingled funds is a high level of current income consistent with stability of principal and liquidity. The commingled funds included within corporate bonds represent the investment of cash collateral received under the Funds' managers' securities lending program that can only be sold upon the return of the loaned securities. See Note 1 under "Nuclear Decommissioning" for additional information.
The money market funds are short-term investments of excess funds in various money market mutual funds, which are portfolios of short-term debt securities. The money market funds are regulated by the SEC and typically receive the highest rating from credit rating agencies. Regulatory and rating agency requirements for money market funds include minimum credit ratings and maximum maturities for individual securities and a maximum weighted average portfolio maturity. Redemptions are available on a same day basis up to the full amount of the Company's investment in the money market funds.
As of
December 31, 2013
and
2012
, other financial instruments for which the carrying amount did not equal fair value were as follows:
|
Carrying Amount
|
Fair Value
|
||||||
|
|
(in millions)
|
||||||
|
Long-term debt:
|
|||||||
|
2013
|
$
|
8,593
|
|
$
|
8,782
|
|
|
|
2012
|
$
|
9,624
|
|
$
|
10,427
|
|
|
II-273
NOTES (continued)
Georgia Power Company 2013 Annual Report
The fair values are determined using Level 2 measurements and are based on quoted market prices for the same or similar issues or on current rates offered to the Company.
11. DERIVATIVES
The Company is exposed to market risks, primarily commodity price risk and interest rate risk. To manage the volatility attributable to these exposures, the Company nets its exposures, where possible, to take advantage of natural offsets and enters into various derivative transactions for the remaining exposures pursuant to the Company’s policies in areas such as counterparty exposure and risk management practices. The Company’s policy is that derivatives are to be used primarily for hedging purposes and mandates strict adherence to all applicable risk management policies. Derivative positions are monitored using techniques including, but not limited to, market valuation, value at risk, stress testing, and sensitivity analysis. Derivative instruments are recognized at fair value in the balance sheets as either assets or liabilities and are presented on a gross basis. In the statements of cash flows, the cash impacts of settled energy-related and interest rate derivatives are recorded as operating activities.
Energy-Related Derivatives
The Company enters into energy-related derivatives to hedge exposures to electricity, gas, and other fuel price changes. However, due to cost-based rate regulations and other various cost recovery mechanisms, the Company has limited exposure to market volatility in commodity fuel prices and prices of electricity. The Company manages a fuel-hedging program, implemented per the guidelines of the Georgia PSC, through the use of financial derivative contracts, which is expected to continue to mitigate price volatility.
To mitigate residual risks relative to movements in gas prices, the Company may enter into fixed-price contracts for natural gas purchases; however, a significant portion of contracts are priced at market.
Energy-related derivative contracts are accounted for in one of two methods:
|
•
|
Regulatory Hedges
– Energy-related derivative contracts which are designated as regulatory hedges relate primarily to the Company’s fuel-hedging program, where gains and losses are initially recorded as regulatory liabilities and assets, respectively, and then are included in fuel expense as the underlying fuel is used in operations and ultimately recovered through the fuel cost recovery mechanism.
|
|
•
|
Not Designated
– Gains and losses on energy-related derivative contracts that are not designated or fail to qualify as hedges are recognized in the statements of income as incurred.
|
Some energy-related derivative contracts require physical delivery as opposed to financial settlement, and this type of derivative is both common and prevalent within the electric industry. When an energy-related derivative contract is settled physically, any cumulative unrealized gain or loss is reversed and the contract price is recognized in the respective line item representing the actual price of the underlying goods being delivered.
At
December 31, 2013
, the net volume of energy-related derivative contracts for natural gas positions totaled
60 million
mmBtu (million British thermal units), all of which expire by
2017
, which is the longest hedge date.
In addition to the volume discussed above, the Company enters into physical natural gas supply contracts that provide the option to sell back excess gas due to operational constraints. The expected volume of natural gas subject to such a feature is
5 million
mmBtu for the Company.
Interest Rate Derivatives
The Company may also enter into interest rate derivatives to hedge exposure to changes in interest rates. Derivatives related to existing variable rate securities or forecasted transactions are accounted for as cash flow hedges where the effective portion of the derivatives’ fair value gains or losses is recorded in OCI and is reclassified into earnings at the same time the hedged transactions affect earnings. The derivatives employed as hedging instruments are structured to minimize ineffectiveness, which is recorded directly to income.
At
December 31, 2013
, there were no interest rate derivatives outstanding.
The estimated pre-tax losses that will be reclassified from accumulated OCI to interest expense for the 12-month period ending
December 31, 2014
are immaterial. The Company has deferred gains and losses related to interest rate derivative settlements that are expected to be amortized into earnings through
2037
.
II-274
NOTES (continued)
Georgia Power Company 2013 Annual Report
Derivative Financial Statement Presentation and Amounts
At
December 31, 2013
and
2012
, the fair value of energy-related derivatives was reflected in the balance sheets as follows:
|
Asset Derivatives
|
Liability Derivatives
|
||||||||||||||||||
|
Derivative Category
|
Balance Sheet Location
|
2013
|
2012
|
Balance Sheet Location
|
2013
|
2012
|
|||||||||||||
|
(in millions)
|
(in millions)
|
||||||||||||||||||
|
Derivatives designated as hedging instruments for regulatory purposes
|
|||||||||||||||||||
|
Energy-related derivatives:
|
Other current assets
|
$
|
3
|
|
$
|
6
|
|
Liabilities from risk management activities
|
$
|
13
|
|
$
|
30
|
|
|||||
|
|
Other deferred charges and assets
|
2
|
|
5
|
|
Other deferred credits and liabilities
|
8
|
|
15
|
|
|||||||||
|
Total derivatives designated as hedging instruments for regulatory purposes
|
$
|
5
|
|
$
|
11
|
|
$
|
21
|
|
$
|
45
|
|
|||||||
All derivative instruments are measured at fair value. See Note 10 for additional information.
The derivative contracts of the Company are not subject to master netting arrangements or similar agreements and are reported gross on the Company's financial statements. Some of these energy-related contracts contain certain provisions that permit intra-contract netting of derivative receivables and payables for routine billing and offsets related to events of default and settlements. Amounts related to energy-related derivative contracts at
December 31, 2013
and
2012
are presented in the following tables.
|
Fair Value
|
||||||||||||||||||
|
Assets
|
2013
|
|
2012
|
|
Liabilities
|
2013
|
|
2012
|
|
|||||||||
|
(in millions)
|
(in millions)
|
|||||||||||||||||
|
Energy-related derivatives presented in the Balance Sheet
(a)
|
$
|
5
|
|
$
|
11
|
|
Energy-related derivatives presented in the Balance Sheet
(a)
|
$
|
21
|
|
$
|
45
|
|
|||||
|
Gross amounts not offset in the Balance Sheet
(b)
|
(5
|
)
|
(11
|
)
|
Gross amounts not offset in the Balance Sheet
(b)
|
(5
|
)
|
(11
|
)
|
|||||||||
|
Net-energy related derivative assets
|
$
|
—
|
|
$
|
—
|
|
Net-energy related derivative liabilities
|
$
|
16
|
|
$
|
34
|
|
|||||
(a) The Company does not offset fair value amounts for multiple derivative instruments executed with the same counterparty on the balance sheets; therefore, gross and net amounts of derivative assets and liabilities presented on the balance sheets are the same.
(b) Includes gross amounts subject to netting terms that are not offset on the balance sheets and any cash/financial collateral pledged or received.
At
December 31, 2013
and
2012
, the pre-tax effects of unrealized derivative gains (losses) arising from energy-related derivative instruments designated as regulatory hedging instruments and deferred on the balance sheets were as follows:
|
Unrealized Losses
|
Unrealized Gains
|
||||||||||||||||||
|
Derivative Category
|
Balance Sheet Location
|
2013
|
2012
|
Balance Sheet Location
|
2013
|
2012
|
|||||||||||||
|
(in millions)
|
(in millions)
|
||||||||||||||||||
|
Energy-related derivatives:
|
Other regulatory assets, current
|
$
|
(13
|
)
|
$
|
(30
|
)
|
Other regulatory liabilities, current
|
$
|
3
|
|
$
|
6
|
|
|||||
|
Other regulatory assets, deferred
|
(8
|
)
|
(15
|
)
|
Other deferred credits and liabilities
|
2
|
|
5
|
|
||||||||||
|
Total energy-related derivative gains (losses)
|
$
|
(21
|
)
|
$
|
(45
|
)
|
$
|
5
|
|
$
|
11
|
|
|||||||
II-275
NOTES (continued)
Georgia Power Company 2013 Annual Report
For the years ended December 31, 2013, 2012, and 2011, the pre-tax effects of interest rate derivatives designated as cash flow hedging instruments recognized in OCI and those reclassified from accumulated OCI into income were immaterial.
There was no material ineffectiveness recorded in earnings for any period presented. The pre-tax effect of energy-related derivatives not designated as hedging instruments on the statements of income was immaterial for all years presented.
Contingent Features
The Company does not have any credit arrangements that would require material changes in payment schedules or terminations as a result of a credit rating downgrade. There are certain derivatives that could require collateral, but not accelerated payment, in the event of various credit rating changes of certain affiliated companies. At
December 31, 2013
, the fair value of derivative liabilities with contingent features was
$3 million
.
At
December 31, 2013
, the Company had no collateral posted with its derivative counterparties; however, because of the joint and several liability features underlying these derivatives, the maximum potential collateral requirements arising from the credit-risk-related contingent features, at a rating below BBB- and/or Baa3, were
$9 million
. If collateral is required, fair value amounts recognized for the right to reclaim cash collateral or the obligation to return cash collateral are not offset against fair value amounts recognized for derivatives executed with the same counterparty.
Generally, collateral may be provided by a Southern Company guaranty, letter of credit, or cash. The Company participates in certain agreements that could require collateral in the event that one or more Southern Company system power pool participants has a credit rating change to below investment grade.
The Company is exposed to losses related to financial instruments in the event of counterparties' nonperformance. The Company only enters into agreements and material transactions with counterparties that have investment grade credit ratings by Moody's Investors Services, Inc. and Standard and Poor's Ratings Services, a division of The McGraw Hill Companies, Inc. or with counterparties who have posted collateral to cover potential credit exposure. The Company has also established risk management policies and controls to determine and monitor the creditworthiness of counterparties in order to mitigate the Company's exposure to counterparty credit risk. Therefore, the Company does not anticipate a material adverse effect on the financial statements as a result of counterparty nonperformance.
II-276
NOTES (continued)
Georgia Power Company 2013 Annual Report
12. QUARTERLY FINANCIAL INFORMATION (UNAUDITED)
Summarized quarterly financial information for
2013
and
2012
is as follows:
|
Quarter Ended
|
Operating Revenues
|
Operating Income
|
Net Income After Dividends on Preferred and Preference Stock
|
||||||||
|
(in millions)
|
|||||||||||
|
March 2013
|
$
|
1,882
|
|
$
|
412
|
|
$
|
197
|
|
||
|
June 2013
|
2,042
|
|
552
|
|
282
|
|
|||||
|
September 2013
|
2,484
|
|
872
|
|
487
|
|
|||||
|
December 2013
|
1,866
|
|
404
|
|
208
|
|
|||||
|
|
|||||||||||
|
March 2012
|
$
|
1,745
|
|
$
|
344
|
|
$
|
167
|
|
||
|
June 2012
|
2,020
|
|
535
|
|
295
|
|
|||||
|
September 2012
|
2,498
|
|
924
|
|
525
|
|
|||||
|
December 2012
|
1,735
|
|
400
|
|
181
|
|
|||||
The Company's business is influenced by seasonal weather conditions.
II-277
SELECTED FINANCIAL AND OPERATING DATA
2009
-
2013
Georgia Power Company
2013
Annual Report
|
2013
|
|
2012
|
|
2011
|
|
2010
|
|
2009
|
|
||||||||||
|
Operating Revenues (
in millions
)
|
$
|
8,274
|
|
$
|
7,998
|
|
$
|
8,800
|
|
$
|
8,349
|
|
$
|
7,692
|
|
||||
|
Net Income After Dividends
on Preferred and Preference Stock (
in millions
)
|
$
|
1,174
|
|
$
|
1,168
|
|
$
|
1,145
|
|
$
|
950
|
|
$
|
814
|
|
||||
|
Cash Dividends on Common Stock (
in millions
)
|
$
|
907
|
|
$
|
983
|
|
$
|
1,096
|
|
$
|
820
|
|
$
|
739
|
|
||||
|
Return on Average Common Equity (
percent
)
|
12.45
|
|
12.76
|
|
12.89
|
|
11.42
|
|
11.01
|
|
|||||||||
|
Total Assets (
in millions
)
|
$
|
28,907
|
|
$
|
28,803
|
|
$
|
27,151
|
|
$
|
25,914
|
|
$
|
24,295
|
|
||||
|
Gross Property Additions (
in millions
)
|
$
|
1,906
|
|
$
|
1,838
|
|
$
|
1,981
|
|
$
|
2,401
|
|
$
|
2,646
|
|
||||
|
Capitalization (
in millions
):
|
|||||||||||||||||||
|
Common stock equity
|
$
|
9,591
|
|
$
|
9,273
|
|
$
|
9,023
|
|
$
|
8,741
|
|
$
|
7,903
|
|
||||
|
Preferred and preference stock
|
266
|
|
266
|
|
266
|
|
266
|
|
266
|
|
|||||||||
|
Long-term debt
|
8,633
|
|
7,994
|
|
8,018
|
|
7,931
|
|
7,782
|
|
|||||||||
|
Total (
excluding amounts due within one year
)
|
$
|
18,490
|
|
$
|
17,533
|
|
$
|
17,307
|
|
$
|
16,938
|
|
$
|
15,951
|
|
||||
|
Capitalization Ratios (
percent
):
|
|||||||||||||||||||
|
Common stock equity
|
51.9
|
|
52.9
|
|
52.1
|
|
51.6
|
|
49.5
|
|
|||||||||
|
Preferred and preference stock
|
1.4
|
|
1.5
|
|
1.5
|
|
1.6
|
|
1.7
|
|
|||||||||
|
Long-term debt
|
46.7
|
|
45.6
|
|
46.4
|
|
46.8
|
|
48.8
|
|
|||||||||
|
Total (
excluding amounts due within one year
)
|
100.0
|
|
100.0
|
|
100.0
|
|
100.0
|
|
100.0
|
|
|||||||||
|
Customers (
year-end
):
|
|||||||||||||||||||
|
Residential
|
2,080,358
|
|
2,062,040
|
|
2,047,390
|
|
2,049,770
|
|
2,043,661
|
|
|||||||||
|
Commercial
|
299,340
|
|
297,294
|
|
296,143
|
|
296,140
|
|
295,375
|
|
|||||||||
|
Industrial
|
8,216
|
|
8,246
|
|
8,279
|
|
8,136
|
|
8,202
|
|
|||||||||
|
Other
|
8,623
|
|
7,724
|
|
7,521
|
|
7,309
|
|
6,580
|
|
|||||||||
|
Total
|
2,396,537
|
|
2,375,304
|
|
2,359,333
|
|
2,361,355
|
|
2,353,818
|
|
|||||||||
|
Employees (
year-end
)
|
7,886
|
|
8,094
|
|
8,310
|
|
8,330
|
|
8,599
|
|
|||||||||
II-278
SELECTED FINANCIAL AND OPERATING DATA
2009
-
2013
(continued)
Georgia Power Company
2013
Annual Report
|
2013
|
|
2012
|
|
2011
|
|
2010
|
|
2009
|
|
||||||||||
|
Operating Revenues (
in millions
):
|
|||||||||||||||||||
|
Residential
|
$
|
3,058
|
|
$
|
2,986
|
|
$
|
3,241
|
|
$
|
3,072
|
|
$
|
2,686
|
|
||||
|
Commercial
|
3,077
|
|
2,965
|
|
3,217
|
|
3,011
|
|
2,826
|
|
|||||||||
|
Industrial
|
1,391
|
|
1,322
|
|
1,547
|
|
1,441
|
|
1,318
|
|
|||||||||
|
Other
|
94
|
|
89
|
|
94
|
|
84
|
|
82
|
|
|||||||||
|
Total retail
|
7,620
|
|
7,362
|
|
8,099
|
|
7,608
|
|
6,912
|
|
|||||||||
|
Wholesale — non-affiliates
|
281
|
|
281
|
|
341
|
|
380
|
|
395
|
|
|||||||||
|
Wholesale — affiliates
|
20
|
|
20
|
|
32
|
|
53
|
|
112
|
|
|||||||||
|
Total revenues from sales of electricity
|
7,921
|
|
7,663
|
|
8,472
|
|
8,041
|
|
7,419
|
|
|||||||||
|
Other revenues
|
353
|
|
335
|
|
328
|
|
308
|
|
273
|
|
|||||||||
|
Total
|
$
|
8,274
|
|
$
|
7,998
|
|
$
|
8,800
|
|
$
|
8,349
|
|
$
|
7,692
|
|
||||
|
Kilowatt-Hour Sales (
in millions
):
|
|||||||||||||||||||
|
Residential
|
25,479
|
|
25,742
|
|
27,223
|
|
29,433
|
|
26,272
|
|
|||||||||
|
Commercial
|
31,984
|
|
32,270
|
|
32,900
|
|
33,855
|
|
32,593
|
|
|||||||||
|
Industrial
|
23,087
|
|
23,089
|
|
23,519
|
|
23,209
|
|
21,810
|
|
|||||||||
|
Other
|
630
|
|
641
|
|
657
|
|
663
|
|
671
|
|
|||||||||
|
Total retail
|
81,180
|
|
81,742
|
|
84,299
|
|
87,160
|
|
81,346
|
|
|||||||||
|
Wholesale — non-affiliates
|
3,029
|
|
2,934
|
|
3,904
|
|
4,662
|
|
5,208
|
|
|||||||||
|
Wholesale — affiliates
|
496
|
|
600
|
|
626
|
|
1,000
|
|
2,504
|
|
|||||||||
|
Total
|
84,705
|
|
85,276
|
|
88,829
|
|
92,822
|
|
89,058
|
|
|||||||||
|
Average Revenue Per Kilowatt-Hour (
cents
):
|
|||||||||||||||||||
|
Residential
|
12.00
|
|
11.60
|
|
11.91
|
|
10.44
|
|
10.22
|
|
|||||||||
|
Commercial
|
9.62
|
|
9.19
|
|
9.78
|
|
8.89
|
|
8.67
|
|
|||||||||
|
Industrial
|
6.03
|
|
5.73
|
|
6.58
|
|
6.21
|
|
6.04
|
|
|||||||||
|
Total retail
|
9.39
|
|
9.01
|
|
9.61
|
|
8.73
|
|
8.50
|
|
|||||||||
|
Wholesale
|
8.54
|
|
8.52
|
|
8.23
|
|
7.65
|
|
6.57
|
|
|||||||||
|
Total sales
|
9.35
|
|
8.99
|
|
9.54
|
|
8.66
|
|
8.33
|
|
|||||||||
|
Residential Average Annual
Kilowatt-Hour Use Per Customer
|
12,293
|
|
12,509
|
|
13,288
|
|
14,367
|
|
12,848
|
|
|||||||||
|
Residential Average Annual
Revenue Per Customer
|
$
|
1,475
|
|
$
|
1,451
|
|
$
|
1,582
|
|
$
|
1,499
|
|
$
|
1,314
|
|
||||
|
Plant Nameplate Capacity
Ratings (
year-end
) (
megawatts
)
|
17,586
|
|
17,984
|
|
16,588
|
|
15,992
|
|
15,995
|
|
|||||||||
|
Maximum Peak-Hour Demand (
megawatts
):
|
|||||||||||||||||||
|
Winter
|
12,767
|
|
14,104
|
|
14,800
|
|
15,614
|
|
15,173
|
|
|||||||||
|
Summer
|
15,228
|
|
16,440
|
|
16,941
|
|
17,152
|
|
16,080
|
|
|||||||||
|
Annual Load Factor (
percent
)
|
63.5
|
|
59.1
|
|
59.5
|
|
60.9
|
|
60.7
|
|
|||||||||
|
Plant Availability (
percent
)*:
|
|||||||||||||||||||
|
Fossil-steam
|
87.1
|
|
90.3
|
|
88.6
|
|
88.6
|
|
92.5
|
|
|||||||||
|
Nuclear
|
91.8
|
|
94.1
|
|
92.2
|
|
94.0
|
|
88.4
|
|
|||||||||
|
Source of Energy Supply (
percent
):
|
|||||||||||||||||||
|
Coal
|
26.4
|
|
26.6
|
|
44.4
|
|
51.8
|
|
52.3
|
|
|||||||||
|
Nuclear
|
17.7
|
|
18.3
|
|
16.6
|
|
16.4
|
|
16.2
|
|
|||||||||
|
Hydro
|
2.0
|
|
0.7
|
|
1.1
|
|
1.4
|
|
1.8
|
|
|||||||||
|
Oil and gas
|
29.6
|
|
22.0
|
|
8.9
|
|
8.0
|
|
7.7
|
|
|||||||||
|
Purchased power -
|
|||||||||||||||||||
|
From non-affiliates
|
3.3
|
|
6.8
|
|
6.1
|
|
5.2
|
|
4.4
|
|
|||||||||
|
From affiliates
|
21.0
|
|
25.6
|
|
22.9
|
|
17.2
|
|
17.6
|
|
|||||||||
|
Total
|
100.0
|
|
100.0
|
|
100.0
|
|
100.0
|
|
100.0
|
|
|||||||||
|
*
|
Beginning in 2012, plant availability is calculated as a weighted equivalent availability.
|
II-279
GULF POWER COMPANY
FINANCIAL SECTION
II-280
MANAGEMENT'S REPORT ON INTERNAL CONTROL OVER FINANCIAL REPORTING
Gulf Power Company
2013
Annual Report
The management of Gulf Power Company (the Company) is responsible for establishing and maintaining an adequate system of internal control over financial reporting as required by the Sarbanes-Oxley Act of 2002 and as defined in Exchange Act Rule 13a-15(f). A control system can provide only reasonable, not absolute, assurance that the objectives of the control system are met.
Under management's supervision, an evaluation of the design and effectiveness of the Company's internal control over financial reporting was conducted based on the framework in
Internal Control—Integrated Framework (1992)
issued by the Committee of Sponsoring Organizations of the Treadway Commission. Based on this evaluation, management concluded that the Company's internal control over financial reporting was effective as of
December 31, 2013
.
/s/ S. W. Connally, Jr.
S. W. Connally, Jr.
President and Chief Executive Officer
/s/ Richard S. Teel
Richard S. Teel
Vice President and Chief Financial Officer
February 27, 2014
II-281
REPORT OF INDEPENDENT REGISTERED PUBLIC ACCOUNTING FIRM
To the Board of Directors of
Gulf Power Company
We have audited the accompanying balance sheets and statements of capitalization of Gulf Power Company (the Company) (a wholly owned subsidiary of The Southern Company) as of
December 31, 2013
and
2012
, and the related statements of income, comprehensive income, common stockholder's equity, and cash flows for each of the three years in the period ended
December 31, 2013
. These financial statements are the responsibility of the Company's management. Our responsibility is to express an opinion on these financial statements based on our audits.
We conducted our audits in accordance with the standards of the Public Company Accounting Oversight Board (United States). Those standards require that we plan and perform the audit to obtain reasonable assurance about whether the financial statements are free of material misstatement. The Company is not required to have, nor were we engaged to perform, an audit of its internal control over financial reporting. Our audits included consideration of internal control over financial reporting as a basis for designing audit procedures that are appropriate in the circumstances, but not for the purpose of expressing an opinion on the effectiveness of the Company's internal control over financial reporting. Accordingly, we express no such opinion. An audit also includes examining, on a test basis, evidence supporting the amounts and disclosures in the financial statements, assessing the accounting principles used and significant estimates made by management, as well as evaluating the overall financial statement presentation. We believe that our audits provide a reasonable basis for our opinion.
In our opinion, such financial statement
s (pages II-305 to II-345) pre
sent fairly, in all material respects, the financial position of Gulf Power Company as of
December 31, 2013
and
2012
, and the results of its operations and its cash flows for each of the three years in the period ended
December 31, 2013
, in conformity with accounting principles generally accepted in the United States of America.
/s/ Deloitte & Touche LLP
Atlanta, Georgia
February 27, 2014
II-282
MANAGEMENT'S DISCUSSION AND ANALYSIS OF FINANCIAL CONDITION AND RESULTS OF OPERATIONS
Gulf Power Company 2013 Annual Report
OVERVIEW
Business Activities
Gulf Power Company (the Company) operates as a vertically integrated utility providing electricity to retail customers within its traditional service area located in northwest Florida and to wholesale customers in the Southeast.
Many factors affect the opportunities, challenges, and risks of the Company's business of selling electricity. These factors include the ability to maintain a constructive regulatory environment, to maintain and grow energy sales given economic conditions, and to effectively manage and secure timely recovery of costs. These costs include those related to projected long-term demand growth, increasingly stringent environmental standards, reliability, restoration following major storms, and fuel. Appropriately balancing required costs and capital expenditures with customer prices will continue to challenge the Company for the foreseeable future.
On December 3, 2013, the Florida Public Service Commission (PSC) voted to approve the settlement agreement (Settlement Agreement) among the Company and all of the intervenors to the docketed proceeding with respect to the Company's request to increase retail base rates. Under the terms of the Settlement Agreement, the Company (1) increased base rates designed to produce an additional $35 million in annual revenues effective January 2014 and will increase base rates designed to produce an additional $20 million in annual revenues effective January 2015; (2) continued its current authorized retail return on equity (ROE) midpoint and range; and (3) will accrue a return similar to allowance for funds used during construction (AFUDC) on certain transmission system upgrades that go into service after January 2014 until the next retail rate case or January 1, 2017, whichever comes first. See FUTURE EARNINGS POTENTIAL – "PSC Matters – Retail Base Rate Case" herein for additional details of the Settlement Agreement.
Key Performance Indicators
The Company continues to focus on several key performance indicators. These indicators include customer satisfaction, plant availability, system reliability, and net income after dividends on preference stock. The Company's financial success is directly tied to customer satisfaction. Key elements of ensuring customer satisfaction include outstanding service, high reliability, and competitive prices. Management uses customer satisfaction surveys and reliability indicators to evaluate the Company's results.
Peak season equivalent forced outage rate (Peak Season EFOR) is an indicator of plant availability and efficient generation fleet operations during the months when generation needs are greatest. The rate is calculated by dividing the number of hours of forced outages by total generation hours. The 2013 Peak Season EFOR was better than the target. Transmission and distribution system reliability performance is measured by the frequency and duration of outages. Performance targets for reliability are set internally based on historical performance. The performance for 2013 was better than the target for these reliability measures.
Net income after dividends on preference stock is the primary measure of the Company's financial performance. The Company's 2013 results compared with its targets for some of these key indicators are reflected in the following chart:
|
Key Performance Indicator
|
2013 Target
Performance
|
2013 Actual
Performance
|
|
|
Customer Satisfaction
|
Top quartile in
customer surveys
|
Top quartile
|
|
|
Peak Season EFOR
|
5.86% or less
|
1.87%
|
|
|
Net Income After Dividends on Preference Stock
|
$124.9 million
|
$124.4 million
|
|
See RESULTS OF OPERATIONS herein for additional information on the Company's financial performance.
Earnings
The Company's 2013 net income after dividends on preference stock was $124.4 million, a decrease of $1.5 million from the previous year. The decrease in net income after dividends on preference stock in 2013 was primarily due to an increase in depreciation and dividends on preference stock, partially offset by decreases in other operations and maintenance expenses and interest expense.
In 2012, net income after dividends on preference stock was $125.9 million, an increase of $20.9 million from the previous year. The increase in net income after dividends on preference stock in 2012 was primarily due to higher revenues due to increases in retail base rates and higher wholesale capacity revenues from non-affiliates in 2012. These increases were partially offset by
II-283
MANAGEMENT'S DISCUSSION AND ANALYSIS (continued)
Gulf Power Company 2013 Annual Report
milder weather in 2012, a decrease in retail energy sales in 2012 due to a decrease in customer usage, and a decrease in AFUDC equity, which is non-taxable.
RESULTS OF OPERATIONS
A condensed statement of income follows:
|
Amount
|
Increase (Decrease)
from Prior Year
|
||||||||||
|
2013
|
2013
|
2012
|
|||||||||
|
(in millions)
|
|||||||||||
|
Operating revenues
|
$
|
1,440.3
|
|
$
|
0.6
|
|
$
|
(80.1
|
)
|
||
|
Fuel
|
532.8
|
|
(12.1
|
)
|
(117.4
|
)
|
|||||
|
Purchased power
|
85.3
|
|
11.2
|
|
(16.4
|
)
|
|||||
|
Other operations and maintenance
|
309.9
|
|
(4.3
|
)
|
2.8
|
|
|||||
|
Depreciation and amortization
|
149.0
|
|
8.0
|
|
11.4
|
|
|||||
|
Taxes other than income taxes
|
98.3
|
|
1.0
|
|
(3.9
|
)
|
|||||
|
Total operating expenses
|
1,175.3
|
|
3.8
|
|
(123.5
|
)
|
|||||
|
Operating income
|
265.0
|
|
(3.2
|
)
|
43.4
|
|
|||||
|
Total other income and (expense)
|
(53.2
|
)
|
3.7
|
|
(4.6
|
)
|
|||||
|
Income taxes
|
79.7
|
|
0.5
|
|
17.9
|
|
|||||
|
Net income
|
132.1
|
|
—
|
|
20.9
|
|
|||||
|
Dividends on preference stock
|
7.7
|
|
1.5
|
|
—
|
|
|||||
|
Net income after dividends on preference stock
|
$
|
124.4
|
|
$
|
(1.5
|
)
|
$
|
20.9
|
|
||
Operating Revenues
Operating revenues for 2013 were $1.44 billion, reflecting an increase of $0.6 million from 2012. The following table summarizes the significant changes in operating revenues for the past two years:
|
Amount
|
|||||||
|
2013
|
2012
|
||||||
|
(in millions)
|
|||||||
|
Retail — prior year
|
$
|
1,144.5
|
|
$
|
1,208.5
|
|
|
|
Estimated change resulting from –
|
|||||||
|
Rates and pricing
|
0.1
|
|
62.7
|
|
|||
|
Sales growth (decline)
|
(1.4
|
)
|
(5.5
|
)
|
|||
|
Weather
|
(0.3
|
)
|
(10.7
|
)
|
|||
|
Fuel and other cost recovery
|
27.1
|
|
(110.5
|
)
|
|||
|
Retail — current year
|
1,170.0
|
|
1,144.5
|
|
|||
|
Wholesale revenues –
|
|||||||
|
Non-affiliates
|
109.4
|
|
106.9
|
|
|||
|
Affiliates
|
99.6
|
|
123.6
|
|
|||
|
Total wholesale revenues
|
209.0
|
|
230.5
|
|
|||
|
Other operating revenues
|
61.3
|
|
64.7
|
|
|||
|
Total operating revenues
|
$
|
1,440.3
|
|
$
|
1,439.7
|
|
|
|
Percent change
|
—
|
%
|
(5.3
|
)%
|
|||
Retail revenues increased $25.5 million, or 2.2%, in 2013 compared to 2012 primarily as a result of higher fuel revenues and energy conservation cost recovery revenues. The increase in fuel revenues was partially offset by a payment received during 2013 pursuant to the resolution of a coal contract dispute. Retail revenues decreased $64.0 million, or 5.3%, in 2012 compared to 2011 primarily as a result of lower fuel revenues due to lower natural gas prices and lower energy sales due to milder weather in 2012
II-284
MANAGEMENT'S DISCUSSION AND ANALYSIS (continued)
Gulf Power Company 2013 Annual Report
compared to 2011, partially offset by higher revenues resulting from increases in retail base rates. See "Energy Sales" below for a discussion of changes in the volume of energy sold, including changes related to sales growth (or decline) and weather.
Revenues associated with changes in rates and pricing were relatively flat in 2013 resulting from higher revenues due to increases in retail base rates, partially offset by lower rates under the Company's energy conservation cost recovery clause and the environmental cost recovery clause. In 2012, revenues associated with changes in rates and pricing included higher revenues due to increases in retail base rates and revenues associated with higher recoverable costs under the Company's energy conservation cost recovery clause, partially offset by a decrease in revenues associated with lower recoverable costs under the Company's environmental cost recovery clause. Annually, the Company petitions the Florida PSC for recovery of projected costs, including any true-up amount from prior periods, and approved rates are implemented each January. The recovery provisions include related expenses and a return on average net investment.
Fuel and other cost recovery provisions include fuel expenses, the energy component of purchased power costs, purchased power capacity costs, and the difference between projected and actual costs and revenues related to energy conservation and environmental compliance. Annually, the Company petitions the Florida PSC for recovery of projected fuel and purchased power costs, including any true-up amount from prior periods, and approved rates are implemented each January. The recovery provisions generally equal the related expenses and have no material effect on earnings.
See Note 1 to the financial statements under "Revenues" and Note 3 to the financial statements under "Retail Regulatory Matters" for additional information regarding the Company's retail base rate case and cost recovery clauses, including the Company's fuel cost recovery, purchased power capacity recovery, environmental cost recovery, and energy conservation cost recovery clauses.
Wholesale revenues from power sales to non-affiliated utilities were as follows:
|
2013
|
2012
|
2011
|
|||||||||
|
(in thousands)
|
|||||||||||
|
Capacity and other
|
$
|
63,947
|
|
$
|
68,174
|
|
$
|
63,224
|
|
||
|
Energy
|
45,439
|
|
38,707
|
|
70,331
|
|
|||||
|
Total non-affiliated
|
$
|
109,386
|
|
$
|
106,881
|
|
$
|
133,555
|
|
||
Wholesale revenues from sales to non-affiliates consist of long-term sales agreements to other utilities in Florida and Georgia and short-term opportunity sales. Capacity revenues from long-term sales agreements represent the greatest contribution to net income. The energy is generally sold at variable cost. Short-term opportunity sales are made at market-based rates that generally provide a margin above the Company's variable cost of energy. Wholesale energy revenues from sales to non-affiliates will vary depending on fuel prices, the market prices of wholesale energy compared to the cost of the Company and the Southern Company system's generation, demand for energy within the Southern Company system's service territory, and the availability of the Southern Company system's generation. See FUTURE EARNINGS POTENTIAL – "General" for additional information.
Wholesale revenues from sales to non-affiliates increased $2.5 million, or 2.3%, in 2013 primarily due to an 18.9% increase in kilowatt-hour (KWH) sales as a result of more energy scheduled by wholesale customers to serve their loads. This increase was partially offset by a 6.2% decrease in capacity revenues related to change-in-law provisions that provide for adjustments to reflect changes in environmental costs related to the generating resource. Wholesale revenues from sales to non-affiliates decreased $26.7 million, or 20.0%, in 2012 primarily due to a 51.5% decrease in KWH sales as a result of less energy scheduled by customers due to their use of lower cost generation resources to serve their loads. This decrease was partially offset by a 7.8% increase in capacity revenues primarily related to higher capacity rates related to change-in-law provisions that provide for adjustments to reflect changes in environmental costs related to the generating resource.
Wholesale revenues from sales to affiliated companies will vary depending on demand and the availability and cost of generating resources at each company. These affiliate sales are made in accordance with the Intercompany Interchange Contract (IIC), as approved by the Federal Energy Regulatory Commission (FERC). These transactions do not have a significant impact on earnings since the revenue related to these energy sales generally offsets the cost of energy sold. In 2013, wholesale revenues from sales to affiliates decreased $24.1 million from the prior period primarily due to lower energy revenues related to a 28.4% decrease in KWH sales that resulted from less Company generation being dispatched to serve affiliated companies' demand. This decrease was partially offset by a 12.7% increase in the price of energy sold to affiliates in 2013. In 2012, wholesale revenues from sales to affiliates increased $12.3 million from the prior period primarily due to higher energy revenues related to a 67.6% increase in KWH sales resulting from the availability of the Company's lower priced generation resources to serve affiliate demand. This increase was partially offset by a 33.8% decrease in the price of energy in 2012.
II-285
MANAGEMENT'S DISCUSSION AND ANALYSIS (continued)
Gulf Power Company 2013 Annual Report
Other operating revenues decreased $3.4 million, or 5.3%, in 2013 primarily due to a $5.4 million decrease in revenues from other energy services, partially offset by a $1.9 million increase in transmission revenues. Other operating revenues decreased $1.7 million, or 2.5%, in 2012 primarily due to a $3.0 million decrease in franchise fees, partially offset by a $2.0 million increase in revenues from other energy services. Revenues from other energy services did not have a material effect on net income since they were generally offset by associated expenses. Franchise fees have no impact on net income.
Energy Sales
Changes in revenues are influenced heavily by the change in the volume of energy sold from year to year. KWH sales for 2013 and the percent change by year were as follows:
|
Total
KWHs
|
Total KWH
Percent Change
|
Weather-Adjusted
Percent Change
|
||||||||||||
|
2013
|
2013
|
2012
|
2013
|
2012
|
||||||||||
|
(in millions)
|
|
|
|
|
|
|||||||||
|
Residential
|
5,089
|
|
0.7
|
%
|
(4.7
|
)%
|
0.5
|
%
|
(0.2
|
)%
|
||||
|
Commercial
|
3,810
|
|
(1.3
|
)
|
(1.4
|
)
|
(0.4
|
)
|
(0.5
|
)
|
||||
|
Industrial
|
1,700
|
|
(1.4
|
)
|
(4.1
|
)
|
(1.4
|
)
|
(4.1
|
)
|
||||
|
Other
|
21
|
|
(17.1
|
)
|
(0.6
|
)
|
(17.1
|
)
|
(0.6
|
)
|
||||
|
Total retail
|
10,620
|
|
(0.4
|
)
|
(3.4
|
)
|
(0.2
|
)%
|
(0.9
|
)%
|
||||
|
Wholesale
|
||||||||||||||
|
Non-affiliates
|
1,162
|
|
18.9
|
|
(51.5
|
)
|
||||||||
|
Affiliates
|
3,127
|
|
(28.4
|
)
|
67.6
|
|
||||||||
|
Total wholesale
|
4,289
|
|
(19.8
|
)
|
15.7
|
|
||||||||
|
Total energy sales
|
14,909
|
|
(6.9
|
)%
|
2.2
|
%
|
||||||||
Changes in retail energy sales are comprised of changes in electricity usage by customers, changes in weather, and changes in the number of customers.
Residential KWH sales increased in 2013 compared to 2012 primarily due to customer growth. Residential KWH sales decreased in 2012 compared to 2011 primarily due to milder weather in 2012 compared to 2011. Weather-adjusted 2012 KWH sales to residential customers remained relatively flat as compared to 2011.
Commercial KWH sales decreased in 2013 compared to 2012 primarily due to milder weather in 2013 compared to 2012 and a decline in weather-adjusted use per customer, partially offset by customer growth. Commercial KWH sales decreased in 2012 compared to 2011 primarily due to milder weather in 2012 compared to 2011. Weather-adjusted 2012 KWH sales to commercial customers remained relatively flat as compared to 2011.
Industrial KWH sales decreased 1.4% in 2013 compared to 2012 primarily due to changes in customers' operations. Industrial KWH sales decreased 4.1% in 2012 compared to 2011 primarily due to increased customer co-generation due to the lower cost of natural gas and changes in customer production levels.
See "Operating Revenues" above for a discussion of significant changes in wholesale sales to non-affiliates and affiliated companies.
Fuel and Purchased Power Expenses
Fuel costs constitute the single largest expense for the Company. The mix of fuel sources for generation of electricity is determined primarily by demand, the unit cost of fuel, and the availability of generating units. Additionally, the Company purchases a portion of its electricity needs from the wholesale market.
II-286
MANAGEMENT'S DISCUSSION AND ANALYSIS (continued)
Gulf Power Company 2013 Annual Report
Details of the Company's generation and purchased power were as follows:
|
2013
|
2012
|
2011
|
||||||
|
Total generation
(millions of KWHs)
|
9,216
|
|
9,648
|
|
12,035
|
|
||
|
Total purchased power
(millions of KWHs)
|
6,298
|
|
6,952
|
|
4,349
|
|
||
|
Sources of generation
(percent)
–
|
||||||||
|
Coal
|
61
|
|
60
|
|
67
|
|
||
|
Gas
|
39
|
|
40
|
|
33
|
|
||
|
Cost of fuel, generated
(cents per net KWH)
–
|
||||||||
|
Coal
(a)
|
4.12
|
|
4.42
|
|
4.97
|
|
||
|
Gas
|
3.95
|
|
3.96
|
|
4.06
|
|
||
|
Average cost of fuel, generated
(cents per net KWH)
(a)
|
4.05
|
|
4.23
|
|
4.67
|
|
||
|
Average cost of purchased power
(cents per net KWH)
(b)
|
3.88
|
|
3.03
|
|
4.39
|
|
||
|
(a)
|
Includes the effect of a payment received in 2013 pursuant to the resolution of a coal contract dispute.
|
|
(b)
|
Average cost of purchased power includes fuel purchased by the Company for tolling agreements where power is generated by the provider.
|
Total fuel and purchased power expenses were $618.1 million in 2013, a decrease of $0.9 million, or 0.2%, from the prior year costs. The decrease in fuel and purchased power expenses was due to a $37.3 million decrease in the volume of KWHs generated and purchased, partially offset by a $36.4 million increase in the average cost of fuel and purchased power which includes the effect of a payment received during 2013 pursuant to the resolution of a coal contract dispute. Excluding the payment, the average cost of fuel and purchased power increased $57.0 million.
Total fuel and purchased power expenses were $619.0 million in 2012, a decrease of $133.8 million, or 17.8%, from the prior year costs. The decrease in fuel and purchased power expenses was due to a $129.9 million decrease in the average cost of fuel and purchased power and a $118.2 million decrease in the volume of KWHs generated. The decrease was partially offset by a $114.3 million increase in the volume of KWHs purchased.
Fuel and purchased power transactions do not have a significant impact on earnings since energy and capacity expenses are generally offset by energy and capacity revenues through the Company's fuel cost and purchased power capacity recovery clauses. See FUTURE EARNINGS POTENTIAL – "PSC Matters – Cost Recovery Clauses – Fuel Cost Recovery" and " – Purchased Power Capacity Recovery" herein for additional information.
Fuel
Fuel expense was $532.8 million in 2013, a decrease of $12.1 million, or 2.2%, from the prior year costs. The decrease was primarily due to a 4.3% decrease in the average cost of fuel which includes the effect of a payment received during 2013 pursuant to the resolution of a coal contract dispute. Excluding the payment, the average cost of fuel increased 1.2%. Fuel expense was $544.9 million in 2012, a decrease of $117.4 million, or 17.7%, from the prior year costs. The decrease was primarily due to a higher utilization of lower cost natural gas-fired sources, a 2.5% decrease in the average cost of natural gas per KWH generated, and a 19.8% decrease in KWHs generated as a result of displacement of coal-fired generation by energy purchases and lower demand related to milder weather. These decreases were partially offset by a 59.8% increase in KWHs purchased.
Purchased Power
–
Non-Affiliates
Purchased power expense from non-affiliates was $52.4 million in 2013, an increase of $1.0 million, or 2.0%, from the prior year primarily due to an increase in energy costs. The increase in energy costs was due to a 31.5% increase in the average cost per KWH purchased, partially offset by a 13.8% decrease in the volume of KWHs purchased. In 2012, purchased power expense from non-affiliates was $51.4 million, an increase of $2.5 million, or 5.2%, from the prior year. The increase was due to a $2.7 million increase in energy costs, partially offset by a $0.2 million decrease in capacity costs. The increase in energy costs was due to an increase in the volume of KWHs purchased, partially offset by a lower average cost per KWH.
Energy purchases from non-affiliates will vary depending on the market prices of wholesale energy as compared to the cost of the Southern Company system's generation, demand for energy within the Southern Company system's service territory, and the availability of the Southern Company system's generation.
II-287
MANAGEMENT'S DISCUSSION AND ANALYSIS (continued)
Gulf Power Company 2013 Annual Report
Purchased Power – Affiliates
Purchased power expense from affiliates was $32.9 million in 2013, an increase of $10.2 million, or 44.9%, from the prior year primarily due to an increase in energy costs. The increase in energy costs was primarily due to a 93.4% increase in the volume of KWHs purchased, partially offset by a 30.2% decrease in the average cost per KWH purchased. In 2012, purchased power expense from affiliates was $22.7 million, a decrease of $18.9 million, or 45.5%, from the prior year. The decrease was due to a $19.1 million decrease in energy costs, partially offset by a $0.2 million increase in capacity costs. The decrease in energy costs was due to a decrease in the volume of KWHs purchased and a lower cost per KWH purchased.
Energy purchases from affiliates will vary depending on demand and the availability and cost of generating resources at each company within the Southern Company system. These purchases are made in accordance with the IIC or other contractual agreements, all as approved by the FERC.
Other Operations and Maintenance Expenses
In 2013, other operations and maintenance expenses decreased $4.3 million, or 1.4%, compared to the prior year primarily due to decreases of $14.4 million in routine and planned maintenance expenses at generation facilities related to decreases in scheduled outages and cost containment efforts in 2013 and $4.9 million in other energy services expenses, partially offset by increases of $5.1 million in pension and other benefit-related expenses, $4.9 million in transmission service related to a third party power purchase agreement (PPA), $2.2 million in distribution system maintenance primarily due to increased vegetation management and $2.1 million in marketing programs.
In 2012, other operations and maintenance expenses increased $2.8 million, or 0.9%, compared to the prior year primarily due to increases of $6.2 million in marketing programs and $3.0 million for transmission service related to a third party PPA, partially offset by
a $6.9 million decrease in routine and planned outage maintenance expense at generation facilities.
The decreased expenses from other energy services did not have a significant impact on earnings since they were generally offset by associated revenues. The increased expenses from transmission service did not have a significant impact on earnings since the expense was offset by purchased power capacity revenues through the Company's purchased power capacity recovery clause. The increased expense from marketing programs did not have a significant impact on earnings since the expense was offset by energy conservation revenues through the Company's energy conservation cost recovery clause. See FUTURE EARNINGS POTENTIAL – "PSC Matters – Cost Recovery Clauses – Purchased Power Capacity Recovery" and "–Energy Conservation Cost Recovery" herein and Note 1 to the financial statements under "Affiliate Transactions" for additional information.
Depreciation and Amortization
Depreciation and amortization increased $8.0 million, or 5.7%, in 2013 compared to the prior year. The increase was primarily attributable to equipment replacements completed on Plant Crist Unit 7 and other additions to transmission and distribution facilities. Depreciation and amortization increased $11.4 million, or 8.8%, in 2012 compared to the prior year primarily due to the addition of environmental control projects at generation facilities and other additions to transmission and distribution facilities.
Taxes Other Than Income Taxes
Taxes other than income taxes increased $1.0 million, or 1.1%, in 2013 compared to the prior year primarily due to a $2.8 million increase in property taxes, partially offset by decreases of $0.7 million in gross receipts taxes, $0.7 million in payroll taxes, and $0.4 million in franchise fees. Taxes other than income taxes decreased $3.9 million, or 3.9%, in 2012 compared to the prior year primarily due to a $6.1 million decrease in gross receipts taxes and franchise fees, partially offset by a $1.3 million increase in property taxes and a $0.7 million increase in payroll taxes. Gross receipts taxes and franchise fees have no impact on net income.
Allowance for Funds Used During Construction Equity
AFUDC equity increased $1.2 million, or 23.5%, in 2013 compared to the prior year primarily due to increased construction projects related to environmental control projects at generation facilities. AFUDC equity decreased $4.7 million, or 47.3%, in 2012 compared to the prior year primarily due to an adjustment related to deferred future generation carrying costs and the completion of construction projects related to environmental control projects at generation facilities. See Note 1 to the financial statements under "Allowance for Funds Used During Construction" for additional information.
Interest Expense, Net of Amounts Capitalized
Interest expense, net of amounts capitalized decreased $4.2 million, or 7.0%, in 2013 compared to the prior year primarily due to lower interest rates on pollution control bonds, senior notes, and customer deposits. Interest expense, net of amounts capitalized increased $2.1 million, or 3.6%, in 2012 compared to the prior year primarily due to increases in long-term debt levels.
II-288
MANAGEMENT'S DISCUSSION AND ANALYSIS (continued)
Gulf Power Company 2013 Annual Report
Income Taxes
Income taxes increased $0.5 million, or 0.6%, in 2013 compared to the prior year. The change was not material. Income taxes increased $17.9 million, or 29.3%, in 2012 compared to the prior year primarily due to higher pre-tax earnings, a reduction in the tax benefits associated with a decrease in AFUDC equity, which is non-taxable, and a decrease in state tax credits. See Note 5 to the financial statements under "Effective Tax Rate" for additional information.
Effects of Inflation
The Company is subject to rate regulation that is generally based on the recovery of historical and projected costs. The effects of inflation can create an economic loss since the recovery of costs could be in dollars that have less purchasing power. Any adverse effect of inflation on the Company's results of operations has not been substantial in recent years.
FUTURE EARNINGS POTENTIAL
General
The Company operates as a vertically integrated utility providing electricity to retail customers within its traditional service area located in northwest Florida and to wholesale customers in the Southeast. Prices for electricity provided by the Company to retail customers are set by the Florida PSC under cost-based regulatory principles. Prices for wholesale electricity sales, interconnecting transmission lines, and the exchange of electric power are regulated by the FERC. Retail rates and earnings are reviewed and may be adjusted periodically within certain limitations. See ACCOUNTING POLICIES – "Application of Critical Accounting Policies and Estimates – Electric Utility Regulation" herein and Note 3 to the financial statements under "Retail Regulatory Matters" for additional information about regulatory matters.
The results of operations for the past three years are not necessarily indicative of future earnings potential. The level of the Company's future earnings depends on numerous factors that affect the opportunities, challenges, and risks of the Company's business of selling electricity. These factors include the Company's ability to maintain a constructive regulatory environment that continues to allow for the timely recovery of prudently-incurred costs during a time of increasing costs. Future earnings in the near term will depend, in part, upon maintaining and growing sales which is subject to a number of factors. These factors include weather, competition, energy conservation practiced by customers, the price of electricity, the price elasticity of demand, the rate of economic growth or decline in the Company's service territory, and the successful remarketing of wholesale capacity as current contracts expire. Changes in regional and global economic conditions impact sales for the Company, as the pace of the economic recovery remains uncertain. The timing and extent of the economic recovery will impact growth and may impact future earnings.
The Company's wholesale business consists of two types of agreements. The first type, referred to as a unit sale, is a wholesale customer purchase from a dedicated generating plant unit where a portion of that unit is reserved for the customer. These agreements are associated with the Company's co-ownership of a unit with Georgia Power Company (Georgia Power) at Plant Scherer and consist of both capacity and energy sales. Capacity revenues represent the majority of the Company's wholesale earnings. The Company currently has long-term sales agreements for 100% of the Company's ownership of that unit for the next two years and 57% for the next five years. The second type, referred to as requirements service, provides that the Company serves the customer's capacity and energy requirements from other Company resources.
Environmental Matters
Compliance costs related to federal and state environmental statutes and regulations could affect earnings if such costs cannot continue to be recovered in retail rates or through long-term wholesale agreements on a timely basis. The State of Florida has statutory provisions that allow a utility to petition the Florida PSC for recovery of prudent environmental compliance costs that are not being recovered through base rates or any other recovery mechanism. The Company's current long-term wholesale agreements contain provisions that permit charging the customer with costs incurred as a result of changes in environmental laws and regulations. The full impact of any such regulatory or legislative changes cannot be determined at this time. Environmental compliance spending over the next several years may differ materially from the amounts estimated. The timing, specific requirements, and estimated costs could change as environmental statutes and regulations are adopted or modified. Further, higher costs that are recovered through regulated rates or long-term wholesale agreements could contribute to reduced demand for electricity as well as impact the cost competitiveness of wholesale capacity, which could negatively affect results of operations, cash flows, and financial condition. See Note 3 to the financial statements under "Environmental Matters" and "Retail Regulatory Matters – Cost Recovery Clauses – Environmental Cost Recovery" for additional information including a discussion on the State of Florida's statutory provisions on environmental cost recovery.
II-289
MANAGEMENT'S DISCUSSION AND ANALYSIS (continued)
Gulf Power Company 2013 Annual Report
The Company has determined it is not economical to add the environmental controls at Plant Scholz necessary to comply with the Mercury and Air Toxics Standards (MATS) rule and that coal-fired generation at Plant Scholz will cease by April 2015. The plant is scheduled to be fully depreciated by April 2015.
New Source Review Actions
As part of a nationwide enforcement initiative against the electric utility industry which began in 1999, the U.S. Environmental Protection Agency (EPA) brought civil enforcement actions in federal district court against Georgia Power alleging violations of the New Source Review (NSR) provisions of the Clean Air Act at certain coal-fired electric generating units, including a unit co-owned by the Company. These civil actions seek penalties and injunctive relief, including orders requiring installation of the best available control technologies at the affected units. These actions were filed concurrently with the issuance of notices of violation of the NSR provisions to the Company with respect to the Company's Plant Crist. The case against Georgia Power (including claims related to a unit co-owned by the Company) has been administratively closed in the U.S. District Court for the Northern District of Georgia since 2001.
The Company believes it complied with applicable laws and regulations in effect at the time the work in question took place. The Clean Air Act authorizes maximum civil penalties of $25,000 to $37,500 per day, per violation, depending on the date of the alleged violation. An adverse outcome could require substantial capital expenditures that cannot be determined at this time and could possibly require payment of substantial penalties. Such expenditures could affect future results of operations, cash flows, and financial condition. The ultimate outcome of this matter cannot be determined at this time.
Environmental Statutes and Regulations
General
The Company's operations are subject to extensive regulation by state and federal environmental agencies under a variety of statutes and regulations governing environmental media, including air, water, and land resources. Applicable statutes include the Clean Air Act; the Clean Water Act; the Comprehensive Environmental Response, Compensation, and Liability Act; the Resource Conservation and Recovery Act; the Toxic Substances Control Act; the Emergency Planning & Community Right-to-Know Act; the Endangered Species Act; and related federal and state regulations. Compliance with these environmental requirements involves significant capital and operating costs, a major portion of which is expected to be recovered through existing ratemaking provisions. Through 2013, the Company had invested approximately $1.5 billion in environmental capital retrofit projects to comply with these requirements, with annual totals of approximately $143 million, $70 million, and $141 million for 2013, 2012, and 2011, respectively. The Company expects that capital expenditures to comply with environmental statutes and regulations will total approximately $464 million from 2014 through 2016, with annual totals of approximately $255 million, $143 million, and $66 million for 2014, 2015, and 2016, respectively.
The Company continues to monitor the development of the EPA's proposed water and coal combustion residuals rules and to evaluate compliance options. Based on its preliminary analysis and an assumption that coal combustion residuals will continue to be regulated as non-hazardous solid waste under the proposed rule, the Company does not anticipate that material compliance costs with respect to these proposed rules will be required during the period of 2014 through 2016. The ultimate capital expenditures and compliance costs with respect to these proposed rules, including additional expenditures required after 2016, will be dependent on the requirements of the final rules and regulations adopted by the EPA and the outcome of any legal challenges to these rules. See "Water Quality" and "Coal Combustion Residuals" herein for additional information.
The Company's ultimate environmental compliance strategy, including potential unit retirement and replacement decisions and future environmental capital expenditures will be affected by the final requirements of new or revised environmental regulations and regulations relating to global climate change that are promulgated, including the proposed environmental regulations described below; the outcome of any legal challenges to the environmental rules; the cost, availability, and existing inventory of emissions allowances; and the Company's fuel mix. Compliance costs may arise from existing unit retirements, installation of additional environmental controls, upgrades to the transmission system, and adding or changing fuel sources for certain existing units. The ultimate outcome of these matters cannot be determined at this time.
Air Quality
Compliance with the Clean Air Act and resulting regulations has been and will continue to be a significant focus for the Company. Since 1990, the Company has spent approximately $1.1 billion in reducing and monitoring emissions pursuant to the Clean Air Act. Additional controls are currently planned or under consideration to further reduce air emissions, maintain compliance with existing regulations, and meet new requirements.
II-290
MANAGEMENT'S DISCUSSION AND ANALYSIS (continued)
Gulf Power Company 2013 Annual Report
The EPA regulates ground level ozone concentrations through implementation of an eight-hour ozone National Ambient Air Quality Standard (NAAQS). In 2008, the EPA adopted a more stringent eight-hour ozone NAAQS, which it began to implement in 2011. In May 2012, the EPA published its final determination of nonattainment areas based on the 2008 eight-hour ozone NAAQS. All areas within the Company's service territory have achieved attainment of this standard.
The EPA regulates fine particulate matter concentrations on an annual and 24-hour average basis. All areas within the Company's service territory have achieved attainment with the 1997 and 2006 particulate matter NAAQS. On January 15, 2013, the EPA published a final rule that increases the stringency of the annual fine particulate matter standard. The new standard could result in the designation of new nonattainment areas within the Company's service territory.
Final revisions to the NAAQS for sulfur dioxide (SO
2
), which established a new one-hour standard, became effective in 2010. No areas within the Company's service territory have been designated as nonattainment under this rule. However, the EPA may designate additional areas as nonattainment in the future, which could include areas within the Company's service territory. Implementation of the revised SO
2
standard could require additional reductions in SO
2
emissions and increased compliance and operational costs.
The Company's service territory is subject to the requirements of the Clean Air Interstate Rule (CAIR), which calls for phased reductions in SO
2
and nitrogen oxide (NO
x
) emissions from power plants in 28 eastern states. In 2008, the U.S. Court of Appeals for the District of Columbia Circuit issued decisions invalidating CAIR, but left CAIR compliance requirements in place while the EPA developed a new rule. In 2011, the EPA promulgated the Cross State Air Pollution Rule (CSAPR) to replace CAIR. However, in August 2012, the U.S. Court of Appeals for the District of Columbia Circuit vacated CSAPR in its entirety and directed the EPA to continue to administer CAIR pending the EPA's development of a valid replacement. Review of the U.S. Court of Appeals for the District of Columbia Circuit's decision regarding CSAPR is currently pending before the U.S. Supreme Court.
The EPA finalized the Clean Air Visibility Rule (CAVR) in 2005, with a goal of restoring natural visibility conditions in certain areas (primarily national parks and wilderness areas) by 2064. The rule involves the application of best available retrofit technology to certain sources built between 1962 and 1977 and any additional emissions reductions necessary for each designated area to achieve reasonable progress toward the natural visibility conditions goal by 2018 and for each 10-year period thereafter.
In February 2012, the EPA finalized the MATS rule, which imposes stringent emissions limits for acid gases, mercury, and particulate matter on coal- and oil-fired electric utility steam generating units. Compliance for existing sources is required by April 16, 2015; however, states may authorize a compliance extension of up to one year to April 16, 2016. Mississippi Power Company (Mississippi Power) has received this one-year extension for Plant Daniel to April 16, 2016. Plant Daniel Units 1 and 2 are jointly owned by Mississippi Power and the Company, with 50% ownership each.
In August 2012, the EPA published proposed revisions to the New Source Performance Standard (NSPS) for Stationary Combustion Turbines (CTs). If finalized as proposed, the revisions would apply the NSPS to all new, reconstructed, and modified CTs (including CTs at combined cycle units), during all periods of operation, including startup and shutdown, and alter the criteria for determining when an existing CT has been reconstructed.
On February 12, 2013, the EPA proposed a rule that would require certain states to revise the provisions of their State Implementation Plans (SIPs) relating to the regulation of excess emissions at industrial facilities, including fossil fuel-fired generating facilities, during periods of startup, shut-down, or malfunction (SSM). The EPA proposes a determination that the SSM provisions in the SIPs for 36 states (including Florida, Georgia, and Mississippi) do not meet the requirements of the Clean Air Act and must be revised within 18 months of the date on which the EPA publishes the final rule. The EPA has entered into a settlement agreement requiring it to finalize the rule by June 12, 2014.
The Company has developed and continually updates a comprehensive environmental compliance strategy to assess compliance obligations associated with the current and proposed environmental requirements discussed above. The impacts of the eight-hour ozone, fine particulate matter and SO
2
NAAQS, CAIR and any future replacement rule, CAVR, the MATS rule, the NSPS for CTs, and the SSM rule on the Company cannot be determined at this time and will depend on the specific provisions of recently finalized and future rules, the resolution of pending and future legal challenges, and the development and implementation of rules at the state level. Certain units in the State of Georgia, including Plant Scherer Unit 3, which is co-owned by the Company, are required to install specific emissions controls according to a schedule set forth in the state's Multi-Pollutant Rule, which is designed to reduce emissions of SO
2
, NO
x
, and mercury.
These regulations could result in significant additional compliance costs that could affect future unit retirement and replacement decisions and results of operations, cash flows, and financial condition.
II-291
MANAGEMENT'S DISCUSSION AND ANALYSIS (continued)
Gulf Power Company 2013 Annual Report
Water Quality
In 2011, the EPA published a proposed rule that establishes standards for reducing effects on fish and other aquatic life caused by cooling water intake structures at existing power plants and manufacturing facilities. The rule also addresses cooling water intake structures for new units at existing facilities. Compliance with the proposed rule could require changes to existing cooling water intake structures at certain of the Company's generating facilities, and new generating units constructed at existing plants would be required to install closed cycle cooling towers. The EPA is required to issue a final rule by April 17, 2014.
The ultimate outcome of this rulemaking will depend on the final rule and the outcome of any legal challenges and cannot be determined at this time.
On June 7, 2013, the EPA published a proposed rule which requested comments on a range of potential regulatory options for addressing certain wastestreams from steam electric power plants. The impact of the revised effluent limitations guidelines will depend on the specific technology requirements of the final rule and, therefore, cannot be determined at this time.
In addition, numeric nutrient water quality standards promulgated by the State of Florida to limit the amount of nitrogen and phosphorous allowed in state waters are expected to go into effect during 2014. The impact of these standards will depend on further regulatory action in connection with the implementation of these standards and cannot be determined at this time.
These regulations could result in significant additional compliance costs that could affect future unit retirement and replacement decisions and results of operations, cash flows, and financial condition.
Coal Combustion Residuals
The Company currently operates three electric generating plants in Florida and is part owner of units at generating plants located in Mississippi and Georgia operated by the respective unit's co-owner with on-site coal combustion residuals storage facilities. In addition to on-site storage, the Company sells a portion of its coal combustion residuals to third parties for beneficial reuse. Historically, individual states have regulated coal combustion residuals and the States of Florida, Georgia, and Mississippi each has its own regulatory requirements. The Company has a routine and robust inspection program in place to ensure the integrity of its coal ash surface impoundments and compliance with applicable regulations.
The EPA continues to evaluate the regulatory program for coal combustion residuals, including coal ash and gypsum, under federal solid and hazardous waste laws. In 2010, the EPA published a proposed rule that requested comments on two potential regulatory options for the management and disposal of coal combustion residuals: regulation as a solid waste or regulation as if the materials technically constituted a hazardous waste. Adoption of either option could require closure of, or significant change to, existing storage facilities and construction of lined landfills, as well as additional waste management and groundwater monitoring requirements. Under both options, the EPA proposes to exempt the beneficial reuse of coal combustion residuals from regulation; however, a hazardous or other designation indicative of heightened risk could limit or eliminate beneficial reuse options. Environmental groups and other parties have filed lawsuits in the U.S. District Court for the District of Columbia seeking to require the EPA to complete its rulemaking process and issue final regulations pertaining to the regulation of coal combustion residuals. On September 30, 2013, the U.S. District Court for the District of Columbia issued an order granting partial summary judgment to the environmental groups and other parties, ruling that the EPA has a statutory obligation to review and revise, as necessary, the federal solid waste regulations applicable to coal combustion residuals. On January 29, 2014, the EPA filed a consent decree requiring the EPA to take final action regarding the proposed regulation of coal combustion residuals as solid waste by December 19, 2014
.
While the ultimate outcome of this matter cannot be determined at this time and will depend on the final form of any rules adopted and the outcome of any legal challenges, additional regulation of coal combustion residuals could have a material impact on the generation, management, beneficial use, and disposal of such residuals. These regulations could result in significant additional compliance costs that could affect future unit retirement and replacement decisions, and results of operations, cash flows, and financial condition. Moreover, the Company could incur additional material asset retirement obligations with respect to closing existing storage facilities.
Environmental Remediation
The Company must comply with other environmental laws and regulations that cover the handling and disposal of waste and releases of hazardous substances. Under these various laws and regulations, the Company may also incur substantial costs to clean up properties. The Company conducts studies to determine the extent of any required cleanup and has recognized in its financial statements the costs to clean up known impacted sites. Included in this amount are costs associated with remediation of the Company's substation sites. These projects have been approved by the Florida PSC for recovery through the environmental cost recovery clause; therefore, there is no impact to the Company's net income as a result of these liabilities. The Company may
II-292
MANAGEMENT'S DISCUSSION AND ANALYSIS (continued)
Gulf Power Company 2013 Annual Report
be liable for some or all required cleanup costs for additional sites that may require environmental remediation. See Note 3 to the financial statements under "Environmental Matters – Environmental Remediation" for additional information.
Global Climate Issues
The EPA currently regulates greenhouse gases under the Prevention of Significant Deterioration and Title V operating permit programs of the Clean Air Act. The legal basis for these regulations is currently being challenged in the U.S. Supreme Court. In addition, over the past several years, the U.S. Congress has considered many proposals to reduce greenhouse gas emissions, mandate renewable or clean energy, and impose energy efficiency standards. Such proposals are expected to continue to be considered by the U.S. Congress. International climate change negotiations under the United Nations Framework Convention on Climate Change are also continuing.
On January 8, 2014, the EPA published re-proposed regulations to establish standards of performance for greenhouse gas emissions from new fossil fuel steam electric generating units. A Presidential memorandum issued on June 25, 2013 also directs the EPA to propose standards, regulations, or guidelines for addressing modified, reconstructed, and existing steam electric generating units by June 1, 2014.
The outcome of any federal, state, and international initiatives, including the EPA's proposed regulations and guidelines discussed above, will depend on the scope and specific requirements of the proposed and final rules and the outcome of any legal challenges and, therefore, cannot be determined at this time. Additional restrictions on the Company's greenhouse gas emissions or requirements relating to renewable energy or energy efficiency at the federal or state level could result in significant additional compliance costs that could affect future unit retirement and replacement decisions and results of operations, cash flows, and financial condition.
The EPA's greenhouse gas reporting rule requires annual reporting of carbon dioxide equivalent emissions in metric tons for a company's operational control of facilities. Based on ownership or financial control of facilities, the Company's 2012 greenhouse gas emissions were approximately 8 million metric tons of carbon dioxide equivalent. The preliminary estimate of the Company's 2013 greenhouse gas emissions on the same basis is approximately 8 million metric tons of carbon dioxide equivalent. The level of greenhouse gas emissions from year to year will depend on the level of generation and mix of fuel sources and other factors.
PSC Matters
The Company's rates and charges for service to retail customers are subject to the regulatory oversight of the Florida PSC. The Company's rates are a combination of base rates and several separate cost recovery clauses for specific categories of costs. These separate cost recovery clauses address such items as fuel and purchased energy costs, purchased power capacity costs, energy conservation and demand side management programs, and the costs of compliance with environmental laws and regulations. Costs not addressed through one of the specific cost recovery clauses are recovered through the Company's base rates.
Retail Base Rate Case
On December 3, 2013, the Florida PSC voted to approve the Settlement Agreement among the Company and all of the intervenors to the docketed proceeding with respect to the Company's request to increase retail base rates. Under the terms of the Settlement Agreement, the Company (1) increased base rates designed to produce an additional $35 million in annual revenues effective January 2014 and will increase base rates designed to produce an additional $20 million in annual revenues effective January 2015; (2) continued its current authorized retail ROE midpoint and range; and (3) will accrue a return similar to AFUDC on certain transmission system upgrades that go into service after January 2014 until the next retail rate case or January 1, 2017, whichever comes first.
The Settlement Agreement also includes a self-executing adjustment mechanism that will increase the authorized ROE midpoint and range by 25 basis points in the event the 30-year treasury yield rate increases by an average of at least 75 basis points above 3.7947% for a consecutive six-month period.
The Settlement Agreement also provides that the Company may reduce depreciation expense and record a regulatory asset that will be included as an offset to the other cost of removal regulatory liability in an amount up to $62.5 million between January 2014 and June 2017. In any given month, such depreciation expense reduction may not exceed the amount necessary for the ROE, as reported to the Florida PSC monthly, to reach the midpoint of the authorized ROE range then in effect. Recovery of the regulatory asset will occur over a period to be determined by the Florida PSC in the Company’s next base rate case or next depreciation and dismantlement study proceeding, whichever comes first.
The Settlement Agreement also provides for recovery of costs associated with any tropical systems named by the National Hurricane Center through the initiation of a storm surcharge. The storm surcharge will begin, on an interim basis, 60 days following the filing of a cost recovery petition. The storm surcharge generally may not exceed $4.00/1,000 KWHs on monthly
II-293
MANAGEMENT'S DISCUSSION AND ANALYSIS (continued)
Gulf Power Company 2013 Annual Report
residential bills in aggregate for a calendar year. This limitation does not apply if the Company incurs in excess of $100 million in storm recovery costs that qualify for recovery in a given calendar year. This threshold amount is inclusive of the amount necessary to replenish the storm reserve to the level that existed as of December 31, 2013.
Pursuant to the Settlement Agreement, the Company may not request an increase in its retail base rates to be effective until after June 2017, unless the Company's actual retail ROE falls below the authorized ROE range.
Cost Recovery Clauses
On November 4, 2013, the Florida PSC approved the Company's annual request for its fuel, purchased power capacity, environmental, and energy conservation cost recovery factors for 2014. The net effect of the approved changes is a $65.2 million increase in annual revenue for 2014.
Revenues for all cost recovery clauses, as recorded on the financial statements, are adjusted for differences in actual recoverable costs and amounts billed in current regulated rates. Accordingly, changes in the billing factor for fuel and purchased power will have no significant effect on the Company's revenues or net income, but will affect annual cash flow. The recovery provisions for environmental compliance and energy conservation include related expenses and a return on net average investment. See Notes 1 and 3 to the financial statements under "Revenues" and "Retail Regulatory Matters" respectively, for additional information.
Fuel Cost Recovery
The Company has established fuel cost recovery rates as approved by the Florida PSC. If, at any time during the year, the projected year-end fuel cost over or under recovery balance exceeds 10% of the projected fuel revenue applicable for the period, the Company is required to notify the Florida PSC and indicate if an adjustment to the fuel cost recovery factor is being requested.
The change in the fuel cost over recovered balance to an under recovered balance during 2013 was primarily due to higher than expected fuel costs and purchased power energy expenses, partially offset by approximately $26.6 million received during 2013 as a result of a payment from one of the Company's fuel vendors pursuant to the resolution of a coal contract dispute. At December 31, 2013, the under recovered fuel balance was approximately $21.0 million, which is included in under recovered regulatory clause revenues in the balance sheets. See Note 7 to the financial statements under "Fuel and Purchased Power Commitments" for additional information. At December 31, 2012, the over recovered fuel balance was approximately $17.1 million, which is included in other regulatory liabilities, current in the balance sheets. See Note 1 to the financial statements under "Fuel Costs" and "Fuel Inventory" for additional information.
Purchased Power Capacity Recovery
The Company has established purchased power capacity recovery cost rates as approved by the Florida PSC. If the projected year-end purchased power capacity cost over or under recovery balance exceeds 10% of the projected purchased power capacity revenue applicable for the period, the Company is required to notify the Florida PSC and indicate if an adjustment to the purchased power capacity cost recovery factor is being requested.
At December 31, 2013 and 2012, the under recovered purchased power capacity balance was approximately $2.8 million and $0.8 million, respectively, which is included in under recovered regulatory clause revenues in the balance sheets. See Note 7 to the financial statements under "Fuel and Purchased Power Commitments" for additional information.
Environmental Cost Recovery
The Florida Legislature adopted legislation for an environmental cost recovery clause, which allows an electric utility to petition the Florida PSC for recovery of prudent environmental compliance costs that are not being recovered through base rates or any other recovery mechanism. Such environmental costs include operations and maintenance expenses, emissions allowance expense, depreciation, and a return on net average investment. This legislation also allows recovery of costs incurred as a result of an agreement between the Company and the Florida Department of Environmental Protection for the purpose of ensuring compliance with ozone ambient air quality standards adopted by the EPA.
In 2007, the Florida PSC voted to approve a stipulation among the Company, the Office of Public Counsel, and the Florida Industrial Power Users Group regarding the Company's plan for complying with certain federal and state regulations addressing air quality. The Company's environmental compliance plan as filed in 2007 contemplated implementation of specific projects identified in the plan from 2007 through 2018. The stipulation covers all elements of the original plan that were committed for implementation at the time of the stipulation. The Florida PSC's approval of the stipulation also required the Company to file annual updates to the plan and outlined a process for approval of additional elements in the plan when they became committed projects. In the 2010 update filing, the Company identified several elements of the updated plan that the Company had decided to
II-294
MANAGEMENT'S DISCUSSION AND ANALYSIS (continued)
Gulf Power Company 2013 Annual Report
implement. Following the process outlined in the original approved stipulation, these additional projects were approved by the Florida PSC later in 2010. The Florida PSC acknowledged that the costs of the approved projects associated with the Company's CAIR and CAVR compliance plans are eligible for recovery through the environmental cost recovery clause.
Annually, the Company seeks recovery of projected costs including any true-up amounts from prior periods. At December 31, 2013 and 2012, the under recovered environmental balance was approximately $14.4 million and $1.9 million, respectively, which is included in under recovered regulatory clause revenues in the balance sheets. See FINANCIAL CONDITION AND LIQUIDITY – "Capital Requirements and Contractual Obligations" herein for additional information.
In April 2012, the Mississippi PSC approved Mississippi Power's request for a certificate of public convenience and necessity to construct a flue gas desulfurization system (scrubber) on Plant Daniel Units 1 and 2. In May 2012, the Sierra Club filed a notice of appeal of the order with the Chancery Court of Harrison County, Mississippi. These units are jointly owned by Mississippi Power and the Company, with 50% ownership each. The estimated total cost of the project is approximately $660 million, with the Company's portion being $330 million, excluding AFUDC, and it is scheduled for completion in December 2015. The Company's portion of the cost is expected to be recovered through the environmental cost recovery clause. The ultimate outcome of this matter cannot be determined at this time.
Energy Conservation Cost Recovery
Every five years, the Florida PSC establishes new numeric conservation goals covering a 10-year period for utilities to reduce annual energy and seasonal peak demand using demand-side management (DSM) programs. After the goals are established, utilities develop plans and programs to meet the approved goals. The costs for these programs are recovered through rates established annually in the energy conservation cost recovery (ECCR) clause.
The most recent goal setting process established new DSM goals for the period 2010 through 2019. The new goals are significantly higher than the goals established in the previous five-year cycle due to a change in the cost-effectiveness test on which the Florida PSC relies to set the goals. The DSM program standards were approved in April 2011. The Company implemented several new programs in June 2011, and the costs related to these programs were reflected in the 2012 and 2013 ECCR factors approved by the Florida PSC. Higher cost recovery rates and achievement of the new DSM goals may result in reduced sales of electricity which could negatively impact results of operations, cash flows, and financial condition if base rates cannot be adjusted on a timely basis.
See BUSINESS under "Rate Matters – Integrated Resource Planning – Gulf Power" in Item 1 for a discussion of the Company's 10-year site plan filed on an annual basis with the Florida PSC.
At December 31, 2013 and 2012, the under recovered energy conservation balance was approximately $7.0 million and $0.8 million, respectively, which is included in under recovered regulatory clause revenues in the balance sheets.
Income Tax Matters
Bonus Depreciation
On January 2, 2013, the American Taxpayer Relief Act of 2012 (ATRA) was signed into law. The ATRA retroactively extended several tax credits through 2013 and extended 50% bonus depreciation for property placed in service in 2013 (and for certain long-term production-period projects to be placed in service in 2014). The extension of 50% bonus depreciation had a positive impact on the Company's cash flows of approximately $25.5 million in 2013 and is expected to have a positive impact of approximately $5.0 million on the cash flows of the Company in 2014.
Other Matters
The Company is involved in various other matters being litigated and regulatory matters that could affect future earnings. In addition, the Company is subject to certain claims and legal actions arising in the ordinary course of business. The Company's business activities are subject to extensive governmental regulation related to public health and the environment, such as regulation of air emissions and water discharges. Litigation over environmental issues and claims of various types, including property damage, personal injury, common law nuisance, and citizen enforcement of environmental requirements, such as air quality and water standards, has increased generally throughout the U.S. In particular, personal injury, property damage, and other claims for damages alleged to have been caused by carbon dioxide and other emissions, coal combustion residuals, and alleged exposure to hazardous materials, and/or requests for injunctive relief in connection with such matters, have become more frequent. The ultimate outcome of such pending or potential litigation against the Company cannot be predicted at this time; however, for current proceedings not specifically reported herein or in Note 3 to the financial statements, management does not anticipate that the ultimate liabilities, if any, arising from such current proceedings would have a material effect on the Company's
II-295
MANAGEMENT'S DISCUSSION AND ANALYSIS (continued)
Gulf Power Company 2013 Annual Report
financial statements. See Note 3 to the financial statements for a discussion of various other contingencies, regulatory matters, and other matters being litigated which may affect future earnings potential.
ACCOUNTING POLICIES
Application of Critical Accounting Policies and Estimates
The Company prepares its financial statements in accordance with generally accepted accounting principles (GAAP). Significant accounting policies are described in Note 1 to the financial statements. In the application of these policies, certain estimates are made that may have a material impact on the Company's results of operations and related disclosures. Different assumptions and measurements could produce estimates that are significantly different from those recorded in the financial statements. Senior management has reviewed and discussed the following critical accounting policies and estimates with the Audit Committee of Southern Company's Board of Directors.
Electric Utility Regulation
The Company is subject to retail regulation by the Florida PSC. The Florida PSC sets the rates the Company is permitted to charge customers based on allowable costs. The Company is also subject to cost-based regulation by the FERC with respect to wholesale transmission rates. As a result, the Company applies accounting standards which require the financial statements to reflect the effects of rate regulation. Through the ratemaking process, the regulators may require the inclusion of costs or revenues in periods different than when they would be recognized by a non-regulated company. This treatment may result in the deferral of expenses and the recording of related regulatory assets based on anticipated future recovery through rates or the deferral of gains or creation of liabilities and the recording of related regulatory liabilities. The application of the accounting standards has a further effect on the Company's financial statements as a result of the estimates of allowable costs used in the ratemaking process. These estimates may differ from those actually incurred by the Company; therefore, the accounting estimates inherent in specific costs such as depreciation, asset retirement obligations, and pension and postretirement benefits have less of a direct impact on the Company's results of operations and financial condition than they would on a non-regulated company.
As reflected in Note 1 to the financial statements, significant regulatory assets and liabilities have been recorded. Management reviews the ultimate recoverability of these regulatory assets and any requirement to refund these regulatory liabilities based on applicable regulatory guidelines and GAAP. However, adverse legislative, judicial, or regulatory actions could materially impact the amounts of such regulatory assets and liabilities and could adversely impact the Company's financial statements.
Pension and Other Postretirement Benefits
The Company's calculation of pension and other postretirement benefits expense is dependent on a number of assumptions. These assumptions include discount rates, healthcare cost trend rates, expected long-term return on plan assets, mortality rates, expected salary and wage increases, and other factors. Components of pension and other postretirement benefits expense include interest and service cost on the pension and other postretirement benefit plans, expected return on plan assets and amortization of certain unrecognized costs and obligations. Actual results that differ from the assumptions utilized are accumulated and amortized over future periods and, therefore, generally affect recognized expense and the recorded obligation in future periods. While the Company believes that the assumptions used are appropriate, differences in actual experience or significant changes in assumptions would affect its pension and other postretirement benefits costs and obligations.
Key elements in determining the Company's pension and other postretirement benefit expense in accordance with GAAP are the expected long-term return on plan assets and the discount rate used to measure the benefit plan obligations and the periodic benefit plan expense for future periods. The expected long-term return on postretirement benefit plan assets is based on the Company's investment strategy, historical experience, and expectations for long-term rates of return that consider external actuarial advice. The Company determines the long-term return on plan assets by applying the long-term rate of expected returns on various asset classes to the Company's target asset allocation. The Company discounts the future cash flows related to its postretirement benefit plans using a single-point discount rate developed from the weighted average of market-observed yields for high-quality fixed income securities with maturities that correspond to expected benefit payments.
A 25 basis point change in any significant assumption (discount rate, salaries, or long-term return on plan assets) would result in a $1.2 million or less change in total annual benefit expense and a $16 million or less change in projected obligations.
II-296
MANAGEMENT'S DISCUSSION AND ANALYSIS (continued)
Gulf Power Company 2013 Annual Report
FINANCIAL CONDITION AND LIQUIDITY
Overview
The Company's financial condition remained stable at December 31, 2013. The Company's cash requirements primarily consist of funding ongoing operations, common stock dividends, capital expenditures, and debt maturities. Capital expenditures and other investing activities include investments to meet projected long-term demand requirements, to comply with environmental regulations, and for restoration following major storms. Operating cash flows provide a substantial portion of the Company's cash needs. For the three-year period from 2014 through 2016, the Company's projected common stock dividends, capital expenditures, and debt maturities are expected to exceed operating cash flows. Projected capital expenditures in that period are primarily to maintain existing generation facilities, to add environmental equipment for existing generating units, and to expand and improve transmission and distribution facilities. The Company plans to finance future cash needs in excess of its operating cash flows primarily through debt and equity issuances. The Company intends to continue to monitor its access to short-term and long-term capital markets as well as its bank credit arrangements to meet future capital and liquidity needs. See "Sources of Capital," "Financing Activities," and "Capital Requirements and Contractual Obligations" herein for additional information.
The Company's investments in the qualified pension plan increased in value as of December 31, 2013 as compared to December 31, 2012. No contributions were made to the qualified pension plan during 2013.
Net cash provided from operating activities totaled $329.7 million in 2013, a decrease of $89.5 million from 2012. Significant changes in operating cash flow include decreases in deferred income taxes related to bonus depreciation and lower recovery of fuel costs which moved from an over recovered to an under recovered position. These decreases were partially offset by increases in cash flow related to reductions in fossil fuel stock. Net cash provided from operating activities totaled $419.2 million in 2012, an increase of $43.0 million from 2011, primarily due to an increase in deferred income taxes primarily related to bonus depreciation, partially offset by decreases in the cash provided from prepaid income taxes, fossil fuel stock, and the recovery of fuel costs.
Net cash used for investing activities totaled $306.6 million, $348.6 million, and $343.5 million for 2013, 2012, and 2011, respectively. The changes in cash used for investing activities were primarily due to gross property additions to utility plant of $304.8 million, $325.2 million, and $337.8 million for 2013, 2012, and 2011, respectively. Funds for the Company's property additions were provided by operating activities, capital contributions, and other financing activities.
Net cash used for financing activities totaled $33.6 million, $55.8 million, and $31.8 million in 2013, 2012, and 2011, respectively. Primary uses of cash were for the payment of common stock dividends and redemptions of long-term debt, partially offset by issuances of stock to Southern Company and issuances of long-term debt. Fluctuations in cash flow from financing activities vary from year to year based on capital needs and the maturity or redemption of securities.
Significant balance sheet changes in 2013 include increases of $204.1 million in property, plant, and equipment, primarily due to additions in generation, transmission, and distribution facilities, $85.4 million in accumulated deferred income tax liabilities primarily related to accelerated depreciation, $48.5 million in preference stock, $42.5 million in deferred capacity expense, $42.1 million in under recovered regulatory clause revenues, and $40.0 million in common stock, without par value due to the issuance of common stock to Southern Company, partially offset by a decrease of $50.5 million in employee benefit obligations.
The Company's ratio of common equity to total capitalization, including short-term debt, was 44.9% in 2013 and 44.5% in 2012. See Note 6 to the financial statements for additional information.
Sources of Capital
The Company plans to obtain the funds required for construction and other purposes from sources similar to those used in the past, which were primarily from operating cash flows, short-term debt, security issuances, term loans, and equity contributions from Southern Company. However, the amount, type, and timing of any future financings, if needed, will depend on regulatory approval, prevailing market conditions, and other factors.
Security issuances are subject to annual regulatory approval by the Florida PSC pursuant to its rules and regulations. Additionally, with respect to the public offering of securities, the Company files registration statements with the U.S. Securities and Exchange Commission (SEC) under the Securities Act of 1933, as amended (1933 Act). The amounts of securities authorized by the Florida PSC, as well as the amounts, if any, registered under the 1933 Act, are continuously monitored and appropriate filings are made to ensure flexibility in the capital markets.
The Company obtains financing separately without credit support from any affiliate. See Note 6 to the financial statements under "Bank Credit Arrangements" for additional information. The Southern Company system does not maintain a centralized cash or
II-297
MANAGEMENT'S DISCUSSION AND ANALYSIS (continued)
Gulf Power Company 2013 Annual Report
money pool. Therefore, funds of the Company are not commingled with funds of any other company in the Southern Company system.
The Company's current liabilities frequently exceed current assets because of the continued use of short-term debt as a funding source to meet scheduled maturities of long-term debt, as well as cash needs, which can fluctuate significantly due to the seasonality of the business. The Company has substantial cash flow from operating activities and access to the capital markets to meet liquidity needs.
At December 31, 2013, the Company had approximately $21.8 million of cash and cash equivalents. Committed credit arrangements with banks at December 31, 2013 were as follows:
|
Expires
(a)
|
Executable
Term-Loans
|
Due Within One Year
|
||||||||||||
|
2014
|
2016
|
Total
|
Unused
|
One
Year
|
Two
Years
|
Term Out
|
No Term Out
|
|||||||
|
(in millions)
|
||||||||||||||
|
$110
|
$165
|
$275
|
$275
|
$45
|
$—
|
$45
|
$65
|
|||||||
|
(a)
|
No credit arrangements expire in 2015, 2017, or 2018.
|
See Note 6 to the financial statements under "Bank Credit Arrangements" for additional information.
Most of these arrangements contain covenants that limit debt levels and contain cross default provisions to other indebtedness (including guarantee obligations) that are restricted only to the indebtedness of the Company. Such cross default provisions to other indebtedness would trigger an event of default if the Company defaulted on indebtedness or guarantee obligations over a specified threshold. The Company is currently in compliance with all such covenants. None of the arrangements contain material adverse change clauses at the time of borrowings. The Company expects to renew its credit arrangements, as needed, prior to expiration. Most of the unused credit arrangements with banks provide liquidity support to the Company's variable rate pollution control revenue bonds and commercial paper borrowings. As of December 31, 2013, the Company had $69 million of outstanding variable rate pollution control revenue bonds requiring liquidity support.
The Company may also meet short-term cash needs through a Southern Company subsidiary organized to issue and sell commercial paper at the request and for the benefit of the Company and the other traditional operating companies. Proceeds from such issuances for the benefit of the Company are loaned directly to the Company. The obligations of each company under these arrangements are several and there is no cross-affiliate credit support.
Details of short-term borrowings were as follows:
|
Short-term Debt at the End of the Period
(a)
|
Short-term Debt During the Period
(b)
|
||||||||||||||||
|
Amount Outstanding
|
Weighted Average Interest Rate
|
Average Outstanding
|
Weighted Average Interest Rate
|
Maximum Amount Outstanding
|
|||||||||||||
|
(in millions)
|
|
(in millions)
|
|
(in millions)
|
|||||||||||||
|
December 31, 2013:
|
|||||||||||||||||
|
Commercial paper
|
$
|
136
|
|
0.2
|
%
|
$
|
92
|
|
0.2
|
%
|
$
|
173
|
|
||||
|
Short-term bank debt
|
—
|
|
N/A
|
|
11
|
|
1.2
|
%
|
125
|
|
|||||||
|
Total
|
$
|
136
|
|
0.2
|
%
|
$
|
103
|
|
0.3
|
%
|
|||||||
|
December 31, 2012:
|
|||||||||||||||||
|
Commercial paper
|
$
|
124
|
|
0.3
|
%
|
$
|
69
|
|
0.3
|
%
|
$
|
124
|
|
||||
|
December 31, 2011:
|
|||||||||||||||||
|
Commercial paper
|
$
|
111
|
|
0.2
|
%
|
$
|
53
|
|
0.2
|
%
|
$
|
111
|
|
||||
|
Short-term bank debt
|
—
|
|
N/A
|
|
4
|
|
1.3
|
%
|
30
|
|
|||||||
|
Total
|
$
|
111
|
|
0.2
|
%
|
$
|
57
|
|
0.3
|
%
|
|||||||
|
(a)
|
Excludes notes payable related to other energy service contracts of $3.2 million and $3.6 million at December 31, 2012 and 2011, respectively.
|
|
(b)
|
Average and maximum amounts are based upon daily balances during the twelve-month periods ended December 31, 2013, 2012, and 2011.
|
Management believes that the need for working capital can be adequately met by utilizing the commercial paper program, lines of credit, and cash.
II-298
MANAGEMENT'S DISCUSSION AND ANALYSIS (continued)
Gulf Power Company 2013 Annual Report
Financing Activities
In February 2013, the Company issued 400,000 shares of common stock to Southern Company and realized proceeds of $40 million. The proceeds were used to repay a portion of the Company's short-term debt and for other general corporate purposes, including the Company's continuous construction program.
In June 2013, the Company entered into a 90-day floating rate bank loan bearing interest based on one-month London Interbank Offered Rate (LIBOR). This short-term loan was for $125 million aggregate principal amount and the proceeds were used for working capital and other general corporate purposes, including the Company's continuous construction program. This bank loan was repaid in July 2013.
The Company purchased and held $42 million aggregate principal amount of Development Authority of Monroe County (Georgia) Pollution Control Revenue Bonds (Gulf Power Company Plant Scherer Project), First Series 2002 (First Series 2002 Bonds) and $21 million aggregate principal amount of Development Authority of Monroe County (Georgia) Pollution Control Revenue Bonds (Gulf Power Company Plant Scherer Project), First Series 2010 (First Series 2010 Bonds) in May 2013 and June 2013, respectively. In June 2013, the Company reoffered the First Series 2002 Bonds and the First Series 2010 Bonds to the public.
In June 2013, the Company issued 500,000 shares of Series 2013A 5.60% Preference Stock and realized proceeds of $50 million. The Company also issued $90 million aggregate principal amount of Series 2013A 5.00% Senior Notes due June 15, 2043. The proceeds from the sale of the Preference Stock, together with the proceeds from the issuance of the Series 2013A Senior Notes, were used to repay at maturity $60 million aggregate principal amount of the Company's Series G 4.35% Senior Notes due July 15, 2013, to repay a portion of a 90-day floating rate bank loan in an aggregate principal amount outstanding of $125 million, for a portion of the redemption in July 2013 of $30 million aggregate principal amount outstanding of the Company’s Series H 5.25% Senior Notes due July 15, 2033, and for general corporate purposes, including the Company’s continuous construction program.
In December 2013, the Company purchased and now holds $13 million aggregate principal amount of Mississippi Business Finance Corporation Solid Waste Disposal Facilities Revenue Refunding Bonds, Series 2012 (Gulf Power Company Project), which the Company may reoffer to the public at a later date.
Subsequent to December 31, 2013, the Company issued 500,000 shares of common stock to Southern Company and realized proceeds of $50 million. The proceeds were used to repay a portion of the Company's short-term debt and for other general corporate purposes, including the Company's continuous construction program.
In addition to any financings that may be necessary to meet capital requirements, contractual obligations, and storm recovery, the Company plans to continue, when economically feasible, a program to retire higher-cost securities and replace these obligations with lower-cost capital if market conditions permit.
Credit Rating Risk
The Company does not have any credit arrangements that would require material changes in payment schedules or terminations as a result of a credit rating downgrade. There are certain contracts that could require collateral, but not accelerated payment, in the event of a credit rating change to BBB- and/or Baa3 or below. These contracts are for physical electricity purchases and sales, fuel transportation and storage, and energy price risk management. The maximum potential collateral requirements under these contracts at December 31, 2013, were as follows:
|
Credit Ratings
|
Maximum Potential Collateral Requirements
|
||
|
(in millions)
|
|||
|
At BBB- and/or Baa3
|
$
|
92
|
|
|
Below BBB- and/or Baa3
|
437
|
|
|
Included in these amounts are certain agreements that could require collateral in the event that one or more Southern Company system power pool participants has a credit rating change to below investment grade. Generally, collateral may be provided by a Southern Company guaranty, letter of credit, or cash. Additionally, any credit rating downgrade could impact the Company's ability to access capital markets, particularly the short-term debt market and the variable rate pollution control revenue bond market.
On May 24, 2013, Standard and Poor's Ratings Services, a division of The McGraw Hill Companies, Inc. (S&P) revised the ratings outlook for Southern Company and the traditional operating companies, including the Company, from stable to negative.
II-299
MANAGEMENT'S DISCUSSION AND ANALYSIS (continued)
Gulf Power Company 2013 Annual Report
On January 31, 2014, Moody's Investors Service, Inc. (Moody's) upgraded the senior unsecured debt and preferred stock ratings of the Company to A2 from A3 and to Baa1 from Baa2, respectively.
Moody's maintained the stable ratings outlook for the Company.
Market Price Risk
Due to cost-based rate regulation and other various cost recovery mechanisms, the Company continues to have limited exposure to market volatility in interest rates, commodity fuel prices, and prices of electricity. To manage the volatility attributable to these exposures, the Company nets the exposures, where possible, to take advantage of natural offsets and may enter into various derivative transactions for the remaining exposures pursuant to the Company's policies in areas such as counterparty exposure and risk management practices. The Company's policy is that derivatives are to be used primarily for hedging purposes and mandates strict adherence to all applicable risk management policies. Derivative positions are monitored using techniques including, but not limited to, market valuation, value at risk, stress testing, and sensitivity analysis.
To mitigate future exposure to changes in interest rates, the Company may enter into derivatives which are designated as hedges. The weighted average interest rate on $69.3 million of outstanding variable rate long-term debt that has not been hedged at January 1, 2014 was 0.05%. If the Company sustained a 100 basis point change in interest rates for all unhedged variable rate long-term debt, the change would affect annualized interest expense by approximately $0.7 million at January 1, 2014. See Note 1 to the financial statements under "Financial Instruments" and Note 10 to the financial statements for additional information.
To mitigate residual risks relative to movements in electricity prices, the Company enters into physical fixed-price contracts for the purchase and sale of electricity through the wholesale electricity market and, to a lesser extent, financial hedge contracts for natural gas purchases. The Company continues to manage a fuel-hedging program implemented per the guidelines of the Florida PSC. The Company had no material change in market risk exposure for the year ended December 31, 2013 when compared to the December 31, 2012 reporting period.
The changes in fair value of energy-related derivative contracts are substantially attributable to both the volume and the price of natural gas. For the years ended December 31, the changes in fair value of energy-related derivative contracts, the majority of which are composed of regulatory hedges, were as follows:
|
2013
Changes
|
2012
Changes
|
||||||
|
Fair Value
|
|||||||
|
(in millions)
|
|||||||
|
Contracts outstanding at the beginning of the period, assets (liabilities), net
|
$
|
(23
|
)
|
$
|
(41
|
)
|
|
|
Contracts realized or settled
|
13
|
|
30
|
|
|||
|
Current period changes
(a)
|
—
|
|
(12
|
)
|
|||
|
Contracts outstanding at the end of the period, assets (liabilities), net
|
$
|
(10
|
)
|
$
|
(23
|
)
|
|
|
(a)
|
Current period changes also include the changes in fair value of new contracts entered into during the period, if any.
|
The net hedge volumes of energy-related derivative contracts for the years ended December 31 were as follows:
|
2013
|
2012
|
|||
|
mmBtu* Volume
|
||||
|
(in millions)
|
||||
|
Commodity – Natural gas swaps
|
87
|
|
71
|
|
|
Commodity – Natural gas options
|
2
|
|
—
|
|
|
Total hedge volume
|
89
|
|
71
|
|
* million British thermal units (mmBtu)
The weighted average swap contract cost above market prices was approximately $0.12 per mmBtu as of December 31, 2013 and $0.32 per mmBtu as of December 31, 2012. The change in option fair value is primarily attributable to the volatility of the market and the underlying change in the natural gas price. Natural gas settlements are recovered through the Company's fuel cost recovery clause.
At December 31, 2013 and 2012, substantially all of the Company's energy-related derivative contracts were designated as regulatory hedges and are related to the Company's fuel-hedging program. Therefore, gains and losses are initially recorded as
II-300
MANAGEMENT'S DISCUSSION AND ANALYSIS (continued)
Gulf Power Company 2013 Annual Report
regulatory liabilities and assets, respectively, and then are included in fuel expense as they are recovered through the fuel cost recovery clause. Gains and losses on energy-related derivative contracts that are not designated or fail to qualify as hedges are recognized in the statements of income as incurred and were not material for any year presented.
The Company uses over-the-counter contracts that are not exchange traded but are fair valued using prices which are market observable, and thus fall into Level 2. See Note 9 to the financial statements for further discussion of fair value measurements. The maturities of the energy-related derivative contracts, which are all Level 2 of the fair value hierarchy, at December 31, 2013 were as follows:
|
Fair Value Measurements
December 31, 2013
|
|||||||||||||||
|
Total
|
Maturity
|
||||||||||||||
|
Fair Value
|
Year 1
|
Years 2&3
|
Years 4&5
|
||||||||||||
|
(in millions)
|
|||||||||||||||
|
Level 1
|
$
|
—
|
|
$
|
—
|
|
$
|
—
|
|
$
|
—
|
|
|||
|
Level 2
|
(10
|
)
|
(1
|
)
|
(6
|
)
|
(3
|
)
|
|||||||
|
Level 3
|
—
|
|
—
|
|
—
|
|
—
|
|
|||||||
|
Fair value of contracts outstanding at end of period
|
$
|
(10
|
)
|
$
|
(1
|
)
|
$
|
(6
|
)
|
$
|
(3
|
)
|
|||
The Company is exposed to market price risk in the event of nonperformance by counterparties to the energy-related derivative contracts. The Company only enters into agreements and material transactions with counterparties that have investment grade credit ratings by Moody's and S&P, or with counterparties who have posted collateral to cover potential credit exposure. Therefore, the Company does not anticipate market risk exposure from nonperformance by the counterparties. For additional information, see Note 1 to the financial statements under "Financial Instruments" and Note 10 to the financial statements.
Capital Requirements and Contractual Obligations
The construction program of the Company is currently estimated to be $394 million for
2014
, $265 million for
2015
, and $212 million for
2016
. These amounts include capital expenditures covered under long-term service agreements. Capital expenditures to comply with environmental statutes and regulations included in these estimated amounts are $255 million, $143 million, and $66 million for
2014
,
2015
, and
2016
, respectively. See FUTURE EARNINGS POTENTIAL – "Environmental Matters – Environmental Statutes and Regulations" for additional information.
The construction program is subject to periodic review and revision, and actual construction costs may vary from these estimates because of numerous factors. These factors include: changes in business conditions; changes in load projections; storm impacts; changes in environmental statutes and regulations; the outcome of any legal challenges to the environmental rules; changes in generating plants, including unit retirements and replacements and adding or changing fuel sources at existing units, to meet regulatory requirements; changes in the expected environmental compliance program; changes in FERC rules and regulations; Florida PSC approvals; changes in legislation; the cost and efficiency of construction labor, equipment, and materials; project scope and design changes; and the cost of capital. In addition, there can be no assurance that costs related to capital expenditures will be fully recovered.
In addition, as discussed in Note 2 to the financial statements, the Company provides postretirement benefits to substantially all employees and funds trusts to the extent required by the FERC and the Florida PSC.
Other funding requirements related to obligations associated with scheduled maturities of long-term debt, as well as the related interest, derivative obligations, preference stock dividends, leases, and other purchase commitments are detailed in the contractual obligations table that follows. See Notes 1, 2, 5, 6, 7, and 10 to the financial statements for additional information.
II-301
MANAGEMENT'S DISCUSSION AND ANALYSIS (continued)
Gulf Power Company 2013 Annual Report
Contractual Obligations
|
2014
|
2015-
2016
|
2017-
2018
|
After
2018
|
Uncertain
Timing
(d)
|
Total
|
||||||||||||||||||
|
(in thousands)
|
|||||||||||||||||||||||
|
Long-term debt
(a)
–
|
|||||||||||||||||||||||
|
Principal
|
$
|
75,000
|
|
$
|
110,000
|
|
$
|
85,000
|
|
$
|
970,955
|
|
$
|
—
|
|
$
|
1,240,955
|
|
|||||
|
Interest
|
53,825
|
|
100,300
|
|
83,625
|
|
647,552
|
|
—
|
|
885,302
|
|
|||||||||||
|
Financial derivative obligations
(b)
|
6,470
|
|
7,722
|
|
2,851
|
|
—
|
|
—
|
|
17,043
|
|
|||||||||||
|
Preference stock dividends
(c)
|
9,003
|
|
18,006
|
|
18,006
|
|
—
|
|
—
|
|
45,015
|
|
|||||||||||
|
Operating leases
(d)
|
13,543
|
|
19,960
|
|
619
|
|
—
|
|
—
|
|
34,122
|
|
|||||||||||
|
Unrecognized tax benefits
(e)
|
—
|
|
—
|
|
—
|
|
—
|
|
45
|
|
45
|
|
|||||||||||
|
Purchase commitments –
|
|||||||||||||||||||||||
|
Capital
(f)
|
393,958
|
|
448,471
|
|
—
|
|
—
|
|
—
|
|
842,429
|
|
|||||||||||
|
Fuel
(g)
|
336,588
|
|
365,762
|
|
255,258
|
|
184,376
|
|
—
|
|
1,141,984
|
|
|||||||||||
|
Purchased power
(h)
|
67,266
|
|
185,126
|
|
184,023
|
|
407,993
|
|
—
|
|
844,408
|
|
|||||||||||
|
Other
(i)
|
16,243
|
|
28,447
|
|
15,294
|
|
7,935
|
|
—
|
|
67,919
|
|
|||||||||||
|
Pension and other postretirement benefit plans
(j)
|
4,431
|
|
9,272
|
|
—
|
|
—
|
|
—
|
|
13,703
|
|
|||||||||||
|
Total
|
$
|
976,327
|
|
$
|
1,293,066
|
|
$
|
644,676
|
|
$
|
2,218,811
|
|
$
|
45
|
|
$
|
5,132,925
|
|
|||||
|
(a)
|
All amounts are reflected based on final maturity dates. The Company plans to continue to retire higher-cost securities and replace these obligations with lower-cost capital if market conditions permit. Variable rate interest obligations are estimated based on rates as of January 1, 2014, as reflected in the statements of capitalization. Fixed rates include, where applicable, the effects of interest rate derivatives employed to manage interest rate risk.
|
|
(b)
|
For additional information, see Notes 1 and 10 to the financial statements.
|
|
(c)
|
Preference stock does not mature; therefore, amounts are provided for the next five years only.
|
|
(d)
|
Excludes PPAs that are accounted for as leases and are included in purchased power.
|
|
(e)
|
See Note 5 to the financial statements under "Unrecognized Tax Benefits" for additional information.
|
|
(f)
|
The Company provides estimated capital expenditures for a three-year period, including capital expenditures and compliance costs associated with environmental regulations. These amounts exclude capital expenditures covered under long-term service agreements, which are reflected in Other. At December 31, 2013, significant purchase commitments were outstanding in connection with the construction program. See FUTURE EARNINGS POTENTIAL – "Environmental Matters – Environmental Statutes and Regulations" for additional information.
|
|
(g)
|
Includes commitments to purchase coal and natural gas, as well as the related transportation and storage. In most cases, these contracts contain provisions for price escalation, minimum purchase levels, and other financial commitments. Natural gas purchase commitments are based on various indices at the time of delivery. Amounts reflected for natural gas purchase commitments have been estimated based on the New York Mercantile Exchange future prices at December 31, 2013.
|
|
(h)
|
The capacity and transmission related costs associated with PPAs are recovered through the purchased power capacity clause. See Notes 3 and 7 to the financial statements for additional information.
|
|
(i)
|
Includes long-term service agreements and contracts for the procurement of limestone. Long-term service agreements include price escalation based on inflation indices.
|
|
(j)
|
The Company forecasts contributions to the pension and other postretirement benefit plans over a three-year period. The Company anticipates no mandatory contributions to the qualified pension plan during the next three years. Amounts presented represent estimated benefit payments for the nonqualified pension plans, estimated non-trust benefit payments for the other postretirement benefit plans, and estimated contributions to the other postretirement benefit plan trusts, all of which will be made from the Company's corporate assets. See Note 2 to the financial statements for additional information related to the pension and other postretirement benefit plans, including estimated benefit payments. Certain benefit payments will be made through the related benefit plans. Other benefit payments will be made from the Company's corporate assets.
|
II-302
MANAGEMENT'S DISCUSSION AND ANALYSIS (continued)
Gulf Power Company 2013 Annual Report
Cautionary Statement Regarding Forward-Looking Statements
The Company's 2013 Annual Report contains forward-looking statements. Forward-looking statements include, among other things, statements concerning retail sales, retail rates, customer growth, economic recovery, fuel and environmental cost recovery and other rate actions, current and proposed environmental regulations and related estimated expenditures, access to sources of capital, projections for the qualified pension plan and postretirement benefit plan contributions, financing activities, start and completion of construction projects, filings with state and federal regulatory authorities, impact of the ATRA, estimated sales and purchases under new power sale and purchase agreements, and estimated construction and other expenditures. In some cases, forward-looking statements can be identified by terminology such as "may," "will," "could," "should," "expects," "plans," "anticipates," "believes," "estimates," "projects," "predicts," "potential," or "continue" or the negative of these terms or other similar terminology. There are various factors that could cause actual results to differ materially from those suggested by the forward-looking statements; accordingly, there can be no assurance that such indicated results will be realized. These factors include:
|
•
|
the impact of recent and future federal and state regulatory changes, including legislative and regulatory initiatives regarding deregulation and restructuring of the electric utility industry, environmental laws including regulation of water, coal combustion residuals, and emissions of sulfur, nitrogen, carbon, soot, particulate matter, hazardous air pollutants, including mercury, and other substances, and also changes in tax and other laws and regulations to which the Company is subject, as well as changes in application of existing laws and regulations;
|
|
•
|
current and future litigation, regulatory investigations, proceedings, or inquiries, including the pending EPA civil action against the Company and Internal Revenue Service and state tax audits;
|
|
•
|
the effects, extent, and timing of the entry of additional competition in the markets in which the Company operates;
|
|
•
|
variations in demand for electricity, including those relating to weather, the general economy and recovery from the recent recession, population and business growth (and declines), the effects of energy conservation measures, including from the development and deployment of alternative energy sources such as self-generation and distributed generation technologies, and any potential economic impacts resulting from federal fiscal decisions;
|
|
•
|
available sources and costs of fuels;
|
|
•
|
effects of inflation;
|
|
•
|
ability to control costs and avoid cost overruns during the development and construction of facilities;
|
|
•
|
investment performance of the Company's employee and retiree benefit plans;
|
|
•
|
advances in technology;
|
|
•
|
state and federal rate regulations and the impact of pending and future rate cases and negotiations, including rate actions relating to fuel and other cost recovery mechanisms;
|
|
•
|
internal restructuring or other restructuring options that may be pursued;
|
|
•
|
potential business strategies, including acquisitions or dispositions of assets or businesses, which cannot be assured to be completed or beneficial to the Company;
|
|
•
|
the ability of counterparties of the Company to make payments as and when due and to perform as required;
|
|
•
|
the ability to obtain new short- and long-term contracts with wholesale customers;
|
|
•
|
the direct or indirect effect on the Company's business resulting from terrorist incidents and the threat of terrorist incidents, including cyber intrusion;
|
|
•
|
interest rate fluctuations and financial market conditions and the results of financing efforts, including the Company's credit ratings;
|
|
•
|
the impacts of any potential U.S. credit rating downgrade or other sovereign financial issues, including impacts on interest rates, access to capital markets, impacts on currency exchange rates, counterparty performance, and the economy in general;
|
|
•
|
the ability of the Company to obtain additional generating capacity at competitive prices;
|
|
•
|
catastrophic events such as fires, earthquakes, explosions, floods, hurricanes, droughts, pandemic health events such as influenzas, or other similar occurrences;
|
|
•
|
the direct or indirect effects on the Company's business resulting from incidents affecting the U.S. electric grid or operation of generating resources;
|
|
•
|
the effect of accounting pronouncements issued periodically by standard setting bodies; and
|
II-303
MANAGEMENT'S DISCUSSION AND ANALYSIS (continued)
Gulf Power Company 2013 Annual Report
|
•
|
other factors discussed elsewhere herein and in other reports (including the Form 10-K) filed by the Company from time to time with the SEC.
|
The Company expressly disclaims any obligation to update any forward-looking statements.
II-304
STATEMENTS OF INCOME
For the Years Ended
December 31, 2013
,
2012
, and
2011
Gulf Power Company
2013
Annual Report
|
|
2013
|
|
2012
|
|
2011
|
|
|||||
|
|
(in thousands)
|
||||||||||
|
Operating Revenues:
|
|||||||||||
|
Retail revenues
|
$
|
1,170,000
|
|
$
|
1,144,471
|
|
$
|
1,208,490
|
|
||
|
Wholesale revenues, non-affiliates
|
109,386
|
|
106,881
|
|
133,555
|
|
|||||
|
Wholesale revenues, affiliates
|
99,577
|
|
123,636
|
|
111,346
|
|
|||||
|
Other revenues
|
61,338
|
|
64,774
|
|
66,421
|
|
|||||
|
Total operating revenues
|
1,440,301
|
|
1,439,762
|
|
1,519,812
|
|
|||||
|
Operating Expenses:
|
|||||||||||
|
Fuel
|
532,791
|
|
544,936
|
|
662,283
|
|
|||||
|
Purchased power, non-affiliates
|
52,443
|
|
51,421
|
|
48,882
|
|
|||||
|
Purchased power, affiliates
|
32,835
|
|
22,665
|
|
41,612
|
|
|||||
|
Other operations and maintenance
|
309,865
|
|
314,195
|
|
311,358
|
|
|||||
|
Depreciation and amortization
|
149,009
|
|
141,038
|
|
129,651
|
|
|||||
|
Taxes other than income taxes
|
98,355
|
|
97,313
|
|
101,302
|
|
|||||
|
Total operating expenses
|
1,175,298
|
|
1,171,568
|
|
1,295,088
|
|
|||||
|
Operating Income
|
265,003
|
|
268,194
|
|
224,724
|
|
|||||
|
Other Income and (Expense):
|
|||||||||||
|
Allowance for equity funds used during construction
|
6,448
|
|
5,221
|
|
9,914
|
|
|||||
|
Interest income
|
369
|
|
1,408
|
|
54
|
|
|||||
|
Interest expense, net of amounts capitalized
|
(56,025
|
)
|
(60,250
|
)
|
(58,150
|
)
|
|||||
|
Other income (expense), net
|
(3,994
|
)
|
(3,227
|
)
|
(4,066
|
)
|
|||||
|
Total other income and (expense)
|
(53,202
|
)
|
(56,848
|
)
|
(52,248
|
)
|
|||||
|
Earnings Before Income Taxes
|
211,801
|
|
211,346
|
|
172,476
|
|
|||||
|
Income taxes
|
79,668
|
|
79,211
|
|
61,268
|
|
|||||
|
Net Income
|
132,133
|
|
132,135
|
|
111,208
|
|
|||||
|
Dividends on Preference Stock
|
7,704
|
|
6,203
|
|
6,203
|
|
|||||
|
Net Income After Dividends on Preference Stock
|
$
|
124,429
|
|
$
|
125,932
|
|
$
|
105,005
|
|
||
The accompanying notes are an integral part of these financial statements.
II-305
STATEMENTS OF COMPREHENSIVE INCOME
For the Years Ended
December 31, 2013
,
2012
, and
2011
Gulf Power Company
2013
Annual Report
|
|
2013
|
|
2012
|
|
2011
|
|
|||||
|
|
(in thousands)
|
||||||||||
|
Net Income
|
$
|
132,133
|
|
$
|
132,135
|
|
$
|
111,208
|
|
||
|
Other comprehensive income (loss):
|
|||||||||||
|
Qualifying hedges:
|
|||||||||||
|
Reclassification adjustment for amounts included in net
income, net of tax of $297, $360, and $360, respectively |
472
|
|
573
|
|
573
|
|
|||||
|
Total other comprehensive income (loss)
|
472
|
|
573
|
|
573
|
|
|||||
|
Comprehensive Income
|
$
|
132,605
|
|
$
|
132,708
|
|
$
|
111,781
|
|
||
The accompanying notes are an integral part of these financial statements.
II-306
STATEMENTS OF CASH FLOWS
For the Years Ended
December 31, 2013
,
2012
, and
2011
Gulf Power Company
2013
Annual Report
The accompanying notes are an integral part of these financial statements.
|
2013
|
|
2012
|
|
2011
|
|
||||||
|
|
(in thousands)
|
||||||||||
|
Operating Activities:
|
|||||||||||
|
Net income
|
$
|
132,133
|
|
$
|
132,135
|
|
$
|
111,208
|
|
||
|
Adjustments to reconcile net income
to net cash provided from operating activities —
|
|||||||||||
|
Depreciation and amortization, total
|
155,798
|
|
147,723
|
|
135,790
|
|
|||||
|
Deferred income taxes
|
77,069
|
|
174,305
|
|
63,228
|
|
|||||
|
Allowance for equity funds used during construction
|
(6,448
|
)
|
(5,221
|
)
|
(9,914
|
)
|
|||||
|
Pension, postretirement, and other employee benefits
|
11,422
|
|
(8,109
|
)
|
(356
|
)
|
|||||
|
Stock based compensation expense
|
1,749
|
|
1,647
|
|
1,318
|
|
|||||
|
Other, net
|
5,866
|
|
4,518
|
|
(8,258
|
)
|
|||||
|
Changes in certain current assets and liabilities —
|
|||||||||||
|
-Receivables
|
(49,051
|
)
|
8,713
|
|
21,518
|
|
|||||
|
-Prepayments
|
(337
|
)
|
417
|
|
10,150
|
|
|||||
|
-Fossil fuel stock
|
19,468
|
|
(6,144
|
)
|
17,519
|
|
|||||
|
-Materials and supplies
|
(1,570
|
)
|
(3,035
|
)
|
(5,073
|
)
|
|||||
|
-Prepaid income taxes
|
15,526
|
|
355
|
|
26,901
|
|
|||||
|
-Other current assets
|
1,018
|
|
—
|
|
40
|
|
|||||
|
-Accounts payable
|
(6,964
|
)
|
(5,195
|
)
|
(2,528
|
)
|
|||||
|
-Accrued taxes
|
(4,759
|
)
|
(4,705
|
)
|
1,475
|
|
|||||
|
-Accrued compensation
|
(3,309
|
)
|
481
|
|
25
|
|
|||||
|
-Over recovered regulatory clause revenues
|
(17,092
|
)
|
(10,858
|
)
|
10,247
|
|
|||||
|
-Other current liabilities
|
(782
|
)
|
(7,837
|
)
|
2,937
|
|
|||||
|
Net cash provided from operating activities
|
329,737
|
|
419,190
|
|
376,227
|
|
|||||
|
Investing Activities:
|
|||||||||||
|
Property additions
|
(292,914
|
)
|
(313,257
|
)
|
(324,372
|
)
|
|||||
|
Cost of removal net of salvage
|
(13,827
|
)
|
(28,993
|
)
|
(14,471
|
)
|
|||||
|
Construction payables
|
6,796
|
|
1,161
|
|
2,902
|
|
|||||
|
Payments pursuant to long-term service agreements
|
(7,109
|
)
|
(8,119
|
)
|
(8,007
|
)
|
|||||
|
Other investing activities
|
496
|
|
656
|
|
420
|
|
|||||
|
Net cash used for investing activities
|
(306,558
|
)
|
(348,552
|
)
|
(343,528
|
)
|
|||||
|
Financing Activities:
|
|||||||||||
|
Increase in notes payable, net
|
12,108
|
|
16,075
|
|
21,324
|
|
|||||
|
Proceeds —
|
|||||||||||
|
Common stock issued to parent
|
40,000
|
|
40,000
|
|
50,000
|
|
|||||
|
Capital contributions from parent company
|
2,987
|
|
2,106
|
|
2,101
|
|
|||||
|
Preference stock
|
50,000
|
|
—
|
|
—
|
|
|||||
|
Pollution control revenue bonds
|
63,000
|
|
13,000
|
|
—
|
|
|||||
|
Senior notes
|
90,000
|
|
100,000
|
|
125,000
|
|
|||||
|
Redemptions —
|
|||||||||||
|
Pollution control revenue bonds
|
(76,000
|
)
|
(13,000
|
)
|
—
|
|
|||||
|
Senior notes
|
(90,000
|
)
|
(91,363
|
)
|
(608
|
)
|
|||||
|
Other long-term debt
|
—
|
|
—
|
|
(110,000
|
)
|
|||||
|
Payment of preference stock dividends
|
(7,004
|
)
|
(6,203
|
)
|
(6,203
|
)
|
|||||
|
Payment of common stock dividends
|
(115,400
|
)
|
(115,800
|
)
|
(110,000
|
)
|
|||||
|
Other financing activities
|
(3,284
|
)
|
(614
|
)
|
(3,419
|
)
|
|||||
|
Net cash used for financing activities
|
(33,593
|
)
|
(55,799
|
)
|
(31,805
|
)
|
|||||
|
Net Change in Cash and Cash Equivalents
|
(10,414
|
)
|
14,839
|
|
894
|
|
|||||
|
Cash and Cash Equivalents at Beginning of Year
|
32,167
|
|
17,328
|
|
16,434
|
|
|||||
|
Cash and Cash Equivalents at End of Year
|
$
|
21,753
|
|
$
|
32,167
|
|
$
|
17,328
|
|
||
|
Supplemental Cash Flow Information:
|
|||||||||||
|
Cash paid during the period for —
|
|||||||||||
|
Interest (net of $3,421, $2,500 and $3,951 capitalized, respectively)
|
$
|
53,401
|
|
$
|
58,255
|
|
$
|
55,486
|
|
||
|
Income taxes (net of refunds)
|
(10,727
|
)
|
(96,639
|
)
|
(26,345
|
)
|
|||||
|
Noncash transactions — accrued property additions at year-end
|
31,546
|
|
27,369
|
|
19,439
|
|
|||||
II-307
BALANCE SHEETS
At
December 31, 2013
and
2012
Gulf Power Company
2013
Annual Report
|
Assets
|
2013
|
|
2012
|
|
|||
|
|
(in thousands)
|
||||||
|
Current Assets:
|
|||||||
|
Cash and cash equivalents
|
$
|
21,753
|
|
$
|
32,167
|
|
|
|
Receivables —
|
|||||||
|
Customer accounts receivable
|
64,884
|
|
58,449
|
|
|||
|
Unbilled revenues
|
57,282
|
|
53,363
|
|
|||
|
Under recovered regulatory clause revenues
|
48,282
|
|
6,138
|
|
|||
|
Other accounts and notes receivable
|
8,620
|
|
11,859
|
|
|||
|
Affiliated companies
|
8,259
|
|
13,624
|
|
|||
|
Accumulated provision for uncollectible accounts
|
(1,131
|
)
|
(1,490
|
)
|
|||
|
Fossil fuel stock, at average cost
|
135,050
|
|
153,710
|
|
|||
|
Materials and supplies, at average cost
|
54,935
|
|
53,365
|
|
|||
|
Other regulatory assets, current
|
18,536
|
|
30,576
|
|
|||
|
Prepaid expenses
|
33,186
|
|
62,877
|
|
|||
|
Other current assets
|
6,120
|
|
2,690
|
|
|||
|
Total current assets
|
455,776
|
|
477,328
|
|
|||
|
Property, Plant, and Equipment:
|
|||||||
|
In service
|
4,363,664
|
|
4,260,844
|
|
|||
|
Less accumulated provision for depreciation
|
1,211,336
|
|
1,168,055
|
|
|||
|
Plant in service, net of depreciation
|
3,152,328
|
|
3,092,789
|
|
|||
|
Construction work in progress
|
280,626
|
|
136,062
|
|
|||
|
Total property, plant, and equipment
|
3,432,954
|
|
3,228,851
|
|
|||
|
Other Property and Investments
|
15,314
|
|
15,737
|
|
|||
|
Deferred Charges and Other Assets:
|
|||||||
|
Deferred charges related to income taxes
|
50,597
|
|
50,139
|
|
|||
|
Prepaid pension costs
|
11,533
|
|
—
|
|
|||
|
Other regulatory assets, deferred
|
340,415
|
|
372,294
|
|
|||
|
Other deferred charges and assets
|
30,982
|
|
33,053
|
|
|||
|
Total deferred charges and other assets
|
433,527
|
|
455,486
|
|
|||
|
Total Assets
|
$
|
4,337,571
|
|
$
|
4,177,402
|
|
|
The accompanying notes are an integral part of these financial statements.
II-308
BALANCE SHEETS
At
December 31, 2013
and
2012
Gulf Power Company
2013
Annual Report
|
Liabilities and Stockholder's Equity
|
2013
|
|
2012
|
|
|||
|
|
(in thousands)
|
||||||
|
Current Liabilities:
|
|||||||
|
Securities due within one year
|
$
|
75,000
|
|
$
|
60,000
|
|
|
|
Notes payable
|
135,878
|
|
127,002
|
|
|||
|
Accounts payable —
|
|||||||
|
Affiliated
|
76,897
|
|
66,161
|
|
|||
|
Other
|
47,038
|
|
54,551
|
|
|||
|
Customer deposits
|
34,433
|
|
34,749
|
|
|||
|
Accrued taxes —
|
|||||||
|
Accrued income taxes
|
45
|
|
45
|
|
|||
|
Other accrued taxes
|
7,486
|
|
7,036
|
|
|||
|
Accrued interest
|
10,272
|
|
12,364
|
|
|||
|
Accrued compensation
|
11,657
|
|
14,966
|
|
|||
|
Other regulatory liabilities, current
|
13,408
|
|
25,887
|
|
|||
|
Liabilities from risk management activities
|
6,470
|
|
16,529
|
|
|||
|
Other current liabilities
|
22,972
|
|
19,930
|
|
|||
|
Total current liabilities
|
441,556
|
|
439,220
|
|
|||
|
Long-Term Debt
(
See accompanying statements
)
|
1,158,163
|
|
1,185,870
|
|
|||
|
Deferred Credits and Other Liabilities:
|
|||||||
|
Accumulated deferred income taxes
|
734,355
|
|
648,952
|
|
|||
|
Accumulated deferred investment tax credits
|
4,055
|
|
5,408
|
|
|||
|
Employee benefit obligations
|
76,338
|
|
126,871
|
|
|||
|
Deferred capacity expense
|
180,149
|
|
137,568
|
|
|||
|
Other cost of removal obligations
|
228,148
|
|
213,413
|
|
|||
|
Other regulatory liabilities, deferred
|
56,051
|
|
47,863
|
|
|||
|
Other deferred credits and liabilities
|
77,126
|
|
93,497
|
|
|||
|
Total deferred credits and other liabilities
|
1,356,222
|
|
1,273,572
|
|
|||
|
Total Liabilities
|
2,955,941
|
|
2,898,662
|
|
|||
|
Preference Stock
(
See accompanying statements
)
|
146,504
|
|
97,998
|
|
|||
|
Common Stockholder's Equity
(
See accompanying statements
)
|
1,235,126
|
|
1,180,742
|
|
|||
|
Total Liabilities and Stockholder's Equity
|
$
|
4,337,571
|
|
$
|
4,177,402
|
|
|
|
Commitments and Contingent Matters
(
See notes
)
|
|
|
|||||
The accompanying notes are an integral part of these financial statements.
II-309
STATEMENTS OF CAPITALIZATION
At
December 31, 2013
and
2012
Gulf Power Company
2013
Annual Report
|
2013
|
|
2012
|
|
2013
|
|
2012
|
|
||||||
|
|
(in thousands)
|
(percent of total)
|
|||||||||||
|
Long-Term Debt:
|
|||||||||||||
|
Long-term notes payable —
|
|||||||||||||
|
4.35% due 2013
|
$
|
—
|
|
$
|
60,000
|
|
|||||||
|
4.90% due 2014
|
75,000
|
|
75,000
|
|
|||||||||
|
5.30% due 2016
|
110,000
|
|
110,000
|
|
|||||||||
|
5.90% due 2017
|
85,000
|
|
85,000
|
|
|||||||||
|
3.10% to 5.75% due 2020-2051
|
675,000
|
|
615,000
|
|
|||||||||
|
Total long-term notes payable
|
945,000
|
|
945,000
|
|
|
|
|||||||
|
Other long-term debt —
|
|||||||||||||
|
Pollution control revenue bonds —
|
|||||||||||||
|
0.55% to 6.00% due 2022-2049
|
226,625
|
|
239,625
|
|
|||||||||
|
Variable rates (0.05% to 0.06% at 1/1/14) due 2022-2039
|
69,330
|
|
69,330
|
|
|
|
|||||||
|
Total other long-term debt
|
295,955
|
|
308,955
|
|
|
|
|||||||
|
Unamortized debt discount
|
(7,792
|
)
|
(8,085
|
)
|
|
|
|||||||
|
Total long-term debt (annual interest
requirement — $53.8 million) |
1,233,163
|
|
1,245,870
|
|
|||||||||
|
Less amount due within one year
|
75,000
|
|
60,000
|
|
|
|
|||||||
|
Long-term debt excluding amount due within one year
|
1,158,163
|
|
1,185,870
|
|
45.6
|
%
|
48.1
|
%
|
|||||
|
Preferred and Preference Stock:
|
|||||||||||||
|
Authorized - 20,000,000 shares—preferred stock
|
|||||||||||||
|
- 10,000,000 shares—preference stock
|
|||||||||||||
|
Outstanding - $100 par or stated value
|
|||||||||||||
|
— 6% preference stock — 550,000 shares (non-cumulative)
|
53,886
|
|
53,886
|
|
|||||||||
|
— 6.45% preference stock — 450,000 shares (non-cumulative)
|
44,112
|
|
44,112
|
|
|||||||||
|
— 5.60% preference stock — 500,000 shares (non-cumulative)
|
48,506
|
|
—
|
|
|
|
|||||||
|
Total preference stock
(annual dividend requirement — $9.0 million) |
146,504
|
|
97,998
|
|
5.8
|
|
4.0
|
|
|||||
|
Common Stockholder's Equity:
|
|||||||||||||
|
Common stock, without par value —
|
|||||||||||||
|
Authorized - 20,000,000 shares
|
|||||||||||||
|
Outstanding - 2013: 4,942,717 shares
|
|||||||||||||
|
- 2012: 4,542,717 shares
|
433,060
|
|
393,060
|
|
|||||||||
|
Paid-in capital
|
552,681
|
|
547,798
|
|
|||||||||
|
Retained earnings
|
250,494
|
|
241,465
|
|
|||||||||
|
Accumulated other comprehensive income (loss)
|
(1,109
|
)
|
(1,581
|
)
|
|
|
|||||||
|
Total common stockholder's equity
|
1,235,126
|
|
1,180,742
|
|
48.6
|
|
47.9
|
|
|||||
|
Total Capitalization
|
$
|
2,539,793
|
|
$
|
2,464,610
|
|
100.0
|
%
|
100.0
|
%
|
|||
The accompanying notes are an integral part of these financial statements.
II-310
STATEMENTS OF COMMON STOCKHOLDER'S EQUITY
For the Years Ended
December 31, 2013
,
2012
, and
2011
Gulf Power Company
2013
Annual Report
|
Number of Common Shares Issued
|
Common Stock
|
Paid-In Capital
|
Retained Earnings
|
Accumulated Other Comprehensive Income (Loss)
|
Total
|
|||||||||||||||||
|
|
(in thousands)
|
|||||||||||||||||||||
|
Balance at December 31, 2010
|
3,643
|
|
$
|
303,060
|
|
$
|
538,375
|
|
$
|
236,328
|
|
$
|
(2,727
|
)
|
$
|
1,075,036
|
|
|||||
|
Net income after dividends on
preference stock
|
—
|
|
—
|
|
—
|
|
105,005
|
|
—
|
|
105,005
|
|
||||||||||
|
Issuance of common stock
|
500
|
|
50,000
|
|
—
|
|
—
|
|
—
|
|
50,000
|
|
||||||||||
|
Capital contributions from parent company
|
—
|
|
—
|
|
4,334
|
|
—
|
|
—
|
|
4,334
|
|
||||||||||
|
Other comprehensive income (loss)
|
—
|
|
—
|
|
—
|
|
—
|
|
573
|
|
573
|
|
||||||||||
|
Cash dividends on common stock
|
—
|
|
—
|
|
—
|
|
(110,000
|
)
|
—
|
|
(110,000
|
)
|
||||||||||
|
Balance at December 31, 2011
|
4,143
|
|
353,060
|
|
542,709
|
|
231,333
|
|
(2,154
|
)
|
1,124,948
|
|
||||||||||
|
Net income after dividends on
preference stock
|
—
|
|
—
|
|
—
|
|
125,932
|
|
—
|
|
125,932
|
|
||||||||||
|
Issuance of common stock
|
400
|
|
40,000
|
|
—
|
|
—
|
|
—
|
|
40,000
|
|
||||||||||
|
Capital contributions from parent company
|
—
|
|
—
|
|
5,089
|
|
—
|
|
—
|
|
5,089
|
|
||||||||||
|
Other comprehensive income (loss)
|
—
|
|
—
|
|
—
|
|
—
|
|
573
|
|
573
|
|
||||||||||
|
Cash dividends on common stock
|
—
|
|
—
|
|
—
|
|
(115,800
|
)
|
—
|
|
(115,800
|
)
|
||||||||||
|
Balance at December 31, 2012
|
4,543
|
|
393,060
|
|
547,798
|
|
241,465
|
|
(1,581
|
)
|
1,180,742
|
|
||||||||||
|
Net income after dividends on
preference stock
|
—
|
|
—
|
|
—
|
|
124,429
|
|
—
|
|
124,429
|
|
||||||||||
|
Issuance of common stock
|
400
|
|
40,000
|
|
—
|
|
—
|
|
—
|
|
40,000
|
|
||||||||||
|
Capital contributions from parent company
|
—
|
|
—
|
|
4,883
|
|
—
|
|
—
|
|
4,883
|
|
||||||||||
|
Other comprehensive income (loss)
|
—
|
|
—
|
|
—
|
|
—
|
|
472
|
|
472
|
|
||||||||||
|
Cash dividends on common stock
|
—
|
|
—
|
|
—
|
|
(115,400
|
)
|
—
|
|
(115,400
|
)
|
||||||||||
|
Balance at December 31, 2013
|
4,943
|
|
$
|
433,060
|
|
$
|
552,681
|
|
$
|
250,494
|
|
$
|
(1,109
|
)
|
$
|
1,235,126
|
|
|||||
The accompanying notes are an integral part of these financial statements.
II-311
NOTES TO FINANCIAL STATEMENTS
Gulf Power Company
2013
Annual Report
Index to the Notes to Financial Statements
|
Note
|
Page
|
|
|
1
|
||
|
2
|
||
|
3
|
||
|
4
|
||
|
5
|
||
|
6
|
||
|
7
|
||
|
8
|
||
|
9
|
||
|
10
|
||
|
11
|
||
II-312
NOTES (continued)
Gulf Power Company 2013 Annual Report
1. SUMMARY OF SIGNIFICANT ACCOUNTING POLICIES
General
Gulf Power Company (the Company) is a wholly-owned subsidiary of The Southern Company (Southern Company), which is the parent company of four traditional operating companies, as well as Southern Power Company (Southern Power), Southern Company Services, Inc. (SCS), Southern Communications Services, Inc. (SouthernLINC Wireless), Southern Company Holdings, Inc. (Southern Holdings), Southern Nuclear Operating Company, Inc. (Southern Nuclear), and other direct and indirect subsidiaries. The traditional operating companies – the Company, Alabama Power Company (Alabama Power), Georgia Power Company (Georgia Power), and Mississippi Power Company (Mississippi Power) – are vertically integrated utilities providing electric service in four Southeastern states. The Company operates as a vertically integrated utility providing electricity to retail customers in northwest Florida and to wholesale customers in the Southeast. Southern Power constructs, acquires, owns, and manages generation assets, including renewable energy projects, and sells electricity at market-based rates in the wholesale market. SCS, the system service company, provides, at cost, specialized services to Southern Company and its subsidiary companies. SouthernLINC Wireless provides digital wireless communications for use by Southern Company and its subsidiary companies and also markets these services to the public and provides fiber cable services within the Southeast. Southern Holdings is an intermediate holding company subsidiary, primarily for Southern Company's investments in leveraged leases. Southern Nuclear operates and provides services to the Southern Company system's nuclear power plants.
The equity method is used for entities in which the Company has significant influence but does not control.
The Company is subject to regulation by the Federal Energy Regulatory Commission (FERC) and the Florida Public Service Commission (PSC). The Company follows generally accepted accounting principles (GAAP) in the U.S. and complies with the accounting policies and practices prescribed by its regulatory commissions. The preparation of financial statements in conformity with GAAP requires the use of estimates, and the actual results may differ from those estimates. Certain prior years' data presented in the financial statements have been reclassified to conform to the current year presentation.
Affiliate Transactions
The Company has an agreement with SCS under which the following services are rendered to the Company at direct or allocated cost: general and design engineering, operations, purchasing, accounting, finance and treasury, tax, information technology, marketing, auditing, insurance and pension administration, human resources, systems and procedures, digital wireless communications, and other services with respect to business and operations, construction management, and power pool transactions. Costs for these services amounted to
$78.4 million
,
$95.9 million
, and
$97.4 million
during
2013
,
2012
, and
2011
, respectively. Cost allocation methodologies used by SCS prior to the repeal of the Public Utility Holding Company Act of 1935, as amended, were approved by the U.S. Securities and Exchange Commission (SEC). Subsequently, additional cost allocation methodologies have been reported to the FERC and management believes they are reasonable. The FERC permits services to be rendered at cost by system service companies.
The Company has agreements with Georgia Power and Mississippi Power under which the Company owns a portion of Plant Scherer and Plant Daniel, respectively. Georgia Power operates Plant Scherer and Mississippi Power operates Plant Daniel. The Company reimbursed Georgia Power
$10.2 million
,
$6.9 million
, and
$6.7 million
and Mississippi Power
$16.5 million
,
$21.1 million
, and
$23.4 million
in
2013
,
2012
, and
2011
, respectively, for its proportionate share of related expenses. See Note 4 and Note 7 under "Operating Leases" for additional information.
The Company entered into a power purchase agreement (PPA) with Southern Power for approximately
292
megawatts (MWs) annually from June 2009 through May 2014. Purchased power expenses associated with the PPA were
$14.2 million
,
$14.7 million
, and
$14.3 million
in
2013
,
2012
, and
2011
, respectively, and fuel costs associated with the PPA were
$0.8 million
,
$2.6 million
, and
$1.8 million
in
2013
,
2012
, and
2011
, respectively. These costs have been approved for recovery by the Florida PSC through the Company's fuel and purchased power capacity cost recovery clauses. Additionally, the Company had
$4.2 million
of deferred capacity expenses included in prepaid expenses and other regulatory liabilities, current in the balance sheets at
December 31, 2013
and
2012
, respectively. See Note 7 under "Fuel and Purchased Power Agreements" for additional information.
The Company has an agreement with Georgia Power under the transmission facility cost allocation tariff for delivery of power from the Company's resources in the state of Georgia. The Company reimbursed Georgia Power
$2.4 million
in each of the years
2013
,
2012
, and
2011
for its share of related expenses.
The Company has an agreement with Alabama Power under which Alabama Power will make transmission system upgrades to ensure firm delivery of energy under a non-affiliate PPA, which was entered into in 2009 for the capacity and energy from a combined cycle plant located in Autauga County, Alabama. Revenue requirement obligations to Alabama Power for these
II-313
NOTES (continued)
Gulf Power Company 2013 Annual Report
upgrades are estimated to be
$135.0 million
for the entire project. These costs began in July 2012 and will continue through 2023. The Company reimbursed Alabama Power
$7.9 million
and
$3.0 million
in 2013 and 2012, respectively, for the revenue requirements. These costs have been approved for recovery by the Florida PSC through the Company's purchased power capacity cost recovery clause and by the FERC in the transmission facilities cost allocation tariff.
The Company provides incidental services to and receives such services from other Southern Company subsidiaries which are generally minor in duration and amount. Except as described herein, the Company neither provided nor received any material services to or from affiliates in
2013
or
2012
. In 2011, the Company provided storm restoration assistance to Alabama Power totaling
$1.4 million
.
The traditional operating companies, including the Company, and Southern Power may jointly enter into various types of wholesale energy, natural gas, and certain other contracts, either directly or through SCS, as agent. Each participating company may be jointly and severally liable for the obligations incurred under these agreements. See Note 7 under "Fuel and Purchased Power Agreements" for additional information.
II-314
NOTES (continued)
Gulf Power Company 2013 Annual Report
Regulatory Assets and Liabilities
The Company is subject to the provisions of the Financial Accounting Standards Board in accounting for the effects of rate regulation. Regulatory assets represent probable future revenues associated with certain costs that are expected to be recovered from customers through the ratemaking process. Regulatory liabilities represent probable future reductions in revenues associated with amounts that are expected to be credited to customers through the ratemaking process.
Regulatory assets and (liabilities) reflected in the balance sheets at December 31 relate to:
|
2013
|
|
2012
|
|
Note
|
|||||
|
(in thousands)
|
|||||||||
|
Deferred income tax charges
|
$
|
47,573
|
|
$
|
46,788
|
|
(a)
|
||
|
Deferred income tax charges — Medicare subsidy
|
3,351
|
|
3,678
|
|
(b)
|
||||
|
Asset retirement obligations
|
(6,089
|
)
|
(5,793
|
)
|
(a,j)
|
||||
|
Other cost of removal obligations
|
(228,148
|
)
|
(213,413
|
)
|
(a)
|
||||
|
Deferred income tax credits
|
(5,238
|
)
|
(6,515
|
)
|
(a)
|
||||
|
Loss on reacquired debt
|
16,565
|
|
16,400
|
|
(c)
|
||||
|
Vacation pay
|
9,521
|
|
9,238
|
|
(d,j)
|
||||
|
Under recovered regulatory clause revenues
|
45,191
|
|
3,523
|
|
(e)
|
||||
|
Over recovered regulatory clause revenues
|
—
|
|
(17,092
|
)
|
(e)
|
||||
|
Property damage reserve
|
(35,380
|
)
|
(31,956
|
)
|
(f)
|
||||
|
Fuel-hedging (realized and unrealized) losses
|
17,043
|
|
29,038
|
|
(g,j)
|
||||
|
Fuel-hedging (realized and unrealized) gains
|
(6,962
|
)
|
(4,358
|
)
|
(g,j)
|
||||
|
PPA charges
|
180,149
|
|
137,568
|
|
(j,k)
|
||||
|
Other regulatory assets
|
12,772
|
|
11,034
|
|
(l)
|
||||
|
Environmental remediation
|
50,384
|
|
60,452
|
|
(h,j)
|
||||
|
PPA credits
|
(7,496
|
)
|
(7,502
|
)
|
(j,k)
|
||||
|
Other regulatory liabilities
|
(1,308
|
)
|
(534
|
)
|
(f)
|
||||
|
Retiree benefit plans, net
|
68,296
|
|
141,429
|
|
(i,j)
|
||||
|
Total regulatory assets (liabilities), net
|
$
|
160,224
|
|
$
|
171,985
|
|
|||
Note: The recovery and amortization periods for these regulatory assets and (liabilities) are as follows:
|
(a)
|
Asset retirement and removal assets and liabilities are recorded, deferred income tax assets are recovered, and deferred income tax liabilities are amortized over the related property lives, which may range up to
65 years
. Asset retirement and removal assets and liabilities will be settled and trued up following completion of the related activities.
|
|
(b)
|
Recovered and amortized over periods not exceeding
14 years
.
|
|
(c)
|
Recovered over either the remaining life of the original issue or, if refinanced, over the life of the new issue, which may range up to
40 years
.
|
|
(d)
|
Recorded as earned by employees and recovered as paid, generally within
one year
. This includes both vacation and banked holiday pay.
|
|
(e)
|
Recorded and recovered or amortized as approved by the Florida PSC, generally within
one year
.
|
|
(f)
|
Recorded and recovered or amortized as approved by the Florida PSC.
|
|
(g)
|
Fuel-hedging assets and liabilities are recognized over the life of the underlying hedged purchase contracts, which generally do not exceed
five years
. Upon final settlement, costs are recovered through the fuel cost recovery clause.
|
|
(h)
|
Recovered through the environmental cost recovery clause when the remediation is performed.
|
|
(i)
|
Recovered and amortized over the average remaining service period which may range up to
15 years
. See Note 2 for additional information.
|
|
(j)
|
Not earning a return as offset in rate base by a corresponding asset or liability.
|
|
(k)
|
Recovered over the life of the PPA for periods up to
14 years
.
|
|
(l)
|
Comprised primarily of net book value of retired meters, deferred rate case expenses, and generation site evaluation costs. These costs are recorded and recovered or amortized as approved by the Florida PSC, generally over periods not exceeding
eight years
, or deferred pursuant to Florida statute while the Company continues to evaluate certain potential new generating projects.
|
In the event that a portion of the Company's operations is no longer subject to applicable accounting rules for rate regulation, the Company would be required to write off to income or reclassify to accumulated other comprehensive income (OCI) related regulatory assets and liabilities that are not specifically recoverable through regulated rates. In addition, the Company would be required to determine if any impairment to other assets, including plant, exists and write down the assets, if impaired, to their fair
II-315
NOTES (continued)
Gulf Power Company 2013 Annual Report
values. All regulatory assets and liabilities are to be reflected in rates. See Note 3 under "Retail Regulatory Matters" for additional information.
Revenues
Wholesale capacity revenues are generally recognized on a levelized basis over the appropriate contract period. Energy and other revenues are recognized as services are provided. Unbilled revenues related to retail sales are accrued at the end of each fiscal period. Electric rates for the Company include provisions to adjust billings for fluctuations in fuel costs, the energy component of purchased power costs, and certain other costs. The Company continuously monitors the over or under recovered fuel cost balance in light of the inherent variability in fuel costs. The Company is required to notify the Florida PSC if the projected fuel cost over or under recovery is expected to exceed
10%
of the projected fuel revenue applicable for the period and indicate if an adjustment to the fuel cost recovery factor is being requested. The Company has similar retail cost recovery clauses for energy conservation costs, purchased power capacity costs, and environmental compliance costs. Revenues are adjusted for differences between these actual costs and amounts billed in current regulated rates. Under or over recovered regulatory clause revenues are recorded in the balance sheets and are recovered or returned to customers through adjustments to the billing factors. Annually, the Company petitions for recovery of projected costs including any true-up amounts from prior periods, and approved rates are implemented each January. See Note 3 under "Retail Regulatory Matters" for additional information.
The Company's wholesale business consists of two types of agreements. The first type, referred to as a unit sale, is a wholesale customer purchase from a dedicated generating plant unit where a portion of that unit is reserved for the customer. These agreements are associated with the Company's co-ownership of a unit with Georgia Power Company (Georgia Power) at Plant Scherer and consist of both capacity and energy sales. Capacity revenues represent the majority of the Company’s wholesale earnings. The Company currently has long-term sales agreements for
100%
of the Company's ownership of that unit for the next
two years
and
57%
for the next
five years
. The second type, referred to as requirements service, provides that the Company serves the customer's capacity and energy requirements from other Company resources.
The Company has a diversified base of customers. No single customer or industry comprises
10%
or more of revenues. For all periods presented, uncollectible accounts averaged less than
1%
of revenues.
Fuel Costs
Fuel costs are expensed as the fuel is used. Fuel expense generally includes fuel transportation costs and the cost of purchased emissions allowances as they are used. Fuel expense and emissions allowance costs are recovered by the Company through the fuel cost recovery and environmental cost recovery rates, respectively, approved annually by the Florida PSC.
Income and Other Taxes
The Company uses the liability method of accounting for deferred income taxes and provides deferred income taxes for all significant income tax temporary differences. Investment tax credits (ITCs) utilized are deferred and amortized to income over the average life of the related property. Taxes that are collected from customers on behalf of governmental agencies to be remitted to these agencies are presented net on the statements of income.
In accordance with accounting standards related to the uncertainty in income taxes, the Company recognizes tax positions that are "more likely than not" of being sustained upon examination by the appropriate taxing authorities. See Note 5 under "Unrecognized Tax Benefits" for additional information.
Property, Plant, and Equipment
Property, plant, and equipment is stated at original cost less any regulatory disallowances and impairments. Original cost includes: materials; labor; minor items of property; appropriate administrative and general costs; payroll-related costs such as taxes, pensions, and other benefits; and the interest capitalized and cost of equity funds used during construction.
II-316
NOTES (continued)
Gulf Power Company 2013 Annual Report
The Company's property, plant, and equipment in service consisted of the following at December 31:
|
2013
|
2012
|
||||||
|
(in thousands)
|
|||||||
|
Generation
|
$
|
2,607,166
|
|
$
|
2,598,773
|
|
|
|
Transmission
|
473,378
|
|
429,341
|
|
|||
|
Distribution
|
1,117,024
|
|
1,069,065
|
|
|||
|
General
|
164,065
|
|
161,379
|
|
|||
|
Plant acquisition adjustment
|
2,031
|
|
2,286
|
|
|||
|
Total plant in service
|
$
|
4,363,664
|
|
$
|
4,260,844
|
|
|
The cost of replacements of property, exclusive of minor items of property, is capitalized. The cost of maintenance, repairs, and replacement of minor items of property is charged to other operations and maintenance expenses as incurred or performed.
Depreciation and Amortization
Depreciation of the original cost of utility plant in service is provided primarily by using composite straight-line rates, which approximated
3.6%
in both
2013
and
2012
and
3.5%
in
2011
. Depreciation studies are conducted periodically to update the composite rates. These studies are approved by the Florida PSC and the FERC. When property subject to depreciation is retired or otherwise disposed of in the normal course of business, its original cost, together with the cost of removal, less salvage, is charged to accumulated depreciation. For other property dispositions, the applicable cost and accumulated depreciation are removed from the balance sheet accounts, and a gain or loss is recognized. Minor items of property included in the original cost of the plant are retired when the related property unit is retired.
Asset Retirement Obligations and Other Costs of Removal
Asset retirement obligations are computed as the present value of the ultimate costs for an asset's future retirement and are recorded in the period in which the liability is incurred. The costs are capitalized as part of the related long-lived asset and depreciated over the asset's useful life. The Company has received an order from the Florida PSC allowing the continued accrual of other future retirement costs for long-lived assets that the Company does not have a legal obligation to retire. Accordingly, the accumulated removal costs for these obligations are reflected in the balance sheets as a regulatory liability.
The liability for asset retirement obligations primarily relates to the Company's combustion turbines at its Pea Ridge facility, various landfill sites, a barge unloading dock, asbestos removal, ash ponds, and disposal of polychlorinated biphenyls in certain transformers. The Company also has identified retirement obligations related to certain transmission and distribution facilities, certain wireless communication towers, and certain structures authorized by the U.S. Army Corps of Engineers. However, liabilities for the removal of these assets have not been recorded because the settlement timing for the retirement obligations related to these assets is indeterminable and, therefore, the fair value of the retirement obligations cannot be reasonably estimated. A liability for these asset retirement obligations will be recognized when sufficient information becomes available to support a reasonable estimation of the asset retirement obligation. The Company will continue to recognize in the statements of income allowed removal costs in accordance with its regulatory treatment. Any differences between costs recognized in accordance with accounting standards related to asset retirement and environmental obligations and those reflected in rates are recognized as either a regulatory asset or liability, as ordered by the Florida PSC, and are reflected in the balance sheets.
Details of the asset retirement obligations included in the balance sheets are as follows:
|
2013
|
2012
|
||||||
|
(in thousands)
|
|||||||
|
Balance at beginning of year
|
$
|
16,055
|
|
$
|
10,729
|
|
|
|
Liabilities incurred
|
518
|
|
—
|
|
|||
|
Liabilities settled
|
(1,913
|
)
|
(107
|
)
|
|||
|
Accretion
|
751
|
|
507
|
|
|||
|
Cash flow revisions
|
773
|
|
4,926
|
|
|||
|
Balance at end of year
|
$
|
16,184
|
|
$
|
16,055
|
|
|
II-317
NOTES (continued)
Gulf Power Company 2013 Annual Report
Allowance for Funds Used During Construction
In accordance with regulatory treatment, the Company records allowance for funds used during construction (AFUDC), which represents the estimated debt and equity costs of capital funds that are necessary to finance the construction of new regulated facilities. While cash is not realized currently from such allowance, AFUDC increases the revenue requirement and is recovered over the service life of the plant through a higher rate base and higher depreciation. The equity component of AFUDC is not included in calculating taxable income. The average annual AFUDC rate was
6.26%
for
2013
,
6.72%
for
2012
, and
7.65%
for
2011
. AFUDC, net of income taxes, as a percentage of net income after dividends on preference stock was
6.87%
,
5.36%
, and
11.75%
for
2013
,
2012
, and
2011
, respectively.
Impairment of Long-Lived Assets and Intangibles
The Company evaluates long-lived assets for impairment when events or changes in circumstances indicate that the carrying value of such assets may not be recoverable. The determination of whether an impairment has occurred is based on either a specific regulatory disallowance or an estimate of undiscounted future cash flows attributable to the assets, as compared with the carrying value of the assets. If an impairment has occurred, the amount of the impairment recognized is determined by either the amount of regulatory disallowance or by estimating the fair value of the assets and recording a loss if the carrying value is greater than the fair value. For assets identified as held for sale, the carrying value is compared to the estimated fair value less the cost to sell in order to determine if an impairment loss is required. Until the assets are disposed of, their estimated fair value is re-evaluated when circumstances or events change.
Property Damage Reserve
The Company accrues for the cost of repairing damages from major storms and other uninsured property damages, including uninsured damages to transmission and distribution facilities, generation facilities, and other property. The costs of such damage are charged to the reserve. The Florida PSC approved annual accrual to the property damage reserve is
$3.5 million
, with a target level for the reserve between
$48.0 million
and
$55.0 million
. The Florida PSC also authorized the Company to make additional accruals above the
$3.5 million
at the Company's discretion. The Company accrued total expenses of
$3.5 million
in each of
2013
,
2012
, and
2011
. As of
December 31, 2013
and
2012
, the balance in the Company's property damage reserve totaled approximately
$35.4 million
and
$32.0 million
, respectively, which is included in deferred liabilities in the balance sheets.
When the property damage reserve is inadequate to cover the cost of major storms, the Florida PSC can authorize a storm cost recovery surcharge to be applied to customer bills. In
2013
, the Florida PSC approved a settlement agreement (Settlement Agreement) that, among other things, provides for recovery of costs associated with any tropical systems named by the National Hurricane Center through the initiation of a storm surcharge. The storm surcharge will begin, on an interim basis,
60
days following the filing of a cost recovery petition. The storm surcharge generally may not exceed
$4.00
/
1,000
kilowatt hours (KWHs) on monthly residential bills in aggregate for a calendar year. This limitation does not apply if the Company incurs in excess of
$100 million
in storm recovery costs that qualify for recovery in a given calendar year. This threshold amount is inclusive of the amount necessary to replenish the storm reserve to the level that existed as of
December 31, 2013
. See Note 3 herein under "Retail Regulatory Matters – Retail Base Rate Case" for details of the Settlement Agreement.
Injuries and Damages Reserve
The Company is subject to claims and lawsuits arising in the ordinary course of business. As permitted by the Florida PSC, the Company accrues for the uninsured costs of injuries and damages by charges to income amounting to
$1.6 million
annually. The Florida PSC has also given the Company the flexibility to increase its annual accrual above
$1.6 million
to the extent the balance in the reserve does not exceed
$2.0 million
and to defer expense recognition of liabilities greater than the balance in the reserve. The cost of settling claims is charged to the reserve. The injuries and damages reserve was
$3.6 million
and
$3.1 million
at
December 31, 2013
and
2012
, respectively. For
2013
,
$1.6 million
and
$2.0 million
are included in current liabilities and deferred credits and other liabilities in the balance sheets, respectively. For
2012
,
$1.6 million
and
$1.5 million
are included in current liabilities and deferred credits and other liabilities in the balance sheets, respectively. There were no liabilities in excess of the reserve balance at
December 31, 2013
or
2012
.
Cash and Cash Equivalents
For purposes of the financial statements, temporary cash investments are considered cash equivalents. Temporary cash investments are securities with original maturities of
90 days
or less.
II-318
NOTES (continued)
Gulf Power Company 2013 Annual Report
Materials and Supplies
Generally, materials and supplies include the average cost of transmission, distribution, and generating plant materials. Materials are charged to inventory when purchased and then expensed or capitalized to plant, as appropriate, at weighted average cost when installed.
Fuel Inventory
Fuel inventory includes the average cost of oil, natural gas, coal, transportation and emissions allowances. Fuel is charged to inventory when purchased and then expensed, at weighted average cost, as used. Fuel expense and emissions allowance costs are recovered by the Company through the fuel cost recovery and environmental cost recovery rates, respectively, approved annually by the Florida PSC. Emissions allowances granted by the U.S. Environmental Protection Agency (EPA) are included in inventory at zero cost.
Financial Instruments
The Company uses derivative financial instruments to limit exposure to fluctuations in interest rates, the prices of certain fuel purchases, and electricity purchases and sales. All derivative financial instruments are recognized as either assets or liabilities (included in "Other" or shown separately as "Risk Management Activities") and are measured at fair value. See Note 9 for additional information. Substantially all of the Company's bulk energy purchases and sales contracts that meet the definition of a derivative are excluded from fair value accounting requirements because they qualify for the "normal" scope exception, and are accounted for under the accrual method. Other derivative contracts qualify as cash flow hedges of anticipated transactions or are recoverable through the Florida PSC approved fuel-hedging program. This results in the deferral of related gains and losses in OCI or regulatory assets and liabilities, respectively, until the hedged transactions occur. Any ineffectiveness arising from cash flow hedges is recognized currently in net income. Other derivative contracts are marked to market through current period income and are recorded on a net basis in the statements of income. See Note 10 for additional information.
The Company does not offset fair value amounts recognized for multiple derivative instruments executed with the same counterparty under a master netting arrangement. Additionally, the Company had no outstanding collateral repayment obligations or rights to reclaim collateral arising from derivative instruments recognized at
December 31, 2013
.
The Company is exposed to losses related to financial instruments in the event of counterparties' nonperformance. The Company has established controls to determine and monitor the creditworthiness of counterparties in order to mitigate the Company's exposure to counterparty credit risk.
Comprehensive Income
The objective of comprehensive income is to report a measure of all changes in common stock equity of an enterprise that result from transactions and other economic events of the period other than transactions with owners. Comprehensive income consists of net income, changes in the fair value of qualifying cash flow hedges, and reclassifications for amounts included in net income.
2. RETIREMENT BENEFITS
The Company has a defined benefit, trusteed, pension plan covering substantially all employees. This qualified pension plan is funded in accordance with requirements of the Employee Retirement Income Security Act of 1974, as amended (ERISA). No contributions were made to the qualified pension plan during
2013
.
No
mandatory contributions to the qualified pension plan are anticipated for the year ending December 31, 2014. The Company also provides certain defined benefit pension plans for a selected group of management and highly compensated employees. Benefits under these non-qualified pension plans are funded on a cash basis. In addition, the Company provides certain medical care and life insurance benefits for retired employees through other postretirement benefit plans. The Company funds its other postretirement trusts to the extent required by the FERC. For the year ending December 31, 2014,
no
other postretirement trust contributions are expected.
Actuarial Assumptions
The weighted average rates assumed in the actuarial calculations used to determine both the benefit obligations as of the measurement date and the net periodic costs for the pension and other postretirement benefit plans for the following year are presented below. Net periodic benefit costs were calculated in 2010 for the 2011 plan year using discount rates for the pension plans and the other postretirement benefit plans of
5.53%
and
5.41%
, respectively, and an annual salary increase of
3.84%
.
II-319
NOTES (continued)
Gulf Power Company 2013 Annual Report
|
2013
|
2012
|
2011
|
||||||
|
Discount rate:
|
||||||||
|
Pension plans
|
5.02
|
%
|
4.27
|
%
|
4.98
|
%
|
||
|
Other postretirement benefit plans
|
4.86
|
|
4.06
|
|
4.88
|
|
||
|
Annual salary increase
|
3.59
|
|
3.59
|
|
3.84
|
|
||
|
Long-term return on plan assets:
|
||||||||
|
Pension plans
|
8.20
|
|
8.20
|
|
8.45
|
|
||
|
Other postretirement benefit plans
|
8.04
|
|
8.02
|
|
8.11
|
|
||
The Company estimates the expected rate of return on pension plan and other postretirement benefit plan assets using a financial model to project the expected return on each current investment portfolio. The analysis projects an expected rate of return on each of seven different asset classes in order to arrive at the expected return on the entire portfolio relying on each trust's target asset allocation and reasonable capital market assumptions. The financial model is based on four key inputs: anticipated returns by asset class (based in part on historical returns), each trust's target asset allocation, an anticipated inflation rate, and the projected impact of a periodic rebalancing of each trust's portfolio.
An additional assumption used in measuring the accumulated other postretirement benefit obligations (APBO) was a weighted average medical care cost trend rate of
7.00%
for 2014, decreasing gradually to
5.00%
through the year
2021
and remaining at that level thereafter. An annual increase or decrease in the assumed medical care cost trend rate of
1%
would affect the APBO and the service and interest cost components at
December 31, 2013
as follows:
|
1 Percent
Increase
|
1 Percent
Decrease
|
||||||
|
|
(in thousands)
|
||||||
|
Benefit obligation
|
$
|
2,884
|
|
$
|
(2,479
|
)
|
|
|
Service and interest costs
|
138
|
|
(119
|
)
|
|||
Pension Plans
The total accumulated benefit obligation for the pension plans was
$353 million
at
December 31, 2013
and
$371 million
at
December 31, 2012
. Changes in the projected benefit obligations and the fair value of plan assets during the plan years ended
December 31, 2013
and
2012
were as follows:
|
2013
|
2012
|
||||||
|
(in thousands)
|
|||||||
|
Change in benefit obligation
|
|||||||
|
Benefit obligation at beginning of year
|
$
|
413,501
|
|
$
|
352,834
|
|
|
|
Service cost
|
11,128
|
|
9,101
|
|
|||
|
Interest cost
|
17,321
|
|
17,199
|
|
|||
|
Benefits paid
|
(14,831
|
)
|
(14,046
|
)
|
|||
|
Plan amendments
|
—
|
|
426
|
|
|||
|
Actuarial (gain) loss
|
(31,791
|
)
|
47,987
|
|
|||
|
Balance at end of year
|
395,328
|
|
413,501
|
|
|||
|
Change in plan assets
|
|||||||
|
Fair value of plan assets at beginning of year
|
350,260
|
|
304,324
|
|
|||
|
Actual return on plan assets
|
49,076
|
|
45,762
|
|
|||
|
Employer contributions
|
1,134
|
|
14,220
|
|
|||
|
Benefits paid
|
(14,831
|
)
|
(14,046
|
)
|
|||
|
Fair value of plan assets at end of year
|
385,639
|
|
350,260
|
|
|||
|
Accrued liability
|
$
|
(9,689
|
)
|
$
|
(63,241
|
)
|
|
II-320
NOTES (continued)
Gulf Power Company 2013 Annual Report
At
December 31, 2013
, the projected benefit obligations for the qualified and non-qualified pension plans were
$374 million
and
$21 million
, respectively. All pension plan assets are related to the qualified pension plan.
Amounts recognized in the balance sheets at
December 31, 2013
and
2012
related to the Company's pension plans consist of the following:
|
2013
|
2012
|
||||||
|
(in thousands)
|
|||||||
|
Prepaid pension costs
|
$
|
11,533
|
|
$
|
—
|
|
|
|
Other regulatory assets, deferred
|
75,280
|
|
139,261
|
|
|||
|
Current liabilities, other
|
(1,183
|
)
|
(855
|
)
|
|||
|
Employee benefit obligations
|
(20,039
|
)
|
(62,386
|
)
|
|||
Presented below are the amounts included in regulatory assets at
December 31, 2013
and
2012
related to the defined benefit pension plans that had not yet been recognized in net periodic pension cost along with the estimated amortization of such amounts for
2014
.
|
2013
|
2012
|
Estimated Amortization in 2014
|
|||||||||
|
(in thousands)
|
|||||||||||
|
Prior service cost
|
$
|
4,401
|
|
$
|
5,565
|
|
$
|
1,115
|
|
||
|
Net (gain) loss
|
70,879
|
|
133,696
|
|
4,559
|
|
|||||
|
Regulatory assets
|
$
|
75,280
|
|
$
|
139,261
|
|
|||||
The changes in the balance of regulatory assets related to the defined benefit pension plans for the years ended
December 31, 2013
and
2012
are presented in the following table:
|
|
2013
|
2012
|
||||
|
|
(in thousands)
|
|||||
|
Regulatory assets:
|
|
|
|
|
||
|
Beginning balance
|
$
|
139,261
|
|
$
|
115,853
|
|
|
Net (gain) loss
|
(54,432
|
)
|
28,157
|
|
||
|
Change in prior service costs
|
—
|
|
426
|
|
||
|
Reclassification adjustments:
|
|
|
||||
|
Amortization of prior service costs
|
(1,164
|
)
|
(1,262
|
)
|
||
|
Amortization of net gain (loss)
|
(8,385
|
)
|
(3,913
|
)
|
||
|
Total reclassification adjustments
|
(9,549
|
)
|
(5,175
|
)
|
||
|
Total change
|
(63,981
|
)
|
23,408
|
|
||
|
Ending balance
|
$
|
75,280
|
|
$
|
139,261
|
|
Components of net periodic pension cost were as follows:
|
2013
|
2012
|
2011
|
|||||||||
|
|
(in thousands)
|
||||||||||
|
Service cost
|
$
|
11,128
|
|
$
|
9,101
|
|
$
|
8,431
|
|
||
|
Interest cost
|
17,321
|
|
17,199
|
|
17,074
|
|
|||||
|
Expected return on plan assets
|
(26,435
|
)
|
(25,932
|
)
|
(27,232
|
)
|
|||||
|
Recognized net (gain) loss
|
8,385
|
|
3,913
|
|
512
|
|
|||||
|
Net amortization
|
1,164
|
|
1,262
|
|
1,262
|
|
|||||
|
Net periodic pension cost
|
$
|
11,563
|
|
$
|
5,543
|
|
$
|
47
|
|
||
II-321
NOTES (continued)
Gulf Power Company 2013 Annual Report
Net periodic pension cost is the sum of service cost, interest cost, and other costs netted against the expected return on plan assets. The expected return on plan assets is determined by multiplying the expected rate of return on plan assets and the market-related value of plan assets. In determining the market-related value of plan assets, the Company has elected to amortize changes in the market value of all plan assets over
five years
rather than recognize the changes immediately. As a result, the accounting value of plan assets that is used to calculate the expected return on plan assets differs from the current fair value of the plan assets.
Future benefit payments reflect expected future service and are estimated based on assumptions used to measure the projected benefit obligation for the pension plans. At
December 31, 2013
, estimated benefit payments were as follows:
|
Benefit Payments
|
|||
|
(in thousands)
|
|||
|
2014
|
$
|
16,548
|
|
|
2015
|
17,440
|
|
|
|
2016
|
18,405
|
|
|
|
2017
|
19,649
|
|
|
|
2018
|
20,681
|
|
|
|
2019 to 2023
|
121,864
|
|
|
Other Postretirement Benefits
Changes in the APBO and in the fair value of plan assets during the plan years ended
December 31, 2013
and
2012
were as follows:
|
2013
|
2012
|
||||||
|
(in thousands)
|
|||||||
|
Change in benefit obligation
|
|||||||
|
Benefit obligation at beginning of year
|
$
|
75,395
|
|
$
|
70,923
|
|
|
|
Service cost
|
1,355
|
|
1,167
|
|
|||
|
Interest cost
|
2,982
|
|
3,367
|
|
|||
|
Benefits paid
|
(3,583
|
)
|
(3,854
|
)
|
|||
|
Actuarial (gain) loss
|
(7,900
|
)
|
3,468
|
|
|||
|
Retiree drug subsidy
|
330
|
|
324
|
|
|||
|
Balance at end of year
|
68,579
|
|
75,395
|
|
|||
|
Change in plan assets
|
|||||||
|
Fair value of plan assets at beginning of year
|
16,227
|
|
14,978
|
|
|||
|
Actual return on plan assets
|
2,119
|
|
2,131
|
|
|||
|
Employer contributions
|
2,381
|
|
2,648
|
|
|||
|
Benefits paid
|
(3,253
|
)
|
(3,530
|
)
|
|||
|
Fair value of plan assets at end of year
|
17,474
|
|
16,227
|
|
|||
|
Accrued liability
|
$
|
(51,105
|
)
|
$
|
(59,168
|
)
|
|
Amounts recognized in the balance sheets at
December 31, 2013
and
2012
related to the Company's other postretirement benefit plans consist of the following:
|
2013
|
2012
|
||||||
|
(in thousands)
|
|||||||
|
Other regulatory assets, deferred
|
$
|
—
|
|
$
|
2,169
|
|
|
|
Current liabilities, other
|
(687
|
)
|
(661
|
)
|
|||
|
Other regulatory liabilities, deferred
|
(6,984
|
)
|
—
|
|
|||
|
Employee benefit obligations
|
(50,418
|
)
|
(58,507
|
)
|
|||
II-322
NOTES (continued)
Gulf Power Company 2013 Annual Report
Presented below are the amounts included in net regulatory assets (liabilities) at
December 31, 2013
and
2012
related to the other postretirement benefit plans that had not yet been recognized in net periodic other postretirement benefit cost along with the estimated amortization of such amounts for
2014
.
|
2013
|
2012
|
Estimated Amortization in 2014
|
|||||||||
|
(in thousands)
|
|||||||||||
|
Prior service cost
|
$
|
138
|
|
$
|
324
|
|
$
|
186
|
|
||
|
Net (gain) loss
|
(7,122
|
)
|
1,845
|
|
(24
|
)
|
|||||
|
Net regulatory assets (liabilities)
|
$
|
(6,984
|
)
|
$
|
2,169
|
|
|||||
The changes in the balance of net regulatory assets (liabilities) related to the other postretirement benefit plans for the plan years ended
December 31, 2013
and
2012
are presented in the following table:
|
|
2013
|
2012
|
||||
|
|
(in thousands)
|
|||||
|
Net regulatory assets (liabilities):
|
|
|
|
|
||
|
Beginning balance
|
$
|
2,169
|
|
$
|
239
|
|
|
Net (gain) loss
|
(8,967
|
)
|
2,309
|
|
||
|
Reclassification adjustments:
|
|
|
|
|
||
|
Amortization of transition obligation
|
—
|
|
(193
|
)
|
||
|
Amortization of prior service costs
|
(186
|
)
|
(186
|
)
|
||
|
Amortization of net gain (loss)
|
—
|
|
—
|
|
||
|
Total reclassification adjustments
|
(186
|
)
|
(379
|
)
|
||
|
Total change
|
(9,153
|
)
|
1,930
|
|
||
|
Ending balance
|
$
|
(6,984
|
)
|
$
|
2,169
|
|
Components of the other postretirement benefit plans' net periodic cost were as follows:
|
2013
|
2012
|
2011
|
|||||||||
|
|
(in thousands)
|
||||||||||
|
Service cost
|
$
|
1,355
|
|
$
|
1,167
|
|
$
|
1,132
|
|
||
|
Interest cost
|
2,982
|
|
3,367
|
|
3,658
|
|
|||||
|
Expected return on plan assets
|
(1,238
|
)
|
(1,311
|
)
|
(1,445
|
)
|
|||||
|
Net amortization
|
186
|
|
379
|
|
396
|
|
|||||
|
Net periodic postretirement benefit cost
|
$
|
3,285
|
|
$
|
3,602
|
|
$
|
3,741
|
|
||
II-323
NOTES (continued)
Gulf Power Company 2013 Annual Report
Future benefit payments, including prescription drug benefits, reflect expected future service and are estimated based on assumptions used to measure the APBO for the other postretirement benefit plans. Estimated benefit payments are reduced by drug subsidy receipts expected as a result of the Medicare Prescription Drug, Improvement, and Modernization Act of 2003 as follows:
|
Benefit
Payments
|
Subsidy
Receipts
|
Total
|
|||||||||
|
(in thousands)
|
|||||||||||
|
2014
|
$
|
4,447
|
|
$
|
(409
|
)
|
$
|
4,038
|
|
||
|
2015
|
4,630
|
|
(456
|
)
|
4,174
|
|
|||||
|
2016
|
4,856
|
|
(504
|
)
|
4,352
|
|
|||||
|
2017
|
4,994
|
|
(557
|
)
|
4,437
|
|
|||||
|
2018
|
5,168
|
|
(611
|
)
|
4,557
|
|
|||||
|
2019 to 2023
|
26,272
|
|
(3,251
|
)
|
23,021
|
|
|||||
Benefit Plan Assets
Pension plan and other postretirement benefit plan assets are managed and invested in accordance with all applicable requirements, including ERISA and the Internal Revenue Code of 1986, as amended (Internal Revenue Code). The Company's investment policies for both the pension plan and the other postretirement benefit plans cover a diversified mix of assets, including equity and fixed income securities, real estate, and private equity. Derivative instruments are used primarily to gain efficient exposure to the various asset classes and as hedging tools. The Company minimizes the risk of large losses primarily through diversification but also monitors and manages other aspects of risk.
The composition of the Company's pension plan and other postretirement benefit plan assets as of
December 31, 2013
and
2012
, along with the targeted mix of assets for each plan, is presented below:
|
Target
|
2013
|
2012
|
||||||
|
Pension plan assets:
|
||||||||
|
Domestic equity
|
26
|
%
|
31
|
%
|
28
|
%
|
||
|
International equity
|
25
|
|
25
|
|
24
|
|
||
|
Fixed income
|
23
|
|
23
|
|
27
|
|
||
|
Special situations
|
3
|
|
1
|
|
1
|
|
||
|
Real estate investments
|
14
|
|
14
|
|
13
|
|
||
|
Private equity
|
9
|
|
6
|
|
7
|
|
||
|
Total
|
100
|
%
|
100
|
%
|
100
|
%
|
||
|
Other postretirement benefit plan assets:
|
||||||||
|
Domestic equity
|
25
|
%
|
30
|
%
|
27
|
%
|
||
|
International equity
|
24
|
|
24
|
|
23
|
|
||
|
Domestic fixed income
|
25
|
|
25
|
|
29
|
|
||
|
Special situations
|
3
|
|
1
|
|
1
|
|
||
|
Real estate investments
|
14
|
|
14
|
|
13
|
|
||
|
Private equity
|
9
|
|
6
|
|
7
|
|
||
|
Total
|
100
|
%
|
100
|
%
|
100
|
%
|
||
The investment strategy for plan assets related to the Company's qualified pension plan is to be broadly diversified across major asset classes. The asset allocation is established after consideration of various factors that affect the assets and liabilities of the pension plan including, but not limited to, historical and expected returns and interest rates, volatility, correlations of asset classes, the current level of assets and liabilities, and the assumed growth in assets and liabilities. Because a significant portion of the liability of the pension plan is long-term in nature, the assets are invested consistent with long-term investment expectations for return and risk. To manage the actual asset class exposures relative to the target asset allocation, the Company employs a formal
II-324
NOTES (continued)
Gulf Power Company 2013 Annual Report
rebalancing program. As additional risk management, external investment managers and service providers are subject to written guidelines to ensure appropriate and prudent investment practices.
Investment Strategies
Detailed below is a description of the investment strategies for each major asset category for the pension and other postretirement benefit plans disclosed above:
|
•
|
Domestic equity.
A mix of large and small capitalization stocks with generally an equal distribution of value and growth attributes, managed both actively and through passive index approaches.
|
|
•
|
International equity.
A mix of growth stocks and value stocks with both developed and emerging market exposure, managed both actively and through passive index approaches.
|
|
•
|
Fixed income.
A mix of domestic and international bonds.
|
|
•
|
Special situations.
Investments in opportunistic strategies with the objective of diversifying and enhancing returns and exploiting short-term inefficiencies as well as investments in promising new strategies of a longer-term nature.
|
|
•
|
Real estate investments.
Investments in traditional private market, equity-oriented investments in real properties (indirectly through pooled funds or partnerships) and in publicly traded real estate securities.
|
|
•
|
Private equity.
Investments in private partnerships that invest in private or public securities typically through privately-negotiated and/or structured transactions, including leveraged buyouts, venture capital, and distressed debt.
|
Benefit Plan Asset Fair Values
Following are the fair value measurements for the pension plan and the other postretirement benefit plan assets as of
December 31, 2013
and
2012
. The fair values presented are prepared in accordance with GAAP. For purposes of determining the fair value of the pension plan and other postretirement benefit plan assets and the appropriate level designation, management relies on information provided by the plan's trustee. This information is reviewed and evaluated by management with changes made to the trustee information as appropriate.
Valuation methods of the primary fair value measurements disclosed in the following tables are as follows:
|
•
|
Domestic and international equity.
Investments in equity securities such as common stocks, American depositary receipts, and real estate investment trusts that trade on a public exchange are classified as Level 1 investments and are valued at the closing price in the active market. Equity investments with unpublished prices (i.e. pooled funds) are valued as Level 2, when the underlying holdings used to value the investment are comprised of Level 1 or Level 2 equity securities.
|
|
•
|
Fixed income.
Investments in fixed income securities are generally classified as Level 2 investments and are valued based on prices reported in the market place. Additionally, the value of fixed income securities takes into consideration certain items such as broker quotes, spreads, yield curves, interest rates, and discount rates that apply to the term of a specific instrument.
|
|
•
|
Real estate investments and private equity.
Investments in private equity and real estate are generally classified as Level 3 as the underlying assets typically do not have observable inputs. The fund manager values the assets using various inputs and techniques depending on the nature of the underlying investments. In the case of private equity, techniques may include purchase multiples for comparable transactions, comparable public company trading multiples, and discounted cash flow analysis. Real estate managers generally use prevailing market capitalization rates, recent sales of comparable investments, and independent third-party appraisals to value underlying real estate investments. The fair value of partnerships is determined by aggregating the value of the underlying assets.
|
II-325
NOTES (continued)
Gulf Power Company 2013 Annual Report
The fair values of pension plan assets as of
December 31, 2013
and
2012
are presented below. These fair value measurements exclude cash, receivables related to investment income, pending investments sales, and payables related to pending investment purchases. Assets that are considered special situations investments, primarily real estate investments and private equities, are presented in the tables below based on the nature of the investment.
|
Fair Value Measurements Using
|
|||||||||||||||
|
Quoted Prices in Active Markets for Identical Assets
|
Significant Other Observable Inputs
|
Significant Unobservable Inputs
|
|||||||||||||
|
As of December 31, 2013:
|
(Level 1)
|
(Level 2)
|
(Level 3)
|
Total
|
|||||||||||
|
(in thousands)
|
|||||||||||||||
|
Assets:
|
|||||||||||||||
|
Domestic equity*
|
$
|
63,269
|
|
$
|
37,037
|
|
$
|
—
|
|
$
|
100,306
|
|
|||
|
International equity*
|
48,606
|
|
44,941
|
|
—
|
|
93,547
|
|
|||||||
|
Fixed income:
|
|||||||||||||||
|
U.S. Treasury, government, and agency bonds
|
—
|
|
26,461
|
|
—
|
|
26,461
|
|
|||||||
|
Mortgage- and asset-backed securities
|
—
|
|
6,873
|
|
—
|
|
6,873
|
|
|||||||
|
Corporate bonds
|
—
|
|
43,222
|
|
—
|
|
43,222
|
|
|||||||
|
Pooled funds
|
—
|
|
20,810
|
|
—
|
|
20,810
|
|
|||||||
|
Cash equivalents and other
|
38
|
|
9,851
|
|
—
|
|
9,889
|
|
|||||||
|
Real estate investments
|
11,493
|
|
—
|
|
44,139
|
|
55,632
|
|
|||||||
|
Private equity
|
—
|
|
—
|
|
25,201
|
|
25,201
|
|
|||||||
|
Total
|
$
|
123,406
|
|
$
|
189,195
|
|
$
|
69,340
|
|
$
|
381,941
|
|
|||
|
Liabilities:
|
|||||||||||||||
|
Derivatives
|
—
|
|
(115
|
)
|
—
|
|
(115
|
)
|
|||||||
|
Total
|
$
|
123,406
|
|
$
|
189,080
|
|
$
|
69,340
|
|
$
|
381,826
|
|
|||
|
*
|
Level 1 securities consist of actively traded stocks while Level 2 securities consist of pooled funds. Management believes that the portfolio is well-diversified with no significant concentrations of risk.
|
II-326
NOTES (continued)
Gulf Power Company 2013 Annual Report
|
|
Fair Value Measurements Using
|
||||||||||||||
|
Quoted Prices in Active Markets for Identical Assets
|
Significant Other Observable Inputs
|
Significant Unobservable Inputs
|
|||||||||||||
|
As of December 31, 2012:
|
(Level 1)
|
(Level 2)
|
(Level 3)
|
Total
|
|||||||||||
|
(in thousands)
|
|||||||||||||||
|
Assets:
|
|||||||||||||||
|
Domestic equity*
|
$
|
51,215
|
|
$
|
29,499
|
|
$
|
—
|
|
$
|
80,714
|
|
|||
|
International equity*
|
40,166
|
|
43,120
|
|
—
|
|
83,286
|
|
|||||||
|
Fixed income:
|
|||||||||||||||
|
U.S. Treasury, government, and agency bonds
|
—
|
|
22,724
|
|
—
|
|
22,724
|
|
|||||||
|
Mortgage- and asset-backed securities
|
—
|
|
5,594
|
|
—
|
|
5,594
|
|
|||||||
|
Corporate bonds
|
—
|
|
38,534
|
|
139
|
|
38,673
|
|
|||||||
|
Pooled funds
|
—
|
|
17,581
|
|
—
|
|
17,581
|
|
|||||||
|
Cash equivalents and other
|
208
|
|
24,148
|
|
—
|
|
24,356
|
|
|||||||
|
Real estate investments
|
11,362
|
|
—
|
|
37,039
|
|
48,401
|
|
|||||||
|
Private equity
|
—
|
|
—
|
|
26,129
|
|
26,129
|
|
|||||||
|
Total
|
$
|
102,951
|
|
$
|
181,200
|
|
$
|
63,307
|
|
$
|
347,458
|
|
|||
|
*
|
Level 1 securities consist of actively traded stocks while Level 2 securities consist of pooled funds. Management believes that the portfolio is well-diversified with no significant concentrations of risk.
|
Changes in the fair value measurement of the Level 3 items in the pension plan assets valued using significant unobservable inputs for the years ended
December 31, 2013
and
2012
were as follows:
|
2013
|
2012
|
||||||||||||||
|
Real Estate Investments
|
Private Equity
|
Real Estate Investments
|
Private Equity
|
||||||||||||
|
(in thousands)
|
|||||||||||||||
|
Beginning balance
|
$
|
37,039
|
|
$
|
26,129
|
|
$
|
34,989
|
|
$
|
26,053
|
|
|||
|
Actual return on investments:
|
|||||||||||||||
|
Related to investments held at year end
|
3,357
|
|
376
|
|
1,918
|
|
44
|
|
|||||||
|
Related to investments sold during the year
|
1,310
|
|
2,282
|
|
132
|
|
1,396
|
|
|||||||
|
Total return on investments
|
4,667
|
|
2,658
|
|
2,050
|
|
1,440
|
|
|||||||
|
Purchases, sales, and settlements
|
2,433
|
|
(3,586
|
)
|
—
|
|
(1,364
|
)
|
|||||||
|
Ending balance
|
$
|
44,139
|
|
$
|
25,201
|
|
$
|
37,039
|
|
$
|
26,129
|
|
|||
II-327
NOTES (continued)
Gulf Power Company 2013 Annual Report
The fair values of other postretirement benefit plan assets as of
December 31, 2013
and
2012
are presented below. These fair value measurements exclude cash, receivables related to investment income, pending investments sales, and payables related to pending investment purchases. Assets that are considered special situations investments, primarily real estate investments and private equities, are presented in the tables below based on the nature of the investment.
|
Fair Value Measurements Using
|
|||||||||||||||
|
Quoted Prices in Active Markets for Identical Assets
|
Significant Other Observable Inputs
|
Significant Unobservable Inputs
|
|||||||||||||
|
As of December 31, 2013:
|
(Level 1)
|
(Level 2)
|
(Level 3)
|
Total
|
|||||||||||
|
(in thousands)
|
|||||||||||||||
|
Assets:
|
|||||||||||||||
|
Domestic equity*
|
$
|
2,778
|
|
$
|
1,628
|
|
$
|
—
|
|
$
|
4,406
|
|
|||
|
International equity*
|
2,136
|
|
1,973
|
|
—
|
|
4,109
|
|
|||||||
|
Fixed income:
|
|||||||||||||||
|
U.S. Treasury, government, and agency bonds
|
—
|
|
1,161
|
|
—
|
|
1,161
|
|
|||||||
|
Mortgage- and asset-backed securities
|
—
|
|
303
|
|
—
|
|
303
|
|
|||||||
|
Corporate bonds
|
—
|
|
1,897
|
|
—
|
|
1,897
|
|
|||||||
|
Pooled funds
|
—
|
|
1,417
|
|
—
|
|
1,417
|
|
|||||||
|
Cash equivalents and other
|
1
|
|
433
|
|
—
|
|
434
|
|
|||||||
|
Real estate investments
|
504
|
|
—
|
|
1,939
|
|
2,443
|
|
|||||||
|
Private equity
|
—
|
|
—
|
|
1,108
|
|
1,108
|
|
|||||||
|
Total
|
$
|
5,419
|
|
$
|
8,812
|
|
$
|
3,047
|
|
$
|
17,278
|
|
|||
|
Liabilities:
|
|||||||||||||||
|
Derivatives
|
—
|
|
(5
|
)
|
—
|
|
(5
|
)
|
|||||||
|
Total
|
$
|
5,419
|
|
$
|
8,807
|
|
$
|
3,047
|
|
$
|
17,273
|
|
|||
|
*
|
Level 1 securities consist of actively traded stocks while Level 2 securities consist of pooled funds. Management believes that the portfolio is well-diversified with no significant concentrations of risk.
|
II-328
NOTES (continued)
Gulf Power Company 2013 Annual Report
|
Fair Value Measurements Using
|
|||||||||||||||
|
Quoted Prices in Active Markets for Identical Assets
|
Significant Other Observable Inputs
|
Significant Unobservable Inputs
|
|||||||||||||
|
As of December 31, 2012:
|
(Level 1)
|
(Level 2)
|
(Level 3)
|
Total
|
|||||||||||
|
(in thousands)
|
|||||||||||||||
|
Assets:
|
|||||||||||||||
|
Domestic equity*
|
$
|
2,290
|
|
$
|
1,319
|
|
$
|
—
|
|
$
|
3,609
|
|
|||
|
International equity*
|
1,795
|
|
1,928
|
|
—
|
|
3,723
|
|
|||||||
|
Fixed income:
|
|||||||||||||||
|
U.S. Treasury, government, and agency bonds
|
—
|
|
1,016
|
|
—
|
|
1,016
|
|
|||||||
|
Mortgage- and asset-backed securities
|
—
|
|
250
|
|
—
|
|
250
|
|
|||||||
|
Corporate bonds
|
—
|
|
1,722
|
|
6
|
|
1,728
|
|
|||||||
|
Pooled funds
|
—
|
|
1,298
|
|
—
|
|
1,298
|
|
|||||||
|
Cash equivalents and other
|
9
|
|
1,078
|
|
—
|
|
1,087
|
|
|||||||
|
Real estate investments
|
508
|
|
—
|
|
1,667
|
|
2,175
|
|
|||||||
|
Private equity
|
—
|
|
15
|
|
1,155
|
|
1,170
|
|
|||||||
|
Total
|
$
|
4,602
|
|
$
|
8,626
|
|
$
|
2,828
|
|
$
|
16,056
|
|
|||
|
*
|
Level 1 securities consist of actively traded stocks while Level 2 securities consist of pooled funds. Management believes that the portfolio is well-diversified with no significant concentrations of risk.
|
Changes in the fair value measurement of the Level 3 items in the other postretirement benefit plan assets valued using significant unobservable inputs for the years ended
December 31, 2013
and
2012
were as follows:
|
2013
|
2012
|
||||||||||||||
|
Real Estate
Investments
|
Private
Equity
|
Real Estate
Investments
|
Private
Equity
|
||||||||||||
|
(in thousands)
|
|||||||||||||||
|
Beginning balance
|
$
|
1,667
|
|
$
|
1,155
|
|
$
|
1,657
|
|
$
|
1,232
|
|
|||
|
Actual return on investments:
|
|||||||||||||||
|
Related to investments held at year end
|
108
|
|
16
|
|
107
|
|
(1
|
)
|
|||||||
|
Related to investments sold during the year
|
57
|
|
104
|
|
6
|
|
80
|
|
|||||||
|
Total return on investments
|
165
|
|
120
|
|
113
|
|
79
|
|
|||||||
|
Purchases, sales, and settlements
|
107
|
|
(167
|
)
|
(103
|
)
|
(156
|
)
|
|||||||
|
Ending balance
|
$
|
1,939
|
|
$
|
1,108
|
|
$
|
1,667
|
|
$
|
1,155
|
|
|||
Employee Savings Plan
The Company also sponsors a 401(k) defined contribution plan covering substantially all employees. The Company provides an
85%
matching contribution on up to
6%
of an employee's base salary. Total matching contributions made to the plan for
2013
,
2012
, and
2011
were
$4.1 million
,
$4.0 million
, and
$3.7 million
, respectively.
3. CONTINGENCIES AND REGULATORY MATTERS
General Litigation Matters
The Company is subject to certain claims and legal actions arising in the ordinary course of business. In addition, the Company's business activities are subject to extensive governmental regulation related to public health and the environment, such as regulation of air emissions and water discharges. Litigation over environmental issues and claims of various types, including property damage, personal injury, common law nuisance, and citizen enforcement of environmental requirements such as air quality and water standards, has increased generally throughout the U.S. In particular, personal injury, property damage, and other claims for damages
II-329
NOTES (continued)
Gulf Power Company 2013 Annual Report
alleged to have been caused by carbon dioxide and other emissions, coal combustion residuals, and alleged exposure to hazardous materials, and/or requests for injunctive relief in connection with such matters, have become more frequent. The ultimate outcome of such pending or potential litigation against the Company cannot be predicted at this time; however, for current proceedings not specifically reported herein, management does not anticipate that the ultimate liabilities, if any, arising from such current proceedings would have a material effect on the Company's financial statements.
Environmental Matters
New Source Review Actions
As part of a nationwide enforcement initiative against the electric utility industry which began in 1999, the EPA brought civil enforcement actions in federal district court against Georgia Power alleging violations of the New Source Review (NSR) provisions of the Clean Air Act at certain coal-fired electric generating units, including a unit co-owned by the Company. These civil actions seek penalties and injunctive relief, including orders requiring installation of the best available control technologies at the affected units. These actions were filed concurrently with the issuance of notices of violation of the NSR provisions to the Company with respect to the Company's Plant Crist. The case against Georgia Power (including claims related to a unit co-owned by the Company) has been administratively closed in the U.S. District Court for the Northern District of Georgia since 2001.
The Company believes it complied with applicable laws and regulations in effect at the time the work in question took place. The Clean Air Act authorizes maximum civil penalties of
$25,000
to
$37,500
per day, per violation, depending on the date of the alleged violation. An adverse outcome could require substantial capital expenditures that cannot be determined at this time and could possibly require payment of substantial penalties. Such expenditures could affect future results of operations, cash flows, and financial condition if such costs are not recovered through regulated rates. The ultimate outcome of this matter cannot be determined at this time.
Environmental Remediation
The Company must comply with environmental laws and regulations that cover the handling and disposal of waste and releases of hazardous substances. Under these various laws and regulations, the Company may also incur substantial costs to clean up properties. The Company received authority from the Florida PSC to recover approved environmental compliance costs through the environmental cost recovery clause. The Florida PSC reviews costs and adjusts rates up or down annually.
The Company recognizes a liability for environmental remediation costs only when it determines a loss is probable. At
December 31, 2013
, the Company's environmental remediation liability included estimated costs of environmental remediation projects of approximately
$50.4 million
. For
2013
, approximately
$3.1 million
was included in under recovered regulatory clause revenues and other current liabilities, and approximately
$47.3 million
was included in other regulatory assets, deferred and other deferred credits and liabilities. These estimated costs relate to site closure criteria by the Florida Department of Environmental Protection (FDEP) for potential impacts to soil and groundwater from herbicide applications at the Company's substations. The schedule for completion of the remediation projects will be subject to FDEP approval. The projects have been approved by the Florida PSC for recovery through the Company's environmental cost recovery clause; therefore, there was no impact on net income as a result of these liabilities.
The final outcome of these matters cannot be determined at this time. However, based on the currently known conditions at these sites and the nature and extent of activities relating to these sites, the Company does not believe that additional liabilities, if any, at these sites would be material to the Company's financial statements.
Retail Regulatory Matters
The Company's rates and charges for service to retail customers are subject to the regulatory oversight of the Florida PSC. The Company's rates are a combination of base rates and several separate cost recovery clauses for specific categories of costs. These separate cost recovery clauses address such items as fuel and purchased energy costs, purchased power capacity costs, energy conservation and demand side management programs, and the costs of compliance with environmental laws and regulations. Costs not addressed through one of the specific cost recovery clauses are recovered through the Company's base rates.
Retail Base Rate Case
On December 3, 2013, the Florida PSC voted to approve the Settlement Agreement among the Company and all of the intervenors to the docketed proceeding with respect to the Company's request to increase retail base rates. Under the terms of the Settlement Agreement, the Company (1) increased base rates designed to produce an additional
$35 million
in annual revenues effective January 2014 and will increase base rates designed to produce an additional
$20 million
in annual revenues effective January 2015; (2) continued its current authorized retail return on equity (ROE) midpoint and range; and (3) will accrue a return similar to AFUDC on
II-330
NOTES (continued)
Gulf Power Company 2013 Annual Report
certain transmission system upgrades that go into service after January 2014 until the next retail rate case or January 1, 2017, whichever comes first.
The Settlement Agreement also includes a self-executing adjustment mechanism that will increase the authorized ROE midpoint and range by 25 basis points in the event the
30
-year treasury yield rate increases by an average of at least 75 basis points above
3.7947%
for a consecutive
six
-month period.
The Settlement Agreement also provides that the Company may reduce depreciation expense and record a regulatory asset that will be included as an offset to the other cost of removal regulatory liability in an amount up to
$62.5 million
between January 2014 and June 2017. In any given month, such depreciation expense reduction may not exceed the amount necessary for the ROE, as reported to the Florida PSC monthly, to reach the midpoint of the authorized ROE range then in effect. Recovery of the regulatory asset will occur over a period to be determined by the Florida PSC in the Company’s next base rate case or next depreciation and dismantlement study proceeding, whichever comes first.
The Settlement Agreement also provides for recovery of costs associated with any tropical systems named by the National Hurricane Center through the initiation of a storm surcharge. The storm surcharge will begin, on an interim basis,
60
days following the filing of a cost recovery petition. The storm surcharge generally may not exceed
$4.00
/
1,000
KWHs on monthly residential bills in aggregate for a calendar year. This limitation does not apply if the Company incurs in excess of
$100 million
in storm recovery costs that qualify for recovery in a given calendar year. This threshold amount is inclusive of the amount necessary to replenish the storm reserve to the level that existed as of
December 31, 2013
.
Pursuant to the Settlement Agreement, the Company may not request an increase in its retail base rates to be effective until after June 2017, unless the Company's actual retail ROE falls below the authorized ROE range.
Cost Recovery Clauses
On November 4, 2013, the Florida PSC approved the Company's annual request for its fuel, purchased power capacity, environmental, and energy conservation cost recovery factors for 2014. The net effect of the approved changes is a
$65.2 million
increase in annual revenue for 2014.
Revenues for all cost recovery clauses, as recorded on the financial statements, are adjusted for differences in actual recoverable costs and amounts billed in current regulated rates. Accordingly, changes in the billing factor for fuel and purchased power will have no significant effect on the Company's revenues or net income, but will affect annual cash flow. The recovery provisions for environmental compliance and energy conservation include related expenses and a return on net average investment.
Fuel Cost Recovery
The Company has established fuel cost recovery rates as approved by the Florida PSC. If, at any time during the year, the projected year-end fuel cost over or under recovery balance exceeds
10%
of the projected fuel revenue applicable for the period, the Company is required to notify the Florida PSC and indicate if an adjustment to the fuel cost recovery factor is being requested.
The change in the fuel cost over recovered balance to an under recovered balance during 2013 was primarily due to higher than expected fuel costs and purchased power energy expenses, partially offset by approximately
$26.6 million
received during 2013 as a result of a payment from one of the Company's fuel vendors pursuant to the resolution of a coal contract dispute. At
December 31, 2013
, the under recovered fuel balance was approximately
$21.0 million
, which is included in under recovered regulatory clause revenues in the balance sheets. At
December 31, 2012
, the over recovered fuel balance was approximately
$17.1 million
, which is included in other regulatory liabilities, current in the balance sheets.
Purchased Power Capacity Recovery
The Company has established purchased power capacity recovery cost rates as approved by the Florida PSC. If the projected year-end purchased power capacity cost over or under recovery balance exceeds
10%
of the projected purchased power capacity revenue applicable for the period, the Company is required to notify the Florida PSC and indicate if an adjustment to the purchased power capacity cost recovery factor is being requested.
At
December 31, 2013
and
2012
, the under recovered purchased power capacity balance was approximately
$2.8 million
and
$0.8 million
, respectively, which is included in under recovered regulatory clause revenues in the balance sheets.
Environmental Cost Recovery
The Florida Legislature adopted legislation for an environmental cost recovery clause, which allows an electric utility to petition the Florida PSC for recovery of prudent environmental compliance costs that are not being recovered through base rates or any other recovery mechanism. Such environmental costs include operations and maintenance expenses, emissions allowance expense,
II-331
NOTES (continued)
Gulf Power Company 2013 Annual Report
depreciation, and a return on net average investment. This legislation also allows recovery of costs incurred as a result of an agreement between the Company and the FDEP for the purpose of ensuring compliance with ozone ambient air quality standards adopted by the EPA.
In 2007, the Florida PSC voted to approve a stipulation among the Company, the Office of Public Counsel, and the Florida Industrial Power Users Group regarding the Company's plan for complying with certain federal and state regulations addressing air quality. The Company's environmental compliance plan as filed in 2007 contemplated implementation of specific projects identified in the plan from 2007 through 2018. The stipulation covers all elements of the original plan that were committed for implementation at the time of the stipulation. The Florida PSC's approval of the stipulation also required the Company to file annual updates to the plan and outlined a process for approval of additional elements in the plan when they became committed projects. In the 2010 update filing, the Company identified several elements of the updated plan that the Company had decided to implement. Following the process outlined in the original approved stipulation, these additional projects were approved by the Florida PSC later in 2010. The Florida PSC acknowledged that the costs of the approved projects associated with the Company's Clean Air Interstate Rule and Clean Air Visibility Rule compliance plans are eligible for recovery through the environmental cost recovery clause.
Annually, the Company seeks recovery of projected costs including any true-up amounts from prior periods. At
December 31, 2013
and
2012
, the under recovered environmental balance was approximately
$14.4 million
and
$1.9 million
, respectively, which is included in under recovered regulatory clause revenues in the balance sheets.
In April 2012, the Mississippi PSC approved Mississippi Power's request for a certificate of public convenience and necessity to construct a flue gas desulfurization system (scrubber) on Plant Daniel Units 1 and 2. In May 2012, the Sierra Club filed a notice of appeal of the order with the Chancery Court of Harrison County, Mississippi. These units are jointly owned by Mississippi Power and the Company, with
50%
ownership each. The estimated total cost of the project is approximately
$660 million
, with the Company's portion being
$330 million
, excluding AFUDC, and it is scheduled for completion in December 2015. The Company's portion of the cost is expected to be recovered through the environmental cost recovery clause. The ultimate outcome of this matter cannot be determined at this time.
Energy Conservation Cost Recovery
Every
five
years, the Florida PSC establishes new numeric conservation goals covering a
10
-year period for utilities to reduce annual energy and seasonal peak demand using demand-side management (DSM) programs. After the goals are established, utilities develop plans and programs to meet the approved goals. The costs for these programs are recovered through rates established annually in the energy conservation cost recovery (ECCR) clause.
The most recent goal setting process established new DSM goals for the period 2010 through 2019. The new goals are significantly higher than the goals established in the previous
five
-year cycle due to a change in the cost-effectiveness test on which the Florida PSC relies to set the goals. The DSM program standards were approved in April 2011. The Company implemented several new programs in June 2011, and the costs related to these programs were reflected in the 2012 and 2013 ECCR factors approved by the Florida PSC. Higher cost recovery rates and achievement of the new DSM goals may result in reduced sales of electricity which could negatively impact results of operations, cash flows, and financial condition if base rates cannot be adjusted on a timely basis.
At
December 31, 2013
and
2012
, the under recovered energy conservation balance was approximately
$7.0 million
and
$0.8 million
, respectively, which is included in under recovered regulatory clause revenues in the balance sheets.
4. JOINT OWNERSHIP AGREEMENTS
The Company and Mississippi Power jointly own Plant Daniel Units 1 and 2, which together represent capacity of
1,000
MWs. Plant Daniel is a generating plant located in Jackson County, Mississippi. In accordance with the operating agreement, Mississippi Power acts as the Company's agent with respect to the construction, operation, and maintenance of these units.
The Company and Georgia Power jointly own the
818
MWs capacity Plant Scherer Unit 3. Plant Scherer is a generating plant located near Forsyth, Georgia. In accordance with the operating agreement, Georgia Power acts as the Company's agent with respect to the construction, operation, and maintenance of the unit.
II-332
NOTES (continued)
Gulf Power Company 2013 Annual Report
At
December 31, 2013
, the Company's percentage ownership and investment in these jointly-owned facilities were as follows:
|
Plant Scherer
Unit 3 (coal)
|
Plant Daniel Units 1 & 2 (coal)
|
||||||
|
(in thousands)
|
|||||||
|
Plant in service
|
$
|
382,374
|
|
(a)
|
$
|
282,370
|
|
|
Accumulated depreciation
|
123,862
|
|
|
172,365
|
|
||
|
Construction work in progress
|
6,303
|
|
|
169,085
|
|
||
|
Company Ownership
|
25
|
%
|
50
|
%
|
|||
|
(a)
|
Includes net plant acquisition adjustment of
$2.0 million
.
|
The Company's proportionate share of its plant operating expenses is included in the corresponding operating expenses in the statements of income and the Company is responsible for providing its own financing.
5. INCOME TAXES
On behalf of the Company, Southern Company files a consolidated federal income tax return and combined state income tax returns for the States of Alabama, Georgia, and Mississippi. In addition, the Company files a separate company income tax return for the State of Florida. Under a joint consolidated income tax allocation agreement, each Southern Company subsidiary's current and deferred tax expense is computed on a stand-alone basis and no subsidiary is allocated more current expense than would be paid if it filed a separate income tax return. In accordance with Internal Revenue Service (IRS) regulations, each company is jointly and severally liable for the federal tax liability.
Current and Deferred Income Taxes
Details of income tax provisions are as follows:
|
2013
|
2012
|
2011
|
|||||||||
|
(in thousands)
|
|||||||||||
|
Federal -
|
|||||||||||
|
Current
|
$
|
5,009
|
|
$
|
(92,610
|
)
|
$
|
(1,548
|
)
|
||
|
Deferred
|
63,134
|
|
161,096
|
|
56,087
|
|
|||||
|
68,143
|
|
68,486
|
|
54,539
|
|
||||||
|
State -
|
|||||||||||
|
Current
|
(2,410
|
)
|
(2,484
|
)
|
(412
|
)
|
|||||
|
Deferred
|
13,935
|
|
13,209
|
|
7,141
|
|
|||||
|
11,525
|
|
10,725
|
|
6,729
|
|
||||||
|
Total
|
$
|
79,668
|
|
$
|
79,211
|
|
$
|
61,268
|
|
||
II-333
NOTES (continued)
Gulf Power Company 2013 Annual Report
The tax effects of temporary differences between the carrying amounts of assets and liabilities in the financial statements and their respective tax bases, which give rise to deferred tax assets and liabilities, are as follows:
|
2013
|
2012
|
||||||
|
(in thousands)
|
|||||||
|
Deferred tax liabilities-
|
|||||||
|
Accelerated depreciation
|
$
|
721,087
|
|
$
|
696,502
|
|
|
|
Property basis differences
|
45,960
|
|
—
|
|
|||
|
Fuel recovery clause
|
7,972
|
|
—
|
|
|||
|
Pension and other employee benefits
|
25,800
|
|
28,579
|
|
|||
|
Regulatory assets associated with employee benefit obligations
|
27,660
|
|
57,279
|
|
|||
|
Regulatory assets associated with asset retirement obligations
|
6,554
|
|
6,502
|
|
|||
|
Other
|
23,947
|
|
16,019
|
|
|||
|
Total
|
858,980
|
|
804,881
|
|
|||
|
Deferred tax assets-
|
|||||||
|
Federal effect of state deferred taxes
|
24,277
|
|
20,656
|
|
|||
|
Postretirement benefits
|
17,816
|
|
17,905
|
|
|||
|
Fuel recovery clause
|
—
|
|
6,922
|
|
|||
|
Pension and other employee benefits
|
33,015
|
|
61,939
|
|
|||
|
Other basis differences
|
—
|
|
23,549
|
|
|||
|
Property reserve
|
15,144
|
|
13,773
|
|
|||
|
Other comprehensive loss
|
696
|
|
993
|
|
|||
|
Asset retirement obligations
|
6,554
|
|
6,502
|
|
|||
|
Alternative minimum tax carryforward
|
18,420
|
|
938
|
|
|||
|
Other
|
17,084
|
|
4,724
|
|
|||
|
Total
|
133,006
|
|
157,901
|
|
|||
|
Net deferred tax liabilities
|
725,974
|
|
646,980
|
|
|||
|
Portion included in current assets (liabilities), net
|
8,381
|
|
1,972
|
|
|||
|
Accumulated deferred income taxes
|
$
|
734,355
|
|
$
|
648,952
|
|
|
At
December 31, 2013
, the tax-related regulatory assets to be recovered from customers were
$50.9 million
. These assets are primarily attributable to tax benefits that flowed through to customers in prior years, to deferred taxes previously recognized at rates lower than the current enacted tax law, and to taxes applicable to capitalized interest.
At
December 31, 2013
, the tax-related regulatory liabilities to be credited to customers were
$5.2 million
. These liabilities are primarily attributable to deferred taxes previously recognized at rates higher than the current enacted tax law and to unamortized ITCs.
In accordance with regulatory requirements, deferred ITCs are amortized over the life of the related property with such amortization normally applied as a credit to reduce depreciation in the statements of income. Credits amortized in this manner amounted to
$1.4 million
in
2013
,
$1.4 million
in
2012
, and
$1.3 million
in
2011
. At
December 31, 2013
, all ITCs available to reduce federal income taxes payable had been utilized.
In 2010, the Tax Relief, Unemployment Insurance Reauthorization, and Job Creation Act of 2010 (Tax Relief Act) was signed into law. Major tax incentives in the Tax Relief Act include
100%
bonus depreciation for property placed in service after September 8, 2010 and through 2011 (and for certain long-term production-period projects placed in service in 2012) and
50%
bonus depreciation for property placed in service in 2012 (and for certain long-term production-period projects placed in service in 2013).
On January 2, 2013, the American Taxpayer Relief Act of 2012 (ATRA) was signed into law. The ATRA retroactively extended several tax credits through 2013 and extended
50%
bonus depreciation for property placed in service in 2013 (and for certain long-term production-period projects to be placed in service in 2014).
II-334
NOTES (continued)
Gulf Power Company 2013 Annual Report
The application of the bonus depreciation provisions in these laws significantly increased deferred tax liabilities related to accelerated depreciation in 2013, 2012, and 2011.
Effective Tax Rate
A reconciliation of the federal statutory income tax rate to the effective income tax rate is as follows:
|
2013
|
2012
|
2011
|
||||||
|
Federal statutory rate
|
35.0
|
%
|
35.0
|
%
|
35.0
|
%
|
||
|
State income tax, net of federal deduction
|
3.5
|
|
3.3
|
|
2.5
|
|
||
|
Non-deductible book depreciation
|
0.5
|
|
0.5
|
|
0.5
|
|
||
|
Differences in prior years' deferred and current tax rates
|
(0.2
|
)
|
(0.2
|
)
|
(0.3
|
)
|
||
|
AFUDC equity
|
(1.1
|
)
|
(0.9
|
)
|
(2.0
|
)
|
||
|
Other, net
|
(0.1
|
)
|
(0.2
|
)
|
(0.2
|
)
|
||
|
Effective income tax rate
|
37.6
|
%
|
37.5
|
%
|
35.5
|
%
|
||
The increase in the 2013 effective tax rate was not material. The increase in the 2012 effective tax rate is primarily the result of a decrease in AFUDC equity, which is not taxable, and a decrease in state tax credits.
Unrecognized Tax Benefits
Changes during the year in unrecognized tax benefits were as follows:
|
2013
|
2012
|
2011
|
|||||||||
|
(in thousands)
|
|||||||||||
|
Unrecognized tax benefits at beginning of year
|
$
|
5,007
|
|
$
|
2,892
|
|
$
|
3,870
|
|
||
|
Tax positions from current periods
|
45
|
|
2,630
|
|
540
|
|
|||||
|
Tax positions from prior periods
|
(5,007
|
)
|
515
|
|
(1,518
|
)
|
|||||
|
Reductions due to settlements
|
—
|
|
(1,030
|
)
|
—
|
|
|||||
|
Balance at end of year
|
$
|
45
|
|
$
|
5,007
|
|
$
|
2,892
|
|
||
The tax positions decrease from prior periods for 2013 relates primarily to the tax accounting method change for repairs-generation assets. See "Tax Method of Accounting for Repairs" herein for additional information.
The impact on the Company's effective tax rate, if recognized, was as follows:
|
2013
|
2012
|
2011
|
|||||||||
|
(in thousands)
|
|||||||||||
|
Tax positions impacting the effective tax rate
|
$
|
45
|
|
$
|
45
|
|
$
|
1,804
|
|
||
|
Tax positions not impacting the effective tax rate
|
—
|
|
4,962
|
|
1,088
|
|
|||||
|
Balance of unrecognized tax benefits
|
$
|
45
|
|
$
|
5,007
|
|
$
|
2,892
|
|
||
The tax positions impacting the effective tax rate for 2013 relate primarily to the research and development credit. These amounts are presented on a gross basis without considering the related federal or state income tax impact.
Accrued interest for unrecognized tax benefits was not material for years 2013, 2012, and 2011.
The Company classifies interest on tax uncertainties as interest expense. The Company did not accrue any penalties on uncertain tax positions.
It is reasonably possible that the amount of the unrecognized tax benefits could change within
12 months
. The settlement of federal and state audits could impact the balances significantly. At this time, an estimate of the range of reasonably possible outcomes cannot be determined.
The IRS has finalized its audits of Southern Company's consolidated federal income tax returns through 2011. Southern Company has filed its 2012 federal income tax return and has received a full acceptance letter from the IRS; however, the IRS has not finalized its audit. For tax years 2012 and 2013, Southern Company was a participant in the Compliance Assurance Process of the
II-335
NOTES (continued)
Gulf Power Company 2013 Annual Report
IRS. The audits for the Company's state income tax returns have either been concluded, or the statute of limitations has expired, for years prior to 2007.
Tax Method of Accounting for Repairs
In 2011, the IRS published regulations on the deduction and capitalization of expenditures related to tangible property that generally apply for tax years beginning on or after January 1, 2014. Additionally, on April 30, 2013, the IRS issued Revenue Procedure 2013-24, which provides guidance for taxpayers related to the deductibility of repair costs associated with generation assets. Based on a review of the regulations, Southern Company incorporated provisions related to repair costs for generation assets into its consolidated 2012 federal income tax return and reversed all related unrecognized tax positions. On September 19, 2013, the IRS issued Treasury Decision 9636, "Guidance Regarding Deduction and Capitalization of Expenditures Related to Tangible Property," which are final tangible property regulations applicable to taxable years beginning on or after January 1, 2014. Southern Company is currently reviewing this new guidance. The ultimate outcome of this matter cannot be determined at this time; however, these regulations are not expected to have a material impact on the Company's financial statements.
6. FINANCING
Securities Due Within One Year
Approximately
$75 million
will be required through December 31, 2014 to fund maturities of long-term debt.
Maturities from 2015 through 2018 applicable to total long-term debt are as follows:
$110 million
in 2016 and
$85 million
in 2017. There are no scheduled maturities in 2015 and 2018.
Senior Notes
At each of
December 31, 2013
and
2012
, the Company had a total of
$945 million
of senior notes outstanding. These senior notes are effectively subordinate to all secured debt of the Company, which totals approximately
$41 million
at
December 31, 2013
.
In June 2013, the Company issued
$90 million
aggregate principal amount of Series 2013A
5.00%
Senior Notes due June 15, 2043. The proceeds from the issuance of the Series 2013A Senior Notes, together with the proceeds from the sale of Preference Stock described below, were used to repay at maturity
$60 million
aggregate principal amount of the Company's Series G
4.35%
Senior Notes due July 15, 2013, to repay a portion of a
90
-day floating rate bank loan in an aggregate principal amount outstanding of
$125 million
, for a portion of the redemption in July 2013 of
$30 million
aggregate principal amount outstanding of the Company’s Series H
5.25%
Senior Notes due July 15, 2033, and for general corporate purposes, including the Company’s continuous construction program.
Pollution Control Revenue Bonds
Pollution control obligations represent loans to the Company from public authorities of funds derived from sales by such authorities of revenue bonds issued to finance pollution control and solid waste disposal facilities. The Company is required to make payments sufficient for the authorities to meet principal and interest requirements of such bonds. The amount of tax-exempt pollution control revenue bonds outstanding at
December 31, 2013
and
2012
was
$296 million
and
$309 million
, respectively.
The Company purchased and held
$42 million
aggregate principal amount of Development Authority of Monroe County (Georgia) Pollution Control Revenue Bonds (Gulf Power Company Plant Scherer Project), First Series 2002 (First Series 2002 Bonds) and
$21 million
aggregate principal amount of Development Authority of Monroe County (Georgia) Pollution Control Revenue Bonds (Gulf Power Company Plant Scherer Project), First Series 2010 (First Series 2010 Bonds) in May 2013 and June 2013, respectively. In June 2013, the Company reoffered the First Series 2002 Bonds and the First Series 2010 Bonds to the public.
In December 2013, the Company purchased and now holds
$13 million
aggregate principal amount of Mississippi Business Finance Corporation Solid Waste Disposal Facilities Revenue Refunding Bonds, Series 2012 (Gulf Power Company Project).
Outstanding Classes of Capital Stock
The Company currently has preferred stock, Class A preferred stock, preference stock, and common stock authorized. The Company's preferred stock and Class A preferred stock, without preference between classes, rank senior to the Company's preference stock and common stock with respect to payment of dividends and voluntary or involuntary dissolution. No shares of preferred stock or Class A preferred stock were outstanding at
December 31, 2013
. The Company's preference stock ranks senior to the common stock with respect to the payment of dividends and voluntary or involuntary dissolution. Certain series of the preference stock are subject to redemption at the option of the Company on or after a specified date (typically
five
or
10
years
II-336
NOTES (continued)
Gulf Power Company 2013 Annual Report
after the date of issuance) at a redemption price equal to
100%
of the liquidation amount of the preference stock. In addition, certain series of the preference stock may be redeemed earlier at a redemption price equal to
100%
of the liquidation amount plus a make-whole premium based on the present value of the liquidation amount and future dividends.
In February 2013, the Company issued
400,000
shares of common stock to Southern Company and realized proceeds of
$40 million
. The proceeds were used to repay a portion of the Company's short-term debt and for other general corporate purposes, including the Company's continuous construction program.
In June 2013, the Company issued
500,000
shares of Series 2013A
5.60%
Preference Stock and realized proceeds of
$50 million
. The proceeds from the sale of the Preference Stock, together with the proceeds from the issuance of Series 2013A Senior Notes, were used to repay at maturity
$60 million
aggregate principal amount of the Company's Series G
4.35%
Senior Notes due July 15, 2013, to repay a portion of a
90
-day floating rate bank loan in an aggregate principal amount outstanding of
$125 million
, for a portion of the redemption in July 2013 of
$30 million
aggregate principal amount outstanding of the Company’s Series H
5.25%
Senior Notes due July 15, 2033, and for general corporate purposes, including the Company’s continuous construction program.
Subsequent to
December 31, 2013
, the Company issued
500,000
shares of common stock to Southern Company and realized proceeds of
$50 million
. The proceeds were used to repay a portion of the Company's short-term debt and for other general corporate purposes, including the Company's continuous construction program.
Dividend Restrictions
The Company can only pay dividends to Southern Company out of retained earnings or paid-in-capital.
Assets Subject to Lien
The Company has granted a lien on its property at Plant Daniel in connection with the issuance of
two
series of pollution control revenue bonds with an outstanding principal amount of
$41 million
. There are no agreements or other arrangements among the Southern Company system companies under which the assets of one company have been pledged or otherwise made available to satisfy obligations of Southern Company or any of its subsidiaries.
Bank Credit Arrangements
At
December 31, 2013
, committed credit arrangements with banks were as follows:
|
Expires
(a)
|
Executable
Term-Loans
|
Due Within One Year
|
||||||||||||||||||||||||||||
|
2014
|
2016
|
Total
|
Unused
|
One
Year
|
Two
Years
|
Term Out
|
No Term Out
|
|||||||||||||||||||||||
|
(in millions)
|
||||||||||||||||||||||||||||||
|
$
|
110
|
|
$
|
165
|
|
$
|
275
|
|
$
|
275
|
|
$
|
45
|
|
$
|
—
|
|
$
|
45
|
|
$
|
65
|
|
|||||||
|
(a)
|
No credit arrangements expire in 2015, 2017, or 2018.
|
The Company expects to renew its credit arrangements, as needed, prior to expiration. Most of the
$275 million
of unused credit arrangements with banks provide liquidity support to the Company's variable rate pollution control revenue bonds and commercial paper borrowings. The amount of variable rate pollution control revenue bonds requiring liquidity support as of December 31, 2013 was
$69 million
and
$206 million
was available for liquidity support for the Company's commercial paper program and for other general corporate purposes. Most of the credit arrangements require payment of commitment fees based on the unused portion of the commitments. Commitment fees average
less than 1/4 of 1%
for the Company.
Most of those credit arrangements with banks contain covenants that limit the Company's debt level to
65%
of total capitalization, as defined in the arrangements. For purposes of these definitions, debt excludes certain hybrid securities. At
December 31, 2013
, the Company was in compliance with these covenants.
For short-term cash needs, the Company borrows primarily through a commercial paper program that has the liquidity support of the Company's committed bank credit arrangements. The Company may also borrow through various other arrangements with banks. Commercial paper and short-term bank loans are included in notes payable in the balance sheets.
II-337
NOTES (continued)
Gulf Power Company 2013 Annual Report
Details of commercial paper included in notes payable on the balance sheets were as follows:
|
Commercial Paper at the
End of the Period
(a)
|
|||||
|
Amount Outstanding
|
Weighted Average Interest Rate
|
||||
|
(in millions)
|
|||||
|
December 31, 2013:
|
|||||
|
$
|
136
|
|
0.2%
|
||
|
December 31, 2012:
|
|||||
|
$
|
124
|
|
0.3%
|
||
|
(a)
|
Excludes notes payable related to other energy service contracts of
$3.2 million
for the period ended December 31, 2012.
|
7. COMMITMENTS
Fuel and Purchased Power Agreements
To supply a portion of the fuel requirements of its generating plants, the Company has entered into various long-term commitments for the procurement and delivery of fossil fuel which are not recognized on the balance sheets. In 2013, 2012, and 2011, the Company incurred fuel expense of
$532.8 million
,
$544.9 million
, and
$662.3 million
, respectively, the majority of which was purchased under long-term commitments. The Company expects that a substantial amount of its future fuel needs will continue to be purchased under long-term commitments.
In addition, the Company has entered into various long-term commitments for the purchase of capacity, energy, and transmission, some of which are accounted for as operating leases. The energy-related costs associated with PPAs are recovered through the fuel cost recovery clause. The capacity and transmission-related costs associated with PPAs are recovered through the purchased power capacity cost recovery clause. Capacity expense under purchased power agreements accounted for as operating leases was
$21.3 million
,
$24.6 million
, and
$25.1 million
for 2013, 2012, and 2011, respectively.
Estimated total minimum long-term commitments at December 31, 2013 were as follows:
|
Operating Lease PPAs
|
|||
|
(in millions)
|
|||
|
2014
|
$
|
52.9
|
|
|
2015
|
78.6
|
|
|
|
2016
|
78.7
|
|
|
|
2017
|
78.8
|
|
|
|
2018
|
78.9
|
|
|
|
2019 and thereafter
|
349.2
|
|
|
|
Total
|
$
|
717.1
|
|
SCS may enter into various types of wholesale energy and natural gas contracts acting as an agent for the Company and all of the other Southern Company traditional operating companies and Southern Power. Under these agreements, each of the traditional operating companies and Southern Power may be jointly and severally liable. Accordingly, Southern Company has entered into keep-well agreements with the Company and each of the other traditional operating companies to ensure the Company will not subsidize or be responsible for any costs, losses, liabilities, or damages resulting from the inclusion of Southern Power as a contracting party under these agreements.
Operating Leases
The Company has operating lease agreements with various terms and expiration dates. Total rent expense was
$18.0 million
,
$20.1 million
, and
$21.9 million
for
2013
,
2012
, and
2011
, respectively.
Estimated total minimum lease payments under operating leases at December 31, 2013 were as follows:
II-338
NOTES (continued)
Gulf Power Company 2013 Annual Report
|
Minimum Lease Payments
|
|||||||||
|
Barges &
Railcars
|
Other
|
Total
|
|||||||
|
(in millions)
|
|||||||||
|
2014
|
$
|
13.3
|
|
$
|
0.2
|
|
$
|
13.5
|
|
|
2015
|
9.9
|
|
0.1
|
|
10.0
|
|
|||
|
2016
|
9.9
|
|
0.1
|
|
10.0
|
|
|||
|
2017
|
0.5
|
|
0.1
|
|
0.6
|
|
|||
|
Total
|
$
|
33.6
|
|
$
|
0.5
|
|
$
|
34.1
|
|
The Company and Mississippi Power jointly entered into operating lease agreements for aluminum railcars for the transportation of coal to Plant Daniel. The Company has the option to purchase the railcars at the greater of lease termination value or fair market value or to renew the leases at the end of each lease term. In early 2011, one operating lease expired and the Company elected not to exercise the option to purchase. The remaining operating lease has
229
aluminum railcars. The Company and Mississippi Power also have separate lease agreements for other railcars that do not include purchase options. The Company's share of the lease costs, charged to fuel inventory and recovered through the fuel cost recovery clause, was
$3.1 million
in
2013
,
$3.6 million
in
2012
, and
$2.6 million
in
2011
. The Company's annual railcar lease payments for 2014 through 2017 will average approximately
$1.4 million
. The Company has no lease payment obligations for the period 2018 and thereafter.
8. STOCK COMPENSATION
Stock Options
Southern Company provides non-qualified stock options through its Omnibus Incentive Compensation Plan to a large segment of the Company's employees ranging from line management to executives. As of
December 31, 2013
, there were
211
current and former employees of the Company participating in the stock option program, and there were
28 million
shares of Southern Company common stock remaining available for awards under the Omnibus Incentive Compensation Plan. The prices of options were at the fair market value of the shares on the dates of grant. These options become exercisable pro rata over a maximum period of
three years
from the date of grant. The Company generally recognizes stock option expense on a straight-line basis over the vesting period which equates to the requisite service period; however, for employees who are eligible for retirement, the total cost is expensed at the grant date. Options outstanding will expire no later than
10 years
after the date of grant, unless terminated earlier by the Southern Company Board of Directors in accordance with the Omnibus Incentive Compensation Plan. Stock options held by employees of a company undergoing a change in control vest upon the change in control.
The estimated fair values of stock options granted were derived using the Black-Scholes stock option pricing model. Expected volatility was based on historical volatility of Southern Company's stock over a period equal to the expected term.
Southern Company used historical exercise data to estimate the expected term that represents the period of time that options granted to employees are expected to be outstanding. The risk-free rate was based on the U.S. Treasury yield curve in effect at the time of grant that covers the expected term of the stock options.
The following table shows the assumptions used in the pricing model and the weighted average grant-date fair value of stock options granted:
|
Year Ended December 31
|
2013
|
2012
|
2011
|
||
|
Expected volatility
|
16.6%
|
17.7%
|
17.5%
|
||
|
Expected term
(in years)
|
5.0
|
5.0
|
5.0
|
||
|
Interest rate
|
0.9%
|
0.9%
|
2.3%
|
||
|
Dividend yield
|
4.4%
|
4.2%
|
4.8%
|
||
|
Weighted average grant-date fair value
|
$2.93
|
$3.39
|
$3.23
|
||
II-339
NOTES (continued)
Gulf Power Company 2013 Annual Report
The Company's activity in the stock option program for
2013
is summarized below:
|
Shares Subject
to Option
|
Weighted Average
Exercise Price
|
|||||
|
Outstanding at December 31, 2012
|
1,388,915
|
|
$
|
36.08
|
|
|
|
Granted
|
285,209
|
|
44.06
|
|
||
|
Exercised
|
(281,377
|
)
|
33.62
|
|
||
|
Cancelled
|
—
|
|
—
|
|
||
|
Outstanding at December 31, 2013
|
1,392,747
|
|
$
|
38.21
|
|
|
|
Exercisable at December 31, 2013
|
883,985
|
|
$
|
35.29
|
|
|
The number of stock options vested, and expected to vest in the future, as of
December 31, 2013
, was not significantly different from the number of stock options outstanding at
December 31, 2013
as stated above. As of
December 31, 2013
, the weighted average remaining contractual term for the options outstanding and options exercisable was approximately
six years
and
five years
, respectively, and the aggregate intrinsic value for the options outstanding and options exercisable was
$5.7 million
and
$5.5 million
, respectively.
As of
December 31, 2013
, there was
$0.4 million
of total unrecognized compensation cost related to stock option awards not yet vested. That cost is expected to be recognized over a weighted average period of approximately
11 months
.
For each of the years ended
December 31, 2013
,
2012
, and
2011
, total compensation cost for stock option awards recognized in income was
$0.7 million
, with the related tax benefit also recognized in income of
$0.3 million
.
The compensation cost and tax benefits related to the grant and exercise of Southern Company stock options to the Company's employees are recognized in the Company's financial statements with a corresponding credit to equity, representing a capital contribution from Southern Company.
The total intrinsic value of options exercised during the years ended
December 31, 2013
,
2012
, and
2011
was
$1.7 million
,
$3.8 million
, and
$3.2 million
, respectively. The actual tax benefit realized by the Company for the tax deductions from stock option exercises totaled
$0.6 million
,
$1.5 million
, and
$1.2 million
for the years ended
December 31, 2013
,
2012
, and
2011
, respectively.
Performance Shares
Southern Company provides performance share award units through its Omnibus Incentive Compensation Plan to a large segment of the Company's employees ranging from line management to executives. The performance share units granted under the plan vest at the end of a
three
-year performance period which equates to the requisite service period. Employees that retire prior to the end of the
three
-year period receive a pro rata number of shares, issued at the end of the performance period, based on actual months of service prior to retirement. The value of the award units is based on Southern Company's total shareholder return (TSR) over the
three
-year performance period which measures Southern Company's relative performance against a group of industry peers. The performance shares are delivered in common stock following the end of the performance period based on Southern Company's actual TSR and may range from
0%
to
200%
of the original target performance share amount.
The fair value of performance share awards is determined as of the grant date using a Monte Carlo simulation model to estimate the TSR of Southern Company's stock among the industry peers over the performance period. The Company recognizes compensation expense on a straight-line basis over the
three
-year performance period without remeasurement. Compensation expense for awards where the service condition is met is recognized regardless of the actual number of shares issued. The expected volatility was based on the historical volatility of Southern Company's stock over a period equal to the performance period. The risk-free rate was based on the U.S. Treasury yield curve in effect at the time of grant that covers the performance period of the award units.
The following table shows the assumptions used in the pricing model and the weighted average grant-date fair value of performance share award units granted:
II-340
NOTES (continued)
Gulf Power Company 2013 Annual Report
|
Year Ended December 31
|
2013
|
2012
|
2011
|
||
|
Expected volatility
|
12.0%
|
16.0%
|
19.2%
|
||
|
Expected term
(in years)
|
3.0
|
3.0
|
3.0
|
||
|
Interest rate
|
0.4%
|
0.4%
|
1.4%
|
||
|
Annualized dividend rate
|
$1.96
|
$1.89
|
$1.82
|
||
|
Weighted average grant-date fair value
|
$40.50
|
$41.99
|
$35.97
|
||
Total unvested performance share units outstanding as of
December 31, 2012
were
68,805
. During
2013
,
30,627
performance share units were granted,
25,102
performance share units were vested, and
1,740
performance share units were forfeited resulting in
72,590
unvested units outstanding at December 31, 2013. In January 2014, the vested performance share award units were converted into
7,476
shares outstanding at a share price of
$41.27
for the
three
-year performance and vesting period ended December 31, 2013.
For the years ended
December 31, 2013
,
2012
, and 2011, total compensation cost for performance share units recognized in income was
$1.0 million
,
$1.0 million
, and
$0.7 million
, respectively, with the related tax benefit also recognized in income of
$0.4 million
,
$0.4 million
, and
$0.3 million
, respectively. As of
December 31, 2013
, there was
$1.2 million
of total unrecognized compensation cost related to performance share award units that will be recognized over a weighted average period of approximately
11 months
.
9. FAIR VALUE MEASUREMENTS
Fair value measurements are based on inputs of observable and unobservable market data that a market participant would use in pricing the asset or liability. The use of observable inputs is maximized where available and the use of unobservable inputs is minimized for fair value measurement and reflects a three-tier fair value hierarchy that prioritizes inputs to valuation techniques used for fair value measurement.
|
•
|
Level 1 consists of observable market data in an active market for identical assets or liabilities.
|
|
•
|
Level 2 consists of observable market data, other than that included in Level 1, that is either directly or indirectly observable.
|
|
•
|
Level 3 consists of unobservable market data. The input may reflect the assumptions of the Company of what a market participant would use in pricing an asset or liability. If there is little available market data, then the Company's own assumptions are the best available information.
|
In the case of multiple inputs being used in a fair value measurement, the lowest level input that is significant to the fair value measurement represents the level in the fair value hierarchy in which the fair value measurement is reported.
As of
December 31, 2013
, assets and liabilities measured at fair value on a recurring basis during the period, together with the level of the fair value hierarchy in which they fall, were as follows:
|
Fair Value Measurements Using
|
|||||||||||||||
|
Quoted Prices in Active Markets for Identical Assets
|
Significant Other Observable Inputs
|
Significant Unobservable Inputs
|
|||||||||||||
|
As of December 31, 2013:
|
(Level 1)
|
(Level 2)
|
(Level 3)
|
Total
|
|||||||||||
|
(in thousands)
|
|||||||||||||||
|
Assets:
|
|||||||||||||||
|
Energy-related derivatives
|
$
|
—
|
|
$
|
6,962
|
|
$
|
—
|
|
$
|
6,962
|
|
|||
|
Cash equivalents
|
15,929
|
|
—
|
|
—
|
|
15,929
|
|
|||||||
|
Total
|
$
|
15,929
|
|
$
|
6,962
|
|
$
|
—
|
|
$
|
22,891
|
|
|||
|
Liabilities:
|
|||||||||||||||
|
Energy-related derivatives
|
$
|
—
|
|
$
|
17,043
|
|
$
|
—
|
|
$
|
17,043
|
|
|||
II-341
NOTES (continued)
Gulf Power Company 2013 Annual Report
As of
December 31, 2012
, assets and liabilities measured at fair value on a recurring basis during the period, together with the level of the fair value hierarchy in which they fall, were as follows:
|
Fair Value Measurements Using
|
|||||||||||||||
|
|
Quoted Prices in Active Markets for Identical Assets
|
Significant
Other
Observable
Inputs
|
Significant
Unobservable
Inputs
|
|
|||||||||||
|
As of December 31, 2012:
|
(Level 1)
|
(Level 2)
|
(Level 3)
|
Total
|
|||||||||||
|
|
(in thousands)
|
||||||||||||||
|
Assets:
|
|||||||||||||||
|
Energy-related derivatives
|
$
|
—
|
|
$
|
4,358
|
|
$
|
—
|
|
$
|
4,358
|
|
|||
|
Cash equivalents
|
15,231
|
|
—
|
|
—
|
|
15,231
|
|
|||||||
|
Total
|
$
|
15,231
|
|
$
|
4,358
|
|
$
|
—
|
|
$
|
19,589
|
|
|||
|
Liabilities:
|
|||||||||||||||
|
Energy-related derivatives
|
$
|
—
|
|
$
|
27,112
|
|
$
|
—
|
|
$
|
27,112
|
|
|||
Valuation Methodologies
The energy-related derivatives primarily consist of over-the-counter financial products for natural gas and physical power products including, from time to time, basis swaps. These are standard products used within the energy industry and are valued using the market approach. The inputs used are mainly from observable market sources, such as forward natural gas prices, power prices, implied volatility, and Overnight Index Swap interest rates. See Note 10 for additional information on how these derivatives are used.
As of
December 31, 2013
and
2012
, the fair value measurements of investments calculated at net asset value per share (or its equivalent), as well as the nature and risks of those investments, were as follows:
|
Fair Value
|
Unfunded
Commitments
|
Redemption
Frequency
|
Redemption
Notice Period
|
||||
|
As of December 31, 2013:
|
(in thousands)
|
|
|
|
|||
|
Cash equivalents:
|
|||||||
|
Money market funds
|
$15,929
|
None
|
Daily
|
Not applicable
|
|||
|
As of December 31, 2012:
|
|||||||
|
Cash equivalents:
|
|||||||
|
Money market funds
|
$15,231
|
None
|
Daily
|
Not applicable
|
|||
The money market funds are short-term investments of excess funds in various money market mutual funds, which are portfolios of short-term debt securities. The money market funds are regulated by the SEC and typically receive the highest rating from credit rating agencies. Regulatory and rating agency requirements for money market funds include minimum credit ratings and maximum maturities for individual securities and a maximum weighted average portfolio maturity. Redemptions are available on a same day basis up to the full amount of the Company's investment in the money market funds.
As of
December 31, 2013
and
2012
, other financial instruments for which the carrying amount did not equal fair value were as follows:
|
Carrying Amount
|
Fair Value
|
||||||
|
|
(in thousands)
|
||||||
|
Long-term debt:
|
|||||||
|
2013
|
$
|
1,233,163
|
|
$
|
1,261,889
|
|
|
|
2012
|
$
|
1,245,870
|
|
$
|
1,367,404
|
|
|
The fair values are determined using Level 2 measurements and are based on quoted market prices for the same or similar issues or on the current rates offered to the Company.
II-342
NOTES (continued)
Gulf Power Company 2013 Annual Report
10. DERIVATIVES
The Company is exposed to market risks, primarily commodity price risk and interest rate risk. To manage the volatility attributable to these exposures, the Company nets its exposures, where possible, to take advantage of natural offsets and may enter into various derivative transactions for the remaining exposures pursuant to the Company's policies in areas such as counterparty exposure and risk management practices. The Company's policy is that derivatives are to be used primarily for hedging purposes and mandates strict adherence to all applicable risk management policies. Derivative positions are monitored using techniques including, but not limited to, market valuation, value at risk, stress testing, and sensitivity analysis. Derivative instruments are recognized at fair value in the balance sheets as either assets or liabilities and are presented on a gross basis. In the statements of cash flows, the cash impacts of settled energy-related and interest rate derivatives are recorded as operating activities and the cash impacts of settled foreign currency derivatives are recorded as investing activities.
Energy-Related Derivatives
The Company enters into energy-related derivatives to hedge exposures to electricity, gas, and other fuel price changes. However, due to cost-based rate regulations and other various cost recovery mechanisms, the Company has limited exposure to market volatility in commodity fuel prices and prices of electricity. The Company manages fuel-hedging programs, implemented per the guidelines of the Florida PSC, through the use of financial derivative contracts, which is expected to continue to mitigate price volatility.
To mitigate residual risks relative to movements in electricity prices, the Company may enter into physical fixed-price contracts for the purchase and sale of electricity through the wholesale electricity market. To mitigate residual risks relative to movements in gas prices, the Company may enter into fixed-price contracts for natural gas purchases; however, a significant portion of contracts are priced at market.
Energy-related derivative contracts are accounted for in one of two methods:
|
•
|
Regulatory Hedges
— Energy-related derivative contracts which are designated as regulatory hedges relate primarily to the Company's fuel-hedging programs, where gains and losses are initially recorded as regulatory liabilities and assets, respectively, and then are included in fuel expense as the underlying fuel is used in operations and ultimately recovered through the fuel cost recovery clause.
|
|
•
|
Not Designated
— Gains and losses on energy-related derivative contracts that are not designated or fail to qualify as hedges are recognized in the statements of income as incurred.
|
Some energy-related derivative contracts require physical delivery as opposed to financial settlement, and this type of derivative is both common and prevalent within the electric industry. When an energy-related derivative contract is settled physically, any cumulative unrealized gain or loss is reversed and the contract price is recognized in the respective line item representing the actual price of the underlying goods being delivered.
At
December 31, 2013
, the net volume of energy-related derivative contracts for natural gas positions totaled
88.62 million
mmBtu (million British thermal units) for the Company, with the longest hedge date of
2018
over which it is hedging its exposure to the variability in future cash flows for forecasted transactions.
Interest Rate Derivatives
The Company may also enter into interest rate derivatives to hedge exposure to changes in interest rates. Derivatives related to existing variable rate securities or forecasted transactions are accounted for as cash flow hedges where the effective portion of the derivatives' fair value gains or losses is recorded in OCI and is reclassified into earnings at the same time the hedged transactions affect earnings. The derivatives employed as hedging instruments are structured to minimize ineffectiveness, which is recorded directly to earnings.
At
December 31, 2013
, there were no interest rate derivatives outstanding.
The estimated pre-tax losses that will be reclassified from accumulated OCI to interest expense for the 12-month period ending
December 31, 2014
are
$0.6 million
. The Company has deferred gains and losses that are expected to be amortized into earnings through 2020.
II-343
NOTES (continued)
Gulf Power Company 2013 Annual Report
Derivative Financial Statement Presentation and Amounts
At
December 31, 2013
and
2012
, the fair value of energy-related derivatives was reflected in the balance sheets as follows:
|
Asset Derivatives
|
Liability Derivatives
|
||||||||||||||||||
|
Derivative Category
|
Balance Sheet Location
|
2013
|
2012
|
Balance Sheet Location
|
2013
|
2012
|
|||||||||||||
|
(in thousands)
|
(in thousands)
|
||||||||||||||||||
|
Derivatives designated as hedging instruments for regulatory purposes
|
|||||||||||||||||||
|
Energy-related derivatives:
|
Other current assets
|
$
|
4,893
|
|
$
|
1,293
|
|
Liabilities from risk management activities
|
$
|
6,470
|
|
$
|
16,529
|
|
|||||
|
Other deferred charges and assets
|
2,069
|
|
3,065
|
|
Other deferred credits and liabilities
|
10,573
|
|
10,583
|
|
||||||||||
|
Total derivatives designated as hedging instruments for regulatory purposes
|
$
|
6,962
|
|
$
|
4,358
|
|
$
|
17,043
|
|
$
|
27,112
|
|
|||||||
All derivative instruments are measured at fair value. See Note 9 for additional information.
The derivative contracts of the Company are not subject to master netting arrangements or similar agreements and are reported gross on the Company's financial statements. Some of these energy-related derivative contracts contain certain provisions that permit intra-contract netting of derivative receivables and payables for routine billing and offsets related to events of default and settlements. Amounts related to energy-related derivative contracts at
December 31, 2013
and
2012
are presented in the following tables.
|
Fair Value
|
||||||||||||||||||
|
Assets
|
2013
|
|
2012
|
|
Liabilities
|
2013
|
|
2012
|
|
|||||||||
|
(in millions)
|
(in millions)
|
|||||||||||||||||
|
Energy-related derivatives presented in the Balance Sheet
(a)
|
$
|
7
|
|
$
|
4
|
|
Energy-related derivatives presented in the Balance Sheet
(a)
|
$
|
17
|
|
$
|
27
|
|
|||||
|
Gross amounts not offset in the Balance Sheet
(b)
|
(6
|
)
|
(4
|
)
|
Gross amounts not offset in the Balance Sheet
(b)
|
(6
|
)
|
(4
|
)
|
|||||||||
|
Net-energy related derivative assets
|
$
|
1
|
|
$
|
—
|
|
Net-energy related derivative liabilities
|
$
|
11
|
|
$
|
23
|
|
|||||
(a) The Company does not offset fair value amounts for multiple derivative instruments executed with the same counterparty on the balance sheets; therefore, gross and net amounts of derivative assets and liabilities presented on the balance sheets are the same.
(b) Includes gross amounts subject to netting terms that are not offset on the balance sheets and any cash/financial collateral pledged or received.
At
December 31, 2013
and
2012
, the pre-tax effects of unrealized derivative gains (losses) arising from energy-related derivative instruments designated as regulatory hedging instruments and deferred on the balance sheets were as follows:
|
Unrealized Losses
|
Unrealized Gains
|
||||||||||||||||||
|
Derivative Category
|
Balance Sheet
Location
|
2013
|
2012
|
Balance Sheet
Location
|
2013
|
2012
|
|||||||||||||
|
(in thousands)
|
(in thousands)
|
||||||||||||||||||
|
Energy-related derivatives:
|
Other regulatory assets, current
|
$
|
(6,470
|
)
|
$
|
(16,529
|
)
|
Other regulatory liabilities, current
|
$
|
4,893
|
|
$
|
1,293
|
|
|||||
|
Other regulatory assets, deferred
|
(10,573
|
)
|
(10,583
|
)
|
Other regulatory liabilities, deferred
|
2,069
|
|
3,065
|
|
||||||||||
|
Total energy-related derivative gains (losses)
|
$
|
(17,043
|
)
|
$
|
(27,112
|
)
|
$
|
6,962
|
|
$
|
4,358
|
|
|||||||
II-344
NOTES (continued)
Gulf Power Company 2013 Annual Report
For the years ended
December 31, 2013
,
2012
, and
2011
, the pre-tax effects of interest rate derivatives designated as cash flow hedging instruments on the statements of income were as follows:
|
Derivatives in Cash
Flow Hedging Relationships
|
Gain (Loss) Recognized in
OCI on Derivative
|
Gain (Loss) Reclassified from Accumulated
OCI into Income (Effective Portion)
|
|||||||||||||||||||||||
|
(Effective Portion)
|
Amount
|
||||||||||||||||||||||||
|
Derivative Category
|
2013
|
2012
|
2011
|
Statements of Income Location
|
2013
|
2012
|
2011
|
||||||||||||||||||
|
(in thousands)
|
(in thousands)
|
||||||||||||||||||||||||
|
Interest rate derivatives
|
$
|
—
|
|
$
|
—
|
|
$
|
—
|
|
Interest expense, net of amounts capitalized
|
$
|
(769
|
)
|
$
|
(933
|
)
|
$
|
(933
|
)
|
||||||
There was no material ineffectiveness recorded in earnings for any period presented.
For the years ended
December 31, 2013
,
2012
, and
2011
, the pre-tax effects of energy-related derivatives not designated as hedging instruments on the statements of income were not material.
Contingent Features
The Company does not have any credit arrangements that would require material changes in payment schedules or terminations as a result of a credit rating downgrade. There are certain derivatives that could require collateral, but not accelerated payment, in the event of various credit rating changes of certain affiliated companies. At
December 31, 2013
, the fair value of derivative liabilities with contingent features was
$3.7 million
.
At
December 31, 2013
, the Company had no collateral posted with its derivative counterparties; however, because of the joint and several liability features underlying these derivatives, the maximum potential collateral requirements arising from the credit-risk-related contingent features, at a rating below BBB- and/or Baa3, were
$8.8 million
. If collateral is required, fair value amounts recognized for the right to reclaim cash collateral or the obligation to return cash collateral are not offset against fair value amounts recognized for derivatives executed with the same counterparty.
Generally, collateral may be provided by a Southern Company guaranty, letter of credit, or cash. The Company participates in certain agreements that could require collateral in the event that one or more Southern Company system power pool participants has a credit rating change to below investment grade.
The Company is exposed to losses related to financial instruments in the event of counterparties' nonperformance. The Company only enters into agreements and material transactions with counterparties that have investment grade credit ratings by Moody's Investors Services, Inc. and Standard and Poor's Ratings Services, a division of The McGraw Hill Companies, Inc. or with counterparties who have posted collateral to cover potential credit exposure. The Company has also established risk management policies and controls to determine and monitor the creditworthiness of counterparties in order to mitigate the Company's exposure to counterparty credit risk. Therefore, the Company does not anticipate a material adverse effect on the financial statements as a result of counterparty nonperformance.
II-345
NOTES (continued)
Gulf Power Company 2013 Annual Report
11. QUARTERLY FINANCIAL INFORMATION (UNAUDITED)
Summarized quarterly financial information for
2013
and
2012
is as follows:
|
Quarter Ended
|
Operating
Revenues
|
Operating
Income
|
Net Income After Dividends on Preference Stock
|
||||||||
|
(in thousands)
|
|||||||||||
|
March 2013
|
$
|
326,274
|
|
$
|
51,640
|
|
$
|
21,792
|
|
||
|
June 2013
|
371,173
|
|
69,151
|
|
32,582
|
|
|||||
|
September 2013
|
399,361
|
|
87,776
|
|
44,754
|
|
|||||
|
December 2013
|
343,493
|
|
56,436
|
|
25,301
|
|
|||||
|
March 2012
|
$
|
316,245
|
|
$
|
49,098
|
|
$
|
20,666
|
|
||
|
June 2012
|
370,208
|
|
71,465
|
|
34,963
|
|
|||||
|
September 2012
|
421,819
|
|
93,813
|
|
47,754
|
|
|||||
|
December 2012
|
331,490
|
|
53,818
|
|
22,549
|
|
|||||
The Company's business is influenced by seasonal weather conditions.
II-346
SELECTED FINANCIAL AND OPERATING DATA
2009
-
2013
Gulf Power Company
2013
Annual Report
|
|
2013
|
|
2012
|
|
2011
|
|
2010
|
|
2009
|
|
|||||||||
|
Operating Revenues (
in thousands
)
|
$
|
1,440,301
|
|
$
|
1,439,762
|
|
$
|
1,519,812
|
|
$
|
1,590,209
|
|
$
|
1,302,229
|
|
||||
|
Net Income After Dividends
on Preference Stock (
in thousands
)
|
$
|
124,429
|
|
$
|
125,932
|
|
$
|
105,005
|
|
$
|
121,511
|
|
$
|
111,233
|
|
||||
|
Cash Dividends
on Common Stock (
in thousands
)
|
$
|
115,400
|
|
$
|
115,800
|
|
$
|
110,000
|
|
$
|
104,300
|
|
$
|
89,300
|
|
||||
|
Return on Average Common Equity (
percent
)
|
10.30
|
|
10.92
|
|
9.55
|
|
11.69
|
|
12.18
|
|
|||||||||
|
Total Assets (
in thousands
)
|
$
|
4,337,571
|
|
$
|
4,177,402
|
|
$
|
3,871,881
|
|
$
|
3,584,939
|
|
$
|
3,293,607
|
|
||||
|
Gross Property Additions (
in thousands
)
|
$
|
304,778
|
|
$
|
325,237
|
|
$
|
337,830
|
|
$
|
285,379
|
|
$
|
450,421
|
|
||||
|
Capitalization (
in thousands
):
|
|||||||||||||||||||
|
Common stock equity
|
$
|
1,235,126
|
|
$
|
1,180,742
|
|
$
|
1,124,948
|
|
$
|
1,075,036
|
|
$
|
1,004,292
|
|
||||
|
Preference stock
|
146,504
|
|
97,998
|
|
97,998
|
|
97,998
|
|
97,998
|
|
|||||||||
|
Long-term debt
|
1,158,163
|
|
1,185,870
|
|
1,235,447
|
|
1,114,398
|
|
978,914
|
|
|||||||||
|
Total (
excluding amounts due within one year
)
|
$
|
2,539,793
|
|
$
|
2,464,610
|
|
$
|
2,458,393
|
|
$
|
2,287,432
|
|
$
|
2,081,204
|
|
||||
|
Capitalization Ratios (
percent
):
|
|||||||||||||||||||
|
Common stock equity
|
48.6
|
|
47.9
|
|
45.8
|
|
47.0
|
|
48.3
|
|
|||||||||
|
Preference stock
|
5.8
|
|
4.0
|
|
4.0
|
|
4.3
|
|
4.7
|
|
|||||||||
|
Long-term debt
|
45.6
|
|
48.1
|
|
50.2
|
|
48.7
|
|
47.0
|
|
|||||||||
|
Total (
excluding amounts due within one year
)
|
100.0
|
|
100.0
|
|
100.0
|
|
100.0
|
|
100.0
|
|
|||||||||
|
Customers (
year-end
):
|
|||||||||||||||||||
|
Residential
|
383,980
|
|
379,922
|
|
378,248
|
|
376,561
|
|
374,091
|
|
|||||||||
|
Commercial
|
54,567
|
|
53,808
|
|
53,450
|
|
53,263
|
|
53,272
|
|
|||||||||
|
Industrial
|
260
|
|
264
|
|
273
|
|
272
|
|
279
|
|
|||||||||
|
Other
|
582
|
|
577
|
|
565
|
|
562
|
|
512
|
|
|||||||||
|
Total
|
439,389
|
|
434,571
|
|
432,536
|
|
430,658
|
|
428,154
|
|
|||||||||
|
Employees (
year-end
)
|
1,410
|
|
1,416
|
|
1,424
|
|
1,330
|
|
1,365
|
|
|||||||||
II-347
SELECTED FINANCIAL AND OPERATING DATA
2009
-
2013
(continued)
Gulf Power Company
2013
Annual Report
|
|
2013
|
|
2012
|
|
2011
|
|
2010
|
|
2009
|
|
|||||||||
|
Operating Revenues (
in thousands
):
|
|||||||||||||||||||
|
Residential
|
$
|
632,495
|
|
$
|
609,454
|
|
$
|
637,352
|
|
$
|
707,196
|
|
$
|
588,073
|
|
||||
|
Commercial
|
395,062
|
|
389,936
|
|
408,389
|
|
439,468
|
|
376,125
|
|
|||||||||
|
Industrial
|
138,585
|
|
140,490
|
|
158,367
|
|
157,591
|
|
138,164
|
|
|||||||||
|
Other
|
3,858
|
|
4,591
|
|
4,382
|
|
4,471
|
|
4,206
|
|
|||||||||
|
Total retail
|
1,170,000
|
|
1,144,471
|
|
1,208,490
|
|
1,308,726
|
|
1,106,568
|
|
|||||||||
|
Wholesale — non-affiliates
|
109,386
|
|
106,881
|
|
133,555
|
|
109,172
|
|
94,105
|
|
|||||||||
|
Wholesale — affiliates
|
99,577
|
|
123,636
|
|
111,346
|
|
110,051
|
|
32,095
|
|
|||||||||
|
Total revenues from sales of electricity
|
1,378,963
|
|
1,374,988
|
|
1,453,391
|
|
1,527,949
|
|
1,232,768
|
|
|||||||||
|
Other revenues
|
61,338
|
|
64,774
|
|
66,421
|
|
62,260
|
|
69,461
|
|
|||||||||
|
Total
|
$
|
1,440,301
|
|
$
|
1,439,762
|
|
$
|
1,519,812
|
|
$
|
1,590,209
|
|
$
|
1,302,229
|
|
||||
|
Kilowatt-Hour Sales (
in thousands
):
|
|||||||||||||||||||
|
Residential
|
5,088,828
|
|
5,053,724
|
|
5,304,769
|
|
5,651,274
|
|
5,254,491
|
|
|||||||||
|
Commercial
|
3,809,939
|
|
3,858,521
|
|
3,911,399
|
|
3,996,502
|
|
3,896,105
|
|
|||||||||
|
Industrial
|
1,700,174
|
|
1,725,121
|
|
1,798,688
|
|
1,685,817
|
|
1,727,106
|
|
|||||||||
|
Other
|
20,946
|
|
25,267
|
|
25,430
|
|
25,602
|
|
25,121
|
|
|||||||||
|
Total retail
|
10,619,887
|
|
10,662,633
|
|
11,040,286
|
|
11,359,195
|
|
10,902,823
|
|
|||||||||
|
Wholesale — non-affiliates
|
1,162,308
|
|
977,395
|
|
2,012,986
|
|
1,675,079
|
|
1,813,592
|
|
|||||||||
|
Wholesale — affiliates
|
3,127,350
|
|
4,369,964
|
|
2,607,873
|
|
2,436,883
|
|
870,470
|
|
|||||||||
|
Total
|
14,909,545
|
|
16,009,992
|
|
15,661,145
|
|
15,471,157
|
|
13,586,885
|
|
|||||||||
|
Average Revenue Per Kilowatt-Hour (
cents
):
|
|||||||||||||||||||
|
Residential
|
12.43
|
|
12.06
|
|
12.01
|
|
12.51
|
|
11.19
|
|
|||||||||
|
Commercial
|
10.37
|
|
10.11
|
|
10.44
|
|
11.00
|
|
9.65
|
|
|||||||||
|
Industrial
|
8.15
|
|
8.14
|
|
8.80
|
|
9.35
|
|
8.00
|
|
|||||||||
|
Total retail
|
11.02
|
|
10.73
|
|
10.95
|
|
11.52
|
|
10.15
|
|
|||||||||
|
Wholesale
|
4.87
|
|
4.31
|
|
5.30
|
|
5.33
|
|
4.70
|
|
|||||||||
|
Total sales
|
9.25
|
|
8.59
|
|
9.28
|
|
9.88
|
|
9.07
|
|
|||||||||
|
Residential Average Annual
|
|||||||||||||||||||
|
Kilowatt-Hour Use Per Customer
|
13,301
|
|
13,303
|
|
14,028
|
|
15,036
|
|
14,049
|
|
|||||||||
|
Residential Average Annual
|
|||||||||||||||||||
|
Revenue Per Customer
|
$
|
1,653
|
|
$
|
1,604
|
|
$
|
1,685
|
|
$
|
1,882
|
|
$
|
1,572
|
|
||||
|
Plant Nameplate Capacity
|
|||||||||||||||||||
|
Ratings (
year-end
) (
megawatts
)
|
2,663
|
|
2,663
|
|
2,663
|
|
2,663
|
|
2,659
|
|
|||||||||
|
Maximum Peak-Hour Demand
(megawatts)
:
|
|||||||||||||||||||
|
Winter
|
1,729
|
|
2,130
|
|
2,485
|
|
2,544
|
|
2,310
|
|
|||||||||
|
Summer
|
2,356
|
|
2,344
|
|
2,527
|
|
2,519
|
|
2,538
|
|
|||||||||
|
Annual Load Factor (
percent
)
|
55.9
|
|
56.3
|
|
54.5
|
|
56.1
|
|
53.8
|
|
|||||||||
|
Plant Availability Fossil-Steam (
percent
)*
|
92.8
|
|
82.5
|
|
84.7
|
|
94.7
|
|
89.7
|
|
|||||||||
|
Source of Energy Supply (
percent
):
|
|||||||||||||||||||
|
Coal
|
36.4
|
|
34.6
|
|
49.4
|
|
64.6
|
|
61.7
|
|
|||||||||
|
Gas
|
23.0
|
|
23.5
|
|
24.0
|
|
17.8
|
|
28.0
|
|
|||||||||
|
Purchased power —
|
|||||||||||||||||||
|
From non-affiliates
|
37.0
|
|
40.2
|
|
22.3
|
|
13.2
|
|
2.2
|
|
|||||||||
|
From affiliates
|
3.6
|
|
1.7
|
|
4.3
|
|
4.4
|
|
8.1
|
|
|||||||||
|
Total
|
100.0
|
|
100.0
|
|
100.0
|
|
100.0
|
|
100.0
|
|
|||||||||
|
*
|
Beginning in 2012, plant availability is calculated as a weighted equivalent availability.
|
II-348
MISSISSIPPI POWER COMPANY
FINANCIAL SECTION
II-349
MANAGEMENT'S REPORT ON INTERNAL CONTROL OVER FINANCIAL REPORTING
Mississippi Power Company
2013
Annual Report
The management of Mississippi Power Company (the Company) is responsible for establishing and maintaining an adequate system of internal control over financial reporting as required by the Sarbanes-Oxley Act of 2002 and as defined in Exchange Act Rule 13a-15(f). A control system can provide only reasonable, not absolute, assurance that the objectives of the control system are met.
Under management's supervision, an evaluation of the design and effectiveness of the Company's internal control over financial reporting was conducted based on the framework in
Internal Control—Integrated Framework (1992)
issued by the Committee of Sponsoring Organizations of the Treadway Commission. Based on this evaluation, management concluded that the Company's internal control over financial reporting was effective as of
December 31, 2013
.
/s/ G. Edison Holland, Jr.
G. Edison Holland, Jr.
President and Chief Executive Officer
/s/ Moses H. Feagin
Moses H. Feagin
Vice President, Chief Financial Officer, and Treasurer
February 27, 2014
II-350
REPORT OF INDEPENDENT REGISTERED PUBLIC ACCOUNTING FIRM
To the Board of Directors of
Mississippi Power Company
We have audited the accompanying balance sheets and statements of capitalization of Mississippi Power Company (the Company) (a wholly owned subsidiary of The Southern Company) as of
December 31, 2013
and
2012
, and the related statements of income, comprehensive income, common stockholder's equity, and cash flows for each of the three years in the period ended
December 31, 2013
. These financial statements are the responsibility of the Company's management. Our responsibility is to express an opinion on these financial statements based on our audits.
We conducted our audits in accordance with the standards of the Public Company Accounting Oversight Board (United States). Those standards require that we plan and perform the audit to obtain reasonable assurance about whether the financial statements are free of material misstatement. The Company is not required to have, nor were we engaged to perform, an audit of its internal control over financial reporting. Our audits included consideration of internal control over financial reporting as a basis for designing audit procedures that are appropriate in the circumstances, but not for the purpose of expressing an opinion on the effectiveness of the Company's internal control over financial reporting. Accordingly, we express no such opinion. An audit also includes examining, on a test basis, evidence supporting the amounts and disclosures in the financial statements, assessing the accounting principles used and significant estimates made by management, as well as evaluating the overall financial statement presentation. We believe that our audits provide a reasonable basis for our opinion.
In our opinion, such financial statement
s (pages II-383 to II-432) pr
esent fairly, in all material respects, the financial position of Mississippi Power Company as of
December 31, 2013
and
2012
, and the results of its operations and its cash flows for each of the three years in the period ended
December 31, 2013
, in conformity with accounting principles generally accepted in the United States of America.
/s/ Deloitte & Touche LLP
Atlanta, Georgia
February 27, 2014
II-351
MANAGEMENT'S DISCUSSION AND ANALYSIS OF FINANCIAL CONDITION AND RESULTS OF OPERATIONS
Mississippi Power Company 2013 Annual Report
OVERVIEW
Business Activities
Mississippi Power Company (the Company) operates as a vertically integrated utility providing electricity to retail customers within its traditional service territory located within the State of Mississippi and to wholesale customers in the Southeast.
Many factors affect the opportunities, challenges, and risks of the Company's business of selling electricity. These factors include the Company's ability to maintain a constructive regulatory environment, to maintain and grow energy sales given economic conditions, and to effectively manage and secure timely recovery of prudently-incurred costs. These costs include those related to projected long-term demand growth, increasingly stringent environmental standards, reliability, fuel, capital expenditures, and restoration following major storms and related to the successful completion of ongoing construction projects, primarily the new integrated coal gasification combined cycle electric generating plant located in Kemper County, Mississippi (Kemper IGCC). Appropriately balancing required costs and capital expenditures with customer prices will continue to challenge the Company for the foreseeable future.
The Company's retail base rates are set under the Performance Evaluation Plan (PEP), a rate plan approved by the Mississippi Public Service Commission (PSC). PEP was designed with the objective to reduce the impact of rate changes on customers and provide incentives for the Company to keep customer prices low and customer satisfaction and reliability high.
In 2010, the Mississippi PSC issued a certificate of public convenience and necessity (CPCN) authorizing the acquisition, construction, and operation of the Kemper IGCC, which is scheduled to be placed into service in the fourth quarter 2014. The certificated cost estimate of the Kemper IGCC established by the Mississippi PSC was $2.4 billion with a construction cost cap of $2.88 billion, net of $245.3 million of grants awarded to the project by the U.S. Department of Energy (DOE) under the Clean Coal Power Initiative Round 2 (DOE Grants) and excluding the cost of the lignite mine and equipment, the cost of the carbon dioxide (CO
2
) pipeline facilities, allowance for funds used during construction (AFUDC), and certain general exceptions, including change of law, force majeure, and beneficial capital (which exists when the Company demonstrates that the purpose and effect of the construction cost increase is to produce efficiencies that will result in a neutral or favorable effect on customers relative to the original proposal for the CPCN) (Cost Cap Exceptions). The Company’s current cost estimate for the Kemper IGCC in total is approximately $5.04 billion, which includes approximately $4.06 billion of costs subject to the construction cost cap. The Company does not intend to seek any rate recovery or joint owner contributions for any related costs that exceed the $2.88 billion cost cap, net of the DOE Grants and excluding the Cost Cap Exceptions. As a result, the Company recorded pre-tax charges to income for revisions to the cost estimate of $78.0 million ($48.2 million after tax) and $1.10 billion ($680.5 million after tax) in 2012 and 2013, respectively.
On January 24, 2013, the Company entered into a settlement agreement (Settlement Agreement) with the Mississippi PSC that, among other things, establishes the process for resolving matters regarding cost recovery related to the Kemper IGCC. Consistent with the terms of the Settlement Agreement, on March 5, 2013, the Mississippi PSC issued an order (2013 MPSC Rate Order) approving retail rate increases of 15% effective March 19, 2013 and 3% effective January 1, 2014, which collectively were designed to collect $156 million annually beginning in 2014. Amounts collected through these rates are being recorded as a regulatory liability to be used to mitigate customer rate impacts after the Kemper IGCC is placed in service. Also consistent with the Settlement Agreement, the Company has filed with the Mississippi PSC a rate recovery plan for the Kemper IGCC for the first seven years of its operation, along with a proposed revenue requirement under such plan for 2014 through 2020 (Seven-Year Rate Plan). The Seven-Year Rate Plan would include recovery of prudently-incurred Kemper IGCC costs up to the $2.4 billion certificated cost estimate, plus certain exceptions, but excluding AFUDC, and any other costs permitted or determined to be excluded from the construction cost cap by the Mississippi PSC.
Legislation to authorize a multi-year rate plan and legislation to provide for alternate financing through securitization was enacted into law on February 26, 2013. The Company intends to securitize (1) prudently-incurred costs in excess of the certificated cost estimate and up to the $2.88 billion cost cap, net of the DOE Grants and excluding the Cost Cap Exceptions, (2) accrued AFUDC, and (3) other prudently-incurred costs as approved by the Mississippi PSC. The Company expects to request recovery of the annual costs of securitization after the Kemper IGCC is placed in service and following completion of the Mississippi PSC's final prudence review of costs for the Kemper IGCC. The Mississippi PSC's prudence review of Kemper IGCC costs incurred through March 31, 2013, as provided for in the Settlement Agreement, is expected to occur in the second quarter 2014. A final review of all costs incurred after March 31, 2013 is expected to be completed within six months of the Kemper IGCC’s in-service date. See
II-352
MANAGEMENT'S DISCUSSION AND ANALYSIS (continued)
Mississippi Power Company 2013 Annual Report
Note 3 to the financial statements under "Integrated Coal Gasification Combined Cycle" for additional information, including the discussion of risks related to the Kemper IGCC.
Key Performance Indicators
The Company continues to focus on several key performance indicators, including the construction of the Kemper IGCC. These indicators are used to measure the Company's performance for customers and employees.
In recognition that the Company's long-term financial success is dependent upon how well it satisfies its customers' needs, the Company's retail base rate mechanism, PEP, includes performance indicators that directly tie customer service indicators to the Company's allowed return. PEP measures the Company's performance on a 10-point scale as a weighted average of results in three areas: average customer price, as compared to prices of other regional utilities (weighted at 40%); service reliability, measured in percentage of time customers had electric service (40%); and customer satisfaction, measured in a survey of residential customers (20%). See Note 3 to the financial statements under "Retail Regulatory Matters – Performance Evaluation Plan" for more information on PEP.
In addition to the PEP performance indicators, the Company focuses on other performance measures, including broader measures of customer satisfaction, plant availability, system reliability, and net income after dividends on preferred stock. The Company's financial success is directly tied to customer satisfaction. Key elements of ensuring customer satisfaction include outstanding service, high reliability, and competitive prices. Management uses customer satisfaction surveys and reliability indicators to evaluate the Company's results.
Peak season equivalent forced outage rate (Peak Season EFOR) is an indicator of fossil plant availability and efficient generation fleet operations during the months when generation needs are greatest. The rate is calculated by dividing the number of hours of forced outages by total generation hours. The 2013 fossil Peak Season EFOR was better than the target. Transmission and distribution system reliability performance is measured by the frequency and duration of outages. Performance targets for reliability are set internally based on historical performance. The 2013 performance was better than the target for these reliability measures.
Net income (loss) after dividends on preferred stock is the primary measure of the Company's financial performance. The Company was below target for 2013 net income after dividends on preferred stock primarily due to revisions to the cost estimate for the Kemper IGCC that exceeded the $2.88 billion cost cap and lower retail and wholesale base revenue, partially offset by lower operations and maintenance expenses and higher AFUDC related to the construction of the Kemper IGCC, which began in 2010. See FUTURE EARNINGS POTENTIAL – "PSC Matters – Performance Evaluation Plan" and FUTURE EARNINGS POTENTIAL – "Integrated Coal Gasification Combined Cycle" herein for additional information.
The Company's 2013 results compared with its targets for some of these key indicators are reflected in the following chart:
|
Key Performance Indicator
|
2013 Target
Performance
|
2013 Actual
Performance
|
||
|
Customer Satisfaction
|
Top quartile in customer surveys
|
Top quartile
|
||
|
Peak Season EFOR
|
5.86% or less
|
0.84%
|
||
|
Net income (loss) after dividends on preferred stock
|
$206.8 million
|
$(476.6) million
|
||
|
Estimated loss on Kemper IGCC
|
$680.5 million
|
|||
|
Net income (loss), excluding estimated loss on Kemper IGCC*
|
$203.9 million
|
|||
*Does not reflect income (loss) as calculated in accordance with generally accepted accounting principles (GAAP). The Company's management uses the non-GAAP measure of income (loss) to evaluate the performance of the Company's ongoing business activities. The Company's management believes the presentation of this non-GAAP measure of income (loss) is useful for investors because it provides earnings information that is consistent with the historical and ongoing business activities of the Company. The presentation of this information is not meant to be considered a substitute for financial measures prepared in accordance with GAAP.
See RESULTS OF OPERATIONS herein for additional information on the Company's financial performance.
Earnings
The Company's net income (loss) after dividends on preferred stock was ($476.6) million in 2013 compared to $99.9 million in 2012. The decrease in 2013 was primarily the result of $1.1 billion in pre-tax charges ($680.5 million after-tax) for revisions of estimated costs expected to be incurred on the Company’s construction of the Kemper IGCC above the $2.88 billion cost cap established by the Mississippi PSC, net of the DOE Grants and excluding the Cost Cap Exceptions. These charges were partially offset by an increase in AFUDC equity primarily related to the construction of the Kemper IGCC which began in 2010 and an
II-353
MANAGEMENT'S DISCUSSION AND ANALYSIS (continued)
Mississippi Power Company 2013 Annual Report
increase in revenues primarily due to retail and wholesale base rate increases and a retail rate increase related to the Kemper IGCC cost recovery that became effective in April 2013. See Note 3 to the financial statements under "Integrated Coal Gasification Combined Cycle" for additional information regarding the Kemper IGCC.
The Company's net income (loss) after dividends on preferred stock was $99.9 million in 2012 compared to $94.2 million in 2011. The 6.1% increase in 2012 was primarily the result of an increase in AFUDC equity related to the construction of the Kemper IGCC, a decrease in operations and maintenance expenses, and an increase in territorial base revenues primarily due to a wholesale base rate increase effective April 1, 2012. This increase in net income after dividends on preferred stock was largely offset by a $78.0 million pre-tax charge ($48.2 million after-tax) for a revision of estimated costs expected to be incurred on the Company’s construction of the Kemper IGCC above the $2.88 billion cost cap established by the Mississippi PSC, net of the DOE Grants and excluding the Cost Cap Exceptions.
RESULTS OF OPERATIONS
A condensed statement of operations follows:
|
Amount
|
Increase (Decrease)
from Prior Year
|
||||||||||
|
2013
|
2013
|
2012
|
|||||||||
|
(in millions)
|
|||||||||||
|
Operating revenues
|
$
|
1,145.2
|
|
$
|
109.2
|
|
$
|
(76.9
|
)
|
||
|
Fuel
|
491.3
|
|
80.0
|
|
(79.2
|
)
|
|||||
|
Purchased power
|
48.3
|
|
(6.8
|
)
|
(16.7
|
)
|
|||||
|
Other operations and maintenance
|
253.3
|
|
24.7
|
|
(37.7
|
)
|
|||||
|
Depreciation and amortization
|
91.4
|
|
4.9
|
|
6.2
|
|
|||||
|
Taxes other than income taxes
|
80.7
|
|
1.2
|
|
9.3
|
|
|||||
|
Estimated loss on Kemper IGCC
|
1,102.0
|
|
1,024.0
|
|
78.0
|
|
|||||
|
Total operating expenses
|
2,067.0
|
|
1,128.0
|
|
(40.1
|
)
|
|||||
|
Operating income
|
(921.8
|
)
|
(1,018.8
|
)
|
(36.8
|
)
|
|||||
|
Allowance for equity funds used during construction
|
121.6
|
|
56.8
|
|
40.1
|
|
|||||
|
Interest income
|
0.2
|
|
(0.6
|
)
|
(0.6
|
)
|
|||||
|
Interest expense, net of amounts capitalized
|
36.5
|
|
(4.4
|
)
|
19.1
|
|
|||||
|
Other income (expense), net
|
(6.2
|
)
|
(6.7
|
)
|
0.5
|
|
|||||
|
Income taxes (benefit)
|
(367.8
|
)
|
(388.4
|
)
|
(21.6
|
)
|
|||||
|
Net income (loss)
|
(474.9
|
)
|
(576.5
|
)
|
5.7
|
|
|||||
|
Dividends on preferred stock
|
1.7
|
|
—
|
|
—
|
|
|||||
|
Net income (loss) after dividends on preferred stock
|
$
|
(476.6
|
)
|
$
|
(576.5
|
)
|
$
|
5.7
|
|
||
II-354
MANAGEMENT'S DISCUSSION AND ANALYSIS (continued)
Mississippi Power Company 2013 Annual Report
Operating Revenues
Operating revenues for 2013 were $1.1 billion, reflecting a $109.2 million increase from 2012. Details of operating revenues were as follows:
|
Amount
|
|||||||
|
2013
|
2012
|
||||||
|
(in millions)
|
|||||||
|
Retail — prior year
|
$
|
747.5
|
|
$
|
792.5
|
|
|
|
Estimated change resulting from —
|
|||||||
|
Rates and pricing
|
18.2
|
|
(2.0
|
)
|
|||
|
Sales growth (decline)
|
(0.7
|
)
|
9.0
|
|
|||
|
Weather
|
1.2
|
|
(9.8
|
)
|
|||
|
Fuel and other cost recovery
|
32.9
|
|
(42.2
|
)
|
|||
|
Retail — current year
|
799.1
|
|
747.5
|
|
|||
|
Wholesale revenues —
|
|||||||
|
Non-affiliates
|
293.9
|
|
255.5
|
|
|||
|
Affiliates
|
34.8
|
|
16.4
|
|
|||
|
Total wholesale revenues
|
328.7
|
|
271.9
|
|
|||
|
Other operating revenues
|
17.4
|
|
16.6
|
|
|||
|
Total operating revenues
|
$
|
1,145.2
|
|
$
|
1,036.0
|
|
|
|
Percent change
|
10.5
|
%
|
(6.9
|
)%
|
|||
Total retail revenues for 2013 increased 6.9% compared to 2012 primarily as a result of a base rate increase, a rate increase related to Kemper IGCC cost recovery that became effective in April 2013, and higher fuel cost recovery revenues in 2013 compared to 2012. Total retail revenues for 2012 decreased 5.7% compared to 2011 primarily as a result of lower energy sales primarily due to milder weather and lower fuel cost recovery revenues in 2012 compared to 2011. See "Energy Sales" below for a discussion of changes in the volume of energy sold, including changes related to sales growth (decline) and weather.
Electric rates for the Company include provisions to adjust billings for fluctuations in fuel costs, including the energy component of purchased power costs. Under these provisions, fuel revenues generally equal fuel expenses, including the energy component of purchased power costs, and do not affect net income. See FUTURE EARNINGS POTENTIAL – "PSC Matters – Fuel Cost Recovery" herein for additional information. Fuel and other cost recovery revenues increased in 2013 compared to 2012 primarily as a result of higher recoverable fuel costs, partially offset by a decrease in revenues related to ad valorem taxes.
Fuel and other cost recovery revenues decreased in 2012 compared to 2011 primarily as a result of lower recoverable fuel costs, partially offset by an increase in revenues related to ad valorem taxes. Recoverable fuel costs include fuel and purchased power expenses reduced by the fuel portion of wholesale revenues from energy sold to customers outside the Company's service territory.
Wholesale revenues from sales to non-affiliates will vary depending on fuel prices, the market prices of wholesale energy compared to the cost of the Company's and the Southern Company system's generation, demand for energy within the Southern Company system's service territory, and the availability of the Southern Company system's generation. Increases and decreases in revenues that are driven by fuel prices are accompanied by an increase or decrease in fuel costs and do not have a significant impact on net income. The Company serves long-term contracts with rural electric cooperatives association and municipalities located in southeastern Mississippi under cost-based electric tariffs which are subject to regulation by the FERC. The contracts with these wholesale customers represented 22.2% of the Company’s total operating revenues in 2013 and are largely subject to rolling 10-year cancellation notices.
Wholesale revenues from sales to non-affiliates increased $38.4 million, or 15.0%, in 2013 compared to 2012 as a result of a $20.5 million increase in base revenues primarily resulting from a wholesale base rate increase effective April 1, 2013 and a $17.8 million increase in energy revenues, of which $14.0 million was associated with higher fuel prices and $3.8 million was associated with an increase in kilowatt-hour (KWH) sales. Wholesale revenues from sales to non-affiliates decreased $17.6 million, or 6.5%, in 2012 compared to 2011 as a result of a $31.0 million decrease in energy revenues, of which $23.2 million was
II-355
MANAGEMENT'S DISCUSSION AND ANALYSIS (continued)
Mississippi Power Company 2013 Annual Report
associated with lower fuel prices and $7.8 million was associated with a decrease in KWH sales, partially offset by a wholesale base rate increase effective April 1, 2012.
Short-term opportunity energy sales are also included in sales for resale to non-affiliates. These opportunity sales are made at market-based rates that generally provide a margin above the Company's variable cost to produce the energy.
Wholesale revenues from sales to affiliates will vary depending on demand and the availability and cost of generating resources at each company. These affiliate sales are made in accordance with the Intercompany Interchange Contract (IIC), as approved by the Federal Energy Regulatory Commission (FERC). These transactions do not have a significant impact on earnings since this energy is generally sold at marginal cost.
Wholesale revenues from sales to affiliates increased $18.4 million in 2013 compared to 2012 due to a $1.3 million increase in capacity revenues and a $17.1 million increase in energy revenues of which $7.2 million was associated with higher prices and $9.9 million was associated with an increase in KWH sales. Wholesale revenues from sales to affiliates decreased $14.0 million in 2012 compared to 2011 primarily due to a $1.6 million decrease in capacity revenues and a $12.4 million decrease in energy revenues of which $9.1 million was associated with lower prices and $3.3 million was associated with a decrease in KWH sales.
Other operating revenues in 2013 increased $0.8 million, or 4.8%, from 2012 primarily due to a $0.5 million increase in transmission revenues and a $0.3 million increase in miscellaneous revenue from timber and easement sale proceeds. Other operating revenues in 2012 decreased $0.2 million, or 1.4%, from 2011 primarily due to a $1.0 million decrease in rent from electric property, partially offset by a $0.9 million increase in transmission revenues.
Energy Sales
Changes in revenues are influenced heavily by the change in the volume of energy sold from year to year. KWH sales for 2013 and percent change by year were as follows:
|
Total
KWHs
|
Total KWH
Percent Change
|
Weather-Adjusted
Percent Change
|
||||||||||||
|
2013
|
2013
|
2012
|
2013
|
2012
|
||||||||||
|
(in millions)
|
|
|
|
|
||||||||||
|
Residential
|
2,088
|
|
2.0
|
%
|
(5.4
|
)%
|
—
|
%
|
2.3
|
%
|
||||
|
Commercial
|
2,865
|
|
(1.7
|
)
|
1.6
|
|
(1.1
|
)
|
1.7
|
|
||||
|
Industrial
|
4,739
|
|
0.8
|
|
2.5
|
|
0.8
|
|
2.5
|
|
||||
|
Other
|
40
|
|
4.0
|
|
(0.2
|
)
|
4.0
|
|
(0.2
|
)
|
||||
|
Total retail
|
9,732
|
|
0.3
|
|
0.5
|
|
0.1
|
%
|
2.2
|
%
|
||||
|
Wholesale
|
||||||||||||||
|
Non-affiliated
|
3,929
|
|
2.9
|
|
(4.8
|
)
|
||||||||
|
Affiliated
|
931
|
|
62.8
|
|
(11.8
|
)
|
||||||||
|
Total wholesale
|
4,860
|
|
10.7
|
|
(5.7
|
)
|
||||||||
|
Total energy sales
|
14,592
|
|
3.5
|
%
|
(1.6
|
)%
|
||||||||
Changes in retail energy sales are comprised of changes in electricity usage by customers, changes in weather, and changes in the number of customers.
Residential energy sales increased 2.0% in 2013 compared to 2012 due to less mild weather and a slight increase in the number of residential customers in 2013 compared to 2012. Residential energy sales decreased 5.4% in 2012 compared to 2011 due to milder than normal weather, partially offset by a slight increase in the number of residential customers in 2012 compared to 2011.
Commercial energy sales decreased 1.7% in 2013 compared to 2012 due to decreased economic activity in 2013 compared to 2012. Commercial energy sales increased 1.6% in 2012 compared to 2011 due to increased economic activity in 2012 compared to 2011.
Industrial energy sales increased 0.8% in 2013 compared to 2012 due to increased usage by larger industrial customers as well as expansions of some existing customers. Industrial energy sales increased 2.5% in 2012 compared to 2011 due to increased production for many of the industrial customers resulting from increased economic activity as well as expansions of some existing customers.
II-356
MANAGEMENT'S DISCUSSION AND ANALYSIS (continued)
Mississippi Power Company 2013 Annual Report
Wholesale energy sales to non-affiliates increased 2.9% in 2013 compared to 2012 primarily due to increased KWH sales to rural electric cooperative associations and municipalities located in southeastern Mississippi resulting from less mild weather in 2013 compared to 2012. Wholesale energy sales to non-affiliates decreased 4.8% in 2012 compared to 2011 primarily due to decreased KWH sales to rural electric cooperative associations and municipalities located in southeastern Mississippi resulting from milder weather in 2012 compared to 2011.
Wholesale sales to non-affiliates will vary depending on fuel prices, the market prices of wholesale energy compared to the cost of the Company and the Southern Company system's generation, demand for energy within the Southern Company system's service territory, and the availability of the Southern Company system's generation.
Wholesale energy sales to affiliates increased 62.8% in 2013 compared to 2012 primarily due to an increase in the Company's generation, resulting in more energy available to sell to affiliate companies. Wholesale energy sales to affiliates decreased 11.8% in 2012 compared to 2011 primarily due to a decrease in the Company's generation, resulting in less energy available to sell to affiliate companies.
Fuel and Purchased Power Expenses
Fuel costs constitute the single largest expense for the Company. The mix of fuel sources for generation of electricity is determined primarily by demand, the unit cost of fuel consumed, and the availability of generating units. Additionally, the Company purchases a portion of its electricity needs from the wholesale market.
Details of the Company's generation and purchased power were as follows:
|
2013
|
2012
|
2011
|
||||||
|
Total generation
(millions of KWHs)
|
13,721
|
|
12,750
|
|
12,986
|
|
||
|
Total purchased power
(millions of KWHs)
|
1,559
|
|
1,961
|
|
2,055
|
|
||
|
Sources of generation
(percent)
–
|
||||||||
|
Coal
|
36
|
|
26
|
|
40
|
|
||
|
Gas
|
64
|
|
74
|
|
60
|
|
||
|
Cost of fuel, generated
(cents per net KWH)
–
|
||||||||
|
Coal
|
4.97
|
|
5.09
|
|
4.39
|
|
||
|
Gas
|
3.16
|
|
2.90
|
|
3.88
|
|
||
|
Average cost of fuel, generated
(cents per net KWH)
|
3.87
|
|
3.53
|
|
4.10
|
|
||
|
Average cost of purchased power
(cents per net KWH)
|
3.10
|
|
2.81
|
|
3.49
|
|
||
Fuel and purchased power expenses were $539.6 million in 2013, an increase of $73.2 million, or 15.7%, above the prior year costs. The increase was primarily due to a $55.1 million increase in the total volume of KWHs generated and purchased and an $18.1 million increase in the cost of fuel and purchased power. Fuel and purchased power expenses were $466.4 million in 2012, a decrease of $95.9 million, or 17.1%, below the prior year costs. The decrease was primarily due to a $70.5 million decrease in the cost of fuel and purchased power and a $25.4 million decrease related to lower total KWHs generated and purchased.
Fuel and purchased power energy transactions do not have a significant impact on earnings, since energy expenses are generally offset by energy revenues through the Company's fuel cost recovery clause. See FUTURE EARNINGS POTENTIAL – "PSC Matters – Fuel Cost Recovery" and Note 1 to the financial statements under "Fuel Costs" for additional information.
Fuel
Fuel expense increased $80.0 million, or 19.5%, in 2013 compared to 2012. The increase was the result of a 9.6% increase in the average cost of fuel per KWH generated and a 9.0% increase in the volume of KWHs generated resulting from increased non-territorial sales in 2013 compared to 2012. Fuel expense decreased $79.2 million, or 16.1%, in 2012 compared to 2011. The decrease was the result of a 13.9% decrease in the average cost of fuel per KWH generated and a 2.6% decrease in the volume of KWHs generated resulting from decreased non-territorial sales in 2012 as compared to 2011.
Purchased Power - Non-Affiliates
Purchased power expense from non-affiliates increased $0.5 million, or 10.2%, in 2013 compared to 2012. The increase was the result of an 8.0% increase in the average cost per KWH purchased and a 2.0% increase in the volume of KWHs purchased. The increase in the average cost per KWH purchased was due to a higher marginal cost of fuel. The increase in the volume of KWHs
II-357
MANAGEMENT'S DISCUSSION AND ANALYSIS (continued)
Mississippi Power Company 2013 Annual Report
purchased was due to a lower market cost of available energy compared to the cost of generation. Purchased power expense from non-affiliates decreased $1.0 million, or 16.3%, in 2012 compared to 2011. The decrease was primarily the result of a 41.2% decrease in the average cost per KWH purchased, partially offset by a 42.3% increase in the volume of KWHs purchased. The decrease in the average cost per KWH purchased was due to a lower marginal cost of fuel. The increase in the volume of KWHs purchased was due to a lower market cost of available energy compared to the cost of generation.
Energy purchases from non-affiliates will vary depending on the market prices of wholesale energy compared to the cost of the Southern Company system's generation, demand for energy within the Southern Company system's service territory, and the availability of the Southern Company system's generation.
Purchased Power - Affiliates
Purchased power expense from affiliates decreased $7.3 million, or 14.7%, in 2013 compared to 2012. The decrease was primarily the result of a 24.7% decrease in the volume of KWHs purchased, partially offset by a 13.2% increase in the average cost per KWH purchased. Purchased power expense from affiliates decreased $15.7 million, or 23.9%, in 2012 compared to 2011. The decrease was primarily the result of a 15.4% decrease in the average cost per KWH purchased and a 10.0% decrease in the volume of KWHs purchased.
Energy purchases from affiliates will vary depending on demand for energy and the availability and cost of generating resources at each company within the Southern Company system. These purchases are made in accordance with the IIC, as approved by the FERC.
Other Operations and Maintenance Expenses
Other operations and maintenance expenses increased $24.7 million in 2013 compared to 2012 primarily due to a $9.8 million increase in generation maintenance expenses for several planned outages, a $7.6 million increase in administrative and general expenses, a $4.2 million increase in transmission maintenance expenses, a $2.8 million increase in customer accounting primarily due to uncollectibles, and a $2.5 million increase in distribution expenses related to overhead line maintenance and vegetation management costs. These increases were partially offset by a $2.7 million decrease in labor expenses.
Other operations and maintenance expenses decreased $37.7 million in 2012 compared to 2011 primarily due to a $34.7 million decrease in rent expense and expenses under a long-term service agreement resulting from the expiration of the Plant Daniel Units 3 and 4 operating lease in October 2011 and a $6.3 million decrease in generation maintenance expenses for several major outages. These decreases were partially offset by a $2.8 million increase in administrative and general expenses. See FINANCIAL CONDITION AND LIQUIDITY – "Purchase of the Plant Daniel Combined Cycle Generating Units" herein for additional information.
Depreciation and Amortization
Depreciation and amortization increased $4.9 million in 2013 compared to 2012 primarily due to a $4.3 million increase in Environmental Compliance Overview (ECO) Plan amortization, a $2.0 million increase in amortization resulting from a regulatory deferral associated with the purchase of Plant Daniel Units 3 and 4, and a $1.6 million increase in depreciation resulting from an increase in plant in service. These increases were partially offset by a $2.1 million decrease in amortization primarily resulting from a regulatory deferral associated with the Kemper IGCC and a $0.7 million decrease in amortization resulting from a regulatory deferral associated with the capital lease related to the Kemper IGCC air separation unit.
Depreciation and amortization increased $6.2 million in 2012 compared to 2011 primarily due to a $10.8 million increase in depreciation resulting from an increase in plant in service and a $6.2 million increase in amortization resulting from the plant acquisition adjustment related to the purchase of Plant Daniel Units 3 and 4, partially offset by a $4.5 million decrease in amortization resulting from a regulatory deferral associated with the purchase of Plant Daniel Units 3 and 4, a $3.3 million decrease in ECO Plan amortization, and a $2.4 million decrease in amortization resulting from a regulatory deferral associated with operations and maintenance expenses that ended in 2011.
See Note 1 to the financial statements under "Depreciation and Amortization" and Note 3 to the financial statements under "Retail Regulatory Matters – Performance Evaluation Plan" and " – Environmental Compliance Overview Plan" for additional information.
Taxes Other Than Income Taxes
Taxes other than income taxes increased $1.2 million in 2013 compared to 2012 primarily as a result of a $3.5 million increase in franchise taxes, partially offset by a $2.1 million decrease in ad valorem taxes and a $0.2 million decrease in payroll taxes. Taxes other than income taxes increased $9.3 million in 2012 compared to 2011 primarily as a result of an $11.7 million increase in ad
II-358
MANAGEMENT'S DISCUSSION AND ANALYSIS (continued)
Mississippi Power Company 2013 Annual Report
valorem taxes resulting from the expiration of a tax exemption related to Plant Daniel Units 3 and 4, partially offset by a $2.2 million decrease in franchise taxes and a $0.2 million decrease in payroll taxes.
The retail portion of ad valorem taxes is recoverable under the Company's ad valorem tax cost recovery clause and, therefore, does not affect net income.
Estimated Loss on Kemper IGCC
Estimated probable losses on the Kemper IGCC of $1.1 billion and $78.0 million were recorded in 2013 and 2012, respectively, to reflect revisions of estimated costs expected to be incurred on the construction of the Kemper IGCC in excess of the $2.88 billion cost cap established by the Mississippi PSC, net of the DOE Grants and excluding the Cost Cap Exceptions.
See Note 3 to the financial statements under "Integrated Coal Gasification Combined Cycle" for additional information.
Allowance for Funds Used During Construction Equity
AFUDC equity increased $56.8 million in 2013 as compared to 2012 and $40.1 million in 2012 as compared to 2011. These increases were primarily due to the construction of the Kemper IGCC which began in 2010. See Note 3 to the financial statements under "Integrated Coal Gasification Combined Cycle" for additional information regarding the Kemper IGCC.
Interest Expense, Net of Amounts Capitalized
Interest expense, net of amounts capitalized decreased $4.4 million in 2013 compared to 2012, primarily due to a $20.1 million increase in capitalized interest primarily resulting from AFUDC debt associated with the Kemper IGCC and a $2.6 million decrease in interest expense associated with the redemption of long-term debt in 2013. These decreases were partially offset by a $12.2 million increase in interest expense primarily associated with the issuances of new long-term debt in 2013, a $4.0 million increase in interest expense resulting from the receipt of a $150.0 million interest-bearing refundable deposit from South Mississippi Electric Power Association (SMEPA) in March 2012 related to its pending purchase of an undivided interest in the Kemper IGCC, and a $2.7 million increase in interest expense on the regulatory liability related to the Kemper IGCC rate recovery.
Interest expense, net of amounts capitalized increased $19.1 million in 2012 compared to 2011, primarily due to a $39.0 million increase in interest expense associated with the issuances of new long-term debt in October 2011, March 2012, August 2012, and November 2012 and a $12.5 million increase in interest expense resulting from the receipt of a $150.0 million interest-bearing refundable deposit from SMEPA in March 2012 related to its pending purchase of an undivided interest in the Kemper IGCC. These increases were partially offset by a $22.8 million increase in capitalized interest primarily resulting from AFUDC debt associated with the Kemper IGCC, a $6.1 million decrease in interest expense resulting from the amortization of the fair value adjustment in the assumed debt related to the purchase of Plant Daniel Units 3 and 4 in October 2011, and a $3.5 million decrease in interest expense associated with the redemption of long term debt in 2012. See Note 3 to the financial statements under "Integrated Coal Gasification Combined Cycle" for additional information regarding the Kemper IGCC.
Other Income (Expense), Net
Other income (expense), net decreased $6.7 million in 2013 compared to 2012 primarily due to a $5.9 million increase in consulting fees. Other income (expense), net increased $0.5 million in 2012 compared to 2011 primarily due to a $1.6 million increase in the sale of property and a $1.1 million increase in non-operating income, partially offset by a $1.9 million increase in consulting fees.
Income Taxes
Income taxes decreased $388.4 million in 2013 compared to 2012 primarily resulting from the reduction in pre-tax earnings related to the estimated probable losses on the Kemper IGCC. Income taxes decreased $21.6 million in 2012 compared to 2011 primarily resulting from lower pre-tax earnings as a result of the estimated probable loss on the Kemper IGCC, an increase in AFUDC equity, which is non-taxable, and a decrease in unrecognized tax benefits, partially offset by lower State of Mississippi manufacturing investment tax credits.
Effects of Inflation
The Company is subject to rate regulation that is generally based on the recovery of historical and projected costs. The effects of inflation can create an economic loss since the recovery of costs could be in dollars that have less purchasing power. Any adverse effect of inflation on the Company's results of operations has not been substantial in recent years.
II-359
MANAGEMENT'S DISCUSSION AND ANALYSIS (continued)
Mississippi Power Company 2013 Annual Report
FUTURE EARNINGS POTENTIAL
General
The Company operates as a vertically integrated utility providing electricity to retail customers within its traditional service area located in southeast Mississippi and to wholesale customers in the Southeast. Prices for electricity provided by the Company to retail customers are set by the Mississippi PSC under cost-based regulatory principles. Retail rates and earnings are reviewed and may be adjusted periodically within certain limitations. Prices for wholesale electricity sales, interconnecting transmission lines, and the exchange of electric power are regulated by the FERC. See "FERC Matters" herein, ACCOUNTING POLICIES – "Application of Critical Accounting Policies and Estimates – Electric Utility Regulation" herein, and Note 3 to the financial statements under "Retail Regulatory Matters" for additional information about regulatory matters.
The results of operations for the past three years are not necessarily indicative of future earnings potential. The level of the Company's future earnings depends on numerous factors that affect the opportunities, challenges, and risks of the Company's business of selling electricity. These factors include the Company's ability to maintain a constructive regulatory environment that continues to allow for the timely recovery of prudently-incurred costs during a time of increasing costs and the successful completion of ongoing construction projects, primarily the Kemper IGCC. Future earnings in the near term will depend, in part, upon maintaining energy sales which is subject to a number of factors. These factors include weather, competition, new energy contracts with other utilities, energy conservation practiced by customers, the price of electricity, the price elasticity of demand, and the rate of economic growth or decline in the Company's service territory. Changes in regional and global economic conditions impact sales for the Company, as the pace of the economic recovery remains uncertain. The timing and extent of the economic recovery will impact growth and may impact future earnings.
Environmental Matters
Compliance costs related to federal and state environmental statutes and regulations could affect earnings if such costs cannot continue to be fully recovered in rates on a timely basis. Environmental compliance spending over the next several years may differ materially from the amounts estimated. The timing, specific requirements, and estimated costs could change as environmental statutes and regulations are adopted or modified. Further, higher costs that are recovered through regulated rates could contribute to reduced demand for electricity, which could negatively affect results of operations, cash flows, and financial condition. See Note 3 to the financial statements under "Environmental Matters" for additional information.
New Source Review Actions
As part of a nationwide enforcement initiative against the electric utility industry which began in 1999, the U.S. Environmental Protection Agency (EPA) brought civil enforcement actions in federal district court against Alabama Power alleging violations of the New Source Review (NSR) provisions of the Clean Air Act at certain coal-fired electric generating units, including a unit co-owned by the Company. These civil actions seek penalties and injunctive relief, including orders requiring installation of the best available control technologies at the affected units. These actions were filed concurrently with the issuance of notices of violation to the Company with respect to the Company's Plant Watson. The case against Alabama Power (including claims involving a unit co-owned by the Company) has been actively litigated in the U.S. District Court for the Northern District of Alabama, resulting in a settlement in 2006 of the alleged NSR violations at Plant Miller; voluntary dismissal of certain claims by the EPA; and a grant of summary judgment for Alabama Power on all remaining claims and dismissal of the case with prejudice in 2011. On September 19, 2013, the U.S. Court of Appeals for the Eleventh Circuit affirmed in part and reversed in part the 2011 judgment in favor of Alabama Power, and the case has been transferred back to the U.S. District Court for the Northern District of Alabama for further proceedings.
The Company believes it complied with applicable laws and regulations in effect at the time the work in question took place. The Clean Air Act authorizes maximum civil penalties of $25,000 to $37,500 per day, per violation, depending on the date of the alleged violation. An adverse outcome could require substantial capital expenditures that cannot be determined at this time and could possibly require payment of substantial penalties. Such expenditures could affect future results of operations, cash flows, and financial condition if such costs are not recovered through regulated rates. The ultimate outcome of this matter cannot be determined at this time.
Environmental Statutes and Regulations
General
The Company's operations are subject to extensive regulation by state and federal environmental agencies under a variety of statutes and regulations governing environmental media, including air, water, and land resources. Applicable statutes include the
II-360
MANAGEMENT'S DISCUSSION AND ANALYSIS (continued)
Mississippi Power Company 2013 Annual Report
Clean Air Act; the Clean Water Act; the Comprehensive Environmental Response, Compensation, and Liability Act; the Resource Conservation and Recovery Act; the Toxic Substances Control Act; the Emergency Planning & Community Right-to-Know Act; the Endangered Species Act; and related federal and state regulations. Compliance with these environmental requirements involves significant capital and operating costs, a major portion of which is expected to be recovered through existing ratemaking provisions. Through 2013, the Company had invested approximately $405 million in environmental capital retrofit projects to comply with these requirements, with annual totals of approximately $104 million, $52 million, and $23 million for 2013, 2012, and 2011, respectively. The Company expects that base level capital expenditures to comply with environmental statutes and regulations will total approximately $313 million from 2014 through 2016, with annual totals of approximately $154 million, $108 million, and $51 million for 2014, 2015, and 2016, respectively.
The Company continues to monitor the development of the EPA's proposed water and coal combustion residuals rules and to evaluate compliance options. Based on its preliminary analysis and an assumption that coal combustion residuals will continue to be regulated as non-hazardous solid waste under the proposed rule, the Company does not anticipate that material compliance costs with respect to these proposed rules will be required during the period of 2014 through 2016. The ultimate capital expenditures and compliance costs with respect to these proposed rules, including additional expenditures required after 2016, will be dependent on the requirements of the final rules and regulations adopted by the EPA and the outcome of any legal challenges to these rules. See "Water Quality" and "Coal Combustion Residuals" herein for additional information.
The Company's ultimate environmental compliance strategy, including potential unit retirement and replacement decisions, and future environmental capital expenditures will be affected by the final requirements of new or revised environmental regulations and regulations relating to global climate change that are promulgated, including the proposed environmental regulations described below; the outcome of any legal challenges to the environmental rules; the cost, availability, and existing inventory of emissions allowances; and the Company's fuel mix. Compliance costs may arise from existing unit retirements, installation of additional environmental controls, and adding or changing fuel sources for certain existing units. The ultimate outcome of these matters cannot be determined at this time.
Compliance with any new federal or state legislation or regulations relating to air quality, water, coal combustion residuals, global climate change, or other environmental and health concerns could significantly affect the Company. Although new or revised environmental legislation or regulations could affect many areas of the Company's operations, the full impact of any such changes cannot be determined at this time. Additionally, many of the Company's commercial and industrial customers may also be affected by existing and future environmental requirements, which for some may have the potential to ultimately affect their demand for electricity.
Air Quality
Compliance with the Clean Air Act and resulting regulations has been and will continue to be a significant focus for the Company. Since 1990, the Company has spent approximately $278 million in reducing and monitoring emissions pursuant to the Clean Air Act. Additional controls are currently planned or under consideration to further reduce air emissions, maintain compliance with existing regulations, and meet new requirements.
Final revisions to the National Ambient Air Quality Standard for sulfur dioxide (SO
2
), which established a new one-hour standard, became effective in 2010. No areas within the Company's service territory have been designated as nonattainment under this rule. However, the EPA may designate additional areas as nonattainment in the future, which could include areas within the Company's service territory. Implementation of the revised SO
2
standard could require additional reductions in SO
2
emissions and increased compliance and operational costs.
On February 13, 2014, the EPA proposed to delete from the Alabama State Implementation Plan (SIP) the Alabama opacity rule that the EPA approved in 2008, which provides operational flexibility to affected units. On March 6, 2013, the U.S. Court of Appeals for the Eleventh Circuit ruled in favor of Alabama Power and vacated an earlier attempt by the EPA to rescind its 2008 approval. The EPA’s latest proposal characterizes the proposed deletion as an error correction within the meaning of the Clean Air Act. Alabama Power believes this interpretation of the Clean Air Act to be incorrect. If finalized, this proposed action could affect unit availability and result in increased operations and maintenance costs for affected units, including units co-owned by the Company.
The Company's service territory is subject to the requirements of the Clean Air Interstate Rule (CAIR), which calls for phased reductions in SO
2
and nitrogen oxide emissions from power plants in 28 eastern states. In 2008, the U.S. Court of Appeals for the District of Columbia Circuit issued decisions invalidating CAIR, but left CAIR compliance requirements in place while the EPA developed a new rule. In 2011, the EPA promulgated the Cross State Air Pollution Rule (CSAPR) to replace CAIR. However, in August 2012, the U.S. Court of Appeals for the District of Columbia Circuit vacated CSAPR in its entirety and directed the EPA
II-361
MANAGEMENT'S DISCUSSION AND ANALYSIS (continued)
Mississippi Power Company 2013 Annual Report
to continue to administer CAIR pending the EPA's development of a valid replacement. Review of the U.S. Court of Appeals for the District of Columbia Circuit's decision regarding CSAPR is currently pending before the U.S. Supreme Court.
The EPA finalized the Clean Air Visibility Rule (CAVR) in 2005, with a goal of restoring natural visibility conditions in certain areas (primarily national parks and wilderness areas) by 2064. The rule involves the application of best available retrofit technology to certain sources built between 1962 and 1977 and any additional emissions reductions necessary for each designated area to achieve reasonable progress toward the natural visibility conditions goal by 2018 and for each 10-year period thereafter.
In February 2012, the EPA finalized the Mercury and Air Toxics Standards (MATS) rule, which imposes stringent emissions limits for acid gases, mercury, and particulate matter on coal- and oil-fired electric utility steam generating units. Compliance for existing sources is required by April 16, 2015; however, states may authorize a compliance extension of up to one year to April 16, 2016. The Company has received this one-year compliance extension for Plant Daniel.
In August 2012, the EPA published proposed revisions to the New Source Performance Standard (NSPS) for Stationary Combustion Turbines (CTs). If finalized as proposed, the revisions would apply the NSPS to all new, reconstructed, and modified CTs (including CTs at combined cycle units), during all periods of operation, including startup and shutdown, and alter the criteria for determining when an existing CT has been reconstructed.
On February 12, 2013, the EPA proposed a rule that would require certain states to revise the provisions of their SIPs relating to the regulation of excess emissions at industrial facilities, including fossil fuel-fired generating facilities, during periods of startup, shut-down, or malfunction (SSM). The EPA proposes a determination that the SSM provisions in the SIPs for 36 states (including Alabama and Mississippi) do not meet the requirements of the Clean Air Act and must be revised within 18 months of the date on which the
EPA publishes the final rule. The EPA has entered into a settlement agreement requiring it to finalize the rule by June 12, 2014.
The Company has developed and continually updates a comprehensive environmental compliance strategy to assess compliance obligations associated with the current and proposed environmental requirements discussed above. The impacts of the SO
2
NAAQS, the Alabama opacity rule, CAIR and any future replacement rule, CAVR, the MATS rule, the NSPS for CTs, and the SSM rule on the Company cannot be determined at this time and will depend on the specific provisions of recently finalized and future rules, the resolution of pending and future legal challenges, and the development and implementation of rules at the state level. These regulations could result in significant additional compliance costs that could affect future unit retirement and replacement decisions and results of operations, cash flows, and financial condition if such costs are not recovered through regulated rates. Further, higher costs that are recovered through regulated rates could contribute to reduced demand for electricity, which could negatively impact results of operations, cash flows, and financial condition.
See Note 3 to the financial statements under "Retail Regulatory Matters – Environmental Compliance Overview Plan" for additional information.
Water Quality
In 2011, the EPA published a proposed rule that establishes standards for reducing effects on fish and other aquatic life caused by cooling water intake structures at existing power plants and manufacturing facilities. The rule also addresses cooling water intake structures for new units at existing facilities. Compliance with the proposed rule could require changes to existing cooling water intake structures at certain of the Company's generating facilities, and new generating units constructed at existing plants would be required to install closed cycle cooling towers. The EPA is required to issue a final rule by April 17, 2014.
On June 7, 2013, the EPA published a proposed rule which requested comments on a range of potential regulatory options for addressing certain wastestreams from steam electric power plants. These regulations could result in the installation of additional controls at certain of the facilities of the Company, which could result in significant capital expenditures and compliance costs that could affect future unit retirement and replacement decisions, depending on the specific technology requirements of the final rule.
The impact of these proposed rules cannot be determined at this time and will depend on the specific provisions of the final rules and the outcome of any legal challenges. These regulations could result in significant additional capital expenditures and compliance costs that could affect future unit retirement and replacement decisions. Also, results of operations, cash flows, and financial condition could be significantly impacted if such costs are not recovered through regulated rates. Further, higher costs that are recovered through regulated rates could contribute to reduced demand for electricity, which could negatively impact results of operations, cash flows, and financial condition.
II-362
MANAGEMENT'S DISCUSSION AND ANALYSIS (continued)
Mississippi Power Company 2013 Annual Report
Coal Combustion Residuals
The Company currently operates two electric generating plants in Mississippi and is also part owner of a plant located in Alabama, each with on-site coal combustion residuals storage facilities. In addition to on-site storage, the Company also sells a portion of its coal combustion residuals to third parties for beneficial reuse. Historically, individual states have regulated coal combustion residuals and the States of Mississippi and Alabama each has its own regulatory requirements. The Company has a routine and robust inspection program in place to ensure the integrity of its coal ash surface impoundments and compliance with applicable regulations.
The EPA continues to evaluate the regulatory program for coal combustion residuals, including coal ash and gypsum, under federal solid and hazardous waste laws. In 2010, the EPA published a proposed rule that requested comments on two potential regulatory options for the management and disposal of coal combustion residuals: regulation as a solid waste or regulation as if the materials technically constituted a hazardous waste. Adoption of either option could require closure of, or significant change to, existing storage facilities and construction of lined landfills, as well as additional waste management and groundwater monitoring requirements. Under both options, the EPA proposes to exempt the beneficial reuse of coal combustion residuals from regulation; however, a hazardous or other designation indicative of heightened risk could limit or eliminate beneficial reuse options. Environmental groups and other parties have filed lawsuits in the U.S. District Court for the District of Columbia seeking to require the EPA to complete its rulemaking process and issue final regulations pertaining to the regulation of coal combustion residuals. On September 30, 2013, the U.S. District Court for the District of Columbia issued an order granting partial summary judgment to the environmental groups and other parties, ruling that the EPA has a statutory obligation to review and revise, as necessary, the federal solid waste regulations applicable to coal combustion residuals. On January 29, 2014, the EPA filed a consent decree requiring the EPA to take final action regarding the proposed regulation of coal combustion residuals as solid waste by December 19, 2014
.
While the ultimate outcome of this matter cannot be determined at this time and will depend on the final form of any rules adopted and the outcome of any legal challenges, additional regulation of coal combustion residuals could have a material impact on the generation, management, beneficial use, and disposal of such residuals. Any material changes are likely to result in substantial additional compliance, operational, and capital costs that could affect future unit retirement and replacement decisions. Moreover, the Company could incur additional material asset retirement obligations with respect to closing existing storage facilities. The Company's results of operations, cash flows, and financial condition could be significantly impacted if such costs are not recovered through regulated rates. Further, higher costs that are recovered through regulated rates could contribute to reduced demand for electricity, which could negatively impact results of operations, cash flows, and financial condition.
Environmental Remediation
The Company must comply with other environmental laws and regulations that cover the handling and disposal of waste and releases of hazardous substances. Under these various laws and regulations, the Company may also incur substantial costs to clean up properties. The Company conducts studies to determine the extent of any required cleanup and has recognized in its financial statements the costs to clean up known impacted sites. Amounts for cleanup and ongoing monitoring costs were not material for any year presented. The Company has authority from the Mississippi PSC to recover approved environmental compliance costs through its ECO clause. The Company may be liable for some or all required cleanup costs for additional sites that may require environmental remediation. See Note 3 to the financial statements under "Environmental Matters – Environmental Remediation" for additional information.
Global Climate Issues
The EPA currently regulates greenhouse gases under the Prevention of Significant Deterioration and Title V operating permit programs of the Clean Air Act. The legal basis for these regulations is currently being challenged in the U.S. Supreme Court. In addition, over the past several years, the U.S. Congress has considered many proposals to reduce greenhouse gas emissions, mandate renewable or clean energy, and impose energy efficiency standards. Such proposals are expected to continue to be considered by the U.S. Congress. International climate change negotiations under the United Nations Framework Convention on Climate Change are also continuing.
On January 8, 2014, the EPA published re-proposed regulations to establish standards of performance for greenhouse gas emissions from new fossil fuel steam electric generating units. A Presidential memorandum issued on June 25, 2013 also directs the EPA to propose standards, regulations, or guidelines for addressing modified, reconstructed, and existing steam electric generating units by June 1, 2014.
Although the outcome of any federal, state, and international initiatives, including the EPA's proposed regulations and guidelines discussed above, will depend on the scope and specific requirements of the proposed and final rules and the outcome of any legal
II-363
MANAGEMENT'S DISCUSSION AND ANALYSIS (continued)
Mississippi Power Company 2013 Annual Report
challenges and, therefore, cannot be determined at this time, additional restrictions on the Company's greenhouse gas emissions or requirements relating to renewable energy or energy efficiency at the federal or state level could result in significant additional compliance costs, including capital expenditures. These costs could affect future unit retirement and replacement decisions and could result in the retirement of additional coal-fired generating units. Also, additional compliance costs and costs related to unit retirements could affect results of operations, cash flows, and financial condition if such costs are not recovered through regulated rates. Further, higher costs that are recovered through regulated rates could contribute to reduced demand for electricity, which could negatively impact results of operations, cash flows, and financial condition.
The EPA's greenhouse gas reporting rule requires annual reporting of CO
2
equivalent emissions in metric tons for a company's operational control of facilities. Based on ownership or financial control of facilities, the Company's 2012 greenhouse gas emissions were approximately 7 million metric tons of CO
2
equivalent. The preliminary estimate of the Company's 2013 greenhouse gas emissions on the same basis is approximately 10 million metric tons of CO
2
equivalent. The level of greenhouse gas emissions from year to year will depend on the level of generation and mix of fuel sources and other factors.
FERC Matters
On May 3, 2013, the FERC accepted a settlement agreement entered into by the Company with its wholesale customers which approved, among other things, the same regulatory treatment for tariff ratemaking as the treatment approved for retail ratemaking by the Mississippi PSC for certain items. The regulatory treatment includes (i) approval to establish a regulatory asset for the portion of non-capitalizable Kemper IGCC-related costs which have been and will continue to be incurred during the construction period for the Kemper IGCC, (ii) authorization to defer as a regulatory asset, for the 10-year period ending October 2021, the difference between the revenue requirement under the purchase option of Plant Daniel Units 3 and 4 (assuming a remaining 30-year life) and the revenue requirement assuming the continuation of the operating lease regulatory treatment with the accumulated deferred balance at the end of the deferral being amortized into wholesale rates over the remaining life of Plant Daniel Units 3 and 4, and (iii) authority to defer in a regulatory asset costs related to the retirement or partial retirement of generating units as a result of environmental compliance rules. See Note 3 to the financial statements under "FERC Matters" for more information.
PSC Matters
General
In August 2012, the Mississippi PSC issued an order for the purpose of investigating and reviewing for informational purposes only the return on equity (ROE) formulas used by the Company and all other regulated electric utilities in Mississippi. On March 14, 2013, the Mississippi Public Utilities Staff (MPUS) filed with the Mississippi PSC its report on the ROE formulas used by the Company and all other regulated electric utilities in Mississippi. The ultimate outcome of this matter cannot be determined at this time.
Energy Efficiency
On July 11, 2013, the Mississippi PSC approved an energy efficiency and conservation rule requiring electric and gas utilities in Mississippi serving more than 25,000 customers to implement energy efficiency programs and standards. Quick Start Plans, which include a portfolio of energy efficiency programs that are intended to provide benefits to a majority of customers, were required to be filed within six months of the order and will be in effect for two to three years. An annual report addressing the performance of all energy efficiency programs is required. On January 10, 2014, the Company submitted its 2014 Energy Efficiency Quick Start Plan filing, which proposed a portfolio of energy efficiency programs. The ultimate outcome of this matter cannot be determined at this time.
Performance Evaluation Plan
The Company’s retail base rates are set under the PEP, a rate plan approved by the Mississippi PSC. Two filings are made for each calendar year: the PEP projected filing, which is typically filed prior to the beginning of the year based on projected revenue requirement, and the PEP lookback filing, which is filed after the year and allows for review of actual revenue requirement compared to the projected filing.
In 2011, the Company submitted its annual PEP lookback filing for 2010, which recommended no surcharge or refund. Later in 2011, the Company received a letter from the MPUS disputing certain items in the 2010 PEP lookback filing. In May 2012, the Mississippi PSC issued an order suspending the Company's annual lookback filing for 2011.
On March 15, 2013, the Company submitted its annual PEP lookback filing for 2012, which indicated a refund due to customers of $4.7 million, which was accrued in retail revenues in 2013. On May 1, 2013, the MPUS contested the filing. Unresolved matters related to certain costs included in the 2010 PEP lookback filing, which are currently under review, also impact the 2012 PEP lookback filing.
II-364
MANAGEMENT'S DISCUSSION AND ANALYSIS (continued)
Mississippi Power Company 2013 Annual Report
On March 5, 2013, the Mississippi PSC approved the projected PEP filing for 2013, which resulted in a rate increase of 1.925%, or $15.3 million, annually, with the new rates effective March 19, 2013. The Company may be entitled to $3.3 million in additional revenues related to 2013 as a result of the late implementation of the 2013 PEP rate increase.
While the Company does not expect the resolution of these matters to have a material impact on its financial statements, the ultimate outcome cannot be determined at this time.
See Note 3 to the financial statements under "Retail Regulatory Matters – Performance Evaluation Plan" for more information.
Environmental Compliance Overview Plan
In 2011, the Company filed a request to establish a regulatory asset to defer certain plant retirement costs if such costs are incurred. This request was made to minimize the potential rate impact to customers arising from pending and final environmental regulations which may require the premature retirement of some generating units. These environmental rules and regulations are continuously monitored by the Company and all options are evaluated. In December 2011, an order was issued by the Mississippi PSC authorizing the Company to defer all plant retirement related costs resulting from compliance with environmental regulations as a regulatory asset for future recovery.
In April 2012, the Mississippi PSC approved the Company's request for a CPCN to construct a flue gas desulfurization system (scrubber) on Plant Daniel Units 1 and 2. In May 2012, the Sierra Club filed a notice of appeal of the order with the Chancery Court of Harrison County, Mississippi (Chancery Court). These units are jointly owned by the Company and Gulf Power, with 50% ownership each. The estimated total cost of the project is approximately $660 million, with the Company's portion being $330 million, excluding AFUDC. The Company's portion of the cost is expected to be recovered through the ECO Plan following the scheduled completion of the project in December 2015. As of December 31, 2013, total project expenditures were $320.6 million, of which the Company's portion was $162.3 million, excluding AFUDC of $8.5 million.
In June 2012, the Mississippi PSC approved the Company's 2012 ECO Plan filing, including a 0.16%, or $1.5 million, decrease in annual revenues, effective June 29, 2012. On August 13, 2013, the Mississippi PSC approved the Company’s 2013 ECO Plan filing which proposed no change in rates.
The ultimate outcome of these matters cannot be determined at this time.
Fuel Cost Recovery
The Company establishes, annually, a retail fuel cost recovery factor that is approved by the Mississippi PSC. The Company is required to file for an adjustment to the retail fuel cost recovery factor annually; the most recent filing occurred on November 15, 2013. The Mississippi PSC approved the 2014 retail fuel cost recovery factor on January 7, 2014, with the new rates effective in February 2014. The retail fuel cost recovery factor will result in an annual increase of 3.4% of total 2013 retail revenue, or $30.1 million. At December 31, 2013, the amount of over recovered retail fuel costs included in the balance sheets was $14.5 million compared to $56.6 million at December 31, 2012. The Company also has a wholesale Municipal and Rural Associations (MRA) and a Market Based (MB) fuel cost recovery factor. Effective January 1, 2014, the wholesale MRA fuel rate increased resulting in an annual increase of $10.1 million. Effective February 1, 2014, the wholesale MB fuel rate increased, resulting in an annual increase of $1.2 million. At December 31, 2013, the amount of over recovered wholesale MRA and MB fuel costs included in the balance sheets was $7.3 million and $0.3 million compared to $19.0 million and $2.1 million, respectively, at December 31, 2012. In addition, at December 31, 2013, the amount of under recovered MRA emissions allowance cost included in the balance sheets was $3.8 million compared to $0.4 million at December 31, 2012. The Company's operating revenues are adjusted for differences in actual recoverable fuel cost and amounts billed in accordance with the currently approved cost recovery rate. Accordingly, changes in the billing factor have no significant effect on the Company's revenues or net income, but will affect cash flow.
The Mississippi PSC engaged an independent professional audit firm to conduct an audit of the Company's fuel-related expenditures included in the retail fuel adjustment clause and energy cost management clause (ECM). The 2013, 2012, and 2011 audits of fuel-related expenditures were completed with no audit findings.
Ad Valorem Tax Adjustment
The Company establishes, annually, an ad valorem tax adjustment factor that is approved by the Mississippi PSC to collect the ad valorem taxes paid by the Company. On June 4, 2013, the Mississippi PSC approved an annual rate increase of 0.9%, or $7.1 million, due to an increase in ad valorem taxes resulting from the expiration of a tax exemption related to Plant Daniel Units 3 and 4. See Results of Operations – "Taxes Other Than Income Taxes" herein for additional information.
II-365
MANAGEMENT'S DISCUSSION AND ANALYSIS (continued)
Mississippi Power Company 2013 Annual Report
System Restoration Rider
The Company is required to make annual System Restoration Rider (SRR) filings to review charges to the property damage reserve and to determine the revenue requirement associated with property damage. The purpose of the SRR is to provide for recovery of costs associated with property damage (including certain property insurance and the costs of self-insurance) and to facilitate the Mississippi PSC's review of these costs. The Mississippi PSC periodically agrees on SRR revenue levels that are developed based on historical data, expected exposure, type and amount of insurance coverage excluding insurance costs, and other relevant information. The applicable SRR rate level will be reviewed every three years, unless a significant change in circumstances occurs such that the Company and the MPUS or the Mississippi PSC deems that a more frequent change in rates would be appropriate. The Company will submit annual filings setting forth SRR-related revenues, expenses, and investment for the projected filing period, as well as the true-up for the prior period.
For 2011, 2012, and 2013, the SRR rate was zero. The Mississippi PSC approved accruals to the property damage reserve of $3.8 million and $3.2 million in 2012 and 2013, respectively. On February 3, 2014, the Company submitted its 2014 SRR rate filing with the Mississippi PSC, which proposed that the 2014 SRR rate level remain at zero and the Company be allowed to accrue $3.3 million to the property damage reserve in 2014. The ultimate outcome of this matter cannot be determined at this time.
Storm Damage Cost Recovery
The Company maintains a reserve to cover the cost of damage from major storms to its transmission and distribution facilities and generally the cost of uninsured damage to its generation facilities and other property. The total storm restoration costs incurred in 2013 were
$2.3 million
. At December 31, 2013, the balance in the property damage reserve was
$60.1 million
.
Integrated Coal Gasification Combined Cycle
Kemper IGCC Overview
Construction of the Kemper IGCC is nearing completion and start-up activities will continue until the Kemper IGCC is placed in service. The Kemper IGCC will utilize an integrated coal gasification combined cycle technology with an output capacity of 582 MWs. The Kemper IGCC will be fueled by locally mined lignite (an abundant, lower heating value coal) from a mine owned by the Company and situated adjacent to the Kemper IGCC. The mine, operated by North American Coal Corporation, started commercial operation on June 5, 2013. In connection with the Kemper IGCC, the Company constructed and plans to operate approximately 61 miles of CO
2
pipeline infrastructure for the planned transport of captured CO
2
for use in enhanced oil recovery.
Kemper IGCC Project Approval
In April 2012, the Mississippi PSC issued a detailed order confirming the CPCN originally approved by the Mississippi PSC in 2010 authorizing the acquisition, construction, and operation of the Kemper IGCC (2012 MPSC CPCN Order), which the Sierra Club appealed to the Chancery Court. In December 2012, the Chancery Court affirmed the 2012 MPSC CPCN Order. On January 8, 2013, the Sierra Club filed an appeal of the Chancery Court's ruling with the Mississippi Supreme Court. The ultimate outcome of the CPCN challenge cannot be determined at this time.
Kemper IGCC Schedule and Cost Estimate
The certificated cost estimate of the Kemper IGCC included in the 2012 MPSC CPCN Order was $2.4 billion, net of the DOE Grants and excluding the cost of the lignite mine and equipment, the cost of the CO
2
pipeline facilities, and AFUDC related to the Kemper IGCC. The 2012 MPSC CPCN Order approved a construction cost cap of up to $2.88 billion, with recovery of prudently-incurred costs subject to approval by the Mississippi PSC. Exceptions to the $2.88 billion cost cap include the Cost Cap Exceptions, as contemplated in the Settlement Agreement and the 2012 MPSC CPCN Order. Recovery of the Cost Cap Exception amounts remains subject to review and approval by the Mississippi PSC. The Kemper IGCC was originally scheduled to be placed in service in May 2014 and is currently scheduled to be placed in service in the fourth quarter 2014.
II-366
MANAGEMENT'S DISCUSSION AND ANALYSIS (continued)
Mississippi Power Company 2013 Annual Report
The Company's 2010 project estimate, current cost estimate, and actual costs incurred as of December 31, 2013 for the Kemper IGCC are as follows:
|
Cost Category
|
2010 Project Estimate
(d)
|
Current Estimate
|
Actual Costs at 12/31/2013
|
||||||
|
(in billions)
|
|||||||||
|
Plant Subject to Cost Cap
(a)
|
$
|
2.40
|
|
$
|
4.06
|
|
$
|
3.25
|
|
|
Lignite Mine and Equipment
|
0.21
|
0.23
|
0.23
|
||||||
|
CO
2
Pipeline Facilities
|
0.14
|
0.11
|
0.09
|
||||||
|
AFUDC
(b)
|
0.17
|
0.45
|
0.28
|
||||||
|
General Exceptions
|
0.05
|
0.10
|
0.07
|
||||||
|
Regulatory Asset
(c)
|
—
|
|
0.09
|
0.07
|
|||||
|
Total Kemper IGCC
(a)
|
$
|
2.97
|
|
$
|
5.04
|
|
$
|
3.99
|
|
|
(a)
|
The 2012 MPSC CPCN Order approved a construction cost cap of up to $2.88 billion, net of the DOE Grants and excluding the Cost Cap Exceptions.
|
|
(b)
|
The Company’s original estimate included recovery of financing costs during construction which was not approved by the Mississippi PSC in June 2012 as described in "Rate Recovery of Kemper IGCC Costs."
|
|
(c)
|
The 2012 MPSC CPCN Order approved deferral of non-capital Kemper IGCC-related costs during construction as described in "Rate Recovery of Kemper IGCC Costs - Regulatory Assets."
|
|
(d)
|
The 2010 Project Estimate is the certificated cost estimate adjusted to include the certificated estimate for the CO
2
pipeline facilities which was approved in 2011 by the Mississippi PSC.
|
Of the total costs incurred as of December 31, 2013, $2.74 billion was included in CWIP (which is net of the DOE Grants and estimated probable losses of $1.18 billion), $70.5 million in other regulatory assets, and $3.9 million in other deferred charges and assets in the balance sheet, and $1.0 million was previously expensed.
The Company does not intend to seek any rate recovery or joint owner contributions for any related costs that exceed the $2.88 billion cost cap, excluding the Cost Cap Exceptions and net of the DOE Grants. The Company recorded pre-tax charges to income for revisions to the cost estimate of $78.0 million ($48.2 million after tax) and $1.1 billion ($680.5 million after tax) in 2012 and 2013, respectively. The revised cost estimates reflect increased labor costs, piping and other material costs, start-up costs, decreases in construction labor productivity, the change in the in-service date, and an increase in the contingency for risks associated with start-up activities. See RESULTS OF OPERATIONS – "Estimated Loss on Kemper IGCC" for additional information.
The Company could experience further construction cost increases and/or schedule extensions with respect to the Kemper IGCC as a result of factors including, but not limited to, labor costs and productivity, adverse weather conditions, shortages and inconsistent quality of equipment, materials, and labor, contractor or supplier delay, or non-performance under construction or other agreements. Furthermore, the Company could also experience further schedule extensions associated with start-up activities for this "first-of-a-kind" technology, including major equipment failure, system integration, and operations, and/or unforeseen engineering problems, which would result in further cost increases and could result in the loss of certain tax benefits related to bonus depreciation. In subsequent periods, any further changes in the estimated costs to complete construction of the Kemper IGCC subject to the $2.88 billion cost cap will be reflected in the Company's statements of income and these changes could be material.
Rate Recovery of Kemper IGCC Costs
See "FERC Matters" for additional information regarding the Company’s MRA cost based tariff relating to recovery of a portion of the Kemper IGCC costs from the Company’s wholesale customers. Rate recovery of the retail portion of the Kemper IGCC is subject to the jurisdiction of the Mississippi PSC. See Note 3 to the financial statements under "Retail Regulatory Matters – Baseload Act" for additional information. See "Income Tax Matters – Investment Tax Credits" for information on certain tax credits related to the Kemper IGCC.
The ultimate outcome of the rate recovery matters discussed herein, including the resolution of legal challenges, determinations of prudency, and the specific manner of recovery of prudently-incurred costs, cannot be determined at this time, but could have a material impact on the Company’s results of operations, financial condition, and liquidity.
II-367
MANAGEMENT'S DISCUSSION AND ANALYSIS (continued)
Mississippi Power Company 2013 Annual Report
2012 MPSC CPCN Order
The 2012 MPSC CPCN Order included provisions relating to both the Company's recovery of financing costs during the course of construction of the Kemper IGCC and the Company's recovery of costs following the date the Kemper IGCC is placed in service. With respect to recovery of costs following the in-service date of the Kemper IGCC, the 2012 MPSC CPCN Order provided for the establishment of operational cost and revenue parameters based upon assumptions in the Company's petition for the CPCN.
In June 2012, the Mississippi PSC denied the Company's proposed rate schedule for recovery of financing costs during construction, pending a final ruling from the Mississippi Supreme Court regarding the Sierra Club's appeal of the Mississippi PSC's issuance of the CPCN for the Kemper IGCC (2012 MPSC CWIP Order).
In July 2012, the Company appealed the Mississippi PSC's June 2012 decision to the Mississippi Supreme Court and requested interim rates under bond. In July 2012, the Mississippi Supreme Court denied the Company's request for interim rates under bond.
Settlement Agreement
On January 24, 2013, the Company entered into the Settlement Agreement with the Mississippi PSC that, among other things, establishes the process for resolving matters regarding cost recovery related to the Kemper IGCC and dismissed the Company's appeal of the 2012 MPSC CWIP Order. Under the Settlement Agreement, the Company agreed to limit the portion of prudently-incurred Kemper IGCC costs to be included in retail rate base to the $2.4 billion certificated cost estimate, plus the Cost Cap Exceptions, but excluding AFUDC, and any other costs permitted or determined to be excluded from the $2.88 billion cost cap by the Mississippi PSC. The Settlement Agreement also allows the Company to secure alternate financing for costs that are not otherwise recovered in any Mississippi PSC rate proceedings contemplated by the Settlement Agreement. Legislation to authorize a multi-year rate plan and legislation to provide for alternate financing through securitization of up to $1.0 billion of prudently-incurred costs was enacted into law on February 26, 2013. The Company intends to securitize (1) prudently-incurred costs in excess of the certificated cost estimate and up to the $2.88 billion cost cap, net of the DOE Grants and excluding the Cost Cap Exceptions, (2) accrued AFUDC, and (3) other prudently-incurred costs as approved by the Mississippi PSC. The rate recovery necessary to recover the annual costs of securitization is expected to be filed and become effective after the Kemper IGCC is placed in service and following completion of the Mississippi PSC's final prudence review of costs for the Kemper IGCC.
The Settlement Agreement provides that the Company may terminate the Settlement Agreement if certain conditions are not met, if the Company is unable to secure alternate financing for any prudently-incurred Kemper IGCC costs not otherwise recovered in any Mississippi PSC rate proceeding contemplated by the Settlement Agreement, or if the Mississippi PSC fails to comply with the requirements of the Settlement Agreement. The Company continues to work with the Mississippi PSC and the MPUS to implement the procedural schedules set forth in the Settlement Agreement and variations to the schedule are likely.
2013 MPSC Rate Order
Consistent with the terms of the Settlement Agreement, on January 25, 2013, the Company filed a new request to increase retail rates in 2013 by $172 million annually, based on projected investment for 2013, to be recorded to a regulatory liability to be used to mitigate rate impacts when the Kemper IGCC is placed in service.
On March 5, 2013, the Mississippi PSC issued the 2013 MPSC Rate Order, approving retail rate increases of 15% effective March 19, 2013 and 3% effective January 1, 2014, which collectively are designed to collect $156 million annually beginning in 2014. Amounts collected through these rates are being recorded as a regulatory liability to be used to mitigate customer rate impacts after the Kemper IGCC is placed in service. As of December 31, 2013, $98.1 million had been collected, with $10.3 million recognized in retail revenues in the statement of operations and the remainder deferred in other regulatory liabilities and included in the balance sheet.
Because the 2013 MPSC Rate Order did not provide for the inclusion of CWIP in rate base as permitted by legislation designed to enhance the Mississippi PSC's authority to facilitate development and construction of baseload generation in the State of Mississippi, the Company continues to record AFUDC on the Kemper IGCC during the construction period. The Company will not record AFUDC on any additional costs of the Kemper IGCC that exceed the $2.88 billion cost cap, except for Cost Cap Exception amounts. The Company will continue to comply with the 2013 MPSC Rate Order by collecting and deferring the approved rates during the construction period unless directed to do otherwise by the Mississippi PSC. On March 21, 2013, a legal challenge to the 2013 MPSC Rate Order was filed by Thomas A. Blanton with the Mississippi Supreme Court, which remains pending against the Company and the Mississippi PSC.
II-368
MANAGEMENT'S DISCUSSION AND ANALYSIS (continued)
Mississippi Power Company 2013 Annual Report
Seven-Year Rate Plan
Also consistent with the Settlement Agreement, on February 26, 2013, the Company filed with the Mississippi PSC the proposed Seven-Year Rate Plan, which is a rate recovery plan for the Kemper IGCC for the first seven years of its operation, along with a proposed revenue requirement under such plan for 2014 through 2020.
On March 22, 2013, the Company, in compliance with the 2013 MPSC Rate Order, filed a revision to the Seven-Year Rate Plan with the Mississippi PSC for the Kemper IGCC for cost recovery through 2020, which is still under review by the Mississippi PSC. In the Seven-Year Rate Plan, the Company proposed recovery of an annual revenue requirement of approximately $156 million of Kemper IGCC-related operational costs and rate base amounts, including plant costs equal to the $2.4 billion certificated cost estimate. The 2013 MPSC Rate Order, which increased rates beginning on March 19, 2013, is integral to the Seven-Year Rate Plan, which contemplates amortization of the regulatory liability balance at the in-service date to be used to mitigate customer rate impacts through 2020, based on a fixed amortization schedule that requires approval by the Mississippi PSC. Under the Seven-Year Rate Plan filing, the Company proposed annual rate recovery to remain the same from 2014 through 2020. At the time of the filing of the Seven-Year Rate Plan, the proposed revenue requirement approximated the forecasted cost of service for the period 2014 through 2020. Under the Company's proposal, to the extent that the actual annual cost of service differs from the forecast approved in the Seven-Year Rate Plan, the difference would be deferred as a regulatory asset or liability, subject to accrual of carrying costs, and would be included in the next year's rate recovery calculation. If any deferred balance remains at the end of the Seven-Year Rate Plan term, the Mississippi PSC will review the amount and determine the appropriate method and period of disposition.
The revenue requirements set forth in the Seven-Year Rate Plan assume the sale of a 15% undivided interest in the Kemper IGCC to SMEPA and utilization of bonus depreciation as provided by the American Taxpayer Relief Act of 2012 (ATRA), which currently requires that the Kemper IGCC be placed in service in 2014. See "Income Tax Matters – Bonus Depreciation" herein for additional information.
In 2014, the Company plans to amend the Seven-Year Rate Plan to reflect changes including the revised in-service date, the change in expected benefits relating to tax credits, various other revenue requirement items, and other tax matters, which include ensuring compliance with the normalization requirements of the Internal Revenue Code. The impact of these revisions for the average annual retail revenue requirement is estimated to be approximately $35 million through 2020. The amendment to the Seven-Year Rate Plan is also expected to reflect rate mitigation options identified by the Company that, if approved by the Mississippi PSC, would result in no change to the total customer rate impacts contemplated in the original Seven-Year Rate Plan.
Further cost increases and/or schedule extensions with respect to the Kemper IGCC could have an adverse impact on the Seven-Year Rate Plan, such as the inability to recover items considered as Cost Cap Exceptions, potential costs subject to securitization financing in excess of $1.0 billion, and the loss of certain tax benefits related to bonus depreciation. While the Kemper IGCC is scheduled to be placed in service in the fourth quarter 2014, any schedule extension beyond 2014 would result in the loss of the tax benefits related to bonus depreciation. The estimated value of the bonus depreciation tax benefits to retail customers is approximately $200 million. Loss of these tax benefits would require further adjustment to the Seven-Year Rate Plan and approval by the Mississippi PSC to ensure compliance with the normalization requirements of the Internal Revenue Code. In the event that the Mississippi PSC does not approve or the Company withdraws the Seven-Year Rate Plan, the Company would seek rate recovery through an alternate means, which could include a traditional rate case.
Prudence Reviews
The Mississippi PSC’s prudence review of Kemper IGCC costs incurred through March 31, 2013, as provided for in the Settlement Agreement, is expected to occur in the second quarter 2014. A final review of all costs incurred after March 31, 2013 is expected to be completed within six months of the Kemper IGCC’s in-service date. Furthermore, regardless of any prudence determinations made during the construction and start-up period, the Mississippi PSC has the right to make a final prudence determination after the Kemper IGCC has been placed in service.
Regulatory Assets
Consistent with the treatment of non-capital costs incurred during the pre-construction period, the Mississippi PSC granted the Company the authority to defer all non-capital Kemper IGCC-related costs to a regulatory asset during the construction period, subject to review of such costs by the Mississippi PSC. The amortization period for any such costs approved for recovery will be determined by the Mississippi PSC at a later date. In addition, the Company is authorized to accrue carrying costs on the unamortized balance of such regulatory assets at a rate and in a manner to be determined by the Mississippi PSC in future cost recovery mechanism proceedings.
II-369
MANAGEMENT'S DISCUSSION AND ANALYSIS (continued)
Mississippi Power Company 2013 Annual Report
Lignite Mine and CO
2
Pipeline Facilities
In conjunction with the Kemper IGCC, the Company will own the lignite mine and equipment and has acquired and will continue to acquire mineral reserves located around the Kemper IGCC site. The mine started commercial operation on June 5, 2013.
In 2010, the Company executed a 40-year management fee contract with Liberty Fuels Company, LLC, a wholly-owned subsidiary of The North American Coal Corporation (Liberty Fuels), which will develop, construct, and manage the mining operations. The contract with Liberty Fuels is effective through the end of the mine reclamation. As the mining permit holder, Liberty Fuels has a legal obligation to perform mine reclamation and the Company has a contractual obligation to fund all reclamation activities. In addition to the obligation to fund the reclamation activities, the Company currently provides working capital support to Liberty Fuels through cash advances for capital purchases, payroll, and other operating expenses. See Note 1 under "Asset Retirement Obligations and Other Costs of Removal" for additional information.
In addition, the Company will acquire, construct, and operate the CO
2
pipeline for the planned transport of captured CO
2
for use in enhanced oil recovery. The Company has entered into agreements with Denbury Onshore (Denbury), a subsidiary of Denbury Resources Inc., and Treetop Midstream Services, LLC (Treetop), an affiliate of Tellus Operating Group, LLC and a subsidiary of Tengrys, LLC, pursuant to which Denbury will purchase 70% of the CO
2
captured from the Kemper IGCC and Treetop will purchase 30% of the CO
2
captured from the Kemper IGCC.
The ultimate outcome of these matters cannot be determined at this time.
Proposed Sale of Undivided Interest to SMEPA
In 2010, the Company and SMEPA entered into an asset purchase agreement whereby SMEPA agreed to purchase a 17.5% undivided interest in the Kemper IGCC. In February 2012, the Mississippi PSC approved the sale and transfer of 17.5% of the Kemper IGCC to SMEPA. In June 2012, the Company and SMEPA signed an amendment to the asset purchase agreement whereby SMEPA reduced its purchase commitment percentage from a 17.5% to a 15% undivided interest in the Kemper IGCC. On March 29, 2013, the Company and SMEPA signed an amendment to the asset purchase agreement whereby the Company and SMEPA agreed to amend the power supply agreement entered into by the parties in April 2011 to reduce the capacity amounts to be received by SMEPA by half (approximately 75 MWs) at the sale and transfer of the undivided interest in the Kemper IGCC to SMEPA. Capacity revenues under the April 2011 power supply agreement were $17.5 million in 2013. On December 24, 2013, the Company and SMEPA agreed to extend SMEPA's option to purchase through December 31, 2014. The sale and transfer of an interest in the Kemper IGCC to SMEPA is subject to approval by the Mississippi PSC.
The closing of this transaction is conditioned upon execution of a joint ownership and operating agreement, receipt of all construction permits, appropriate regulatory approvals, financing, and other conditions. In September 2012, SMEPA received a conditional loan commitment from Rural Utilities Service to provide funding for SMEPA's undivided interest in the Kemper IGCC.
In March 2012 and subsequent to December 31, 2013, the Company received $150 million and $75 million, respectively, of interest-bearing refundable deposits from SMEPA to be applied to the purchase. While the expectation is that these amounts will be applied to the purchase price at closing, the Company would be required to refund the deposits upon the termination of the asset purchase agreement, within 60 days of a request by SMEPA for a full or partial refund, or within 15 days at SMEPA's discretion in the event that the Company is assigned a senior unsecured credit rating of BBB+ or lower by Standard and Poor's Ratings Services, a division of The McGraw Hill Companies, Inc. (S&P) or Baa1 or lower by Moody's Investors Service, Inc. (Moody's) or ceases to be rated by either of these rating agencies. Given the interest-bearing nature of the deposit and SMEPA's ability to request a refund, the March 2012 deposit has been presented as a current liability in the balance sheet and as financing proceeds in the statement of cash flow. On July 18, 2013, Southern Company entered into an agreement with SMEPA under which Southern Company has agreed to guarantee the obligations of the Company with respect to any required refund of the deposits.
The ultimate outcome of these matters cannot be determined at this time.
Income Tax Matters
Bonus Depreciation
On January 2, 2013, the ATRA was signed into law. The ATRA retroactively extended several tax credits through 2013 and extended 50% bonus depreciation for property placed in service in 2013 (and for certain long-term production-period projects to be placed in service in 2014), which is expected to apply to the Kemper IGCC and have a positive impact on the future cash flows of the Company through 2014. The extension of 50% bonus depreciation had a positive impact on the Company's cash flows of approximately $89 million in 2013 and is expected to have a positive impact of between $560 million and $620 million in 2014. These estimated positive cash flow impacts are dependent upon placing the Kemper IGCC in service in 2014. See "Integrated
II-370
MANAGEMENT'S DISCUSSION AND ANALYSIS (continued)
Mississippi Power Company 2013 Annual Report
Coal Gasification Combined Cycle" for additional information on factors which could result in changes to the scheduled in-service date of the Kemper IGCC and result in the loss of the tax benefits related to bonus depreciation.
Investment Tax Credits
The Internal Revenue Service (IRS) allocated $133 million (Phase I) and $279 million (Phase II) of Internal Revenue Code Section 48A tax credits to the Company in connection with the Kemper IGCC. On May 15, 2013, the IRS notified the Company that no additional tax credits under the Internal Revenue Code Section 48A Phase III were allocated to the Kemper IGCC. As a result of the schedule extension for the Kemper IGCC, the Phase I credits have been recaptured. Through December 31, 2013, the Company had recorded tax benefits totaling $276.4 million for the remaining Phase II credits, which will be amortized as a reduction to depreciation and amortization over the life of the Kemper IGCC and are dependent upon meeting the IRS certification requirements, including an in-service date no later than April 19, 2016 and the capture and sequestration (via enhanced oil recovery) of at least 65%
of the CO
2
produced by the Kemper IGCC during operations in accordance with the Internal Revenue Code. A portion of the Phase II tax credits will be subject to recapture upon successful completion of SMEPA's purchase of an undivided interest in the Kemper IGCC as described above.
The ultimate outcome of these matters cannot be determined at this time.
Other Matters
The Company is involved in various other matters being litigated and regulatory matters that could affect future earnings. In addition, the Company is subject to certain claims and legal actions arising in the ordinary course of business. The Company's business activities are subject to extensive governmental regulation related to public health and the environment, such as regulation of air emissions and water discharges. Litigation over environmental issues and claims of various types, including property damage, personal injury, common law nuisance, and citizen enforcement of environmental requirements, such as air quality and water standards, has increased generally throughout the U.S. In particular, personal injury, property damage, and other claims for damages alleged to have been caused by CO
2
and other emissions, coal combustion residuals, and alleged exposure to hazardous materials, and/or requests for injunctive relief in connection with such matters, have become more frequent.
The ultimate outcome of such pending or potential litigation against the Company cannot be predicted at this time; however, for current proceedings not specifically reported herein or in Note 3 to the financial statements, management does not anticipate that the ultimate liabilities, if any, arising from such current proceedings would have a material effect on the Company's financial statements. See Note 3 to the financial statements for a discussion of various other contingencies, regulatory matters, and other matters being litigated which may affect future earnings potential.
On February 6, 2013, the Company submitted a claim under the Deepwater Horizon Economic and Property Damages Settlement Agreement associated with the oil spill that occurred in April 2010 in the Gulf of Mexico. The ultimate outcome of this matter cannot be determined at this time.
ACCOUNTING POLICIES
Application of Critical Accounting Policies and Estimates
The Company prepares its financial statements in accordance with GAAP. Significant accounting policies are described in Note 1 to the financial statements. In the application of these policies, certain estimates are made that may have a material impact on the Company's results of operations and related disclosures. Different assumptions and measurements could produce estimates that are significantly different from those recorded in the financial statements. Senior management has reviewed and discussed the following critical accounting policies and estimates with the Audit Committee of Southern Company's Board of Directors.
Electric Utility Regulation
The Company is subject to retail regulation by the Mississippi PSC and wholesale regulation by the FERC. These regulatory agencies set the rates the Company is permitted to charge customers based on allowable costs. As a result, the Company applies accounting standards which require the financial statements to reflect the effects of rate regulation. Through the ratemaking process, the regulators may require the inclusion of costs or revenues in periods different than when they would be recognized by a non-regulated company. This treatment may result in the deferral of expenses and the recording of related regulatory assets based on anticipated future recovery through rates or the deferral of gains or creation of liabilities and the recording of related regulatory liabilities. The application of the accounting standards has a further effect on the Company's financial statements as a result of the estimates of allowable costs used in the ratemaking process. These estimates may differ from those actually incurred by the Company; therefore, the accounting estimates inherent in specific costs such as depreciation and pension and
II-371
MANAGEMENT'S DISCUSSION AND ANALYSIS (continued)
Mississippi Power Company 2013 Annual Report
postretirement benefits have less of a direct impact on the Company's results of operations and financial condition than they would on a non-regulated company.
As reflected in Note 1 to the financial statements, significant regulatory assets and liabilities have been recorded. Management reviews the ultimate recoverability of these regulatory assets and any requirement to refund these regulatory liabilities based on applicable regulatory guidelines and GAAP. However, adverse legislative, judicial, or regulatory actions could materially impact the amounts of such regulatory assets and liabilities and could adversely impact the Company's financial statements.
Contingent Obligations
The Company is subject to a number of federal and state laws and regulations, as well as other factors and conditions that subject it to environmental, litigation, and other risks. See FUTURE EARNINGS POTENTIAL herein and Note 3 to the financial statements for more information regarding certain of these contingencies. The Company periodically evaluates its exposure to such risks and, in accordance with GAAP, records reserves for those matters where a non-tax-related loss is considered probable and reasonably estimable. The adequacy of reserves can be significantly affected by external events or conditions that can be unpredictable; thus, the ultimate outcome of such matters could materially affect the Company's financial statements.
Unbilled Revenues
Revenues related to the retail sale of electricity are recorded when electricity is delivered to customers. However, the determination of KWH sales to individual customers is based on the reading of their meters, which is performed on a systematic basis throughout the month. At the end of each month, amounts of electricity delivered to customers, but not yet metered and billed, are estimated. Components of the unbilled revenue estimates include total KWH territorial supply, total KWH billed, estimated total electricity lost in delivery, and customer usage. These components can fluctuate as a result of a number of factors including weather, generation patterns, power delivery volume, and other operational constraints. These factors can be unpredictable and can vary from historical trends. As a result, the overall estimate of unbilled revenues could be significantly affected, which could have a material impact on the Company's results of operations.
Pension and Other Postretirement Benefits
The Company's calculation of pension and other postretirement benefits expense is dependent on a number of assumptions. These assumptions include discount rates, healthcare cost trend rates, expected long-term return on plan assets, mortality rates, expected salary and wage increases, and other factors. Components of pension and other postretirement benefits expense include interest and service cost on the pension and other postretirement benefit plans, expected return on plan assets, and amortization of certain unrecognized costs and obligations. Actual results that differ from the assumptions utilized are accumulated and amortized over future periods and, therefore, generally affect recognized expense and the recorded obligation in future periods. While the Company believes that the assumptions used are appropriate, differences in actual experience or significant changes in assumptions would affect its pension and other postretirement benefits costs and obligations.
Key elements in determining the Company's pension and other postretirement benefit expense in accordance with GAAP are the expected long-term return on plan assets and the discount rate used to measure the benefit plan obligations and the periodic benefit plan expense for future periods. The expected long-term return on postretirement benefit plan assets is based on the Company's investment strategy, historical experience, and expectations for long-term rates of return that consider external actuarial advice. The Company determines the long-term return on plan assets by applying the long-term rate of expected returns on various asset classes to the Company's target asset allocation. The Company discounts the future cash flows related to its postretirement benefit plans using a single-point discount rate developed from the weighted average of market-observed yields for high quality fixed income securities with maturities that correspond to expected benefit payments.
A 25 basis point change in any significant assumption (discount rate, salaries, or long-term return on plan assets) would result in a $1.3 million or less change in total annual benefit expense and a $16.5 million or less change in projected obligations.
Allowance for Funds Used During Construction
In accordance with regulatory treatment, the Company records AFUDC, which represents the estimated debt and equity costs of capital funds that are necessary to finance the construction of new regulated facilities. While cash is not realized currently from such allowance, AFUDC increases the revenue requirement over the service life of the plant through a higher rate base and higher depreciation. The equity component of AFUDC is not included in the calculation of taxable income. The average annual AFUDC rate was
6.89%
,
7.04%
, and
7.06%
for the years ended
December 31, 2013
,
2012
, and
2011
, respectively. The AFUDC rate is applied to CWIP consistent with jurisdictional regulatory treatment.
II-372
MANAGEMENT'S DISCUSSION AND ANALYSIS (continued)
Mississippi Power Company 2013 Annual Report
Kemper IGCC Estimated Construction Costs, Project Completion Date, and Rate Recovery
The Company estimates the scheduled in-service date for the Kemper IGCC to be the fourth quarter 2014 and has revised its cost estimate to complete construction above the $2.88 billion cost cap, net of the DOE Grants and excluding the Cost Cap Exceptions. The Company does not intend to seek rate recovery or any joint owner contributions for any related costs that exceed the $2.88 billion cost cap, net of the DOE Grants and excluding the Cost Cap Exceptions. As a result of the revisions to the cost estimate, the Company recorded pretax charges of $78 million in 2012 and $1.10 billion in 2013. In subsequent periods, any further changes in the estimated costs to complete construction of the Kemper IGCC subject to the $2.88 billion cost cap will be reflected in the statements of income and these changes could be material. The Company could experience further construction cost increases and/or schedule extensions with respect to the Kemper IGCC as a result of factors including, but not limited to, labor costs and productivity, adverse weather conditions, shortages and inconsistent quality of equipment, materials, and labor, contractor or supplier delay, or non-performance under construction or other agreements. Furthermore, the Company could also experience further schedule extensions associated with start-up activities for this "first-of-a-kind" technology, including major equipment failure, system integration, and operations, and/or unforeseen engineering problems, which would result in further cost increases.
Given the significant judgment involved in estimating the future costs to complete construction, the project completion date, the ultimate rate recovery for the Kemper IGCC, and the potential impact on the results of operations, the Company considers these items to be critical accounting estimates. See FUTURE EARNINGS POTENTIAL – "Integrated Coal Gasification Combined Cycle" herein and Note 3 to the financial statements under "Integrated Coal Gasification Combined Cycle" for additional information.
FINANCIAL CONDITION AND LIQUIDITY
Overview
Although earnings in 2013 were negatively affected by revisions to the cost estimate for the Kemper IGCC, the Company's financial condition remained stable at
December 31, 2013
. These charges for the year ended December 31, 2013 have resulted in cash expenditures of
$375.1 million
with no recovery as of December 31, 2013 and are expected to result in future cash expenditures (primarily in 2014) of approximately $805 million with no recovery. In 2013, the Company received $1.1 billion in capital contributions from Southern Company. The Company's cash requirements primarily consist of funding ongoing operations, common stock dividends, capital expenditures, and debt maturities. Capital expenditures and other investing activities include investments to meet projected long-term demand requirements, to comply with environmental regulations, and for restoration following major storms. Operating cash flows provide a substantial portion of the Company's cash needs. For the three-year period from 2014 through 2016, the Company's projected common stock dividends, capital expenditures, and debt maturities are expected to exceed operating cash flows. In addition to the Kemper IGCC, projected capital expenditures in that period include investments to maintain existing generation facilities, to add environmental equipment for existing generating units, and to expand and improve transmission and distribution facilities. The Company plans to finance future cash needs in excess of its operating cash flows primarily through debt and equity issuances. The Company intends to continue to monitor its access to short-term and long-term capital markets as well as its bank credit arrangements to meet future capital and liquidity needs. See "Sources of Capital," "Financing Activities," and "Capital Requirements and Contractual Obligations" herein for additional information.
The Company's investments in the qualified pension plan remained stable in value as of December 31, 2013 as compared to December 31, 2012. No contributions to the qualified pension plan were made for the year ended December 31, 2013. No mandatory contributions to the qualified pension plan are anticipated for the year ending December 31, 2014.
Net cash provided from operating activities totaled $447.6 million for 2013, an increase of $212.2 million as compared to the corresponding period in 2012. The increase in net cash provided from operating activities was primarily due to an increase in investment tax credits received related to the Kemper IGCC, increases in rate recovery related to the Kemper IGCC, and decreases in fossil fuel stock, partially offset by a decrease in over-recovered regulatory clause revenues and an increase in regulatory assets associated with the Kemper IGCC. Net cash provided from operating activities totaled $235.4 million for 2012, an increase of $3.9 million as compared to the corresponding period in 2011. The increase in net cash provided from operating activities was primarily due to an increase in investment tax credits received related to the Kemper IGCC and an increase in over recovered regulatory clause revenues. The increase in cash provided from operating activities was partially offset by a contribution to the qualified pension plan in 2012, payments for fuel stock, and the settlement of interest rate swaps.
Net cash used for investing activities totaled $1.6 billion for 2013 primarily due to gross property additions primarily related to the Kemper IGCC and the Plant Daniel scrubber, partially offset by proceeds from asset sales. Net cash used for investing activities totaled $1.5 billion for 2012 primarily due to an increase in property additions primarily related to the Kemper IGCC, partially offset by a decrease in restricted cash, a decrease in capital grant proceeds received primarily related to the DOE Grants
II-373
MANAGEMENT'S DISCUSSION AND ANALYSIS (continued)
Mississippi Power Company 2013 Annual Report
and Smart Grid Investment grants, and a decrease in plant acquisition due to the cash payment associated with the purchase of Plant Daniel Units 3 and 4 in 2011.
Net cash provided from financing activities totaled $1.2 billion in 2013 primarily due to an increase in capital contributions from Southern Company and an increase in long-term debt financings, partially offset by redemptions of long-term debt. Net cash provided from financing activities totaled $1.2 billion in 2012 primarily due to an increase in capital contributions from Southern Company, an increase in long-term debt, and the receipt of an interest bearing refundable deposit related to a pending asset sale, partially offset by redemptions of long-term debt.
Significant balance sheet changes as of December 31, 2013 compared to 2012 include an increase in total property, plant, and equipment of $585.6 million, primarily due to the Kemper IGCC, and a decrease in fossil fuel stock of $63.1 million. Prepaid income taxes, accumulated deferred income taxes, and accumulated deferred investment tax credits decreased $95.1 million, $172.2 million, and $86.3 million, respectively, primarily due to the estimated probable losses on the Kemper IGCC and the recapture of the Phase I investment tax credits. Long-term debt increased $602.6 million primarily due to the issuance of $600.0 million of bank notes and the addition of the Kemper IGCC capital lease obligation relating to the nitrogen supply agreement of $79.7 million, partially offset by $82.6 million of revenue bonds paid at maturity. Total common stockholder’s equity increased $427.3 million due to a $975.1 million increase in paid-in capital, partially offset by a $548.6 million decrease in retained earnings, which was primarily due to the estimated probable losses on the Kemper IGCC. The increase in paid-in capital was primarily due to $1.1 billion in capital contributions from Southern Company.
The Company's ratio of common equity to total capitalization, excluding long-term debt due within one year, decreased from 52.3% in 2012 to 49.7% at December 31, 2013.
Sources of Capital
Except as described herein, the Company plans to obtain the funds required for construction and other purposes from sources similar to those used in the past, which were primarily from operating cash flows, security issuances, term loans, short-term debt, and equity contributions from Southern Company. However, the amount, type, and timing of any future financings, if needed, will depend upon regulatory approval, prevailing market conditions, and other factors. See "Capital Requirements and Contractual Obligations" herein for additional information.
The Company has received $245.3 million of DOE Grants that were used for the construction of the Kemper IGCC. An additional $25 million of DOE Grants is expected to be received for the initial operation of the Kemper IGCC. See Note 3 to the financial statements under "Integrated Coal Gasification Combined Cycle" for information regarding legislation related to the securitization of certain costs of the Kemper IGCC.
The issuance of securities by the Company is subject to regulatory approval by the FERC. Additionally, with respect to the public offering of securities, the Company files registration statements with the U.S. Securities and Exchange Commission (SEC) under the Securities Act of 1933, as amended (1933 Act). The amounts of securities authorized by the FERC, as well as the amounts registered under the 1933 Act, are continuously monitored and appropriate filings are made to ensure flexibility in raising capital.
The Company obtains financing separately without credit support from any affiliate. See Note 6 to the financial statements under "Bank Credit Arrangements" for additional information. The Southern Company system does not maintain a centralized cash or money pool. Therefore, funds of the Company are not commingled with funds of any other company in the Southern Company system.
The Company's current liabilities frequently exceed current assets because of the continued use of short-term obligations as a funding source to meet scheduled maturities of long-term debt, as well as cash needs, which can fluctuate significantly due to the seasonality of the Company's business.
At December 31, 2013, the Company had approximately $145.2 million of cash and cash equivalents. Committed credit arrangements with banks at December 31, 2013 were as follows:
|
Expires
(a)
|
Executable
Term-Loans
|
Due Within One Year
|
||||||||||||||||||||||||||||
|
2014
|
2016
|
Total
|
Unused
|
One
Year
|
Two
Years
|
Term Out
|
No Term Out
|
|||||||||||||||||||||||
|
(in millions)
|
||||||||||||||||||||||||||||||
|
$
|
135
|
|
$
|
165
|
|
$
|
300
|
|
$
|
300
|
|
$
|
25
|
|
$
|
40
|
|
$
|
65
|
|
$
|
70
|
|
|||||||
|
(a)
|
No credit arrangements expire in 2015, 2017, or 2018.
|
See Note 6 to the financial statements under "Bank Credit Arrangements" for additional information.
II-374
MANAGEMENT'S DISCUSSION AND ANALYSIS (continued)
Mississippi Power Company 2013 Annual Report
Most of these arrangements contain covenants that limit debt levels and typically contain cross default provisions to other indebtedness (including guarantee obligations) of the Company. Such cross default provisions to other indebtedness would trigger an event of default if the Company defaulted on indebtedness or guarantee obligations over a specified threshold. The Company is currently in compliance with all such covenants. None of the arrangements contain material adverse change clauses at the time of borrowing. The Company expects to renew its credit arrangements, as needed prior to expiration.
A portion of the $300 million unused credit arrangements with banks is allocated to provide liquidity support to the Company's variable rate pollution control revenue bonds and commercial paper borrowings. The amount of variable rate pollution control revenue bonds outstanding requiring liquidity support as of December 31, 2013 was $40.1 million.
The Company may also meet short-term cash needs through a Southern Company subsidiary organized to issue and sell commercial paper at the request and for the benefit of the Company and the other traditional operating companies. Proceeds from such issuances for the benefit of the Company are loaned directly to the Company. The obligations of each traditional operating company under these arrangements are several and there is no cross affiliate credit support.
Details of short-term borrowings were as follows:
|
Commercial Paper at the End of the Period
|
Commercial Paper During the Period
(a)
|
||||||||||||||||
|
Amount Outstanding
|
Weighted Average Interest Rate
|
Average Outstanding
|
Weighted Average Interest Rate
|
Maximum Amount Outstanding
|
|||||||||||||
|
(in millions)
|
|
(in millions)
|
|
(in millions)
|
|||||||||||||
|
December 31, 2013
|
$
|
—
|
|
—
|
%
|
$
|
23
|
|
0.2
|
%
|
$
|
148
|
|
||||
|
December 31, 2012
|
$
|
—
|
|
—
|
%
|
$
|
—
|
|
—
|
%
|
$
|
—
|
|
||||
|
December 31, 2011
|
$
|
—
|
|
—
|
%
|
$
|
7
|
|
0.2
|
%
|
$
|
70
|
|
||||
(a) Average and maximum amounts are based upon daily balances during the twelve-month periods ended December 31.
Management believes that the need for working capital can be adequately met by utilizing commercial paper programs, lines of credit, and cash.
Financing Activities
In addition to any financings that may be necessary to meet capital requirements, contractual obligations, and storm restoration costs, the Company plans to continue, when economically feasible, a program to retire higher-cost securities and replace these obligations with lower-cost capital if market conditions permit.
Bank Term Loans
In November 2012, the Company entered into a 366-day $100 million aggregate principal amount floating rate bank loan bearing interest based on one-month London Interbank Offered Rate (LIBOR). The first advance in the amount of $50 million was made in November 2012. In January 2013, the second advance in the amount of $50 million was made. In September 2013, the Company amended the bank loan, which extended the maturity date to 2015. The proceeds of this loan were used for working capital and other general corporate purposes, including the Company's continuous construction program.
In March 2013, the Company entered into four two-year floating rate bank loans bearing interest based on one-month LIBOR. These term loans were for an aggregate principal amount of $300 million and proceeds were used for working capital and other general corporate purposes, including the Company's continuous construction program.
In September 2013, the Company entered into a two-year floating rate bank loan bearing interest based on one-month LIBOR. The term loan was for $125 million aggregate principal amount and proceeds were used to repay at maturity a two-year floating rate bank loan in the aggregate principal amount of $125 million.
Subsequent to December 31, 2013, the Company entered into an 18-month floating rate bank loan bearing interest based on one-month LIBOR. The term loan was for $250 million aggregate principal amount, and proceeds were used for working capital and other general corporate purposes, including the Company's continuous construction program.
These bank loans and the other revenue bonds described below have covenants that limit debt levels to
65%
of total capitalization, as defined in the agreements. For purposes of these definitions, debt excludes the long-term debt payable to affiliated trusts, other hybrid securities, and securitized debt relating to the securitization of certain costs of the Kemper IGCC. At
December 31, 2013
, the Company was in compliance with its debt limits.
II-375
MANAGEMENT'S DISCUSSION AND ANALYSIS (continued)
Mississippi Power Company 2013 Annual Report
In addition, these bank loans and the other revenue bonds described below contain cross default provisions to other indebtedness (including guarantee obligations) that would be triggered if the Company defaulted on indebtedness above a specified threshold. The Company is currently in compliance with all such covenants.
Senior Notes
In November 2013, the Company's $50.0 million aggregate principal amount of Series 2008A 6.0% Senior Notes due November 15, 2013 matured. These senior notes are effectively subordinated to all secured debt of the Company. See "Plant Daniel Revenue Bonds" below for additional information regarding the Company’s secured indebtedness.
Other Revenue Bonds
In March 2013 and July 2013, the Mississippi Business Finance Corporation (MBFC) issued $15.8 million and $15.3 million, respectively, aggregate principal amount of MBFC Taxable Revenue Bonds (Mississippi Power Company Project), Series 2012A. The proceeds were used to reimburse the Company for the cost of the acquisition, construction, equipping, installation, and improvement of certain equipment and facilities for the lignite mining facility related to the Kemper IGCC. In September 2013, the MBFC Taxable Revenue Bonds (Mississippi Power Company Project), Series 2012A of $40.07 million, Series 2012B of $21.25 million, and Series 2012C of $21.25 million were paid at maturity.
In November 2013, the MBFC entered into an agreement to issue up to $33.75 million aggregate principal amount of MBFC Taxable Revenue Bonds, Series 2013A (Mississippi Power Company Project) and up to $11.25 million aggregate principal amount of MBFC Taxable Revenue Bonds, Series 2013B (Mississippi Power Company Project) for the benefit of the Company. In November 2013, the MBFC issued $11.25 million aggregate principal amount of MBFC Taxable Revenue Bonds (Mississippi Power Company Project), Series 2013B for the benefit of the Company. The proceeds were used to reimburse the Company for the cost of the acquisition, construction, equipping, installation, and improvement of certain equipment and facilities for the lignite mining facility related to the Kemper IGCC. Any future issuances of the Series 2013A bonds will be used for this same purpose.
Other Obligations
In March 2012 and subsequent to December 31, 2013, the Company received $150 million and $75 million, respectively, of interest-bearing refundable deposits from SMEPA to be applied to the sale price for the pending sale of an undivided interest in the Kemper IGCC. Until the sale is closed, the deposits bear interest at the Company's AFUDC rate adjusted for income taxes, which was 9.932% per annum for 2013 and 9.967% per annum for 2012, and are refundable to SMEPA upon termination of the asset purchase agreement related to such purchase, within 60 days of a request by SMEPA for a full or partial refund, or within 15 days at SMEPA's discretion in the event that the Company is assigned a senior unsecured credit rating of BBB+ or lower by S&P or Baa1 or lower by Moody's or ceases to be rated by either of these rating agencies. In July 2013, Southern Company entered into an agreement with SMEPA under which Southern Company has agreed to guarantee the obligations of the Company with respect to any required refund of the deposits.
In September 2013, the Company entered into a nitrogen supply agreement for the air separation unit of the Kemper IGCC, which resulted in a capital lease obligation at inception of $82.9 million with an annual interest rate of 4.9%. Assets acquired under capital leases are recorded on the balance sheet as utility plant in service and the related obligations are classified as long-term debt.
Credit Rating Risk
The Company does not have any credit arrangements that would require material changes in payment schedules or terminations as a result of a credit rating downgrade. There are certain contracts that could require collateral, but not accelerated payment, in the event of a credit rating change to below BBB- and/or Baa3. These contracts are for physical electricity sales, fuel transportation and storage, emissions allowances, and energy price risk management. At
December 31, 2013
, the maximum potential collateral requirements under these contracts at a rating below BBB- and/or Baa3 were approximately $243 million. Included in these amounts are certain agreements that could require collateral in the event that one or more Southern Company system power pool participants has a credit rating change to below investment grade. Generally, collateral may be provided by a Southern Company guaranty, letter of credit, or cash. Additionally, any credit rating downgrade could impact the Company's ability to access capital markets, particularly the short-term debt market and the variable rate pollution control revenue bond market.
In March 2012 and subsequent to December 31, 2013, the Company received $150 million and $75 million, respectively, of interest-bearing refundable deposits from SMEPA to be applied to the sale price for the pending sale of an undivided interest in the Kemper IGCC. Until the acquisition is closed, the deposits bear interest at the Company's AFUDC rate adjusted for income taxes, which was 9.932% per annum for 2013 and 9.967% per annum for 2012, and are refundable to SMEPA upon termination of
II-376
MANAGEMENT'S DISCUSSION AND ANALYSIS (continued)
Mississippi Power Company 2013 Annual Report
the asset purchase agreement related to such purchase, within 60 days of a request by SMEPA for a full or partial refund, or within 15 days at SMEPA's discretion in the event that the Company is assigned a senior unsecured credit rating of BBB+ or lower by S&P or Baa1 or lower by Moody's or ceases to be rated by either of these rating agencies. On July 18, 2013, Southern Company entered into an agreement with SMEPA under which Southern Company has agreed to guarantee the obligations of the Company with respect to any required refund of the deposits.
On May 24, 2013, S&P revised the ratings outlook for Southern Company and the traditional operating companies, including the Company, from stable to negative.
On August 6, 2013, Moody's downgraded the senior unsecured debt and preferred stock ratings of the Company to Baa1 from A3 and to Baa3 from Baa2, respectively. Moody's maintained the stable ratings outlook for the Company.
On August 6, 2013, Fitch Ratings, Inc. affirmed the senior unsecured debt and preferred stock ratings of the Company and revised the ratings outlook for the Company from stable to negative.
Market Price Risk
Due to cost-based rate regulation and other various cost recovery mechanisms, the Company continues to have limited exposure to market volatility in interest rates, foreign currency exchange rates, commodity fuel prices, and prices of electricity. To manage the volatility attributable to these exposures, the Company nets the exposures, where possible, to take advantage of natural offsets and enters into various derivative transactions for the remaining exposures pursuant to the Company's policies in areas such as counterparty exposure and risk management practices. The Company's policy is that derivatives are to be used primarily for hedging purposes and mandates strict adherence to all applicable risk management policies. Derivative positions are monitored using techniques that include, but are not limited to, market valuation, value at risk, stress testing, and sensitivity analysis.
To mitigate future exposure to changes in interest rates, the Company enters into derivatives that have been designated as hedges. The weighted average interest rate on $576.3 million of outstanding variable rate long-term debt at December 31, 2013 was 0.87%. If the Company sustained a 100 basis point change in interest rates for all unhedged variable rate long-term debt, the change would affect annualized interest expense by approximately $5.8 million at January 1, 2014. See Note 1 to the financial statements under "Financial Instruments" and Note 10 to the financial statements for additional information.
To mitigate residual risks relative to movements in electricity prices, the Company enters into physical fixed-price contracts for the purchase and sale of electricity through the wholesale electricity market and, to a lesser extent, financial hedge contracts for natural gas purchases. The Company continues to manage retail fuel-hedging programs implemented per the guidelines of the Mississippi PSC and wholesale fuel-hedging programs under agreements with wholesale customers. The Company had no material change in market risk exposure for the year ended December 31, 2013 when compared to the December 31, 2012 reporting period.
The changes in fair value of energy-related derivative contracts are substantially attributable to both the volume and the price of natural gas. For the years ended December 31, the changes in fair value of energy-related derivative contracts, the majority of which are composed of regulatory hedges, were as follows:
|
2013
Changes
|
2012
Changes
|
||||||
|
Fair Value
|
|||||||
|
(in thousands)
|
|||||||
|
Contracts outstanding at the beginning of the period, assets (liabilities), net
|
$
|
(16,927
|
)
|
$
|
(50,990
|
)
|
|
|
Contracts realized or settled
|
11,271
|
|
43,326
|
|
|||
|
Current period changes
(a)
|
178
|
|
(9,263
|
)
|
|||
|
Contracts outstanding at the end of the period, assets (liabilities), net
|
$
|
(5,478
|
)
|
$
|
(16,927
|
)
|
|
|
(a)
|
Current period changes also include the changes in fair value of new contracts entered into during the period, if any.
|
II-377
MANAGEMENT'S DISCUSSION AND ANALYSIS (continued)
Mississippi Power Company 2013 Annual Report
The net hedge volumes of energy-related derivative contracts, all of which are natural gas swaps, for the years ended December 31 were as follows:
|
2013
|
2012
|
|||
|
mmBtu* Volume
|
||||
|
(in thousand)
|
||||
|
Total hedge volume
|
56,440
|
|
38,130
|
|
* million British thermal units (mmBtu)
The weighted average swap contract cost above market prices was approximately $0.10 per mmBtu as of December 31, 2013 and $0.44 per mmBtu as of December 31, 2012. There were no options outstanding as of the reporting periods presented. The costs associated with natural gas hedges are recovered through the Company's energy cost management clauses.
At December 31, 2013 and 2012, substantially all of the Company's energy-related derivative contracts were designated as regulatory hedges and are related to the Company's fuel-hedging program. Therefore, gains and losses are initially recorded as regulatory liabilities and assets, respectively, and then are included in fuel expense as they are recovered through the ECM clause. Gains and losses on energy-related derivatives that are designated as cash flow hedges are used to hedge anticipated purchases and sales and are initially deferred in other comprehensive income before being recognized in income in the same period as the hedged transaction. Gains and losses on energy-related derivative contracts that are not designated or fail to qualify as hedges are recognized in the statements of income as incurred and were not material for any year presented. The pre-tax gains and losses reclassified from other comprehensive income to revenue and fuel expense were not material for any period presented and are not expected to be material for 2014.
The Company uses over-the-counter contracts that are not exchange traded but are fair valued using prices which are market observable, and thus fall into Level 2. See Note 9 to the financial statements for further discussion of fair value measurements. The maturities of the energy-related derivative contracts, which are all Level 2 of the fair value hierarchy, at December 31, 2013 were as follows:
|
Fair Value Measurements
|
|||||||||||||||
|
December 31, 2013
|
|||||||||||||||
|
Total
Fair Value
|
Maturity
|
||||||||||||||
|
Year 1
|
Years 2&3
|
Years 4&5
|
|||||||||||||
|
(in thousands)
|
|||||||||||||||
|
Level 1
|
$
|
—
|
|
$
|
—
|
|
$
|
—
|
|
$
|
—
|
|
|||
|
Level 2
|
(5,478
|
)
|
(300
|
)
|
(4,020
|
)
|
(1,158
|
)
|
|||||||
|
Level 3
|
—
|
|
—
|
|
—
|
|
—
|
|
|||||||
|
Fair value of contracts outstanding at end of period
|
$
|
(5,478
|
)
|
$
|
(300
|
)
|
$
|
(4,020
|
)
|
$
|
(1,158
|
)
|
|||
The Company is exposed to market price risk in the event of nonperformance by counterparties to the energy-related derivative contracts. The Company only enters into agreements and material transactions with counterparties that have investment grade credit ratings by Moody's and S&P or with counterparties who have posted collateral to cover potential credit exposure. Therefore, the Company does not anticipate market risk exposure from nonperformance by the counterparties. For additional information, see Note 1 to the financial statements under "Financial Instruments" and Note 10 to the financial statements.
Capital Requirements and Contractual Obligations
The construction program of the Company is currently estimated to be $757 million for
2014
, $252 million for
2015
, and $249 million for
2016
. Included in the estimate for 2014 are expenditures related to the construction of the Kemper IGCC of $490 million, which is net of SMEPA's 15% proposed ownership share of the Kemper IGCC of approximately $555 million in 2014 (including construction costs for all prior years relating to its proposed ownership interest). Capital expenditures to comply with environmental statutes and regulations included in these estimated amounts are $154 million, $108 million, and $51 million for
2014
,
2015
, and
2016
, respectively. These estimated amounts also include capital expenditures covered under long-term service agreements.
See FUTURE EARNINGS POTENTIAL – "Environmental Matters – Environmental Statutes and Regulations" and – "Integrated Coal Gasification Combined Cycle" for additional information.
II-378
MANAGEMENT'S DISCUSSION AND ANALYSIS (continued)
Mississippi Power Company 2013 Annual Report
The construction program is subject to periodic review and revision, and actual construction costs may vary from these estimates because of numerous factors. These factors include: changes in business conditions; changes in load projections; storm impacts; changes in environmental statutes and regulations; the outcome of any legal challenges to environmental rules; changes in generating plants, including unit retirements and replacements and adding or changing fuel sources at existing units, to meet regulatory requirements; changes in FERC rules and regulations; Mississippi PSC approvals; changes in the expected environmental compliance program; changes in legislation; the cost and efficiency of construction labor, equipment, and materials; project scope and design changes; and the cost of capital. In addition, there can be no assurance that costs related to capital expenditures will be fully recovered. See Note 3 to the financial statements under "Integrated Coal Gasification Combined Cycle" for additional information and further risks related to the estimated schedule and costs and rate recovery for the Kemper IGCC.
In addition, as discussed in Note 2 to the financial statements, the Company provides postretirement benefits to substantially all employees and funds trusts to the extent required by the FERC.
Other funding requirements related to obligations associated with scheduled maturities of long-term debt, as well as the related interest, derivative obligations, preferred stock dividends, leases, and other purchase commitments are detailed in the contractual obligations table that follows. See Notes 1, 2, 5, 6, 7, and 10 to the financial statements for additional information.
II-379
MANAGEMENT'S DISCUSSION AND ANALYSIS (continued)
Mississippi Power Company 2013 Annual Report
Contractual Obligations
|
2014
|
2015-2016
|
2017-2018
|
After
2018
|
Total
|
|||||||||||||||
|
(in thousands)
|
|||||||||||||||||||
|
Long-term debt
(a)
—
|
|||||||||||||||||||
|
Principal
|
$
|
11,250
|
|
$
|
825,000
|
|
$
|
35,000
|
|
$
|
1,157,695
|
|
$
|
2,028,945
|
|
||||
|
Interest
|
75,050
|
|
144,598
|
|
123,159
|
|
783,899
|
|
1,126,706
|
|
|||||||||
|
Preferred stock dividends
(b)
|
1,733
|
|
3,465
|
|
3,465
|
|
—
|
|
8,663
|
|
|||||||||
|
Financial derivative obligations
(c)
|
3,652
|
|
5,399
|
|
1,230
|
|
—
|
|
10,281
|
|
|||||||||
|
Unrecognized tax benefits
(d)
|
3,840
|
|
—
|
|
—
|
|
—
|
|
3,840
|
|
|||||||||
|
Operating leases
(e)
|
10,181
|
|
2,457
|
|
513
|
|
—
|
|
13,151
|
|
|||||||||
|
Capital leases
(f)
|
2,539
|
|
5,467
|
|
6,029
|
|
68,182
|
|
82,217
|
|
|||||||||
|
Purchase commitments —
|
|||||||||||||||||||
|
Capital
(g)
|
757,255
|
|
494,179
|
|
—
|
|
—
|
|
1,251,434
|
|
|||||||||
|
Fuel
(h)
|
288,228
|
|
350,996
|
|
213,902
|
|
328,345
|
|
1,181,471
|
|
|||||||||
|
Long-term service agreements
(i)
|
22,512
|
|
43,181
|
|
19,045
|
|
138,755
|
|
223,493
|
|
|||||||||
|
Pension and other postretirement benefits plans
(j)
|
5,779
|
|
12,101
|
|
—
|
|
—
|
|
17,880
|
|
|||||||||
|
Total
|
$
|
1,182,019
|
|
$
|
1,886,843
|
|
$
|
402,343
|
|
$
|
2,476,876
|
|
$
|
5,948,081
|
|
||||
|
(a)
|
All amounts are reflected based on final maturity dates. The Company plans to continue to retire higher-cost securities and replace these obligations with lower-cost capital if market conditions permit. Variable rate interest obligations are estimated based on rates as of January 1, 2014, as reflected in the statements of capitalization. Fixed rates include, where applicable, the effects of interest rate derivatives employed to manage interest rate risk. Long-term debt excludes capital lease amounts (shown separately).
|
|
(b)
|
Preferred stock does not mature; therefore, amounts are provided for the next five years only.
|
|
(c)
|
For additional information, see Notes 1 and 10 to the financial statements.
|
|
(d)
|
See Note 5 to the financial statements under "Unrecognized Tax Benefits" for additional information.
|
|
(e)
|
See Note 7 to the financial statements for additional information.
|
|
(f)
|
Capital lease related to a 20-year nitrogen supply agreement for the Kemper IGCC. See Note 6 to the financial statements for additional information.
|
|
(g)
|
The Company provides estimated capital expenditures for a three-year period, including capital expenditures and compliance costs associated with environmental regulations. Estimates reflect the proposed sale of 15% of the Kemper IGCC to SMEPA. At December 31, 2013, significant purchase commitments were outstanding in connection with the construction program. These amounts exclude capital expenditures covered under long-term service agreements, which are reflected separately. See FUTURE EARNINGS POTENTIAL – "Environmental Matters – Environmental Statutes and Regulations" for additional information. See Note 3 to the financial statements under "Integrated Coal Gasification Combined Cycle" for additional information.
|
|
(h)
|
Includes commitments to purchase coal and natural gas, as well as the related transportation and storage. In most cases, these contracts contain provisions for price escalation, minimum purchase levels, and other financial commitments. Natural gas purchase commitments are based on various indices at the time of delivery. Amounts reflected for natural gas purchase commitments have been estimated based on the New York Mercantile Exchange future prices at December 31, 2013.
|
|
(i)
|
Long-term service agreements include price escalation based on inflation indices.
|
|
(j)
|
The Company forecasts contributions to the pension and other postretirement benefit plans over a three-year period. The Company anticipates no mandatory contributions to the qualified pension plan during the next three years. Amounts presented represent estimated benefit payments for the nonqualified pension plans, estimated non-trust benefit payments for the other postretirement benefit plans, and estimated contributions to the other postretirement benefit plan trusts, all of which will be made from the Company's corporate assets. See Note 2 to the financial statements for additional information related to the pension and other postretirement benefit plans, including estimated benefit payments. Certain benefit payments will be made through the related benefit plans. Other benefit payments will be made from the Company's corporate assets.
|
II-380
MANAGEMENT'S DISCUSSION AND ANALYSIS (continued)
Mississippi Power Company 2013 Annual Report
Cautionary Statement Regarding Forward-Looking Statements
The Company's 2013 Annual Report contains forward-looking statements. Forward-looking statements include, among other things, statements concerning retail sales, retail rates, customer growth, fuel and environmental cost recovery and other rate actions, current and proposed environmental regulations and related estimated expenditures, access to sources of capital, projections for the qualified pension plan and postretirement benefit plan, financing activities, completion of construction projects, plans and estimated costs for new generation resources, filings with state and federal regulatory authorities, impact of the ATRA, estimated sales and purchases under new power sale and purchase agreements, storm damage cost recovery and repairs, economic recovery, and estimated construction and other expenditures. In some cases, forward-looking statements can be identified by terminology such as "may," "will," "could," "should," "expects," "plans," "anticipates," "believes," "estimates," "projects," "predicts," "potential," or "continue" or the negative of these terms or other similar terminology. There are various factors that could cause actual results to differ materially from those suggested by the forward-looking statements; accordingly, there can be no assurance that such indicated results will be realized. These factors include:
|
•
|
the impact of recent and future federal and state regulatory changes, including legislative and regulatory initiatives regarding deregulation and restructuring of the electric utility industry, environmental laws including regulation of water, coal combustion residuals, and emissions of sulfur, nitrogen, carbon, soot, particulate matter, hazardous air pollutants, including mercury, and other substances, and also changes in tax and other laws and regulations to which the Company is subject, as well as changes in application of existing laws and regulations;
|
|
•
|
current and future litigation, regulatory investigations, proceedings, or inquiries, including FERC matters, the pending EPA civil action, and IRS and state tax audits;
|
|
•
|
the effects, extent, and timing of the entry of additional competition in the markets in which the Company operates;
|
|
•
|
variations in demand for electricity, including those relating to weather, the general economy and recovery from the recent recession, population and business growth (and declines), the effects of energy conservation measures, including from the development and deployment of alternative energy sources such as self-generation and distributed generation technologies, and any potential economic impacts resulting from federal fiscal decisions;
|
|
•
|
available sources and costs of fuels;
|
|
•
|
effects of inflation;
|
|
•
|
ability to control costs and avoid cost overruns during the development and construction of facilities, which includes the development and construction of facilities with designs that have not been finalized or previously constructed, including changes in labor costs and productivity factors, adverse weather conditions, shortages and inconsistent quality of equipment, material, and labor, contractor or supplier delay or non-performance under construction or other agreements, delays associated with start-up activities, including major equipment failure, system integration, and operations, and/or unforeseen engineering problems;
|
|
•
|
ability to construct facilities in accordance with the requirements of permits and licenses and to satisfy any operational and environmental performance standards, including the requirements of tax credits and other incentives;
|
|
•
|
investment performance of the Company's employee and retiree benefit plans;
|
|
•
|
advances in technology;
|
|
•
|
state and federal rate regulations and the impact of pending and future rate cases and negotiations, including rate actions relating to fuel and other cost recovery mechanisms;
|
|
•
|
actions related to cost recovery for the Kemper IGCC, including actions relating to proposed securitization, Mississippi PSC approval of the Company's proposed rate recovery plan, as ultimately amended, which includes the ability to complete the proposed sale of an interest in the Kemper IGCC to SMEPA, the ability to utilize bonus depreciation, which currently requires that the Kemper IGCC be placed in service in 2014, and satisfaction of requirements to utilize investment tax credits and grants;
|
|
•
|
Mississippi PSC review of the prudence of Kemper IGCC costs;
|
|
•
|
the outcome of any legal or regulatory proceedings regarding the Mississippi PSC's issuance of the CPCN for the Kemper IGCC, the settlement agreement between the Company and the Mississippi PSC, or the Baseload Act;
|
|
•
|
internal restructuring or other restructuring options that may be pursued;
|
|
•
|
potential business strategies, including acquisitions or dispositions of assets or businesses, which cannot be assured to be completed or beneficial to the Company;
|
|
•
|
the ability of counterparties of the Company to make payments as and when due and to perform as required;
|
|
•
|
the ability to obtain new short- and long-term contracts with wholesale customers;
|
II-381
MANAGEMENT'S DISCUSSION AND ANALYSIS (continued)
Mississippi Power Company 2013 Annual Report
|
•
|
the direct or indirect effect on the Company's business resulting from terrorist incidents and the threat of terrorist incidents, including cyber intrusion;
|
|
•
|
interest rate fluctuations and financial market conditions and the results of financing efforts, including the Company's credit ratings;
|
|
•
|
the impacts of any potential U.S. credit rating downgrade or other sovereign financial issues, including impacts on interest rates, access to capital markets, impacts on currency exchange rates, counterparty performance, and the economy in general;
|
|
•
|
the ability of the Company to obtain additional generating capacity at competitive prices;
|
|
•
|
catastrophic events such as fires, earthquakes, explosions, floods, hurricanes, droughts, pandemic health events such as influenzas, or other similar occurrences;
|
|
•
|
the direct or indirect effects on the Company's business resulting from incidents affecting the U.S. electric grid or operation of generating resources;
|
|
•
|
the effect of accounting pronouncements issued periodically by standard setting bodies; and
|
|
•
|
other factors discussed elsewhere herein and in other reports (including the Form 10-K) filed by the Company from time to time with the SEC.
|
The Company expressly disclaims any obligation to update any forward-looking statements.
II-382
For the Years Ended
December 31, 2013
,
2012
, and
2011
Mississippi Power Company
2013
Annual Report
|
|
2013
|
2012
|
2011
|
||||||||
|
|
(in thousands)
|
||||||||||
|
Operating Revenues:
|
|||||||||||
|
Retail revenues
|
$
|
799,139
|
|
$
|
747,453
|
|
$
|
792,463
|
|
||
|
Wholesale revenues, non-affiliates
|
293,871
|
|
255,557
|
|
273,178
|
|
|||||
|
Wholesale revenues, affiliates
|
34,773
|
|
16,403
|
|
30,417
|
|
|||||
|
Other revenues
|
17,374
|
|
16,583
|
|
16,819
|
|
|||||
|
Total operating revenues
|
1,145,157
|
|
1,035,996
|
|
1,112,877
|
|
|||||
|
Operating Expenses:
|
|||||||||||
|
Fuel
|
491,250
|
|
411,226
|
|
490,415
|
|
|||||
|
Purchased power, non-affiliates
|
5,752
|
|
5,221
|
|
6,239
|
|
|||||
|
Purchased power, affiliates
|
42,579
|
|
49,907
|
|
65,574
|
|
|||||
|
Other operations and maintenance
|
253,329
|
|
228,675
|
|
266,395
|
|
|||||
|
Depreciation and amortization
|
91,398
|
|
86,510
|
|
80,337
|
|
|||||
|
Taxes other than income taxes
|
80,694
|
|
79,445
|
|
70,127
|
|
|||||
|
Estimated loss on Kemper IGCC
|
1,102,000
|
|
78,000
|
|
—
|
|
|||||
|
Total operating expenses
|
2,067,002
|
|
938,984
|
|
979,087
|
|
|||||
|
Operating Income (Loss)
|
(921,845
|
)
|
97,012
|
|
133,790
|
|
|||||
|
Other Income and (Expense):
|
|||||||||||
|
Allowance for equity funds used during construction
|
121,629
|
|
64,793
|
|
24,707
|
|
|||||
|
Interest income
|
186
|
|
745
|
|
1,347
|
|
|||||
|
Interest expense, net of amounts capitalized
|
(36,481
|
)
|
(40,838
|
)
|
(21,691
|
)
|
|||||
|
Other income (expense), net
|
(6,216
|
)
|
519
|
|
(45
|
)
|
|||||
|
Total other income and (expense)
|
79,118
|
|
25,219
|
|
4,318
|
|
|||||
|
Earnings (Loss) Before Income Taxes
|
(842,727
|
)
|
122,231
|
|
138,108
|
|
|||||
|
Income taxes (benefit)
|
(367,835
|
)
|
20,556
|
|
42,193
|
|
|||||
|
Net Income (Loss)
|
(474,892
|
)
|
101,675
|
|
95,915
|
|
|||||
|
Dividends on Preferred Stock
|
1,733
|
|
1,733
|
|
1,733
|
|
|||||
|
Net Income (Loss) After Dividends on Preferred Stock
|
$
|
(476,625
|
)
|
$
|
99,942
|
|
$
|
94,182
|
|
||
The accompanying notes are an integral part of these financial statements.
II-383
STATEMENTS OF COMPREHENSIVE INCOME (LOSS)
For the Years Ended
December 31, 2013
,
2012
, and
2011
Mississippi Power Company
2013
Annual Report
|
|
2013
|
2012
|
2011
|
||||||||
|
|
(in thousands)
|
||||||||||
|
Net Income (Loss)
|
$
|
(474,892
|
)
|
$
|
101,675
|
|
$
|
95,915
|
|
||
|
Other comprehensive income (loss):
|
|||||||||||
|
Qualifying hedges:
|
|||||||||||
|
Changes in fair value, net of tax of $-, $(296), and $(5,494)
respectively |
—
|
|
(479
|
)
|
(8,870
|
)
|
|||||
|
Reclassification adjustment for amounts included in net
income, net of tax of $526, $411, and $(18), respectively |
849
|
|
663
|
|
(29
|
)
|
|||||
|
Total other comprehensive income (loss)
|
849
|
|
184
|
|
(8,899
|
)
|
|||||
|
Comprehensive Income (Loss)
|
$
|
(474,043
|
)
|
$
|
101,859
|
|
$
|
87,016
|
|
||
The accompanying notes are an integral part of these financial statements.
II-384
STATEMENTS OF CASH FLOWS
For the Years Ended
December 31, 2013
,
2012
, and
2011
Mississippi Power Company
2013
Annual Report
|
|
2013
|
2012
|
2011
|
||||||||
|
|
(in thousands)
|
||||||||||
|
Operating Activities:
|
|||||||||||
|
Net income (loss)
|
$
|
(474,892
|
)
|
$
|
101,675
|
|
$
|
95,915
|
|
||
|
Adjustments to reconcile net income (loss)
to net cash provided from operating activities —
|
|||||||||||
|
Depreciation and amortization, total
|
92,465
|
|
86,981
|
|
83,787
|
|
|||||
|
Deferred income taxes
|
(396,400
|
)
|
17,688
|
|
71,764
|
|
|||||
|
Investment tax credits received
|
144,036
|
|
82,464
|
|
—
|
|
|||||
|
Allowance for equity funds used during construction
|
(121,629
|
)
|
(64,793
|
)
|
(24,707
|
)
|
|||||
|
Pension, postretirement, and other employee benefits
|
13,953
|
|
(35,425
|
)
|
3,169
|
|
|||||
|
Hedge settlements
|
—
|
|
(15,983
|
)
|
848
|
|
|||||
|
Stock based compensation expense
|
2,510
|
|
2,084
|
|
1,548
|
|
|||||
|
Regulatory assets associated with Kemper IGCC
|
(35,220
|
)
|
(15,445
|
)
|
(7,719
|
)
|
|||||
|
Estimated loss on Kemper IGCC
|
1,102,000
|
|
78,000
|
|
—
|
|
|||||
|
Kemper regulatory deferral
|
90,524
|
|
—
|
|
—
|
|
|||||
|
Other, net
|
14,585
|
|
10,516
|
|
(433
|
)
|
|||||
|
Changes in certain current assets and liabilities —
|
|||||||||||
|
-Receivables
|
(25,001
|
)
|
(6,589
|
)
|
5,864
|
|
|||||
|
-Fossil fuel stock
|
63,093
|
|
(36,206
|
)
|
(27,933
|
)
|
|||||
|
-Materials and supplies
|
(11,087
|
)
|
(3,473
|
)
|
(2,116
|
)
|
|||||
|
-Prepaid income taxes
|
16,644
|
|
(3,852
|
)
|
12,907
|
|
|||||
|
-Other current assets
|
(4,363
|
)
|
(19,851
|
)
|
1,606
|
|
|||||
|
-Other accounts payable
|
12,693
|
|
8,814
|
|
24,143
|
|
|||||
|
-Accrued interest
|
16,768
|
|
17,627
|
|
6,817
|
|
|||||
|
-Accrued taxes
|
11,141
|
|
13,768
|
|
1,209
|
|
|||||
|
-Accrued compensation
|
(6,382
|
)
|
(183
|
)
|
(187
|
)
|
|||||
|
-Over recovered regulatory clause revenues
|
(58,979
|
)
|
16,836
|
|
(16,544
|
)
|
|||||
|
-Other current liabilities
|
1,109
|
|
757
|
|
1,557
|
|
|||||
|
Net cash provided from operating activities
|
447,568
|
|
235,410
|
|
231,495
|
|
|||||
|
Investing Activities:
|
|||||||||||
|
Property additions
|
(1,640,782
|
)
|
(1,620,047
|
)
|
(964,233
|
)
|
|||||
|
Plant acquisition
|
—
|
|
—
|
|
(84,803
|
)
|
|||||
|
Distribution of restricted cash
|
—
|
|
—
|
|
50,000
|
|
|||||
|
Cost of removal net of salvage
|
(10,386
|
)
|
(4,355
|
)
|
(7,432
|
)
|
|||||
|
Construction payables
|
(50,000
|
)
|
78,961
|
|
97,079
|
|
|||||
|
Capital grant proceeds
|
4,500
|
|
13,372
|
|
232,442
|
|
|||||
|
Proceeds from asset sales
|
79,020
|
|
—
|
|
—
|
|
|||||
|
Other investing activities
|
14,903
|
|
(16,706
|
)
|
(5,736
|
)
|
|||||
|
Net cash used for investing activities
|
(1,602,745
|
)
|
(1,548,775
|
)
|
(682,683
|
)
|
|||||
|
Financing Activities:
|
|||||||||||
|
Proceeds —
|
|||||||||||
|
Capital contributions from parent company
|
1,077,088
|
|
702,971
|
|
299,305
|
|
|||||
|
Bonds-Other
|
42,342
|
|
51,471
|
|
—
|
|
|||||
|
Senior notes issuances
|
—
|
|
600,000
|
|
300,000
|
|
|||||
|
Interest-bearing refundable deposit related to asset sale
|
—
|
|
150,000
|
|
—
|
|
|||||
|
Other long-term debt issuances
|
475,000
|
|
50,000
|
|
115,000
|
|
|||||
|
Redemptions —
|
|||||||||||
|
Bonds-Other
|
(82,563
|
)
|
—
|
|
—
|
|
|||||
|
Senior notes
|
(50,000
|
)
|
(90,000
|
)
|
—
|
|
|||||
|
Other long-term debt
|
(125,000
|
)
|
(115,000
|
)
|
(130,000
|
)
|
|||||
|
Return of paid in capital
|
(104,804
|
)
|
—
|
|
—
|
|
|||||
|
Payment of preferred stock dividends
|
(1,733
|
)
|
(1,733
|
)
|
(1,733
|
)
|
|||||
|
Payment of common stock dividends
|
(71,956
|
)
|
(106,800
|
)
|
(75,500
|
)
|
|||||
|
Other financing activities
|
(3,040
|
)
|
5,879
|
|
(5,078
|
)
|
|||||
|
Net cash provided from financing activities
|
1,155,334
|
|
1,246,788
|
|
501,994
|
|
|||||
|
Net Change in Cash and Cash Equivalents
|
157
|
|
(66,577
|
)
|
50,806
|
|
|||||
|
Cash and Cash Equivalents at Beginning of Year
|
145,008
|
|
211,585
|
|
160,779
|
|
|||||
|
Cash and Cash Equivalents at End of Year
|
$
|
145,165
|
|
$
|
145,008
|
|
$
|
211,585
|
|
||
|
Supplemental Cash Flow Information:
|
|||||||||||
|
Cash paid (received) during the period for —
|
|||||||||||
|
Interest (net of $54,118, $32,816 and $10,065 capitalized, respectively)
|
$
|
20,285
|
|
$
|
32,589
|
|
$
|
14,814
|
|
||
|
Income taxes (net of refunds)
|
(134,198
|
)
|
(77,580
|
)
|
(41,024
|
)
|
|||||
|
Noncash transactions — accrued property additions at year-end
|
164,863
|
|
214,863
|
|
135,902
|
|
|||||
|
Noncash transactions — capital lease obligation
|
82,915
|
|
—
|
|
—
|
|
|||||
|
Assumption of debt due to plant acquisition
|
—
|
|
—
|
|
346,051
|
|
|||||
II-385
BALANCE SHEETS
At
December 31, 2013
and
2012
Mississippi Power Company
2013
Annual Report
|
Assets
|
2013
|
2012
|
|||||
|
|
(in thousands)
|
||||||
|
Current Assets:
|
|||||||
|
Cash and cash equivalents
|
$
|
145,165
|
|
$
|
145,008
|
|
|
|
Receivables —
|
|||||||
|
Customer accounts receivable
|
40,978
|
|
29,561
|
|
|||
|
Unbilled revenues
|
38,895
|
|
32,688
|
|
|||
|
Other accounts and notes receivable
|
4,600
|
|
7,517
|
|
|||
|
Affiliated companies
|
34,920
|
|
27,160
|
|
|||
|
Accumulated provision for uncollectible accounts
|
(3,018
|
)
|
(373
|
)
|
|||
|
Fossil fuel stock, at average cost
|
113,285
|
|
176,378
|
|
|||
|
Materials and supplies, at average cost
|
45,347
|
|
34,260
|
|
|||
|
Other regulatory assets, current
|
52,496
|
|
55,302
|
|
|||
|
Prepaid income taxes
|
34,751
|
|
129,835
|
|
|||
|
Other current assets
|
9,357
|
|
17,170
|
|
|||
|
Total current assets
|
516,776
|
|
654,506
|
|
|||
|
Property, Plant, and Equipment:
|
|||||||
|
In service
|
3,458,770
|
|
3,036,159
|
|
|||
|
Less accumulated provision for depreciation
|
1,095,352
|
|
1,065,474
|
|
|||
|
Plant in service, net of depreciation
|
2,363,418
|
|
1,970,685
|
|
|||
|
Construction work in progress
|
2,586,031
|
|
2,393,145
|
|
|||
|
Total property, plant, and equipment
|
4,949,449
|
|
4,363,830
|
|
|||
|
Other Property and Investments
|
4,857
|
|
4,887
|
|
|||
|
Deferred Charges and Other Assets:
|
|||||||
|
Deferred charges related to income taxes
|
139,834
|
|
71,869
|
|
|||
|
Other regulatory assets, deferred
|
200,620
|
|
236,225
|
|
|||
|
Other deferred charges and assets
|
36,673
|
|
42,304
|
|
|||
|
Total deferred charges and other assets
|
377,127
|
|
350,398
|
|
|||
|
Total Assets
|
$
|
5,848,209
|
|
$
|
5,373,621
|
|
|
The accompanying notes are an integral part of these financial statements.
II-386
BALANCE SHEETS
At
December 31, 2013
and
2012
Mississippi Power Company
2013
Annual Report
|
Liabilities and Stockholder's Equity
|
2013
|
2012
|
|||||
|
|
(in thousands)
|
||||||
|
Current Liabilities:
|
|||||||
|
Securities due within one year
|
$
|
13,789
|
|
$
|
276,471
|
|
|
|
Interest-bearing refundable deposit related to asset sale
|
150,000
|
|
150,000
|
|
|||
|
Accounts payable —
|
|||||||
|
Affiliated
|
70,299
|
|
54,769
|
|
|||
|
Other
|
210,191
|
|
262,992
|
|
|||
|
Customer deposits
|
14,379
|
|
14,202
|
|
|||
|
Accrued taxes —
|
|||||||
|
Accrued income taxes
|
5,590
|
|
2,339
|
|
|||
|
Other accrued taxes
|
77,958
|
|
69,376
|
|
|||
|
Accrued interest
|
47,144
|
|
30,376
|
|
|||
|
Accrued compensation
|
9,324
|
|
15,706
|
|
|||
|
Other regulatory liabilities, current
|
24,981
|
|
5,376
|
|
|||
|
Over recovered regulatory clause liabilities
|
18,358
|
|
77,338
|
|
|||
|
Other current liabilities
|
21,413
|
|
31,882
|
|
|||
|
Total current liabilities
|
663,426
|
|
990,827
|
|
|||
|
Long-Term Debt
(
See accompanying statements
)
|
2,167,067
|
|
1,564,462
|
|
|||
|
Deferred Credits and Other Liabilities:
|
|||||||
|
Accumulated deferred income taxes
|
72,808
|
|
244,958
|
|
|||
|
Deferred credits related to income taxes
|
9,145
|
|
10,106
|
|
|||
|
Accumulated deferred investment tax credits
|
284,248
|
|
370,554
|
|
|||
|
Employee benefit obligations
|
94,430
|
|
157,421
|
|
|||
|
Other cost of removal obligations
|
151,340
|
|
143,461
|
|
|||
|
Other regulatory liabilities, deferred
|
140,880
|
|
56,984
|
|
|||
|
Other deferred credits and liabilities
|
55,534
|
|
52,860
|
|
|||
|
Total deferred credits and other liabilities
|
808,385
|
|
1,036,344
|
|
|||
|
Total Liabilities
|
3,638,878
|
|
3,591,633
|
|
|||
|
Cumulative Redeemable Preferred Stock
(
See accompanying statements
)
|
32,780
|
|
32,780
|
|
|||
|
Common Stockholder's Equity
(
See accompanying statements
)
|
2,176,551
|
|
1,749,208
|
|
|||
|
Total Liabilities and Stockholder's Equity
|
$
|
5,848,209
|
|
$
|
5,373,621
|
|
|
|
Commitments and Contingent Matters
(
See notes
)
|
|
|
|||||
The accompanying notes are an integral part of these financial statements.
II-387
STATEMENTS OF CAPITALIZATION
At
December 31, 2013
and
2012
Mississippi Power Company
2013
Annual Report
|
|
2013
|
2012
|
2013
|
2012
|
|||||||||
|
|
(in thousands)
|
(percent of total)
|
|||||||||||
|
Long-Term Debt:
|
|||||||||||||
|
Long-term notes payable —
|
|||||||||||||
|
6.00% due 2013
|
$
|
—
|
|
$
|
50,000
|
|
|||||||
|
2.35% due 2016
|
300,000
|
|
300,000
|
|
|||||||||
|
5.60% due 2017
|
35,000
|
|
35,000
|
|
|||||||||
|
1.63% to 5.55% due 2019-2042
|
805,000
|
|
805,000
|
|
|||||||||
|
Adjustable rates (0.63% to 1.21% at 1/1/13) due 2013
|
—
|
|
226,471
|
|
|||||||||
|
Adjustable rate (1.29% at 1/1/14) due 2014
|
11,250
|
|
—
|
|
|||||||||
|
Adjustable rates (0.77% to 0.97% at 1/1/14) due 2015
|
525,000
|
|
—
|
|
|||||||||
|
Total long-term notes payable
|
1,676,250
|
|
1,416,471
|
|
|||||||||
|
Other long-term debt —
|
|||||||||||||
|
Pollution control revenue bonds:
|
|||||||||||||
|
5.15% due 2028
|
42,625
|
|
42,625
|
|
|||||||||
|
Variable rates (0.04% to 0.05% at 1/1/14) due 2020-2028
|
40,070
|
|
40,070
|
|
|||||||||
|
Plant Daniel revenue bonds (7.13%) due 2021
|
270,000
|
|
270,000
|
|
|||||||||
|
Total other long-term debt
|
352,695
|
|
352,695
|
|
|||||||||
|
Capitalized lease obligations
|
82,217
|
|
—
|
|
|||||||||
|
Unamortized debt premium
|
71,807
|
|
80,912
|
|
|||||||||
|
Unamortized debt discount
|
(2,113
|
)
|
(9,145
|
)
|
|||||||||
|
Total long-term debt (annual interest requirement — $75 million)
|
2,180,856
|
|
1,840,933
|
|
|||||||||
|
Less amount due within one year
|
13,789
|
|
276,471
|
|
|||||||||
|
Long-term debt excluding amount due within one year
|
2,167,067
|
|
1,564,462
|
|
49.6
|
%
|
46.7
|
%
|
|||||
|
Cumulative Redeemable Preferred Stock:
|
|||||||||||||
|
$100 par value
|
|||||||||||||
|
Authorized: 1,244,139 shares
|
|||||||||||||
|
Outstanding: 334,210 shares
|
|||||||||||||
|
4.40% to 5.25% (annual dividend requirement — $1.7 million)
|
32,780
|
|
32,780
|
|
0.7
|
|
1.0
|
|
|||||
|
Common Stockholder's Equity:
|
|||||||||||||
|
Common stock, without par value —
|
|||||||||||||
|
Authorized: 1,130,000 shares
|
|
|
|||||||||||
|
Outstanding: 1,121,000 shares
|
37,691
|
|
37,691
|
|
|||||||||
|
Paid-in capital
|
2,376,595
|
|
1,401,520
|
|
|||||||||
|
Retained earnings (deficit)
|
(229,871
|
)
|
318,710
|
|
|||||||||
|
Accumulated other comprehensive income (loss)
|
(7,864
|
)
|
(8,713
|
)
|
|||||||||
|
Total common stockholder's equity
|
2,176,551
|
|
1,749,208
|
|
49.7
|
|
52.3
|
|
|||||
|
Total Capitalization
|
$
|
4,376,398
|
|
$
|
3,346,450
|
|
100.0
|
%
|
100.0
|
%
|
|||
The accompanying notes are an integral part of these financial statements.
II-388
STATEMENTS OF COMMON STOCKHOLDER'S EQUITY
For the Years Ended
December 31, 2013
,
2012
, and
2011
Mississippi Power Company
2013
Annual Report
|
|
Number of Common Shares Issued
|
Common
Stock
|
Paid-In Capital
|
Retained Earnings
|
Accumulated Other Comprehensive Income (Loss)
|
Total
|
||||||||||||||||
|
|
(in thousands)
|
|||||||||||||||||||||
|
Balance at December 31, 2010
|
1,121
|
|
$
|
37,691
|
|
$
|
392,790
|
|
$
|
306,885
|
|
$
|
2
|
|
$
|
737,368
|
|
|||||
|
Net income after dividends
on preferred stock
|
—
|
|
—
|
|
—
|
|
94,182
|
|
—
|
|
94,182
|
|
||||||||||
|
Capital contributions from parent company
|
—
|
|
—
|
|
302,065
|
|
—
|
|
—
|
|
302,065
|
|
||||||||||
|
Other comprehensive income (loss)
|
—
|
|
—
|
|
—
|
|
—
|
|
(8,899
|
)
|
(8,899
|
)
|
||||||||||
|
Cash dividends on common stock
|
—
|
|
—
|
|
—
|
|
(75,500
|
)
|
—
|
|
(75,500
|
)
|
||||||||||
|
Other
|
—
|
|
—
|
|
—
|
|
1
|
|
—
|
|
1
|
|
||||||||||
|
Balance at December 31, 2011
|
1,121
|
|
37,691
|
|
694,855
|
|
325,568
|
|
(8,897
|
)
|
1,049,217
|
|
||||||||||
|
Net income after dividends
on preferred stock
|
—
|
|
—
|
|
—
|
|
99,942
|
|
—
|
|
99,942
|
|
||||||||||
|
Capital contributions from parent company
|
—
|
|
—
|
|
706,665
|
|
—
|
|
—
|
|
706,665
|
|
||||||||||
|
Other comprehensive income (loss)
|
—
|
|
—
|
|
—
|
|
—
|
|
184
|
|
184
|
|
||||||||||
|
Cash dividends on common stock
|
—
|
|
—
|
|
—
|
|
(106,800
|
)
|
—
|
|
(106,800
|
)
|
||||||||||
|
Balance at December 31, 2012
|
1,121
|
|
37,691
|
|
1,401,520
|
|
318,710
|
|
(8,713
|
)
|
1,749,208
|
|
||||||||||
|
Net loss after dividends
on preferred stock
|
—
|
|
—
|
|
—
|
|
(476,625
|
)
|
—
|
|
(476,625
|
)
|
||||||||||
|
Capital contributions from parent company
|
—
|
|
—
|
|
975,075
|
|
—
|
|
—
|
|
975,075
|
|
||||||||||
|
Other comprehensive income (loss)
|
—
|
|
—
|
|
—
|
|
—
|
|
849
|
|
849
|
|
||||||||||
|
Cash dividends on common stock
|
—
|
|
—
|
|
—
|
|
(71,956
|
)
|
—
|
|
(71,956
|
)
|
||||||||||
|
Balance at December 31, 2013
|
1,121
|
|
$
|
37,691
|
|
$
|
2,376,595
|
|
$
|
(229,871
|
)
|
$
|
(7,864
|
)
|
$
|
2,176,551
|
|
|||||
The accompanying notes are an integral part of these financial statements.
II-389
NOTES TO FINANCIAL STATEMENTS
Mississippi Power Company
2013
Annual Report
Index to the Notes to Financial Statements
|
Note
|
Page
|
|
|
1
|
||
|
2
|
||
|
3
|
||
|
4
|
||
|
5
|
||
|
6
|
||
|
7
|
||
|
8
|
||
|
9
|
||
|
10
|
||
|
11
|
||
II-390
NOTES (continued)
Mississippi Power Company 2013 Annual Report
1. SUMMARY OF SIGNIFICANT ACCOUNTING POLICIES
General
Mississippi Power Company (the Company) is a wholly owned subsidiary of The Southern Company (Southern Company), which is the parent company of the Company and three other traditional operating companies, as well as Southern Power Company (Southern Power), Southern Company Services, Inc. (SCS), Southern Communications Services, Inc. (SouthernLINC Wireless), Southern Company Holdings, Inc. (Southern Holdings), Southern Nuclear Operating Company, Inc. (Southern Nuclear), and other direct and indirect subsidiaries. The traditional operating companies – Alabama Power Company (Alabama Power), Georgia Power Company, Gulf Power Company (Gulf Power), and the Company – are vertically integrated utilities providing electric service in four Southeastern states. The Company operates as a vertically integrated utility providing electricity to retail customers in southeast Mississippi and to wholesale customers in the Southeast. Southern Power constructs, acquires, owns, and manages generation assets, including renewable energy projects, and sells electricity at market-based rates in the wholesale market. SCS, the system service company, provides, at cost, specialized services to Southern Company and its subsidiary companies. SouthernLINC Wireless provides digital wireless communications for use by Southern Company and its subsidiary companies and also markets these services to the public and provides fiber cable services within the Southeast. Southern Holdings is an intermediate holding company subsidiary, primarily for Southern Company's investments in leveraged leases. Southern Nuclear operates and provides services to the Southern Company system's nuclear power plants.
The equity method is used for entities in which the Company has significant influence but does not control and for variable interest entities (VIEs) where the Company has an equity investment, but is not the primary beneficiary.
The Company is subject to regulation by the Federal Energy Regulatory Commission (FERC) and the Mississippi Public Service Commission (PSC). The Company follows generally accepted accounting principles (GAAP) in the U.S. and complies with the accounting policies and practices prescribed by its regulatory commissions. The preparation of financial statements in conformity with GAAP requires the use of estimates, and the actual results may differ from those estimates. Certain prior years' data presented in the financial statements have been reclassified to conform to the current year presentation.
Affiliate Transactions
The Company has an agreement with SCS under which the following services are rendered to the Company at direct or allocated cost: general and design engineering, operations, purchasing, accounting, finance and treasury, tax, information technology, marketing, auditing, insurance and pension administration, human resources, systems and procedures, digital wireless communications, and other services with respect to business and operations, construction management, and power pool transactions. Costs for these services amounted to
$205.0 million
,
$212.7 million
, and
$185.5 million
during
2013
,
2012
, and
2011
, respectively. Cost allocation methodologies used by SCS prior to the repeal of the Public Utility Holding Company Act of 1935, as amended, were approved by the U.S. Securities and Exchange Commission (SEC). Subsequently, additional cost allocation methodologies have been reported to the FERC and management believes they are reasonable. The FERC permits services to be rendered at cost by system service companies.
The Company has an agreement with Alabama Power under which the Company owns a portion of Greene County Steam Plant. Alabama Power operates Greene County Steam Plant, and the Company reimburses Alabama Power for its proportionate share of non-fuel expenditures and costs, which totaled
$12.5 million
,
$11.7 million
, and
$12.2 million
in
2013
,
2012
, and
2011
, respectively. Also, the Company reimburses Alabama Power for any direct fuel purchases delivered from an Alabama Power transfer facility, which were
$27.1 million
,
$28.1 million
, and
$20.9 million
in
2013
,
2012
, and
2011
, respectively. The Company also has an agreement with Gulf Power under which Gulf Power owns a portion of Plant Daniel. The Company operates Plant Daniel, and Gulf Power reimburses the Company for its proportionate share of all associated expenditures and costs, which totaled
$16.5 million
,
$21.2 million
, and
$23.3 million
in
2013
,
2012
, and
2011
, respectively. See Note 4 for additional information.
The Company also provides incidental services to and receives such services from other Southern Company subsidiaries which are generally minor in duration and amount. Except as described herein, the Company neither provided nor received any material services to or from affiliates in 2013 or 2011. The Company received storm assistance from other Southern Company subsidiaries totaling
$2.0 million
in 2012.
The traditional operating companies, including the Company, and Southern Power may jointly enter into various types of wholesale energy, natural gas, and certain other contracts, either directly or through SCS, as agent. Each participating company may be jointly and severally liable for the obligations incurred under these agreements. See Note 7 under "Fuel and Purchased Power Agreements" for additional information.
II-391
NOTES (continued)
Mississippi Power Company 2013 Annual Report
Regulatory Assets and Liabilities
The Company is subject to the provisions of the Financial Accounting Standards Board in accounting for the effects of rate regulation. Regulatory assets represent probable future revenues associated with certain costs that are expected to be recovered from customers through the ratemaking process. Regulatory liabilities represent probable future reductions in revenues associated with amounts that are expected to be credited to customers through the ratemaking process.
Regulatory assets and (liabilities) reflected in the balance sheets at December 31 relate to:
|
2013
|
|
2012
|
|
Note
|
|||||
|
(in thousands)
|
|||||||||
|
Retiree benefit plans – regulatory assets
|
$
|
82,799
|
|
$
|
162,293
|
|
(a,g)
|
||
|
Retiree benefit plans – regulatory liabilities
|
(3,111
|
)
|
—
|
|
(a,g)
|
||||
|
Property damage
|
(60,092
|
)
|
(58,789
|
)
|
(i)
|
||||
|
Deferred income tax charges
|
140,185
|
|
68,175
|
|
(c)
|
||||
|
Property tax
|
31,206
|
|
27,882
|
|
(d)
|
||||
|
Vacation pay
|
10,214
|
|
9,635
|
|
(e,g)
|
||||
|
Loss on reacquired debt
|
9,178
|
|
9,815
|
|
(k)
|
||||
|
Plant Daniel Units 3 and 4 regulatory assets
|
18,821
|
|
12,386
|
|
(j)
|
||||
|
Other regulatory assets
|
1,201
|
|
2,035
|
|
(b)
|
||||
|
Fuel-hedging (realized and unrealized) losses
|
10,340
|
|
20,906
|
|
(f,g)
|
||||
|
Asset retirement obligations
|
8,918
|
|
9,353
|
|
(c)
|
||||
|
Deferred income tax credits
|
(10,191
|
)
|
(11,157
|
)
|
(c)
|
||||
|
Other cost of removal obligations
|
(156,683
|
)
|
(143,461
|
)
|
(c)
|
||||
|
Fuel-hedging (realized and unrealized) gains
|
(5,335
|
)
|
(2,519
|
)
|
(f,g)
|
||||
|
Kemper IGCC* regulatory assets
|
75,873
|
|
36,047
|
|
(h)
|
||||
|
Kemper regulatory deferral
|
(90,524
|
)
|
—
|
|
(h)
|
||||
|
Other regulatory liabilities
|
(409
|
)
|
—
|
|
(b)
|
||||
|
Deferred income tax charges – Medicare subsidy
|
4,214
|
|
4,868
|
|
(l)
|
||||
|
Total regulatory assets (liabilities), net
|
$
|
66,604
|
|
$
|
147,469
|
|
|||
* Integrated coal gasification combined cycle electric generating plant located in Kemper County, Mississippi (Kemper IGCC).
Note: The recovery and amortization periods for these regulatory assets and (liabilities) are as follows:
|
(a)
|
Recovered and amortized over the average remaining service period which may range up to
14 years
. See Note 2 for additional information.
|
|
(b)
|
Recorded and recovered as approved by the Mississippi PSC.
|
|
(c)
|
Asset retirement and removal assets and liabilities and deferred income tax assets are recovered, and removal assets and deferred income tax liabilities are amortized over the related property lives, which may range up to
50 years
. Asset retirement and removal assets and liabilities will be settled and trued up following completion of the related activities.
|
|
(d)
|
Recovered through the ad valorem tax adjustment clause over a
12
-month period beginning in April of the following year. See Note 3 under "Ad Valorem Tax Adjustment" for additional information.
|
|
(e)
|
Recorded as earned by employees and recovered as paid, generally within
one
year. This includes both vacation and banked holiday pay.
|
|
(f)
|
Fuel-hedging assets and liabilities are recorded over the life of the underlying hedged purchase contracts, which generally do not exceed
four
years. Upon final settlement, costs are recovered through the Energy Cost Management clause (ECM).
|
|
(g)
|
Not earning a return as offset in rate base by a corresponding asset or liability.
|
|
(h)
|
For additional information, see Note 3 under "Integrated Coal Gasification Combined Cycle."
|
|
(i)
|
For additional information, see Note 1 under "Provision for Property Damage" and Note 3 under "Retail Regulatory Matters – System Restoration Rider."
|
|
(j)
|
Deferred and amortized over a
10
-year period beginning October 2021, as approved by the Mississippi PSC for the difference between the revenue requirement under the purchase option and the revenue requirement assuming operating lease accounting treatment for the extended term.
|
|
(k)
|
Recovered over the remaining life of the original issue or, if refinanced, over the life of the new issue, which may range up to
50 years
.
|
|
(l)
|
Recovered and amortized over a
10
-year period beginning in 2012, as approved by the Mississippi PSC for the retail portion and a
five
-year period for the wholesale portion, as approved by FERC.
|
In the event that a portion of the Company's operations is no longer subject to applicable accounting rules for rate regulation, the Company would be required to write off to income or reclassify to accumulated other comprehensive income (OCI) related
II-392
NOTES (continued)
Mississippi Power Company 2013 Annual Report
regulatory assets and liabilities that are not specifically recoverable through regulated rates. In addition, the Company would be required to determine if any impairment to other assets, including plant, exists and write down the assets, if impaired, to their fair values. All regulatory assets and liabilities are to be reflected in rates. See Note 3 under "Retail Regulatory Matters" and "Integrated Coal Gasification Combined Cycle" for additional information.
Government Grants
In 2008, the Company requested that the U.S. Department of Energy (DOE) transfer the remaining funds previously granted under the Clean Coal Power Initiative Round 2 (DOE Grants) from a cancelled integrated coal gasification combined cycle project of one of Southern Company's subsidiaries that would have been located in Orlando, Florida. In 2010, the DOE, through a cooperative agreement with SCS, agreed to fund
$270.0 million
of the Kemper IGCC through the DOE Grants funds. Through
December 31, 2013
, the Company has received grant funds of
$245.3 million
, used for the construction of the Kemper IGCC, which is reflected in the Company's financial statements as a reduction to the Kemper IGCC capital costs. An additional
$25 million
is expected to be received for its initial operation.
Revenues
Energy and other revenues are recognized as services are provided. Wholesale capacity revenues from long-term contracts are recognized at the lesser of the levelized amount or the amount billable under the contract over the respective contract period. Unbilled revenues related to retail sales are accrued at the end of each fiscal period. The Company's retail and wholesale rates include provisions to adjust billings for fluctuations in fuel costs, fuel hedging, the energy component of purchased power costs, and certain other costs. Retail rates also include provisions to adjust billings for fluctuations in costs for ad valorem taxes and certain qualifying environmental costs. Revenues are adjusted for differences between these actual costs and amounts billed in current regulated rates. Under or over recovered regulatory clause revenues are recorded in the balance sheets and are recovered or returned to customers through adjustments to the billing factors. The Company is required to file with the Mississippi PSC for an adjustment to the fuel cost recovery, ad valorem, and environmental factors annually.
The Company serves long-term contracts with rural electric cooperative associations and municipalities located in southeastern Mississippi under cost-based electric tariffs which are subject to regulation by the FERC. The contracts with these wholesale customers represented
22.2%
of the Company's total operating revenues in
2013
and are largely subject to rolling
10
-year cancellation notices.
The Company has a diversified base of customers. No single customer or industry comprises
10%
or more of revenues. For all periods presented, uncollectible accounts averaged less than
1%
of revenues.
Fuel Costs
Fuel costs are expensed as the fuel is used. Fuel expense generally includes fuel transportation costs and the cost of purchased emissions allowances as they are used. Fuel costs also include gains and/or losses from fuel-hedging programs as approved by the Mississippi PSC.
Income and Other Taxes
The Company uses the liability method of accounting for deferred income taxes and provides deferred income taxes for all significant income tax temporary differences. Investment tax credits (ITCs) utilized are deferred and amortized to income over the average life of the related property. Taxes that are collected from customers on behalf of governmental agencies to be remitted to these agencies are presented net on the statements of income.
In accordance with accounting standards related to the uncertainty in income taxes, the Company recognizes tax positions that are "more likely than not" of being sustained upon examination by the appropriate taxing authorities. See Note 5 under "Unrecognized Tax Benefits" for additional information.
Property, Plant, and Equipment
Property, plant, and equipment is stated at original cost less any regulatory disallowances and impairments. Original cost includes: materials; labor; minor items of property; appropriate administrative and general costs; payroll-related costs such as taxes, pensions, and other benefits; and the interest capitalized and cost of equity funds used during construction for projects where recovery of construction work in progress (CWIP) is not allowed in rates.
II-393
NOTES (continued)
Mississippi Power Company 2013 Annual Report
The Company's property, plant, and equipment in service consisted of the following at December 31:
|
2013
|
2012
|
||||||
|
(in thousands)
|
|||||||
|
Generation
|
$
|
1,475,264
|
|
$
|
1,363,269
|
|
|
|
Transmission
|
633,903
|
|
563,037
|
|
|||
|
Distribution
|
828,470
|
|
802,718
|
|
|||
|
General
|
439,721
|
|
225,723
|
|
|||
|
Plant acquisition adjustment
|
81,412
|
|
81,412
|
|
|||
|
Total plant in service
|
$
|
3,458,770
|
|
$
|
3,036,159
|
|
|
The cost of replacements of property, exclusive of minor items of property, is capitalized. The cost of maintenance, repairs, and replacement of minor items of property is charged to other operations and maintenance expenses except for all costs associated with operating and maintaining the lignite mine for the Kemper IGCC and a portion of the railway track maintenance costs, which are charged to fuel stock and recovered through the Company's fuel clause.
Purchase of the Plant Daniel Combined Cycle Generating Units
In 2011, the Company purchased the combined cycle generating Units 3 and 4 at Plant Daniel (Plant Daniel Units 3 and 4) for
$84.8 million
in cash and the assumption of
$270.0 million
face value of debt obligations of the lessor related to Plant Daniel Units 3 and 4, which mature in 2021, bear interest at a fixed stated interest rate of
7.13%
per annum, and had a fair value at the time of purchase of
$346.1 million
. These obligations are secured by Plant Daniel Units 3 and 4 and certain personal property. The fair value of the debt was determined using a discounted cash flow model based on the Company's borrowing rate at the closing date. The fair value is considered a Level 2 disclosure for financial reporting purposes. Accordingly, Plant Daniel Units 3 and 4 were reflected in the Company's financial statements as follows:
|
(in thousands)
|
|
||
|
Assumption of debt obligations
|
$
|
270,000
|
|
|
Fair value adjustment at date of purchase
|
76,051
|
|
|
|
Total debt
|
346,051
|
|
|
|
Cash payment for the purchase
|
84,803
|
|
|
|
Total value of Plant Daniel Units 3 and 4
|
$
|
430,854
|
|
See Note 3 under "Retail Regulatory Matters – Performance Evaluation Plan" for additional information.
Depreciation, Depletion, and Amortization
Depreciation of the original cost of plant in service is provided primarily by using composite straight-line rates, which approximated
3.4%
in
2013
,
3.5%
in
2012
, and
3.9%
in
2011
. Depreciation studies are conducted periodically to update the composite rates. When property subject to depreciation is retired or otherwise disposed of in the normal course of business, its original cost, together with the cost of removal, less salvage, is charged to accumulated depreciation. Minor items of property included in the original cost of the plant are retired when the related property unit is retired. Depreciation includes an amount for the expected cost of removal of facilities.
The Company, in compliance with FERC guidance, classified
$81.4 million
as a plant acquisition adjustment on the purchase of Plant Daniel Units 3 and 4. This includes
$76.1 million
recorded in conjunction with the premium on long-term debt and is being amortized over
10 years
beginning October 2011. See "Purchase of the Plant Daniel Combined Cycle Generating Units" herein for additional information.
In January 2012, the Mississippi PSC issued an order allowing the Company to defer in a regulatory asset the difference between the revenue requirement under the purchase option of Plant Daniel Units 3 and 4 and the revenue requirement assuming operating lease accounting treatment for the extended term. The regulatory asset will be deferred for a
10
-year period ending October 2021. At the conclusion of the deferral period, the unamortized deferral balance will be amortized into rates over the remaining life of the units.
The Kemper IGCC will be fueled by locally mined lignite (an abundant, lower heating value coal) from a mine owned by the Company and situated adjacent to the Kemper IGCC. The mine, operated by North American Coal Corporation, started
II-394
NOTES (continued)
Mississippi Power Company 2013 Annual Report
commercial operation on June 5, 2013. Depreciation associated with fixed assets, amortization associated with rolling stock, and depletion associated with minerals and minerals rights will be recognized and charged to fuel stock and recovered through the Company’s fuel clause.
Asset Retirement Obligations and Other Costs of Removal
Asset retirement obligations (ARO) are computed as the present value of the ultimate costs for an asset's future retirement and are recorded in the period in which the liability is incurred. The costs are capitalized as part of the related long-lived asset and depreciated over the asset's useful life. The Company has received accounting guidance from the Mississippi PSC allowing the continued accrual of other future retirement costs for long-lived assets that the Company does not have a legal obligation to retire. Accordingly, the accumulated removal costs for these obligations are reflected in the balance sheets as a regulatory liability.
The Company has AROs related to various landfill sites, ash ponds, underground storage tanks, deep injection wells, water wells, substation removal, mine reclamation, and asbestos removal. The Company also has identified AROs related to certain transmission and distribution facilities, certain wireless communication towers, and certain structures authorized by the U.S. Army Corps of Engineers. However, liabilities for the removal of these assets have not been recorded because the settlement timing for the AROs related to these assets is indeterminable and, therefore, the fair value of the AROs cannot be reasonably estimated. A liability for these AROs will be recognized when sufficient information becomes available to support a reasonable estimation of the ARO. The Company will continue to recognize in the statements of income allowed removal costs in accordance with its regulatory treatment. Any differences between costs recognized in accordance with accounting standards related to asset retirement and environmental obligations and those reflected in rates are recognized as either a regulatory asset or liability, as ordered by the Mississippi PSC, and are reflected in the balance sheets.
Details of the ARO included in the balance sheets are as follows:
|
2013
|
2012
|
||||||
|
(in thousands)
|
|||||||
|
Balance at beginning of year
|
$
|
42,115
|
|
$
|
19,148
|
|
|
|
Liabilities incurred
|
—
|
|
20,989
|
|
|||
|
Liabilities settled
|
(24
|
)
|
(282
|
)
|
|||
|
Accretion
|
1,840
|
|
1,874
|
|
|||
|
Cash flow revisions
|
(2,021
|
)
|
386
|
|
|||
|
Balance at end of year
|
$
|
41,910
|
|
$
|
42,115
|
|
|
Allowance for Funds Used During Construction
In accordance with regulatory treatment, the Company records allowance for funds used during construction (AFUDC), which represents the estimated debt and equity costs of capital funds that are necessary to finance the construction of new regulated facilities. While cash is not realized currently from such allowance, AFUDC increases the revenue requirement and is recovered over the service life of the plant through a higher rate base and higher depreciation. The equity component of AFUDC is not included in the calculation of taxable income. The average annual AFUDC rate was
6.89%
,
7.04%
, and
7.06%
for the years ended
December 31, 2013
,
2012
, and
2011
, respectively.
Impairment of Long-Lived Assets and Intangibles
The Company evaluates long-lived assets for impairment when events or changes in circumstances indicate that the carrying value of such assets may not be recoverable. The determination of whether an impairment has occurred is based on either a specific regulatory disallowance or an estimate of undiscounted future cash flows attributable to the assets, as compared with the carrying value of the assets. If an impairment has occurred, the amount of the impairment recognized is determined by either the amount of regulatory disallowance or by estimating the fair value of the assets and recording a loss if the carrying value is greater than the fair value. For assets identified as held for sale, the carrying value is compared to the estimated fair value less the cost to sell in order to determine if an impairment loss is required. Until the assets are disposed of, their estimated fair value is re-evaluated when circumstances or events change. See Note 3 under "Integrated Coal Gasification Combined Cycle – Kemper IGCC Schedule and Cost Estimate" for additional information.
II-395
NOTES (continued)
Mississippi Power Company 2013 Annual Report
Provision for Property Damage
The Company carries insurance for the cost of certain types of damage to generation plants and general property. However, the Company is self-insured for the cost of storm, fire, and other uninsured casualty damage to its property, including transmission and distribution facilities. As permitted by the Mississippi PSC and the FERC, the Company accrues for the cost of such damage through an annual expense accrual credited to regulatory liability accounts for the retail and wholesale jurisdictions. The cost of repairing actual damage resulting from such events that individually exceed
$50,000
is charged to the reserve. In 2009, the Mississippi PSC approved the System Restoration Rider (SRR) stipulation between the Company and the Mississippi Public Utilities Staff (MPUS). In accordance with the stipulation, every three years the Mississippi PSC, MPUS, and the Company will agree on SRR revenue level(s) for the ensuing period, based on historical data, expected exposure, type and amount of insurance coverage, excluding insurance cost, and any other relevant information. The accrual amount and the reserve balance are determined based on the SRR revenue level(s). If a significant change in circumstances occurs, then the SRR revenue level can be adjusted more frequently if the Company and the MPUS or the Mississippi PSC deem the change appropriate. Each year the Company will set rates to collect the approved SRR revenues. The property damage reserve accrual will be the difference between the approved SRR revenues and the SRR revenue requirement, excluding any accrual to the reserve. In
2013
,
2012
, and
2011
, the Company made retail accruals of
$3.2 million
,
$3.5 million
, and
$3.8 million
, respectively, per the annual SRR rate filings. In addition, SRR allows the Company to set up a regulatory asset, pending review, if the allowable actual retail property damage costs exceed the amount in the retail property damage reserve. See Note 3 under "Retail Regulatory Matters – System Restoration Rider" for additional information. The Company accrued
$0.3 million
annually in
2013
,
2012
, and
2011
for the wholesale jurisdiction.
Cash and Cash Equivalents
For purposes of the financial statements, temporary cash investments are considered cash equivalents. Temporary cash investments are securities with original maturities of
90 days
or less.
Materials and Supplies
Generally, materials and supplies include the average cost of transmission, distribution, mining, and generating plant materials. Materials are charged to inventory when purchased and then expensed, capitalized to plant, or charged to fuel stock, as appropriate, at weighted-average cost when utilized.
Fuel Inventory
Fuel inventory includes the average cost of coal, lignite, natural gas, oil, transportation and emissions allowances. Fuel is charged to inventory when purchased, except for the cost of owning and operating the lignite mine related to the Kemper IGCC which is charged to inventory as incurred, and then expensed, at weighted average cost, as used and recovered by the Company through fuel cost recovery rates. The retail rate is approved by the Mississippi PSC and the wholesale rates are approved by the FERC. Emissions allowances granted by the U.S. Environmental Protection Agency (EPA) are included in inventory at zero cost.
Financial Instruments
The Company uses derivative financial instruments to limit exposure to fluctuations in interest rates, the prices of certain fuel purchases, electricity purchases and sales, and occasionally foreign currency exchange rates. All derivative financial instruments are recognized as either assets or liabilities (included in "Other" or shown separately as "Risk Management Activities") and are measured at fair value. See Note 9 for additional information. Substantially all of the Company's bulk energy purchases and sales contracts that meet the definition of a derivative are excluded from the fair value accounting requirements because they qualify for the "normal" scope exception, and are accounted for under the accrual method. Fuel and interest rate derivative contracts qualify as cash flow hedges of anticipated transactions or are recoverable through the Mississippi PSC approved fuel-hedging program as discussed below. This results in the deferral of related gains and losses in OCI or regulatory assets and liabilities, respectively, until the hedged transactions occur. Foreign currency exchange rate hedges are designated as fair value hedges. Settled foreign currency exchange hedges are recorded in CWIP. Any ineffectiveness arising from these would be recognized currently in net income; however, the Company has regulatory approval allowing it to defer any ineffectiveness arising from hedging instruments relating to the Kemper IGCC to a regulatory asset. Other derivative contracts are marked to market through current period income and are recorded on a net basis in the statements of income. The amounts related to derivatives on the cash flow statement are classified in the same category as the items being hedged. See Note 10 for additional information.
The Company does not offset fair value amounts recognized for multiple derivative instruments executed with the same counterparty under a master netting arrangement. Additionally, the Company has no outstanding collateral repayment obligations or rights to reclaim collateral arising from derivative instruments recognized at
December 31, 2013
.
II-396
NOTES (continued)
Mississippi Power Company 2013 Annual Report
The Company has an ECM clause which, among other things, allows the Company to utilize financial instruments to hedge its fuel commitments. Changes in the fair value of these financial instruments are recorded as regulatory assets or liabilities. Amounts paid or received as a result of financial settlement of these instruments are classified as fuel expense and are included in the ECM factor applied to customer billings. The Company's jurisdictional wholesale customers have a similar ECM mechanism, which has been approved by the FERC.
The Company is exposed to losses related to financial instruments in the event of counterparties' nonperformance. The Company has established controls to determine and monitor the creditworthiness of counterparties in order to mitigate the Company's exposure to counterparty credit risk.
Comprehensive Income
The objective of comprehensive income is to report a measure of all changes in common stock equity of an enterprise that result from transactions and other economic events of the period other than transactions with owners. Comprehensive income consists of net income, changes in the fair value of qualifying cash flow hedges, certain changes in pension and other postretirement benefit plans, and reclassifications for amounts included in net income.
Variable Interest Entities
The primary beneficiary of a VIE is required to consolidate the VIE when it has both the power to direct the activities of the VIE that most significantly impact the VIE's economic performance and the obligation to absorb losses or the right to receive benefits from the VIE that could potentially be significant to the VIE.
The Company is required to provide financing for all costs associated with the mine development and operation under a contract with Liberty Fuels Company, LLC, a subsidiary of North American Coal Corporation (Liberty Fuels), in conjunction with the construction of the Kemper IGCC. Liberty Fuels qualifies as a VIE for which the Company is the primary beneficiary. For the year ended
December 31, 2013
, the VIE consolidation resulted in an ARO and an associated liability in the amounts of
$21.0 million
and
$22.7 million
, respectively. For the year ended December 31, 2012, the VIE consolidation resulted in an ARO and an associated liability in the amounts of
$21.0 million
and
$21.8 million
, respectively. For the year ended 2011, Liberty Fuels did not have a material impact on the financial position and results of operations of the Company. See Note 3 under "Integrated Coal Gasification Combined Cycle" for additional information.
2. RETIREMENT BENEFITS
The Company has a defined benefit, trusteed, pension plan covering substantially all employees. This qualified pension plan is funded in accordance with requirements of the Employee Retirement Income Security Act of 1974, as amended (ERISA). No contributions were made to the qualified pension plan during
2013
.
No
mandatory contributions to the qualified pension plan are anticipated for the year ending December 31, 2014. The Company also provides certain defined benefit pension plans for a selected group of management and highly compensated employees. Benefits under these non-qualified pension plans are funded on a cash basis. In addition, the Company provides certain medical care and life insurance benefits for retired employees through other postretirement benefit plans. The Company funds its other postretirement trusts to the extent required by the FERC. For the year ending December 31, 2014, no other postretirement trust contributions are expected.
II-397
NOTES (continued)
Mississippi Power Company 2013 Annual Report
Actuarial Assumptions
The weighted average rates assumed in the actuarial calculations used to determine both the benefit obligations as of the measurement date and the net periodic costs for the pension and other postretirement benefit plans for the following year are presented below. Net periodic benefit costs were calculated in 2010 for the 2011 plan year using discount rates for the pension plans and the other postretirement benefit plans of
5.51%
and
5.39%
, respectively, and an annual salary increase of
3.84%
.
|
2013
|
2012
|
2011
|
||||||
|
Discount rate:
|
||||||||
|
Pension plans
|
5.01
|
%
|
4.26
|
%
|
4.98
|
%
|
||
|
Other postretirement benefit plans
|
4.85
|
|
4.04
|
|
4.87
|
|
||
|
Annual salary increase
|
3.59
|
|
3.59
|
|
3.84
|
|
||
|
Long-term return on plan assets:
|
||||||||
|
Pension plans
|
8.20
|
|
8.20
|
|
8.45
|
|
||
|
Other postretirement benefit plans
|
7.04
|
|
6.96
|
|
7.53
|
|
||
The Company estimates the expected rate of return on pension plan and other postretirement benefit plan assets using a financial model to project the expected return on each current investment portfolio. The analysis projects an expected rate of return on each of seven different asset classes in order to arrive at the expected return on the entire portfolio relying on each trust's target asset allocation and reasonable capital market assumptions. The financial model is based on four key inputs: anticipated returns by asset class (based in part on historical returns), each trust's target asset allocation, an anticipated inflation rate, and the projected impact of a periodic rebalancing of each trust's portfolio.
An additional assumption used in measuring the accumulated other postretirement benefit obligations (APBO) was a weighted average medical care cost trend rate of
7.00%
for 2014, decreasing gradually to
5.00%
through the year
2021
and remaining at that level thereafter. An annual increase or decrease in the assumed medical care cost trend rate of
1%
would affect the APBO and the service and interest cost components at
December 31, 2013
as follows:
|
1 Percent
Increase
|
1 Percent
Decrease
|
||||||
|
(in thousands)
|
|||||||
|
Benefit obligation
|
$
|
4,665
|
|
$
|
(4,004
|
)
|
|
|
Service and interest costs
|
224
|
|
(192
|
)
|
|||
II-398
NOTES (continued)
Mississippi Power Company 2013 Annual Report
Pension Plans
The total accumulated benefit obligation for the pension plans was
$370 million
at
December 31, 2013
and
$392 million
at
December 31, 2012
. Changes in the projected benefit obligations and the fair value of plan assets during the plan years ended
December 31, 2013
and
2012
were as follows:
|
2013
|
2012
|
||||||
|
(in thousands)
|
|||||||
|
Change in benefit obligation
|
|||||||
|
Benefit obligation at beginning of year
|
$
|
432,553
|
|
$
|
369,680
|
|
|
|
Service cost
|
11,067
|
|
9,416
|
|
|||
|
Interest cost
|
18,062
|
|
18,019
|
|
|||
|
Benefits paid
|
(16,207
|
)
|
(14,949
|
)
|
|||
|
Actuarial (gain) loss
|
(36,080
|
)
|
50,387
|
|
|||
|
Balance at end of year
|
409,395
|
|
432,553
|
|
|||
|
Change in plan assets
|
|||||||
|
Fair value of plan assets at beginning of year
|
351,749
|
|
282,100
|
|
|||
|
Actual return on plan assets
|
49,431
|
|
39,668
|
|
|||
|
Employer contributions
|
2,430
|
|
44,930
|
|
|||
|
Benefits paid
|
(16,207
|
)
|
(14,949
|
)
|
|||
|
Fair value of plan assets at end of year
|
387,403
|
|
351,749
|
|
|||
|
Accrued liability
|
$
|
(21,992
|
)
|
$
|
(80,804
|
)
|
|
At
December 31, 2013
, the projected benefit obligations for the qualified and non-qualified pension plans were
$382 million
and
$28 million
, respectively. All pension plan assets are related to the qualified pension plan.
Amounts recognized in the balance sheets at
December 31, 2013
and
2012
related to the Company's pension plans consist of the following:
|
2013
|
2012
|
||||||
|
(in thousands)
|
|||||||
|
Prepaid pension costs
|
$
|
5,698
|
|
$
|
—
|
|
|
|
Other regulatory assets, deferred
|
77,572
|
|
146,838
|
|
|||
|
Other current liabilities
|
(2,134
|
)
|
(2,087
|
)
|
|||
|
Employee benefit obligations
|
(25,556
|
)
|
(78,717
|
)
|
|||
Presented below are the amounts included in regulatory assets at
December 31, 2013
and
2012
related to the defined benefit pension plans that had not yet been recognized in net periodic pension cost along with the estimated amortization of such amounts for
2014
.
|
2013
|
2012
|
Estimated Amortization in 2014
|
|||||||||
|
(in thousands)
|
|||||||||||
|
Prior service cost
|
$
|
4,118
|
|
$
|
5,261
|
|
$
|
1,088
|
|
||
|
Net (gain) loss
|
73,454
|
|
141,577
|
|
4,937
|
|
|||||
|
Regulatory assets
|
$
|
77,572
|
|
$
|
146,838
|
|
|||||
II-399
NOTES (continued)
Mississippi Power Company 2013 Annual Report
The changes in the balance of regulatory assets related to the defined benefit pension plans for the years ended
December 31, 2013
and
2012
are presented in the following table:
|
2013
|
2012
|
|||||
|
(in thousands)
|
||||||
|
Regulatory assets:
|
||||||
|
Beginning balance
|
$
|
146,838
|
|
$
|
117,354
|
|
|
Net (gain) loss
|
(58,662
|
)
|
34,893
|
|
||
|
Reclassification adjustments:
|
||||||
|
Amortization of prior service costs
|
(1,143
|
)
|
(1,309
|
)
|
||
|
Amortization of net gain (loss)
|
(9,461
|
)
|
(4,100
|
)
|
||
|
Total reclassification adjustments
|
(10,604
|
)
|
(5,409
|
)
|
||
|
Total change
|
(69,266
|
)
|
29,484
|
|
||
|
Ending balance
|
$
|
77,572
|
|
$
|
146,838
|
|
Components of net periodic pension cost were as follows:
|
2013
|
2012
|
2011
|
|||||||||
|
(in thousands)
|
|||||||||||
|
Service cost
|
$
|
11,067
|
|
$
|
9,416
|
|
$
|
8,838
|
|
||
|
Interest cost
|
18,062
|
|
18,019
|
|
17,827
|
|
|||||
|
Expected return on plan assets
|
(26,849
|
)
|
(24,121
|
)
|
(25,166
|
)
|
|||||
|
Recognized net (gain) loss
|
9,461
|
|
4,100
|
|
1,114
|
|
|||||
|
Net amortization
|
1,143
|
|
1,309
|
|
1,309
|
|
|||||
|
Net periodic pension cost
|
$
|
12,884
|
|
$
|
8,723
|
|
$
|
3,922
|
|
||
Net periodic pension cost is the sum of service cost, interest cost, and other costs netted against the expected return on plan assets. The expected return on plan assets is determined by multiplying the expected rate of return on plan assets and the market-related value of plan assets. In determining the market-related value of plan assets, the Company has elected to amortize changes in the market value of all plan assets over
five years
rather than recognize the changes immediately. As a result, the accounting value of plan assets that is used to calculate the expected return on plan assets differs from the current fair value of the plan assets.
Future benefit payments reflect expected future service and are estimated based on assumptions used to measure the projected benefit obligation for the pension plans. At
December 31, 2013
, estimated benefit payments were as follows:
|
Benefit
Payments
|
|||
|
(in thousands)
|
|||
|
2014
|
$
|
17,245
|
|
|
2015
|
18,076
|
|
|
|
2016
|
18,993
|
|
|
|
2017
|
20,172
|
|
|
|
2018
|
21,237
|
|
|
|
2019 to 2023
|
124,728
|
|
|
II-400
NOTES (continued)
Mississippi Power Company 2013 Annual Report
Other Postretirement Benefits
Changes in the APBO and in the fair value of plan assets during the plan years ended
December 31, 2013
and
2012
were as follows:
|
2013
|
2012
|
||||||
|
(in thousands)
|
|||||||
|
Change in benefit obligation
|
|||||||
|
Benefit obligation at beginning of year
|
$
|
91,783
|
|
$
|
87,447
|
|
|
|
Service cost
|
1,151
|
|
1,038
|
|
|||
|
Interest cost
|
3,619
|
|
4,155
|
|
|||
|
Benefits paid
|
(4,080
|
)
|
(4,432
|
)
|
|||
|
Actuarial (gain) loss
|
(11,959
|
)
|
3,166
|
|
|||
|
Retiree drug subsidy
|
426
|
|
409
|
|
|||
|
Balance at end of year
|
80,940
|
|
91,783
|
|
|||
|
Change in plan assets
|
|||||||
|
Fair value of plan assets at beginning of year
|
21,990
|
|
20,534
|
|
|||
|
Actual return on plan assets
|
2,379
|
|
2,427
|
|
|||
|
Employer contributions
|
2,562
|
|
3,052
|
|
|||
|
Benefits paid
|
(3,654
|
)
|
(4,023
|
)
|
|||
|
Fair value of plan assets at end of year
|
23,277
|
|
21,990
|
|
|||
|
Accrued liability
|
$
|
(57,663
|
)
|
$
|
(69,793
|
)
|
|
Amounts recognized in the balance sheets at
December 31, 2013
and
2012
related to the Company's other postretirement benefit plans consist of the following:
|
2013
|
2012
|
||||||
|
(in thousands)
|
|||||||
|
Other regulatory assets, deferred
|
$
|
5,227
|
|
$
|
15,454
|
|
|
|
Other regulatory liabilities, deferred
|
(3,111
|
)
|
—
|
|
|||
|
Employee benefit obligations
|
(57,663
|
)
|
(69,793
|
)
|
|||
Presented below are the amounts included in net regulatory assets (liabilities) at
December 31, 2013
and
2012
related to the other postretirement benefit plans that had not yet been recognized in net periodic other postretirement benefit cost along with the estimated amortization of such amounts for
2014
.
|
2013
|
2012
|
Estimated Amortization in 2014
|
|||||||||
|
(in thousands)
|
|||||||||||
|
Prior service cost
|
$
|
(2,311
|
)
|
$
|
(2,498
|
)
|
$
|
(188
|
)
|
||
|
Net (gain) loss
|
4,427
|
|
17,952
|
|
—
|
|
|||||
|
Net regulatory assets (liabilities)
|
$
|
2,116
|
|
$
|
15,454
|
|
|||||
II-401
NOTES (continued)
Mississippi Power Company 2013 Annual Report
The changes in the balance of net regulatory assets (liabilities) related to the other postretirement benefit plans for the plan years ended
December 31, 2013
and
2012
are presented in the following table:
|
2013
|
2012
|
|||||
|
(in thousands)
|
||||||
|
Net regulatory assets (liabilities):
|
||||||
|
Beginning balance
|
$
|
15,454
|
|
$
|
13,324
|
|
|
Net (gain) loss
|
(12,867
|
)
|
2,600
|
|
||
|
Reclassification adjustments:
|
||||||
|
Amortization of transition obligation
|
—
|
|
(171
|
)
|
||
|
Amortization of prior service costs
|
188
|
|
188
|
|
||
|
Amortization of net gain (loss)
|
(659
|
)
|
(487
|
)
|
||
|
Total reclassification adjustments
|
(471
|
)
|
(470
|
)
|
||
|
Total change
|
(13,338
|
)
|
2,130
|
|
||
|
Ending balance
|
$
|
2,116
|
|
$
|
15,454
|
|
Components of the other postretirement benefit plans' net periodic cost were as follows:
|
2013
|
2012
|
2011
|
|||||||||
|
(in thousands)
|
|||||||||||
|
Service cost
|
$
|
1,151
|
|
$
|
1,038
|
|
$
|
1,012
|
|
||
|
Interest cost
|
3,619
|
|
4,155
|
|
4,292
|
|
|||||
|
Expected return on plan assets
|
(1,472
|
)
|
(1,552
|
)
|
(1,763
|
)
|
|||||
|
Net amortization
|
471
|
|
470
|
|
274
|
|
|||||
|
Net periodic postretirement benefit cost
|
$
|
3,769
|
|
$
|
4,111
|
|
$
|
3,815
|
|
||
Future benefit payments, including prescription drug benefits, reflect expected future service and are estimated based on assumptions used to measure the APBO for the other postretirement benefit plans. Estimated benefit payments are reduced by drug subsidy receipts expected as a result of the Medicare Prescription Drug, Improvement, and Modernization Act of 2003 as follows:
|
Benefit Payments
|
Subsidy Receipts
|
Total
|
|||||||||
|
(in thousands)
|
|||||||||||
|
2014
|
$
|
5,051
|
|
$
|
(526
|
)
|
$
|
4,525
|
|
||
|
2015
|
5,335
|
|
(577
|
)
|
4,758
|
|
|||||
|
2016
|
5,569
|
|
(632
|
)
|
4,937
|
|
|||||
|
2017
|
5,849
|
|
(689
|
)
|
5,160
|
|
|||||
|
2018
|
6,091
|
|
(748
|
)
|
5,343
|
|
|||||
|
2019 to 2023
|
32,600
|
|
(3,793
|
)
|
28,807
|
|
|||||
Benefit Plan Assets
Pension plan and other postretirement benefit plan assets are managed and invested in accordance with all applicable requirements, including ERISA and the Internal Revenue Code of 1986, as amended (Internal Revenue Code). The Company's investment policies for both the pension plan and the other postretirement benefit plans cover a diversified mix of assets, including equity and fixed income securities, real estate, and private equity. Derivative instruments are used primarily to gain efficient exposure to the various asset classes and as hedging tools. The Company minimizes the risk of large losses primarily through diversification but also monitors and manages other aspects of risk.
II-402
NOTES (continued)
Mississippi Power Company 2013 Annual Report
The composition of the Company's pension plan and other postretirement benefit plan assets as of
December 31, 2013
and
2012
, along with the targeted mix of assets for each plan, is presented below:
|
Target
|
2013
|
2012
|
||||||
|
Pension plan assets:
|
||||||||
|
Domestic equity
|
26
|
%
|
31
|
%
|
28
|
%
|
||
|
International equity
|
25
|
|
25
|
|
24
|
|
||
|
Fixed income
|
23
|
|
23
|
|
27
|
|
||
|
Special situations
|
3
|
|
1
|
|
1
|
|
||
|
Real estate investments
|
14
|
|
14
|
|
13
|
|
||
|
Private equity
|
9
|
|
6
|
|
7
|
|
||
|
Total
|
100
|
%
|
100
|
%
|
100
|
%
|
||
|
Other postretirement benefit plan assets:
|
||||||||
|
Domestic equity
|
21
|
%
|
25
|
%
|
22
|
%
|
||
|
International equity
|
20
|
|
20
|
|
19
|
|
||
|
Fixed income
|
38
|
|
38
|
|
42
|
|
||
|
Special situations
|
3
|
|
1
|
|
1
|
|
||
|
Real estate investments
|
11
|
|
11
|
|
10
|
|
||
|
Private equity
|
7
|
|
5
|
|
6
|
|
||
|
Total
|
100
|
%
|
100
|
%
|
100
|
%
|
||
The investment strategy for plan assets related to the Company's qualified pension plan is to be broadly diversified across major asset classes. The asset allocation is established after consideration of various factors that affect the assets and liabilities of the pension plan including, but not limited to, historical and expected returns and interest rates, volatility, correlations of asset classes, the current level of assets and liabilities, and the assumed growth in assets and liabilities. Because a significant portion of the liability of the pension plan is long-term in nature, the assets are invested consistent with long-term investment expectations for return and risk. To manage the actual asset class exposures relative to the target asset allocation, the Company employs a formal rebalancing program. As additional risk management, external investment managers and service providers are subject to written guidelines to ensure appropriate and prudent investment practices.
Investment Strategies
Detailed below is a description of the investment strategies for each major asset category for the pension and other postretirement benefit plans disclosed above:
|
•
|
Domestic equity.
A mix of large and small capitalization stocks with generally an equal distribution of value and growth attributes, managed both actively and through passive index approaches.
|
|
•
|
International equity.
A mix of growth stocks and value stocks with both developed and emerging market exposure, managed both actively and through passive index approaches.
|
|
•
|
Fixed income.
A mix of domestic and international bonds.
|
|
•
|
Special situations.
Investments in opportunistic strategies with the objective of diversifying and enhancing returns and exploiting short-term inefficiencies as well as investments in promising new strategies of a longer-term nature.
|
|
•
|
Real estate investments.
Investments in traditional private market, equity-oriented investments in real properties (indirectly through pooled funds or partnerships) and in publicly traded real estate securities.
|
|
•
|
Private equity.
Investments in private partnerships that invest in private or public securities typically through privately-negotiated and/or structured transactions, including leveraged buyouts, venture capital, and distressed debt.
|
Benefit Plan Asset Fair Values
Following are the fair value measurements for the pension plan and the other postretirement benefit plan assets as of
December 31, 2013
and
2012
. The fair values presented are prepared in accordance with GAAP. For purposes of determining the fair value of the pension plan and other postretirement benefit plan assets and the appropriate level designation, management
II-403
NOTES (continued)
Mississippi Power Company 2013 Annual Report
relies on information provided by the plan's trustee. This information is reviewed and evaluated by management with changes made to the trustee information as appropriate.
Valuation methods of the primary fair value measurements disclosed in the following tables are as follows:
|
•
|
Domestic and international equity.
Investments in equity securities such as common stocks, American depositary receipts, and real estate investment trusts that trade on a public exchange are classified as Level 1 investments and are valued at the closing price in the active market. Equity investments with unpublished prices (i.e. pooled funds) are valued as Level 2, when the underlying holdings used to value the investment are comprised of Level 1 or Level 2 equity securities.
|
|
•
|
Fixed income.
Investments in fixed income securities are generally classified as Level 2 investments and are valued based on prices reported in the market place. Additionally, the value of fixed income securities takes into consideration certain items such as broker quotes, spreads, yield curves, interest rates, and discount rates that apply to the term of a specific instrument.
|
|
•
|
Real estate investments and private equity.
Investments in private equity and real estate are generally classified as Level 3 as the underlying assets typically do not have observable inputs. The fund manager values the assets using various inputs and techniques depending on the nature of the underlying investments. In the case of private equity, techniques may include purchase multiples for comparable transactions, comparable public company trading multiples, and discounted cash flow analysis. Real estate managers generally use prevailing market capitalization rates, recent sales of comparable investments, and independent third-party appraisals to value underlying real estate investments. The fair value of partnerships is determined by aggregating the value of the underlying assets.
|
The fair values of pension plan assets as of
December 31, 2013
and
2012
are presented below. These fair value measurements exclude cash, receivables related to investment income, pending investments sales, and payables related to pending investment purchases. Assets that are considered special situations investments, primarily real estate investments and private equities, are presented in the tables below based on the nature of the investment.
|
Fair Value Measurements Using
|
|||||||||||||||
|
Quoted Prices in Active Markets for Identical Assets
|
Significant Other Observable Inputs
|
Significant Unobservable Inputs
|
|||||||||||||
|
As of December 31, 2013:
|
(Level 1)
|
(Level 2)
|
(Level 3)
|
Total
|
|||||||||||
|
(in thousands)
|
|||||||||||||||
|
Assets:
|
|||||||||||||||
|
Domestic equity*
|
$
|
63,558
|
|
$
|
37,206
|
|
$
|
—
|
|
$
|
100,764
|
|
|||
|
International equity*
|
48,829
|
|
45,146
|
|
—
|
|
93,975
|
|
|||||||
|
Fixed income:
|
|||||||||||||||
|
U.S. Treasury, government, and agency bonds
|
—
|
|
26,582
|
|
—
|
|
26,582
|
|
|||||||
|
Mortgage- and asset-backed securities
|
—
|
|
6,904
|
|
—
|
|
6,904
|
|
|||||||
|
Corporate bonds
|
—
|
|
43,420
|
|
—
|
|
43,420
|
|
|||||||
|
Pooled funds
|
—
|
|
20,905
|
|
—
|
|
20,905
|
|
|||||||
|
Cash equivalents and other
|
38
|
|
9,896
|
|
—
|
|
9,934
|
|
|||||||
|
Real estate investments
|
11,546
|
|
—
|
|
44,341
|
|
55,887
|
|
|||||||
|
Private equity
|
—
|
|
—
|
|
25,316
|
|
25,316
|
|
|||||||
|
Total
|
$
|
123,971
|
|
$
|
190,059
|
|
$
|
69,657
|
|
$
|
383,687
|
|
|||
|
Liabilities:
|
|||||||||||||||
|
Derivatives
|
—
|
|
(115
|
)
|
—
|
|
(115
|
)
|
|||||||
|
Total
|
$
|
123,971
|
|
$
|
189,944
|
|
$
|
69,657
|
|
$
|
383,572
|
|
|||
|
*
|
Level 1 securities consist of actively traded stocks while Level 2 securities consist of pooled funds. Management believes that the portfolio is well-diversified with no significant concentrations of risk.
|
II-404
NOTES (continued)
Mississippi Power Company 2013 Annual Report
|
Fair Value Measurements Using
|
|||||||||||||||
|
Quoted Prices in Active Markets for Identical Assets
|
Significant Other Observable Inputs
|
Significant Unobservable Inputs
|
|||||||||||||
|
As of December 31, 2012:
|
(Level 1)
|
(Level 2)
|
(Level 3)
|
Total
|
|||||||||||
|
(in thousands)
|
|||||||||||||||
|
Assets:
|
|||||||||||||||
|
Domestic equity*
|
$
|
51,433
|
|
$
|
29,624
|
|
$
|
—
|
|
$
|
81,057
|
|
|||
|
International equity*
|
40,337
|
|
43,303
|
|
—
|
|
83,640
|
|
|||||||
|
Fixed income:
|
|||||||||||||||
|
U.S. Treasury, government, and agency bonds
|
—
|
|
22,820
|
|
—
|
|
22,820
|
|
|||||||
|
Mortgage- and asset-backed securities
|
—
|
|
5,618
|
|
—
|
|
5,618
|
|
|||||||
|
Corporate bonds
|
—
|
|
38,696
|
|
140
|
|
38,836
|
|
|||||||
|
Pooled funds
|
—
|
|
17,656
|
|
—
|
|
17,656
|
|
|||||||
|
Cash equivalents and other
|
209
|
|
24,251
|
|
—
|
|
24,460
|
|
|||||||
|
Real estate investments
|
11,410
|
|
—
|
|
37,196
|
|
48,606
|
|
|||||||
|
Private equity
|
—
|
|
—
|
|
26,240
|
|
26,240
|
|
|||||||
|
Total
|
$
|
103,389
|
|
$
|
181,968
|
|
$
|
63,576
|
|
$
|
348,933
|
|
|||
|
*
|
Level 1 securities consist of actively traded stocks while Level 2 securities consist of pooled funds. Management believes that the portfolio is well-diversified with no significant concentrations of risk.
|
Changes in the fair value measurement of the Level 3 items in the pension plan assets valued using significant unobservable inputs for the years ended
December 31, 2013
and
2012
were as follows:
|
2013
|
2012
|
||||||||||||||
|
Real Estate
Investments
|
Private Equity
|
Real Estate
Investments
|
Private Equity
|
||||||||||||
|
(in thousands)
|
|||||||||||||||
|
Beginning balance
|
$
|
37,196
|
|
$
|
26,240
|
|
$
|
32,434
|
|
$
|
24,151
|
|
|||
|
Actual return on investments:
|
|||||||||||||||
|
Related to investments held at year end
|
3,385
|
|
378
|
|
4,629
|
|
44
|
|
|||||||
|
Related to investments sold during the year
|
1,316
|
|
2,300
|
|
133
|
|
3,415
|
|
|||||||
|
Total return on investments
|
4,701
|
|
2,678
|
|
4,762
|
|
3,459
|
|
|||||||
|
Purchases, sales, and settlements
|
2,444
|
|
(3,602
|
)
|
—
|
|
(1,370
|
)
|
|||||||
|
Ending balance
|
$
|
44,341
|
|
$
|
25,316
|
|
$
|
37,196
|
|
$
|
26,240
|
|
|||
II-405
NOTES (continued)
Mississippi Power Company 2013 Annual Report
The fair values of other postretirement benefit plan assets as of
December 31, 2013
and
2012
are presented below. These fair value measurements exclude cash, receivables related to investment income, pending investments sales, and payables related to pending investment purchases. Assets that are considered special situations investments, primarily real estate investments and private equities, are presented in the tables below based on the nature of the investment.
|
Fair Value Measurements Using
|
|||||||||||||||
|
Quoted Prices in Active Markets for Identical Assets
|
Significant Other Observable Inputs
|
Significant Unobservable Inputs
|
|||||||||||||
|
As of December 31, 2013:
|
(Level 1)
|
(Level 2)
|
(Level 3)
|
Total
|
|||||||||||
|
|
(in thousands)
|
||||||||||||||
|
Assets:
|
|||||||||||||||
|
Domestic equity*
|
$
|
3,089
|
|
$
|
1,809
|
|
$
|
—
|
|
$
|
4,898
|
|
|||
|
International equity*
|
2,375
|
|
2,193
|
|
—
|
|
4,568
|
|
|||||||
|
Fixed income:
|
|||||||||||||||
|
U.S. Treasury, government, and agency bonds
|
—
|
|
5,213
|
|
—
|
|
5,213
|
|
|||||||
|
Mortgage- and asset-backed securities
|
—
|
|
337
|
|
—
|
|
337
|
|
|||||||
|
Corporate bonds
|
—
|
|
2,109
|
|
—
|
|
2,109
|
|
|||||||
|
Pooled funds
|
—
|
|
1,016
|
|
—
|
|
1,016
|
|
|||||||
|
Cash equivalents and other
|
1
|
|
968
|
|
—
|
|
969
|
|
|||||||
|
Real estate investments
|
560
|
|
—
|
|
2,156
|
|
2,716
|
|
|||||||
|
Private equity
|
—
|
|
—
|
|
1,231
|
|
1,231
|
|
|||||||
|
Total
|
$
|
6,025
|
|
$
|
13,645
|
|
$
|
3,387
|
|
$
|
23,057
|
|
|||
|
Liabilities:
|
|||||||||||||||
|
Derivatives
|
—
|
|
(5
|
)
|
—
|
|
(5
|
)
|
|||||||
|
Total
|
$
|
6,025
|
|
$
|
13,640
|
|
$
|
3,387
|
|
$
|
23,052
|
|
|||
|
*
|
Level 1 securities consist of actively traded stocks while Level 2 securities consist of pooled funds. Management believes that the portfolio is well-diversified with no significant concentrations of risk.
|
II-406
NOTES (continued)
Mississippi Power Company 2013 Annual Report
|
Fair Value Measurements Using
|
|||||||||||||||
|
Quoted Prices in Active Markets for Identical Assets
|
Significant Other Observable Inputs
|
Significant Unobservable Inputs
|
|||||||||||||
|
As of December 31, 2012:
|
(Level 1)
|
(Level 2)
|
(Level 3)
|
Total
|
|||||||||||
|
(in thousands)
|
|||||||||||||||
|
Assets:
|
|||||||||||||||
|
Domestic equity*
|
$
|
2,561
|
|
$
|
1,475
|
|
$
|
—
|
|
$
|
4,036
|
|
|||
|
International equity*
|
2,008
|
|
2,156
|
|
—
|
|
4,164
|
|
|||||||
|
Fixed income:
|
|||||||||||||||
|
U.S. Treasury, government, and agency bonds
|
—
|
|
5,187
|
|
—
|
|
5,187
|
|
|||||||
|
Mortgage- and asset-backed securities
|
—
|
|
280
|
|
—
|
|
280
|
|
|||||||
|
Corporate bonds
|
—
|
|
1,925
|
|
7
|
|
1,932
|
|
|||||||
|
Pooled funds
|
—
|
|
879
|
|
—
|
|
879
|
|
|||||||
|
Cash equivalents and other
|
11
|
|
1,612
|
|
—
|
|
1,623
|
|
|||||||
|
Real estate investments
|
569
|
|
—
|
|
1,865
|
|
2,434
|
|
|||||||
|
Private equity
|
—
|
|
14
|
|
1,293
|
|
1,307
|
|
|||||||
|
Total
|
$
|
5,149
|
|
$
|
13,528
|
|
$
|
3,165
|
|
$
|
21,842
|
|
|||
|
*
|
Level 1 securities consist of actively traded stocks while Level 2 securities consist of pooled funds. Management believes that the portfolio is well-diversified with no significant concentrations of risk.
|
Changes in the fair value measurement of the Level 3 items in the other postretirement benefit plan assets valued using significant unobservable inputs for the years ended
December 31, 2013
and
2012
were as follows:
|
2013
|
2012
|
||||||||||||||
|
Real Estate Investments
|
Private Equity
|
Real Estate Investments
|
Private Equity
|
||||||||||||
|
(in thousands)
|
|||||||||||||||
|
Beginning balance
|
$
|
1,865
|
|
$
|
1,293
|
|
$
|
1,851
|
|
$
|
1,377
|
|
|||
|
Actual return on investments:
|
|||||||||||||||
|
Related to investments held at year end
|
158
|
|
18
|
|
119
|
|
(1
|
)
|
|||||||
|
Related to investments sold during the year
|
64
|
|
110
|
|
7
|
|
90
|
|
|||||||
|
Total return on investments
|
222
|
|
128
|
|
126
|
|
89
|
|
|||||||
|
Purchases, sales, and settlements
|
69
|
|
(190
|
)
|
(112
|
)
|
(173
|
)
|
|||||||
|
Ending balance
|
$
|
2,156
|
|
$
|
1,231
|
|
$
|
1,865
|
|
$
|
1,293
|
|
|||
Employee Savings Plan
The Company also sponsors a 401(k) defined contribution plan covering substantially all employees. The Company provides an
85%
matching contribution on up to
6%
of an employee's base salary. Total matching contributions made to the plan for
2013
,
2012
, and
2011
were
$4.1 million
,
$3.9 million
, and
$3.8 million
, respectively.
3. CONTINGENCIES AND REGULATORY MATTERS
General Litigation Matters
The Company is subject to certain claims and legal actions arising in the ordinary course of business. In addition, the Company's business activities are subject to extensive governmental regulation related to public health and the environment such as regulation of air emissions and water discharges. Litigation over environmental issues and claims of various types, including property damage, personal injury, common law nuisance, and citizen enforcement of environmental requirements such as air quality and water standards, has increased generally throughout the U.S. In particular, personal injury, property damage, and other
II-407
NOTES (continued)
Mississippi Power Company 2013 Annual Report
claims for damages alleged to have been caused by carbon dioxide (CO
2
) and other emissions, coal combustion residuals, and alleged exposure to hazardous materials, and/or requests for injunctive relief in connection with such matters, have become more frequent. The ultimate outcome of such pending or potential litigation against the Company cannot be predicted at this time; however, for current proceedings not specifically reported herein, management does not anticipate that the ultimate liabilities, if any, arising from such current proceedings would have a material effect on the Company's financial statements.
Environmental Matters
New Source Review Actions
As part of a nationwide enforcement initiative against the electric utility industry which began in 1999, the EPA brought civil enforcement actions in federal district court against Alabama Power alleging violations of the New Source Review (NSR) provisions of the Clean Air Act at certain coal-fired electric generating units, including a unit co-owned by the Company. These civil actions seek penalties and injunctive relief, including orders requiring installation of the best available control technologies at the affected units. These actions were filed concurrently with the issuance of notices of violation to the Company with respect to the Company's Plant Watson. The case against Alabama Power (including claims involving a unit co-owned by the Company) has been actively litigated in the U.S. District Court for the Northern District of Alabama, resulting in a settlement in 2006 of the alleged NSR violations at Plant Miller; voluntary dismissal of certain claims by the EPA; and a grant of summary judgment for Alabama Power on all remaining claims and dismissal of the case with prejudice in 2011. On September 19, 2013, the U.S. Court of Appeals for the Eleventh Circuit affirmed in part and reversed in part the 2011 judgment in favor of Alabama Power, and the case has been transferred back to the U.S. District Court for the Northern District of Alabama for further proceedings.
The Company believes it complied with applicable laws and regulations in effect at the time the work in question took place. The Clean Air Act authorizes maximum civil penalties of
$25,000
to
$37,500
per day, per violation, depending on the date of the alleged violation. An adverse outcome could require substantial capital expenditures that cannot be determined at this time and could possibly require payment of substantial penalties. Such expenditures could affect future results of operations, cash flows, and financial condition if such costs are not recovered through regulated rates. The ultimate outcome of this matter cannot be determined at this time.
Environmental Remediation
The Company must comply with environmental laws and regulations that cover the handling and disposal of waste and releases of hazardous substances. Under these various laws and regulations, the Company may also incur substantial costs to clean up properties. The Company has authority from the Mississippi PSC to recover approved environmental compliance costs through regulatory mechanisms.
In 2003, the Texas Commission on Environmental Quality (TCEQ) designated the Company as a potentially responsible party at a site in Texas. The site was owned by an electric transformer company that handled the Company's transformers as well as those of many other entities. The site owner is bankrupt and the State of Texas has entered into an agreement with the Company and several other utilities to investigate and remediate the site. Hundreds of entities have received notices from the TCEQ requesting their participation in the anticipated site remediation. The TCEQ approved the final site remediation plan in December 2013.
Amounts expensed and accrued during
2011
,
2012
, and
2013
related to this work were not material. The final impact of this matter on the Company will depend upon further environmental assessment and the ultimate number of potentially responsible parties. The remediation expenses incurred by the Company are expected to be recovered through the Environmental Compliance Overview (ECO) Plan.
The final outcome of this matter cannot now be determined. However, based on the currently known conditions at this site and the nature and extent of activities relating to this site, the Company does not believe that additional liabilities, if any, at this site would be material to the financial statements.
FERC Matters
In November 2011, the Company filed a request with the FERC for an increase in wholesale base revenues of approximately
$32 million
under the wholesale cost-based electric tariff. In its filing with the FERC, the Company sought (i) approval to establish a regulatory asset for the portion of non-capitalizable Kemper IGCC-related costs which have been and will continue to be incurred during the construction period for the Kemper IGCC, (ii) authorization to defer as a regulatory asset, for the
10
-year period ending October 2021, the difference between the revenue requirement under the purchase option of Plant Daniel Units 3 and 4 (assuming a remaining
30
-year life) and the revenue requirement assuming the continuation of the operating lease regulatory treatment with the accumulated deferred balance at the end of the deferral being amortized into wholesale rates over the
II-408
NOTES (continued)
Mississippi Power Company 2013 Annual Report
remaining life of Plant Daniel Units 3 and 4, and (iii) authority to defer in a regulatory asset costs related to the retirement or partial retirement of generating units as a result of environmental compliance rules.
In March 2012, the Company entered into a settlement agreement with its wholesale customers with respect to the Company's request for revised rates under the wholesale cost-based electric tariff. The settlement agreement provided that base rates under the cost-based electric tariff increase by approximately
$22.6 million
over a
12
-month period with revised rates effective April 1, 2012. A significant portion of the difference between the requested base rate increase and the agreed upon rate increase was due to a change in the recovery methodology for the return on the Kemper IGCC CWIP. Under the settlement agreement, a portion of CWIP will continue to accrue AFUDC. The tariff customers specifically agreed to the same regulatory treatment for tariff ratemaking as the treatment approved for retail ratemaking by the Mississippi PSC with respect to (i) the accounting for Kemper IGCC-related costs that cannot be capitalized, (ii) the accounting for the lease termination and purchase of Plant Daniel Units 3 and 4, and (iii) the establishment of a regulatory asset for certain potential plant retirement costs.
In March 2012, the FERC approved a motion to place interim rates into effect beginning in May 2012. In September 2012, the Company, with its wholesale customers, filed a final settlement agreement with the FERC. On May 3, 2013, the Company received an order from the FERC accepting the settlement agreement.
On April 1, 2013, the Company reached a settlement agreement with its wholesale customers and filed a request with the FERC for an additional increase in the Municipal and Rural Associations (MRA) cost-based electric tariff, which was accepted by the FERC on May 30, 2013. The 2013 settlement agreement provided that base rates under the MRA cost-based electric tariff will increase by approximately
$24.2 million
annually, effective April 1, 2013.
Retail Regulatory Matters
General
In August 2012, the Mississippi PSC issued an order for the purpose of investigating and reviewing for informational purposes only the return on equity (ROE) formulas used by the Company and all other regulated electric utilities in Mississippi. On March 14, 2013, the Mississippi Public Utilities Staff (MPUS) filed with the Mississippi PSC its report on the ROE formulas used by the Company and all other regulated electric utilities in Mississippi. The ultimate outcome of this matter cannot be determined at this time.
Energy Efficiency
On July 11, 2013, the Mississippi PSC approved an energy efficiency and conservation rule requiring electric and gas utilities in Mississippi serving more than
25,000
customers to implement energy efficiency programs and standards. Quick Start Plans, which include a portfolio of energy efficiency programs that are intended to provide benefits to a majority of customers, were required to be filed within
six months
of the order and will be in effect for
two
to
three years
. An annual report addressing the performance of all energy efficiency programs is required. On January 10, 2014, the Company submitted its 2014 Energy Efficiency Quick Start Plan filing which proposed a portfolio of energy efficiency programs. The ultimate outcome of this matter cannot be determined at this time.
Performance Evaluation Plan
The Company’s retail base rates are set under the Performance Evaluation Plan (PEP), a rate plan approved by the Mississippi PSC. Two filings are made for each calendar year: the PEP projected filing, which is typically filed prior to the beginning of the year based on projected revenue requirement, and the PEP lookback filing, which is filed after the year and allows for review of actual revenue requirement compared to the projected filing. PEP was designed with the objective to reduce the impact of rate changes on the customer and provide incentives for the Company to keep customer prices low and customer satisfaction and reliability high. PEP is a mechanism for rate adjustments based on three indicators: price, customer satisfaction, and service reliability.
In 2011, the Company submitted its annual PEP lookback filing for 2010, which recommended no surcharge or refund. Later in 2011, the Company received a letter from the MPUS disputing certain items in the 2010 PEP lookback filing. In May 2012, the Mississippi PSC issued an order suspending the Company's annual lookback filing for 2011.
On March 15, 2013, the Company submitted its annual PEP lookback filing for 2012, which indicated a refund due to customers of
$4.7 million
, which was accrued in retail revenues in 2013. On May 1, 2013, the MPUS contested the filing. Unresolved matters related to certain costs included in the 2010 PEP lookback filing, which are currently under review, also impact the 2012 PEP lookback filing.
II-409
NOTES (continued)
Mississippi Power Company 2013 Annual Report
On March 5, 2013, the Mississippi PSC approved the projected PEP filing for 2013, which resulted in a rate increase of
1.925%
, or
$15.3 million
, annually, with the new rates effective March 19, 2013. The Company may be entitled to
$3.3 million
in additional revenues related to 2013 as a result of the late implementation of the 2013 PEP rate increase.
While the Company does not expect the resolution of these matters to have a material impact on its financial statements, the ultimate outcome cannot be determined at this time.
Environmental Compliance Overview Plan
In 2011, the Company filed a request to establish a regulatory asset to defer certain plant retirement costs if such costs are incurred. This request was made to minimize the potential rate impact to customers arising from pending and final environmental regulations which may require the premature retirement of some generating units. These environmental rules and regulations are continuously monitored by the Company and all options are evaluated. In December 2011, an order was issued by the Mississippi PSC authorizing the Company to defer all plant retirement related costs resulting from compliance with environmental regulations as a regulatory asset for future recovery.
In April 2012, the Mississippi PSC approved the Company's request for a certificate of public convenience and necessity (CPCN) to construct a flue gas desulfurization system (scrubber) on Plant Daniel Units 1 and 2. In May 2012, the Sierra Club filed a notice of appeal of the order with the Chancery Court of Harrison County, Mississippi (Chancery Court). These units are jointly owned by the Company and Gulf Power, with
50%
ownership each. The estimated total cost of the project is approximately
$660 million
, with the Company's portion being
$330 million
, excluding AFUDC. The Company's portion of the cost is expected to be recovered through the ECO Plan following the scheduled completion of the project in December 2015. As of
December 31, 2013
, total project expenditures were
$320.6 million
, of which the Company's portion was
$162.3 million
, excluding AFUDC of
$8.5 million
.
In June 2012, the Mississippi PSC approved the Company's 2012 ECO Plan filing, including a
0.16%
, or $
1.5 million
, decrease in annual revenues, effective June 29, 2012. On August 13, 2013, the Mississippi PSC approved the Company’s 2013 ECO Plan filing which proposed no change in rates.
The ultimate outcome of these matters cannot be determined at this time.
Fuel Cost Recovery
The Company establishes, annually, a retail fuel cost recovery factor that is approved by the Mississippi PSC. The Company is required to file for an adjustment to the retail fuel cost recovery factor annually; the most recent filing occurred on November 15, 2013. The Mississippi PSC approved the 2014 retail fuel cost recovery factor on January 7, 2014, with the new rates effective in February 2014. The retail fuel cost recovery factor will result in an annual increase of
3.4%
of total 2013 retail revenue, or
$30.1 million
. At
December 31, 2013
, the amount of over recovered retail fuel costs included in the balance sheets was
$14.5 million
compared to
$56.6 million
at
December 31, 2012
. The Company also has a wholesale MRA and a Market Based (MB) fuel cost recovery factor. Effective January 1, 2014, the wholesale MRA fuel rate increased resulting in an annual increase of
$10.1 million
. Effective February 1, 2014, the wholesale MB fuel rate increased, resulting in an annual increase of
$1.2 million
. At
December 31, 2013
, the amount of over recovered wholesale MRA and MB fuel costs included in the balance sheets was
$7.3 million
and
$0.3 million
compared to
$19.0 million
and
$2.1 million
, respectively, at
December 31, 2012
. In addition, at
December 31, 2013
, the amount of under recovered MRA emissions allowance cost included in the balance sheets was
$3.8 million
compared to
$0.4 million
at
December 31, 2012
. The Company's operating revenues are adjusted for differences in actual recoverable fuel cost and amounts billed in accordance with the currently approved cost recovery rate. Accordingly, changes in the billing factor have no significant effect on the Company's revenues or net income, but will affect cash flow.
In March 2011, a portion of the Company's territorial wholesale loads that was formerly served under the MB tariff terminated service. Beginning in April 2011, a new power purchase agreement (PPA) went into effect to cover these MB customers as non-territorial load. In June 2011, the Company and South Mississippi Electric Power Association (SMEPA) reached an agreement to allocate
$3.7 million
of the over recovered fuel balance at March 31, 2011 to the PPA. This amount was subsequently refunded to SMEPA in June 2011.
The Mississippi PSC engaged an independent professional audit firm to conduct an audit of the Company's fuel-related expenditures included in the retail fuel adjustment clause and ECM. The 2013, 2012, and 2011 audits of fuel-related expenditures were completed with no audit findings.
Ad Valorem Tax Adjustment
The Company establishes, annually, an ad valorem tax adjustment factor that is approved by the Mississippi PSC to collect the ad valorem taxes paid by the Company. On June 4, 2013, the Mississippi PSC approved an annual rate increase of
0.9%
, or
$7.1
II-410
NOTES (continued)
Mississippi Power Company 2013 Annual Report
million
, due to an increase in ad valorem taxes resulting from the expiration of a tax exemption related to Plant Daniel Units 3 and 4.
System Restoration Rider
The Company is required to make annual SRR filings to review charges to the property damage reserve and to determine the revenue requirement associated with property damage. The purpose of the SRR is to provide for recovery of costs associated with property damage (including certain property insurance and the costs of self-insurance) and to facilitate the Mississippi PSC's review of these costs. The Mississippi PSC periodically agrees on SRR revenue levels that are developed based on historical data, expected exposure, type and amount of insurance coverage excluding insurance costs, and other relevant information. The applicable SRR rate level will be reviewed every
three years
, unless a significant change in circumstances occurs such that the Company and the MPUS or the Mississippi PSC deems that a more frequent change in rates would be appropriate. The Company will submit annual filings setting forth SRR-related revenues, expenses, and investment for the projected filing period, as well as the true-up for the prior period.
For 2011, 2012, and 2013, the SRR rate was zero. The Mississippi PSC approved accruals to the property damage reserve of
$3.8 million
and
$3.2 million
in 2012 and 2013, respectively. On February 3, 2014, the Company submitted its 2014 SRR rate filing with the Mississippi PSC, which proposed that the 2014 SRR rate level remain at zero and the Company be allowed to accrue
$3.3 million
to the property damage reserve in 2014. The ultimate outcome of this matter cannot be determined at this time.
Storm Damage Cost Recovery
The Company maintains a reserve to cover the cost of damage from major storms to its transmission and distribution facilities and generally the cost of uninsured damage to its generation facilities and other property. The total storm restoration costs incurred in
2013
and 2012 were
$2.3 million
and
$10.5 million
, respectively. At
December 31, 2013
, the balance in the property damage reserve was
$60.1 million
.
Baseload Act
In 2008, legislation designed to enhance the Mississippi PSC's authority to facilitate development and construction of baseload generation in the State of Mississippi (Baseload Act) was signed by the Governor of Mississippi. The Baseload Act authorizes, but does not require, the Mississippi PSC to adopt a cost recovery mechanism that includes in retail base rates, prior to and during construction, all or a portion of the prudently-incurred pre-construction and construction costs incurred by a utility in constructing a base load electric generating plant. Prior to the passage of the Baseload Act, such costs would traditionally be recovered only after the plant was placed in service. The Baseload Act also provides for periodic prudence reviews by the Mississippi PSC and prohibits the cancellation of any such generating plant without the approval of the Mississippi PSC. In the event of cancellation of the construction of the plant without approval of the Mississippi PSC, the Baseload Act authorizes the Mississippi PSC to make a public interest determination as to whether and to what extent the utility will be afforded rate recovery for costs incurred in connection with such cancelled generating plant. There are legal challenges to the constitutionality of the Baseload Act currently pending before the Mississippi Supreme Court. The ultimate outcome of any legal challenges to this legislation cannot be determined at this time. See "Integrated Coal Gasification Combined Cycle – Rate Recovery of Kemper IGCC Costs" herein for additional information.
Integrated Coal Gasification Combined Cycle
Kemper IGCC Overview
Construction of the Kemper IGCC is nearing completion and start-up activities will continue until the Kemper IGCC is placed in service. The Kemper IGCC will utilize an integrated coal gasification combined cycle technology with an output capacity of
582
megawatts (MWs). The Kemper IGCC will be fueled by locally mined lignite (an abundant, lower heating value coal) from a mine owned by the Company and situated adjacent to the Kemper IGCC. The mine, operated by North American Coal Corporation, started commercial operation on June 5, 2013. In connection with the Kemper IGCC, the Company constructed and plans to operate approximately
61
miles of CO
2
pipeline infrastructure for the planned transport of captured CO
2
for use in enhanced oil recovery.
Kemper IGCC Project Approval
In April 2012, the Mississippi PSC issued a detailed order confirming the CPCN originally approved by the Mississippi PSC in 2010 authorizing the acquisition, construction, and operation of the Kemper IGCC (2012 MPSC CPCN Order), which the Sierra Club appealed to the Chancery Court. In December 2012, the Chancery Court affirmed the 2012 MPSC CPCN Order. On January 8, 2013, the Sierra Club filed an appeal of the Chancery Court's ruling with the Mississippi Supreme Court. The ultimate outcome of the CPCN challenge cannot be determined at this time.
II-411
NOTES (continued)
Mississippi Power Company 2013 Annual Report
Kemper IGCC Schedule and Cost Estimate
The certificated cost estimate of the Kemper IGCC included in the 2012 MPSC CPCN Order was
$2.4 billion
, net of the
$245.3 million
of DOE Grants and excluding the cost of the lignite mine and equipment, the cost of the CO
2
pipeline facilities, and AFUDC related to the Kemper IGCC. The 2012 MPSC CPCN Order approved a construction cost cap of up to
$2.88 billion
, with recovery of prudently-incurred costs subject to approval by the Mississippi PSC. Exceptions to the
$2.88 billion
cost cap include the cost of the lignite mine and equipment, the cost of the CO
2
pipeline facilities, AFUDC, and certain general exceptions, including change of law, force majeure, and beneficial capital (which exists when the Company demonstrates that the purpose and effect of the construction cost increase is to produce efficiencies that will result in a neutral or favorable effect on the ratepayers, relative to the original proposal for the CPCN) (Cost Cap Exceptions), as contemplated in the settlement agreement between the Company and the Mississippi PSC entered into on January 24, 2013 (Settlement Agreement) and the 2012 MPSC CPCN Order. Recovery of the Cost Cap Exception amounts remains subject to review and approval by the Mississippi PSC. The Kemper IGCC was originally scheduled to be placed in service in May 2014 and is currently scheduled to be placed in service in the fourth quarter 2014.
The Company's 2010 project estimate, current cost estimate, and actual costs incurred as of December 31, 2013 for the Kemper IGCC are as follows:
|
Cost Category
|
2010 Project Estimate
(d)
|
Current Estimate
|
Actual Costs at 12/31/2013
|
||||||
|
(in billions)
|
|||||||||
|
Plant Subject to Cost Cap
(a)
|
$
|
2.40
|
|
$
|
4.06
|
|
$
|
3.25
|
|
|
Lignite Mine and Equipment
|
0.21
|
0.23
|
0.23
|
||||||
|
CO
2
Pipeline Facilities
|
0.14
|
0.11
|
0.09
|
||||||
|
AFUDC
(b)
|
0.17
|
0.45
|
0.28
|
||||||
|
General Exceptions
|
0.05
|
0.10
|
0.07
|
||||||
|
Regulatory Asset
(c)
|
—
|
|
0.09
|
0.07
|
|||||
|
Total Kemper IGCC
(a)
|
$
|
2.97
|
|
$
|
5.04
|
|
$
|
3.99
|
|
|
(a)
|
The 2012 MPSC CPCN Order approved a construction cost cap of up to
$2.88 billion
, net of the DOE Grants and excluding the Cost Cap Exceptions.
|
|
(b)
|
The Company’s original estimate included recovery of financing costs during construction which was not approved by the Mississippi PSC in June 2012 as described in "Rate Recovery of Kemper IGCC Costs."
|
|
(c)
|
The 2012 MPSC CPCN Order approved deferral of non-capital Kemper IGCC-related costs during construction as described in "Rate Recovery of Kemper IGCC Costs – Regulatory Assets."
|
|
(d)
|
The 2010 Project Estimate is the certificated cost estimate adjusted to include the certificated estimate for the CO
2
pipeline facilities which was approved in 2011 by the Mississippi PSC.
|
Of the total costs incurred as of December 31, 2013,
$2.74 billion
was included in CWIP (which is net of the DOE Grants and estimated probable losses of
$1.18 billion
),
$70.5 million
in other regulatory assets, and
$3.9 million
in other deferred charges and assets in the balance sheet, and
$1.0 million
was previously expensed.
The Company does not intend to seek any rate recovery or joint owner contributions for any related costs that exceed the
$2.88 billion
cost cap, excluding the Cost Cap Exceptions and net of the DOE Grants. The Company recorded pre-tax charges to income for revisions to the cost estimate of
$78.0 million
(
$48.2 million
after tax) and
$1.1 billion
(
$680.5 million
after tax) in 2012 and 2013, respectively. The revised cost estimates reflect increased labor costs, piping and other material costs, start-up costs, decreases in construction labor productivity, the change in the in-service date, and an increase in the contingency for risks associated with start-up activities.
The Company could experience further construction cost increases and/or schedule extensions with respect to the Kemper IGCC as a result of factors including, but not limited to, labor costs and productivity, adverse weather conditions, shortages and inconsistent quality of equipment, materials, and labor, contractor or supplier delay, or non-performance under construction or other agreements. Furthermore, the Company could also experience further schedule extensions associated with start-up activities for this "first-of-a-kind" technology, including major equipment failure, system integration, and operations, and/or unforeseen engineering problems, which would result in further cost increases and could result in the loss of certain tax benefits related to bonus depreciation. In subsequent periods, any further changes in the estimated costs to complete construction of the Kemper
II-412
NOTES (continued)
Mississippi Power Company 2013 Annual Report
IGCC subject to the
$2.88 billion
cost cap will be reflected in the Company's statements of income and these changes could be material.
Rate Recovery of Kemper IGCC Costs
See "FERC Matters" for additional information regarding the Company’s MRA cost based tariff relating to recovery of a portion of the Kemper IGCC costs from the Company’s wholesale customers. Rate recovery of the retail portion of the Kemper IGCC is subject to the jurisdiction of the Mississippi PSC. See "Retail Regulatory Matters – Baseload Act" for additional information.
The ultimate outcome of the rate recovery matters discussed herein, including the resolution of legal challenges, determinations of prudency, and the specific manner of recovery of prudently-incurred costs, cannot be determined at this time, but could have a material impact on the Company’s results of operations, financial condition, and liquidity.
2012 MPSC CPCN Order
The 2012 MPSC CPCN Order included provisions relating to both the Company's recovery of financing costs during the course of construction of the Kemper IGCC and the Company's recovery of costs following the date the Kemper IGCC is placed in service. With respect to recovery of costs following the in-service date of the Kemper IGCC, the 2012 MPSC CPCN Order provided for the establishment of operational cost and revenue parameters based upon assumptions in the Company's petition for the CPCN.
In June 2012, the Mississippi PSC denied the Company's proposed rate schedule for recovery of financing costs during construction, pending a final ruling from the Mississippi Supreme Court regarding the Sierra Club's appeal of the Mississippi PSC's issuance of the CPCN for the Kemper IGCC (2012 MPSC CWIP Order).
In July 2012, the Company appealed the Mississippi PSC's June 2012 decision to the Mississippi Supreme Court and requested interim rates under bond. In July 2012, the Mississippi Supreme Court denied the Company's request for interim rates under bond.
Settlement Agreement
On January 24, 2013, the Company entered into the Settlement Agreement with the Mississippi PSC that, among other things, establishes the process for resolving matters regarding cost recovery related to the Kemper IGCC and dismissed the Company's appeal of the 2012 MPSC CWIP Order. Under the Settlement Agreement, the Company agreed to limit the portion of prudently-incurred Kemper IGCC costs to be included in retail rate base to the
$2.4 billion
certificated cost estimate, plus the Cost Cap Exceptions, but excluding AFUDC, and any other costs permitted or determined to be excluded from the
$2.88 billion
cost cap by the Mississippi PSC. The Settlement Agreement also allows the Company to secure alternate financing for costs that are not otherwise recovered in any Mississippi PSC rate proceedings contemplated by the Settlement Agreement. Legislation to authorize a multi-year rate plan and legislation to provide for alternate financing through securitization of up to
$1.0 billion
of prudently-incurred costs was enacted into law on February 26, 2013. The Company intends to securitize (1) prudently-incurred costs in excess of the certificated cost estimate and up to the
$2.88 billion
cost cap, net of the DOE Grants and excluding the Cost Cap Exceptions, (2) accrued AFUDC, and (3) other prudently-incurred costs as approved by the Mississippi PSC. The rate recovery necessary to recover the annual costs of securitization is expected to be filed and become effective after the Kemper IGCC is placed in service and following completion of the Mississippi PSC's final prudence review of costs for the Kemper IGCC.
The Settlement Agreement provides that the Company may terminate the Settlement Agreement if certain conditions are not met, if the Company is unable to secure alternate financing for any prudently-incurred Kemper IGCC costs not otherwise recovered in any Mississippi PSC rate proceeding contemplated by the Settlement Agreement, or if the Mississippi PSC fails to comply with the requirements of the Settlement Agreement. The Company continues to work with the Mississippi PSC and the MPUS to implement the procedural schedules set forth in the Settlement Agreement and variations to the schedule are likely.
2013 MPSC Rate Order
Consistent with the terms of the Settlement Agreement, on January 25, 2013, the Company filed a new request to increase retail rates in 2013 by
$172 million
annually, based on projected investment for 2013, to be recorded to a regulatory liability to be used to mitigate rate impacts when the Kemper IGCC is placed in service.
On March 5, 2013, the Mississippi PSC issued an order (2013 MPSC Rate Order) approving retail rate increases of
15%
effective March 19, 2013 and
3%
effective January 1, 2014, which collectively are designed to collect
$156 million
annually beginning in 2014. Amounts collected through these rates are being recorded as a regulatory liability to be used to mitigate customer rate impacts after the Kemper IGCC is placed in service. As of December 31, 2013,
$98.1 million
had been collected, with
$10.3
II-413
NOTES (continued)
Mississippi Power Company 2013 Annual Report
million
recognized in retail revenues in the statement of operations and the remainder deferred in other regulatory liabilities and included in the balance sheet.
Because the 2013 MPSC Rate Order did not provide for the inclusion of CWIP in rate base as permitted by the Baseload Act, the Company continues to record AFUDC on the Kemper IGCC during the construction period. The Company will not record AFUDC on any additional costs of the Kemper IGCC that exceed the
$2.88 billion
cost cap, except for Cost Cap Exception amounts. The Company will continue to comply with the 2013 MPSC Rate Order by collecting and deferring the approved rates during the construction period unless directed to do otherwise by the Mississippi PSC. On March 21, 2013, a legal challenge to the 2013 MPSC Rate Order was filed by Thomas A. Blanton with the Mississippi Supreme Court, which remains pending against the Company and the Mississippi PSC.
Seven-Year Rate Plan
Also consistent with the Settlement Agreement, on February 26, 2013, the Company filed with the Mississippi PSC the proposed
Seven
-Year Rate Plan, which is a rate recovery plan for the Kemper IGCC for the first
seven years
of its operation, along with a proposed revenue requirement under such plan for 2014 through 2020.
On March 22, 2013, the Company, in compliance with the 2013 MPSC Rate Order, filed a revision to the
Seven
-Year Rate Plan with the Mississippi PSC for the Kemper IGCC for cost recovery through 2020, which is still under review by the Mississippi PSC. In the
Seven
-Year Rate Plan, the Company proposed recovery of an annual revenue requirement of approximately
$156 million
of Kemper IGCC-related operational costs and rate base amounts, including plant costs equal to the
$2.4 billion
certificated cost estimate. The 2013 MPSC Rate Order, which increased rates beginning on March 19, 2013, is integral to the
Seven
-Year Rate Plan, which contemplates amortization of the regulatory liability balance at the in-service date to be used to mitigate customer rate impacts through 2020, based on a fixed amortization schedule that requires approval by the Mississippi PSC. Under the
Seven
-Year Rate Plan filing, the Company proposed annual rate recovery to remain the same from 2014 through 2020. At the time of the filing of the
Seven
-Year Rate Plan, the proposed revenue requirement approximated the forecasted cost of service for the period 2014 through 2020. Under the Company's proposal, to the extent that the actual annual cost of service differs from the forecast approved in the
Seven
-Year Rate Plan, the difference would be deferred as a regulatory asset or liability, subject to accrual of carrying costs, and would be included in the next year's rate recovery calculation. If any deferred balance remains at the end of the
Seven
-Year Rate Plan term, the Mississippi PSC will review the amount and determine the appropriate method and period of disposition.
The revenue requirements set forth in the
Seven
-Year Rate Plan assume the sale of a
15%
undivided interest in the Kemper IGCC to SMEPA and utilization of bonus depreciation as provided by the American Taxpayer Relief Act of 2012 (ATRA), which currently requires that the Kemper IGCC be placed in service in 2014. See "Investment Tax Credits and Bonus Depreciation" herein for additional information regarding bonus depreciation.
In 2014, the Company plans to amend the
Seven
-Year Rate Plan to reflect changes including the revised in-service date, the change in expected benefits relating to tax credits, various other revenue requirement items, and other tax matters, which include ensuring compliance with the normalization requirements of the Internal Revenue Code. The impact of these revisions for the average annual retail revenue requirement is estimated to be approximately
$35 million
through 2020. The amendment to the
Seven
-Year Rate Plan is also expected to reflect rate mitigation options identified by the Company that, if approved by the Mississippi PSC, would result in no change to the total customer rate impacts contemplated in the original
Seven
-Year Rate Plan.
Further cost increases and/or schedule extensions with respect to the Kemper IGCC could have an adverse impact on the
Seven
-Year Rate Plan, such as the inability to recover items considered as Cost Cap Exceptions, potential costs subject to securitization financing in excess of
$1.0 billion
, and the loss of certain tax benefits related to bonus depreciation. While the Kemper IGCC is scheduled to be placed in service in the fourth quarter 2014, any schedule extension beyond 2014 would result in the loss of the tax benefits related to bonus depreciation. The estimated value of the bonus depreciation tax benefits to retail customers is approximately
$200 million
. Loss of these tax benefits would require further adjustment to the
Seven
-Year Rate Plan and approval by the Mississippi PSC to ensure compliance with the normalization requirements of the Internal Revenue Code. In the event that the Mississippi PSC does not approve or the Company withdraws the Seven-Year Rate Plan, the Company would seek rate recovery through an alternate means, which could include a traditional rate case.
Prudence Reviews
The Mississippi PSC’s prudence review of Kemper IGCC costs incurred through March 31, 2013, as provided for in the Settlement Agreement, is expected to occur in the second quarter 2014. A final review of all costs incurred after March 31, 2013 is expected to be completed within
six months
of the Kemper IGCC’s in-service date. Furthermore, regardless of any prudence
II-414
NOTES (continued)
Mississippi Power Company 2013 Annual Report
determinations made during the construction and start-up period, the Mississippi PSC has the right to make a final prudence determination after the Kemper IGCC has been placed in service.
Regulatory Assets
Consistent with the treatment of non-capital costs incurred during the pre-construction period, the Mississippi PSC granted the Company the authority to defer all non-capital Kemper IGCC-related costs to a regulatory asset during the construction period, subject to review of such costs by the Mississippi PSC. The amortization period for any such costs approved for recovery will be determined by the Mississippi PSC at a later date. In addition, the Company is authorized to accrue carrying costs on the unamortized balance of such regulatory assets at a rate and in a manner to be determined by the Mississippi PSC in future cost recovery mechanism proceedings.
Lignite Mine and CO
2
Pipeline Facilities
In conjunction with the Kemper IGCC, the Company will own the lignite mine and equipment and has acquired and will continue to acquire mineral reserves located around the Kemper IGCC site. The mine started commercial operation on June 5, 2013.
In 2010, the Company executed a
40
-year management fee contract with Liberty Fuels, which will develop, construct, and manage the mining operations. The contract with Liberty Fuels is effective through the end of the mine reclamation. As the mining permit holder, Liberty Fuels has a legal obligation to perform mine reclamation and the Company has a contractual obligation to fund all reclamation activities. In addition to the obligation to fund the reclamation activities, the Company currently provides working capital support to Liberty Fuels through cash advances for capital purchases, payroll, and other operating expenses. See Note 1 under "Asset Retirement Obligations and Other Costs of Removal" for additional information.
In addition, the Company will acquire, construct, and operate the CO
2
pipeline for the planned transport of captured CO
2
for use in enhanced oil recovery. The Company has entered into agreements with Denbury Onshore (Denbury), a subsidiary of Denbury Resources Inc., and Treetop Midstream Services, LLC (Treetop), an affiliate of Tellus Operating Group, LLC and a subsidiary of Tengrys, LLC, pursuant to which Denbury will purchase
70%
of the CO
2
captured from the Kemper IGCC and Treetop will purchase
30%
of the CO
2
captured from the Kemper IGCC.
The ultimate outcome of these matters cannot be determined at this time.
Proposed Sale of Undivided Interest to SMEPA
In 2010, the Company and SMEPA entered into an asset purchase agreement whereby SMEPA agreed to purchase a
17.5%
undivided interest in the Kemper IGCC. In February 2012, the Mississippi PSC approved the sale and transfer of
17.5%
of the Kemper IGCC to SMEPA. In June 2012, the Company and SMEPA signed an amendment to the asset purchase agreement whereby SMEPA reduced its purchase commitment percentage from a
17.5%
to a
15%
undivided interest in the Kemper IGCC. On March 29, 2013, the Company and SMEPA signed an amendment to the asset purchase agreement whereby the Company and SMEPA agreed to amend the power supply agreement entered into by the parties in April 2011 to reduce the capacity amounts to be received by SMEPA by half (approximately
75
MWs) at the sale and transfer of the undivided interest in the Kemper IGCC to SMEPA. Capacity revenues under the April 2011 power supply agreement were
$17.5 million
in 2013. On December 24, 2013, the Company and SMEPA agreed to extend SMEPA's option to purchase through December 31, 2014. The sale and transfer of an interest in the Kemper IGCC to SMEPA is subject to approval by the Mississippi PSC.
The closing of this transaction is conditioned upon execution of a joint ownership and operating agreement, receipt of all construction permits, appropriate regulatory approvals, financing, and other conditions. In September 2012, SMEPA received a conditional loan commitment from Rural Utilities Service to provide funding for SMEPA's undivided interest in the Kemper IGCC.
In March 2012 and subsequent to December 31, 2013, the Company received
$150 million
and
$75 million
, respectively, of interest-bearing refundable deposits from SMEPA to be applied to the purchase. While the expectation is that these amounts will be applied to the purchase price at closing, the Company would be required to refund the deposits upon the termination of the asset purchase agreement, within
60
days of a request by SMEPA for a full or partial refund, or within
15
days at SMEPA's discretion in the event that the Company is assigned a senior unsecured credit rating of BBB+ or lower by Standard and Poor's Ratings Services, a division of The McGraw Hill Companies, Inc. (S&P) or Baa1 or lower by Moody's Investors Service, Inc. (Moody's) or ceases to be rated by either of these rating agencies. Given the interest-bearing nature of the deposit and SMEPA's ability to request a refund, the March 2012 deposit has been presented as a current liability in the balance sheet and as financing proceeds in the statement of cash flow. On July 18, 2013, Southern Company entered into an agreement with SMEPA under which Southern Company has agreed to guarantee the obligations of the Company with respect to any required refund of the deposits.
II-415
NOTES (continued)
Mississippi Power Company 2013 Annual Report
The ultimate outcome of these matters cannot be determined at this time.
Investment Tax Credits and Bonus Depreciation
The Internal Revenue Service (IRS) allocated
$133 million
(Phase I) and
$279 million
(Phase II) of Internal Revenue Code Section 48A tax credits to the Company in connection with the Kemper IGCC. On May 15, 2013, the IRS notified the Company that no additional tax credits under the Internal Revenue Code Section 48A Phase III were allocated to the Kemper IGCC. As a result of the schedule extension for the Kemper IGCC, the Phase I credits have been recaptured. Through December 31, 2013, the Company had recorded tax benefits totaling
$276.4 million
for the remaining Phase II credits, which will be amortized as a reduction to depreciation and amortization over the life of the Kemper IGCC and are dependent upon meeting the IRS certification requirements, including an in-service date no later than April 19, 2016 and the capture and sequestration (via enhanced oil recovery) of at least
65%
of the CO
2
produced by the Kemper IGCC during operations in accordance with the Internal Revenue Code. A portion of the Phase II tax credits will be subject to recapture upon successful completion of SMEPA's purchase of an undivided interest in the Kemper IGCC as described above.
On January 2, 2013, the ATRA was signed into law. The ATRA retroactively extended several tax credits through 2013 and extended 50% bonus depreciation for property placed in service in 2013 (and for certain long-term production-period projects to be placed in service in 2014), which is expected to apply to the Kemper IGCC and have a positive impact on the future cash flows of the Company of between
$560 million
and
$620 million
in 2014. These estimated positive cash flow impacts are dependent upon placing the Kemper IGCC in service in 2014. See "Rate Recovery of Kemper IGCC Costs – Seven-Year Rate Plan" herein for additional information.
The ultimate outcome of these matters cannot be determined at this time.
4. JOINT OWNERSHIP AGREEMENTS
The Company and Alabama Power own, as tenants in common, Units 1 and 2 (total capacity of
500
MWs) at Greene County Steam Plant, which is located in Alabama and operated by Alabama Power. Additionally, the Company and Gulf Power, own as tenants in common, Units 1 and 2 (total capacity of
1,000
MWs) at Plant Daniel, which is located in Mississippi and operated by the Company.
At
December 31, 2013
, the Company's percentage ownership and investment in these jointly-owned facilities in commercial operation were as follows:
|
Generating
Plant
|
Company
Ownership
|
Plant in Service
|
Accumulated
Depreciation
|
Construction Work in Progress
|
|||||||||
|
(in thousands)
|
|||||||||||||
|
Greene County
|
|||||||||||||
|
Units 1 and 2
|
40
|
%
|
$
|
96,153
|
|
$
|
49,731
|
|
$
|
3,017
|
|
||
|
Daniel
|
|||||||||||||
|
Units 1 and 2
|
50
|
%
|
$
|
299,179
|
|
$
|
152,952
|
|
$
|
168,539
|
|
||
The Company's proportionate share of plant operating expenses is included in the statements of income and the Company is responsible for providing its own financing.
See Note 3 under "Retail Regulatory Matters – Environmental Compliance Overview Plan" for additional information.
5. INCOME TAXES
On behalf of the Company, Southern Company files a consolidated federal income tax return and combined state income tax returns for the States of Alabama and Mississippi. Under a joint consolidated income tax allocation agreement, each Southern Company subsidiary's current and deferred tax expense is computed on a stand-alone basis and no subsidiary is allocated more current expense than would be paid if it filed a separate income tax return. In accordance with IRS regulations, each company is jointly and severally liable for the federal tax liability.
II-416
NOTES (continued)
Mississippi Power Company 2013 Annual Report
Current and Deferred Income Taxes
Details of income tax provisions are as follows:
|
2013
|
2012
|
2011
|
|||||||||
|
(in thousands)
|
|||||||||||
|
Federal —
|
|||||||||||
|
Current
|
$
|
23,345
|
|
$
|
1,212
|
|
$
|
(27,099
|
)
|
||
|
Deferred
|
(342,870
|
)
|
16,994
|
|
65,206
|
|
|||||
|
(319,525
|
)
|
18,206
|
|
38,107
|
|
||||||
|
State —
|
|||||||||||
|
Current
|
5,219
|
|
1,656
|
|
(2,473
|
)
|
|||||
|
Deferred
|
(53,529
|
)
|
694
|
|
6,559
|
|
|||||
|
(48,310
|
)
|
2,350
|
|
4,086
|
|
||||||
|
Total
|
$
|
(367,835
|
)
|
$
|
20,556
|
|
$
|
42,193
|
|
||
II-417
NOTES (continued)
Mississippi Power Company 2013 Annual Report
The tax effects of temporary differences between the carrying amounts of assets and liabilities in the financial statements and their respective tax bases, which give rise to deferred tax assets and liabilities, are as follows:
|
2013
|
2012
|
||||||
|
(in thousands)
|
|||||||
|
Deferred tax liabilities —
|
|||||||
|
Accelerated depreciation
|
$
|
371,553
|
|
$
|
385,899
|
|
|
|
Property basis differences
|
130,679
|
|
72,451
|
|
|||
|
Energy cost management clause under recovered
|
1,777
|
|
9,492
|
|
|||
|
Regulatory assets associated with asset retirement obligations
|
16,764
|
|
16,851
|
|
|||
|
Pensions and other benefits
|
23,769
|
|
33,756
|
|
|||
|
Regulatory assets associated with employee benefit obligations
|
33,127
|
|
68,717
|
|
|||
|
Regulatory assets associated with the Kemper IGCC
|
30,708
|
|
10,492
|
|
|||
|
Rate differential
|
56,074
|
|
27,270
|
|
|||
|
Federal effect of state deferred taxes
|
30,615
|
|
—
|
|
|||
|
Other
|
35,583
|
|
33,886
|
|
|||
|
Total
|
730,649
|
|
658,814
|
|
|||
|
Deferred tax assets —
|
|||||||
|
Federal effect of state deferred taxes
|
—
|
|
7,732
|
|
|||
|
Fuel clause over recovered
|
7,741
|
|
38,955
|
|
|||
|
Estimated loss on Kemper IGCC
|
472,000
|
|
31,200
|
|
|||
|
Pension and other benefits
|
57,999
|
|
87,416
|
|
|||
|
Property insurance
|
23,693
|
|
23,171
|
|
|||
|
Premium on long-term debt
|
23,736
|
|
26,778
|
|
|||
|
Unbilled fuel
|
12,136
|
|
11,642
|
|
|||
|
Long-term service agreement
|
—
|
|
5,544
|
|
|||
|
Asset retirement obligations
|
16,764
|
|
16,851
|
|
|||
|
Interest rate hedges
|
5,094
|
|
5,644
|
|
|||
|
ITC carryforward
|
—
|
|
170,938
|
|
|||
|
Kemper rate factor - regulatory liability retail
|
36,210
|
|
—
|
|
|||
|
Other
|
18,094
|
|
23,800
|
|
|||
|
Total
|
673,467
|
|
449,671
|
|
|||
|
Total deferred tax liabilities, net
|
57,182
|
|
209,143
|
|
|||
|
Portion included in (accrued) prepaid income taxes, net
|
15,626
|
|
35,815
|
|
|||
|
Accumulated deferred income taxes
|
$
|
72,808
|
|
$
|
244,958
|
|
|
At
December 31, 2013
, the tax-related regulatory assets were
$144.4 million
. These assets are primarily attributable to tax benefits that flowed through to customers in prior years, to deferred taxes previously recognized at rates lower than the current enacted tax law, and to taxes applicable to capitalized interest.
At
December 31, 2013
, the tax-related regulatory liabilities were
$10.2 million
. These liabilities are primarily attributable to deferred taxes previously recognized at rates higher than the current enacted tax law and to unamortized ITCs.
In accordance with regulatory requirements, deferred ITCs are amortized over the life of the related property with such amortization normally applied as a credit to reduce depreciation in the statements of income. Credits for non-Kemper IGCC related deferred ITCs amortized in this manner amounted to
$1.2 million
,
$1.2 million
, and
$1.3 million
for
2013
,
2012
, and
2011
, respectively. At
December 31, 2013
, all non-Kemper IGCC ITCs available to reduce federal income taxes payable had been utilized.
II-418
NOTES (continued)
Mississippi Power Company 2013 Annual Report
In 2010, the Company began recognizing ITCs associated with the construction expenditures related to the Kemper IGCC. At
December 31, 2013
, the Company had
$276.4 million
in unamortized ITCs associated with the Kemper IGCC, which will be amortized over the life of the Kemper IGCC once placed in service and are dependent upon meeting the IRS certification requirements, including an in-service date no later than April 19, 2016 and the capture and sequestration (via enhanced oil recovery) of at least
65%
of the CO
2
produced by the Kemper IGCC during operation in accordance with the Internal Revenue Code. A portion of the tax credits will be subject to recapture upon successful completion of SMEPA's purchase of an undivided interest in the Kemper IGCC.
In 2010, the Tax Relief, Unemployment Insurance Reauthorization, and Job Creation Act of 2010 (Tax Relief Act) was signed into law. Major tax incentives in the Tax Relief Act include
100%
bonus depreciation for property placed in service after September 8, 2010 and through 2011 (and for certain long-term production-period projects placed in service in 2012) and
50%
bonus depreciation for property placed in service in 2012 (and for certain long-term production-period projects placed in service in 2013).
On January 2, 2013, the ATRA was signed into law. The ATRA retroactively extended several tax credits through 2013 and extended
50%
bonus depreciation for property placed in service in 2013 (and for certain long-term production-period projects to be placed in service in 2014, including the Kemper IGCC, which is scheduled for completion in 2014).
Effective Tax Rate
A reconciliation of the federal statutory income tax rate to the effective income tax rate is as follows:
|
2013
|
2012
|
2011
|
||||||
|
Federal statutory rate
|
35.0
|
%
|
35.0
|
%
|
35.0
|
%
|
||
|
State income tax, net of federal deduction
|
3.7
|
|
1.3
|
|
1.9
|
|
||
|
Non-deductible book depreciation
|
(0.1
|
)
|
0.3
|
|
0.3
|
|
||
|
AFUDC-equity
|
5.0
|
|
(18.6
|
)
|
(6.3
|
)
|
||
|
Other
|
0.1
|
|
(1.2
|
)
|
(0.3
|
)
|
||
|
Effective income tax rate
|
43.7
|
%
|
16.8
|
%
|
30.6
|
%
|
||
The Company's 2013 effective tax rate increased from 2012 primarily due to the increase in estimated losses associated with the Kemper IGCC.
Unrecognized Tax Benefits
Changes during the year in unrecognized tax benefits were as follows:
|
2013
|
2012
|
2011
|
|||||||||
|
(in thousands)
|
|||||||||||
|
Unrecognized tax benefits at beginning of year
|
$
|
5,755
|
|
$
|
4,964
|
|
$
|
4,288
|
|
||
|
Tax positions from current periods
|
226
|
|
1,186
|
|
1,486
|
|
|||||
|
Tax positions from prior periods
|
(2,141
|
)
|
(26
|
)
|
(810
|
)
|
|||||
|
Settlements with taxing authorities
|
—
|
|
(369
|
)
|
—
|
|
|||||
|
Balance at end of year
|
$
|
3,840
|
|
$
|
5,755
|
|
$
|
4,964
|
|
||
The tax positions decrease from prior periods for
2013
relates to the uncertain tax position for the tax accounting method change for repairs-generation assets. See "Tax Method of Accounting for Repairs" below for additional information.
The impact on the Company's effective tax rate, if recognized, was as follows:
|
2013
|
2012
|
2011
|
|||||||||
|
(in thousands)
|
|||||||||||
|
Tax positions impacting the effective tax rate
|
$
|
3,840
|
|
$
|
3,656
|
|
$
|
4,144
|
|
||
|
Tax positions not impacting the effective tax rate
|
—
|
|
2,099
|
|
820
|
|
|||||
|
Balance of unrecognized tax benefits
|
$
|
3,840
|
|
$
|
5,755
|
|
$
|
4,964
|
|
||
II-419
NOTES (continued)
Mississippi Power Company 2013 Annual Report
The tax positions impacting the effective tax rate for
2013
primarily relate to the State of Mississippi ITC. The tax positions not impacting the effective tax rate for
2012
related to the timing difference associated with the tax accounting method change for repairs - generation assets. See "Tax Method of Accounting for Repairs" herein for additional information. These amounts are presented on a gross basis without considering the related federal or state income tax impact.
Accrued interest for unrecognized tax benefits was as follows:
|
2013
|
2012
|
2011
|
|||||||||
|
(in thousands)
|
|||||||||||
|
Interest accrued at beginning of year
|
$
|
772
|
|
$
|
680
|
|
$
|
413
|
|
||
|
Interest accrued during the year
|
399
|
|
92
|
|
267
|
|
|||||
|
Balance at end of year
|
$
|
1,171
|
|
$
|
772
|
|
$
|
680
|
|
||
The Company classifies interest on tax uncertainties as interest expense. The Company did not accrue any penalties on uncertain tax positions.
It is reasonably possible that the amount of the unrecognized tax benefits could change within
12 months
. The settlement of federal and state audits could impact the balances significantly. At this time, an estimate of the range of reasonably possible outcomes cannot be determined.
The IRS has finalized its audits of Southern Company's consolidated federal income tax returns through 2011. Southern Company has filed its 2012 federal income tax return and has received a full acceptance letter from the IRS; however, the IRS has not finalized its audit. For tax years 2012 and 2013, Southern Company was a participant in the Compliance Assurance Process of the IRS. The audits for the Company's state income tax returns have either been concluded, or the statute of limitations has expired, for years prior to 2007.
Tax Method of Accounting for Repairs
In 2011, the IRS published regulations on the deduction and capitalization of expenditures related to tangible property that generally apply for tax years beginning on or after January 1, 2014. Additionally, on April 30, 2013, the IRS issued Revenue Procedure 2013-24, which provides guidance for taxpayers related to the deductibility of repair costs associated with generation assets. Based on a review of the regulations, Southern Company incorporated provisions related to repair costs for generation assets into its consolidated 2012 federal income tax return and reversed all related unrecognized tax positions. On September 19, 2013, the IRS issued Treasury Decision 9636, "Guidance Regarding Deduction and Capitalization of Expenditures Related to Tangible Property," which are final tangible property regulations applicable to taxable years beginning on or after January 1, 2014. Southern Company is currently reviewing this new guidance. The ultimate outcome of this matter cannot be determined at this time; however, these regulations are not expected to have a material impact on the Company's financial statements.
6. FINANCING
Bank Term Loans
In November 2012, the Company entered into a
366
-day
$100 million
aggregate principal amount floating rate bank loan bearing interest based on
one-month
London Interbank Offered Rate (LIBOR). The first advance in the amount of
$50 million
was made in November 2012. In January 2013, the second advance in the amount of
$50 million
was made. In September 2013, the Company amended the bank loan, which extended the maturity date to 2015. The proceeds of this loan were used for working capital and for other general corporate purposes, including the Company's continuous construction program.
In March 2013, the Company entered into four two-year floating rate bank loans bearing interest based on
one-month
LIBOR. These term loans were for an aggregate principal amount of
$300 million
and proceeds were used for working capital and other general corporate purposes, including the Company's continuous construction program.
In September 2013, the Company entered into a
two
-year floating rate bank loan bearing interest based on
one-month
LIBOR. The term loan was for
$125 million
aggregate principal amount and proceeds were used to repay at maturity a
two
-year floating rate bank loan in the aggregate principal amount of
$125 million
.
Subsequent to December 31, 2013, the Company entered into an
18
-month floating rate bank loan bearing interest based on
one-month
LIBOR. The term loan was for
$250 million
aggregate principal amount and proceeds were used for working capital and other general corporate purposes, including the Company’s continuous construction program.
II-420
NOTES (continued)
Mississippi Power Company 2013 Annual Report
At
December 31, 2013
and
2012
, the Company had
$525 million
, which is reflected in the statements of capitalization as long-term debt, and
$175 million
of bank loans outstanding, respectively.
These bank loans and the other revenue bonds described below have covenants that limit debt levels to
65%
of total capitalization, as defined in the agreements. For purposes of these definitions, debt excludes the long-term debt payable to affiliated trusts, other hybrid securities, and securitized debt relating to the securitization of certain costs of the Kemper IGCC. At
December 31, 2013
, the Company was in compliance with its debt limits.
Senior Notes
In November 2013, the Company's
$50 million
aggregate principal amount of Series 2008A
6.0%
Senior Notes due November 15, 2013 matured. At
December 31, 2013
and
2012
, the Company had
$1.1 billion
of senior notes outstanding. These senior notes are effectively subordinated to all secured debt of the Company. See "Plant Daniel Revenue Bonds" below for additional information regarding the Company's secured indebtedness.
Plant Daniel Revenue Bonds
In 2011, in connection with the Company's election under its operating lease of Plant Daniel Units 3 and 4 to purchase the assets, the Company assumed the obligations of the lessor related to
$270 million
aggregate principal amount of Mississippi Business Finance Corporation Taxable Revenue Bonds,
7.13%
Series 1999A due October 20, 2021, issued for the benefit of the lessor as described in Note 1 under "Purchase of the Plant Daniel Combined Cycle Generating Units" herein. These bonds are secured by Plant Daniel Units 3 and 4 and certain personal property. The bonds were recorded at fair value as of the date of assumption, or
$346.1 million
, reflecting a premium of
$76.1 million
.
Securities Due Within One Year
A summary of scheduled maturities and redemptions of securities due within one year at
December 31, 2013
and
2012
was as follows:
|
2013
|
2012
|
||||||
|
(in millions)
|
|||||||
|
Senior notes
|
$
|
—
|
|
$
|
50.0
|
|
|
|
Bank term loans
|
—
|
|
175.0
|
|
|||
|
Revenue bonds
|
11.3
|
|
51.5
|
|
|||
|
Capitalized leases
|
2.5
|
|
—
|
|
|||
|
Outstanding at December 31
|
$
|
13.8
|
|
$
|
276.5
|
|
|
Maturities through 2018 applicable to total long-term debt are as follows:
$13.8 million
in 2014,
$527.7 million
in 2015,
$302.8 million
in 2016,
$37.9 million
in 2017, and
$3.1 million
in 2018.
Pollution Control Revenue Bonds
Pollution control obligations represent loans to the Company from public authorities of funds derived from sales by such authorities of revenue bonds issued to finance pollution control and solid waste disposal facilities. The Company is required to make payments sufficient for the authorities to meet principal and interest requirements of such bonds. The amount of tax-exempt pollution control revenue bonds outstanding at
December 31, 2013
and
2012
was
$82.7 million
.
Other Revenue Bonds
Other revenue bond obligations represent loans to the Company from a public authority of funds derived from the sale by such authority of revenue bonds issued to finance a portion of the costs of constructing the Kemper IGCC and related facilities.
In March 2013 and July 2013, the Mississippi Business Finance Corporation (MBFC) issued
$15.8 million
and
$15.3 million
, respectively, aggregate principal amount of MBFC Taxable Revenue Bonds (Mississippi Power Company Project), Series 2012A. The proceeds were used to reimburse the Company for the cost of the acquisition, construction, equipping, installation, and improvement of certain equipment and facilities for the lignite mining facility related to the Kemper IGCC.
In September 2013, the MBFC Taxable Revenue Bonds (Mississippi Power Company Project), Series 2012A of
$40.07 million
, Series 2012B of
$21.25 million
, and Series 2012C of
$21.25 million
were paid at maturity.
II-421
NOTES (continued)
Mississippi Power Company 2013 Annual Report
In November 2013, the MBFC entered into an agreement to issue up to
$33.75 million
aggregate principal amount of MBFC Taxable Revenue Bonds, Series 2013A (Mississippi Power Company Project) and up to
$11.25 million
aggregate principal amount of MBFC Taxable Revenue Bonds, Series 2013B (Mississippi Power Company Project) for the benefit of the company. In November 2013, the MBFC issued
$11.25 million
aggregate principal amount of MBFC Taxable Revenue Bonds (Mississippi Power Company Project), Series 2013B for the benefit of the Company. The proceeds were used to reimburse the Company for the cost of the acquisition, construction, equipping, installation, and improvement of certain equipment and facilities for the lignite mining facility related to the Kemper IGCC. Any future issuances of the Series 2013A bonds will be used for this same purpose.
The Company had
$50.0 million
of such obligations outstanding related to tax-exempt revenue bonds at
December 31, 2013
and
2012
, and
$11.3 million
and
$51.5 million
of such obligations related to taxable revenue bonds outstanding at
December 31, 2013
and
2012
, respectively. Such amounts are reflected in the statements of capitalization as long-term senior notes and debt.
Capital Leases
In September 2013, the Company entered into an agreement to sell the air separation unit for the Kemper IGCC and also entered into a
20
-year nitrogen supply agreement. The nitrogen supply agreement was determined to be a sale/leaseback agreement which resulted in a capital lease obligation for the Company at inception of
$82.9 million
with an annual interest rate of
4.9%
. There are no contingent rentals in the contract and a portion of the monthly payment specified in the agreement is related to executory costs for the operation and maintenance of the air separation unit and excluded from the minimum lease payments. The minimum lease payments for
2013
were
$1.8 million
and will be
$6.5 million
each year thereafter. As of December 31, 2013, no amortization expense had been incurred associated with the capital lease due to the Kemper IGCC not yet being in service.
Other Obligations
In March 2012 and subsequent to December 31, 2013, the Company received $
150 million
and
$75 million
, respectively, interest-bearing refundable deposits from SMEPA to be applied to the sale price for the pending sale of an undivided interest in the Kemper IGCC. Until the sale is closed, the deposits bear interest at the Company's AFUDC rate adjusted for income taxes, which was
9.932%
per annum for
2013
and
9.967%
per annum for
2012
, and are refundable to SMEPA upon termination of the asset purchase agreement related to such purchase, within
60
days of a request by SMEPA for a full or partial refund, or within
15
days at SMEPA's discretion in the event that the Company is assigned a senior unsecured credit rating of BBB+ or lower by S&P or Baa1 or lower by Moody's or ceases to be rated by either of these rating agencies.
Assets Subject to Lien
The revenue bonds assumed in conjunction with the purchase of Plant Daniel Units 3 and 4 are secured by Plant Daniel Units 3 and 4 and certain personal property. See Note 1 under "Purchase of the Plant Daniel Combined Cycle Generating Units" and "Plant Daniel Revenue Bonds" for additional information. There are no agreements or other arrangements among the Southern Company system companies under which the assets of one company have been pledged or otherwise made available to satisfy the obligations of Southern Company or another of its other subsidiaries.
Outstanding Classes of Capital Stock
The Company currently has preferred stock (including depositary shares which represent one-fourth of a share of preferred stock) and common stock authorized and outstanding. The preferred stock of the Company contains a feature that allows the holders to elect a majority of the Company's board of directors if dividends are not paid for four consecutive quarters. Because such a potential redemption-triggering event is not solely within the control of the Company, this preferred stock is presented as "Cumulative Redeemable Preferred Stock" in a manner consistent with temporary equity under applicable accounting standards. The Company's preferred stock and depositary preferred stock, without preference between classes, rank senior to the Company's common stock with respect to payment of dividends and voluntary or involuntary dissolution. The preferred stock and depositary preferred stock is subject to redemption at the option of the Company at a redemption price equal to
100%
of the liquidation amount of the stock.
Dividend Restrictions
The Company can only pay dividends to Southern Company out of retained earnings or paid-in-capital.
II-422
NOTES (continued)
Mississippi Power Company 2013 Annual Report
Bank Credit Arrangements
At
December 31, 2013
, committed credit arrangements with banks were as follows:
|
Expires
(a)
|
Executable
Term-Loans
|
Due Within One Year
|
||||||||||||
|
2014
|
2016
|
Total
|
Unused
|
One
Year
|
Two
Years
|
Term Out
|
No Term Out
|
|||||||
|
(in millions)
|
||||||||||||||
|
$135
|
$165
|
$300
|
$300
|
$25
|
$40
|
$65
|
$70
|
|||||||
|
(a)
|
No credit arrangements expire in 2015, 2017, or 2018.
|
The Company expects to renew its credit arrangements, as needed, prior to expiration.
Most of these credit arrangements require payment of commitment fees based on the unused portions of the commitments or to maintain compensating balances with the banks. Commitment fees average less than 1/4 of 1% for the Company. Compensating balances are not legally restricted from withdrawal.
Most of these credit arrangements contain covenants that limit the Company's debt levels to
65%
of total capitalization, as defined in the agreements. For purposes of these definitions, debt excludes certain hybrid securities and securitized debt relating to the securitization of certain costs of the Kemper IGCC.
A portion of the
$300 million
unused credit arrangements with banks is allocated to provide liquidity support to the Company's variable rate pollution control revenue bonds and its commercial paper borrowings. The amount of variable rate pollution control revenue bonds outstanding requiring liquidity support as of
December 31, 2013
was
$40.1 million
.
The Company makes short-term borrowings primarily through a commercial paper program that has the liquidity support of the Company's committed bank credit arrangements.
At
December 31, 2013
and
2012
, there was
no
short-term debt outstanding.
7. COMMITMENTS
Fuel and Purchased Power Agreements
To supply a portion of the fuel requirements of its generating plants, the Company has entered into various long-term commitments for the procurement and delivery of fossil fuel which are not recognized on the balance sheets. In
2013
,
2012
, and
2011
, the Company incurred fuel expense of
$491.3 million
,
$411.2 million
, and
$490.4 million
, respectively, the majority of which was purchased under long-term commitments. The Company expects that a substantial amount of its future fuel needs will continue to be purchased under long-term commitments.
Coal commitments include a management fee associated with a
40
-year management contract with Liberty Fuels related to the Kemper IGCC with the remaining amount due at December 31, 2013 of
$38.7 million
. Additional commitments for fuel will be required to supply the Company's future needs.
SCS may enter into various types of wholesale energy and natural gas contracts acting as an agent for the Company and all of the other Southern Company traditional operating companies and Southern Power. Under these agreements, each of the traditional operating companies and Southern Power may be jointly and severally liable. Accordingly, Southern Company has entered into keep-well agreements with the Company and each of the other traditional operating companies to ensure the Company will not subsidize or be responsible for any costs, losses, liabilities, or damages resulting from the inclusion of Southern Power as a contracting party under these agreements.
Operating Leases
The Company has operating lease agreements with various terms and expiration dates. Total rent expense was
$10.1 million
,
$11.1 million
, and
$32.6 million
for
2013
,
2012
, and
2011
respectively, which includes the Plant Daniel Units 3 and 4 operating lease that ended October 20, 2011.
The Company and Gulf Power have jointly entered into operating lease agreements for aluminum railcars for the transportation of coal at Plant Daniel. The Company has the option to purchase the railcars at the greater of lease termination value or fair market value, or to renew the leases at the end of the lease term. In early 2011, one operating lease expired and the Company elected not to exercise the option to purchase. The remaining operating lease has
229
aluminum railcars. The Company and Gulf Power also have separate lease agreements for other railcars that do not contain a purchase option.
II-423
NOTES (continued)
Mississippi Power Company 2013 Annual Report
The Company's share (
50%
) of the leases, charged to fuel stock and recovered through the fuel cost recovery clause, was
$3.1 million
in
2013
,
$3.6 million
in
2012
, and
$2.6 million
in
2011
. The Company's annual railcar lease payments for 2014 through 2017 will average approximately
$1.4 million
. The Company has no lease obligation for the period 2018 and thereafter.
In addition to railcar leases, the Company has other operating leases for fuel handling equipment at Plants Daniel and Watson and operating leases for barges and tow/shift boats for the transport of coal at Plant Watson. The Company's share (
50%
at Plant Daniel and
100%
at Plant Watson) of the leases for fuel handling was charged to fuel handling expense in the amount of
$0.2 million
in
2013
,
$0.2 million
in
2012
, and
$0.4 million
in
2011
. The Company's annual lease payment for 2014 is expected to be
$0.2 million
for fuel handling equipment. The Company charged to fuel stock and recovered through fuel cost recovery the barge transportation leases in the amount of
$6.7 million
in
2013
,
$7.3 million
in
2012
, and
$7.5 million
in
2011
related to barges and tow/shift boats. The Company's annual lease payment for 2014 with respect to these barge transportation leases is expected to be
$7.6 million
.
8. STOCK COMPENSATION
Stock Options
Southern Company provides non-qualified stock options through its Omnibus Incentive Compensation Plan to a large segment of the Company's employees ranging from line management to executives. As of
December 31, 2013
, there were
236
current and former employees of the Company participating in the stock option program and there were
28 million
shares of Southern Company common stock remaining available for awards under the Omnibus Incentive Compensation Plan. The prices of options were at the fair market value of the shares on the dates of grant. These options become exercisable pro rata over a maximum period of
three years
from the date of grant. The Company generally recognizes stock option expense on a straight-line basis over the vesting period which equates to the requisite service period; however, for employees who are eligible for retirement, the total cost is expensed at the grant date. Options outstanding will expire no later than
10 years
after the date of grant, unless terminated earlier by the Southern Company Board of Directors in accordance with the Omnibus Incentive Compensation Plan. Stock options held by employees of a company undergoing a change in control vest upon the change in control.
The estimated fair values of stock options granted were derived using the Black-Scholes stock option pricing model. Expected volatility was based on historical volatility of Southern Company's stock over a period equal to the expected term. Southern Company used historical exercise data to estimate the expected term that represents the period of time that options granted to employees are expected to be outstanding. The risk-free rate was based on the U.S. Treasury yield curve in effect at the time of grant that covers the expected term of the stock options.
The following table shows the assumptions used in the pricing model and the weighted average grant-date fair value of stock options granted:
|
Year Ended December 31
|
2013
|
2012
|
2011
|
||
|
Expected volatility
|
16.6%
|
17.7%
|
17.5%
|
||
|
Expected term
(in years)
|
5.0
|
5.0
|
5.0
|
||
|
Interest rate
|
0.9%
|
0.9%
|
2.3%
|
||
|
Dividend yield
|
4.4%
|
4.2%
|
4.8%
|
||
|
Weighted average grant-date fair value
|
$2.93
|
$3.39
|
$3.23
|
||
The Company's activity in the stock option program for
2013
is summarized below:
|
Shares Subject to Option
|
Weighted Average Exercise Price
|
|||||
|
Outstanding at December 31, 2012
|
1,373,566
|
|
$
|
36.34
|
|
|
|
Granted
|
345,830
|
|
44.03
|
|
||
|
Exercised
|
(379,933
|
)
|
33.59
|
|
||
|
Cancelled
|
(5,870
|
)
|
44.94
|
|
||
|
Outstanding at December 31, 2013
|
1,333,593
|
|
$
|
39.08
|
|
|
|
Exercisable at December 31, 2013
|
898,518
|
|
$
|
37.02
|
|
|
The number of stock options vested, and expected to vest in the future, as of
December 31, 2013
was not significantly different from the number of stock options outstanding at
December 31, 2013
as stated above. As of
December 31, 2013
, the weighted
II-424
NOTES (continued)
Mississippi Power Company 2013 Annual Report
average remaining contractual term for the options outstanding and options exercisable was approximately
six years
and
four years
, respectively, and the aggregate intrinsic value for the options outstanding and options exercisable was
$4.6 million
and
$4.4 million
, respectively.
As of
December 31, 2013
, there was
$0.3 million
of total unrecognized compensation cost related to stock option awards not yet vested. That cost is expected to be recognized over a weighted-average period of approximately
10 months
.
For the years ended
December 31, 2013
,
2012
, and
2011
, total compensation cost for stock option awards recognized in income was
$1.0 million
,
$0.9 million
, and
$0.8 million
, respectively, with the related tax benefit also recognized in income of
$0.4 million
,
$0.3 million
, and
$0.3 million
, respectively.
The compensation cost and tax benefits related to the grant and exercise of Southern Company stock options to the Company's employees are recognized in the Company's financial statements with a corresponding credit to equity, representing a capital contribution from Southern Company.
The total intrinsic value of options exercised during the years ended
December 31, 2013
,
2012
, and
2011
was
$2.7 million
,
$4.9 million
, and
$4.2 million
, respectively. The actual tax benefit realized by the Company for the tax deductions from stock option exercises totaled
$1.1 million
,
$1.9 million
, and
$1.6 million
for the years ended
December 31, 2013
,
2012
, and
2011
, respectively.
Performance Shares
Southern Company provides performance share award units through its Omnibus Incentive Compensation Plan to a large segment of the Company's employees ranging from line management to executives. The performance share units granted under the plan vest at the end of a
three
-year performance period which equates to the requisite service period. Employees that retire prior to the end of the
three
-year period receive a pro rata number of shares, issued at the end of the performance period, based on actual months of service prior to retirement. The value of the award units is based on Southern Company's total shareholder return (TSR) over the
three
-year performance period which measures Southern Company's relative performance against a group of industry peers. The performance shares are delivered in common stock following the end of the performance period based on Southern Company's actual TSR and may range from
0%
to
200%
of the original target performance share amount.
The fair value of performance share awards is determined as of the grant date using a Monte Carlo simulation model to estimate the TSR of Southern Company's stock among the industry peers over the performance period. The Company recognizes compensation expense on a straight-line basis over the
three
-year performance period without remeasurement. Compensation expense for awards where the service condition is met is recognized regardless of the actual number of shares issued. The expected volatility was based on the historical volatility of Southern Company's stock over a period equal to the performance period. The risk-free rate was based on the U.S. Treasury yield curve in effect at the time of grant that covers the performance period of the award units.
The following table shows the assumptions used in the pricing model and the weighted average grant-date fair value of performance share award units granted:
|
Year Ended December 31
|
2013
|
2012
|
2011
|
||
|
Expected volatility
|
12.0%
|
16.0%
|
19.2%
|
||
|
Expected term
(in years)
|
3.0
|
3.0
|
3.0
|
||
|
Interest rate
|
0.4%
|
0.4%
|
1.4%
|
||
|
Annualized dividend rate
|
$1.96
|
$1.89
|
$1.82
|
||
|
Weighted average grant-date fair value
|
$40.50
|
$41.99
|
$35.97
|
||
Total unvested performance share units outstanding as of
December 31, 2012
were
68,486
. During
2013
,
36,769
performance share units were granted,
48,019
performance share units were vested, and
15,699
performance share units were forfeited resulting in
41,537
unvested units outstanding at
December 31, 2013
. In January 2014, the vested performance share award units were converted into
14,341
shares outstanding at a share price of
$41.27
for the
three
-year performance and vesting period ended
December 31, 2013
.
For the years ended
December 31, 2013
,
2012
, and
2011
, total compensation cost for performance share units recognized in income was
$1.5 million
,
$1.2 million
, and
$0.7 million
, respectively, with the related tax benefit also recognized in income of
$0.6 million
,
$0.4 million
, and
$0.3 million
, respectively. As of
December 31, 2013
, there was
$1.7 million
of total unrecognized compensation cost related to performance share award units that will be recognized over a weighted-average period of approximately
11 months
.
II-425
NOTES (continued)
Mississippi Power Company 2013 Annual Report
9. FAIR VALUE MEASUREMENTS
Fair value measurements are based on inputs of observable and unobservable market data that a market participant would use in pricing the asset or liability. The use of observable inputs is maximized where available and the use of unobservable inputs is minimized for fair value measurement and reflects a three-tier fair value hierarchy that prioritizes inputs to valuation techniques used for fair value measurement.
|
•
|
Level 1 consists of observable market data in an active market for identical assets or liabilities.
|
|
•
|
Level 2 consists of observable market data, other than that included in Level 1, that is either directly or indirectly observable.
|
|
•
|
Level 3 consists of unobservable market data. The input may reflect the assumptions of the Company of what a market participant would use in pricing an asset or liability. If there is little available market data, then the Company's own assumptions are the best available information.
|
In the case of multiple inputs being used in a fair value measurement, the lowest level input that is significant to the fair value measurement represents the level in the fair value hierarchy in which the fair value measurement is reported.
As of
December 31, 2013
, assets and liabilities measured at fair value on a recurring basis during the period, together with the level of the fair value hierarchy in which they fall, were as follows:
|
Fair Value Measurements Using
|
|||||||||||||||
|
Quoted Prices in Active Markets for Identical Assets
|
Significant Other Observable Inputs
|
Significant Unobservable Inputs
|
|||||||||||||
|
As of December 31, 2013:
|
(Level 1)
|
(Level 2)
|
(Level 3)
|
Total
|
|||||||||||
|
(in thousands)
|
|||||||||||||||
|
Assets:
|
|||||||||||||||
|
Energy-related derivatives
|
$
|
—
|
|
$
|
4,803
|
|
$
|
—
|
|
$
|
4,803
|
|
|||
|
Cash equivalents
|
125,000
|
|
—
|
|
—
|
|
125,000
|
|
|||||||
|
Total
|
$
|
125,000
|
|
$
|
4,803
|
|
$
|
—
|
|
$
|
129,803
|
|
|||
|
Liabilities:
|
|||||||||||||||
|
Energy-related derivatives
|
$
|
—
|
|
$
|
10,281
|
|
$
|
—
|
|
$
|
10,281
|
|
|||
|
Foreign currency derivatives
|
—
|
|
1
|
|
—
|
|
1
|
|
|||||||
|
Total
|
$
|
—
|
|
$
|
10,282
|
|
$
|
—
|
|
$
|
10,282
|
|
|||
II-426
NOTES (continued)
Mississippi Power Company 2013 Annual Report
As of
December 31, 2012
, assets and liabilities measured at fair value on a recurring basis during the period, together with the level of the fair value hierarchy in which they fall, were as follows:
|
Fair Value Measurements Using
|
|||||||||||||||
|
Quoted Prices in Active Markets for Identical Assets
|
Significant Other Observable Inputs
|
Significant Unobservable Inputs
|
|||||||||||||
|
As of December 31, 2012:
|
(Level 1)
|
(Level 2)
|
(Level 3)
|
Total
|
|||||||||||
|
(in thousands)
|
|||||||||||||||
|
Assets:
|
|||||||||||||||
|
Energy-related derivatives
|
$
|
—
|
|
$
|
2,519
|
|
$
|
—
|
|
$
|
2,519
|
|
|||
|
Cash equivalents
|
125,600
|
|
—
|
|
—
|
|
125,600
|
|
|||||||
|
Total
|
$
|
125,600
|
|
$
|
2,519
|
|
$
|
—
|
|
$
|
128,119
|
|
|||
|
Liabilities:
|
|||||||||||||||
|
Energy-related derivatives
|
$
|
—
|
|
$
|
19,446
|
|
$
|
—
|
|
$
|
19,446
|
|
|||
|
Foreign currency derivatives
|
—
|
|
37
|
|
—
|
|
37
|
|
|||||||
|
Total
|
$
|
—
|
|
$
|
19,483
|
|
$
|
—
|
|
$
|
19,483
|
|
|||
Valuation Methodologies
The energy-related derivatives primarily consist of over-the-counter financial products for natural gas and physical power products including, from time to time, basis swaps. These are standard products used within the energy industry and are valued using the market approach. The inputs used are mainly from observable market sources, such as forward natural gas prices, power prices, implied volatility, and Overnight Index Swap interest rates. Interest rate and foreign currency derivatives are also standard over-the-counter financial products valued using the market approach. Inputs for interest rate derivatives include LIBOR interest rates, interest rate futures contracts, and occasionally implied volatility of interest rate options. Inputs for foreign currency derivatives are from observable market sources. See Note 10 for additional information on how these derivatives are used.
As of
December 31, 2013
and
2012
, the fair value measurements of investments calculated at net asset value per share (or its equivalent), as well as the nature and risks of those investments, were as follows:
|
Fair Value
|
Unfunded
Commitments
|
Redemption
Frequency
|
Redemption
Notice Period
|
||||||
|
As of December 31, 2013:
|
(in thousands)
|
||||||||
|
Cash equivalents:
|
|||||||||
|
Money market funds
|
$
|
125,000
|
|
None
|
Daily
|
Not applicable
|
|||
|
As of December 31, 2012:
|
|||||||||
|
Cash equivalents:
|
|||||||||
|
Money market funds
|
$
|
125,600
|
|
None
|
Daily
|
Not applicable
|
|||
The money market funds are short-term investments of excess funds in various money market mutual funds, which are portfolios of short-term debt securities. The money market funds are regulated by the SEC and typically receive the highest rating from credit rating agencies. Regulatory and rating agency requirements for money market funds include minimum credit ratings and maximum maturities for individual securities and a maximum weighted average portfolio maturity. Redemptions are available on a same day basis up to the full amount of the Company's investment in the money market funds.
II-427
NOTES (continued)
Mississippi Power Company 2013 Annual Report
As of
December 31, 2013
and
2012
, other financial instruments for which the carrying amount did not equal fair value were as follows:
|
Carrying Amount
|
Fair Value
|
||||||
|
(in thousands)
|
|||||||
|
Long-term debt:
|
|||||||
|
2013
|
$
|
2,098,639
|
|
$
|
2,045,519
|
|
|
|
2012
|
$
|
1,840,933
|
|
$
|
1,956,799
|
|
|
The fair values are determined using primarily Level 2 measurements and are based on quoted market prices for the same or similar issues or on the current rates offered to the Company.
10. DERIVATIVES
The Company is exposed to market risks, primarily commodity price risk and interest rate risk and occasionally foreign currency risk. To manage the volatility attributable to these exposures, the Company nets its exposures, where possible, to take advantage of natural offsets and enters into various derivative transactions for the remaining exposures pursuant to the Company's policies in areas such as counterparty exposure and risk management practices. The Company's policy is that derivatives are to be used primarily for hedging purposes and mandates strict adherence to all applicable risk management policies. Derivative positions are monitored using techniques including, but not limited to, market valuation, value at risk, stress testing, and sensitivity analysis. Derivative instruments are recognized at fair value in the balance sheets as either assets or liabilities and are presented on a gross basis. In the statements of cash flows, the cash impacts of settled energy-related and interest rate derivatives are recorded as operating activities and the cash impacts of settled foreign currency derivatives are recorded as investing activities.
Energy-Related Derivatives
The Company enters into energy-related derivatives to hedge exposures to electricity, gas, and other fuel price changes. However, due to cost-based rate regulations and other various cost recovery mechanisms, the Company has limited exposure to market volatility in commodity fuel prices and prices of electricity. The Company manages fuel-hedging programs, implemented per the guidelines of the Mississippi PSC, through the use of financial derivative contracts, which is expected to continue to mitigate price volatility.
To mitigate residual risks relative to movements in electricity prices, the Company may enter into physical fixed-price or heat rate contracts for the purchase and sale of electricity through the wholesale electricity market. To mitigate residual risks relative to movements in gas prices, the Company may enter into fixed-price contracts for natural gas purchases; however, a significant portion of contracts are priced at market.
Energy-related derivative contracts are accounted for in one of three methods:
|
•
|
Regulatory Hedges
– Energy-related derivative contracts which are designated as regulatory hedges relate primarily to the Company's fuel-hedging programs, where gains and losses are initially recorded as regulatory liabilities and assets, respectively, and then are included in fuel expense as the underlying fuel is used in operations and ultimately recovered through the respective fuel cost recovery clauses.
|
|
•
|
Cash Flow Hedges
– Gains and losses on energy-related derivatives designated as cash flow hedges which are mainly used to hedge anticipated purchases and sales and are initially deferred in OCI before being recognized in the statements of income in the same period as the hedged transactions are reflected in earnings.
|
|
•
|
Not Designated
– Gains and losses on energy-related derivative contracts that are not designated or fail to qualify as hedges are recognized in the statements of income as incurred.
|
Some energy-related derivative contracts require physical delivery as opposed to financial settlement, and this type of derivative is both common and prevalent within the electric industry. When an energy-related derivative contract is settled physically, any cumulative unrealized gain or loss is reversed and the contract price is recognized in the respective line item representing the actual price of the underlying goods being delivered.
II-428
NOTES (continued)
Mississippi Power Company 2013 Annual Report
At
December 31, 2013
, the net volume of energy-related derivative contracts for natural gas positions for the Company, together with the longest hedge date over which it is hedging its exposure to the variability in future cash flows for forecasted transactions and the longest date for derivatives not designated as hedges, were as follows:
|
Net Purchased
mmBtu*
|
Longest Hedge
Date
|
Longest Non-Hedge
Date
|
||
|
(in millions)
|
||||
|
56
|
2017
|
—
|
||
|
*
|
mmBtu — million British thermal units
|
Interest Rate Derivatives
The Company may also enter into interest rate derivatives to hedge exposure to changes in interest rates. Derivatives related to existing variable rate securities or forecasted transactions are accounted for as cash flow hedges where the effective portion of the derivatives' fair value gains or losses is recorded in OCI and is reclassified into earnings at the same time the hedged transactions affect earnings. The derivatives employed as hedging instruments are structured to minimize ineffectiveness, which is recorded directly to income.
At
December 31, 2013
, there were no interest rate derivatives outstanding.
The estimated pre-tax losses that will be reclassified from accumulated OCI to interest expense for the 12-month period ending
December 31, 2014
are
$1.4 million
. The Company has deferred gains and losses that are expected to be amortized into earnings through 2022.
Foreign Currency Derivatives
The Company may enter into foreign currency derivatives to hedge exposure to changes in foreign currency exchange rates arising from purchases of equipment denominated in a currency other than U.S. dollars. Derivatives related to a firm commitment in a foreign currency transaction are accounted for as a fair value hedge where the derivatives' fair value gains or losses and the hedged items' fair value gains or losses are both recorded directly to earnings. Derivatives related to a forecasted transaction are accounted for as a cash flow hedge where the effective portion of the derivatives' fair value gains or losses is recorded in OCI and is reclassified into earnings at the same time the hedged transactions affect earnings. Any ineffectiveness is typically recorded directly to earnings; however, the Company has regulatory approval allowing it to defer any ineffectiveness associated with firm commitments related to the Kemper IGCC to a regulatory asset. During 2011, certain fair value hedges were de-designated and subsequently settled in 2012. The ineffectiveness related to the de-designated hedges was recorded as a regulatory asset and was immaterial to the Company. The derivatives employed as hedging instruments are structured to minimize ineffectiveness.
At
December 31, 2013
, the foreign currency derivatives outstanding were immaterial.
II-429
NOTES (continued)
Mississippi Power Company 2013 Annual Report
Derivative Financial Statement Presentation and Amounts
At
December 31, 2013
and
2012
, the fair value of energy-related derivatives, foreign currency derivatives, and interest rate derivatives was reflected in the balance sheets as follows:
|
Asset Derivatives
|
Liability Derivatives
|
||||||||||||||||||
|
Derivative Category
|
Balance Sheet Location
|
2013
|
2012
|
Balance Sheet
Location
|
2013
|
2012
|
|||||||||||||
|
(in thousands)
|
(in thousands)
|
||||||||||||||||||
|
Derivatives designated as hedging instruments for regulatory purposes
|
|||||||||||||||||||
|
Energy-related derivatives:
|
Other current assets
|
$
|
3,352
|
|
$
|
638
|
|
Liabilities from risk management activities
|
$
|
3,652
|
|
$
|
13,116
|
|
|||||
|
Other deferred charges and assets
|
1,451
|
|
1,881
|
|
Other deferred credits and liabilities
|
6,629
|
|
6,330
|
|
||||||||||
|
Total derivatives designated as hedging instruments for regulatory purposes
|
$
|
4,803
|
|
$
|
2,519
|
|
$
|
10,281
|
|
$
|
19,446
|
|
|||||||
|
Derivatives designated as hedging instruments in cash flow and fair value hedges
|
|||||||||||||||||||
|
Foreign currency derivatives:
|
Other current assets
|
$
|
—
|
|
$
|
—
|
|
Liabilities from risk management activities
|
$
|
1
|
|
$
|
—
|
|
|||||
|
Other deferred charges and assets
|
—
|
|
—
|
|
Other deferred credits and liabilities
|
—
|
|
37
|
|
||||||||||
|
Total derivatives designated as hedging instruments in cash flow and fair value hedges
|
$
|
—
|
|
$
|
—
|
|
$
|
1
|
|
$
|
37
|
|
|||||||
|
Total
|
$
|
4,803
|
|
$
|
2,519
|
|
$
|
10,282
|
|
$
|
19,483
|
|
|||||||
All derivative instruments are measured at fair value. See Note 9 for additional information.
The derivative contracts of the Company are not subject to master netting arrangements or similar agreements and are reported gross on the Company's financial statements. Some of these energy-related and interest rate derivative contracts contain certain provisions that permit intra-contract netting of derivative receivables and payables for routine billing and offsets related to events of default and settlements. Amounts related to energy-related derivative contracts at
December 31, 2013
and
2012
are presented in the following tables.
|
Fair Value
|
||||||||||||||||||
|
Assets
|
2013
|
|
2012
|
|
Liabilities
|
2013
|
|
2012
|
|
|||||||||
|
(in thousands)
|
(in thousands)
|
|||||||||||||||||
|
Energy-related derivatives presented in the Balance Sheet
(a)
|
$
|
4,803
|
|
$
|
2,519
|
|
Energy-related derivatives presented in the Balance Sheet
(a)
|
$
|
10,281
|
|
$
|
19,446
|
|
|||||
|
Gross amounts not offset in the Balance Sheet
(b)
|
(3,856
|
)
|
(2,333
|
)
|
Gross amounts not offset in the Balance Sheet
(b)
|
(3,856
|
)
|
(2,333
|
)
|
|||||||||
|
Net-energy related derivative assets
|
$
|
947
|
|
$
|
186
|
|
Net-energy related derivative liabilities
|
$
|
6,425
|
|
$
|
17,113
|
|
|||||
(a) The Company does not offset fair value amounts for multiple derivative instruments executed with the same counterparty on the balance sheets; therefore, gross and net amounts of derivative assets and liabilities presented on the balance sheets are the same.
(b) Includes gross amounts subject to netting terms that are not offset on the balance sheets and any cash/financial collateral pledged or received.
II-430
NOTES (continued)
Mississippi Power Company 2013 Annual Report
At
December 31, 2013
and
2012
, the pre-tax effects of unrealized derivative gains (losses) arising from energy-related derivative instruments designated as regulatory hedging instruments and deferred on the balance sheets were as follows:
|
Unrealized Losses
|
Unrealized Gains
|
||||||||||||||||||
|
Derivative Category
|
Balance Sheet
Location
|
2013
|
2012
|
Balance Sheet
Location
|
2013
|
2012
|
|
||||||||||||
|
(in thousands)
|
(in thousands)
|
||||||||||||||||||
|
Energy-related derivatives:
|
Other regulatory assets, current
|
$
|
(3,652
|
)
|
$
|
(13,116
|
)
|
Other regulatory liabilities, current
|
$
|
3,352
|
|
$
|
638
|
|
|||||
|
Other regulatory assets, deferred
|
(6,629
|
)
|
(6,330
|
)
|
Other regulatory liabilities, deferred
|
1,451
|
|
1,881
|
|
||||||||||
|
Total energy-related derivative gains (losses)
|
$
|
(10,281
|
)
|
$
|
(19,446
|
)
|
$
|
4,803
|
|
$
|
2,519
|
|
|||||||
For the years ended
December 31, 2013
,
2012
, and
2011
, the pre-tax effects of derivatives designated as cash flow hedging instruments on the statements of income were as follows:
|
Derivatives in Cash Flow
Hedging Relationships
|
Gain (Loss) Recognized in
OCI on Derivative
(Effective Portion)
|
Gain (Loss) Reclassified from Accumulated
OCI into Income
(Effective Portion)
|
|||||||||||||||||||||||
|
Amount
|
|||||||||||||||||||||||||
|
Derivative Category
|
2013
|
2012
|
2011
|
Statements of Income Location
|
2013
|
2012
|
2011
|
||||||||||||||||||
|
(in thousands)
|
(in thousands)
|
||||||||||||||||||||||||
|
Energy-related derivatives
|
$
|
—
|
|
$
|
—
|
|
$
|
(3
|
)
|
Fuel
|
$
|
—
|
|
$
|
—
|
|
$
|
—
|
|
||||||
|
Interest rate derivatives
|
—
|
|
(774
|
)
|
(14,361
|
)
|
Interest Expense
|
(1,375
|
)
|
(1,073
|
)
|
48
|
|
||||||||||||
|
Total
|
$
|
—
|
|
$
|
(774
|
)
|
$
|
(14,364
|
)
|
$
|
(1,375
|
)
|
$
|
(1,073
|
)
|
$
|
48
|
|
|||||||
There was no material ineffectiveness recorded in earnings for any period presented.
For the years ended
December 31, 2013
,
2012
, and
2011
, the pre-tax effects of energy-related derivatives not designated as hedging instruments on the statements of income were immaterial.
For the year ended
December 31, 2013
, the pre-tax effects of foreign currency derivatives designated as fair value hedging instruments on the Company's statements of income were immaterial. For the year ended December 31, 2012, the pre-tax effect of foreign currency derivatives designated as fair value hedging instruments, which include a pre-tax loss associated with the de-designated hedges prior to de-designation, was a
$0.6 million
gain. For the year ended
December 31, 2011
, the pre-tax loss was $
3.6 million
. These amounts were offset by changes in the fair value of the purchase commitment related to equipment purchases. Therefore, there is no impact on the Company's statements of income.
Contingent Features
The Company does not have any credit arrangements that would require material changes in payment schedules or terminations as a result of a credit rating downgrade. There are certain derivatives that could require collateral, but not accelerated payment, in the event of various credit rating changes of certain affiliated companies. At
December 31, 2013
, the fair value of derivative liabilities with contingent features was
$1.5 million
.
At
December 31, 2013
, the Company had no collateral posted with its derivative counterparties; however, because of the joint and several liability features underlying these derivatives, the maximum potential collateral requirements arising from the credit-risk-related contingent features, at a rating below BBB- and/or Baa3, were
$8.8 million
. If collateral is required, fair value amounts recognized for the right to reclaim cash collateral or the obligation to return cash collateral are not offset against fair value amounts recognized for derivatives executed with the same counterparty.
Generally, collateral may be provided by a Southern Company guaranty, letter of credit, or cash. The Company participates in certain agreements that could require collateral in the event that one or more Southern Company system power pool participants has a credit rating change to below investment grade.
II-431
NOTES (continued)
Mississippi Power Company 2013 Annual Report
The Company is exposed to losses related to financial instruments in the event of counterparties' nonperformance. The Company only enters into agreements and material transactions with counterparties that have investment grade credit ratings by Moody's and S&P or with counterparties who have posted collateral to cover potential credit exposure. The Company has also established risk management policies and controls to determine and monitor the creditworthiness of counterparties in order to mitigate the Company's exposure to counterparty credit risk. Therefore, the Company does not anticipate a material adverse effect on the financial statements as a result of counterparty nonperformance.
II-432
NOTES (continued)
Mississippi Power Company 2013 Annual Report
11. QUARTERLY FINANCIAL INFORMATION (UNAUDITED)
Summarized quarterly financial information for
2013
and
2012
is as follows:
|
Quarter Ended
|
Operating
Revenues
|
Operating
Income (Loss)
|
Net Income (Loss) After Dividends on Preferred Stock
|
||||||||
|
(in thousands)
|
|||||||||||
|
March 2013
|
$
|
245,934
|
|
$
|
(429,148
|
)
|
$
|
(246,321
|
)
|
||
|
June 2013
|
306,435
|
|
(388,395
|
)
|
(219,110
|
)
|
|||||
|
September 2013
|
325,206
|
|
(79,890
|
)
|
(24,115
|
)
|
|||||
|
December 2013
|
267,582
|
|
(24,412
|
)
|
12,921
|
|
|||||
|
March 2012
|
$
|
228,714
|
|
$
|
30,213
|
|
$
|
25,255
|
|
||
|
June 2012
|
266,084
|
|
46,986
|
|
35,027
|
|
|||||
|
September 2012
|
305,419
|
|
66,151
|
|
54,625
|
|
|||||
|
December 2012 (Restated)
|
235,779
|
|
(46,338
|
)
|
(14,965
|
)
|
|||||
The Company's business is influenced by seasonal weather conditions.
II-433
SELECTED FINANCIAL AND OPERATING DATA
2009
-
2013
Mississippi Power Company
2013
Annual Report
|
2013
|
2012
|
2011
|
2010
|
2009
|
|||||||||||||||
|
Operating Revenues (
in thousands
)
|
$
|
1,145,157
|
|
$
|
1,035,996
|
|
$
|
1,112,877
|
|
$
|
1,143,068
|
|
$
|
1,149,421
|
|
||||
|
Net Income (Loss) After Dividends
on Preferred Stock (
in thousands
)
|
$
|
(476,625
|
)
|
$
|
99,942
|
|
$
|
94,182
|
|
$
|
80,217
|
|
$
|
84,967
|
|
||||
|
Cash Dividends
on Common Stock (
in thousands
)
|
$
|
71,956
|
|
$
|
106,800
|
|
$
|
75,500
|
|
$
|
68,600
|
|
$
|
68,500
|
|
||||
|
Return on Average Common Equity (
percent
)
|
(24.28
|
)
|
7.14
|
|
10.54
|
|
11.49
|
|
13.12
|
|
|||||||||
|
Total Assets (
in thousands
)
|
$
|
5,848,209
|
|
$
|
5,373,621
|
|
$
|
3,671,842
|
|
$
|
2,476,321
|
|
$
|
2,072,681
|
|
||||
|
Gross Property Additions (
in thousands
)
|
$
|
1,773,332
|
|
$
|
1,665,498
|
|
$
|
1,205,704
|
|
$
|
340,162
|
|
$
|
95,573
|
|
||||
|
Capitalization (
in thousands
):
|
|||||||||||||||||||
|
Common stock equity
|
$
|
2,176,551
|
|
$
|
1,749,208
|
|
$
|
1,049,217
|
|
$
|
737,368
|
|
$
|
658,522
|
|
||||
|
Redeemable preferred stock
|
32,780
|
|
32,780
|
|
32,780
|
|
32,780
|
|
32,780
|
|
|||||||||
|
Long-term debt
|
2,167,067
|
|
1,564,462
|
|
1,103,596
|
|
462,032
|
|
493,480
|
|
|||||||||
|
Total (
excluding amounts due within one year
)
|
$
|
4,376,398
|
|
$
|
3,346,450
|
|
$
|
2,185,593
|
|
$
|
1,232,180
|
|
$
|
1,184,782
|
|
||||
|
Capitalization Ratios (percent):
|
|||||||||||||||||||
|
Common stock equity
|
49.7
|
|
52.3
|
|
48.0
|
|
59.8
|
|
55.6
|
|
|||||||||
|
Redeemable preferred stock
|
0.7
|
|
1.0
|
|
1.5
|
|
2.7
|
|
2.8
|
|
|||||||||
|
Long-term debt
|
49.6
|
|
46.7
|
|
50.5
|
|
37.5
|
|
41.6
|
|
|||||||||
|
Total (
excluding amounts due within one year
)
|
100.0
|
|
100.0
|
|
100.0
|
|
100.0
|
|
100.0
|
|
|||||||||
|
Customers (
year-end
):
|
|||||||||||||||||||
|
Residential
|
152,585
|
|
152,265
|
|
151,805
|
|
151,944
|
|
151,375
|
|
|||||||||
|
Commercial
|
33,250
|
|
33,112
|
|
33,200
|
|
33,121
|
|
33,147
|
|
|||||||||
|
Industrial
|
480
|
|
472
|
|
496
|
|
504
|
|
513
|
|
|||||||||
|
Other
|
175
|
|
175
|
|
175
|
|
187
|
|
180
|
|
|||||||||
|
Total
|
186,490
|
|
186,024
|
|
185,676
|
|
185,756
|
|
185,215
|
|
|||||||||
|
Employees (
year-end
)
|
1,344
|
|
1,281
|
|
1,264
|
|
1,280
|
|
1,285
|
|
|||||||||
II-434
SELECTED FINANCIAL AND OPERATING DATA
2009
-
2013
(continued)
Mississippi Power Company
2013
Annual Report
|
2013
|
|
2012
|
|
2011
|
|
2010
|
|
2009
|
|
||||||||||
|
Operating Revenues (
in thousands
):
|
|||||||||||||||||||
|
Residential
|
$
|
241,956
|
|
$
|
226,847
|
|
$
|
246,510
|
|
$
|
256,994
|
|
$
|
245,357
|
|
||||
|
Commercial
|
265,506
|
|
250,860
|
|
263,256
|
|
266,406
|
|
269,423
|
|
|||||||||
|
Industrial
|
289,272
|
|
262,978
|
|
275,752
|
|
267,588
|
|
269,128
|
|
|||||||||
|
Other
|
2,405
|
|
6,768
|
|
6,945
|
|
6,924
|
|
7,041
|
|
|||||||||
|
Total retail
|
799,139
|
|
747,453
|
|
792,463
|
|
797,912
|
|
790,949
|
|
|||||||||
|
Wholesale — non-affiliates
|
293,871
|
|
255,557
|
|
273,178
|
|
287,917
|
|
299,268
|
|
|||||||||
|
Wholesale — affiliates
|
34,773
|
|
16,403
|
|
30,417
|
|
41,614
|
|
44,546
|
|
|||||||||
|
Total revenues from sales of electricity
|
1,127,783
|
|
1,019,413
|
|
1,096,058
|
|
1,127,443
|
|
1,134,763
|
|
|||||||||
|
Other revenues
|
17,374
|
|
16,583
|
|
16,819
|
|
15,625
|
|
14,658
|
|
|||||||||
|
Total
|
$
|
1,145,157
|
|
$
|
1,035,996
|
|
$
|
1,112,877
|
|
$
|
1,143,068
|
|
$
|
1,149,421
|
|
||||
|
Kilowatt-Hour Sales (
in thousands
):
|
|||||||||||||||||||
|
Residential
|
2,087,704
|
|
2,045,999
|
|
2,162,419
|
|
2,296,157
|
|
2,091,825
|
|
|||||||||
|
Commercial
|
2,864,947
|
|
2,915,934
|
|
2,870,714
|
|
2,921,942
|
|
2,851,248
|
|
|||||||||
|
Industrial
|
4,738,714
|
|
4,701,681
|
|
4,586,356
|
|
4,466,560
|
|
4,329,924
|
|
|||||||||
|
Other
|
40,139
|
|
38,588
|
|
38,684
|
|
38,570
|
|
38,855
|
|
|||||||||
|
Total retail
|
9,731,504
|
|
9,702,202
|
|
9,658,173
|
|
9,723,229
|
|
9,311,852
|
|
|||||||||
|
Wholesale — non-affiliates
|
3,929,177
|
|
3,818,773
|
|
4,009,637
|
|
4,284,289
|
|
4,651,606
|
|
|||||||||
|
Wholesale — affiliates
|
931,153
|
|
571,908
|
|
648,772
|
|
774,375
|
|
839,372
|
|
|||||||||
|
Total
|
14,591,834
|
|
14,092,883
|
|
14,316,582
|
|
14,781,893
|
|
14,802,830
|
|
|||||||||
|
Average Revenue Per Kilowatt-Hour (
cents
)**:
|
|||||||||||||||||||
|
Residential
|
11.59
|
|
11.09
|
|
11.40
|
|
11.19
|
|
11.73
|
|
|||||||||
|
Commercial
|
9.27
|
|
8.60
|
|
9.17
|
|
9.12
|
|
9.45
|
|
|||||||||
|
Industrial
|
6.10
|
|
5.59
|
|
6.01
|
|
5.99
|
|
6.22
|
|
|||||||||
|
Total retail
|
8.21
|
|
7.70
|
|
8.21
|
|
8.21
|
|
8.49
|
|
|||||||||
|
Wholesale
|
6.76
|
|
6.19
|
|
6.52
|
|
6.51
|
|
6.26
|
|
|||||||||
|
Total sales
|
7.73
|
|
7.23
|
|
7.66
|
|
7.63
|
|
7.67
|
|
|||||||||
|
Residential Average Annual
Kilowatt-Hour Use Per Customer
|
13,680
|
|
13,426
|
|
14,229
|
|
15,130
|
|
13,762
|
|
|||||||||
|
Residential Average Annual
Revenue Per Customer
|
$
|
1,585
|
|
$
|
1,489
|
|
$
|
1,622
|
|
$
|
1,693
|
|
$
|
1,614
|
|
||||
|
Plant Nameplate Capacity
Ratings (
year-end
) (
megawatts
)
|
3,088
|
|
3,088
|
|
3,156
|
|
3,156
|
|
3,156
|
|
|||||||||
|
Maximum Peak-Hour Demand (
megawatts
):
|
|||||||||||||||||||
|
Winter
|
2,083
|
|
2,168
|
|
2,618
|
|
2,792
|
|
2,392
|
|
|||||||||
|
Summer
|
2,352
|
|
2,435
|
|
2,462
|
|
2,638
|
|
2,522
|
|
|||||||||
|
Annual Load Factor (
percent
)
|
64.7
|
|
61.9
|
|
59.1
|
|
57.9
|
|
60.7
|
|
|||||||||
|
Plant Availability Fossil-Steam (
percent
)*
|
89.3
|
|
91.5
|
|
87.7
|
|
93.8
|
|
94.1
|
|
|||||||||
|
Source of Energy Supply (
percent
):
|
|||||||||||||||||||
|
Coal
|
32.7
|
|
22.8
|
|
34.9
|
|
43.0
|
|
40.0
|
|
|||||||||
|
Oil and gas
|
57.1
|
|
63.9
|
|
51.5
|
|
41.9
|
|
43.6
|
|
|||||||||
|
Purchased power -
|
|||||||||||||||||||
|
From non-affiliates
|
2.0
|
|
2.0
|
|
1.4
|
|
1.3
|
|
3.3
|
|
|||||||||
|
From affiliates
|
8.2
|
|
11.3
|
|
12.2
|
|
13.8
|
|
13.1
|
|
|||||||||
|
Total
|
100.0
|
|
100.0
|
|
100.0
|
|
100.0
|
|
100.0
|
|
|||||||||
|
*
**
|
Beginning in 2012, plant availability is calculated as a weighted equivalent availability.
The average revenue per kilowatt-hour (cents) is based on booked operating revenues and will not match billed revenue per kilowatt-hour.
|
II-435
SOUTHERN POWER COMPANY
FINANCIAL SECTION
II-436
MANAGEMENT'S REPORT ON INTERNAL CONTROL OVER FINANCIAL REPORTING
Southern Power Company and Subsidiary Companies
2013
Annual Report
The management of Southern Power Company (the Company) is responsible for establishing and maintaining an adequate system of internal control over financial reporting as required by the Sarbanes-Oxley Act of 2002 and as defined in Exchange Act Rule 13a-15(f). A control system can provide only reasonable, not absolute, assurance that the objectives of the control system are met.
Under management's supervision, an evaluation of the design and effectiveness of the Company's internal control over financial reporting was conducted based on the framework in
Internal Control—Integrated Framework (1992)
issued by the Committee of Sponsoring Organizations of the Treadway Commission. Based on this evaluation, management concluded that the Company's internal control over financial reporting was effective as of
December 31, 2013
.
/s/ Oscar C. Harper, IV
Oscar C. Harper, IV
President and Chief Executive Officer
/s/ William C. Grantham
William C. Grantham
Vice President, Chief Financial Officer, and Treasurer
February 27, 2014
II-437
REPORT OF INDEPENDENT REGISTERED PUBLIC ACCOUNTING FIRM
To the Board of Directors of
Southern Power Company
We have audited the accompanying consolidated balance sheets of Southern Power Company and Subsidiary Companies (the Company) (a wholly owned subsidiary of The Southern Company) as of
December 31, 2013
and
2012
, and the related consolidated statements of income, comprehensive income, common stockholder's equity, and cash flows for each of the three years in the period ended
December 31, 2013
. These financial statements are the responsibility of the Company's management. Our responsibility is to express an opinion on these financial statements based on our audits.
We conducted our audits in accordance with the standards of the Public Company Accounting Oversight Board (United States). Those standards require that we plan and perform the audit to obtain reasonable assurance about whether the financial statements are free of material misstatement. The Company is not required to have, nor were we engaged to perform, an audit of its internal control over financial reporting. Our audits included consideration of internal control over financial reporting as a basis for designing audit procedures that are appropriate in the circumstances, but not for the purpose of expressing an opinion on the effectiveness of the Company's internal control over financial reporting. Accordingly, we express no such opinion. An audit also includes examining, on a test basis, evidence supporting the amounts and disclosures in the financial statements, assessing the accounting principles used and significant estimates made by management, as well as evaluating the overall financial statement presentation. We believe that our audits provide a reasonable basis for our opinion.
In our opinion, such consolidated financial statement
s (pages II-457 to II-478) p
resent fairly, in all material respects, the financial position of Southern Power Company and Subsidiary Companies as of
December 31, 2013
and
2012
, and the results of their operations and their cash flows for each of the three years in the period ended
December 31, 2013
, in conformity with accounting principles generally accepted in the United States of America.
/s/ Deloitte & Touche LLP
Atlanta, Georgia
February 27, 2014
II-438
MANAGEMENT'S DISCUSSION AND ANALYSIS OF FINANCIAL CONDITION AND RESULTS OF OPERATIONS
Southern Power Company and Subsidiary Companies
2013
Annual Report
OVERVIEW
Business Activities
Southern Power Company and its subsidiaries (the Company) construct, acquire, own, and manage generation assets, including renewable energy projects, and sell electricity at market-based rates in the wholesale market. The Company continually seeks opportunities to execute its strategy to create value through various transactions including acquisitions and sales of assets, construction of new power plants, and entry into purchase power agreements (PPAs) primarily with investor owned utilities, independent power producers, municipalities, and electric cooperatives. In general, the Company has constructed or acquired new generating capacity only after entering into long-term capacity contracts for the new facilities.
In accordance with this overall growth strategy, on April 23, 2013, the Company and Turner Renewable Energy, LLC (TRE), through Southern Turner Renewable Energy, LLC (STR), a jointly-owned subsidiary owned 90% by a subsidiary of Southern Power Company, acquired all of the outstanding membership interests of Campo Verde Solar, LLC (Campo Verde). Campo Verde constructed and owns an approximately 139-megawatt (MW) solar facility in Southern California. The solar facility began commercial operation on October 25, 2013. The output of the plant is contracted under a 20-year PPA with San Diego Gas & Electric Company, a subsidiary of Sempra Energy.
In September 2013, the Company completed construction of Plant Spectrum, a solar photovoltaic facility in North Las Vegas, Nevada with a nameplate capacity of 30 MWs. The Company has a long-term PPA covering the entire output of the plant from 2013 through 2038.
See FUTURE EARNINGS POTENTIAL – "Acquisitions" herein and Note 2 to the financial statements for additional information.
As of
December 31, 2013
, the Company had generating units totaling 8,924 MWs nameplate capacity in commercial operation. The average remaining duration of the Company's wholesale contracts exceeds 9 years, which reduces remarketing risk. The Company’s renewable assets, including biomass and solar, are covered under contracts in excess of 20 years. The Company has entered into long-term power sales agreements for an average of 79% of its available capacity for the next five years and 70% of its available capacity for the next 10 years. The Company's future earnings will depend on the parameters of the wholesale market and the efficient operation of its wholesale generating assets. See FUTURE EARNINGS POTENTIAL herein for additional information.
Key Performance Indicators
To evaluate operating results and to ensure the Company's ability to meet its contractual commitments to customers, the Company focuses on several key performance indicators. These indicators include peak season equivalent forced outage rate (Peak Season EFOR), contract availability, and net income. Peak Season EFOR defines the hours during peak demand times when the Company's generating units are not available due to forced outages (the lower the better). Contract availability measures the percentage of scheduled hours delivered. Net income is the primary measure of the Company's financial performance. The Company's actual performance in
2013
surpassed targets for Peak Season EFOR and contract availability, but did not meet net income targets. See RESULTS OF OPERATIONS herein for additional information on the Company's net income for
2013
.
Earnings
The Company's 2013 net income was $165.5 million, a $9.8 million decrease compared to 2012. The decrease was primarily due to an increase in other operations and maintenance expenses and depreciation primarily due to an increase in costs related to scheduled outages and new plants placed in service, higher fuel and purchased power expenses, and higher interest expense. The decrease was partially offset by an increase in capacity and energy revenues from non-affiliates and lower income tax expense associated with the net impact of investment tax credits (ITCs) received in 2013.
The Company's 2012 net income was $175.3 million, a $13.1 million increase compared to 2011. The increase was primarily due to higher energy revenues from sales to affiliates under the Intercompany Interchange Contract (IIC), higher capacity revenues due to an increase in total MWs of capacity under long-term contracts, lower fuel and purchased power expenses, lower interest expense, and a loss on early redemption of long-term debt in 2011. The increase was partially offset by lower energy revenues from non-affiliates, higher depreciation and amortization, and higher income tax expense.
II-439
MANAGEMENT'S DISCUSSION AND ANALYSIS (continued)
Southern Power Company and Subsidiary Companies 2013 Annual Report
RESULTS OF OPERATIONS
A condensed statement of income follows:
|
Amount
|
Increase (Decrease)
from Prior Year
|
||||||||||
|
2013
|
2013
|
2012
|
|||||||||
|
(in millions)
|
|||||||||||
|
Operating revenues
|
$
|
1,275.2
|
|
$
|
89.2
|
|
$
|
(49.9
|
)
|
||
|
Fuel
|
473.8
|
|
47.5
|
|
(28.5
|
)
|
|||||
|
Purchased power
|
106.4
|
|
13.1
|
|
(37.9
|
)
|
|||||
|
Other operations and maintenance
|
208.3
|
|
35.2
|
|
1.5
|
|
|||||
|
Depreciation and amortization
|
175.3
|
|
32.7
|
|
18.4
|
|
|||||
|
Taxes other than income taxes
|
21.4
|
|
2.1
|
|
1.6
|
|
|||||
|
Total operating expenses
|
985.2
|
|
130.6
|
|
(44.9
|
)
|
|||||
|
Operating income
|
290.0
|
|
(41.4
|
)
|
(5.0
|
)
|
|||||
|
Interest expense, net of amounts capitalized
|
74.5
|
|
12.0
|
|
(14.8
|
)
|
|||||
|
Loss on extinguishment of debt
|
—
|
|
—
|
|
19.8
|
|
|||||
|
Other income (expense), net
|
(4.1
|
)
|
(3.1
|
)
|
0.2
|
|
|||||
|
Income taxes
|
45.9
|
|
(46.7
|
)
|
16.7
|
|
|||||
|
Net income
|
$
|
165.5
|
|
$
|
(9.8
|
)
|
$
|
13.1
|
|
||
Operating Revenues
Operating revenues for 2013 were $1.3 billion, reflecting an $89.2 million (7.5%) increase from 2012. Details of operating revenues are as follows:
|
2013
|
2012
|
2011
|
|||||||||
|
(in millions)
|
|||||||||||
|
Capacity revenues —
|
|||||||||||
|
Affiliates
|
$
|
126.0
|
|
$
|
125.9
|
|
$
|
146.5
|
|
||
|
Non-affiliates
|
446.4
|
|
372.6
|
|
322.7
|
|
|||||
|
Total
|
572.4
|
|
498.5
|
|
469.2
|
|
|||||
|
Energy revenues —
|
|||||||||||
|
Affiliates
|
23.8
|
|
35.6
|
|
39.3
|
|
|||||
|
Non-affiliates
|
427.1
|
|
346.7
|
|
482.9
|
|
|||||
|
Total
|
450.9
|
|
382.3
|
|
522.2
|
|
|||||
|
Total PPA revenues
|
1,023.3
|
|
880.8
|
|
991.4
|
|
|||||
|
Revenues not covered by PPA
|
245.3
|
|
298.0
|
|
237.8
|
|
|||||
|
Other revenues
|
6.6
|
|
7.2
|
|
6.7
|
|
|||||
|
Total Operating Revenues
|
$
|
1,275.2
|
|
$
|
1,186.0
|
|
$
|
1,235.9
|
|
||
The increase in operating revenues in 2013 was primarily due to a $73.8 million increase in capacity revenues under PPAs with non-affiliates, resulting from a 10.6% increase in the total MWs of capacity under contract, primarily due to a new PPA served by Plant Nacogdoches, which began in June 2012, and an increase in capacity amounts under existing PPAs. Also contributing was an $80.4 million increase in energy sales under PPAs with non-affiliates, reflecting a 29.6% increase in the average price of energy and a $7.8 million increase related to new solar contracts, which began in 2013, served by Plants Campo Verde and Spectrum. This increase was partially offset by an $11.8 million decrease in energy sales under PPAs with affiliates, reflecting a 48.1% decrease in kilowatt-hour (KWH) sales primarily due to lower demand, partially offset by a 28.9% increase in the average price of energy. The increase in energy revenues from PPAs was partially offset by a $52.4 million decrease in energy sales not
II-440
MANAGEMENT'S DISCUSSION AND ANALYSIS (continued)
Southern Power Company and Subsidiary Companies 2013 Annual Report
covered by PPAs, reflecting a 30.5% decrease in KWH sales primarily due to lower demand, partially offset by an 18.6% increase in the average price of energy.
Operating revenues in 2012 were $1.2 billion, a $49.9 million (4.0%) decrease from 2011. The decrease was primarily due to a $139.9 million decrease in energy sales under PPAs, reflecting a 25.8% reduction in the average price of energy and a 1.3% decrease in KWH sales. The decrease was partially offset by a $60.3 million increase in energy sales not covered by PPAs, reflecting a 78.5% increase in KWH sales, partially offset by a 29.7% reduction in the average price of energy. Overall, energy sales decreased $79.6 million, reflecting a 22.1% reduction in the average price of energy, partially offset by a 14.9% increase in KWH sales. The decrease in operating revenues from energy sales was partially offset by a $29.3 million increase in capacity revenue due to an increase in the total MWs of capacity under contract.
Wholesale revenues from sales to affiliate companies will vary depending on demand and the availability and cost of generating resources at each company. Sales to affiliate companies that are not covered by PPAs are made in accordance with the IIC, as approved by the Federal Energy Regulatory Commission (FERC).
Wholesale revenues from sales to non-affiliates will vary depending on the energy demand of those customers and their generation capacity, as well as the market prices of wholesale energy compared to the cost of the Company's energy. Increases and decreases in revenues that are driven by fuel prices are accompanied by an increase or decrease in fuel costs and do not have a significant impact on net income.
Capacity revenues are an integral component of the Company's PPAs with both affiliate and non-affiliate customers and generally represent the greatest contribution to net income. Energy under the PPAs is generally sold at variable cost or is indexed to published gas indices. Energy revenues also include fees for support services, fuel storage, and unit start charges.
Fuel and Purchased Power Expenses
Fuel costs constitute the single largest expense for the Company. Additionally, the Company purchases a portion of its electricity needs from the wholesale market.
Details of the Company's fuel and purchased power expenditures are as follows:
|
2013
|
2012
|
2011
|
|||||||||
|
(in millions)
|
|||||||||||
|
Fuel
|
$
|
473.8
|
|
$
|
426.3
|
|
$
|
454.8
|
|
||
|
Purchased power-non-affiliates
|
76.0
|
|
80.4
|
|
78.4
|
|
|||||
|
Purchased power-affiliates
|
30.4
|
|
12.9
|
|
52.9
|
|
|||||
|
Total fuel and purchased power expenses
|
$
|
580.2
|
|
$
|
519.6
|
|
$
|
586.1
|
|
||
The Company's PPAs generally provide that the purchasers are responsible for substantially all of the cost of fuel. Consequently, any increase or decrease in fuel cost is generally accompanied by an increase or decrease in related fuel revenue and does not have a significant impact on net income. The Company is responsible for the cost of fuel for generating units that are not covered under PPAs. Power from these generating units is sold into the market or sold to affiliates under the IIC.
Purchased power expenses will vary depending on demand and the availability and cost of generating resources throughout the Southern Company system and other contract resources. Load requirements are submitted to the Southern Company system power pool (Power Pool) on an hourly basis and are fulfilled with the lowest cost alternative, whether that is generation owned by Southern Power Company, affiliate-owned generation, or external purchases.
In 2013, total fuel and purchased power expenses increased $60.6 million (11.7%) compared to 2012, primarily due to a 28.8% increase in the average cost of natural gas and a 21.1% increase in the average cost of purchased power. The increase was partially offset by a 12.8% net decrease in the volume of KWHs generated and purchased primarily due to lower demand and the availability of lower cost affiliate power. In 2012, total fuel and purchased power expenses decreased $66.5 million (11.3%) compared to 2011, primarily due to a 27.2% decrease in the average cost of natural gas and a 23.0% decrease in the average cost of purchased power. The decrease was partially offset by a 21.4% net increase in the volume of KWHs generated and purchased.
In 2013, fuel expense increased $47.5 million (11.2%) compared to 2012. The increase was primarily due to a $104.1 million increase associated with the average cost of natural gas per KWH generated, partially offset by a $58.5 million decrease associated with the volume of KWHs generated. In 2012, fuel expense decreased $28.5 million (6.3%) compared to 2011. The decrease was primarily due to a $155.7 million decrease associated with the average cost of natural gas per KWH generated, partially offset by a $127.2 million increase associated with the volume of KWHs generated.
II-441
MANAGEMENT'S DISCUSSION AND ANALYSIS (continued)
Southern Power Company and Subsidiary Companies 2013 Annual Report
In 2013, purchased power expense increased $13.1 million (14.0%) compared to 2012. The increase was primarily due to an $18.3 million increase associated with the average cost of purchased power, partially offset by a $5.3 million decrease associated with the volume of KWHs purchased. In 2012, purchased power expense decreased $37.9 million (28.9%) compared to 2011. The decrease was primarily due to a $27.8 million decrease associated with the average cost of purchased power and a $10.1 million decrease associated with the volume of KWHs purchased.
Other Operations and Maintenance Expenses
In 2013, other operations and maintenance expenses increased $35.2 million (20.4%) compared to 2012. The increase was primarily due to a $21.8 million increase related to scheduled outage costs at Plants Franklin and Wansley, $6.2 million in additional costs related to new plant additions, including Plants Nacogdoches, Apex, Granville, and Cleveland in 2012 and Plants Spectrum and Campo Verde in 2013, and a $1.4 million increase in transmission costs.
In 2012, other operations and maintenance expenses increased $1.5 million (0.9%) compared to 2011. The increase was primarily due to a $7.8 million increase in administrative and general expenses associated with business development and affiliate service company costs and a $1.2 million increase in transmission costs, partially offset by a $7.4 million decrease in generating plant scheduled outages and maintenance in 2012.
Depreciation and Amortization
In 2013, depreciation and amortization increased $32.7 million (22.9%) compared to 2012. The increase was primarily due to a $23.8 million increase in depreciation resulting from an increase in plant in service, including the additions of Plants Nacogdoches, Apex, Granville, and Cleveland in 2012 and Plants Spectrum and Campo Verde in 2013, a $3.5 million increase for outage related capital costs, and a $2.4 million increase resulting from higher depreciation rates driven by major outages occurring in 2013.
In 2012, depreciation and amortization increased $18.4 million (14.8%) compared to 2011. The increase was primarily due to a $17.2 million increase in depreciation resulting from an increase in plant in service, including the additions of Plants Nacogdoches, Apex, Granville, and Cleveland in 2012, and a $2.5 million increase resulting from higher depreciation rates from the depreciation study adopted in January 2012, partially offset by a $1.3 million decrease in depreciation related to asset retirements.
See ACCOUNTING POLICIES – "Application of Critical Accounting Policies and Estimates – Depreciation" herein for additional information regarding the Company's ongoing review of depreciation estimates. See also Note 1 to the financial statements under "Depreciation" for additional information.
Interest Expense, Net of Amounts Capitalized
In 2013, interest expense, net of amounts capitalized increased $12.0 million (19.2%) compared to 2012. The increase was primarily due to a $19.1 million decrease in capitalized interest resulting from the completion of Plants Nacogdoches and Cleveland in 2012, partially offset by a $9.2 million increase in capitalized interest associated with the construction of Plants Spectrum and Campo Verde in 2013.
In 2012, interest expense, net of amounts capitalized decreased $14.8 million (19.2%) compared to 2011. The decrease was primarily due to a $13.7 million expense reduction associated with the refinancing of $575 million in long-term debt in December 2011 and a $1.1 million increase in capitalized interest associated with the construction of Plants Nacogdoches and Cleveland.
Other Income (Expense), Net
In 2013, other income (expense), net decreased $3.1 million compared to 2012. The decrease in 2013 was primarily due to increased earnings of STR, which resulted in a larger allocation of earnings to noncontrolling interest. The increase in 2012 was immaterial.
Income Taxes
In 2013, income taxes decreased $46.7 million (50.4%) compared to 2012. The decrease was primarily due to a $24.2 million increase in tax benefits from ITCs for solar plants placed in service in 2013 and a $20.9 million decrease associated with lower pre-tax earnings.
In 2012, income taxes increased $16.7 million (22.1%) compared to 2011. The increase was primarily due to an $11.9 million increase associated with higher pre-tax earnings and a $9.3 million increase in Alabama state income taxes due to a decrease in the state income tax deduction for federal income taxes paid, partially offset by a $2.2 million decrease due to the conclusion of prior year Internal Revenue Service (IRS) audits and a $1.7 million increase in tax benefits from ITCs compared to 2011.
II-442
MANAGEMENT'S DISCUSSION AND ANALYSIS (continued)
Southern Power Company and Subsidiary Companies 2013 Annual Report
See Note 5 to the financial statements under "Effective Tax Rate" for additional information.
Effects of Inflation
The Company is party to long-term contracts reflecting market-based rates, including inflation expectations. Any adverse effect of inflation on the Company's results of operations has not been substantial in recent years.
FUTURE EARNINGS POTENTIAL
General
The results of operations for the past three years are not necessarily indicative of future earnings potential. The level of the Company's future earnings depends on numerous factors that affect the opportunities, challenges, and risks of the Company's competitive wholesale business. These factors include: the Company's ability to achieve sales growth while containing costs; regulatory matters; creditworthiness of customers; total generating capacity available in the Company's target market areas; the successful remarketing of capacity as current contracts expire; and the Company's ability to execute its acquisition and value creation strategy and to construct generating facilities.
Other factors that could influence future earnings include weather, demand, cost of generating units within the Power Pool, and operational limitations.
Power Sales Agreements
The Company's sales are primarily through long-term PPAs. The Company is working to maintain and expand its share of the wholesale market. The Company expects that additional demand for capacity will begin to develop within some of its existing market areas beginning in the 2014-2016 timeframe.
The Company's PPAs consist of two types of agreements. The first type, referred to as a unit or block sale, is a customer purchase from a dedicated plant unit where all or a portion of the generation from that unit is reserved for that customer. The Company typically has the ability to serve the unit or block sale customer from an alternate resource. The second type, referred to as requirements service, provides that the Company serve the customer's capacity and energy requirements from a combination of the customer's own generating units and from Company resources not dedicated to serve unit or block sales. The Company has rights to purchase power provided by the requirements customers' resources when economically viable.
II-443
MANAGEMENT'S DISCUSSION AND ANALYSIS (continued)
Southern Power Company and Subsidiary Companies 2013 Annual Report
The Company has assumed/entered into the following PPAs over the past three years:
|
Date
|
MWs
|
Plant
|
Contract Term
|
|
|
2013
|
||||
|
San Diego Gas & Electric Company
|
April 2013
|
139
|
Campo Verde
|
10/13-10/33
|
|
Cobb Electric Membership Corporation (EMC)
(a)
|
September 2013
|
108
(b)
|
Unassigned
|
1/14-12/15
|
|
Duke Energy Florida, Inc.
|
September 2013
|
434
|
Franklin
|
6/16-5/21
|
|
2012
|
||||
|
Nevada Power Company
|
June 2012
|
20
|
Apex
|
7/12-12/37
|
|
Jackson EMC
|
September 2012
|
65
(c)
|
Franklin
|
1/16-12/35
|
|
GreyStone Power Corporation
|
September 2012
|
40
(c)
|
Franklin
|
1/16-12/35
|
|
Nevada Power Company
|
September 2012
|
30
|
Spectrum
|
6/13-12/38
|
|
Progress Energy Carolinas, Inc.
|
October 2012
|
2.5
|
Granville
|
10/12-10/32
|
|
Cobb EMC
|
December 2012
|
100
|
Franklin
|
1/16-12/22
|
|
Cobb EMC
|
December 2012
|
225
|
Dahlberg
|
1/16-12/22
|
|
Cobb EMC
|
December 2012
|
108
(b)
|
Unassigned
|
1/16-12/22
|
|
2011
|
||||
|
Georgia Power Company
|
June 2011
|
75
|
Dahlberg
|
1/15-5/30
|
|
Georgia Power Company
|
June 2011
|
625
|
Harris
(d)
|
6/15-5/30
|
|
Georgia Power Company
|
June 2011
|
298
|
Addison
|
1/15-5/30
|
|
Morgan Stanley Capital Group
|
August 2011
|
250
|
Franklin
|
1/16-12/25
|
|
Tampa Electric Company
|
December 2011
|
160
|
Oleander
|
1/13-12/15
|
|
(a)
|
Bridge agreement for requirements service agreement effective January 1, 2016.
|
|
(b)
|
Represents estimated average annual capacity purchases.
|
|
(c)
|
Includes an option which expires on February 28, 2014 to reduce the amount by 5 MWs.
|
|
(d)
|
This agreement is contracted with Plant Franklin from June 2015 through December 2015.
|
The Company has PPAs with some of Southern Company's traditional operating companies, other investor owned utilities, independent power producers, municipalities, electric cooperatives, and an energy marketing firm. Although some of the Company's PPAs are with the traditional operating companies, the Company's generating facilities are not in the traditional operating companies' regulated rate bases, and the Company is not able to seek recovery from the traditional operating companies' ratepayers for construction, repair, environmental, or maintenance costs. The Company expects that the capacity payments in the PPAs will produce sufficient cash flows to cover costs, pay debt service, and provide an equity return. However, the Company's overall profit will depend on numerous factors, including efficient operation of its generating facilities and demand under the Company's PPAs.
As a general matter, existing PPAs provide that the purchasers are responsible for either procuring the fuel or reimbursing the Company for the cost of fuel relating to the energy delivered under such PPAs. To the extent a particular generating facility does not meet the operational requirements contemplated in the PPAs, the Company may be responsible for excess fuel costs. With respect to fuel transportation risk, most of the Company's PPAs provide that the counterparties are responsible for transporting the fuel to the particular generating facility.
Fixed and variable operation and maintenance costs will be recovered through capacity charges based on dollars-per-kilowatt year or energy charges based on dollars-per-MW hour. In general, the Company has long-term service contracts with General Electric International, Inc., Siemens Electric, Inc., First Solar, Inc., and NVT Licenses, LLC to reduce its exposure to certain operation and maintenance costs relating to such vendors' applicable equipment.
Many of the Company's PPAs have provisions that require the posting of collateral or an acceptable substitute guarantee in the event that Standard & Poor's Rating Services, a division of The McGraw Hill Companies, Inc. (S&P) or Moody's Investors Service, Inc. (Moody's) downgrades the credit ratings of the counterparty to an unacceptable credit rating or if the counterparty is
II-444
MANAGEMENT'S DISCUSSION AND ANALYSIS (continued)
Southern Power Company and Subsidiary Companies 2013 Annual Report
not rated or fails to maintain a minimum coverage ratio. The PPAs are expected to provide the Company with a stable source of revenue during their respective terms.
The Company has entered into long-term power sales agreements for an average of 79% of its available capacity for the next five years and 70% of its available capacity for the next 10 years.
Environmental Matters
The Company's operations are subject to extensive regulation by state and federal environmental agencies under a variety of statutes and regulations governing environmental media, including air, water, and land resources. Applicable statutes include the Clean Air Act; the Clean Water Act; the Comprehensive Environmental Response, Compensation, and Liability Act; the Resource Conservation and Recovery Act; the Toxic Substances Control Act; the Emergency Planning & Community Right-to-Know Act; the Endangered Species Act; and related federal and state regulations. Compliance with possible additional federal or state legislation or regulations related to global climate change, air quality, water quality, or other environmental and health concerns could also significantly affect the Company.
New environmental legislation or regulations, such as requirements related to greenhouse gases or changes to existing statutes or regulations, could affect many areas of the Company's operations. While the Company's PPAs generally contain provisions that permit charging the counterparty with some of the new costs incurred as a result of changes in environmental laws and regulations, the full impact of any such regulatory or legislative changes cannot be determined at this time.
Because the Company's units are newer gas-fired and renewable generating facilities, costs associated with environmental compliance for these facilities have been less significant than for similarly situated coal-fired generating facilities or older gas-fired generating facilities. Environmental, natural resource, and land use concerns, including the applicability of air quality limitations, the availability of water withdrawal rights, uncertainties regarding aesthetic impacts such as increased light or noise, and concerns about potential adverse health impacts can, however, increase the cost of siting and operating any type of future electric generating facility. The impact of such statutes and regulations on the Company cannot be determined at this time.
Environmental Statutes and Regulations
Air Quality
Each of the states in which the Company has fossil generation is subject to the requirements of the Clean Air Interstate Rule (CAIR), which calls for phased reductions in sulfur dioxide and nitrogen oxide emissions from power plants in 28 eastern states. In 2008, the U.S. Court of Appeals for the District of Columbia Circuit issued decisions invalidating CAIR, but left CAIR compliance requirements in place while the U.S. Environmental Protection Agency (EPA) developed a new rule. In 2011, the EPA promulgated the Cross State Air Pollution Rule (CSAPR) to replace CAIR. However, in August 2012, the U.S. Court of Appeals for the District of Columbia Circuit vacated CSAPR in its entirety and directed the EPA to continue to administer CAIR pending the EPA's development of a valid replacement. Review of the U.S. Court of Appeals for the District of Columbia Circuit's decision regarding CSAPR is currently pending before the U.S. Supreme Court.
In August 2012, the EPA published proposed revisions to the New Source Performance Standard (NSPS) for Stationary Combustion Turbines (CTs). If finalized as proposed, the revisions would apply the NSPS to all new, reconstructed, and modified CTs (including CTs at combined cycle units), during all periods of operation, including startup and shutdown, and alter the criteria for determining when an existing CT has been reconstructed.
On February 12, 2013, the EPA proposed a rule that would require certain states to revise the provisions of their State Implementation Plans (SIPs) relating to the regulation of excess emissions at industrial facilities, including fossil fuel-fired generating facilities, during periods of startup, shut-down, or malfunction (SSM). The EPA proposes a determination that the SSM provisions in the SIPs for 36 states (including Alabama, Florida, Georgia, and North Carolina) do not meet the requirements of the Clean Air Act and must be revised within 18 months of the date on which the EPA publishes the final rule. The EPA has entered into a settlement agreement requiring it to finalize the rule by June 12, 2014.
The Company has developed and continually updates a comprehensive environmental compliance strategy to assess compliance obligations associated with the current and proposed environmental requirements discussed above. The impacts of the CAIR and any future replacement rule, the NSPS for CTs, and the SSM rule on the Company cannot be determined at this time and will depend on the specific provisions of recently finalized and future rules, the resolution of pending and future legal challenges, and the development and implementation of rules at the state level. These regulations could result in additional compliance costs that could affect results of operations, cash flows, and financial condition if such costs are not recovered through PPAs. Further, higher costs that are recovered through regulated rates at other utilities could contribute to reduced demand for electricity, which could negatively impact results of operations, cash flows, and financial condition.
II-445
MANAGEMENT'S DISCUSSION AND ANALYSIS (continued)
Southern Power Company and Subsidiary Companies 2013 Annual Report
Water Quality
In 2011, the EPA published a proposed rule that establishes standards for reducing effects on fish and other aquatic life caused by cooling water intake structures at existing power plants and manufacturing facilities. The rule also addresses cooling water intake structures for new units at existing facilities. Compliance with the proposed rule could require changes to existing cooling water intake structures at certain of the Company's generating facilities, and new generating units constructed at existing plants would be required to install closed cycle cooling towers. The EPA is required to issue a final rule by April 17, 2014.
On June 7, 2013, the EPA published a proposed rule which requested comments on a range of potential regulatory options for addressing certain wastestreams from steam electric power plants. These regulations could result in the installation of additional controls at certain of the facilities of the Company, which could result in significant capital expenditures and compliance costs that could affect future unit retirement and replacement decisions, depending on the specific technology requirements of the final rule.
The impact of these proposed rules cannot be determined at this time and will depend on the specific provisions of the final rules and the outcome of any legal challenges. These regulations could result in additional capital expenditures and compliance costs. Also, results of operations, cash flows, and financial condition could be impacted if such costs are not recovered through PPAs. Based on a preliminary assessment of the impact of the proposed rules, the Company estimates compliance costs to be immaterial. Further, higher costs that are recovered through regulated rates at other utilities could contribute to reduced demand for electricity, which could negatively impact results of operations, cash flows, and financial condition.
Global Climate Issues
The EPA currently regulates greenhouse gases under the Prevention of Significant Deterioration and Title V operating permit programs of the Clean Air Act. The legal basis for these regulations is currently being challenged in the U.S. Supreme Court. In addition, over the past several years, the U.S. Congress has considered many proposals to reduce greenhouse gas emissions, mandate renewable or clean energy, and impose energy efficiency standards. Such proposals are expected to continue to be considered by the U.S. Congress. International climate change negotiations under the United Nations Framework Convention on Climate Change are also continuing.
On January 8, 2014, the EPA published re-proposed regulations to establish standards of performance for greenhouse gas emissions from new fossil fuel steam electric generating units. A Presidential memorandum issued on June 25, 2013 also directs the EPA to propose standards, regulations, or guidelines for addressing modified, reconstructed, and existing steam electric generating units by June 1, 2014.
Although the outcome of any federal, state, and international initiatives, including the EPA's proposed regulations and guidelines discussed above, will depend on the scope and specific requirements of the proposed and final rules and the outcome of any legal challenges and, therefore, cannot be determined at this time, additional restrictions on the Company's greenhouse gas emissions at the federal or state level could result in additional compliance costs, including capital expenditures. Such costs could affect results of operations, cash flows, and financial condition if they are not recovered through PPAs. Further, higher costs that are recovered through regulated rates at other utilities could contribute to reduced demand for electricity, which could also negatively impact the Company's results of operations, cash flows, and financial condition.
The EPA's greenhouse gas reporting rule requires annual reporting of carbon dioxide equivalent emissions in metric tons for a company's operational control of facilities. Based on ownership or financial control of facilities, the Company's 2012 greenhouse gas emissions were approximately 11.4 million metric tons of carbon dioxide equivalent. The preliminary estimate of the Company's 2013 greenhouse gas emissions on the same basis is approximately 9.0 million metric tons of carbon dioxide equivalent. The level of greenhouse gas emissions from year to year will depend on the level of generation and mix of fuel sources and other factors.
Income Tax Matters
Investment Tax Credits
In 2009, President Obama signed into law the American Recovery and Reinvestment Act of 2009 (ARRA). Major tax incentives in the ARRA included renewable energy incentives. On January 2, 2013, the American Taxpayer Relief Act of 2012 (ATRA) was signed into law. The ATRA retroactively extended several renewable energy incentives through 2013, including extending ITCs for biomass projects which began construction before January 1, 2014. The Company received such ITCs related to Plants Cimarron, Nacogdoches, Apex, Granville, Campo Verde, and Spectrum, which have had a material impact on cash flows and net income. See Note 1 to the financial statements under "Income and Other Taxes" and Note 5 to the financial statements under "Effective Tax Rate" for additional information.
II-446
MANAGEMENT'S DISCUSSION AND ANALYSIS (continued)
Southern Power Company and Subsidiary Companies 2013 Annual Report
Bonus Depreciation
The ATRA retroactively extended
50%
bonus depreciation for property placed in service in 2013 (and for certain long-term production-period projects to be placed in service in 2014). The extension of
50%
bonus depreciation had a positive impact of $98.9 million on the Company’s cash flows in 2013. There is no benefit to the Company expected for 2014.
Acquisitions
Adobe Solar, LLC
On August 27, 2013, the Company and TRE, through STR, entered into a purchase agreement with Sun Edison, LLC, the developer of the project, which provides for the acquisition of all of the outstanding membership interests of Adobe Solar, LLC (Adobe) by STR. Adobe is constructing an approximately 20-MW solar generating facility in Kern County, California. The solar facility is expected to begin commercial operation in spring 2014. The Company's purchase of Adobe for approximately $100 million is expected to occur in spring 2014. The output of the plant is contracted under a 20-year PPA with Southern California Edison. See Note 2 to the financial statements for additional information.
Campo Verde Solar, LLC
On April 23, 2013, the Company and TRE, through STR, acquired all of the outstanding membership interests of Campo Verde from First Solar, Inc., the developer of the project. Campo Verde constructed and owns an approximately 139-MW solar photovoltaic facility in Southern California. The solar facility began commercial operation on October 25, 2013. The output of the plant is contracted under a 20-year PPA with San Diego Gas & Electric Company, a subsidiary of Sempra Energy. See Note 2 to the financial statements for additional information.
Other Matters
The Company is involved in various other matters being litigated and regulatory matters that could affect future earnings. In addition, the Company is subject to certain claims and legal actions arising in the ordinary course of business. The Company's business activities are subject to extensive governmental regulation related to public health and the environment, such as regulation of air emissions and water discharges. Litigation over environmental issues and claims of various types, including property damage, personal injury, common law nuisance, and citizen enforcement of environmental requirements such as air quality and water standards, has increased generally throughout the U.S. In particular, personal injury, property damage, and other claims for damages alleged to have been caused by carbon dioxide and other emissions and alleged exposure to hazardous materials, and/or requests for injunctive relief in connection with such matters, have become more frequent.
The ultimate outcome of such pending or potential litigation against the Company cannot be predicted at this time; however, for current proceedings not specifically reported herein, management does not anticipate that the ultimate liabilities, if any, arising from such current proceedings would have a material effect on the Company's financial statements.
ACCOUNTING POLICIES
Application of Critical Accounting Policies and Estimates
The Company prepares its consolidated financial statements in accordance with generally accepted accounting principles (GAAP). Significant accounting policies are described in Note 1 to the financial statements. In the application of these policies, certain estimates are made that may have a material impact on the Company's results of operations and related disclosures. Different assumptions and measurements could produce estimates that are significantly different from those recorded in the financial statements. Senior management has reviewed and discussed the following critical accounting policies and estimates with the Audit Committee of Southern Company's Board of Directors.
Revenue Recognition
The Company's revenue recognition depends on appropriate classification and documentation of transactions in accordance with GAAP. In general, the Company's power sale transactions can be classified in one of four categories: leases, non-derivatives or normal sale derivatives, derivatives designated as cash flow hedges, and derivatives not designated as hedges. For more information on derivative transactions, see FINANCIAL CONDITION AND LIQUIDITY – "Market Price Risk" herein and Notes 1 and 9 to the financial statements. The Company's revenues are dependent upon significant judgments used to determine the appropriate transaction classification, which must be documented upon the inception of each contract.
II-447
MANAGEMENT'S DISCUSSION AND ANALYSIS (continued)
Southern Power Company and Subsidiary Companies 2013 Annual Report
Lease Transactions
The Company considers the following factors to determine whether the sales contract is a lease:
|
•
|
Assessing whether specific property is explicitly or implicitly identified in the agreement;
|
|
•
|
Determining whether the fulfillment of the arrangement is dependent on the use of the identified property; and
|
|
•
|
Assessing whether the arrangement conveys to the purchaser the right to use the identified property.
|
If the contract meets the above criteria for a lease, the Company performs further analysis as to whether the lease is classified as operating or capital. All of the Company's power sales contracts classified as leases are accounted for as operating leases and revenue is recognized on a straight-line basis over the term of the contract.
Non-Derivative and Normal Sale Derivative Transactions
If the power sales contract is not classified as a lease, the Company further considers the following factors to determine proper classification:
|
•
|
Assessing whether the contract meets the definition of a derivative;
|
|
•
|
Assessing whether the contract meets the definition of a capacity contract;
|
|
•
|
Assessing the probability at inception and throughout the term of the individual contract that the contract will result in physical delivery; and
|
|
•
|
Ensuring that the contract quantities do not exceed available generating capacity (including purchased capacity).
|
Contracts that do not meet the definition of a derivative or are designated as normal sales (i.e. capacity contracts which provide for the sale of electricity that involve physical delivery in quantities within the Company's available generating capacity) are accounted for as executory contracts. The related capacity revenue is recognized on an accrual basis in amounts equal to the lesser of the cumulative levelized amount or the cumulative amount billable under the contract over the respective contract periods. Revenues are recorded on a gross basis in accordance with GAAP. Contracts recorded on the accrual basis represented the majority of the Company's operating revenues for the years ended December 31,
2013
,
2012
, and
2011
.
Cash Flow Hedge Transactions
The Company further considers the following in designating other derivative contracts for the sale of electricity as cash flow hedges of anticipated sale transactions:
|
•
|
Identifying the hedging instrument, the hedged transaction, and the nature of the risk being hedged; and
|
|
•
|
Assessing hedge effectiveness at inception and throughout the contract term.
|
These contracts are accounted for on a fair value basis and are marked to market through accumulated other comprehensive income (AOCI) over the life of the contract. Realized gains and losses are then recognized in revenues as incurred.
Mark-to-Market Transactions
Contracts for sales and purchases of electricity, which meet the definition of a derivative and that either do not qualify or are not designated as normal sales or as cash flow hedges, are accounted for on a fair value basis and are marked-to-market directly through net income.
Impairment of Long Lived Assets and Intangibles
The Company's investments in long-lived assets are primarily generation assets, whether in service or under construction. The Company's intangible assets consist of acquired PPAs that are amortized over the term of the PPAs and goodwill resulting from acquisitions. The Company evaluates the carrying value of these assets in accordance with accounting standards whenever indicators of potential impairment exist, or annually in the case of goodwill. Examples of impairment indicators could include significant changes in construction schedules, current period losses combined with a history of losses or a projection of continuing losses, a significant decrease in market prices, and the inability to remarket generating capacity for an extended period. If an indicator exists, the asset is tested for recoverability by comparing the asset carrying value to the sum of the undiscounted expected future cash flows directly attributable to the asset. If the estimate of undiscounted future cash flows is less than the carrying value of the asset, the fair value of the asset is determined and a loss is recorded. A high degree of judgment is required in developing estimates related to these evaluations, which are based on projections of various factors, including the following:
|
•
|
Future demand for electricity based on projections of economic growth and estimates of available generating capacity;
|
|
•
|
Future power and natural gas prices, which have been quite volatile in recent years; and
|
II-448
MANAGEMENT'S DISCUSSION AND ANALYSIS (continued)
Southern Power Company and Subsidiary Companies 2013 Annual Report
|
•
|
Future operating costs.
|
Acquisition Accounting
The Company acquires generation assets as part of its overall growth strategy. The Company accounts for business acquisitions from non-affiliates as business combinations. Accordingly, the Company has included these operations in the consolidated financial statements from the respective date of acquisition. The purchase price, including contingent consideration, if any, of each acquisition was allocated based on the fair value of the identifiable assets and liabilities. Assets acquired that do not meet the definition of a business in accordance with GAAP are accounted for as asset acquisitions. The purchase price of each asset acquisition was allocated based on the relative fair value of assets acquired. Any due diligence or transition costs incurred by the Company for successful or potential acquisitions have been expensed as incurred.
Depreciation
Depreciation of the original cost of assets is computed under the straight-line method and applies a composite depreciation rate based on the assets' estimated useful lives determined by management. The primary assets in property, plant, and equipment are power plants, which have estimated composite lives ranging from
18
to
34
years. These lives reflect a weighted average of the significant components (retirement units) that make up the plants. Key judgments impacting the estimated lives of component parts include estimates of run-hours and starts which can impact the future utility of these components. The Company reviews its estimated useful lives and salvage values on an ongoing basis. The results of these reviews could result in changes which could have a material impact on net income in the near term.
When property subject to composite depreciation is retired or otherwise disposed of in the normal course of business, its cost is charged to accumulated depreciation. For other property dispositions, the applicable cost and accumulated depreciation is removed from the accounts and a gain or loss is recognized.
Beginning in 2014, the Company changed to component depreciation. Certain generation assets will be depreciated on a units-of-production basis to better match outage and maintenance costs to the usage of and revenues from these assets. The difference in depreciation expense under this method is not expected to have a material impact on the financial statements.
Investment Tax Credits
Under the ARRA and ATRA, certain construction costs related to renewable generating assets are eligible for ITCs. A high degree of judgment is required in determining which construction expenditures qualify for ITCs. See Note 1 to the financial statements under "Income and Other Taxes" for additional information.
FINANCIAL CONDITION AND LIQUIDITY
Overview
The Company's financial condition remained stable at
December 31, 2013
. The Company intends to continue to monitor its access to short-term and long-term capital markets as well as its bank credit arrangements as needed to meet its future capital and liquidity needs. See "Sources of Capital" herein for additional information on lines of credit.
Net cash provided from operating activities totaled $604.4 million in 2013, an increase of $31.2 million as compared to 2012. This increase was primarily due to an increase in cash received from ITCs. Net cash provided from operating activities totaled $573.1 million in 2012, an increase of $160.8 million compared to 2011. This increase was primarily due to an increase in tax deductions associated with bonus depreciation, partially offset by a decrease in cash received for ITCs and the loss on the extinguishment of debt in 2011.
Net cash used for investing activities totaled $696.0 million, $332.5 million, and $328.4 million in 2013, 2012, and 2011, respectively. Net cash used for investing activities in 2013 was primarily due to the Campo Verde acquisition and Plants Spectrum and Campo Verde construction. Net cash used for investing activities in 2012 was primarily due to the Apex, Spectrum, and Granville acquisitions, construction of Plants Nacogdoches and Cleveland, and payments pursuant to long-term service agreements. Net cash used for investing activities in 2011 was primarily due to construction of Plants Nacogdoches and Cleveland.
Net cash provided from financing activities totaled $131.8 million in 2013. Net cash used for financing activities totaled $229.0 million and $81.3 million in 2012 and 2011, respectively. Net cash provided from financing activities in 2013 was primarily the result of the issuance of new senior notes. Net cash used for financing activities in 2012 was primarily due to payment of common stock dividends and a decrease in notes payable. Net cash used for financing activities in 2011 was primarily due to a decrease in
II-449
MANAGEMENT'S DISCUSSION AND ANALYSIS (continued)
Southern Power Company and Subsidiary Companies 2013 Annual Report
notes payable. Fluctuations in cash flow from financing activities vary year to year based on capital needs and the maturity or redemption of securities.
Significant asset changes in the balance sheet during
2013
include an increase in property, plant, and equipment, primarily due to the Campo Verde acquisition and the construction of Plants Spectrum and Campo Verde.
Significant liability and stockholder's equity changes in the balance sheet during
2013
include an increase in long-term debt due to the senior note issuance and an increase in accumulated deferred income taxes and deferred ITCs related to Plants Spectrum and Campo Verde.
Sources of Capital
The Company may use operating cash flows, external funds, or equity capital or loans from Southern Company to finance any new projects, acquisitions, and ongoing capital requirements. The Company expects to generate external funds from the issuance of unsecured senior debt and commercial paper or utilization of credit arrangements from banks. However, the amount, type, and timing of any future financings, if needed, will depend upon prevailing market conditions, regulatory approval, and other factors.
The issuance of securities by Southern Power Company is subject to regulatory approval by the FERC. Additionally, with respect to the public offering of securities, Southern Power Company files registration statements with the U.S. Securities and Exchange Commission (SEC) under the Securities Act of 1933, as amended (1933 Act). The amounts of securities authorized by the FERC, as well as the amounts registered under the 1933 Act, are continuously monitored and appropriate filings are made to ensure flexibility in the capital markets.
The Company's current liabilities frequently exceed current assets due to the use of short-term debt as a funding source, as well as cash needs, which can fluctuate significantly due to the seasonality of the business.
To meet liquidity and capital resource requirements, Southern Power Company had at
December 31, 2013
cash and cash equivalents of approximately $68.7 million and a committed credit facility of $500 million (Facility) expiring in 2018. As of
December 31, 2013
, the total amount available under the Facility was $500 million. The Facility does not contain a material adverse change clause applicable to borrowing. Southern Power Company plans to renew the Facility prior to its expiration.
The Facility contains a covenant that limits the ratio of debt to capitalization (each as defined in the Facility) to a maximum of 65% and contains a cross default provision that is restricted only to indebtedness of the Company. Southern Power Company is currently in compliance with all covenants in the Facility.
Proceeds from the Facility may be used for working capital and general corporate purposes as well as liquidity support for the Company's commercial paper program. See Note 6 to the financial statements under "Bank Credit Arrangements" for additional information.
The Company's commercial paper program is used to finance acquisition and construction costs related to electric generating facilities and for general corporate purposes.
Details of short-term borrowings were as follows:
|
Commercial Paper at the
End of the Period
|
Commercial Paper During the Period
(a)
|
||||||||||||||||
|
Amount Outstanding
|
Weighted Average Interest Rate
|
Average Outstanding
|
Weighted Average Interest Rate
|
Maximum Amount Outstanding
|
|||||||||||||
|
(in millions)
|
(in millions)
|
(in millions)
|
|||||||||||||||
|
December 31, 2013:
|
$
|
—
|
|
N/A
|
|
$
|
117
|
|
0.4
|
%
|
$
|
271
|
|
||||
|
December 31, 2012:
|
$
|
71
|
|
0.5
|
%
|
$
|
170
|
|
0.5
|
%
|
$
|
309
|
|
||||
|
December 31, 2011:
|
$
|
180
|
|
0.5
|
%
|
$
|
175
|
|
0.4
|
%
|
$
|
305
|
|
||||
|
(a)
|
Average and maximum amounts are based upon daily balances during the twelve-month periods ended December 31, 2013, 2012, and 2011.
|
Management believes that the need for working capital can be adequately met by utilizing the commercial paper program, the line of credit, and cash.
Financing Activities
During
2013
, the Company prepaid $9.3 million on a long-term debt payable to TRE and issued an aggregate $4.2 million due September 30, 2032 and $19.4 million due April 30, 2033 under promissory notes to TRE related to the financing of Plants Spectrum and Campo Verde, respectively.
II-450
MANAGEMENT'S DISCUSSION AND ANALYSIS (continued)
Southern Power Company and Subsidiary Companies 2013 Annual Report
In July 2013, Southern Power Company issued $300 million aggregate principal amount of its Series 2013A 5.25% Senior Notes due July 15, 2043. The net proceeds from the sale of the Series 2013A Senior Notes were used to repay a portion of its outstanding short-term indebtedness and for other general corporate purposes, including the Company’s continuous construction program.
In addition to any financings that may be necessary to meet capital requirements and contractual obligations, Southern Power Company plans to continue, when economically feasible, a program to retire higher-cost securities and replace these obligations with lower-cost capital if market conditions permit.
Credit Rating Risk
The Company does not have any credit arrangements that would require material changes in payment schedules or terminations as a result of a credit rating downgrade. There are certain contracts that could require collateral, but not accelerated payment, in the event of a credit rating change to BBB and Baa2, or BBB- and/or Baa3 or below. These contracts are for physical electricity purchases and sales, fuel transportation and storage, and energy price risk management.
The maximum potential collateral requirements under these contracts at
December 31, 2013
were as follows:
|
Credit Ratings
|
Maximum Potential Collateral Requirements
|
||
|
|
(in millions)
|
||
|
At BBB and Baa2
|
$
|
9
|
|
|
At BBB- and/or Baa3
|
314
|
|
|
|
Below BBB- and/or Baa3
|
1,004
|
|
|
Included in these amounts are certain agreements that could require collateral in the event that one or more Power Pool participants has a credit rating change to below investment grade. Generally, collateral may be provided by a Southern Company guaranty, letter of credit, or cash. Additionally, any credit rating downgrade could impact the Company's ability to access capital markets, particularly the short-term debt market.
In addition, through the acquisition of Plant Rowan, the Company assumed a PPA with North Carolina Municipal Power Agency No. 1 that could require collateral, but not accelerated payment, in the event of a downgrade of Southern Power Company's credit. The PPA requires credit assurances without stating a specific credit rating. The amount of collateral required would depend upon actual losses, if any, resulting from a credit downgrade.
Market Price Risk
The Company is exposed to market risks, primarily commodity price risk and interest rate risk. To manage the volatility attributable to these exposures, the Company nets its exposures, where possible, to take advantage of natural offsets and enters into various derivative transactions for the remaining exposures pursuant to the Company's policies in areas such as counterparty exposure and risk management practices. The Company's policy is that derivatives are to be used primarily for hedging purposes and mandates strict adherence to all applicable risk management policies. Derivative positions are monitored using techniques including, but not limited to, market valuation, value at risk, stress testing, and sensitivity analysis. Derivative instruments are recognized at fair value in the balance sheets as either assets or liabilities and are presented on a gross basis. In the statements of cash flows, the cash impacts of settled energy-related and interest rate derivatives are recorded as operating activities.
At
December 31, 2013
, the Company had $17.8 million of long-term variable debt outstanding. The effect on annualized interest expense related to long-term debt if the Company sustained a 100 basis point change in interest rates is immaterial. Since a significant portion of outstanding indebtedness bears interest at fixed rates, the Company is not aware of any facts or circumstances that would significantly affect exposure on existing indebtedness in the near term. However, the impact on future financing costs cannot be determined at this time.
Because energy from the Company's facilities is primarily sold under long-term PPAs with tolling agreements and provisions shifting substantially all of the responsibility for fuel cost to the counterparties, the Company's exposure to market volatility in commodity fuel prices and prices of electricity is generally limited. However, the Company has been and may continue to be exposed to market volatility in energy-related commodity prices as a result of uncontracted generating capacity.
II-451
MANAGEMENT'S DISCUSSION AND ANALYSIS (continued)
Southern Power Company and Subsidiary Companies 2013 Annual Report
The changes in fair value of energy-related derivative contracts associated with both power and natural gas positions, none of which are designated as hedges, for the years ended December 31 were as follows:
|
2013
Changes
|
2012
Changes
|
||||||
|
Fair Value
|
|||||||
|
(in millions)
|
|||||||
|
Contracts outstanding at the beginning of the period, assets (liabilities), net
|
$
|
0.8
|
|
$
|
(9.2
|
)
|
|
|
Contracts realized or settled
|
(0.8
|
)
|
15.6
|
|
|||
|
Current period changes
(a)
|
—
|
|
(5.6
|
)
|
|||
|
Contracts outstanding at the end of the period, assets (liabilities), net
|
$
|
—
|
|
$
|
0.8
|
|
|
|
(a)
|
Current period changes also include changes in the fair value of new contracts entered into during the period, if any.
|
The changes in contracts outstanding were attributable to both the volume and the prices of power and natural gas as follows:
|
December 31,
2013 |
December 31,
2012 |
||||||
|
Power – net purchased or (sold)
|
|||||||
|
Megawatt hours (MWH) (in millions)
|
0.2
|
|
—
|
|
|||
|
Weighted average contract cost per MWH above (below) market prices (in dollars)
|
$
|
(2.22
|
)
|
$
|
—
|
|
|
|
Natural gas net purchased
|
|||||||
|
Commodity – million British thermal unit (mmBtu)
|
1.6
|
|
5.0
|
|
|||
|
Commodity – weighted average contract cost per mmBtu above (below) market prices (in dollars)
|
$
|
(0.08
|
)
|
$
|
(0.02
|
)
|
|
At December 31, 2013 and 2012, the net fair value of energy-related derivative contracts were not material. For the Company's energy-related derivatives not designated as hedging instruments, a substantial portion of the pre-tax realized and unrealized gains and losses is associated with hedging fuel price risk of certain PPA customers and has no impact on net income or on fuel expense as presented in the Company's statements of income. As a result, for the years ended December 31,
2013
,
2012
, and
2011
, the pre-tax effects of energy-related derivatives not designated as hedging instruments on the Company's statements of income were not material. This third party hedging activity has been discontinued.
Gains and losses on energy-related derivatives designated as cash flow hedges which are used by the Company to hedge anticipated purchases and sales are initially deferred in other comprehensive income before being recognized in income in the same period as the hedged transactions are reflected in earnings. Gains and losses on energy-related derivative contracts that are not designated or fail to qualify as hedges are recognized in the statements of income as incurred.
The Company uses over-the-counter contracts that are not exchange traded but are fair valued using prices which are market observable, and thus fall into Level 2. See Note 8 to the financial statements for further discussion of fair value measurements. The maturities of the energy-related derivative contracts, which are all Level 2 of the fair value hierarchy, at
December 31, 2013
were as follows:
|
Fair Value Measurements
December 31, 2013
|
|||||||||||||||
|
Total
|
Maturity
|
||||||||||||||
|
Fair Value
|
Year 1
|
Years 2&3
|
Years 4&5
|
||||||||||||
|
(in millions)
|
|||||||||||||||
|
Level 1
|
$
|
—
|
|
$
|
—
|
|
$
|
—
|
|
$
|
—
|
|
|||
|
Level 2
|
—
|
|
(0.4
|
)
|
0.2
|
|
0.2
|
|
|||||||
|
Level 3
|
—
|
|
—
|
|
—
|
|
—
|
|
|||||||
|
Fair value of contracts outstanding at end of period
|
$
|
—
|
|
$
|
(0.4
|
)
|
$
|
0.2
|
|
$
|
0.2
|
|
|||
The Company is exposed to losses related to financial instruments in the event of counterparties’ nonperformance. The Company only enters into agreements and material transactions with counterparties that have investment grade credit ratings by S&P and Moody's or with counterparties who have posted collateral to cover potential credit exposure. The Company has also established
II-452
MANAGEMENT'S DISCUSSION AND ANALYSIS (continued)
Southern Power Company and Subsidiary Companies 2013 Annual Report
risk management policies and controls to determine and monitor the creditworthiness of counterparties in order to mitigate the Company’s exposure to counterparty credit risk. Therefore, the Company does not anticipate a material adverse effect on the financial statements as a result of counterparty nonperformance. See Note 1 to the financial statements under "Financial Instruments" and Note 9 to the financial statements for additional information.
Capital Requirements and Contractual Obligations
The capital program of the Company is currently estimated to be $477.0 million for
2014
, $638.0 million for
2015
, and $714.0 million for
2016
. The construction program is subject to periodic review and revision. These amounts include estimates for potential plant acquisitions and new construction as well as ongoing capital improvements and work to be performed under long-term service agreements. Planned expenditures for plant acquisitions may vary due to market opportunities and the Company's ability to execute its growth strategy. Actual construction costs may vary from these estimates because of changes in factors such as: business conditions; environmental statutes and regulations; FERC rules and regulations; load projections; legislation; the cost and efficiency of construction labor, equipment, and materials; project scope and design changes; and the cost of capital.
In addition, pursuant to an agreement with TRE, on or after November 25, 2015, TRE may require the Company to purchase its noncontrolling interest in STR at fair market value.
Other funding requirements related to obligations associated with scheduled maturities of long-term debt, as well as the related interest, leases, derivative obligations, and other purchase commitments are detailed in the contractual obligations table that follows. See Notes 1, 5, 6, 7, and 9 to the financial statements for additional information.
II-453
MANAGEMENT'S DISCUSSION AND ANALYSIS (continued)
Southern Power Company and Subsidiary Companies 2013 Annual Report
Contractual Obligations
|
2014
|
2015-2016
|
|
2017-2018
|
|
After
2018
|
Total
|
|||||||||||||
|
(in millions)
|
|||||||||||||||||||
|
Long-term debt
(a)
—
|
|||||||||||||||||||
|
Principal
|
$
|
0.6
|
|
$
|
525.0
|
|
$
|
—
|
|
$
|
1,092.8
|
|
$
|
1,618.4
|
|
||||
|
Interest
|
84.0
|
|
143.0
|
|
117.4
|
|
1,296.7
|
|
1,641.1
|
|
|||||||||
|
Financial derivative obligations
(b)
|
0.6
|
|
—
|
|
—
|
|
—
|
|
0.6
|
|
|||||||||
|
Operating leases
(c)
|
2.7
|
|
5.0
|
|
5.1
|
|
83.9
|
|
96.7
|
|
|||||||||
|
Unrecognized tax benefits
(d)
|
1.5
|
|
—
|
|
—
|
|
—
|
|
1.5
|
|
|||||||||
|
Purchase commitments —
|
|||||||||||||||||||
|
Capital
(e)
|
402.0
|
|
1,204.0
|
|
—
|
|
—
|
|
1,606.0
|
|
|||||||||
|
Fuel
(f)
|
538.1
|
|
644.5
|
|
404.5
|
|
235.4
|
|
1,822.5
|
|
|||||||||
|
Purchased power
(g)
|
51.6
|
|
91.8
|
|
79.0
|
|
124.4
|
|
346.8
|
|
|||||||||
|
Other
(h)
|
94.9
|
|
155.3
|
|
180.6
|
|
529.8
|
|
960.6
|
|
|||||||||
|
Transmission agreements
(i)
|
1.6
|
|
4.6
|
|
4.6
|
|
2.3
|
|
13.1
|
|
|||||||||
|
Total
|
$
|
1,177.6
|
|
$
|
2,773.2
|
|
$
|
791.2
|
|
$
|
3,365.3
|
|
$
|
8,107.3
|
|
||||
|
(a)
|
All amounts are reflected based on final maturity dates. The Company plans to retire higher-cost securities and replace these obligations with lower-cost capital if market conditions permit.
|
|
(b)
|
For additional information, see Notes 1 and 9 to the financial statements.
|
|
(c)
|
Operating lease commitments for the Plant Stanton Unit A land lease are subject to annual price escalation based on the Consumer Price Index for All Urban Consumers.
|
|
(d)
|
See Note 5 to the financial statements under "Unrecognized Tax Benefits" for additional information.
|
|
(e)
|
The Company provides estimated capital expenditures for a three-year period. Amounts represent current estimates of total expenditures, excluding capital expenditures covered under long-term service agreements.
|
|
(f)
|
Primarily includes commitments to purchase, transport, and store natural gas fuel. Amounts reflected are based on contracted cost and may contain provisions for price escalation. Amounts reflected for natural gas purchase commitments are based on various indices at the time of delivery and have been estimated based on the New York Mercantile Exchange future prices at December 31, 2013.
|
|
(g)
|
Purchased power commitments of $36.8 million in 2014, $75.9 million in 2015-2016, $79.0 million in 2017-2018, and $124.4 million after 2018 will be resold under a third party agreement to Energy United EMC. The purchases will be resold at cost.
|
|
(h)
|
Includes long-term service agreements, capital leases, and operation and maintenance agreements. Long-term service agreements include price escalation based on inflation indices.
|
|
(i)
|
Transmission commitments are based on Southern Company's current tariff rate for point-to-point transmission.
|
II-454
MANAGEMENT'S DISCUSSION AND ANALYSIS (continued)
Southern Power Company and Subsidiary Companies 2013 Annual Report
Cautionary Statement Regarding Forward-Looking Statements
The Company's
2013
Annual Report contains forward-looking statements. Forward-looking statements include, among other things, statements concerning the strategic goals for the Company's business, customer growth, economic recovery, fuel and environmental cost recovery, current and proposed environmental regulations and related estimated expenditures, access to sources of capital, financing activities, impact of the ATRA, estimated sales and purchases under new power sale and purchase agreements, timing of expected future capacity need in existing markets, completion of construction projects, filings with federal regulatory authorities, plans and estimated costs for new generation resources, and estimated construction and other expenditures. In some cases, forward-looking statements can be identified by terminology such as "may," "will," "could," "should," "expects," "plans," "anticipates," "believes," "estimates," "projects," "predicts," "potential," or "continue" or the negative of these terms or other similar terminology. There are various factors that could cause actual results to differ materially from those suggested by the forward-looking statements; accordingly, there can be no assurance that such indicated results will be realized. These factors include:
|
•
|
the impact of recent and future federal and state regulatory changes, including legislative and regulatory initiatives regarding deregulation and restructuring of the electric utility industry, environmental laws including regulation of water and emissions of sulfur, nitrogen, carbon, soot, particulate matter, hazardous air pollutants, including mercury, and other substances, and also changes in tax and other laws and regulations to which the Company is subject, as well as changes in application of existing laws and regulations;
|
|
•
|
current and future litigation, regulatory investigations, proceedings, or inquiries, including Internal Revenue Service and state tax audits;
|
|
•
|
the effects, extent, and timing of the entry of additional competition in the markets in which the Company operates;
|
|
•
|
variations in demand for electricity, including those relating to weather, the general economy and recovery from the recent recession, population and business growth (and declines), the effects of energy conservation measures, including from the development and deployment of alternative energy sources such as self-generation and distributed generation technologies, and any potential economic impacts resulting from federal fiscal decisions;
|
|
•
|
available sources and costs of fuels;
|
|
•
|
effects of inflation;
|
|
•
|
ability to control costs and avoid cost overruns during the development and construction of facilities, to construct facilities in accordance with the requirements of permits and licenses, and to satisfy any operational and environmental performance standards, including the requirements of tax credits and other incentives;
|
|
•
|
advances in technology;
|
|
•
|
state and federal rate regulations;
|
|
•
|
internal restructuring or other restructuring options that may be pursued;
|
|
•
|
potential business strategies, including acquisitions or dispositions of assets or businesses, which cannot be assured to be completed or beneficial to the Company;
|
|
•
|
the ability of counterparties of the Company to make payments as and when due and to perform as required;
|
|
•
|
the ability to obtain new short- and long-term contracts with wholesale customers;
|
|
•
|
the direct or indirect effect on the Company's business resulting from terrorist incidents and the threat of terrorist incidents, including cyber intrusion;
|
|
•
|
interest rate fluctuations and financial market conditions and the results of financing efforts, including the Company's credit ratings;
|
|
•
|
the impacts of any potential U.S. credit rating downgrade or other sovereign financial issues, including impacts on interest rates, access to capital markets, impacts on currency exchange rates, counterparty performance, and the economy in general;
|
|
•
|
the ability of the Company to obtain additional generating capacity at competitive prices;
|
|
•
|
catastrophic events such as fires, earthquakes, explosions, floods, hurricanes, droughts, pandemic health events such as influenzas, or other similar occurrences;
|
|
•
|
the direct or indirect effects on the Company's business resulting from incidents affecting the U.S. electric grid or operation of generating resources;
|
|
•
|
the effect of accounting pronouncements issued periodically by standard setting bodies; and
|
II-455
MANAGEMENT'S DISCUSSION AND ANALYSIS (continued)
Southern Power Company and Subsidiary Companies 2013 Annual Report
|
•
|
other factors discussed elsewhere herein and in other reports (including the Form 10-K) filed by the Company from time to time with the SEC.
|
The Company expressly disclaims any obligation to update any forward-looking statements.
II-456
CONSOLIDATED STATEMENTS OF INCOME
For the Years Ended
December 31, 2013
,
2012
, and
2011
Southern Power Company and Subsidiary Companies
2013
Annual Report
|
|
2013
|
|
2012
|
|
2011
|
|
|||||
|
|
(in thousands)
|
||||||||||
|
Operating Revenues:
|
|||||||||||
|
Wholesale revenues, non-affiliates
|
$
|
922,811
|
|
$
|
753,653
|
|
$
|
870,607
|
|
||
|
Wholesale revenues, affiliates
|
345,799
|
|
425,180
|
|
358,585
|
|
|||||
|
Other revenues
|
6,616
|
|
7,215
|
|
6,769
|
|
|||||
|
Total operating revenues
|
1,275,226
|
|
1,186,048
|
|
1,235,961
|
|
|||||
|
Operating Expenses:
|
|||||||||||
|
Fuel
|
473,805
|
|
426,257
|
|
454,790
|
|
|||||
|
Purchased power, non-affiliates
|
75,954
|
|
80,438
|
|
78,368
|
|
|||||
|
Purchased power, affiliates
|
30,415
|
|
12,915
|
|
52,924
|
|
|||||
|
Other operations and maintenance
|
208,366
|
|
173,074
|
|
171,538
|
|
|||||
|
Depreciation and amortization
|
175,295
|
|
142,624
|
|
124,204
|
|
|||||
|
Taxes other than income taxes
|
21,416
|
|
19,309
|
|
17,686
|
|
|||||
|
Total operating expenses
|
985,251
|
|
854,617
|
|
899,510
|
|
|||||
|
Operating Income
|
289,975
|
|
331,431
|
|
336,451
|
|
|||||
|
Other Income and (Expense):
|
|||||||||||
|
Interest expense, net of amounts capitalized
|
(74,475
|
)
|
(62,503
|
)
|
(77,334
|
)
|
|||||
|
Loss on extinguishment of debt
|
—
|
|
—
|
|
(19,806
|
)
|
|||||
|
Other income (expense), net
|
(4,072
|
)
|
(1,022
|
)
|
(1,223
|
)
|
|||||
|
Total other income and (expense)
|
(78,547
|
)
|
(63,525
|
)
|
(98,363
|
)
|
|||||
|
Earnings Before Income Taxes
|
211,428
|
|
267,906
|
|
238,088
|
|
|||||
|
Income taxes
|
45,895
|
|
92,621
|
|
75,857
|
|
|||||
|
Net Income
|
$
|
165,533
|
|
$
|
175,285
|
|
$
|
162,231
|
|
||
The accompanying notes are an integral part of these financial statements.
II-457
CONSOLIDATED STATEMENTS OF COMPREHENSIVE INCOME
For the Years Ended
December 31, 2013
,
2012
, and
2011
Southern Power Company and Subsidiary Companies
2013
Annual Report
|
|
2013
|
|
2012
|
|
2011
|
|
|||||
|
|
(in thousands)
|
||||||||||
|
Net Income
|
$
|
165,533
|
|
$
|
175,285
|
|
$
|
162,231
|
|
||
|
Other comprehensive income (loss):
|
|||||||||||
|
Qualifying hedges:
|
|||||||||||
|
Changes in fair value, net of tax of $-, $(90), and $55, respectively
|
—
|
|
(136
|
)
|
65
|
|
|||||
|
Reclassification adjustment for amounts included in net income, net of tax of $2,357, $3,919, and $4,837, respectively
|
3,695
|
|
6,189
|
|
7,125
|
|
|||||
|
Total other comprehensive income (loss)
|
3,695
|
|
6,053
|
|
7,190
|
|
|||||
|
Comprehensive Income
|
$
|
169,228
|
|
$
|
181,338
|
|
$
|
169,421
|
|
||
The accompanying notes are an integral part of these financial statements.
II-458
CONSOLIDATED STATEMENTS OF CASH FLOWS
For the Years Ended
December 31, 2013
,
2012
, and
2011
Southern Power Company and Subsidiary Companies
2013
Annual Report
|
|
2013
|
|
2012
|
|
2011
|
|
|||||
|
|
(in thousands)
|
||||||||||
|
Operating Activities:
|
|||||||||||
|
Net income
|
$
|
165,533
|
|
$
|
175,285
|
|
$
|
162,231
|
|
||
|
Adjustments to reconcile net income
to net cash provided from operating activities —
|
|||||||||||
|
Depreciation and amortization, total
|
177,704
|
|
153,635
|
|
138,787
|
|
|||||
|
Deferred income taxes
|
171,301
|
|
228,780
|
|
4,481
|
|
|||||
|
Investment tax credits
|
158,096
|
|
45,047
|
|
84,723
|
|
|||||
|
Deferred revenues
|
(18,477
|
)
|
(12,633
|
)
|
(10,594
|
)
|
|||||
|
Mark-to-market adjustments
|
850
|
|
(9,275
|
)
|
8,000
|
|
|||||
|
Loss on extinguishment of debt
|
—
|
|
—
|
|
19,806
|
|
|||||
|
Other, net
|
3,335
|
|
3,104
|
|
495
|
|
|||||
|
Changes in certain current assets and liabilities —
|
|||||||||||
|
-Receivables
|
(11,178
|
)
|
(1,384
|
)
|
10,448
|
|
|||||
|
-Fossil fuel stock
|
2,438
|
|
(8,578
|
)
|
532
|
|
|||||
|
-Materials and supplies
|
(8,410
|
)
|
(7,825
|
)
|
(4,097
|
)
|
|||||
|
-Prepaid income taxes
|
(29,609
|
)
|
(3,223
|
)
|
10,693
|
|
|||||
|
-Other current assets
|
(2,219
|
)
|
(1,624
|
)
|
(485
|
)
|
|||||
|
-Accounts payable
|
(11,572
|
)
|
10,514
|
|
(6,138
|
)
|
|||||
|
-Accrued taxes
|
(299
|
)
|
431
|
|
2,134
|
|
|||||
|
-Accrued interest
|
6,093
|
|
385
|
|
(8,102
|
)
|
|||||
|
-Other current liabilities
|
777
|
|
492
|
|
(535
|
)
|
|||||
|
Net cash provided from operating activities
|
604,363
|
|
573,131
|
|
412,379
|
|
|||||
|
Investing Activities:
|
|||||||||||
|
Property additions
|
(500,756
|
)
|
(116,633
|
)
|
(254,725
|
)
|
|||||
|
Cash paid for acquisitions
|
(132,163
|
)
|
(124,059
|
)
|
—
|
|
|||||
|
Change in construction payables
|
(4,072
|
)
|
(27,387
|
)
|
(14,291
|
)
|
|||||
|
Payments pursuant to long-term service agreements
|
(57,269
|
)
|
(63,932
|
)
|
(57,969
|
)
|
|||||
|
Other investing activities
|
(1,725
|
)
|
(446
|
)
|
(1,387
|
)
|
|||||
|
Net cash used for investing activities
|
(695,985
|
)
|
(332,457
|
)
|
(328,372
|
)
|
|||||
|
Financing Activities:
|
|||||||||||
|
Decrease in notes payable, net
|
(70,968
|
)
|
(108,552
|
)
|
(90,267
|
)
|
|||||
|
Proceeds —
|
|||||||||||
|
Capital contributions
|
1,487
|
|
(662
|
)
|
127,241
|
|
|||||
|
Senior notes
|
300,000
|
|
—
|
|
575,000
|
|
|||||
|
Other long-term debt
|
23,583
|
|
5,470
|
|
—
|
|
|||||
|
Redemptions —
|
|||||||||||
|
Senior notes
|
—
|
|
—
|
|
(575,000
|
)
|
|||||
|
Other long-term debt
|
(9,284
|
)
|
(2,450
|
)
|
(3,691
|
)
|
|||||
|
Premium for early debt extinguishment
|
—
|
|
—
|
|
(19,375
|
)
|
|||||
|
Payment of common stock dividends
|
(129,120
|
)
|
(127,000
|
)
|
(91,200
|
)
|
|||||
|
Other financing activities
|
16,076
|
|
4,169
|
|
(3,976
|
)
|
|||||
|
Net cash provided from (used for) financing activities
|
131,774
|
|
(229,025
|
)
|
(81,268
|
)
|
|||||
|
Net Change in Cash and Cash Equivalents
|
40,152
|
|
11,649
|
|
2,739
|
|
|||||
|
Cash and Cash Equivalents at Beginning of Year
|
28,592
|
|
16,943
|
|
14,204
|
|
|||||
|
Cash and Cash Equivalents at End of Year
|
$
|
68,744
|
|
$
|
28,592
|
|
$
|
16,943
|
|
||
|
Supplemental Cash Flow Information:
|
|||||||||||
|
Cash paid during the period for —
|
|||||||||||
|
Interest (net of $9,178, $19,092 and $18,001 capitalized, respectively)
|
$
|
60,396
|
|
$
|
50,248
|
|
$
|
74,989
|
|
||
|
Income taxes (net of refunds and investment tax credits)
|
(226,179
|
)
|
(175,269
|
)
|
(26,486
|
)
|
|||||
|
Noncash transactions — accrued property additions at year-end
|
5,567
|
|
11,203
|
|
32,590
|
|
|||||
II-459
CONSOLIDATED BALANCE SHEETS
At
December 31, 2013
and
2012
Southern Power Company and Subsidiary Companies
2013
Annual Report
|
Assets
|
2013
|
|
2012
|
|
|||
|
|
(in thousands)
|
||||||
|
Current Assets:
|
|||||||
|
Cash and cash equivalents
|
$
|
68,744
|
|
$
|
28,592
|
|
|
|
Receivables —
|
|||||||
|
Customer accounts receivable
|
73,497
|
|
62,857
|
|
|||
|
Other accounts receivable
|
3,983
|
|
3,135
|
|
|||
|
Affiliated companies
|
38,391
|
|
38,269
|
|
|||
|
Fossil fuel stock, at average cost
|
19,178
|
|
21,616
|
|
|||
|
Materials and supplies, at average cost
|
54,780
|
|
46,370
|
|
|||
|
Prepaid service agreements — current
|
81,206
|
|
80,629
|
|
|||
|
Prepaid income taxes
|
54,732
|
|
4,498
|
|
|||
|
Other prepaid expenses
|
7,915
|
|
5,637
|
|
|||
|
Assets from risk management activities
|
182
|
|
375
|
|
|||
|
Total current assets
|
402,608
|
|
291,978
|
|
|||
|
Property, Plant, and Equipment:
|
|||||||
|
In service
|
4,696,134
|
|
4,059,839
|
|
|||
|
Less accumulated provision for depreciation
|
871,963
|
|
786,620
|
|
|||
|
Plant in service, net of depreciation
|
3,824,171
|
|
3,273,219
|
|
|||
|
Construction work in progress
|
9,843
|
|
24,835
|
|
|||
|
Total property, plant, and equipment
|
3,834,014
|
|
3,298,054
|
|
|||
|
Other Property and Investments:
|
|||||||
|
Goodwill
|
1,839
|
|
1,839
|
|
|||
|
Other intangible assets, net of amortization of $5,614 and $3,141
at December 31, 2013 and December 31, 2012, respectively |
43,505
|
|
45,979
|
|
|||
|
Total other property and investments
|
45,344
|
|
47,818
|
|
|||
|
Deferred Charges and Other Assets:
|
|||||||
|
Prepaid long-term service agreements
|
73,676
|
|
100,921
|
|
|||
|
Other deferred charges and assets — affiliated
|
4,605
|
|
3,468
|
|
|||
|
Other deferred charges and assets — non-affiliated
|
68,853
|
|
37,688
|
|
|||
|
Total deferred charges and other assets
|
147,134
|
|
142,077
|
|
|||
|
Total Assets
|
$
|
4,429,100
|
|
$
|
3,779,927
|
|
|
The accompanying notes are an integral part of these financial statements.
II-460
CONSOLIDATED BALANCE SHEETS
At
December 31, 2013
and
2012
Southern Power Company and Subsidiary Companies
2013
Annual Report
|
Liabilities and Stockholder's Equity
|
2013
|
|
2012
|
|
|||
|
|
(in thousands)
|
||||||
|
Current Liabilities:
|
|||||||
|
Securities due within one year
|
$
|
599
|
|
$
|
259
|
|
|
|
Notes payable — non-affiliated
|
—
|
|
70,968
|
|
|||
|
Accounts payable —
|
|||||||
|
Affiliated
|
56,661
|
|
65,832
|
|
|||
|
Other
|
20,747
|
|
26,204
|
|
|||
|
Accrued taxes —
|
|||||||
|
Accrued income taxes
|
161
|
|
87
|
|
|||
|
Other accrued taxes
|
2,662
|
|
3,031
|
|
|||
|
Accrued interest
|
28,352
|
|
22,259
|
|
|||
|
Other current liabilities
|
18,492
|
|
8,932
|
|
|||
|
Total current liabilities
|
127,674
|
|
197,572
|
|
|||
|
Long-Term Debt:
|
|||||||
|
Senior notes —
|
|||||||
|
4.875% due 2015
|
525,000
|
|
525,000
|
|
|||
|
6.375% due 2036
|
200,000
|
|
200,000
|
|
|||
|
5.15% due 2041
|
575,000
|
|
575,000
|
|
|||
|
5.25% due 2043
|
300,000
|
|
—
|
|
|||
|
Other long-term notes (3.25% due 2032-2033)
|
17,787
|
|
3,828
|
|
|||
|
Unamortized debt premium
|
2,467
|
|
2,557
|
|
|||
|
Unamortized debt discount
|
(1,013
|
)
|
(286
|
)
|
|||
|
Long-term debt
|
1,619,241
|
|
1,306,099
|
|
|||
|
Deferred Credits and Other Liabilities:
|
|||||||
|
Accumulated deferred income taxes
|
724,390
|
|
550,685
|
|
|||
|
Investment tax credits
|
340,269
|
|
167,130
|
|
|||
|
Deferred capacity revenues — affiliated
|
15,279
|
|
19,514
|
|
|||
|
Other deferred credits and liabilities — affiliated
|
1,621
|
|
2,638
|
|
|||
|
Other deferred credits and liabilities — non-affiliated
|
7,896
|
|
5,863
|
|
|||
|
Total deferred credits and other liabilities
|
1,089,455
|
|
745,830
|
|
|||
|
Total Liabilities
|
2,836,370
|
|
2,249,501
|
|
|||
|
Redeemable Noncontrolling Interest
|
28,778
|
|
8,069
|
|
|||
|
Common Stockholder's Equity:
|
|||||||
|
Common stock, par value $0.01 per share —
|
|||||||
|
Authorized - 1,000,000 shares
|
|||||||
|
Outstanding - 1,000 shares
|
—
|
|
—
|
|
|||
|
Paid-in capital
|
1,029,035
|
|
1,027,548
|
|
|||
|
Retained earnings
|
531,998
|
|
495,585
|
|
|||
|
Accumulated other comprehensive income (loss)
|
2,919
|
|
(776
|
)
|
|||
|
Total common stockholder's equity
|
1,563,952
|
|
1,522,357
|
|
|||
|
Total Liabilities and Stockholder's Equity
|
$
|
4,429,100
|
|
$
|
3,779,927
|
|
|
|
Commitments and Contingent Matters
(
See notes
)
|
|
|
|||||
The accompanying notes are an integral part of these financial statements.
II-461
CONSOLIDATED STATEMENTS OF COMMON STOCKHOLDER'S EQUITY
For the Years Ended
December 31, 2013
,
2012
, and
2011
Southern Power Company and Subsidiary Companies
2013
Annual Report
|
|
Number of Common Shares Issued
|
Common Stock
|
Paid-In Capital
|
Retained Earnings
|
|
Accumulated Other Comprehensive Income (Loss)
|
Total
|
|||||||||||||||
|
|
(in thousands)
|
|||||||||||||||||||||
|
Balance at December 31, 2010
|
1
|
|
$
|
—
|
|
$
|
900,969
|
|
$
|
376,270
|
|
$
|
(14,019
|
)
|
$
|
1,263,220
|
|
|||||
|
Net income
|
—
|
|
—
|
|
—
|
|
162,231
|
|
—
|
|
162,231
|
|
||||||||||
|
Capital contributions from parent company
|
—
|
|
—
|
|
127,241
|
|
—
|
|
—
|
|
127,241
|
|
||||||||||
|
Other comprehensive income (loss)
|
—
|
|
—
|
|
—
|
|
—
|
|
7,190
|
|
7,190
|
|
||||||||||
|
Cash dividends on common stock
|
—
|
|
—
|
|
—
|
|
(91,200
|
)
|
—
|
|
(91,200
|
)
|
||||||||||
|
Balance at December 31, 2011
|
1
|
|
—
|
|
1,028,210
|
|
447,301
|
|
(6,829
|
)
|
1,468,682
|
|
||||||||||
|
Net income
|
—
|
|
—
|
|
—
|
|
175,285
|
|
—
|
|
175,285
|
|
||||||||||
|
Capital contributions from parent company
|
—
|
|
—
|
|
(662
|
)
|
—
|
|
—
|
|
(662
|
)
|
||||||||||
|
Other comprehensive income (loss)
|
—
|
|
—
|
|
—
|
|
—
|
|
6,053
|
|
6,053
|
|
||||||||||
|
Cash dividends on common stock
|
—
|
|
—
|
|
—
|
|
(127,000
|
)
|
—
|
|
(127,000
|
)
|
||||||||||
|
Other
|
—
|
|
—
|
|
—
|
|
(1
|
)
|
—
|
|
(1
|
)
|
||||||||||
|
Balance at December 31, 2012
|
1
|
|
—
|
|
1,027,548
|
|
495,585
|
|
(776
|
)
|
1,522,357
|
|
||||||||||
|
Net income
|
—
|
|
—
|
|
—
|
|
165,533
|
|
—
|
|
165,533
|
|
||||||||||
|
Capital contributions from parent company
|
—
|
|
—
|
|
1,487
|
|
—
|
|
—
|
|
1,487
|
|
||||||||||
|
Other comprehensive income (loss)
|
—
|
|
—
|
|
—
|
|
—
|
|
3,695
|
|
3,695
|
|
||||||||||
|
Cash dividends on common stock
|
—
|
|
—
|
|
—
|
|
(129,120
|
)
|
—
|
|
(129,120
|
)
|
||||||||||
|
Balance at December 31, 2013
|
1
|
|
$
|
—
|
|
$
|
1,029,035
|
|
$
|
531,998
|
|
$
|
2,919
|
|
$
|
1,563,952
|
|
|||||
The accompanying notes are an integral part of these financial statements.
II-462
NOTES TO FINANCIAL STATEMENTS
Southern Power Company and Subsidiary Companies
2013
Annual Report
Index to the Notes to Financial Statements
|
Note
|
Page
|
|
|
1
|
||
|
2
|
||
|
3
|
||
|
4
|
||
|
5
|
||
|
6
|
||
|
7
|
||
|
8
|
||
|
9
|
||
|
10
|
||
II-463
NOTES (continued)
Southern Power Company and Subsidiary Companies 2013 Annual Report
1. SUMMARY OF SIGNIFICANT ACCOUNTING POLICIES
General
Southern Power Company is a wholly-owned subsidiary of The Southern Company (Southern Company), which is also the parent company of four traditional operating companies, Southern Company Services, Inc. (SCS), Southern Communications Services, Inc. (SouthernLINC Wireless), Southern Company Holdings, Inc. (Southern Holdings), Southern Nuclear Operating Company, Inc. (Southern Nuclear), and other direct and indirect subsidiaries. The traditional operating companies – Alabama Power Company, Georgia Power Company (Georgia Power), Gulf Power Company, and Mississippi Power Company – are vertically integrated utilities providing electric service in four Southeastern states. Southern Power Company and its subsidiaries (the Company) construct, acquire, own, and manage generation assets, including renewable energy projects, and sell electricity at market-based rates in the wholesale market. SCS, the system service company, provides, at cost, specialized services to Southern Company and its subsidiary companies. SouthernLINC Wireless provides digital wireless communications for use by Southern Company and its subsidiary companies and also markets these services to the public and provides fiber cable services within the Southeast. Southern Holdings is an intermediate holding company subsidiary, primarily for Southern Company's investments in leveraged leases. Southern Nuclear operates and provides services to the Southern Company system's nuclear power plants.
Southern Power Company and certain of its generation subsidiaries are subject to regulation by the Federal Energy Regulatory Commission (FERC). The Company follows generally accepted accounting principles (GAAP). The preparation of financial statements in conformity with GAAP requires the use of estimates, and the actual results may differ from those estimates. Certain prior years' data presented in the financial statements have been reclassified to conform to the current year presentation.
The financial statements include the accounts of Southern Power Company and its wholly-owned subsidiaries, Southern Company - Florida LLC, Oleander Power Project, LP, and Nacogdoches Power LLC, which own, operate, and maintain the Company's ownership interests in Plants Stanton Unit A, Oleander, and Nacogdoches, respectively. The financial statements also include the accounts of Southern Power Company's wholly-owned subsidiary, Southern Renewable Energy, Inc. (SRE). SRE was formed to construct, acquire, own, and manage renewable generation assets and sell electricity at market-based prices in the wholesale market. Through Southern Turner Renewable Energy LLC (STR), a jointly-owned subsidiary owned
90%
by SRE and
10%
by Turner Renewable Energy, LLC (TRE), SRE and its subsidiaries own, operate, and maintain Plants Cimarron, Apex, Granville, Spectrum, and Campo Verde. All intercompany accounts and transactions have been eliminated in consolidation.
Affiliate Transactions
Southern Power Company has an agreement with SCS under which the following services are rendered to the Company at amounts in compliance with FERC regulation: general and design engineering, purchasing, accounting, finance and treasury, tax, information technology, marketing, auditing, insurance and pension administration, human resources, systems and procedures, digital wireless communications, labor, and other services with respect to business and operations, construction management, and transactions associated with the Southern Company system's fleet of generating units. Because the Company has no employees, all employee-related charges are rendered at amounts in compliance with FERC regulation under agreements with SCS. Costs for these services from SCS amounted to approximately
$117.6 million
in
2013
,
$125.4 million
in
2012
, and
$112.7 million
in
2011
. Approximately
$114.3 million
in
2013
,
$107.7 million
in
2012
, and
$87.9 million
in
2011
were operations and maintenance expenses; the remainder was recorded to plant in service. Cost allocation methodologies used by SCS prior to the repeal of the Public Utility Holding Company Act of 1935, as amended, were approved by the U.S. Securities and Exchange Commission (SEC). Subsequently, additional cost allocation methodologies have been reported to the FERC and management believes they are reasonable. The FERC permits services to be rendered at cost by system service companies.
The Company has several agreements with SCS for transmission services. Transmission purchased from affiliates totaled
$8.3 million
in
2013
,
$6.6 million
in
2012
, and
$7.1 million
in
2011
. All charges were billed to the Company based on the Southern Company Open Access Transmission Tariff as filed with the FERC.
Total billings for all power purchase agreements (PPAs) with affiliates totaled
$148.4 million
,
$159.9 million
, and
$175.9 million
in
2013
,
2012
, and
2011
, respectively. The deferred amounts outstanding were
$17.6 million
and
$19.0 million
as of
December 31, 2013
and
2012
, respectively, which are recorded as "Deferred capacity revenues – affiliated" on the balance sheets. Revenue recognized under affiliate PPAs accounted for as operating leases totaled
$69.0 million
,
$76.2 million
, and
$75.6 million
in
2013
,
2012
, and
2011
, respectively. The Company and the traditional operating companies may jointly enter into various types of wholesale energy, natural gas, and certain other contracts, either directly or through SCS as agent. Each participating company may be jointly and severally liable for the obligations incurred under these agreements. See "Revenues" herein for additional information.
II-464
NOTES (continued)
Southern Power Company and Subsidiary Companies 2013 Annual Report
The Company and the traditional operating companies generally settle amounts related to the above transactions on a monthly basis in the month following the performance of such services or the purchase or sale of electricity.
Acquisition Accounting
The Company acquires generation assets as part of its overall growth strategy. The Company accounts for business acquisitions from non-affiliates as business combinations. Accordingly, the Company has included these operations in the consolidated financial statements from the respective date of acquisition. The purchase price, including contingent consideration, if any, of each acquisition was allocated based on the fair value of the identifiable assets and liabilities. Assets acquired that do not meet the definition of a business in accordance with GAAP are accounted for as asset acquisitions. The purchase price of each asset acquisition was allocated based on the relative fair value of assets acquired. Any due diligence or transition costs incurred by the Company for successful or potential acquisitions have been expensed as incurred.
Revenues
The Company sells capacity at rates specified under contractual terms for long-term PPAs. These PPAs are generally accounted for as operating leases, non-derivatives, or normal sale derivatives. Capacity revenues from PPAs classified as operating leases are recognized on a straight-line basis over the term of the agreement. Capacity revenues from PPAs classified as non-derivatives or normal sales are recognized at the lesser of the levelized amount or the amount billable under the contract over the respective contract periods. When multiple contracts exist with the same counterparty, the revenues from each contract are accounted for as separate arrangements.
The Company may also enter into contracts to sell short-term capacity in the wholesale electricity markets. These sales are generally classified as mark-to-market derivatives and net unrealized gains (losses) on such contracts are recorded in wholesale revenues. See Note 9 for further information.
Energy revenues and other contingent revenues are recognized in the period the energy is delivered or the service is rendered. All revenues under solar PPAs are accounted for as contingent revenues and recognized as services are performed. Transmission revenues and other fees are recognized as earned as other operating revenues. Revenues are recorded on a gross basis for all full requirements PPAs. See "Financial Instruments" herein for additional information.
Significant portions of the Company's revenues have been derived from certain customers pursuant to PPAs. For the year ended
December 31, 2013
, Florida Power & Light Company (FPL) accounted for
11.8%
of total revenues, Georgia Power accounted for
10.7%
of total revenues, and Duke Energy Corporation (resulting from a merger between Duke Energy Corporation and Progress Energy, Inc.) accounted for
10.3%
of total revenues. For the year ended
December 31, 2012
, FPL accounted for
12.8%
of total revenues, Georgia Power accounted for
12.5%
of total revenues, and Progress Energy Florida, Inc. accounted for
5.9%
of total revenues. For the year ended
December 31, 2011
, FPL accounted for
14.7%
of total revenues, Georgia Power accounted for
14%
of total revenues, and Progress Energy Carolinas, Inc. accounted for
8.3%
of total revenues.
Fuel Costs
Fuel costs are expensed as the fuel is used. Fuel costs also include emissions allowances which are expensed as the emissions occur.
Income and Other Taxes
The Company uses the liability method of accounting for deferred income taxes and provides deferred income taxes for all significant income tax temporary differences.
Under the American Recovery and Reinvestment Act of 2009 (ARRA), certain projects are eligible for investment tax credits (ITCs) or cash grants. The Company has elected to receive ITCs. The credits are recorded as a deferred credit and are amortized to income tax expense over the life of the asset. Credits amortized in this manner amount to
$5.5 million
and
$2.6 million
in 2013 and 2012, respectively. Furthermore, the tax basis of the asset is reduced by
50%
of the credits received, resulting in a net deferred tax asset. The Company has elected to recognize the tax benefit of this basis difference as a reduction to income tax expense as costs are incurred during the construction period. At December 31, 2013, all ITCs available to reduce federal income taxes payable have been utilized. Additionally, state ITCs are recognized at the time the credit is claimed on the state income tax return. A portion of the state ITCs available to reduce state income taxes payable were not utilized currently and will be carried forward and utilized in future years.
In accordance with accounting standards related to the uncertainty in income taxes, the Company recognizes tax positions that are "more likely than not" of being sustained upon examination by the appropriate taxing authorities. See Note 5 under "Unrecognized Tax Benefits" for additional information.
II-465
NOTES (continued)
Southern Power Company and Subsidiary Companies 2013 Annual Report
Property, Plant, and Equipment
The Company's depreciable property, plant, and equipment consists entirely of generation assets.
Property, plant, and equipment is stated at original cost. Original cost includes: materials, direct labor incurred by contractors and affiliated companies, minor items of property, and interest capitalized. Interest is capitalized on qualifying projects during the development and construction period. The cost to replace significant items of property defined as retirement units is capitalized. The cost of maintenance, repairs, and replacement of minor items of property is charged to other operations and maintenance expenses as incurred.
Depreciation
Depreciation of the original cost of assets is computed under the straight-line method and applies a composite depreciation rate based on the assets' estimated useful lives determined by the Company. The primary assets in property, plant, and equipment are power plants, which have estimated composite depreciable lives ranging from
18
to
34 years
. These lives reflect a composite of the significant components (retirement units) that make up the plants. The Company reviews its estimated useful lives and salvage values on an ongoing basis. The results of these reviews could result in changes which could have a material impact on net income in the near term.
When property subject to composite depreciation is retired or otherwise disposed of in the normal course of business, its cost is charged to accumulated depreciation. For other property dispositions, the applicable cost and accumulated depreciation is removed from the balance sheet accounts and a gain or loss is recognized.
Beginning in 2014, the Company changed to component depreciation. Certain generation assets will be depreciated on a units-of-production basis to better match outage and maintenance costs to the usage of and revenues from these assets.
Impairment of Long-Lived Assets and Intangibles
The Company evaluates long-lived assets and finite-lived intangibles for impairment when events or changes in circumstances indicate that the carrying value of such assets may not be recoverable. The Company's intangible assets consist of acquired PPAs that are amortized over the term of the PPA and goodwill resulting from acquisitions. The average term of these PPAs is
20 years
. The determination of whether an impairment has occurred is based on an estimate of undiscounted future cash flows attributable to the assets, as compared with the carrying value of the assets. If the estimate of undiscounted future cash flows is less than the carrying value of the asset, the fair value of the asset is determined and a loss is recorded. For assets identified as held for sale, the carrying value is compared to the estimated fair value less the cost to sell in order to determine if an impairment loss is required. Until the assets are disposed of, their estimated fair value is re-evaluated when circumstances or events change.
The amortization expense for the acquired PPAs is as follows:
|
Amortization
Expense
|
|||
|
(in millions)
|
|||
|
2013
|
$
|
2.5
|
|
|
2014
|
2.5
|
|
|
|
2015
|
2.5
|
|
|
|
2016
|
2.5
|
|
|
|
2017
|
2.5
|
|
|
|
2018 and beyond
|
33.5
|
|
|
|
Total
|
$
|
46.0
|
|
Deferred Project Development Costs
The Company capitalizes project development costs once it is determined that it is probable that a specific site will be acquired and a plant constructed. These costs include professional services, permits, and other costs directly related to the construction of a project. In addition, the Company has acquired emission reduction credits necessary for future unspecified construction in areas designated by the U.S. Environmental Protection Agency (EPA) as non-attainment areas for nitrogen oxide or volatile organic compound emissions. These credits are reflected on the balance sheets at historical cost. Deferred project development costs, including the cost of emission reduction offsets to be surrendered, are generally transferred to construction work in progress
II-466
NOTES (continued)
Southern Power Company and Subsidiary Companies 2013 Annual Report
(CWIP) upon commencement of construction. The total deferred project development costs were
$11.2 million
at
December 31, 2013
and 2012.
Cash and Cash Equivalents
For purposes of the financial statements, temporary cash investments are considered cash equivalents. Temporary cash investments are securities with original maturities of
90 days
or less.
Materials and Supplies
Generally, materials and supplies include the average cost of generating plant materials. Materials are charged to inventory when purchased and then expensed or capitalized to plant, as appropriate, at weighted average cost when installed.
Fuel Inventory
Fuel inventory includes the cost of oil, natural gas, biomass, and emissions allowances. The Company maintains oil inventory for use at several generating units. The Company has contracts in place for natural gas storage to support normal operations of the Company's natural gas generating units. The Company maintains biomass inventory for use at Plant Nacogdoches. Inventory is maintained using the weighted average cost method. Fuel inventory and emissions allowances are recorded at actual cost when purchased and then expensed at weighted average cost as used. Emissions allowances granted by the EPA are included at zero cost.
Financial Instruments
The Company uses derivative financial instruments to limit exposure to fluctuations in interest rates, the prices of certain fuel purchases, and electricity purchases and sales. All derivative financial instruments are recognized as either assets or liabilities (included in "Other" or shown separately as "Risk Management Activities") and are measured at fair value. See Note 8 for additional information. Substantially all of the Company's bulk energy purchases and sales contracts that meet the definition of a derivative are excluded from fair value accounting requirements because they qualify for the "normal" scope exception, and are accounted for under the accrual method. Other derivative contracts qualify as cash flow hedges of anticipated transactions. This results in the deferral of related gains and losses in accumulated other comprehensive income (AOCI) until the hedged transactions occur. Any ineffectiveness arising from cash flow hedges is recognized currently in net income. Other derivative contracts are marked to market through current period income and are recorded in the financial statement line item where they will eventually settle. See Note 9 for additional information. Cash flows from derivatives are classified on the statement of cash flows in the same category as the hedged item.
The Company does not offset fair value amounts recognized for multiple derivative instruments executed with the same counterparty under a master netting arrangement. Additionally, the Company had no outstanding collateral repayment obligations or rights to reclaim collateral arising from derivative instruments recognized at
December 31, 2013
.
The Company is exposed to losses related to financial instruments in the event of counterparties' nonperformance. The Company has established controls to determine and monitor the creditworthiness of counterparties in order to mitigate the Company's exposure to counterparty credit risk.
Other Income and (Expense)
Other income and (expense) includes non-operating revenues and expenses. Revenues are recognized when earned and expenses are recognized when incurred.
Comprehensive Income
The objective of comprehensive income is to report a measure of all changes in common stock equity of an enterprise that result from transactions and other economic events of the period other than transactions with owners. Comprehensive income consists of net income, changes in the fair value of qualifying cash flow hedges, and reclassifications of amounts included in net income.
Variable Interest Entities
The primary beneficiary of a variable interest entity (VIE) is required to consolidate the VIE when it has both the power to direct the activities of the VIE that most significantly impact the VIE's economic performance and the obligation to absorb losses or the right to receive benefits from the VIE that could potentially be significant to the VIE.
II-467
NOTES (continued)
Southern Power Company and Subsidiary Companies 2013 Annual Report
The Company has certain wholly-owned subsidiaries that are determined to be VIEs. The Company is considered the primary beneficiary of these VIEs because it controls the most significant activities of the VIEs, including operating and maintaining the respective assets, and has the obligation to absorb expected losses of these VIEs to the extent of its equity interests.
2. ACQUISITIONS
Adobe Solar, LLC
On August 27, 2013, the Company and TRE, through STR, entered into a purchase agreement with Sun Edison, LLC, the developer of the project, which provides for the acquisition of all of the outstanding membership interests of Adobe Solar, LLC (Adobe) by STR. Adobe is constructing an approximately
20
-megawatt (MW) solar generating facility in Kern County, California. The solar facility is expected to begin commercial operation in spring
2014
. The output of the plant is contracted under a
20
-year PPA with Southern California Edison Company, which is expected to begin in spring 2014. The acquisition is in accordance with the Company's overall growth strategy.
The Company's acquisition of Adobe is expected to occur in spring 2014 and the purchase price is expected to be approximately
$100 million
.
The completion of the acquisition is subject to Sun Edison, LLC achieving certain construction and project milestones by certain dates and various customary conditions to closing. The ultimate outcome of this matter cannot be determined at this time.
Campo Verde Solar, LLC
On April 23, 2013, the Company and TRE, through STR, acquired all of the outstanding membership interests of Campo Verde Solar, LLC (Campo Verde) from First Solar, Inc., the developer of the project. Campo Verde constructed and owns an approximately
139
-MW solar photovoltaic facility in Southern California. The solar facility began commercial operation on October 25,
2013
. The output of the plant is contracted under a
20
-year PPA with San Diego Gas & Electric Company, a subsidiary of Sempra Energy, which began on the commercial operation date. The asset acquisition was in accordance with the Company's overall growth strategy.
The Company's acquisition of Campo Verde included cash consideration of
$136.6 million
, of which
$132.2 million
has been paid and
$4.4 million
remains to be paid upon completion of certain milestones. The purchase price was allocated primarily to CWIP and
$1.0 million
to other assets. As of December 31, 2013, the allocation of the purchase price to individual assets has not been finalized. The acquisition did not include any contingent consideration and due diligence costs were expensed as incurred and were not material. Under an engineering, procurement, and construction agreement, an additional
$355.5 million
was paid to a subsidiary of First Solar, Inc. for construction of the solar facility.
Spectrum Nevada Solar, LLC
On September 28, 2012, the Company and TRE, through STR, acquired all of the outstanding membership interests of Spectrum Nevada Solar, LLC (Spectrum) from Sun Edison, LLC, the original developer of the project. Spectrum constructed and owns an approximately
30
-MW solar photovoltaic facility in North Las Vegas, Nevada. The solar facility began commercial operation on September 23,
2013
. The output of the plant is contracted under a
25
-year PPA with Nevada Power Company, a subsidiary of NV Energy, Inc., which began on the commercial operation date. The asset acquisition was in accordance with the Company's overall growth strategy.
The Company's acquisition of Spectrum consisted of cash consideration of
$17.6 million
paid at closing which was allocated to CWIP and did not include any contingent consideration. Due diligence costs were expensed as incurred and were not material. Under an engineering, procurement, and construction agreement, an additional
$104.0 million
was paid in 2013 to a subsidiary of Sun Edison, LLC to complete the construction of the solar facility.
Apex Nevada Solar, LLC
On June 29, 2012, the Company and TRE, through STR, acquired all of the outstanding membership interests of Apex Nevada Solar, LLC (Apex) from Sun Edison, LLC, the original developer of the project. Apex constructed and owns an approximately
20
-MW solar photovoltaic facility in North Las Vegas, Nevada. The solar facility began commercial operation on July 21, 2012. The output of the plant is contracted under a
25
-year PPA with Nevada Power Company, a subsidiary of NV Energy, Inc., that began in July
2012
. The business acquisition was in accordance with the Company's overall growth strategy.
The Company's acquisition of Apex included cash consideration of
$102.0 million
, of which
$96.0 million
was paid in 2012 and
$6.0 million
will be paid upon completion of certain milestones. The purchase price was allocated to CWIP. The acquisition did not include any contingent consideration. Due diligence costs were expensed as incurred and were not material.
II-468
NOTES (continued)
Southern Power Company and Subsidiary Companies 2013 Annual Report
3. CONTINGENCIES AND REGULATORY MATTERS
General Litigation Matters
The Company is subject to certain claims and legal actions arising in the ordinary course of business. In addition, the Company's business activities are subject to extensive governmental regulation related to public health and the environment. Litigation over environmental issues and claims of various types, including property damage, personal injury, common law nuisance, and citizen enforcement of environmental requirements such as air quality and water standards, has increased generally throughout the U.S. In particular, personal injury, property damage, and other claims for damages alleged to have been caused by carbon dioxide and other emissions and alleged exposure to hazardous materials, and/or requests for injunctive relief in connection with such matters, have become more frequent. The ultimate outcome of such pending or potential litigation against the Company and its subsidiaries cannot be predicted at this time; however, for current proceedings not specifically reported herein, management does not anticipate that the ultimate liabilities, if any, arising from such current proceedings would have a material effect on the Company's financial statements.
4. JOINT OWNERSHIP AGREEMENTS
The Company is a
65%
owner of Plant Stanton A, a combined-cycle project unit with a nameplate capacity of
659
MWs. The unit is co-owned by the Orlando Utilities Commission (
28%
), Florida Municipal Power Agency (
3.5%
), and Kissimmee Utility Authority (
3.5%
). The Company has a service agreement with SCS whereby SCS is responsible for the operation and maintenance of Plant Stanton A. As of
December 31, 2013
,
$156.0 million
was recorded in plant in service with associated accumulated depreciation of
$41.8 million
. These amounts represent the Company's share of the total plant assets and each owner is responsible for providing its own financing. The Company's proportionate share of Plant Stanton A's operating expense is included in the corresponding operating expenses in the statements of income.
5. INCOME TAXES
On behalf of the Company, Southern Company files a consolidated federal income tax return and combined state income tax returns for the States of Alabama, Georgia, and Mississippi. In addition, the Company files separate company income tax returns for the States of Florida, New Mexico, South Carolina, and Tennessee. Unitary income tax returns are filed for the States of California, North Carolina, and Texas. Under a joint consolidated income tax allocation agreement, each Southern Company subsidiary's current and deferred tax expense is computed on a stand-alone basis and no subsidiary is allocated more current expense than would be paid if it filed a separate income tax return. In accordance with Internal Revenue Service (IRS) regulations, each company is jointly and severally liable for the federal tax liability.
Current and Deferred Income Taxes
Details of income tax provisions are as follows:
|
2013
|
2012
|
2011
|
|||||||||
|
(in millions)
|
|||||||||||
|
Federal —
|
|||||||||||
|
Current
|
$
|
(120.2
|
)
|
$
|
(133.1
|
)
|
$
|
61.6
|
|
||
|
Deferred
|
158.7
|
|
210.4
|
|
12.4
|
|
|||||
|
38.5
|
|
77.3
|
|
74.0
|
|
||||||
|
State —
|
|||||||||||
|
Current
|
(5.2
|
)
|
(3.0
|
)
|
9.8
|
|
|||||
|
Deferred
|
12.6
|
|
18.3
|
|
(7.9
|
)
|
|||||
|
7.4
|
|
15.3
|
|
1.9
|
|
||||||
|
Total
|
$
|
45.9
|
|
$
|
92.6
|
|
$
|
75.9
|
|
||
II-469
NOTES (continued)
Southern Power Company and Subsidiary Companies 2013 Annual Report
The tax effects of temporary differences between the carrying amounts of assets and liabilities in the financial statements and their respective tax bases, which give rise to deferred tax assets and liabilities, are as follows:
|
2013
|
2012
|
||||||
|
(in millions)
|
|||||||
|
Deferred tax liabilities —
|
|||||||
|
Accelerated depreciation and other property basis differences
|
$
|
829.5
|
|
$
|
632.9
|
|
|
|
Basis difference on asset transfers
|
2.8
|
|
3.1
|
|
|||
|
Levelized capacity revenues
|
11.2
|
|
—
|
|
|||
|
Other
|
0.9
|
|
—
|
|
|||
|
Total
|
844.4
|
|
636.0
|
|
|||
|
Deferred tax assets —
|
|||||||
|
Federal effect of state deferred taxes
|
29.7
|
|
25.2
|
|
|||
|
Net basis difference on ITCs
|
58.0
|
|
28.6
|
|
|||
|
Basis difference on asset transfers
|
2.9
|
|
3.9
|
|
|||
|
Alternative minimum tax carryforward
|
1.1
|
|
1.1
|
|
|||
|
Unrealized loss on interest rate swaps
|
11.2
|
|
15.7
|
|
|||
|
Levelized capacity revenues
|
6.0
|
|
4.5
|
|
|||
|
State net operating loss
|
17.0
|
|
8.3
|
|
|||
|
Other
|
1.8
|
|
4.4
|
|
|||
|
Total
|
127.7
|
|
91.7
|
|
|||
|
Valuation Allowance
|
(7.5
|
)
|
(6.2
|
)
|
|||
|
Net deferred income tax assets
|
120.2
|
|
85.5
|
|
|||
|
Total deferred tax liabilities, net
|
724.2
|
|
550.5
|
|
|||
|
Portion included in current income taxes
|
0.2
|
|
0.2
|
|
|||
|
Accumulated deferred income taxes
|
$
|
724.4
|
|
$
|
550.7
|
|
|
Deferred tax liabilities are the result of property related timing differences primarily due to bonus depreciation. The transfer of the Plant McIntosh construction project to Georgia Power in 2004 resulted in a deferred gain for federal income tax purposes. Georgia Power is reimbursing the Company for the related tax liability balance of
$2.8 million
. Of this total,
$0.3 million
is included in the balance sheets in "Receivables – Affiliated companies" and the remainder is included in "Other deferred charges and assets – affiliated."
Deferred tax assets consist primarily of timing differences related to net basis differences on ITCs, the recognition of capacity revenues, and the unrealized loss on interest rate swaps reflected in AOCI. The transfer of Plants Dahlberg, Wansley, and Franklin to the Company from Georgia Power in 2001 also resulted in a deferred gain for federal income tax purposes. The Company will reimburse Georgia Power for the related tax asset of
$2.6 million
. Of this total,
$1.0 million
is included in the balance sheets in "Accounts payable – Affiliated" and the remainder is included in "Other deferred credits and liabilities – affiliated."
At
December 31, 2013
and
December 31, 2012
, the Company had state net operating loss (NOL) carryforwards of
$240.8 million
and
$117.7 million
, respectively. The NOL carryforwards resulted in deferred tax assets of
$11.0 million
as of
December 31, 2013
and
$5.4 million
as of
December 31, 2012
. The Company has established a valuation allowance due to the remote likelihood that the full tax benefits will be realized. During
2013
, the estimated amount of NOL utilization decreased resulting in an
$18.6 million
increase in the valuation allowance. Of the NOL balance at
December 31, 2013
, approximately
$87.0 million
expires in 2015, approximately
$40.0 million
expires in 2017, and approximately
$107.0 million
expires in 2018.
In 2010, the Tax Relief, Unemployment Insurance Reauthorization, and Job Creation Act of 2010 (Tax Relief Act) was signed into law. Major tax incentives in the Tax Relief Act include
100%
bonus depreciation for property placed in service after September 8, 2010 and through 2011 (and for certain long-term production period projects placed in service in 2012) and
50%
bonus depreciation for property placed in service in 2012 (and for certain long-term production period projects placed in service in 2013).
II-470
NOTES (continued)
Southern Power Company and Subsidiary Companies 2013 Annual Report
On January 2, 2013, the American Taxpayer Relief Act of 2012 (ATRA) was signed into law. The ATRA retroactively extended several tax credits through 2013 and extended
50%
bonus depreciation for property placed in service in 2013 (and for certain long-term production-period projects to be placed in service in 2014). The extension of
50%
bonus depreciation had a positive impact of
$98.9 million
on the Company’s cash flows in 2013 and significantly increased deferred tax liabilities related to accelerated depreciation in 2012 and 2013.
Effective Tax Rate
A reconciliation of the federal statutory income tax rate to the effective income tax rate is as follows:
|
2013
|
2012
|
2011
|
||||||
|
Federal statutory rate
|
35.0
|
%
|
35.0
|
%
|
35.0
|
%
|
||
|
State income tax, net of federal deduction
|
2.2
|
|
3.7
|
|
0.6
|
|
||
|
Amortization of ITC
|
(1.7
|
)
|
(1.0
|
)
|
(0.4
|
)
|
||
|
ITC basis difference
|
(14.5
|
)
|
(2.6
|
)
|
(3.1
|
)
|
||
|
Other
|
0.3
|
|
(0.6
|
)
|
(0.3
|
)
|
||
|
Effective income tax rate
|
21.3
|
%
|
34.5
|
%
|
31.8
|
%
|
||
The Company's effective tax rate decreased in
2013
primarily as a result of ITCs recognized related to Plants Campo Verde and Spectrum. The Company's effective tax rate increased in 2012 primarily as a result of a decrease in the Alabama income tax deduction for federal income taxes paid.
In 2009, President Obama signed into law the ARRA. Major tax incentives in the ARRA included renewable energy incentives. The ATRA retroactively extended several renewable energy incentives through 2013, including extending ITCs for biomass projects which begin construction before January 1, 2014. The Company received ITCs under the renewable energy incentives related to Plants Nacogdoches, Cimarron, Apex, Granville, Spectrum, and Campo Verde, which had a material impact on cash flows and net income.
Cash ITCs received in
2013
for the construction of Plants Nacogdoches, Apex, Granville, Spectrum, and Campo Verde were
$158.1 million
. The tax benefit of the basis difference reduced income tax expense by
$31.3 million
in
2013
.
Cash ITCs received in
2012
for the construction of Plants Nacogdoches, Apex, and Granville were
$45.0 million
. The tax benefit of the basis difference reduced income tax expense by
$6.9 million
in
2012
.
Cash ITCs received in
2011
for the construction of Plants Nacogdoches and Cimarron were
$84.7 million
, which includes $
42.9 million
earned in 2010. The tax benefit of the basis difference reduced income tax expense by
$7.3 million
in
2011
.
See Note 1 under "Investment Tax Credits" for additional information.
Unrecognized Tax Benefits
Changes in unrecognized tax benefits were as follows:
|
2013
|
2012
|
2011
|
|||||||||
|
(in millions)
|
|||||||||||
|
Unrecognized tax benefits at beginning of year
|
$
|
2.9
|
|
$
|
2.6
|
|
$
|
2.3
|
|
||
|
Tax positions from current periods
|
1.6
|
|
0.7
|
|
0.4
|
|
|||||
|
Tax positions from prior periods
|
(3.0
|
)
|
(0.2
|
)
|
(0.1
|
)
|
|||||
|
Reductions due to settlements
|
—
|
|
(0.2
|
)
|
—
|
|
|||||
|
Balance at end of year
|
$
|
1.5
|
|
$
|
2.9
|
|
$
|
2.6
|
|
||
The increase in unrecognized tax benefits from current periods for
2013
relates primarily to ITCs. The decrease in unrecognized tax benefits from prior periods for 2013 relates primarily to the tax accounting method change for repairs-generation assets. See "Tax Method of Accounting for Repairs" herein for additional information.
II-471
NOTES (continued)
Southern Power Company and Subsidiary Companies 2013 Annual Report
The impact on the Company's effective tax rate, if recognized, was as follows:
|
2013
|
2012
|
2011
|
|||||||||
|
(in millions)
|
|||||||||||
|
Tax positions impacting the effective tax rate
|
$
|
1.5
|
|
$
|
0.3
|
|
$
|
0.5
|
|
||
|
Tax positions not impacting the effective tax rate
|
—
|
|
2.6
|
|
2.1
|
|
|||||
|
Balance of unrecognized tax benefits
|
$
|
1.5
|
|
$
|
2.9
|
|
$
|
2.6
|
|
||
The tax positions impacting the effective tax rate for
2013
primarily relate to the ITCs realized in 2013. These amounts are presented on a gross basis without considering the related federal or state income tax impact.
Accrued interest for unrecognized tax benefits was immaterial for all years presented.
The Company classifies interest on tax uncertainties as interest expense. The Company did not accrue any penalties on uncertain tax positions.
It is reasonably possible that the amount of the unrecognized tax benefits could change within
12 months
. The settlement of federal and state audits could impact the balances. At this time, an estimate of the range of reasonably possible outcomes cannot be determined.
The IRS has finalized its audits of Southern Company's consolidated federal income tax returns through 2011. For tax years 2012 and 2013, Southern Company is a participant in the Compliance Assurance Process of the IRS. Southern Company has filed its 2012 federal income tax return and has received a full acceptance letter from the IRS; however, the IRS has not finalized its audit. The audits for Southern Company's state income tax returns have either been concluded, or the statute of limitations has expired, for years prior to 2007.
Tax Method of Accounting for Repairs
In 2011, the IRS published regulations on the deduction and capitalization of expenditures related to tangible property that generally apply for tax years beginning on or after January 1, 2014. Additionally, on April 30, 2013, the IRS issued Revenue Procedure 2013-24, which provides guidance for taxpayers related to the deductibility of repair costs associated with generation assets. Based on a review of the regulations, Southern Company incorporated provisions related to repair costs for generation assets into its consolidated 2012 federal income tax return and reversed all related unrecognized tax positions. On September 19, 2013, the IRS issued Treasury Decision 9636, "Guidance Regarding Deduction and Capitalization of Expenditures Related to Tangible Property," which are final tangible property regulations applicable to taxable years beginning on or after January 1, 2014. Southern Company is currently reviewing this new guidance. The ultimate outcome of this matter cannot be determined at this time; however, these regulations are not expected to materially impact the Company's financial statements.
6. FINANCING
Other Long-Term Notes
During
2013
, the Company prepaid
$9.3 million
on a long-term debt payable to TRE and issued an aggregate
$4.2 million
due September 30, 2032 and
$19.4 million
due April 30, 2033 under promissory notes to TRE related to the financing of Plants Spectrum and Campo Verde, respectively.
Senior Notes
During 2013, Southern Power Company issued
$300 million
aggregate principal amount of its Series 2013A
5.25%
Senior Notes due July 15, 2043. The net proceeds from the sale of the Series 2013A Senior Notes were used to repay a portion of its outstanding short-term indebtedness and for other general corporate purposes, including the Company’s continuous construction program.
In 2011, Southern Power Company redeemed
$575 million
aggregate principal amount of its Series B
6.25%
Senior Notes due July 15, 2012. The loss recognized for the early redemption was
$19.8 million
primarily related to the payment of a make whole premium.
At
December 31, 2013
and
2012
, Southern Power Company had
$1.6 billion
and
$1.3 billion
, respectively, of senior notes outstanding.
II-472
NOTES (continued)
Southern Power Company and Subsidiary Companies 2013 Annual Report
Bank Credit Arrangements
In February 2013, Southern Power Company amended its
$500 million
committed credit facility (Facility), which extended the maturity date from 2016 to 2018. There were no borrowings outstanding under the Facility at
December 31, 2013
and 2012. The Facility does not contain a material adverse change clause at the time of borrowing. The Company plans to renew the Facility prior to its expiration.
Southern Power Company is required to pay a commitment fee on the unused balance of the Facility. This fee is less than 1/4 of 1%. The Facility contains a covenant that limits the ratio of debt to capitalization (each as defined in the Facility) to a maximum of
65%
. At December 31, 2013, the Company was in compliance with its debt limits.
Proceeds from the Facility may be used for working capital and general corporate purposes as well as liquidity support for the Company's commercial paper program.
The Company's commercial paper program is used to finance acquisition and construction costs related to electric generating facilities and for general corporate purposes. Commercial paper is included in notes payable in the balance sheets.
Details of short-term borrowings were as follows:
|
Commercial Paper at the
End of the Period
|
||||||
|
Amount Outstanding
|
Weighted Average Interest Rate
|
|||||
|
(in millions)
|
||||||
|
December 31, 2013:
|
$
|
—
|
|
N/A
|
|
|
|
December 31, 2012:
|
$
|
71
|
|
0.5
|
%
|
|
Dividend Restrictions
Southern Power Company can only pay dividends to Southern Company out of retained earnings or paid-in-capital.
The indenture related to certain series of Southern Power Company's senior notes also contains certain limitations on the payment of common stock dividends. No dividends may be paid unless, as of the end of any calendar quarter, the Company's projected cash flows from fixed priced capacity PPAs are at least
80%
of total projected cash flows for the next 12 months or the Company's debt to capitalization ratio is no greater than
60%
. At
December 31, 2013
, Southern Power Company was in compliance with these ratios and had no other restrictions on its ability to pay dividends.
7. COMMITMENTS
Fuel Agreements
SCS, as agent for the Company and the traditional operating companies, has entered into various fuel transportation and procurement agreements to supply a portion of the fuel (primarily natural gas) requirements for the operating facilities which are not recognized on the Company's balance sheets. In
2013
,
2012
, and
2011
, the Company incurred fuel expense of
$473.8 million
,
$426.3 million
, and
$454.8 million
, respectively, the majority of which was purchased under long-term commitments. The Company expects that a substantial amount of its future fuel needs will continue to be purchased under long-term commitments.
SCS may enter into various types of wholesale energy and natural gas contracts acting as an agent for the Company and Southern Company's traditional operating companies. Under these agreements, each of the traditional operating companies and the Company may be jointly and severally liable. Southern Company has entered into keep-well agreements with each of the traditional operating companies to ensure they will not subsidize or be responsible for any costs, losses, liabilities, or damages resulting from the inclusion of the Company as a contracting party under these agreements.
Operating Leases
The Company has operating lease agreements with various terms and expiration dates. Total rent expense was
$1.9 million
,
$0.8 million
, and
$0.6 million
for
2013
,
2012
, and
2011
, respectively. These amounts include contingent rent expense related to the Plant Stanton Unit A land lease based on escalation in the Consumer Price Index for All Urban Consumers. The Company includes step rents, escalations, and lease concessions in its computation of minimum lease payments, which are recognized on a straight-line basis over the minimum lease term. As of December 31, 2013, estimated minimum lease payments under operating leases were
$2.7 million
in 2014,
$2.5 million
in 2015,
$2.5 million
in 2016,
$2.5 million
in 2017,
$2.6 million
in 2018, and
$83.9 million
in 2019 and thereafter. The majority of the committed future expenditures are land leases at solar facilities.
II-473
NOTES (continued)
Southern Power Company and Subsidiary Companies 2013 Annual Report
Redeemable Noncontrolling Interest
Pursuant to an agreement with TRE, on or after November 25, 2015, or earlier in the event of the death of the controlling member of TRE, TRE may require the Company to purchase its noncontrolling interest in STR at fair market value.
8. FAIR VALUE MEASUREMENTS
Fair value measurements are based on inputs of observable and unobservable market data that a market participant would use in pricing the asset or liability. The use of observable inputs is maximized where available and the use of unobservable inputs is minimized for fair value measurement and reflects a three-tier fair value hierarchy that prioritizes inputs to valuation techniques used for fair value measurement.
|
•
|
Level 1 consists of observable market data in an active market for identical assets or liabilities.
|
|
•
|
Level 2 consists of observable market data, other than that included in Level 1, that is either directly or indirectly observable.
|
|
•
|
Level 3 consists of unobservable market data. The input may reflect the assumptions of the Company of what a market participant would use in pricing an asset or liability. If there is little available market data, then the Company's own assumptions are the best available information. The need to use unobservable inputs would typically apply to long-term energy-related derivative contracts and generally results from the nature of the energy industry, as each participant forecasts its own power supply and demand and those of other participants, which directly impact the valuation of each unique contract.
|
In the case of multiple inputs being used in a fair value measurement, the lowest level input that is significant to the fair value measurement represents the level in the fair value hierarchy in which the fair value measurement is reported.
As of
December 31, 2013
, assets and liabilities measured at fair value on a recurring basis during the period, together with the level of the fair value hierarchy in which they fall, were as follows:
|
Fair Value Measurements Using
|
|||||||||||||||
|
Quoted Prices in Active Markets for Identical Assets
|
Significant Other Observable Inputs
|
Significant Unobservable Inputs
|
|||||||||||||
|
As of December 31, 2013:
|
(Level 1)
|
(Level 2)
|
(Level 3)
|
Total
|
|||||||||||
|
(in millions)
|
|||||||||||||||
|
Assets:
|
|||||||||||||||
|
Energy-related derivatives
|
$
|
—
|
|
$
|
0.6
|
|
$
|
—
|
|
$
|
0.6
|
|
|||
|
Cash equivalents
|
68.0
|
|
—
|
|
—
|
|
68.0
|
|
|||||||
|
Total
|
$
|
68.0
|
|
$
|
0.6
|
|
$
|
—
|
|
$
|
68.6
|
|
|||
|
Liabilities:
|
|||||||||||||||
|
Energy-related derivatives
|
$
|
—
|
|
$
|
0.6
|
|
$
|
—
|
|
$
|
0.6
|
|
|||
II-474
NOTES (continued)
Southern Power Company and Subsidiary Companies 2013 Annual Report
As of
December 31, 2012
, assets and liabilities measured at fair value on a recurring basis during the period, together with the level of the fair value hierarchy in which they fall, were as follows:
|
Fair Value Measurements Using
|
|||||||||||||||
|
|
Quoted Prices in Active Markets for Identical Assets
|
Significant Other Observable Inputs
|
Significant Unobservable Inputs
|
|
|||||||||||
|
As of December 31, 2012:
|
(Level 1)
|
(Level 2)
|
(Level 3)
|
Total
|
|||||||||||
|
|
(in millions)
|
||||||||||||||
|
Assets:
|
|||||||||||||||
|
Energy-related derivatives
|
$
|
—
|
|
$
|
2.1
|
|
$
|
—
|
|
$
|
2.1
|
|
|||
|
Cash equivalents
|
26.0
|
|
—
|
|
—
|
|
26.0
|
|
|||||||
|
Total
|
$
|
26.0
|
|
$
|
2.1
|
|
$
|
—
|
|
$
|
28.1
|
|
|||
|
Liabilities:
|
|||||||||||||||
|
Energy-related derivatives
|
$
|
—
|
|
$
|
1.3
|
|
$
|
—
|
|
$
|
1.3
|
|
|||
Valuation Methodologies
The energy-related derivatives primarily consist of over-the-counter financial products for natural gas and physical power products including, from time to time, basis swaps. These are standard products used within the energy industry and are valued using the market approach. The inputs used are mainly from observable market sources, such as forward natural gas prices, power prices, implied volatility, and Overnight Index Swap interest rates. See Note 9 for additional information on how these derivatives are used.
As of
December 31, 2013
and
2012
, the fair value measurements of investments calculated at net asset value per share (or its equivalent), as well as the nature and risks of those investments, were as follows:
|
Fair Value
|
Unfunded
Commitments
|
Redemption
Frequency
|
Redemption
Notice Period
|
||||||
|
As of December 31, 2013:
|
(in millions)
|
||||||||
|
Cash equivalents:
|
|||||||||
|
Money market funds
|
$
|
68.0
|
|
None
|
Daily
|
Not applicable
|
|||
|
As of December 31, 2012:
|
|||||||||
|
Cash equivalents:
|
|||||||||
|
Money market funds
|
$
|
26.0
|
|
None
|
Daily
|
Not applicable
|
|||
The money market funds are short-term investments of excess funds in various money market mutual funds, which are portfolios of short-term debt securities. The money market funds are regulated by the SEC and typically receive the highest rating from credit rating agencies. Regulatory and rating agency requirements for money market funds include minimum credit ratings and maximum maturities for individual securities and a maximum weighted average portfolio maturity. Redemptions are available on a same day basis up to the full amount of the Company's investment in the money market funds.
As of
December 31, 2013
and
2012
, other financial instruments for which the carrying amount did not equal fair value were as follows:
|
Carrying Amount
|
Fair Value
|
||||||
|
|
(in millions)
|
||||||
|
Long-term debt:
|
|||||||
|
2013
|
$
|
1,620
|
|
$
|
1,660
|
|
|
|
2012
|
$
|
1,306
|
|
$
|
1,444
|
|
|
The fair values are determined using Level 2 measurements and are based on quoted market prices for the same or similar issues or on the current rates offered to the Company.
II-475
NOTES (continued)
Southern Power Company and Subsidiary Companies 2013 Annual Report
9. DERIVATIVES
The Company is exposed to market risks, primarily commodity price risk and interest rate risk. To manage the volatility attributable to these exposures, the Company nets its exposures, where possible, to take advantage of natural offsets and enters into various derivative transactions for the remaining exposures pursuant to the Company's policies in areas such as counterparty exposure and risk management practices. The Company's policy is that derivatives are to be used primarily for hedging purposes and mandates strict adherence to all applicable risk management policies. Derivative positions are monitored using techniques including, but not limited to, market valuation, value at risk, stress testing, and sensitivity analysis. Derivative instruments are recognized at fair value in the balance sheets as either assets or liabilities and are presented on a gross basis. In the statements of cash flows, the cash impacts of settled energy-related and interest rate derivatives are recorded as operating activities
Energy-Related Derivatives
The Company enters into energy-related derivatives to hedge exposures to electricity, gas, and other fuel price changes. The Company has limited exposure to market volatility in commodity fuel prices and prices of electricity because its long-term sales contracts shift substantially all fuel cost responsibility to the purchaser. However, the Company has been and may continue to be exposed to market volatility in energy-related commodity prices as a result of uncontracted generating capacity.
To mitigate residual risks relative to movements in electricity prices, the Company enters into physical fixed-price or heat rate contracts for the purchase and sale of electricity through the wholesale electricity market. To mitigate residual risks relative to movements in gas prices, the Company may enter into fixed-price contracts for natural gas purchases; however, a significant portion of contracts are priced at market.
Energy-related derivative contracts are accounted for in one of two methods:
|
•
|
Cash Flow Hedges
– Gains and losses on energy-related derivatives designated as cash flow hedges which are used to hedge anticipated purchases and sales and are initially deferred in other comprehensive income (OCI) before being recognized in the statements of income in the same period as the hedged transactions are reflected in earnings.
|
|
•
|
Not Designated
– Gains and losses on energy-related derivative contracts that are not designated or fail to qualify as hedges are recognized in the statements of income as incurred.
|
Some energy-related derivative contracts require physical delivery as opposed to financial settlement, and this type of derivative is both common and prevalent within the electric industry. When an energy-related derivative contract is settled physically, any cumulative unrealized gain or loss is reversed and the contract price is recognized in the respective line item representing the actual price of the underlying goods being delivered.
At
December 31, 2013
, the net volume of energy-related derivative contracts for natural gas positions totaled
1.6 million
mmBtu (million British thermal units), all of which expire by
2017
, which is the longest non-hedge date. At December 31, 2013, the net volume of energy-related derivative contracts for power positions was immaterial. In addition to the volume discussed above, the Company enters into physical natural gas supply contracts that provide the option to sell back excess gas due to operational constraints. The maximum expected volume of natural gas subject to such a feature is
1.4 million
mmBtu.
Interest Rate Derivatives
The Company may also enter into interest rate derivatives from time to time to hedge exposure to changes in interest rates. Derivatives related to existing variable rate securities or forecasted transactions are accounted for as cash flow hedges, where the effective portion of the derivatives' fair value gains or losses is recorded in OCI and is reclassified into earnings at the same time the hedged transactions affect earnings. The derivatives employed as hedging instruments are structured to minimize ineffectiveness, which is recorded directly to earnings.
At
December 31, 2013
, there were no interest rate derivatives outstanding.
The estimated pre-tax loss that will be reclassified from AOCI to interest expense for the 12-month period ending
December 31, 2014
is
$0.9 million
. The Company has deferred gains and losses that are expected to be amortized into earnings through 2016.
II-476
NOTES (continued)
Southern Power Company and Subsidiary Companies 2013 Annual Report
Derivative Financial Statement Presentation and Amounts
At
December 31, 2013
and
2012
, the fair value of energy-related derivatives was reflected in the balance sheets as follows:
|
Asset Derivatives
|
Liability Derivatives
|
||||||||||||||||||
|
Derivative Category
|
Balance Sheet
Location
|
2013
|
2012
|
Balance Sheet
Location
|
2013
|
2012
|
|||||||||||||
|
(in millions)
|
(in millions)
|
||||||||||||||||||
|
Derivatives not designated as hedging instruments
|
|||||||||||||||||||
|
Energy-related derivatives:
|
Assets from risk management activities
|
$
|
0.2
|
|
$
|
0.4
|
|
Other current liabilities
|
$
|
0.6
|
|
$
|
0.7
|
|
|||||
|
Other deferred charges and assets – non-affiliated
|
0.4
|
|
1.7
|
|
Other deferred credits and liabilities – non-affiliated
|
—
|
|
0.6
|
|
||||||||||
|
Total derivatives not designated as hedging instruments
|
$
|
0.6
|
|
$
|
2.1
|
|
$
|
0.6
|
|
$
|
1.3
|
|
|||||||
|
Total
|
$
|
0.6
|
|
$
|
2.1
|
|
$
|
0.6
|
|
$
|
1.3
|
|
|||||||
All derivative instruments are measured at fair value. See Note 8 for additional information.
The derivative contracts of the Company are not subject to master netting arrangements or similar agreements and are reported gross on the Company's financial statements. Some of these energy-related and interest rate derivative contracts contain certain provisions that permit intra-contract netting of derivative receivables and payables for routine billing and offsets related to events of default and settlements. Amounts related to energy-related derivative contracts at
December 31, 2013
and
2012
are presented in the following tables. Interest rate derivatives presented in the tables above do not have amounts available for offset and are therefore excluded from the offsetting disclosure tables below.
|
Fair Value
|
||||||||||||||||||
|
Assets
|
2013
|
|
2012
|
|
Liabilities
|
2013
|
|
2012
|
|
|||||||||
|
(in millions)
|
(in millions)
|
|||||||||||||||||
|
Energy-related derivatives presented in the Balance Sheet
(a)
|
$
|
0.6
|
|
$
|
2.1
|
|
Energy-related derivatives presented in the Balance Sheet
(a)
|
$
|
0.6
|
|
$
|
1.3
|
|
|||||
|
Gross amounts not offset in the Balance Sheet
(b)
|
(0.1
|
)
|
(1.0
|
)
|
Gross amounts not offset in the Balance Sheet
(b)
|
(0.1
|
)
|
(1.0
|
)
|
|||||||||
|
Net-energy related derivative assets
|
$
|
0.5
|
|
$
|
1.1
|
|
Net-energy related derivative liabilities
|
$
|
0.5
|
|
$
|
0.3
|
|
|||||
(a) The Company does not offset fair value amounts for multiple derivative instruments executed with the same counterparty on the balance sheets; therefore, gross and net amounts of derivative assets and liabilities presented on the balance sheets are the same.
(b) Includes gross amounts subject to netting terms that are not offset on the balance sheets and any cash/financial collateral pledged or received.
II-477
NOTES (continued)
Southern Power Company and Subsidiary Companies 2013 Annual Report
For the years ended
December 31, 2013
,
2012
, and
2011
, the pre-tax effects of energy-related derivatives and interest rate derivatives designated as cash flow hedging instruments on the statements of income were as follows:
|
Derivatives in Cash Flow Hedging Relationships
|
Gain (Loss) Recognized in
AOCI on Derivative
(Effective Portion)
|
Gain (Loss) Reclassified from AOCI into Income
(Effective Portion)
|
||||||||||||||||||||||
|
Amount
|
||||||||||||||||||||||||
|
Derivative Category
|
2013
|
|
2012
|
|
2011
|
|
Statements of Income Location
|
2013
|
|
2012
|
|
2011
|
||||||||||||
|
(in millions)
|
(in millions)
|
|||||||||||||||||||||||
|
Energy-related derivatives
|
$
|
—
|
|
$
|
(0.2
|
)
|
$
|
0.1
|
|
Depreciation and amortization
|
$
|
0.4
|
|
$
|
0.4
|
|
$
|
0.4
|
|
|||||
|
Interest rate derivatives
|
—
|
|
—
|
|
—
|
|
Interest expense, net of amounts capitalized
|
(6.5
|
)
|
(10.5
|
)
|
(11.4
|
)
|
|||||||||||
|
Other income (expense), net
|
—
|
|
—
|
|
(1.0
|
)
|
||||||||||||||||||
|
Total
|
$
|
—
|
|
$
|
(0.2
|
)
|
$
|
0.1
|
|
$
|
(6.1
|
)
|
$
|
(10.1
|
)
|
$
|
(12.0
|
)
|
||||||
There was no material ineffectiveness recorded in earnings for any period presented.
For the Company's energy-related derivatives not designated as hedging instruments, a substantial portion of the pre-tax realized and unrealized gains and losses is associated with hedging fuel price risk of certain PPA customers and has no impact on net income or on fuel expense as presented in the Company's statements of income. As a result, the pre-tax effects of energy-related derivatives not designated as hedging instruments on the Company's statements of income were immaterial for the years ended
December 31, 2013
,
2012
, and
2011
. This third party hedging activity has been discontinued.
Contingent Features
The Company does not have any credit arrangements that would require material changes in payment schedules or terminations as a result of a credit rating downgrade. There are certain derivatives that could require collateral, but not accelerated payment, in the event of various credit rating changes of certain affiliated companies. At
December 31, 2013
, the fair value of derivative liabilities with contingent features was immaterial.
At
December 31, 2013
, the Company had no collateral posted with its derivative counterparties; however, because of the joint and several liability features underlying these derivatives, the maximum potential collateral requirements arising from the credit-risk-related contingent features, at a rating below BBB- and/or Baa3, were
$8.8 million
. If collateral is required, fair value amounts recognized for the right to reclaim cash collateral or the obligation to return cash collateral are not offset against fair value amounts recognized for derivatives executed with the same counterparty.
Generally, collateral may be provided by a Southern Company guaranty, letter of credit, or cash. Southern Power Company participates in certain agreements that could require collateral in the event that one or more Southern Company system power pool participants has a credit rating change to below investment grade.
The Company is exposed to losses related to financial instruments in the event of counterparties' nonperformance. The Company only enters into agreements and material transactions with counterparties that have investment grade credit ratings by Moody's Investors Services, Inc. and Standard and Poor's Ratings Services, a division of The McGraw Hill Companies, Inc. or with counterparties who have posted collateral to cover potential credit exposure. The Company has also established risk management policies and controls to determine and monitor the creditworthiness of counterparties in order to mitigate the Company's exposure to counterparty credit risk. Therefore, the Company does not anticipate a material adverse effect on the financial statements as a result of counterparty nonperformance.
II-478
NOTES (continued)
Southern Power Company and Subsidiary Companies 2013 Annual Report
10. QUARTERLY FINANCIAL INFORMATION (UNAUDITED)
Summarized quarterly financial information for
2013
and
2012
is as follows:
|
Quarter Ended
|
Operating
Revenues
|
Operating
Income
|
Net
Income
|
||||||||
|
(in thousands)
|
|||||||||||
|
March 2013
|
$
|
302,947
|
|
$
|
64,673
|
|
$
|
29,192
|
|
||
|
June 2013
|
307,255
|
|
55,024
|
|
27,922
|
|
|||||
|
September 2013
|
364,767
|
|
116,497
|
|
85,153
|
|
|||||
|
December 2013
|
300,257
|
|
53,781
|
|
23,266
|
|
|||||
|
March 2012
|
$
|
253,681
|
|
$
|
56,343
|
|
$
|
29,316
|
|
||
|
June 2012
|
285,805
|
|
90,038
|
|
46,602
|
|
|||||
|
September 2012
|
354,971
|
|
119,234
|
|
68,376
|
|
|||||
|
December 2012
|
291,591
|
|
65,816
|
|
30,991
|
|
|||||
The Company's business is influenced by seasonal weather conditions.
II-479
SELECTED CONSOLIDATED FINANCIAL AND OPERATING DATA
2009
-
2013
Southern Power Company and Subsidiary Companies
2013
Annual Report
|
|
2013
|
|
2012
|
|
2011
|
|
2010
|
|
2009
|
|
|||||||||
|
Operating Revenues (
in thousands
):
|
|||||||||||||||||||
|
Wholesale — non-affiliates
|
$
|
922,811
|
|
$
|
753,653
|
|
$
|
870,607
|
|
$
|
752,772
|
|
$
|
394,366
|
|
||||
|
Wholesale — affiliates
|
345,799
|
|
425,180
|
|
358,585
|
|
370,630
|
|
544,415
|
|
|||||||||
|
Total revenues from sales of electricity
|
1,268,610
|
|
1,178,833
|
|
1,229,192
|
|
1,123,402
|
|
938,781
|
|
|||||||||
|
Other revenues
|
6,616
|
|
7,215
|
|
6,769
|
|
6,939
|
|
7,870
|
|
|||||||||
|
Total
|
$
|
1,275,226
|
|
$
|
1,186,048
|
|
$
|
1,235,961
|
|
$
|
1,130,341
|
|
$
|
946,651
|
|
||||
|
Net Income (
in thousands
)
|
$
|
165,533
|
|
$
|
175,285
|
|
$
|
162,231
|
|
$
|
131,309
|
|
$
|
155,852
|
|
||||
|
Cash Dividends
on Common Stock (
in thousands
)
|
$
|
129,120
|
|
$
|
127,000
|
|
$
|
91,200
|
|
$
|
107,100
|
|
$
|
106,100
|
|
||||
|
Return on Average Common Equity (
percent
)
|
10.73
|
|
11.72
|
|
11.88
|
|
10.68
|
|
13.36
|
|
|||||||||
|
Total Assets (
in thousands
)
|
$
|
4,429,100
|
|
$
|
3,779,927
|
|
$
|
3,580,977
|
|
$
|
3,437,734
|
|
$
|
3,043,053
|
|
||||
|
Gross Property Additions/Plant Acquisitions (
in thousands
)
|
$
|
632,919
|
|
$
|
240,692
|
|
$
|
254,725
|
|
$
|
404,644
|
|
$
|
331,289
|
|
||||
|
Capitalization (
in thousands
):
|
|||||||||||||||||||
|
Common stock equity
|
$
|
1,563,952
|
|
$
|
1,522,357
|
|
$
|
1,468,682
|
|
$
|
1,263,220
|
|
$
|
1,195,122
|
|
||||
|
Long-term debt
|
1,619,241
|
|
1,306,099
|
|
1,302,758
|
|
1,302,619
|
|
1,297,607
|
|
|||||||||
|
Total (
excluding amounts due within one year
)
|
$
|
3,183,193
|
|
$
|
2,828,456
|
|
$
|
2,771,440
|
|
$
|
2,565,839
|
|
$
|
2,492,729
|
|
||||
|
Capitalization Ratios (
percent
):
|
|||||||||||||||||||
|
Common stock equity
|
49.1
|
|
53.8
|
|
53.0
|
|
49.2
|
|
47.9
|
|
|||||||||
|
Long-term debt
|
50.9
|
|
46.2
|
|
47.0
|
|
50.8
|
|
52.1
|
|
|||||||||
|
Total (
excluding amounts due within one year
)
|
100.0
|
|
100.0
|
|
100.0
|
|
100.0
|
|
100.0
|
|
|||||||||
|
Kilowatt-Hour Sales (
in thousands
):
|
|||||||||||||||||||
|
Wholesale — non-affiliates
|
15,110,616
|
|
15,636,986
|
|
16,089,875
|
|
13,294,455
|
|
7,513,569
|
|
|||||||||
|
Wholesale — affiliates
|
9,359,500
|
|
16,373,245
|
|
11,773,890
|
|
10,494,339
|
|
12,293,585
|
|
|||||||||
|
Total
|
24,470,116
|
|
32,010,231
|
|
27,863,765
|
|
23,788,794
|
|
19,807,154
|
|
|||||||||
|
Average Revenue Per Kilowatt-Hour (
cents
)
|
5.18
|
|
3.68
|
|
4.41
|
|
4.72
|
|
4.74
|
|
|||||||||
|
Plant Nameplate Capacity
Ratings (
year-end
) (
megawatts
)
|
8,924
|
|
8,764
|
|
7,908
|
|
7,908
|
|
7,880
|
|
|||||||||
|
Maximum Peak-Hour Demand (
megawatts
):
|
|||||||||||||||||||
|
Winter
|
2,685
|
|
3,018
|
|
3,255
|
|
3,295
|
|
3,224
|
|
|||||||||
|
Summer
|
3,271
|
|
3,641
|
|
3,589
|
|
3,543
|
|
3,308
|
|
|||||||||
|
Annual Load Factor (
percent
)
|
54.2
|
|
48.6
|
|
51.0
|
|
54.0
|
|
52.6
|
|
|||||||||
|
Plant Availability (
percent
)*
|
91.8
|
|
92.9
|
|
93.9
|
|
94.0
|
|
96.7
|
|
|||||||||
|
Source of Energy Supply (
percent
):
|
|||||||||||||||||||
|
Gas
|
88.5
|
|
91.0
|
|
89.2
|
|
88.8
|
|
84.4
|
|
|||||||||
|
Alternative (Solar and Biomass)
|
1.1
|
|
0.5
|
|
0.2
|
|
—
|
|
—
|
|
|||||||||
|
Purchased power —
|
|||||||||||||||||||
|
From non-affiliates
|
6.4
|
|
7.2
|
|
6.7
|
|
5.5
|
|
7.9
|
|
|||||||||
|
From affiliates
|
4.0
|
|
1.3
|
|
3.9
|
|
5.7
|
|
7.7
|
|
|||||||||
|
Total
|
100.0
|
|
100.0
|
|
100.0
|
|
100.0
|
|
100.0
|
|
|||||||||
|
*
|
Beginning in 2012, plant availability is calculated as a weighted equivalent availability.
|
II-480
PART III
Items 10, 11, 12 (other than the information in paragraph (b) in Item 12), 13, and 14 for Southern Company are incorporated by reference to Southern Company's Definitive Proxy Statement relating to the 2014 Annual Meeting of Stockholders. Specifically, reference is made to "Nominees for Election as Directors," "Corporate Governance," and "Section 16(a) Beneficial Ownership Reporting Compliance" for Item 10, "Executive Compensation," "Compensation Discussion and Analysis," "Compensation and Management Succession Committee Report," "Director Compensation," and "Director Compensation Table" for Item 11, "Stock Ownership Table" for Item 12, "Certain Relationships and Related Transactions" and "Director Independence" for Item 13, and "Principal Public Accounting Firm Fees" for Item 14.
Items 10, 11, 12 (other than the information in paragraph (b) in Item 12), 13, and 14 for Alabama Power, Georgia Power, and Mississippi Power are incorporated by reference to the Definitive Information Statements of Alabama Power, Georgia Power, and Mississippi Power relating to each of their respective 2014 Annual Meetings of Shareholders. Specifically, reference is made to "Nominees for Election as Directors," "Corporate Governance," and "Section 16(a) Beneficial Ownership Reporting Compliance" for Item 10, "Executive Compensation," "Compensation Discussion and Analysis," "Compensation and Management Succession Committee Report," "Director Compensation," and "Director Compensation Table" for Item 11, "Stock Ownership Table" for Item 12, "Certain Relationships and Related Transactions" and "Director Independence" for Item 13, and "Principal Public Accounting Firm Fees" for Item 14.
Items 10, 11, 12, 13, and 14 for Gulf Power are contained herein.
Items 10, 11, 12, and 13 for Southern Power are omitted pursuant to General Instruction I(2)(c) of Form 10-K. Item 14 for Southern Power is contained herein.
|
Item 10.
|
DIRECTORS, EXECUTIVE OFFICERS AND CORPORATE GOVERNANCE.
|
Identification of directors of Gulf Power.
|
S. W. Connally, Jr.
President and Chief Executive Officer
Age 44
Served as Director since 2012
|
Julian B. MacQueen
(1)
Age 63
Served as Director since 2013
|
|
Allan G. Bense
(1)
Age 62
Served as Director since 2010
|
J. Mort O'Sullivan, III
(1)
Age 62
Served as Director since 2010
|
|
Deborah H. Calder
(1)
Age 53
Served as Director since 2010 |
Michael T. Rehwinkel
(1)
Age 57
Served as Director since 2013 |
|
William C. Cramer, Jr.
(1)
Age 61
Served as Director since 2002 |
Winston E. Scott
(1)
Age 63
Served as Director since 2003 |
|
(1)
|
No position other than director.
|
Each of the above is currently a director of Gulf Power, serving a term running from the last annual meeting of Gulf Power's shareholders (June 25, 2013) for one year until the next annual meeting or until a successor is elected and qualified, except for Messrs. MacQueen and Rehwinkel whose elections were effective July 25, 2013 and November 21, 2013, respectively.
There are no arrangements or understandings between any of the individuals listed above and any other person pursuant to which he or she was or is to be selected as a director, other than any arrangements or understandings with directors or officers of Gulf Power acting solely in their capacities as such.
III-1
Identification of executive officers of Gulf Power.
|
S. W. Connally, Jr.
President and Chief Executive Officer
Age 44
Served as Executive Officer since 2012
|
Michael L. Burroughs
Vice President — Senior Production Officer
Age 53
Served as Executive Officer since 2010
|
|
P. Bernard Jacob (1)
Vice President — Customer Operations
Age 59
Served as Executive Officer since 2003
|
Bentina C. Terry
Vice President — External Affairs and Corporate Services
Age 43
Served as Executive Officer since 2007
|
|
Richard S. Teel
Vice President and Chief Financial Officer
Age 43
Served as Executive Officer since 2010
|
|
(1) Mr. Jacob will retire effective May 3, 2014.
Each of the above is currently an executive officer of Gulf Power, serving a term until the next annual organizational meeting or until a successor is elected and qualified.
There are no arrangements or understandings between any of the individuals listed above and any other person pursuant to which he or she was or is to be selected as an officer, other than any arrangements or understandings with directors or officers of Gulf Power acting solely in their capacities as such.
Identification of certain significant employees.
None.
Family relationships.
None.
Business experience.
Unless noted otherwise, each director has served in his or her present position for at least the past five years.
DIRECTORS
Gulf Power's Board of Directors possesses collective knowledge and experience in accounting, finance, leadership, business operations, risk management, corporate governance, and Gulf Power's industry.
S. W. Connally, Jr.
- President and Chief Executive Officer of Gulf Power since July 2012. Mr. Connally previously served as Senior Vice President and Chief Production Officer of Georgia Power from July 2010 through June 2012 and Manager of Alabama Power's Plant Barry from August 2007 through July 2010.
Allan G. Bense
- Panama City businessman and former Speaker of the Florida House of Representatives. Mr. Bense is a partner in several companies involved in road building, mechanical contracting, insurance, general contracting, golf courses, and farming and represented the Bay County area in the Florida House of Representatives beginning in 1998 and served as Speaker of the House from 2004 through 2006. Mr. Bense also served as Vice Chair of Enterprise Florida, the economic development agency for the state, from January 2009 to January 2011. Mr. Bense is also a member of the board of directors of Capital City Bank Group, Inc.
Deborah H. Calder
- Senior Vice President for Navy Federal Credit Union since June 2008. Since September 2007, Ms. Calder has directed the day-to-day operations of more than 2,700 employees and the ongoing construction of Navy Federal Credit Union's campus in the Pensacola area. Ms. Calder has been with Navy Federal Credit Union for over 20 years, serving in previous positions as Vice President of Consumer and Credit Card Lending, Vice President of Collections, Vice President of Call Center Operations, and Assistant Vice President of Credit Cards.
William C. Cramer, Jr.
- President and Owner of automobile dealerships in Florida, Georgia, and Alabama. Mr. Cramer has been an authorized Chevrolet dealer since 1986. In 2009, Mr. Cramer became an authorized dealer of Cadillac, Buick, and GMC vehicles.
Julian B. MacQueen
- Founder and Chief Executive Officer of Innisfree Hotels, Inc. He is currently a member of the American Hotel & Lodging Association and a director of the Beach Community Bank.
J. Mort O'Sullivan, III
- Managing Partner of Warren Averett O'Sullivan Creel LLP, an accounting firm originally formed as O'Sullivan Patton Jacobi in 1981. Mr. O'Sullivan currently focuses on consulting and management advisory services to clients, while continuing to offer his expertise in litigation support, business valuations, and mergers and acquisitions. He is a registered investment advisor.
Michael T. Rehwinkel
- Executive Chairman of EVRAZ North America, a steel manufacturer, since July 2013. He previously served as Chief Executive Officer and President of EVRAZ North America from February 2010 to July 2013 and held various
III-2
executive positions at Georgia-Pacific Corporation, including President of Wood Products from January 2009 to December 2009. Mr. Rehwinkel is also Chairman of the American Iron and Steel Institute. Mr. Rehwinkel has more than 30 years of industrial business and leadership experience.
Winston E. Scott
- Senior Vice President for External Relations, Florida Institute of Technology since March 2012. He previously served as Dean, College of Aeronautics, Florida Institute of Technology, Melbourne, Florida from August 2008 through March 2012 and Vice President and Deputy General Manager, Engineering and Science Contract Group at Jacobs Engineering, Houston, Texas, from September 2006 through July 2008. Mr. Scott is also a member of the board of directors of Environmental Tectonics Corporation. Mr. Scott's experience also included serving as a pilot in the U.S. Navy, as an astronaut with the National Aeronautic and Space Administration, and as executive director of the Florida Space Authority.
EXECUTIVE OFFICERS
Michael L. Burroughs
- Vice President and Senior Production Officer since August 2010. He previously served as Manager of Georgia Power's Plant Yates from September 2007 to July 2010.
P. Bernard Jacob
- Vice President of Customer Operations since 2007.
Richard S. Teel
- Vice President and Chief Financial Officer since August 2010. He previously served as Vice President and Chief Financial Officer of Southern Company Generation, a business unit of Southern Company, from January 2007 to July 2010.
Bentina C. Terry
- Vice President of External Affairs and Corporate Services since 2007.
Involvement in certain legal proceedings.
None.
Promoters and Certain Control Persons.
None.
Section 16(a) Beneficial Ownership Reporting Compliance.
None.
Code of Ethics
The registrants collectively have adopted a code of business conduct and ethics (Code of Ethics) that applies to each director, officer, and employee of the registrants and their subsidiaries. The Code of Ethics can be found on Southern Company's website located at
www.southerncompany.com
. The Code of Ethics is also available free of charge in print to any shareholder by requesting a copy from Melissa K. Caen, Corporate Secretary, Southern Company, 30 Ivan Allen Jr. Boulevard NW, Atlanta, Georgia 30308. Any amendment to or waiver from the code of ethics that applies to executive officers and directors will be posted on the website.
Corporate Governance
Southern Company has adopted corporate governance guidelines and committee charters. The corporate governance guidelines and the charters of Southern Company's Audit Committee, Compensation and Management Succession Committee, Finance Committee, Governance Committee, and Nuclear/Operations Committee can be found on Southern Company's website located at
www.southerncompany.com
. The corporate governance guidelines and charters are also available free of charge in print to any shareholder by requesting a copy from Melissa K. Caen, Corporate Secretary, Southern Company, 30 Ivan Allen Jr. Boulevard NW, Atlanta, Georgia 30308.
III-3
|
Item 11.
|
EXECUTIVE COMPENSATION
|
GULF POWER
|
COMPENSATION DISCUSSION AND ANALYSIS (CD&A)
|
||
|
In this CD&A and this Form 10-K, references to the “Compensation Committee” are to the Compensation and Management Succession Committee of the Board of Directors of Southern Company.
|
||
|
This section describes the compensation program for Gulf Power’s Chief Executive Officer and Chief Financial Officer in 2013, as well as each of its other three most highly compensated executive officers serving at the end of the year. Collectively, these officers are referred to as the named executive officers.
|
||
|
S. W. Connally, Jr.
|
President and Chief Executive Officer
|
|
|
Richard S. Teel
|
Vice President and Chief Financial Officer
|
|
|
Michael L. Burroughs
|
Vice President
|
|
|
P. Bernard Jacob
|
Vice President
|
|
|
Bentina C. Terry
|
Vice President
|
|
Executive Summary
Performance
Performance-based pay represents a substantial portion of the total direct compensation paid or granted to the named executive officers for 2013.
|
Salary ($)(1)
|
% of Total
|
Short-Term Performance Pay ($)(1)
|
% of Total
|
Long-Term Performance Pay ($)(1)
|
% of Total
|
|
|
S. W. Connally, Jr.
|
372,977
|
36
|
164,557
|
16
|
488,381
|
48
|
|
R. S. Teel
|
244,903
|
52
|
80,895
|
17
|
147,715
|
31
|
|
M. L. Burroughs
|
193,498
|
59
|
59,127
|
18
|
77,774
|
23
|
|
P. B. Jacob
|
258,605
|
52
|
85,236
|
17
|
155,665
|
31
|
|
B. C. Terry
|
262,809
|
52
|
86,809
|
17
|
158,513
|
31
|
(1) Salary is the actual amount paid in 2013, Short-Term Performance Pay is the actual amount earned in 2013 based on performance, and Long-Term Performance Pay is the value on the grant date of stock options and performance shares granted in 2013. See the Summary Compensation Table for the amounts of all elements of reportable compensation described in this CD&A.
Gulf Power financial and operational and Southern Company earnings per share (EPS) goal results for 2013 are shown below:
|
Financial: 43% of Target
|
Operational: 177% of Target
|
EPS: 0% of Target
|
Southern Company’s annualized total shareholder return has been:
|
1-Year: 0.49 %
|
3-Year: 7.22%
|
5-year: 7.22%
|
These levels of achievement resulted in payouts that were aligned with Gulf Power and Southern Company performance
.
III-4
Compensation and Benefit Beliefs
The compensation and benefit program is based on the following beliefs:
|
•
|
Employees’ commitment and performance have a significant impact on achieving business results;
|
|
•
|
Compensation and benefits offered must attract, retain, and engage employees and must be financially sustainable;
|
|
•
|
Compensation should be consistent with performance: higher pay for higher performance and lower pay for lower performance; and
|
|
•
|
Both business drivers and culture should influence the compensation and benefit program.
|
Based on these beliefs, the Compensation Committee believes that Gulf Power’s executive compensation program should:
|
•
|
Be competitive with the companies in Gulf Power’s industry;
|
|
•
|
Motivate and reward achievement of Gulf Power’s goals;
|
|
•
|
Be aligned with the interests of Southern Company’s stockholders and Gulf Power’s customers; and
|
|
•
|
Not encourage excessive risk-taking.
|
Executive compensation is targeted at the market median of industry peers, but actual compensation is primarily determined by achievement of Gulf Power’s business goals. Gulf Power believes that focusing on its customers drives achievement of financial objectives and delivery of a premium, risk-adjusted total shareholder return for Southern Company’s stockholders. Therefore, short-term performance pay is based on achievement of Gulf Power’s operational and financial performance goals, with one-third determined by operational performance, such as safety, reliability, and customer satisfaction; one-third determined by financial performance; and one-third determined by Southern Company's EPS performance. Long-term performance pay is tied to Southern Company's stockholder value, with 40% of the target value awarded in Southern Company stock options, which reward stock price appreciation, and 60% awarded in performance share units, which reward Southern Company's total shareholder return performance relative to that of industry peers and stock price appreciation
.
Key Governance and Pay Practices
• Annual pay risk assessment required by the Compensation Committee charter.
|
•
|
Retention of an independent compensation consultant by the Compensation Committee, Pay Governance LLC, that provides no other services to Gulf Power or Southern Company.
|
|
•
|
Inclusion of a claw-back provision that permits the Compensation Committee to recoup performance pay from any employee if determined to have been based on erroneous results, and requires recoupment from an executive officer in the event of a material financial restatement due to fraud or misconduct of the executive officer.
|
• No excise tax gross-up on change-in-control severance arrangements.
|
•
|
Provision of limited ongoing perquisites and no income tax gross-ups for the Chief Executive Officer except on certain relocation-related benefits.
|
• “No-hedging” provision in Gulf Power’s insider trading policy that is applicable to all employees.
• Strong stock ownership requirements that are being met by all named executive officers.
III-5
|
ESTABLISHING EXECUTIVE COMPENSATION
|
||
The Compensation Committee establishes the Southern Company system executive compensation program. In doing so, the Compensation Committee uses information from others, principally its independent compensation consultant, Pay Governance LLC. The Compensation Committee also relies on information from Southern Company’s Human Resources staff and, for individual executive officer performance, from Southern Company’s and Gulf Power’s respective Chief Executive Officers. The role and information provided by each of these sources is described throughout this CD&A.
Consideration of Advisory Vote on Executive Compensation
The Compensation Committee considered the stockholder vote on Southern Company’s executive compensation at the 2013 Annual Meeting of Stockholders. In light of the significant support of Southern Company's stockholders (94% of votes cast voting in favor of the proposal) and the actual payout levels of the performance-based compensation program, the Compensation Committee continues to believe that the executive compensation program is competitive, aligned with financial and operational performance, and in the best interests of Gulf Power’s customers and Southern Company’s stockholders.
Executive Compensation Focus
The executive compensation program places significant focus on rewarding performance. The program is performance-based in several respects:
|
•
|
Business unit performance, which includes return on equity (ROE) or net income, and operational performance, compared to target levels established early in the year, and EPS determine the actual payouts under the short-term (annual) performance-based compensation program (Performance Pay Program).
|
|
•
|
Southern Company Common Stock (Common Stock) price changes result in higher or lower ultimate values of stock options.
|
|
•
|
Southern Company total shareholder return compared to those of industry peers leads to higher or lower payouts under the Performance Share Program (performance shares).
|
In support of this performance-based pay philosophy, Gulf Power has no general employment contracts or guaranteed severance with the named executive officers, except upon a change in control.
The pay-for-performance principles apply not only to the named executive officers, but to all employees. The Performance Pay Program covers almost all of the more than 1,400 employees of Gulf Power. Stock options and performance shares are granted to over 115 employees of Gulf Power. These programs engage employees, which ultimately is good not only for them, but also for Gulf Power’s customers and Southern Company’s stockholders.
III-6
|
OVERVIEW OF EXECUTIVE COMPENSATION COMPONENTS
|
The primary components of the 2013 executive compensation program are shown below:
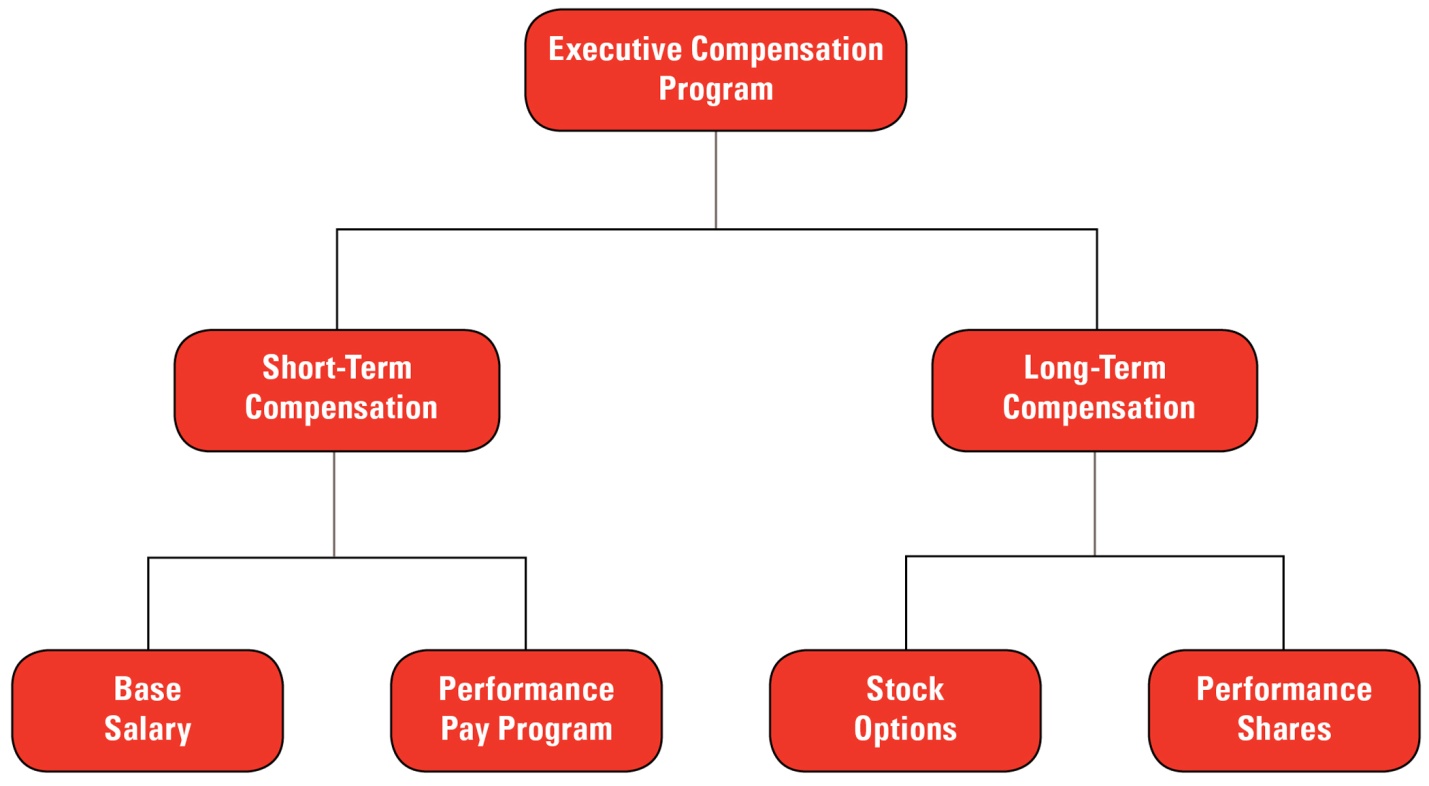 Gulf Power’s executive compensation program consists of a combination of short-term and long-term components. Short-term compensation includes base salary and the Performance Pay Program. Long-term compensation includes stock options and performance shares. The performance-based compensation components are linked to financial and operational performance, Common Stock performance, and Southern Company's total shareholder return. The executive compensation program is approved by the Compensation Committee, which consists entirely of independent directors. The Compensation Committee believes that the executive compensation program is a balanced program that provides market-based compensation and motivates and rewards performance.
|
ESTABLISHING MARKET-BASED COMPENSATION LEVELS
|
For the named executive officers, the Compensation Committee and Southern Company Human Resources staff review compensation data from large, publicly-owned electric and gas utilities. Pay Governance LLC develops and presents to the Compensation Committee a competitive market-based compensation level for the Gulf Power Chief Executive Officer. Southern Company Human Resources staff develops competitive market pay rates for the other Gulf Power named executive officers. The market-based compensation levels for both are developed from a size-appropriate energy services executive compensation survey database. The survey participants are utilities with revenues of $1 billion or more (see table below). The Compensation Committee reviews the data and uses it in establishing market-based compensation levels for the executives.
III-7
|
AGL Resources Inc.
|
Exelon Corporation
|
Portland General Electric Company
|
|
Alliant Energy Corporation
|
FirstEnergy Corp.
|
PPL Corporation
|
|
Ameren Corporation
|
First Solar Inc.
|
Proliance Holdings, LLC
|
|
American Electric Power Company, Inc.
|
GDF SUEZ Energy North America, Inc.
|
Public Service Enterprise Group Inc.
|
|
Areva Inc.
|
Hunt Consolidated, Inc.
|
Puget Energy, Inc.
|
|
Atmos Energy Corporation
|
Iberdrola USA, Inc.
|
Questar Corporation
|
|
Avista Corporation
|
Idaho Power Company
|
Sacramento Municipal Utility District
|
|
Bg US Services, Inc.
|
Indianapolis Power & Light Company
|
|
|
Black Hills Corporation
|
Integrys Energy Group, Inc.
|
SAIC
|
|
Boardwalk Pipeline Partners, L.P.
|
JEA
|
Salt River Project
|
|
Calpine Corporation
|
Kinder Morgan Energy Partners, L.P.
|
SCANA Corporation
|
|
Capital Power Corporation
|
LG&E and KU Energy LLC
|
Sempra Energy
|
|
CenterPoint Energy, Inc.
|
Lower Colorado River Authority
|
Southern Company Services, Inc.
|
|
CMS Energy Corporation
|
MDU Resources Group, Inc.
|
Southwest Gas Corporation
|
|
Consolidated Edison, Inc.
|
MidAmerican Energy Company
|
Spectra Energy Corp.
|
|
Constellation Energy Group, Inc.
|
National Grid USA
|
SunCoke Energy, Inc.
|
|
CPS Energy
|
New York Power Authority
|
TECO Energy, Inc.
|
|
Crosstex Energy, Inc.
|
NextEra Energy, Inc.
|
Tennessee Valley Authority
|
|
Dominion Resources, Inc.
|
NiSource Inc.
|
The AES Corporation
|
|
DTE Energy Company
|
Northeast Utilities
|
The Babcock & Wilcox Company
|
|
Duke Energy Corporation
|
NorthWestern Corporation
|
The Williams Companies, Inc.
|
|
DynegyInc.
|
NRG Energy, Inc.
|
TransCanada Corporation
|
|
Edison International
|
NV Energy, Inc.
|
UGI Corporation
|
|
Edison Mission Energy
|
Oglethorpe Power Corporation
|
UIL Holdings
|
|
ElectriCities of North Carolina
|
Omaha Public Power District
|
UNS Energy Corporation
|
|
Energen Corporation
|
Oncor Electric Delivery Company LLC
|
URENCO USA
|
|
Energy Future Holdings Corp.
|
ONEOK, Inc.
|
USEC Inc.
|
|
Energy Solutions, Inc.
|
Pacific Gas & Electric Company
|
Vectren Corporation
|
|
Energy Transfer Partners, L.P.
|
Pepco Holdings, Inc.
|
Westar Energy, Inc.
|
|
Entergy Corporation
|
Pinnacle West Capital Corporation
|
Wisconsin Energy Corporation
|
|
EQT Corporation
|
PNM Resources Inc.
|
Xcel Energy Inc.
|
Market data for the chief executive officer position and other positions in terms of scope of responsibilities that most closely resemble the positions held by the named executive officers is reviewed. When appropriate, the market data is size-adjusted, up or down, to accurately reflect comparable scopes of responsibility. Based on the data, a total target compensation opportunity is established for each named executive officer. Total target compensation opportunity is the sum of base salary, annual performance-based compensation at a target performance level, and long-term performance-based compensation (stock options and performance shares) at a target value. Actual compensation paid may be more or less than the total target compensation opportunity based on actual performance above or below target performance levels. As a result, the compensation program is designed to result in payouts that are market-appropriate given Gulf Power’s and Southern Company’s performance for the year or period.
A specified weight was not targeted for base salary or annual or long-term performance-based compensation as a percentage of total target compensation opportunities, nor did amounts realized or realizable from prior compensation serve to increase or decrease 2013 compensation amounts. Total target compensation opportunities for senior management as a group, including the named executive officers, are managed to be at the median of the market for companies of similar size in the electric utility industry. Therefore, some executives may be paid above and others below market. This practice allows for differentiation based on time in the position, scope of responsibilities, and individual performance. The differences in the total pay opportunities for each named executive officer are based almost exclusively on the differences indicated by the market data for persons holding similar positions. Because of the use of market data from a large number of industry peer companies for positions that are not identical in terms of scope of responsibility from company to company, minor differences are not considered to be material and the compensation program is believed to be
III-8
market-appropriate, as long as senior management as a group is within an appropriate range. Generally, compensation is considered to be within an appropriate range if it is not more or less than 15% of the applicable market data. The total target compensation opportunity was established in early 2013 for each named executive officer below:
|
|
Salary ($)
|
Target Annual
Performance-Based
Compensation
($)
|
Target Long-Term
Performance-Based
Compensation
($)
|
Total Target
Compensation
Opportunity
($)
|
|
S. W. Connally, Jr.
|
375,700
|
225,420
|
488,381
|
1,089,501
|
|
R. S. Teel
|
246,255
|
110,815
|
147,715
|
504,785
|
|
M. L. Burroughs
|
194,496
|
77,799
|
77,774
|
350,069
|
|
P. B. Jacob
|
259,469
|
116,761
|
155,665
|
531,895
|
|
B. C. Terry
|
264,260
|
118,917
|
158,513
|
541,690
|
The salary levels shown above were not effective until March 2013. Therefore, the salary amounts reported in the Summary Compensation Table are different than the amounts shown above because that table reports actual amounts paid in 2013.
For purposes of comparing the value of the compensation program to the market data, stock options are valued at $2.92 per option and performance shares at $40.50 per unit. These values represent risk-adjusted present values on the date of grant and are consistent with the methodologies used to develop the market data. The mix of stock options and performance shares granted were 40% and 60%, respectively, of the long-term value shown above.
In 2012, Pay Governance LLC analyzed the level of actual payouts for 2011 performance under the annual Performance Pay Program to the named executive officers relative to performance versus peer companies to provide a check on the goal-setting process, including goal levels and associated performance-based pay opportunities. The findings from the analysis were used in establishing performance goals and the associated range of payouts for goal achievement for 2013. That analysis was updated in 2013 by Pay Governance LLC for 2012 performance, and those findings were used in establishing goals for 2014.
|
DESCRIPTION OF KEY COMPENSATION COMPONENTS
|
2013 Base Salary
Most employees, including all of the named executive officers, received base salary increases in 2013.
With the exception of Southern Company executive officers, including Mr. Connally, base salaries for all Southern Company system officers are within a position level with a base salary range that is established by Southern Company Human Resources staff using the market data described above. Each officer is within one of these established position levels based on the scope of responsibilities that most closely resemble the positions included in the market data described above. The base salary level for individual officers is set within the applicable pre-established range. Factors that influence the specific base salary level within the range include the need to retain an experienced team, internal equity, time in position, and individual performance. Individual performance includes the degree of competence and initiative exhibited and the individual’s relative contribution to the results of operations in prior years. Base salaries are reviewed annually in February and changes are made effective March 1. The base salary levels established early in the year for the named executive officers were set within the applicable position level salary range and were recommended by the individual named executive officer’s superior and approved by Southern Company's Chief Executive Officer. Mr. Connally's base salary increase was approved by the Compensation Committee.
III-9
2013 Performance-Based Compensation
This section describes performance-based compensation for 2013.
Achieving Operational and Financial Performance Goals — The Guiding Principle for Performance-Based Compensation
The Southern Company system’s number one priority is to continue to provide customers outstanding reliability and superior service at reasonable prices while achieving a level of financial performance that benefits Southern Company’s stockholders in the short and long term. Operational excellence and business unit and Southern Company financial performance are integral to the achievement of business results that benefit customers and stockholders.
Therefore, in 2013, Gulf Power strove for and rewarded:
|
•
|
Continuing industry-leading reliability and customer satisfaction, while maintaining reasonable retail prices;
|
• Meeting energy demand with the best economic and environmental choices;
• ROE - target performance level in the top quartile of comparable electric utilities;
• Southern Company dividend growth;
• Long-term, risk-adjusted total shareholder return; and
• Financial integrity — an attractive risk-adjusted return and sound financial policy.
The performance-based compensation program is designed to encourage achievement of these goals.
The Southern Company Chief Executive Officer, with the assistance of Southern Company’s Human Resources staff, recommended to the Compensation Committee the program design and award amounts for senior management, including the named executive officers.
2013 Annual Performance-Based Pay Program
Annual Performance Pay Program Highlights
|
Ÿ
Rewards achievement of annual goals:
Ÿ
EPS
Ÿ
Business unit financial performance (ROE or net income)
Ÿ
Business unit operational performance
Ÿ
Goals are weighted one-third each
Ÿ
Performance results range from 0% to 200% of target, based on level of goal achievement
|
Overview of Program Design
Almost all employees of Gulf Power, including the named executive officers, are participants.
The performance goals are set at the beginning of each year by the Compensation Committee.
|
•
|
EPS is defined as Southern Company’s net income from ongoing business activities divided by average shares outstanding during the year. The EPS performance measure is applicable to all participants in the Performance Pay Program.
|
|
•
|
For Southern Company’s traditional operating companies, including Gulf Power, the business unit financial performance goal is ROE, which is defined as the traditional operating company’s net income divided by average equity for the year. For Southern Power, the business unit financial performance goal is net income.
|
|
•
|
For Southern Company’s traditional operating companies, including Gulf Power, operational goals are safety, customer satisfaction, plant availability, transmission and distribution system reliability, and culture. For the nuclear operating company, Southern Nuclear, operational goals are safety, plant operations, and culture. Each of these operational goals is explained in more detail under Goal Details below. The level of achievement for each operational goal is determined according to the respective performance schedule, and the total operational goal performance is determined by the weighted average result. Each business unit has its own operational goals.
|
III-10
The Compensation Committee may make adjustments, both positive and negative, to goal achievement for purposes of determining payouts. For the financial performance goals, such adjustments could include the impact of items considered non-recurring or outside of normal operations or not anticipated in the business plan when the EPS goal was established and of sufficient magnitude to warrant recognition. In 2013, Southern Company recorded pre-tax charges to earnings of $1.14 billion due to estimated probable losses relating to Mississippi Power's construction of the Kemper IGCC. Although these charges are not expected to occur with regularity, the Compensation Committee did not exclude the charges with respect to the EPS goal, and consequently the EPS result was under the threshold performance level that was established at the beginning of the year. As a result, no payout associated with EPS was made to any employee in the Southern Company system, including Gulf Power's named executive officers.
There are over 4,000 Southern Company system employees that provide professional and technical support to all of Southern Company's subsidiaries, including Gulf Power. For that reason, the business unit financial goal component for these employees is based largely on Southern Company corporate-level ROE. Due to the charges described above, Mississippi Power's net income was negative $477 million, and, therefore, its ROE was below the threshold performance level established, which resulted in a zero payout on the business unit financial goal for Mississippi Power employees. Additionally, the impact of Mississippi Power's negative net income resulted in a Southern Company corporate-level ROE that was below the threshold performance level established by the Compensation Committee. Therefore, for the employees paid based on Southern Company corporate-level ROE, including Mr. Burroughs, this would have resulted in no payout for Southern Company corporate-level ROE, despite above threshold achievement at the other business units supported by these employees. For that reason, the Compensation Committee believed that a zero payout on the Southern Company corporate-level ROE component was not an equitable result for all of those employees and amended the methodology for calculating Southern Company corporate-level ROE from an aggregate ROE to a weighted average payout. The weighted average payout methodology is the methodology that was used under the annual performance-based pay program prior to 2010. See "Calculating Payouts" in this CD&A for a full description of how payouts were calculated for Mr. Burroughs.
Under the terms of the program, no payout can be made if Southern Company’s current earnings are not sufficient to fund the Common Stock dividend at the same level or higher than the prior year (dividend funding mechanism). In 2013, the Compensation Committee clarified that the dividend funding mechanism was not intended to apply when Southern Company earnings are insufficient due to items not expected to occur with any regularity that do not impact Southern Company's financial ability to fund the Common Stock dividend, such as the Kemper IGCC charges described above.
Goal Details
|
Financial Performance Goals
|
Description
|
Why It Is Important
|
|
EPS
|
Southern Company's net income from ongoing business activities divided by average shares outstanding during the year.
|
Supports commitment to provide Southern Company's stockholders solid, risk-adjusted returns.
|
|
Business Unit ROE/Net Income
|
For the traditional operating companies, including Gulf Power, the business unit financial performance goal is ROE, which is defined as the applicable company's net income divided by average equity for the year. For Southern Power, the business unit financial performance goal is net income.
|
Supports delivery of Southern Company stockholder value and contributes to Gulf Power's and Southern Company's sound financial policies and stable credit ratings.
|
III-11
|
Operational Goals
|
Description
|
Why It Is Important
|
|
Customer Satisfaction
|
Customer satisfaction surveys evaluate performance. The survey results provide an overall ranking for each traditional operating company, including Gulf Power, as well as a ranking for each customer segment: residential, commercial, and industrial.
|
Customer satisfaction is key to operations. Performance of all operational goals affects customer satisfaction.
|
|
Reliability
|
Transmission and distribution system reliability performance is measured by the frequency and duration of outages. Performance targets for reliability are set internally based on recent historical performance.
|
Reliably delivering power to customers is essential to Gulf Power's operations.
|
|
Availability
|
Peak season equivalent forced outage rate is an indicator of availability and efficient generation fleet operations during the months when generation needs are greatest. Availability is measured as a percentage of the hours of forced outages out of the total generation hours.
|
Availability of sufficient power during peak season fulfills the obligation to serve and provide customers with the least cost generating resources.
|
|
Nuclear Plant Operations
|
Nuclear plant performance is evaluated by measuring nuclear safety as rated by independent industry evaluators, as well as by a quantitative score comprised of various plant performance indicators. Plant reliability and operational availability are measured as a percentage of time the nuclear plant is operating. The reliability and availability metrics take generation reductions associated with planned outages into consideration.
|
Safe and efficient operation of the nuclear fleet is important for delivering clean energy at a reasonable price.
|
|
Major Projects - Plant Vogtle Units 3 and 4 and Kemper IGCC
|
To help ensure the construction and licensing of Plant Vogtle Units 3 and 4 and the Kemper IGCC are on time, on budget, and in full compliance with all pertinent safety and quality requirements, the Southern Company system has an executive review committee in place for each project to assess progress towards these goals. Each committee may consider a combination of subjective and objective measures to determine their evaluation. Final assessments for each project are approved by the Southern Company chief executive officer and confirmed by the Nuclear/Operations Committee of the Southern Company Board of Directors.
|
Strategic projects enable the Southern Company system to expand capacity to provide clean, affordable energy to customers across the region.
|
|
Safety
|
Southern Company's Target Zero program is focused on continuous improvement in having a safe work environment. The performance is measured by the applicable company's ranking, as compared to peer utilities in the Southeastern Electric Exchange.
|
Essential for the protection of employees, customers, and communities.
|
|
Culture
|
The culture goal seeks to improve Gulf Power's inclusive workplace. This goal includes measures for work environment (employee satisfaction survey), representation of minorities and females in leadership roles (subjectively assessed), and supplier diversity.
|
Supports workforce development efforts and helps to assure diversity of suppliers.
|
The range of EPS, business unit ROE, and Southern Power net income goals for 2013 is shown below. ROE goals vary from the allowed retail ROE range due to state regulatory accounting requirements, wholesale activities, other non-jurisdictional revenues and expenses, and other activities not subject to state regulation.
|
Level of Performance
|
EPS ($)
|
ROE (%)
|
Southern Power
Net Income ($)
(millions)
|
|
Maximum
|
2.87
|
14.0
|
215
|
|
Target
|
2.74
|
12.0
|
175
|
|
Threshold
|
2.61
|
9.0
|
135
|
In setting the goals for pay purposes, the Compensation Committee relies on information on financial and operational goals from the Finance Committee and the Nuclear/Operations Committee of Southern Company’s Board of Directors, respectively.
III-12
The ranges of performance levels established for the primary operational goals are detailed below.
|
Level of
Performance
|
Customer
Satisfaction
|
Reliability
|
Availability
|
Nuclear Plant Operations
|
Safety
|
Plant Vogtle Units 3 and 4 and Kemper IGCC
|
Culture
|
|
Maximum
|
Top quartile for all customer segments
and overall
|
Significantly
exceed targets
|
Industry best
|
Significantly
exceed targets
|
Greater than
90
th
percentile or five-year company best
|
Significantly exceed targets
|
Significant
improvement
|
|
Target
|
Top quartile overall
|
Meet targets
|
Top quartile
|
Meet targets
|
60th percentile
|
Meet targets
|
Improvement
|
|
Threshold
|
2nd quartile overall
|
Significantly below targets
|
2nd quartile
|
Significantly
below targets
|
40th percentile
|
Significantly below targets
|
Significantly below expectations
|
The Compensation Committee approves specific objective performance schedules to calculate performance between the threshold, target, and maximum levels for each of the operational goals. If goal achievement is below threshold, there is no payout associated with the applicable goal.
2013 Achievement
Actual 2013 goal achievement is shown in the following tables.
Financial Performance Goal Results:
|
Goal
|
Result
|
Achievement Percentage (%)
|
|
EPS (from ongoing business activities)
|
$1.88
|
0
|
|
Gulf Power ROE
|
10.3%
|
43
|
|
Corporate ROE
|
Weighted average
|
113
|
|
Southern Power Net Income
|
$165.5M
|
76
|
Due to the pre-tax charges to Southern Company earnings related to Mississippi Power's construction of the Kemper IGCC, Southern Company's EPS for 2013 fell below the threshold necessary for payment under the Performance Pay Program. No payout was associated with the EPS goal.
Operational Goal Results:
|
Gulf Power
|
Achievement Percentage
|
|
Customer Satisfaction
|
200
|
|
Reliability
|
200
|
|
Availability
|
200
|
|
Safety
|
144
|
|
Culture
|
141
|
|
Total Gulf Power Operational Goal Performance Factor
|
177
|
|
Southern Company Generation
|
Achievement Percentage
|
|
Customer Satisfaction
|
200
|
|
Reliability
|
100
|
|
Availability
|
200
|
|
Safety
|
57
|
|
Culture
|
141
|
|
Major Projects - Plant Vogtle Units 3 & 4
|
175
|
|
Major Projects - Kemper IGCC
|
0
|
|
Total Southern Company Generation Operational Goal Performance Factor
|
133
|
III-13
Calculating Payouts:
All of the named executive officers are paid based on EPS performance. With the exception of Mr. Burroughs, all of the named executive officers are paid based on Gulf Power ROE and operational performance. Southern Company Generation officers, including Mr. Burroughs, are paid based on the goal achievement of the traditional operating company supported (60%) and Southern Company Generation (40%). With the exception of the culture and safety goals, Southern Company Generation’s operational goal results are the corporate/aggregate results.
A total performance factor is determined by adding the EPS and applicable business unit financial and operational goal performance results and dividing by three. The total performance factor is multiplied by the target Performance Pay Program opportunity, as described above, to determine the payout for each named executive officer. The table below shows the calculation of the total performance factor for each of the named executive officers, based on results shown above.
|
Southern Company EPS Result (%)
1/3 weight
|
Business Unit Financial Goal Result (%)
1/3 weight
|
Business Unit Operational Goal Result (%)
1/3 weight
|
Total Performance Factor (%)
|
|
|
S. W. Connally, Jr.
|
0
|
43
|
177
|
73
|
|
R. S. Teel
|
0
|
43
|
177
|
73
|
|
M. L. Burroughs
|
0
|
70
|
159
|
76
|
|
P. B. Jacob
|
0
|
43
|
177
|
73
|
|
B. C. Terry
|
0
|
43
|
177
|
73
|
The table below shows the pay opportunity at target-level performance and the actual payout based on the actual performance shown above.
|
|
Target Annual Performance Pay Program Opportunity (%)
|
Target Annual
Performance
Pay Program
Opportunity ($)
|
Total
Performance
Factor (%)
|
Actual Annual
Performance
Pay Program
Payout ($)
|
|
S. W. Connally, Jr.
|
60
|
225,420
|
73
|
164,557
|
|
R. S. Teel
|
45
|
110,815
|
73
|
80,895
|
|
M. L. Burroughs
|
40
|
77,799
|
76
|
59,127
|
|
P. B. Jacob
|
45
|
116,761
|
73
|
85,236
|
|
B. C. Terry
|
45
|
118,917
|
73
|
86,809
|
III-14
Long-Term Performance-Based Compensation
2013 Long-Term Pay Program Highlights
|
Ÿ
Stock Options:
§
Reward long-term Common Stock price appreciation
§
Represent 40% of long-term target value
§
Vest over three years
§
Ten-year term
Ÿ
Performance Shares:
§
Reward total shareholder return relative to industry peers and stock price appreciation
§
Represent 60% of long-term target value
§
Three-year performance period
§
Performance results can range from 0% to 200% of target
§
Paid in Common Stock at end of performance period
|
Overview of Program Design
Long-term performance-based awards are intended to promote long-term success and increase Southern Company's stockholder value by directly tying a substantial portion of the named executive officers’ total compensation to the interests of Southern Company’s stockholders. The long-term awards provide an incentive to grow Southern Company's stockholder value. Long-term performance-based awards also benefit customers by providing competitive compensation that allows the Southern Company system to attract, retain, and engage employees who provide focus on serving customers and delivering safe and reliable electric service.
Stock options represent 40% of the long-term performance target value and performance shares represent the remaining 60%. The Compensation Committee elected this mix because it concluded that doing so represented an appropriate balance between incentives. Stock options only generate value if the price of the stock appreciates after the grant date, and performance shares reward employees based on Southern Company total shareholder return relative to industry peers, as well as Common Stock price.
The following table shows the grant date fair value of the long-term performance-based awards in total and each component awarded in 2013.
|
Value of
Options ($)
|
Value of
Performance Shares ($)
|
Total Long-Term
Value ($)
|
|
|
S. W. Connally, Jr.
|
195,363
|
293,018
|
488,381
|
|
R. S. Teel
|
59,101
|
88,614
|
147,715
|
|
M. L. Burroughs
|
31,118
|
46,656
|
77,774
|
|
P. B. Jacob
|
62,272
|
93,393
|
155,665
|
|
B. C. Terry
|
63,419
|
95,094
|
158,513
|
Stock Options
Stock options granted have a 10-year term, vest over a three-year period, fully vest upon retirement or termination of employment following a change in control, and expire at the earlier of five years from the date of retirement or the end of the 10-year term. For the grants made in 2013, unvested options are forfeited if the named executive officer retires from the Southern Company system and accepts a position with a peer company within two years of retirement. The value of each stock option was derived using the Black-Scholes stock option pricing model. The assumptions used in calculating that amount are discussed in Note 8 to the financial statements of Gulf Power in Item 8 herein. For 2013, the Black-Scholes value on the grant date was $2.92 per stock option.
Performance Shares
2013-2015 Grant
Performance shares are denominated in units, meaning no actual shares are issued on the grant date. A grant date fair value per unit was determined using a Monte-Carlo simulation model. For the grant made in 2013, the value per unit was $40.50. See the Summary Compensation Table and the information accompanying it for more information on the grant date fair value. The total target value for
III-15
performance share units is divided by the value per unit to determine the number of performance share units granted to each participant, including the named executive officers. Each performance share unit represents one share of Common Stock.
At the end of the three-year performance period (January 1, 2013 through December 31, 2015), the number of units will be adjusted up or down (0% to 200%) based on Southern Company’s total shareholder return relative to that of its peers in the Philadelphia Utility Index and the Southern Company custom peer group. The companies in the custom peer group are those that are believed to be most similar to Southern Company in both business model and investors. The Philadelphia Utility Index was chosen because it is a published index and, because it includes a larger number of peer companies, it can mitigate volatility in results over time, providing an appropriate level of balance. The peer groups vary from the Market Data peer group discussed previously due to the timing and criteria of the peer selection process; however, there is significant overlap. The results of the two peer groups will be averaged. The number of performance share units earned will be paid in Common Stock at the end of the three-year performance period. No dividends or dividend equivalents will be paid or earned on the performance share units.
The peers in the Philadelphia Utility Index on the grant date are listed below.
|
Ameren Corporation
|
Entergy Corporation
|
|
American Electric Power Company, Inc.
|
Exelon Corporation
|
|
CenterPoint Energy, Inc.
|
FirstEnergy Corp.
|
|
Consolidated Edison, Inc.
|
NextEra Energy, Inc.
|
|
Covanta Holding Corporation
|
Northeast Utilities
|
|
Dominion Resources, Inc.
|
PG&E Corporation
|
|
DTE Energy Company
|
Public Service Enterprise Group Inc.
|
|
Duke Energy Corporation
|
The AES Corporation
|
|
Edison International
|
Xcel Energy Inc.
|
|
El Paso Electric Company
|
|
The peers in the custom peer group on the grant date are listed below.
|
Alliant Energy Corporation
|
Northeast Utilities
|
|
Ameren Corporation
|
Pepco Holdings, Inc.
|
|
American Electric Power Company, Inc.
|
PG&E Corporation
|
|
CMS Energy Corporation
|
Pinnacle West Capital Corporation
|
|
Consolidated Edison, Inc.
|
SCANA Corporation
|
|
DTE Energy Company
|
Wisconsin Energy Corporation
|
|
Duke Energy Corporation
|
Xcel Energy Inc.
|
|
Edison International
|
|
The scale below will determine the number of units paid in Common Stock following the last year of the performance period, based on the 2013 through 2015 performance period. Payout for performance between points will be interpolated on a straight-line basis.
|
Performance vs. Peer Group
|
Payout (% of Each Performance Share Unit Paid)
|
|
90th percentile or higher (Maximum)
|
200
|
|
50th percentile (Target)
|
100
|
|
10th percentile or lower (Threshold)
|
0
|
Performance shares are not earned until the end of the three-year performance period. A participant who terminates, other than due to retirement or death, forfeits all unearned performance shares. Participants who retire or die during the performance period only earn a prorated number of units, based on the number of months they were employed during the performance period.
2011-2013 Payouts
The performance share grants were made in 2011 with a three-year performance period that ended on December 31, 2013. Based on Southern Company’s total shareholder return achievement relative to that of the Philadelphia Utility Index (50%) and the customer
III-16
peer group (10%), the payout percentage was 30% of target. The following table shows the target and actual awards of performance shares for the named executive officers.
|
|
Target Performance Shares (#)
|
Target Value of Performance Shares ($)
|
Performance Shares Earned (#)
|
Value of Performance Shares Earned ($)
|
|
S. W. Connally, Jr.
|
2,182
|
78,487
|
654
|
26,886
|
|
R. S. Teel
|
2,273
|
81,760
|
681
|
27,996
|
|
M. L. Burroughs
|
1,213
|
43,632
|
363
|
14,923
|
|
P. B. Jacob
|
2,500
|
89,925
|
750
|
30,833
|
|
B. C. Terry
|
2,517
|
90,536
|
755
|
31,038
|
Timing of Performance-Based Compensation
As discussed above, the 2013 annual Performance Pay Program goals and the total shareholder return goals applicable to performance shares were established early in the year by the Compensation Committee. Annual stock option grants also were made by the Compensation Committee. The establishment of performance-based compensation goals and the granting of stock options were not timed with the release of material, non-public information. This procedure is consistent with prior practices. Stock option grants are made to new hires or newly-eligible participants on preset, regular quarterly dates that were approved by the Compensation Committee. The exercise price of options granted to employees in 2013 was the closing price of the Common Stock on the grant date or the last trading day before the grant date, if the grant date was not a trading day.
Retirement and Severance Benefits
Certain post-employment compensation is provided to employees, including the named executive officers.
Retirement Benefits
Generally, all full-time employees of Gulf Power participate in the funded Pension Plan after completing one year of service. Normal retirement benefits become payable when participants attain age 65 and complete five years of participation. Gulf Power also provides unfunded benefits that count salary and annual Performance Pay Program payouts that are ineligible to be counted under the Pension Plan. See the Pension Benefits table and accompanying information for more pension-related benefits information.
Gulf Power also provides supplemental retirement benefits to certain employees that were first employed by Gulf Power, or an affiliate of Gulf Power, in the middle of their careers. Gulf Power has had a supplemental retirement agreement (SRA) with Ms. Terry since 2010. Prior to her employment, Ms. Terry provided legal services to Southern Company's subsidiaries. Ms. Terry's agreement provides retirement benefits as if she was employed an additional 10 years. Ms. Terry must remain employed at Gulf Power or an affiliate of Gulf Power for 10 years from the effective date of the SRA before vesting in the benefits. This agreement provides a benefit which recognizes the expertise she brought to Gulf Power and provides a strong retention incentive to remain with Gulf Power, or one of its affiliates, for the vesting period and beyond.
Gulf Power also provides the Deferred Compensation Plan, which is an unfunded plan that permits participants to defer income as well as certain federal, state, and local taxes until a specified date or their retirement, disability, death, or other separation from service. Up to 50% of base salary and up to 100% of performance-based non-equity compensation may be deferred at the election of eligible employees. All of the named executive officers are eligible to participate in the Deferred Compensation Plan. See the Nonqualified Deferred Compensation table and accompanying information for more information about the Deferred Compensation Plan.
Change-in-Control Protections
Change-in-control protections, including severance pay and, in some situations, vesting or payment of long-term performance-based awards, are provided upon a change in control of Southern Company or Gulf Power coupled with an involuntary termination not for cause or a voluntary termination for “Good Reason.” This means there is a “double trigger” before severance benefits are paid;
i.e.,
there must be both a change in control and a termination of employment. Severance payment amounts are two times salary plus target Performance Pay Program opportunity for Mr. Connally and one times salary plus Performance Pay Program opportunity for the other named executive officers. No excise tax gross-up would be provided. More information about severance arrangements is included in the section entitled "Potential Payments upon Termination or Change in Control."
III-17
Perquisites
Gulf Power provides limited ongoing perquisites to its executive officers, including the named executive officers. The perquisites provided in 2013, including amounts, are described in detail in the information accompanying the Summary Compensation Table. No tax assistance is provided on perquisites for Southern Company executive officers, including Mr. Connally, except on certain relocation-related benefits.
|
EXECUTIVE STOCK OWNERSHIP REQUIREMENTS
|
Officers of Gulf Power that are in a position of Vice President or above are subject to stock ownership requirements. All of the named executive officers are covered by the requirements. Ownership requirements further align the interest of officers and Southern Company’s stockholders by promoting a long-term focus and long-term share ownership. The types of ownership arrangements counted toward the requirements are shares owned outright, those held in Southern Company-sponsored plans, and Common Stock accounts in the Deferred Compensation Plan and the Supplemental Benefit Plan. One-third of vested stock options may be counted, but, if so, the ownership requirement is doubled. The ownership requirement is reduced by one-half at age 60.
The requirements are expressed as a multiple of base salary as shown below.
|
|
Multiple of Salary without
Counting Stock Options
|
Multiple of Salary Counting
1/3 of Vested Options
|
|
S. W. Connally, Jr.
|
3 Times
|
6 Times
|
|
R. S. Teel
|
2 Times
|
4 Times
|
|
M. L. Burroughs
|
1 Times
|
2 Times
|
|
P. B. Jacob
|
2 Times
|
4 Times
|
|
B. C. Terry
|
2 Times
|
4 Times
|
Newly-elected officers have approximately five years from the date of their election to meet the applicable ownership requirement. Newly-promoted officers, including Mr. Connally, have approximately five years from the date of their promotion to meet the increased ownership requirements. All of the named executive officers are meeting their respective ownership requirement.
|
POLICY ON RECOVERY OF AWARDS
|
Southern Company’s Omnibus Incentive Compensation Plan provides that, if Southern Company or Gulf Power is required to prepare an accounting restatement due to material noncompliance as a result of misconduct, and if an executive officer of Gulf Power knowingly or grossly negligently engaged in or failed to prevent the misconduct or is subject to automatic forfeiture under the Sarbanes-Oxley Act of 2002, the executive officer will reimburse the amount of any payment in settlement of awards earned or accrued during the 12-month period following the first public issuance or filing that was restated.
|
POLICY REGARDING HEDGING THE ECONOMIC RISK OF STOCK OWNERSHIP
|
Southern Company’s policy is that employees and outside directors will not trade Southern Company options on the options market and will not engage in short sales.
III-18
|
COMPENSATION COMMITTEE REPORT
|
The Compensation Committee met with management to review and discuss the CD&A. Based on such review and discussion, the Compensation Committee recommended to the Southern Company Board of Directors that the CD&A be included in Gulf Power's Annual Report on Form 10-K for the fiscal year ended December 31, 2013. The Southern Company Board of Directors approved that recommendation.
Members of the Compensation Committee:
Veronica M. Hagen, Chair
Henry A. Clark III
H. William Habermeyer, Jr.
William G. Smith, Jr.
III-19
SUMMARY COMPENSATION TABLE
The Summary Compensation Table shows the amount and type of compensation received or earned in 2011, 2012, and 2013 by the named executive officers, except as noted below.
|
Name and Principal
Position
(a)
|
Year
(b)
|
Salary
($)
(c)
|
Bonus
($)
(d)
|
Stock
Awards
($)
(e)
|
Option
Awards
($)
(f)
|
Non-Equity
Incentive
Plan
Compensation
($)
(g)
|
Change in
Pension Value
and
Nonqualified
Deferred
Compensation
Earnings
($)
(h)
|
All Other
Compensation
($)
(i)
|
Total
($)
(j)
|
||||||||
|
S. W. Connally, Jr.
|
2013
|
372,977
|
|
—
|
|
293,018
|
|
195,363
|
|
164,557
|
|
54,607
|
|
25,602
|
|
1,106,124
|
|
|
President, Chief Executive Officer, and Director
|
2012
|
295,103
|
|
24,376
|
|
81,629
|
|
54,420
|
|
249,526
|
|
431,809
|
|
179,308
|
|
1,316,171
|
|
|
R. S. Teel
|
2013
|
244,903
|
|
—
|
|
88,614
|
|
59,101
|
|
80,895
|
|
—
|
|
17,004
|
|
490,517
|
|
|
Vice President and Chief Financial Officer
|
2012
|
236,882
|
|
—
|
|
86,038
|
|
57,379
|
|
143,335
|
|
118,474
|
|
15,610
|
|
657,718
|
|
|
2011
|
225,993
|
|
—
|
|
81,760
|
|
54,516
|
|
156,624
|
|
72,473
|
|
14,773
|
|
606,139
|
|
|
|
M. L. Burroughs
|
2013
|
193,498
|
|
—
|
|
46,656
|
|
31,118
|
|
59,127
|
|
—
|
|
11,225
|
|
341,624
|
|
|
Vice President
|
2012
|
187,855
|
|
—
|
|
45,391
|
|
30,269
|
|
94,634
|
|
204,035
|
|
12,218
|
|
574,402
|
|
|
2011
|
180,684
|
|
—
|
|
43,632
|
|
29,107
|
|
102,255
|
|
135,314
|
|
49,366
|
|
540,358
|
|
|
|
P. B. Jacob
|
2013
|
258,605
|
|
—
|
|
93,393
|
|
62,272
|
|
85,236
|
|
—
|
|
19,033
|
|
518,539
|
|
|
Vice President
|
2012
|
253,959
|
|
—
|
|
91,748
|
|
61,169
|
|
145,616
|
|
310,532
|
|
16,671
|
|
879,695
|
|
|
2011
|
249,188
|
|
—
|
|
89,925
|
|
59,969
|
|
159,207
|
|
233,428
|
|
15,714
|
|
807,431
|
|
|
|
B. C. Terry
|
2013
|
262,809
|
|
—
|
|
95,094
|
|
63,419
|
|
86,809
|
|
—
|
|
16,735
|
|
524,866
|
|
|
Vice President
|
2012
|
255,634
|
|
—
|
|
92,336
|
|
61,573
|
|
159,332
|
|
210,941
|
|
16,910
|
|
796,726
|
|
|
2011
|
250,194
|
|
—
|
|
90,536
|
|
60,366
|
|
182,994
|
|
122,604
|
|
15,957
|
|
722,651
|
|
|
Column (a)
Mr. Connally was not an executive officer of Gulf Power prior to 2012.
Column (e)
This column does not reflect the value of stock awards that were actually earned or received in 2013. Rather, as required by applicable rules of the SEC, this column reports the aggregate grant date fair value of performance shares granted in 2013. The value reported is based on the probable outcome of the performance conditions as of the grant date, using a Monte Carlo simulation model. No amounts will be earned until the end of the three-year performance period on December 31, 2015. The value then can be earned based on performance ranging from 0 to 200%, as established by the Compensation Committee. The aggregate grant date fair value of the performance shares granted in 2013 to Ms. Terry and Messrs. Connally, Teel, Burroughs, and Jacob, assuming the highest level of performance is achieved, is $190,188, $586,035, $177,228, $93,312, and $186,786, respectively (200% of the amount shown in the table). See Note 8 to the financial statements of Gulf Power in Item 8 herein for a discussion of the assumptions used in calculating these amounts.
III-20
Column (f)
This column reports the aggregate grant date fair value of stock options. See Note 8 to the financial statements of Gulf Power in Item 8 herein for a discussion of the assumptions used in calculating these amounts.
Column (g)
The amounts in this column are the aggregate of the payouts under the annual Performance Pay Program. The amount reported for the Performance Pay Program is for the one-year performance period that ended December 31, 2013. The Performance Pay Program is described in detail in the CD&A.
Column (h)
This column reports the aggregate change in the actuarial present value of each named executive officer's accumulated benefit under the Pension Plan and the supplemental pension plans (collectively, Pension Benefits) as of December 31, 2011, 2012, and 2013. The Pension Benefits as of each measurement date are based on the named executive officer's age, pay, and service accruals and the plan provisions applicable as of the measurement date. The actuarial present values as of each measurement date reflect the assumptions Gulf Power selected for cost purposes as of that measurement date; however, the named executive officers were assumed to remain employed at Gulf Power or any other Southern Company subsidiary until their benefits commence at the pension plans' stated normal retirement date, generally age 65. As a result, the amounts in column (h) related to Pension Benefits represent the combined impact of several factors: growth in the named executive officer's Pension Benefits over the measurement year; impact on the total present values of one year shorter discounting period due to the named executive officer being one year closer to normal retirement; impact on the total present values attributable to changes in assumptions from measurement date to measurement date; and impact on the total present values attributable to plan changes between measurement dates.
For more information about the Pension Benefits and the assumptions used to calculate the actuarial present value of accumulated benefits as of December 31, 2013, see the information following the Pension Benefits table. The key differences between assumptions used for the actuarial present values of accumulated benefits calculations as of December 31, 2012 and December 31, 2013 are:
|
•
|
Discount rate for the Pension Plan was increased to 5.05% as of December 31, 2013 from 4.30% as of December 31, 2012.
|
|
•
|
Discount rate for the supplemental pension plans was increased to 4.50% as of December 31, 2013 from 3.70% as of December 31, 2012.
|
This column also reports above-market earnings on deferred compensation under the Deferred Compensation Plan (DCP). However, there were no above-market earnings on deferred compensation in the years reported.
In 2013, the pension value for Ms. Terry and Messrs. Teel, Burroughs, and Jacob decreased primarily due to the change in the discount rate. Pursuant to SEC rules, those negative amounts for the change in pension value were not included in the column (h) total. The table below shows the actual change in pension value for Ms. Terry and Messrs. Teel, Burroughs, and Jacob.
|
Change in Pension Value ($)
|
|
|
R. S. Teel
|
(27,028)
|
|
M. L. Burroughs
|
(25,371)
|
|
P. B. Jacob
|
(35,288)
|
|
B. C. Terry
|
(76,112)
|
Column (i)
This column reports the following items: perquisites; tax reimbursements on certain perquisites; employer contributions in 2013 to the Southern Company Employee Savings Plan (ESP), which is a tax-qualified defined contribution plan intended to meet requirements of Section 401(k) of the Internal Revenue Code of 1986, as amended (Code); and contributions in 2013 under the Southern Company Supplemental Benefit Plan (Non-Pension Related) (SBP). The SBP is described more fully in the information following the Nonqualified Deferred Compensation table.
III-21
The amounts reported are itemized below.
|
|
Perquisites
($)
|
Tax
Reimbursements
($)
|
ESP
($)
|
SBP
($)
|
Total
($)
|
|||||
|
S. W. Connally, Jr.
|
6,581
|
|
—
|
|
11,458
|
|
7,563
|
|
25,602
|
|
|
R. S. Teel
|
4,500
|
|
14
|
|
12,490
|
|
—
|
|
17,004
|
|
|
M. L. Burroughs
|
1,243
|
|
114
|
|
9,868
|
|
—
|
|
11,225
|
|
|
P. B. Jacob
|
6,697
|
|
995
|
|
11,157
|
|
184
|
|
19,033
|
|
|
B. C. Terry
|
4,872
|
|
194
|
|
11,271
|
|
398
|
|
16,735
|
|
Description of Perquisites
Personal Financial Planning
is provided for most officers of Gulf Power, including all of the named executive officers. Gulf Power pays for the services of the financial planner on behalf of the officers, up to a maximum amount of $8,700 per year, after the initial year that the benefit is provided. In the initial year, the allowed amount is $15,000. Gulf Power also provides a five-year allowance of $6,000 for estate planning and tax return preparation fees.
Personal Use of Corporate-Owned Aircraft.
The Southern Company system has aircraft that are used to facilitate business travel. All flights on these aircraft must have a business purpose, except limited personal use that is associated with business travel is permitted. The amount reported for such personal use is the incremental cost of providing the benefit, primarily fuel costs. Also, if seating is available, the Company permits a spouse or other family member to accompany an employee on a flight. However, because in such cases the aircraft is being used for a business purpose, there is no incremental cost associated with the family travel, and no amounts are included for such travel. Any additional expenses incurred that are related to family travel are included.
Other Miscellaneous Perquisites.
The amount included reflects the full cost to Gulf Power of providing the following items: personal use of company-provided tickets for sporting and other entertainment events and gifts distributed to and activities provided to attendees at company-sponsored events.
III-22
GRANTS OF PLAN-BASED AWARDS IN 2013
This table provides information on stock option grants made and goals established for future payouts under the performance-based compensation programs during 2013 by the Compensation Committee.
|
Name
(a)
|
Grant
Date
(b)
|
Estimated Future Payouts Under
Non-Equity Incentive Plan Awards
|
Estimated Future Payouts Under
Equity Incentive Plan Awards
|
All Other
Option
Awards:
Number of
Securities
Underlying
Options
(#)
(i)
|
Exercise
or Base
Price of
Option
Awards
($/Sh)
(j)
|
Grant Date
Fair
Value of
Stock and
Option
Awards
($)
(k)
|
|||||||||||||
|
Threshold
($)
(c)
|
Target
($)
(d)
|
Maximum
($)
(e)
|
Threshold
(#)
(f)
|
Target
(#)
(g)
|
Maximum
(#)
(h)
|
||||||||||||||
|
S. W. Connally, Jr.
|
2,254
|
|
225,420
|
|
450,840
|
|
|||||||||||||
|
2/11/2013
|
72
|
|
7,235
|
|
14,470
|
|
293,018
|
|
|||||||||||
|
2/11/2013
|
66,905
|
|
44.06
|
|
195,363
|
|
|||||||||||||
|
R. S. Teel
|
1,108
|
|
110,815
|
|
221,630
|
|
|||||||||||||
|
2/11/2013
|
21
|
|
2,188
|
|
4,376
|
|
88,614
|
|
|||||||||||
|
2/11/2013
|
20,240
|
|
44.06
|
|
59,101
|
|
|||||||||||||
|
M. L. Burroughs
|
778
|
|
77,799
|
|
155,598
|
|
|||||||||||||
|
2/11/2013
|
11
|
|
1,152
|
|
2,304
|
|
46,656
|
|
|||||||||||
|
2/11/2013
|
10,657
|
|
44.06
|
|
31,118
|
|
|||||||||||||
|
P. B. Jacob
|
1,168
|
|
116,761
|
|
233,522
|
|
|||||||||||||
|
2/11/2013
|
23
|
|
2,306
|
|
4,612
|
|
93,393
|
|
|||||||||||
|
2/11/2013
|
21,326
|
|
44.06
|
|
62,272
|
|
|||||||||||||
|
B. C. Terry
|
1,189
|
|
118,917
|
|
237,834
|
|
|||||||||||||
|
2/11/2013
|
23
|
|
2,348
|
|
4,696
|
|
95,094
|
|
|||||||||||
|
2/11/2013
|
21,719
|
|
44.06
|
|
63,419
|
|
|||||||||||||
Columns (c), (d), and (e)
These columns reflect the annual Performance Pay Program opportunity granted to the named executive officers in 2013 as described in the CD&A. The information shown as "Threshold," "Target," and "Maximum" reflects the range of potential payouts established by the Compensation Committee. The actual amounts earned are disclosed in the Summary Compensation Table.
Columns (f), (g), and (h)
These columns reflect the performance shares granted to the named executive officers in 2013 as described in the CD&A. The information shown as "Threshold," "Target," and "Maximum" reflects the range of potential payouts established by the Compensation Committee. Earned performance shares will be paid out in Common Stock following the end of the 2013-2015 performance period, based on the extent to which the performance goals are achieved. Any shares not earned are forfeited.
Columns (i) and (j)
Column (i) reflects the number of stock options granted to the named executive officers in 2013, as described in the CD&A, and column (j) reflects the exercise price of the stock options, which was the closing price on the grant date.
Column (k)
This column reflects the aggregate grant date fair value of the performance shares and stock options granted in 2013. For performance shares, the value is based on the probable outcome of the performance conditions as of the grant date using a Monte Carlo simulation model. For stock options, the value is derived using the Black-Scholes stock option pricing model.
The assumptions used in calculating these amounts are discussed in Note 8 to the financial statements of Gulf Power in Item 8 herein.
III-23
OUTSTANDING EQUITY AWARDS AT 2013 FISCAL YEAR-END
This table provides information pertaining to all outstanding stock options and stock awards (performance shares) held by or granted to the named executive officers as of December 31, 2013.
|
Name
(a)
|
Option Awards
|
Stock Awards
|
|||||
|
Number
of
Securities Underlying Unexercised Options
Exercisable
(#)
(b)
|
Number of Securities Underlying Unexercised Options
Unexercisable
(#)
(c)
|
Option Exercise Price
($)
(d)
|
Option Expiration Date
(e)
|
Equity Incentive Plan Awards: Number of Unearned Shares, Units or Other Rights That Have Not Vested
(#)
(f)
|
Equity Incentive Plan Awards: Market or Payout Value of Unearned Shares, Units or Other Rights That Have Not Vested
($)
(g)
|
||
|
S. W. Connally, Jr.
|
5,096
5,437
8,521
14,392
11,262
10,733
5,351
0
|
5,367
10,702
66,905
|
33.81
36.42
35.78
31.39
31.17
37.97
44.42
44.06
|
02/20/2016
02/19/2017
02/18/2018
02/16/2019
02/15/2020
02/14/2021
02/13/2022
02/11/2023
|
1,944
7,235
|
79,918
297,431
|
|
|
R. S. Teel
|
9,265
9,078
15,332
9,629
11,183
5,642
0
|
5,591
11,284
20,240
|
36.42
35.78
31.39
31.17
37.97
44.42
44.06
|
02/19/2017
02/18/2018
02/16/2019
02/15/2020
02/14/2021
02/13/2022
02/11/2023
|
2,049
2,188
|
84,234
89,949
|
|
|
M. L. Burroughs
|
289
1,604
2,610
1,207
5,971
2,977
0
|
2,985
5,952
10,657
|
33.81
36.42
35.78
31.17
37.97
44.42
44.06
|
02/20/2016
02/19/2017
02/18/2018
02/15/2020
02/14/2021
02/13/2022
02/11/2023
|
1,081
1,152
|
44,440
47,359
|
|
|
P. B. Jacob
|
13,785
9,326
8,553
6,150
6,015
0
|
6,151
12,029
21,326
|
35.78
31.39
31.17
37.97
44.42
44.06
|
02/18/2018
02/16/2019
02/15/2020
02/14/2021
02/13/2022
02/11/2023
|
2,185
2,306
|
89,825
94,800
|
|
|
B. C. Terry
|
9,367
12,918
21,453
8,482
12,383
6,055
0
|
6,191
12,108
21,719
|
36.42
35.78
31.39
31.17
37.97
44.42
44.06
|
02/19/2017
02/18/2018
02/16/2019
02/15/2020
02/14/2021
02/13/2022
02/11/2023
|
2,199
2,348
|
90,401
96,526
|
|
III-24
Columns (b), (c), (d), and (e)
Stock options vest one-third per year on the anniversary of the grant date. Options granted from 2006 through 2010 with expiration dates from 2016 through 2020 were fully vested as of December 31, 2013. The options granted in 2011, 2012, and 2013 become fully vested as shown below.
|
Year Option Granted
|
Expiration Date
|
Date Fully Vested
|
||
|
2011
|
February 14, 2021
|
February 14, 2014
|
||
|
2012
|
February 13, 2022
|
February 13, 2015
|
||
|
2013
|
February 11, 2023
|
February 11, 2016
|
||
Options also fully vest upon death, total disability, or retirement and expire three years following death or total disability or five years following retirement, or on the original expiration date if earlier. See Potential Payments upon Termination or Change in Control for more information about the treatment of stock options under different termination and change-in-control events.
Columns (f) and (g)
In accordance with SEC rules, column (f) reflects the target number of performance shares that can be earned at the end of each three-year performance period (December 31, 2014 and 2015) that were granted in 2012 and 2013, respectively. The performance shares granted for the 2011-2013 performance period vested December 31, 2013 and are shown in the Option Exercises and Stock Vested in 2013 table below. The value in column (g) is derived by multiplying the number of shares in column (f) by the Common Stock closing price on December 31, 2013 ($41.11). The ultimate number of shares earned, if any, will be based on the actual performance results at the end of each respective performance period. See further discussion of performance shares in the CD&A.
OPTION EXERCISES AND STOCK VESTED IN 2013
|
Option Awards
|
Stock Awards
|
|||
|
Name
(a)
|
Number of Shares Acquired on Exercise (#)
(b)
|
Value Realized on Exercise ($)
(c)
|
Number of Shares Acquired on Vesting (#)
(d)
|
Value Realized on Vesting ($)
(e)
|
|
S. W. Connally, Jr.
|
—
|
—
|
654
|
26,886
|
|
R. S. Teel
|
7,821
|
94,578
|
681
|
27,996
|
|
M. L. Burroughs
|
—
|
—
|
363
|
14,923
|
|
P. B. Jacob
|
21,179
|
261,429
|
750
|
30,833
|
|
B. C. Terry
|
8,905
|
102,956
|
755
|
31,038
|
Columns (b) and (c)
Column (b) reflects the number of shares acquired upon the exercise of stock options during 2013 and column (c) reflects the value realized. The value realized is the difference in the market price over the exercise price on the exercise date.
Columns (d) and (e)
Column (d) includes the performance shares awarded for the 2011-2013 performance period that vested on December 31, 2013. The value reflected in column (e) is derived by multiplying the number of shares in column (d) by the market value of the underlying shares on the vesting date ($41.11).
III-25
PENSION BENEFITS AT 2013 FISCAL YEAR-END
|
Name
|
Plan Name
|
Number of Years Credited Service (#)
|
Present Value of Accumulated Benefit ($)
|
Payments During
Last Fiscal Year ($)
|
|
(a)
|
(b)
|
(c)
|
(d)
|
(e)
|
|
S.W. Connally, Jr.
|
Pension Plan
SBP-P
SERP
|
22.17
22.17
22.17
|
380,266
272,669
250,807
|
0
0
0
|
|
R. S. Teel
|
Pension Plan
SBP-P
SERP
|
13.33
13.33
13.33
|
221,394
40,733
68,369
|
0
0
0
|
|
M. L. Burroughs
|
Pension Plan
SBP-P
SERP
|
21.58
21.58
21.58
|
454,813
63,650
104,411
|
0
0
0
|
|
P. B. Jacob
|
Pension Plan
SBP-P
SERP
|
30.42
30.42
30.42
|
1,088,238
258,555
289,895
|
0
0
0
|
|
B. C. Terry
|
Pension Plan
SBP-P
SERP
SRA
|
11.50
11.50
11.50
10.00
|
207,873
42,575
63,804
314,757
|
0
0
0
0
|
Pension Plan
The Pension Plan is a tax-qualified, funded plan. It is Southern Company's primary retirement plan. Generally, all full-time employees participate in this plan after one year of service. Normal retirement benefits become payable when participants attain age 65 and complete five years of participation. The plan benefit equals the greater of amounts computed using a "1.7% offset formula" and a "1.25% formula," as described below. Benefits are limited to a statutory maximum.
The 1.7% offset formula amount equals 1.7% of final average pay times years of participation less an offset related to Social Security benefits. The offset equals a service ratio times 50% of the anticipated Social Security benefits in excess of $4,200. The service ratio adjusts the offset for the portion of a full career that a participant has worked. The highest three rates of pay out of a participant's last 10 calendar years of service are averaged to derive final average pay. The pay considered for this formula is the base salary rate with no adjustments for voluntary deferrals after 2008. A statutory limit restricts the amount considered each year; the limit for 2013 was $255,000.
The 1.25% formula amount equals 1.25% of final average pay times years of participation. For this formula, the final average pay computation is the same as above, but annual performance-based compensation earned each year is added to the base rates of pay.
Early retirement benefits become payable once plan participants have, during employment, attained age 50 and completed 10 years of participation. Participants who retire early from active service receive benefits equal to the amounts computed using the same formulas employed at normal retirement. However, a 0.3% reduction applies for each month (3.6% for each year) prior to normal retirement that participants elect to have their benefit payments commence. For example, 64% of the formula benefits are payable starting at age 55. As of December 31, 2013, Ms. Terry and Messrs. Connally and Teel were not retirement-eligible.
The Pension Plan's benefit formulas produce amounts payable monthly over a participant's post-retirement lifetime. At retirement, plan participants can choose to receive their benefits in one of seven alternative forms of payment. All forms pay benefits monthly over the lifetime of the retiree or the joint lifetimes of the retiree and a spouse. A reduction applies if a retiring participant chooses a payment form other than a single life annuity. The reduction makes the value of the benefits paid in the form chosen comparable to what it would have been if benefits were paid as a single life annuity over the retiree's life.
Participants vest in the Pension Plan after completing five years of service. All the named executive officers are vested in their Pension Plan benefits. Participants who terminate employment after vesting can elect to have their pension benefits commence at age 50 if they participated in the Pension Plan for 10 years. If such an election is made, the early retirement reductions that apply are actuarially determined factors and are larger than 0.3% per month.
If a participant dies while actively employed and is either age 50 or vested in the Pension Plan as of date of death, benefits will be paid to a surviving spouse. A survivor's benefit equals 45% of the monthly benefit that the participant had earned before his or her
III-26
death. Payments to a surviving spouse of a participant who could have retired will begin immediately. Payments to a survivor of a participant who was not retirement-eligible will begin when the deceased participant would have attained age 50.
After commencing, survivor benefits are payable monthly for the remainder of a survivor's life. Participants who are eligible for early retirement may opt to have an 80% survivor benefit paid if they die; however, there is a charge associated with this election.
If participants become totally disabled, periods that Social Security or employer-provided disability income benefits are paid will count as service for benefit calculation purposes. The crediting of this additional service ceases at the point a disabled participant elects to commence retirement payments. Outside of this extra service crediting, the normal plan provisions apply to disabled participants.
The Southern Company Supplemental Benefit Plan (Pension-Related) (SBP-P)
The SBP-P is an unfunded retirement plan that is not tax qualified. This plan provides high-paid employees any benefits that the Pension Plan cannot pay due to statutory pay/benefit limits. The SBP-P's vesting and early retirement provisions mirror those of the Pension Plan. Its disability provisions mirror those of the Pension Plan but cease upon a participant's separation from service.
The amounts paid by the SBP-P are based on the additional monthly benefit that the Pension Plan would pay if the statutory limits and pay deferrals were ignored. When an SBP-P participant separates from service, vested monthly benefits provided by the benefit formulas are converted into a single sum value. It equals the present value of what would have been paid monthly for an actuarially determined average post-retirement lifetime. The discount rate used in the calculation is based on the 30-year U.S. Treasury yields for the September preceding the calendar year of separation, but not more than six percent.
Vested participants terminating prior to becoming eligible to retire will be paid their single sum value as of September 1 following the calendar year of separation. If the terminating participant is retirement eligible, the single sum value will be paid in 10 annual installments starting shortly after separation. The unpaid balance of a retiree's single sum will be credited with interest at the prime rate published in
The Wall Street Journal
. If the separating participant is a "key man" under Section 409A of the Code, the first installment will be delayed for six months after the date of separation.
If an SBP-P participant dies after becoming vested in the Pension Plan, the spouse of the deceased participant will receive the installments the participant would have been paid upon retirement. If a vested participant's death occurs prior to age 50, the installments will be paid to a spouse as if the participant had survived to age 50.
The Southern Company Supplemental Executive Retirement Plan (SERP)
The SERP is also an unfunded retirement plan that is not tax qualified. This plan provides high-paid employees additional benefits that the Pension Plan and the SBP-P would pay if the 1.7% offset formula calculations reflected a portion of annual performance-based compensation. To derive the SERP benefits, a final average pay is determined reflecting participants' base rates of pay and their annual performance-based compensation amounts, whether or not deferred, to the extent they exceed 15% of those base rates (ignoring statutory limits). This final average pay is used in the 1.7% offset formula to derive a gross benefit. The Pension Plan and the SBP-P benefits are subtracted from the gross benefit to calculate the SERP benefit. The SERP's early retirement, survivor benefit, disability, and form of payment provisions mirror the SBP-P's provisions. However, except upon a change in control, SERP benefits do not vest until participants retire, so no benefits are paid if a participant terminates prior to becoming retirement-eligible. More information about vesting and payment of SERP benefits following a change in control is included in the section entitled "Potential Payments upon Termination or Change in Control."
Supplemental Pension Benefit Agreements (SRA)
Gulf Power also provides supplemental retirement benefits to certain employees that were first employed by Gulf Power, or an affiliate of Gulf Power, in the middle of their careers and generally provide for additional retirement benefits by giving credit for years of employment prior to employment with Gulf Power or one of its affiliates. These supplemental retirement benefits are also unfunded and not tax qualified. Information about the supplemental retirement agreement with Ms. Terry is included in the CD&A.
III-27
Pension Benefit Assumptions
The following assumptions were used in the present value calculations for all pension benefits:
|
l
|
Discount rate - 5.05% Pension Plan and 4.50% supplemental plans as of December 31, 2013
|
||||
|
l
|
Retirement date - Normal retirement age (65 for all named executive officers)
|
||||
|
l
|
Mortality after normal retirement - RP2000 Combined Healthy with generational projections
|
||||
|
l
|
Mortality, withdrawal, disability, and retirement rates prior to normal retirement - None
|
||||
|
l
|
Form of payment for Pension Benefits:
|
||||
|
|
o
|
Male retirees: 25% single life annuity; 25% level income annuity; 25% joint and 50% survivor annuity; and 25% joint and 100% survivor annuity
|
|||
|
|
o
|
Female retirees: 75% single life annuity; 15% level income annuity; 5% joint and 50% survivor annuity; and 5% joint and 100% survivor annuity
|
|||
|
l
|
Spouse ages - Wives two years younger than their husbands
|
||||
|
l
|
Annual performance-based compensation earned but unpaid as of the measurement date - 130% of target opportunity percentages times base rate of pay for year amount is earned
|
||||
|
l
|
Installment determination - 3.75% discount rate for single sum calculation and 4.25% prime rate during installment payment period
|
||||
For all of the named executive officers, the number of years of credited service for the Pension Plan, the SBP-P, and the SERP is one year less than the number of years of employment
.
NONQUALIFIED DEFERRED COMPENSATION AS OF 2013 FISCAL YEAR-END
|
Name
(a)
|
Executive Contributions
in Last FY
($)
(b)
|
Registrant Contributions
in Last FY
($)
(c)
|
Aggregate Earnings
in Last FY
($)
(d)
|
Aggregate Withdrawals/
Distributions
($)
(e)
|
Aggregate Balance
at Last FYE
($)
(f)
|
|
S. W. Connally, Jr.
|
—
|
7,563
|
3,209
|
—
|
112,765
|
|
R. S. Teel
|
—
|
—
|
1
|
—
|
130
|
|
M. L. Burroughs
|
—
|
—
|
—
|
—
|
—
|
|
P. B. Jacob
|
—
|
184
|
2,652
|
—
|
410,355
|
|
B. C. Terry
|
—
|
398
|
121
|
—
|
200,457
|
Southern Company provides the DCP which is designed to permit participants to defer income as well as certain federal, state, and local taxes until a specified date or their retirement, or other separation from service. Up to 50% of base salary and up to 100% of performance-based non-equity compensation may be deferred at the election of eligible employees. All of the named executive officers are eligible to participate in the DCP.
Participants have two options for the deemed investments of the amounts deferred - the Stock Equivalent Account and the Prime Equivalent Account. Under the terms of the DCP, participants are permitted to transfer between investments at any time.
The amounts deferred in the Stock Equivalent Account are treated as if invested at an equivalent rate of return to that of an actual investment in Common Stock, including the crediting of dividend equivalents as such are paid by Southern Company from time to time. It provides participants with an equivalent opportunity for the capital appreciation (or loss) and income of that of a Southern Company stockholder. During 2013, the rate of return in the Stock Equivalent Account was 0.65%.
Alternatively, participants may elect to have their deferred compensation deemed invested in the Prime Equivalent Account which is treated as if invested at a prime interest rate compounded monthly, as published in
The Wall Street Journal
as the base rate on corporate loans posted as of the last business day of each month by at least 75% of the United States' largest banks. The interest rate earned on amounts deferred during 2013 in the Prime Equivalent Account was 3.25%.
III-28
Column (b)
This column reports the actual amounts of compensation deferred under the DCP by each named executive officer in 2013. The amount of salary deferred by the named executive officers, if any, is included in the Salary column in the Summary Compensation Table. The amounts of performance-based compensation deferred in 2013 were the amounts paid for performance under the annual Performance Pay Program that were earned as of December 31, 2012 but not payable until the first quarter of 2013. These amounts are not reflected in the Summary Compensation Table because that table reports performance-based compensation that was earned in 2013, but not payable until early 2014. These deferred amounts may be distributed in a lump sum or in up to 10 annual installments at termination of employment or in a lump sum at a specified date, at the election of the participant.
Column (c)
This column reflects contributions under the SBP. Under the Code, employer matching contributions are prohibited under the ESP on employee contributions above stated limits in the ESP, and, if applicable, above legal limits set forth in the Code. The SBP is a nonqualified deferred compensation plan under which contributions are made that are prohibited from being made in the ESP. The contributions are treated as if invested in Common Stock and are payable in cash upon termination of employment in a lump sum or in up to 20 annual installments, at the election of the participant. The amounts reported in this column also were reported in the All Other Compensation column in the Summary Compensation Table.
Column (d)
This column reports earnings or losses on both compensation the named executive officers elected to defer and on employer contributions under the SBP.
Column (f)
This column includes amounts that were deferred under the DCP and contributions under the SBP in prior years and reported in Gulf Power's prior years' Information Statements or Annual Reports on Form 10-K. The chart below shows the amounts reported in Gulf Power's prior years' Information Statements or Annual Reports on Form 10-K.
|
Amounts Deferred under the DCP Prior to 2013 and Reported in Prior Years' Information Statements or Annual Reports on Form 10-K
|
Employer Contributions under the SBP Prior to 2013 and Reported in Prior Years' Information Statements or Annual Reports on Form 10-K
|
Total
|
|||||||||||||
|
Name
|
($)
|
($)
|
($)
|
||||||||||||
|
S. W. Connally, Jr.
|
20,370
|
|
2,943
|
|
23,313
|
|
|||||||||
|
R. S. Teel
|
—
|
|
—
|
|
—
|
|
|||||||||
|
M. L. Burroughs
|
—
|
|
—
|
|
—
|
|
|||||||||
|
P. B. Jacob
|
257,105
|
|
23,090
|
|
280,195
|
|
|||||||||
|
B. C. Terry
|
181,984
|
|
552
|
|
182,536
|
|
|||||||||
POTENTIAL PAYMENTS UPON TERMINATION OR CHANGE IN CONTROL
This section describes and estimates payments that could be made to the named executive officers under different termination and change-in-control events. The estimated payments would be made under the terms of Southern Company's compensation and benefit program or the change-in-control severance program. All of the named executive officers are participants in Southern Company's change-in-control severance program for officers. The amount of potential payments is calculated as if the triggering events occurred as of December 31, 2013 and assumes that the price of Common Stock is the closing market price on December 31, 2013.
III-29
Description of Termination and Change-in-Control Events
The following charts list different types of termination and change-in-control events that can affect the treatment of payments under the compensation and benefit programs. No payments are made under the change-in-control severance program unless, within two years of the change in control, the named executive officer is involuntarily terminated or voluntarily terminates for Good Reason. (See the description of Good Reason below.)
Traditional Termination Events
|
l
|
Retirement or Retirement-Eligible - Termination of a named executive officer who is at least 50 years old and has at least 10 years of credited service.
|
|
|
l
|
Resignation - Voluntary termination of a named executive officer who is not retirement-eligible.
|
|
|
l
|
Lay Off - Involuntary termination of a named executive officer who is not retirement-eligible not for cause.
|
|
|
l
|
Involuntary Termination - Involuntary termination of a named executive officer for cause. Cause includes individual performance below minimum performance standards and misconduct, such as violation of Gulf Power's Drug and Alcohol Policy.
|
|
|
l
|
Death or Disability - Termination of a named executive officer due to death or disability.
|
|
Change-in-Control-Related Events
At the Southern Company or Gulf Power level:
|
l
|
Southern Company Change-in-Control I - Acquisition by another entity of 20% or more of Common Stock, or following a merger with another entity Southern Company's stockholders own 65% or less of the entity surviving the merger.
|
|
|
l
|
Southern Company Change-in-Control II - Acquisition by another entity of 35% or more of Common Stock, or following a merger with another entity Southern Company shareholders own less than 50% of Southern Company surviving the merger.
|
|
|
l
|
Southern Company Termination - A merger or other event and Southern Company is not the surviving company or the Common Stock is no longer publicly traded.
|
|
|
l
|
Gulf Power Change in Control - Acquisition by another entity, other than another subsidiary of Southern Company, of 50% or more of the stock of Gulf Power, a merger with another entity and Gulf Power is not the surviving company, or the sale of substantially all the assets of Gulf Power.
|
|
At the employee level:
|
l
|
Involuntary Change-in-Control Termination or Voluntary Change-in-Control Termination for Good Reason - Employment is terminated within two years of a change in control, other than for cause, or the employee voluntarily terminates for Good Reason. Good Reason for voluntary termination within two years of a change in control generally is satisfied when there is a material reduction in salary, performance-based compensation opportunity or benefits, relocation of over 50 miles, or a diminution in duties and responsibilities.
|
|
III-30
T
he following chart describes the treatment of different pay and benefit elements in connection with the Traditional Termination Events described above.
|
Program
|
Retirement/
Retirement-
Eligible
|
Lay Off
(Involuntary
Termination
Not For Cause)
|
Resignation
|
Death or
Disability
|
Involuntary
Termination
(For Cause)
|
|
Pension Benefits Plans
|
Benefits payable
as described in the notes following
the Pension
Benefits table.
|
Same as Retirement.
|
Same as Retirement.
|
Same as Retirement.
|
Same as Retirement.
|
|
Annual Performance Pay Program
|
Prorated if
retire before 12/31.
|
Same as Retirement.
|
Forfeit.
|
Same as Retirement.
|
Forfeit.
|
|
Stock Options
|
Vest; expire earlier of original expiration date or five years.
|
Vested options expire in 90 days; unvested are forfeited.
|
Same as Lay Off.
|
Vest; expire earlier of original expiration date or three years.
|
Forfeit.
|
|
Performance Shares
|
Prorated if retire prior to end of performance
period.
|
Forfeit.
|
Forfeit.
|
Same as Retirement.
|
Forfeit.
|
|
Financial
Planning Perquisite
|
Continues for one year.
|
Terminates.
|
Terminates.
|
Same as Retirement.
|
Terminates.
|
|
Deferred Compensation Plan
|
Payable per prior elections (lump
sum or up to 10 annual installments).
|
Same as Retirement.
|
Same as Retirement.
|
Payable to beneficiary or participant per prior elections. Amounts deferred prior to 2005 can be paid as a lump sum per the benefit administration committee's discretion.
|
Same as Retirement.
|
|
Supplemental Benefit Plan - non-pension related
|
Payable per prior elections (lump
sum or up to 20 annual installments).
|
Same as Retirement.
|
Same as Retirement.
|
Same as the Deferred Compensation Plan.
|
Same as Retirement.
|
The chart below describes the treatment of payments under compensation and benefit programs under different change-in-control events, except the Pension Plan. The Pension Plan is not affected by change-in-control events.
III-31
|
Program
|
Southern Company
Change-in-Control I
|
Southern Company
Change-in-Control II
|
Southern Company
Termination or
Gulf Power
Change in
Control
|
Involuntary
Change-in-
Control-Related
Termination or
Voluntary
Change-in-
Control-Related
Termination
for Good Reason
|
|
Nonqualified Pension Benefits
(except SRA)
|
All SERP-related benefits vest if participants vested in tax-qualified pension benefits; otherwise, no impact. SBP - pension- related benefits vest for all participants and single sum value of benefits earned to change-in-control date paid following termination or retirement.
|
Benefits vest for all participants and single sum value of benefits earned to the change-in-control date paid following termination or retirement.
|
Same as Southern Company Change-
in-Control II.
|
Based on type of change-in-control event.
|
|
SRA
|
Not affected by change-in-control events.
|
Not affected by change-in-control events.
|
Not affected by change-in-control events.
|
Vest.
|
|
Annual Performance Pay Program
|
If no program
termination, paid at greater of target or actual performance. If program terminated within two years of change in control, prorated at target performance level.
|
Same as Southern Company Change-in-Control I.
|
Prorated at target performance level.
|
If not otherwise eligible for payment, if the program is still in effect, prorated at target performance level.
|
|
Stock Options
|
Not affected by
change-in-control events.
|
Not affected by change-in-control events.
|
Vest and convert to surviving company's securities; if cannot convert, pay spread in cash.
|
Vest.
|
|
Performance Shares
|
Not affected by
change-in-control events.
|
Not affected by change-in-control events.
|
Vest and convert to surviving company's securities; if cannot convert, pay spread in cash.
|
Vest.
|
|
DCP
|
Not affected by
change-in-control events.
|
Not affected by change-in-control events.
|
Not affected by change-in-control events.
|
Not affected by change-in-control events.
|
III-32
|
Program
|
Southern Company
Change-in-Control I
|
Southern Company
Change-in-Control II
|
Southern Company
Termination or
Gulf Power
Change in
Control
|
Involuntary
Change-in-
Control-Related
Termination or
Voluntary
Change-in-
Control-Related
Termination
for Good Reason
|
|
SBP
|
Not affected by
change-in-control events.
|
Not affected by change-in-control events.
|
Not affected by change-in-control events.
|
Not affected by change-in-control events.
|
|
Severance Benefits
|
Not applicable.
|
Not applicable.
|
Not applicable.
|
One or two times base salary plus target annual performance-based pay.
|
|
Healthcare Benefits
|
Not applicable.
|
Not applicable.
|
Not applicable.
|
Up to five years participation in group healthcare plan plus payment of two or three years' premium amounts.
|
|
Outplacement Services
|
Not applicable.
|
Not applicable.
|
Not applicable.
|
Six months.
|
Potential Payments
This section describes and estimates payments that would become payable to the named executive officers upon a termination or change in control as of December 31, 2013
.
Pension Benefits
The amounts that would have become payable to the named executive officers if the Traditional Termination Events occurred as of December 31, 2013 under the Pension Plan, the SBP-P, the SERP, and, if applicable, an SRA are itemized in the chart below. The amounts shown under the column Retirement are amounts that would have become payable to the named executive officers that were retirement-eligible on December 31, 2013 and are the monthly Pension Plan benefits and the first of 10 annual installments from the SBP-P and the SERP. The amounts shown under the column Resignation or Involuntary Termination are the amounts that would have become payable to the named executive officers who were not retirement-eligible on December 31, 2013 and are the monthly Pension Plan benefits that would become payable as of the earliest possible date under the Pension Plan and the single sum value of benefits earned up to the termination date under the SBP-P, paid as a single payment rather than in 10 annual installments. Benefits under the SERP would be forfeited. The amounts shown that are payable to a spouse in the event of the death of the named executive officer are the monthly amounts payable to a spouse under the Pension Plan and the first of 10 annual installments from the SBP-P and the SERP. The amounts in this chart are very different from the pension values shown in the Summary Compensation Table and the Pension Benefits table. Those tables show the present values of all the benefits amounts anticipated to be paid over the lifetimes of the named executive officers and their spouses. Those plans are described in the notes following the Pension Benefits table. Of the named executive officers, Ms. Terry and Messrs. Connally and Teel were not retirement-eligible on December 31, 2013. The SRA for Ms. Terry contains an additional service requirement for benefit eligibility which was not met as of December 31, 2013. Therefore she was not eligible to receive retirement benefits under the agreement. However, death benefits would be paid to her surviving spouse.
III-33
|
Name
|
Retirement ($)
|
Resignation or Involuntary Termination ($)
|
Death (payments to a spouse) ($)
|
|||||||||||
|
S. W. Connally, Jr.
|
Pension
|
n/a
|
1,973
|
3,241
|
|
|||||||||
|
SBP-P
|
n/a
|
421,106
|
48,982
|
|
||||||||||
|
SERP
|
n/a
|
—
|
45,054
|
|
||||||||||
|
R. S. Teel
|
Pension
|
n/a
|
1,171
|
1,923
|
|
|||||||||
|
|
SBP-P
|
n/a
|
63,318
|
7,453
|
|
|||||||||
|
|
SERP
|
n/a
|
—
|
12,509
|
|
|||||||||
|
M. L. Burroughs
|
Pension
|
3,226
|
All plans treated as retiring
|
2,529
|
|
|||||||||
|
|
SBP-P
|
9,089
|
9,089
|
|
||||||||||
|
|
SERP
|
14,910
|
|
14,910
|
|
|||||||||
|
P. B. Jacob
|
Pension
|
7,988
|
All plans treated as retiring
|
4,482
|
|
|||||||||
|
|
SBP-P
|
33,750
|
33,750
|
|
||||||||||
|
|
SERP
|
37,841
|
|
37,841
|
|
|||||||||
|
B. C. Terry
|
Pension
|
n/a
|
1,070
|
1,757
|
|
|||||||||
|
|
SBP-P
|
n/a
|
66,054
|
7,818
|
|
|||||||||
|
SERP
|
n/a
|
—
|
11,717
|
|
||||||||||
|
|
SRA
|
n/a
|
—
|
57,800
|
|
|||||||||
As described in the Change-in-Control chart, the only change in the form of payment, acceleration, or enhancement of the pension benefits is that the single sum value of benefits earned up to the change-in-control date under the SBP-P and the SERP could be paid as a single payment rather than in 10 annual installments. Also, the SERP benefits vest for participants who are not retirement-eligible upon a change in control. Estimates of the single sum payment that would have been made to the named executive officers, assuming termination as of December 31, 2013 following a change-in-control event, other than a Southern Company Change-in-Control I (which does not impact how pension benefits are paid), are itemized below. These amounts would be paid instead of the benefits shown in the Traditional Termination Events chart above; they are not paid in addition to those amounts.
|
Name
|
SBP-P ($)
|
SERP ($)
|
SRA ($)
|
Total ($)
|
|||||||||||||||||||||||||
|
S. W. Connally, Jr.
|
414,189
|
380,981
|
—
|
795,170
|
|||||||||||||||||||||||||
|
R. S. Teel
|
62,278
|
104,533
|
—
|
166,811
|
|||||||||||||||||||||||||
|
M. L. Burroughs
|
90,893
|
149,102
|
—
|
239,995
|
|||||||||||||||||||||||||
|
P. B. Jacob
|
337,499
|
378,407
|
—
|
715,906
|
|||||||||||||||||||||||||
|
B. C. Terry
|
64,969
|
97,365
|
480,320
|
642,654
|
|||||||||||||||||||||||||
The pension benefit amounts in the tables above were calculated as of December 31, 2013 assuming payments would begin as soon as possible under the terms of the plans. Accordingly, appropriate early retirement reductions were applied. Any unpaid annual performance-based compensation was assumed to be paid at 1.30 times the target level. Pension Plan benefits were calculated assuming each named executive officer chose a single life annuity form of payment, because that results in the greatest monthly benefit. The single sum values were based on a 2.88% discount rate
.
Annual Performance Pay Program
The amount payable if a change in control had occurred on December 31, 2013 is the greater of target or actual performance. Because actual payouts for 2013 performance were below the target level, the amount that would have been payable was the target amount as reported in the CD&A
.
III-34
Stock Options
and Performance Share Units (Equity Awards)
Equity Awards would be treated as described in the Termination and Change-in-Control charts above. Under a Southern Company Termination, all Equity Awards vest. In addition, if there is an Involuntary Change-in-Control Termination or Voluntary Change-in-Control Termination for Good Reason, Equity Awards vest. There is no payment associated with Equity Awards unless there is a Southern Company Termination and the participants' Equity Awards cannot be converted into surviving company awards. In that event, the value of outstanding Equity Awards would be paid to the named executive officers. For stock options, that value is the excess of the exercise price and the closing price of Common Stock on December 31, 2013 and, for performance shares, it is the closing price on December 31, 2013.
The chart below shows the number of stock options for which vesting would be accelerated under a Southern Company Termination and the amount that would be payable under a Southern Company Termination if there were no conversion to the surviving company's stock options. It also shows the number and value of performance shares that would be paid.
|
|
|||||||
|
Total Number of
|
|||||||
|
Number of Equity
|
Equity Awards
|
Total Payable in
|
|||||
|
Awards with
|
Following
|
Cash without
|
|||||
|
Accelerated Vesting (#)
|
Accelerated Vesting (#)
|
Conversion of
|
|||||
|
Stock
|
Performance
|
Stock
|
Performance
|
Equity
|
|||
|
Name
|
Options
|
Shares
|
Options
|
Shares
|
Awards ($)
|
||
|
S. W. Connally, Jr.
|
82,974
|
9,179
|
143,766
|
9,179
|
787,854
|
||
|
R. S. Teel
|
37,115
|
4,237
|
97,244
|
4,237
|
563,431
|
||
|
M. L. Burroughs
|
19,594
|
2,233
|
34,252
|
2,233
|
155,462
|
||
|
P. B. Jacob
|
39,506
|
4,491
|
83,335
|
4,491
|
472,390
|
||
|
B. C. Terry
|
40,018
|
4,547
|
110,676
|
4,547
|
650,868
|
||
DCP and SBP
The aggregate balances reported in the Nonqualified Deferred Compensation table would be payable to the named executive officers as described in the Traditional Termination and Change-in-Control-Related Events charts above. There is no enhancement or acceleration of payments under these plans associated with termination or change-in-control events, other than the lump-sum payment opportunity described in the above charts. The lump sums that would be payable are those that are reported in the Nonqualified Deferred Compensation table
.
Healthcare Benefits
Messrs. Burroughs and Jacob are retirement-eligible. Healthcare benefits are provided to retirees, and there is no incremental payment associated with the termination or change-in-control events. At the end of 2013, the other named executive officers were not retirement-eligible and thus healthcare benefits would not become available until each reaches age 50, except in the case of a change-in-control-related termination, as described in the Change-in-Control-Related Events chart. The estimated cost of providing healthcare insurance premiums for up to a maximum of two years for Ms. Terry and Mr. Teel is $11,603 and $27,630, respectively. The estimated cost of providing healthcare insurance premiums for up to a maximum of three years for Mr. Connally is $44,069
.
Financial Planning Perquisite
Since Messrs. Burroughs and Jacob are retirement-eligible, an additional year of the Financial Planning perquisite, which is set at a maximum of $8,700 per year, will be provided after retirement. The other named executive officers are not retirement-eligible.
There are no other perquisites provided to the named executive officers under any of the traditional termination or change-in-control-related events
.
Severance Benefits
The named executive officers are participants in a change-in-control severance plan. The plan provides severance benefits, including outplacement services, if within two years of a change in control, they are involuntarily terminated, not for cause, or they voluntarily terminate for Good Reason. The severance benefits are not paid unless the named executive officer releases the employing company from any claims he or she may have against the employing company.
III-35
The estimated cost of providing the six months of outplacement services is $6,000 per named executive officer. The severance payment is two times the base salary and target payout under the annual Performance Pay Program for Mr. Connally and one times the base salary and target payout under the annual Performance Pay Program for the other named executive officers. If any portion of the severance amount constitutes an "excess parachute payment" under Section 280G of the Code and is therefore subject to an excise tax, the severance amount will be reduced unless the after-tax "unreduced amount" exceeds the after-tax "reduced amount." Excise tax gross-ups will not be provided on change-in-control severance payments.
The table below estimates the severance payments that would be made to the named executive officers if they were terminated as of December 31, 2013 in connection with a change in control.
|
|
|
|
||
|
Name
|
Severance Amount ($)
|
|||
|
S. W. Connally, Jr.
|
1,202,240
|
|||
|
R. S. Teel
|
357,070
|
|||
|
M. L. Burroughs
|
272,295
|
|||
|
P. B. Jacob
|
376,231
|
|||
|
B. C. Terry
|
383,177
|
|||
III-36
DIRECTOR COMPENSATION
Only non-employee directors of Gulf Power are compensated for service on the board of directors.
During 2013, the pay components for non-employee directors were:
|
Annual cash retainer:
|
$22,000 per year
|
|
Annual stock retainer:
|
$19,500 per year in Common Stock
|
|
Board meeting fees:
|
If more than five meetings are held in a calendar year, $1,200 will be paid for participation beginning with the sixth meeting.
|
|
Committee meeting fees:
|
If more than five meetings of any one committee are held in a calendar year, $1,000 will be paid for participation in each meeting of that committee beginning with the sixth meeting.
|
DIRECTOR DEFERRED COMPENSATION PLAN
Any deferred quarterly equity grants or stock retainers are required to be deferred in the Deferred Compensation Plan For Directors of Gulf Power Company (Director Deferred Compensation Plan) and are invested in Common Stock units which earn dividends as if invested in Common Stock. Earnings are reinvested in additional stock units. Upon leaving the board, distributions are made in shares of Common Stock.
In addition, directors may elect to defer up to 100% of their remaining compensation in the Director Deferred Compensation Plan until membership on the board ends. Deferred compensation may be invested as follows, at the director's election:
|
•
|
in Common Stock units which earn dividends as if invested in Common Stock and are distributed in shares of Common Stock upon leaving the board;
|
|
•
|
in Common Stock units which earn dividends as if invested in Common Stock and are distributed in cash upon leaving the board; or
|
|
•
|
at prime interest which is paid in cash upon leaving the board.
|
All investments and earnings in the Director Deferred Compensation Plan are fully vested and, at the election of the director, may be distributed in a lump sum payment or in up to 10 annual distributions after leaving the board
.
III-37
DIRECTOR COMPENSATION TABLE
The following table reports all compensation to Gulf Power's non-employee directors during 2013, including amounts deferred in the Director Deferred Compensation Plan. Non-employee directors do not receive Non-Equity Incentive Plan Compensation or stock option awards, and there is no pension plan for non-employee directors
.
|
Name
|
Fees Earned or Paid in Cash
($)(1)
|
Stock
Awards
($)(2)
|
Change in Pension Value and Nonqualified Deferred Compensation Earnings
($)
|
All Other Compensation
($) (3)
|
Total
($)
|
||||
|
Allan G. Bense
|
22,000
|
|
19,500
|
|
0
|
325
|
|
41,825
|
|
|
Deborah H. Calder
|
22,000
|
|
19,500
|
|
0
|
33
|
|
41,533
|
|
|
William C. Cramer, Jr.
|
22,000
|
|
19,500
|
|
0
|
33
|
|
41,533
|
|
|
Julian B. MacQueen (4)
|
11,000
|
|
9,750
|
|
0
|
64
|
|
20,814
|
|
|
J. Mort O'Sullivan III
|
22,000
|
|
19,500
|
|
0
|
325
|
|
41,825
|
|
|
Michael T. Rehwinkel (4)
|
5,500
|
|
4,875
|
|
0
|
13
|
|
10,388
|
|
|
Winston E. Scott
|
22,000
|
|
19,500
|
|
0
|
33
|
|
41,533
|
|
|
(1)
|
Includes amounts voluntarily deferred in the Director Deferred Compensation Plan.
|
|
(2)
|
Includes fair market value of equity grants on grant dates. All such stock awards are vested immediately upon grant.
|
|
(3)
|
Consists of reimbursement for taxes on imputed income associated with gifts and activities provided to attendees at Southern Company system-sponsored events and group life insurance.
|
|
(4)
|
Messrs. MacQueen and Rehwinkel were elected to Gulf Power's board of directors effective July 25, 2013 and November 21, 2013, respectively.
|
COMPENSATION RISK ASSESSMENT
Southern Company reviewed its compensation policies and practices, including those of Gulf Power, and concluded that excessive risk-taking is not encouraged. This conclusion was based on an assessment of the mix of pay components and performance goals, the annual pay/performance analysis by the Compensation Committee's independent consultant, stock ownership requirements, compensation governance practices, and the claw-back provision. The assessment was reviewed with the Compensation Committee.
COMPENSATION COMMITTEE INTERLOCKS AND INSIDER PARTICIPATION
The Compensation Committee is made up of non-employee directors of Southern Company who have never served as executive officers of Southern Company or Gulf Power. During 2013, none of Southern Company's or Gulf Power's executive officers served on the board of directors of any entities whose directors or executive officers serve on the Compensation Committee.
III-38
|
ITEM 12.
|
SECURITY OWNERSHIP OF CERTAIN BENEFICIAL OWNERS AND MANAGEMENT AND RELATED STOCKHOLDER MATTERS
|
(a) Security Ownership (Applicable to Gulf Power only).
Security Ownership of Certain Beneficial Owners
.
Southern Company is the beneficial owner of 100% of the outstanding common stock of Gulf Power. The number of outstanding shares reported in the table below is as of January 31, 2014.
|
Title of Class
|
Name and Address
of Beneficial
Owner
|
Amount and
Nature of
Beneficial
Ownership
|
Percent
of
Class
|
|||||
|
Common Stock
|
The Southern Company
30 Ivan Allen Jr. Boulevard, N.W.
Atlanta, Georgia 30308
|
100
|
%
|
|||||
|
Registrant:
Gulf Power
|
5,442,717
|
|
||||||
Security Ownership of Management.
The following tables show the number of shares of Common Stock owned by the directors, nominees, and executive officers as of December 31, 2013. It is based on information furnished by the directors, nominees, and executive officers. The shares beneficially owned by all directors, nominees, and executive officers as a group constitute less than one percent of the total number of shares of Common Stock outstanding on December 31, 2013.
|
|
|
Shares Beneficially Owned Include:
|
||||||
|
Name of Directors,
Nominees, and
Executive Officers
|
Shares
Beneficially
Owned (1)
|
Deferred Stock
Units (2)
|
Shares
Individuals
Have Rights
to Acquire
Within 60
Days (3)
|
|||||
|
S. W. Connally, Jr.
|
102,176
|
|
0
|
|
93,812
|
|
||
|
Allan G. Bense
|
2,478
|
|
0
|
|
0
|
|
||
|
Deborah H. Calder
|
1,948
|
|
1,467
|
|
0
|
|
||
|
William C. Cramer, Jr.
|
15,676
|
|
15,676
|
|
0
|
|
||
|
Julian B. MacQueen
|
483
|
|
—
|
|
0
|
|
||
|
J. Mort O'Sullivan III
|
2,836
|
|
2,836
|
|
0
|
|
||
|
Michael T. Rehwinkel
|
—
|
|
0
|
|
0
|
|
||
|
Winston E. Scott
|
6,909
|
|
0
|
|
0
|
|
||
|
P. Bernard Jacob
|
73,941
|
|
0
|
|
63,103
|
|
||
|
Michael L. Burroughs
|
28,648
|
|
0
|
|
24,172
|
|
||
|
Richard S. Teel
|
79,401
|
|
0
|
|
78,109
|
|
||
|
Bentina C. Terry
|
95,710
|
|
0
|
|
90,143
|
|
||
|
Directors, Nominees, and Executive Officers as a group (12 people)
|
410,206
|
|
19,979
|
|
349,339
|
|
||
|
(1)
|
"Beneficial ownership" means the sole or shared power to vote, or to direct the voting of, a security and/or investment power with respect to a security or any combination thereof.
|
|
(2)
|
Indicates the number of deferred stock units held under the Director Deferred Compensation Plan.
|
|
(3)
|
Indicates shares of Common Stock that certain executive officers have the right to acquire within 60 days. Shares indicated are included in the Shares Beneficially Owned column.
|
Changes in Control.
Southern Company and Gulf Power know of no arrangements which may at a subsequent date result in any change in control.
III-39
(b) Equity Compensation Plan Information (Applicable to all registrants).
The following table provides information as of December 31, 2013 concerning shares of Common Stock authorized for issuance under Southern Company's existing non-qualified equity compensation plans.
|
Plan category
|
Number of securities to be issued upon exercise of outstanding options, warrants, and rights (a)
|
Weighted-average exercise price of outstanding options, warrants, and rights (b)
|
Number of securities remaining available for future issuance under equity compensation plans (excluding securities reflected in column (a)) (c)
|
||
|
Equity compensation plans approved by security holders
|
38,819,366
|
$38.64
|
29,533,239
|
||
|
Equity compensation plans not approved by security holders
|
n/a
|
n/a
|
n/a
|
||
|
(1)
|
Includes shares available for future issuance under the Omnibus Incentive Compensation Plan (28,421,692) and the Outside Directors Stock Plan (1,111,547).
|
|
ITEM 13.
|
CERTAIN RELATIONSHIPS AND RELATED TRANSACTIONS, AND DIRECTOR INDEPENDENCE.
|
Transactions with Related Persons.
None.
Review, Approval or Ratification of Transactions with Related Persons.
Gulf Power does not have a written policy pertaining solely to the approval or ratification of "related party transactions." Southern Company has a Code of Ethics as well as a Contract Guidance Manual and other formal written procurement policies and procedures that guide the purchase of goods and services, including requiring competitive bids for most transactions above $10,000 or approval based on documented business needs for sole sourcing arrangements. The approval and ratification of any related party transactions would be subject to these written policies and procedures which include a determination of the need for the goods and services; preparation and evaluation of requests for proposals by supply chain management; the writing of contracts; controls and guidance regarding the evaluation of the proposals; and negotiation of contract terms and conditions. As appropriate, these contracts are also reviewed by individuals in the legal, accounting, and/or risk management/services departments prior to being approved by the responsible individual. The responsible individual will vary depending on the department requiring the goods and services, the dollar amount of the contract, and the appropriate individual within that department who has the authority to approve a contract of the applicable dollar amount.
Director Independence.
The board of directors of Gulf Power consists of seven non-employee directors (Ms. Deborah H. Calder and Messrs. Allan G. Bense, William C. Cramer, Jr., Julian B. MacQueen, J. Mort O'Sullivan, III, Michael T. Rehwinkel, and Winston E. Scott) and Mr. Connally.
Southern Company owns all of Gulf Power's outstanding common stock. Gulf Power has listed only debt securities on the NYSE. Accordingly, under the rules of the NYSE, Gulf Power is exempt from most of the NYSE's listing standards relating to corporate governance. Gulf Power has voluntarily complied with certain NYSE listing standards relating to corporate governance where such compliance was deemed to be in the best interests of Gulf Power's shareholders. In addition, under the rules of the SEC, Gulf Power is exempt from the audit committee requirements of Section 301 of the Sarbanes-Oxley Act of 2002 and, therefore, is not required to have an audit committee or an audit committee report on whether it has an audit committee financial expert.
III-40
|
ITEM 14.
|
PRINCIPAL ACCOUNTANT FEES AND SERVICES
|
The following represents the fees billed to Gulf Power and Southern Power for the last two fiscal years by Deloitte & Touche LLP, each company's principal public accountant for 2013 and 2012:
|
2013
|
2012
|
||||||
|
|
(in thousands)
|
||||||
|
Gulf Power
|
|||||||
|
Audit Fees (1)
|
$
|
1,395
|
|
$
|
1,454
|
|
|
|
Audit-Related Fees
|
—
|
|
—
|
|
|||
|
Tax Fees
|
—
|
|
—
|
|
|||
|
All Other Fees
|
—
|
|
—
|
|
|||
|
Total
|
$
|
1,395
|
|
$
|
1,454
|
|
|
|
Southern Power
|
|||||||
|
Audit Fees (1)
|
$
|
1,159
|
|
$
|
1,279
|
|
|
|
Audit-Related Fees
|
—
|
|
—
|
|
|||
|
Tax Fees
|
—
|
|
—
|
|
|||
|
All Other Fees
|
—
|
|
—
|
|
|||
|
Total
|
$
|
1,159
|
|
$
|
1,279
|
|
|
|
(1)
|
Includes services performed in connection with financing transactions.
|
The Southern Company Audit Committee (on behalf of Southern Company and its subsidiaries) adopted a Policy of Engagement of the Independent Auditor for Audit and Non-Audit Services that includes requirements for such Audit Committee to pre-approve audit and non-audit services provided by Deloitte & Touche LLP. All of the audit services provided by Deloitte & Touche LLP in fiscal years 2013 and 2012 (described in the footnotes to the table above) and related fees were approved in advance by the Southern Company Audit Committee.
III-41
|
Item 15.
|
EXHIBITS AND FINANCIAL STATEMENT SCHEDULES
|
|
(a)
|
The following documents are filed as a part of this report on Form 10-K:
|
|
(1)
|
Financial Statements and Financial Statement Schedules:
|
Management's Report on Internal Control Over Financial Reporting for Southern Company and Subsidiary Companies is listed under Item 8 herein.
Management's Report on Internal Control Over Financial Reporting for Alabama Power is listed under Item 8 herein.
Management's Report on Internal Control Over Financial Reporting for Georgia Power is listed under Item 8 herein.
Management's Report on Internal Control Over Financial Reporting for Gulf Power is listed under Item 8 herein.
Management's Report on Internal Control Over Financial Reporting for Mississippi Power is listed under Item 8 herein.
Management's Report on Internal Control Over Financial Reporting for Southern Power and Subsidiary Companies is listed under Item 8 herein.
Reports of Independent Registered Public Accounting Firm on the financial statements and financial statement schedules for Southern Company and Subsidiary Companies, Alabama Power, Georgia Power, Gulf Power, and Mississippi Power, as well as the Report of Independent Registered Public Accounting Firm on the financial statements of Southern Power and Subsidiary Companies are listed under Item 8 herein.
The financial statements filed as a part of this report for Southern Company and Subsidiary Companies, Alabama Power, Georgia Power, Gulf Power, Mississippi Power, and Southern Power and Subsidiary Companies are listed under Item 8 herein.
The financial statement schedules for Southern Company and Subsidiary Companies, Alabama Power, Georgia Power, Gulf Power, and Mississippi Power are listed in the Index to the Financial Statement Schedules at page S-1.
|
(2)
|
Exhibits:
|
Exhibits for Southern Company, Alabama Power, Georgia Power, Gulf Power, Mississippi Power, and Southern Power are listed in the Exhibit Index at page E-1.
IV-1
THE SOUTHERN COMPANY
SIGNATURES
Pursuant to the requirements of Section 13 or 15(d) of the Securities Exchange Act of 1934, the registrant has duly caused this report to be signed on its behalf by the undersigned, thereunto duly authorized. The signature of the undersigned company shall be deemed to relate only to matters having reference to such company and any subsidiaries thereof.
|
THE SOUTHERN COMPANY
|
|
|
By:
|
Thomas A. Fanning
|
|
Chairman, President, and
|
|
|
Chief Executive Officer
|
|
|
By:
|
/s/ Melissa K. Caen
|
|
(Melissa K. Caen, Attorney-in-fact)
|
|
|
Date:
|
February 27, 2014
|
Pursuant to the requirements of the Securities Exchange Act of 1934, this report has been signed below by the following persons on behalf of the registrant and in the capacities and on the dates indicated. The signature of each of the undersigned shall be deemed to relate only to matters having reference to the above-named company and any subsidiaries thereof.
|
Thomas A. Fanning
Chairman, President,
Chief Executive Officer, and Director
(Principal Executive Officer)
|
|||
|
Art P. Beattie
Executive Vice President and Chief Financial Officer
(Principal Financial Officer)
|
|||
|
Ann P. Daiss
Comptroller and Chief Accounting Officer
(Principal Accounting Officer)
|
|||
|
Directors:
|
|||
|
Juanita Powell Baranco
Jon A. Boscia
Henry A. Clark III
David J. Grain
H. William Habermeyer, Jr.
Veronica M. Hagen
|
Warren A. Hood, Jr.
Donald M. James
Dale E. Klein
William G. Smith, Jr.
Steven R. Specker
E. Jenner Wood III
|
||
|
By:
|
/s/ Melissa K. Caen
|
|
|
(Melissa K. Caen, Attorney-in-fact)
|
||
Date:
February 27, 2014
IV-2
ALABAMA POWER COMPANY
SIGNATURES
Pursuant to the requirements of Section 13 or 15(d) of the Securities Exchange Act of 1934, the registrant has duly caused this report to be signed on its behalf by the undersigned, thereunto duly authorized. The signature of the undersigned company shall be deemed to relate only to matters having reference to such company and any subsidiaries thereof.
|
ALABAMA POWER COMPANY
|
|
|
By:
|
Charles D. McCrary
|
|
President and Chief Executive Officer
|
|
|
By:
|
/s/ Melissa K. Caen
|
|
(Melissa K. Caen, Attorney-in-fact)
|
|
|
Date:
|
February 27, 2014
|
Pursuant to the requirements of the Securities Exchange Act of 1934, this report has been signed below by the following persons on behalf of the registrant and in the capacities and on the dates indicated. The signature of each of the undersigned shall be deemed to relate only to matters having reference to the above-named company and any subsidiaries thereof.
|
Charles D. McCrary
President, Chief Executive Officer, and Director
(Principal Executive Officer)
|
|||
|
Philip C. Raymond
Executive Vice President, Chief Financial Officer, and Treasurer
(Principal Financial Officer)
|
|||
|
Anita Allcorn-Walker
Vice President and Comptroller
(Principal Accounting Officer)
|
|||
|
Directors:
|
|||
|
Whit Armstrong
Ralph D. Cook
David J. Cooper, Sr.
Thomas A. Fanning
John D. Johns
Patricia M. King
|
James K. Lowder
Malcolm Portera
Robert D. Powers
C. Dowd Ritter
James H. Sanford
John Cox Webb, IV
|
||
|
By:
|
/s/ Melissa K. Caen
|
|
|
(Melissa K. Caen, Attorney-in-fact)
|
||
Date:
February 27, 2014
IV-3
GEORGIA POWER COMPANY
SIGNATURES
Pursuant to the requirements of Section 13 or 15(d) of the Securities Exchange Act of 1934, the registrant has duly caused this report to be signed on its behalf by the undersigned, thereunto duly authorized. The signature of the undersigned company shall be deemed to relate only to matters having reference to such company and any subsidiaries thereof.
|
GEORGIA POWER COMPANY
|
|
|
By:
|
W. Paul Bowers
|
|
President and Chief Executive Officer
|
|
|
By:
|
/s/ Melissa K. Caen
|
|
(Melissa K. Caen, Attorney-in-fact)
|
|
|
Date:
|
February 27, 2014
|
Pursuant to the requirements of the Securities Exchange Act of 1934, this report has been signed below by the following persons on behalf of the registrant and in the capacities and on the dates indicated. The signature of each of the undersigned shall be deemed to relate only to matters having reference to the above-named company and any subsidiaries thereof.
|
W. Paul Bowers
President, Chief Executive Officer, and Director
(Principal Executive Officer)
|
|||
|
W. Ron Hinson
Executive Vice President, Chief Financial Officer,
and Treasurer
(Principal Financial Officer)
|
|||
|
Laura I. Patterson
Comptroller and Assistant Secretary
(Principal Accounting Officer)
|
|||
|
Directors:
|
|||
|
Robert L. Brown, Jr.
Anna R. Cablik
Thomas A. Fanning
Stephen S. Green
Jimmy C. Tallent
|
Charles K. Tarbutton
Beverly Daniel Tatum
D. Gary Thompson
Clyde C. Tuggle
Richard W. Ussery
|
||
|
By:
|
/s/ Melissa K. Caen
|
|
|
(Melissa K. Caen, Attorney-in-fact)
|
||
Date:
February 27, 2014
IV-4
GULF POWER COMPANY
SIGNATURES
Pursuant to the requirements of Section 13 or 15(d) of the Securities Exchange Act of 1934, the registrant has duly caused this report to be signed on its behalf by the undersigned, thereunto duly authorized. The signature of the undersigned company shall be deemed to relate only to matters having reference to such company and any subsidiaries thereof.
|
GULF POWER COMPANY
|
|
|
By:
|
S. W. Connally, Jr.
|
|
President and Chief Executive Officer
|
|
|
By:
|
/s/ Melissa K. Caen
|
|
(Melissa K. Caen, Attorney-in-fact)
|
|
|
Date:
|
February 27, 2014
|
Pursuant to the requirements of the Securities Exchange Act of 1934, this report has been signed below by the following persons on behalf of the registrant and in the capacities and on the dates indicated. The signature of each of the undersigned shall be deemed to relate only to matters having reference to the above-named company and any subsidiaries thereof.
|
S. W. Connally, Jr.
President, Chief Executive Officer, and Director
(Principal Executive Officer)
|
|||
|
Richard S. Teel
Vice President and Chief Financial Officer
(Principal Financial Officer)
|
|||
|
Constance J. Erickson
Comptroller
(Principal Accounting Officer)
|
|||
|
Directors:
|
|||
|
Allan G. Bense
|
J. Mort O'Sullivan, III
|
||
|
Deborah H. Calder
|
Michael T. Rehwinkel
|
||
|
William C. Cramer, Jr.
|
Winston E. Scott
|
||
|
Julian B. MacQueen
|
|||
|
By:
|
/s/ Melissa K. Caen
|
|
|
(Melissa K. Caen, Attorney-in-fact)
|
||
Date:
February 27, 2014
IV-5
MISSISSIPPI POWER COMPANY
SIGNATURES
Pursuant to the requirements of Section 13 or 15(d) of the Securities Exchange Act of 1934, the registrant has duly caused this report to be signed on its behalf by the undersigned, thereunto duly authorized. The signature of the undersigned company shall be deemed to relate only to matters having reference to such company and any subsidiaries thereof.
|
MISSISSIPPI POWER COMPANY
|
|
|
By:
|
G. Edison Holland, Jr.
|
|
President and Chief Executive Officer
|
|
|
By:
|
/s/ Melissa K. Caen
|
|
(Melissa K. Caen, Attorney-in-fact)
|
|
|
Date:
|
February 27, 2014
|
Pursuant to the requirements of the Securities Exchange Act of 1934, this report has been signed below by the following persons on behalf of the registrant and in the capacities and on the dates indicated. The signature of each of the undersigned shall be deemed to relate only to matters having reference to the above-named company and any subsidiaries thereof.
|
G. Edison Holland, Jr.
President, Chief Executive Officer, and Director
(Principal Executive Officer)
|
|||
|
Moses H. Feagin
Vice President, Treasurer, and
Chief Financial Officer
(Principal Financial Officer)
|
|||
|
Cynthia F. Shaw
Comptroller
(Principal Accounting Officer)
|
|||
|
Directors:
|
|||
|
Carl J. Chaney
|
Christine L. Pickering
|
||
|
L. Royce Cumbest
|
Phillip J. Terrell
|
||
|
Thomas A. Dews
|
M. L. Waters
|
||
|
Mark E. Keenum
|
|||
|
By:
|
/s/ Melissa K. Caen
|
|
|
(Melissa K. Caen, Attorney-in-fact)
|
||
Date:
February 27, 2014
IV-6
SOUTHERN POWER COMPANY
SIGNATURES
Pursuant to the requirements of Section 13 or 15(d) of the Securities Exchange Act of 1934, the registrant has duly caused this report to be signed on its behalf by the undersigned, thereunto duly authorized. The signature of the undersigned company shall be deemed to relate only to matters having reference to such company and any subsidiaries thereof.
|
SOUTHERN POWER COMPANY
|
|
|
By:
|
Oscar C. Harper IV
|
|
President and Chief Executive Officer
|
|
|
By:
|
/s/ Melissa K. Caen
|
|
(Melissa K. Caen, Attorney-in-fact)
|
|
|
Date:
|
February 27, 2014
|
Pursuant to the requirements of the Securities Exchange Act of 1934, this report has been signed below by the following persons on behalf of the registrant and in the capacities and on the dates indicated. The signature of each of the undersigned shall be deemed to relate only to matters having reference to the above-named company and any subsidiaries thereof.
|
Oscar C. Harper IV
President, Chief Executive Officer, and Director
(Principal Executive Officer)
|
|||
|
William C. Grantham
Vice President, Chief Financial Officer, and Treasurer
(Principal Financial Officer)
|
|||
|
Janet J. Hodnett
Comptroller and Corporate Secretary
(Principal Accounting Officer)
|
|||
|
Directors:
|
|||
|
Art P. Beattie
|
Kimberly S. Greene
|
||
|
Thomas A. Fanning
|
Christopher C. Womack
|
||
|
By:
|
/s/ Melissa K. Caen
|
|
|
(Melissa K. Caen, Attorney-in-fact)
|
||
Date:
February 27, 2014
Supplemental Information to be Furnished With Reports Filed Pursuant to Section 15(d) of the Act by Registrants Which Have Not Registered Securities Pursuant to Section 12 of the Act:
No annual report, proxy statement, form of proxy or other proxy soliciting material has been sent to security holders of the registrant during the period covered by this Annual Report on Form 10-K for the fiscal year ended December 31, 2013.
IV-7
R
EPORT OF INDEPENDENT REGISTERED PUBLIC ACCOUNTING FIRM
To the Board of Directors and Stockholders of
Southern Company
We have audited the consolidated financial statements of Southern Company and Subsidiaries (the "Company") as of
December 31, 2013 and 2012, and for each of the three years in the period ended December 31, 2013, and the Company's internal control over financial reporting as of December 31, 2013, and have issued our report thereon dated
February 27, 2014
; such report is included elsewhere in this Form 10-K. Our audits also included the consolidated financial statement schedule of the Company (page S-2) listed in Item 15. This consolidated financial statement schedule is the responsibility of the Company's management. Our responsibility is to express an opinion based on our audits. In our opinion, such consolidated financial statement schedule, when considered in relation to the basic consolidated financial statements taken as a whole, presents fairly, in all material respects, the information set forth therein.
/s/ Deloitte & Touche LLP
Atlanta, Georgia
February 27, 2014
IV-8
REPORT OF INDEPENDENT REGISTERED PUBLIC ACCOUNTING FIRM
To the Board of Directors of
Alabama Power Company
We have audited the financial statements of Alabama Power Company (the "Company") (a wholly owned subsidiary of The Southern Company) as of December 31, 2013 and 2012, and for each of the three years in the period ended December 31, 2013, and have issued our report thereon dated
February 27, 2014
; such report is included elsewhere in this Form 10-K. Our audits also included the financial statement schedule of the Company (Page S-3) listed in Item 15. This financial statement schedule is the responsibility of the Company's management. Our responsibility is to express an opinion based on our audits. In our opinion, such financial statement schedule, when considered in relation to the basic financial statements taken as a whole, presents fairly, in all material respects, the information set forth therein.
/s/ Deloitte & Touche LLP
Birmingham, Alabama
February 27, 2014
IV-9
REPORT OF INDEPENDENT REGISTERED PUBLIC ACCOUNTING FIRM
To the Board of Directors of
Georgia Power Company
We have audited the financial statements of Georgia Power Company (the "Company") (a wholly owned subsidiary of The Southern Company) as of December 31, 2013 and 2012, and for each of the three years in the period ended December 31, 2013, and have issued our report thereon dated
February 27, 2014
; such report is included elsewhere in this Form 10-K. Our audits also included the financial statement schedule of the Company (Page S-4) listed in Item 15. This financial statement schedule is the responsibility of the Company's management. Our responsibility is to express an opinion based on our audits. In our opinion, such financial statement schedule, when considered in relation to the basic financial statements taken as a whole, presents fairly, in all material respects, the information set forth therein.
/s/ Deloitte & Touche LLP
Atlanta, Georgia
February 27, 2014
IV-10
REPORT OF INDEPENDENT REGISTERED PUBLIC ACCOUNTING FIRM
To the Board of Directors of
Gulf Power Company
We have audited the financial statements of Gulf Power Company (the "Company") (a wholly owned subsidiary of The Southern Company) as of December 31, 2013 and 2012, and for each of the three years in the period ended December 31, 2013, and have issued our report thereon dated
February 27, 2014
; such report is included elsewhere in this Form 10-K. Our audits also included the financial statement schedule of the Company (Page S-5) listed in Item 15. This financial statement schedule is the responsibility of the Company's management. Our responsibility is to express an opinion based on our audits. In our opinion, such financial statement schedule, when considered in relation to the basic financial statements taken as a whole, presents fairly, in all material respects, the information set forth therein.
/s/ Deloitte & Touche LLP
Atlanta, Georgia
February 27, 2014
IV-11
REPORT OF INDEPENDENT REGISTERED PUBLIC ACCOUNTING FIRM
To the Board of Directors of
Mississippi Power Company
We have audited the financial statements of Mississippi Power Company (the "Company") (a wholly owned subsidiary of The Southern Company) as of December 31, 2013 and 2012, and for each of the three years in the period ended December 31, 2013, and have issued our report thereon dated
February 27, 2014
; such report is included elsewhere in this Form 10-K. Our audits also included the financial statement schedule of the Company (Page S-6) listed in Item 15. This financial statement schedule is the responsibility of the Company's management. Our responsibility is to express an opinion based on our audits. In our opinion, such financial statement schedule, when considered in relation to the basic financial statements taken as a whole, presents fairly, in all material respects, the information set forth therein.
/s/ Deloitte & Touche LLP
Atlanta, Georgia
February 27, 2014
IV-12
INDEX TO FINANCIAL STATEMENT SCHEDULES
|
|
Page
|
|
Schedule II
|
|
|
Valuation and Qualifying Accounts and Reserves 2013, 2012, and 2011
|
|
|
S-2
|
|
|
S-3
|
|
|
S-4
|
|
|
S-5
|
|
|
S-6
|
|
Schedules I through V not listed above are omitted as not applicable or not required. A Schedule II for Southern Power Company and Subsidiary Companies is not being provided because there were no reportable items for the three-year period ended
December 31, 2013
. Columns omitted from schedules filed have been omitted because the information is not applicable or not required.
S-1
THE SOUTHERN COMPANY AND SUBSIDIARY COMPANIES
SCHEDULE II — VALUATION AND QUALIFYING ACCOUNTS
FOR THE YEARS ENDED
DECEMBER 31, 2013
,
2012
, AND
2011
(Stated in Thousands of Dollars)
|
|
|
Additions
|
|
|
|||||||||||||||
|
Description
|
Balance at Beginning of Period
|
Charged to Income
|
Charged to Other Accounts
|
Deductions (Note)
|
Balance at End of Period
|
||||||||||||||
|
Provision for uncollectible accounts
|
|||||||||||||||||||
|
2013
|
$
|
16,984
|
|
$
|
36,788
|
|
$
|
—
|
|
$
|
35,917
|
|
$
|
17,855
|
|
||||
|
2012
|
26,155
|
|
35,305
|
|
—
|
|
44,476
|
|
16,984
|
|
|||||||||
|
2011
|
24,919
|
|
66,641
|
|
—
|
|
65,405
|
|
26,155
|
|
|||||||||
(Note) Represents write-off of accounts considered to be uncollectible, less recoveries of amounts previously written off.
S-2
ALABAMA POWER COMPANY
SCHEDULE II — VALUATION AND QUALIFYING ACCOUNTS
FOR THE YEARS ENDED
DECEMBER 31, 2013
,
2012
, AND
2011
(Stated in Thousands of Dollars)
|
|
|
Additions
|
|
|
|||||||||||||||
|
Description
|
Balance at Beginning
of Period
|
Charged to
Income
|
Charged to Other Accounts
|
Deductions
(Note)
|
Balance at End of Period
|
||||||||||||||
|
Provision for uncollectible accounts
|
|||||||||||||||||||
|
2013
|
$
|
8,450
|
|
$
|
12,327
|
|
$
|
—
|
|
$
|
12,427
|
|
$
|
8,350
|
|
||||
|
2012
|
9,856
|
|
10,537
|
|
—
|
|
11,943
|
|
8,450
|
|
|||||||||
|
2011
|
9,602
|
|
16,415
|
|
—
|
|
16,161
|
|
9,856
|
|
|||||||||
(Note)
Represents write-off of accounts considered to be uncollectible, less recoveries of amounts previously written off.
S-3
GEORGIA POWER COMPANY
SCHEDULE II — VALUATION AND QUALIFYING ACCOUNTS
FOR THE YEARS ENDED
DECEMBER 31, 2013
,
2012
, AND
2011
(Stated in Thousands of Dollars)
|
|
|
Additions
|
|
|
|||||||||||||||
|
Description
|
Balance at Beginning
of Period
|
Charged to
Income
|
Charged to Other
Accounts
|
Deductions
(Note)
|
Balance at End of Period
|
||||||||||||||
|
Provision for uncollectible accounts
|
|||||||||||||||||||
|
2013
|
$
|
6,259
|
|
$
|
18,362
|
|
$
|
—
|
|
$
|
19,547
|
|
$
|
5,074
|
|
||||
|
2012
|
13,038
|
|
20,995
|
|
—
|
|
27,774
|
|
6,259
|
|
|||||||||
|
2011
|
11,098
|
|
45,267
|
|
—
|
|
43,327
|
|
13,038
|
|
|||||||||
(
Note)
Represents write-off of accounts considered to be uncollectible, less recoveries of amounts previously written off.
S-4
GULF POWER COMPANY
SCHEDULE II — VALUATION AND QUALIFYING ACCOUNTS
FOR THE YEARS ENDED
DECEMBER 31, 2013
,
2012
, AND
2011
(Stated in Thousands of Dollars)
|
|
|
Additions
|
|
|
|||||||||||||||
|
Description
|
Balance at Beginning
of Period
|
Charged to
Income
|
Charged to Other
Accounts
|
Deductions
(Note)
|
Balance at End of Period
|
||||||||||||||
|
Provision for uncollectible accounts
|
|||||||||||||||||||
|
2013
|
$
|
1,490
|
|
$
|
1,900
|
|
$
|
—
|
|
$
|
2,259
|
|
$
|
1,131
|
|
||||
|
2012
|
1,962
|
|
2,611
|
|
—
|
|
3,083
|
|
1,490
|
|
|||||||||
|
2011
|
2,014
|
|
3,332
|
|
—
|
|
3,384
|
|
1,962
|
|
|||||||||
(Note)
Represents write-off of accounts considered to be uncollectible, less recoveries of amounts previously written off.
S-5
MISSISSIPPI POWER COMPANY
SCHEDULE II — VALUATION AND QUALIFYING ACCOUNTS
FOR THE YEARS ENDED
DECEMBER 31, 2013
,
2012
, AND
2011
(Stated in Thousands of Dollars)
|
|
|
Additions
|
|
|
|||||||||||||||
|
Description
|
Balance at Beginning
of Period
|
Charged to
Income
|
Charged to Other
Accounts
|
Deductions
(Note)
|
Balance at End of Period
|
||||||||||||||
|
Provision for uncollectible accounts
|
|||||||||||||||||||
|
2013
|
$
|
373
|
|
$
|
3,757
|
|
$
|
—
|
|
$
|
1,112
|
|
$
|
3,018
|
|
||||
|
2012
|
547
|
|
628
|
|
—
|
|
802
|
|
373
|
|
|||||||||
|
2011
|
638
|
|
1,235
|
|
—
|
|
1,326
|
|
547
|
|
|||||||||
(
Note
)
Represents write-off of accounts considered to be uncollectible, less recoveries of amounts previously written off.
S-6
EXHIBIT INDEX
The exhibits below with an asterisk (*) preceding the exhibit number are filed herewith. The remaining exhibits have previously been filed with the SEC and are incorporated herein by reference. The exhibits marked with a pound sign (#) are management contracts or compensatory plans or arrangements required to be identified as such by Item 15 of Form 10-K.
|
(2)
|
Plan of acquisition, reorganization, arrangement, liquidation or succession
|
|||||||||
|
Mississippi Power
|
||||||||||
|
(e)
|
1
|
—
|
Assignment and Assumption Agreement dated as of October 20, 2011, between Mississippi Power and Juniper Capital L.P. (Designated in Form 8-K dated October 20, 2011, File No. 001-11229, as Exhibit 2.1.)
|
|||||||
|
(e)
|
2
|
—
|
Bond Assumption and Exchange Agreement, dated as of October 20, 2011, by and among Mississippi Business Finance Corporation, Mississippi Power, and the bondholders parties thereto. (Designated in Form 8-K dated October 20, 2011, File No. 001-11229, as Exhibit 2.2.)
|
|||||||
|
(3)
|
Articles of Incorporation and By-Laws
|
|||||||||
|
Southern Company
|
||||||||||
|
(a)
|
1
|
—
|
Composite Certificate of Incorporation of Southern Company, reflecting all amendments thereto through May 27, 2010. (Designated in Registration No. 33-3546 as Exhibit 4(a), in Certificate of Notification, File No. 70-7341, as Exhibit A, in Certificate of Notification, File No. 70-8181, as Exhibit A, and in Form 8-K dated May 26, 2010, File No. 1-3526, as Exhibit 3.1.)
|
|||||||
|
(a)
|
2
|
—
|
By-laws of Southern Company as amended effective February 11, 2013, and as presently in effect. (Designated in Form 8-K dated February 11, 2013, File No. 1-3526, as Exhibit 3.1.)
|
|||||||
|
Alabama Power
|
||||||||||
|
(b)
|
1
|
—
|
Charter of Alabama Power and amendments thereto through April 25, 2008. (Designated in Registration Nos. 2-59634 as Exhibit 2(b), 2-60209 as Exhibit 2(c), 2-60484 as Exhibit 2(b), 2-70838 as Exhibit 4(a)-2, 2-85987 as Exhibit 4(a)-2, 33-25539 as Exhibit 4(a)-2, 33-43917 as Exhibit 4(a)-2, in Form 8-K dated February 5, 1992, File No. 1-3164, as Exhibit 4(b)-3, in Form 8-K dated July 8, 1992, File No. 1-3164, as Exhibit 4(b)-3, in Form 8-K dated October 27, 1993, File No. 1-3164, as Exhibits 4(a) and 4(b), in Form 8-K dated November 16, 1993, File No. 1-3164, as Exhibit 4(a), in Certificate of Notification, File No. 70-8191, as Exhibit A, in Alabama Power's Form 10-K for the year ended December 31, 1997, File No. 1-3164, as Exhibit 3(b)2, in Form 8-K dated August 10, 1998, File No. 1-3164, as Exhibit 4.4, in Alabama Power's Form 10-K for the year ended December 31, 2000, File No. 1-3164, as Exhibit 3(b)2, in Alabama Power's Form 10-K for the year ended December 31, 2001, File No. 1-3164, as Exhibit 3(b)2, in Form 8-K dated February 5, 2003, File No. 1-3164, as Exhibit 4.4, in Alabama Power's Form 10-Q for the quarter ended March 31, 2003, File No 1-3164, as Exhibit 3(b)1, in Form 8-K dated February 5, 2004, File No. 1-3164, as Exhibit 4.4, in Alabama Power's Form 10-Q for the quarter ended March 31, 2006, File No. 1-3164, as Exhibit 3(b)(1), in Form 8-K dated December 5, 2006, File No. 1-3164, as Exhibit 4.2, in Form 8-K dated September 12, 2007, File No. 1-3164, as Exhibit 4.5, in Form 8-K dated October 17, 2007, File No. 1-3164, as Exhibit 4.5, and in Alabama Power's Form 10-Q for the quarter ended March 31, 2008, File No. 1-3164, as Exhibit 3(b)1.)
|
|||||||
|
(b)
|
2
|
—
|
Amended and Restated By-laws of Alabama Power effective February 10, 2014, and as presently in effect. (Designated in Form 8-K dated February 10, 2014, File No 1-3164, as Exhibit 3.1.)
|
|||||||
|
Georgia Power
|
||||||||||
|
(c)
|
1
|
—
|
Charter of Georgia Power and amendments thereto through October 9, 2007. (Designated in Registration Nos. 2-63392 as Exhibit 2(a)-2, 2-78913 as Exhibits 4(a)-(2) and 4(a)-(3), 2-93039 as Exhibit 4(a)-(2), 2-96810 as Exhibit 4(a)-2, 33-141 as Exhibit 4(a)-(2), 33-1359 as Exhibit 4(a)(2), 33-5405 as Exhibit 4(b)(2), 33-14367 as Exhibits 4(b)-(2) and 4(b)-(3), 33-22504 as Exhibits 4(b)-(2), 4(b)-(3) and 4(b)-(4), in Georgia Power's Form 10-K for the year ended December 31, 1991, File No. 1-6468, as Exhibits 4(a)(2) and 4(a)(3), in Registration No. 33-48895 as Exhibits 4(b)-(2) and 4(b)-(3), in Form 8-K dated December 10, 1992, File No. 1-6468 as Exhibit 4(b), in Form 8-K dated June 17, 1993, File No. 1-6468, as Exhibit 4(b), in Form 8-K dated October 20, 1993, File No. 1-6468, as Exhibit 4(b), in Georgia Power's Form 10-K for the year ended December 31, 1997, File No. 1-6468, as Exhibit 3(c)2, in Georgia Power's Form 10-K for the year ended December 31, 2000, File No. 1-6468, as Exhibit 3(c)2, in Form 8-K dated June 27, 2006, File No. 1-6468, as Exhibit 3.1, and in Form 8-K dated October 3, 2007, File No. 1-6468, as Exhibit 4.5.)
|
|||||||
E-1
|
(c)
|
2
|
—
|
By-laws of Georgia Power as amended effective May 20, 2009, and as presently in effect. (Designated in Form 8-K dated May 20, 2009, File No. 1-6468, as Exhibit 3(c)2.)
|
|||||||
|
Gulf Power
|
||||||||||
|
(d)
|
1
|
—
|
Amended and Restated Articles of Incorporation of Gulf Power and amendments thereto through June 17, 2013. (Designated in Form 8-K dated October 27, 2005, File No. 001-31737, as Exhibit 3.1, in Form 8-K dated November 9, 2005, File No. 001-31737, as Exhibit 4.7, in Form 8-K dated October 16, 2007, File No. 001-31737, as Exhibit 4.5, and in Form 8-K dated June 10, 2013, File No. 001-31737, as Exhibit 4.7.)
|
|||||||
|
(d)
|
2
|
—
|
By-laws of Gulf Power as amended effective November 2, 2005, and as presently in effect. (Designated in Form 8-K dated October 27, 2005, File No. 001-31737, as Exhibit 3.2.)
|
|||||||
|
Mississippi Power
|
||||||||||
|
(e)
|
1
|
—
|
Articles of Incorporation of Mississippi Power, articles of merger of Mississippi Power Company (a Maine corporation) into Mississippi Power and articles of amendment to the articles of incorporation of Mississippi Power through April 2, 2004. (Designated in Registration No. 2-71540 as Exhibit 4(a)-1, in Form U5S for 1987, File No. 30-222-2, as Exhibit B-10, in Registration No. 33-49320 as Exhibit 4(b)-(1), in Form 8-K dated August 5, 1992, File No. 001-11229, as Exhibits 4(b)-2 and 4(b)-3, in Form 8-K dated August 4, 1993, File No. 001-11229, as Exhibit 4(b)-3, in Form 8-K dated August 18, 1993, File No. 001-11229, as Exhibit 4(b)-3, in Mississippi Power's Form 10-K for the year ended December 31, 1997, File No. 001-11229, as Exhibit 3(e)2, in Mississippi Power's Form 10-K for the year ended December 31, 2000, File No. 001-11229, as Exhibit 3(e)2, and in Form 8-K dated March 3, 2004, File No. 001-11229, as Exhibit 4.6.)
|
|||||||
|
(e)
|
2
|
—
|
By-laws of Mississippi Power as amended effective February 28, 2001, and as presently in effect. (Designated in Mississippi Power's Form 10-K for the year ended December 31, 2001, File No. 001-11229, as Exhibit 3(e)2.)
|
|||||||
|
Southern Power
|
||||||||||
|
(f)
|
1
|
—
|
Certificate of Incorporation of Southern Power Company dated January 8, 2001. (Designated in Registration No. 333-98553 as Exhibit 3.1.)
|
|||||||
|
(f)
|
2
|
—
|
By-laws of Southern Power Company effective January 8, 2001. (Designated in Registration No. 333-98553 as Exhibit 3.2.)
|
|||||||
|
(4)
|
Instruments Describing Rights of Security Holders, Including Indentures
|
|||||||||
|
With respect to each of Southern Company, Alabama Power, Georgia Power, Gulf Power, Mississippi Power, and Southern Power Company, such registrant has not included any instrument with respect to long-term debt that does not exceed 10% of the total assets of such registrant and its subsidiaries. Each such registrant agrees, upon request of the SEC, to furnish copies of any or all such instruments to the SEC.
|
||||||||||
|
Southern Company
|
||||||||||
|
(a)
|
1
|
—
|
Senior Note Indenture dated as of January 1, 2007, between Southern Company and Wells Fargo Bank, National Association, as Trustee, and indentures supplemental thereto through August 27, 2013. (Designated in Form 8-K dated January 11, 2006, File No. 1-3526, as Exhibits 4.1 and 4.2, in Form 8-K dated March 20, 2007, File No. 1-3526, as Exhibit 4.2, in Form 8-K dated August 13, 2008, File No. 1-3526, as Exhibit 4.2, in Form 8-K dated May 11, 2009, File No. 1-3526, as Exhibit 4.2, in Form 8-K dated October 19, 2009, File No. 1-3526, as Exhibit 4.2, in Form 8-K dated September 13, 2010, File No. 1-3526, as Exhibit 4.2, in Form 8-K dated August 16, 2011, File No. 1-3526, as Exhibit 4.2, and in Form 8-K dated August 21, 2013, File No. 1-3526, as Exhibit 4.2.)
|
|||||||
|
Alabama Power
|
||||||||||
|
(b)
|
1
|
—
|
Subordinated Note Indenture dated as of January 1, 1997, between Alabama Power and The Bank of New York Mellon (as successor to JPMorgan Chase Bank, N.A. (formerly known as The Chase Manhattan Bank)), as Trustee, and indentures supplemental thereto through October 2, 2002. (Designated in Form 8-K dated January 9, 1997, File No. 1-3164, as Exhibits 4.1 and 4.2, in Form 8-K dated February 18, 1999, File No. 1-3164, as Exhibit 4.2, and in Form 8-K dated September 26, 2002, File No. 3164, as Exhibits 4.9-A and 4.9-B.)
|
|||||||
E-2
|
(b)
|
2
|
—
|
Senior Note Indenture dated as of December 1, 1997, between Alabama Power and The Bank of New York Mellon (as successor to JPMorgan Chase Bank, N.A. (formerly known as The Chase Manhattan Bank)), as Trustee, and indentures supplemental thereto through December 6, 2013. (Designated in Form 8-K dated December 4, 1997, File No. 1-3164, as Exhibits 4.1 and 4.2, in Form 8-K dated February 20, 1998, File No. 1-3164, as Exhibit 4.2, in Form 8-K dated April 17, 1998, File No. 1-3164, as Exhibit 4.2, in Form 8-K dated August 11, 1998, File No. 1-3164, as Exhibit 4.2, in Form 8-K dated September 8, 1998, File No. 1-3164, as Exhibit 4.2, in Form 8-K dated September 16, 1998, File No. 1-3164, as Exhibit 4.2, in Form 8-K dated October 7, 1998, File No. 1-3164, as Exhibit 4.2, in Form 8-K dated October 28, 1998, File No. 1-3164, as Exhibit 4.2, in Form 8-K dated November 12, 1998, File No. 1-3164, as Exhibit 4.2, in Form 8-K dated May 19, 1999, File No. 1-3164, as Exhibit 4.2, in Form 8-K dated August 13, 1999, File No. 1-3164, as Exhibit 4.2, in Form 8-K dated September 21, 1999, File No. 1-3164, as Exhibit 4.2, in Form 8-K dated May 11, 2000, File No. 1-3164, as Exhibit 4.2, in Form 8-K dated August 22, 2001, File No. 1-3164, as Exhibits 4.2(a) and 4.2(b), in Form 8-K dated June 21, 2002, File No. 1-3164, as Exhibit 4.2(a), in Form 8-K dated October 16, 2002, File No. 1-3164, as Exhibit 4.2(a), in Form 8-K dated November 20, 2002, File No. 1-3164, as Exhibit 4.2(a), in Form 8-K dated December 6, 2002, File No. 1-3164, as Exhibit 4.2, in Form 8-K dated February 11, 2003, File No. 1-3164, as Exhibits 4.2(a) and 4.2(b), in Form 8-K dated March 12, 2003, File No. 1-3164, as Exhibit 4.2, in Form 8-K dated April 15, 2003, File No. 1-3164, as Exhibit 4.2, in Form 8-K dated May 1, 2003, File No. 1-3164, as Exhibit 4.2, in Form 8-K dated November 14, 2003, File No. 1-3164, as Exhibit 4.2, in Form 8-K dated February 10, 2004, File No. 1-3164, as Exhibit 4.2 in Form 8-K dated April 7, 2004, File No. 1-3164, as Exhibit 4.2, in Form 8-K dated August 19, 2004, File No. 1-3164, as Exhibit 4.2, in Form 8-K dated November 9, 2004, File No. 1-3164, as Exhibit 4.2, in Form 8-K dated March 8, 2005, File No. 1-3164, as Exhibit 4.2, in Form 8-K dated January 11, 2006, File No. 1-3164, as Exhibit 4.2, in Form 8-K dated January 13, 2006, File No. 1-3164, as Exhibit 4.2, in Form 8-K dated February 1, 2006, File No. 1-3164, as Exhibits 4.2(a) and 4.2(b), in Form 8-K dated March 9, 2006, File No. 1-3164, as Exhibit 4.2, in Form 8-K dated June 7, 2006, File No. 1-3164, as Exhibit 4.2, in Form 8-K dated January 30, 2007, File No. 1-3164, as Exhibit 4.2, in Form 8-K dated April 4, 2007, File No. 1-3164, as Exhibit 4.2, in Form 8-K dated October 11, 2007, File No. 1-3164, as Exhibit 4.2, in Form 8-K dated December 4, 2007, File No. 1-3164, as Exhibit 4.2, in Form 8-K dated May 8, 2008, File No. 1-3164, as Exhibit 4.2, in Form 8-K dated November 14, 2008, File No. 1-3164 as Exhibit 4.2, in Form 8-K dated February 26, 2009, File No. 1-3164 as Exhibit 4.2, in Form 8-K dated September 27, 2010, File No. 1-3164, as Exhibit 4.2, in Form 8-K dated March 3, 2011, File No. 1-3164, as Exhibit 4.2, in Form 8-K dated May 18, 2011, File No. 1-3164, as Exhibits 4.2(a) and 4.2(b), in Form 8-K dated January 10, 2012, File No. 1-3164, as Exhibit 4.2, in Form 8-K dated October 9, 2012, File No. 1-3164, as Exhibit 4.2, in Form 8-K dated November 27, 2012, File No. 1-3164, as Exhibit 4.2, and in Form 8-K dated December 3, 2013, File No. 1-3164, as Exhibit 4.2.)
|
|||||||
|
(b)
|
3
|
—
|
Amended and Restated Trust Agreement of Alabama Power Capital Trust V dated as of September 1, 2002. (Designated in Form 8-K dated September 26, 2002, File No. 1-3164, as Exhibit 4.12-B.)
|
|||||||
|
(b)
|
4
|
—
|
Guarantee Agreement relating to Alabama Power Capital Trust V dated as of September 1, 2002. (Designated in Form 8-K dated September 26, 2002, File No. 1-3164, as Exhibit 4.16-B.)
|
|||||||
E-3
|
Georgia Power
|
||||||||||
|
(c)
|
1
|
—
|
Senior Note Indenture dated as of January 1, 1998, between Georgia Power and The Bank of New York Mellon (as successor to JPMorgan Chase Bank, N.A. (formerly known as The Chase Manhattan Bank)), as Trustee, and indentures supplemental thereto through August 16, 2013. (Designated in Form 8-K dated January 21, 1998, File No. 1-6468, as Exhibits 4.1 and 4.2, in Forms 8-K each dated November 19, 1998, File No. 1-6468, as Exhibit 4.2, in Form 8-K dated March 3, 1999, File No. 1-6469 as Exhibit 4.2, in Form 8-K dated February 15, 2000, File No. 1-6469 as Exhibit 4.2, in Form 8-K dated January 26, 2001, File No. 1-6469 as Exhibits 4.2(a) and 4.2(b), in Form 8-K dated February 16, 2001, File No. 1-6469 as Exhibit 4.2, in Form 8-K dated May 1, 2001, File No. 1-6468, as Exhibit 4.2, in Form 8-K dated June 27, 2002, File No. 1-6468, as Exhibit 4.2, in Form 8-K dated November 15, 2002, File No. 1-6468, as Exhibit 4.2, in Form 8-K dated February 13, 2003, File No. 1-6468, as Exhibit 4.2, in Form 8-K dated February 21, 2003, File No. 1-6468, as Exhibit 4.2, in Form 8-K dated April 10, 2003, File No. 1-6468, as Exhibits 4.1, 4.2 and 4.3, in Form 8-K dated September 8, 2003, File No. 1-6468, as Exhibit 4.1, in Form 8-K dated September 23, 2003, File No. 1-6468, as Exhibit 4.1, in Form 8-K dated January 12, 2004, File No. 1-6468, as Exhibits 4.1 and 4.2, in Form 8-K dated February 12, 2004, File No. 1-6468, as Exhibit 4.1, in Form 8-K dated August 11, 2004, File No. 1-6468, as Exhibits 4.1 and 4.2, in Form 8-K dated January 13, 2005, File No. 1-6468, as Exhibit 4.1, in Form 8-K dated April 12, 2005, File No. 1-6468, as Exhibit 4.1, in Form 8-K dated November 30, 2005, File No. 1-6468, as Exhibit 4.1, in Form 8-K dated December 8, 2006, File No. 1-6468, as Exhibit 4.2, in Form 8-K dated March 6, 2007, File No. 1-6468, as Exhibit 4.2, in Form 8-K dated June 4, 2007, File No. 1-6468, as Exhibit 4.2, in Form 8-K dated June 18, 2007, File No. 1-6468, as Exhibit 4.2, in Form 8-K dated July 10, 2007, File No. 1-6468, as Exhibit 4.2, in Form 8-K dated August 24, 2007, File No. 1-6468, as Exhibit 4.2, in Form 8-K dated November 29, 2007, File No. 1-6468, as Exhibit 4.2, in Form 8-K dated March 12, 2008, File No. 1-6468, as Exhibit 4.2, in Form 8-K dated June 5, 2008, File No. 1-6468, as Exhibit 4.2, in Form 8-K dated November 12, 2008, File No. 1-6468, as Exhibits 4.2(a) and 4.2(b), in Form 8-K dated February 4, 2009, File No. 1-6468, as Exhibit 4.2, in Form 8-K dated December 8, 2009, File No. 1-6468, as Exhibit 4.2, in Form 8-K dated March 9, 2010, File No. 1-6468, as Exhibit 4.2, in Form 8-K dated May 24, 2010, File No. 1-6468, as Exhibit 4.2, in Form 8-K dated August 26, 2010, File No. 1-6468, as Exhibit 4.2, in Form 8-K dated September 20, 2010, File No. 1-6468, as Exhibit 4.2, in Form 8-K dated January 13, 2011, File No. 1-6468, as Exhibit 4.2, in Form 8-K dated April 12, 2011, File No. 1-6468, as Exhibit 4.2, in Form 8-K dated February 29, 2012, File No. 1-6468, as Exhibit 4.2, in Form 8-K dated May 8, 2012, File No. 1-6468, as Exhibit 4.2(b), in Form 8-K dated August 7, 2012, File No. 1-6468, as Exhibit 4.2, in Form 8-K dated November 8, 2012, File No. 1-6468, as Exhibit 4.2, in Form 8-K dated March 12, 2013, File No. 1-6468, as Exhibits 4.2(a) and 4.2(b), and in Form 8-K dated August 12, 2013, File No. 1-6468, as Exhibit 4.2.)
|
|||||||
|
(c)
|
2
|
—
|
Loan Guarantee Agreement between Georgia Power and the DOE dated as of February 20, 2014. (Designated in Form 8-K dated February 20, 2014, File No. 1-6468, as Exhibit 4.1.)
|
|||||||
|
(c)
|
3
|
—
|
Note Purchase Agreement among Georgia Power, the DOE, and the Federal Financing Bank dated as of February 20, 2014. (Designated in Form 8-K dated February 20, 2014, File No. 1-6468, as Exhibit 4.2.)
|
|||||||
|
(c)
|
4
|
—
|
Future Advance Promissory Note dated February 20, 2014 made by Georgia Power to the Federal Financing Bank. (Designated in Form 8-K dated February 20, 2014, File No. 1-6468, as Exhibit 4.3.)
|
|||||||
|
(c)
|
5
|
—
|
Deed to Secure Debt, Security Agreement and Fixture Filing between Georgia Power and PNC Bank, National Association, doing business as Midland Loan Services Inc., a division of PNC Bank, National Association dated as of February 20, 2014. (Designated in Form 8-K dated February 20, 2014, File No. 1-6468, as Exhibit 4.4.)
|
|||||||
|
(c)
|
6
|
—
|
Owners Consent to Assignment and Direct Agreement and Amendment to Plant Alvin W. Vogtle Additional Units Ownership Participation Agreement by and among Georgia Power, OPC, MEAG Power, and Dalton dated as of February 20, 2014. (Designated in Form 8-K dated February 20, 2014, File No. 1-6468, as Exhibit 4.5.)
|
|||||||
E-4
|
Gulf Power
|
||||||||||
|
(d)
|
1
|
—
|
Senior Note Indenture dated as of January 1, 1998, between Gulf Power and The Bank of New York Mellon (as successor to JPMorgan Chase Bank, N.A. (formerly known as The Chase Manhattan Bank)), as Trustee, and indentures supplemental thereto through June 18, 2013. (Designated in Form 8-K dated June 17, 1998, File No. 0-2429, as Exhibits 4.1 and 4.2, in Form 8-K dated August 17, 1999, File No. 0-2429, as Exhibit 4.2, in Form 8-K dated July 31, 2001, File No. 0-2429, as Exhibit 4.2, in Form 8-K dated October 5, 2001, File No. 0-2429, as Exhibit 4.2, in Form 8-K dated January 18, 2002, File No. 0-2429, as Exhibit 4.2, in Form 8-K dated March 21, 2003, File No. 0-2429, as Exhibit 4.2, in Form 8-K dated July 10, 2003, File No. 001-31737, as Exhibits 4.1 and 4.2, in Form 8-K dated September 5, 2003, File No. 001-31737, as Exhibit 4.1, in Form 8-K dated April 6, 2004, File No. 001-31737, as Exhibit 4.1, in Form 8-K dated September 13, 2004, File No. 001-31737, as Exhibit 4.1, in Form 8-K dated August 11, 2005, File No. 001-31737, as Exhibit 4.1, in Form 8-K dated October 27, 2005, File No. 001-31737, as Exhibit 4.1, in Form 8-K dated November 28, 2006, File No. 001-31737, as Exhibit 4.2, in Form 8-K dated June 5, 2007, File No. 001-31737, as Exhibit 4.2, in Form 8-K dated June 22, 2009, File No. 001-31737, as Exhibit 4.2, in Form 8-K dated April 6, 2010, File No. 001-31737, as Exhibit 4.2, in Form 8-K dated September 9, 2010, File No. 001-31737, as Exhibit 4.2, in Form 8-K dated May 12, 2011, File No. 001-31737, as Exhibit 4.2, in Form 8-K dated May 15, 2012, File No. 001-31737, as Exhibit 4.2, and in Form 8-K dated June 10, 2013, File No. 001-31737, as Exhibit 4.2.)
|
|||||||
|
Mississippi Power
|
||||||||||
|
(e)
|
1
|
—
|
Senior Note Indenture dated as of May 1, 1998 between Mississippi Power and Wells Fargo Bank, National Association, as Successor Trustee, and indentures supplemental thereto through March 9, 2012. (Designated in Form 8-K dated May 14, 1998, File No. 001-11229, as Exhibits 4.1, 4.2(a) and 4.2(b), in Form 8-K dated March 22, 2000, File No. 001-11229, as Exhibit 4.2, in Form 8-K dated March 12, 2002, File No. 001-11229, as Exhibit 4.2, in Form 8-K dated April 24, 2003, File No. 001-11229, as Exhibit 4.2, in Form 8-K dated March 3, 2004, File No. 001-11229, as Exhibit 4.2, in Form 8-K dated June 24, 2005, File No. 001-11229, as Exhibit 4.2, in Form 8-K dated November 8, 2007, File No. 001-11229, as Exhibit 4.2, in Form 8-K dated November 14, 2008, File No. 001-11229, as Exhibit 4.2, in Form 8-K dated March 3, 2009, File No. 001-11229, as Exhibit 4.2, in Form 8-K dated October 11, 2011, File No. 001-11229, as Exhibits 4.2(a) and 4.2(b), and in Form 8-K dated March 5, 2012, File No. 001-11229, as Exhibit 4.2(b).)
|
|||||||
|
Southern Power
|
||||||||||
|
(f)
|
1
|
—
|
Senior Note Indenture dated as of June 1, 2002, between Southern Power Company and The Bank of New York Mellon (formerly known as The Bank of New York), as Trustee, and indentures supplemental thereto through July 16, 2013. (Designated in Registration No. 333-98553 as Exhibits 4.1 and 4.2 and in Southern Power Company's Form 10-Q for the quarter ended June 30, 2003, File No. 333-98553, as Exhibit 4(g)1, in Form 8-K dated November 13, 2006, File No. 333-98553, as Exhibit 4.2, in Form 8-K dated September 14, 2011, File No. 333-98553, as Exhibit 4.4, and in Form 8-K dated July 10, 2013, File No. 333-98553, as Exhibit 4.4.)
|
|||||||
|
(10)
|
Material Contracts
|
|||||||||
|
Southern Company
|
||||||||||
|
#
|
(a)
|
1
|
—
|
Southern Company 2011 Omnibus Incentive Compensation Plan, effective May 25, 2011. (Designated in Southern Company's Form 8-K dated May 25, 2011, File No. 1-3526, as Exhibit 10.1.)
|
||||||
|
#
|
(a)
|
2
|
—
|
Form of Stock Option Award Agreement for Executive Officers of Southern Company under the Southern Company Omnibus Incentive Compensation Plan. (Designated in Southern Company's Form 10-Q for the quarter ended March 31, 2011, File No. 1-3526, as Exhibit 10(a)3.)
|
||||||
|
#
|
(a)
|
3
|
—
|
Deferred Compensation Plan for Outside Directors of The Southern Company, Amended and Restated effective January 1, 2008. (Designated in Southern Company's Form 10-K for the year ended December 31, 2007, File No. 1-3526, as Exhibit 10(a)3.)
|
||||||
|
#
|
(a)
|
4
|
—
|
Southern Company Deferred Compensation Plan as amended and restated as of January 1, 2009 and First Amendment thereto effective January 1, 2010. (Designated in Southern Company's Form 10-K for the year ended December 31, 2008, File No. 1-3526, as Exhibit 10(a)4 and in Southern Company's Form 10-K for the year ended December 31, 2009, File No. 1-3526, as Exhibit 10(a)5.)
|
||||||
E-5
|
#
|
(a)
|
5
|
—
|
Outside Directors Stock Plan for The Southern Company and its Subsidiaries, effective May 26, 2004. (Designated in Southern Company's Form 10-Q for the quarter ended June 30, 2004, File No. 1-3526, as Exhibit 10(a)2.)
|
||||||
|
#
|
(a)
|
6
|
—
|
The Southern Company Supplemental Executive Retirement Plan, Amended and Restated effective January 1, 2009 and First Amendment thereto effective January 1, 2010. (Designated in Southern Company's Form 10-K for the year ended December 31, 2008, File No. 1-3526, as Exhibit 10(a)6 and in Southern Company's Form 10-K for the year ended December 31, 2009, File No. 1-3526, as Exhibit 10(a)(8).)
|
||||||
|
#
|
(a)
|
7
|
—
|
The Southern Company Supplemental Benefit Plan, Amended and Restated effective as of January 1, 2009 and First Amendment thereto effective January 1, 2010. (Designated in Southern Company's Form 10-K for the year ended December 31, 2008, File No. 1-3526, as Exhibit 10(a)7 and in Southern Company's Form 10-K for the year ended December 31, 2009, File No. 1-3526, as Exhibit 10(a)10.)
|
||||||
|
#
|
(a)
|
8
|
—
|
Retention and Restricted Stock Unit Award Agreement by and between Southern Company and Charles D. McCrary effective May 22, 2012. (Designated in Southern Company's Form 10-Q for the quarter ended June 30, 2012, File No. 1-3526, as Exhibit 10(a)1.)
|
||||||
|
# *
|
(a)
|
9
|
—
|
Amendment to Retention and Restricted Stock Unit Award Agreement by and between Southern Company and Charles D. McCrary effective February 10, 2014.
|
||||||
|
#
|
(a)
|
10
|
—
|
The Southern Company Change in Control Benefits Protection Plan, effective December 31, 2008. (Designated in Form 8-K dated December 31, 2008, File No. 1-3526, as Exhibit 10.1.)
|
||||||
|
#
|
(a)
|
11
|
—
|
Southern Company Deferred Compensation Trust Agreement as amended and restated effective January 1, 2001 between Wells Fargo Bank, N.A., as successor to Wachovia Bank, N.A., Southern Company, SCS, Alabama Power, Georgia Power, Gulf Power, Mississippi Power, SouthernLINC Wireless, Southern Company Energy Solutions, LLC, and Southern Nuclear and First Amendment thereto effective January 1, 2009. (Designated in Southern Company's Form 10-K for the year ended December 31, 2000, File No. 1-3526, as Exhibit 10(a)103 and in Southern Company's Form 10-K for the year ended December 31, 2008, File No. 1-3526, as Exhibit 10(a)16.)
|
||||||
|
#
|
(a)
|
12
|
—
|
Deferred Stock Trust Agreement for Directors of Southern Company and its subsidiaries, dated as of January 1, 2000, between Reliance Trust Company, Southern Company, Alabama Power, Georgia Power, Gulf Power, and Mississippi Power and First Amendment thereto effective January 1, 2009. (Designated in Southern Company's Form 10-K for the year ended December 31, 2000, File No. 1-3526, as Exhibit 10(a)104 and in Southern Company's Form 10-K for the year ended December 31, 2008, File No. 1-3526, as Exhibit 10(a)18.)
|
||||||
|
#
|
(a)
|
13
|
—
|
Amended and Restated Deferred Cash Compensation Trust Agreement for Directors of Southern Company and its subsidiaries, effective September 1, 2001, between Wells Fargo Bank, N.A., as successor to Wachovia Bank, N.A., Southern Company, Alabama Power, Georgia Power, Gulf Power, and Mississippi Power and First Amendment thereto effective January 1, 2009. (Designated in Southern Company's Form 10-K for the year ended December 31, 2001, File No. 1-3526, as Exhibit 10(a)92 and in Southern Company's Form 10-K for the year ended December 31, 2008, File No. 1-3526, as Exhibit 10(a)20.)
|
||||||
|
#
|
(a)
|
14
|
—
|
Amended and Restated Southern Company Senior Executive Change in Control Severance Plan effective December 31, 2008, First Amendment thereto effective January 1, 2010, and Second Amendment thereto effective February 23, 2011. (Designated in Southern Company's Form 10-K for the year ended December 31, 2008, File No. 1-3526, as Exhibit 10(a)23, in Southern Company's Form 10-K for the year ended December 31, 2009, File No. 1-3526, as Exhibit 10(a)22, and in Southern Company's Form 10-K for the year ended December 31, 2010, File No. 1-3526, as Exhibit 10(a)16.)
|
||||||
|
#
|
(a)
|
15
|
—
|
Southern Company Executive Change in Control Severance Plan, Amended and Restated effective December 31, 2008 and First Amendment thereto effective January 1, 2010. (Designated in Southern Company's Form 10-K for the year ended December 31, 2008, File No. 1-3526, as Exhibit 10(a)24 and in Southern Company's Form 10-K for the year ended December 31, 2009, File No. 1-3526, as Exhibit 10(a)24.)
|
||||||
|
# *
|
(a)
|
16
|
—
|
Base Salaries of Named Executive Officers.
|
||||||
|
#
|
(a)
|
17
|
—
|
Summary of Non-Employee Director Compensation Arrangements. (Designated in Form
8-K dated February 10, 2014, File No. 1-3526, as Exhibit 10.1.)
|
||||||
|
#
|
(a)
|
18
|
—
|
Form of Terms for Performance Share Awards granted under the Southern Company Omnibus Incentive Compensation Plan. (Designated in Form 8-K dated February 9, 2010, File No. 1-3526, as Exhibit 10.1.)
|
||||||
E-6
|
#
|
(a)
|
19
|
—
|
Letter Agreement between Southern Company and Stephen E. Kuczynski dated June 4, 2011 regarding the terms of an offer of employment. (Designated in Form 10-Q for the quarter ended March 31, 2013, File No. 1-3526, as Exhibit 10(a)2).)
|
||||||
|
#
|
(a)
|
20
|
—
|
Retention and Restricted Stock Unit Award Agreement between Southern Nuclear and Stephen E. Kuczynski effective as of July 11, 2011. (Designated in Form 10-Q for the quarter ended March 31, 2013, File No. 1-3526, as Exhibit 10(a)3).)
|
||||||
|
Alabama Power
|
||||||||||
|
(b)
|
1
|
—
|
Intercompany Interchange Contract as revised effective May 1, 2007, among Alabama Power, Georgia Power, Gulf Power, Mississippi Power, Southern Power Company, and SCS. (Designated in Form 10-Q for the quarter ended March 31, 2007, File No. 1-3164, as Exhibit 10(b)5.)
|
|||||||
|
#
|
(b)
|
2
|
—
|
Southern Company 2011 Omnibus Incentive Compensation Plan, effective May 25, 2011. See Exhibit 10(a)1 herein.
|
||||||
|
#
|
(b)
|
3
|
—
|
Form of Stock Option Award Agreement for Executive Officers of Southern Company under the Southern Company Omnibus Incentive Compensation Plan. See Exhibit 10(a)2 herein.
|
||||||
|
#
|
(b)
|
4
|
—
|
Southern Company Deferred Compensation Plan as amended and restated as of January 1, 2009 and First Amendment thereto effective January 1, 2010. See Exhibit 10(a)4 herein.
|
||||||
|
#
|
(b)
|
5
|
—
|
Outside Directors Stock Plan for The Southern Company and its Subsidiaries, effective May 26, 2004. See Exhibit 10(a)5 herein.
|
||||||
|
#
|
(b)
|
6
|
—
|
The Southern Company Supplemental Executive Retirement Plan, Amended and Restated effective January 1, 2009 and First Amendment thereto effective January 1, 2010. See Exhibit 10(a)6 herein.
|
||||||
|
#
|
(b)
|
7
|
—
|
The Southern Company Supplemental Benefit Plan, Amended and Restated effective as of January 1, 2009 and First Amendment thereto effective January 1, 2010. See Exhibit 10(a)7 herein.
|
||||||
|
#
|
(b)
|
8
|
—
|
Southern Company Executive Change in Control Severance Plan, Amended and Restated effective December 31, 2008 and First Amendment thereto effective January 1, 2010. See Exhibit 10(a)15 herein.
|
||||||
|
#
|
(b)
|
9
|
—
|
Deferred Compensation Plan for Directors of Alabama Power Company, Amended and Restated effective January 1, 2008. (Designated in Alabama Power's Form 10-Q for the quarter ended June 30, 2008, File No. 1-3164, as Exhibit 10(b)1.)
|
||||||
|
#
|
(b)
|
10
|
—
|
The Southern Company Change in Control Benefits Protection Plan, effective December 31, 2008. See Exhibit 10(a)10 herein.
|
||||||
|
#
|
(b)
|
11
|
—
|
Southern Company Deferred Compensation Trust Agreement as amended and restated effective January 1, 2001 between Wells Fargo Bank, N.A., as successor to Wachovia Bank, N.A., Southern Company, SCS, Alabama Power, Georgia Power, Gulf Power, Mississippi Power, SouthernLINC Wireless, Southern Company Energy Solutions, LLC, and Southern Nuclear and First Amendment thereto effective January 1, 2009. See Exhibit 10(a)11 herein.
|
||||||
|
#
|
(b)
|
12
|
—
|
Deferred Stock Trust Agreement for Directors of Southern Company and its subsidiaries, dated as of January 1, 2000, between Reliance Trust Company, Southern Company, Alabama Power, Georgia Power, Gulf Power, and Mississippi Power and First Amendment thereto effective January 1, 2009. See Exhibit 10(a)12 herein.
|
||||||
|
#
|
(b)
|
13
|
—
|
Amended and Restated Deferred Cash Compensation Trust Agreement for Directors of Southern Company and its subsidiaries, effective September 1, 2001, between Wells Fargo Bank, N.A., as successor to Wachovia Bank, N.A., Southern Company, Alabama Power, Georgia Power, Gulf Power, and Mississippi Power and First Amendment thereto effective January 1, 2009. See Exhibit 10(a)13 herein.
|
||||||
|
#
|
(b)
|
14
|
—
|
Amended and Restated Southern Company Senior Executive Change in Control Severance Plan effective December 31, 2008, First Amendment thereto effective January 1, 2010, and Second Amendment thereto effective February 23, 2011. See Exhibit 10(a)14 herein.
|
||||||
|
# *
|
(b)
|
15
|
—
|
Base Salaries of Named Executive Officers.
|
||||||
|
#
|
(b)
|
16
|
—
|
Summary of Non-Employee Director Compensation Arrangements. (Designated in Alabama Power's Form 10-Q for the quarter ended June 30, 2010, File No. 1-3164, as Exhibit 10(b)1.)
|
||||||
|
#
|
(b)
|
17
|
—
|
Form of Terms for Performance Share Awards granted under the Southern Company Omnibus Incentive Compensation Plan. See Exhibit 10(a)18 herein.
|
||||||
E-7
|
#
|
(b)
|
18
|
—
|
Deferred Compensation Agreement between Southern Company, Alabama Power, Georgia Power, Gulf Power, Mississippi Power, and SCS and Philip C. Raymond dated September 15, 2010. (Designated in Alabama Power's Form 10-Q for the quarter ended September 30, 2010, File No. 1-3164, as Exhibit 10(b)2.)
|
||||||
|
#
|
(b)
|
19
|
Retention and Restricted Stock Unit Award Agreement by and between Southern Company and Charles D. McCrary effective May 22, 2012. See Exhibit 10(a)8 herein.
|
|||||||
|
#
|
(b)
|
20
|
—
|
Amendment to Retention and Restricted Stock Unit Award Agreement by and between Southern Company and Charles D. McCrary effective February 10, 2014. See Exhibit 10(a)9 herein.
|
||||||
|
#
|
(b)
|
21
|
Retention Award Agreement between Alabama Power and Steven R. Spencer effective July 15, 2013. (Designated in Form 10-Q for the quarter ended September 30, 2013, File No. 1-3164, as Exhibit 10(b)1.)
|
|||||||
|
Georgia Power
|
||||||||||
|
(c)
|
1
|
—
|
Intercompany Interchange Contract as revised effective May 1, 2007, among Alabama Power, Georgia Power, Gulf Power, Mississippi Power, Southern Power Company, and SCS. See Exhibit 10(b)1 herein.
|
|||||||
|
(c)
|
2
|
—
|
Revised and Restated Integrated Transmission System Agreement dated as of November 12, 1990, between Georgia Power and OPC. (Designated in Georgia Power's Form 10-K for the year ended December 31, 1990, File No. 1-6468, as Exhibit 10(g).)
|
|||||||
|
(c)
|
3
|
—
|
Revised and Restated Integrated Transmission System Agreement between Georgia Power and Dalton dated as of December 7, 1990. (Designated in Georgia Power's Form 10-K for the year ended December 31, 1990, File No. 1-6468, as Exhibit 10(gg).)
|
|||||||
|
(c)
|
4
|
—
|
Revised and Restated Integrated Transmission System Agreement between Georgia Power and MEAG Power dated as of December 7, 1990. (Designated in Georgia Power's Form 10-K for the year ended December 31, 1990, File No. 1-6468, as Exhibit 10(hh).)
|
|||||||
|
#
|
(c)
|
5
|
—
|
Southern Company 2011 Omnibus Incentive Compensation Plan, effective May 25, 2011. See Exhibit 10(a)1 herein.
|
||||||
|
#
|
(c)
|
6
|
—
|
Form of Stock Option Award Agreement for Executive Officers of Southern Company under the Southern Company Omnibus Incentive Compensation Plan. See Exhibit 10(a)2 herein.
|
||||||
|
#
|
(c)
|
7
|
—
|
Southern Company Deferred Compensation Plan as amended and restated as of January 1, 2009 and First Amendment thereto effective January 1, 2010. See Exhibit 10(a)4 herein.
|
||||||
|
#
|
(c)
|
8
|
—
|
Outside Directors Stock Plan for The Southern Company and its Subsidiaries, effective May 26, 2004. See Exhibit 10(a)5 herein.
|
||||||
|
#
|
(c)
|
9
|
—
|
The Southern Company Supplemental Executive Retirement Plan, Amended and Restated effective January 1, 2009 and First Amendment thereto effective January 1, 2010. See Exhibit 10(a)6 herein.
|
||||||
|
#
|
(c)
|
10
|
—
|
The Southern Company Supplemental Benefit Plan, Amended and Restated effective as of January 1, 2009 and First Amendment thereto effective January 1, 2010. See Exhibit 10(a)7 herein.
|
||||||
|
#
|
(c)
|
11
|
—
|
Southern Company Executive Change in Control Severance Plan, Amended and Restated effective December 31, 2008 and First Amendment thereto effective January 1, 2010. See Exhibit 10(a)15 herein.
|
||||||
|
#
|
(c)
|
12
|
—
|
Deferred Compensation Plan For Directors of Georgia Power Company, Amended and Restated Effective January 1, 2008. (Designated in Form 10-K for the year ended December 31, 2007, File No. 1-6468, as Exhibit 10(c)12.)
|
||||||
|
#
|
(c)
|
13
|
—
|
The Southern Company Change in Control Benefits Protection Plan, effective December 31, 2008. See Exhibit 10(a)10 herein.
|
||||||
|
#
|
(c)
|
14
|
—
|
Southern Company Deferred Compensation Trust Agreement as amended and restated effective January 1, 2001 between Wells Fargo Bank, N.A., as successor to Wachovia Bank, N.A., Southern Company, SCS, Alabama Power, Georgia Power, Gulf Power, Mississippi Power, SouthernLINC Wireless, Southern Company Energy Solutions, LLC, and Southern Nuclear and First Amendment thereto effective January 1, 2009. See Exhibit 10(a)11 herein.
|
||||||
|
#
|
(c)
|
15
|
—
|
Deferred Stock Trust Agreement for Directors of Southern Company and its subsidiaries, dated as of January 1, 2000, between Reliance Trust Company, Southern Company, Alabama Power, Georgia Power, Gulf Power, and Mississippi Power and First Amendment thereto effective January 1, 2009. See Exhibit 10(a)12 herein.
|
||||||
E-8
|
#
|
(c)
|
16
|
—
|
Amended and Restated Deferred Cash Compensation Trust Agreement for Directors of Southern Company and its subsidiaries, effective September 1, 2001, between Wells Fargo Bank, N.A., as successor to Wachovia Bank, N.A., Southern Company, Alabama Power, Georgia Power, Gulf Power, and Mississippi Power and First Amendment thereto effective January 1, 2009. See Exhibit 10(a)13 herein.
|
||||||
|
#
|
(c)
|
17
|
—
|
Amended and Restated Southern Company Senior Executive Change in Control Severance Plan effective December 31, 2008, First Amendment thereto effective January 1, 2010, and Second Amendment thereto effective February 23, 2011. See Exhibit 10(a)14 herein.
|
||||||
|
# *
|
(c)
|
18
|
—
|
Base Salaries of Named Executive Officers.
|
||||||
|
#
|
(c)
|
19
|
—
|
Summary of Non-Employee Director Compensation Arrangements. (Designated in Georgia Power's Form 10-K for the year ended December 31, 2009, File No. 1-6468, as Exhibit 10(c)26.)
|
||||||
|
(c)
|
20
|
—
|
Engineering, Procurement and Construction Agreement, dated as of April 8, 2008, between Georgia Power, for itself and as agent for OPC, MEAG Power, and Dalton, as owners, and a consortium consisting of Westinghouse Electric Company LLC and Stone & Webster, Inc., as contractor, for Units 3 & 4 at the Vogtle Electric Generating Plant Site, Amendment No. 1 thereto dated as of December 11, 2009, Amendment No. 2 thereto dated as of January 15, 2010, Amendment No. 3 thereto dated as of February 23, 2010, Amendment No. 4 thereto dated as of May 2, 2011, and Amendment No. 5 thereto dated as of February 7, 2012. (Georgia Power requested confidential treatment for certain portions of these documents pursuant to applications for confidential treatment sent to the SEC. Georgia Power omitted such portions from the filings and filed them separately with the SEC.) (Designated in Form 10-Q/A for the quarter ended June 30, 2008, File No. 1-6468, as Exhibit 10(c)1, in Form 10-K for the year ended December 31, 2009, File No. 1-6468, as Exhibit 10(c)29, in Georgia Power's Form 10-Q for the quarter ended March 31, 2010, File No. 1-6468, as Exhibits 10(c)1 and 10(c)2, in Georgia Power's Form 10-Q for the quarter ended June 30, 2011, File No. 1-6468, as Exhibit 10(c)2, and in Georgia Power's Form 10-Q for the quarter ended March 31, 2012, File No. 1-6468, as Exhibit 10(c)2.)
|
|||||||
|
#
|
(c)
|
21
|
—
|
Form of Terms for Performance Share Awards granted under the Southern Company Omnibus Incentive Compensation Plan. See Exhibit 10(a)18 herein.
|
||||||
|
#
|
(c)
|
22
|
—
|
Retention Award Agreement and Amendment thereto between Southern Nuclear and Joseph A. Miller, effective January 1, 2013. (Designated in Form 10-K for the year ended December 31, 2012, File No. 1-6468, as Exhibits 10(c)24 and 10(c)25.)
|
||||||
|
#
|
(c)
|
23
|
—
|
Separation Agreement between Georgia Power and Ronnie R. Labrato effective April 1, 2013. (Designated in Form 10-Q for the quarter ended June 30, 2013, File No. 1-6468, as Exhibit 10(c)1.)
|
||||||
|
#
|
(c)
|
24
|
—
|
Release Agreement between Georgia Power and Ronnie R. Labrato effective April 1, 2013. (Designated in Form 10-Q for the quarter ended June 30, 2013, File No. 1-6468, as Exhibit 10(c)2.)
|
||||||
|
Gulf Power
|
||||||||||
|
(d)
|
1
|
—
|
Intercompany Interchange Contract as revised effective May 1, 2007, among Alabama Power, Georgia Power, Gulf Power, Mississippi Power, Southern Power Company, and SCS. See Exhibit 10(b)1 herein.
|
|||||||
|
#
|
(d)
|
2
|
—
|
Southern Company 2011 Omnibus Incentive Compensation Plan, effective May 25, 2011. See Exhibit 10(a)1 herein.
|
||||||
|
#
|
(d)
|
3
|
—
|
Form of Stock Option Award Agreement for Executive Officers of Southern Company under the Southern Company Omnibus Incentive Compensation Plan. See Exhibit 10(a)2 herein.
|
||||||
|
#
|
(d)
|
4
|
—
|
Southern Company Deferred Compensation Plan as amended and restated as of January 1, 2009 and First Amendment thereto effective January 1, 2010. See Exhibit 10(a)4 herein.
|
||||||
|
#
|
(d)
|
5
|
—
|
Outside Directors Stock Plan for The Southern Company and its Subsidiaries, effective May 26, 2004. See Exhibit 10(a)5 herein.
|
||||||
|
#
|
(d)
|
6
|
—
|
The Southern Company Supplemental Benefit Plan, Amended and Restated effective as of January 1, 2009 and First Amendment thereto effective January 1, 2010. See Exhibit 10(a)7 herein.
|
||||||
|
#
|
(d)
|
7
|
—
|
Southern Company Executive Change in Control Severance Plan, Amended and Restated effective December 31, 2008 and First Amendment thereto effective January 1, 2010. See Exhibit 10(a)15 herein.
|
||||||
E-9
|
#
|
(d)
|
8
|
—
|
The Southern Company Supplemental Executive Retirement Plan, Amended and Restated effective January 1, 2009 and First Amendment thereto effective January 1, 2010. See Exhibit 10(a)6 herein.
|
||||||
|
#
|
(d)
|
9
|
—
|
Deferred Compensation Plan For Outside Directors of Gulf Power Company, Amended and Restated effective January 1, 2008. (Designated in Gulf Power's Form 10-Q for the quarter ended March 31, 2008, File No. 0-2429, as Exhibit 10(d)1.)
|
||||||
|
#
|
(d)
|
10
|
—
|
The Southern Company Change in Control Benefits Protection Plan, effective December 31, 2008. See Exhibit 10(a)10 herein.
|
||||||
|
#
|
(d)
|
11
|
—
|
Southern Company Deferred Compensation Trust Agreement as amended and restated effective January 1, 2001 between Wells Fargo Bank, N.A., as successor to Wachovia Bank, N.A., Southern Company, SCS, Alabama Power, Georgia Power, Gulf Power, Mississippi Power, SouthernLINC Wireless, Southern Company Energy Solutions, LLC, and Southern Nuclear and First Amendment thereto effective January 1, 2009. See Exhibit 10(a)11 herein.
|
||||||
|
#
|
(d)
|
12
|
—
|
Deferred Stock Trust Agreement for Directors of Southern Company and its subsidiaries, dated as of January 1, 2000, between Reliance Trust Company, Southern Company, Alabama Power, Georgia Power, Gulf Power, and Mississippi Power and First Amendment thereto effective January 1, 2009. See Exhibit 10(a)12 herein.
|
||||||
|
#
|
(d)
|
13
|
—
|
Amended and Restated Deferred Cash Compensation Trust Agreement for Directors of Southern Company and its subsidiaries, effective September 1, 2001, between Wells Fargo Bank, N.A., as successor to Wachovia Bank, N.A., Southern Company, Alabama Power, Georgia Power, Gulf Power, and Mississippi Power and First Amendment thereto effective January 1, 2009. See Exhibit 10(a)13 herein.
|
||||||
|
#
|
(d)
|
14
|
—
|
Amended and Restated Southern Company Senior Executive Change in Control Severance Plan effective December 31, 2008, First Amendment thereto effective January 1, 2010, and Second Amendment thereto effective February 23, 2011. See Exhibit 10(a)14 herein.
|
||||||
|
# *
|
(d)
|
15
|
—
|
Base Salaries of Named Executive Officers.
|
||||||
|
#
|
(d)
|
16
|
—
|
Summary of Non-Employee Director Compensation Arrangements. (Designated in Gulf Power's Form 10-Q for the quarter ended June 30, 2010, File No. 001-31737, as Exhibit 10(d)1.)
|
||||||
|
#
|
(d)
|
17
|
—
|
Form of Terms for Performance Share Awards granted under the Southern Company Omnibus Incentive Compensation Plan. See Exhibit 10(a)18 herein.
|
||||||
|
#
|
(d)
|
18
|
—
|
Deferred Compensation Agreement between Southern Company, Georgia Power, Gulf Power, and Southern Nuclear and Bentina C. Terry dated August 1, 2010. (Designated in Gulf Power's Form 10-Q for the quarter ended September 30, 2010, File No. 001-31737, as Exhibit 10(d)2.)
|
||||||
|
Mississippi Power
|
||||||||||
|
(e)
|
1
|
—
|
Intercompany Interchange Contract as revised effective May 1, 2007, among Alabama Power, Georgia Power, Gulf Power, Mississippi Power, Southern Power Company, and SCS. See Exhibit 10(b)1 herein.
|
|||||||
|
(e)
|
2
|
—
|
Transmission Facilities Agreement dated February 25, 1982, Amendment No. 1 dated May 12, 1982 and Amendment No. 2 dated December 6, 1983, between Entergy Corporation (formerly Gulf States) and Mississippi Power. (Designated in Mississippi Power's Form 10-K for the year ended December 31, 1981, File No. 001-11229, as Exhibit 10(f), in Mississippi Power's Form 10-K for the year ended December 31, 1982, File No. 001-11229, as Exhibit 10(f)(2), and in Mississippi Power's Form 10-K for the year ended December 31, 1983, File No. 001-11229, as Exhibit 10(f)(3).)
|
|||||||
|
#
|
(e)
|
3
|
—
|
Southern Company 2011 Omnibus Incentive Compensation Plan, effective May 25, 2011. See Exhibit 10(a)1 herein.
|
||||||
|
#
|
(e)
|
4
|
—
|
Form of Stock Option Award Agreement for Executive Officers of Southern Company under the Southern Company Omnibus Incentive Compensation Plan. See Exhibit 10(a)2 herein.
|
||||||
|
#
|
(e)
|
5
|
—
|
Southern Company Deferred Compensation Plan as amended and restated as of January 1, 2009 and First Amendment thereto effective January 1, 2010. See Exhibit 10(a)4 herein.
|
||||||
|
#
|
(e)
|
6
|
—
|
Outside Directors Stock Plan for The Southern Company and its Subsidiaries, effective May 26, 2004. See Exhibit 10(a)5 herein.
|
||||||
|
#
|
(e)
|
7
|
—
|
The Southern Company Supplemental Benefit Plan, Amended and Restated effective as of January 1, 2009 and First Amendment thereto effective January 1, 2010. See Exhibit 10(a)7 herein.
|
||||||
E-10
|
#
|
(e)
|
8
|
—
|
Southern Company Executive Change in Control Severance Plan, Amended and Restated effective December 31, 2008 and First Amendment thereto effective January 1, 2010. See Exhibit 10(a)15 herein.
|
||||||
|
#
|
(e)
|
9
|
—
|
The Southern Company Supplemental Executive Retirement Plan, Amended and Restated effective January 1, 2009 and First Amendment thereto effective January 1, 2010. See Exhibit 10(a)6 herein.
|
||||||
|
#
|
(e)
|
10
|
—
|
Deferred Compensation Plan for Outside Directors of Mississippi Power Company, Amended and Restated effective January 1, 2008. (Designated in Mississippi Power's Form 10-Q for the quarter ended March 31, 2008, File No. 001-11229 as Exhibit 10(e)1.)
|
||||||
|
#
|
(e)
|
11
|
—
|
The Southern Company Change in Control Benefits Protection Plan, effective December 31, 2008. See Exhibit 10(a)10 herein.
|
||||||
|
#
|
(e)
|
12
|
—
|
Southern Company Deferred Compensation Trust Agreement as amended and restated effective January 1, 2001 between Wells Fargo Bank, N.A., as successor to Wachovia Bank, N.A., Southern Company, SCS, Alabama Power, Georgia Power, Gulf Power, Mississippi Power, SouthernLINC Wireless, Southern Company Energy Solutions, LLC, and Southern Nuclear and First Amendment thereto effective January 1, 2009. See Exhibit 10(a)11 herein.
|
||||||
|
#
|
(e)
|
13
|
—
|
Deferred Stock Trust Agreement for Directors of Southern Company and its subsidiaries, dated as of January 1, 2000, between Reliance Trust Company, Southern Company, Alabama Power, Georgia Power, Gulf Power, and Mississippi Power and First Amendment thereto effective January 1, 2009. See Exhibit 10(a)12 herein.
|
||||||
|
#
|
(e)
|
14
|
—
|
Amended and Restated Deferred Cash Compensation Trust Agreement for Directors of Southern Company and its subsidiaries, effective September 1, 2001, between Wells Fargo Bank, N.A., as successor to Wachovia Bank, N.A., Southern Company, Alabama Power, Georgia Power, Gulf Power, and Mississippi Power and First Amendment thereto effective January 1, 2009. See Exhibit 10(a)13 herein.
|
||||||
|
#
|
(e)
|
15
|
—
|
Amended and Restated Southern Company Senior Executive Change in Control Severance Plan effective December 31, 2008 and First Amendment thereto effective January 1, 2010. See Exhibit 10(a)14 herein.
|
||||||
|
# *
|
(e)
|
16
|
—
|
Base Salaries of Named Executive Officers.
|
||||||
|
#
|
(e)
|
17
|
—
|
Summary of Non-Employee Director Compensation Arrangements. (Designated in Mississippi Power's Form 10-K for the year ended December 31, 2009, File No. 001-11229, as Exhibit 10(e)22.)
|
||||||
|
(e)
|
18
|
—
|
Cooperative Agreement between the DOE and SCS dated as of December 12, 2008. (Designated in Mississippi Power's Form 10-K for the year ended December 31, 2008, File No. 001-11229, as Exhibit 10(e)22.) (Mississippi Power requested confidential treatment for certain portions of this document pursuant to an application for confidential treatment sent to the SEC. Mississippi Power omitted such portions from this filing and filed them separately with the SEC.)
|
|||||||
|
#
|
(e)
|
19
|
—
|
Form of Terms for Performance Share Awards granted under the Southern Company Omnibus Incentive Compensation Plan. See Exhibit 10(a)18 herein.
|
||||||
|
#
|
(e)
|
20
|
—
|
Consulting Agreement between Mississippi Power and Edward Day, VI effective May 20, 2013. (Designated in Form 10-Q for the quarter ended June 30, 2013, File No. 001-11229, as Exhibit 10(e)1.)
|
||||||
|
#
|
(e)
|
21
|
—
|
Separation and Release Agreement between Mississippi Power and Thomas O. Anderson, IV effective May 31, 2013. (Designated in Form 10-Q for the quarter ended June 30, 2013, File No. 001-11229, as Exhibit 10(e)2.)
|
||||||
|
#
|
(e)
|
22
|
—
|
Amended Deferred Compensation Agreement, effective December 31, 2008 between Southern Company, SCS, Georgia Power, Gulf Power and G. Edison Holland, Jr. (Designated in Form 10-Q for the quarter ended March 31, 2011, File No. 001-11229, as Exhibit 10(a)2.)
|
||||||
|
# *
|
(e)
|
23
|
—
|
Agreement dated October 2, 2013 with Tommy O. Anderson, IV for services provided subsequent to his retirement.
|
||||||
E-11
|
Southern Power
|
||||||||||
|
(f)
|
1
|
—
|
Service contract dated as of January 1, 2001, between SCS and Southern Power Company. (Designated in Southern Company's Form 10-K for the year ended December 31, 2001, File No. 1-3526, as Exhibit 10(a)(2).)
|
|||||||
|
(f)
|
2
|
|
—
|
Intercompany Interchange Contract as revised effective May 1, 2007, among Alabama Power, Georgia Power, Gulf Power, Mississippi Power, Southern Power Company, and SCS. See Exhibit 10(b)1 herein.
|
||||||
|
(14)
|
Code of Ethics
|
|||||||||
|
Southern Company
|
||||||||||
|
*
|
(a)
|
—
|
The Southern Company Code of Ethics.
|
|||||||
|
Alabama Power
|
||||||||||
|
(b)
|
—
|
The Southern Company Code of Ethics. See Exhibit 14(a) herein.
|
||||||||
|
Georgia Power
|
||||||||||
|
(c)
|
—
|
The Southern Company Code of Ethics. See Exhibit 14(a) herein.
|
||||||||
|
Gulf Power
|
||||||||||
|
(d)
|
—
|
The Southern Company Code of Ethics. See Exhibit 14(a) herein.
|
||||||||
|
Mississippi Power
|
||||||||||
|
(e)
|
—
|
The Southern Company Code of Ethics. See Exhibit 14(a) herein.
|
||||||||
|
Southern Power
|
||||||||||
|
(f)
|
—
|
The Southern Company Code of Ethics. See Exhibit 14(a) herein.
|
||||||||
|
(21)
|
Subsidiaries of Registrants
|
|||||||||
|
Southern Company
|
||||||||||
|
*
|
(a)
|
—
|
Subsidiaries of Registrant.
|
|||||||
|
Alabama Power
|
||||||||||
|
(b)
|
—
|
Subsidiaries of Registrant. See Exhibit 21(a) herein.
|
||||||||
|
Georgia Power
|
||||||||||
|
(c)
|
—
|
Subsidiaries of Registrant. See Exhibit 21(a) herein.
|
||||||||
|
Gulf Power
|
||||||||||
|
(d)
|
—
|
Subsidiaries of Registrant. See Exhibit 21(a) herein.
|
||||||||
|
Mississippi Power
|
||||||||||
|
(e)
|
—
|
Subsidiaries of Registrant. See Exhibit 21(a) herein.
|
||||||||
|
Southern Power
|
||||||||||
|
Omitted pursuant to General Instruction I(2)(b) of Form 10-K.
|
||||||||||
|
(23)
|
Consents of Experts and Counsel
|
|||||||||
|
Southern Company
|
||||||||||
|
*
|
(a)
|
1
|
|
—
|
Consent of Deloitte & Touche LLP.
|
|||||
|
Alabama Power
|
||||||||||
|
*
|
(b)
|
1
|
|
—
|
Consent of Deloitte & Touche LLP.
|
|||||
|
Georgia Power
|
||||||||||
|
*
|
(c)
|
1
|
|
—
|
Consent of Deloitte & Touche LLP.
|
|||||
|
Gulf Power
|
||||||||||
|
*
|
(d)
|
1
|
|
—
|
Consent of Deloitte & Touche LLP.
|
|||||
|
Mississippi Power
|
||||||||||
|
*
|
(e)
|
1
|
|
—
|
Consent of Deloitte & Touche LLP.
|
|||||
|
Southern Power
|
||||||||||
|
*
|
(f)
|
1
|
|
—
|
Consent of Deloitte & Touche LLP.
|
|||||
E-12
|
(24)
|
Powers of Attorney and Resolutions
|
|||||||||
|
Southern Company
|
||||||||||
|
*
|
(a)
|
—
|
Power of Attorney and resolution.
|
|||||||
|
Alabama Power
|
||||||||||
|
*
|
(b)
|
—
|
Power of Attorney and resolution.
|
|||||||
|
Georgia Power
|
||||||||||
|
*
|
(c)
|
—
|
Power of Attorney and resolution.
|
|||||||
|
Gulf Power
|
||||||||||
|
*
|
(d)
|
1
|
—
|
Power of Attorney and resolution.
|
||||||
|
*
|
(d)
|
2
|
—
|
Power of Attorney for Michael T. Rehwinkel.
|
||||||
|
Mississippi Power
|
||||||||||
|
*
|
(e)
|
—
|
Power of Attorney and resolution.
|
|||||||
|
Southern Power
|
||||||||||
|
*
|
(f)
|
—
|
Power of Attorney and resolution.
|
|||||||
|
(31)
|
Section 302 Certifications
|
|||||||||
|
Southern Company
|
||||||||||
|
*
|
(a)
|
1
|
—
|
Certificate of Southern Company's Chief Executive Officer required by Section 302 of the Sarbanes-Oxley Act of 2002.
|
||||||
|
*
|
(a)
|
2
|
—
|
Certificate of Southern Company's Chief Financial Officer required by Section 302 of the Sarbanes-Oxley Act of 2002.
|
||||||
|
Alabama Power
|
||||||||||
|
*
|
(b)
|
1
|
—
|
Certificate of Alabama Power's Chief Executive Officer required by Section 302 of the Sarbanes-Oxley Act of 2002.
|
||||||
|
*
|
(b)
|
2
|
—
|
Certificate of Alabama Power's Chief Financial Officer required by Section 302 of the Sarbanes-Oxley Act of 2002.
|
||||||
|
Georgia Power
|
||||||||||
|
*
|
(c)
|
1
|
—
|
Certificate of Georgia Power's Chief Executive Officer required by Section 302 of the Sarbanes-Oxley Act of 2002.
|
||||||
|
*
|
(c)
|
2
|
—
|
Certificate of Georgia Power's Chief Financial Officer required by Section 302 of the Sarbanes-Oxley Act of 2002.
|
||||||
|
Gulf Power
|
||||||||||
|
*
|
(d)
|
1
|
—
|
Certificate of Gulf Power's Chief Executive Officer required by Section 302 of the Sarbanes-Oxley Act of 2002.
|
||||||
|
*
|
(d)
|
2
|
—
|
Certificate of Gulf Power's Chief Financial Officer required by Section 302 of the Sarbanes-Oxley Act of 2002.
|
||||||
|
Mississippi Power
|
||||||||||
|
*
|
(e)
|
1
|
—
|
Certificate of Mississippi Power's Chief Executive Officer required by Section 302 of the Sarbanes-Oxley Act of 2002.
|
||||||
|
*
|
(e)
|
2
|
—
|
Certificate of Mississippi Power's Chief Financial Officer required by Section 302 of the Sarbanes-Oxley Act of 2002.
|
||||||
|
Southern Power
|
||||||||||
|
*
|
(f)
|
1
|
—
|
Certificate of Southern Power Company's Chief Executive Officer required by Section 302 of the Sarbanes-Oxley Act of 2002.
|
||||||
|
*
|
(f)
|
2
|
—
|
Certificate of Southern Power Company's Chief Financial Officer required by Section 302 of the Sarbanes-Oxley Act of 2002.
|
||||||
|
(32)
|
Section 906 Certifications
|
|||||||||
|
Southern Company
|
||||||||||
|
*
|
(a)
|
—
|
Certificate of Southern Company's Chief Executive Officer and Chief Financial Officer required by Section 906 of the Sarbanes-Oxley Act of 2002.
|
|||||||
E-13
|
Alabama Power
|
||||||||||
|
*
|
(b)
|
—
|
Certificate of Alabama Power's Chief Executive Officer and Chief Financial Officer required by Section 906 of the Sarbanes-Oxley Act of 2002.
|
|||||||
|
Georgia Power
|
||||||||||
|
*
|
(c)
|
—
|
Certificate of Georgia Power's Chief Executive Officer and Chief Financial Officer required by Section 906 of the Sarbanes-Oxley Act of 2002.
|
|||||||
|
Gulf Power
|
||||||||||
|
*
|
(d)
|
—
|
Certificate of Gulf Power's Chief Executive Officer and Chief Financial Officer required by Section 906 of the Sarbanes-Oxley Act of 2002.
|
|||||||
|
Mississippi Power
|
||||||||||
|
*
|
(e)
|
—
|
Certificate of Mississippi Power's Chief Executive Officer and Chief Financial Officer required by Section 906 of the Sarbanes-Oxley Act of 2002.
|
|||||||
|
Southern Power
|
||||||||||
|
*
|
(f)
|
—
|
Certificate of Southern Power Company's Chief Executive Officer and Chief Financial Officer required by Section 906 of the Sarbanes-Oxley Act of 2002.
|
|||||||
|
(101)
|
XBRL-Related Documents
|
|||||||||
|
*
|
INS
|
—
|
XBRL Instance Document
|
|||||||
|
*
|
SCH
|
—
|
XBRL Taxonomy Extension Schema Document
|
|||||||
|
*
|
CAL
|
—
|
XBRL Taxonomy Calculation Linkbase Document
|
|||||||
|
*
|
DEF
|
—
|
XBRL Definition Linkbase Document
|
|||||||
|
*
|
LAB
|
—
|
XBRL Taxonomy Label Linkbase Document
|
|||||||
|
*
|
PRE
|
—
|
XBRL Taxonomy Presentation Linkbase Document
|
|||||||
E-14
TABLE OF CONTENTS
Part IItem 1. BusinessItem 1A. Risk FactorsPart on Sales Under Ppas. The Failure Of A Counterparty To One Of These Ppas ToItem 1B. Unresolved Staff CommentsItem 2. PropertiesItem 3. Legal ProceedingsItem 4. Mine Safety DisclosuresPart IIItem 5. Market For Registrants' Common Equity, Related Stockholder Matters and Issuer Purchases Of Equity SecuritiesItem 6. Selected Financial DataItem 7. Management's Discussion and Analysis Of Financial Condition and Results Of OperationsItem 7A. Quantitative and Qualitative Disclosures About Market RiskItem 8. Financial Statements and Supplementary DataItem 9. Changes in and Disagreements with Accountants on Accounting and Financial DisclosureItem 9A. Controls and ProceduresItem 9B. Other InformationPart IIIItem 10. Directors, Executive Officers and Corporate GovernanceItem 11. Executive CompensationItem 12. Security Ownership Of Certain Beneficial Owners and Management and Related Stockholder MattersItem 13. Certain Relationships and Related Transactions, and Director IndependenceItem 14. Principal Accountant Fees and ServicesPart IVItem 15. Exhibits and Financial Statement Schedules