S&P GLOBAL INC.
10-Ks and 10-Qs
|
|
|
|
|
|
|
|
|
|
|
|
|
|
|
|
|
|
|
|
|
|
|
|
|
|
|
|
|
|
|
|
|
|
|
|
|
|
|
|
|
|
|
|
|
|
|
|
|
|
|
|
|
|
|
|
UNITED STATES SECURITIES AND EXCHANGE COMMISSION
WASHINGTON, D.C. 20549
FORM 10-K
|
þ
|
ANNUAL REPORT PURSUANT TO SECTION 13 OR 15(d) OF THE SECURITIES EXCHANGE ACT OF 1934
|
For the fiscal year ended December 31, 2012
OR
|
¨
|
TRANSITION REPORT PURSUANT TO SECTION 13 OR 15(d) OF THE SECURITIES EXCHANGE ACT OF 1934
|
For the transition period from
to
Commission File Number 1-1023

(Exact name of registrant as specified in its charter)
|
New York
|
|
13-1026995
|
|
(State or other jurisdiction of incorporation or organization)
|
|
(I.R.S. Employer Identification No.)
|
|
1221 Avenue of the Americas, New York, New York
|
|
10020
|
|
(Address of principal executive offices)
|
|
(Zip Code)
|
Registrant’s telephone number, including area code:
212-512-2000
|
Title of each class
|
|
Name of exchange on which registered
|
|
Common Stock — $1 par value
|
|
New York Stock Exchange
|
Securities registered pursuant to Section 12(g) of the Act: None
Indicate by check mark if the Registrant is a well-known seasoned issuer, as defined in Rule 405 of the Securities Act.
YES
þ
NO
¨
Indicate by check mark if the Registrant is not required to file reports pursuant to Section 13 or Section 15(d) of the Act.
YES
¨
NO
þ
Indicate by check mark whether the Registrant (1) has filed all reports required to be filed by Section 13 or 15 (d) of the Securities Exchange Act of 1934 during the preceding 12 months (or for such shorter period that the Registrant was required to file such reports), and (2) has been subject to such filing requirements for the past 90 days.
YES
þ
NO
¨
Indicate by check mark whether the Registrant has submitted electronically and posted on its corporate Web site, if any, every Interactive Date File required to be submitted and posted pursuant to Rule 405 of Regulation S-T (§232.405 of this chapter) during the preceding 12 months (or for such shorter period that the Registrant was required to submit and post such files).
YES
þ
NO
¨
Indicate by check mark if disclosure of delinquent filers pursuant to Item 405 of Regulation S-K (§229.405 of this chapter) is not contained herein, and will not be contained, to the best of Registrant’s knowledge, in definitive proxy or information statements incorporated by reference in Part III of this Form 10-K or any amendment to this Form 10-K.
þ
Indicate by check mark whether the Registrant is a large accelerated filer, an accelerated filer, a non-accelerated filer, or a smaller reporting company. See the definitions of “large accelerated filer,” “accelerated filer” and “small reporting company” in Rule 12b-2 of the Exchange Act. (Check one):
|
þ
Large accelerated filer
|
|
o
Accelerated filer
|
|
o
Non-accelerated filer
|
|
o
Smaller reporting company
|
|
|
|
(Do not check if a smaller reporting company)
|
||||
Indicate by check mark whether the registrant is a shell company (as defined in Rule 12b-2 of the Exchange Act).
YES
¨
NO
þ
The aggregate market value of voting stock held by non-affiliates of the Registrant as of the last business day of the second fiscal quarter ended June 30, 2012, was $12.6 billion, based on the closing price of the common stock as reported on the New York Stock Exchange of $45.00 per common share. For purposes of this calculation, it is assumed that directors, executive officers and beneficial owners of more than 10% of the registrant outstanding stock are affiliates. The number of shares of common stock of the Registrant outstanding as of February 1, 2013 was 280.8 million shares.
Part III incorporates information by reference from the definitive proxy statement for the 2013 annual meeting of shareholders.
2
TABLE OF CONTENTS
|
|
PART I
|
|
|
Item
|
Page
|
|
|
1
|
||
|
1a.
|
||
|
1b.
|
||
|
2
|
||
|
3
|
||
|
4
|
||
|
PART II
|
||
|
5
|
||
|
6
|
||
|
7
|
||
|
7a.
|
||
|
8.
|
||
|
9.
|
||
|
9a.
|
||
|
9b.
|
||
|
PART III
|
||
|
10
|
||
|
11
|
||
|
12
|
||
|
13
|
||
|
14
|
||
|
PART IV
|
||
|
15
|
||
3
FORWARD-LOOKING STATEMENTS
This report contains forward-looking statements, including without limitation statements relating to our businesses and our prospects, new products, sales, expenses, tax rates, cash flows, and operating and capital requirements that are made pursuant to the safe harbor provisions of the Private Securities Litigation Reform Act of 1995. These forward-looking statements are intended to provide management’s current expectations or plans for our future operating and financial performance and are based on assumptions management believes are reasonable at the time they are made.
Forward-looking statements can be identified by the use of words such as “believe,” “expect,” “plan,” “estimate,” “project,” “target,” “anticipate,” “intend,” “may,” “will,” “continue” and other words of similar meaning in connection with a discussion of future operating or financial performance. These statements are not guarantees of future performance and involve certain risks, uncertainties and assumptions that are difficult to predict; therefore, actual outcomes and results could differ materially from what is expected or forecasted. These risks and uncertainties include, among others:
|
•
|
worldwide economic, financial, political and regulatory conditions;
|
|
•
|
currency and foreign exchange volatility;
|
|
•
|
the effect of competitive products and pricing;
|
|
•
|
the level of success of new product development and global expansion;
|
|
•
|
the level of future cash flows;
|
|
•
|
the levels of capital investments;
|
|
•
|
income tax rates;
|
|
•
|
restructuring charges;
|
|
•
|
the health of debt and equity markets, including credit quality and spreads, the level of liquidity and future debt issuances;
|
|
•
|
the level of interest rates and the strength of the capital markets in the U.S. and abroad;
|
|
•
|
the demand and market for debt ratings, including collateralized debt obligations, residential and commercial mortgage and asset-backed securities and related asset classes;
|
|
•
|
the state of the credit markets and their impact on Standard & Poor’s Ratings and the economy in general;
|
|
•
|
the regulatory environment affecting Standard & Poor’s Ratings and our other businesses;
|
|
•
|
the likely outcome and impact of litigation and investigations on our operations and financial condition;
|
|
•
|
the level of merger and acquisition activity in the U.S. and abroad;
|
|
•
|
continued investment by the construction, automotive, computer and aviation industries;
|
|
•
|
the strength and performance of the domestic and international automotive markets;
|
|
•
|
the volatility of the energy marketplace;
|
|
•
|
and the contract value of public works, manufacturing and single-family unit construction.
|
In addition, there are certain risks and uncertainties relating to our previously announced Growth and Value Plan which contemplates a separation of our education business, including, but not limited to, the impact and possible disruption to our operations, the timing and certainty of completing the transaction, unanticipated developments that may delay or negatively impact the transaction, and the ability of each business to operate as an independent entity upon completion of the transaction. We caution readers not to place undue reliance on forward-looking statements.
4
Item 1.
Business
Overview
The McGraw-Hill Companies, Inc. (together with its consolidated subsidiaries, the “Company,” the “Registrant,” “we,” “us” or “our”) is a leading content and analytics provider serving the capital, commodities and commercial markets. The capital markets include asset managers, banks, exchanges, issuers and financial advisors; the commodities markets include producers, traders and intermediaries within energy, metals, and agriculture; and the commercial markets include professionals and corporate executives within automotive, construction, aerospace and defense, and marketing / research information services. We serve our global customers through a broad range of products and services available through both third-party and proprietary distribution channels.
On September 12, 2011, we announced that our Board of Directors had unanimously approved a comprehensive Growth and Value Plan that includes separation into two companies: McGraw Hill Financial ("MHF"), focused on providing essential information to the capital, commodities and commercial markets, and McGraw-Hill Education ("MHE"), focused on education products and services and digital learning. The Growth and Value Plan has been focused on accelerating growth and increasing shareholder value through not only this separation, but also through substantial cost-cutting initiatives and increased share repurchases.
As we approach the completion of our Growth and Value Plan we have achieved our objectives under our Growth and Value Plan relating to the separation of MHE, cost reductions, increased shareholder return and investing / divesting in targeted assets that position us for long-term growth.
Separation of MHE
Our Board of Directors determined that the separation would provide benefits to the Company, including:
|
•
|
Strategic Focus
. Allow each independent company to design and implement corporate strategies and policies based on the industries that they serve and each specific business' unique characteristics, including customers, sales cycles and product life cycles.
|
|
•
|
Management Focus
. Allow management of both companies to design and implement plans and policies in line with the specific business characteristics and strategic objectives of the respective companies.
|
|
•
|
Management and Employee Incentives
. Enable both companies to create incentives for its management and employees that are more closely tied to its business performance. Separate compensation arrangements more closely align the interests of each company's management and employees with the interests of its stockholders and increase their ability to attract and retain personnel.
|
|
•
|
Access to Capital
. Remove the need for the businesses to compete internally for capital. Instead, both companies would have the ability to tailor their capital structures and financial policies to fit their individual business needs.
|
|
•
|
Flexibility for Acquisitions and Partnerships
. Provide each independent company increased strategic flexibility to make acquisitions and form partnerships and alliances in its target markets, unencumbered by considerations of the potential impact on the businesses of the other company.
|
|
•
|
Investor Choice
. Provide investors in each company with a more targeted investment opportunity with different investment and business characteristics, including different opportunities for growth, capital structure, business models and financial returns. This will allow investors to evaluate the separate and distinct merits, performance and future prospects of each company.
|
The timing of completing the separation has been dependent on many factors, including whether the separation occurs through a spin-off to our shareholders or a sale. After carefully considering all of the options for creating shareholder value, our Board of Directors concluded that a sale of MHE would generate the best value and certainty for our shareholders and most favorably position MHE for long-term success.
As such, on November 26, 2012, we entered into a definitive agreement to sell MHE to investment funds affiliated with Apollo Global Management, LLC, for a purchase price of $2.5 billion subject to certain closing adjustments. As part of this transaction, McGraw-Hill will receive $250 million in senior unsecured notes issued by the purchaser at an annual interest rate of 8.5%. We are currently in the process of determining the fair value of these notes. For all periods presented in this Form 10-K, the results of operations of MHE have been reclassified to reflect the business as a discontinued operation and the assets and liabilities of the business have been reclassified as held for sale in our consolidated balance sheets. The sale of MHE is subject to various
5
closing conditions and is anticipated to close in the first quarter of 2013. See Item 1a,
Risk Factors,
in this Form 10-K for updates to certain risk factors related to the sale.
We plan to use the proceeds of the sale to pay off any short-term borrowing obligations, to make selective acquisitions that enhance our portfolio of brands and to sustain our share repurchase program.
Cost Reductions
From the announcement of our Growth and Value Plan we have been committed to on-going cost savings by year-end of greater than $100 million. We have surpassed that goal by approaching $175 million in savings by the end of 2012 through a focused effort on our cost structure, including:
|
•
|
select headcount reductions of approximately 670 employees within MHF and 530 employees within MHE,
|
|
•
|
the migration of numerous accounting work-streams, human resource processes and selected information-technology support services to world-class partners that specialize in these operations, and
|
|
•
|
redesigning the employee benefit plans including a freeze of our U.S. employee retirement plan.
|
These cost goals were focused across the entire Company, including MHE. Approximately two-thirds of these cost reductions benefited MHE. Cost savings at MHF were partially offset by costs that were previously allocated to MHE, such as costs for centralized departments, that could not be classified as discontinued operations due to the nature of the expense. We will continue to look to extend outsourcing efforts to enhance cost synergies and realign administrative support for a leaner overall cost structure.
Increased Shareholder Return
During the two years ended December 31, 2012, we have returned $3.1 billion to our shareholders through a combination of share repurchases, our quarterly dividend and a special dividend.
We completed share repurchases of $1.8 billion and distributed regularly quarterly dividends totaling approximately $600 million during the two years ended December 31, 2012. On December 6, 2012, our Board of Directors approved a special dividend in the amount of $2.50 per share on our common stock, payable on December 27, 2012 to shareholders on record on December 18, 2012. This returned an additional approximately $700 million to our shareholders. Also, on January 30, 2013, the Board of Directors approved an increase in the quarterly common stock dividend from $0.255 per share to $0.28 per share.
Investing / Divesting Targeted Assets
During 2012, we completed several acquisitions that we believe will position us for long-term growth across all our segments.
|
•
|
S&P Dow Jones Indices
- our transaction with CME Group, Inc. and CME Group Index Services LLC to form a new company, S&P Dow Jones Indices LLC;
|
|
•
|
S&P Capital IQ
- Credit Market Analysis Limited, a provider of independent data concerning the over-the-counter markets; QuantHouse, an independent global provider of end-to-end systematic low-latency market data solutions; and R² Technologies, a provider of advanced risk and scenario-based analytics;
|
|
•
|
Commodities & Commercial
- Kingsman SA, a privately-held, Switzerland-based provider of price information and analytics for the global sugar and biofuels markets;
|
|
•
|
Standard & Poor's Ratings
- Coalition Development Ltd., a privately-held U.K. analytics company.
|
Refer to "
Acquisitions and Partnerships
" below for further discussion.
We completed the sale of our Broadcasting Group, previously included in our Commodities & Commercial segment, on December 30, 2011 and, accordingly, for the year ended December 31, 2011 and prior periods, the results of operations of the Broadcasting Group have been reclassified to reflect the business as a discontinued operation and assets and liabilities of the business have been removed from our consolidated balance sheet as of December 31, 2011.
6
The Growth and Value Plan has required us to incur non-recurring costs necessary to enable separation, reduce our cost structure, accelerate growth and increase shareholder value. The table below summarizes these costs including restructuring charges for the year ended December 31, 2012:
|
(in millions)
|
|||||||
|
Continuing
|
Discontinued
|
||||||
|
Professional fees
|
$
|
117
|
|
$
|
17
|
|
|
|
Restructuring charges
|
68
|
|
39
|
|
|||
|
Transaction costs for our S&P Dow Jones Indices LLC joint venture
|
15
|
|
—
|
|
|||
|
Charges related to our lease commitments
|
8
|
|
3
|
|
|||
|
Miscellaneous charges
|
18
|
|
2
|
|
|||
|
$
|
226
|
|
$
|
61
|
|
||
Total costs incurred since the Growth and Value Plan was announced in September of 2011 have been $
297 million
. These one-time expenses are largely professional fees, as we need the support of various consultants, business process and information technology firms, and financial advisors.
Our Businesses
As a result of our transaction with CME Group, Inc. and CME Group Index Services LLC to form a new company, S&P Dow Jones Indices LLC and how we are managing this company, combined with the formation of MHF, we have separated our previously reported S&P Capital IQ / S&P Indices segment into two separate reportable segments. Our operations now consist of four reportable segments: Standard & Poor’s Ratings (“S&P Ratings”), S&P Capital IQ, S&P Dow Jones Indices ("S&P DJ Indices") and Commodities & Commercial (“C&C”). Our previously reported MHE segment is reported as a discontinued operation as discussed previously under the heading, "
Separation of MHE
".
S&P Ratings
S&P Ratings is a provider of credit ratings, offering investors and market participants information and independent ratings benchmarks. Credit ratings are one of several tools that investors can use when making decisions about purchasing bonds and other fixed income investments. They are opinions about credit risk and our ratings express our opinion about the ability and willingness of an issuer, such as a corporation or state or city government, to meet its financial obligations in full and on time. Our credit ratings can also speak to the credit quality of an individual debt issue, such as a corporate or municipal bond, and the relative likelihood that the issue may default.
As the capital markets continue to evolve, S&P Ratings is well-positioned to capitalize on opportunities driven by continuing regulatory changes through its global network, well-established position in corporate markets and strong investor reputation.
With offices in over 23 countries around the world, S&P Ratings is an important part of the world's financial infrastructure and has played a leading role for over 150 years in providing investors with information and independent benchmarks for their investment and financial decisions as well as access to the capital markets. The key constituents S&P Ratings serves are investors; corporations; governments; municipalities; commercial and investment banks; insurance companies; asset managers; and other debt issuers.
S&P Ratings differentiates its revenue between transaction and non-transaction. Transaction revenue primarily includes fees associated with:
|
•
|
ratings related to new issuance of corporate and government debt instruments, and structured finance debt instruments;
|
|
•
|
bank loan ratings; and
|
|
•
|
corporate credit estimates, which are intended, based on an abbreviated analysis, to provide an indication of our opinion regarding creditworthiness of a company which does not currently have an S&P Ratings credit rating.
|
Non-transaction revenue primarily includes fees for surveillance of a credit rating, annual fees for customer relationship-based pricing programs and fees for entity credit ratings.
S&P Capital IQ
S&P Capital IQ is a global provider of digital and traditional financial research and analytical tools for capital market participants. It deploys the latest technology-driven strategies to deliver to customers an integrated portfolio of cross-asset analytics, desktop services, and investment recommendations in the rapidly growing financial information, data and analytics market. The key
7
constituents S&P Capital IQ serves are asset managers; investment banks; investors; brokers; financial advisors; investment sponsors; and companies’ back-office functions, including compliance, operations, risk, clearance, and settlement.
S&P Capital IQ's portfolio of products brings together integrated data sets, indices, research, and analytic insights in an integrated desktop solution to serve multiple investor segments across the financial community. In addition, the segment has products that integrate its content for delivery to the financial market via feeds, as well as through on-demand and customizable delivery tools. Specific products include:
|
•
|
Capital IQ - a product suite that provides data, analytics and third-party research for global financial professionals;
|
|
•
|
Global Credit Portal - a web-based solution that provides real-time credit research, market information and risk analytics, which includes RatingsDirect®;
|
|
•
|
Global Data Solutions - combines high-quality, multi-asset class and market data to help professional investors, traders, and analysts meet the new analytical, risk management, regulatory and front-to-back office operation requirements, which includes RatingsXpress®; and
|
|
•
|
investment research products.
|
S&P DJ Indices
S&P DJ Indices is a global index provider that maintains a wide variety of investable and benchmark indices to meet an array of investor needs. S&P DJ Indices generates subscription revenue but primarily derives revenue from non-subscription products based on the S&P and Dow Jones Indices, specifically through fees on exchange traded funds, mutual funds and insurance assets. Additionally, fees are generated through both over-the-counter derivative issuances as well as exchange traded derivatives.
S&P DJ Indices includes our transaction with CME Group, Inc. and CME Group Index Services LLC to form a new company, S&P Dow Jones Indices LLC. The combination of these businesses created the world's largest provider of market indices.
S&P DJ Indices generate revenue through investment vehicles such as:
|
•
|
exchange traded funds, which are based on the S&P and Dow Jones Indices and generate revenue through fees based on assets and underlying funds;
|
|
•
|
index-related licensing fees, which are generally either annual fees based on assets under management or flat fees for over-the-counter derivatives and retail-structured products;
|
|
•
|
data subscriptions, which support index fund management, portfolio analytics and research; and
|
|
•
|
listed derivatives, which generate royalties based on trading volumes of derivatives contracts.
|
Commodities & Commercial
C&C consists of business-to-business companies specializing in the commodities and commercial markets that deliver their customers access to high-value information, data, analytic services and pricing benchmarks. C&C includes such brands as Platts, J.D. Power and Associates, McGraw-Hill Construction and
Aviation Week
.
The C&C business is driven by the need for high-value information and transparency in a variety of industries. Our commodities business serves producers, traders and intermediaries within energy, metals and agriculture markets. Our commercial business serves professionals and executives within automotive, construction, aerospace and defense and marketing / research services markets. C&C delivers premier content that is deeply embedded in customer workflows and decision making processes.
Commodities revenue is generated primarily through the following sources:
|
•
|
subscriptions to its real-time news and price information; end-of-day market data; newsletters and reports; and geospatial data and maps;
|
|
•
|
and trading services related products.
|
Commercial revenue is generated primarily from digital and print subscriptions for a variety of products, proprietary research and consulting, ad claims and industry conferences.
8
Our Strategy
We strive to be the foremost provider of essential information such as benchmarks, intelligence and analytics in the global capital, commodities and commercial markets. We seek to leverage the strength of our globally recognized brands to promote sustainable growth by bringing transparency and independent insights to those markets. Our strategy seeks to understand the key trends affecting our businesses and address them through the achievement of our enterprise objectives.
Four key trends are increasing the need for content and analytics in the markets we serve:
|
•
|
The globalization of the capital markets: the global demand for capital and commodities markets trading and liquidity is expanding rapidly in both developed and growth markets;
|
|
•
|
The need for data-driven decision making tools: developments in technology, communications and data processing have increased the demand for time-critical, multi-asset class data and solutions;
|
|
•
|
Systemic regulatory change: new global legislation (e.g. Dodd-Frank, U.S. Commodity Futures Trading Commission and Basel III) is creating new and complex operating and capital models for banks and market participants; and
|
|
•
|
Increased volatility and risk: amplified uncertainty and market volatility around short-term events are driving the need for new methodologies to measure risk, return and profitability.
|
We are focused on delivering against these enterprise objectives:
•
Extend Market Leadership: extend our position as a global leader in our market segments
•
Build Scalable Capabilities: further institutionalize key capabilities such as technology and risk management
•
Foster Talent: attract and retain top talent
|
•
|
Create Shareholder Value: deliver high top-line and bottom-line growth and positive returns to shareholders
|
Our enterprise strategy, which will support the achievement of these core objectives, includes the following components:
|
•
|
Organic Growth: support a portfolio of leading market brands that delivers high top-line and bottom-line growth
|
|
•
|
Global Expansion: expand our global footprint to capture opportunities in both mature and growth markets
|
|
•
|
Acquisitions and Partnerships: supplement organic growth with acquisitions and partnerships
|
|
•
|
Scalable Capabilities: create and leverage efficiency and effectiveness through common platforms, processes and standards
|
|
•
|
Talent Retention and Acquisition: leverage our position as a market leader to become an employer of choice in our chosen markets and geographies
|
Organic Growth
Our businesses share a set of competitive advantages, including leading global brands, scalable technology and multi-channel distribution capabilities. We will leverage these capabilities to extend and expand our product offerings across high-value segments of the information value chain, such as benchmarks, pricing and valuation, analytics and tools, research and desktop / enterprise solutions. Additionally, we will seek out cross-business growth initiatives and synergies, in areas such as adjacent asset classes and parts of the value-chain. This will result in the creation of innovative new solutions that help investors face the evolving challenges of today's volatile and changing market landscape.
Global Expansion
Global growth remains a high priority for our Company as we continue to expand our footprint to capture opportunities in mature and growth markets. Our scale and leadership position within our core markets will enable us to identify and capitalize on growth trends and further extend our position in fast-developing growth markets. We are committed to enhancing our local data capabilities in growth markets for both local and global distribution.
Acquisitions and Partnerships
We will continue to drive acquisitions and partnerships that supplement organic growth and strengthen our market position in our target asset classes, high-value segments of the information value chain, and high-priority geographic markets. Our acquisition and partnership activity in 2012 included the following transactions across all our segments:
9
S&P DJ Indices
|
•
|
On June 29, 2012, we closed our transaction with CME Group, Inc. (“CME Group”) and CME Group Index Services LLC, a joint venture between CME Group and Dow Jones & Company, Inc., to form a new company, S&P Dow Jones Indices LLC.
|
S&P Capital IQ
|
•
|
On June 29, 2012, we acquired Credit Market Analysis Limited (“CMA”) from the CME Group. CMA provides independent data concerning the over-the-counter markets. CMA's data and technology will enhance our capability to provide pricing and related over-the-counter information.
|
|
•
|
On April 3, 2012, we completed the acquisition of QuantHouse, an independent global provider of end-to-end systematic low-latency market data solutions. The acquisition allows us to offer real-time monitors, derived data sets and analytics as well as the ability to package and resell this data as part of a core solution.
|
|
•
|
On February 8, 2012, we completed the acquisition of R² Technologies (“R²”). R² provides advanced risk and scenario-based analytics to traders, portfolio and risk managers for pricing, hedging and capital management across asset classes.
|
C&C
|
•
|
On November 1, 2012, we completed the acquisition of Kingsman SA (“Kingsman”), a privately-held, Switzerland-based provider of price information and analytics for the global sugar and biofuels markets. The acquisition of Kingsman will expand our presence in sugar and biofuels information markets and has the potential to provide growth in the global agricultural information markets.
|
S&P Ratings
|
•
|
On July 4, 2012, CRISIL, our majority owned Indian credit rating agency, completed the acquisition of Coalition Development Ltd. (“Coalition”), a privately-held U.K. analytics company, and its subsidiaries. Coalition provides high-end analytics to leading global investment banks and other financial services firms. Coalition will be integrated into CRISIL's Global Research & Analytics business.
|
Scalable Capabilities
We will maximize the capabilities of our entire portfolio of assets through an operating model that allows us to leverage infrastructure, and more quickly and effectively combine assets to create new solutions. We will further institutionalize enterprise-wide functions, including: technology and data operations; marketing, branding and communications; and risk management and compliance. This will allow us to create high-value, differentiated solutions and serve as a platform for growth.
Talent Retention and Acquisition
Consistent with our position as one of the leading content and analytics providers, we have a professional workforce of analysts, researchers and technologists, including the world's largest credit analytics teams, with over 1,400 analysts at S&P Ratings. We will promote a culture that is results-oriented and serves customers in a responsible and innovative way. We strive to recruit and retain the top talent required to deliver on our vision to be a leading provider of benchmarks, intelligence and analytics in the global capital, commodities and commercial markets.
There can be no assurance that we will achieve success in implementing any one or more of these strategies as a variety of factors could unfavorably impact operating results, including prolonged difficulties in the global credit markets and a change in the regulatory environment affecting our businesses.
Further projections and discussion on our outlook for our segments can be found within “Results of Operations”.
Segment and Geographic Data
The relative contribution of our operating segments to operating revenue, operating profit, long-lived assets and geographic area for the three years ended December 31, 2012 is included in Note 12 –
Segment and Geographic Information
to the consolidated financial statements under Item 8,
Consolidated Financial Statements and Supplementary Data
, in this Form 10-K.
Our Personnel
As of December 31, 2012, we have 21,687 employees located worldwide, of which 9,942 were employed in the United States. Of these 21,687 employees, approximately 5,000 were MHE employees.
10
Available Information
The Company's investor kit includes the current Annual Report, Proxy Statement, Form 10-Qs, Form 10-K, and the current earnings release. For online access to the Digital Investor Kit, go to www.mcgraw-hill.com/investor_relations. Requests for printed copies, free of charge, can be e-mailed to investor_relations@mcgraw-hill.com or mailed to Investor Relations, The McGraw-Hill Companies, Inc., 1221 Avenue of the Americas, New York, NY 10020-1095. Interested parties can also call Investor Relations toll-free at 866-436-8502 (domestic callers) or 212-512-2192 (international callers).
Access to more than 10 years of the Company's filings made with the Securities and Exchange Commission is available through the Company's Investor Relations Web site. Go to www.mcgraw-hill.com/investor_relations and click on the SEC Filings link. In addition, these filings are available to the public on the Commission's Web site through their EDGAR filing system at www.sec.gov. Interested parties may also read and copy materials that the Company has filed with the Securities and Exchange Commission (“SEC”) at the SEC's public reference room located at 450 Fifth Street, N.W., Room 1024, Washington, D.C. 20549. Please call the Commission at 1-800-SEC-0330 for further information on the public reference room.
Item 1a.
Risk Factors
We are providing the following cautionary statements which identify all known material risks, uncertainties and other factors that could cause our actual results to differ materially from historical and expected results.
We operate in the capital, commodities and commercial markets.
The capital markets include asset managers, banks, exchanges, issuers and financial advisors; the commodities markets include producers, traders and intermediaries within energy, metals, and agriculture; and the commercial markets include professionals and corporate executives within automotive, construction, aerospace and defense, and marketing / research information services.
Certain risk factors are applicable to individual markets while other risk factors are applicable company-wide.
Market Risks
Introduction of new products, services or technologies could impact our profitability
|
•
|
We operate in highly competitive markets that continue to change to adapt to customer needs. In order to maintain a competitive position, we must continue to invest in new offerings and new ways to deliver our products and services.
|
|
◦
|
These investments may not be profitable or may be less profitable than what we have experienced historically.
|
|
•
|
We could experience threats to our existing businesses from the rise of new competitors due to the rapidly changing environment within which we operate.
|
|
•
|
We rely on our information technology environment and certain critical databases, systems and applications to support key product and service offerings. We believe we have appropriate policies, processes and internal controls to ensure the stability of our information technology, provide security from unauthorized access to our systems and maintain business continuity, but our business could be subject to significant disruption and our operating results may be adversely impacted by unanticipated system failures, data corruption or unauthorized access to our systems.
|
Exposure to litigation could have a material effect on our financial position and results of operations
|
•
|
We are involved in legal actions and claims arising from our business practices, as discussed under Item 7,
Management's Discussion and Analysis of Financial Condition and Results of Operations
, in this Form 10-K and in Note 13 –
Commitments and Contingencies
to the consolidated financial statements under Item 8,
Consolidated Financial Statements and Supplementary Data
, in this Form 10-K, and face the risk that additional actions and claims will be filed in the future. Due to the inherent uncertainty of the litigation process, the resolution of any actions or claims that may be brought in the future, or the change in applicable legal standards could have a material effect on our financial position and results of operations.
|
Changes in the volume of securities issued and traded in domestic and/or global capital markets and changes in interest rates and volatility in the financial markets could have a material impact on our results of operations
|
•
|
Unfavorable financial or economic conditions that either reduce investor demand for debt securities or reduce issuers' willingness or ability to issue such securities could reduce the number and dollar volume of debt issuance for which S&P Ratings provides credit ratings.
|
11
|
•
|
Unfavorable financial or economic conditions could also adversely impacts S&P DJ Indices, which receives a portion of its revenue from fees based on derivatives trading volumes and index-based ETF assets under management.
|
|
•
|
Increases in interest rates or credit spreads, volatility in financial markets or the interest rate environment, significant political or economic events, defaults of significant issuers and other market and economic factors may negatively impact the general level of debt issuance, the debt issuance plans of certain categories of borrowers, the level of derivatives trading and/or the types of credit-sensitive products being offered.
|
|
•
|
Any weakness in the macroeconomic environment could constrain customer budgets across the markets we serve, potentially leading to a reduction in their employee headcount and a decrease in demand for our subscription-based products.
|
Increased domestic and foreign regulation may adversely impact our businesses
|
•
|
Our results could be adversely affected because of public statements or actions by market participants, government officials and others who may be advocates of increased regulation or regulatory scrutiny.
|
|
•
|
The financial services industry is subject to the potential for increasing regulation in the United States and abroad. The businesses conducted by S&P Ratings are in certain cases regulated under the U.S. Credit Rating Agency Reform Act of 2006, the U.S. Securities Exchange Act of 1934, and/or the laws of the states or other jurisdictions in which they conduct business.
|
|
◦
|
In the past several years, the U.S. Congress, the SEC and the European Commission, through regulators including the International Organization of Securities Commissions and the European Securities and Markets Authority, as well as regulators in other countries in which S&P Ratings operates have been reviewing the role of rating agencies and their processes and the need for greater oversight or regulations concerning the issuance of credit ratings or the activities of credit rating agencies.
|
|
▪
|
We do not believe that the laws, regulations and rules that have been adopted as part of this process will have a material adverse effect on our financial condition or results of operations.
|
|
◦
|
Other laws, regulations and rules relating to credit rating agencies are being considered by local, national, foreign and multinational bodies and are likely to continue to be considered in the future, including provisions seeking to reduce regulatory and investor reliance on credit ratings, rotation of credit rating agencies and liability standards applicable to credit rating agencies. The impact on us of the adoption of any such laws, regulations or rules remains uncertain, but could increase the costs and legal risks relating to S&P Rating's rating activities.
|
|
◦
|
Additional information regarding rating agencies is provided under Item 7,
Management's Discussion and Analysis of Financial Condition and Results of Operations
, in this Form 10-K.
|
|
•
|
Our commodities business is subject to the potential for increasing regulatory review in the United States and abroad.
|
|
◦
|
In the fall of 2011, the G20 Cannes Final Summit Declaration called upon the International Organization of Securities Commissions ("IOSCO"), International Energy Forum, International Energy Agency and the Organization of Petroleum Exporting Countries to prepare recommendations to improve the functioning and oversight of price reporting companies by mid-2012.
|
|
◦
|
In a meeting with representatives of IOSCO in January 2012, principals at IOSCO advised Platts management that among the recommendations the regulatory group is considering is establishment of formal oversight of price reporting organizations and their processes, or a self-regulatory oversight regime.
|
|
◦
|
In addition, new rules that are expected to be adopted by the U.S. Commodity Futures Trading Commission in 2013 affecting transactions in oil derivatives may hinder Platts in relation to its administration of the Platts electronic window (eWindow) as a means of determining price assessments in oil. Similar new rules and regulations in Europe are currently under consideration, albeit on a slower time frame.
|
|
◦
|
On October 5, 2012, IOSCO issued its final report to the G-20, including Principles for Oil Price Reporting Agencies, which sets out principles IOSCO states are intended to enhance the reliability of oil price assessments that are referenced in derivative contracts subject to regulation by IOSCO members. On January 9, 2013, IOSCO held a meeting with the Price Reporting Organizations to discuss implementation of the Principles for Oil Price Reporting Agencies. At the meeting, Platts was able to obtain clarification from IOSCO on its expectations for voluntary implementation of the Principles by Platts and the other PROs and, with that clarification, Platts believes that the Principles will not have a significant negative impact on its ongoing business operations.
|
|
◦
|
We do not believe that any new regulatory or self-regulatory oversight regime would have a material adverse effect on our financial condition or results of operations.
|
12
Operating Risks
A significant increase in operating costs and expenses could have a material adverse effect on our profitability
|
•
|
Our major expenses include employee compensation and capital investments.
|
|
◦
|
We offer competitive salary and benefit packages in order to attract and retain the quality employees required to grow and expand our businesses. Compensation costs are influenced by general economic factors, including those affecting the cost of health insurance and postretirement benefits, and any trends specific to the employee skill sets we require.
|
|
◦
|
We make significant investments in information technology data centers and other technology initiatives. Although we believe we are prudent in our investment strategies and execution of our implementation plans, there is no assurance as to the ultimate recoverability of these investments.
|
Our ability to protect our intellectual property rights could impact our competitive position
|
•
|
Our products contain intellectual property delivered through a variety of media, including print and digital. Our ability to achieve anticipated results depends in part on our ability to defend our intellectual property against infringement. Our operating results may be adversely affected by inadequate or changing legal and technological protections for intellectual property and proprietary rights in some jurisdictions and markets.
|
Risk of doing business abroad
|
•
|
As we continue to expand our operations overseas, we face the increased risks of doing business abroad, including inflation, fluctuation in interest rates and currency exchange rates, changes in applicable laws and regulatory requirements, export and import restrictions, tariffs, nationalization, expropriation, limits on repatriation of funds, civil unrest, terrorism, unstable governments and legal systems, and other factors. Adverse developments in any of these areas could cause actual results to differ materially from historical and/or expected operating results.
|
Increased competition could result in a loss of market share or revenue
|
•
|
The markets for credit ratings, financial research, investment and advisory services, and index-based products are competitive. S&P Ratings, S&P Capital IQ and S&P DJ Indices compete domestically and internationally on the basis of a number of factors, including the quality of its ratings, research and advisory services, client service, reputation, price, geographic scope, range of products and technological innovation.
|
|
•
|
While our businesses face competition from traditional content and analytics providers, we also face competition from non-traditional providers such as exchanges, asset managers, investment banks and technology-led companies that are adding content and analytics capabilities to their core businesses.
|
|
•
|
In addition, in some of the countries in which S&P Ratings competes, governments may provide financial or other support to locally-based rating agencies and may from time to time establish official credit rating agencies, credit ratings criteria or procedures for evaluating local issuers.
|
Consolidation of customers as well as staffing levels across our customer base could impact our available markets and revenue growth
|
•
|
Our businesses within S&P Capital IQ and S&P DJ Indices have a customer base which is largely comprised of members from the financial services industry. The current challenging business environment and the consolidation of customers resulting from mergers and acquisitions in the financial services industry can result in reductions in the number of firms and workforce which can impact the size of our customer base.
|
Changes to our financial processing systems and the transition of certain of our support functions to selected outsource providers may adversely impact our business
|
•
|
We are in the process of changing certain of our financial processing systems to an enterprise-wide systems solution. There can be no certainty that these initiatives will deliver the expected benefits. The failure to implement these changes successfully may impact our ability to process transactions accurately and efficiently and could lead to business disruption.
|
|
•
|
In addition, we have and plan to outsource certain support functions to third-party service providers to achieve cost savings and efficiencies. If the service providers to which we outsource these functions to do not perform effectively, we
|
13
may not be able to achieve the expected cost savings and, depending on the function involved, we may experience business disruption, processing inefficiencies, or harm employee morale.
Risks associated with the sale of McGraw-Hill Education
|
•
|
The sale will result in two separate independent companies each of which is a smaller, less diversified company than we currently were with a narrower business focus than we previously had. In addition, diversification of revenues, costs, and cash flows may diminish. As such, it is possible that the results of operations, cash flows, working capital and financing requirements of the two separate businesses may be subject to increased volatility.
|
|
•
|
Completion of the sale requires significant time, effort and expense. Any delays in the anticipated completion of the transaction may increase the expenses which we incur to complete the transaction.
|
|
•
|
This transaction requires us to retain and develop our senior management and a highly skilled workforce. Any unplanned turnover or our failure to develop current leadership positions or to retain a skilled workforce could affect our institutional knowledge base and our competitive advantage. In addition, our operating results could be adversely affected by increased costs due to increased competition for employees and higher employee turnover.
|
Item 1b.
Unresolved Staff Comments
None.
Item 2.
Properties
Our corporate headquarters are located in leased premises located at 1221 Avenue of the Americas, New York, NY 10020. We lease office facilities at 103 locations; 42 are in the United States. In addition, we own real property at 6 locations, of which 2 are in the United States. The number of overall locations decreased from 2011 as a result of classifying MHE as a discontinued operation. MHE's anticipated divestiture will result in the loss of owned buildings. See Note 2 –
Growth and Value Plan & Discontinued Operations
under Item 8,
Consolidated Financial Statements and Supplementary Data
, in this Form 10-K for further detail. Our properties consist primarily of office space used by each of our segments. We believe that all of our facilities are well maintained and are suitable and adequate for our current needs.
Item 3.
Legal Proceedings
Information on our legal proceedings in Note 13 –
Commitments and Contingencies
under Item 8,
Consolidated Financial Statements and Supplementary Data
, in this Form 10-K.
Item 4.
Mine Safety Disclosures
Not applicable.
14
Executive Officers of the Registrant
|
Name
|
Age
|
Position
|
||
|
Harold McGraw III
|
64
|
Chairman of the Board, President and Chief Executive Officer
|
||
|
Jack F. Callahan, Jr.
|
54
|
Executive Vice President and Chief Financial Officer
|
||
|
John L. Berisford
|
49
|
Executive Vice President, Human Resources
|
||
|
D. Edward Smyth
|
63
|
Executive Vice President, Corporate Affairs and Executive Assistant
|
||
|
to the Chairman, President and Chief Executive Officer
|
||||
|
Charles L. Teschner, Jr.
|
52
|
Executive Vice President, Global Strategy
|
||
|
Kenneth M. Vittor
|
63
|
Executive Vice President and General Counsel
|
||
The following executive officers have been full-time employees and officers for less than five years: Mr. Callahan, Mr. Berisford, Mr. Smyth and Mr. Teschner.
Mr. Callahan, prior to becoming an officer on December 6, 2010, was Chief Financial Officer of Dean Foods. Prior to that, Mr. Callahan held senior management positions at PepsiCo, including Chief Financial Officer of Frito-Lay International.
Mr. Berisford, prior to becoming an officer on January 3, 2011, was Senior Vice President, Human Resources, for Pepsi Beverages Company. Prior to that, he held senior Human Resources positions with Pepsi Bottling Group.
Mr. Smyth, prior to becoming an officer on February 17, 2009, served as Chief Administrative Officer and Senior Vice President of Corporate and Government Affairs for H.J. Heinz Company. Prior to that, Mr. Smyth spent fifteen years as a senior Irish diplomat.
Mr. Teschner, prior to becoming an officer on March 23, 2009, served as Lead Partner and senior client officer at the consulting firm of Booz Allen Hamilton, where he lived or worked in more than 20 countries and served on various management committees.
15
Item 5.
Market for the Registrant’s Common Equity, Related Stockholder Matters and Issuer Purchases of Equity Securities
Price Range of Common Stock
On February 1, 2013, the closing price of our common stock was $58.34 per share as reported on the New York Stock Exchange (“NYSE”) under the ticker symbol “MHP”. The approximate number of record holders of our common stock as of February 1, 2013 was 280.8 million. The high and low sales prices of the McGraw-Hill Companies’ common stock on the NYSE for the past three fiscal years are as follows:
|
2012
|
2011
|
2010
|
|||
|
First Quarter
|
$48.60 - $44.67
|
$40.56 - $36.20
|
$36.67 - $32.68
|
||
|
Second Quarter
|
50.00 - 42.02
|
43.50 - 38.09
|
36.94 - 26.95
|
||
|
Third Quarter
|
55.19 - 44.19
|
46.99 - 34.95
|
33.80 - 27.08
|
||
|
Fourth Quarter
|
57.44 - 49.56
|
45.77 - 38.68
|
39.45 - 32.70
|
||
|
Year
|
57.44 - 42.02
|
46.99 - 34.95
|
39.45 - 26.95
|
||
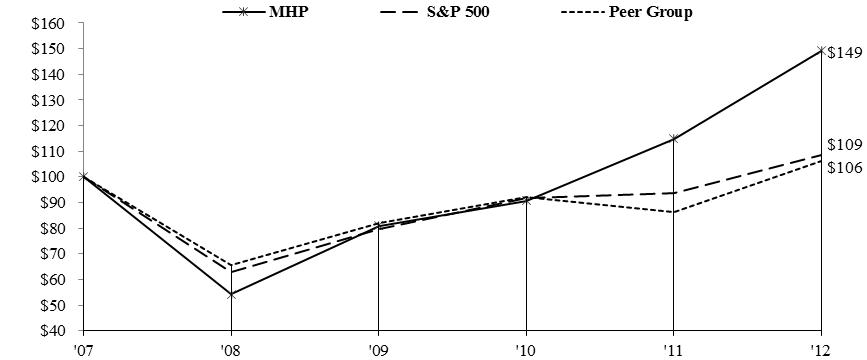
The performance graph below compares our cumulative total shareholder return during the previous five years with a performance indicator of the overall market (i.e., S&P 500), and our peer group. The Peer Group consists of the following companies: Thomson Reuters Corporation, Thomson Reuters PLC (through September 2009), Reed Elsevier NV, Reed Elsevier PLC, Pearson PLC, Moody’s Corporation and Wolters Kluwer. Returns assume $100 invested on December 31, 2008 and total return includes reinvestment of dividends through December 31, 2012.
Dividend Policy
We expect to continue our policy of paying regular cash dividends, although there is no assurance as to future dividend payments because they depend on future earnings, capital requirements and our financial condition. Regular quarterly dividends per share of our common stock for 2012 and 2011 were as follows:
|
2012
|
2011
|
||||||
|
$0.255 per quarter in 2012
|
$
|
1.02
|
|
||||
|
$0.250 per quarter in 2011
|
$
|
1.00
|
|
||||
In addition, as part of our ongoing Growth and Value Plan to generate shareholder value, we paid a special dividend of $2.50 per share on our common stock on December 27, 2012 to shareholders of record on December 18, 2012.
16
On January 30, 2013, the Board of Directors approved an increase in the quarterly common stock dividend from $0.255 per share to $0.28 per share.
Transfer Agent and Registrar for Common Stock
Computershare is the transfer agent for The McGraw-Hill Companies. Computershare maintains the records for the Company's registered shareholders and can assist with a variety of shareholder related services.
Shareholder correspondence should be mailed to:
Computershare
P.O. Box 43006
Providence, RI 02940-3006
Overnight correspondence should be mailed to:
Computershare
250 Royall Street
Canton, MA 02021
Registered shareholders can view and manage account online at www.computershare.com/investor.
For shareholder assistance:
|
In the U.S. and Canada:
|
888-201-5538
|
|
Outside the U.S. and Canada:
|
201-680-6578
|
|
TDD for the hearing impaired:
|
800-231-5469
|
|
TDD outside the U.S. and Canada:
|
201-680-6610
|
|
E-mail address:
|
shareholder@computershare.com
|
Repurchase of Equity Securities
On January 31, 2007, the Board of Directors approved a stock repurchase program authorizing the purchase of up to 45 million shares of the Company’s common stock (the “2007 Repurchase Program”), which was approximately 13% of the total shares of our outstanding common stock at that time. During the third quarter of 2011, we completed the repurchase of such shares.
On June 29, 2011, the Board of Directors approved a new stock repurchase program authorizing the purchase of up to 50 million shares (the “2011 Repurchase Program”), which was approximately 17% of the total shares of our outstanding common stock at that time. During 2012, we repurchased 6.8 million shares and, as of December 31, 2012, 16.9 million shares remained available under the 2011 Repurchase Program. The repurchased shares may be used for general corporate purposes, including the issuance of shares for stock compensation plans and to offset the dilutive effect of the exercise of employee stock options. The 2011 Repurchase Program has no expiration date and purchases under this program may be made from time to time on the open market and in private transactions, depending on market conditions.
We did not make any purchases of our outstanding common stock during the fourth quarter of 2012 pursuant to the 2011 Repurchase Program.
17
Item 6
. Selected Financial Data
The results of operations of McGraw-Hill Education have been reclassified to reflect the business as a discontinued operation and the assets and liabilities of the business have been reclassified as held for sale in our consolidated balance sheets. As a result, the selected financial data relate to our continuing operations.
|
(in millions, except per share data)
|
2012
|
2011
|
2010
|
2009
|
2008
|
|||||||||||||||
|
Income statement data:
|
||||||||||||||||||||
|
Revenue
|
$
|
4,450
|
|
|
$
|
3,954
|
|
|
$
|
3,639
|
|
|
$
|
4,132
|
|
|
$
|
4,354
|
|
|
|
Segment operating profit
|
1,517
|
|
|
1,303
|
|
|
1,230
|
|
|
1,110
|
|
1,118
|
|
|
||||||
|
Income from continuing operations before taxes on income
|
1,130
|
|
1
|
1,000
|
|
2
|
943
|
|
3
|
876
|
|
4
|
932
|
|
5
|
|||||
|
Provision for taxes on income
|
404
|
|
|
374
|
|
|
344
|
|
|
315
|
|
|
348
|
|
|
|||||
|
Net income from continuing operations attributable to The McGraw-Hill Companies, Inc.
|
676
|
|
607
|
|
582
|
|
|
543
|
|
|
582
|
|
|
|||||||
|
Earnings per share attributable to the McGraw-Hill Companies, Inc. common shareholders:
|
||||||||||||||||||||
|
Basic
|
2.43
|
|
2.03
|
|
1.88
|
|
|
1.74
|
|
1.85
|
|
|
||||||||
|
Diluted
|
2.37
|
|
2.00
|
|
1.86
|
|
|
1.73
|
|
1.83
|
|
|
||||||||
|
Dividends per share
|
1.02
|
|
|
1.00
|
|
|
0.94
|
|
|
0.90
|
|
|
0.88
|
|
|
|||||
|
Special dividend declared per common share
|
2.50
|
|
||||||||||||||||||
|
Operating statistics:
|
||||||||||||||||||||
|
Return on average equity
|
40.5
|
%
|
48.2
|
%
|
40.4
|
%
|
45.7
|
%
|
54.0
|
%
|
||||||||||
|
Income from continuing operations before taxes on income as a percent of revenue from continuing operations
|
25.4
|
%
|
25.3
|
%
|
25.9
|
%
|
21.2
|
%
|
21.4
|
%
|
||||||||||
|
Net Income from continuing operations as a percent of revenue from continuing operations
|
16.3
|
%
|
15.8
|
%
|
16.5
|
%
|
13.6
|
%
|
13.4
|
%
|
||||||||||
|
Balance sheet data:
6
|
||||||||||||||||||||
|
Working capital
|
$
|
(1,044
|
)
|
$
|
(845
|
)
|
$
|
262
|
|
$
|
2
|
|
$
|
(771
|
)
|
|||||
|
Total assets
|
5,122
|
|
4,112
|
|
4,664
|
|
4,010
|
|
3,201
|
|
|
|||||||||
|
Total debt
|
1,256
|
|
1,198
|
|
1,198
|
|
1,198
|
|
1,268
|
|
|
|||||||||
|
Redeemable noncontrolling interest
|
811
|
|
—
|
|
—
|
|
—
|
|
—
|
|
||||||||||
|
Equity
|
840
|
|
1,584
|
|
2,292
|
|
1,929
|
|
1,353
|
|
|
|||||||||
|
Number of employees
|
21,687
|
|
22,660
|
|
20,755
|
|
21,077
|
|
21,649
|
|
|
|||||||||
|
1
|
Includes the impact of the following items: $135 million charge for Growth and Value Plan costs, a $68 million restructuring charge, transaction costs of $15 million for our S&P Dow Jones Indices LLC joint venture, an $8 million charge related to a reduction in our lease commitments, partially offset by a vacation accrual reversal of $52 million.
|
|
2
|
Includes the impact of a $32 million restructuring charge and a $10 million charge for Growth and Value Plan costs.
|
|
3
|
Includes the impact of the following items: a $16 million charge for subleasing excess space in our New York facilities, an $11 million restructuring charge and a $7 million gain on the sale of certain equity interests at S&P Ratings.
|
|
4
|
Includes the impact of the following items: a $14 million loss on the sale of Vista Research, Inc., an $11 million gain on the sale of
BusinessWeek
and
a $4 million net restructuring charge.
|
|
5
|
Includes a $48 million restructuring charge.
|
|
6
|
Excludes discontinued operations.
|
18
Item 7
. Management’s Discussion and Analysis of Financial Condition and Results of Operations
The following Management Discussion and Analysis (“MD&A”) provides a narrative of the results of operations and financial condition of The McGraw-Hill Companies, Inc. (together with its consolidated subsidiaries, the “Company,” “we,” “us” or “our”) for the years ended December 31, 2012 and 2011, respectively. The MD&A should be read in conjunction with the consolidated financial statements and accompanying notes included in this Form 10-K for the year ended December 31, 2012, which have been prepared in accordance with accounting principles generally accepted in the United States of America (“U.S. GAAP”).
The MD&A includes the following sections:
|
•
|
Overview
|
|
•
|
Results of Operations
|
|
•
|
Liquidity and Capital Resources
|
|
•
|
Reconciliation of Non-GAAP Financial Information
|
|
•
|
Critical Accounting Estimates
|
|
•
|
Recently Issued or Adopted Accounting Standards
|
Certain of the statements below are forward-looking statements within the meaning of the Private Securities Litigation Reform Act of 1995. In addition, any projections of future results of operations and cash flows are subject to substantial uncertainty. See Forward-Looking Statements on page 4 of this report.
OVERVIEW
We are a leading content and analytics provider serving the capital, commodities and commercial markets. The capital markets include asset managers, banks, exchanges, issuers and financial advisors; the commodities markets include producers, traders and intermediaries within energy, metals, and agriculture; and the commercial markets include professionals and corporate executives within automotive, construction, aerospace and defense and marketing / research information services.
As a result of our joint venture between CME Group and Dow Jones & Company, Inc., to form a new company, S&P Dow Jones Indices LLC and how we are managing this company, combined with the formation of McGraw Hill Financial, we have separated our previously reported S&P Capital IQ / S&P Indices segment into two separate reportable segments. Our operations now consist of four reportable segments: Standard & Poor’s Ratings (“S&P Ratings”), S&P Capital IQ, S&P Dow Jones Indices ("S&P DJ Indices") and Commodities & Commercial (“C&C”). Our previously reported MHE segment is reported as a discontinued operation as discussed under the heading, "
Separation of MHE
".
|
•
|
S&P Ratings is a provider of credit ratings, offering investors and market participants with information and independent ratings benchmarks.
|
|
•
|
S&P Capital IQ is a global provider of digital and traditional financial research and analytical tools, which integrate cross-asset analytics and desktop services.
|
|
•
|
S&P DJ Indices is a global index provider that maintains a wide variety of valuation and index benchmarks for investment advisors, wealth managers and institutional investors.
|
|
•
|
C&C consists of business-to-business companies specializing in commercial and commodities markets that deliver their customers access to high-value information, data, analytic services and pricing benchmarks.
|
Growth and Value Plan Actions
On September 12, 2011, we announced that our Board of Directors had unanimously approved a comprehensive Growth and Value Plan that includes separation into two companies: McGraw Hill Financial ("MHF"), focused on providing essential information to the capital, commodities and commercial markets, and McGraw-Hill Education ("MHE"), focused on education products and services and digital learning. The Growth and Value Plan has been focused on accelerating growth and increasing shareholder value through not only this separation, but also through substantial cost-cutting initiatives and increased share repurchases.
As we approach the completion of the Growth and Value Plan we have achieved our objectives under our Growth and Value Plan relating to the separation of MHE, cost reductions, increased shareholder return and investing / divesting in targeted assets that position us for long-term growth.
19
Separation of MHE
The timing of completing the separation has been dependent on many factors, including whether the separation occurs through a spin-off to our shareholders or a sale. After carefully considering all of the options for creating shareholder value, our Board of Directors concluded that a sale of MHE would generate the best value and certainty for our shareholders and most favorably position MHE for long-term success.
As such, on November 26, 2012, we entered into a definitive agreement to sell MHE to investment funds affiliated with Apollo Global Management, LLC, for a purchase price of $2.5 billion subject to certain closing adjustments. As part of this transaction, McGraw-Hill will receive $250 million in senior unsecured notes issued by the purchaser at an annual interest rate of 8.5%. We are currently in the process of determining the fair value of these notes. For all periods presented in this Form 10-K, the results of operations of MHE have been reclassified to reflect the business as a discontinued operation and the assets and liabilities of the business have been reclassified as held for sale in our consolidated balance sheets. The sale of MHE is subject to various closing conditions and is anticipated to close in the first quarter of 2013. Unless otherwise indicated, all disclosures and amounts in the MD&A relate to our continuing operations. See Item 1a,
Risk Factors,
in this Form 10-K for updates to certain risk factors related to the sale.
We plan to use the proceeds of the sale to pay off any short-term borrowing obligations, to make selective acquisitions that enhance our portfolio of brands and to sustain our share repurchase program.
Cost Reductions
From the announcement of our Growth and Value Plan we have been committed to on-going cost savings by year-end of greater than $100 million. We have surpassed that goal by approaching $175 million in savings by the end of 2012 through a focused effort on our cost structure, including:
|
•
|
select headcount reductions of approximately 670 employees within MHF and 530 employees within MHE,
|
|
•
|
the migration of numerous accounting work-streams, human resource processes and selected information-technology support services to world-class partners that specialize in these operations, and
|
|
•
|
redesigning the employee benefit plans including a freeze of our U.S. employee retirement plan.
|
These cost goals were focused across the entire Company, including MHE. Approximately two-thirds of these cost reductions benefited MHE. Cost savings at MHF were partially offset by costs that were previously allocated to MHE, such as costs for centralized departments, that could not be classified as discontinued operations due to the nature of the expense. We will continue to look to extend outsourcing efforts to enhance cost synergies and realign administrative support for a leaner overall cost structure.
Increased Shareholder Return
During the two years ended December 31, 2012, we have returned $3.1 billion to our shareholders through a combination of share repurchases, our quarterly dividend and a special dividend.
We completed share repurchases of $1.8 billion and distributed regular quarterly dividends totaling approximately $600 million during the two years ended December 31, 2012. During the fourth quarter of 2012, our Board of Directors approved on December 6, 2012 a special dividend in the amount of $2.50 per share on our common stock, payable on December 27, 2012 to shareholders on record on December 18, 2012. This returned an additional approximately $700 million to our shareholders.
Investing / Divesting Targeted Assets
During 2012, we completed several acquisitions that we believe will position us for long-term growth across all our segments.
|
•
|
S&P DJ Indices
- our transaction with CME Group, Inc. and CME Group Index Services LLC to form a new company, S&P Dow Jones Indices LLC;
|
|
•
|
S&P Capital IQ
- Credit Market Analysis Limited, a provider of independent data concerning the over-the-counter markets; QuantHouse, an independent global provider of end-to-end systematic low-latency market data solutions; and R² Technologies, a provider of advanced risk and scenario-based analytics;
|
|
•
|
C&C
- Kingsman SA, a privately-held, Switzerland-based provider of price information and analytics for the global sugar and biofuels markets;
|
|
•
|
S&P Ratings
- Coalition Development Ltd., a privately-held U.K. analytics company.
|
Refer to Note 3 –
Acquisitions and Divestitures
to our consolidated financial statements for further discussion.
20
In addition to the agreement to sell MHE, we completed the sale of our Broadcasting Group, previously included in our C&C segment, on December 30, 2011 and, accordingly, for the year ended December 31, 2011 and prior periods, the results of operations of the Broadcasting Group have been reclassified to reflect the business as a discontinued operation and assets and liabilities of the business have been removed from our consolidated balance sheet as of December 31, 2011.
The Growth and Value Plan has required us to incur non-recurring costs necessary to enable separation, reduce our cost structure, accelerate growth and increase shareholder value. The table below summarizes these costs including restructuring charges for the year ended December 31, 2012:
|
(in millions)
|
|||||||
|
Continuing
|
Discontinued
|
||||||
|
Professional fees
|
$
|
117
|
|
$
|
17
|
|
|
|
Restructuring charges
|
68
|
|
39
|
|
|||
|
Transaction costs for our S&P Dow Jones Indices LLC joint venture
|
15
|
|
—
|
|
|||
|
Charges related to our lease commitments
|
8
|
|
3
|
|
|||
|
Miscellaneous charges
|
18
|
|
2
|
|
|||
|
$
|
226
|
|
$
|
61
|
|
||
Total costs incurred since the Growth and Value Plan was announced in September of 2011 have been $
297 million
. These one-time expenses are largely professional fees, as we need the support of various consultants, business process and information technology firms, and financial advisors.
Key Results
|
(in millions)
|
Years ended December 31,
|
% Change
1
|
|||||||||||||
|
|
2012
|
2011
|
2010
|
’12 vs ’11
|
’11 vs ’10
|
||||||||||
|
Revenue
|
$
|
4,450
|
|
$
|
3,954
|
|
$
|
3,639
|
|
13%
|
9%
|
||||
|
Operating profit
|
$
|
1,211
|
|
$
|
1,077
|
|
$
|
1,026
|
|
12%
|
5%
|
||||
|
% Operating margin
|
27
|
%
|
27
|
%
|
28
|
%
|
|||||||||
|
Diluted EPS from continuing operations
|
$
|
2.37
|
|
$
|
2.00
|
|
$
|
1.86
|
|
19%
|
8%
|
||||
|
1
|
% changes in the tables throughout the MD&A are calculated off of the actual number, not the rounded number presented.
|
2012
S&P Ratings
–
Revenue and operating profit increased
15%
and
18%
, respectively. Revenue growth was driven by strong high-yield and investment grade corporate bond issuance related to robust refinancing activity and increases in bank loan ratings and structured finance. The increase was also impacted by increases in public finance driven by strong municipal bond issuance in the United States. Operating profit increased compared to
2011
primarily due to the increases in revenue, partially offset by higher incentive costs due to improved financial performance, an increase in legal expenses, restructuring charges of $15 million in the second half of 2012 and unfavorable foreign exchange rates.
S&P Capital IQ
– Revenue increased
9%
, while operating profit decreased
3%
. The revenue increase was primarily attributable to growth at Capital IQ driven by market share gains and increased contract values for existing accounts; and increases in our subscription base for the Global Credit Portal, which includes RatingsDirect®. Operating profit was significantly impacted by restructuring charges of $19 million recorded in the second half of 2012, as well as increased costs to further develop our content and software. The acquisitions of R
2
Technologies in February 2012, QuantHouse in April 2012 and Credit Market Analysis Limited ("CMA") in June 2012 also impacted the results, particularly amortization charges relating to the intangible assets.
S&P DJ Indices
– Revenue and operating profit increased
20%
and
12%
, respectively. The revenue increases were primarily due to revenue from our S&P Dow Jones Indices LLC joint venture. Excluding revenue from the joint venture, revenue increased 3%, primarily due to higher average levels of assets under management for ETF products and higher mutual fund revenue. Operating profit was significantly impacted by expenses for our joint venture, higher data fees and additional personnel costs for targeted staff increases to drive future growth.
C&C
– Revenue and operating profit increased
9%
and
38%
, respectively. These increases were primarily driven by continued demand for Platts’ proprietary content as annualized contract values increased; growth across our automotive sectors at J.D. Power
21
and Associates ("JDPA"), primarily in Asia and the United States; and a strong focus on the management of expenses across the brands. Partially offsetting the growth in the segment were additional costs related to revenue growth, incentive costs at Platts and JDPA and restructuring charges of $12 million recorded in the second half of 2012.
2011
S&P Ratings
–
Revenue increased
4%
and operating profit declined
6%
. Revenue growth was driven by an increase in non-transaction revenues due to growth in non-issuance related revenue at corporate ratings and increases at CRISIL, our majority owned Indian credit rating agency, partially offset by declines in structured finance. The decline in operating profit was driven by an increase in expenses resulting from staff increases and incremental compliance and regulatory costs as well as a decline in transaction revenue.
S&P Capital IQ
–
Revenue and operating profit increased
13%
and
25%
, respectively. Increases were primarily driven by Integrated Desktop Solutions due to growth at Capital IQ, revenue from TheMarkets.com acquired in September 2010 and our subscription base for the Global Credit Portal, which includes RatingsDirect; and increases at Enterprise Solutions driven by growth at Global Data Solutions, which includes RatingsXpress. Also impacting operating profit were higher expenses from personnel costs and additional costs to further develop infrastructure.
S&P DJ Indices
– Revenue and operating profit increased
18%
and
31%
, respectively, due to growth in our exchange-traded fund products. Also impacting operating profit were higher expenses from personnel costs.
C&C
– Revenue and operating profit increased
10%
and
18%
, primarily driven by strong demand for Platt’s’ proprietary content and growth in our syndicated studies and consulting services in the automotive and non-automotive sectors, partially offset by decreases in the construction business.
Outlook
We strive to be the foremost provider of essential information such as benchmarks, intelligence and analytics in the global capital, commodities and commercial markets. We seek to leverage the strength of our globally recognized brands to promote sustainable growth by bringing transparency and independent insights to those markets. Our strategy seeks to understand the key trends affecting our businesses and address them, thereby achieving our enterprise objectives.
Four key trends are increasing the need for content and analytics in the markets we serve:
|
•
|
The globalization of the capital markets: the global demand for capital and commodities markets trading and liquidity is expanding rapidly in both developed and growth markets;
|
|
•
|
The need for data-driven decision making tools: developments in technology, communications and data processing have increased the demand for time-critical, multi-asset class data and solutions;
|
|
•
|
Systemic regulatory change: new global legislation (e.g. Dodd-Frank, U.S. Commodity Futures Trading Commission and Basel III) is creating new and complex operating and capital models for banks and market participants; and
|
|
•
|
Increased volatility and risk: amplified uncertainty and market volatility around short-term events are driving the need for new methodologies to measure risk, return and profitability.
|
We are focused on delivering against these enterprise objectives:
|
•
|
Extend Market Leadership: extend our position as a global leader in our market segments
|
•
Build Scalable Capabilities: further institutionalize key capabilities such as technology and risk management
•
Foster Talent: attract and retain top talent
|
•
|
Create Shareholder Value: deliver high top-line and bottom-line growth and positive returns to shareholders
|
Our enterprise strategy, which will support the achievement of these core objectives, includes the following components:
|
•
|
Organic Growth: support a portfolio of leading market brands that delivers high top-line and bottom-line growth
|
|
•
|
Global Expansion: expand our global footprint to capture opportunities in both mature and growth markets
|
|
•
|
Acquisitions and Partnerships: supplement organic growth with acquisitions and partnerships
|
22
|
•
|
Scalable Capabilities: create and leverage efficiency and effectiveness through common platforms, processes and standards
|
|
•
|
Talent Retention and Acquisition: leverage our position as a market leader to become an employer of choice in our chosen markets and geographies
|
There can be no assurance that we will achieve success in implementing any one or more of these strategies as a variety of factors could unfavorably impact operating results, including prolonged difficulties in the global credit markets and a change in the regulatory environment affecting our businesses.
Further projections and discussion on our 2013 outlook for our segments can be found within “Segment Review”.
RESULTS OF OPERATIONS
Consolidated Review
|
(in millions)
|
Years ended December 31,
|
% Change
|
|||||||||||||
|
|
2012
|
2011
|
2010
|
'12 vs '11
|
'11 vs '10
|
||||||||||
|
Revenue
|
$
|
4,450
|
|
$
|
3,954
|
|
$
|
3,639
|
|
13%
|
9%
|
||||
|
Expenses:
|
|||||||||||||||
|
Operating-related expenses
|
1,460
|
|
1,392
|
|
1,206
|
|
5%
|
15%
|
|||||||
|
Selling and general expenses
|
1,709
|
|
1,387
|
|
1,318
|
|
23%
|
5%
|
|||||||
|
Depreciation and amortization
|
122
|
|
111
|
|
96
|
|
11%
|
15%
|
|||||||
|
Total expenses
|
3,291
|
|
2,890
|
|
2,620
|
|
14%
|
10%
|
|||||||
|
Other income
|
52
|
|
13
|
|
7
|
|
N/M
|
82%
|
|||||||
|
Operating profit
|
1,211
|
|
1,077
|
|
1,026
|
|
12%
|
5%
|
|||||||
|
Interest expense, net
|
81
|
|
77
|
|
83
|
|
4%
|
(7)%
|
|||||||
|
Provision for taxes on income
|
404
|
|
374
|
|
344
|
|
8%
|
9%
|
|||||||
|
Income from continuing operations
|
726
|
|
626
|
|
599
|
|
16%
|
5%
|
|||||||
|
(Loss) income from discontinued operations
|
(234
|
)
|
308
|
|
252
|
|
N/M
|
22%
|
|||||||
|
Less: net income from continuing operations attributable to noncontrolling interests
|
(50
|
)
|
(19
|
)
|
(19
|
)
|
N/M
|
1%
|
|||||||
|
Less: net income from discontinuing operations attributable to noncontrolling interests
|
(5
|
)
|
(4
|
)
|
(4
|
)
|
6%
|
(4)%
|
|||||||
|
Net income attributable to The McGraw-Hill Companies, Inc.
|
$
|
437
|
|
$
|
911
|
|
$
|
828
|
|
(52)%
|
10%
|
||||
N/M - not meaningful
Revenue
|
(in millions)
|
Years ended December 31,
|
% Change
|
|||||||||||||
|
|
2012
|
2011
|
2010
|
’12 vs ’11
|
’11 vs ’10
|
||||||||||
|
Subscription / Non-transaction revenue
|
$
|
2,855
|
|
$
|
2,672
|
|
$
|
2,407
|
|
7%
|
11%
|
||||
|
Non-subscription / Transaction revenue
|
$
|
1,595
|
|
$
|
1,282
|
|
$
|
1,232
|
|
24%
|
4%
|
||||
|
Domestic revenue
|
$
|
2,684
|
|
$
|
2,373
|
|
$
|
2,253
|
|
13%
|
5%
|
||||
|
International revenue
|
$
|
1,766
|
|
$
|
1,581
|
|
$
|
1,386
|
|
12%
|
14%
|
||||
2012
Revenue increased
$496 million
or
13%
as compared to 2011, primarily due to strong high-yield investment grade corporate bond issuance, which impacted non-subscription / transaction revenue; growth in our global commodities products; growth for our Capital IQ product, strong municipal bond issuance in the U.S. and increases in bank loan ratings; increases in the subscription
23
base for Global Data Solutions; and recent acquisitions, including, QuantHouse in April 2012 and CMA and our S&P Dow Jones Indices LLC joint venture in June 2012. See “Segment Review” below for further information.
Foreign exchange rates had an unfavorable impact of $40 million on revenue. This impact refers to constant currency comparisons estimated by re-calculating current year results of foreign operations using the average exchange rate from the prior year.
2011
Revenue increased primarily due to growth in our global commodities products, growth at Capital IQ, revenue from TheMarkets.com acquired in September 2010, non-transaction revenue growth at CRISIL, an increase in our corporate industrial ratings and higher sales of our exchange-traded fund products. This was partially offset by a decline in our construction business, public finance, structured finance and investment research products.
Foreign exchange rates had a favorable impact of $35 million on revenue. This impact refers to constant currency comparisons estimated by re-calculating current year results of foreign operations using the average exchange rate from the prior year.
Total Expenses
The following tables provide an analysis by segment of our operating-related expenses and selling and general expenses for the years ended
December 31
, 2012 and 2011:
|
(in millions)
|
2012
|
2011
|
% Change
|
||||||||||||||||
|
Operating-
related expenses
|
Selling and
general expenses
|
Operating-
related expenses
|
Selling and
general expenses
|
Operating-
related expenses
|
Selling and
general expenses
|
||||||||||||||
|
S&P Ratings
|
$
|
677
|
|
$
|
479
|
|
$
|
657
|
|
$
|
362
|
|
3%
|
33%
|
|||||
|
S&P Capital IQ
|
456
|
|
412
|
|
383
|
|
393
|
|
19%
|
5%
|
|||||||||
|
S&P DJ Indices
1
|
73
|
|
96
|
|
75
|
|
56
|
|
(3)%
|
71%
|
|||||||||
|
C&C
|
335
|
|
368
|
|
351
|
|
356
|
|
(5)%
|
3%
|
|||||||||
|
Intersegment eliminations
|
(69
|
)
|
—
|
|
(63
|
)
|
—
|
|
(9)%
|
—%
|
|||||||||
|
Total segments
|
1,472
|
|
1,355
|
|
1,403
|
|
1,167
|
|
5%
|
16%
|
|||||||||
|
Corporate
2
|
(12
|
)
|
354
|
|
(11
|
)
|
220
|
|
7%
|
61%
|
|||||||||
|
$
|
1,460
|
|
$
|
1,709
|
|
$
|
1,392
|
|
$
|
1,387
|
|
5%
|
23%
|
||||||
|
1
|
For 2012,
selling and general expenses includes transaction costs of $15 million for our S&P Dow Jones Indices LLC joint venture.
|
|
2
|
For 2012, selling and general expenses includes expenses of $156 million for our Growth and Value Plan, including costs related to the separation of MHE, restructuring costs and other related non-recurring costs, partially offset by a vacation accrual reversal of $52 million.
|
Operating-Related Expenses
Operating-related expenses increased $
68 million
or
5%
as compared to
2011
, primarily driven by increased costs at S&P Ratings of $50 million or 9% and S&P Capital IQ of $37 million or 15%. These increases were primarily a result of higher personnel costs, including incentive compensation, at S&P Ratings and global staff increases at S&P Capital IQ. This was partially offset by lower compensation expense at C&C of $13 million or 15% due to a reduction in headcount from recent restructuring actions.
Intersegment eliminations relates to a royalty charged to S&P Capital IQ for the rights to use and distribute content and data developed by S&P Ratings.
Selling and General Expenses
During 2012, we recorded
$226 million
of Growth and Value Plan related costs necessary to enable separation and reduce our cost structure, which includes professional fees, severance charges, transaction costs for our S&P Dow Jones Indices LLC joint venture and a charge related to a reduction in our lease commitments. Excluding these costs and $10 million of Growth and Value Plan costs for 2011, selling and general expenses increased $106 million as compared to
2011
, due to higher costs associated with increased sales and additional stock-based compensation, mainly due to higher expected performance achievement and an increase in the grant price of our equity awards. Personnel costs increased $43 million at S&P Ratings, $26 million at C&C, $7 million at S&P DJ Indices and $5 million at S&P Capital IQ as revenue growth improved
15%
,
9%
,
20%
and
9%
, respectively. In addition, S&P Ratings had increased legal costs as compared to 2011.
24
Depreciation and Amortization
Depreciation and amortization increased
$11 million
or
11%
as compared to
2011
, primarily due to additional intangible asset amortization related to our recent acquisitions, partially offset by reduced purchases of furniture and computer equipment last year as we focused on continued cost controls.
The following tables provide an analysis by segment of our operating-related expenses and selling and general expenses for the years ended
December 31
, 2011 and 2010:
|
(in millions)
|
2011
|
2010
|
% Change
|
||||||||||||||||
|
Operating-
related expenses
|
Selling and
general expenses
|
Operating-
related expenses
|
Selling and
general expenses
|
Operating-
related expenses
|
Selling and
general expenses
|
||||||||||||||
|
S&P Ratings
|
$
|
657
|
|
$
|
362
|
|
$
|
573
|
|
$
|
321
|
|
15%
|
13%
|
|||||
|
S&P Capital IQ
|
383
|
|
393
|
|
325
|
|
408
|
|
18%
|
(4)%
|
|||||||||
|
S&P DJ Indices
|
75
|
|
56
|
|
59
|
|
70
|
|
27%
|
(20)%
|
|||||||||
|
C&C
|
351
|
|
356
|
|
309
|
|
328
|
|
14%
|
9%
|
|||||||||
|
Intersegment eliminations
|
(63
|
)
|
—
|
|
(56
|
)
|
—
|
|
(13)%
|
—%
|
|||||||||
|
Total segments
|
1,403
|
|
1,167
|
|
1,210
|
|
1,127
|
|
16%
|
4%
|
|||||||||
|
Corporate
|
(11
|
)
|
220
|
|
(4
|
)
|
191
|
|
N/M
|
15%
|
|||||||||
|
$
|
1,392
|
|
$
|
1,387
|
|
$
|
1,206
|
|
$
|
1,318
|
|
15%
|
5%
|
||||||
Operating-Related Expenses
Operating-related expenses increased $
186 million
or
15%
as compared to 2010, primarily driven by increased personnel costs and additional costs to further develop infrastructure.
Intersegment eliminations relates to a royalty charged to S&P Capital IQ for the rights to use and distribute content and data developed by S&P Ratings.
Selling and General Expenses
Selling and general expenses increased
$69 million
or
5%
as compared to 2010, primarily due to a fourth quarter restructuring plan we initiated across the Company as part of our Growth and Value Plan which resulted in a $32 million charge; higher costs associated with increased sales; higher compensation; and incremental compliance and regulatory costs, primarily in our S&P Ratings segment.
Depreciation and Amortization
Depreciation and amortization increased
$15 million
or
15%
as compared to 2010, primarily due to additional intangible asset amortization related to our recent acquisitions.
Other Income
In the fourth quarter of 2012, we recorded a pre-tax gain of $52 million within other income in the consolidated statement of income related to a change in our vacation policy. The change in our vacation policy modified the number of days that employees are entitled to for unused vacation time upon termination of employment
as they will only be paid for vacation days equivalent to what they have earned in the current year.
During 2011, we recorded a pre-tax gain of $13 million within other income in the consolidated statement of income, which related to the sale of our interest in LinkedIn Corporation in their initial public offering. This investment was held within our C&C segment.
During 2010, we recorded a pre-tax gain of $7 million within other income in the consolidated statement of income, which related to the sale of certain equity interests in India which were part of our S&P Ratings segment.
Operating Profit
We consider operating profit to be an important measure for evaluating our operating performance and we define operating profit as revenues less the related cost of producing the revenues and selling and general expenses. We also further evaluate operating profit for each of the reportable business segments in which we operate.
25
We internally manage our operations by reference to “segment operating profit” and resources are allocated primarily based on segment operating profit. Segment operating profit is defined as operating profit before allocated expenses, which are centrally managed costs and do not affect the operating results of our segments. Segment operating profit is one of the key metrics we use to evaluate operating performance. Segment operating profit is not, however, a measure of financial performance under U.S. GAAP, and may not be defined and calculated by other companies in the same manner.
|
(in millions)
|
% Change
|
||||||||||||
|
2012
|
2011
|
2010
|
'12 vs '11
|
'11 vs '10
|
|||||||||
|
S&P Ratings
|
$
|
849
|
|
$
|
720
|
|
$
|
762
|
|
18%
|
(6)%
|
||
|
S&P Capital IQ
|
208
|
|
214
|
|
171
|
|
(3)%
|
25%
|
|||||
|
S&P DJ Indices
1
|
212
|
|
189
|
|
144
|
|
12%
|
31%
|
|||||
|
C&C
|
248
|
|
180
|
|
153
|
|
38%
|
18%
|
|||||
|
Total segment operating profit
|
1,517
|
|
1,303
|
|
1,230
|
|
16%
|
6%
|
|||||
|
Unallocated expense
2
|
(306
|
)
|
(226
|
)
|
(204
|
)
|
36%
|
11%
|
|||||
|
Total operating profit
|
$
|
1,211
|
|
$
|
1,077
|
|
$
|
1,026
|
|
12%
|
5%
|
||
|
1
|
2012 includes transaction costs for our S&P Dow Jones Indices LLC joint venture.
|
|
2
|
Includes depreciation expense and expenses for our Growth and Value Plan, including restructuring costs and other related non-recurring costs, partially offset by a vacation accrual reversal.
|
2012
Segment Operating Profit
– Increased
$214 million
, or
16%
as compared to
2011
. Segment operating income margins were
34%
and
33%
for
2012
and
2011
, respectively. Restructuring charges and other non-recurring charges as noted above mitigated the margin improvement for the period. See “Segment Review” below for further information. In addition, segment operating profit benefited from reduced pension costs as we froze our U.S. Employee Retirement Plan effective on April 1, 2012.
Unallocated Expense
– Increased by
$80 million
or
36%
as compared to
2011
, mainly as a result of $156 million of Growth and Value Plan related costs necessary to enable separation and reduce our cost structure, which includes professional fees of $117 million and restructuring charges of $21 million. This was partially offset by a vacation accrual reversal of $52 million. Unallocated expenses also includes an increase for costs that were previously allocated to MHE, such as costs for centralized departments, that could not be classified as discontinued operations due to the nature of the expense.
Foreign exchange rates had an unfavorable impact of $6 million on operating profit for
2012
. This impact refers to constant currency comparisons and the remeasurement of monetary assets and liabilities. Constant currency impacts are estimated by re-calculating current year results of foreign operations using the average exchange rate from the prior year. Remeasurement impacts are based on the variance between current-year and prior-year foreign exchange rate fluctuations on assets and liabilities denominated in currencies other than the individual business' functional currency.
2011
Segment Operating Profit
– Increased $
73 million
, or
6%
as compared to 2010. Segment operating income margins were and
33%
34%
for 2011 and 2010, respectively. Restructuring charges as noted above mitigated the margin improvement for the period. See “Segment Review” below for further information.
Unallocated Expense
– Increased by
$22 million
or
11%
as compared to 2010, mainly as a result of $27 million of Growth and Value Plan related costs necessary to enable separation and reduce our cost structure, which includes restructuring charges of $17 million and professional fees of $10 million.
Foreign exchange rates had a favorable impact of $13 million on operating profit for 2011.
Interest Expense, net
Net interest expense increased
4%
as compared to
2011
, primarily due to increased interest expense related to uncertain tax positions, as well as lower international interest income from our investments in
2012
compared with
2011
. Net interest expense decreased 7% compared to 2010 primarily due to higher international interest income from our investments in 2011 compared with 2010.
26
Provision for Income Taxes
Our effective tax rate from continuing operations was 35.8%, 37.4% and 36.4% for 2012, 2011 and 2010, respectively. The reduction in the effective tax rate from the prior year periods was primarily due to the partnership structure of the S&P Dow Jones Indices LLC joint venture, the Growth and Value Plan and restructuring costs incurred primarily in the United States. Including discontinued operations, the effective tax rate was 45.8%, 36.5% and 36.4% for 2012, 2011 and 2010, respectively. The increase in the effective tax rate including discontinued operations for 2012 was due to the goodwill impairment recorded at MHE.
Absent any impact of factors including intervening audit settlements, changes in federal, state or foreign law and changes in the geographical mix of our income, we expect our 2013 effective tax rate to decrease from our 2012 effective tax rate due to the full year effect of the S&P Dow Jones Indices LLC joint venture.
(Loss) Income from Discontinued Operations
2012
Loss from discontinued operations was $234 million in 2012 as compared to income from discontinued operations of $308 million in 2011, primarily as a result of revenue declines and several non-recurring items.
Revenue at MHE decreased $230 million or 10% as compared to 2011, primarily due to decreases in the adoption states as well as open territory sales at School Education Group. Also contributing to the reduction was a substantial increase in deferred revenue due to higher sales of programs that contain digital components that will be delivered over multiple years. In the Higher Education, Professional and International Group, sales of new editions have been impacted by the growth of the used book and rental market. However, digital sales across MHE continue to increase as compared to 2011.
Non-recurring items impacting the loss from discontinued operations included:
|
•
|
Intangible asset impairments of
$497,000,000
million that consisted of goodwill, prepublication and inventory assets at MHE's School Education Group ("SEG").
|
|
◦
|
As a result of the offer we received from Apollo Global Management, LLC in the fourth quarter of 2012, we performed a goodwill impairment review at MHE, which resulted in a full impairment of goodwill of
$478
million at SEG.
|
|
◦
|
An impairment charge of
$19,000,000
million was recorded on certain prepublication and inventory assets as targeted school programs were shut down.
|
|
•
|
Restructuring charges of
$39
million consisting primarily of employee severance costs related to a workforce reduction of approximately 530 positions.
|
|
•
|
Direct transaction costs of $17 million for legal and professional fees related to the sale of MHE.
|
|
•
|
A charge related to a lease commitment of
$3
million.
|
|
•
|
These charges were partially offset by a vacation accrual reversal of
$17
million
related to a change in our vacation policy
.
|
2011
Income from discontinued operations increased
22%
, primarily due to a gain of $74 million, net of tax, related to the sale of our Broadcasting Group completed on December 30, 2011. Excluding the gain, income from discontinued operations decreased 7% compared to 2010 as a result of revenue declines and restructuring charges at MHE of $34 million consisting primarily of employee severance costs. Revenue at MHE decreased $141 million or 6% as compared to 2010, primarily due to decreases in the adoption states as well as open territory sales at SEG.
Segment Review
S&P Ratings
Credit ratings are one of several tools that investors can use when making decisions about purchasing bonds and other fixed income investments. They are opinions about credit risk and our ratings express our opinion about the ability and willingness of an issuer, such as a corporation or state or city government, to meet its financial obligations in full and on time. Our credit ratings can also relate to the credit quality of an individual debt issue, such as a corporate or municipal bond, and the relative likelihood that the issuer may default.
27
S&P Ratings differentiates its revenue between transaction and non-transaction. Transaction revenue primarily includes fees associated with:
|
•
|
ratings related to new issuance of corporate and government debt instruments, and structured finance debt instruments;
|
|
•
|
bank loan ratings; and
|
|
•
|
corporate credit estimates, which are intended, based on an abbreviated analysis, to provide an indication of our opinion regarding creditworthiness of a company which does not currently have an S&P Ratings credit rating.
|
Non-transaction revenue primarily includes fees for surveillance of a credit rating, annual fees for customer relationship-based pricing programs and fees for entity credit ratings.
|
(in millions)
|
Years ended December 31,
|
% Change
|
||||||||||||||||
|
|
2012
|
2011
|
2010
|
’12 vs ’11
|
’11 vs ’10
|
|||||||||||||
|
Revenue:
|
||||||||||||||||||
|
Transaction
|
$
|
903
|
|
$
|
651
|
|
$
|
662
|
|
39
|
%
|
(2
|
)%
|
|||||
|
Non-transaction
|
1,131
|
|
1,116
|
|
1,033
|
|
1
|
%
|
8
|
%
|
||||||||
|
Total revenue
|
$
|
2,034
|
|
$
|
1,767
|
|
$
|
1,695
|
|
15
|
%
|
4
|
%
|
|||||
|
% of total revenue:
|
||||||||||||||||||
|
Transaction
|
44
|
%
|
37
|
%
|
39
|
%
|
||||||||||||
|
Non-transaction
|
56
|
%
|
63
|
%
|
61
|
%
|
||||||||||||
|
Domestic revenue
|
$
|
1,102
|
|
$
|
910
|
|
$
|
919
|
|
21
|
%
|
(1
|
)%
|
|||||
|
International revenue
|
$
|
932
|
|
$
|
857
|
|
$
|
776
|
|
9
|
%
|
10
|
%
|
|||||
|
Operating profit
|
$
|
849
|
|
$
|
720
|
|
$
|
762
|
|
18
|
%
|
(6
|
)%
|
|||||
|
% Operating margin
|
42
|
%
|
41
|
%
|
45
|
%
|
||||||||||||
Revenue
2012
Transaction revenue grew significantly as compared to 2011 driven by strong high-yield and investment grade corporate bond issuance related to robust refinancing activity. Borrowers took advantage of low rates replacing existing bonds with cheaper debt, particularly in the second half of 2012 as issuers refinanced in advance of the uncertainty surrounding the U.S. fiscal cliff and Presidential election. The significant increase was also attributable to weak results in the second half of 2011 resulting from the impacts of the sovereign crisis in Europe and a slow economic recovery. Additionally, increases in 2012 in public finance contributed to growth in transaction revenue, primarily from strong municipal bond issuance in the U.S. as refunding activity increased dramatically over 2011. Strong growth in bank loan ratings, resulting from a favorable interest rate environment, was also a key driver contributing to the growth in structured finance revenues, specifically an increase to U.S. collateralized loan obligations ("CLO") transaction revenue. U.S. asset backed securities ("ABS") transaction revenue also increased due to favorable spreads, expansion of both bank & non-bank issuance and solid refinancing activity of student loans.
Non-transaction revenue remained relatively flat as growth in non-issuance related revenue at corporate ratings, primarily for entity credit ratings and rating evaluation services, was offset by declines in annual fees and program fees in structured finance. Annual fees include surveillance fees and other customer relationship-based fees. Additionally, CRISIL's acquisition of Coalition Development Ltd. in July of 2012 had a favorable impact on non-transaction revenue in 2012. Non-transaction revenue includes an intersegment royalty charged to S&P Capital IQ for the rights to use and distribute content and data developed by S&P Ratings. Royalty revenue for
2012
and 2011 was
$69 million
and
$63 million
, respectively.
Foreign exchange rates had an unfavorable impact of $37 million on revenue for 2012.
2011
Revenue increased compared to 2010 as non-transaction revenue growth offset the slight decline in transaction revenue. Non-transaction revenue includes an intersegment royalty charged to S&P Capital IQ for the rights to use and distribute content and
28
data developed by S&P Ratings. Royalty revenue for the years ended December 31, 2011 and 2010 was $63 million and $56 million, respectively. Foreign exchange rates had a favorable impact of $25 million on revenue for 2011.
The decrease in transaction revenue was driven primarily by declines in public finance and structured finance. These declines were partially offset by increases at corporate ratings due to growth in bank loan ratings and high-yield corporate bond ratings revenue. U.S. municipal bond issuance decreased as municipal market volume declined driven by the expiration of the Build America Bond program at the end of 2010. Declines in structured finance were driven by lower issuance volumes in the U.S. of residential mortgage-backed securities (“RMBS”), collateralized debt obligations (“CDO”) and ABS.
Revenue derived from non-transaction related sources increased compared to 2010, primarily as a result of growth in non-issuance related revenue at corporate ratings, primarily for entity credit ratings, ratings evaluation services and surveillance fees, and CRISIL, our majority owned Indian credit rating agency, primarily for outsourcing services and the acquisition of Pipal Research in December 2010. This was partially offset by declines in structured finance related to lower annual fees that were adversely impacted by increased deal maturities and defaults, primarily on CDO deals. Non-transaction revenue represented a larger percentage of total S&P Ratings revenue for 2011 compared to 2010 as transaction revenue decreased and non-transaction revenue increased in 2011 due to the factors discussed above.
Operating Profit
2012
Operating profit increased compared to 2011 primarily due to the increases in revenue as noted above. These increases were partially offset by increased expenses resulting from higher incentive costs due to improved financial performance, an increase in legal expenses, restructuring charges of $15 million in the second half of 2012 consisting of employee severance costs related to a workforce reduction of approximately 100 positions, CRISIL's acquisition of Coalition Development Ltd. in July of 2012 and an unfavorable impact from foreign exchange rates of $13 million.
2011
Operating profit decreased compared to 2010 due to increased expenses resulting from staff increases, incremental compliance and regulatory costs, restructuring charges of $9 million in the fourth quarter of 2011 consisting of employee severance costs related to a workforce reduction of approximately 30 positions and a decline in transaction revenue, partially offset by growth in non-transaction revenue as noted above and a favorable impact from foreign exchange rates of $12 million.
Issuance Volumes
We monitor issuance volumes as an indicator of trends in transaction revenue streams within S&P Ratings. Issuance volumes noted within the discussion that follows are based on the domicile of the issuer. Issuance volumes can be reported in two ways: by “domicile” which is based on where an issuer is located or where the assets associated with an issue are located, or based on “marketplace” which is where the bonds are sold. The following tables depict changes in issuance levels as compared to the prior year, based on Thomson Financial, Harrison Scott Publications, Dealogic and S&P Rating’s internal estimates.
|
|
2012 Compared to 2011
|
|||||
|
Corporate Issuance
|
U.S.
|
Europe
|
||||
|
High-Yield Issuance
|
51
|
%
|
35
|
%
|
||
|
Investment Grade
|
29
|
%
|
20
|
%
|
||
|
Total New Issue Dollars—Corporate Issuance
|
35
|
%
|
21
|
%
|
||
|
•
|
Corporate issuance in the U.S. and Europe was driven by strong high-yield debt issuance and investment grade debt issuance as borrowers took advantage of low funding rates to opportunistically refinance existing debt. Both investment grade and high-yield issuance comparisons also benefited from low volumes in 2011.
|
29
|
|
2012 Compared to 2011
|
|||||
|
Structured Finance
|
U.S.
|
Europe
|
||||
|
Residential Mortgage-Backed Securities (“RMBS”)
|
49
|
%
|
(51
|
)%
|
||
|
Commercial Mortgage-Backed Securities (“CMBS”)
|
46
|
%
|
*
|
|
||
|
Collateralized Debt Obligations (“CDO”)
|
115
|
%
|
*
|
|
||
|
Asset-Backed Securities (“ABS”)
|
43
|
%
|
(1
|
)%
|
||
|
Covered Bonds
|
*
|
|
(46
|
)%
|
||
|
Total New Issue Dollars—Structured Finance
|
54
|
%
|
(42
|
)%
|
||
|
*
|
Represents low issuance levels in 2012 and 2011.
|
|
•
|
RMBS volume is up in the U.S. due to higher re-REMIC activity. RMBS grew off of a low base in 2011. RMBS volumes in Europe were down reflecting issuers taking advantage of the Bank of England's Funding for Lending Scheme.
|
|
•
|
CMBS issuance is up in the U.S. as improving economic conditions, stabilizing delinquency rates and narrowing spreads have increased the attractiveness and competitiveness of the CMBS market, particularly in the fourth quarter. European CMBS issuance continued to remain constrained with low issuance levels in both periods.
|
|
•
|
Issuance in the CDO asset class in the U.S. was driven by strong CLO issuance due to an increase in corporate loan activity. European issuance in the CDO asset class was minimal due to economic uncertainty and increases compare to a very low level of activity in 2011.
|
|
•
|
ABS issuance in the U.S. is up primarily due to strength in autos, partially due to growth in subprime lending as well as an expansion of bank lending on prime loans. An increasingly tighter spread environment has triggered a substantial return of credit card activity from banks and also resulted in significant refinancing opportunities in the student loan sector which also contributed to the growth. European ABS issuance levels remained in line with 2011.
|
|
•
|
Covered bond issuance (which are debt securities backed by cash flows from mortgages or public sector loans) in Europe is down resulting from uncertainty regarding sovereign risk and the potential unfavorable impact on this sector as well as lower funding requirements due to additional liquidity provided by the European Central Bank through its long-term refinancing operations.
|
Industry Highlights and Outlook
Strong high-yield and investment grade issuance in 2012 was driven by robust refinancing activity as borrowers took advantage of low rates replacing existing bonds with cheaper debt. During the second half, issuance was driven by issuers refinancing in advance of the uncertainty surrounding the U.S. fiscal cliff and Presidential election. In 2013, opportunistic issuance is expected to continue at a slightly slower pace as many refinancings were completed in 2012, however, we believe the longer term outlook for the corporate bond market continues to be healthy.
Structured finance issuance in the U.S. continued its turnaround throughout 2012 and 2013 looks to build on this momentum. The U.S. RMBS market is expected to remain modest given continuing home pricing pressures, historically low mortgage origination levels, and continued high unemployment nationally. European RMBS issuance volumes continued to remain low during 2012 and we expect the Bank of England's Funding for Lending Scheme will continue to dampen European RMBS issuance in 2013. U.S. CMBS issuance experienced growth, particularly in the fourth quarter, due to improving economic conditions, low interest rates, stabilizing delinquency rates, and narrowing spreads. Healthier U.S. CMBS issuance levels are expected to continue in 2013.
The U.S. CDO market experienced strong CLO activity in 2012. We expect this activity to remain strong as we move into 2013. U.S. ABS issuance volume in 2012 was robust with strength in autos leading the way as vehicle sales have increased and the outlook for 2013 remains strong. European ABS issuance volume experienced strong growth in autos and credit cards in the fourth quarter of 2012. These trends are also expected to continue in 2013.
Legal and Regulatory Environment
The financial services industry is subject to the potential for increased regulation in the U.S. and abroad. The businesses conducted by our S&P Ratings segment are, in certain cases, regulated under the Credit Rating Agency Reform Act of 2006, the U.S. Securities Exchange Act of 1934 and/or the laws of the states or other jurisdictions in which they conduct business.
30
Standard & Poor’s Ratings Services is a credit rating agency that is registered with the SEC as a Nationally Recognized Statistical Rating Organization (“NRSRO”). The SEC first began designating NRSROs in 1975 for use of their credit ratings in the determination of capital charges for registered brokers and dealers under the SEC’s Net Capital Rule.
The “Credit Rating Agency Reform Act of 2006” (the “Act”) created a new SEC registration system for rating agencies that choose to register as NRSROs. Under the Act, the SEC is given authority and oversight of NRSROs and can censure NRSROs, revoke their registration or limit or suspend their registration in certain cases. The rules implemented by the SEC pursuant to the Act address, among other things, prevention or misuse of material non-public information, conflicts of interest and improving transparency of ratings performance and methodologies. The public portions of the current version of S&P Ratings’s Form NRSRO are available on S&P Rating’s Web site.
Outside the U.S., regulators and government officials have been implementing formal oversight of credit rating agencies. S&P Ratings is subject to regulations in several foreign jurisdictions in which it operates and continues to work closely with regulators globally, including the International Organization of Securities Commissions, the European Securities and Markets Authority and others to promote the global consistency of regulatory requirements. S&P Ratings expects regulators in additional countries to introduce new regulations in the future.
We have reviewed the new laws, regulations and rules which have been adopted and have implemented, or are planning to implement, changes as required. We do not believe that such new laws, regulations or rules will have a materially adverse effect on our financial condition or results of operations. Other laws, regulations and rules relating to credit rating agencies are being considered by local, national, foreign and multinational bodies and are likely to continue to be considered in the future, including provisions seeking to reduce regulatory and investor reliance on credit ratings, rotation of credit rating agencies and liability standards applicable to credit rating agencies. The impact on us of the adoption of any such laws, regulations or rules remains uncertain, but could increase the costs and legal risks relating to S&P Rating’s rating activities.
For a further discussion of competitive and other risks inherent in the S&P Ratings business, see Item 1a,
Risk Factors Specific to our Standard & Poor’s Ratings Segment
, in this Form 10-K.
In the normal course of business both in the U.S. and abroad, the Company and its subsidiaries are defendants in numerous legal proceedings and are involved, from time to time, in governmental and self-regulatory agency proceedings which may result in adverse judgments, damages, fines or penalties. Also, various governmental and self-regulatory agencies regularly make inquiries and conduct investigations concerning compliance with applicable laws and regulations.
See Note 13 –
Commitments and Contingencies
to our consolidated financial statements for further discussion.
S&P Capital IQ
S&P Capital IQ's portfolio of products brings together integrated data sets, indices, research, and analytic insights in an integrated desktop solution to serve multiple investor segments across the financial community. In addition, the segment has products that integrates its content for delivery to the financial market via feeds, as well as through on-demand and customizable delivery tools. Specific products include:
|
•
|
Capital IQ - a product suite that provides data, analytics and third-party research for global financial professionals;
|
|
•
|
Global Credit Portal - a web-based solution that provides real-time credit research, market information and risk analytics, which includes RatingsDirect®;
|
|
•
|
Global Data Solutions - combines high-quality, multi-asset class and market data to help professional investors, traders, and analysts meet the new analytical, risk management, regulatory and front-to-back office operation requirement, which includes RatingsXpress®; and
|
|
•
|
investment research products.
|
31
|
(in millions)
|
Years ended December 31,
|
% Change
|
||||||||||||||||
|
|
2012
|
2011
|
2010
|
’12 vs ’11
|
’11 vs ’10
|
|||||||||||||
|
Revenue
|
$
|
1,124
|
|
$
|
1,031
|
|
$
|
916
|
|
9
|
%
|
13
|
%
|
|||||
|
Subscription revenue
|
$
|
1,014
|
|
$
|
922
|
|
$
|
812
|
|
10
|
%
|
14
|
%
|
|||||
|
Non-subscription revenue
|
$
|
110
|
|
$
|
109
|
|
$
|
104
|
|
1
|
%
|
5
|
%
|
|||||
|
Domestic revenue
|
$
|
749
|
|
$
|
693
|
|
$
|
622
|
|
8
|
%
|
11
|
%
|
|||||
|
International revenue
|
$
|
375
|
|
$
|
338
|
|
$
|
294
|
|
11
|
%
|
15
|
%
|
|||||
|
Operating profit
|
$
|
208
|
|
$
|
214
|
|
$
|
171
|
|
(3
|
)%
|
25
|
%
|
|||||
|
% Operating margin
|
19
|
%
|
21
|
%
|
19
|
%
|
||||||||||||
Revenue
2012
Revenue grew compared to 2011, primarily due to growth at Capital IQ, Global Data Solutions and the recent acquisitions of R² Technologies, QuantHouse and CMA.
The increase at Capital IQ was driven by market share gains and increased contract values for existing accounts, however headcount reductions in the financial services industry have tempered growth. The number of clients have still increased 7% from 2011 and the spend from the top accounts continues to grow. The client increase includes a certain percentage of clients on TheMarkets.com platform that have been migrated to the Capital IQ platform. The subscription base for the Global Credit Portal increased slightly as difficult market conditions due to budget constraints and reductions in headcount across the customer base affected revenue in 2012. Clients continue to reduce staff levels to manage their spending levels and layoffs have continued to be announced through the fourth quarter of 2012.
The subscription base for Global Data Solutions is growing from new client relationships and expanded relationships into existing accounts as the number of RatingsXpress® customers have increased 10% in 2012 as compared to 2011. However, average contract values for those customers have declined due to customer budget constraints amidst difficult market conditions. Client cancellations have also been higher than in the prior year due to increased merger and acquisition activity during the year that caused those clients to reevaluate their subscriptions.
Traditionally, revenue has been primarily domestic, however, due to increases in Europe for the subscription base for RatingsXpress®, continued sales efforts of the Capital IQ desktop in Europe and Asia and recent acquisitions in Europe, international growth continued to occur throughout 2012.
2011
Revenue grew compared to 2010, primarily due to platform enhancements resulting in market share gains and increased contract values for existing accounts at Capital IQ; the acquisition of TheMarkets.com in September 2010; and growth in the subscription base, both in new clients and in further expanding the existing customer base for the Global Credit Portal, which includes RatingsDirect®. Global Data Solutions also contributed to the increase driven primarily by growth in the subscription base from new client relationships and expanded relationships into existing accounts.
Capital IQ continued to have significant client growth as the number of clients increased 14% in 2011 as compared to 2010. Traditionally, subscription revenue has been primarily domestic, however, due to the continued enhancements of the Capital IQ international database, strong sales for the Global Credit Portal and RatingsXpress®, particularly in Europe, double-digit international growth occurred in 2011.
Operating Profit
2012
Operating profit decreased slightly as compared to 2011. 2012 was significantly impacted by restructuring charges of $19 million recorded in the second half of 2012 consisting of employee severance costs related to a workforce reduction of approximately 150 positions. The 2012 acquisitions also contributed to the decrease, particularly due to amortization charges relating to the intangible assets. Also impacting operating profit were staff increases, primarily in developing regions, increased technology costs to support
32
the growth in the employee base and costs to further develop our content and software. These decreases were partially offset by the increase in revenue discussed above and a favorable impact from foreign exchange rates of $7 million.
2011
Operating profit increased compared to 2010, primarily due to increases in the subscription base for the Global Credit Portal and Global Data Solutions and strong results in our CUSIP business. In addition, growth at Capital IQ and the acquisition of TheMarkets.com contributed to the increase. These increases were partially offset by higher personnel costs and staff increases internationally, mainly in India, and additional costs to build out our integrated data feed within Global Data Solutions and costs to further develop our infrastructure.
Industry Highlights and Outlook
The segment is focused on integrating and evolving its assets and capabilities into one scaled business that offers unique, high-value offerings across all asset classes. S&P Capital IQ made significant progress in building new functionality filling critical capability gaps to bolster their foundation for future growth. Specific strategic acquisitions included:
|
•
|
In February 2012, we completed the acquisition of R² Technologies, a provider of advanced risk and scenario-based analytics to traders, portfolio and risk managers for pricing, hedging and capital management across asset classes, allowing us to offer an integrated view of market and credit risks across asset classes.
|
|
•
|
In April 2012, we completed the acquisition of QuantHouse, an independent global provider of end-to-end systematic low-latency market data solutions, allowing us to offer unique real-time monitors, derived data sets and analytics as well as the ability to package and resell this data as part of a core solution.
|
|
•
|
In June 2012, we completed the acquisition of CMA, a provider of independent data in the over-the-counter markets.
|
As a result of our focus on integration and these acquisitions, demand is expected to continue to increase for our Capital IQ and data and information offerings. Enhancements to the segments content and platforms will be a key focus in 2013. In addition, growing the client base will be another important area of focus. As the segment increases the integration of their services on their delivery platforms, specifically, RatingsDirect® on the Capital IQ platform and the delivery of RatingsXpress®, and continues to bring new analytic and data solutions to the marketplace, they expect additional customer growth to occur.
Legal and Regulatory Environment
The financial services industry is subject to the potential for increased regulation in the U.S. and abroad. The businesses conducted by S&P Capital IQ are in certain cases regulated under the U.S. Investment Advisers Act of 1940, the U.S. Securities Exchange Act of 1934 and/or the laws of the states or other jurisdictions in which they conduct business.
The markets for financial research, investment and advisory services are very competitive. S&P Capital IQ competes domestically and internationally on the basis of a number of factors, including the quality of its research and advisory services, client service, reputation, price, geographic scope, range of products and services, and technological innovation.
On November 17, 2009, the European Commission, Directorate-General for Competition (“EC”) sent a Statement of Objections (“SO”) to the Company outlining the EC’s preliminary view that Standard & Poor’s CUSIP Service Bureau (an S&P Rating’s brand that is part of S&P Capital IQ) was abusing its position as the sole-appointed National Numbering Agency for U.S. securities by requiring financial institutions and Information Service Providers to pay licensing fees for the use of International Securities Identification Numbers. As set forth in the SO, the EC’s preliminary view was that this behavior amounted to unfair pricing and infringed European competition law. The Company believed these preliminary views were erroneous but in order to resolve the investigation, proposed a set of commitments to the EC. Following market testing of the commitments, further discussions between the parties and some limited modifications to the commitments, the EC on November 15, 2011 accepted and made those commitments legally binding and ended its investigation. Pursuant to the commitments, CUSIP Global Services will create and distribute a new data feed of US International Securities Identification Numbers tailored specifically to the institutions for their use within the European Economic Area within five months.
See Note 13 –
Commitments and Contingencies
to our consolidated financial statements for further discussion.
S&P DJ Indices
S&P DJ Indices is a global index provider that maintains a wide variety of investable and benchmark indices to meet an array of investor needs. S&P DJ Indices generates subscription revenue but primarily derives revenue from non-subscription products
33
based on the S&P and Dow Jones Indices, specifically through fees on exchange traded funds ("ETFs"), mutual funds and insurance assets. Additionally, fees are generated through both over-the-counter derivative issuances as well as exchange traded derivatives.
S&P DJ Indices includes our transaction in June 2012 with CME Group, Inc. and CME Group Index Services LLC to form a new company, S&P Dow Jones Indices LLC. The combination of these businesses created the world's largest provider of financial market indices.
S&P DJ Indices generate revenue through investment vehicles such as:
|
•
|
exchange traded funds, which are based on the S&P and Dow Jones Indices and generate revenue through fees based on assets and underlying funds;
|
|
•
|
index-related licensing fees, which are generally either annual fees based on assets under management or flat fees for over-the-counter derivatives and retail-structured products;
|
|
•
|
data subscriptions, which support index fund management, portfolio analytics and research; and
|
|
•
|
listed derivatives, which generate royalties based on trading volumes of derivatives contracts.
|
|
(in millions)
|
Years ended December 31,
|
% Change
|
||||||||||||||
|
|
2012
|
2011
|
2010
|
’12 vs ’11
|
’11 vs ’10
|
|||||||||||
|
Revenue
|
$
|
388
|
|
$
|
323
|
|
$
|
273
|
|
20%
|
18%
|
|||||
|
Subscription revenue
|
$
|
87
|
|
$
|
71
|
|
$
|
64
|
|
22%
|
11%
|
|||||
|
Non-subscription revenue
|
$
|
301
|
|
$
|
252
|
|
$
|
209
|
|
19%
|
20%
|
|||||
|
Domestic revenue
|
$
|
301
|
|
$
|
248
|
|
$
|
207
|
|
21%
|
20%
|
|||||
|
International revenue
|
$
|
87
|
|
$
|
75
|
|
$
|
66
|
|
16%
|
14%
|
|||||
|
Operating profit
|
$
|
212
|
|
$
|
189
|
|
$
|
144
|
|
12%
|
31%
|
|||||
|
Less: net income attributable to noncontrolling interests
|
$
|
34
|
|
$
|
—
|
|
$
|
—
|
|
|
|
|||||
|
Net operating profit
|
$
|
178
|
|
$
|
189
|
|
$
|
144
|
|
(6)%
|
31%
|
|||||
|
% Operating margin
|
55
|
%
|
59
|
%
|
53
|
%
|
||||||||||
|
% Net operating margin
|
46
|
%
|
59
|
%
|
53
|
%
|
||||||||||
Revenue
2012
Revenue at S&P DJ Indices increased 20%, primarily due to the S&P Dow Jones Indices LLC joint venture. Excluding revenue from the joint venture, S&P DJ Indices revenue increased 3% primarily due to higher average levels of assets under management for ETF products and higher mutual fund revenue. Both domestic and international revenue increased over prior year primarily due to the joint venture. Excluding this impact, domestic revenue was still up, however international decreased due lower reported over-the-counter derivative trades in Europe.
85 new ETFs were launched during 2012 compared to 77 launched during 2011. Assets under management for ETFs rose 28% to $402 billion in 2012 from $314 billion in 2011.
2011
Revenue at S&P DJ Indices increased 18% due to a mix of higher average levels of assets under management for ETF products linked to our indices, significant increases in exchange-traded derivatives from higher trading volumes as a result of market volatility in 2011, increased mutual fund revenue, higher sales from over-the-counter derivatives, and 77 new ETFs launched during 2011. Assets under management for ETFs rose 5% to $314 billion in 2011 from $300 billion in 2010. Also contributing to the increase in subscription revenue were higher data and custom index sales.
34
Operating Profit
2012
Operating profit increased due to the increase in revenue discussed above, partially offset by the impact of expenses for our S&P Dow Jones Indices LLC joint venture, higher data fees and additional personal costs for targeted staff increases.
2011
Operating profit increased compared to 2010, primarily due to growth in ETF products.
Industry Highlights and Outlook
Products at S&P DJ Indices should continue to benefit in 2013 as ETF assets grow globally. The segment will also continue to launch new ETFs where they see a customer interest or opportunity. The business will continue to benefit from our S&P Dow Jones Indices LLC joint venture. The combination of these businesses creates the world's largest provider of financial market indices. This group also should see opportunities in products internationally, primarily in the Middle East and Asia.
Legal and Regulatory Environment
The financial services industry is subject to the potential for increased regulation in the U.S. and abroad. The businesses conducted by S&P DJ Indices are in certain cases regulated under the U.S. Investment Advisers Act of 1940, the U.S. Securities Exchange Act of 1934 and/or the laws of the states or other jurisdictions in which they conduct business.
The markets for index providers are very competitive. S&P DJ Indices competes domestically and internationally on the basis of a number of factors, including the quality of its benchmark indices, client service, reputation, price, geographic scope, range of products and services, and technological innovation.
See Note 13 –
Commitments and Contingencies
to our consolidated financial statements for further discussion.
Commodities & Commercial
C&C consists of business-to-business companies specializing in the commodities and commercial markets that deliver their customers access to high-value information, data, analytic services and pricing benchmarks. C&C includes such brands as Platts, JDPA, McGraw-Hill Construction and
Aviation Week
. The Broadcasting Group had historically been part of C&C. As of December 30, 2011 we completed the sale of the Broadcasting Group and in accordance with the presentation of the Broadcasting Group as discontinued operations, the results of operations for the year ended December 31, 2011 and prior periods presented have been reclassified to reflect this change. See Note 2 –
Growth and Value Plan & Discontinued Operations
to our consolidated financial statements for further discussion.
The C&C business is driven by the need for high-value information and transparency in a variety of industries. Our commodities business serves producers, traders and intermediaries within energy, metals and agriculture markets. Our commercial business serves professionals and executives within automotive, construction, aerospace and defense and marketing / research services markets. C&C delivers premier content that is deeply embedded in customer workflows and decision making processes.
Commodities revenue is generated primarily through the following sources:
|
•
|
subscriptions to its real-time news and price information; end-of-day market data; newsletters and reports; and geospatial data and maps;
|
|
•
|
and trading services related products.
|
Commercial revenue is generated primarily from digital and print subscriptions for a variety of products, proprietary research and consulting, ad claims and industry conferences.
35
|
(in millions)
|
Years ended December 31,
|
% Change
|
||||||||||||||||
|
|
2012
|
2011
|
2010
|
’12 vs ’11
|
’11 vs ’10
|
|||||||||||||
|
Revenue:
|
||||||||||||||||||
|
Commodities
|
$
|
489
|
|
$
|
419
|
|
$
|
344
|
|
17
|
%
|
22
|
%
|
|||||
|
Commercial
|
484
|
|
477
|
|
467
|
|
1
|
%
|
2
|
%
|
||||||||
|
Total revenue
|
$
|
973
|
|
$
|
896
|
|
$
|
811
|
|
9
|
%
|
10
|
%
|
|||||
|
Subscription revenue
|
$
|
622
|
|
$
|
562
|
|
$
|
498
|
|
11
|
%
|
13
|
%
|
|||||
|
Non-subscription revenue
|
$
|
351
|
|
$
|
334
|
|
$
|
313
|
|
5
|
%
|
7
|
%
|
|||||
|
Domestic revenue
|
$
|
563
|
|
$
|
551
|
|
$
|
531
|
|
2
|
%
|
4
|
%
|
|||||
|
International revenue
|
$
|
410
|
|
$
|
345
|
|
$
|
280
|
|
19
|
%
|
23
|
%
|
|||||
|
Operating profit
|
$
|
248
|
|
$
|
180
|
|
$
|
153
|
|
38
|
%
|
18
|
%
|
|||||
|
% Operating margin
|
26
|
%
|
20
|
%
|
19
|
%
|
||||||||||||
Revenue
2012
Revenue at C&C increased primarily due to continued demand for Platts’ proprietary content and by growth across our automotive sectors at JDPA, primarily in Asia and the United States.
Platts’ revenue grew by 17% and represents 50% of total C&C revenue with growth across all regions. This growth was mainly driven by strength in Platts’ market data and price assessment products across all commodity sectors, led by petroleum and natural gas. While petroleum is still the biggest driver, the revenue mix is becoming more diversified as metals and global trading services have shown strong growth year over year. Excluding recent acquisitions, annualized contract values for Platts' top 250 customers have increased 13% as compared to 2011 and those customers represent approximately 67% of Platts' total annualized contract value. The two strategic acquisitions in 2011, Bentek Energy LLC in January and Steel Business Briefing Group in July, also contributed to the increase in revenue at Platts. All commodity sectors have also shown very strong renewal rates for subscription products during the year.
JDPA had revenue growth across their global automotive sectors, including automotive consulting and their Power Information Network® ("PIN"). PIN provides real-time automotive information and decision-support tools based on the collection and analysis of daily new- and used-vehicle retail transaction data from thousands of automotive franchises. Growth occurred across the majority of regions, most notably China and Japan. International growth was 14% and represents 37% of the total revenue. Also contributing to the increase at JDPA was an increase in their roundtables and events as well as licensing revenue associated with syndicated studies.
Partially offsetting these increases at C&C were declines in McGraw-Hill Construction as market contraction declines have continued to impact revenue; however growth related to new products and enhancements is gaining traction.
2011
Revenue increased primarily by strong demand for Platts’ proprietary content and by growth in syndicated studies and consulting services across automotive and non-automotive sectors. Foreign exchange rates had a favorable impact of $4 million on revenue.
Platts’ revenue grew by more than 21% and represents nearly 47% of total C&C revenue for the year. Platts’ global commodities products, primarily related to petroleum and natural gas, have shown strong growth as continued volatility in commodity prices drove the need for market information. The spread between the highest and lowest price for crude oil futures during 2011 was approximately 63% greater than the spread in 2010. The growth rate in international revenue across the commodities products was strong across all regions, particularly in Asia and Europe.
International growth for automotive revenue was strong in 2011 across all regions. Also contributing to revenue growth for 2011 was the final transitioning during 2010 of certain automotive syndicated studies to an online service platform. This resulted in revenue that was deferred in 2010 to be recognized in 2011.
36
Partially offsetting these increases at C&C were decreases in the construction business as market weakness has continued to impact revenue, although the rate of decline is moderating.
Operating Profit
2012
Operating profit increased primarily due to the revenue growth described above and a strong focus on the management of expenses across the brands. The nonrecurring items that impacted operating profit in the prior year also contributed to the increase in 2012. Offsetting the increase were additional costs primarily related to revenue growth, additional incentive costs at Platts and JDPA and restructuring charges of $12 million that were recorded in the second half of 2012, consisting primarily of employee severance costs related to a workforce reduction of approximately 110 positions.
2011
The key drivers for operating profit growth in the segment for 2011 were the revenue growth mentioned above along with lower compensation costs as a result of restructuring actions. Restructuring charges of $6 million were recorded in the fourth quarter, consisting primarily of employee severance costs related to a workforce reduction of approximately 100 positions. Additional costs from our acquisition of Bentek Energy LLC and Steel Business Briefing Group partially offset the growth in the segment. Also impacting operating profit were a number of nonrecurring items consisting of a write-off of deferred costs recorded in prior periods, offset by a gain on the sale of our interest in LinkedIn Corporation as discussed in more detail in Note 3 –
Acquisitions and Divestitures
to our consolidated financial statements, and insurance recoveries on costs incurred in prior periods.
Industry Highlights and Outlook
C&C expects to continue to invest in digital capabilities that will enable our brands to become more integrated, compete more effectively in the marketplace, and create a foundation for the development of new products and revenue streams. The segment expects to further expand its presence in selected markets and geographies to help drive growth.
The continuing growth in oil demand and the uncertainty of supply causes volatility in energy prices, which will drive market participant demand for Platts' proprietary content, including news, price assessments and analytics. The International Energy Agency projects that world oil consumption will rise to 90.8 million barrels per day, a gain of 0.9 million barrels per day compared to 2012. In 2013, Platts will continue to invest in technology and customer engagement activities to drive additional revenue growth across all commodity sectors. They will also continue to leverage the capabilities and content from recent acquisitions and expend into adjacent markets. Similar to 2012, they will continue to introduce a number of new products and price assessments within all commodity sectors. Platts will also continue to ensure readiness for adherence to the International Organization of Securities Commissions ("IOSCO") Principles and while the Principles focus on oil, Platts is ensuring that processes related to all commodities are in adherence with the Principles.
Demand for our automotive studies is driven by the performance of the automotive industry. In 2012, global and U.S. light vehicle sales increased approximately 5% and 13%, respectively, compared to 2011, with growth across all major markets except Europe. For 2013, JDPA projects growth for global and U.S. light vehicles sales of 3% and 4%, respectively. In 2013, JDPA will strive to grow the core business by strengthening their benchmark studies, leveraging new initiatives to drive operational efficiencies and enhance customer delivery and increasing the distribution of their syndicated studies. International growth will also be a key focus as they will look to extend their product offerings by expanding their PIN business to China and Brazil.
Demand for our construction offerings is primarily dependent on the non-residential construction industry. Non-residential building construction in 2012 was down 9% from a year ago due to 12% decline for the institutional side and a 33% decline for manufacturing facilities. Residential building climbed 29%, compared to 2011. Non-building construction in 2012 increased 2% from prior year, as a 9% increase in electric utilities offset a 1% decline in public works. In 2013, total construction starts are forecast to rise 7% with residential building up 24% and the commercial building sector up 14%. McGraw-Hill Construction will continue to focus on expense management in 2013 and new business growth should begin to outweigh the historical loss of certain strategic accounts.
37
Legal and Regulatory Environment
Our commodities business is subject to the potential for increased regulation in the U.S. and abroad. On October 5, 2012, IOSCO issued its final report to the G-20, including Principles for Oil Price Reporting Agencies, which sets out principles IOSCO states are intended to enhance the reliability of oil price assessments that are referenced in derivative contracts subject to regulation by IOSCO members. On January 9, 2013, IOSCO held a meeting with the Price Reporting Organizations to discuss implementation of the Principles for Oil Price Reporting Agencies. At the meeting, Platts was able to obtain clarification from IOSCO on its expectations for voluntary implementation of the Principles by Platts and the other PROs and, with that clarification, Platts believes that the Principles will not have a significant negative impact on its ongoing business operations.
See Note 13 –
Commitments and Contingencies
to our consolidated financial statements for additional matters and discussion.
LIQUIDITY AND CAPITAL RESOURCES
We continue to maintain a strong financial position. Our primary source of funds for operations is cash from our businesses and our core businesses have been strong cash generators. In 2013, cash on hand, cash flows from operations and availability under our existing credit facility are expected to be sufficient to meet any additional operating and recurring cash needs into the foreseeable future. We use our cash for a variety of needs, including among others: ongoing investments in our businesses, strategic acquisitions, share repurchases, dividends, repayment of debt, capital expenditures and investment in our infrastructure.
Cash Flow Overview
Cash and cash equivalents were
$760 million
as of December 31, 2012, a decrease of
$75 million
as compared to December 31, 2011, and consisted of domestic cash of $136 million and cash held abroad of $624 million. Typically, cash held outside the U.S. is anticipated to be utilized to fund international operations or to be reinvested outside of the U.S., as a significant portion of our opportunities for growth in the coming years is expected to be abroad. In the event funds from international operations are needed to fund operations in the U.S., we would be required to accrue for and pay taxes in the U.S. to repatriate these funds.
|
(in millions)
|
Years ended December 31,
|
|||||||||||
|
|
2012
|
2011
|
2010
|
|||||||||
|
Net cash provided by (used for):
|
||||||||||||
|
Operating activities from continuing operations
|
$
|
747
|
|
$
|
924
|
|
$
|
704
|
|
|||
|
Investing activities from continuing operations
|
(247
|
)
|
(271
|
)
|
(386
|
)
|
||||||
|
Financing activities from continuing operations
|
(905
|
)
|
(1,660
|
)
|
(530
|
)
|
||||||
In 2012, we generated free cash flow of
$626 million
versus
$809 million
in 2011, a decrease of $
183 million
. The decline is primarily due to one-time costs related to the Growth and Value Plan and a $150 million fourth quarter pension contribution. Free cash flow is a non-GAAP financial measure and reflects our cash flow provided by operating activities less capital expenditures and dividends and other payments paid to noncontrolling interests. Capital expenditures include purchases of property and equipment and additions to technology projects. See “Reconciliation of Non-GAAP Financial Information” below for a reconciliation of cash flow provided by operating activities, the most directly comparable U.S. GAAP financial measure, to free cash flow.
Operating activities
Cash provided by operating activities decreased $
177 million
to $
747 million
in 2012, mainly due to an increase in accounts receivable as a result of higher billings at S&P Ratings, S&P Indices and S&P Capital IQ in 2012 compared to 2011 and higher pension plan contributions in 2012, partially offset by higher income taxes payable as the IRS extended the due date for the fourth quarter estimated income tax payment until the first quarter of 2013, and higher payments to vendors in 2011.
Cash provided by operating activities increased $
220 million
to $
924 million
in 2011, mainly due to higher pension plan contributions in 2010, an increase in accounts receivable in 2010 due to higher billings in 2010 compared to 2009 and a tax refund in 2011 that did not occur in 2010, partially offset by increased payments to vendors, higher payments for incentives and higher legal and third-party consulting payments in 2011. Higher incentive compensation payments in 2011 reflect greater achievement against targeted results in 2010 as compared to achievement against targets in 2009.
Investing activities
Our cash outflows from investing activities are primarily for acquisitions and capital expenditures, while cash inflows are primarily from dispositions.
38
Cash used for investing activities decreased $
24 million
to $
247 million
for 2012, primarily due to a higher amount of cash inflows from short-term investments and a lower amount of cash paid for acquisitions, partially offset by lower proceeds from dispositions due to the sale of our interest in LinkedIn Corporation in 2011.
Cash used for investing activities decreased $
115 million
to $
271 million
in 2011, primarily due to higher amount of cash paid for acquisitions in 2010.
Refer to Note 3 –
Acquisitions and Divestitures
to our consolidated financial statements for further information.
Financing activities
Our cash outflows from financing activities consist primarily of share repurchases, dividends and repayment of debt, while cash inflows are primarily inflows from commercial paper borrowings and proceeds from the exercise of stock options.
Cash used for financing activities decreased $
755 million
to $
905 million
in 2012. The decrease is primarily attributable to a decrease in cash used for share repurchases, partially offset by an increase in dividend paid to shareholders due to a special dividend payment in 2012.
Cash used for financing activities increased $
1,130 million
to $
1,660 million
in 2011. The increase is primarily attributable to cash used to repurchase shares.
During 2012, we used cash to repurchase 6.8 million shares for $295 million, including commissions. The average price per share, excluding commissions, was $50.35. During 2011, we utilized cash to repurchase 34.7 million shares for $1.5 billion, including commissions. The average price per share, excluding commissions, was $40.48. The average prices per share for 2012 and 2011 does not include the accelerated share repurchase transactions as discussed in more detail in Note 9 –
Equity
to our consolidated financial statements. We repurchased 8.7 million shares for $256 million, including commissions, during 2010. The average price per share, excluding commissions, was $29.37. The repurchased shares may be used for general corporate purposes, including the issuance of shares for stock compensation plans and to offset the dilutive effect of the exercise of employee stock options.
On June 29, 2011, the Board of Directors approved a new stock repurchase program authorizing the purchase of up to 50 million shares (the “2011 Repurchase Program”), which was approximately 17% of the total shares of our outstanding common stock at that time. The 2011 Repurchase Program has no expiration date and purchases under this program may be made from time to time on the open market and in private transactions, depending on market conditions. As of December 31, 2012, 16.9 million shares remained available under the 2011 Repurchase Program.
Discontinued Operations
Cash flows from discontinued operations reflects the classification of MHE and the Broadcasting Group as discontinued operations as discussed in Note 2 –
Growth and Value Plan & Discontinued Operations
.
Cash flows provided by operating activities from discontinued operations increased $100 million to $520 million in 2012 and decreased $333 million to $420 million in 2011. The increase in 2012 is primarily due to a reduction in accounts receivables as a result of lower sales year over year at MHE, higher unearned revenue at SEG and lower inventory purchases. The decrease in 2011 is primarily due to lower operating results, higher extended payment terms provided on a specific state adoption in the fourth quarter of 2011 and slower cash collections, accelerated payments to vendors and lower incentive compensation based on lower performance.
Cash (used for) provided by investing activities from discontinued operations decreased $223 million to $(198) million in 2012 and increased $237 million to $25 million in 2011, primarily due to proceeds of $216 million received for the sale of the Broadcasting Group in 2011.
Cash used for financing activities increased $8 million to $12 million in 2012 and 2011 was comparable with 2010.
Additional Financing
We have the ability to borrow a total of $1.2 billion through our commercial paper program, which is supported by our $1.2 billion three-year credit agreement (our “credit facility”) that will terminate on July 30, 2013. We pay a commitment fee of 15 to 35 basis points for our credit facility, depending on our credit rating, whether or not amounts have been borrowed, and currently pay a commitment fee of 20 basis points. The interest rate on borrowings under our credit facility is, at our option, calculated using rates
39
that are primarily based on either the prevailing London Inter-Bank Offer Rate, the prime rate determined by the administrative agent or the Federal funds rate. For certain borrowings under our credit facility there is also a spread based on our credit rating added to the applicable rate.
In connection with the special dividend in the amount of $2.50 per share on our common stock we utilized our commercial paper program in December of 2012, and as a result, commercial paper borrowings outstanding as of December 31, 2012 totaled
$457 million
with an average interest rate and term of 0.48% and 28 days. As of December 31, 2012, we can borrow $743 million in additional funds through the commercial paper program. There were no outstanding commercial paper borrowings as of December 31, 2011.
Our credit facility contains certain covenants. The only financial covenant requires that our indebtedness to cash flow ratio, as defined in our credit facility, is not greater than 4 to 1, and this covenant has never been exceeded.
On February 7, 2013, Fitch Ratings downgraded our credit rating to BBB+ from A- and placed our ratings on Rating Watch Negative. On February 14, 2013, Moody's Investors Service downgraded our credit rating from A3 to Baa2 with negative outlook. There has been no change to our short-term / commercial paper ratings of F2 from Fitch Ratings and P-2 from Moody's Investors Service.
Dividends
On January 30, 2013, the Board of Directors approved an increase in the quarterly common stock dividend from $0.255 per share to $0.28 per share.
On December 6, 2012, our Board of Directors approved a special dividend in the amount of $2.50 per share on our common stock, payable on December 27, 2012 to shareholders on record on December 18, 2012.
Contractual Obligations
We typically have various contractual obligations, which are recorded as liabilities in our consolidated balance sheets, while other items, such as certain purchase commitments and other executory contracts, are not recognized, but are disclosed herein. For example, we are contractually committed to contracts for information-technology outsourcing, certain enterprise-wide information-technology software licensing and maintenance and make certain minimum lease payments for the use of property under operating lease agreements.
We believe that the amount of cash and cash equivalents on hand, cash flow expected from operations and availability under our credit facility will be adequate for us to execute our business strategy and meet anticipated requirements for lease obligations, capital expenditures, working capital and debt service for 2013.
The following table summarizes our significant contractual obligations and commercial commitments as of December 31, 2012, over the next several years that relate to our continuing operations. Additional details regarding these obligations are provided in the notes to our consolidated financial statements, as referenced in the footnotes to the table:
|
(in millions)
|
Less than 1
Year
|
1-3 Years
|
4-5 Years
|
After 5
Years
|
Total
|
||||||||||||||
|
Debt:
1
|
|
|
|||||||||||||||||
|
Principal payments
|
$
|
457
|
|
$
|
—
|
|
$
|
400
|
|
$
|
399
|
|
$
|
1,256
|
|
||||
|
Interest payments
|
52
|
|
100
|
|
100
|
|
524
|
|
776
|
|
|||||||||
|
Operating leases
2
|
166
|
|
290
|
|
244
|
|
372
|
|
1,072
|
|
|||||||||
|
Purchase obligations and other
3
|
113
|
|
182
|
|
151
|
|
110
|
|
556
|
|
|||||||||
|
Total contractual cash obligations
|
$
|
788
|
|
$
|
572
|
|
$
|
895
|
|
$
|
1,405
|
|
$
|
3,660
|
|
||||
|
1
|
Our debt obligations are described in Note 6 –
Debt
to our consolidated financial statements.
|
|
2
|
Amounts shown include taxes and escalation payments, see Note 13 –
Commitments and Contingencies
to our consolidated financial statements for further discussion on our operating lease obligations
.
|
|
3
|
Other consists primarily of commitments for unconditional purchase obligations in contracts for information-technology outsourcing and certain enterprise-wide information-technology software licensing and maintenance.
|
40
As of December 31, 2012, we had $74 million of liabilities for unrecognized tax benefits. We have excluded the liabilities for unrecognized tax benefits from our contractual obligations table because reasonable estimates of the timing of cash settlements with the respective taxing authorities are not practicable.
We make contributions to our pension and postretirement plans in order to satisfy minimum funding requirements as well as additional contributions that we consider appropriate to improve the funded status of our plans. During 2012, we contributed $193 million and $12 million to our domestic and international retirement and postretirement plans, respectively. Expected employer contributions in 2013 are $30 million and $12 million for our domestic and international retirement and postretirement plans, respectively. In 2013, we may elect to make additional non-required contributions depending on investment performance and the pension plan status. See Note 7 –
Employee Benefits
to our consolidated financial statements for further discussion.
Off-Balance Sheet Arrangements
As of December 31, 2012 and 2011, we did not have any relationships with unconsolidated entities, such as entities often referred to as specific purpose or variable interest entities where we are the primary beneficiary, which would have been established for the purpose of facilitating off-balance sheet arrangements or other contractually narrow or limited purposes. As such we are not exposed to any financial liquidity, market or credit risk that could arise if we had engaged in such relationships.
RECONCILIATION OF NON-GAAP FINANCIAL INFORMATION
Free cash flow is a non-GAAP financial measure and reflects our cash flow provided by operating activities less capital expenditures and dividends and other payments paid to noncontrolling interests. Capital expenditures include purchases of property and equipment and additions to technology projects. Our cash flow provided by operating activities is the most directly comparable U.S. GAAP financial measure to free cash flow.
We believe the presentation of free cash flow allows our investors to evaluate the cash generated from our underlying operations in a manner similar to the method used by management. We use free cash flow to conduct and evaluate our business because we believe it typically presents a more conservative measure of cash flows since capital expenditures and dividends and other payments paid to noncontrolling interests are considered a necessary component of ongoing operations. Free cash flow is useful for management and investors because it allows management and investors to evaluate the cash available to us to service debt, make strategic acquisitions and investments, repurchase stock and fund ongoing operation and working capital needs.
The presentation of free cash flow is not intended to be considered in isolation or as a substitute for the financial information prepared and presented in accordance with U.S. GAAP. Free cash flow, as we calculate it, may not be comparable to similarly titled measures employed by other companies. The following table presents a reconciliation of our cash flow provided by operating activities to free cash flow:
|
(in millions)
|
Years ended December 31,
|
|||||||||||
|
|
2012
|
2011
|
2010
|
|||||||||
|
Cash provided by operating activities
|
$
|
747
|
|
$
|
924
|
|
$
|
704
|
|
|||
|
Capital expenditures
|
(97
|
)
|
(92
|
)
|
(86
|
)
|
||||||
|
Dividends and other payments paid to noncontrolling interests
|
(24
|
)
|
(23
|
)
|
(34
|
)
|
||||||
|
Free cash flow
|
$
|
626
|
|
$
|
809
|
|
$
|
584
|
|
|||
CRITICAL ACCOUNTING ESTIMATES
Our discussion and analysis of our financial condition and results of operations is based upon our consolidated financial statements, which have been prepared in accordance with U.S. GAAP. The preparation of these financial statements requires us to make estimates and judgments that affect the reported amounts of assets, liabilities, revenues and expenses and related disclosure of contingent assets and liabilities. Unless otherwise indicated, all discussion and analysis of our financial condition and results of operations relate to our continuing operations.
On an ongoing basis, we evaluate our estimates and assumptions, including those related to revenue recognition, allowance for doubtful accounts, valuation of long-lived assets, goodwill and other intangible assets, pension plans, incentive compensation and stock-based compensation, income taxes, contingencies and redeemable noncontrolling interests. We base our estimates on historical experience, current developments and on various other assumptions that we believe to be reasonable under these circumstances, the results of which form the basis for making judgments about carrying values of assets and liabilities that cannot readily be determined from other sources. There can be no assurance that actual results will not differ from those estimates.
41
Management considers an accounting estimate to be critical if it required assumptions to be made that were uncertain at the time the estimate was made and changes in the estimate or different estimates could have a material effect on our results of operations. Management has discussed the development and selection of our critical accounting estimates with the Audit Committee of our Board of Directors. The Audit Committee has reviewed our disclosure relating to them in this MD&A.
We believe the following critical accounting policies require us to make significant judgments and estimates in the preparation of our consolidated financial statements:
Revenue recognition
Revenue is recognized as it is earned when goods are shipped to customers or services are rendered. We consider amounts to be earned once evidence of an arrangement has been obtained, services are performed, fees are fixed or determinable and collectability is reasonably assured. Revenue relating to products that provide for more than one deliverable is recognized based upon the relative fair value to the customer of each deliverable as each deliverable is provided. Revenue relating to agreements that provide for more than one service is recognized based upon the relative fair value to the customer of each service component as each component is earned. If the fair value to the customer for each service is not objectively determinable, we make our best estimate of the services’ stand alone selling price and recognize revenue as earned as the services are delivered. The allocation of consideration received from multiple element arrangements that involve initial assignment of ratings and the future surveillance of ratings is determined through an analysis that considers cash consideration that would be received for instances when the service components are sold separately. In such cases, we defer portions of rating fees that we estimate will be attributed to future surveillance and recognize the deferred revenue ratably over the estimated surveillance periods. Advertising revenue is recognized when the page is run. Subscription income is recognized over the related subscription period.
For the years ended December 31, 2012, 2011 and 2010, no significant changes have been made to the underlying assumptions related to estimates of revenue or the methodologies applied. Based on our current outlook these assumptions are not expected to significantly change in 2013.
Allowance for doubtful accounts
The allowance for doubtful accounts reserve methodology is based on historical analysis, a review of outstanding balances and current conditions. In determining these reserves, we consider, amongst other factors, the financial condition and risk profile of our customers, areas of specific or concentrated risk as well as applicable industry trends or market indicators. The impact on operating profit for a one percentage point change in the allowance for doubtful accounts is approximately $10 million.
For the years ended December 31, 2012, 2011 and 2010, we made no material changes in our assumptions regarding the determination of the allowance for doubtful accounts. Based on our current outlook these assumptions are not expected to significantly change in 2013.
Accounting for the impairment of long-lived assets (including other intangible assets)
We evaluate long-lived assets for impairment whenever events or changes in circumstances indicate that the carrying amount of an asset may not be recoverable. Upon such an occurrence, recoverability of assets to be held and used is measured by comparing the carrying amount of an asset to current forecasts of undiscounted future net cash flows expected to be generated by the asset. If the carrying amount of the asset exceeds its estimated future cash flows, an impairment charge is recognized equal to the amount by which the carrying amount of the asset exceeds the fair value of the asset. For long-lived assets held for sale, assets are written down to fair value, less cost to sell. Fair value is determined based on market evidence, discounted cash flows, appraised values or management’s estimates, depending upon the nature of the assets. There were no material impairments of long-lived assets for the years ended December 31, 2012, 2011 and 2010.
Goodwill and indefinite-lived intangible assets
Goodwill represents the excess of purchase price and related costs over the value assigned to the net tangible and identifiable intangible assets of businesses acquired. As of December 31, 2012 and 2011, the carrying value of goodwill and other indefinite-lived intangible assets was $2.1 billion and $1.3 billion, respectively. Goodwill and other intangible assets with indefinite lives are not amortized, but instead are tested for impairment annually during the fourth quarter each year or more frequently if events or changes in circumstances indicate that the asset might be impaired.
Goodwill
As part of our annual impairment test of our 4 reporting units, we initially perform a qualitative analysis evaluating whether any events and circumstances occurred that provide evidence that it is more likely than not that the fair value of any of our reporting units is less than its carrying amount. Our qualitative assessment included, but was not limited to, consideration of macroeconomic conditions, industry and market conditions, cost factors, cash flows, changes in key Company personnel and our share price. If,
42
based on our evaluation of the events and circumstances that occurred during the year we do not believe that it is more likely than not that the fair value of any of our reporting units is less than its carrying amount, no quantitative impairment test is performed. Conversely, if the results of our qualitative assessment determine that it is more likely than not that the fair value of any of our reporting units is less than its respective carrying amount we perform a two-step quantitative impairment test. For 2012, based on our qualitative assessments, with the exception of impairments in our SEG reporting unit previously discussed under the heading, “
Discontinued Operations”
, we determined that it is more likely than not that our reporting units’ fair value was greater than their respective carrying amounts. Our qualitative assessment included, but was not limited to, consideration of macroeconomic conditions, industry and market conditions, cost factors, cash flows, changes in key Company personnel and our share price.
If the fair value of the reporting unit is less than the carrying value, a second step is performed which compares the implied fair value of the reporting unit's goodwill to the carrying value of the goodwill. The implied fair value of the goodwill is determined based on the difference between the fair value of the reporting unit and the net fair value of the identifiable assets and liabilities of the reporting unit. If the implied fair value of the goodwill is less than the carrying value, the difference is recognized as an impairment charge.
Indefinite-Lived Intangible Assets
We evaluate the recoverability of indefinite-lived intangible assets by first performing a qualitative analysis evaluating whether any events and circumstances occurred that provide evidence that it is more likely than not that the indefinite-lived asset is impaired. If, based on our evaluation of the events and circumstances that occurred during the year we do not believe that it is more likely than not that the indefinite-lived asset is impaired, no quantitative impairment test is performed. Conversely, if the results of our qualitative assessment determine that it is more likely than not that the indefinite-lived asset is impaired a quantitative impairment test is performed. If necessary, the impairment test is performed by comparing the estimated fair value of the intangible asset to its carrying value. If the indefinite-lived intangible asset carrying value exceeds its fair value, an impairment analysis is performed using the income approach. The fair value of loss is recognized in an amount equal to that excess. Significant judgments inherent in these analyses include estimating the amount and timing of future cash flows and the selection of appropriate discount rates, royalty rates and long-term growth rate assumptions. Changes in these estimates and assumptions could materially affect the determination of fair value for this indefinite-lived intangible asset and could result in an impairment charge, which could be material to our financial position and results of operations.
We performed our impairment assessment of goodwill and indefinite-lived intangible assets at our S&P Ratings, S&P Capital IQ, S&P DJ Indices and C&C operating segments and concluded that no impairment existed for the years ended December 31, 2012, 2011, and 2010.
Retirement plans and postretirement healthcare and other benefits
Our employee pension and other postretirement benefit costs and obligations are dependent on assumptions concerning the outcome of future events and circumstances, including compensation increases, long-term return on pension plan assets, healthcare cost trends, discount rates and other factors. In determining such assumptions, we consult with outside actuaries and other advisors where deemed appropriate. In accordance with relevant accounting standards, if actual results differ from our assumptions, such differences are deferred and amortized over the estimated future working life of the plan participants. While we believe that the assumptions used in these calculations are reasonable, differences in actual experience or changes in assumptions could affect the expense and liabilities related to our pension and other postretirement benefits.
The following is a discussion of some significant assumptions that we make in determining costs and obligations for pension and other postretirement benefits:
|
•
|
Discount rate assumptions are based on current yields on high-grade corporate long-term bonds.
|
|
•
|
Salary growth assumptions are based on our long-term actual experience and future outlook.
|
|
•
|
Healthcare cost trend assumptions are based on historical market data, the near-term outlook and an assessment of likely long-term trends.
|
|
•
|
The expected return on assets assumption is calculated based on the plan’s asset allocation strategy and projected market returns over the long-term.
|
43
Our discount rate and return on asset assumptions used to determine the net periodic pension and postretirement benefit cost on our U.S. retirement plans are as follows:
|
|
Retirement Plans
|
Postretirement Plans
|
||||||||||||||||
|
January 1
|
2013
|
2012
|
2011
|
2013
|
2012
|
2011
|
||||||||||||
|
Discount rate
|
4.1
|
%
|
5.1
|
%
|
5.4
|
%
|
3.45
|
%
|
4.45
|
%
|
4.65
|
%
|
||||||
|
Return on assets
|
7.25
|
%
|
7.75
|
%
|
8.0
|
%
|
||||||||||||
|
Weighted-average healthcare cost rate
|
7.5
|
%
|
8.0
|
%
|
8.0
|
%
|
||||||||||||
Stock-based compensation
Stock-based compensation expense is measured at the grant date based on the fair value of the award and is recognized over the requisite service period, which typically is the vesting period. Stock-based compensation is classified as both operating-related expense and selling and general expense in our consolidated statements of income.
We use a lattice-based option-pricing model to estimate the fair value of options granted. The following assumptions were used in valuing the options granted (in 2012, stock options were not granted as part of employees' total stock-based incentive awards):
|
|
Years ended December 31,
|
|||||
|
|
2011
|
2010
|
||||
|
Risk-free average interest rate
|
0.2 - 3.5%
|
0.3-4.2%
|
||||
|
Dividend yield
|
2.5 - 3.0%
|
2.9-3.1%
|
||||
|
Volatility
|
21 - 51%
|
28 - 60%
|
||||
|
Expected life (years)
|
6.1 - 6.2
|
5.8 - 7.0
|
||||
|
Weighted-average grant-date fair value per option
|
$10.61
|
$10.02
|
||||
Because lattice-based option-pricing models incorporate ranges of assumptions, those ranges are disclosed. These assumptions are based on multiple factors, including historical exercise patterns, post-vesting termination rates, expected future exercise patterns and the expected volatility of our stock price. The risk-free interest rate is the imputed forward rate based on the U.S. Treasury yield at the date of grant. We use the historical volatility of our stock price over the expected term of the options to estimate the expected volatility. The expected term of options granted is derived from the output of the lattice model and represents the period of time that options granted are expected to be outstanding.
Income taxes
Deferred tax assets and liabilities are recognized for the future tax consequences attributable to differences between financial statement carrying amounts of existing assets and liabilities and their respective tax bases. Deferred tax assets and liabilities are measured using enacted tax rates expected to be applied to taxable income in the years in which those temporary differences are expected to be recovered or settled. We recognize liabilities for uncertain tax positions taken or expected to be taken in income tax returns. Accrued interest and penalties related to unrecognized tax benefits are recognized in interest expense and operating expense, respectively.
Judgment is required in determining our provision for income taxes, deferred tax assets and liabilities and unrecognized tax benefits. In determining the need for a valuation allowance, the historical and projected financial performance of the operation that is recording a net deferred tax asset is considered along with any other pertinent information.
We file income tax returns in the U.S. federal jurisdiction, various states, and foreign jurisdictions, and we are routinely under audit by many different tax authorities. We believe that our accrual for tax liabilities is adequate for all open audit years based on our assessment of many factors including past experience and interpretations of tax law. This assessment relies on estimates and assumptions and may involve a series of complex judgments about future events. It is possible that examinations will be settled prior to December 31, 2013. If any of these tax audit settlements do occur within that period we would make any necessary adjustments to the accrual for unrecognized tax benefits. Until formal resolutions are reached between us and the tax authorities, the determination of a possible audit settlement range with respect to the impact on unrecognized tax benefits is not practicable. On the basis of present information, it is our opinion that any assessments resulting from the current audits will not have a material effect on our consolidated financial statements.
We have determined that the undistributed earnings of our foreign subsidiaries are permanently reinvested within those foreign operations. Accordingly, we have not provided deferred income taxes on these indefinitely reinvested earnings. A future distribution
44
by the foreign subsidiaries of these earnings could result in additional tax liability, which may be material to our future reported results, financial position and cash flows.
For the years ended December 31, 2012, 2011, and 2010, we made no material changes in our assumptions regarding the determination of the provision for income taxes. However, certain events could occur that would materially affect our estimates and assumptions regarding deferred taxes. Changes in current tax laws and applicable enacted tax rates could affect the valuation of deferred tax assets and liabilities, thereby impacting our income tax provision.
Contingencies
We are subject to a number of lawsuits and claims that arise in the ordinary course of business. We recognize a liability for such contingencies when both (a) information available prior to issuance of the financial statements indicates that it is probable that a liability had been incurred at the date of the financial statements and (b) the amount of loss can reasonably be estimated. We continually assess the likelihood of any adverse judgments or outcomes to our contingencies, as well as potential amounts or ranges of probable losses, and recognize a liability, if any, for these contingencies based on an analysis of each matter with the assistance of outside legal counsel and, if applicable, other experts. Because many of these matters are resolved over long periods of time, our estimate of liabilities may change due to new developments, changes in assumptions or changes in our strategy related to the matter.
Redeemable Noncontrolling Interest
The fair value component of the redeemable noncontrolling interest in S&P DJ Indices business is based on a combination of an income and market valuation approach. Our income and market valuation approaches may incorporate Level 3 measures for instances when observable inputs are not available, including assumptions related to expected future net cash flows, long-term growth rates, the timing and nature of tax attributes, and the redemption features.
RECENT
ACCOUNTING STANDARDS
See Note 1 –
Accounting Policies
, to the consolidated financial statements for a detailed description of recent accounting standards. We do not expect these recent accounting standards to have a material impact on our results of operations, financial condition, or liquidity in future periods.
Item 7a
. Quantitative and Qualitative Disclosures about Market Risk
There have been no significant changes in our exposure to market risk during the year ended December 31, 2012. Our exposure to market risk includes changes in foreign exchange rates. We have operations in various foreign countries where the functional currency is primarily the local currency. For international operations that are determined to be extensions of the parent company, the U.S. dollar is the functional currency. We typically have naturally hedged positions in most countries from a local currency perspective with offsetting assets and liabilities. As of December 31, 2012, we have entered into an immaterial amount of foreign exchange forwards to hedge the effect of adverse fluctuations in foreign currency exchange rates. We have not entered into any derivative financial instruments for speculative purposes.
45
Item 8.
Consolidated Financial Statements and Supplementary Data
TABLE OF CONTENTS
|
|
Page
|
46
Report of Independent Registered Public Accounting Firm
The Board of Directors and Shareholders of The McGraw-Hill Companies, Inc.
We have audited the accompanying consolidated balance sheets of The McGraw-Hill Companies, Inc. as of December 31, 2012 and 2011, and the related consolidated statements of income, comprehensive income, cash flows and equity for each of the three years in the period ended December 31, 2012. Our audits also included the financial statement schedule listed in Item 15(a)(2). These financial statements and schedule are the responsibility of the Company’s management. Our responsibility is to express an opinion on these financial statements and schedule based on our audits.
We conducted our audits in accordance with the standards of the Public Company Accounting Oversight Board (United States). Those standards require that we plan and perform the audit to obtain reasonable assurance about whether the financial statements are free of material misstatement. An audit includes examining, on a test basis, evidence supporting the amounts and disclosures in the financial statements. An audit also includes assessing the accounting principles used and significant estimates made by management, as well as evaluating the overall financial statement presentation. We believe that our audits provide a reasonable basis for our opinion.
In our opinion, the financial statements referred to above present fairly, in all material respects, the consolidated financial position of The McGraw-Hill Companies, Inc. at December 31, 2012 and 2011, and the consolidated results of its operations and its cash flows for each of the three years in the period ended December 31, 2012, in conformity with U.S. generally accepted accounting principles. Also, in our opinion, the related financial statement schedule, when considered in relation to the basic financial statements taken as a whole, presents fairly in all material respects the information set forth therein.
We also have audited, in accordance with the standards of the Public Company Accounting Oversight Board (United States), The McGraw-Hill Companies, Inc.’s internal control over financial reporting as of December 31, 2012, based on criteria established in Internal Control – Integrated Framework issued by the Committee of Sponsoring Organizations of the Treadway Commission and our report dated
February 28, 2013
expressed an unqualified opinion thereon.
/s/
ERNST & YOUNG LLP
New York, New York
February 28, 2013
47
Report of Independent Registered Public Accounting Firm
The Board of Directors and Shareholders of The McGraw-Hill Companies, Inc.
We have audited The McGraw-Hill Companies, Inc.’s internal control over financial reporting as of December 31, 2012, based on criteria established in Internal Control – Integrated Framework issued by the Committee of Sponsoring Organizations of the Treadway Commission (the COSO criteria). The McGraw-Hill Companies, Inc.’s management is responsible for maintaining effective internal control over financial reporting, and for its assessment of the effectiveness of internal control over financial reporting included in the accompanying Management’s Annual Report on its Responsibility for the Company’s Financial Statements and Internal Control Over Financial Reporting. Our responsibility is to express an opinion on the Company’s internal control over financial reporting based on our audit.
We conducted our audit in accordance with the standards of the Public Company Accounting Oversight Board (United States). Those standards require that we plan and perform the audit to obtain reasonable assurance about whether effective internal control over financial reporting was maintained in all material respects. Our audit included obtaining an understanding of internal control over financial reporting, assessing the risk that a material weakness exists, testing and evaluating the design and operating effectiveness of internal control based on the assessed risk, and performing such other procedures as we considered necessary in the circumstances. We believe that our audit provides a reasonable basis for our opinion.
A company’s internal control over financial reporting is a process designed to provide reasonable assurance regarding the reliability of financial reporting and the preparation of financial statements for external purposes in accordance with generally accepted accounting principles. A company’s internal control over financial reporting includes those policies and procedures that (1) pertain to the maintenance of records that, in reasonable detail, accurately and fairly reflect the transactions and dispositions of the assets of the company; (2) provide reasonable assurance that transactions are recorded as necessary to permit preparation of financial statements in accordance with generally accepted accounting principles, and that receipts and expenditures of the company are being made only in accordance with authorizations of management and directors of the company; and (3) provide reasonable assurance regarding prevention or timely detection of unauthorized acquisition, use, or disposition of the company’s assets that could have a material effect on the financial statements.
Because of its inherent limitations, internal control over financial reporting may not prevent or detect misstatements. Also, projections of any evaluation of effectiveness to future periods are subject to the risk that controls may become inadequate because of changes in conditions, or that the degree of compliance with the policies or procedures may deteriorate.
In our opinion, The McGraw-Hill Companies, Inc. maintained, in all material respects, effective internal control over financial reporting as of December 31, 2012, based on the COSO criteria.
We also have audited, in accordance with the standards of the Public Company Accounting Oversight Board (United States), the consolidated balance sheets of The McGraw-Hill Companies, Inc. as of December 31, 2012 and 2011, and the related consolidated statements of income, comprehensive income, cash flows and equity for each of the three years in the period ended December 31, 2012 of The McGraw-Hill Companies, Inc. and our report dated
February 28, 2013
expressed an unqualified opinion thereon.
/s/
ERNST & YOUNG LLP
New York, New York
February 28, 2013
48
|
(in millions, except per share data)
|
Years ended December 31,
|
||||||||||
|
|
2012
|
2011
|
2010
|
||||||||
|
Revenue
|
$
|
4,450
|
|
$
|
3,954
|
|
$
|
3,639
|
|
||
|
Expenses:
|
|||||||||||
|
Operating-related expenses
|
1,460
|
|
1,392
|
|
1,206
|
|
|||||
|
Selling and general expenses
|
1,709
|
|
1,387
|
|
1,318
|
|
|||||
|
Depreciation
|
74
|
|
78
|
|
75
|
|
|||||
|
Amortization of intangibles
|
48
|
|
33
|
|
21
|
|
|||||
|
Total expenses
|
3,291
|
|
2,890
|
|
2,620
|
|
|||||
|
Other income
|
52
|
|
13
|
|
7
|
|
|||||
|
Operating profit
|
1,211
|
|
1,077
|
|
1,026
|
|
|||||
|
Interest expense, net
|
81
|
|
77
|
|
83
|
|
|||||
|
Income from continuing operations before taxes on income
|
1,130
|
|
1,000
|
|
943
|
|
|||||
|
Provision for taxes on income
|
404
|
|
374
|
|
344
|
|
|||||
|
Income from continuing operations
|
726
|
|
626
|
|
599
|
|
|||||
|
(Loss) income from discontinued operations, net of tax
|
(234
|
)
|
308
|
|
252
|
|
|||||
|
Net income
|
492
|
|
934
|
|
851
|
|
|||||
|
Less: net income from continuing operations attributable to noncontrolling interests
|
(50
|
)
|
(19
|
)
|
(19
|
)
|
|||||
|
Less: net income from discontinued operations attributable to noncontrolling interests
|
(5
|
)
|
(4
|
)
|
(4
|
)
|
|||||
|
Net income attributable to The McGraw-Hill Companies, Inc.
|
$
|
437
|
|
$
|
911
|
|
$
|
828
|
|
||
|
Amounts attributable to The McGraw-Hill Companies, Inc. common shareholders:
|
|||||||||||
|
Income from continuing operations
|
$
|
676
|
|
$
|
607
|
|
$
|
581
|
|
||
|
(Loss) income from discontinued operations
|
(239
|
)
|
304
|
|
247
|
|
|||||
|
Net income
|
$
|
437
|
|
$
|
911
|
|
$
|
828
|
|
||
|
Earnings per share attributable to The McGraw-Hill Companies, Inc. common shareholders:
|
|||||||||||
|
Basic:
|
|||||||||||
|
Income from continuing operations
|
$
|
2.43
|
|
$
|
2.03
|
|
$
|
1.88
|
|
||
|
(Loss) income from discontinued operations
|
(0.86
|
)
|
1.02
|
|
0.80
|
|
|||||
|
Net income
|
$
|
1.57
|
|
$
|
3.05
|
|
$
|
2.68
|
|
||
|
Diluted:
|
|||||||||||
|
Income from continuing operations
|
$
|
2.37
|
|
$
|
2.00
|
|
$
|
1.86
|
|
||
|
(Loss) income from discontinued operations
|
(0.84
|
)
|
1.00
|
|
0.79
|
|
|||||
|
Net income
|
$
|
1.53
|
|
$
|
3.00
|
|
$
|
2.65
|
|
||
|
Average number of common shares outstanding:
|
|||||||||||
|
Basic
|
278.6
|
|
298.1
|
|
309.4
|
|
|||||
|
Diluted
|
284.6
|
|
303.6
|
|
312.2
|
|
|||||
|
Dividend declared per common share
|
$
|
1.02
|
|
$
|
1.00
|
|
$
|
0.94
|
|
||
|
Special dividend declared per common share
|
$
|
2.50
|
|
$
|
—
|
|
$
|
—
|
|
||
See accompanying notes to the consolidated financial statements.
49
Consolidated Statements of Comprehensive Income
|
(in millions)
|
Years ended December 31,
|
||||||||||
|
2012
|
2011
|
2010
|
|||||||||
|
Net income
|
$
|
492
|
|
$
|
934
|
|
$
|
851
|
|
||
|
Other comprehensive income:
|
|||||||||||
|
Foreign currency translation adjustment
|
29
|
|
(35
|
)
|
(9
|
)
|
|||||
|
Income tax effect
|
(19
|
)
|
11
|
|
13
|
|
|||||
|
10
|
|
(24
|
)
|
4
|
|
||||||
|
Pension and other postretirement benefit plans
|
(164
|
)
|
(45
|
)
|
(37
|
)
|
|||||
|
Income tax effect
|
63
|
|
9
|
|
11
|
|
|||||
|
(101
|
)
|
(36
|
)
|
(26
|
)
|
||||||
|
Unrealized (loss) gain on investment and forward exchange contract
|
(4
|
)
|
(12
|
)
|
5
|
|
|||||
|
Income tax effect
|
2
|
|
4
|
|
(2
|
)
|
|||||
|
(2
|
)
|
(8
|
)
|
3
|
|
||||||
|
Comprehensive income
|
399
|
|
866
|
|
832
|
|
|||||
|
Less: comprehensive income attributable to nonredeemable noncontrolling interests
|
(20
|
)
|
(13
|
)
|
(27
|
)
|
|||||
|
Less: comprehensive income attributable to redeemable noncontrolling interests
|
(34
|
)
|
—
|
|
—
|
|
|||||
|
Comprehensive income attributable to The McGraw-Hill Companies, Inc.
|
$
|
345
|
|
$
|
853
|
|
$
|
805
|
|
||
See accompanying notes to the consolidated financial statements.
50
|
(in millions)
|
December 31,
|
||||||
|
|
2012
|
2011
|
|||||
|
ASSETS
|
|||||||
|
Current assets:
|
|||||||
|
Cash and equivalents
|
$
|
760
|
|
$
|
835
|
|
|
|
Short-term investments
|
1
|
|
29
|
|
|||
|
Accounts receivable, net of allowance for doubtful accounts: 2012 - $54; 2011 - $29
|
954
|
|
702
|
|
|||
|
Deferred income taxes
|
117
|
|
110
|
|
|||
|
Prepaid and other current assets
|
127
|
|
128
|
|
|||
|
Assets held for sale
|
1,940
|
|
2,508
|
|
|||
|
Total current assets
|
3,899
|
|
4,312
|
|
|||
|
Property and equipment:
|
|||||||
|
Buildings and leasehold improvements
|
439
|
|
435
|
|
|||
|
Equipment and furniture
|
701
|
|
729
|
|
|||
|
Total property and equipment
|
1,140
|
|
1,164
|
|
|||
|
Less: accumulated depreciation
|
(772
|
)
|
(791
|
)
|
|||
|
Property and equipment, net
|
368
|
|
373
|
|
|||
|
Goodwill
|
1,438
|
|
1,104
|
|
|||
|
Other intangible assets, net
|
1,081
|
|
427
|
|
|||
|
Other non-current assets
|
266
|
|
404
|
|
|||
|
Total assets
|
$
|
7,052
|
|
$
|
6,620
|
|
|
|
LIABILITIES AND EQUITY
|
|||||||
|
Current liabilities:
|
|||||||
|
Accounts payable
|
$
|
249
|
|
$
|
223
|
|
|
|
Accrued compensation and contributions to retirement plans
|
453
|
|
415
|
|
|||
|
Short-term debt
|
457
|
|
400
|
|
|||
|
Income taxes currently payable
|
158
|
|
33
|
|
|||
|
Unearned revenue
|
1,229
|
|
1,187
|
|
|||
|
Other current liabilities
|
457
|
|
392
|
|
|||
|
Liabilities held for sale
|
664
|
|
719
|
|
|||
|
Total current liabilities
|
3,667
|
|
3,369
|
|
|||
|
Long-term debt
|
799
|
|
798
|
|
|||
|
Pension and other postretirement benefits
|
529
|
|
511
|
|
|||
|
Other non-current liabilities
|
407
|
|
358
|
|
|||
|
Total liabilities
|
5,402
|
|
5,036
|
|
|||
|
Redeemable noncontrolling interest
|
810
|
|
—
|
|
|||
|
Commitments and contingencies (Note 13)
|
|
|
|||||
|
Equity:
|
|||||||
|
Common stock, $1 par value: authorized - 600 million shares; issued - 412 million shares in 2012 and 2011
|
412
|
|
412
|
|
|||
|
Additional paid-in capital
|
492
|
|
94
|
|
|||
|
Retained income
|
6,525
|
|
7,667
|
|
|||
|
Accumulated other comprehensive loss
|
(517
|
)
|
(425
|
)
|
|||
|
Less: common stock in treasury - at cost: 2012 - 133 million shares; 2011 - 136 million shares
|
(6,145
|
)
|
(6,240
|
)
|
|||
|
Total equity – controlling interests
|
767
|
|
1,508
|
|
|||
|
Total equity – noncontrolling interests (including 2012 - $25 and 2011 - $33 attributable to discontinued operations)
|
73
|
|
76
|
|
|||
|
Total equity
|
840
|
|
1,584
|
|
|||
|
Total liabilities and equity
|
$
|
7,052
|
|
$
|
6,620
|
|
|
See accompanying notes to the consolidated financial statements.
51
|
(in millions)
|
Years ended December 31,
|
||||||||||
|
|
2012
|
2011
|
2010
|
||||||||
|
Operating Activities:
|
|||||||||||
|
Net income
|
$
|
492
|
|
$
|
934
|
|
$
|
851
|
|
||
|
Less: (loss) income from discontinued operations
|
(234
|
)
|
308
|
|
252
|
|
|||||
|
Net income from continuing operations
|
726
|
|
626
|
|
599
|
|
|||||
|
Adjustments to reconcile income from continuing operations to cash provided by operating activities from continuing operations:
|
|||||||||||
|
Depreciation (including amortization of technology projects)
|
93
|
|
93
|
|
87
|
|
|||||
|
Amortization of intangibles
|
48
|
|
33
|
|
21
|
|
|||||
|
Provision for losses on accounts receivable
|
32
|
|
6
|
|
13
|
|
|||||
|
Deferred income taxes
|
53
|
|
17
|
|
33
|
|
|||||
|
Stock-based compensation
|
93
|
|
77
|
|
51
|
|
|||||
|
Gain on dispositions
|
—
|
|
(13
|
)
|
(7
|
)
|
|||||
|
Other
|
16
|
|
63
|
|
33
|
|
|||||
|
Changes in operating assets and liabilities, net of effect of acquisitions and dispositions:
|
|||||||||||
|
Accounts receivable
|
(239
|
)
|
14
|
|
(73
|
)
|
|||||
|
Prepaid and other current assets
|
3
|
|
(16
|
)
|
(8
|
)
|
|||||
|
Accounts payable and accrued expenses
|
60
|
|
(29
|
)
|
100
|
|
|||||
|
Unearned revenue
|
17
|
|
44
|
|
57
|
|
|||||
|
Other current liabilities
|
(70
|
)
|
(52
|
)
|
(16
|
)
|
|||||
|
Net change in prepaid/accrued income taxes
|
119
|
|
55
|
|
(47
|
)
|
|||||
|
Net change in other assets and liabilities
|
(204
|
)
|
6
|
|
(139
|
)
|
|||||
|
Cash provided by operating activities from continuing operations
|
747
|
|
924
|
|
704
|
|
|||||
|
Investing Activities:
|
|||||||||||
|
Capital expenditures
|
(97
|
)
|
(92
|
)
|
(86
|
)
|
|||||
|
Acquisitions, including contingent payments, net of cash acquired
|
(177
|
)
|
(194
|
)
|
(327
|
)
|
|||||
|
Proceeds from dispositions
|
—
|
|
21
|
|
25
|
|
|||||
|
Changes in short-term investments
|
27
|
|
(6
|
)
|
2
|
|
|||||
|
Cash used for investing activities from continuing operations
|
(247
|
)
|
(271
|
)
|
(386
|
)
|
|||||
|
Financing Activities:
|
|||||||||||
|
Additions to short-term debt
|
457
|
|
—
|
|
—
|
|
|||||
|
Payments on senior notes
|
(400
|
)
|
—
|
|
—
|
|
|||||
|
Dividends paid to shareholders
|
(984
|
)
|
(296
|
)
|
(292
|
)
|
|||||
|
Dividends and other payments paid to noncontrolling interests
|
(24
|
)
|
(23
|
)
|
(34
|
)
|
|||||
|
Repurchase of treasury shares
|
(295
|
)
|
(1,500
|
)
|
(256
|
)
|
|||||
|
Exercise of stock options
|
299
|
|
139
|
|
50
|
|
|||||
|
Excess tax benefits from share-based payments
|
42
|
|
20
|
|
2
|
|
|||||
|
Cash used for financing activities from continuing operations
|
(905
|
)
|
(1,660
|
)
|
(530
|
)
|
|||||
|
Effect of exchange rate changes on cash from continuing operations
|
5
|
|
(10
|
)
|
(15
|
)
|
|||||
|
Cash used for continuing operations
|
(400
|
)
|
(1,017
|
)
|
(227
|
)
|
|||||
|
Discontinued Operations:
|
|||||||||||
|
Cash provided by operating activities
|
520
|
|
420
|
|
753
|
|
|||||
|
Cash (used for) provided by investing activities
|
(198
|
)
|
25
|
|
(212
|
)
|
|||||
|
Cash used for financing activities
|
(12
|
)
|
(4
|
)
|
(3
|
)
|
|||||
|
Effect of exchange rate changes on cash
|
3
|
|
(5
|
)
|
4
|
|
|||||
|
Effect of change in cash and equivalents
|
12
|
|
—
|
|
(17
|
)
|
|||||
|
Cash provided by discontinued operations
|
325
|
|
436
|
|
525
|
|
|||||
|
Net change in cash and equivalents
|
(75
|
)
|
(581
|
)
|
298
|
|
|||||
|
Cash and equivalents at beginning of year
|
835
|
|
1,416
|
|
1,118
|
|
|||||
|
Cash and equivalents at end of year
|
$
|
760
|
|
$
|
835
|
|
$
|
1,416
|
|
||
|
Cash paid during the year for:
|
|||||||||||
|
Interest (including discontinued operations)
|
$
|
77
|
|
$
|
71
|
|
$
|
71
|
|
||
|
Income taxes (including discontinued operations)
|
$
|
243
|
|
$
|
452
|
|
$
|
410
|
|
||
See accompanying notes to the consolidated financial statements.
52
Consolidated Statements of Equity
|
(in millions)
|
Common Stock $1 par
|
Additional Paid-in Capital
|
Retained Income
|
Accumulated
Other Comprehensive Loss |
Less: Treasury Stock
|
Total MHP Equity
|
Noncontrolling Interests
|
Total Equity
|
|||||||||||||||||||||||
|
Balance as of December 31, 2009
|
$
|
412
|
|
$
|
5
|
|
$
|
6,523
|
|
$
|
(344
|
)
|
$
|
4,749
|
|
$
|
1,847
|
|
$
|
82
|
|
$
|
1,929
|
|
|||||||
|
Comprehensive income
|
828
|
|
(23
|
)
|
805
|
|
27
|
|
832
|
|
|||||||||||||||||||||
|
Dividends
|
(294
|
)
|
(294
|
)
|
(19
|
)
|
(313
|
)
|
|||||||||||||||||||||||
|
Noncontrolling interest transactions
|
(8
|
)
|
(8
|
)
|
(9
|
)
|
(17
|
)
|
|||||||||||||||||||||||
|
Share repurchases
|
256
|
|
(256
|
)
|
(256
|
)
|
|||||||||||||||||||||||||
|
Employee stock plans, net of tax benefit
|
70
|
|
(47
|
)
|
117
|
|
117
|
|
|||||||||||||||||||||||
|
Balance as of December 31, 2010
|
$
|
412
|
|
$
|
67
|
|
$
|
7,057
|
|
$
|
(367
|
)
|
$
|
4,958
|
|
$
|
2,211
|
|
$
|
81
|
|
$
|
2,292
|
|
|||||||
|
Comprehensive income
|
911
|
|
(58
|
)
|
853
|
|
13
|
|
866
|
|
|||||||||||||||||||||
|
Dividends
|
(301
|
)
|
(301
|
)
|
(12
|
)
|
(313
|
)
|
|||||||||||||||||||||||
|
Noncontrolling interest transactions
|
(3
|
)
|
(3
|
)
|
(4
|
)
|
(7
|
)
|
|||||||||||||||||||||||
|
Share repurchases
|
(73
|
)
|
1,427
|
|
(1,500
|
)
|
(1,500
|
)
|
|||||||||||||||||||||||
|
Employee stock plans, net of tax benefit
|
103
|
|
(145
|
)
|
248
|
|
248
|
|
|||||||||||||||||||||||
|
Other
|
—
|
|
(2
|
)
|
(2
|
)
|
|||||||||||||||||||||||||
|
Balance as of December 31, 2011
|
$
|
412
|
|
$
|
94
|
|
$
|
7,667
|
|
$
|
(425
|
)
|
$
|
6,240
|
|
$
|
1,508
|
|
$
|
76
|
|
$
|
1,584
|
|
|||||||
|
Comprehensive income
1
|
437
|
|
(92
|
)
|
345
|
|
20
|
|
365
|
|
|||||||||||||||||||||
|
Dividends
|
(989
|
)
|
(989
|
)
|
(22
|
)
|
(1,011
|
)
|
|||||||||||||||||||||||
|
Noncontrolling interest transactions
|
350
|
|
(573
|
)
|
(223
|
)
|
|
|
(223
|
)
|
|||||||||||||||||||||
|
Share repurchases
|
50
|
|
345
|
|
(295
|
)
|
(3
|
)
|
(298
|
)
|
|||||||||||||||||||||
|
Employee stock plans, net of tax benefit
|
(2
|
)
|
(440
|
)
|
438
|
|
438
|
|
|||||||||||||||||||||||
|
Change in redemption value of redeemable noncontrolling interest
|
(17
|
)
|
(17
|
)
|
(17
|
)
|
|||||||||||||||||||||||||
|
Other
|
—
|
|
2
|
|
2
|
|
|||||||||||||||||||||||||
|
Balance as of December 31, 2012
|
$
|
412
|
|
$
|
492
|
|
$
|
6,525
|
|
$
|
(517
|
)
|
$
|
6,145
|
|
$
|
767
|
|
$
|
73
|
|
$
|
840
|
|
|||||||
|
1
|
Excludes
$34
million attributable to redeemable noncontrolling interest.
|
See accompanying notes to the consolidated financial statements.
53
Notes to the Consolidated Financial Statements
1. Accounting Policies
Nature of operations
The McGraw-Hill Companies, Inc. (together with its consolidated subsidiaries, the “Company,” the “Registrant,” “we,” “us” or “our”) is a leading content and analytics provider serving the capital, commodities and commercial markets. The capital markets include asset managers, banks, exchanges, issuers and financial advisors; the commodities markets include producers, traders and intermediaries within energy, metals, and agriculture; and the commercial markets include professionals and corporate executives within automotive, construction, aerospace and defense and marketing / research information services.
As a result of our joint venture between CME Group and Dow Jones & Company, Inc., to form a new company, S&P Dow Jones Indices LLC and how we are managing this company, combined with the formation of McGraw Hill Financial, we have separated our previously reported S&P Capital IQ / S&P Indices segment into two separate reportable segments. Our operations now consist of four reportable segments: Standard & Poor’s Ratings (“S&P Ratings”), S&P Capital IQ, S&P Dow Jones Indices ("S&P DJ Indices") and Commodities & Commercial (“C&C”). Our previously reported McGraw-Hill Education segment is reported as a discontinued operation as discussed in Note 2 –
Growth and Value Plan & Discontinued Operations
.
|
•
|
S&P Ratings is a provider of credit ratings, offering investors and market participants with information and independent ratings benchmarks.
|
|
•
|
S&P Capital IQ is a global provider of digital and traditional financial research and analytical tools, which integrate cross-asset analytics and desktop services.
|
|
•
|
S&P DJ Indices is a global leading index provider that maintains a wide variety of valuation and index benchmarks for investment advisors, wealth managers and institutional investors.
|
|
•
|
C&C consists of business-to-business companies specializing in commercial and commodities markets that deliver their customers access to high-value information, data, analytic services and pricing benchmarks.
|
See Note 12 –
Segment and Geographic Information
for further discussion on our operating segments, which are also our reportable segments.
Discontinued Operations
In determining whether a group of assets disposed or to be disposed of should be presented as a discontinued operation, we make a determination of whether the group of assets being disposed of comprises a component of the entity; that is, whether it has historic operations and cash flows that can be clearly distinguished both operationally and for financial reporting purposes. We also determine whether the cash flows associated with the group of assets have been or will be eliminated from our ongoing operations as a result of the disposal transaction and whether we will have significant continuing involvement in the operations of the group of assets after the disposal transaction. If we conclude that the cash flows have been eliminated and we have no significant continuing involvement, then the results of operations of the group of assets being disposed of (as well as any gain or loss on the disposal transaction) are aggregated for separate presentation apart from our continuing operating results in the consolidated financial statements. See Note 2 –
Growth and Value Plan & Discontinued Operations
for a summary of discontinued operations. Unless otherwise indicated, all disclosures and amounts in the notes to our consolidated financial statements relate to our continuing operations.
Changes in presentation
In the fourth quarter of 2012, we recorded a pre-tax gain of
$52
million within other income in the consolidated statement of income related to a change in our vacation policy. The change in our vacation policy modified the number of days
that employees are entitled to for unused vacation time upon termination of employment as they will only be paid for vacation days equivalent to what they have earned in the current year.
Principles of consolidation
The consolidated financial statements include the accounts of all subsidiaries and our share of earnings or losses of joint ventures and affiliated companies under the equity method of accounting. All significant intercompany accounts and transactions have been eliminated.
Use of estimates
The preparation of financial statements in conformity with generally accepted accounting principles in the United States of America requires management to make estimates and assumptions that affect the amounts reported in the financial statements and accompanying notes. Actual results could differ from those estimates.
54
Cash and cash equivalents
Cash and cash equivalents include ordinary bank deposits and highly liquid investments with original maturities of three months or less that consist primarily of money market funds with unrestricted daily liquidity and fixed term time deposits. Such investments and bank deposits are stated at cost, which approximates market value and were
$760 million
and
$835 million
as of December 31, 2012 and 2011, respectively. These investments are not subject to significant market risk.
Short-term investments
Short-term investments are securities with original maturities greater than
90 days
that are available for use in our operations in the next twelve months. The short-term investments, primarily consisting of certificates of deposit, are classified as held-to-maturity and therefore are carried at cost. Interest and dividends are recorded into income when earned.
Accounts receivable
Credit is extended to customers based upon an evaluation of the customer’s financial condition. Accounts receivable, which include billings consistent with terms of contractual arrangements, are recorded at net realizable value.
Allowance for doubtful accounts
The allowance for doubtful accounts reserve methodology is based on historical analysis, a review of outstanding balances and current conditions. In determining these reserves, we consider, amongst other factors, the financial condition and risk profile of our customers, areas of specific or concentrated risk as well as applicable industry trends or market indicators.
Deferred technology costs
We capitalize certain software development and website implementation costs. Capitalized costs only include incremental, direct costs of materials and services incurred to develop the software after the preliminary project stage is completed, funding has been committed and it is probable that the project will be completed and used to perform the function intended. Incremental costs are expenditures that are out-of-pocket to us and are not part of an allocation or existing expense base. Software development and website implementation costs are expensed as incurred during the preliminary project stage. Capitalized costs are amortized from the year the software is ready for its intended use over its estimated useful life,
three
to
seven
years, using the straight-line method. Periodically, we evaluate the amortization methods, remaining lives and recoverability of such costs. Capitalized software development and website implementation costs are included in other non-current assets and are presented net of accumulated amortization. Gross deferred technology costs were
$115 million
and
$90 million
as of December 31, 2012 and 2011, respectively. Accumulated amortization of deferred technology costs was
$58 million
and
$37 million
as of December 31, 2012 and 2011, respectively.
Fair Value
Certain assets and liabilities are required to be recorded at fair value and classified within a fair value hierarchy based on inputs used when measuring fair value. We have an immaterial amount of forward exchange contracts that are adjusted to fair value on a recurring basis.
Other financial instruments, including cash and equivalents and short-term investments, are recorded at cost, which approximates fair value because of the short-term maturity and highly liquid nature of these instruments. The fair value of our long-term debt borrowings were
$0.9
billion and
$1.3
billion as of December 31, 2012 and 2011, respectively, and was estimated based on quoted market prices.
Accounting for the impairment of long-lived assets (including other intangible assets)
We evaluate long-lived assets for impairment whenever events or changes in circumstances indicate that the carrying amount of an asset may not be recoverable. Upon such an occurrence, recoverability of assets to be held and used is measured by comparing the carrying amount of an asset to current forecasts of undiscounted future net cash flows expected to be generated by the asset. If the carrying amount of the asset exceeds its estimated future cash flows, an impairment charge is recognized equal to the amount by which the carrying amount of the asset exceeds the fair value of the asset. For long-lived assets held for sale, assets are written down to fair value, less cost to sell. Fair value is determined based on market evidence, discounted cash flows, appraised values or management’s estimates, depending upon the nature of the assets. There were no material impairments of long-lived assets for the years ended December 31, 2012, 2011 and 2010.
Goodwill and other indefinite-lived intangible assets
Goodwill represents the excess of purchase price and related costs over the value assigned to the net tangible and identifiable intangible assets of businesses acquired. Goodwill and other intangible assets with indefinite lives are not amortized, but instead are tested for impairment annually during the fourth quarter each year or more frequently if events or changes in circumstances indicate that the asset might be impaired. We have
four
reporting units with goodwill that are evaluated for impairment.
55
We initially perform a qualitative analysis evaluating whether any events and circumstances occurred or exist that provide evidence that it is more likely than not that the fair value of any of our reporting units is less than its carrying amount. If, based on our evaluation we do not believe that it is more likely than not that the fair value of any of our reporting units is less than its carrying amount, no quantitative impairment test is performed. Conversely, if the results of our qualitative assessment determine that it is more likely than not that the fair value of any of our reporting units is less than their respective carrying amounts we perform a two-step quantitative impairment test.
When conducting the first step of our two step impairment test to evaluate the recoverability of goodwill at the reporting unit level, the estimated fair value of the reporting unit is compared to its carrying value including goodwill. Fair value of the reporting units are estimated using the income approach, which incorporates the use of a discounted free cash flow (“DCF”) analyses and are corroborated using the market approach, which incorporates the use of revenue and earnings multiples based on market data. The DCF analyses are based on the current operating budgets and estimated long-term growth projections for each reporting unit. Future cash flows are discounted based on a market comparable weighted average cost of capital rate for each reporting unit, adjusted for market and other risks where appropriate. In addition, we analyze any difference between the sum of the fair values of the reporting units and our total market capitalization for reasonableness, taking into account certain factors including control premiums.
If the fair value of the reporting unit is less than the carrying value, a second step is performed which compares the implied fair value of the reporting unit’s goodwill to the carrying value of the goodwill. The fair value of the goodwill is determined based on the difference between the fair value of the reporting unit and the net fair value of the identifiable assets and liabilities of the reporting unit. If the implied fair value of the goodwill is less than the carrying value, the difference is recognized as an impairment charge.
We evaluate the recoverability of indefinite-lived intangible assets by first performing a qualitative analysis evaluating whether any events and circumstances occurred that provide evidence that it is more likely than not that the indefinite-lived asset is impaired. If, based on our evaluation of the events and circumstances that occurred during the year we do not believe that it is more likely than not that the indefinite-lived asset is impaired, no quantitative impairment test is performed. Conversely, if the results of our qualitative assessment determine that it is more likely than not that the indefinite-lived asset is impaired a quantitative impairment test is performed. If necessary, the impairment test is performed by comparing the estimated fair value of the intangible asset to its carrying value. If the indefinite-lived intangible asset carrying value exceeds its fair value, an impairment analysis is performed using the income approach. The fair value of loss is recognized in an amount equal to that excess.
Significant judgments inherent in these analyses include estimating the amount and timing of future cash flows and the selection of appropriate discount rates, royalty rates and long-term growth rate assumptions. Changes in these estimates and assumptions could materially affect the determination of fair value for each reporting unit and indefinite-lived intangible asset and could result in an impairment charge, which could be material to our financial position and results of operations.
We performed our impairment assessment of goodwill and indefinite-lived intangible assets and concluded that no impairment existed for the years ended December 31, 2011, and 2010. As further discussed in Note 2 –
Growth and Value Plan & Discontinued Operations
, we determined that during the year ended December 31, 2012, the goodwill at MHE's School Education Group was impaired.
Foreign currency translation
We have operations in many foreign countries. For most international operations, the local currency is the functional currency. For international operations that are determined to be extensions of the parent company, the U.S. dollar is the functional currency. For local currency operations, assets and liabilities are translated into U.S. dollars using end of period exchange rates, and revenue and expenses are translated into U.S. dollars using weighted-average exchange rates. Foreign currency translation adjustments are accumulated in a separate component of equity.
Revenue recognition
Revenue is recognized as it is earned when goods are shipped to customers or services are rendered. We consider amounts to be earned once evidence of an arrangement has been obtained, services are performed, fees are fixed or determinable and collectability is reasonably assured. Revenue relating to products that provide for more than one deliverable is recognized based upon the relative fair value to the customer of each deliverable as each deliverable is provided. Revenue relating to agreements that provide for more than one service is recognized based upon the relative fair value to the customer of each service component as each component is earned. If the fair value to the customer for each service is not objectively determinable, management makes its best estimate of the services’ stand-alone selling price and records revenue as it is earned over the service period. For arrangements that include multiple services, fair value of the service components are determined using an analysis that considers cash consideration that
56
would be received for instances when the service components are sold separately. Advertising revenue is recognized when the page is run. Subscription income is recognized over the related subscription period.
Depreciation
The costs of property and equipment are depreciated using the straight-line method based upon the following estimated useful lives: buildings and improvements from
15
to
40
years and equipment and furniture from
2
to
10 years
. The costs of leasehold improvements are amortized over the lesser of the useful lives or the terms of the respective leases.
Advertising expense
The cost of advertising is expensed as incurred. We incurred
$34 million
,
$32 million
and
$30 million
in advertising costs for the years ended December 31, 2012, 2011 and 2010, respectively.
Stock-based compensation
Stock-based compensation expense is measured at the grant date based on the fair value of the award and is recognized over the requisite service period, which typically is the vesting period. Stock-based compensation is classified as both operating-related expense and selling and general expense in the consolidated statements of income.
Income taxes
Deferred tax assets and liabilities are recognized for the future tax consequences attributable to differences between financial statement carrying amounts of existing assets and liabilities and their respective tax bases. Deferred tax assets and liabilities are measured using enacted tax rates expected to be applied to taxable income in the years in which those temporary differences are expected to be recovered or settled. We recognize liabilities for uncertain tax positions taken or expected to be taken in income tax returns. Accrued interest and penalties related to unrecognized tax benefits are recognized in interest expense and operating expense, respectively.
Judgment is required in determining our provision for income taxes, deferred tax assets and liabilities and unrecognized tax benefits. In determining the need for a valuation allowance, the historical and projected financial performance of the operation that is recording a net deferred tax asset is considered along with any other pertinent information.
We file income tax returns in the U.S. federal jurisdiction, various states, and foreign jurisdictions, and we are routinely under audit by many different tax authorities. We believe that our accrual for tax liabilities is adequate for all open audit years based on our assessment of many factors including past experience and interpretations of tax law. This assessment relies on estimates and assumptions and may involve a series of complex judgments about future events. It is possible that examinations will be settled prior to December 31, 2013. If any of these tax audit settlements do occur within that period we would make any necessary adjustments to the accrual for unrecognized tax benefits. Until formal resolutions are reached between us and the tax authorities, the determination of a possible audit settlement range with respect to the impact on unrecognized tax benefits is not practicable. On the basis of present information, our opinion is that any assessments resulting from the current audits will not have a material effect on our consolidated financial statements.
Redeemable Noncontrolling Interest
The agreement with the minority partners of our S&P Dow Jones Indices LLC joint venture discussed in Note 3
—
Acquisitions and Divestitures
, contains redemption features whereby interests held by our minority partners is redeemable both at the option of the holder and upon the occurrence of an event that is not solely within our control. Since redemption of the noncontrolling interest is outside of our control, this interest is presented on our consolidated balance sheets under the caption “Redeemable noncontrolling interest.” If the interest were to be redeemed, we would be required to purchase all of such interest at fair value on the date of redemption. We adjust the redeemable noncontrolling interest each reporting period to its estimated redemption value, but never less than its initial fair value, using a combination of an income and market valuation approach. Our income and market valuation approaches may incorporate Level 3 measures for instances when observable inputs are not available, including assumptions related to expected future net cash flows, long-term growth rates, the timing and nature of tax attributes, and the redemption features. Any adjustments to the redemption value will impact retained income. See Note 9 –
Equity
, for further detail.
Contingencies
We accrue for loss contingencies when both (a) information available prior to issuance of the financial statements indicates that it is probable that a liability had been incurred at the date of the financial statements and (b) the amount of loss can reasonably be estimated. When we accrue for loss contingencies and the reasonable estimate of the loss is within a range, we record its best estimate within the range. We disclose an estimated possible loss or a range of loss when it is at least reasonably possible that a loss may have been incurred.
57
Recent Accounting Standards
In February 2013, the Financial Accounting Standards Board (“FASB”) issued amended guidance expanding the disclosure requirements for amounts reclassified out of accumulated other comprehensive income. The amendments require an entity to present, either on the face of the statement where net income is presented or in the notes to its financial statements, details of significant items reclassified in their entirety out of accumulated other comprehensive income and identification of the respective line items effecting net income for instances when reclassification is required under U.S. GAAP. For other amounts that are not required under U.S. GAAP to be reclassified in their entirety to net income in the same reporting period, an entity will be required to cross-reference to other disclosures required under U.S. GAAP that provide additional detail about those amounts. The amendments do not change the current requirements for reporting net income or other comprehensive income in financial statements. However, the amendments require an entity to provide information about the amounts reclassified out of accumulated other comprehensive income by type. The amendments are effective prospectively for our reporting period beginning January 1, 2013.
In July 2012, FASB issued guidance that simplified how an entity tests for impairment of indefinite-lived intangible assets. Under the revised guidance, an entity has the option first to assess qualitative factors to determine whether the existence of events and circumstances indicates that it is more likely than not that the indefinite-lived intangible asset is impaired. If, after assessing the totality of events and circumstances, an entity determines that it is more likely than not that the indefinite-lived intangible asset is impaired, then the entity is required to determine the fair value of the indefinite-lived intangible asset and perform the quantitative impairment test by comparing the fair value of the indefinite-lived intangible asset with its carrying amount. Otherwise, no further testing is required. The guidance is effective for interim and annual periods beginning after September 15, 2012; however, early adoption is permitted. We adopted the FASB's guidance during our fourth quarter ended December 31, 2012. Adoption of this guidance did not have a significant impact on our financial position, results of operations or cash flows.
In September 2011, FASB issued guidance that simplified how an entity tests goodwill for impairment. The revised guidance provides an entity the option to make a qualitative evaluation about the likelihood of goodwill impairment. Under the revised guidance, an entity is permitted to first assess qualitative factors to determine whether goodwill impairment exists prior to performing analyses comparing the fair value of a reporting unit to its carrying amount. If, after assessing the totality of events or circumstances, an entity determines that it is more likely than not that the fair value of a reporting unit is less than its carrying amount, then performing the quantitative impairment test is required. Otherwise, no further testing is required. We adopted the FASB’s guidance during our fourth quarter ended December 31, 2011. The adoption of the guidance did not have a significant impact on our financial position, results of operations or cash flows.
In June 2011, the FASB issued guidance that modified how comprehensive income is presented in an entity’s financial statements. The guidance issued requires an entity to present the total of comprehensive income, the components of net income, and the components of other comprehensive income either in a single continuous statement of comprehensive income or in two separate but consecutive statements and eliminates the option to present the components of other comprehensive income as part of the statement of equity. The revised financial statement presentation for comprehensive income was effective on January 1, 2012 and has been incorporated into this Form 10-K.
In May 2011, the FASB issued new guidance for fair value measurements intended to achieve common fair value measurement and disclosure requirements in U.S. GAAP and International Financial Reporting Standards. The amended guidance provides a consistent definition of fair value to ensure that the fair value measurement and disclosure requirements are similar between U.S. GAAP and International Financial Reporting Standards. The amended guidance changes certain fair value measurement principles and enhances the disclosure requirements, particularly for Level 3 fair value measurements. The amended guidance, which went into effect for us beginning January 1, 2012, did not have a significant impact on our financial position, results of operations or cash flows.
Reclassification
In addition to the effects of discontinued operations presentation, certain other prior year amounts have been reclassified for comparability purposes.
2. Growth and Value Plan & Discontinued Operations
On September 12, 2011, we announced that our Board of Directors had unanimously approved a comprehensive Growth and Value Plan that includes separation into two companies: McGraw Hill Financial, focused on providing essential information to the capital, commodities and commercial markets, and McGraw-Hill Education ("MHE"), focused on education products and services and digital learning. The Growth and Value Plan has been focused on accelerating growth and increasing shareholder value through not only this separation, but also through substantial cost-cutting initiatives and increased share repurchases.
58
As we approach the completion of the Growth and Value Plan we have achieved our objectives under our Growth and Value Plan relating to the separation of MHE, cost reductions, increased shareholder return and investing / divesting in targeted assets that position us for long-term growth.
On November 26, 2012, we entered into a definitive agreement to sell MHE to investment funds affiliated with Apollo Global Management, LLC, for a purchase price of
$2.5
billion subject to certain closing adjustments. As part of this transaction, McGraw-Hill will receive
$250
million in senior unsecured notes issued by the purchaser at an annual interest rate of
8.5%
. We are currently in the process of determining the fair value of these notes. For all periods presented in this Form 10-K, the results of operations of MHE have been reclassified to reflect the business as a discontinued operation and the assets and liabilities of the business have been reclassified as held for sale in the consolidated balance sheets. The sale of MHE is subject to various closing conditions and is anticipated to close in the first quarter of 2013. See Item 1a,
Risk Factors,
in this Form 10-K for updates to certain risk factors related to the sale.
The table below summarizes our costs related to the Growth and Value Plan including restructuring charges for the year ended December 31, 2012:
|
(in millions)
|
|||||||
|
Continuing
|
Discontinued
|
||||||
|
Professional fees
|
$
|
117
|
|
$
|
17
|
|
|
|
Restructuring charges
|
68
|
|
39
|
|
|||
|
Transaction costs for our S&P Dow Jones Indices LLC joint venture
|
15
|
|
—
|
|
|||
|
Charges related to lease commitments
|
8
|
|
3
|
|
|||
|
Miscellaneous charges
|
18
|
|
2
|
|
|||
|
$
|
226
|
|
$
|
61
|
|
||
These are costs necessary to enable separation, reduce our cost structure, accelerate growth and increase shareholder value. Total costs incurred since the Growth and Value Plan was announced in September of 2011 have been
$297 million
.
The Growth and Value Plan costs are included in selling and general expenses in our consolidated statements of income as follows:
|
(in millions)
|
Years ended December 31,
|
||||||
|
2012
|
2011
|
||||||
|
Growth and Value Plan costs
|
$
|
226
|
|
$
|
10
|
|
|
|
Other selling and general expenses
|
1,483
|
|
1,377
|
|
|||
|
Total selling and general expenses
|
$
|
1,709
|
|
$
|
1,387
|
|
|
In addition to the sale of MHE, our discontinued operations for the years ended December 31, 2011 and 2010 also include the Broadcasting Group as we entered into a definitive agreement on October 3, 2011 with The E.W. Scripps Company to sell the Broadcasting Group. The sale was completed on December 30, 2011, when we received net proceeds of approximately
$216 million
. As a result of the sale, we recognized a pre-tax gain of
$123 million
, which was included in (loss) income from discontinued operations. For the year ended December 31, 2011 and prior periods presented, we reported our Broadcasting Group, previously included in our C&C segment, as a discontinued operation. The results of operations of the Broadcasting Group have been reclassified to reflect the business as a discontinued operation and assets and liabilities of the business have been removed from the consolidated balance sheet as of December 31, 2011.
59
The key components of (loss) income from discontinued operations consist of the following:
|
(in millions)
|
Years ended December 31,
|
||||||||||
|
|
2012
|
2011
|
2010
|
||||||||
|
Revenue
|
$
|
2,062
|
|
$
|
2,382
|
|
$
|
2,529
|
|
||
|
Expenses
|
2,287
|
|
2,035
|
|
2,135
|
|
|||||
|
Operating (loss) profit
|
(225
|
)
|
347
|
|
394
|
|
|||||
|
Interest income, net
|
(2
|
)
|
(3
|
)
|
(2
|
)
|
|||||
|
(Loss) income before taxes on (loss) income
|
(223
|
)
|
350
|
|
396
|
|
|||||
|
Provision for taxes on (loss) income
|
11
|
|
116
|
|
144
|
|
|||||
|
(Loss) income from discontinued operations before gain on sale
|
(234
|
)
|
234
|
|
252
|
|
|||||
|
Gain from discontinued operations, net of taxes of $48
|
—
|
|
74
|
|
—
|
|
|||||
|
(Loss) income from discontinued operations, net of tax
|
$
|
(234
|
)
|
$
|
308
|
|
$
|
252
|
|
||
Results from discontinued operations for the year ended December 31, 2012 included several non-recurring items:
|
•
|
Intangible asset impairments of
$497
million that consisted of goodwill, prepublication and inventory assets at MHE's School Education Group ("SEG").
|
|
◦
|
As a result of the offer we received from Apollo Global Management, LLC in the fourth quarter of 2012, we performed a goodwill impairment review at MHE, which resulted in a full impairment of goodwill of
$478
million at SEG.
|
|
◦
|
An impairment charge of
$19
million was recorded on certain prepublication and inventory assets as targeted school programs were shut down.
|
|
•
|
Restructuring charges of
$39
million consisting primarily of employee severance costs related to a workforce reduction of approximately
530
positions.
|
|
•
|
Direct transaction costs of
$17
million for legal and professional fees related to the sale of MHE.
|
|
•
|
A charge related to a lease commitment of
$3
million.
|
|
•
|
These charges were partially offset by a vacation accrual reversal of
$17
million
related to a change in our vacation policy as discussed in Note 1
–
Accounting Policies
.
|
The components of assets and liabilities classified as discontinued operations in the consolidated balance sheets consist of the following:
|
(in millions)
|
December 31,
|
||||||
|
|
2012
|
2011
|
|||||
|
Accounts receivable, net
|
$
|
333
|
|
$
|
343
|
|
|
|
Property and equipment, net
|
122
|
|
127
|
|
|||
|
Goodwill
|
469
|
|
944
|
|
|||
|
Other intangible assets, net
|
156
|
|
181
|
|
|||
|
Inventories, net
|
235
|
|
262
|
|
|||
|
Prepublication costs
|
304
|
|
325
|
|
|||
|
Other assets
|
321
|
|
326
|
|
|||
|
Assets held for sale
|
$
|
1,940
|
|
$
|
2,508
|
|
|
|
|
|||||||
|
Accounts payable and accrued expenses
|
123
|
|
157
|
|
|||
|
Unearned revenue
|
192
|
|
117
|
|
|||
|
Other liabilities
|
349
|
|
445
|
|
|||
|
Liabilities held for sale
|
$
|
664
|
|
$
|
719
|
|
|
60
3. Acquisitions and Divestitures
Acquisitions
For the year ended December 31, 2012, we paid cash for acquisitions, net of cash acquired, totaling
$177 million
. None of our acquisitions were material either individually or in the aggregate, including the pro forma impact on earnings. All acquisitions were funded with cash flows from operations. Acquisitions completed during the year ended December 31, 2012 by segment included:
S&P DJ Indices
|
•
|
On June 29, 2012, we closed our transaction with CME Group, Inc. (“CME Group”) and CME Group Index Services LLC (“CGIS”), a joint venture between CME Group and Dow Jones & Company, Inc., to form a new company, S&P Dow Jones Indices LLC. See below for further detail related to this transaction.
|
S&P Capital IQ
|
•
|
On June 29, 2012, we acquired Credit Market Analysis Limited (“CMA”) from the CME Group. CMA provides independent data concerning the over-the-counter markets. CMA's data and technology will enhance our capability to provide pricing and related over-the-counter information.
|
|
•
|
On April 3, 2012, we completed the acquisition of QuantHouse, an independent global provider of end-to-end systematic low-latency market data solutions. The acquisition allows us to offer real-time monitors, derived data sets and analytics as well as the ability to package and resell this data as part of a core solution.
|
|
•
|
On February 8, 2012, we completed the acquisition of R² Technologies (“R²”). R² provides advanced risk and scenario-based analytics to traders, portfolio and risk managers for pricing, hedging and capital management across asset classes.
|
C&C
|
•
|
On November 1, 2012, we completed the acquisition of Kingsman SA (“Kingsman”), a privately-held, Switzerland-based provider of price information and analytics for the global sugar and biofuels markets. The acquisition of Kingsman will expand our presence in sugar and biofuels information markets and has the potential to provide growth in the global agricultural information markets.
|
S&P Ratings
|
•
|
On July 4, 2012, CRISIL, our majority owned Indian credit rating agency, completed the acquisition of Coalition Development Ltd. (“Coalition”), a privately-held U.K. analytics company, and its subsidiaries. Coalition provides high-end analytics to leading global investment banks and other financial services firms. Coalition has been integrated into CRISIL's Global Research & Analytics business.
|
Our acquisitions during 2012 were accounted for using the purchase method. Under the purchase method, the excess of the purchase price over the fair value of the net assets acquired is allocated to goodwill and other intangibles. Intangible assets recorded for all transactions are amortized using the straight-line method for periods not exceeding
20
years. None of the goodwill acquired from our acquisitions during 2012 will be deductible for tax purposes.
Acquisition of Dow Jones Index Business
We own
73%
and CME Group and CGIS collectively own
27%
of S&P Dow Jones LLC. In exchange for their
27%
minority interest, CME Group and CGIS contributed their Dow Jones Index (“DJI”) business; in exchange for our
73%
and controlling interest, we contributed our Standard & Poor's Index (“S&P Index”) business. The DJI business focuses on the development of financial benchmarks used by licensees to create exchange-traded funds, option contracts and futures contracts traded on exchanges as well as used as a metric to evaluate economic performance. The combination of these businesses creates the world's premier provider of financial market indices; we expect to increase revenue through international and asset-class expansion, new product development, enhanced market data offerings and increased cross-selling opportunities. The pro forma impact on revenue and earnings from our joint venture with the DJI business was not material to our consolidated results for the year ended December 31, 2012.
The terms of the operating agreement of S&P Dow Jones Indices LLC contain redemption features whereby interests held by minority partners are redeemable. See Note 9 –
Equity
for further discussion.
61
Acquisition-Related Expenses
During the year ended
December 31, 2012
, we incurred
$15 million
of acquisition-related costs related to the formation of S&P Dow Jones Indices LLC. These expenses are included in selling and general expenses in our consolidated statement of income.
Preliminary Allocation of Purchase Price
Because we consolidate S&P Dow Jones Indices LLC, we have applied the purchase method of accounting to the S&P Dow Jones Indices LLC contributed business. DJI's results of operations have been included in our consolidated results of operations subsequent to June 29, 2012 (the "Acquisition Date").
The fair value of the DJI business acquired of
$792 million
was estimated by applying a market approach and an income approach. This fair value measurement is based on significant inputs not observable in the market and thus represents a Level 3 measurement. The fair value estimates of the proportionate shares of the contributed businesses are based on, but not limited to, future expected cash flows, appropriate discount rates ranging from
10%
to
11%
, long term growth rates of
2.5
% to
3.5%
, assumed financial multiples of companies deemed to be similar to the DJI, and market rate assumptions for contractual obligations. S&P Index continues to be recorded at its historical or carry-over basis.
At the Acquisition Date, our noncontrolling interest has been recorded at the fair value of DJI we acquired plus the proportionate interest of the S&P Index business at our carry-over basis. As of June 30, 2012, we recorded a redeemable noncontrolling interest in our consolidated financial statements (see Note 9 –
Equity
for further discussion) at the preliminary fair value of
27%
of S&P Dow Jones Indices LLC or
$792 million
due to the redemption provisions described above, representing CME Group's and CGIS' interest in S&P Dow Jones Indices LLC.
The tables below present the consideration transferred and the allocation of purchase price to the assets and liabilities of the DJI business acquired as a result of the transaction.
Consideration Transferred
|
(in millions)
|
|||
|
Fair value of 27% of S&P Index
|
$
|
571
|
|
|
Fair value of redeemable noncontrolling interest associated with net assets acquired
|
221
|
|
|
|
Total
|
$
|
792
|
|
Purchase Price Allocation
|
(in millions)
|
|||
|
Current assets
|
$
|
79
|
|
|
Intangible assets:
|
|||
|
Indefinite-lived intangibles
|
470
|
|
|
|
Customer relationships
|
110
|
|
|
|
Other intangibles
|
33
|
|
|
|
Goodwill
|
111
|
|
|
|
Current liabilities
|
(11
|
)
|
|
|
Total net assets
|
$
|
792
|
|
The intangible assets, excluding goodwill and indefinite-lived intangibles, will be amortized over their anticipated useful lives of between
5
and
20
years, which will be determined when we finalize our purchase price allocation.
Income Taxes
We are responsible for the tax matters for S&P Dow Jones Indices LLC, including the filing of returns and the administration of any proceedings with taxing authorities. For U.S. federal income tax purposes, S&P Dow Jones Indices LLC is treated as a partnership. The income of S&P Dow Jones Indices LLC will flow through and be subject to tax at the partners' level. However S&P Dow Jones Indices LLC is expected to incur current and deferred income taxes in a limited number of states and localities and its foreign subsidiaries are expected to incur immaterial current and deferred foreign income taxes.
62
We recognized
$216 million
of non-current deferred tax liabilities in connection with CME Group and CGIS acquiring an indirect noncontrolling interest in the S&P Index business in exchange for our acquisition of a portion of our interest in the DJI business. Because we maintained control of the S&P Index business, the excess of fair value received over historical carrying value and the related tax impact were recorded in additional paid-in capital.
Goodwill and Identifiable Intangibles
Goodwill consists primarily of intangible assets that do not qualify for separate recognition, including assembled workforce, noncontractual relationships and agreements. The goodwill is not expected to be deductible for tax purposes.
For the year ended December 31, 2011, we completed acquisitions totaling
$194 million
. None of our acquisitions were material either individually or in the aggregate, including the pro forma impact on earnings. All acquisitions were funded with cash flows from operations. Acquisitions completed during the year ended December 31, 2011 included:
|
•
|
On July 1, 2011, we acquired the issued and outstanding shares of Steel Business Briefing Group (the “SBB Group”), a privately held U.K. company and leading provider of news, pricing and analytics to the global steel market. The SBB Group provides subscription-based, electronic products to the steel industry and its participants through two principal businesses, Steel Business Briefing and The Steel Index. The SBB Group is included within Platts, part of our C&C segment. In connection with the preliminary purchase price allocation, estimates of the fair values of long-lived and intangible assets have been determined utilizing currently available information and are subject to finalization.
|
|
•
|
On January 3, 2011, we acquired all of the issued and outstanding membership interest units of Bentek Energy LLC (“Bentek”), which is included as part of our C&C segment. Bentek offers its customers a comprehensive portfolio of data, information and analytics products in the natural gas and liquids sector. The primary purpose of the acquisition was to acquire Bentek’s knowledge, skill and expertise in gathering high-quality detailed data and their ability to identify key relationships within the data critical to industry participants.
|
Our acquisitions of the SBB Group and Bentek were accounted for using the purchase method. Under the purchase method, the excess of the purchase price over the fair value of the net assets acquired is allocated to goodwill and other intangibles. Intangible assets recorded for all transactions are amortized using the straight-line method for periods not exceeding
12 years
. The goodwill acquired from the Bentek acquisition will be deductible for tax purposes; the goodwill acquired from the SBB Group acquisition will not be deductible for tax purposes.
For the year ended December 31, 2010, our acquisition and investment activities totaled
$327 million
. None of our acquisitions or investments was material either individually or in the aggregate, including the pro forma impact on earnings. All acquisitions were funded with cash flows from operations. Acquisitions and investment activities completed during the year ended December 31, 2010 included:
|
•
|
On December 3, 2010, our majority owned subsidiary, Crisil Ltd., acquired substantially all the assets and certain liabilities of Pipal Research Corporation (“Pipal”), an Indian-based knowledge process outsourcing company focused on providing information to enable management teams to make more informed strategic, operational, and marketing decisions across a broad range of industries. The acquisition of Pipal will enable Crisil, which is part of our S&P Ratings segment, to expand its service offerings that can be offered to its traditional customer base.
|
|
•
|
On September 20, 2010, we acquired substantially all the assets and certain liabilities of TheMarkets.com LLC, a company focused on providing real-time investment information to brokers and institutional investors. This acquisition is consistent with S&P Capital IQ's focus on creating strategic value through providing access to investment research, data, and analytics to customers that facilitates informed investment decisions.
|
|
•
|
In April of 2010, we made a
$5 million
contingent payment related to an asset acquisition in 2008, which is part of our S&P Capital IQ segment.
|
63
Non-cash investing activities
Liabilities assumed in conjunction with the acquisition of businesses are as follows:
|
(in millions)
|
Years ended December 31,
|
||||||||||
|
|
2012
|
2011
|
2010
|
||||||||
|
Fair value of assets acquired
|
$
|
1,071
|
|
$
|
214
|
|
$
|
347
|
|
||
|
Fair value of consideration transferred for DJI business
|
792
|
|
—
|
|
—
|
|
|||||
|
Cash paid (net of cash acquired)
|
177
|
|
194
|
|
327
|
|
|||||
|
Liabilities assumed
|
$
|
102
|
|
$
|
20
|
|
$
|
20
|
|
||
Divestitures
We did not complete any dispositions during the year ended December 31, 2012.
As discussed in Note 2 –
Growth and Value Plan & Discontinued Operations
, MHE is classified as a discontinued operation for all periods presented as we have entered into a definitive agreement to sell and the Broadcasting Group sale was completed on December 30, 2011.
During the year ended December 31, 2011, we recorded a pre-tax gain of
$13 million
within other income in the consolidated statement of income, related to the sale of our interest in the LinkedIn Corporation in May as part of their initial public offering. This investment was held within our C&C segment.
During the year ended December 31, 2010, we recorded a pre-tax gain of
$7 million
within other income in the consolidated statement of income, related to the sale of certain equity interests in September which were a part of our S&P Ratings segment. The gain was primarily from the sale of an equity interest in an Indian commodity exchange that was made to comply with local regulations discouraging foreign-based entities from owning an interest in local Indian exchanges in excess of
5%
.
4. Goodwill and Other Intangible Assets
Goodwill
Goodwill represents the excess of purchase price and related costs over the value assigned to the net tangible and identifiable intangible assets of businesses acquired.
As a result of our joint venture between CME Group and Dow Jones & Company, Inc., to form a new company, S&P Dow Jones Indices LLC and how we are managing this company, combined with the formation of McGraw Hill Financial, we have separated our previously reported S&P Capital IQ / S&P Indices segment into two separate reportable segments. See Note 12 –
Segment and Geographic Information
for further discussion on our segments.
As a result, we reallocated the goodwill balance of S&P Capital IQ / S&P Indices to reflect the new segment based on a relative fair value approach. The change in the carrying amount of goodwill by segment is shown below:
|
(in millions)
|
S&P Ratings
|
S&P Capital IQ
|
S&P DJ Indices
|
C&C
|
Total
|
||||||||||||||
|
Balance as of December 31, 2010
|
$
|
191
|
|
$
|
240
|
|
$
|
223
|
|
$
|
289
|
|
$
|
943
|
|
||||
|
Additions, net
|
—
|
|
—
|
|
—
|
|
159
|
|
159
|
|
|||||||||
|
Other (primarily Fx)
|
6
|
|
(2
|
)
|
—
|
|
(2
|
)
|
2
|
|
|||||||||
|
Balance as of December 31, 2011
|
197
|
|
238
|
|
223
|
|
446
|
|
1,104
|
|
|||||||||
|
Additions
|
29
|
|
164
|
|
111
|
|
21
|
|
325
|
|
|||||||||
|
Transfers/reorganizations
|
(95
|
)
|
53
|
|
45
|
|
—
|
|
3
|
|
|||||||||
|
Other (primarily Fx)
|
(1
|
)
|
2
|
|
1
|
|
4
|
|
6
|
|
|||||||||
|
Balance as of December 31, 2012
|
$
|
130
|
|
$
|
457
|
|
$
|
380
|
|
$
|
471
|
|
$
|
1,438
|
|
||||
Goodwill additions in the table above relate to transactions discussed in Note 3 –
Acquisitions and Divestitures
.
64
Other Intangible Assets
Other intangible assets include both indefinite-lived assets not subject to amortization and definite-lived assets subject to amortization. We have indefinite-lived assets with a carrying value of
$634
million and
$164
million as of December 31, 2012 and 2011, respectively, that consist of:
|
•
|
$380 million
and
$90 million
, for Dow Jones Indices intellectual property and the Dow Jones tradename, respectively, that we recorded as part of the transaction to form S&P Dow Jones Indices LLC in 2012 further described in Note 3 –
Acquisitions and Divestitures,
and
|
|
•
|
$164 million
within our C&C segment for J.D. Power and Associates tradename.
|
The following table summarizes our definite-lived intangible assets:
|
(in millions)
|
|
||||||||||||||||||||||
|
Cost
|
Databases and software
|
Content
|
Customer relationships
|
Tradenames
|
Other intangibles
|
Total
|
|||||||||||||||||
|
Balance as of December 31, 2010
|
$
|
82
|
|
$
|
139
|
|
$
|
104
|
|
$
|
37
|
|
$
|
60
|
|
$
|
422
|
|
|||||
|
Additions, net
|
27
|
|
—
|
|
11
|
|
8
|
|
2
|
|
48
|
|
|||||||||||
|
Balance as of December 31, 2011
|
109
|
|
139
|
|
115
|
|
45
|
|
62
|
|
470
|
|
|||||||||||
|
Additions, net
|
17
|
|
—
|
|
110
|
|
1
|
|
108
|
|
236
|
|
|||||||||||
|
Other (primarily Fx)
|
—
|
|
—
|
|
—
|
|
(1
|
)
|
1
|
|
—
|
|
|||||||||||
|
Balance as of December 31, 2012
|
$
|
126
|
|
$
|
139
|
|
$
|
225
|
|
$
|
45
|
|
$
|
171
|
|
$
|
706
|
|
|||||
|
Accumulated amortization
|
|||||||||||||||||||||||
|
Balance as of December 31, 2010
|
$
|
64
|
|
$
|
3
|
|
$
|
36
|
|
$
|
24
|
|
$
|
47
|
|
$
|
174
|
|
|||||
|
Current year amortization
|
6
|
|
14
|
|
7
|
|
3
|
|
3
|
|
33
|
|
|||||||||||
|
Balance as of December 31, 2011
|
70
|
|
17
|
|
43
|
|
27
|
|
50
|
|
207
|
|
|||||||||||
|
Current year amortization
|
10
|
|
14
|
|
11
|
|
3
|
|
10
|
|
48
|
|
|||||||||||
|
Other (primarily Fx)
|
—
|
|
—
|
|
1
|
|
—
|
|
3
|
|
4
|
|
|||||||||||
|
Balance as of December 31, 2012
|
$
|
80
|
|
$
|
31
|
|
$
|
55
|
|
$
|
30
|
|
$
|
63
|
|
$
|
259
|
|
|||||
|
Net definite-lived intangibles:
|
|||||||||||||||||||||||
|
December 31, 2011
|
$
|
39
|
|
$
|
122
|
|
$
|
72
|
|
$
|
18
|
|
$
|
12
|
|
$
|
263
|
|
|||||
|
December 31, 2012
|
$
|
46
|
|
$
|
108
|
|
$
|
170
|
|
$
|
15
|
|
$
|
108
|
|
$
|
447
|
|
|||||
Definite-lived intangible assets are being amortized on a straight-line basis over periods of up to
40 years
. The weighted-average life of the intangible assets as of December 31, 2012 is approximately
11 years
. Amortization expense for the years ended December 31, 2012, 2011 and 2010, and the projected amortization expense for intangible assets over the next
five years
for the years ended December 31, assuming no further acquisitions or dispositions, is as follows:
|
(in millions)
|
Amortization
expense
|
Expected
amortization
expense
|
|||||
|
2010
|
$
|
21
|
|
||||
|
2011
|
33
|
|
|||||
|
2012
|
48
|
|
|||||
|
2013
|
$
|
51
|
|
||||
|
2014
|
52
|
|
|||||
|
2015
|
49
|
|
|||||
|
2016
|
49
|
|
|||||
|
2017
|
46
|
|
|||||
65
5. Taxes on Income
Income before taxes on income resulted from domestic and foreign operations as follows:
|
(in millions)
|
Years ended December 31,
|
||||||||||
|
|
2012
|
2011
|
2010
|
||||||||
|
Domestic operations
|
$
|
841
|
|
$
|
700
|
|
$
|
699
|
|
||
|
Foreign operations
|
289
|
|
300
|
|
244
|
|
|||||
|
Total continuing income before taxes
|
$
|
1,130
|
|
$
|
1,000
|
|
$
|
943
|
|
||
The provision/(benefit) for taxes on income consists of the following:
|
(in millions)
|
Years ended December 31,
|
||||||||||
|
|
2012
|
2011
|
2010
|
||||||||
|
Federal:
|
|||||||||||
|
Current
|
$
|
194
|
|
$
|
238
|
|
$
|
159
|
|
||
|
Deferred
|
74
|
|
(6
|
)
|
37
|
|
|||||
|
Total federal
|
268
|
|
232
|
|
196
|
|
|||||
|
Foreign:
|
|||||||||||
|
Current
|
91
|
|
93
|
|
109
|
|
|||||
|
Deferred
|
(9
|
)
|
13
|
|
(14
|
)
|
|||||
|
Total foreign
|
82
|
|
106
|
|
95
|
|
|||||
|
State and local:
|
|||||||||||
|
Current
|
40
|
|
36
|
|
49
|
|
|||||
|
Deferred
|
14
|
|
—
|
|
4
|
|
|||||
|
Total state and local
|
54
|
|
36
|
|
53
|
|
|||||
|
Total provision for taxes for continuing operations
|
404
|
|
374
|
|
344
|
|
|||||
|
Provision for discontinued operations
|
11
|
|
164
|
|
143
|
|
|||||
|
Total provision for taxes
|
$
|
415
|
|
$
|
538
|
|
$
|
487
|
|
||
A reconciliation of the U.S. federal statutory income tax rate to our effective income tax rate for financial reporting purposes is as follows:
|
|
Years ended December 31,
|
|||||||
|
|
2012
|
2011
|
2010
|
|||||
|
U.S. federal statutory income tax rate
|
35.0
|
%
|
35.0
|
%
|
35.0
|
%
|
||
|
State and local income taxes
|
3.6
|
|
2.4
|
|
4.6
|
|
||
|
Foreign operations
|
(2.6
|
)
|
(3.0
|
)
|
(1.6
|
)
|
||
|
S&P Dow Jones Indices LLC joint venture
|
(1.1
|
)
|
—
|
|
—
|
|
||
|
Other, net
|
0.9
|
|
3.0
|
|
(1.6
|
)
|
||
|
Effective income tax rate for continuing operations
|
35.8
|
%
|
37.4
|
%
|
36.4
|
%
|
||
66
The principal temporary differences between the accounting for income and expenses for financial reporting and income tax purposes are as follows:
|
(in millions)
|
December 31,
|
||||||
|
|
2012
|
2011
|
|||||
|
Deferred tax assets:
|
|||||||
|
Postretirement benefits
|
$
|
201
|
|
$
|
202
|
|
|
|
Employee compensation
|
123
|
|
128
|
|
|||
|
Accrued expenses
|
105
|
|
99
|
|
|||
|
Unearned revenue
|
60
|
|
58
|
|
|||
|
Allowance for doubtful accounts
|
17
|
|
10
|
|
|||
|
Loss carryforwards
|
25
|
|
8
|
|
|||
|
Total deferred tax assets
|
531
|
|
505
|
|
|||
|
Deferred tax liabilities:
|
|||||||
|
Goodwill and intangible assets
1
|
(379
|
)
|
(131
|
)
|
|||
|
Fixed assets
|
(54
|
)
|
(58
|
)
|
|||
|
Other
|
(1
|
)
|
(7
|
)
|
|||
|
Total deferred tax liabilities
|
(434
|
)
|
(196
|
)
|
|||
|
Net deferred income tax asset before valuation allowance
|
97
|
|
309
|
|
|||
|
Valuation allowance
|
(7
|
)
|
(7
|
)
|
|||
|
Net deferred income tax asset
|
$
|
90
|
|
$
|
302
|
|
|
|
Reported as:
|
|||||||
|
Current deferred tax assets
|
$
|
117
|
|
$
|
110
|
|
|
|
Current deferred tax liabilities
|
(7
|
)
|
(2
|
)
|
|||
|
Non-current deferred tax assets
|
36
|
|
207
|
|
|||
|
Non-current deferred tax liabilities
|
(56
|
)
|
(13
|
)
|
|||
|
Net deferred income tax asset
|
$
|
90
|
|
$
|
302
|
|
|
|
1
|
See Note 3 –
Acquisitions and
Divestitures
for further discussion regarding the impact related to the S&P Dow Jones Indices LLC.
|
We record valuation allowances against deferred income tax assets when we determine that it is more likely than not based upon all the available evidence that such deferred income tax assets will not be realized. The valuation allowance is primarily related to operating losses.
We have not recorded deferred income taxes applicable to undistributed earnings of foreign subsidiaries that are indefinitely reinvested in foreign operations. Undistributed earnings that are indefinitely reinvested in foreign operations amounted to
$762 million
at December 31, 2012. Quantification of the deferred tax liability, if any, associated with indefinitely reinvested earnings is not practicable.
We made net income tax payments for continuing and discontinued operations totaling
$243 million
in 2012,
$452 million
in 2011, and
$410 million
in 2010. As of December 31, 2012, we had net operating loss carryforwards of $
133
million, some of which will expire over varying periods.
67
A reconciliation of the beginning and ending amount of unrecognized tax benefits is as follows:
|
(in millions)
|
Years ended December 31,
|
||||||||||
|
|
2012
|
2011
|
2010
|
||||||||
|
Balance at beginning of year
|
$
|
58
|
|
$
|
53
|
|
$
|
37
|
|
||
|
Additions based on tax positions related to the current year
|
14
|
|
12
|
|
14
|
|
|||||
|
Additions for tax positions of prior years
|
3
|
|
3
|
|
10
|
|
|||||
|
Reduction for tax positions of prior years
|
(1
|
)
|
(10
|
)
|
(8
|
)
|
|||||
|
Balance at end of year
|
$
|
74
|
|
$
|
58
|
|
$
|
53
|
|
||
The total amount of federal, state and local, and foreign unrecognized tax benefits as of December 31, 2012 and 2011 was
$74 million
and
$58 million
, respectively, exclusive of interest and penalties. The increase of
$16 million
in 2012 is the amount of unrecognized tax benefits that unfavorably impacted tax expense. The unfavorable impact to the tax provision was partially offset by the favorable outcome of the completed state, local and foreign tax audits.
We recognize accrued interest and penalties related to unrecognized tax benefits in interest expense and operating-related expense, respectively. In addition to the unrecognized tax benefits, as of December 31, 2012 and 2011, we had
$14 million
and
$10 million
, respectively, of accrued interest and penalties associated with uncertain tax positions.
During 2012, we completed various state and foreign tax audits and, with few exceptions, we are no longer subject to federal, state and local, or non-U.S. income tax examinations by tax authorities for the years before 2003. During 2011, we effectively completed the U.S. federal tax audit for 2010 and we also completed various state and foreign tax audits. During 2010, we effectively completed the U.S. federal tax audit for 2009 and we also completed various state and foreign tax audits. The impact to tax expense in 2012, 2011 and 2010 was not material. However, even though we have effectively completed the U.S. federal tax audit for the years 2010, 2009, 2008 and 2007, those years remained open pending the appeal of an unresolved issue. On February 5, 2013, the Appeals Office of the Internal Revenue Service issued a Notice of Deficiency determining that we are not eligible for the deduction for domestic production activities. We have 90 days to decide whether we will file a petition in Tax Court. We do not believe the outcome of this action will have a material adverse effect on our results of operations.
We file income tax returns in the U.S. federal jurisdiction, various states, and foreign jurisdictions, and we are routinely under audit by many different tax authorities. We believe that our accrual for tax liabilities is adequate for all open audit years based on an assessment of many factors including past experience and interpretations of tax law. This assessment relies on estimates and assumptions and may involve a series of complex judgments about future events. It is possible that tax examinations will be settled prior to December 31, 2013. If any of these tax audit settlements do occur within that period, we would make any necessary adjustments to the accrual for unrecognized tax benefits. Until formal resolutions are reached between us and the tax authorities, the determination of a possible audit settlement range with respect to the impact on unrecognized tax benefits is not practicable. On the basis of present information, it is our opinion that any assessments resulting from the current audits will not have a material effect on our consolidated financial statements.
Although the timing of income tax audit resolution and negotiations with taxing authorities are highly uncertain, we do not anticipate a significant change to the total amount of unrecognized income tax benefits within the next twelve months.
A summary of short-term and long-term debt outstanding is as follows:
|
(in millions)
|
December 31,
|
||||||
|
|
2012
|
2011
|
|||||
|
5.375% Senior Notes, due 2012
|
$
|
—
|
|
$
|
400
|
|
|
|
5.9% Senior Notes, due 2017
1
|
400
|
|
399
|
|
|||
|
6.55% Senior Notes, due 2037
2
|
399
|
|
399
|
|
|||
|
Commercial paper
|
457
|
|
—
|
|
|||
|
Total debt
|
1,256
|
|
1,198
|
|
|||
|
Less: short-term debt including current maturities
|
457
|
|
400
|
|
|||
|
Long-term debt
|
$
|
799
|
|
$
|
798
|
|
|
68
|
1
|
Interest payments are due semiannually on April 15 and October 15, and as of December 31, 2012, the unamortized debt discount is
$0.5 million
.
|
|
2
|
Interest payments are due semiannually on May 15 and November 15, and as of December 31, 2012, the unamortized debt discount is
$1.3 million
.
|
On November 15, 2012, our
$400 million
, 5.375% Senior Notes matured and were fully repaid.
Annual long-term debt maturities are scheduled as follows based on book values as of December 31, 2012:
no
amounts due from 2013-2016, approximately
$400 million
due in 2017 and approximately
$399 million
due thereafter.
We have the ability to borrow a total of
$1.2 billion
through our commercial paper program, which is supported by our
$1.2 billion
three-year credit agreement (our “credit facility”) that will terminate on July 30, 2013. We pay a commitment fee of
15
to
35
basis points for our credit facility, depending on our credit rating, whether or not amounts have been borrowed and currently pay a commitment fee of
20
basis points. The interest rate on borrowings under our credit facility is, at our option, calculated using rates that are primarily based on either the prevailing London Inter-Bank Offer Rate, the prime rate determined by the administrative agent or the Federal funds rate. For certain borrowings under this credit facility there is also a spread based on our credit rating added to the applicable rate.
In connection with the special dividend in the amount of
$2.50
per share on our common stock we utilized our commercial paper program in December of 2012 and as a result, commercial paper borrowings outstanding as of December 31, 2012 totaled
$457 million
with an average interest rate and term of
0.48%
and
28
days. See Note 9 –
Equity
for further discussion concerning the special dividend. As of December 31, 2012, we can borrow
$743 million
in additional funds through the commercial paper program. There were
no
outstanding commercial paper borrowings as of December 31, 2011.
Our credit facility contains certain covenants. The only financial covenant requires that our indebtedness to cash flow ratio, as defined in our credit facility, is not greater than
4
to
1
, and this covenant has never been exceeded.
On February 7, 2013, Fitch Ratings downgraded our credit rating to BBB+ from A- and placed our ratings on Rating Watch Negative. On February 14, 2013, Moody's Investors Service downgraded our credit rating from A3 to Baa2 with negative outlook. There has been no change to our short-term / commercial paper ratings of F2 from Fitch Ratings and P-2 from Moody's Investors Service.
7. Employee Benefits
We have a number of defined benefit pension plans and defined contribution plans covering substantially all employees. Our primary U.S. pension plan is a noncontributory plan under which benefits are based on employee career employment compensation. In December 2011, our Board of Directors approved a plan amendment that froze our U.S. employee retirement plan (“U.S. ERP”) effective on April 1, 2012. Our U.S. ERP is a defined benefit plan. Under the amendment, no new employees will be permitted to enter the U.S. ERP and no additional benefits for current participants for future services will be accrued.
We also have unfunded non-U.S. and supplemental benefit plans. The supplemental benefit plans provide senior management with supplemental retirement, disability and death benefits. Certain supplemental retirement benefits are based on final monthly earnings. In addition, we sponsor voluntary 401(k) plans under which we may match employee contributions up to certain levels of compensation as well as profit-sharing plans under which we contribute a percentage of eligible employees’ compensation to the employees’ accounts.
We also provide certain postretirement medical, dental and life insurance benefits for retired employees and eligible dependents. The medical and dental plans are contributory while the life insurance plan is noncontributory. We currently do not prefund any of these plans.
We recognize the funded status of our retirement and postretirement plans in the consolidated balance sheets, with a corresponding adjustment to accumulated other comprehensive income, net of taxes. The amounts in accumulated other comprehensive income represent net unrecognized actuarial losses and unrecognized prior service costs. These amounts will be subsequently recognized as net periodic pension cost pursuant to our accounting policy for amortizing such amounts.
As part of the definitive agreement to sell MHE to investment funds affiliated with Apollo Global Management, LLC, described further in Note 2 –
Growth and Value Plan & Discontinued Operations
, we will retain the benefit obligations and plan assets related to MHE, however, the benefit cost for periods presented is bifurcated between continuing and discontinued operations.
69
Benefit Obligation
A summary of the benefit obligation and the fair value of plan assets, as well as the funded status for the retirement and postretirement plans as of December 31, is as follows (benefits paid in the table below include only those amounts contributed directly to or paid directly from plan assets):
|
(in millions)
|
Retirement Plans
|
Postretirement Plans
|
|||||||||||||
|
|
2012
|
2011
|
2012
|
2011
|
|||||||||||
|
Net benefit obligation at beginning of year
|
$
|
1,834
|
|
$
|
1,794
|
|
$
|
129
|
|
$
|
144
|
|
|||
|
Service cost
|
24
|
|
67
|
|
3
|
|
3
|
|
|||||||
|
Interest cost
|
93
|
|
99
|
|
5
|
|
6
|
|
|||||||
|
Plan participants’ contributions
|
1
|
|
1
|
|
5
|
|
5
|
|
|||||||
|
Actuarial loss (gain)
|
287
|
|
59
|
|
3
|
|
(14
|
)
|
|||||||
|
Gross benefits paid
|
(71
|
)
|
(63
|
)
|
(17
|
)
|
(16
|
)
|
|||||||
|
Plan amendments
1
|
—
|
|
(129
|
)
|
—
|
|
—
|
|
|||||||
|
Foreign currency effect
|
11
|
|
3
|
|
—
|
|
—
|
|
|||||||
|
Federal subsidy benefits received
|
—
|
|
—
|
|
1
|
|
1
|
|
|||||||
|
Other adjustments
|
(8
|
)
|
3
|
|
—
|
|
—
|
|
|||||||
|
Net benefit obligation at end of year
|
2,171
|
|
1,834
|
|
129
|
|
129
|
|
|||||||
|
Fair value of plan assets at beginning of year
|
1,505
|
|
1,567
|
|
—
|
|
—
|
|
|||||||
|
Actual return on plan assets
|
212
|
|
(31
|
)
|
—
|
|
—
|
|
|||||||
|
Employer contributions
|
193
|
|
29
|
|
12
|
|
10
|
|
|||||||
|
Plan participants’ contributions
|
1
|
|
1
|
|
5
|
|
6
|
|
|||||||
|
Gross benefits paid
|
(71
|
)
|
(63
|
)
|
(17
|
)
|
(16
|
)
|
|||||||
|
Foreign currency effect
|
11
|
|
2
|
|
—
|
|
—
|
|
|||||||
|
Fair value of plan assets at end of year
|
1,851
|
|
1,505
|
|
—
|
|
—
|
|
|||||||
|
Funded status
|
$
|
(320
|
)
|
$
|
(329
|
)
|
$
|
(129
|
)
|
$
|
(129
|
)
|
|||
|
Amounts recognized in consolidated balance sheets
|
|||||||||||||||
|
Non-current assets
|
$
|
97
|
|
$
|
68
|
|
$
|
—
|
|
$
|
—
|
|
|||
|
Current liabilities
|
(6
|
)
|
(6
|
)
|
(11
|
)
|
(9
|
)
|
|||||||
|
Non-current liabilities
|
(411
|
)
|
(391
|
)
|
(118
|
)
|
(120
|
)
|
|||||||
|
$
|
(320
|
)
|
$
|
(329
|
)
|
$
|
(129
|
)
|
$
|
(129
|
)
|
||||
|
Accumulated benefit obligation
|
$
|
2,093
|
|
$
|
1,773
|
|
|||||||||
|
Plans with accumulated benefit obligation in excess of the fair value of plan assets
|
|||||||||||||||
|
Projected benefit obligation
|
$
|
1,773
|
|
$
|
1,487
|
|
|||||||||
|
Accumulated benefit obligation
|
$
|
1,756
|
|
$
|
1,480
|
|
|||||||||
|
Fair value of plan assets
|
$
|
1,356
|
|
$
|
1,090
|
|
|||||||||
|
Amounts recognized in accumulated other comprehensive loss, net of tax
|
|||||||||||||||
|
Net actuarial loss (gain)
|
$
|
455
|
|
$
|
359
|
|
$
|
(3
|
)
|
$
|
(5
|
)
|
|||
|
Prior service credit
|
(4
|
)
|
(6
|
)
|
(1
|
)
|
(2
|
)
|
|||||||
|
Total recognized
|
$
|
451
|
|
$
|
353
|
|
$
|
(4
|
)
|
$
|
(7
|
)
|
|||
|
1
|
In December 2011, our Board of Directors approved a plan amendment that froze our U.S. ERP effective on April 1, 2012. This amendment decreased our pension benefit liabilities by
$129 million
, and resulted in an after-tax decrease in accumulated other comprehensive loss of
$82 million
. We also recorded an immaterial amount of pension plan curtailment expense in 2011 as a result of the plan amendment.
|
The actuarial loss included in accumulated other comprehensive loss for our retirement plans and expected to be recognized in net periodic pension cost during the year ending December 31, 2013 is
$25 million
. There is an immaterial amount of prior service
70
credit included in accumulated other comprehensive loss for our retirement plans expected to be recognized in net periodic benefit cost during the year ending December 31, 2013.
The prior service credit included in accumulated other comprehensive loss for our postretirement plans and expected to be recognized in net periodic benefit cost during the year ending December 31, 2013 is
$1 million
. There is
no
actuarial loss in accumulated other comprehensive loss for our postretirement plans expected to be recognized in net periodic benefit cost during the year ending December 31, 2013.
Net Periodic Cost
For purposes of determining annual pension cost, prior service costs are being amortized straight-line over the average remaining service period of employees expected to receive benefits.
A summary of net periodic benefit cost for our retirement and postretirement plans for the years ended December 31, is as follows:
|
(in millions)
|
Retirement Plans
|
Postretirement Plans
|
|||||||||||||||||||||
|
|
2012
|
2011
|
2010
|
2012
|
2011
|
2010
|
|||||||||||||||||
|
Service cost
|
$
|
24
|
|
$
|
67
|
|
$
|
61
|
|
$
|
3
|
|
$
|
3
|
|
$
|
3
|
|
|||||
|
Interest cost
|
93
|
|
99
|
|
94
|
|
5
|
|
6
|
|
7
|
|
|||||||||||
|
Expected return on assets
|
(124
|
)
|
(127
|
)
|
(112
|
)
|
—
|
|
—
|
|
—
|
|
|||||||||||
|
Amortization of:
|
|||||||||||||||||||||||
|
Actuarial loss
|
32
|
|
31
|
|
15
|
|
—
|
|
—
|
|
—
|
|
|||||||||||
|
Prior service credit
|
(1
|
)
|
—
|
|
—
|
|
(1
|
)
|
(1
|
)
|
(1
|
)
|
|||||||||||
|
Net periodic benefit cost
|
$
|
24
|
|
$
|
70
|
|
$
|
58
|
|
$
|
7
|
|
$
|
8
|
|
$
|
9
|
|
|||||
Our United Kingdom (“U.K.”) retirement plan accounted for
$3 million
in 2012 and 2011 and
$6 million
in 2010 of the net periodic benefit cost attributable to the funded plans.
Other changes in plan assets and benefit obligations recognized in other comprehensive income, net of tax for the years ended December 31, are as follows:
|
(in millions)
|
Retirement Plans
|
Postretirement Plans
|
|||||||||||||||||||||
|
|
2012
|
2011
|
2010
|
2012
|
2011
|
2010
|
|||||||||||||||||
|
Net actuarial loss (gain)
|
$
|
116
|
|
$
|
65
|
|
$
|
41
|
|
$
|
2
|
|
$
|
(12
|
)
|
$
|
(6
|
)
|
|||||
|
Recognized actuarial gain
|
(20
|
)
|
(18
|
)
|
(9
|
)
|
—
|
|
—
|
|
—
|
|
|||||||||||
|
Prior service credit
|
2
|
|
—
|
|
—
|
|
1
|
|
1
|
|
1
|
|
|||||||||||
|
Total recognized
|
$
|
98
|
|
$
|
47
|
|
$
|
32
|
|
$
|
3
|
|
$
|
(11
|
)
|
$
|
(5
|
)
|
|||||
The total cost for our retirement plans was
$129 million
for 2012,
$175 million
for 2011 and
$156 million
for 2010. Included in the total retirement plans cost are defined contribution plans cost of
$86 million
for 2012,
$88 million
for 2011 and
$83 million
2010.
71
Assumptions
|
|
Retirement Plans
|
Postretirement Plans
|
|||||||||||||||
|
|
2012
|
2011
|
2010
|
2012
|
2011
|
2010
|
|||||||||||
|
Benefit obligation:
1
|
|||||||||||||||||
|
Discount rate
|
4.1
|
%
|
5.1
|
%
|
5.4
|
%
|
3.45
|
%
|
4.45
|
%
|
4.7
|
%
|
|||||
|
Compensation increase factor
|
N/A
|
|
4.5
|
%
|
4.5
|
%
|
|||||||||||
|
Net periodic cost:
|
|||||||||||||||||
|
Weighted-average healthcare cost rate
2
|
7.5
|
%
|
8.0
|
%
|
8.0
|
%
|
|||||||||||
|
Discount rate - U.S. plan
3
|
5.1
|
%
|
5.4
|
%
|
5.95
|
%
|
4.45
|
%
|
4.65
|
%
|
5.3
|
%
|
|||||
|
Discount rate - U.K. plan
3
|
5.1
|
%
|
5.5
|
%
|
5.9
|
%
|
|||||||||||
|
Compensation increase factor - U.S. plan
|
4.5
|
%
|
4.5
|
%
|
5.5
|
%
|
|||||||||||
|
Compensation increase factor - U.K. plan
|
5.85
|
%
|
6.25
|
%
|
6.25
|
%
|
|||||||||||
|
Return on assets
4
|
7.75
|
%
|
8.0
|
%
|
8.0
|
%
|
|||||||||||
|
1
|
These assumptions for the retirement plans relate to our U.S. ERP and a compensation increase factor is no longer applicable for 2012 because there are no further salary increases as the U.S. ERP was frozen in April 2012.
|
|
2
|
The assumed weighted-average healthcare cost trend rate will decrease ratably from
7.5%
in 2012 to
5%
in 2018 and remain at that level thereafter. Assumed healthcare cost trends have an effect on the amounts reported for the healthcare plans. A one percentage point change in assumed healthcare cost trend creates the following effects:
|
|
(in millions)
|
1% point
increase
|
1% point
decrease
|
|||||
|
Effect on postretirement obligation
|
$
|
4
|
|
$
|
(4
|
)
|
|
|
3
|
Effective January 1, 2013, we changed our discount rate assumption on our U.S. retirement plans to
4.1%
from
5.1%
in 2012 and changed our discount rate assumption on our U.K. plan to
4.8%
from
5.1%
in 2012.
|
|
4
|
The expected return on assets assumption is calculated based on the plan’s asset allocation strategy and projected market returns over the long-term. Effective January 1, 2013, we changed our return on assets assumption to
7.25%
from
7.75%
in 2012.
|
Cash Flows
In December 2003, the Medicare Prescription Drug, Improvement and Modernization Act of 2003 (the “Act”) was enacted. The Act established a prescription drug benefit under Medicare, known as “Medicare Part D”, and a federal subsidy to sponsors of retiree healthcare benefit plans that provide a benefit that is at least actuarially equivalent to Medicare Part D. Our benefits provided to certain participants are at least actuarially equivalent to Medicare Part D, and, accordingly, we are entitled to a subsidy.
Expected employer contributions in 2013 are
$30 million
for our retirement plans and
$12 million
for our postretirement plans. In 2013, we may elect to make additional non-required contributions depending on investment performance and the pension plan status. Information about the expected cash flows for our retirement and postretirement plans and the impact of the Medicare subsidy is as follows:
|
(in millions)
|
|
Postretirement Plans
2
|
|||||||||||||||||
|
Retirement
Plans
1
|
Gross
payments
|
Retiree
contributions
|
Medicare
subsidy
|
Net
payments
|
|||||||||||||||
|
2013
|
$
|
72
|
|
$
|
19
|
|
$
|
(7
|
)
|
$
|
(1
|
)
|
$
|
11
|
|
||||
|
2014
|
75
|
|
21
|
|
(8
|
)
|
(1
|
)
|
12
|
|
|||||||||
|
2015
|
78
|
|
22
|
|
(10
|
)
|
(1
|
)
|
11
|
|
|||||||||
|
2016
|
82
|
|
24
|
|
(12
|
)
|
(1
|
)
|
11
|
|
|||||||||
|
2017
|
86
|
|
25
|
|
(14
|
)
|
(1
|
)
|
10
|
|
|||||||||
|
2018-2022
|
484
|
|
151
|
|
(98
|
)
|
(3
|
)
|
50
|
|
|||||||||
|
1
|
Reflects the total benefits expected to be paid from the plans or from our assets including both our share of the benefit cost and the participants’ share of the cost.
|
72
|
2
|
Reflects the total benefits expected to be paid from our assets.
|
Fair Value of Plan Assets
In accordance with authoritative guidance for fair value measurements certain assets and liabilities are required to be recorded at fair value. Fair value is defined as the amount that would be received for selling an asset or paid to transfer a liability in an orderly transaction between market participants. A fair value hierarchy has been established which requires us to maximize the use of observable inputs and minimize the use of unobservable inputs when measuring fair value. The three levels of inputs used to measure fair value are as follows:
|
•
|
Level 1 - Unadjusted quoted prices in active markets for identical assets or liabilities.
|
|
•
|
Level 2 - Observable inputs other than Level 1 prices, such as quoted prices for similar assets or liabilities; quoted prices in markets that are not active; or other inputs that are observable or can be corroborated by observable market data for substantially the full term of the assets or liabilities.
|
|
•
|
Level 3 - Unobservable inputs that are supported by little or no market activity and that are significant to the fair value of the assets or liabilities.
|
The fair value of our defined benefit plans assets as of December 31, 2012 and 2011, by asset class is as follows:
|
(in millions)
|
December 31, 2012
|
||||||||||||||
|
|
Total
|
Level 1
|
Level 2
|
Level 3
|
|||||||||||
|
Cash and short-term investments, and other
|
$
|
180
|
|
$
|
2
|
|
$
|
178
|
|
$
|
—
|
|
|||
|
Equity securities:
|
|||||||||||||||
|
U.S. indexes
1
|
399
|
|
119
|
|
280
|
|
—
|
|
|||||||
|
U.S. growth and value
|
344
|
|
307
|
|
37
|
|
—
|
|
|||||||
|
U.K.
|
154
|
|
85
|
|
69
|
|
—
|
|
|||||||
|
International, excluding U.K.
|
225
|
|
137
|
|
87
|
|
1
|
|
|||||||
|
Fixed income securities:
|
|||||||||||||||
|
Long duration strategy
2
|
370
|
|
—
|
|
370
|
|
—
|
|
|||||||
|
Intermediate duration securities
|
3
|
|
—
|
|
3
|
|
—
|
|
|||||||
|
Agency mortgage backed securities
|
13
|
|
—
|
|
13
|
|
—
|
|
|||||||
|
Asset backed securities
|
10
|
|
—
|
|
10
|
|
—
|
|
|||||||
|
Non-agency mortgage backed securities
3
|
52
|
|
—
|
|
52
|
|
—
|
|
|||||||
|
U.K.
4
|
41
|
|
—
|
|
41
|
|
—
|
|
|||||||
|
International, excluding U.K.
|
43
|
|
—
|
|
43
|
|
—
|
|
|||||||
|
Real estate:
|
|||||||||||||||
|
U.K.
5
|
17
|
|
—
|
|
—
|
|
17
|
|
|||||||
|
Total
|
$
|
1,851
|
|
$
|
650
|
|
$
|
1,183
|
|
$
|
18
|
|
|||
73
|
(in millions)
|
December 31, 2011
|
||||||||||||||
|
|
Total
|
Level 1
|
Level 2
|
Level 3
|
|||||||||||
|
Cash and short-term investments, and other
|
$
|
32
|
|
$
|
2
|
|
$
|
30
|
|
$
|
—
|
|
|||
|
Equity securities:
|
|||||||||||||||
|
U.S. indexes
1
|
306
|
|
125
|
|
181
|
|
—
|
|
|||||||
|
U.S. growth and value
|
370
|
|
370
|
|
—
|
|
—
|
|
|||||||
|
U.K.
|
144
|
|
78
|
|
66
|
|
—
|
|
|||||||
|
International, excluding U.K.
|
297
|
|
157
|
|
139
|
|
1
|
|
|||||||
|
Fixed income securities:
|
|||||||||||||||
|
Long duration strategy
2
|
195
|
|
—
|
|
195
|
|
—
|
|
|||||||
|
Non-agency mortgage backed securities
3
|
66
|
|
—
|
|
66
|
|
—
|
|
|||||||
|
U.K.
4
|
45
|
|
—
|
|
45
|
|
—
|
|
|||||||
|
International, excluding U.K.
|
28
|
|
—
|
|
28
|
|
—
|
|
|||||||
|
Real estate:
|
|||||||||||||||
|
U.K.
5
|
22
|
|
—
|
|
—
|
|
22
|
|
|||||||
|
Total
|
$
|
1,505
|
|
$
|
732
|
|
$
|
750
|
|
$
|
23
|
|
|||
|
1
|
Includes securities that are tracked in the following indexes: S&P 500, S&P MidCap 400, S&P MidCap 400 Growth and S&P Smallcap 600.
|
|
2
|
Includes securities that are investment grade obligations of issuers in the U.S.
|
|
3
|
Includes U.S. mortgage-backed securities that are not backed by the U.S. government.
|
|
4
|
Includes securities originated by the government of and other issuers from the U.K.
|
|
5
|
Includes a fund which holds real estate properties in the U.K.
|
For securities that are quoted in active markets, the trustee/custodian determines fair value by applying securities’ prices obtained from its pricing vendors. For commingled funds that are not actively traded, the trustee applies pricing information provided by investment management firms to the unit quantities of such funds. Investment management firms employ their own pricing vendors to value the securities underlying each commingled fund. Underlying securities that are not actively traded derive their prices from investment managers, which in turn, employ vendors that use pricing models (e.g. discounted cash flow, comparables). The domestic defined benefit plans have no investment in our stock, except through the S&P 500 commingled index fund.
The trustee obtains estimated prices from vendors for securities that are not easily quotable and they are categorized accordingly as Level 3. The following tables details further information our plan assets where we have used significant unobservable inputs (Level 3):
|
(in millions)
|
|||
|
Beginning balance as of December 31, 2011
|
$
|
23
|
|
|
Capital distributions
|
(5
|
)
|
|
|
Ending balance as of December 31, 2012
|
$
|
18
|
|
Pension Trusts’ Asset Allocations
There are
two
pension trusts,
one
in the U.S. and
one
in the U.K.
|
•
|
The U.S. pension trust had assets of
$1.5 billion
and
$1.2 billion
as of December 31, 2012 and 2011, respectively, and the target allocations in 2013 include
50%
domestic equities,
16%
international equity securities, and
34%
debt securities and short-term investments.
|
|
•
|
The U.K. pension trust had assets of
$318 million
and
$258 million
as of December 31, 2012 and 2011, respectively, and the target allocations in 2013 include
78%
equities,
16%
fixed income, and
6%
U.K. real estate.
|
The pension assets are invested with the goal of producing a combination of capital growth and income. The mix of assets is established after consideration of the long-term performance and risk characteristics of asset classes. Investments are selected
74
based on their potential to enhance returns, preserve capital, and reduce overall volatility. Holdings are diversified within each asset class. The portfolios employ a mix of index and actively managed equity strategies by market capitalization, style, geographic regions, and economic sectors. The fixed income strategies include U.S. long duration securities, opportunistic fixed income securities, and U.K. debt instruments. The short-term portfolio, whose primary goal is capital preservation for liquidity purposes, is composed of government and government-agency securities, un-invested cash, receivables, and payables. The portfolios do not employ any financial leverage.
U.S. Defined Contribution Plans
Assets of the defined contribution plans in the U.S. consist primarily of investment options which include actively managed equity, indexed equity, actively managed equity/bond funds, McGraw-Hill common stock, stable value, and money market strategies. There is also a self-directed mutual fund investment option. The plans purchased
620,455
and sold
869,199
shares of McGraw-Hill common stock in 2012 and purchased
695,632
and sold
796,934
shares of McGraw-Hill common stock in 2011. The plans held approximately
3.7 million
shares of McGraw-Hill common stock as of December 31, 2012 and
4.0
million shares as of December 31, 2011, with market values of
$200 million
and
$178 million
, respectively. The plans received dividends on McGraw-Hill common stock of
$13 million
during the year ended December 31, 2012 and
$4 million
during the year ended December 31, 2011.
8. Stock-Based Compensation
We issue stock-based incentive awards to our eligible employees and Directors under two employee stock ownership plans (the 1993 and 2002 Employee Stock Incentive Plans) and a Director Deferred Stock Ownership Plan.
|
•
|
1993 Employee Stock Incentive Plan
– This plan provided for the granting of incentive stock options, nonqualified stock options, stock appreciation rights (“SARs”), restricted stock awards, or other stock-based awards. No further awards may be granted under this plan; although awards granted prior to the adoption of the 2002 Plan, as amended, remain outstanding under this plan in accordance with their terms. The remaining options under this plan will expire in the first quarter of 2013.
|
|
•
|
2002 Employee Stock Incentive Plan (the “2002 Plan”)
– The 2002 Plan permits the granting of nonqualified stock options, SARs, performance stock, restricted stock and other stock-based awards.
|
|
•
|
Director Deferred Stock Ownership Plan
– Under this plan, common stock reserved may be credited to deferred stock accounts for eligible Directors. In general, the plan requires that
50%
of eligible Directors’ annual compensation plus dividend equivalents be credited to deferred stock accounts. Each Director may also elect to defer all or a portion of the remaining compensation and have an equivalent number of shares credited to the deferred stock account. Recipients under this plan are not required to provide consideration to us other than rendering service. Shares will be delivered as of the date a recipient ceases to be a member of the Board of Directors or within five years thereafter, if so elected. The plan will remain in effect until terminated by the Board of Directors or until no shares of stock remain available under the plan.
|
The number of common shares reserved for issuance are as follows:
|
(in millions)
|
December 31,
|
||
|
2012
|
2011
|
||
|
Shares available for granting under the 2002 Plan
|
26.8
|
19.2
|
|
|
Options outstanding
|
18.6
|
27.0
|
|
|
Total shares reserved for issuance
1
|
45.4
|
46.2
|
|
|
1
|
Shares reserved for issuance under the Director Deferred Stock Ownership Plan are included in the total, but are less than
0.2 million
.
|
We issue treasury shares upon exercise of stock options and the issuance of restricted stock and unit awards. To offset the dilutive effect of the exercise of employee stock options, we periodically repurchase shares, see Note 9 –
Equity
for further discussion.
Also impacting the common shares reserved for issuance was the special dividend announced in the fourth quarter of 2012. In conjunction with the special dividend, the Compensation and Leadership Development Committee of the Board of Directors decided that employees who hold stock options, performance share units and restricted unit awards under the employee stock ownership plans should receive the economic benefit of the special dividend. Therefore, employees' equity awards have been adjusted to maintain the value of the award prior to the special dividend.
75
Stock-based compensation expense and the corresponding tax benefit are as follows:
|
(in millions)
|
Years ended December 31,
|
||||||||||
|
|
2012
|
2011
|
2010
|
||||||||
|
Stock option expense
|
$
|
10
|
|
$
|
19
|
|
$
|
18
|
|
||
|
Restricted stock and unit awards expense
|
83
|
|
58
|
|
33
|
|
|||||
|
Total stock-based compensation expense
|
$
|
93
|
|
$
|
77
|
|
$
|
51
|
|
||
|
Tax benefit
|
36
|
|
29
|
|
20
|
|
|||||
Included in total stock-based compensation expense are amounts related to employees at the Company's corporate offices who transferred to MHE of
$5 million
,
$4 million
and
$2 million
for the years ended December 31, 2012, 2011 and 2010. Additionally, stock-based compensation of
$16
million,
$19
million and $
14
million is recorded in discontinued operations for the years ended December 31, 2012, 2011 and 2010, respectively, as as result of the definitive agreement to sell MHE described further in Note 2 –
Growth and Value Plan & Discontinued Operations
.
Stock Options
Stock options, which may not be granted at a price less than the fair market value of our common stock on the date of grant, vest over a
two years
service period in equal annual installments and have a maximum term of
10 years
. Therefore, stock option compensation costs are recognized from the date of grant, utilizing a two-year graded vesting method. Under this method,
fifty percent
of the costs are ratably recognized over the first twelve months with the remaining costs ratably recognized over a twenty-four month period starting from the date of grant.
We use a lattice-based option-pricing model to estimate the fair value of options granted. The following assumptions were used in valuing the options granted (in 2012, stock options were not granted as part of employees' total stock-based incentive awards):
|
Years ended December 31,
|
|||||||||
|
|
2011
|
2010
|
|||||||
|
Risk-free average interest rate
|
0.2-3.5%
|
|
0.3-4.2%
|
|
|||||
|
Dividend yield
|
2.5-3.0%
|
|
2.9-3.1%
|
|
|||||
|
Volatility
|
21-51%
|
|
28-60%
|
|
|||||
|
Expected life (years)
|
6.1-6.2
|
|
5.8-7.0
|
|
|||||
|
Weighted-average grant-date fair value per option
|
$
|
10.61
|
|
$
|
10.02
|
|
|||
Because lattice-based option-pricing models incorporate ranges of assumptions, those ranges are disclosed. These assumptions are based on multiple factors, including historical exercise patterns, post-vesting termination rates, expected future exercise patterns and the expected volatility of our stock price. The risk-free interest rate is the imputed forward rate based on the U.S. Treasury yield at the date of grant. We use the historical volatility of our stock price over the expected term of the options to estimate the expected volatility. The expected term of options granted is derived from the output of the lattice model and represents the period of time that options granted are expected to be outstanding.
Stock option activity is as follows:
|
(in millions, except per award amounts)
|
Shares
|
Weighted average exercise price
|
Weighted-average remaining years of contractual term
|
Aggregate intrinsic value
|
|||||||||
|
Options outstanding as of December 31, 2011
|
27.0
|
|
$
|
39.96
|
|
||||||||
|
Granted
1
|
0.7
|
|
1
|
|
—
|
|
|||||||
|
Exercised
|
(8.4
|
)
|
$
|
35.61
|
|
||||||||
|
Canceled, forfeited and expired
|
(0.7
|
)
|
$
|
52.85
|
|
||||||||
|
Options outstanding as of December 31, 2012
|
18.6
|
|
$
|
39.58
|
|
4.1
|
$
|
288
|
|
||||
|
Options exercisable as of December 31, 2012
|
17.5
|
|
$
|
39.71
|
|
3.8
|
$
|
270
|
|
||||
|
1
|
These shares relate to the adjustment in connection with the special dividend announced in the fourth quarter of 2012 and, as such, a weighted average exercise price was not calculated.
|
76
|
(in millions, except per award amounts)
|
Shares
|
Weighted-average grant-date fair value
|
|||||
|
Nonvested options outstanding as of December 31, 2011
|
3.6
|
|
$
|
10.41
|
|
||
|
Vested
1
|
(2.4
|
)
|
$
|
10.34
|
|
||
|
Forfeited
|
(0.1
|
)
|
$
|
10.41
|
|
||
|
Nonvested options outstanding as of December 31, 2012
|
1.1
|
|
$
|
10.61
|
|
||
|
Total unrecognized compensation expense related to nonvested options
|
$
|
1
|
|
||||
|
Weighted-average years to be recognized over
|
0.3
|
|
|||||
|
1
|
The majority of the share adjustment that was recorded in connection with the special dividend announced in the fourth quarter of 2012 related to options that have previously vested, therefore, the shares granted were offset by the equivalent vested amount.
|
The total fair value of our stock options that vested during the years ended December 31, 2012, 2011 and 2010 was
$21 million
,
$18 million
and
$20 million
, respectively.
We receive a tax deduction for certain stock option exercises during the period in which the options are exercised, generally for the excess of the quoted market value of the stock at the time of the exercise of the options over the exercise price of the options (“intrinsic value”). For the years ended December 31, 2012, 2011 and 2010,
$42 million
,
$20 million
and
$2 million
, respectively, of excess tax benefits from stock options exercised are reported in our cash flows used for financing activities.
Information regarding our stock option exercises is as follows:
|
(in millions)
|
Years ended December 31,
|
||||||||||
|
|
2012
|
2011
|
2010
|
||||||||
|
Net cash proceeds from the exercise of stock options
|
$
|
299
|
|
$
|
139
|
|
$
|
50
|
|
||
|
Total intrinsic value of stock option exercises
|
$
|
120
|
|
$
|
41
|
|
$
|
16
|
|
||
|
Income tax benefit realized from stock option exercises
|
$
|
47
|
|
$
|
16
|
|
$
|
6
|
|
||
Restricted Stock and Unit Awards
Restricted stock and unit awards (performance and non-performance) have been granted under the 2002 Plan. Restricted stock and unit performance awards will vest only if we achieve certain financial goals over the performance period. Restricted stock non-performance awards have various vesting periods (generally three years), with vesting beginning on the first anniversary of the awards. Recipients of restricted stock and unit awards are not required to provide consideration to us other than rendering service.
The stock-based compensation expense for restricted stock and unit awards is determined based on the market price of our stock at the grant date of the award applied to the total number of awards that are anticipated to fully vest. For restricted stock and unit performance awards, adjustments are made to expense dependent upon financial goals achieved.
Restricted stock and unit activity for performance and non-performance awards is as follows:
|
(in millions, except per award amounts)
|
Shares
|
Weighted-average grant-date fair value
|
|||||
|
Nonvested shares as of December 31, 2011
|
4.4
|
|
$
|
36.78
|
|
||
|
Granted
1
|
1.7
|
|
$
|
44.38
|
|
||
|
Vested
|
(2.5
|
)
|
$
|
35.24
|
|
||
|
Forfeited
|
(0.2
|
)
|
$
|
37.54
|
|
||
|
Nonvested shares as of December 31, 2012
|
3.4
|
|
$
|
40.49
|
|
||
|
Total unrecognized compensation expense related to nonvested options
|
$
|
115
|
|
||||
|
Weighted-average years to be recognized over
|
1.7
|
|
|||||
|
1
|
There are
0.2 million
shares within the total amount granted during the year that relate to the adjustment in connection with the special dividend announced in the fourth quarter of 2012.
|
77
|
|
Years ended December 31,
|
||||||||||
|
|
2012
|
2011
|
2010
|
||||||||
|
Weighted-average grant-date fair value per award
|
$
|
44.38
|
|
$
|
37.80
|
|
$
|
33.72
|
|
||
|
Total fair value of restricted stock and unit awards vested
|
$
|
90
|
|
$
|
1
|
|
$
|
1
|
|
||
|
Tax benefit relating to restricted stock activity
|
$
|
32
|
|
$
|
22
|
|
$
|
13
|
|
||
9. Equity
Capital Stock
Two million
shares of preferred stock, par value
$1
per share, are authorized; none have been issued.
The following table provides detail of our dividend history. On December 6, 2012, our Board of Directors approved a special dividend in the amount of
$2.50
per share on our common stock, payable on December 27, 2012 to shareholders on record on December 18, 2012. On January 30, 2013, the Board of Directors approved an increase in the dividends for 2013 to a quarterly rate of
$0.28
per common share.
|
|
Years ended December 31,
|
||||||||||
|
|
2012
|
2011
|
2010
|
||||||||
|
Quarterly dividend rate
|
$
|
0.255
|
|
$
|
0.25
|
|
$
|
0.235
|
|
||
|
Annualized dividend rate
|
$
|
1.02
|
|
$
|
1.00
|
|
$
|
0.94
|
|
||
|
Special dividend
|
$
|
2.50
|
|
$
|
—
|
|
$
|
—
|
|
||
|
Dividends paid (in millions)
|
$
|
984
|
|
$
|
296
|
|
$
|
292
|
|
||
Stock Repurchases
In 2007 the Board of Directors approved a stock repurchase program authorizing the purchase of up to
45 million
shares (the “2007 Repurchase Program”). On June 29, 2011, the Board of Directors approved a new stock repurchase program authorizing the purchase of up to
50 million
shares (the “2011 Repurchase Program”), which was approximately
17%
of the total shares of our outstanding common stock at that time.
Share repurchases were as follows:
|
(in millions, except average price)
|
Years ended December 31,
|
||||||||||
|
2012
|
2011
|
2010
|
|||||||||
|
Total number of shares purchased - 2011 Repurchase Program
1
|
6.8
|
|
26.3
|
|
—
|
|
|||||
|
Total number of shares purchased - 2007 Repurchase Program
|
—
|
|
8.4
|
|
8.7
|
|
|||||
|
Average price paid per share
2
|
$
|
50.35
|
|
$
|
40.48
|
|
$
|
29.37
|
|
||
|
Total cash utilized
|
$
|
295
|
|
$
|
1,500
|
|
$
|
256
|
|
||
|
1
|
2012 includes shares received at the conclusion of the uncollared Accelerated Share Repurchase Agreement described in more detail below.
|
|
2
|
Average price paid per share information does not include the accelerated share repurchase transaction as discussed in more detail below.
|
Our purchased shares may be used for general corporate purposes, including the issuance of shares for stock compensation plans and to offset the dilutive effect of the exercise of employee stock options. As of December 31, 2012,
16.9 million
shares remained available under the 2011 Repurchase Program. As of December 31, 2012, there were
no
remaining shares available under the 2007 Repurchase Program. The 2011 Repurchase Program has no expiration date and purchases under this program may be made from time to time on the open market and in private transactions, depending on market conditions.
Accelerated Share Repurchase Program
On December 7, 2011 we entered into
two
separate Accelerated Share Repurchase Agreements (“ASR Agreements”) with a financial institution to initiate share repurchases, aggregating
$500 million
.
78
|
•
|
The first ASR Agreement was structured as an uncollared ASR Agreement for the repurchase of
$250 million
of shares at a per share price equal to the volume weighted average price (“VWAP”) of our common stock between December 7, 2011 and February 22, 2012.
|
|
•
|
The second ASR Agreement was structured as a capped ASR Agreement for the repurchase of
$250 million
of shares at a per share price that was capped based on
110%
of the VWAP of our common stock during the period from December 7, 2011 through December 21, 2011. This capped price set the minimum number of shares that will be repurchased.
|
Uncollared ASR Agreement
We paid
$250 million
on December 12, 2011 and received an initial delivery of approximately
5 million
shares from the financial institution subject to a
20%
, or
$50 million
, holdback. At the conclusion of the uncollared ASR Agreement, which occurred on February 22, 2012, we received
0.8 million
additional shares bringing the total shares repurchased under the uncollared ASR Agreement to approximately
6 million
shares.
Capped ASR Agreement
We paid
$250 million
and received approximately
5 million
shares representing the minimum number of common shares to be repurchased based on a calculation using a specific capped price per share. At the conclusion of the capped ASR agreement, which occurred on April 23, 2012, we received
0.1 million
additional shares bringing the total shares repurchased under the capped ASR Agreement to approximately
5 million
shares.
The ASR Agreements were accounted for as two transactions; a stock purchase transaction and a forward stock purchase contract. The initial delivery of shares resulted in an immediate reduction of our outstanding shares used to determine our weighted average common shares outstanding for purposes of calculating basic and diluted net earnings per share. The forward stock purchase contract is classified as an equity instrument. As of December 31, 2012 and 2011, the excess amount paid on a per share basis for the minimum shares purchased under the capped ASR Agreement was recorded as a reduction to additional paid-in capital in our consolidated balance sheets. We have evaluated the capped ASR Agreement for its potential dilution and as a result, these additional shares were not included in our weighted average diluted earnings per share calculation because their effect would be antidilutive.
Redeemable Noncontrolling Interests
The agreement with the minority partners of our S&P Dow Jones Indices LLC partnership discussed in Note 3 –
Acquisitions and Divestitures
contains redemption features whereby interests held by minority partners are redeemable either (i) at the option of the holder or (ii) upon the occurrence of an event that is not solely within our control. Specifically, under the terms of the operating agreement of S&P Dow Jones Indices LLC, after December 31, 2017, CME Group and CGIS will have the right at any time to sell, and we are obligated to buy, at least
20%
of their share in S&P Dow Jones Indices LLC. In addition, in the event there is a change of control of the Company, for the
15
days following a change in control, CME Group and CGIS will have the right to put their interest to us at the then fair value of CME Group's and CGIS' minority interest.
If interests were to be redeemed under this agreement, we would generally be required to purchase the interest at fair value on the date of redemption. This interest is presented on the consolidated balance sheet outside of equity under the caption “Redeemable noncontrolling interest” with an initial value based on fair value for the portion attributable to the net assets we acquired, and based on our historical cost for the portion attributable to our S&P Index business. Redeemable noncontrolling interest will be adjusted each reporting period to its estimated redemption value using a combination of an income and market valuation approach, but in no event to an amount less than its initial fair value. Any adjustments to the redemption value will impact retained income.
Noncontrolling interests that do not contain such redemption features are presented in equity.
Ch
anges to redeemable noncontrolling interest during the year ended December 31, 2012 were as follows:
|
(in millions)
|
|||
|
Opening redeemable noncontrolling interest
|
$
|
792
|
|
|
Net income attributable to noncontrolling interest
|
34
|
|
|
|
Distributions to noncontrolling interest
|
(33
|
)
|
|
|
Redemption value adjustment
|
17
|
|
|
|
Ending redeemable noncontrolling interest
|
$
|
810
|
|
79
10. Earnings per Share
Basic earnings per common share (“EPS”) is computed by dividing net income attributable to the common shareholders of the Company by the weighted-average number of common shares outstanding. Diluted EPS is computed in the same manner as basic EPS, except the number of shares is increased to include additional common shares that would have been outstanding if potential common shares with a dilutive effect had been issued. Potential common shares consist primarily of stock options, restricted stock and restricted stock units calculated using the treasury stock method. The calculation for basic and diluted EPS is as follows:
|
(in millions, except per share data)
|
Years ended December 31,
|
||||||||||
|
|
2012
|
2011
|
2010
|
||||||||
|
Amount attributable to The McGraw-Hill Companies, Inc. common shareholders:
|
|||||||||||
|
Income from continuing operations
|
$
|
676
|
|
$
|
607
|
|
$
|
581
|
|
||
|
(Loss) income from discontinued operations
|
(239
|
)
|
304
|
|
247
|
|
|||||
|
Net income attributable to the Company
|
$
|
437
|
|
$
|
911
|
|
$
|
828
|
|
||
|
Basic weighted-average number of common shares outstanding
|
278.6
|
|
298.1
|
|
309.4
|
|
|||||
|
Effect of stock options and other dilutive securities
|
6.0
|
|
5.5
|
|
2.8
|
|
|||||
|
Diluted weighted-average number of common shares outstanding
|
284.6
|
|
303.6
|
|
312.2
|
|
|||||
|
Basic EPS:
|
|||||||||||
|
Income from continuing operations
|
$
|
2.43
|
|
$
|
2.03
|
|
$
|
1.88
|
|
||
|
(Loss) income from discontinued operations
|
(0.86
|
)
|
1.02
|
|
0.80
|
|
|||||
|
Net income
|
$
|
1.57
|
|
$
|
3.05
|
|
$
|
2.68
|
|
||
|
Diluted EPS:
|
|||||||||||
|
Income from continuing operations
|
$
|
2.37
|
|
$
|
2.00
|
|
$
|
1.86
|
|
||
|
(Loss) income from discontinued operations
|
(0.84
|
)
|
1.00
|
|
0.79
|
|
|||||
|
Net income
|
$
|
1.53
|
|
$
|
3.00
|
|
$
|
2.65
|
|
||
There were
1.4 million
,
1.6 million
and
1.4 million
restricted performance shares outstanding as of December 31, 2012, 2011 and 2010, respectively, that were not included in the computation of diluted earnings per common share because the necessary vesting conditions have not yet been met.
The effect of the potential exercise of stock options is excluded from the computation of diluted earnings per share when the average market price of the common stock is lower than the exercise price of the related option during the period because the effect would have been antidilutive. For the years ended December 31, 2012, 2011 and 2010, the number of stock options excluded from the computation was
3.4 million
,
10.1 million
and
23.2 million
, respectively.
11. Restructuring
In order to contain costs and mitigate the impact of current and expected future economic conditions, as well as continued focus on process improvements, we have initiated various restructuring plans over the last several years. The plans that are currently active with a remaining liability are further described below. The charges for each restructuring plan are classified as selling and general expenses within the consolidated statements of income and the reserves are included in other current liabilities in the consolidated balance sheets.
In certain circumstances, reserves are no longer needed because of efficiencies in carrying out the plans or because employees previously identified for separation resigned from the Company and did not receive severance or were reassigned due to circumstances not foreseen when the original plans were initiated. In these cases, we reverse reserves through the consolidated statements of income when it is determined they are no longer needed. As part of the definitive agreement to sell MHE to investment funds affiliated with Apollo Global Management, LLC, described further in Note 2 –
Growth and Value Plan & Discontinued Operations,
we will retain MHE's restructuring liabilities. Therefore the remaining reserves described below include MHE's restructuring liability, however, the charge associated with the reserve has been bifurcated between continuing and discontinued operations.
80
During the second half of 2012, we continued to identify opportunities for cost savings through workforce reductions and other restructuring activities as part of our Growth and Value Plan, which includes creating two independent companies with focused cost structures. Approximately
45%
of the headcount reduction related to our finance & accounting, human resource, information technology, and other support services within our shared service center as we transition various work to selected outsource providers. We recorded a pre-tax restructuring charge of $
68 million
, consisting of employee severance costs related to a company-wide workforce reduction of approximately
670
positions. This charge consisted of
$15 million
for S&P Ratings,
$19 million
for S&P Capital IQ, $
1 million
for S&P DJ Indices,
$12 million
for C&C and
$21 million
for our corporate segment. The total reserve, including MHE, was
$107
million. For the year ended
December 31, 2012
, we have reduced the reserve by $
15 million
for cash payments for employee severance costs. The remaining reserve as of
December 31, 2012
is $
92 million
.
During the fourth quarter of 2011, we initiated a restructuring plan to create a flatter and more agile organization as part of our Growth and Value Plan. We recorded a pre-tax restructuring charge of
$32 million
, consisting primarily of facility exit costs and employee severance costs related to a company-wide workforce reduction of approximately
250
positions. This charge consisted of
$9 million
for S&P Ratings,
$6 million
for C&C and
$17 million
for our corporate segment. The total reserve, including MHE, was
$66
million. In the second quarter of 2012 we recorded an additional pre-tax restructuring charge of
$5 million
primarily for employee severance costs as part of the Growth and Value Plan. For the years ended
December 31, 2012
and
December 31, 2011
, we have reduced the reserve by $
47 million
and
$4 million
, respectively, primarily relating to cash payments for employee severance costs. The remaining reserve as of
December 31, 2012
is
$20 million
.
As of
December 31, 2012
, our 2006 restructuring initiative still has a remaining reserve relating to facilities costs of
$2 million
.
12. Segment and Geographic Information
As discussed in Note 1 –
Accounting Policies
, we have
four
reportable segments: S&P Ratings, S&P Capital IQ, S&P DJ Indices and C&C. As a result of our joint venture between CME Group and Dow Jones & Company, Inc., to form a new company, S&P Dow Jones Indices LLC and how we are managing this company, combined with the formation of McGraw Hill Financial, we have separated our previously reported S&P Capital IQ / S&P Indices segment into two separate reportable segments. These changes had no impact on consolidated revenue or operating profit. Our previously reported MHE segment is reported as a discontinued operation as discussed in Note 2 –
Growth and Value Plan & Discontinued Operations
.
The Executive Committee, consisting of our principal corporate executives, is our chief operating decision-maker and evaluates performance of our segments and allocates resources based primarily on operating profit. Segment operating profit does not include unallocated expense or interest expense, which are centrally managed costs. We use the same accounting policies for our segments as those described in Note 1 –
Accounting Policie
s.
Segment information for the years ended December 31 is as follows:
|
(in millions)
|
Revenue
|
Operating Profit
|
|||||||||||||||||||||
|
|
2012
|
2011
|
2010
|
2012
|
2011
|
2010
|
|||||||||||||||||
|
S&P Ratings
|
$
|
2,034
|
|
$
|
1,767
|
|
$
|
1,695
|
|
$
|
849
|
|
$
|
720
|
|
$
|
762
|
|
|||||
|
S&P Capital IQ
|
1,124
|
|
1,031
|
|
916
|
|
208
|
|
214
|
|
171
|
|
|||||||||||
|
S&P DJ Indices
|
388
|
|
323
|
|
273
|
|
212
|
|
189
|
|
144
|
|
|||||||||||
|
C&C
|
973
|
|
896
|
|
811
|
|
248
|
|
180
|
|
153
|
|
|||||||||||
|
Intersegment elimination
|
(69
|
)
|
(63
|
)
|
(56
|
)
|
—
|
|
—
|
|
—
|
|
|||||||||||
|
Total operating segments
|
4,450
|
|
3,954
|
|
3,639
|
|
1,517
|
|
1,303
|
|
1,230
|
|
|||||||||||
|
Unallocated expense
|
—
|
|
—
|
|
—
|
|
(306
|
)
|
(226
|
)
|
(204
|
)
|
|||||||||||
|
Total
|
$
|
4,450
|
|
$
|
3,954
|
|
$
|
3,639
|
|
$
|
1,211
|
|
$
|
1,077
|
|
$
|
1,026
|
|
|||||
81
|
(in millions)
|
Depreciation & Amortization
1
|
Capital Expenditures
|
|||||||||||||||||||||
|
|
2012
|
2011
|
2010
|
2012
|
2011
|
2010
|
|||||||||||||||||
|
S&P Ratings
|
$
|
43
|
|
$
|
40
|
|
$
|
37
|
|
$
|
43
|
|
$
|
40
|
|
$
|
39
|
|
|||||
|
S&P Capital IQ
|
50
|
|
43
|
|
28
|
|
22
|
|
21
|
|
21
|
|
|||||||||||
|
S&P DJ Indices
|
8
|
|
3
|
|
3
|
|
2
|
|
2
|
|
2
|
|
|||||||||||
|
C&C
|
23
|
|
23
|
|
22
|
|
17
|
|
14
|
|
10
|
|
|||||||||||
|
Total operating segments
|
124
|
|
109
|
|
90
|
|
84
|
|
77
|
|
72
|
|
|||||||||||
|
Corporate
|
17
|
|
17
|
|
18
|
|
13
|
|
15
|
|
14
|
|
|||||||||||
|
Total
|
$
|
141
|
|
$
|
126
|
|
$
|
108
|
|
$
|
97
|
|
$
|
92
|
|
$
|
86
|
|
|||||
|
1
|
Depreciation & Amortization includes amortization of technology projects.
|
Segment information as of December 31 is as follows:
|
(in millions)
|
Total Assets
|
||||||
|
|
2012
|
2011
|
|||||
|
S&P Ratings
|
$
|
726
|
|
$
|
667
|
|
|
|
S&P Capital IQ
|
1,123
|
|
809
|
|
|||
|
S&P DJ Indices
|
1,133
|
|
303
|
|
|||
|
C&C
|
1,000
|
|
954
|
|
|||
|
Total operating segments
|
3,982
|
|
2,733
|
|
|||
|
Corporate
1
|
1,130
|
|
1,379
|
|
|||
|
Assets held for sale
|
1,940
|
|
2,508
|
|
|||
|
Total
|
$
|
7,052
|
|
$
|
6,620
|
|
|
|
1
|
Corporate assets consist principally of cash and equivalents, assets for pension benefits, deferred income taxes and leasehold improvements related to subleased areas.
|
We have operations with foreign revenue and long-lived assets in approximately
80
countries. We do not have operations in any foreign country that represent more than
8%
of our consolidated revenue. Transfers between geographic areas are recorded at agreed upon prices and intercompany revenue and profit are eliminated. No single customer accounted for more than
10%
of our consolidated revenue.
The following is a schedule of revenue and long-lived assets by geographic region:
|
(in millions)
|
Revenue
|
Long-lived Assets
|
|||||||||||||||||
|
|
Years ended December 31,
|
December 31,
|
|||||||||||||||||
|
|
2012
|
2011
|
2010
|
2012
|
2011
|
||||||||||||||
|
United States
|
$
|
2,684
|
|
$
|
2,373
|
|
$
|
2,253
|
|
$
|
2,376
|
|
$
|
873
|
|
||||
|
European region
|
1,067
|
|
951
|
|
839
|
|
441
|
|
638
|
|
|||||||||
|
Asia
|
454
|
|
423
|
|
357
|
|
70
|
|
406
|
|
|||||||||
|
Rest of the world
|
245
|
|
207
|
|
190
|
|
57
|
|
40
|
|
|||||||||
|
Total
|
$
|
4,450
|
|
$
|
3,954
|
|
$
|
3,639
|
|
$
|
2,944
|
|
$
|
1,957
|
|
||||
See Note 3 –
Acquisitions and
Divestitures
, and Note 11 –
Restructuring
, for actions that impacted the segment operating results.
13. Commitments and Contingencies
Rental Expense and Lease Obligations
We are committed under lease arrangements covering property, computer systems and office equipment. Leasehold improvements are amortized on a straight-line basis over the shorter of their economic lives or their lease term. Certain lease arrangements contain escalation clauses covering increased costs for various defined real estate taxes and operating services and the associated fees are recognized on a straight-line basis over the minimum lease period.
82
Rental expense for property and equipment under all operating lease agreements is as follows:
|
(in millions)
|
Years ended December 31,
|
||||||||||
|
|
2012
|
2011
|
2010
|
||||||||
|
Gross rental expense
|
$
|
164
|
|
$
|
158
|
|
$
|
156
|
|
||
|
Less: sublease revenue
|
(4
|
)
|
(2
|
)
|
(2
|
)
|
|||||
|
Less: Rock-McGraw rent credit
|
(19
|
)
|
(18
|
)
|
(18
|
)
|
|||||
|
Net rental expense
|
$
|
141
|
|
$
|
138
|
|
$
|
136
|
|
||
In December 2003, we sold our
45%
equity investment in Rock-McGraw, Inc., which owns our headquarters building in New York City, and remained an anchor tenant of what continues to be known as The McGraw-Hill Companies building by concurrently leasing back space through 2020. As of December 31, 2012, we leased approximately
17%
of the building space. Proceeds from the disposition were
$382 million
and the sale resulted in a pre-tax gain, net of transaction costs, of
$131 million
(
$58 million
after-tax) upon disposition. As a result of the amount of building space we retained through our leaseback, a pre-tax gain of
$212 million
(
$126 million
after-tax) was deferred upon the disposition in 2003. This gain is being amortized over the remaining lease term as a reduction in rent expense, reducing the deferred gain to
$123 million
as of
December 31, 2012
. The amount of the gain amortized during the year ended December 31, 2012 was
$13 million
. Interest expense associated with this operating lease for the year ended
December 31, 2012
was
$6 million
.
Cash amounts for future minimum rental commitments, including rent payments on the sale-leaseback, under existing non-cancelable leases with a remaining term of more than one year, along with minimum sublease rental income to be received under non-cancelable subleases are shown in the following table.
|
(in millions)
|
Rent
commitment
|
Sublease
income
|
Net rent
|
||||||||
|
2013
|
$
|
166
|
|
$
|
(8
|
)
|
$
|
158
|
|
||
|
2014
|
151
|
|
(7
|
)
|
144
|
|
|||||
|
2015
|
138
|
|
(8
|
)
|
130
|
|
|||||
|
2016
|
127
|
|
(7
|
)
|
120
|
|
|||||
|
2017
|
117
|
|
(6
|
)
|
111
|
|
|||||
|
2018 and beyond
|
373
|
|
(14
|
)
|
359
|
|
|||||
|
Total
|
$
|
1,072
|
|
$
|
(50
|
)
|
$
|
1,022
|
|
||
Related Party Agreements
We entered into a new license agreement (the "License Agreement") with the holder of S&P Dow Jones Indices LLC noncontrolling interest, CME Group, which replaced the 2005 license agreement between S&P DJ Indices and CME Group. Under the terms of the License Agreement, S&P Dow Jones Indices LLC receives a share of the profits from the trading and clearing of CME Group's equity index products. During the year ended
December 31, 2012
, S&P Dow Jones Indices LLC earned
$21 million
of revenue under the terms of the License Agreement. The entire amount of this revenue is included in our consolidated statement of income, and the portion related to the
27%
noncontrolling interest is removed in the net income attributable to noncontrolling interests.
Legal Matters
In the normal course of business both in the United States and abroad, the Company and its subsidiaries are defendants in numerous legal proceedings and are involved, from time to time, in governmental and self-regulatory agency proceedings which may result in adverse judgments, damages, fines or penalties. Also, various governmental and self-regulatory agencies regularly make inquiries and conduct investigations concerning compliance with applicable laws and regulations.
A writ of summons was served on The McGraw-Hill Companies, SRL and on The McGraw-Hill Companies, SA (both indirect subsidiaries of the Company) (collectively, “Standard & Poor's”) on September 29, 2005 and October 7, 2005, respectively, in an action brought in the Tribunal of Milan, Italy by Enrico Bondi (“Bondi”), the Extraordinary Commissioner of Parmalat Finanziaria S.p.A. and Parmalat S.p.A. (collectively, “Parmalat”). Bondi had brought numerous other lawsuits in both Italy and the United States against entities and individuals who had dealings with Parmalat. In this suit, Parmalat claims that Standard & Poor's, which had issued investment grade ratings on Parmalat until shortly before Parmalat's collapse in December 2003, breached its duty to
83
issue an independent and professional rating and negligently and knowingly assigned inflated ratings in order to retain Parmalat's business. Alleging joint and several liability, Parmalat claims damages of euros
4,073,984,120
(representing the value of bonds issued by Parmalat and the rating fees paid by Parmalat) with interest, plus damages to be ascertained for Standard & Poor's alleged complicity in aggravating Parmalat's financial difficulties and/or for having contributed in bringing about Parmalat's indebtedness towards its bondholders, and legal fees. On June 29, 2011, the Court issued its final decision dismissing in its entirety Parmalat's main damages claim which was based on the value of the bonds issued. The Court ordered Standard & Poor's to pay Parmalat the sum of approximately euros
784,000
(approximately
$1.1
million), representing the amount of rating fees paid to Standard & Poor's by Parmalat, plus interest from the date of service of the Writ of Summons. The Court also ordered Standard & Poor's to reimburse Parmalat for euros
47,390
(less than
$0.1
million) in trial costs and for its share of fees paid to Court-appointed experts, amounting to euros
67,797
(also less than
$0.1
million). On September 29, 2012, Parmalat submitted a brief to the Court of Appeals of Milan appealing the judgment issued by the Tribunal of Milan. An initial hearing on the appeal is scheduled to take place on May 29, 2013. Standard & Poor's response to the appeal, including a cross-appeal, if any, must be filed at least
20
days prior to the initial hearing.
In a separate proceeding, the prosecutor's office in Parma, Italy is conducting an investigation into the bankruptcy of Parmalat. In June 2006, the prosecutor's office issued a Note of Completion of an Investigation (“Note of Completion”) concerning allegations, based on Standard & Poor's investment grade ratings of Parmalat, that individual Standard & Poor's rating analysts conspired with Parmalat insiders and rating advisors to fraudulently or negligently cause the Parmalat bankruptcy. The Note of Completion was served on
eight
Standard & Poor's rating analysts. While not a formal charge, the Note of Completion indicates the prosecutor's intention that the named rating analysts should appear before a judge in Parma for a preliminary hearing, at which hearing the judge will determine whether there is sufficient evidence against the rating analysts to proceed to trial. No date has been set for the preliminary hearing. On July 7, 2006, a defense brief was filed with the Parma prosecutor's office on behalf of the rating analysts.
On October 8, 2009, an action was filed in the District Court for the Southern District of New York entitled Reed Construction Data, Inc. v. The McGraw-Hill Companies, Inc. in which Reed Construction Data asserted
eleven
claims under various state and federal laws against the Company relating to alleged misappropriation and unfair competition by McGraw-Hill Construction and seeking an unspecified amount of damages, plus attorneys' fees and costs. In response to the Company's motion to dismiss
five
of the
eleven
claims in the Reed action, Plaintiff filed an Amended Complaint on December 10, 2009, among other things adding an allegation that McGraw-Hill Construction misappropriated Plaintiff's confidential and trade secret information regarding specific construction projects. The Company filed a renewed motion to dismiss
five
of the
eleven
claims in the Amended Complaint on January 22, 2010. On September 14, 2010, the Court granted the Company's motion to dismiss
three
of the
five
claims, including claims that alleged violations by the Company of the Racketeer Influenced and Corrupt Organizations Act (RICO) and conspiracy to violate RICO. On May 31, 2011, the Court granted Plaintiff's motion to file a Second Amended Complaint that, among other things, added a false advertising claim under the Lanham Act, including a demand for treble damages and attorneys' fees. The Second Amended Complaint also contains allegations purporting to further support Reed's existing tort and antitrust claims. On June 3, 2011, the Court granted the Company's motion to file a counterclaim against Reed alleging, among other things, that Reed misappropriated the Company's trade secrets and engaged in unfair competition as a result of Reed's recruitment of former employees of the Company and use of information about the Company's customers obtained from the former employees to solicit those customers. The parties are currently engaged in fact discovery.
The Company and Standard & Poor's Ratings Services, together with other credit rating agencies, have been named in numerous lawsuits in U.S. State and Federal Courts, as well as in foreign jurisdictions, relating to the ratings activity of Standard & Poor's Ratings Services brought by alleged purchasers and issuers of rated securities. The Company and Standard & Poor's Ratings Services have also received numerous subpoenas and other government inquiries concerning the rating activity of Standard & Poor's Ratings Services in these areas and continue to respond to all such requests. Additional actions, investigations or proceedings may be initiated from time to time in the future.
In addition, the Company and certain of its officers and directors have been named in a putative class action brought under the federal securities laws by its shareholders and two putative class actions by participants in the Company's ERISA plans relating to alleged misrepresentations and omissions concerning the Company's ratings business:
On August 28, 2007, a putative shareholder class action titled Reese v. Bahash was filed in the District Court for the District of Columbia, and was subsequently transferred to the Southern District of New York. The Company and its CEO and former CFO were named as defendants in the suit, which alleged claims under the federal securities laws in connection with alleged misrepresentations and omissions made by the defendants relating to the Company's earnings and S&P's business practices. On November 3, 2008, the District Court denied Lead Plaintiff's motion to lift the discovery stay imposed by the Private Securities Litigation Reform Act in order to obtain documents S&P submitted to the SEC during the SEC's examination. The Company filed a motion to dismiss the Second Amended Complaint which was fully briefed and submitted as of May 2009. The Court granted
84
a motion by plaintiffs permitting the plaintiffs to amend the complaint on June 29, 2010 and the Third Amended Complaint was filed on July 1, 2010. Defendants' motion to dismiss the Third Amended Complaint was fully briefed. On April 2, 2012, the District Court entered judgment granting the Defendants' motion to dismiss, and dismissing all claims asserted against the Defendants in their entirety. The Lead Plaintiff appealed the dismissal order. On December 20, 2012, the United States Court of Appeals for the Second Circuit affirmed the dismissal in its entirety.
On September 10, 2008, a putative shareholder class action titled Patrick Gearren, et al. v. The McGraw-Hill Companies, Inc., et al. was filed in the District Court for the Southern District of New York against the Company, its Board of Directors, its Pension Investment Committee and the administrator of its pension plans. The Complaint alleged that the defendants breached fiduciary duties to participants in the Company's ERISA plans by allowing participants to continue to invest in Company stock as an investment option under the plans during a period when plaintiffs allege the Company's stock price to have been artificially inflated. The Complaint also asserted that defendants breached fiduciary duties under ERISA by making certain material misrepresentations and non-disclosures concerning the ratings business in plan communications and the Company's SEC filings. A virtually identical complaint was filed on June 12, 2009 in an action titled Sullivan v. The McGraw-Hill Companies, Inc. et al., Case No. 09-CV-5450 in the Southern District of New York. On February 10, 2010 both actions were dismissed in their entirety for failure to state a claim under applicable law. Both plaintiffs appealed and on October 19, 2011, the Court of Appeals for the Second Circuit affirmed the dismissals in their entirety. On February 23, 2012, the Court of Appeals denied the plaintiffs' petition for reconsideration by the full Court. Plaintiffs filed a petition with the United States Supreme Court asking it to review the decision. The Supreme Court has denied plaintiffs' request and the dismissals are now final.
On September 22, 2011 the Company received a “Wells Notice” from the staff of the U.S. Securities and Exchange Commission (the “Commission”) stating that the staff is considering recommending that the Commission institute a civil injunctive action against Standard & Poor's Ratings Services alleging violations of federal securities laws with respect to S&P's ratings for a particular 2007 offering of collateralized debt obligations, known as “Delphinus CDO 2007-1”. The Wells Notice is neither a formal allegation nor a finding of wrongdoing. It allows its recipients the opportunity to provide their perspective and to address the issues raised by the staff before any decision is made by the Commission on whether to authorize the commencement of an enforcement proceeding against its recipients. S&P has responded to the staff presenting its position on the issues raised and why the Commission should not commence enforcement proceedings.
In connection with a previously disclosed investigation by the Civil Division of the Department of Justice ("DOJ") of Standard & Poor's Financial Services LLC ("S&P"), the DOJ filed a civil complaint in the United States District Court for the Central District of California on February 4, 2013 against the Company and S&P alleging violations of the Financial Institutions Reform, Recovery and Enforcement Act of 1989 regarding S&P's ratings in 2004-2007 of certain U.S. collateralized debt obligations and S&P's rating models for certain structured finance products. S&P was notified of related state lawsuits.
The Company believes that the claims in the proceedings described above have no basis and they will be vigorously defended by the Company and/or the subsidiaries involved.
In view of the inherent difficulty of predicting the outcome of legal matters, particularly where the claimants seek very large or indeterminate damages, or where the cases present novel legal theories, involve a large number of parties or are in early stages of discovery, we cannot state with confidence what the eventual outcome of these pending matters will be, what the timing of the ultimate resolution of these matters will be or what the eventual loss, fines, penalties or impact related to each pending matter may be. We believe, based on our current knowledge, that the outcome of the legal actions, proceedings and investigations currently pending should not have a material, adverse effect on our consolidated financial condition.
85
14. Quarterly Financial Information (Unaudited)
The results of operations of MHE for all periods presented and the Broadcasting Group for 2011 have been reclassified to reflect MHE and the Broadcasting Group as discontinued operations. Refer to Note 2 –
Growth and Value Plan & Discontinued Operations
for further discussion.
|
(in millions, except per share data)
|
First
quarter
|
Second
quarter
|
Third
quarter
|
Fourth
quarter
|
Total
year
|
||||||||||||||
|
2012
|
|||||||||||||||||||
|
Revenue
|
$
|
1,035
|
|
|
$
|
1,072
|
|
|
$
|
1,116
|
|
|
$
|
1,226
|
|
|
$
|
4,450
|
|
|
Income from continuing operations
|
$
|
163
|
|
|
$
|
180
|
|
|
$
|
172
|
|
|
$
|
211
|
|
|
$
|
726
|
|
|
(Loss) income from discontinued operations
|
$
|
(36
|
)
|
|
$
|
40
|
|
|
$
|
165
|
|
|
$
|
(404
|
)
|
|
$
|
(234
|
)
|
|
Net income (loss)
|
$
|
127
|
|
|
$
|
220
|
|
|
$
|
337
|
|
|
$
|
(193
|
)
|
|
$
|
492
|
|
|
Net income attributable to The McGraw-Hill Companies, Inc. common shareholders:
|
|
||||||||||||||||||
|
Income from continuing operations
|
$
|
158
|
|
|
$
|
176
|
|
|
$
|
151
|
|
|
$
|
190
|
|
|
$
|
676
|
|
|
(Loss) income from discontinued operations
|
(35
|
)
|
|
39
|
|
|
162
|
|
|
(406
|
)
|
|
(239
|
)
|
|||||
|
Net income (loss)
|
$
|
123
|
|
|
$
|
216
|
|
|
$
|
314
|
|
|
$
|
(216
|
)
|
|
$
|
437
|
|
|
Basic earnings (loss) per share:
|
|
||||||||||||||||||
|
Continuing operations
|
$
|
0.57
|
|
|
$
|
0.63
|
|
|
$
|
0.54
|
|
|
$
|
0.68
|
|
|
$
|
2.43
|
|
|
Discontinued operations
|
(0.13
|
)
|
|
0.14
|
|
|
0.58
|
|
|
(1.46
|
)
|
|
(0.86
|
)
|
|||||
|
Net Income
|
$
|
0.44
|
|
|
$
|
0.77
|
|
|
$
|
1.13
|
|
|
$
|
(0.78
|
)
|
|
$
|
1.57
|
|
|
Diluted earnings (loss) per share:
|
|
||||||||||||||||||
|
Continuing operations
|
$
|
0.56
|
|
|
$
|
0.62
|
|
|
$
|
0.53
|
|
|
$
|
0.67
|
|
|
$
|
2.37
|
|
|
Discontinued operations
|
(0.13
|
)
|
|
0.14
|
|
|
0.57
|
|
|
(1.43
|
)
|
|
(0.84
|
)
|
|||||
|
Net Income
|
$
|
0.43
|
|
|
$
|
0.76
|
|
|
$
|
1.10
|
|
|
$
|
(0.76
|
)
|
|
$
|
1.53
|
|
|
2011
|
|||||||||||||||||||
|
Revenue
|
$
|
959
|
|
|
$
|
1,020
|
|
|
$
|
971
|
|
|
$
|
1,004
|
|
|
$
|
3,954
|
|
|
Income from continuing operations
|
$
|
165
|
|
|
$
|
181
|
|
|
$
|
167
|
|
|
$
|
113
|
|
|
$
|
626
|
|
|
(Loss) income from discontinued operations
|
$
|
(41
|
)
|
|
$
|
34
|
|
|
$
|
207
|
|
|
$
|
108
|
|
|
$
|
308
|
|
|
Net income
|
$
|
124
|
|
|
$
|
216
|
|
|
$
|
374
|
|
|
$
|
221
|
|
|
$
|
934
|
|
|
Net income attributable to The McGraw-Hill Companies, Inc. common shareholders:
|
|||||||||||||||||||
|
Income from continuing operations
|
$
|
160
|
|
|
$
|
177
|
|
|
$
|
161
|
|
|
$
|
108
|
|
|
$
|
607
|
|
|
(Loss) income from discontinued operations
|
(40
|
)
|
|
34
|
|
|
205
|
|
|
106
|
|
|
304
|
|
|||||
|
Net income
|
$
|
120
|
|
|
$
|
211
|
|
|
$
|
366
|
|
|
$
|
214
|
|
|
$
|
911
|
|
|
Basic earnings (loss) per share:
|
|||||||||||||||||||
|
Continuing operations
|
$
|
0.52
|
|
|
$
|
0.59
|
|
|
$
|
0.54
|
|
|
$
|
0.38
|
|
|
$
|
2.03
|
|
|
Discontinued operations
|
(0.13
|
)
|
|
0.11
|
|
|
0.69
|
|
|
0.37
|
|
|
1.02
|
|
|||||
|
Net Income
|
$
|
0.39
|
|
|
$
|
0.70
|
|
|
$
|
1.23
|
|
|
$
|
0.75
|
|
|
$
|
3.05
|
|
|
Diluted earnings (loss) per share:
|
|||||||||||||||||||
|
Continuing operations
|
$
|
0.52
|
|
|
$
|
0.57
|
|
|
$
|
0.53
|
|
|
$
|
0.37
|
|
|
$
|
2.00
|
|
|
Discontinued operations
|
(0.13
|
)
|
|
0.11
|
|
|
0.67
|
|
|
0.36
|
|
|
1.00
|
|
|||||
|
Net Income
|
$
|
0.39
|
|
|
$
|
0.68
|
|
|
$
|
1.21
|
|
|
$
|
0.73
|
|
|
$
|
3.00
|
|
Note - Totals presented may not sum due to rounding.
Basic and diluted earnings per share are computed independently for each quarter and full year presented. The number of weighted-average shares outstanding changes as common shares are issued pursuant to employee stock plans, as shares are repurchased by us, and other activity occurs throughout the year. Accordingly, the sum of the quarterly earnings per share data may not agree with the calculated full year earnings per share.
86
Item 9.
Changes in and Disagreements with Accountants on Accounting and Financial Disclosure
Not applicable.
Item 9a.
Controls and Procedures
We have filed the required certifications under Section 302 of the Sarbanes-Oxley Act of 2002 incorporated herein by reference from Exhibits (31.1) and (31.2) to this Form 10-K. In addition we have filed the required certifications under Section 906 of the Sarbanes-Oxley Act of 2002 incorporated herein by reference from Exhibit (32) to this Form 10-K.
This Item 9a. includes information concerning the controls and control evaluations referred to in the required certifications.
Disclosure Controls and Procedures
We maintain disclosure controls and procedures that are designed to ensure that information required to be disclosed in our reports filed with the SEC is recorded, processed, summarized and reported within the time periods specified in the SEC’s rules and forms, and that such information is accumulated and communicated to management, including our Chief Executive Officer (“CEO”) and Chief Financial Officer (“CFO”), as appropriate, to allow timely decisions regarding required disclosure.
As of December 31, 2012, an evaluation was performed under the supervision and with the participation of management, including the CEO and CFO, of the effectiveness of the design and operation of our disclosure controls and procedures (as defined in Rules 13a-15(e) and 15d-15(e) under the U.S. Securities Exchange Act of 1934). Based on that evaluation, management, including the CEO and CFO, concluded that our disclosure controls and procedures were effective as of December 31, 2012.
Management’s Annual Report on Internal Control Over Financial Reporting
Pursuant to Section 404 of the Sarbanes-Oxley Act of 2002 and as defined in Rules 13a-15(f) under the U.S. Securities Exchange Act of 1934, management is required to provide the following report on our internal control over financial reporting:
|
1.
|
Management is responsible for establishing and maintaining adequate internal control over financial reporting.
|
|
2.
|
Management has evaluated the system of internal control using the Committee of Sponsoring Organizations of the Treadway Commission (“COSO”) framework. Management has selected the COSO framework for its evaluation as it is a control framework recognized by the SEC and the Public Company Accounting Oversight Board that is free from bias, permits reasonably consistent qualitative and quantitative measurement of our internal controls, is sufficiently complete so that relevant controls are not omitted and is relevant to an evaluation of internal controls over financial reporting.
|
|
3.
|
Based on management’s evaluation under this framework, management has concluded that our internal controls over financial reporting were effective as of December 31, 2012. There are no material weaknesses in our internal control over financial reporting that have been identified by management.
|
|
4.
|
Our independent registered public accounting firm, Ernst & Young LLP, has audited our consolidated financial statements for the year ended December 31, 2012, and has issued their reports on the financial statements and the effectiveness of our internal control over financial reporting. These reports are located on pages 47 and 48 of this Form 10-K.
|
Changes in Internal Control over Financial Reporting
There have been no changes in our internal control over financial reporting during the most recent quarter that have materially affected, or are reasonably likely to materially affect, our internal control over financial reporting.
However, we initiated a number of outsourcing initiatives in 2012 relating to certain information technology, human resources, accounting and transaction processing processes. These initiatives are expected to be fully implemented throughout 2013. We do not believe that these initiatives have had an adverse effect on the internal control over financial reporting.
Item 9b.
Other Information
Not applicable.
87
Item 10.
Directors, Executive Officers and Corporate Governance
Incorporated herein by reference from our definitive proxy statement for the 2013 annual meeting of shareholders. The information under the heading “Executive Officers of the Registrant” in Part I of this Form 10-K is also incorporated herein by reference.
Code of Ethics
We have adopted a Code of Ethics for our CEO and senior financial officers that applies to our CEO, CFO and chief accounting officer. To access such code, go to the Corporate Governance section of our Investor Relations Web site at www.mcgraw-hill.com/investor_relations. Any waivers that may in the future be granted from such Code will be posted at such Web site address. In addition to our Code of Ethics for the CEO and senior financial officers noted above, the following documents may be found on our Web site at the above Web site address:
|
•
|
Code of Business Ethics for all employees;
|
|
•
|
Code of Business Conduct and Ethics for Directors;
|
|
•
|
Employee Complaint Procedures;
|
|
•
|
Certificate of Incorporation;
|
|
•
|
By-Laws;
|
|
•
|
Corporate Governance Guidelines;
|
|
•
|
Audit Committee Charter;
|
|
•
|
Compensation and Leadership Development Committee Charter;
|
|
•
|
Nominating and Corporate Governance Committee Charter;
|
|
•
|
Financial Policy Committee Charter; and
|
|
•
|
Executive Committee Charter.
|
The foregoing documents are also available in print, free of charge, to any shareholder who requests them. Requests for printed copies may be e-mailed to corporate_secretary@mcgraw-hill.com or mailed to the Corporate Secretary, The McGraw-Hill Companies, Inc., 1221 Avenue of the Americas, New York, NY 10020-1095.
New York Stock Exchange Certification
Promptly following the 2013 annual meeting of shareholders, we intend to file with the NYSE the CEO certification regarding our compliance with the NYSE’s corporate governance listing standards as required by NYSE Rule 303A.12. Last year, we filed this CEO certification with the NYSE on April 26, 2012.
Item 11.
Executive Compensation
Incorporated herein by reference from our definitive proxy statement for the 2013 annual meeting of shareholders.
Item 12.
Security Ownership of Certain Beneficial Owners and Management and Related Stockholder Matters
Incorporated herein by reference from our definitive proxy statement for the 2013 annual meeting of shareholders.
88
The following table details our equity compensation plans as of December 31, 2012:
|
|
Equity Compensation Plans’ Information
|
|
||||||||
|
|
(a)
|
|
(b)
|
(c)
|
|
|||||
|
Plan category
|
Number of securities to be
issued upon exercise of
outstanding options,
warrants and rights
|
|
Weighted-average
exercise price of
outstanding options,
warrants and rights
|
Number of securities
remaining available for
future issuance under
equity compensation
plans (excluding
securities reflected in
column (a))
|
|
|||||
|
Equity compensation plans approved by security holders
|
18,636,354
|
|
|
$
|
39.58
|
|
26,954,277
|
|
|
|
|
Equity compensation plans not approved by security holders
|
—
|
|
|
—
|
|
—
|
|
|
||
|
Total
|
18,636,354
|
|
1
|
$
|
39.58
|
|
26,954,277
|
|
2,3
|
|
|
1
|
Shares to be issued upon exercise of outstanding options under our Stock Incentive Plans.
|
|
2
|
Included in this number are 166,639 shares reserved for issuance under the Director Deferred Stock Ownership Plan. The remaining 26,787,638 shares are reserved for issuance under the 2002 Stock Incentive Plan (the “2002 Plan”) for Performance Stock, Restricted Stock, Other Stock-Based Awards, Stock Options and Stock Appreciation Rights.
|
|
3
|
Under the terms of the 2002 Plan, shares subject to an award or shares paid in settlement of a dividend equivalent reduce the number of shares available under the 2002 Plan by one share for each such share granted or paid.
|
The 2002 Plan is also governed by certain share recapture provisions. The aggregate number of shares of stock available under the 2002 Plan for issuance are increased by the number of shares of stock granted as an award under the 2002 Plan or 1993 Employee Stock Incentive Plan (the “1993 Plan”) that are:
|
•
|
forfeited, cancelled, settled in cash or property other than stock, or otherwise not distributable under the 2002 Plan or 1993 Plan;
|
|
•
|
tendered or withheld to pay the exercise or purchase price of an award under the 2002 Plan or 1993 Plan or to satisfy applicable wage or other required tax withholding in connection with the exercise, vesting or payment of, or other event related to, an award under the 2002 Plan or 1993 Plan; or
|
|
•
|
repurchased by us with the option proceeds in respect of the exercise of a stock option under the 2002 Plan or 1993 Plan.
|
Item 13.
Certain Relationships and Related Transactions, and Director Independence
Incorporated herein by reference from our definitive proxy statement for the 2013 annual meeting of shareholders.
Item 14.
Principal Accounting Fees and Services
During the year ended December 31, 2012, Ernst & Young LLP audited the consolidated financial statements of the Registrant and its subsidiaries.
Incorporated herein by reference from our definitive proxy statement for the 2013 annual meeting of shareholders.
89
Item 15.
Exhibits, Financial Statement Schedules
(a) Documents filed as part of this Form 10-K:
|
1.
|
Financial Statements
|
|
•
|
Report of Management
|
|
•
|
Reports of Independent Registered Public Accounting Firm
|
|
•
|
Consolidated Statements of Income for the three years ended December 31, 2012
|
|
•
|
Consolidated Statements of Comprehensive Income for the three years ended December 31, 2012
|
|
•
|
Consolidated Balance Sheets as of December 31, 2012 and 2011
|
|
•
|
Consolidated Statements of Cash Flows for the three years ended December 31, 2012
|
|
•
|
Consolidated Statements of Equity for the three years ended December 31, 2012
|
|
•
|
Notes to the Consolidated Financial Statements
|
|
2.
|
Financial Schedule
|
|
•
|
Schedule II—Valuation and Qualifying Accounts
|
All other schedules have been omitted since the required information is not present or not present in amounts sufficient to require submission of the schedule, or because the information required is included in the consolidated financial statements or the notes thereto.
|
3.
|
Exhibits – The exhibits filed as part of this Form 10-K are listed in the Exhibit Index immediately preceding such Exhibits, and such Exhibit Index is incorporated herein by reference.
|
90
The McGraw Hill Companies, Inc.
Schedule II – Valuation and Qualifying Accounts
(in millions)
|
Additions/(deductions)
|
Balance at
beginning of
year
|
Net charges
to income
|
Deductions and other
1
|
Balance at end
of year
|
|||||||||||
|
Year ended December 31, 2012
|
|||||||||||||||
|
Allowance for doubtful accounts
|
$
|
29
|
|
$
|
32
|
|
$
|
(7
|
)
|
$
|
54
|
|
|||
|
Year ended December 31, 2011
|
|||||||||||||||
|
Allowance for doubtful accounts
|
$
|
38
|
|
$
|
26
|
|
$
|
(35
|
)
|
$
|
29
|
|
|||
|
Year ended December 31, 2010
|
|||||||||||||||
|
Allowance for doubtful accounts
|
$
|
38
|
|
$
|
13
|
|
$
|
(13
|
)
|
$
|
38
|
|
|||
|
1
|
Primarily includes uncollectible accounts written off, net of recoveries, impact of acquisitions and divestitures and adjustments for foreign currency translation.
|
91
Signatures
Pursuant to the requirements of Section 13 or 15(d) of the Securities Exchange Act of 1934, the Registrant has duly caused this Form 10-K to be signed on its behalf by the undersigned, thereunto duly authorized.
|
The McGraw-Hill Companies, Inc.
|
|
Registrant
|
|
By:
|
|
/s/ Kenneth M. Vittor
|
|
Kenneth M. Vittor
|
|
Executive Vice President and General Counsel
|
February 28, 2013
Each individual whose signature appears below constitutes and appoints Jack F. Callahan, Jr. and Kenneth M. Vittor, and each of them singly, his or her true and lawful attorneys-in-fact and agents with full power of substitution, for him or her and in his or her name, place and stead, in any and all capacities, to sign any and all amendments to this Form 10-K filed with the Securities and Exchange Commission, granting unto said attorneys-in-fact and agents, and each of them, full power and authority to do and perform each and every act and thing requisite and necessary to be done in and about the premises, as fully to all intents and purposes as he or she might or could do in person, hereby ratifying and confirming all the said attorneys-in-fact and agents or any of them or their or his or her substitute or substitutes, may lawfully do or cause to be done by virtue hereof.
Pursuant to the requirements of the Securities Exchange Act of 1934, this report has been signed on
February 28, 2013
on behalf of the Registrant by the following persons who signed in the capacities as set forth below under their respective names.
|
/s/ Harold W. McGraw III
|
|
Harold W. McGraw III
|
|
Chairman, President, Chief Executive Officer and Director
|
|
/s/
Jack F. Callahan, Jr.
|
|
Jack F. Callahan, Jr.
|
|
Executive Vice President and Chief Financial Officer
|
|
/s/
Emmanuel N. Korakis
|
|
Emmanuel N. Korakis
|
|
Senior Vice President and Corporate Controller
|
|
/s/
Pedro Aspe
|
|
Pedro Aspe
|
|
Director
|
|
/s/
Sir Winfried F.W. Bischoff
|
|
Sir Winfried F.W. Bischoff
|
|
Director
|
|
/s/ William D. Green
|
|
William D. Green
|
|
Director
|
|
/s/ Charles E. Haldeman, Jr.
|
|
Charles E. Haldeman, Jr.
|
|
Director
|
|
/s/
Linda Koch Lorimer
|
|
Linda Koch Lorimer
|
|
Director
|
|
/s/
Robert P. McGraw
|
|
Robert P. McGraw
|
|
Director
|
|
/s/
Hilda Ochoa-Brillembourg
|
|
Hilda Ochoa-Brillembourg
|
|
Director
|
|
/s/
Sir Michael Rake
|
|
Sir Michael Rake
|
|
Director
|
|
/s/
Edward B. Rust, Jr.
|
|
Edward B. Rust, Jr.
|
|
Director
|
|
/s/
Kurt L. Schmoke
|
|
Kurt L. Schmoke
|
|
Director
|
|
/s/
Sidney Taurel
|
|
Sidney Taurel
|
|
Director
|
|
/s/
Richard E. Thornburgh
|
|
Richard E. Thornburgh
|
|
Director
|
92
|
Exhibit
Number
|
Exhibit Index
|
|
|
(2.1
|
)
|
Purchase and Sale Agreement between the Registrant, McGraw-Hill Education LLC, various sellers named therein and MHE Acquisition, LLC, dated November 26, 2012, incorporated by reference from Registrant's Form 8-K filed November 26, 2012.
|
|
(3
|
)
|
Restated Certificate of Incorporation of Registrant, incorporated by reference from Registrant’s Form 8-K filed April 28, 2011.
|
|
(3
|
)
|
By-laws of Registrant, incorporated by reference from Registrant’s Form 10-Q filed June 26, 2012.
|
|
(4.1
|
)
|
Indenture dated as of November 2, 2007 between the Registrant, as issuer, and The Bank of New York, as trustee, incorporated by reference from Registrant’s Form 8-K filed November 2, 2007.
|
|
(4.2
|
)
|
First Supplemental Indenture, dated January 1, 2009, between the Company and The Bank of New York Mellon, as trustee, incorporated by reference from Registrant’s Form 8-K filed January 2, 2009.
|
|
(10.1
|
)
|
Form of Indemnification Agreement between Registrant and each of its directors and certain of its executive officers, incorporated by reference from Registrant’s Form 10-K for the fiscal year ended December 31, 2004.
|
|
(10.2)*
|
|
Registrant’s Amended and Restated 1993 Employee Stock Incentive Plan, as amended and restated as of December 6, 2006, incorporated by reference from Registrant’s Form 10-K for the fiscal year ended December 31, 2006.
|
|
(10.3)*
|
|
Amendment to Registrant’s Amended and Restated 1993 Employee Stock Incentive Plan, effective as of January 1, 2010, incorporated by reference from the Registrant’s Form 10-K for the fiscal year ended December 31, 2009.
|
|
(10.4)*
|
|
Registrant’s Amended and Restated 2002 Stock Incentive Plan, as amended and restated as of January 28, 2009, incorporated by reference from the Registrant’s Form 10-K for the fiscal year ended December 31, 2008.
|
|
(10.5)*
|
|
Form of Performance Share Unit Terms and Conditions, incorporated by reference from Registrant’s Form 10-Q for the fiscal quarter ended March 31, 2009.
|
|
(10.6)*
|
|
Form of Stock Option Award, incorporated by reference from Registrant’s Form 10-K for the fiscal year ended December 31, 2004.
|
|
(10.7)*
|
|
Registrant’s Key Executive Short Term Incentive Compensation Plan, as amended effective as of July 28, 2009, incorporated by reference from the Registrant’s Form 10-K for the fiscal year ended December 31, 2009.
|
|
(10.8)*
|
|
Registrant’s Key Executive Short-Term Incentive Deferred Compensation Plan, as amended and restated as of January 1, 2008, incorporated by reference from Registrant’s Form 10-K for the fiscal year ended December 31, 2007.
|
|
(10.9)*
|
|
Registrant’s Executive Deferred Compensation Plan, incorporated by reference from Registrant’s Form SE filed March 28, 1991 in connection with Registrant’s Form 10-K for the fiscal year ended December 31, 1990.
|
|
(10.10)*
|
|
Registrant’s Management Severance Plan, as amended and restated as of January 1, 2012, incorporated from the Registrant's Form 10-K for the fiscal year ended December 31, 2012.
|
|
(10.10.1)*
|
|
Amendment to Registrant's Management Severance Plan, effective as of January 1, 2013.
|
|
(10.11)*
|
|
Registrant’s Executive Severance Plan, as amended and restated as of January 1, 2012, incorporated from the Registrant's Form 10-K for the fiscal year ended December 31, 2012.
|
|
(10.11.1)*
|
|
Amendment to Registrant's Executive Severance Plan, effective as of January 1, 2013.
|
|
(10.12)*
|
|
Registrant’s Senior Executive Severance Plan, as amended and restated as of January 1, 2012, incorporated from the Registrant's Form 10-K for the fiscal year ended December 31, 2012.
|
93
|
Exhibit
Number
|
Exhibit Index
|
|
|
(10.13)
|
|
$1,200,000,000 Three-Year Credit Agreement dated as of July 30, 2010 ("Credit Agreement") among the Registrant, Standard & Poor’s Financial Services LLC, as guarantor, the lenders listed therein, JP Morgan Chase Bank, N.A., as administrative agent, and Bank of America, N.A., as syndication agent, incorporated by reference from the Registrant’s Form 8-K filed August 2, 2010.
|
|
(10.13.1)
|
|
First Amendment to Credit Agreement, dated as of January 11, 2012.
|
|
(10.13.2)
|
|
Second Amendment to Credit Agreement, dated as of November 2, 2012.
|
|
(10.14)*
|
|
Registrant’s Employee Retirement Plan Supplement, as amended and restated as of January 1, 2008, incorporated by reference from Registrant’s Form 10-K for the fiscal year ended December 31, 2007.
|
|
(10.15)*
|
|
First Amendment to Employee Retirement Plan Supplement, effective as of January 1, 2010, incorporated by reference from the Registrant’s Form 10-K for the fiscal year ended December 31, 2009.
|
|
(10.16)*
|
|
Second Amendment to Employee Retirement Plan Supplement, effective as of January 1, 2010, incorporated by reference from the Registrant’s Form 10-K for the fiscal year ended December 31, 2009.
|
|
(10.17)*
|
|
Third Amendment to Employee Retirement Plan Supplement, effective as of January 1, 2012, incorporated from the Registrant's Form 10-K for the fiscal year ended December 31, 2012.
|
|
(10.18)*
|
|
Standard & Poor’s Employee Retirement Plan Supplement, as amended and restated as of January 1, 2008, incorporated by reference from the Registrant’s Form 10-K for the fiscal year ended December 31, 2009.
|
|
(10.19)*
|
|
First Amendment to Standard & Poor’s Employee Retirement Plan Supplement, effective as of January 1, 2010, incorporated by reference from the Registrant’s Form 10-K for the fiscal year ended December 31, 2009.
|
|
(10.20)*
|
|
Second Amendment to Standard & Poor’s Employee Retirement Plan Supplement, effective as of January 1, 2010, incorporated by reference from the Registrant’s Form 10-K for the fiscal year ended December 31, 2009.
|
|
(10.21)*
|
|
Third Amendment to Standard & Poor’s Employee Retirement Plan Supplement, effective as of January 1, 2012, incorporated from the Registrant's Form 10-K for the fiscal year ended December 31, 2012.
|
|
(10.22)*
|
|
Registrant’s 401(k) Savings and Profit Sharing Supplement, as amended and restated as of January 1, 2008, incorporated by reference from Registrant’s Form 10-K for the fiscal year ended December 31, 2007.
|
|
(10.23)*
|
|
Amendment to Registrant’s 401(k) Savings and Profit Sharing Supplement, effective as of January 1, 2010, incorporated by reference from the Registrant’s Form 10-K for the fiscal year ended December 31, 2009.
|
|
(10.23.1)*
|
|
Amendment to Registrant's 401(k) Savings and Profit Sharing Plan Supplement, effective January 1, 2013.
|
|
(10.24)*
|
|
Registrant’s Management Supplemental Death and Disability Benefits Plan, as amended January 24, 2006, incorporated by reference from Registrant’s Form 10-K for the fiscal year ended December 31, 2005.
|
|
(10.25)*
|
|
Amendment to Registrant’s Management Supplemental and Disability Benefits Plan, effective as of January 1, 2010, incorporated by reference from the Registrant’s Form 10-K for the fiscal year ended December 31, 2009.
|
|
(10.26)*
|
|
Registrant’s Senior Executive Supplemental Death, Disability & Retirement Benefits Plan, as amended and restated as of January 1, 2008, incorporated by reference from Registrant's Form 10-K for the fiscal year ended December 31, 2007.
|
|
(10.27)*
|
|
Amendment to Registrant’s Senior Executive Supplemental Death, Disability & Retirement Benefits Plan, effective as of January 1, 2010, incorporated by reference from the Registrant’s Form 10-K for the fiscal year ended December 31, 2009.
|
|
(10.28)*
|
|
Registrant's Director Retirement Plan, incorporated by reference from Registrant’s Form SE filed March 29, 1990 in connection with Registrant’s Form 10-K for the fiscal year ended December 31, 1989.
|
94
|
Exhibit
Number
|
Exhibit Index
|
|
|
(10.29)*
|
|
Resolutions Freezing Existing Benefits and Terminating Additional Benefits under Registrant’s Directors Retirement Plan, as adopted on January 31, 1996, incorporated by reference from Registrant’s Form 10-K for the fiscal year ended December 31, 1996.
|
|
(10.30)*
|
|
Registrant’s Director Deferred Compensation Plan, as amended and restated as of January 1, 2008, incorporated by reference from Registrant’s Form 10-K for the fiscal year ended December 31, 2007.
|
|
(10.31)*
|
|
Registrant’s Director Deferred Stock Ownership Plan, incorporated by reference from Registrant’s Form 10-K for the fiscal year ended December 31, 2010.
|
|
(10.32)*
|
|
Amendment dated December 9, 2011 to offer letter dated November 2, 2010 to Jack F. Callahan, Jr., Executive Vice President and Chief Financial Officer, incorporated from the Registrant's Form 10-K for the fiscal year ended December 31, 2012.
|
|
(10.33)*
|
|
Amendment dated December 9, 2011 to offer letter dated October 27, 2010 to John L. Berisford, Executive Vice President, Human Resources, incorporated from the Registrant's Form 10-K for the fiscal year ended December 31, 2012.
|
|
(10.34)*
|
|
Communication dated January 25, 2012 regarding the equity enhancements under the Growth and Value Severance Program, incorporated from the Registrant's Form 10-K for the fiscal year ended December 31, 2012.
|
|
(12
|
)
|
Computation of Ratio of Earnings to Fixed Charges.
|
|
(21
|
)
|
Subsidiaries of the Registrant.
|
|
(23
|
)
|
Consent of Ernst & Young LLP, Independent Registered Public Accounting Firm.
|
|
(31.1
|
)
|
Certification of the Chief Executive Officer pursuant to Rule 13a-14(a) and Rule 15d-14(a) of the Securities Exchange Act, as amended.
|
|
(31.2
|
)
|
Certification of the Chief Financial Officer pursuant to Rule 13a-14(a) and Rule 15d-14(a) of the Securities Exchange Act, as amended.
|
|
(32
|
)
|
Certification of the Chief Executive Officer and the Chief Financial Officer pursuant to 18 U.S.C. 1350, as adopted pursuant to Section 906 of the Sarbanes-Oxley Act of 2002.
|
|
(101.INS)
|
|
XBRL Instance Document
|
|
(101.SCH)
|
|
XBRL Taxonomy Extension Schema
|
|
(101.CAL)
|
|
XBRL Taxonomy Extension Calculation Linkbase
|
|
(101.LAB)
|
|
XBRL Taxonomy Extension Label Linkbase
|
|
(101.PRE)
|
|
XBRL Taxonomy Extension Presentation Linkbase
|
|
(101.DEF)
|
|
XBRL Taxonomy Extension Definition Linkbase
|
* These exhibits relate to management contracts or compensatory plan arrangements.
95
TABLE OF CONTENTS
Part IItem 1. BusinessItem 1A. Risk FactorsItem 1B. Unresolved Staff CommentsItem 2. PropertiesItem 3. Legal ProceedingsItem 4. Mine Safety DisclosuresPart IIItem 5. Market For The Registrant S Common Equity, Related Stockholder Matters and Issuer Purchases Of Equity SecuritiesItem 6 . Selected Financial DataItem 7 . Management S Discussion and Analysis Of Financial Condition and Results Of OperationsItem 7A . Quantitative and Qualitative Disclosures About Market RiskItem 8. Consolidated Financial Statements and Supplementary DataItem 9. Changes in and Disagreements with Accountants on Accounting and Financial DisclosureItem 9A. Controls and ProceduresItem 9B. Other InformationPart IIIItem 10. Directors, Executive Officers and Corporate GovernanceItem 11. Executive CompensationItem 12. Security Ownership Of Certain Beneficial Owners and Management and Related Stockholder MattersItem 13. Certain Relationships and Related Transactions, and Director IndependenceItem 14. Principal Accounting Fees and ServicesPart IVItem 15. Exhibits, Financial Statement Schedules