S&P GLOBAL INC.
10-Ks and 10-Qs
|
|
|
|
|
|
|
|
|
|
|
|
|
|
|
|
|
|
|
|
|
|
|
|
|
|
|
|
|
|
|
|
|
|
|
|
|
|
|
|
|
|
|
|
|
|
|
|
|
|
|
|
|
|
|
|
UNITED STATES SECURITIES AND EXCHANGE COMMISSION
WASHINGTON, D.C. 20549
FORM 10-Q
|
þ
|
QUARTERLY REPORT PURSUANT TO SECTION 13 OR 15(d) OF THE SECURITIES EXCHANGE ACT OF 1934
|
For the quarterly period ended
March 31, 2018
OR
|
¨
|
TRANSITION REPORT PURSUANT TO SECTION 13 OR 15(d) OF THE SECURITIES EXCHANGE ACT OF 1934
|
For the transition period from
to
Commission File Number: 1-1023

S&P Global Inc.
(Exact name of registrant as specified in its charter)
|
New York
|
13-1026995
|
|
(State or other jurisdiction of incorporation or organization)
|
(I.R.S. Employer Identification No.)
|
|
55 Water Street, New York, New York
|
10041
|
|
(Address of principal executive offices)
|
(Zip Code)
|
Registrant’s telephone number, including area code: 212-438-1000
(Former name, former address and former fiscal year, if changed since last report)
Indicate by check mark whether the registrant (1) has filed all reports required to be filed by Section 13 or 15(d) of the Securities Exchange Act of 1934 during the preceding 12 months (or for such shorter period that the registrant was required to file such reports), and (2) has been subject to such filing requirements for the past 90 days.
YES
þ
NO
¨
Indicate by check mark whether the registrant has submitted electronically and posted on its corporate Website, if any, every Interactive Date File required to be submitted and posted pursuant to Rule 405 of Regulation S-T (§232.405 of this chapter) during the preceding 12 months (or for such shorter period that the registrant was required to submit and post such files).
YES
þ
NO
¨
Indicate by check mark whether the registrant is a large accelerated filer, an accelerated filer, a non-accelerated filer, a smaller reporting company, or an emerging growth company. See definition of “large accelerated filer,” “accelerated filer”, “small reporting company”, and "emerging growth company" in Rule 12b-2 of the Exchange Act.
|
þ
Large accelerated filer
|
o
Accelerated filer
|
o
Non-accelerated filer
|
o
Smaller reporting company
|
o
Emerging growth company
|
Indicate by check mark whether the registrant is a shell company (as defined in Rule 12b-2 of the Exchange Act).
YES
¨
NO
þ
If an emerging growth company, indicate by check mark if the registrant has elected not to use the extended transition period for complying with any new or revised accounting standards provided pursuant to Section 13(a) of the Exchange Act.
¨
Indicate the number of shares outstanding of each of the issuer's classes of common stock, as of the latest practicable date:
|
Class
|
Shares Outstanding
|
Date
|
|
Common stock (par value $1.00 per share)
|
251.3 million
|
April 20, 2018
|
1
S&P Global Inc.
INDEX
|
|
Page Number
|
2
Report of Independent Registered Public Accounting Firm
To the Shareholders and Board of Directors of S&P Global Inc.
Results of Review of Interim Financial Statements
We have reviewed the accompanying consolidated balance sheet of S&P Global Inc. (and subsidiaries) (the “Company”) as of March 31, 2018, the related consolidated statements of income, comprehensive income and cash flows for the three-month periods ended March 31, 2018 and 2017, the related consolidated statement of equity for the three-month period ended March 31, 2018, and the related notes (collectively referred to as the “consolidated interim financial statements”). Based on our reviews, we are not aware of any material modifications that should be made to the consolidated interim financial statements for them to be in conformity with U.S. generally accepted accounting principles.
We have previously audited, in accordance with the standards of the Public Company Accounting Oversight Board (United States) (PCAOB), the consolidated balance sheet of the Company as of December 31, 2017, the related consolidated statements of income, comprehensive income, equity and cash flows for the year then ended, and the related notes and schedule (not presented herein); and in our report dated February 9, 2018, we expressed an unqualified audit opinion on those consolidated financial statements. In our opinion, the information set forth in the accompanying consolidated balance sheet as of December 31, 2017, is fairly stated, in all material respects, in relation to the consolidated balance sheet from which it has been derived.
Basis for Review Results
These consolidated interim financial statements are the responsibility of the Company's management. We are a public accounting firm registered with the PCAOB and are required to be independent with respect to the company in accordance with the U.S. federal securities laws and the applicable rules and regulations of the SEC and the PCAOB. We conducted our review in accordance with the standards of the PCAOB. A review of consolidated interim financial statements consists principally of applying analytical procedures and making inquiries of persons responsible for financial and accounting matters. It is substantially less in scope than an audit conducted in accordance with the standards of the PCAOB, the objective of which is the expression of an opinion regarding the consolidated interim financial statements taken as a whole. Accordingly, we do not express such an opinion.
/s/ Ernst & Young LLP
New York, NY
April 26, 2018
3
Item 1.
Financial Statements
S&P Global Inc.
(Unaudited)
|
(in millions, except per share amounts)
|
Three Months Ended
|
||||||
|
March 31,
|
|||||||
|
2018
|
2017
|
||||||
|
Revenue
|
$
|
1,567
|
|
$
|
1,453
|
|
|
|
Expenses:
|
|||||||
|
Operating-related expenses
|
439
|
|
411
|
|
|||
|
Selling and general expenses
|
372
|
|
360
|
|
|||
|
Depreciation
|
21
|
|
19
|
|
|||
|
Amortization of intangibles
|
24
|
|
24
|
|
|||
|
Total expenses
|
856
|
|
814
|
|
|||
|
Operating profit
|
711
|
|
639
|
|
|||
|
Other (income) expense, net
|
(4
|
)
|
(9
|
)
|
|||
|
Interest expense, net
|
34
|
|
37
|
|
|||
|
Income before taxes on income
|
681
|
|
611
|
|
|||
|
Provision for taxes on income
|
147
|
|
181
|
|
|||
|
Net income
|
534
|
|
430
|
|
|||
|
Less: net income attributable to noncontrolling interests
|
(43
|
)
|
(31
|
)
|
|||
|
Net income attributable to S&P Global Inc.
|
$
|
491
|
|
$
|
399
|
|
|
|
Earnings per share attributable to S&P Global Inc. common shareholders:
|
|||||||
|
Net income:
|
|||||||
|
Basic
|
$
|
1.94
|
|
$
|
1.54
|
|
|
|
Diluted
|
$
|
1.93
|
|
$
|
1.53
|
|
|
|
Weighted-average number of common shares outstanding:
|
|||||||
|
Basic
|
252.4
|
|
258.2
|
|
|||
|
Diluted
|
254.4
|
|
260.8
|
|
|||
|
Actual shares outstanding at period end
|
249.4
|
|
257.8
|
|
|||
|
Dividend declared per common share
|
$
|
0.50
|
|
$
|
0.41
|
|
|
See accompanying notes to the unaudited consolidated financial statements.
4
S&P Global Inc.
Consolidated Statements of Comprehensive Income
(Unaudited)
|
(in millions)
|
Three Months Ended
|
||||||
|
March 31,
|
|||||||
|
2018
|
2017
|
||||||
|
Net income
|
$
|
534
|
|
$
|
430
|
|
|
|
Other comprehensive income:
|
|||||||
|
Foreign currency translation adjustment
|
23
|
|
30
|
|
|||
|
Income tax effect
|
(18
|
)
|
—
|
|
|||
|
5
|
|
30
|
|
||||
|
Pension and other postretirement benefit plans
|
4
|
|
4
|
|
|||
|
Income tax effect
|
(1
|
)
|
(1
|
)
|
|||
|
3
|
|
3
|
|
||||
|
Unrealized gain on forward exchange contracts
|
1
|
|
7
|
|
|||
|
Income tax effect
|
—
|
|
(2
|
)
|
|||
|
1
|
|
5
|
|
||||
|
Comprehensive income
|
543
|
|
468
|
|
|||
|
Less: comprehensive income attributable to nonredeemable noncontrolling interests
|
(3
|
)
|
(1
|
)
|
|||
|
Less: comprehensive income attributable to redeemable noncontrolling interests
|
(40
|
)
|
(30
|
)
|
|||
|
Comprehensive income attributable to S&P Global Inc.
|
$
|
500
|
|
$
|
437
|
|
|
See accompanying notes to the unaudited consolidated financial statements.
5
S&P Global Inc.
|
(in millions)
|
March 31,
2018 |
December 31,
2017 |
|||||
|
(Unaudited)
|
|
||||||
|
ASSETS
|
|||||||
|
Current assets:
|
|||||||
|
Cash and cash equivalents
|
$
|
1,756
|
|
$
|
2,779
|
|
|
|
Accounts receivable, net of allowance for doubtful accounts: 2018 - $34; 2017 - $33
|
1,313
|
|
1,319
|
|
|||
|
Prepaid and other current assets
|
215
|
|
226
|
|
|||
|
Total current assets
|
3,284
|
|
4,324
|
|
|||
|
Property and equipment, net of accumulated depreciation: 2018 - $569; 2017 - $554
|
270
|
|
275
|
|
|||
|
Goodwill
|
3,045
|
|
2,989
|
|
|||
|
Other intangible assets, net
|
1,390
|
|
1,388
|
|
|||
|
Other non-current assets
|
508
|
|
449
|
|
|||
|
Total assets
|
$
|
8,497
|
|
$
|
9,425
|
|
|
|
LIABILITIES AND EQUITY
|
|||||||
|
Current liabilities:
|
|||||||
|
Accounts payable
|
$
|
196
|
|
$
|
195
|
|
|
|
Accrued compensation and contributions to retirement plans
|
195
|
|
472
|
|
|||
|
Short-term debt
|
400
|
|
399
|
|
|||
|
Income taxes currently payable
|
100
|
|
77
|
|
|||
|
Unearned revenue
|
1,679
|
|
1,613
|
|
|||
|
Accrued legal and regulatory settlements
|
82
|
|
107
|
|
|||
|
Other current liabilities
|
483
|
|
351
|
|
|||
|
Total current liabilities
|
3,135
|
|
|
3,214
|
|
||
|
Long-term debt
|
3,170
|
|
3,170
|
|
|||
|
Pension and other postretirement benefits
|
235
|
|
244
|
|
|||
|
Other non-current liabilities
|
539
|
|
679
|
|
|||
|
Total liabilities
|
7,079
|
|
7,307
|
|
|||
|
Redeemable noncontrolling interest (Note 8)
|
1,350
|
|
1,350
|
|
|||
|
Commitments and contingencies (Note 12)
|
|
|
|||||
|
Equity:
|
|||||||
|
Common stock
|
412
|
|
412
|
|
|||
|
Additional paid-in capital
|
335
|
|
525
|
|
|||
|
Retained income
|
10,427
|
|
10,025
|
|
|||
|
Accumulated other comprehensive loss
|
(630
|
)
|
(649
|
)
|
|||
|
Less: common stock in treasury
|
(10,537
|
)
|
(9,602
|
)
|
|||
|
Total equity — controlling interests
|
7
|
|
711
|
|
|||
|
Total equity — noncontrolling interests
|
61
|
|
57
|
|
|||
|
Total equity
|
68
|
|
768
|
|
|||
|
Total liabilities and equity
|
$
|
8,497
|
|
$
|
9,425
|
|
|
See accompanying notes to the unaudited consolidated financial statements.
6
S&P Global Inc.
(Unaudited)
|
(in millions)
|
Three Months Ended
|
||||||
|
March 31,
|
|||||||
|
2018
|
2017
|
||||||
|
Operating Activities:
|
|||||||
|
Net income
|
$
|
534
|
|
$
|
430
|
|
|
|
Adjustments to reconcile net income to cash provided by operating activities:
|
|||||||
|
Depreciation
|
21
|
|
19
|
|
|||
|
Amortization of intangibles
|
24
|
|
24
|
|
|||
|
Provision for losses on accounts receivable
|
8
|
|
5
|
|
|||
|
Stock-based compensation
|
13
|
|
19
|
|
|||
|
Other
|
16
|
|
13
|
|
|||
|
Changes in operating assets and liabilities, net of effect of acquisitions and dispositions:
|
|||||||
|
Accounts receivable
|
7
|
|
12
|
|
|||
|
Prepaid and other current assets
|
(21
|
)
|
9
|
|
|||
|
Accounts payable and accrued expenses
|
(289
|
)
|
(235
|
)
|
|||
|
Unearned revenue
|
27
|
|
(6
|
)
|
|||
|
Accrued legal settlements
|
(29
|
)
|
(1
|
)
|
|||
|
Other current liabilities
|
19
|
|
(58
|
)
|
|||
|
Net change in prepaid/accrued income taxes
|
74
|
|
146
|
|
|||
|
Net change in other assets and liabilities
|
(44
|
)
|
(24
|
)
|
|||
|
Cash provided by operating activities
|
360
|
|
353
|
|
|||
|
Investing Activities:
|
|||||||
|
Capital expenditures
|
(33
|
)
|
(23
|
)
|
|||
|
Acquisitions, net of cash acquired
|
(57
|
)
|
(1
|
)
|
|||
|
Proceeds from dispositions
|
—
|
|
2
|
|
|||
|
Changes in short-term investments
|
3
|
|
—
|
|
|||
|
Cash used for investing activities
|
(87
|
)
|
(22
|
)
|
|||
|
Financing Activities:
|
|||||||
|
Dividends paid to shareholders
|
(127
|
)
|
(106
|
)
|
|||
|
Distributions to noncontrolling interest holders
|
(50
|
)
|
(24
|
)
|
|||
|
Repurchase of treasury shares
|
(1,100
|
)
|
(201
|
)
|
|||
|
Exercise of stock options
|
10
|
|
29
|
|
|||
|
Employee withholding tax on share-based payments
|
(49
|
)
|
(44
|
)
|
|||
|
Cash used for financing activities
|
(1,316
|
)
|
(346
|
)
|
|||
|
Effect of exchange rate changes on cash from continuing operations
|
20
|
|
34
|
|
|||
|
Net change in cash and cash equivalents
|
(1,023
|
)
|
19
|
|
|||
|
Cash and cash equivalents at beginning of period
|
2,779
|
|
2,392
|
|
|||
|
Cash and cash equivalents at end of period
|
$
|
1,756
|
|
$
|
2,411
|
|
|
See accompanying notes to the unaudited consolidated financial statements.
7
S&P Global Inc.
Consolidated Statement of Equity
(Unaudited)
|
(in millions)
|
Common Stock $1 par
|
Additional Paid-in Capital
|
Retained Income
|
Accumulated Other Comprehensive Loss
|
Less: Treasury Stock
|
Total SPGI Equity
|
Noncontrolling Interests
|
Total Equity
|
|||||||||||||||||||||||
|
Balance as of December 31, 2017
|
$
|
412
|
|
$
|
525
|
|
$
|
10,025
|
|
$
|
(649
|
)
|
$
|
9,602
|
|
$
|
711
|
|
$
|
57
|
|
$
|
768
|
|
|||||||
|
Comprehensive income
1
|
491
|
|
9
|
|
500
|
|
3
|
|
503
|
|
|||||||||||||||||||||
|
Dividends
|
(127
|
)
|
(127
|
)
|
|
|
(127
|
)
|
|||||||||||||||||||||||
|
Share repurchases
|
(150
|
)
|
950
|
|
(1,100
|
)
|
|
(1,100
|
)
|
||||||||||||||||||||||
|
Employee stock plans
|
(40
|
)
|
(15
|
)
|
(25
|
)
|
1
|
|
(24
|
)
|
|||||||||||||||||||||
|
Change in redemption value of redeemable noncontrolling interest
|
12
|
|
12
|
|
12
|
|
|||||||||||||||||||||||||
|
Other
2
|
|
26
|
|
10
|
|
|
36
|
|
|
|
36
|
|
|||||||||||||||||||
|
Balance as of March 31, 2018
|
$
|
412
|
|
$
|
335
|
|
$
|
10,427
|
|
$
|
(630
|
)
|
$
|
10,537
|
|
$
|
7
|
|
$
|
61
|
|
$
|
68
|
|
|||||||
|
1
|
Excludes
$40 million
attributable to our redeemable noncontrolling interest.
|
|
2
|
Reflects a net increase to opening retained earnings due to the cumulative effect of adopting Accounting Standards Codification 606, partially offset by a decrease related to the adoption of Accounting Standards Update 2016-01.
|
See accompanying notes to the unaudited consolidated financial statements.
8
S&P Global Inc.
Notes to the Consolidated Financial Statements
(Unaudited)
|
1.
|
Nature of Operations and Basis of Presentation
|
S&P Global Inc. (together with its consolidated subsidiaries, "S&P Global," the “Company,” “we,” “us” or “our”) is a leading provider of transparent and independent ratings, benchmarks, analytics and data to the capital and commodity markets worldwide.
Our operations consist of
four
reportable segments: S&P Global Ratings ("Ratings"), S&P Global Market Intelligence ("Market Intelligence"), S&P Global Platts ("Platts") and S&P Dow Jones Indices ("Indices").
|
•
|
Ratings is an independent provider of credit ratings, research, and analytics, offering investors and other market participants information, ratings and benchmarks.
|
|
•
|
Market Intelligence is a global provider of multi-asset-class data, research and analytical capabilities, which integrate cross-asset analytics and desktop services.
|
|
•
|
Platts is the leading independent provider of information and benchmark prices for the commodity and energy markets.
|
|
•
|
Indices is a global index provider that maintains a wide variety of valuation and index benchmarks for investment advisors, wealth managers and institutional investors.
|
The accompanying unaudited financial statements of the Company have been prepared in accordance with accounting principles generally accepted in the United States of America (“U.S. GAAP”) for interim financial information and with the instructions to Form 10-Q and Article 10 of Regulation S-X. Accordingly, they do not include all of the information and footnotes required by U.S. GAAP for complete financial statements. Therefore, the financial statements included herein should be read in conjunction with the financial statements and notes included in our Form 10-K for the year ended
December 31, 2017
(our “Form 10-K”). Certain prior-year amounts have been reclassified to conform with current presentation.
In the opinion of management, all normal recurring adjustments considered necessary for a fair statement of the results of the interim periods have been included. The operating results for the
three
months ended
March 31, 2018
are not necessarily indicative of the results that may be expected for the full year.
Our critical accounting estimates are disclosed in Item 7,
Management’s Discussion and Analysis of Financial Condition and Results of Operations
, in our Form 10-K. On an ongoing basis, we evaluate our estimates and assumptions, including those related to revenue recognition, allowance for doubtful accounts, valuation of long-lived assets, goodwill and other intangible assets, pension plans, incentive compensation and stock-based compensation, income taxes, contingencies and redeemable noncontrolling interests. Since the date of our Form 10-K, we adopted Financial Accounting Standards Board Accounting Standards Codification ("ASC") 606 as discussed below. There have been no other material changes to our critical accounting policies and estimates.
Adoption of ASC 606, “Revenue from Contracts with Customers”
On January 1, 2018, we adopted ASC 606 "Revenue from Contracts with Customers" using the modified retrospective transition method applied to our revenue contracts with customers as of January 1, 2018. Results for reporting periods beginning after January 1, 2018 are presented under ASC 606, while prior year amounts are not adjusted and continue to be reported in accordance with our historic accounting under ASC 605. We recorded a net increase to opening retained earnings of
$35 million
as of January 1, 2018 due to the cumulative effect of adopting ASC 606, with the impact primarily related to our treatment of costs to obtain a contract and to a lesser extent, changes to the timing of the recognition of our subscription and non-transaction revenues. We recognized additional revenue of
$3 million
for three months ended March 31, 2018 as a result of the adoption of this standard.
Under ASC 606, revenue is recognized when a customer obtains control of promised goods or services in an amount that reflects the consideration the entity expects to receive in exchange for those goods or services.
9
The following table presents our revenue disaggregated by revenue type:
|
(in millions)
|
Three Months Ended March 31, 2018
|
||||||||||||||||||||||
|
Ratings
|
Market Intelligence
|
Platts
|
Indices
|
Intersegment Elimination
1
|
Total
|
||||||||||||||||||
|
Subscription
|
$
|
—
|
|
$
|
424
|
|
$
|
181
|
|
$
|
33
|
|
$
|
—
|
|
$
|
638
|
|
|||||
|
Non-transaction
|
380
|
|
—
|
|
—
|
|
—
|
|
(28
|
)
|
352
|
|
|||||||||||
|
Non-subscription / Transaction
|
368
|
|
8
|
|
2
|
|
—
|
|
—
|
|
378
|
|
|||||||||||
|
Asset-linked fees
|
—
|
|
5
|
|
—
|
|
131
|
|
—
|
|
136
|
|
|||||||||||
|
Sales usage-based royalties
|
—
|
|
—
|
|
13
|
|
50
|
|
—
|
|
63
|
|
|||||||||||
|
Total revenue
|
$
|
748
|
|
$
|
437
|
|
$
|
196
|
|
$
|
214
|
|
$
|
(28
|
)
|
$
|
1,567
|
|
|||||
|
Timing of revenue recognition
|
|
|
|
|
|
|
|
|
|
|
|
|
|||||||||||
|
Services transferred at a point in time
|
$
|
368
|
|
$
|
8
|
|
$
|
2
|
|
$
|
—
|
|
$
|
—
|
|
$
|
378
|
|
|||||
|
Services transferred over time
|
380
|
|
429
|
|
194
|
|
214
|
|
(28
|
)
|
1,189
|
|
|||||||||||
|
Total revenue
|
$
|
748
|
|
$
|
437
|
|
$
|
196
|
|
$
|
214
|
|
$
|
(28
|
)
|
$
|
1,567
|
|
|||||
|
(in millions)
|
Three Months Ended March 31, 2017
2
|
||||||||||||||||||||||
|
Ratings
|
Market Intelligence
|
Platts
|
Indices
|
Intersegment Elimination
1
|
Total
|
||||||||||||||||||
|
Subscription
|
$
|
—
|
|
$
|
385
|
|
$
|
172
|
|
$
|
31
|
|
$
|
—
|
|
$
|
588
|
|
|||||
|
Non-transaction
|
341
|
|
—
|
|
—
|
|
—
|
|
(25
|
)
|
316
|
|
|||||||||||
|
Non-subscription / Transaction
|
373
|
|
11
|
|
3
|
|
—
|
|
—
|
|
387
|
|
|||||||||||
|
Asset-linked fees
|
—
|
|
6
|
|
—
|
|
108
|
|
—
|
|
114
|
|
|||||||||||
|
Sales usage-based royalties
|
—
|
|
—
|
|
16
|
|
32
|
|
—
|
|
48
|
|
|||||||||||
|
Total revenue
|
$
|
714
|
|
$
|
402
|
|
$
|
191
|
|
$
|
171
|
|
$
|
(25
|
)
|
$
|
1,453
|
|
|||||
|
Timing of revenue recognition
|
|||||||||||||||||||||||
|
Services transferred at a point in time
|
$
|
373
|
|
$
|
11
|
|
$
|
3
|
|
$
|
—
|
|
$
|
—
|
|
$
|
387
|
|
|||||
|
Services transferred over time
|
341
|
|
391
|
|
188
|
|
171
|
|
(25
|
)
|
1,066
|
|
|||||||||||
|
Total revenue
|
$
|
714
|
|
$
|
402
|
|
$
|
191
|
|
$
|
171
|
|
$
|
(25
|
)
|
$
|
1,453
|
|
|||||
|
1
|
Intersegment eliminations mainly consists of a royalty charged to Market Intelligence for the rights to use and distribute content and data developed by Ratings.
|
|
2
|
As noted above, amounts for the three month ended March 31, 2017 were not adjusted under the modified retrospective transition method applied to our revenue contracts with customers as of January 1, 2018.
|
Subscription revenue
Subscription revenue at Market Intelligence is primarily derived from distribution of data, analytics, third party research, and credit ratings-related information primarily through web-based channels including Market Intelligence Desktop, RatingsDirect®, RatingsXpress®, and Credit Analytics. Subscription revenue at Platts is generated by providing customers access to commodity and energy-related price assessments, market data, and real-time news, along with other information services. Subscription revenue at Indices is derived from the contracts for underlying data of our indexes to support our customers' management of index funds, portfolio analytics, and research.
For subscription products and services, we generally provide continuous access to dynamic data sets and analytics for a defined period, with revenue recognized ratably as our performance obligation to provide access to our data and analytics is progressively fulfilled over the stated term of the contract.
10
Non-transaction revenue
Non-transaction revenue at Ratings is primarily related to surveillance of a credit rating, annual fees for customer relationship-based pricing programs, fees for entity credit ratings and global research and analytics. Non-transaction revenue also includes an intersegment revenue elimination of
$28 million
and
$25 million
for the three months ended March 31, 2018 and 2017, respectively, mainly consisting of the royalty charged to Market Intelligence for the rights to use and distribute content and data developed by Ratings.
For non-transaction revenue related to Rating’s surveillance services, we continuously monitor factors that impact the creditworthiness of an issuer over the contractual term with revenue recognized to the extent that our performance obligation is progressively fulfilled over the term contract. Because surveillance services are continuously provided throughout the term of the contract, our measure of progress towards fulfillment of our obligation to monitor a rating is a time-based output measure with revenue recognized ratably over the term of the contract.
Non-subscription / Transaction revenue
Transaction revenue at our Ratings segment primarily includes fees associated with:
|
•
|
ratings related to new issuance of corporate and government debt instruments; and structured finance instruments;
|
|
•
|
bank loan ratings; and
|
|
•
|
corporate credit estimates, which are intended, based on an abbreviated analysis, to provide an indication of our opinion regarding creditworthiness of a company which does not currently have a Ratings credit rating.
|
Transaction revenue is recognized at the point in time when our performance obligation is satisfied by issuing a rating on our customer's instruments, our customer's creditworthiness, or a counter-party's creditworthiness and when we have a right to payment and the customer can benefit from the significant risks and rewards of ownership.
Non-subscription revenue at Market Intelligence is primarily related to certain advisory, pricing and analytical services. Non-subscription revenue at Platts is primarily related conference sponsorship, consulting engagements and events.
Asset-linked fees
Asset-linked fees at Indices and Market Intelligence are primarily related to royalties payments based on the value of assets under management in our customers exchange-traded funds and mutual funds.
For asset-linked products and services, we provide licenses conveying continuous access to our index and benchmark related intellectual property during a specified contract term. Revenue is recognized when the extent that our customers have used our licensed intellectual property can be quantified. Recognition of revenue for our asset-linked fee arrangements is subject to the "recognition constraint" for usage-based royalty payments because we cannot reasonably predict the value of the assets that will be invested in index funds structured using our intellectual property until it is either publicly available or when we are notified by our customers. Revenue derived from an asset-linked fee arrangement is measured and recognized when the uncertainty of the extent of its utilization of our index products by our customers is known.
Sales usage-based royalties
Sales and usage-based royalty revenue at our Indices segment is primarily related to trading based fees from exchange-traded derivatives. Sales and usage-based royalty revenue at our Platts segment is primarily related to licensing of its proprietary market price data and price assessments to commodity exchanges.
For sales and usage-based royalty products and services, we provide licenses conveying the right to continuous access to our intellectual property over the contract term, with revenue recognized when the extent of our license’s utilization can be quantified, or more specifically, when trading volumes are known and publicly available to us or when we are notified by our customers. Recognition of revenue of fees tied to trading volumes is subject to the recognition constraint for a usage-based royalty promised by our customers in exchange for the license of our intellectual property, with revenue recognized when trading volumes are known.
11
Arrangements with Multiple Performance Obligations
Our contracts with customers may include multiple performance obligations. Revenue relating to agreements that provide for more than one performance obligation is recognized based upon the relative fair value to the customer of each service component as each component is earned. The fair value of the service components are determined using an analysis that considers cash consideration that would be received for instances when the service components are sold separately. If the fair value to the customer for each service is not objectively determinable, we make our best estimate of the services’ stand-alone selling price and records revenue as it is earned over the service period.
Receivables
We record a receivable when a customer is billed or when revenue is recognized prior to billing a customer. For multi-year agreements, we generally invoice customers annually at the beginning of each annual period. The opening balance of accounts receivable, net of allowance for doubtful accounts, was
$1,319 million
as of January 1, 2018.
Contract Assets
Contract assets include unbilled amounts that result from when the Company transfers service to a customer before a customer pays consideration or before payment is due. As of March 31, 2018 and December 31, 2017, contract assets were
$28 million
and
$17 million
, respectively, and are included in accounts receivable in our consolidated balance sheets.
Unearned Revenue
We record unearned revenue when cash payments are received or due in advance of our performance. The increase in the deferred revenue balance for the three months ended March 31, 2018 is primarily driven by cash payments received or due in advance of satisfying our performance obligations, offset by
$710 million
of revenues recognized that were included in the unearned revenue balance at the beginning of the period.
Remaining Performance Obligations
Remaining performance obligations represent the transaction price of contracts for which work has not yet been performed. As of March 31, 2018, the aggregate amount of the transaction price allocated to remaining performance obligations was
$1.2 billion
. We expect to recognize revenue on approximately half and three-quarters of the remaining performance obligations over the next
12
and
24
months, respectively, with the remainder recognized thereafter.
We do not disclose the value of unsatisfied performance obligations for (i) contracts with an original expected length of one year or less and (ii) contracts where revenue is a usage-based royalty promised in exchange for a license of intellectual property.
Costs to Obtain a Contract
We recognize an asset for the incremental costs of obtaining a contract with a customer if we expect the benefit of those costs to be longer than one year. We have determined that certain sales commission programs meet the requirements to be capitalized. Total capitalized costs to obtain a contract were
$81 million
as of March 31, 2018, and is included in other current and long-term assets on our consolidated balance sheets. The asset will be amortized over a period consistent with the transfer to the customer of the goods or services to which the asset relates, calculated based on the customer term and the average life of the products and services underlying the contracts. The expense is recorded within selling and general expenses.
We expense sales commissions when incurred if the amortization period would have been one year or less. These costs are recorded within selling and general expenses.
Presentation of net periodic pension cost and net periodic postretirement benefit cost
During the first quarter of 2018, we adopted new accounting guidance requiring that net periodic benefit cost for our retirement and postretirement plans other than the service cost component be included outside of operating profit; these costs are included in other (income) expense, net in our consolidated statements of income.
The components of other (income) expense, net for the three months ended March 31 are as follows:
12
|
(in millions)
|
2018
|
2017
|
|||||
|
Other components of net periodic benefit cost
|
$
|
(8
|
)
|
$
|
(9
|
)
|
|
|
Net loss from investments
1
|
4
|
|
—
|
|
|||
|
Other (income) expense, net
|
$
|
(4
|
)
|
$
|
(9
|
)
|
|
|
1
|
Primarily relates to the change in fair value of CRISIL's investment in Care Ratings Limited ("CARE"). The investment balance of CARE as of March 31, 2018 and December 31, 2017 is
$49 million
and
$54 million
, respectively, and is included in non-current assets in our consolidated balance sheets.
|
|
2.
|
Acquisitions and Divestitures
|
Acquisitions
2018
In April of 2018, we acquired Kensho Technologies Inc. ("Kensho") for approximately
$550 million
, net of cash acquired, in a mix of cash and stock. Kensho is a leading edge provider of next-generation analytics, artificial intelligence, machine learning, and data visualization systems to Wall Street's premier global banks and investment institutions, as well as the National Security community. The acquisition is expected to strengthen S&P Global's emerging technology capabilities, enhance our ability to deliver essential, actionable insights that will transform the user experience for our clients, and accelerate efforts to improve efficiency and effectiveness of our core internal operations. The acquisition of Kensho is not material to our consolidated financial statements.
In February of 2018, Market Intelligence acquired Panjiva, Inc. ("Panjiva"), a privately held company that provides deep, differentiated, sector-relevant insights on global supply chains, leveraging data science and technology to make sense of large, unstructured datasets. The acquisition will help strengthen the insights, products and data that we provide to our clients throughout the world. The acquisition of Panjiva is not material to our consolidated financial statements.
In January of 2018, CRISIL, included within our Ratings segment, acquired a
100%
stake in Pragmatix Services Private Limited ("Pragmatix"), a data analytics company focused on delivering cutting edge solutions in the "data to intelligence" life cycle to the Banking, Financial Services and Insurance vertical. The acquisition will strengthen CRISIL's position as an agile, innovative and global analytics company. The acquisition of Pragmatix is not material to our consolidated financial statements.
2017
During the three months ended March 31, 2017, we did not complete any material acquisitions.
Divestitures
2018
During the three months ended March 31, 2018, we did not complete any dispositions.
2017
In January of 2017, we completed the sale of Quant House SAS, included in our Market Intelligence segment, to QH Holdco, an independent third party.
|
3.
|
Income Taxes
|
Comprehensive tax legislation, enacted through the Tax Cuts and Jobs Act (“TCJA”) on December 22, 2017, significantly modified U.S. corporate income tax law. Provisional amounts have been recorded in our financial statements based on the Company’s initial analysis of the TCJA. The Company may adjust these amounts in future periods if our interpretation of the TCJA changes or as additional guidance from the U.S. Treasury becomes available.
The effective income tax rate was
21.6%
and
29.5%
for the
three
months ended
March 31, 2018
and
March 31, 2017
, respectively. The decrease in 2018 was primarily due to the reduction of the U.S. federal corporate tax rate as a result of the enactment of the TCJA.
At the end of each interim period, we estimate the annual effective tax rate and apply that rate to our ordinary quarterly earnings. The tax expense or benefit related to significant unusual or infrequently occurring items that will be separately reported or reported net of their related tax effect, and are individually computed, is recognized in the interim period in which those items occur. In addition, the effect of changes in enacted tax laws or rates or tax status is recognized in the interim period in which the change occurs.
13
The Company is continuously subject to tax examinations in various jurisdictions. As of
March 31, 2018
and
December 31, 2017
, the total amount of federal, state and local, and foreign unrecognized tax benefits was
$210 million
and
$212 million
, respectively, exclusive of interest and penalties. We recognize accrued interest and penalties related to unrecognized tax benefits in interest expense and operating-related expense, respectively. As of
March 31, 2018
and
December 31, 2017
, we had
$56 million
and
$59 million
, respectively, of accrued interest and penalties associated with unrecognized tax benefits. Based on the current status of income tax audits, we believe that the total amount of unrecognized tax benefits on the balance sheet may be reduced by approximately
$90 million
in the next twelve months as a result of the resolution of tax examinations.
|
4.
|
|
A summary of short-term and long-term debt outstanding is as follows:
|
(in millions)
|
March 31,
2018 |
December 31,
2017 |
|||||
|
2.5% Senior Notes, due 2018
1
|
$
|
400
|
|
$
|
399
|
|
|
|
3.3% Senior Notes, due 2020
2
|
697
|
|
697
|
|
|||
|
4.0% Senior Notes, due 2025
3
|
692
|
|
692
|
|
|||
|
4.4% Senior Notes, due 2026
4
|
892
|
|
892
|
|
|||
|
2.95% Senior Notes, due 2027
5
|
493
|
|
493
|
|
|||
|
6.55% Senior Notes, due 2037
6
|
396
|
|
396
|
|
|||
|
Total debt
|
3,570
|
|
3,569
|
|
|||
|
Less: short-term debt including current maturities
|
400
|
|
399
|
|
|||
|
Long-term debt
|
$
|
3,170
|
|
$
|
3,170
|
|
|
|
1
|
Interest payments are due semiannually on February 15 and August 15, and as of
March 31, 2018
, the unamortized debt discount and issuance costs are less than
$1 million
.
|
|
2
|
Interest payments are due semiannually on February 14 and August 14, and as of
March 31, 2018
, the unamortized debt discount and issuance costs total
$3 million
.
|
|
3
|
Interest payments are due semiannually on June 15 and December 15, and as of
March 31, 2018
, the unamortized debt discount and issuance costs total
$8 million
.
|
|
4
|
Interest payments are due semiannually on February 15 and August 15, and as of
March 31, 2018
, the unamortized debt discount and issuance costs total
$8 million
.
|
|
5
|
Interest payments are due semiannually on January 22 and July 22, and as of
March 31, 2018
, the unamortized debt discount and issuance costs total
$7 million
.
|
|
6
|
Interest payments are due semiannually on May 15 and November 15, and as of
March 31, 2018
, the unamortized debt discount and issuance costs total
$4 million
.
|
The fair value of our total debt borrowings was $
3.7 billion
and
$3.8 billion
as of
March 31, 2018
and
December 31, 2017
, respectively, and was estimated based on quoted market prices.
We have the ability to borrow a total of
$1.2 billion
through our commercial paper program, which is supported by our revolving
$1.2 billion
five
-year credit agreement (our "credit facility") that we entered into on June 30, 2017. This credit facility will terminate on June 30, 2022. As of
March 31, 2018
and
December 31, 2017
, there were
no
commercial paper borrowings outstanding.
Depending on our corporate credit rating, we pay a commitment fee of
8
to
17.5
basis points for our credit facility, whether or not amounts have been borrowed. We currently pay a commitment fee of
12.5
basis points. The interest rate on borrowings under our credit facility is, at our option, calculated using rates that are primarily based on either the prevailing London Inter-Bank Offer Rate, the prime rate determined by the administrative agent or the Federal Funds Rate. For certain borrowings under this credit facility, there is also a spread based on our corporate credit rating.
Our credit facility contains certain covenants. The only financial covenant requires that our indebtedness to cash flow ratio, as defined in our credit facility, is not greater than
4
to
1
, and this covenant level has never been exceeded.
|
5.
|
Derivative Instruments
|
Our exposure to market risk includes changes in foreign exchange rates. We have operations in foreign countries where the functional currency is primarily the local currency. For international operations that are determined to be extensions of the parent company, the U.S. dollar is the functional currency. We typically have naturally hedged positions in most countries from a local currency perspective with offsetting assets and liabilities. As of
March 31, 2018
and
December 31, 2017
, we have entered into foreign exchange forward contracts to mitigate or hedge the effect of adverse fluctuations in foreign currency exchange rates. Foreign currency forward contracts are recorded at fair value that is based on foreign currency exchange rates in active markets; therefore, we classify these derivative contracts within Level 2 of the fair value hierarchy. We do not enter into any derivative financial instruments for speculative purposes.
14
Undesignated Derivative Instruments
During the three months ended December 31, 2017, we entered into foreign exchange forward contracts in order to mitigate the change in fair value of specific assets and liabilities in the consolidated balance sheet. These forward contracts do not qualify for hedge accounting. As of
March 31, 2018
, the aggregate notional value of these outstanding forward contracts was
$156 million
. The fair value of these forward contracts are recorded in prepaid and other assets or other current liabilities in the consolidated balance sheet with their corresponding change in fair value recognized into selling and general expenses in the consolidated statement of income. The net loss recorded in selling and general expense for the three months ended
March 31, 2018
related to these contracts was
$1 million
.
Cash Flow Hedges
During the three months ended March 31, 2018 and December 31, 2017, we entered into a series of foreign exchange forward contracts to hedge a portion of the Indian rupee, British pound, and Euro exposures through the first quarter of 2019 and the fourth quarter of 2018, respectively. These contracts are intended to offset the impact of movement of exchange rates on future revenue and operating costs and are scheduled to mature within
twelve months
. The changes in the fair value of these contracts are initially reported in accumulated other comprehensive loss in our consolidated balance sheet and are subsequently reclassified into revenue and selling and general expenses in the same period that the hedged transaction affects earnings.
As of
March 31, 2018
, we estimate that
$3 million
of the net gains related to derivatives designated as cash flow hedges recorded in other comprehensive income (loss) is expected to be reclassified into earnings within the next twelve months. There was no material hedge ineffectiveness for the
three
months ended
March 31, 2018
and March 31,
2017
. As of
March 31, 2018
and
March 31, 2017
, the aggregate notional value of our outstanding foreign currency forward contracts was
$275 million
and
$255 million
, respectively.
The following table provides information on the location and fair value amounts of our cash flow hedges as of
March 31, 2018
and
December 31, 2017
:
|
(in millions)
Balance Sheet Location
|
March 31, 2018
|
December 31, 2017
|
||||||
|
Prepaid and other current assets
|
Foreign exchange forward contracts
|
$
|
3
|
|
$
|
3
|
|
|
|
Other current liabilities
|
Foreign exchange forward contracts
|
$
|
1
|
|
$
|
—
|
|
|
The following table provides information on the location and amounts of pre-tax gains (losses) on our cash flow hedges for the three months ended
March 31
:
|
(in millions)
|
Gain (Loss) Recognized in Accumulated Other Comprehensive Loss (effective portion)
|
Location of Gain Reclassified from Accumulated Other Comprehensive Loss into Income (effective portion)
|
Gain (Loss) Reclassified from Accumulated Other Comprehensive Loss into Income (effective portion)
|
||||||||||||||
|
Cash flow hedges - designated as hedging instruments
|
2018
|
2017
|
2018
|
2017
|
|||||||||||||
|
Foreign exchange forward contracts
|
$
|
1
|
|
$
|
5
|
|
Selling and general expenses
|
$
|
1
|
|
$
|
1
|
|
||||
The activity related to the change in unrealized gains (losses) in accumulated other comprehensive loss was as follows for the three months ended
March 31
:
|
(in millions)
|
Three Months
|
||||||
|
2018
|
2017
|
||||||
|
Net unrealized gains on cash flow hedges, net of taxes, beginning of period
|
$
|
2
|
|
$
|
2
|
|
|
|
Change in fair value, net of tax
|
2
|
|
6
|
|
|||
|
Reclassification into earnings, net of tax
|
(1
|
)
|
(1
|
)
|
|||
|
Net unrealized gains on cash flow hedges, net of taxes, end of period
|
$
|
3
|
|
$
|
7
|
|
|
|
6.
|
Employee Benefits
|
We maintain a number of active defined contribution retirement plans for our employees. The majority of our defined benefit plans are frozen. As a result, no new employees will be permitted to enter these plans and no additional benefits for current participants in the frozen plans will be accrued.
We have supplemental benefit plans that provide senior management with supplemental retirement, disability and death benefits. Certain supplemental retirement benefits are based on final monthly earnings. In addition, we sponsor voluntary 401(k) plans under which we may match employee contributions up to certain levels of compensation as well as profit-sharing plans under which we contribute a percentage of eligible employees' compensation to the employees' accounts.
We also provide certain medical, dental and life insurance benefits for active and retired employees and eligible dependents. The medical and dental plans and supplemental life insurance plan are contributory, while the basic life insurance plan is noncontributory. We currently do not prefund any of these plans.
We recognize the funded status of our defined benefit retirement and postretirement plans in the consolidated balance sheets, with a corresponding adjustment to accumulated other comprehensive loss, net of taxes. The amounts in accumulated other comprehensive loss represent unrecognized actuarial losses and unrecognized prior service costs. These amounts will be subsequently recognized as net periodic benefit cost pursuant to our accounting policy for amortizing such amounts.
Net periodic benefit cost for our retirement and postretirement plans other than the service cost component are included in other (income) expense, net in our consolidated statements of income.
The components of net periodic benefit cost for our retirement plans and postretirement plans for the three months ended
March 31
are as follows:
|
(in millions)
|
2018
|
2017
|
|||||
|
Service cost
|
$
|
1
|
|
$
|
1
|
|
|
|
Interest cost
|
18
|
|
18
|
|
|||
|
Expected return on assets
|
(32
|
)
|
(31
|
)
|
|||
|
Amortization of actuarial loss
|
4
|
|
4
|
|
|||
|
Net periodic benefit cost
|
$
|
(9
|
)
|
$
|
(8
|
)
|
|
Net periodic benefit cost related to our postretirement plans reflected in the table above was not material for the three months ended
March 31, 2018
and
March 31, 2017
, respectively.
As discussed in our Form 10-K, we changed certain discount rate assumptions for our retirement and postretirement plans and our expected return on assets assumption for our retirement plans, which became effective on January 1, 2018. The effect of the assumption changes on retirement and postretirement expense for the
three
months ended
March 31, 2018
did not have a material impact to our financial position, results of operations or cash flows.
In the first
three
months of
2018
, we contributed
$2 million
to our retirement plans and expect to make additional required contributions of approximately
$7 million
to our retirement plans during the remainder of the year. We may elect to make additional non-required contributions depending on investment performance and the pension plan status in the remaining nine months of
2018
.
15
|
7.
|
Stock-Based Compensation
|
We issue stock-based incentive awards to our eligible employees and Directors under the 2002 Employee Stock Incentive Plan and a Director Deferred Stock Ownership Plan. The 2002 Employee Stock Incentive Plan permits the granting of nonqualified stock options, stock appreciation rights, performance stock, restricted stock and other stock-based awards.
Stock-based compensation for the three months ended
March 31
is as follows:
|
(in millions)
|
2018
|
2017
|
|||||
|
Stock option expense
|
$
|
1
|
|
$
|
1
|
|
|
|
Restricted stock and unit awards expense
|
12
|
|
18
|
|
|||
|
Total stock-based compensation expense
|
$
|
13
|
|
$
|
19
|
|
|
Total unrecognized compensation expense related to unvested restricted stock and unit awards as of
March 31, 2018
was
$53 million
, which is expected to be recognized over a weighted average period of
1.5 years
.
|
8.
|
Equity
|
Stock Repurchases
On December 4, 2013, the Board of Directors approved a share repurchase program authorizing the purchase of
50 million
shares, which was approximately
18%
of the total shares of our outstanding common stock at that time.
In any period, share repurchase transactions could result in timing differences between the recognition of those repurchases and their settlement for cash. This could result in a difference between the cash used for financing activities related to common stock repurchased and the comparable change in equity.
Share repurchases for the three months ended
March 31
were as follows:
|
(in millions, except average price)
|
2018
|
2017
|
|||||
|
Total number of shares purchased
1
|
5.0
|
|
1.5
|
|
|||
|
Average price paid per share
2
|
$
|
178.11
|
|
$
|
129.97
|
|
|
|
Total cash utilized
|
$
|
1,100
|
|
$
|
201
|
|
|
|
1
|
The three months ended March 31, 2018 include shares received as part of our accelerated share repurchase agreement described in more detail below.
|
|
2
|
Average price paid per share information does not include the accelerated share repurchase agreement as discussed in more detail below.
|
Our purchased shares may be used for general corporate purposes, including the issuance of shares for stock compensation plans and to offset the dilutive effect of the exercise of employee stock options. As of
March 31, 2018
, approximately
14.0 million
shares remained available under the current share repurchase program which has no expiration date and purchases under this program may be made from time to time on the open market and in private transactions, depending on market conditions.
Accelerated Share Repurchase Agreement
We entered into an accelerated share repurchase ("ASR") agreement with a financial institution on March 6, 2018 to initiate share repurchases aggregating
$1 billion
. The ASR agreement was structured as an uncapped ASR agreement in which we paid
$1 billion
and received an initial delivery of approximately
4.5 million
shares, representing
85%
of the
$1 billion
at a price equal to the then market price of the Company. The total number of shares to be repurchased under the ASR agreement will be equal to
$1 billion
divided by the volume weighted-average share price, less a discount, over the term of the ASR agreement. The final settlement of the transaction under the ASR agreement is expected to be completed no later than the third quarter of 2018. The repurchased shares are held in Treasury. The ASR agreement was executed under the current share repurchase program, approved on December 4, 2013.
16
Redeemable Noncontrolling Interests
The agreement with the minority partners that own
27%
of our S&P Dow Jones Indices LLC joint venture contains redemption features whereby interests held by minority partners are redeemable either (i) at the option of the holder or (ii) upon the occurrence of an event that is not solely within our control. Specifically, under the terms of the operating agreement of S&P Dow Jones Indices LLC, after December 31, 2017, CME Group and CME Group Index Services LLC ("CGIS") has the right at any time to sell, and we are obligated to buy, at least
20%
of their share in S&P Dow Jones Indices LLC. In addition, in the event there is a change of control of the Company, for the
15
days following a change in control, CME Group and CGIS will have the right to put their interest to us at the then fair value of CME Group's and CGIS' minority interest.
If interests were to be redeemed under this agreement, we would generally be required to purchase the interest at fair value on the date of redemption. This interest is presented on the consolidated balance sheets outside of equity under the caption “Redeemable noncontrolling interest” with an initial value based on fair value for the portion attributable to the net assets we acquired, and based on our historical cost for the portion attributable to our S&P Index business. We adjust the redeemable noncontrolling interest each reporting period to its estimated redemption value, but never less than its initial fair value, considering a combination of an income and market valuation approach. Our income and market valuation approaches incorporate Level 3 fair value measures for instances when observable inputs are not available, including assumptions related to expected future net cash flows, long-term growth rates, the timing and nature of tax attributes, and the redemption features. Any adjustments to the redemption value will impact retained income.
Noncontrolling interests that do not contain such redemption features are presented in equity.
Changes to redeemable noncontrolling interest during the
three
months ended
March 31, 2018
were as follows:
|
(in millions)
|
|||
|
Balance as of December 31, 2017
|
$
|
1,350
|
|
|
Net income attributable to noncontrolling interest
|
40
|
|
|
|
Distributions payable to noncontrolling interest
|
(28
|
)
|
|
|
Redemption value adjustment
|
(12
|
)
|
|
|
Balance as of March 31, 2018
|
$
|
1,350
|
|
Accumulated Other Comprehensive Loss
The following table summarizes the changes in the components of accumulated other comprehensive loss for the
three
months ended
March 31, 2018
:
|
(in millions)
|
Foreign Currency Translation Adjustment
|
Pension and Postretirement Benefit Plans
|
Unrealized Gain (Loss) on Forward Exchange Contracts
|
Unrealized Gain (Loss) on Investments
|
Accumulated Other Comprehensive Loss
|
||||||||||||||||
|
Balance as of December 31, 2017
|
$
|
(239
|
)
|
$
|
(402
|
)
|
$
|
2
|
|
(10
|
)
|
$
|
(649
|
)
|
|||||||
|
Other comprehensive income before reclassifications
|
5
|
|
—
|
|
2
|
|
10
|
|
17
|
|
|||||||||||
|
Reclassifications from accumulated other comprehensive loss to net earnings
|
—
|
|
3
|
|
1
|
|
(1
|
)
|
2
|
|
—
|
|
2
|
|
|||||||
|
Net other comprehensive income
|
5
|
|
3
|
|
1
|
|
10
|
|
19
|
|
|||||||||||
|
Balance as of March 31, 2018
|
$
|
(234
|
)
|
$
|
(399
|
)
|
$
|
3
|
|
$
|
—
|
|
$
|
(630
|
)
|
||||||
|
1
|
See Note 6
—
Employee Benefits
for additional details of items reclassed from accumulated other comprehensive loss to net earnings.
|
|
2
|
See Note 5
—
Derivative Instruments
for additional details of items reclassed from accumulated other comprehensive loss to net earnings.
|
The net actuarial loss and prior service cost related to pension and other postretirement benefit plans included in other comprehensive income is net of a tax provision of
$1 million
for the
three
months ended
March 31, 2018
.
17
|
9.
|
Earnings Per Share
|
Basic earnings per common share (“EPS”) is computed by dividing net income attributable to the common shareholders of the Company by the weighted-average number of common shares outstanding. Diluted EPS is computed in the same manner as basic EPS, except the number of shares is increased to include additional common shares that would have been outstanding if potential common shares with a dilutive effect had been issued. Potential common shares consist primarily of stock options and restricted performance shares calculated using the treasury stock method.
The calculation for basic and diluted EPS for the three months ended
March 31
is as follows:
|
(in millions, except per share amounts)
|
2018
|
2017
|
|||||
|
Amounts attributable to S&P Global Inc. common shareholders:
|
|||||||
|
Net income
|
$
|
491
|
|
$
|
399
|
|
|
|
Basic weighted-average number of common shares outstanding
|
252.4
|
|
258.2
|
|
|||
|
Effect of stock options and other dilutive securities
|
2.0
|
|
2.6
|
|
|||
|
Diluted weighted-average number of common shares outstanding
|
254.4
|
|
260.8
|
|
|||
|
Earnings per share attributable to S&P Global Inc. common shareholders:
|
|||||||
|
Net income:
|
|||||||
|
Basic
|
$
|
1.94
|
|
$
|
1.54
|
|
|
|
Diluted
|
$
|
1.93
|
|
$
|
1.53
|
|
|
We have certain stock options and restricted performance shares that are potentially excluded from the computation of diluted EPS. The effect of the potential exercise of stock options is excluded when the average market price of our common stock is lower than the exercise price of the related option during the period or when a net loss exists because the effect would have been antidilutive. Additionally, restricted performance shares are excluded because the necessary vesting conditions had not been met or when a net loss exists. For the
three
months ended
March 31, 2018
and
2017
, there were
no
stock options excluded. Restricted performance shares outstanding of
0.6 million
and
0.7 million
as of
March 31, 2018
and
2017
, respectively, were excluded.
|
10.
|
Restructuring
|
We continuously evaluate our cost structure to identify cost savings to streamline our operating model. Our 2017 restructuring plans consisted of a company-wide workforce reduction of approximately
520
positions and are further detailed below. The charges for the restructuring plan are classified as selling and general expenses within the consolidated statements of income and the reserves are included in other current liabilities in the consolidated balance sheets.
In certain circumstances, reserves are no longer needed because of efficiencies in carrying out the plans or because employees previously identified for separation resigned from the Company and did not receive severance or were reassigned due to circumstances not foreseen when the original plans were initiated. In these cases, we reverse reserves through the consolidated statements of income during the period when it is determined they are no longer needed.
The initial restructuring charge recorded and the ending reserve balance as of
March 31, 2018
by segment is as follows:
|
2017 Restructuring Plans
|
|||||||
|
(in millions)
|
Initial Charge Recorded
|
Ending Reserve Balance
|
|||||
|
Ratings
|
$
|
25
|
|
$
|
21
|
|
|
|
Market Intelligence
|
8
|
|
4
|
|
|||
|
Platts
|
1
|
|
—
|
|
|||
|
Indices
|
—
|
|
—
|
|
|||
|
Corporate
|
10
|
|
8
|
|
|||
|
Total
|
$
|
44
|
|
$
|
33
|
|
|
The ending reserve balance for the 2017 restructuring plan was
$39 million
as of December 31, 2017. For the
three
months ended
March 31, 2018
, we have reduced the reserve for the 2017 restructuring plan by
$6 million
. The reductions primarily related to cash payments for employee severance charges.
|
11.
|
Segment and Related Information
|
We have
four
reportable segments: Ratings, Market Intelligence, Platts and Indices. Our Chief Executive Officer is our chief operating decision-maker and evaluates performance of our segments and allocates resources based primarily on operating profit. Segment operating profit does not include unallocated expense or interest expense as these are costs that do not affect the operating results of our segments.
Effective beginning with the first quarter of 2018, we began reporting the financial results of Market Intelligence and Platts as separate reportable segments consistent with the changes to our organizational structure and how our Chief Executive Officer evaluates the performance of these segments. Our historical segment reporting has been retroactively revised to reflect the current organizational structure.
A summary of operating results by reportable segment for the three months ended
March 31
is as follows:
|
2018
|
2017
|
||||||||||||||
|
(in millions)
|
Revenue
|
Operating Profit
|
Revenue
|
Operating Profit
|
|||||||||||
|
Ratings
1
|
$
|
748
|
|
$
|
408
|
|
$
|
714
|
|
$
|
374
|
|
|||
|
Market Intelligence
2
|
437
|
|
112
|
|
402
|
|
104
|
|
|||||||
|
Platts
3
|
196
|
|
90
|
|
191
|
|
82
|
|
|||||||
|
Indices
4
|
214
|
|
147
|
|
171
|
|
115
|
|
|||||||
|
Intersegment elimination
5
|
(28
|
)
|
—
|
|
(25
|
)
|
—
|
|
|||||||
|
Total operating segments
|
1,567
|
|
757
|
|
1,453
|
|
675
|
|
|||||||
|
Unallocated expense
|
—
|
|
(46
|
)
|
—
|
|
(36
|
)
|
|||||||
|
Total
|
$
|
1,567
|
|
$
|
711
|
|
$
|
1,453
|
|
$
|
639
|
|
|||
|
1
|
Operating profit for
2017
includes legal settlement expenses of
$2 million
and amortization of intangibles from acquisitions of
$1 million
.
|
|
2
|
Operating profit for
2018
and
2017
includes amortization of intangibles from acquisitions of
$17 million
. Operating profit for
2017
includes non-cash disposition-related adjustments of
$4 million
.
|
|
3
|
Operating profit for
2018
and
2017
includes amortization of intangibles from acquisitions of
$5 million
. Operating profit for
2017
includes non-cash acquisition-related adjustments of
$11 million
.
|
|
4
|
Operating profit for
2018
and
2017
includes amortization of intangibles from acquisitions of
$2 million
and
$1 million
, respectively.
|
|
5
|
Revenue for Ratings and expenses for Market Intelligence include an intersegment royalty charged to Market Intelligence for the rights to use and distribute content and data developed by Ratings.
|
The following provides revenue by geographic region for the three months ended
March 31
:
|
(in millions)
|
2018
|
2017
|
|||||
|
U.S.
|
$
|
951
|
|
$
|
891
|
|
|
|
European region
|
381
|
|
346
|
|
|||
|
Asia
|
156
|
|
132
|
|
|||
|
Rest of the world
|
79
|
|
84
|
|
|||
|
Total
|
$
|
1,567
|
|
$
|
1,453
|
|
|
See Note 2
—
Acquisitions and Divestitures
and Note 10
—
Restructuring
for additional actions that impacted the segment operating results.
18
|
12.
|
Commitments and Contingencies
|
Related Party Agreements
During the first quarter of 2018, the Company made a
$20 million
contribution to the S&P Global Foundation.
In June of 2012, we entered into a license agreement (the "License Agreement") with the holder of S&P Dow Jones Indices LLC noncontrolling interest, CME Group, which replaced the 2005 license agreement between Indices and CME Group. Under the terms of the License Agreement, S&P Dow Jones Indices LLC receives a share of the profits from the trading and clearing of CME Group's equity index products. During the
three
months ended
March 31, 2018
, S&P Dow Jones Indices LLC earned
$31 million
of revenue under the terms of the License Agreement. The entire amount of this revenue is included in our consolidated statement of income and the portion related to the
27%
noncontrolling interest is removed in net income attributable to noncontrolling interests.
Legal and Regulatory Matters
In the normal course of business both in the United States and abroad, the Company and its subsidiaries are defendants in a number of legal proceedings and are often the subject of government and regulatory proceedings, investigations and inquiries. Many of these proceedings, investigations and inquiries relate to the ratings activity of S&P Global Ratings brought by issuers and alleged purchasers of rated securities. In addition, various government and self-regulatory agencies frequently make inquiries and conduct investigations into our compliance with applicable laws and regulations, including those related to ratings activities and antitrust matters. Any of these proceedings, investigations or inquiries could ultimately result in adverse judgments, damages, fines, penalties or activity restrictions, which could adversely impact our consolidated financial condition, cash flows, business or competitive position.
The Company believes that it has meritorious defenses to the pending claims and potential claims in the matters described below and is diligently pursuing these defenses, and in some cases working to reach an acceptable negotiated resolution. However, in view of the uncertainty inherent in litigation and government and regulatory enforcement matters, we cannot predict the eventual outcome of these matters or the timing of their resolution, or in most cases reasonably estimate what the eventual judgments, damages, fines, penalties or impact of activity restrictions may be. As a result, we cannot provide assurance that the outcome of the matters described below will not have a material adverse effect on our consolidated financial condition, cash flows, business or competitive position. As litigation or the process to resolve pending matters progresses, as the case may be, we will continue to review the latest information available and assess our ability to predict the outcome of such matters and the effects, if any, on our consolidated financial condition, cash flows, business and competitive position, which may require that we record liabilities in the consolidated financial statements in future periods.
With respect to the matters identified below, we have recognized a liability when both (a) information available indicates that it is probable that a liability has been incurred as of the date of these financial statements and (b) the amount of loss can reasonably be estimated.
S&P Global Ratings
Financial Crisis Litigation
The Company and its subsidiaries continue to defend civil cases brought by private and public plaintiffs arising out of ratings activities prior to and during the global financial crisis of 2008-2009. Included in these civil cases are several lawsuits in Australia against the Company and Standard & Poor’s International, LLC relating to alleged investment losses in collateralized debt obligations (“CDOs”) rated by S&P Global Ratings. We can provide no assurance that we will not be obligated to pay significant amounts in order to satisfy any judgments or to resolve these matters on terms deemed acceptable.
U.S. Securities and Exchange Commission
As a nationally recognized statistical rating organization registered with the SEC under Section 15E of the Securities Exchange Act of 1934, S&P Global Ratings is in ongoing communication with the staff of the SEC regarding compliance with its extensive obligations under the federal securities laws. Although S&P Global Ratings seeks to promptly address any compliance issues that it detects or that the staff of the SEC raises, there can be no assurance that the SEC will not seek remedies against S&P Global Ratings for one or more compliance deficiencies.
19
Trani Prosecutorial Proceeding
In 2014, the prosecutor in the Italian city of Trani obtained criminal indictments against several current and former S&P Global Ratings managers and ratings analysts for alleged market manipulation, and against Standard & Poor’s Credit Market Services Europe under Italy’s vicarious liability statute, for having allegedly failed to properly supervise the ratings analysts and prevent them from committing market manipulation. The prosecutor’s theories were based on various actions by S&P Global Ratings taken with respect to Italian sovereign debt between May of 2011 and January of 2012. On March 30, 2017, following trial, the court in Trani issued an oral verdict acquitting each of the individual defendants and Standard & Poor’s Credit Market Services Europe of all charges, and on September 27, 2017, the court filed a written opinion supporting the verdict. The prosecutor did not appeal, and the verdict is now final.
Shareholder Derivative Actions
In August of 2015,
two
purported shareholders commenced a putative derivative action on behalf of the Company in New York State Supreme Court titled Retirement Plan for General Employees of the City of North Miami Beach and Robin Stein v. Harold McGraw III, et al. The complaint asserted claims for, among other things, breach of fiduciary duty, waste of corporate assets, and mismanagement against the board of directors and certain former directors and employees of the Company. Plaintiffs sought recovery from the defendants based primarily on allegations that S&P Global Ratings’ credit ratings practices for certain residential mortgage-backed securities and collateralized debt obligations misrepresented the credit risks of those securities, allegedly resulting in losses to the Company. In January of 2016, a different purported shareholder commenced a separate putative derivative action on behalf of the Company in New York State Supreme Court titled L.A. Grika v. Harold McGraw III, et al. The allegations in the complaint are substantially similar to those in the North Miami Beach matter. The complaint asserts claims for, among other things, breach of fiduciary duty, aiding and abetting breaches of fiduciary duty, unjust enrichment, contribution and indemnification against Harold McGraw III, Douglas L. Peterson, and
nine
former employees of the Company. The Grika matter was transferred to the judge presiding over the North Miami Beach matter. In December of 2016, the court issued orders granting the Company's motions to dismiss both the North Miami Beach and Grika matters. In January of 2017, the plaintiffs in both matters filed notices of appeal. On February 13, 2018, the appellate court affirmed the lower court's dismissal of the North Miami Beach matter. Briefing on the Grika appeal is now complete, and oral argument was held on April 11, 2018.
|
13.
|
Recently Issued or Adopted Accounting Standards
|
In February of 2018, the Financial Accounting Standards Board ("FASB") issued guidance which allows companies to reclassify certain stranded income tax effects resulting from the enactment of the TCJA from accumulated other comprehensive income to retained earnings. The guidance is effective for reporting periods after December 15, 2018; however, early adoption is permitted. We are currently evaluating the impact of the adoption of this guidance on our consolidated financial statements.
In August of 2017, FASB issued guidance to enhance the hedge accounting model for both nonfinancial and financial risk components, which includes amendments to address certain aspects of recognition and presentation disclosure. The guidance is effective for reporting periods beginning after December 15, 2018. We do not expect this guidance to have a significant impact on our consolidated financial instruments.
In May of 2017, FASB issued guidance that provides clarification on when modification accounting should be used for changes to the terms or conditions of a share-based payment award. This guidance does not change the accounting for modifications but
clarifies when modification accounting guidance should be applied. Under the new guidance, an entity should apply modification accounting in response to a change in the terms and conditions of an entity's share-based payment awards unless three newly specified criteria are met. The guidance was effective on January 1, 2018, and the adoption of this guidance did not have a significant impact on our consolidated financial statements.
In March of 2017, FASB issued guidance to enhance the presentation of net periodic pension cost and net periodic postretirement benefit cost. The guidance requires employers to report the service cost component in the same line item or items as other compensation costs arising from services rendered by the pertinent employees during the period, and requires the other components of net periodic pension cost and net periodic postretirement benefit cost to be presented in the income statement separately from the service cost component outside a subtotal of income from operations. Additionally, only the service cost component is eligible for capitalization. We adopted the guidance on January 1, 2018. The change in capitalization requirement did not have a material impact on our consolidated financial statements. As a result of the adoption of the guidance, net periodic benefit cost for our retirement and postretirement plans other than the service cost component are included in other (income) expense, net in our consolidated statements of income. See Note 6
—
Employee Benefits
for additional information related to our retirement and postretirement plans.
20
In January of 2017, the FASB issued guidance that simplifies the subsequent measurement of goodwill and eliminates Step 2 from the goodwill impairment test. Under the new guidance, an entity should perform its annual, or interim, goodwill impairment test by comparing the fair value of a reporting unit with its carrying amount. An entity should recognize an impairment charge for the amount by which the carrying amount exceeds the reporting unit's fair value; however, the loss recognized should not exceed the total amount of goodwill allocated to that reporting unit. Additionally, an entity should consider income tax effects from any tax deductible goodwill on the carrying amount of the reporting unit when measuring the goodwill impairment loss, if applicable. The guidance is effective for reporting periods beginning after December 15, 2019; however, early adoption is permitted. We do not expect this guidance to have a significant impact on our consolidated financial statements.
In January of 2017, the FASB issued guidance that clarifies the definition of a business with the objective of adding guidance to assist entities with evaluating whether transactions should be accounted for as acquisitions (or disposals) of assets or businesses. The guidance was effective on January 1, 2018, and the adoption of this guidance did not have a significant impact on our consolidated financial statements.
In August of 2016, the FASB issued guidance providing amendments to eight specific statement of cash flows classification issues. The guidance was effective on January 1, 2018, and the adoption of this guidance did not have a significant impact on our consolidated financial statements.
In February of 2016, the FASB issued guidance that amends accounting for leases. Under the new guidance, a lessee will recognize assets and liabilities but will recognize expenses similar to current lease accounting. The guidance is effective for reporting periods beginning after December 15, 2018; however early adoption is permitted. The new guidance must be adopted using a modified retrospective approach to each prior reporting period presented with various optional practical expedients. We are in the process of designing our implementation plan to adopt the new standard for the January 1, 2019 implementation date and are continuing to evaluate the impact of the adoption of this guidance on our consolidated financial statements.
In January of 2016, the FASB issued guidance to enhance the reporting model for financial instruments, which includes amendments to address certain aspects of recognition, measurement, presentation and disclosure. We adopted this guidance on January 1, 2018. We recorded a reduction to opening retained earnings and an increase to accumulated other comprehensive income of
$10 million
as of January 1, 2018 due to the adoption of this guidance. The adoption of this guidance did not have a significant impact on our consolidated financial statements.
In May of 2014, the FASB and the International Accounting Standards Board (“IASB”) issued jointly a converged standard on the recognition of revenue from contracts with customers, which is intended to improve the financial reporting of revenue and comparability of the top line in financial statements globally. The core principle of the new standard is for the recognition of revenue to depict the transfer of goods or services to customers in amounts that reflect the payment to which the company expects to be entitled in exchange for those goods or services. The new standard also results in enhanced revenue disclosures, provides guidance for transactions that were not previously addressed comprehensively and improves guidance for multiple-element arrangements. We adopted the new revenue standard effective January 1, 2018 using the modified retrospective transition method. See Note 1
—
Nature of Operations and Basis of Presentation
for further details.
|
14.
|
Condensed Consolidating Financial Statements
|
On September 22, 2016, we issued
$500 million
of
2.95%
senior notes due in 2027. On May 26, 2015, we issued
$700 million
of
4.0%
senior notes due in 2025. On August 18, 2015, we issued
$2.0 billion
of senior notes, consisting of
$400 million
of
2.5%
senior notes due in 2018,
$700 million
of
3.3%
senior notes due in 2020 and
$900 million
of
4.4%
senior notes due in 2026. See Note 4
—
Debt
for additional information.
The senior notes described above are fully and unconditionally guaranteed by Standard & Poor's Financial Services LLC, a
100%
owned subsidiary of the Company. The following condensed consolidating financial statements present the results of operations, financial position and cash flows of S&P Global Inc., Standard & Poor's Financial Services LLC, and the Non-Guarantor Subsidiaries of S&P Global Inc. and Standard & Poor's Financial Services LLC, and the eliminations necessary to arrive at the information for the Company on a consolidated basis.
21
|
Statement of Income
|
|||||||||||||||||||
|
Three Months Ended March 31, 2018
|
|||||||||||||||||||
|
(Unaudited)
|
|||||||||||||||||||
|
(in millions)
|
S&P Global Inc.
|
Standard & Poor's Financial Services LLC
|
Non-Guarantor Subsidiaries
|
Eliminations
|
S&P Global Inc. Consolidated
|
||||||||||||||
|
Revenue
|
$
|
191
|
|
$
|
434
|
|
$
|
977
|
|
$
|
(35
|
)
|
$
|
1,567
|
|
||||
|
Expenses:
|
|||||||||||||||||||
|
Operating-related expenses
|
34
|
|
117
|
|
323
|
|
(35
|
)
|
439
|
|
|||||||||
|
Selling and general expenses
|
37
|
|
87
|
|
248
|
|
—
|
|
372
|
|
|||||||||
|
Depreciation
|
8
|
|
2
|
|
11
|
|
—
|
|
21
|
|
|||||||||
|
Amortization of intangibles
|
—
|
|
—
|
|
24
|
|
—
|
|
24
|
|
|||||||||
|
Total expenses
|
79
|
|
206
|
|
606
|
|
(35
|
)
|
856
|
|
|||||||||
|
Operating profit
|
112
|
|
228
|
|
371
|
|
—
|
|
711
|
|
|||||||||
|
Other (income) expense, net
|
(7
|
)
|
—
|
|
3
|
|
—
|
|
(4
|
)
|
|||||||||
|
Interest expense (income), net
|
38
|
|
—
|
|
(4
|
)
|
—
|
|
34
|
|
|||||||||
|
Non-operating intercompany transactions
|
100
|
|
(20
|
)
|
(1,096
|
)
|
1,016
|
|
—
|
|
|||||||||
|
Income before taxes on income
|
(19
|
)
|
248
|
|
1,468
|
|
(1,016
|
)
|
681
|
|
|||||||||
|
(Benefit) provision for taxes on income
|
(14
|
)
|
71
|
|
90
|
|
—
|
|
147
|
|
|||||||||
|
Equity in net income of subsidiaries
|
1,512
|
|
—
|
|
—
|
|
(1,512
|
)
|
—
|
|
|||||||||
|
Net income
|
$
|
1,507
|
|
$
|
177
|
|
$
|
1,378
|
|
$
|
(2,528
|
)
|
$
|
534
|
|
||||
|
Less: net income attributable to noncontrolling interests
|
—
|
|
—
|
|
—
|
|
(43
|
)
|
(43
|
)
|
|||||||||
|
Net income attributable to S&P Global Inc.
|
$
|
1,507
|
|
$
|
177
|
|
$
|
1,378
|
|
$
|
(2,571
|
)
|
$
|
491
|
|
||||
|
Comprehensive income
|
$
|
1,487
|
|
$
|
177
|
|
$
|
1,412
|
|
$
|
(2,533
|
)
|
$
|
543
|
|
||||
22
|
Statement of Income
|
|||||||||||||||||||
|
Three Months Ended March 31, 2017
|
|||||||||||||||||||
|
(Unaudited)
|
|||||||||||||||||||
|
(in millions)
|
S&P Global Inc.
|
Standard & Poor's Financial Services LLC
|
Non-Guarantor Subsidiaries
|
Eliminations
|
S&P Global Inc. Consolidated
|
||||||||||||||
|
Revenue
|
$
|
180
|
|
$
|
438
|
|
$
|
867
|
|
$
|
(32
|
)
|
$
|
1,453
|
|
||||
|
Expenses:
|
|||||||||||||||||||
|
Operating-related expenses
|
31
|
|
119
|
|
293
|
|
(32
|
)
|
411
|
|
|||||||||
|
Selling and general expenses
|
26
|
|
88
|
|
246
|
|
—
|
|
360
|
|
|||||||||
|
Depreciation
|
7
|
|
3
|
|
9
|
|
—
|
|
19
|
|
|||||||||
|
Amortization of intangibles
|
—
|
|
—
|
|
24
|
|
—
|
|
24
|
|
|||||||||
|
Total expenses
|
64
|
|
210
|
|
572
|
|
(32
|
)
|
814
|
|
|||||||||
|
Operating profit
|
116
|
|
228
|
|
295
|
|
—
|
|
639
|
|
|||||||||
|
Other (income) expense, net
|
(6
|
)
|
—
|
|
(3
|
)
|
—
|
|
(9
|
)
|
|||||||||
|
Interest expense (income), net
|
39
|
|
—
|
|
(2
|
)
|
—
|
|
37
|
|
|||||||||
|
Non-operating intercompany transactions
|
82
|
|
(19
|
)
|
(901
|
)
|
838
|
|
—
|
|
|||||||||
|
Income before taxes on income
|
1
|
|
247
|
|
1,201
|
|
(838
|
)
|
611
|
|
|||||||||
|
(Benefit) provision for taxes on income
|
(11
|
)
|
99
|
|
93
|
|
—
|
|
181
|
|
|||||||||
|
Equity in net income of subsidiaries
|
1,224
|
|
—
|
|
—
|
|
(1,224
|
)
|
—
|
|
|||||||||
|
Net income
|
$
|
1,236
|
|
$
|
148
|
|
$
|
1,108
|
|
$
|
(2,062
|
)
|
$
|
430
|
|
||||
|
Less: net income attributable to noncontrolling interests
|
—
|
|
—
|
|
—
|
|
(31
|
)
|
(31
|
)
|
|||||||||
|
Net income attributable to S&P Global Inc.
|
$
|
1,236
|
|
$
|
148
|
|
$
|
1,108
|
|
$
|
(2,093
|
)
|
$
|
399
|
|
||||
|
Comprehensive income
|
$
|
1,238
|
|
$
|
147
|
|
$
|
1,147
|
|
$
|
(2,064
|
)
|
$
|
468
|
|
||||
23
|
Balance Sheet
|
|||||||||||||||||||
|
March 31, 2018
|
|||||||||||||||||||
|
(Unaudited)
|
|||||||||||||||||||
|
(in millions)
|
S&P Global Inc.
|
Standard & Poor's Financial Services LLC
|
Non-Guarantor Subsidiaries
|
Eliminations
|
S&P Global Inc. Consolidated
|
||||||||||||||
|
ASSETS
|
|||||||||||||||||||
|
Current assets:
|
|||||||||||||||||||
|
Cash and cash equivalents
|
$
|
581
|
|
$
|
—
|
|
$
|
1,175
|
|
$
|
—
|
|
$
|
1,756
|
|
||||
|
Accounts receivable, net of allowance for doubtful accounts
|
133
|
|
178
|
|
1,002
|
|
—
|
|
1,313
|
|
|||||||||
|
Intercompany receivable
|
608
|
|
1,454
|
|
2,887
|
|
(4,949
|
)
|
—
|
|
|||||||||
|
Prepaid and other current assets
|
92
|
|
(4
|
)
|
127
|
|
—
|
|
215
|
|
|||||||||
|
Total current assets
|
1,414
|
|
1,628
|
|
5,191
|
|
(4,949
|
)
|
3,284
|
|
|||||||||
|
Property and equipment, net of accumulated depreciation
|
170
|
|
1
|
|
99
|
|
|
270
|
|
||||||||||
|
Goodwill
|
261
|
|
—
|
|
2,775
|
|
9
|
|
3,045
|
|
|||||||||
|
Other intangible assets, net
|
—
|
|
—
|
|
1,390
|
|
—
|
|
1,390
|
|
|||||||||
|
Investments in subsidiaries
|
7,069
|
|
5
|
|
8,085
|
|
(15,159
|
)
|
—
|
|
|||||||||
|
Intercompany loans receivable
|
118
|
|
—
|
|
1,885
|
|
(2,003
|
)
|
—
|
|
|||||||||
|
Other non-current assets
|
232
|
|
63
|
|
213
|
|
—
|
|
508
|
|
|||||||||
|
Total assets
|
$
|
9,264
|
|
$
|
1,697
|
|
$
|
19,638
|
|
$
|
(22,102
|
)
|
$
|
8,497
|
|
||||
|
LIABILITIES AND EQUITY
|
|||||||||||||||||||
|
Current liabilities:
|
|||||||||||||||||||
|
Accounts payable
|
$
|
79
|
|
$
|
19
|
|
$
|
98
|
|
$
|
—
|
|
$
|
196
|
|
||||
|
Intercompany payable
|
3,577
|
|
29
|
|
1,343
|
|
(4,949
|
)
|
—
|
|
|||||||||
|
Accrued compensation and contributions to retirement plans
|
84
|
|
14
|
|
97
|
|
—
|
|
195
|
|
|||||||||
|
Short-term debt
|
400
|
|
—
|
|
—
|
|
—
|
|
400
|
|
|||||||||
|
Income taxes currently payable
|
13
|
|
—
|
|
87
|
|
—
|
|
100
|
|
|||||||||
|
Unearned revenue
|
288
|
|
247
|
|
1,144
|
|
—
|
|
1,679
|
|
|||||||||
|
Accrued legal settlements
|
—
|
|
—
|
|
82
|
|
—
|
|
82
|
|
|||||||||
|
Other current liabilities
|
265
|
|
21
|
|
197
|
|
—
|
|
483
|
|
|||||||||
|
Total current liabilities
|
4,706
|
|
330
|
|
3,048
|
|
(4,949
|
)
|
3,135
|
|
|||||||||
|
Long-term debt
|
3,170
|
|
—
|
|
—
|
|
—
|
|
3,170
|
|
|||||||||
|
Intercompany loans payable
|
102
|
|
—
|
|
1,901
|
|
(2,003
|
)
|
—
|
|
|||||||||
|
Pension and other postretirement benefits
|
178
|
|
—
|
|
57
|
|
—
|
|
235
|
|
|||||||||
|
Other non-current liabilities
|
157
|
|
55
|
|
327
|
|
—
|
|
539
|
|
|||||||||
|
Total liabilities
|
8,313
|
|
385
|
|
5,333
|
|
(6,952
|
)
|
7,079
|
|
|||||||||
|
Redeemable noncontrolling interest
|
—
|
|
—
|
|
—
|
|
1,350
|
|
1,350
|
|
|||||||||
|
Equity:
|
|||||||||||||||||||
|
Common stock
|
412
|
|
—
|
|
2,318
|
|
(2,318
|
)
|
412
|
|
|||||||||
|
Additional paid-in capital
|
(415
|
)
|
604
|
|
9,335
|
|
(9,189
|
)
|
335
|
|
|||||||||
|
Retained income
|
11,780
|
|
708
|
|
3,056
|
|
(5,117
|
)
|
10,427
|
|
|||||||||
|
Accumulated other comprehensive loss
|
(289
|
)
|
—
|
|
(382
|
)
|
41
|
|
(630
|
)
|
|||||||||
|
Less: common stock in treasury
|
(10,537
|
)
|
—
|
|
(23
|
)
|
23
|
|
(10,537
|
)
|
|||||||||
|
Total equity - controlling interests
|
951
|
|
1,312
|
|
14,304
|
|
(16,560
|
)
|
7
|
|
|||||||||
|
Total equity - noncontrolling interests
|
—
|
|
—
|
|
1
|
|
60
|
|
61
|
|
|||||||||
|
Total equity
|
951
|
|
1,312
|
|
14,305
|
|
(16,500
|
)
|
68
|
|
|||||||||
|
Total liabilities and equity
|
$
|
9,264
|
|
$
|
1,697
|
|
$
|
19,638
|
|
$
|
(22,102
|
)
|
$
|
8,497
|
|
||||
24
|
Balance Sheet
|
|||||||||||||||||||
|
December 31, 2017
|
|||||||||||||||||||
|
(in millions)
|
S&P Global Inc.
|
Standard & Poor's Financial Services LLC
|
Non-Guarantor Subsidiaries
|
Eliminations
|
S&P Global Inc. Consolidated
|
||||||||||||||
|
ASSETS
|
|||||||||||||||||||
|
Current assets:
|
|||||||||||||||||||
|
Cash and cash equivalents
|
$
|
632
|
|
$
|
—
|
|
$
|
2,147
|
|
$
|
—
|
|
$
|
2,779
|
|
||||
|
Accounts receivable, net of allowance for doubtful accounts
|
138
|
|
152
|
|
1,029
|
|
—
|
|
1,319
|
|
|||||||||
|
Intercompany receivable
|
768
|
|
1,784
|
|
2,527
|
|
(5,079
|
)
|
—
|
|
|||||||||
|
Prepaid and other current assets
|
143
|
|
(3
|
)
|
86
|
|
—
|
|
226
|
|
|||||||||
|
Total current assets
|
1,681
|
|
1,933
|
|
5,789
|
|
(5,079
|
)
|
4,324
|
|
|||||||||
|
Property and equipment, net of accumulated depreciation
|
158
|
|
10
|
|
107
|
|
—
|
|
275
|
|
|||||||||
|
Goodwill
|
261
|
|
—
|
|
2,719
|
|
9
|
|
2,989
|
|
|||||||||
|
Other intangible assets, net
|
—
|
|
—
|
|
1,388
|
|
—
|
|
1,388
|
|
|||||||||
|
Investments in subsidiaries
|
8,364
|
|
5
|
|
8,028
|
|
(16,397
|
)
|
—
|
|
|||||||||
|
Intercompany loans receivable
|
116
|
|
—
|
|
1,699
|
|
(1,815
|
)
|
—
|
|
|||||||||
|
Other non-current assets
|
215
|
|
61
|
|
174
|
|
(1
|
)
|
449
|
|
|||||||||
|
Total assets
|
$
|
10,795
|
|
$
|
2,009
|
|
$
|
19,904
|
|
$
|
(23,283
|
)
|
$
|
9,425
|
|
||||
|
LIABILITIES AND EQUITY
|
|||||||||||||||||||
|
Current liabilities:
|
|||||||||||||||||||
|
Accounts payable
|
$
|
79
|
|
$
|
23
|
|
$
|
93
|
|
$
|
—
|
|
$
|
195
|
|
||||
|
Intercompany payable
|
3,433
|
|
492
|
|
1,154
|
|
(5,079
|
)
|
—
|
|
|||||||||
|
Accrued compensation and contributions to retirement plans
|
145
|
|
86
|
|
241
|
|
—
|
|
472
|
|
|||||||||
|
Short-term debt
|
399
|
|
—
|
|
—
|
|
—
|
|
399
|
|
|||||||||
|
Income taxes currently payable
|
2
|
|
—
|
|
75
|
|
—
|
|
77
|
|
|||||||||
|
Unearned revenue
|
293
|
|
193
|
|
1,127
|
|
—
|
|
1,613
|
|
|||||||||
|
Accrued legal settlements
|
—
|
|
2
|
|
105
|
|
—
|
|
107
|
|
|||||||||
|
Other current liabilities
|
136
|
|
21
|
|
194
|
|
—
|
|
351
|
|
|||||||||
|
Total current liabilities
|
4,487
|
|
817
|
|
2,989
|
|
(5,079
|
)
|
3,214
|
|
|||||||||
|
Long-term debt
|
3,170
|
|
—
|
|
—
|
|
—
|
|
3,170
|
|
|||||||||
|
Intercompany loans payable
|
101
|
|
—
|
|
1,715
|
|
(1,816
|
)
|
—
|
|
|||||||||
|
Pension and other postretirement benefits
|
180
|
|
—
|
|
64
|
|
—
|
|
244
|
|
|||||||||
|
Other non-current liabilities
|
376
|
|
74
|
|
229
|
|
—
|
|
679
|
|
|||||||||
|
Total liabilities
|
8,314
|
|
891
|
|
4,997
|
|
(6,895
|
)
|
7,307
|
|
|||||||||
|
Redeemable noncontrolling interest
|
—
|
|
—
|
|
—
|
|
1,350
|
|
1,350
|
|
|||||||||
|
Equity:
|
|||||||||||||||||||
|
Common stock
|
412
|
|
—
|
|
2,318
|
|
(2,318
|
)
|
412
|
|
|||||||||
|
Additional paid-in capital
|
(216
|
)
|
602
|
|
9,256
|
|
(9,117
|
)
|
525
|
|
|||||||||
|
Retained income
|
12,156
|
|
516
|
|
3,782
|
|
(6,429
|
)
|
10,025
|
|
|||||||||
|
Accumulated other comprehensive loss
|
(269
|
)
|
—
|
|
(426
|
)
|
46
|
|
(649
|
)
|
|||||||||
|
Less: common stock in treasury
|
(9,602
|
)
|
—
|
|
(23
|
)
|
23
|
|
(9,602
|
)
|
|||||||||
|
Total equity - controlling interests
|
2,481
|
|
1,118
|
|
14,907
|
|
(17,795
|
)
|
711
|
|
|||||||||
|
Total equity - noncontrolling interests
|
—
|
|
—
|
|
—
|
|
57
|
|
57
|
|
|||||||||
|
Total equity
|
2,481
|
|
1,118
|
|
14,907
|
|
(17,738
|
)
|
768
|
|
|||||||||
|
Total liabilities and equity
|
$
|
10,795
|
|
$
|
2,009
|
|
$
|
19,904
|
|
$
|
(23,283
|
)
|
$
|
9,425
|
|
||||
25
|
Statement of Cash Flows
|
|||||||||||||||||||
|
Three Months Ended March 31, 2018
|
|||||||||||||||||||
|
(Unaudited)
|
|||||||||||||||||||
|
(in millions)
|
S&P Global Inc.
|
Standard & Poor's Financial Services LLC
|
Non-Guarantor Subsidiaries
|
Eliminations
|
S&P Global Inc. Consolidated
|
||||||||||||||
|
Operating Activities:
|
|||||||||||||||||||
|
Net income
|
$
|
1,507
|
|
$
|
177
|
|
$
|
1,378
|
|
$
|
(2,528
|
)
|
$
|
534
|
|
||||
|
Adjustments to reconcile net income to cash provided by operating activities:
|
|||||||||||||||||||
|
Depreciation
|
8
|
|
2
|
|
11
|
|
—
|
|
21
|
|
|||||||||
|
Amortization of intangibles
|
—
|
|
—
|
|
24
|
|
—
|
|
24
|
|
|||||||||
|
Provision for losses on accounts receivable
|
—
|
|
2
|
|
6
|
|
—
|
|
8
|
|
|||||||||
|
Stock-based compensation
|
5
|
|
3
|
|
5
|
|
—
|
|
13
|
|
|||||||||
|
Other
|
(71
|
)
|
—
|
|
87
|
|
—
|
|
16
|
|
|||||||||
|
Changes in operating assets and liabilities, net of effect of acquisitions and dispositions:
|
|||||||||||||||||||
|
Accounts receivable
|
5
|
|
(27
|
)
|
29
|
|
—
|
|
7
|
|
|||||||||
|
Prepaid and other current assets
|
(18
|
)
|
1
|
|
(4
|
)
|
—
|
|
(21
|
)
|
|||||||||
|
Accounts payable and accrued expenses
|
(60
|
)
|
(79
|
)
|
(150
|
)
|
—
|
|
(289
|
)
|
|||||||||
|
Unearned revenue
|
(4
|
)
|
28
|
|
3
|
|
—
|
|
27
|
|
|||||||||
|
Accrued legal settlements
|
(29
|
)
|
—
|
|
—
|
|
—
|
|
(29
|
)
|
|||||||||
|
Other current liabilities
|
22
|
|
(2
|
)
|
(1
|
)
|
—
|
|
19
|
|
|||||||||
|
Net change in prepaid/accrued income taxes
|
73
|
|
1
|
|
—
|
|
—
|
|
74
|
|
|||||||||
|
Net change in other assets and liabilities
|
(37
|
)
|
—
|
|
(7
|
)
|
—
|
|
(44
|
)
|
|||||||||
|
Cash provided by operating activities
|
1,401
|
|
106
|
|
1,381
|
|
(2,528
|
)
|
360
|
|
|||||||||
|
Investing Activities:
|
|||||||||||||||||||
|
Capital expenditures
|
(23
|
)
|
(6
|
)
|
(4
|
)
|
—
|
|
(33
|
)
|
|||||||||
|
Acquisitions, net of cash acquired
|
—
|
|
—
|
|
(57
|
)
|
—
|
|
(57
|
)
|
|||||||||
|
Changes in short-term investments
|
—
|
|
—
|
|
3
|
|
—
|
|
3
|
|
|||||||||
|
Cash used for investing activities
|
(23
|
)
|
(6
|
)
|
(58
|
)
|
—
|
|
(87
|
)
|
|||||||||
|
Financing Activities:
|
|||||||||||||||||||
|
Dividends paid to shareholders
|
(127
|
)
|
—
|
|
—
|
|
—
|
|
(127
|
)
|
|||||||||
|
Distributions to noncontrolling interest holders
|
—
|
|
—
|
|
(50
|
)
|
—
|
|
(50
|
)
|
|||||||||
|
Repurchase of treasury shares
|
(1,100
|
)
|
—
|
|
—
|
|
—
|
|
(1,100
|
)
|
|||||||||
|
Exercise of stock options
|
10
|
|
—
|
|
|
—
|
|
10
|
|
||||||||||
|
Employee withholding tax on share-based payments
|
(49
|
)
|
—
|
|
—
|
|
—
|
|
(49
|
)
|
|||||||||
|
Intercompany financing activities
|
(158
|
)
|
(100
|
)
|
(2,270
|
)
|
2,528
|
|
—
|
|
|||||||||
|
Cash used for financing activities
|
(1,424
|
)
|
(100
|
)
|
(2,320
|
)
|
2,528
|
|
(1,316
|
)
|
|||||||||
|
Effect of exchange rate changes on cash from continuing operations
|
(5
|
)
|
—
|
|
25
|
|
—
|
|
20
|
|
|||||||||
|
Net change in cash and cash equivalents
|
(51
|
)
|
—
|
|
(972
|
)
|
—
|
|
(1,023
|
)
|
|||||||||
|
Cash and cash equivalents at beginning of period
|
632
|
|
—
|
|
2,147
|
|
—
|
|
2,779
|
|
|||||||||
|
Cash and cash equivalents at end of period
|
$
|
581
|
|
$
|
—
|
|
$
|
1,175
|
|
$
|
—
|
|
$
|
1,756
|
|
||||
26
|
Statement of Cash Flows
|
|||||||||||||||||||
|
Three Months Ended March 31, 2017
|
|||||||||||||||||||
|
(Unaudited)
|
|||||||||||||||||||
|
(in millions)
|
S&P Global Inc.
|
Standard & Poor's Financial Services LLC
|
Non-Guarantor Subsidiaries
|
Eliminations
|
S&P Global Inc. Consolidated
|
||||||||||||||
|
Operating Activities:
|
|||||||||||||||||||
|
Net income
|
$
|
1,236
|
|
$
|
148
|
|
$
|
1,108
|
|
$
|
(2,062
|
)
|
$
|
430
|
|
||||
|
Adjustments to reconcile net income to cash provided by operating activities:
|
|||||||||||||||||||
|
Depreciation
|
7
|
|
3
|
|
9
|
|
—
|
|
19
|
|
|||||||||
|
Amortization of intangibles
|
—
|
|
—
|
|
24
|
|
—
|
|
24
|
|
|||||||||
|
Provision for losses on accounts receivable
|
1
|
|
1
|
|
3
|
|
—
|
|
5
|
|
|||||||||
|
Stock-based compensation
|
7
|
|
4
|
|
8
|
|
—
|
|
19
|
|
|||||||||
|
Other
|
5
|
|
—
|
|
8
|
|
—
|
|
13
|
|
|||||||||
|
Changes in operating assets and liabilities, net of effect of acquisitions and dispositions:
|
|||||||||||||||||||
|
Accounts receivable
|
8
|
|
(59
|
)
|
63
|
|
—
|
|
12
|
|
|||||||||
|
Prepaid and other current assets
|
8
|
|
3
|
|
(2
|
)
|
—
|
|
9
|
|
|||||||||
|
Accounts payable and accrued expenses
|
(61
|
)
|
12
|
|
(186
|
)
|
—
|
|
(235
|
)
|
|||||||||
|
Unearned revenue
|
5
|
|
25
|
|
(36
|
)
|
—
|
|
(6
|
)
|
|||||||||
|
Accrued legal settlements
|
—
|
|
(1
|
)
|
—
|
|
—
|
|
(1
|
)
|
|||||||||
|
Other current liabilities
|
(35
|
)
|
(3
|
)
|
(20
|
)
|
—
|
|
(58
|
)
|
|||||||||
|
Net change in prepaid/accrued income taxes
|
123
|
|
—
|
|
23
|
|
—
|
|
146
|
|
|||||||||
|
Net change in other assets and liabilities
|
(6
|
)
|
(4
|
)
|
(14
|
)
|
—
|
|
(24
|
)
|
|||||||||
|
Cash provided by operating activities
|
1,298
|
|
129
|
|
988
|
|
(2,062
|
)
|
353
|
|
|||||||||
|
Investing Activities:
|
|||||||||||||||||||
|
Capital expenditures
|
(4
|
)
|
(4
|
)
|
(15
|
)
|
—
|
|
(23
|
)
|
|||||||||
|
Acquisitions, net of cash acquired
|
—
|
|
—
|
|
(1
|
)
|
—
|
|
(1
|
)
|
|||||||||
|
Proceeds from dispositions
|
—
|
|
—
|
|
2
|
|
—
|
|
2
|
|
|||||||||
|
Cash used for investing activities
|
(4
|
)
|
(4
|
)
|
(14
|
)
|
—
|
|
(22
|
)
|
|||||||||
|
Financing Activities:
|
|||||||||||||||||||
|
Dividends paid to shareholders
|
(106
|
)
|
—
|
|
—
|
|
—
|
|
(106
|
)
|
|||||||||
|
Distributions to noncontrolling interest holders
|
—
|
|
—
|
|
(24
|
)
|
—
|
|
(24
|
)
|
|||||||||
|
Repurchase of treasury shares
|
(201
|
)
|
—
|
|
—
|
|
—
|
|
(201
|
)
|
|||||||||
|
Exercise of stock options
|
29
|
|
—
|
|
—
|
|
—
|
|
29
|
|
|||||||||
|
Employee withholding tax on share-based payments
|
(44
|
)
|
—
|
|
—
|
|
—
|
|
(44
|
)
|
|||||||||
|
Intercompany financing activities
|
(1,056
|
)
|
(125
|
)
|
(881
|
)
|
2,062
|
|
—
|
|
|||||||||
|
Cash used for financing activities
|
(1,378
|
)
|
(125
|
)
|
(905
|
)
|
2,062
|
|
(346
|
)
|
|||||||||
|
Effect of exchange rate changes on cash from continuing operations
|
—
|
|
—
|
|
34
|
|
—
|
|
34
|
|
|||||||||
|
Net change in cash and cash equivalents
|
(84
|
)
|
—
|
|
103
|
|
—
|
|
19
|
|
|||||||||
|
Cash and cash equivalents at beginning of period
|
711
|
|
—
|
|
1,681
|
|
—
|
|
2,392
|
|
|||||||||
|
Cash and cash equivalents at end of period
|
$
|
627
|
|
$
|
—
|
|
$
|
1,784
|
|
$
|
—
|
|
$
|
2,411
|
|
||||
27
Item 2.
Management’s Discussion and Analysis of Financial Condition and Results of Operations (Unaudited)
The following Management's Discussion and Analysis (“MD&A”) provides a narrative of the results of operations and financial condition of S&P Global Inc. (together with its consolidated subsidiaries, "S&P Global," the “Company,” “we,” “us” or “our”) for the
three
months ended
March 31, 2018
. The MD&A should be read in conjunction with the consolidated financial statements, accompanying notes and MD&A included in our Form 10-K for the year ended
December 31, 2017
(our “Form 10-K”), which have been prepared in accordance with accounting principles generally accepted in the United States of America (“U.S. GAAP”). The MD&A includes the following sections:
|
•
|
Overview
|
|
•
|
Results of Operations — Comparing the
Three Months Ended
March 31, 2018
and
2017
|
|
•
|
Liquidity and Capital Resources
|
|
•
|
Reconciliation of Non-GAAP Financial Information
|
|
•
|
Critical Accounting Estimates
|
|
•
|
Recently Issued or Adopted Accounting Standards
|
|
•
|
Forward-Looking Statements
|
OVERVIEW
We are a leading provider of transparent and independent ratings, benchmarks, analytics and data to the capital and commodity markets worldwide.
Our operations consist of four reportable segments: S&P Global Ratings ("Ratings"), S&P Global Market Intelligence ("Market Intelligence"), S&P Global Platts ("Platts") and S&P Dow Jones Indices ("Indices").
|
•
|
Ratings is an independent provider of credit ratings, research, and analytics, offering investors and other market participants information, ratings and benchmarks.
|
|
•
|
Market Intelligence is a global provider of multi-asset-class data, research and analytical capabilities, which integrate cross-asset analytics and desktop services.
|
|
•
|
Platts is the leading independent provider of information and benchmark prices for the commodity and energy markets.
|
|
•
|
Indices is a global index provider maintaining a wide variety of valuation and index benchmarks for investment advisors, wealth managers and institutional investors.
|
Effective beginning with the first quarter of 2018, we began reporting the financial results of Market Intelligence and Platts as separate reportable segments consistent with the changes to our organizational structure and how our Chief Executive Officer evaluates the performance of these segments. Our historical segment reporting has been retroactively revised to reflect the current organizational structure.
Key results for the three months ended
March 31
are as follows:
|
(in millions, except per share amounts)
|
2018
|
|
2017
|
|
% Change
1
|
||||
|
Revenue
|
$
|
1,567
|
|
$
|
1,453
|
|
|
8%
|
|
|
Operating profit
2
|
$
|
711
|
|
$
|
639
|
|
|
11%
|
|
|
Operating margin %
|
45
|
%
|
44
|
%
|
|
||||
|
Diluted earnings per share from net income
|
$
|
1.93
|
|
$
|
1.53
|
|
26%
|
||
|
1
|
% changes in the tables throughout the MD&A are calculated off of the actual number, not the rounded number presented.
|
|
2
|
2018
and
2017
include amortization of intangibles from acquisitions of
$24 million
.
2017
includes non-cash acquisition and disposition-related adjustments of $15 million and legal settlement expenses of $2 million.
|
Revenue increased
8%
driven by increases at all of our reportable segments, with a 2 percentage point favorable impact from foreign exchange rates. Revenue growth at Indices was driven by higher volumes for exchange-traded derivatives and higher levels of assets under management for exchange traded funds ("ETFs"). The increase at Ratings was due to growth in non-transaction revenue primarily due to an increase in surveillance fees, higher entity credit ratings revenue and an increase in Ratings Evaluation Service activity. Revenue growth at Market Intelligence was driven by annualized contract value growth in the Market Intelligence
28
Desktop and Global Risk Services products. The increase at Platts was due to continued demand for market data and price assessment products.
Operating profit increased
11%
, with a 2 percentage point favorable impact from foreign exchange rates. Excluding the favorable impact of non-cash acquisition and disposition-related adjustments in 2017 of 3 percentage points, operating profit increased 8%. The increase was primarily due to revenue growth at Indices and Ratings and a decrease in incentive costs at Ratings, partially offset by higher compensation costs due to annual merit increases and additional headcount. Additionally, operating profit was unfavorably impacted by a $20 million contribution made by the Company to the S&P Global Foundation during the first quarter of 2018.
Our Strategy
We are a leading provider of transparent and independent ratings, benchmarks, analytics and data to the capital and commodity markets worldwide. Our purpose is to provide the intelligence that is essential for companies, governments and individuals to make decisions with conviction. We seek to deliver on this purpose within the framework of our core values of integrity, excellence and relevance.
We seek to deliver an exceptional, differentiated customer experience across the globe. We strive for operational excellence, continuous innovation, and a high performance culture driven by our best-in-class talent. We strive to deliver on our strategic priorities in the following four categories by:
Finance
|
•
|
Achieving financial targets and creating shareholder value by focusing on organic revenue growth and continuing to deliver margin expansion with a focus on operating leverage and efficiency opportunities; and
|
|
•
|
Outperforming traditional and nontraditional competitors.
|
Customer
|
•
|
Delivering greater customer value through deeper client and market insights, innovative solutions, stronger internal teamwork and reliable, nimble Go-to-Market processes;
|
|
•
|
Enriching and modernizing the user experience to improve customer loyalty;
|
|
•
|
Identifying and executing transformative growth opportunities; and
|
|
•
|
Accelerating investments and coordination in building new products and in developing new markets.
|
Operations
|
•
|
Enhancing planning and software engineering processes to speed up the delivery of content and products;
|
|
•
|
Applying lean management, robotics, automation and machine learning to streamline internal workflow and deliver productivity;
|
|
•
|
Strengthening our Digital Infrastructure capabilities, with emphasis on workplace services and cybersecurity; and
|
|
•
|
Upholding our commitment to a disciplined and practical risk, control and compliance environment.
|
People
|
•
|
Creating a performance culture to drive innovation, flexibility and agility to address customer needs;
|
|
•
|
Committing to leadership development programs and skills training;
|
|
•
|
Embracing and expanding diversity and inclusion in our workforce; and
|
|
•
|
Enhancing and augmenting technology talent and skills across the Company.
|
29
There can be no assurance that we will achieve success in implementing any one or more of these strategies as a variety of factors could unfavorably impact operating results, including prolonged difficulties in the global credit markets and a change in the regulatory environment affecting our businesses.
30
RESULTS OF OPERATIONS — COMPARING THE THREE MONTHS ENDED MARCH 31, 2018 AND 2017
Consolidated Review
|
(in millions)
|
2018
|
2017
|
% Change
|
||||||
|
Revenue
|
$
|
1,567
|
|
$
|
1,453
|
|
8%
|
||
|
Total Expenses:
|
|||||||||
|
Operating-related expenses
|
439
|
|
411
|
|
7%
|
||||
|
Selling and general expenses
|
372
|
|
360
|
|
3%
|
||||
|
Depreciation and amortization
|
45
|
|
43
|
|
5%
|
||||
|
Total expenses
|
856
|
|
814
|
|
5%
|
||||
|
Operating profit
|
711
|
|
639
|
|
11%
|
||||
|
Other (income) expense, net
|
(4
|
)
|
(9
|
)
|
(51)%
|
||||
|
Interest expense, net
|
34
|
|
37
|
|
(8)%
|
||||
|
Provision for taxes on income
|
147
|
|
181
|
|
(18)%
|
||||
|
Net income
|
534
|
|
430
|
|
24%
|
||||
|
Less: net income attributable to noncontrolling interests
|
(43
|
)
|
(31
|
)
|
36%
|
||||
|
Net income attributable to S&P Global Inc.
|
$
|
491
|
|
$
|
399
|
|
23%
|
||
Revenue
The following table provides consolidated revenue information for the three months ended
March 31
:
|
(in millions)
|
2018
|
2017
|
% Change
|
||||||
|
Revenue
|
$
|
1,567
|
|
$
|
1,453
|
|
8%
|
||
|
Subscription revenue
|
$
|
638
|
|
$
|
588
|
|
8%
|
||
|
Non-transaction revenue
|
352
|
|
316
|
|
11%
|
||||
|
Non-subscription / transaction revenue
|
378
|
|
387
|
|
(2)%
|
||||
|
Asset-linked fees
|
136
|
|
114
|
|
19%
|
||||
|
Sales usage-based royalties
|
63
|
|
48
|
|
34%
|
||||
|
% of total revenue:
|
|
|
|||||||
|
Subscription revenue
|
41
|
%
|
40
|
%
|
|||||
|
Non-transaction revenue
|
22
|
%
|
22
|
%
|
|||||
|
Non-subscription / transaction revenue
|
24
|
%
|
27
|
%
|
|||||
|
Asset-linked fees
|
9
|
%
|
8
|
%
|
|||||
|
Sales usage-based royalties
|
4
|
%
|
3
|
%
|
|||||
|
U.S. revenue
|
$
|
951
|
|
$
|
891
|
|
7%
|
||
|
International revenue:
|
|||||||||
|
European region
|
381
|
|
346
|
|
10%
|
||||
|
Asia
|
156
|
|
132
|
|
18%
|
||||
|
Rest of the world
|
79
|
|
84
|
|
(6)%
|
||||
|
Total international revenue
|
$
|
616
|
|
$
|
562
|
|
10%
|
||
|
% of total revenue:
|
|||||||||
|
U.S. revenue
|
61
|
%
|
61
|
%
|
|||||
|
International revenue
|
39
|
%
|
39
|
%
|
|||||
31
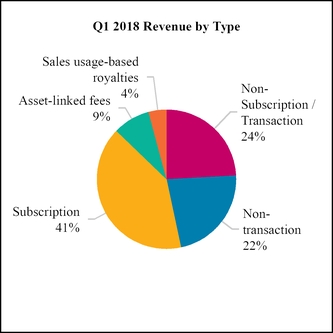
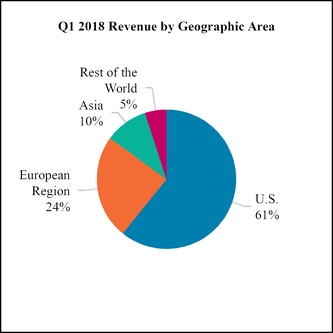
Subscription revenue increased primarily from growth in Market Intelligence's average contract values and continued demand for Platt's proprietary content. Non-transaction revenue grew at Ratings primarily due to an increase in surveillance fees, higher entity credit ratings revenue and an increase in Ratings Evaluation Service activity. Non-subscription / transaction revenue decreased primarily due to reduction in transaction revenue at Ratings due to a decline in corporate bond ratings revenue and public finance revenue in the U.S. and a decrease in U.S. bank loan ratings. Asset-linked fees increased primarily due to the impact of higher levels of assets under management for ETFs. Sales usage-based royalties increased primarily driven by higher volumes for exchange-traded derivatives. See “Segment Review” below for further information.
The favorable impact of foreign exchange rates increased revenue by 2 percentage points. This impact refers to constant currency comparisons estimated by recalculating current year results of foreign operations using the average exchange rate from the prior year.
Total Expenses
The following tables provide an analysis by segment of our operating-related expenses and selling and general expenses for the three months ended
March 31
:
|
(in millions)
|
2018
|
2017
|
% Change
|
||||||||||||||||
|
Operating-
related expenses
|
Selling and
general expenses
|
Operating-
related expenses
|
Selling and
general expenses
|
Operating-
related expenses
|
Selling and
general expenses
|
||||||||||||||
|
Ratings
1
|
$
|
217
|
|
$
|
114
|
|
$
|
207
|
|
$
|
125
|
|
5%
|
(8)%
|
|||||
|
Market Intelligence
2
|
172
|
|
129
|
|
154
|
|
119
|
|
12%
|
7%
|
|||||||||
|
Platts
3
|
54
|
|
46
|
|
52
|
|
52
|
|
4%
|
(11)%
|
|||||||||
|
Indices
|
24
|
|
40
|
|
23
|
|
30
|
|
1%
|
32%
|
|||||||||
|
Intersegment eliminations
4
|
(28
|
)
|
—
|
|
(25
|
)
|
—
|
|
(13)%
|
N/M
|
|||||||||
|
Total segments
|
439
|
|
329
|
|
411
|
|
326
|
|
7%
|
1%
|
|||||||||
|
Corporate
|
—
|
|
43
|
|
—
|
|
34
|
|
N/M
|
27%
|
|||||||||
|
Total
|
$
|
439
|
|
$
|
372
|
|
$
|
411
|
|
$
|
360
|
|
7%
|
3%
|
|||||
N/M - not meaningful
|
1
|
In 2017, selling and general expenses include legal settlement expenses of $2 million.
|
32
|
2
|
In 2017, selling and general expenses include non-cash disposition-related adjustments of $4 million.
|
|
3
|
In 2017, selling and general expenses include non-cash acquisition-related adjustments of $11 million.
|
|
4
|
Intersegment eliminations relate to a royalty charged to Market Intelligence for the rights to use and distribute content and data developed by Ratings.
|
Operating-Related Expenses
Operating-related expenses increased
7%
driven by increases at Market Intelligence and Ratings due to higher compensation costs primarily related to annual merit increases and additional headcount. The increase at Ratings was partially offset by a decrease in incentive costs.
Intersegment eliminations primarily relate to a royalty charged to Market Intelligence for the rights to use and distribute content and data developed by Ratings.
Selling and General Expenses
Selling and general expenses increased
3%
. Excluding the favorable impact of non-cash acquisition and disposition-related adjustments of 5 percentage points, selling and general expenses increased 8%. The increase is due to higher compensation costs primarily related to additional headcount and increased technology costs at Market Intelligence and Indices, and an expense related to a $20 million contribution made by the Company to the S&P Global Foundation during the first quarter of 2018.
Depreciation and Amortization
Depreciation and amortization increased
5%
compared to the
first
quarter of
2017
due to an increase in depreciation expense primarily related to asset additions that occurred in the last nine months of 2017.
Operating Profit
We consider operating profit to be an important measure for evaluating our operating performance and we evaluate operating profit for each of the reportable business segments in which we operate.
We internally manage our operations by reference to operating profit with economic resources allocated primarily based on each segments contribution to operating profit. Segment operating profit is defined as operating profit before unallocated expense. Segment operating profit is not, however, a measure of financial performance under U.S. GAAP, and may not be defined and calculated by other companies in the same manner.
The table below reconciles segment operating profit to total operating profit for the three months ended
March 31
:
|
(in millions)
|
2018
|
2017
|
% Change
|
||||||
|
Ratings
1
|
$
|
408
|
|
$
|
374
|
|
9%
|
||
|
Market Intelligence
2
|
112
|
|
104
|
|
8%
|
||||
|
Platts
3
|
90
|
|
82
|
|
9%
|
||||
|
Indices
4
|
147
|
|
115
|
|
28%
|
||||
|
Total segment operating profit
|
757
|
|
675
|
|
12%
|
||||
|
Unallocated expense
|
(46
|
)
|
(36
|
)
|
28%
|
||||
|
Total operating profit
|
$
|
711
|
|
$
|
639
|
|
11%
|
||
|
1
|
2017
includes legal settlement expenses of $2 million and amortization of intangibles from acquisitions of
$1 million
.
|
|
2
|
2018
and
2017
include amortization of intangibles from acquisitions of
$17 million
.
2017
includes non-cash disposition-related adjustments of $4 million.
|
|
3
|
2018
and
2017
include amortization of intangibles from acquisitions of
$5 million
.
2017
includes non-cash acquisition-related adjustments of $11 million.
|
|
4
|
2018
and
2017
includes amortization of intangibles from acquisitions of
$2 million
and
$1 million
, respectively.
|
33
Segment Operating Profit —
Increased
12%
as compared to the
first
quarter of
2017
. Excluding the favorable impact of non-cash acquisition and disposition-related adjustments 3 percentage points, segment operating profit increased 9%. This increase was primarily due to revenue growth at Indices and Ratings, partially offset by higher compensation costs due to annual merit increases and additional headcount. See “Segment Review” below for further information.
Unallocated Expense
—
These expenses, included in selling and general expenses, mainly include costs for corporate center functions, select initiatives and unoccupied office space. Unallocated expense increased
28%
as compared to the
first
quarter of 2017 primarily due to a $20 million contribution made by the Company to the S&P Global Foundation during the first quarter of 2018.
Foreign exchange rates had a favorable impact on operating profit of 2 percentage points. This impact refers to constant currency comparisons and the remeasurement of monetary assets and liabilities. Constant currency impacts are estimated by re-calculating current year results of foreign operations using the average exchange rate from the prior year. Remeasurement impacts are based on the variance between current-year and prior-year foreign exchange rate fluctuations on assets and liabilities denominated in currencies other than the individual businesses functional currency.
Interest Expense, net
Net interest expense decreased compared to the
first
quarter of
2017
due to higher interest income in 2018 driven by an increase in deposit rates of cash held in U.S. dollar accounts.
Provision for Income Taxes
Comprehensive tax legislation, enacted through the Tax Cuts and Jobs Act (“TCJA”) on December 22, 2017, significantly modified U.S. corporate income tax law. Provisional amounts have been recorded in our financial statements based on the Company’s initial analysis of the TCJA. The Company may adjust these amounts in future periods if our interpretation of the TCJA changes or as additional guidance from the U.S. Treasury becomes available.
The effective income tax rate was
21.6%
and
29.5%
for the
three
months ended
March 31, 2018
and
March 31, 2017
, respectively. The decrease in 2018 was primarily due to the reduction of the U.S. federal corporate tax rate as a result of the enactment of the TCJA.
The Company is continuously subject to tax examinations in various jurisdictions. In May 2017, the IRS issued a 30-Day Letter proposing to increase the Company’s federal income tax for the 2015 tax year by approximately $242 million. The proposed increase relates primarily to the IRS’s proposed disallowance of claimed tax deductions for certain amounts paid in 2015 to settle lawsuits by nineteen states and the District of Columbia. We vigorously disagree with the proposed adjustment and have filed a formal protest with the IRS to contest the matter before the IRS Appeals Office. This development does not materially change our initial assessment of the deductibility of our settlement payments.
Segment Review
Ratings
Ratings is an independent provider of credit ratings, research, and analytics to investors, issuers and other market participants. Credit ratings are one of several tools investors can use when making decisions about purchasing bonds and other fixed income investments. They are opinions about credit risk and our ratings express our opinion about the ability and willingness of an issuer, such as a corporation or state or city government, to meet its financial obligations in full and on time. Our credit ratings can also relate to the credit quality of an individual debt issue, such as a corporate or municipal bond, and the relative likelihood that the issue may default.
Ratings differentiates its revenue between transaction and non-transaction. Transaction revenue primarily includes fees associated with:
|
•
|
ratings related to new issuance of corporate and government debt instruments, and structured finance debt instruments;
|
|
•
|
bank loan ratings; and
|
|
•
|
corporate credit estimates, which are intended, based on an abbreviated analysis, to provide an indication of our opinion regarding creditworthiness of a company which does not currently have a Ratings credit rating.
|
34
Non-transaction revenue primarily includes fees for surveillance of a credit rating, annual fees for customer relationship-based pricing programs, fees for entity credit ratings and global research and analytics. Non-transaction revenue also includes an intersegment royalty charged to Market Intelligence for the rights to use and distribute content and data developed by Ratings. Royalty revenue was
$26 million
and
$24 million
for the
three
months ended
March 31, 2018
and
March 31, 2017
, respectively.
The following table provides revenue and segment operating profit information for the three months ended
March 31
:
|
(in millions)
|
2018
|
2017
|
% Change
|
||||||
|
Revenue
|
$
|
748
|
|
$
|
714
|
|
5%
|
||
|
Non-transaction revenue
|
$
|
380
|
|
$
|
341
|
|
11%
|
||
|
Transaction revenue
|
$
|
368
|
|
$
|
373
|
|
(1)%
|
||
|
% of total revenue:
|
|||||||||
|
Non-transaction revenue
|
51
|
%
|
48
|
%
|
|||||
|
Transaction revenue
|
49
|
%
|
52
|
%
|
|||||
|
U.S. revenue
|
$
|
422
|
|
$
|
418
|
|
1%
|
||
|
International revenue
|
$
|
326
|
|
$
|
296
|
|
10%
|
||
|
% of total revenue:
|
|||||||||
|
U.S. revenue
|
56
|
%
|
59
|
%
|
|||||
|
International revenue
|
44
|
%
|
41
|
%
|
|||||
|
|
|
|
|
|
|||||
|
Operating profit
1
|
$
|
408
|
|
$
|
374
|
|
9%
|
||
|
Operating margin %
|
55
|
%
|
52
|
%
|
|||||
|
1
|
2017
includes legal settlement expenses of $2 million and amortization of intangibles from acquisitions of
$1 million
.
|
Revenue increased
5%
, with a 3 percentage point favorable impact from foreign exchange rates. Non-transaction revenue grew primarily due to an increase in surveillance fees, higher entity credit ratings revenue and an increase in Ratings Evaluation Service activity. The increase in non-transaction revenue was slightly offset by a reduction in transaction revenue primarily due to a decline in corporate bond ratings revenue and public finance revenue driven by lower issuance in the U.S. and a decrease in U.S. bank loan ratings. These transaction revenue decreases were partially offset by an increase in structured finance transaction revenue primarily driven by increased U.S. collateralized loan obligations ("CLO") and U.S. commercial mortgage-backed securities issuance. Revenue growth also benefited from improved contract terms.
Operating profit increased
9%
, with a 5 percentage point favorable impact from foreign exchange rates. Excluding the favorable impact of higher legal settlement expenses and amortization of intangibles in 2017 of 1 percentage point, operating profit increased 8%. This increase was primarily due to the favorable impact of foreign exchange rates, revenue growth and a decrease in incentive costs, partially offset by higher salary costs primarily driven by annual merit increases.
Market Issuance Volumes
We monitor market issuance volumes regularly within Ratings. Market issuance volumes noted within the discussion that follows are based on the domicile of the issuer. Issuance volumes can be reported in two ways: by “domicile” which is based on where an issuer is located or where the assets associated with an issue are located, or based on “marketplace” which is where the bonds are sold. The following tables depict changes in issuance levels as compared to the prior year, based on a composite of Thomson Financial, Harrison Scott Publications, Dealogic and Ratings' internal estimates.
|
|
First Quarter
Compared to Prior Year
|
||||
|
Corporate Bond Issuance
|
U.S.
|
Europe
|
Global
|
||
|
High-yield issuance
|
(37)%
|
(11)%
|
(22)%
|
||
|
Investment grade
|
(17)%
|
(6)%
|
(7)%
|
||
|
Total new issue dollars — Corporate issuance
|
(21)%
|
(7)%
|
(9)%
|
||
35
|
•
|
Corporate issuance in the U.S. and Europe declined driven by market volatility. An increase in interest rates in the U.S. contributed to market volatility in the quarter.
|
|
|
First Quarter Compared to Prior Year
|
||||
|
Structured Finance
|
U.S.
|
Europe
|
Global
|
||
|
Asset-backed securities (“ABS”)
|
27%
|
135%
|
35%
|
||
|
Structured credit
|
43%
|
91%
|
52%
|
||
|
Commercial mortgage-backed securities (“CMBS”)
|
29%
|
(22)%
|
27%
|
||
|
Residential mortgage-backed securities (“RMBS”)
|
1%
|
63%
|
23%
|
||
|
Covered bonds
|
*
|
8%
|
13%
|
||
|
Total new issue dollars — Structured finance
|
29%
|
29%
|
29%
|
||
|
*
|
Represents no activity in 2018 and 2017.
|
|
•
|
ABS issuance was up in the U.S. and Europe in the quarter reflecting an increase in auto transactions.
|
|
•
|
Issuance was up in the U.S. and European structured credit markets driven by new CLO transactions.
|
|
•
|
CMBS issuance was up in the U.S. reflecting increased market volume. European CMBS issuance was down, although from a low 2017 base.
|
|
•
|
RMBS issuance was up in the U.S. and Europe reflecting increased market volume.
|
|
•
|
Covered bond (debt securities backed by mortgages or other high-quality assets that remain on the issuer's balance sheet) issuance in Europe was up partially due to the impact from the European Central Bank's covered bond asset purchase program.
|
For a further discussion of the legal and regulatory environment see Note 12 –
Commitments and Contingencies
to the consolidated financial statements of this Form 10-Q.
Market Intelligence
Market Intelligence's portfolio of capabilities are designed to help investment professionals, government agencies, corporations and universities track performance, generate alpha, identify investment ideas, understand competitive and industry dynamics, perform valuations and assess credit risk.
Market Intelligence includes the following business lines:
|
•
|
Desktop
—
a product suite that provides data, analytics and third-party research for global finance professionals, which includes the Market Intelligence Desktop (which are inclusive of the S&P Capital IQ and SNL Desktop products);
|
|
•
|
Data Management Solutions
—
integrated bulk data feeds and application programming interfaces that can be customized, which includes Compustat, GICS, Point In Time Financials and CUSIP; and
|
|
•
|
Risk Services
—
commercial arm that sells Ratings' credit ratings and related data, analytics and research, which includes subscription-based offerings, RatingsDirect® and RatingsXpress®, and Credit Analytics.
|
Subscription revenue at Market Intelligence is primarily derived from distribution of data, analytics, third party research, and credit ratings-related information primarily through web-based channels including Market Intelligence Desktop, RatingsDirect®, RatingsXpress®, and Credit Analytics. Non-subscription revenue at Market Intelligence is primarily related to certain advisory, pricing and analytical services.
36
The following table provides revenue and segment operating profit information for the three months ended
March 31
:
|
(in millions)
|
2018
|
2017
|
% Change
|
||||||
|
Revenue
|
$
|
437
|
|
$
|
402
|
|
9%
|
||
|
Subscription revenue
1
|
$
|
424
|
|
$
|
385
|
|
10%
|
||
|
Non-subscription revenue
1
|
$
|
8
|
|
$
|
11
|
|
(23)%
|
||
|
Asset-linked fees
|
$
|
5
|
|
$
|
6
|
|
(13)%
|
||
|
% of total revenue:
|
|||||||||
|
Subscription revenue
|
97
|
%
|
96
|
%
|
|||||
|
Non-subscription revenue
|
2
|
%
|
3
|
%
|
|||||
|
Asset-linked fees
|
1
|
%
|
1
|
%
|
|||||
|
U.S. revenue
|
$
|
290
|
|
$
|
271
|
|
7%
|
||
|
International revenue
|
$
|
147
|
|
$
|
131
|
|
12%
|
||
|
% of total revenue:
|
|||||||||
|
U.S. revenue
|
66
|
%
|
67
|
%
|
|||||
|
International revenue
|
34
|
%
|
33
|
%
|
|||||
|
|
|
|
|
|
|||||
|
Operating profit
2
|
$
|
112
|
|
$
|
104
|
|
8%
|
||
|
Operating margin %
|
26
|
%
|
26
|
%
|
|||||
|
1
|
In the third quarter of 2017, we reevaluated our subscription and non-subscription revenue presentation which resulted in a reclassification of $18 million from non-subscription revenue to subscription revenue for the three months ended March 31, 2017.
|
|
2
|
2018
and
2017
includes amortization of intangibles from acquisitions of
$17 million
.
2017
includes a non-cash disposition-related adjustment of $4 million.
|
Revenue increased
9%
, with a 1 percentage point favorable impact from foreign exchange rates. Revenue increased driven by growth in annualized contract values in the Market Intelligence Desktop products, RatingsXpress® and RatingsDirect®. The number of users and customers continued to grow for each of these products in the quarter.
Operating profit increased
8%
. Excluding the favorable impact of a non-cash disposition-related adjustment in 2017 of 4 percentage points, operating profit increased 4%. The increase was primarily due to revenue growth, partially offset by higher compensation costs, higher fringe benefit costs and an increase in technology costs. Higher compensation costs were driven by annual merit increases and additional headcount partially related to the acquisition of Panjiva Inc. ("Panjiva")in February of 2018. See Note 2 -
Acquisitions and Divestitures
to the consolidated financial statements of this Form 10-Q for further discussion.
Platts
Platts is the leading independent provider of information and benchmark prices for the commodity and energy markets. Platts provides essential price data, analytics, and industry insight enabling the commodity and energy markets to perform with greater transparency and efficiency.
Platts' revenue is generated primarily through the following sources:
|
•
|
Subscription revenue
—
primarily from subscriptions to our real-time news, market data and price assessments, along with other information products;
|
|
•
|
Sales and usage-based royalties
—
primarily from licensing of our proprietary market price data and price assessments to commodity exchanges; and
|
|
•
|
Non-subscription revenue
—
conference sponsorship, consulting engagements, and events.
|
37
The following table provides revenue and segment operating profit information for the three months ended
March 31
:
|
(in millions)
|
2018
|
2017
|
% Change
|
||||||
|
Revenue
|
$
|
196
|
|
$
|
191
|
|
3%
|
||
|
Subscription revenue
|
$
|
181
|
|
$
|
172
|
|
5%
|
||
|
Sales usage-based royalties
|
$
|
13
|
|
$
|
16
|
|
(17)%
|
||
|
Non-subscription revenue
|
$
|
2
|
|
$
|
3
|
|
(19)%
|
||
|
% of total revenue:
|
|||||||||
|
Subscription revenue
|
92
|
%
|
90
|
%
|
|||||
|
Sales usage-based royalties
|
7
|
%
|
8
|
%
|
|||||
|
Non-subscription revenue
|
1
|
%
|
2
|
%
|
|||||
|
U.S. revenue
|
$
|
69
|
|
$
|
72
|
|
(3)%
|
||
|
International revenue
|
$
|
127
|
|
$
|
119
|
|
6%
|
||
|
% of total revenue:
|
|||||||||
|
U.S. revenue
|
35
|
%
|
38
|
%
|
|||||
|
International revenue
|
65
|
%
|
62
|
%
|
|||||
|
Operating profit
1
|
$
|
90
|
|
$
|
82
|
|
9%
|
||
|
Operating margin %
|
46
|
%
|
43
|
%
|
|||||
|
1
|
2018
and
2017
includes amortization of intangibles from acquisitions of
$5 million
.
2017
includes a non-cash acquisition-related adjustment of $11 million.
|
Revenue increased
3%
due to continued demand for market data and price assessment products, led by petroleum, partially offset by a decrease in sales usage-based royalties from the licensing of our proprietary market price data and price assessments to commodity exchanges mainly due to a decline in oil trading volumes. While petroleum is still the biggest driver, the revenue mix continues to become more diversified as other sectors contributed to revenue growth including metals and petrochemicals.
Operating profit increased
9%
, with a 5 percentage point unfavorable impact from foreign exchange rates. Excluding the favorable impact of a non-cash acquisition-related adjustment in 2017 of 13 percentage points, operating profit decreased 4%. The decrease was primarily due to the unfavorable impact of foreign exchange rates and a reduction in revenue from the licensing of our proprietary market price data and price assessments to commodity exchanges.
Indices
Indices is a global index provider maintaining a wide variety of indices to meet an array of investor needs. Indices’ mission is to provide transparent benchmarks to help with decision making, collaborate with the financial community to create innovative products and provide investors with tools to monitor world markets.
Indices primarily derives revenue from asset-linked fees based on the S&P and Dow Jones Indices and to a lesser extent generates subscription revenue and transaction revenue. Specifically, Indices generates revenue from the following sources:
|
•
|
Investment vehicles
—
asset-linked fees such as ETFs and mutual funds, that are based on the S&P Dow Jones Indices' benchmarks that generate revenue through fees based on assets and underlying funds;
|
|
•
|
Exchange traded derivatives
—
generate sales usage-based royalties based on trading volumes of derivatives contracts listed on various exchanges;
|
|
•
|
Index-related licensing fees
—
fixed or variable annual and per-issue asset-linked fees for over-the-counter derivatives and retail-structured products; and
|
|
•
|
Data and customized index subscription fees
—
fees from supporting index fund management, portfolio analytics and research.
|
38
The following table provides revenue and segment operating profit information for the three months ended
March 31
:
|
(in millions)
|
2018
|
2017
|
% Change
|
||||||
|
Revenue
|
$
|
214
|
|
$
|
171
|
|
25%
|
||
|
Asset-linked fees
|
$
|
131
|
|
$
|
108
|
|
21%
|
||
|
Sales usage-based royalties
|
$
|
50
|
|
$
|
32
|
|
59%
|
||
|
Subscription revenue
|
$
|
33
|
|
$
|
31
|
|
5%
|
||
|
% of total revenue:
|
|||||||||
|
Asset-linked fees
|
61
|
%
|
63
|
%
|
|||||
|
Sales usage-based royalties
|
24
|
%
|
19
|
%
|
|||||
|
Subscription revenue
|
15
|
%
|
18
|
%
|
|||||
|
U.S. revenue
|
$
|
184
|
|
$
|
142
|
|
29%
|
||
|
International revenue
|
$
|
30
|
|
$
|
29
|
|
4%
|
||
|
% of total revenue:
|
|||||||||
|
U.S. revenue
|
86
|
%
|
83
|
%
|
|||||
|
International revenue
|
14
|
%
|
17
|
%
|
|||||
|
Operating profit
1
|
$
|
147
|
|
$
|
115
|
|
28%
|
||
|
Less: net operating profit attributable to noncontrolling interests
|
40
|
|
30
|
|
|
||||
|
Net operating profit
|
$
|
107
|
|
$
|
85
|
|
27%
|
||
|
Operating margin %
|
69
|
%
|
67
|
%
|
|||||
|
Net operating margin %
|
50
|
%
|
49
|
%
|
|||||
|
1
|
2018
and
2017
includes amortization of intangibles from acquisitions of
$2 million
and
$1 million
, respectively.
|
Revenue at Indices increased
25%
, primarily driven by higher volumes for exchange-traded derivatives and higher levels of assets under management ("AUM") for ETFs. Ending AUM for ETFs in the
first
quarter of
2018
increased 19% to $1.326 trillion and average AUM for ETFs increased 28% to $1.377 trillion compared to the
first
quarter of 2017. Ending AUM for the first quarter of 2018 was slightly lower than the ending AUM of $1.343 trillion in the fourth quarter of 2017.
Operating profit grew
28%
. The impact of revenue growth was partially offset by higher compensation costs and increased operating costs to support revenue growth and business initiatives. Higher compensation costs were driven by annual merit increases and additional headcount. Foreign exchange rates had an unfavorable impact on operating profit of 2 percentage points.
LIQUIDITY AND CAPITAL RESOURCES
We continue to maintain a strong financial position. Our primary source of funds for operations is cash from our businesses. Cash on hand, cash flows from operations and availability under our existing credit facility are expected to be sufficient to meet any additional operating and recurring cash needs into the foreseeable future. We use our cash for a variety of needs, including but not limited to: ongoing investments in our businesses, strategic acquisitions, share repurchases, dividends, repayment of debt, capital expenditures and investment in our infrastructure.
39
Cash Flow Overview
Cash and cash equivalents were
$1,756 million
as of
March 31, 2018
, a decrease of
$1,023 million
from
December 31, 2017
, and consisted of approximately 30% of domestic cash and 70% of cash held abroad.
The following table provides cash flow information for the
three
months ended
March 31
:
|
(in millions)
|
2018
|
2017
|
% Change
|
||||||
|
Net cash provided by (used for):
|
|||||||||
|
Operating activities
|
$
|
360
|
|
$
|
353
|
|
2%
|
||
|
Investing activities
|
$
|
(87
|
)
|
$
|
(22
|
)
|
N/M
|
||
|
Financing activities
|
$
|
(1,316
|
)
|
$
|
(346
|
)
|
N/M
|
||
N/M - not meaningful
In the first
three
months of
2018
, free cash flow decreased to
$277 million
compared to
$306 million
in the first
three
months of
2017
. The decrease is primarily due to legal settlement payments and a $20 million contribution made by the Company to the S&P Global Foundation during the first quarter of 2018. Free cash flow is a non-GAAP financial measure and reflects our cash flow provided by operating activities less capital expenditures and distributions to noncontrolling interest holders. Capital expenditures include purchases of property and equipment and additions to technology projects. See “Reconciliation of Non-GAAP Financial Information” below for a reconciliation of cash flow provided by operating activities, the most directly comparable U.S. GAAP financial measure, to free cash flow and free cash flow excluding certain items.
Operating activities
Cash provided by operating activities increased
$7 million
to
$360 million
for the first
three
months of
2018
. The increase is mainly due to higher results from operations in 2018, partially offset by lower income tax accruals in 2018 due to the reduction of the U.S. federal corporate tax rate as a result of the enactment of the TCJA.
Investing activities
Our cash outflows from investing activities are primarily for acquisitions and capital expenditures, while cash inflows are primarily proceeds from dispositions.
Cash used for investing activities increased to
$87 million
for the first
three
months of
2018
compared to
$22 million
in the first
three
months of
2017
, primarily due to cash used for the acquisitions of Pragmatix Services Private Limited ("Pragmatix") and Panjiva in 2018. See Note 2
—
Acquisitions and Divestitures
to the consolidated financial statements of this Form 10-Q for further discussion.
Financing activities
Our cash outflows from financing activities consist primarily of share repurchases, dividends to shareholders and repayments of short-term and long-term debt, while cash inflows are primarily attributable to the borrowing of short-term and long-term debt and proceeds from the exercise of stock options.
Cash used for financing activities increased to
$1,316 million
for the first
three
months of
2018
as compared to
$346 million
in the first
three
months of
2017
. The increase is primarily attributable to an increase in cash used for share repurchases in 2018.
During the first
three
months of
2018
, we used cash to repurchase
5.0 million
shares for
$1,100 million
. We entered into an accelerated share repurchase ("ASR") agreement with a financial institution on March 6, 2018 to initiate share repurchases aggregating
$1 billion
. The ASR agreement was structured as an uncapped ASR agreement in which we paid
$1 billion
and received an initial delivery of approximately
4.5 million
shares, representing
85%
of the
$1 billion
at a price equal to the then market price of the Company. The total number of shares to be repurchased under the ASR agreement will be equal to
$1 billion
divided by the volume weighted-average share price, less a discount, over the term of the ASR agreement. The final settlement of the transaction under the ASR agreement is expected to be completed no later than the third quarter of 2018. The repurchased shares are held in Treasury. The ASR agreement was executed under the current share repurchase program, approved on December 4, 2013. During the first
three
months of
2017
, we used cash to repurchase
1.5 million
shares for
$201 million
.
40
Additional Financing
We have the ability to borrow a total of
$1.2 billion
through our commercial paper program, which is supported by our revolving
$1.2 billion
five
-year credit agreement (our "credit facility") that we entered into on June 30, 2017. This credit facility will terminate on June 30, 2022. As of
March 31, 2018
and
December 31, 2017
, there were
no
commercial paper borrowings outstanding.
Depending on our corporate credit rating, we pay a commitment fee of
8
to
17.5
basis points for our credit facility, whether or not amounts have been borrowed. We currently pay a commitment fee of
12.5
basis points. The interest rate on borrowings under our credit facility is, at our option, calculated using rates that are primarily based on either the prevailing London Inter-Bank Offer Rate, the prime rate determined by the administrative agent or the Federal Funds Rate. For certain borrowings under this credit facility, there is also a spread based on our corporate credit rating.
Our credit facility contains certain covenants. The only financial covenant requires that our indebtedness to cash flow ratio, as defined in our credit facility, is not greater than
4
to
1
, and this covenant level has never been exceeded.
Dividends
On February 2, 2018, the Board of Directors approved an increase in the quarterly common stock dividend from $0.41 per share to $0.50 per share.
RECONCILIATION OF NON-GAAP FINANCIAL INFORMATION
Free cash flow is a non-GAAP financial measure and reflects our cash flow provided by operating activities less capital expenditures and distributions to noncontrolling interest holders. Capital expenditures include purchases of property and equipment and additions to technology projects. Our cash flow provided by operating activities is the most directly comparable U.S. GAAP financial measure to free cash flow. Additionally, we have considered certain items in evaluating free cash flow, which are included in the table below.
We believe the presentation of free cash flow and free cash flow excluding certain items allows our investors to evaluate the cash generated from our underlying operations in a manner similar to the method used by management. We use free cash flow to conduct and evaluate our business because we believe it typically presents a more conservative measure of cash flows since capital expenditures and distributions to noncontrolling interest holders are considered a necessary component of ongoing operations. Free cash flow is useful for management and investors because it allows management and investors to evaluate the cash available to us to prepay debt, make strategic acquisitions and investments and repurchase stock.
The presentation of free cash flow and free cash flow excluding certain items are not intended to be considered in isolation or as a substitute for the financial information prepared and presented in accordance with U.S. GAAP. Free cash flow, as we calculate it, may not be comparable to similarly titled measures employed by other companies. The following table presents a reconciliation of our cash flow provided by operating activities to free cash flow excluding the impact of the item below for the
three
months ended
March 31
:
|
(in millions)
|
2018
|
2017
|
% Change
|
|||||||
|
Cash provided by operating activities
|
$
|
360
|
|
$
|
353
|
|
2
|
%
|
||
|
Capital expenditures
|
(33
|
)
|
(23
|
)
|
|
|
||||
|
Distributions to noncontrolling interest holders
|
(50
|
)
|
(24
|
)
|
|
|
||||
|
Free cash flow
|
277
|
|
306
|
|
(10
|
)%
|
||||
|
Payment of legal settlements
|
29
|
|
1
|
|
|
|
||||
|
Tax benefit from legal settlements
|
(7
|
)
|
|
—
|
|
|
|
|||
|
Free cash flow excluding above items
|
$
|
299
|
|
$
|
307
|
|
(3
|
)%
|
||
|
(in millions)
|
2018
|
2017
|
% Change
|
||||
|
Cash used for investing activities
|
(87
|
)
|
(22
|
)
|
N/M
|
||
|
Cash used for financing activities
|
(1,316
|
)
|
(346
|
)
|
N/M
|
||
N/M - not meaningful
41
CRITICAL ACCOUNTING ESTIMATES
Our accounting policies are described in Note 1
—
Accounting Policies
to the consolidated financial statements in our most recent Form 10-K. As discussed in Item 7,
Management’s Discussion and Analysis of Financial Condition and Results of Operations
, in our most recent Form 10-K, we consider an accounting estimate to be critical if it required assumptions to be made that were uncertain at the time the estimate was made and changes in the estimate or different estimates could have a material effect on our results of operations. These critical estimates include those related to revenue recognition, allowance for doubtful accounts, valuation of long-lived assets, goodwill and other intangible assets, pension plans, incentive compensation and stock-based compensation, income taxes, contingencies and redeemable non-controlling interests. We base our estimates on historical experience, current developments and on various other assumptions that we believe to be reasonable under these circumstances, the results of which form the basis for making judgments about carrying values of assets and liabilities that cannot readily be determined from other sources. There can be no assurance that actual results will not differ from those estimates. Since the date of our most recent Form 10-K, we adopted Financial Accounting Standards Board Accounting Standards Codification ("ASC") 606. There have been no other material changes to our critical accounting policies and estimates.
RECENTLY ISSUED OR ADOPTED ACCOUNTING STANDARDS
See Note 13 –
Recently Issued or Adopted Accounting Standards
to the consolidated financial statements of this Form 10-Q for further information.
42
FORWARD-LOOKING STATEMENTS
This report contains “forward-looking statements,” as defined in the Private Securities Litigation Reform Act of 1995. These statements, which express management’s current views concerning future events, trends, contingencies or results, appear at various places in this report and use words like “anticipate,” “assume,” “believe,” “continue,” “estimate,” “expect,” “forecast,” “future,” “intend,” “plan,” “potential,” “predict,” “project,” “strategy,” “target” and similar terms, and future or conditional tense verbs like “could,” “may,” “might,” “should,” “will” and “would.” For example, management may use forward-looking statements when addressing topics such as: the outcome of contingencies; future actions by regulators; changes in the Company’s business strategies and methods of generating revenue; the development and performance of the Company’s services and products; the expected impact of acquisitions and dispositions; the Company’s effective tax rates; and the Company’s cost structure, dividend policy, cash flows or liquidity.
Forward-looking statements are subject to inherent risks and uncertainties. Factors that could cause actual results to differ materially from those expressed or implied in forward-looking statements include, among other things:
|
•
|
the impact of the recent acquisition of Kensho, including the impact on the Company’s results of operations; any failure to successfully integrate Kensho into the Company’s operations; any failure to attract and retain key employees; and the risk of litigation, unexpected costs, charges or expenses relating to the acquisition;
|
|
•
|
worldwide economic, financial, political and regulatory conditions, including conditions that may result from legislative, regulatory and policy changes associated with the current U.S. administration or the United Kingdom’s withdrawal from the European Union;
|
|
•
|
the rapidly evolving regulatory environment, in Europe, the United States and elsewhere, affecting Ratings, S&P Global Platts, Indices, and S&P Global Market Intelligence, including new and amended regulations and the Company’s compliance therewith;
|
|
•
|
our ability to make acquisitions and dispositions and successfully integrate the businesses we acquire;
|
|
•
|
the outcome of litigation, government and regulatory proceedings, investigations and inquiries;
|
|
•
|
the health of debt and equity markets, including credit quality and spreads, the level of liquidity and future debt issuances;
|
|
•
|
the demand and market for credit ratings in and across the sectors and geographies where the Company operates;
|
|
•
|
concerns in the marketplace affecting the Company’s credibility or otherwise affecting market perceptions of the integrity or utility of independent credit ratings;
|
|
•
|
the effect of competitive products and pricing, including the level of success of new product developments and global expansion;
|
|
•
|
consolidation in the Company’s end-customer markets;
|
|
•
|
the introduction of competing products or technologies by other companies;
|
|
•
|
the impact of customer cost-cutting pressures, including in the financial services industry and the commodities markets;
|
|
•
|
a decline in the demand for credit risk management tools by financial institutions;
|
|
•
|
the level of merger and acquisition activity in the United States and abroad;
|
|
•
|
the volatility of the energy marketplace;
|
|
•
|
the health of the commodities markets;
|
|
•
|
our ability to attract, incentivize and retain key employees;
|
|
•
|
the Company’s ability to maintain adequate physical, technical and administrative safeguards to protect the security of confidential information and data, and the potential of a system or network disruption that results in regulatory penalties, remedial costs or improper disclosure of confidential information or data;
|
|
•
|
the Company’s ability to successfully recover should it experience a disaster or other business continuity problem from a hurricane, flood, earthquake, terrorist attack, pandemic, security breach, cyber-attack, power loss, telecommunications failure or other natural or man-made event;
|
|
•
|
our ability to adjust to changes in European and United Kingdom markets as the United Kingdom leaves the European Union, and the impact of the United Kingdom’s departure on our credit rating activities and other European and United Kingdom offerings;
|
|
•
|
changes in applicable tax or accounting requirements;
|
|
•
|
guidance and information regarding the implementation of the Tax Cuts and Jobs Act;
|
|
•
|
the level of the Company’s future cash flows and capital investments;
|
|
•
|
the impact on the Company’s revenue and net income caused by fluctuations in foreign currency exchange rates; and
|
|
•
|
the Company’s exposure to potential criminal sanctions or civil penalties if it fails to comply with foreign and U.S. laws and regulations that are applicable in the domestic and international jurisdictions in which it operates, including sanctions laws relating to countries such as Iran, Russia, Sudan and Syria, anti-corruption laws such as the U.S. Foreign Corrupt Practices Act and the U.K. Bribery Act of 2010, and local laws prohibiting corrupt payments to government officials, as well as import and export restrictions.
|
43
The factors noted above are not exhaustive. The Company and its subsidiaries operate in a dynamic business environment in which new risks emerge frequently. Accordingly, the Company cautions readers not to place undue reliance on any forward-looking statements, which speak only as of the dates on which they are made. The Company undertakes no obligation to update or revise any forward-looking statement to reflect events or circumstances arising after the date on which it is made, except as required by applicable law. Further information about the Company’s businesses, including information about factors that could materially affect its results of operations and financial condition, is contained in the Company’s filings with the SEC, including the “Risk Factors” section in the Company’s most recently filed Annual Report on Form 10-K.
44
Item 3.
Quantitative and Qualitative Disclosures About Market Risk
Our exposure to market risk includes changes in foreign exchange rates. We have operations in foreign countries where the functional currency is primarily the local currency. For international operations that are determined to be extensions of the parent company, the U.S. dollar is the functional currency. We typically have naturally hedged positions in most countries from a local currency perspective with offsetting assets and liabilities. As of
March 31, 2018
and
December 31, 2017
, we entered into foreign exchange forward contracts in order to mitigate the change in fair value of specific assets and liabilities in the consolidated balance sheet. These forward contracts are not designated as hedges and do not qualify for hedge accounting. As of
March 31, 2018
and
December 31, 2017
, we entered into foreign exchange forward contracts to hedge the effect of adverse fluctuations in foreign currency exchange rates. We have not entered into any derivative financial instruments for speculative purposes. See Note 5 -
Derivative Instruments
to the consolidated financial statements of this Form 10-Q for further discussion.
Item 4.
Controls and Procedures
Disclosure Controls and Procedures
We maintain disclosure controls and procedures that are designed so that information required to be disclosed in our reports filed with the U.S. Securities and Exchange Commission (the “SEC”) is recorded, processed, summarized and reported within the time periods specified in the SEC’s rules and forms, and that such information is accumulated and communicated to management, including our Chief Executive Officer (“CEO”) and Chief Financial Officer (“CFO”), as appropriate, to allow timely decisions regarding required disclosure.
As of
March 31, 2018
, an evaluation was performed under the supervision and with the participation of management, including the CEO and CFO, of the effectiveness of the design and operation of our disclosure controls and procedures (as defined in Rules 13a-15(e) and 15d-15(e) under the Securities Exchange Act of 1934). Based on that evaluation, management, including the CEO and CFO, concluded that our disclosure controls and procedures were effective as of
March 31, 2018
.
Changes in Internal Control over Financial Reporting
There have been no changes in our internal control over financial reporting during the most recent quarter that have materially affected, or are reasonably likely to materially affect, our internal control over financial reporting.
45
Item 1.
Legal Proceedings
See Note 12 –
Commitments and Contingencies - Legal & Regulatory Matters
to the consolidated financial statements of this Form 10-Q for information on our legal proceedings.
Item 1a.
Risk Factors
Our most recent Form 10-K contains detailed cautionary statements which identify all known material risks, uncertainties and other factors that could cause our actual results to differ materially from historical or expected results. There have been no material changes to the risk factors we have previously disclosed in Item 1a, Risk Factors, in our most recent Form 10-K.
Item 2.
Unregistered Sales of Equity Securities and Use of Proceeds
On December 4, 2013, the Board of Directors approved a share repurchase program authorizing the purchase of up to 50 million shares, which was approximately 18% of the Company's outstanding shares at that time. During the
first
quarter of
2018
, we repurchased
5.0 million
shares, and as of
March 31, 2018
,
14.0 million
shares remained under our current repurchase program.
We entered into an accelerated share repurchase ("ASR") agreement with a financial institution on March 6, 2018 to initiate share repurchases aggregating $1 billion. The ASR agreement was structured as an uncapped ASR agreement in which we paid $1 billion and received an initial delivery of approximately 4.5 million shares, representing 85% of the $1 billion at a price equal to the then market price of the Company. The total number of shares to be repurchased under the ASR agreement will be equal to $1 billion divided by the volume weighted-average share price, less a discount, over the term of the ASR agreement. The final settlement of the transaction under the ASR agreement is expected to be completed no later than the third quarter of 2018. The repurchased shares are held in Treasury. The ASR agreement was executed under the current share repurchase program, approved on December 4, 2013.
Repurchased shares may be used for general corporate purposes, including the issuance of shares for stock compensation plans and to offset the dilutive effect of the exercise of employee stock options. Our current repurchase program has no expiration date and purchases under this program may be made from time to time on the open market and in private transactions, depending on market conditions.
The following table provides information on our purchases of our outstanding common stock during the
first
quarter of
2018
pursuant to our current share repurchase program (column c). In addition to these purchases, the number of shares in column (a) include shares of common stock that are tendered to us to satisfy our employees’ tax withholding obligations in connection with the vesting of awards of restricted shares (we repurchase such shares based on their fair market value on the vesting date). There were no other share repurchases during the quarter outside the repurchases noted below.
|
Period
|
(a) Total Number of Shares Purchased
|
(b) Average Price Paid per Share
|
(c) Total Number of Shares Purchased as
Part of Publicly Announced Programs
|
(d) Maximum Number of Shares that may yet be Purchased Under the Programs
|
|||||||||
|
January 1 — January 31, 2018
|
444,437
|
|
$
|
177.87
|
|
442,400
|
|
18.6
|
|
||||
|
February 1 — February 28, 2018
|
119,391
|
|
178.92
|
|
119,000
|
|
18.5
|
|
|||||
|
March 1 — March 31, 2018
1
|
4,450,516
|
|
189.52
|
|
4,450,495
|
|
14.0
|
|
|||||
|
Total — Quarter
1
|
5,014,344
|
|
$
|
178.09
|
|
5,011,895
|
|
14.0
|
|
||||
|
1
|
Average price paid per share information does not include the accelerated share repurchase transaction as discussed in more detail above.
|
Item 5.
Other Information
IRAN THREAT REDUCTION AND SYRIA HUMAN RIGHTS ACT DISCLOSURE
Pursuant to Section 219 of the Iran Threat Reduction and Syria Human Rights Act of 2012, which amended the Securities Exchange Act of 1934, an issuer is required to disclose in its annual or quarterly reports, as applicable, whether, during the reporting period,
46
it or any of its affiliates knowingly engaged in certain activities, transactions or dealings relating to Iran or with individuals or entities designated pursuant to certain Executive Orders. Disclosure is generally required even where the activities, transactions or dealings were conducted in compliance with applicable laws and regulations.
Revenue during the first quarter of 2018 attributable to the transactions or dealings by the Company described below was approximately $94,000 with net profit from such sales being a fraction of the revenues.
During the first quarter of 2018, Platts, a division of the Company that provides energy-related information in over 150 countries, sold information and informational materials, which are generally exempt from U.S. economic sanctions, to 12 subscribers that are owned or controlled, or appear to be owned or controlled, by the Government of Iran (the “GOI”). The Company, among other things, offers customers that subscribe to its publications access to proprietary data, analytics, and industry information that enable commodities markets to perform with greater transparency and efficiency. This division provided such data related to the energy and petrochemicals markets to the subscribers referenced above, generating revenue that was a
de minimis
portion of both the division's and the Company’s revenue. Six of the subscribers are designated by OFAC as GOI entities; and five appear, based on publicly available information, to be owned or controlled by GOI entities. In addition, during the third quarter of 2017, this division entered into a contract to sell information and informational materials to another subscriber that is owned or controlled by the Government of Iran, but no revenues were received under this contract during the third quarter. We believe that these transactions were permissible under U.S. sanctions pursuant to certain statutory and regulatory exemptions for the exportation of information and informational materials. The Company will continue to monitor its provision of products and services to these Iranian customers so that such activity continues to be permissible under U.S. sanctions.
47
Item 6.
Exhibits
|
(10.1)
|
|
|
(10.2)
|
|
|
(10.3)
|
|
|
(10.4)
|
|
|
(12)
|
|
|
(15)
|
|
|
(31.1)
|
|
|
(31.2)
|
|
|
(32)
|
|
|
(101.INS)
|
XBRL Instance Document
|
|
(101.SCH)
|
XBRL Taxonomy Extension Schema
|
|
(101.CAL)
|
XBRL Taxonomy Extension Calculation Linkbase
|
|
(101.LAB)
|
XBRL Taxonomy Extension Label Linkbase
|
|
(101.PRE)
|
XBRL Taxonomy Extension Presentation Linkbase
|
|
(101.DEF)
|
XBRL Taxonomy Extension Definition Linkbase
|
48
Signatures
Pursuant to the requirements of the Securities Exchange Act of 1934, the registrant has duly caused this quarterly report on Form 10-Q to be signed on its behalf by the undersigned, thereunto duly authorized.
|
S&P Global Inc.
|
|||
|
Registrant
|
|||
|
Date:
|
April 26, 2018
|
By:
|
/s/
Ewout L. Steenbergen
|
|
Ewout L. Steenbergen
|
|||
|
Executive Vice President and Chief Financial Officer
|
|||
|
Date:
|
April 26, 2018
|
By:
|
/s/
Robert J. MacKay
|
|
Robert J. MacKay
|
|||
|
Senior Vice President and Corporate Controller
|
|||
49
TABLE OF CONTENTS
Part I Financial InformationItem 1. Financial StatementsItem 2. Management S Discussion and Analysis Of Financial Condition and Results Of Operations (unaudited)Item 3. Quantitative and Qualitative Disclosures About Market RiskItem 4. Controls and ProceduresPart II Other InformationItem 1. Legal ProceedingsItem 1A. Risk FactorsItem 2. Unregistered Sales Of Equity Securities and Use Of ProceedsItem 5. Other InformationItem 6. Exhibits