STEEL PARTNERS HOLDINGS L.P.
10-Ks and 10-Qs
|
|
|
|
|
|
|
|
|
|
|
|
|
|
|
|
|
|
|
|
|
|
|
|
|
|
|
|
|
|
|
|
|
|
|
|
|
|
|
|
|
|
|
|
|
|
|
|
|
|
|
|
|
UNITED STATES
SECURITIES AND EXCHANGE COMMISSION
WASHINGTON, D.C. 20549
FORM 10-K
(Mark One)
|
þ
|
ANNUAL REPORT PURSUANT TO SECTION 13 OR 15(d) OF THE SECURITIES EXCHANGE ACT OF 1934
|
For The Fiscal Year Ended December 31, 2011
OR
|
¨
|
TRANSITION REPORT PURSUANT TO SECTION 13 OR 15(d) OF THE SECURITIES EXCHANGE ACT OF 1934
|
For the Transition Period from
to
Commission File Number 000-5465
_______________
STEEL PARTNERS HOLDINGS L.P.
(Exact name of registrant as specified in its charter)
|
Delaware
|
13-3727655
|
|
(State of or other jurisdiction of
|
(I.R.S. Employer
|
|
incorporation or organization)
|
Identification No.)
|
|
590 Madison Avenue, 32
nd
Floor
|
|
|
New York, New York
|
10022
|
|
(Address of principal executive offices)
|
(Zip code)
|
Registrant's telephone number, including area code
: 212-520-2300
Securities registered pursuant to Section 12(b) of the Act:
|
Name of each exchange on
|
|
|
Title of each class
|
which registered
|
NONE
Securities registered pursuant to Section 12(g) of the Act:
Common Units, no par value
Indicate by check mark if the Registrant is a well-known seasoned issuer, as defined in Rule 405 of the Securities Act. Yes
¨
No
ý
Indicate by check mark if the Registrant is not required to file reports pursuant to Section 13 or Section 15(d) of the Act. Yes
¨
No
ý
Indicate by check mark whether the registrant: (1) has filed all reports required to be filed by Section 13 or 15(d) of the Securities Exchange Act of 1934 during the preceding 12 months (or for such shorter period that the registrant was required to file such reports), and (2) has been subject to such filing requirements for the past 90 days. Yes
¨
No
ý
Indicate by check mark whether the registrant has submitted electronically and posted on its corporate Web site, if any, every Interactive Data File required to be submitted and posted pursuant to Rule 405 of Regulation S-T (§232.405) during the preceding 12 months (or for such shorter period that the registrant was required to submit and post such files). Yes
¨
No
ý
Indicate by check mark if disclosure of delinquent filers pursuant to Item 405 of Regulation S-K is not contained herein, and will not be contained, to the best of registrant’s knowledge, in definitive proxy or information statements incorporated by reference in Part III of this Form 10-K or any amendment to this Form 10-K.
ý
Indicate by check mark whether the Registrant is a large accelerated filer, an accelerated filer, a non-accelerated filer or a smaller reporting company. See definition of “accelerated filer and large accelerated filer” in Rule 12b-2 of the Exchange Act. (Check one):
|
Large accelerated filer
|
¨
|
Non-accelerated filer
|
ý
|
|
|
Accelerated filer
|
¨
|
Smaller reporting company
|
¨
|
Indicate by check mark whether the registrant is a shell company (as defined in Rule 12b-2 of the Exchange Act). Yes
¨
No
ý
The aggregate market value of our common units held by non-affiliates of registrant as of June 30, 2011 was approximately $341.3 million.
On March 16, 2012, there were 25,183,039 common units outstanding.
DOCUMENTS INCORPORATED BY REFERENCE
None
Steel
Partners Holdings L.P.
Table of Contents
|
PART I
|
||||||
|
Item 1.
|
3
|
|||||
|
Item 1A.
|
16
|
|||||
|
Item 1B.
|
29
|
|||||
|
Item 2.
|
29
|
|||||
|
Item 3.
|
30
|
|||||
|
Item 4.
|
30
|
|||||
|
PART II
|
||||||
|
Item 5.
|
30
|
|||||
|
Item 6.
|
32
|
|||||
|
Item 7.
|
34
|
|||||
|
Item 7A.
|
72
|
|||||
|
Item 8.
|
75
|
|||||
|
Item 9.
|
179
|
|||||
|
Item 9A.
|
179
|
|||||
|
Item 9B.
|
179
|
|||||
|
PART III
|
||||||
|
Item 10.
|
179
|
|||||
|
Item 11.
|
183
|
|||||
|
Item 12.
|
189
|
|||||
|
Item 13.
|
190
|
|||||
|
Item 14.
|
195
|
|||||
|
PART IV
|
||||||
|
Item 15.
|
196
|
|||||
|
198
|
||||||
|
EXHIBIT INDEX
|
||||||
As used in this Form 10-K, unless the context otherwise requires the terms “we,” “us,” “our,” “SPH” and the “Company” refer to Steel Partners Holdings L.P., a Delaware limited partnership.
FORWARD-LOOKING STATEMENTS
This report includes “forward-looking statements” within the meaning of Section 27A of the Securities Act of 1933, as amended (the “Securities Act”), and Section 21E of the Securities Exchange Act of 1934, as amended (the “Exchange Act”), including, in particular, forward-looking statements under the headings “Item 7- Management’s Discussion and Analysis of Financial Condition and Results of Operations” and “Item 8 - Financial Statements and Supplementary Data.” These statements appear in a number of places in this report and include statements regarding the Company’s intent, belief or current expectations with respect to (i) its financing plans, (ii) trends affecting its financial condition or results of operations, and (iii) the impact of competition. The words “expect,” “anticipate,” “intend,” “plan,” “believe,” “seek,” “estimate,” and similar expressions are intended to identify such forward-looking statements; however, this report also contains other forward-looking statements in addition to historical information.
Item 1.
Business
All monetary amounts used in this discussion are in thousands unless otherwise indicated.
Who We Are
Steel Partners Holdings L.P. is a global diversified holding company that engages in multiple businesses through consolidated subsidiaries, associated companies and other interests. We own and operate businesses and have significant interests in leading companies in various industries, including diversified industrial products, energy, defense, banking, insurance, food products and services, oilfield services, sports, training, education, and the entertainment and lifestyle industries.
Each of our companies has its own management team with significant experience and proven success in their industries. Our subsidiary, SPH Services, Inc., through its subsidiary, SP Corporate Services LLC (“SP Corporate”), provides certain executive and corporate management services to us and some of our companies. We seek to work with our companies to increase corporate value over the long term for our unitholders and all stakeholders by implementing our unique strategy discussed in more detail below.
As of December 31, 2011, our total equity attributable to our common unitholders is $415,797. Our capital structure enables us to manage our businesses with a long-term time horizon.
Our Strategy
We continuously evaluate the retention and disposition of existing operations and investigate possible acquisitions of new businesses, often focusing on businesses that are selling substantially below intrinsic value. We consider possible synergies and economies of scale in operating and/or making determinations to acquire or dispose of companies. We seek additional means to reduce costs and to encourage integration of operations and the building of business relationships among our companies consistent with our desire that our unitholders benefit from the diversified holding company structure.
We strive to enhance the business operations of our companies and increase long-term value for unitholders and stakeholders through balance sheet improvements, strategic allocation of capital and operational and growth initiatives. Our operational initiatives include creating efficiencies through consolidated purchasing and materials sourcing provided by the
Steel Partners Purchasing Council,
which arranges shared purchasing programs and is reducing costs for, and providing other benefits to, a number of our companies. We are reducing our companies’ operational costs, and enhancing growth and profitability, through the implementation of
Steel Partners Operational Excellence Programs
, which include the deployment of Lean Manufacturing, Design for Six Sigma, Six Sigma and Strategy Deployment. We are focused on reducing corporate overhead of our companies by centralizing certain administrative and corporate services through
Steel Partners Corporate Services
that provides management, consulting and advisory services.
Generally, we seek to actively acquire and maintain control over our companies through our ability to influence their policies. Depending on the size of our ownership interests in any given company, this may be achieved by obtaining board representation and overseeing and providing assistance to the existing management team. We generally view our companies as long-term holdings and we expect to realize value by operating them with a view towards fostering growth and maximizing their value rather than through the sale of ownership interests. The securities of some of the companies in which we have interests are traded on national securities exchanges, while others are privately held or not actively traded.
Our Business Segments
We categorize our companies as follows:
|
Diversified Industrial
|
Financial Services
|
Corporate
|
|
Handy & Harman Ltd.
(1)
|
WebBank
(1)
|
SPH Services, Inc.
(1)
|
|
BNS Holding, Inc.
(1)
|
Steel Excel Inc.
(2)
|
|
|
DGT Holdings Corp.
(1)
|
CoSine Communications, Inc.
(2)
|
|
|
SL Industries, Inc.
(2)
|
Barbican Group Holdings Limited
(3)
|
|
|
API Group PLC
(3)
|
Fox & Hound Restaurant Group
(3)
|
|
|
JPS Industries, Inc.
(3)
|
GenCorp Inc.
(3)
|
_______________
|
(1)
|
Consolidated subsidiary
|
|
(2)
|
Associated company
|
|
(3)
|
Other core company
|
Our Businesses
Handy & Harman Ltd.
Our Ownership Interest
We have an ownership interest of approximately 55.6% as of March 16, 2012 in Handy & Harman Ltd. (NASDAQ (CM): HNH), formerly known as WHX Corporation prior to January 3, 2011, a Delaware corporation (“HNH”). On May 7, 2010, our ownership interest in HNH exceeded 50%, and as a result, HNH became a controlled subsidiary of SPH and is consolidated from that date. We hold as of March 16, 2012, $20,715 principal amount of 10% subordinated secured notes issued by a subsidiary of HNH that mature on October 15, 2017 (the “Subordinated Notes”), which are eliminated in consolidation, and warrants (the “Warrants”) to purchase 406,324 shares of HNH common stock. The Subordinated Notes bear interest at a rate of 10% per annum, 6% of which is payable in cash and 4% of which is payable in-kind. The Warrants have an exercise price of $11.00 per share and are exercisable beginning October 14, 2013.
Four of our representatives serve on HNH’s eight-member board of directors, one of whom serves as Chairman. Our representatives also serve as the Chief Executive Officer, Chief Financial Officer, Chief Legal Officer and as a Vice President of HNH.
Description of Business
HNH is a diversified manufacturer of engineered niche industrial products with leading market positions in many of the markets it serves. Through its operating subsidiaries, HNH focuses on high margin products and innovative technology and serves customers across a wide range of end markets. HNH’s diverse product offerings are marketed throughout the United States and internationally. For the years ended December 31, 2011 and 2010, HNH generated net sales of $664,017and $568,212, respectively.
HNH Products and Product Mix
Precious Metal
HNH’s Precious Metal segment primarily fabricates precious metals and their alloys into brazing alloys. Brazing alloys are used to join similar and dissimilar metals as well as specialty metals and some ceramics with strong, hermetic joints. Precious Metal segment offers these metal joining products in a wide variety of alloys including gold, silver, palladium, copper, nickel, aluminum and tin. These brazing alloys are fabricated into a variety of engineered forms and are used in many industries including electrical, appliance, transportation, construction and general industrial, where dissimilar material and metal-joining applications are required. Operating income from precious metal products is principally derived from the ‘‘value added’’ of processing and fabricating and not from the purchase and resale of precious metal. Precious Metal segment has limited exposure to the prices of precious metals due to HNH’s hedging and pricing models. HNH believes that the business unit that comprises its Precious Metal segment is the North American market leader in many of the markets that it serves.
Tubing
HNH’s Tubing segment manufactures a wide variety of steel tubing products. HNH believes that its Stainless Steel Tubing Group manufactures the world’s longest continuous seamless stainless steel tubing coils in excess of 5,000 feet serving the petrochemical infrastructure and shipbuilding markets. HNH also believes it is the number one supplier of small diameter (<3mm) coil tubing to industry leading specifications serving the aerospace, defense and semiconductor fabrication markets. HNH’s Specialty Tubing unit manufactures welded carbon steel tubing in coiled and straight lengths with a primary focus on products for the consumer and commercial refrigeration, automotive, heating, ventilation and cooling (HVAC) and oil and gas industries. In addition to producing bulk tubing, it produces value added fabrications for several of these industries.
Engineered Materials
HNH’s Engineered Materials segment manufactures and supplies products primarily to the commercial construction and building industries. It manufactures fasteners and fastening systems for the U.S. commercial low slope roofing industry which are sold to building and roofing material wholesalers, roofing contractors and private label roofing system manufacturers; a line of engineered specialty fasteners for the building products industry for fastening applications in the remodeling and construction of homes, decking and landscaping; plastic and steel fittings and connectors for natural gas, propane and water distribution service lines along with exothermic welding products for electrical grounding, cathodic protection and lightning protection; and electro-galvanized and painted cold rolled sheet steel products primarily for the construction, entry door, container and appliance industries. HNH believes that its primary business unit in the Engineered Materials segment is the market leader in fasteners and accessories for commercial low-slope roofing applications, and that the majority of the net sales for the segment are for the commercial construction repair and replacement market.
Arlon Electronic Materials
HNH’s Arlon Electronic Materials segment (“Arlon”) provides high performance materials for the printed circuit board (‘‘PCB’’) industry and silicone rubber-based insulation materials used in a broad range of industrial, military/aerospace, consumer and commercial markets. It also supplies high technology circuit substrate laminate materials to the PCB industry. Products are marketed principally to Original Equipment Manufacturers (‘‘OEMs’’), distributors and PCB manufacturers globally. Arlon also manufactures a line of market-leading silicone rubber materials used in a broad range of military, consumer, industrial and commercial products.
Kasco Blades and Route Repair Services
HNH’s Kasco Blades and Route Repair Services (“Kasco”) segment provides meat-room blade products, repair services and resale products for the meat and deli departments of supermarkets, restaurants, meat and fish processing plants and for distributors of electrical saws and cutting equipment principally in North America and Europe. Kasco also provides wood cutting blade products for the pallet manufacturing, pallet recycler and portable saw mill industries in North America.
Business Strategy
HNH’s business strategy is to enhance the growth and profitability of the business units of HNH and to build upon their strengths through internal growth and strategic acquisitions. HNH expects to continue to focus on high margin products and innovative technology.
HNH also will continue to evaluate, from time to time, the sale of certain businesses and assets, as well as strategic and opportunistic acquisitions.
HNH uses a set of tools and processes called the HNH Business System to drive operational and sales efficiencies across each of its business units. The HNH Business System is designed to drive strategy deployment and sales and marketing based on lean principles. HNH pursues a number of ongoing strategic initiatives intended to improve its performance, including objectives relating to manufacturing improvement, idea generation, product development and global sourcing of materials and services. HNH utilizes lean tools and philosophies in operations and commercialization activities to increase sales, improve business processes, and reduce and eliminate waste coupled with the tools targeted at variation reduction.
Customers
HNH is diversified across industrial markets and customers. HNH sells to customers in the construction, electronics, telecommunications, home appliance OEM, transportation, utility, medical, semiconductor, aerospace, military electronics, medical, telecommunications, automotive, railroad, and the food industry.
No customer accounted for more than 5% of consolidated sales in 2011 or 2010. However, HNH’s 15 largest customers accounted for approximately 27% of consolidated HNH net sales.
Foreign Revenue
The following table presents HNH revenue for the periods indicated; however, HNH revenue is only included in SPH’s consolidation since May 7, 2010:
|
Revenue
|
||||||||||||
|
Year Ended December 31,
|
||||||||||||
|
2011
|
2010
|
2009
|
||||||||||
|
U.S.
|
$ | 589,836 | $ | 514,992 | $ | 424,048 | ||||||
|
Foreign (a)
|
74,181 | 53,220 | 36,655 | |||||||||
| $ | 664,017 | $ | 568,212 | $ | 460,703 | |||||||
|
(a)
|
Foreign revenue is based on the country in which the legal subsidiary is domiciled.
|
Raw Materials
Besides precious metals, the raw materials used in the operations of the Precious Metal, Tubing, Engineered Materials, and Kasco segments consist principally of stainless, galvanized, and carbon steel, nickel alloys, a variety of high-performance alloys, and various plastic compositions. HNH purchases all such raw materials at open market prices from domestic and foreign suppliers. HNH has not experienced any significant problem in obtaining the necessary quantities of raw materials. Prices and availability, particularly of raw materials purchased from foreign suppliers, are affected by world market conditions and government policies. The raw materials used by HNH in its non-precious metal segments are generally readily available from more than one source.
The essential raw materials used in the Arlon segment are silicone rubber, fiberglass cloths, non-woven glass mats, pigments, copper foils, various plastic films, special release liners, various solvents, Teflon™ or PTFE dispersion, skive PTFE film, polyimide resin, epoxy resins, other thermoset resins, ceramic fillers, as well as various chemicals. Generally, these materials are each available from several qualified suppliers. There are, however, several raw materials used in products that are purchased from chemical companies that are proprietary in nature. Other raw materials are purchased from a single approved vendor on a “sole source” basis, although alternative sources could be developed in the future if necessary. However, the qualification procedure for new suppliers can take several months or longer and could therefore interrupt production if the primary raw material source became unexpectedly unavailable. Current suppliers are located in the United States, Asia, and Europe.
Capital Investments
HNH believes that in order to be and remain competitive, its businesses must continuously strive to improve productivity and product quality, and control and/or reduce manufacturing costs. Accordingly, HNH’s segments expect to continue to incur capital investments that reduce overall manufacturing costs, improve the quality of products produced, and broaden the array of products offered to the industries HNH serves, as well as replace equipment as necessary to maintain compliance with environmental, health and safety laws and regulations. HNH’s capital expenditures for 2011 and 2010 for continuing operations were $13.4 million and $10.6 million, respectively. HNH anticipates funding its capital expenditures in 2012 from funds generated by operations and borrowed funds. HNH anticipates its capital expenditures to be in the range between $18 and $26 million per year for the next several years.
Energy Requirements
HNH requires significant amounts of electricity and natural gas to operate its facilities and is subject to price changes in these commodities. A shortage of electricity or natural gas, or a government allocation of supplies resulting in a general reduction in supplies, could increase costs of production and could cause some curtailment of production.
Competition
There are many companies, both domestic and foreign, which manufacture products of the type HNH manufactures. Some of these competitors are larger than HNH and have financial resources greater than it does. Some of these competitors enjoy certain other competitive advantages, including greater name recognition, greater financial, technical, marketing and other resources, a larger installed base of customers, and well-established relationships with current and potential customers. Competition is based on quality, technology, service, and price and in some industries, new product introduction, each of which is of equal importance. HNH may not be able to compete successfully and competition may have a negative impact on its business, operating results or financial condition by reducing volume of products sold and/or selling prices, and accordingly reducing revenues and profits.
In its served markets, HNH competes against large as well as smaller-sized private and public companies. This results in intense competition in a number of markets in which it operates. Significant competition could in turn lead to lower prices, lower levels of shipments and/or higher costs in some markets that could have a negative effect on results of operations.
Sales Channels
HNH distributes products to customers through Company sales personnel, outside sales representatives and distributors in North and South America, Europe, Australia, and the Far East and several other international markets.
Patents and Trademarks
HNH owns patents and registered trademarks under which certain of its products are sold. In addition, HNH owns a number of US and foreign mechanical patents related to certain of its products, as well as a number of design patents. HNH does not believe that the loss of any or all of these trademarks would have a material adverse effect on its businesses. HNH’s patents have remaining durations ranging from less-than-one year to 17 years, with expiration dates occurring in 2012 through 2028.
Environmental Regulation
HNH is subject to laws and regulations relating to the protection of the environment. HNH does not presently anticipate that compliance with currently applicable environmental regulations and controls will significantly change its competitive position, capital spending or earnings during 2012. HNH believes it is in compliance with all orders and decrees consented to by HNH with environmental regulatory agencies.
Employment
As of December 31, 2011, HNH employed 1,621 employees worldwide. Of these employees, 326 were sales employees, 478 were office employees, 155 were covered by collective bargaining agreements, and 662 were non-union operating employees.
BNS Holding, Inc.
Our Ownership Interest
We have an ownership interest of approximately 84.9% as of March 16, 2012 in BNS Holding, Inc. (OTC: BNSSA.PK), a Delaware corporation (“BNS”). Two of our representatives serve on BNS’ three-member board of directors. Our representatives also serve as the Chief Executive Officer and Chief Financial Officer of BNS and as the Chief Executive Officer of its wholly-owned subsidiary, Sun Well Services, Inc. (“Sun Well”).
Description of Business
BNS operates through Sun Well, a provider of premium well services to exploration and production (“E&P”) companies operating primarily in the Williston Basin in North Dakota and eastern Montana. Sun Well provides critical services needed by E&P operators, including well completion, well maintenance and workover, well recompletion, hydrostatic tubular testing and plug and abandonment services.
On February 2, 2011, BNS acquired all of the capital stock of SWH, Inc. (“SWH”) for an aggregate purchase price of approximately $50,463. SWH owns all of the capital stock of Sun Well, its sole asset. Prior to the acquisition of Sun Well and during the past five years, BNS operated primarily through its 80% ownership of Collins Industries, Inc. (“Collins”), a North American manufacturer of small school, activity and shuttle buses, ambulances, and terminal trucks/road construction equipment, until its disposition of Collins in February 2010.
On February 13, 2012, BNS and Steel Excel Inc., in which SPH holds approximately a 40% interest, announced that they are engaged in preliminary discussions regarding a possible acquisition by Steel Excel Inc. of BNS. BNS has appointed a special committee of its independent directors to consider the transaction on behalf of its unaffiliated stockholders. Steel Excel Inc. has appointed a special committee of independent directors to consider and negotiate the transaction. No assurances can be given that an agreement between the parties can be reached or, if an agreement is reached, that any such transaction will be completed.
Sales
For the period February 2, 2011 through December 31, 2011, Sun Well generated $32,984 of revenue from approximately 62 different customers. Sun Well’s top customers are among the largest E&P operators in the Bakken shale formation. Sun Well’s three largest customers accounted for approximately 59% of Sun Well’s revenue for 2011.
Government Regulation
Sun Well operates under the jurisdiction of a number of regulatory bodies that regulate worker safety standards, the handling of hazardous materials and the protection of the environment. Regulations concerning equipment certification create an ongoing need for regular maintenance which is incorporated into Sun Well’s daily operating procedures. The oil and gas industry is subject to environmental regulation pursuant to local, state and federal legislation.
Competition
Sun Well’s competitors include some of the largest energy service companies in the United States. In addition, Sun Well competes with smaller, independent service providers.
Employees
As of December 31, 2011, Sun Well had 129 employees.
DGT Holdings Corp.
Our Ownership Interest
We have an ownership interest of approximately 51.5% as of March 16, 2012 in DGT Holdings Corp. (OTC: DGTC.OB), a New York corporation (“DGT”). Prior to July 5, 2011, we had an ownership interest of approximately 46.1% in DGT. On July 5, 2011, our ownership interest in DGT increased to 51.1%, and as a result, DGT became a controlled subsidiary of SPH and is consolidated from that date. Two of our representatives serve on DGT’s five-member board of directors, one of which serves as DGT’s President and Chief Executive Officer. Another of our representatives serves as DGT’s Chief Financial Officer.
Description of Business
DGT operates through its subsidiary, RFI Corporation (“RFI”), which comprises DGT’s Power Conversion Group. For its fiscal year ended July 30, 2011, RFI generated revenue of $10,783. In November 2011, DGT sold its subsidiary, Villa Sistemi Medicali S.p.A. (“Villa”), which comprised its Medical Systems Group division, which accounted for approximately 84% of DGT’s total consolidated revenues for the year ended July 30, 2011. As a result, the operations of Villa are reflected as discontinued operations in our consolidated financial statements for the period from July 5, 2011.
RFI designs, manufactures, markets and sells high voltage precision components and sub-assemblies and electronic noise suppression components for a variety of applications. These products are utilized by OEMs who build systems that are used in a broad range of markets. RFI’s products are sold under the following industry brands: RFI, Filtron, Sprague and Stanley.
Noise suppression filters and components are used to help isolate and reduce the electromagnetic interference (commonly referred to as “noise”) among the different components in a system sharing the same power source. Examples of systems that use RFI’s noise suppression products include aviation electronics, mobile and land-based telecommunication systems and missile guidance systems.
RFI also provides subsystems and components which are used in the manufacture of medical electronics, military and industrial applications in the following markets: aerospace; defense and homeland security; telecommunications; industrial/commercial and medical.
Marketing and Distribution
DGT markets its Power Conversion Group products through in-house sales personnel, independent sales representatives in the U.S., and international agents in Europe, Asia, the Middle East, Canada and Australia. DGT’s sales representatives are compensated primarily on a commission basis and the international agents are compensated either on a commission basis or act as independent distributors. DGT’s marketing efforts emphasize its ability to custom engineer products to optimal performance specifications. DGT emphasizes team selling where its sales representatives, engineers and management personnel all work together to market its products. DGT also markets its products through catalogs and trade journals and participation in industry shows.
Raw Materials and Principal Suppliers
DGT in most cases uses two or more alternative sources of supply for each of its raw materials, which consist primarily of electronic components and subassemblies, metal enclosures for its products and certain other materials. In certain instances, however, DGT will use a single source of supply when directed by a customer or by need. In order to ensure the consistent quality of its products, DGT follows strict supplier evaluation and qualification procedures, and where possible, enters into strategic relationships with its suppliers to assure a continuing supply of high quality critical components.
Trademarks and Patents
The majority of DGT’s products are based on technology that is not protected by patent or other rights. Certain of DGT’s products and brand names are protected by trademarks, both in the U.S. and internationally. Because DGT does not have patent rights in its products, its technology may not preclude or inhibit competitors from producing products that have identical performance as DGT’s products. DGT’s future success is dependent primarily on the technological expertise and management abilities of its employees and the strength of its relationship with its worldwide dealer network.
Government Regulation
DGT is subject to various U.S. government guidelines and regulations relating to the qualification of its products for inclusion in government qualified product lists in order to be eligible to receive purchase orders from a government agency or for inclusion of a product in a system which will ultimately be used by a governmental agency. DGT has had many years of experience in designing, testing and qualifying its products for sale to governmental agencies. Certain government contracts are subject to cancellation rights at the government’s election. DGT has experienced no material termination of any government contract and is not aware of any pending terminations of government contracts.
Product Development
DGT has a well developed engineering and technical staff in its Power Conversion Group. DGT’s technical and scientific employees are generally employed in the engineering departments at its RFI business unit, and split their time, depending on business mix and their own technical background, between supporting existing production and development and research efforts for new product variations or new customer specifications.
Competition
DGT’s Power Conversion Group competes with several small, privately owned suppliers of electronic systems and components. From DGT’s perspective, competition is primarily based on each company’s design, service and technical capabilities, and secondarily on price.
The markets for DGT’s Power Conversion Group’s products are subject to limited technological changes and gradually evolving industry requirements and standards. DGT believes that these trends will continue into the foreseeable future.
Some of DGT’s current and potential competitors may have substantially greater financial, marketing and other resources than DGT. As a result, they may be able to adapt more quickly to new or emerging technologies and changes in customer requirements, or to devote greater resources to the promotion and sale of their products than DGT can. Competition could increase if new companies enter the market or if existing competitors expand their product lines or intensify efforts within existing product lines. In addition, certain competing products may have other advantages which may limit DGT’s market. There can be no assurance that continuing improvements in current or new competing products will not make them technically equivalent or superior to DGT’s products in addition to providing cost or other advantages. There can be no assurance that DGT’s current products, products under development or ability to introduce new products will enable DGT to compete effectively.
Employees
As of December 31, 2011, DGT had 89 employees.
SPH Services, Inc.
Our Ownership Interest
SPH Services, Inc. (“SPH Services”) is our wholly-owned subsidiary. Three of our representatives serve as members, including as the Chairman, of the board of directors of SPH Services. These representatives also serve as SPH Services’ Chief Executive Officer, President, Secretary, Chief Financial Officer and Treasurer.
Description of Business
SPH Services is a newly-formed subsidiary of SPH, which commenced operations on January 1, 2012, that was created to consolidate the executive and corporate functions of SPH and certain of our affiliates, including SP Corporate and Steel Partners LLC, to provide such services, including, without limitation, legal, tax, accounting, treasury, consulting, auditing, administration, compliance, environmental health and safety, human resources, marketing, investor relations and other similar services, to other companies. In connection with the formation of SPH Services, we acquired SP Corporate and Steel Partners LLC, as well as certain assets from HNH, on January 1, 2012. Prior to our acquisition of Steel Partners LLC, our former manager, Steel Partners LLC transferred certain assets, including its interest in our management agreement, to SP General Services LLC.
SPH Services operates through its wholly owned subsidiaries, SP Corporate and Steel Partners LLC. SP Corporate has management services agreements with HNH, BNS, CoSine (as defined below), DGT, NOVT Corporation (“NOVT”), Ore Holdings, Inc., Steel Excel (as defined below) and WebBank.
By consolidating corporate overhead and back office functions, SPH believes it will achieve cost savings over time for its affiliated companies while delivering more efficient and effective services. As a result of the synergies associated with SP Corporate's specialization and capabilities across a broad range of corporate and executive functions that are provided to SPH and other companies, SP Corporate believes that it will be able to create high value business partnerships by delivering higher quality services and more efficient professional transaction processing which will result in significant cost savings that can be achieved through standardization, clear processes and procedures, the elimination of non-value adding activities and economies of scale.
Employees
As of March 7, 2012, SPH Services had 60 employees.
WebBank
Our Ownership Interest
SPH’s wholly owned subsidiary, WebFinancial Holding Corporation conducts financial operations through its wholly-owned subsidiary, WebBank (“WebBank”). One of our representatives serves as the Chairman of the board of directors of WebBank.
Description of Business
WebBank is a Utah chartered industrial bank subject to the regulation, examination, and supervision of the Federal Deposit Insurance Corporation (“FDIC”) and the State of Utah Department of Financial Institutions (“UDFI”). WebBank is not considered a “bank” for Bank Holding Company Act purposes and, as such, SPH is not regulated as a bank holding company. WebBank, whose deposits are insured by the FDIC, generates commercial, real estate, government guaranteed and consumer loans.
WebBank continues to evaluate its different business lines and consider various alternatives to maximize the aggregate value of its businesses and increase value, including seeking acquisitions and/or merger transactions, as well as product line extensions, additions and/or divestitures.
Sales
WebBank generates revenue through a combination of interest income and non-interest income. Interest income is primarily derived from interest and origination fees earned on loans, factored receivables and investments. Non-interest income is primarily derived from strategic partner fee income and loan servicing fees. For the years ended December 31, 2011 and 2010, WebBank generated approximately $14,842 and $10,803 in revenue, respectively. For the years ended December 31, 2011 and 2010, two contractual lending programs accounted for 58% and 54%, respectively, of WebBank’s total revenue.
Government Regulation
WebBank is subject to various regulatory capital requirements administered by the FDIC. Failure to meet minimum capital requirements can initiate certain actions by regulators that, if undertaken, could have a direct material adverse effect on WebBank’s financial statements. Under capital adequacy guidelines and the regulatory framework for prompt corrective action, WebBank must meet specific capital guidelines that involve quantitative measures of WebBank’s assets, liabilities, and certain off-balance sheet items as calculated under regulatory accounting practices. WebBank’s capital amounts and classification are also subject to qualitative judgments by the regulators about components, risk weightings, and other factors.
Competition
WebBank competes with a broad range of local and regional banks and finance companies across its various lines of business.
Employees
As of December 31, 2011, WebBank had 30 employees.
Associated Companies
SL Industries, Inc.
We have an ownership interest of approximately 21.7% as of March 16, 2012 in SL Industries, Inc. (AMEX:SLI), a New Jersey corporation (“SLI”). Two of our representatives serve on SLI’s six-member board of directors, one of whom serves as Chairman. SLI designs, manufactures and markets power electronics, motion control, power protection, power quality electromagnetic and specialized communication equipment. SLI’s products are used in a variety of medical, commercial and military aerospace, computer, datacom, industrial, telecom, transportation, utility, rail and highway equipment applications.
Steel Excel Inc.
We have an ownership interest of approximately 40.3% as of March 16, 2012 in Steel Excel Inc., a Delaware corporation formerly known as ADPT Corporation (“Steel Excel”) (OTC: SXCL.PK). Three of our representatives serve on Steel Excel’s six-member board of directors, one of whom serves as Chairman and another of whom serves as the Chief Executive Officer. One of our representatives also serves as Chief Financial Officer. Steel Excel is primarily focused on capital redeployment and identification of new business operations in which it can utilize its existing working capital and maximize the use of its net tax operating losses (“NOLs”) in the future. The identification of new business operations includes, but is not limited to, the oilfield servicing, sports, training, education, entertainment, and lifestyle businesses. On December 8, 2011, Steel Excel acquired the business and assets of Rogue Pressure Services, LLC, a Wyoming limited liability company (“Rogue”). The purchase price for Rogue was approximately $29 million, which was paid in cash, with the sellers receiving the opportunity to earn additional consideration based upon Rogue’s achievement of certain performance levels pursuant to an earn-out. This acquisition marked the launch of Steel Excel’s new strategy to focus a portion of its acquisition efforts on new opportunities in the United States oilfield service industry presented by technological advances in horizontal drilling and hydraulic fracturing.
On February 9, 2012, Steel Excel acquired the business and assets of Eagle Well Services, Inc., a leader in the oilfield service industry serving customers in the Bakken based in North Dakota and Montana. The purchase price of this acquisition was $48.1 million in cash.
CoSine Communications, Inc.
We have an ownership interest of approximately 46.8% as of March 16, 2012 in CoSine Communications, Inc. (OTC: COSN.PK), a Delaware corporation (“CoSine”). Two of our representatives serve on CoSine’s four-member board of directors, one of whom serves as the Chief Executive Officer and Chief Financial Officer. CoSine is currently in the business of seeking to acquire one or more business operations.
Other Core Companies
API Group PLC
We have an ownership interest of approximately 32.4% as of March 16, 2012 in API Group PLC (API. LN), an English corporation (“API”). One of our representatives serves on API’s six-member board of directors. API is a leading manufacturer of specialized materials for packaging premium branded goods. The main end use markets for API’s products are in premium, fast-moving consumer goods such as alcoholic drinks, perfumery, cosmetics, healthcare, specialty food and tobacco. These sectors use high impact finishes and effects on labeling and packaging to reinforce and authenticate brand image. Effective December 31, 2011, we reclassified our investment in API to Investments at fair value on our Consolidated Balance Sheet. Previously we classified it as an associated company. For additional information, see Note 5- “Associated Companies” to the SPH financial statements included elsewhere in this Form 10-K.
On February 8, 2012, the Company sent a letter to API expressing its belief that the market price of API does not reflect its intrinsic value and that this value will only be realized through a sale of API.
JPS Industries, Inc.
We have an ownership interest of approximately 39.3% as of March 16, 2012 in JPS Industries, Inc. (OTC: JPST.PK), a Delaware corporation (“JPS”). JPS Industries, Inc. is a major U.S. manufacturer of extruded urethanes, ethylene vinyl acetates and mechanically formed glass and aramid substrate materials for specialty applications in a wide expanse of markets requiring highly engineered components. JPS’s products are used in a wide range of applications including: printed electronic circuit boards; advanced composite materials; civilian and military aerospace components; filtration and insulation products; specialty commercial construction substrates; high performance glass laminates for security and transportation applications; photovoltaic solar modules; paint protection films; plasma display screens; medical, automotive and industrial components; and soft body armor for civilian and military applications. Headquartered in Greenville, South Carolina, JPS operates four manufacturing locations in Anderson and Slater, South Carolina; Statesville, North Carolina; and Easthampton, Massachusetts. Effective December 31, 2011, we reclassified our investment in JPS to an available for sale security. Previously we classified it as an associated company. For additional information, see Note 5- “Associated Companies” to the SPH financial statements included elsewhere in this Form 10-K.
GenCorp Inc.
We have an ownership interest of approximately 6.9% as of March 16, 2012 in GenCorp Inc. (NYSE: GY), an Ohio corporation (“GenCorp”). One of our representatives serves on GenCorp’s eight-member board of directors. GenCorp’s continuing operations are comprised of two segments, Aerospace and Defense and Real Estate. GenCorp’s Aerospace and Defense segment includes the operations of Aerojet-General Corporation, which develops and manufactures propulsion systems for defense and space applications, armament systems for precision tactical weapon systems and munitions applications. GenCorp’s Real Estate segment includes the entitlement, sale and leasing of its excess real estate.
Barbican Group Holdings Limited
We have an economic interest, direct and indirect, of approximately 19.6% as of March 16, 2012 in Barbican Group Holdings Limited and its subsidiaries (“Barbican”). In addition, one of our affiliates shares 50/50 control over Barbican with another investor. Two of our representatives serve on Barbican’s seven-member board of directors. Barbican is a privately-held company incorporated in Guernsey, which underwrites property and casualty insurance and reinsurance through its subsidiaries and its Lloyds of London syndicate.
Fox & Hound Restaurant Group
We had an indirect ownership interest of approximately 21.3% as of December 31, 2011 in Fox & Hound Restaurant Group, a Delaware corporation (“Fox & Hound”). Two of our representatives serve on Fox & Hound’s four-member board of directors. Fox & Hound is a privately held owner and operator of a chain of approximately 130 company-owned and 14 franchised social destination casual dining and entertainment based restaurants in 32 states. On March 19, 2012, we invested $10,923 as part of a recapitalization of Fox & Hound which involved the issuance by Fox & Hound of new common equity in conjunction with a long-term refinancing of Fox & Hound
’
s debt. As a result of the transaction, as of March 19, 2012 we have an indirect ownership interest of 43.6% in Fox & Hound.
Our History
SPH, formerly known as WebFinancial L.P., is a limited partnership formed in the State of Delaware on December 16, 2008. SPH is the successor through a merger on December 31, 2008 with WebFinancial Corporation (formerly Rose’s Holdings, Inc.), a Delaware corporation that was incorporated in 1997 to act as a holding company for Rose’s Stores, Inc., an operator of general merchandise discount stores founded in 1927. WebFinancial Corporation (“Webfinancial”) completed the sale of its store operations in 1997 and acquired WebBank in 1998.
Effective as of July 15, 2009, we completed an exchange transaction in which we acquired the limited partnership interest of Steel Partners II, L.P. (“SPII”) pursuant to which we acquired net assets of $454.3 million that were held by SPII, consisting of holdings in a variety of companies, in exchange for our common units which were distributed to certain former indirect investors in SPII (the “Exchange Transaction”). As a result, we became a global diversified holding company, with partners’ capital of $367.1 million as of July 15, 2009, which has increased to $415.8 million as of December 31, 2011. Since July 15, 2009, we have concentrated our holdings into a select number of businesses. Certain of our privately held ownership interests, such as our indirect interest in Barbican and all of our indirect interest in Fox & Hound, are directly held by SPII Liquidating Series Trust (“SPII Liquidating Trust”), a Delaware statutory trust that SPII formed prior to the completion of the Exchange Transaction to hold certain assets previously held by SPII.
In connection with the Exchange Transaction, we agreed to distribute to the holders of our common units a total of up to $87.5 million (the “Target Distribution”), subject to certain limitations, during the period from July 16, 2009 to April 30, 2011, or the “Final Distribution Date.” On April 1, 2010, we distributed to our unitholders of record as of March 26, 2010 approximately $54.4 million or $1.95 per common unit. On April 6, 2011, we distributed to our unitholders of record as of March 25, 2011 approximately $33.1 million, or $1.18 per common unit, representing the final required distribution in full satisfaction of the Target Distribution. We may, at our option, make further distributions to the unitholders although we currently have no plan to make any distributions in excess of the Target Distribution.
Our Structure
SPH is managed by SP General Services LLC (the “Manager”), pursuant to the terms of an amended and restated management agreement, or the “Management Agreement” discussed in further detail in the section entitled “Executive Compensation - The Management Agreement.” From its founding in 1990, the Manager and its affiliates have created significant increases in value for investors in the entities it has managed, including SPH and SPII. Since our day-to-day business affairs are managed by our Manager, we do not have any employees.
Our wholly-owned subsidiary, Steel Partners Holdings GP Inc., formerly known as Web LLC and Steel Partners Holdings GP LLC, or the “General Partner”, is our general partner. The General Partner converted from a limited liability company to a corporation on September 21, 2010. The General Partner has a board of directors, or the “Board of Directors.” The Board of Directors is currently comprised of seven members, five of whom are elected annually by our unitholders and two of whom are appointed by the Manager. Warren G. Lichtenstein, the Chairman and Chief Executive Officer of our Manager, serves as the Chairman of the Board of Directors.
Our Common Units
Our common units are quoted on the over-the-counter market on the Pink Sheets under the symbol SPNHU.PK. We intend to have our common units listed on a national securities exchange, depending on market conditions and meeting any applicable listing requirements.
Other Information
Our business address is 590 Madison Avenue, 32
nd
Floor, New York, New York 10022, and our telephone number is (212) 520-2300. Our website is www.steelpartners.com. The information contained in, or that can be accessed through, the website is not part of this Form 10-K.
This Form 10-K, quarterly reports on Form 10-Q, current reports on Form 8-K, and all amendments to those reports, are available to you free of charge through our website as soon as reasonably practicable after those materials have been electronically filed with, or furnished to, the SEC.
Item
1A.
Risk Factors
Our business is subject to a number of risks. You should carefully consider the following risk factors, together with all of the other information included or incorporated by reference in this report, before you decide whether to purchase our common units. The factors listed below represent certain important factors which we believe could cause such results to differ. These factors are not intended to represent a complete list of the general or specific risks that may affect us. It should be recognized that other risks may be significant, presently or in the future, and the risks set forth below may affect us to a greater extent than indicated. If any of the following risks occur, our business, financial condition and results of operations could be materially adversely affected. In such case, the trading price of our common units could decline, and you may lose all or part of your investment.
Risks Related to Our Structure
Our consolidated financial statements will not include meaningful comparisons to prior years.
The Exchange Transaction, pursuant to which SPII became a wholly-owned subsidiary of SPH on July 15, 2009, is accounted for as a transaction between entities under common control and as such SPII’s accounts are consolidated with SPH for all periods presented. SPH’s operations prior to July 16, 2009 and operations related to the assets acquired as a result of the acquisition of SPII as of July 15, 2009 are presented in the consolidated financial statements as “Diversified Industrial, Financial Services and Other”. The Company accounts for the consolidation of SPII in the consolidated financial statements as “Investment Operations” for all periods presented through July 15, 2009. Due to differences between the operating company accounting policies of Diversified Industrial, Financial Services and Other operations and the accounting policies of Investment Operations, our consolidated financial statements will not include meaningful comparisons to prior years.
Being classified as an “investment company” would subject us to numerous restrictions and requirements that would be inconsistent with the manner in which we operate our business, and could have a material adverse effect on our business and operations.
We plan to continue to conduct our business and operations in such a manner as not to be deemed an investment company under the Investment Company Act of 1940, as amended (the “Investment Company Act”). An entity will generally be deemed to be an “investment company” for purposes of the Investment Company Act if: (a) it is or holds itself out as being engaged primarily, or proposes to engage primarily, in the business of investing, reinvesting or trading in securities; or (b) absent an applicable exemption, it owns or proposes to acquire investment securities having a value exceeding 40% of the value of its total assets (exclusive of U.S. government securities and cash items) on an unconsolidated basis (the “40% Test”). Since we operate as a diversified holding company engaged in a variety of operating businesses through our subsidiaries and controlled companies, we do not believe that we are primarily engaged in an investment company type business, nor do we propose to primarily engage in such a business. Our intent to operate in this manner may have a material adverse effect on us, as it may limit our ability to make certain investments or take certain actions or compel us to divest certain holdings or to take or forego certain actions that could otherwise be beneficial to us.
As a result of the Exchange Transaction, on July 14, 2009, we could no longer definitively conclude that we passed the 40% Test or were able to rely on any exception from the definition of an investment company. Since then, we have taken reasonable actions to alter our holdings so that we can comply with the 40% Test or a relevant exception as soon as reasonably practicable. These actions have included liquidating certain of our assets and acquiring additional interests in existing or new subsidiaries or controlled companies. Due to market conditions and other factors beyond our reasonable control, we were unable to complete all actions necessary to comply with the 40% Test or a relevant exception within the one-year grace period permitted under the Investment Company Act. As a result, on July 8, 2010, prior to the conclusion of the grace period, we filed an application with the SEC for an extended temporary exemption from the Investment Company Act, which application is still pending.
If we were deemed to be an investment company under the Investment Company Act, we could suffer adverse consequences, including a need to further adjust our business strategy and assets, including by divesting certain desirable assets immediately to fall outside of the definition or within an exemption, to register as an investment company or to cease operations.
Investment companies are subject to extensive, restrictive and potentially adverse regulations relating to, among other things, operating methods, management, capital structure, dividends and transactions with affiliates. If we were required to register as an investment company under the Investment Company Act, we would be subject to numerous restrictions and requirements that would be inconsistent with the manner in which we operate our business and which may have a material adverse effect on our operations, financial conditions and prospects, including restrictions on our capital structure and restrictions on our ability to transact business with affiliates, including our operating subsidiaries and controlled companies.
Our revenue, net income and cash flow are highly variable, which may prevent us from achieving steady earnings growth on a quarterly basis and may cause the price of the common units to be volatile.
Our revenue, net income and cash flow are highly variable. We may experience fluctuations in our results from quarter to quarter due to a number of factors, including changes in the values of our various operations, changes in our operating expenses, changes in asset values, changes in the competitive environment, and general economic and market conditions. Such fluctuations may lead to volatility in the trading price of the common units and cause our results for a particular period not to be indicative of our future performance. It may be difficult for us to achieve steady growth in net income and cash flow on a quarterly basis, which could lead to volatility in the price of the common units.
As our revenue, net income and cash flow are highly variable from period to period, we do not expect to provide any guidance. The lack of guidance may affect the expectations of analysts and could cause increased volatility in the price of the common units. Many of our operating companies are small cap and micro cap companies that are thinly traded and may trade at prices that do not reflect their intrinsic value. Such prices may affect the price at which the common units trade. In addition, some of our holdings are private companies for which there is no trading market.
The requirements of being a public entity and sustaining our growth may result in increased costs over prior years.
Effective as of February 13, 2012, we became subject to the reporting requirements of the Exchange Act. Consequently, we are required to file annual, quarterly and current reports with respect to our business and financial condition. In addition, sustained growth may require us to commit additional management, operational and financial resources to identifying new professionals to join us and to maintain adequate operational and financial systems to support expansion. These requirements may divert management’s attention. We may incur significant additional annual expenses related to these steps, including additional directors’ and officers’ liability insurance, Exchange Act reporting costs, transfer agent fees, salaries and expenses for additional accounting, legal and administrative personnel.
Once we are required to comply with the evaluations of controls under Section 404 of the Sarbanes-Oxley Act, failure to comply with these requirements may have a material adverse effect on our results of operations.
We are required to comply with the Sarbanes-Oxley Act of 2002 (“Sarbanes-Oxley Act”), and we will be required to furnish a report by our management on internal control over financial reporting. This report must contain, among other matters, an assessment of the effectiveness of our internal control over financial reporting and disclosure of any material weaknesses. In addition, the report must contain a statement that our auditors have issued an attestation report on management’s assessment of such internal control over financial reporting. We expect that management will be required to provide a report on our internal control over financial reporting beginning with our annual report for the fiscal year ending December 31, 2012 and that we will be required to provide an auditor’s attestation on management’s assessment of internal controls beginning with our annual report for the fiscal year ending December 31, 2013.
If we fail to maintain an effective system of internal controls over financial reporting, we might be subject to sanctions or investigation by regulatory authorities such as the SEC. A material weakness in our internal control over financial reporting could adversely impact our ability to provide timely and accurate financial information and may cause investors to lose confidence in our financial statements and our common unit price may be adversely affected. If we fail to remedy any material weakness, our financial statements may be inaccurate, we may not have access to the capital markets, and our common unit price may be adversely affected. Further, if our auditors fail to issue an opinion that our internal controls over financial reporting are effective, this may trigger a negative reaction in the financial markets. We may also be required to incur costs to improve our internal control system and hire additional personnel.
The unitholders have limited recourse to maintain actions against the General Partner, the Board of Directors, our officers and the Manager.
The Limited Partnership Agreement of SPH, or the “Partnership Agreement,” contains broad indemnification and exculpation provisions that limit the right of a unitholder to maintain an action against the General Partner, the Board of Directors, our officers and the Manager, or to recover losses or costs incurred by us as a result of their actions or failures to act.
If we are dissolved, unitholders may not realize the value that may otherwise be realized over time.
We may be dissolved at the election of the Board of Directors by a majority of the directors. If we are dissolved, unitholders may not realize the value that may otherwise be realized over time.
We require the financial results of certain of the companies in which we have interests in order to report our own financial results. As such, our ability to timely file financial statements will depend on the cooperation of those companies. There can be no assurance that those companies will produce financial results in a timely manner. Our failure to timely file financial statements may have an adverse effect on our business and operations.
Our Partnership Agreement contains certain limitations on the voting rights of unitholders.
Our Partnership Agreement contains specific provisions that are intended to comply with regulatory limitations on the ownership of our securities as a result of our ownership of WebBank. Under the Partnership Agreement, a person or group that acquires beneficial ownership of 10% or more of the common units without the prior approval of the Board of Directors may lose voting rights with respect to all of its common units in excess of 9.9%. Please see “Material Provisions of Steel Partners Holdings L.P. Partnership Agreement -- Limitations on Voting Rights.”
We may have conflicts of interest with the minority shareholders of our businesses and decisions may need to be made by disinterested directors, without the participation of directors or officers associated with the Manager and SPH Services, which may be different from the decisions we would make. Companies in which we have interests but we do not control may make decisions that do not serve our interests and those of our unitholders.
The boards of directors and officers of our respective businesses, including directors and officers associated with our Manager and SPH Services, have fiduciary duties to their shareholders. As a result, they may make decisions that are in the best interests of their shareholders generally but which are not necessarily in our best interest or that of our unitholders. In dealings with us, the directors and officers of our businesses may have conflicts of interest and decisions may have to be made without their participation. Such decisions may be different from the decisions we would make and may not be in the best interests of our common unitholders, which may have an adverse effect on our business and results of operations.
Our assets include interests in companies that we do not control. The majority stakeholders or the management of such companies may make decisions we do not agree with or which do not serve our interests. If any of the foregoing were to occur, the values of interests held by us may decrease and our financial condition, results of operations and cash flow may suffer as a result.
There are certain interlocking relationships among us and certain affiliates of Warren G. Lichtenstein, our Chairman and Chief Executive Officer, which may present potential conflicts of interest.
Warren G. Lichtenstein, our Chairman and Chief Executive Officer and a substantial unitholder, is the Chief Executive Officer of our Manager. As of March 16, 2012, Mr. Lichtenstein beneficially owned approximately 7.1% of our outstanding common units. Mr. Lichtenstein also controls the Manager, and WGL Capital Corp. (“WGL”), an affiliate of the Manager to which certain deferred fees are owed, and is the managing member of Steel Partners II GP LLC (“SPIIGP”), which serves as the liquidating trustee of SPII Liquidating Trust. We have entered into transactions and/or agreements with each of these entities. In addition, through WGL, Mr. Lichtenstein can increase his beneficial ownership if WGL elects to receive its payment of certain deferred fees owed to it in the form of our common units, which payment may become immediately due and payable upon certain termination events as specified in the deferred fee agreement. There can be no assurance that such entities will not have interests in conflict with our own. For more information regarding these relationships and other relationships between us and related parties, see “Certain Relationships and Related Transactions.”
We have engaged, and in the future may engage, in transactions with our affiliates and may choose to purchase additional securities of entities that we control, and we could have to expend substantial resources in resolving any challenges to those transactions.
Generally, Delaware law, under which we are governed, requires that any transactions between us and any of our affiliates be on terms that, when taken as a whole, are substantially as favorable to us as those then reasonably obtainable from a person who is not an affiliate in an arms-length transaction. We believe that the terms of the agreements we have entered into with our affiliates satisfy the requirements of Delaware law, but in the event that one or more parties challenges the fairness of such terms we could have to expend substantial resources in resolving the challenge and we can make no guarantees as to the result. Similarly, we currently own significant equity positions in a number of companies. We may choose in the future to purchase additional securities of such companies. We intend to engage in any such transactions on terms that are fair to all shareholders and are the result of arms-length negotiations. However, one or more minority shareholders may choose to challenge the fairness of such purchases by a controlling shareholder. Defending against such potential challenges may cause us to expend substantial resources in resolving the challenge and we can make no guarantees as to the result.
Certain members of our management team may be involved in other business activities that may involve conflicts of interest.
Certain individual members of our management team may, from time to time, be involved in the management of other businesses, including those owned or controlled by our Manager and its affiliates. Accordingly, these individuals may focus a portion of their time and attention on managing these other businesses. Conflicts may arise in the future between our interests and the interests of the other entities and business activities in which such individuals are involved.
We, as a diversified holding company, may have substantial limitations on our ability to sell interests in the underlying operating companies.
We accumulate significant positions in underlying operating companies and have a significant role in the management of various underlying operating companies. As a result, we may face significant legal and market restrictions on selling our interests in the underlying operating companies. For example, employees of the Manager and SPH Services may also serve as managers or members of the board of directors of the underlying operating companies, and, thus, may receive material and confidential information concerning the operating companies that would preclude us, under federal securities laws, from trading securities of the relevant operating company. Some privately held businesses may be subject to shareholders agreements which may limit our ability to sell our interests in such companies. In addition, we may be limited in our ability to sell securities in an underlying operating company in light of the size of our ownership interest and the absence of liquidity in the market to absorb our ownership interest, or, alternatively, may be required to sell our ownership interest at a discounted and unfavorable price.
We hold and expect to continue to hold illiquid assets with a limited market for resale and, therefore, may be unable to dispose of such assets at a time and at a price that we deem desirable.
We may hold assets that have a limited market for resale. We may be unable to dispose of such assets at a time and at a price that we deem desirable. In the event that we desire to sell such assets on an expedited basis, we may not be able to obtain a price for such assets that is equal to or greater than what we could receive if there was a public market for such assets.
Risks Related to Our Business
We may not be able to fund future acquisitions of new businesses or raise funds for operating expenses due to the lack of availability of debt or equity financing on acceptable terms, which could materially adversely impact our financial condition, business and results of operations.
In order to make future acquisitions and fund operations, we may need to raise capital primarily through debt or equity financings. Since the timing and size of acquisitions or the need for additional capital cannot be readily predicted, we may need to obtain funding on short notice to benefit fully from attractive acquisition opportunities or to address business needs. Such funding may not be available on acceptable terms, or at all. In addition, the level of our indebtedness may impact our ability to borrow. Also, depending on market conditions and investor demand for the common units, we may not be able to raise capital by selling additional common units at prices that we consider to be in our interest. These risks may materially adversely affect our ability to pursue our acquisition strategy successfully and materially adversely affect our financial condition, business and results of operations.
We conduct operations or own interests in companies with operations outside of the U.S., which may expose us to additional risks not typically associated with companies that operate solely in the U.S.
We have operations or own interests in securities of companies with operations located outside the U.S. and they present certain risks not typically associated with U.S. operations, including risks relating to currency exchange matters, less developed or efficient financial markets than in the U.S., absence of uniform accounting, auditing and financial reporting standards, differences in the legal and regulatory environment, different publicly available information in respect of companies in non-U.S. markets, economic and political risks, and possible imposition of non-U.S. taxes. There can be no assurance that adverse developments with respect to such risks will not adversely affect our assets that are held in certain countries or the returns from these assets.
If certain of our operating subsidiaries are unable to access funds generated by their respective subsidiaries, such operating subsidiaries may not be able to meet their financial obligations.
Because certain of our operating subsidiaries are holding companies that conduct operations through their subsidiaries, such operating subsidiaries depend on those entities for dividends, distributions and other payments to generate the funds necessary to meet their financial obligations. Certain of such operating subsidiaries may face restrictions on their ability to transfer cash to their parent company pursuant to the terms of any credit agreement to which they are a party. Failure by one of those subsidiaries to generate sufficient cash flow and meet the requirements of their respective credit facilities could have a material adverse effect on our business, financial condition and results of operations.
Our businesses are subject to unplanned business interruptions which may adversely affect our performance.
Operational interruptions and unplanned events at one or more of our businesses’ production facilities could cause substantial losses in production capacity and may expose our businesses to liability from claims by customers who have in turn had to delay their deliveries or reschedule their operations. Such interruptions may also harm our reputation or the reputation of our businesses, potentially resulting in a loss of business. To the extent these losses are not covered by insurance, our financial position, results of operations and cash flows may be adversely affected by such events.
Our businesses rely, and may rely, on their intellectual property and licenses to use others’ intellectual property, for competitive advantage. If our businesses are unable to protect their intellectual property, are unable to obtain or retain licenses to use others’ intellectual property, or if they infringe upon or are alleged to have infringed upon others’ intellectual property, it could have a material adverse effect on their financial condition, business and results of operations.
The success of each of our businesses depends in part on its, or licenses to use others’ brand names, proprietary technology and manufacturing techniques. These businesses rely on a combination of patents, trademarks, copyrights, trade secrets, confidentiality procedures and contractual provisions to protect their intellectual property rights. The steps they have taken to protect their intellectual property rights may not prevent third parties from using their intellectual property without their authorization or independently developing intellectual property that is similar. In addition, the laws of foreign countries may not protect our businesses’ intellectual property rights effectively. Stopping unauthorized use of proprietary information and intellectual property, and defending claims of unauthorized use of others’ proprietary information or intellectual property, may be difficult, time-consuming and costly and could subject our businesses to significant liability for damages and invalidate their property rights. Such unauthorized use could reduce or eliminate any competitive advantage our businesses have developed, cause them to lose sales or otherwise harm their business.
The success of our businesses, including the operations and research and development of some of our services and technology, depends on the collective experience of our technical, management and sales employees. If these employees were to leave our businesses, our operations and our ability to compete effectively could be materially adversely impacted.
Our future success depends upon the continued service of our technical, management and sales personnel who have developed and continue to develop our services, technology and products. We compete with many other entities for skilled management and employees. If any of these employees leave our businesses, the loss of their knowledge and experience may materially adversely affect our operations and research and development. If we are not able to replace our technical, management and sales personnel with new employees with comparable experience or attract additional individuals, we may not keep up with innovations in the industries in which we operate. As a result, our ability to continue to compete effectively and our operations may be materially adversely affected.
If our businesses are unable to continue the technological innovation and successful commercial introduction of new products and services, their financial condition, business and results of operations could be materially adversely affected.
The industries in which our businesses operate experience periodic technological changes and ongoing product improvements. Their results of operations depend significantly on the development of commercially viable new products, product upgrades and their ability to integrate new technologies. Our future growth will depend on their ability to gauge the direction of, and effectively respond to, the technological progress in key end-use markets and upon their ability to successfully develop new generations of products. Our businesses must make ongoing capital investments and may need to seek better educated and trained workers, who may not be available in sufficient numbers. Failure to effectively respond to technological developments may result in reduced sales and sunk developmental costs.
Potential supply constraints and significant price fluctuations of electricity, natural gas and other petroleum based products could adversely affect our businesses.
In our
production and distribution processes, we consume significant amounts of electricity, natural gas, fuel and other petroleum-based commodities. The availability and pricing of these commodities are subject to market forces beyond our control. Variability in the supply and prices of these commodities could materially affect our operating results from period to period and rising costs could erode our profitability.
We do not have long-term contracts with all of our customers and clients, the loss of which could materially adversely affect our financial condition, business and results of operations.
Our businesses are based primarily upon individual orders and sales with our customers and clients and not long-term supply contracts. As such, our customers and clients could cease using services or buying products at any time and for any reason and we will have no recourse in the event a customer or client no longer wants to use our businesses’ services or purchase products from us. If a significant number of our customers or clients elect not to use such services or purchase products, it could materially adversely affect our financial condition, business and results of operations.
Our businesses are and may be subject to federal, state and foreign environmental laws and regulations that expose them to potential financial liability. Complying with applicable environmental laws requires significant resources, and if our businesses fail to comply, they could be subject to substantial liability.
Some of the facilities and operations of our businesses are, and may be, subject to a variety of federal, state and foreign environmental laws and regulations, including laws and regulations pertaining to the handling, storage and transportation of raw materials, products and wastes, and hazardous materials and wastes, which require and will continue to require significant expenditures to remain in compliance with such laws and regulations. Any material violations of these laws can lead to substantial liability, revocations of discharge permits, fines or penalties, which could negatively impact our financial condition, business and results of operations.
Defects in the products provided by our businesses could result in financial or other damages to our customers, which could result in reduced demand for our businesses’ products and/or liability claims against our businesses.
Some of our businesses manufacture products to customer specifications that are highly complex and critical to customer operations. Defects in products could result in product liability suits, compensation for damages, or a reduction or cancellation of future purchases due to customer dissatisfaction. If these defects occur frequently, our reputation may be impaired. Any of these outcomes could negatively impact our financial condition, business and results of operations.
Some of our businesses are subject to certain risks associated with the movement of businesses offshore.
Some of our businesses are potentially at risk of losing business to competitors operating in lower cost countries. An additional risk is the movement offshore of some of our businesses’ customers, leading them to procure products or services from more closely located companies. Either of these factors could negatively impact our financial condition, business and results of operations.
Loss of key customers of some of our businesses could negatively impact our financial condition.
Some of our businesses have significant exposure to certain key customers, the loss of which could negatively impact our financial condition, business and results of operations.
Our business strategy includes acquisitions which entail numerous risks.
Our business strategy and the strategy of our businesses includes acquisitions and entails several risks, including the diversion of management’s attention from other business concerns and the need to finance such acquisitions with additional equity and/or debt. Any future acquisitions may also result in material changes in the composition of our assets and liabilities or the assets and liabilities of our businesses and if unsuccessful could reduce the value of our common units. In addition, once found, acquisitions entail further risks, including unanticipated costs and liabilities of the acquired businesses that could materially adversely affect our results of operations; difficulties in assimilating acquired businesses; negative effects on existing business relationships with suppliers and customers and losing key employees of the acquired businesses.
HNH sponsors a defined benefit pension plan which could subject it to substantial cash funding requirements in the future.
HNH’s ongoing operating cash flow requirements include funding the minimum requirements of its defined benefit pension plan (the “WHX Pension Plan”). HNH expects to have required minimum contributions to the WHX Pension Plan for 2012, 2013, 2014, 2015, 2016 and thereafter of $20.0 million, $19.4 million, $23.8 million, $19.5 million, $14.8 million, and $26.4 million, respectively. Such required future contributions are determined based upon assumptions regarding such matters as discount rates on future obligations, assumed rates of return on plan assets and legislative changes. Actual future pension costs and required funding obligations will be affected by changes in the factors and assumptions described in the previous sentence, as well as other changes such as any plan termination.
Difficult economic and market conditions may adversely affect our operations, which could materially reduce our revenue, cash flow and asset value, and adversely affect our financial condition.
We operate in a variety of competitive industries and market sectors, which are susceptible to economic downturns. Our operations and assets are materially affected by conditions in the financial markets and economic conditions throughout the world that are outside our control, such as interest rates, availability of credit, inflation rates, economic uncertainty, changes in laws, trade barriers, commodity prices, currency exchange rates and controls and national and international political circumstances. These factors may affect the level and volatility of securities prices and the liquidity and the value of our operations and assets, and we may not be able to or may choose not to manage our exposure to these market conditions.
Our operations’ revenues and assets could also be affected by a continued economic downturn. Our operations may also have difficulty expanding and be unable to meet our debt service and pension obligations or other expenses as they become due. In addition, during periods of adverse economic conditions, it may be more difficult and costly or impossible to obtain funding for our operations. Furthermore, such conditions could also increase the risk of default with respect to our operations that have significant debt.
Legislative and regulatory actions taken now or in the future to address the current liquidity and credit crisis in the financial industry may significantly affect our liquidity or financial condition.
On July 21, 2010, President Barack Obama signed the Dodd-Frank Act into law. The Dodd-Frank Act is intended primarily to overhaul the financial regulatory framework following the global financial crisis and will impact all financial institutions, including WebBank. The Dodd-Frank Act contains provisions that will, among other things, establish a Bureau of Consumer Financial Protection, establish a systemic risk regulator, consolidate certain federal bank regulators and impose increased corporate governance and executive compensation requirements. While many of the provisions in the Dodd-Frank Act are aimed at financial institutions significantly larger than ours, it will likely increase our regulatory compliance burden and may have a material adverse effect on us.
The Dodd-Frank Act also requires the Government Accountability Officer (“GAO”) to conduct a study, within 18 months of the enactment, of the various exemptions in the Bank Holding Company Act for certain types of depository institutions, including industrial banks such as WebBank. SPH is not regulated as a bank holding company as a result of this exemption. It is too early to say what impact, if any, the GAO study would have on the continued availability of this exemption.
In addition, the Dodd-Frank Act added a new Section 13 to the Bank Holding Company Act, the so-called “Volcker Rule,” which generally restricts certain banking entities, and their subsidiaries or affiliates, from engaging in proprietary trading activities and owning equity in or sponsoring any private equity or hedge fund. The Volcker Rule becomes effective July 21, 2012. The draft implementing regulations for the Volcker Rule were issued by various regulatory agencies on October 11 and 12, 2011. Under the proposed regulations, we (or our affiliates) may be restricted from engaging in proprietary trading, investing in third party hedge or private equity funds or sponsoring new funds unless we qualify for an exemption from the rule. We will not know the full impact of the Volcker Rule on our operations or financial condition until the final implementing regulations are adopted sometime in 2012.
Furthermore, effective July 21, 2011, all companies that directly or indirectly control an FDIC-insured bank are required to serve as a source of financial strength for such institution. As a result, SPH could be called upon by the FDIC to infuse additional capital into WebBank to the extent that WebBank fails to satisfy its capital requirements. Currently, WebBank meets or exceeds all such requirements.
Further, the U.S. Congress and state legislatures and federal and state regulatory authorities continually review banking laws, regulations and policies for possible changes. We cannot predict whether additional legislation will be enacted and, if enacted, the effect that it would have on our business, financial condition or results of operations.
Increased volatility in raw materials costs and availability may continue to reduce revenues and profitability in our diversified industrial businesses.
Certain of our Diversified Industrial operations are subject to risks associated with increased volatility in raw material prices and availability of key raw materials. If the price for raw materials continues to increase and our operations are not able to pass these price increases to their customers, or are unable to obtain key raw materials, our results of operations may be negatively impacted.
We and our businesses operate in highly competitive markets.
Many of our competitors and the competitors of our businesses are substantially larger and have considerably greater financial, technical and marketing resources than we do. Some competitors may have a lower cost of funds than we or our businesses do and access to financing sources that may not be available to us or our businesses. In addition, some of our competitors and the competitors of our businesses may have higher risk tolerances or different risk assessments, which could allow them to consider a wider variety of business opportunities than we or our businesses can.
Risks Related to Our Manager
We depend on Warren G. Lichtenstein, the Chairman and Chief Executive Officer of the Manager and Jack Howard, the President of the Manager, the loss of whose services could have a material adverse effect on our business, results and financial condition.
Our success depends on the efforts, skills, reputation and business contacts of Warren G. Lichtenstein, the Chairman and Chief Executive Officer of the Manager and Jack Howard, the President of the Manager. While the key members of the Manager have worked for the Manager and its affiliates for many years, our Manager does not have any employment agreements with any of the key members of its management team and their continued service is not guaranteed. The loss of the services of Mr. Lichtenstein or Mr. Howard could have a material adverse effect on our asset value, revenues, net income and cash flows and could harm our ability to maintain or grow our existing operations or pursue additional opportunities in the future.
Certain members of the Manager’s management team may be involved in other business activities that may involve conflicts of interest.
Certain individual members of the Manager’s management team are involved in the management of other businesses. Accordingly, these individuals may focus a portion of their time and attention on managing these other businesses. Conflicts may arise in the future between our interests and the interests of the other entities and business activities in which such individuals are involved.
The interests of our Manager may not be aligned with our interests or those of our unitholders.
Our Manager receives a quarterly Management Fee at a rate of 1.5% of total partner’s capital, payable on the first day of each quarter, subject to quarterly adjustment. Our Manager is entitled to receive a Management Fee regardless of our net income. In addition and as more fully described in “Management Agreement - Management Fees and Incentive Compensation”, our Manager was granted certain incentive units to receive Class B common units of SPH. The Manager may consider entering into or recommending riskier transactions that represent a potential higher reward in order for the Manager’s units to be profitable. Any such riskier investment decisions or recommendations, if unsuccessful, could result in losses to us and a decline in the value of the common units.
We cannot determine the amount of the Management Fee that will be paid over time with any certainty.
The Management Fee is calculated by reference in part to our total partner’s capital. Our total partner’s capital will be impacted by the performance of our businesses and other businesses we may acquire in the future, as well as the issuance of additional common units. Changes in our total partner’s capital and in the resulting Management Fee could be significant, resulting in a material adverse effect on our results of operations. In addition, if our performance declines, assuming our total partner’s capital, remains the same, the Management Fee will increase as a percentage of our net income.
Our Manager’s liability is limited under the Management Agreement, and we have agreed to indemnify our Manager against certain liabilities. Such indemnification may incentivize our Manager to take unnecessary risks with respect to actions for which it will be indemnified.
Under the Management Agreement, our Manager, its members, officers, employees, affiliates, agents and legal representatives are not liable for, and we have agreed to indemnify such persons from any loss or expense, including without limitations, any judgment, settlement, reasonable attorneys’ fees and other costs and expenses incurred in connection with the defense of any actual or threatened proceeding, other than losses resulting from willful misconduct or gross negligence in the performance of such indemnified person’s obligations and duties. Such indemnification may incentivize our Manager to take unnecessary risks with respect to actions for which it will be indemnified.
Risks Related to our Common Units
Our common units lack a significant trading market, and the value of the common units may be adversely affected by market volatility.
Our common units are quoted on the over-the-counter market on the
Pink Sheets. However, there is a limited trading market for our common units at this time. There is no assurance that an active trading market in our common units will develop, or if such a market develops, that it will be sustained. The Pink Sheets market is highly illiquid. As a result, an investor may find it more difficult to dispose of, or to obtain accurate quotations as to the market value of our common units or to obtain coverage for significant news events concerning us, and the common units could become substantially less attractive for margin loans, for investment by financial institutions, as consideration in future capital raising transactions or for other purposes. Even if we are listed on a national exchange and an active trading market develops, the market price and trading of the common units may be highly volatile and could be subject to wide fluctuations. Some of the factors that could negatively affect the price or trading volume of the common units include additions or departures of key personnel, adverse market reaction to any indebtedness we may incur or securities we may issue in the future, actions by unitholders, changes or proposed changes in laws or regulations, and general market and economic conditions.
We may issue additional common units in the future without the consent of unitholders and at a discount to the market price of such common units. In particular, sales of significant amounts of the common units may cause the price of the common units to decline.
Under the terms of the Partnership Agreement, additional common units may be issued without the consent of unitholders at a discount to the market price. In addition, other classes of securities may be issued with rights that are senior to or which otherwise have preferential rights to the rights of the common units. Sales of significant amounts of the common units in the public market or the perception that such sales of significant amounts may occur could adversely affect its market price. Moreover, the perceived risk of any potential dilution could cause common unit holders to attempt to sell their common units and investors to “short” the common units, a practice in which an investor sells common units that he or she does not own at prevailing market prices, hoping to purchase common units later at a lower price to cover the sale. Any event that would cause the number of common units being offered for sale to increase would likely cause the common units’ market price to further decline. These sales might also make it more difficult for us to sell additional common units in the future at a time and price that we deem appropriate.
We may not make future cash distributions to our unitholders.
In connection with the Exchange Transaction, we agreed to distribute to the holders of our common units the Target Distribution, subject to certain limitations, during the period from July 16, 2009 to April 30, 2011. On April 1, 2010, we distributed to our unitholders of record as of March 26, 2010 approximately $54.4 million or $1.95 per common unit. On April 6, 2011, we distributed to our unitholders of record as of March 25, 2011 approximately $33.1 million, or $1.18 per common unit, representing the final required distribution in full satisfaction of the Target Distribution. We may, at our option, make further distributions to the unitholders although we currently have no plan to make any distributions in excess of the Target Distribution.
Risks Related to Taxation
All statutory references in this section are to the Internal Revenue Code of 1986, as amended, or the “Code.”
Our unitholders may be subject to U.S. federal and other income tax on their share of our taxable income, regardless of whether they receive any cash distributions from us.
It is anticipated that we will be treated, for U.S. federal income tax purposes, as a partnership and not a publicly traded partnership taxable as a corporation. Our unitholders will be subject to U.S. federal, state, local and possibly, in some cases, foreign income tax on their allocable share of our taxable income, whether or not they receive cash distributions from us. We do not anticipate making any additional cash distributions or paying any cash dividends. Accordingly, our unitholders may be required to make tax payments in connection with their ownership of common units that significantly exceed their cash distributions in any given year.
Our tax treatment is not assured. If we are taxed as a corporation, it could adversely impact our results of operations.
A partnership is not a taxable entity and distributions by a partnership to a partner are generally not taxable to the partnership or the partner unless the amount of cash distributed to such partner exceeds the partner’s adjusted basis in its partnership interest. Section 7704 provides that generally publicly traded partnerships are taxed as corporations. However, an exception, referred to as the “Qualifying Income Exception,” exists with respect to publicly traded partnerships of which 90 percent or more of the gross income for every taxable year consists of “qualifying income” as defined in the Code. We expect that we will meet the Qualifying Income Exception. However, the Qualifying Income Exception will not apply if we register, or are required to register, as an investment company under the Investment Company Act.
If the Qualifying Income Exception is not available to us, then we will be treated as a corporation instead of a partnership. In that event, the deemed incorporation of SPH should be tax-free, unless the corporation is an investment company for tax purposes and the partners are treated as diversifying their interests. If we were taxed as a corporation, (i) our net income would be taxed at corporate income tax rates, thereby substantially reducing our profitability, (ii) our unitholders would not be allowed to deduct their share of losses of SPH and (iii) distributions to our unitholders, other than liquidating distributions, would constitute dividends to the extent of our current or accumulated earnings and profits, and would be taxable as such.
The tax treatment of (i) publicly traded partnerships or (ii) an investment in our common units could be subject to potential legislative, judicial or administrative changes and differing interpretations, possibly on a retroactive basis.
The current U.S. federal income tax treatment of (i) publicly traded partnerships, including us, or (ii) an investment in our common units may be modified by administrative, legislative or judicial interpretation at any time, possibly on a retroactive basis. The U.S. federal income tax rules are constantly under review by persons involved in the legislative process, the Internal Revenue Service (“IRS”), and the United States Treasury Department, frequently resulting in revised interpretations of established concepts, statutory changes, revisions to regulations and other modifications and interpretations. Changes to the U.S. federal income tax laws and interpretations thereof could make it more difficult or impossible to meet the Qualifying Income Exception, affect or cause us to change our investments, affect the tax considerations of an investment in us, or change the character or treatment of portions of our income. Any such changes could adversely impact the value of an investment in our common units.
Our structure involves complex provisions of U.S. federal income tax law for which no clear precedent or authority may be available.
The U.S. federal income tax treatment of our unitholders depends in some instances on interpretations of complex provisions of U.S. federal income tax law for which no clear precedent or authority may be available. Our Partnership Agreement permits our General Partner to modify it from time to time, including the allocation of items of income, gain, loss and deduction (including unrealized gain and unrealized loss to the extent allowable under U.S. federal income tax law), without the consent of our unitholders, to address certain changes in U.S. federal income tax regulations, legislation or interpretation or to preserve the uniformity of our common units. In some circumstances, such revisions could have a material adverse impact on some or all unitholders. In addition, we formed a subsidiary partnership, to which we contributed certain of our assets, or the “Subsidiary Partnership.” To preserve the uniformity of common units, we (but not the Subsidiary Partnership) will make an election permitted under Section 754 and we will adopt the remedial allocation method under Section 704(c) with respect to items of income, gain, loss and deduction attributable to assets contributed to us (which we will contribute to the Subsidiary Partnership), to account for any difference between the tax basis and fair market value of such assets at the time of contribution, or attributable to the “book-up” or “book-down” of our assets prior to their contribution to the Subsidiary Partnership, or while they were held by the Subsidiary Partnership, to account for the difference between the tax basis and fair market value of such assets at the time of a mark-to-market event. We intend generally to make allocations under Section 704(c) to our unitholders in accordance with their respective percentage interests. However, built-in gain or built-in loss in existence and allocable to the assets we contributed to the Subsidiary Partnership, when recognized, will be allocated to our unitholders as of the contribution date. We intend to prepare our tax returns on the basis that buyers of common units from such unitholders will not inherit such unitholders’ built-in gains or built-in losses as of that date as a result of the election under Section 754. However, it is not clear whether this position will be upheld if challenged by the IRS. While we believe it represents the right result, there is no law directly on point.
We will prorate our items of income, gain, loss and deduction between transferors and transferees of our common units each month based upon the ownership of our common units on the first day of each month, instead of on the basis of the date a particular common unit is transferred. The IRS might challenge this treatment, which could change the allocation of items of income, gain, loss and deduction among our unitholders.
We will apply certain assumptions and conventions in an attempt to comply with applicable rules and to report income, gain, loss, deduction and credit to our unitholders in a manner that reflects such unitholders’ beneficial ownership of partnership items, taking into account variation in unitholder ownership interests during each taxable year because of trading activity. Our allocations of items of taxable income and loss between transferors and transferees of our common units generally will be determined annually, will be prorated on a monthly basis and will be subsequently apportioned among the unitholders in proportion to the number of common units owned by each of them as of the opening of trading of our common units on any national exchange on which we are listed, on the first business day of every month. As a result, a unitholder transferring common units may be allocated items of income, gain, loss, deduction and credit realized after the date of transfer. However, those assumptions and conventions may not be in compliance with all aspects of applicable U.S. federal income tax requirements. If the IRS were to challenge this method or new Treasury Regulations were issued, we might be required to change the allocation of items of income, gain, loss, deduction and credit among our unitholders in a manner that adversely affects them.
Non-U.S. persons face unique U.S. tax issues from owning common units that may result in adverse tax consequences to them.
We generally do not intend to engage in activities that will cause us to be treated as engaged in a U.S. trade or business for U.S. federal income tax purposes. However, it is possible that we may acquire the stock of U.S. corporations owning significant U.S. real property. The gain from the sale of the stock of such corporations may be treated as effectively connected income (“ECI”) with respect to non-U.S. unitholders. In addition, it is possible that we may acquire interests in U.S. real property (other than through corporations) as long as the income from the property is “qualifying income” under Section 7704. The income from such real property, including the gain from the sale of such property, may be ECI to non-U.S. unitholders. To the extent our income is treated as ECI, non-U.S. unitholders generally will be subject to withholding tax on their allocable share of such income when such income is distributed, will be required to file a U.S. federal income tax return for such year reporting their allocable share of income effectively connected with such trade or business and any other income treated as ECI, and will be subject to U.S. federal income tax at regular U.S. tax rates on any such income (state and local income taxes and filings may also apply in that event). Non-U.S. unitholders that are corporations may also be subject to a 30 percent branch profits tax on their allocable share of such income, which branch profits tax may be reduced or eliminated pursuant to an income tax treaty.
Certain passive income received by us, such as U.S. source dividends and interest that does not qualify as “portfolio interest,” that is allocable to non-U.S. unitholders will be subject to U.S. federal withholding tax of 30 percent (in the absence of relief under an income tax treaty). We are required to pay to the IRS such withholding tax on such income allocable to non-U.S. unitholders even if we do not make distributions to them. We will apply this withholding tax in a manner intended to preserve the uniformity of our common units.
Tax-exempt entities face unique tax issues from owning common units that may result in adverse tax consequences to them.
A holder of common units that is a tax-exempt organization may be subject to U.S. federal income taxation to the extent that its allocable share of our income consists of unrelated business taxable income (“UBTI”). We may borrow money. A tax-exempt partner of a partnership may be treated as earning UBTI if the partnership regularly engages in a trade or business that is unrelated to the exempt function of the tax-exempt partner, if the partnership derives income from debt-financed property or if the tax-exempt organization’s partnership interest itself is debt-financed.
Unitholders may be subject to state and local taxes and return filing requirements as a result of investing in our common units.
In addition to U.S. federal income taxes, our unitholders may be subject to other taxes, including state and local taxes, unincorporated business taxes and estate, inheritance or intangible taxes that are imposed by the various jurisdictions in which we conduct activities or own property, if any, now or in the future, even if our unitholders do not reside in any of those jurisdictions. Our unitholders may be required to file state and local income tax returns and pay state and local income taxes in some or all of these jurisdictions. Further, unitholders may be subject to penalties for failure to comply with those requirements. It is the responsibility of each unitholder to file all U.S. federal, state and local tax returns that may be required of such unitholder.
We do not expect to be able to furnish to each unitholder specific tax information within 90 days after the close of each calendar year, which means that holders of common units who are U.S. taxpayers should anticipate the need to file annually a request for an extension of the due date of their income tax returns.
It will most likely require longer than 90 days after the end of our fiscal year to obtain the requisite information so that IRS Form K-1s may be prepared for us. Further, we do not expect to provide estimates of such information within such time period. For this reason, holders of common units who are U.S. taxpayers should anticipate the need to file annually with the IRS (and certain states) a request for an extension past April 15 or the otherwise applicable due date of their income tax returns for the taxable year.
Not applicable
Item
2.
Properties
All dollars used in this discussion are in thousands.
HNH
As of December 31, 2011, HNH had 22 active operating plants in the United States, Canada, China, United Kingdom, Germany, France, and Mexico, with a total area of approximately 1,475,000 square feet, including warehouse, office and laboratory space. HNH also owns or leases sales, service and warehouse facilities at 8 other locations in the United States which have a total area of approximately 202,000 square feet, and owns or leases 5 non-operating locations with a total area of approximately 326,000 square feet. Manufacturing facilities are located in: Camden and Bear, Delaware; Evansville, Indiana; Agawam, Massachusetts; Middlesex, New Jersey; Canfield, Ohio; Rancho Cucamonga, California; St. Louis, Missouri; Tulsa and Broken Arrow, Oklahoma; Cudahy, Wisconsin; Toronto and Montreal, Canada; Coahuila and Matamoros, Mexico; Gwent, Wales, United Kingdom; Pansdorf, Germany; Riberac, France; and Suzhou, People’s Republic of China. All plants are owned except for the Middlesex, Rancho Cucamonga, Montreal, Coahuila and two of the Suzhou plants, which are leased.
HNH considers its manufacturing plants and service facilities to be well maintained and efficiently equipped, and therefore suitable for the work being done. The productive capacity and extent of utilization of its facilities is dependent in some cases on general business conditions and in other cases on the seasonality of the utilization of its products. Capacity can be expanded at some locations.
BNS
As of December 31, 2011, Sun Well owned 16 and leased 2 well service rigs located in Montana and North Dakota. Sun Well also leases 3 facilities, comprising an aggregate of 20,630 square feet of leased space in North Dakota and owns a 15-acre parcel of land in Williams County, North Dakota. In May 2011, Sun Well signed a contract to commence construction of a new rig shop and headquarters building. The contract is for $5,054 and the building was completed in February 2012. BNS has no other properties other than the Sun Well properties noted herein.
BNS believes that the above facilities are adequate for SunWell’s current needs and that suitable additional space will be available as required.
DGT
DGT’s Power Conversion Group owns 55,000 square feet of manufacturing and office space headquartered in Bay Shore, New York. On September 1, 2010, RFI entered into a mortgage on this property in favor of People’s Bank in the amount of $2,500 payable over 10 years at an annual rate of interest of 4.9%.
As discussed elsewhere in this Form 10-K, on November 3, 2011 DGT completed the sale of Villa, its Italian subsidiary. DGT continues to own the real estate property from which Villa operates, which is subject to a six year lease
which may be extended for an additional six years after the initial term. The property, which is located in Milan, Italy, consists of 67,000 square feet of design and manufacturing space.
DGT believes that its current facilities are sufficient for its present and anticipated future requirements. DGT’s manufacturing operations run on one shift and DGT has the ability to add a second shift, if needed.
WebBank
As of December 31, 2011, WebBank leases 8,000 square feet of office space headquartered in Salt Lake City, Utah. The term of the lease expires in March 2017. WebBank also leases office space in New Jersey through March 2014. Its WCS subsidiary leases office space in Des Plaines, Illinois through August 2013.
WebBank believes that the above facilities are adequate for its current needs and that suitable additional space will be available as required.
Item
3.
Legal Proceedings
The information set forth under Note 23 - Commitments and Contingencies of our Notes to Consolidated Financial Statements, included in Part II, Item 8, Financial Statements, of this Report, is
incorporated herein by reference. For an additional discussion of certain risks associated with legal proceedings, see the section entitled Part I, Item 1A, Risk Factors, of this Report.
Not applicable.
|
Item 5.
|
Market for the Registrant’s Common Equity and Related Stockholder Matters and Issuer Purchases of Equity Securities
|
Market Information
As of December 31, 2011, we had 25,183,039 common units issued and outstanding.
Our common units, no par value, are quoted on the over-the-counter market on the Pink Sheets under the symbol “SPNHU.PK”. The following table sets forth the high and low bid prices for our common units for the periods indicated as reported by the OTC Bulletin Board. Prior to April 19, 2011, there was no active trading market for our common units. The prices state inter-dealer quotations, which do not include retail mark-ups, mark-downs or commissions. These prices do not necessarily represent actual transactions.
|
Fiscal year ending December 31, 2011
|
High
|
Low
|
||||||
|
Second Quarter
|
$ | 16.75 | $ | 15.50 | ||||
|
Third Quarter
|
$ | 16.75 | $ | 14.60 | ||||
|
Fourth Quarter
|
$ | 14.78 | $ | 11.50 | ||||
Holders
As of December 31, 2011, there were approximately 411 unitholders of record.
Distributions
In connection with the Exchange Transaction, we agreed to distribute to the holders of our common units the Target Distribution, subject to certain limitations, during the period from July 16, 2009 to the Final Distribution Date. On April 1, 2010, we distributed to our unitholders of record as of March 26, 2010, approximately $54.4 million, or $1.95 per common unit. On April 6, 2011, we distributed to our unitholders of record as of March 25, 2011, approximately $33.1 million, or $1.18 per common unit, representing the final required distribution in full satisfaction of the Target Distribution.
We may, at our option, make further distributions to the unitholders although we currently have no plan to make any distributions in excess of the Target Distribution.
Unit Performance Graph
The following graph compares the cumulative total return provided to unitholders on SPH’s common units since the common units began trading on April 19, 2011, relative to the cumulative total returns of the Russell 2000 index, and a customized peer group of seven companies that includes: Blackstone Group L.P., Leucadia National Corporation, Apollo Investment Corporation, Compass Diversified Holdings LLC, Gladstone Capital Corporation, Knights Capital Group, Inc. and Main Street Capital Corporation. An investment of $100 (with reinvestment of all dividends) is assumed to have been made in our common units, in the peer group, and the index on April 19, 2011 and its relative performance is tracked through December 31, 2011. We did not declare or pay any dividends during the comparison period.
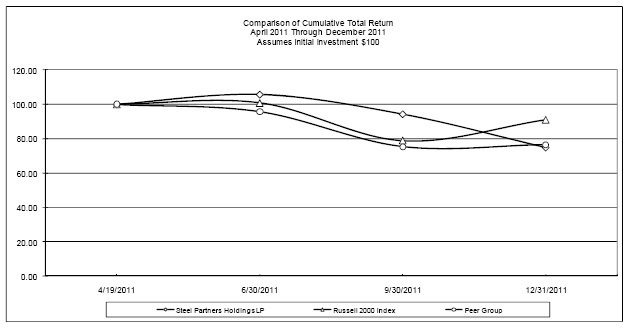
|
4/19/2011
|
6/30/2011
|
9/30/2011
|
12/31/2011
|
|||||||||||||
|
Steel Partners Holdings L.P.
|
$ | 100.00 | $ | 105.71 | $ | 94.29 | $ | 74.92 | ||||||||
|
Russell 2000 Index
|
$ | 100.00 | $ | 100.81 | $ | 78.77 | $ | 90.96 | ||||||||
|
Peer Group
|
$ | 100.00 | $ | 95.78 | $ | 75.29 | $ | 76.44 | ||||||||
The unit price performance included in this graph is not necessarily indicative of future unit price performance
The performance graph shall not be deemed to be incorporated by reference by means of any general statement incorporating by reference this Form 10-K into any filing under the Securities Act or the Exchange Act, except to the extent that we specifically incorporate such information by reference, and shall not otherwise be deemed filed under such acts.
Item
6.
Selected Financial Data
The following table contains our selected historical consolidated financial data, which should be read in conjunction with our consolidated financial statements and the related notes thereto, and Management’s Discussion and Analysis of Financial Condition and Results of Operations contained in this Annual Report on Form 10-K. The selected financial data as of December 31, 2011 and 2010 and for the fiscal years ended December 31, 2011 and 2010, and the periods from January 1, 2009 to July 15, 2009 and July 16, 2009 to December 31, 2009 have been derived from our audited consolidated financial statements at those dates and for those periods, contained elsewhere in this Annual Report on Form 10-K. The historical selected financial data as of December 31, 2009 and 2008 and for the fiscal years ended December 31, 2008 and 2007 have been derived from our audited consolidated financial statements at those dates and for those periods, not contained in this Annual Report on Form 10-K. The selected historical financial data as of December 31, 2007 is unaudited and consolidates SPH (formerly known as WebFinancial L.P.), WebFinancial, and SPII based on information derived from SPH’s and SPII’s separately audited financial statements and other unaudited financial information, not contained in this Form 10-K, on a basis consistent with the consolidated financial statements presented elsewhere in this Form 10-K.
SPH entered into the Exchange Transaction pursuant to which SPII became a wholly-owned subsidiary of SPH on July 15, 2009, subject to no further conditions. The Exchange Transaction is accounted for as a transaction between entities under common control and as such SPII’s accounts are consolidated with SPH for all periods presented.
The operations of SPH prior to taking into account the assets acquired as a result of the Exchange Transaction (the “Pre-Exchange Operations”), together with the operations related to the assets acquired as a result of the acquisition of SPII as of July 15, 2009 are accounted for and presented on an operating company basis of accounting, in accordance with U.S. generally accepted accounting principles (“GAAP”). These operations are presented in the consolidated financial statements as “Diversified Industrial, Financial Services and Other”.
SPH accounts for the consolidation of SPII in the consolidated financial statements as “Investment Operations” on the basis of the specialized GAAP prescribed in ASC 946, “Financial Services – Investment Companies” for all periods presented through July 15, 2009. After July 15, 2009, the date which SPII became a subsidiary of SPH, SPH accounts for the assets it acquired as part of the Exchange Transaction in accordance with its accounting policies as an operating company, and therefore it does not report Investment Operations in its consolidated financial statements after July 15, 2009.
SPH acquired a controlling interest in HNH, which has been consolidated as of May 7, 2010. In addition, as discussed elsewhere in this Form 10, on February 2, 2011, through BNS, SPH acquired SWH and on July 5, 2011 acquired a controlling interest in DGT that have been consolidated since their acquisition dates. These acquisitions affect the comparability of our selected financial data presented below.
|
July 16,
|
January 1,
|
|||||||||||||||||||||||
|
2009 to
|
2009 to
|
|||||||||||||||||||||||
|
Year Ended December 31,
|
December 31,
|
July 15,
|
Year Ended December 31,
|
|||||||||||||||||||||
|
2011
|
2010
|
2009
|
2009
|
2008
|
2007
|
|||||||||||||||||||
|
STATEMENTS OF OPERATIONS DATA (a)
|
||||||||||||||||||||||||
|
Revenues:
|
||||||||||||||||||||||||
|
Diversified Industrial, Financial Services and Other
|
$ | 712,222 | $ | 424,665 | $ | 14,424 | $ | 2,225 | $ | 23,445 | $ | 5,534 | ||||||||||||
|
Investment Operations
|
- | - | - | (51,681 | ) | (736,747 | ) | 94,665 | ||||||||||||||||
|
Total revenues
|
$ | 712,222 | $ | 424,665 | $ | 14,424 | $ | (49,456 | ) | $ | (713,302 | ) | $ | 100,199 | ||||||||||
|
Net income (loss) from continuing operations
|
$ | 80,537 | $ | 18,316 | $ | (4,254 | ) | $ | (57,527 | ) | $ | (756,949 | ) | $ | 19,724 | |||||||||
|
Income from discontinued operations
|
740 | 28,130 | 1,177 | - | - | - | ||||||||||||||||||
|
Net income (loss)
|
81,277 | 46,446 | (3,077 | ) | (57,527 | ) | (756,949 | ) | 19,724 | |||||||||||||||
|
Net income attributable to redeemable partners' capital
|
- | - | - | 54,064 | 767,812 | (18,613 | ) | |||||||||||||||||
|
Less: Net (income) loss attributable to non-controlling interests:
|
(45,808 | ) | (14,699 | ) | (442 | ) | - | 100 | - | |||||||||||||||
|
Net income (loss) attributable to common unitholders
|
$ | 35,469 | $ | 31,747 | $ | (3,519 | ) | $ | (3,463 | ) | $ | 10,963 | $ | 1,111 | ||||||||||
|
Per common unit and per share (c)
|
||||||||||||||||||||||||
|
Net income (loss) per common unit - basic
|
||||||||||||||||||||||||
|
Net income (loss) from continuing operations
|
$ | 1.39 | $ | 0.69 | $ | (0.16 | ) | $ | (1.59 | ) | $ | 5.02 | $ | 0.51 | ||||||||||
|
Net income from discontinued operations
|
0.02 | 0.57 | 0.02 | - | - | - | ||||||||||||||||||
|
Net income (loss) attributable to common unitholders
|
$ | 1.41 | $ | 1.26 | $ | (0.14 | ) | $ | (1.59 | ) | $ | 5.02 | $ | 0.51 | ||||||||||
|
Basic weighted average common units outstanding
|
25,233 | 25,235 | 25,219 | 2,183 | 2,183 | 2,183 | ||||||||||||||||||
|
Net income (loss) per common unit - diluted
|
||||||||||||||||||||||||
|
Net income (loss) from continuing operations
|
$ | 0.98 | $ | 0.63 | $ | (0.16 | ) | $ | (1.59 | ) | $ | 5.02 | $ | 0.51 | ||||||||||
|
Net income from discontinued operations
|
0.01 | 0.53 | 0.02 | - | - | - | ||||||||||||||||||
|
Net income (loss) attributable to common unitholders
|
$ | 0.99 | $ | 1.16 | $ | (0.14 | ) | $ | (1.59 | ) | $ | 5.02 | $ | 0.51 | ||||||||||
|
Diluted weighted average common units outstanding
|
29,670 | 27,483 | 25,219 | 2,183 | 2,183 | 2,183 | ||||||||||||||||||
|
December 31,
|
||||||||||||||||||||
|
2011
|
2010
|
2009
|
2008
|
2007(d)
|
||||||||||||||||
|
BALANCE SHEET DATA
|
(In thousands, except per unit data)
|
(unaudited)
|
||||||||||||||||||
|
Diversified Industrial, Financial Services and Other:
|
||||||||||||||||||||
|
Cash and cash equivalents
|
$ | 127,027 | $ | 180,684 | $ | 114,247 | $ | 30,072 | $ | 3,359 | ||||||||||
|
Investments at fair value
|
150,020 | 71,872 | 200,015 | 1,325 | 13,610 | |||||||||||||||
|
Investments in associated companies
|
128,218 | 163,270 | 121,148 | 5,066 | 5,369 | |||||||||||||||
|
Investment Operations:
|
||||||||||||||||||||
|
Investments
|
- | - | - | 1,118,294 | 2,801,447 | |||||||||||||||
|
Total assets
|
1,129,843 | 1,091,865 | 731,903 | 1,442,618 | 3,234,824 | |||||||||||||||
|
Redeemable partners’ capital (b)
|
- | - | - | 1,258,725 | 2,138,144 | |||||||||||||||
|
SPH Partners’ capital
|
415,797 | 405,732 | 416,913 | 42,090 | 31,120 | |||||||||||||||
|
SPH Partners’ capital per common unit
|
$ | 14.02 | $ | 16.07 | $ | 16.53 | $ | 19.28 | $ | 14.25 | ||||||||||
|
(a)
|
Statement of operations data for the Diversified Industrial segment includes the consolidation of the results of acquired entities from their respective acquisition dates: the acquisition of HNH effective May 7, 2010, the acquisition of SWH by BNS on February 2, 2011 and the acquisition of DGT on July 5, 2011. On February 18, 2010, BNS sold its interest in Collins. The criteria for discontinued operations presentation were met at the date of sale and Collins’ operations are reported as discontinued operations for all periods presented.
|
|
(b)
|
The Exchange Transaction was subject to being unwound, in whole or part, until July 15, 2009. Accordingly, the entire partners’ capital of SPII represented a redeemable interest in SPH and is presented as “Redeemable Partners’ Capital” until July 15, 2009, when the capital relating to SPII was no longer subject to redemption.
|
|
(c)
|
Prior to December 31, 2008, SPH (as WebFinancial) was a corporation with common shares outstanding. On December 31, 2008 SPH converted into a limited partnership. Each common share of WebFinancial Corporation was exchanged for a common unit of WebFinancial L.P., now known as SPH.
|
|
(d)
|
The selected balance sheet data for 2007 is unaudited and consolidates SPH and SPII based on information derived from SPH’s and SPII separately audited financial statements and other unaudited financial information on a basis consistent with the consolidated financial statements presented elsewhere in Annual Report on Form 10-K.
|
The following discussion and analysis of our financial condition and results of operations should be read in conjunction with our consolidated financial statements and related notes thereto that are available elsewhere in this Annual Report on Form 10-K. The following is a discussion and analysis of SPH’s consolidated results of operations for the years ended December 31, 2011 and 2010, and the periods from January 1, 2009 to July 15, 2009 and July 16, 2009 to December 31, 2009. In addition to historical consolidated financial information, the following discussion contains forward-looking statements that reflect our plans, estimates and beliefs. Our actual results could differ materially from those discussed in the forward-looking statements. Factors that could cause or contribute to these differences include those discussed below and elsewhere in this Annual Report on Form 10-K, particularly in “Risk Factors” in Item 1A.
All monetary amounts used in this discussion are in thousands except common units and share amounts.
Overview
We are a global diversified holding company that engages in multiple businesses through consolidated subsidiaries, associated companies and other interests. We have interests in a variety of businesses, including diversified industrial products, energy, defense, banking, insurance, food products and services, oilfield services, sports, training, education, and the entertainment and lifestyle industries. The securities of some of the companies in which we have interests are traded on national securities exchanges, while others are privately held or less liquid. We seek to work with our companies to increase corporate value over the long term for all stakeholders and shareholders by implementing Steel Partners Operational Excellence programs, the Steel Partners Purchasing Council, Steel Partners Corporate Services, balance sheet improvements, capital allocation policies and growth initiatives.
The Company’s consolidated subsidiaries, associated companies and other core companies are as follows:
|
Consolidated Subsidiaries
|
Associated Companies
|
Other Core Companies
|
|
BNS Holding, Inc.
|
CoSine Communications, Inc.
|
API Group PLC (e)
|
|
DGT Holdings Corp. (a)
|
SL Industries, Inc. (c)
|
Barbican Group Holdings Limited
|
|
Handy & Harman Ltd. (b)
|
Steel Excel Inc. (d)
|
Fox & Hound Restaurant Corp.
|
|
WebBank
|
GenCorp Inc.
|
|
|
JPS Industries, Inc. (f)
|
_______________
|
(a)
|
DGT was an Associated Company until July 5, 2011, when it became a Consolidated Subsidiary.
|
|
(b)
|
HNH was an Associated Company until May 7, 2010, when it became a Consolidated Subsidiary.
|
|
(c)
|
SLI became an Associated Company on December 31, 2010..
|
|
(d)
|
Steel Excel, which was formerly known as ADPT, became an Associated Company on June 3, 2010 and is presented on the equity method on a retroactive basis in the consolidated financial statements for the period July 16, 2009 to December 31, 2009.
|
|
(e)
|
API became an Associated Company on September 1, 2010 and on December 31, 2011 was reclassified to Investments at fair value.
|
|
(f)
|
JPS was an Associated Company through 2011 and on December 31, 2011 was reclassified to Investments at fair value.
|
Segment Information
Our operations are conducted through consolidated subsidiaries and associated companies which represent significant equity interests in operating businesses that are accounted for under the equity method of accounting. We also own interests directly and indirectly in other core companies and certain other interests that are accounted for as available-for-sale securities or held by the SPII Liquidating Trust. Our reportable business segments are: Diversified Industrial (from July 14, 2009, the date SPH acquired BNS from SPII, Financial Services (for all periods presented), Investment Operations (for all periods through July 15, 2009) and Corporate.
Diversified Industrial
As of December 31, 2011, our Diversified Industrial segment for financial reporting purposes consists of HNH, BNS and DGT, which are consolidated subsidiaries, SLI which is an associated company, API and JPS, which are classified as Investments at fair value. There were no Diversified Industrial operations presented for periods prior to July 14, 2009.
HNH is a holding company that owns and manages a group of businesses on a decentralized basis whose strategic business units encompass its five reportable segments: precious metal, tubing, engineered materials, electronic materials, and Kasco replacement products and services. Subsequent to December 31, 2009, SPH purchased additional shares of HNH in the open market and on May 7, 2010 its ownership exceeded 50%, at which point HNH became a controlled subsidiary. HNH’s operations are consolidated with SPH from May 7, 2010. HNH was an associated company accounted for under the fair value option from July 15, 2009 until May 6, 2010.
The Diversified Industrial segment also includes our majority owned consolidated subsidiary BNS, which was acquired from SPII on July 14, 2009, which in turn principally operated through its 80% ownership of Collins, a manufacturer of small school, activity and shuttle buses, ambulances, and terminal trucks/road construction equipment. Collins was sold on February 18, 2010, and its results of operations and financial position are reported in our consolidated financial statements from July 15, 2009 as discontinued operations for all periods presented.
On February 2, 2011, BNS acquired all of the capital stock of SWH which owns all of the capital stock of Sun Well, its sole asset. Sun Well is a work-over rig provider to oil and gas exploration companies throughout the Williston Basin in North Dakota and eastern Montana. SWH was acquired to further the Company’s position as a global diversified holding company.
DGT, through its subsidiary RFI, manufactures and sells electronic systems and components for a variety of applications. SPH purchased additional shares of DGT and on July 5, 2011 its ownership exceeded 50%, at which point DGT became a controlled subsidiary. DGT’s operations are consolidated with SPH from July 5, 2011. In November 2011, DGT sold its subsidiary, Villa, which comprised its Medical Systems Group Division. As a result, the operations of Villa are reflected as discontinued operations in our consolidated financial statements for the period from July 5, 2011. DGT was an associated company accounted for under the equity method from July 15, 2009 until July 5, 2011.
Financial Services
Our Financial Services segment, for financial reporting purposes, primarily consists of our consolidated and wholly-owned subsidiary WebBank, which operates in niche banking markets. WebBank provides commercial and consumer loans and services. WebBank’s deposits are insured by the FDIC, and the bank is examined and regulated by the FDIC and UDFI.
Investment Operations
The Investment Operations segment consisted of the operations of SPII, an entity of the SPII Fund
1
acquired by SPH in an Exchange Transaction on July 15, 2009. The SPII operations are presented as the Investment Operations segment on an investment company basis for all periods through July 15, 2009. From July 16, 2009 the Investment Operations ceased upon the completion of the Exchange Transaction when SPII’s net assets were in effect acquired by SPH and such net assets were no longer managed as an investment fund. After July 15, 2009 the SPII assets in effect acquired by SPH, as appropriate, are reported as part of the Company’s Diversified Industrial, Financial Services and Corporate segments.
See description of the Exchange Transaction in the SPH 2011 Audited Consolidated Financial Statements – Note 21 - “Exchange Transaction”.
1
“SPII Fund” refers collectively to the entities that indirectly invested in SPII, Steel Partners II (Onshore) LP, (“SPII Onshore”) and Steel Partners II (Offshore) Ltd. (“SPII Offshore”).
Corporate
Corporate revenues primarily consist of investment and other income and investment gains and losses. Corporate assets, revenues, overhead expenses and interest expense are not allocated to the operating units. Corporate also has investments in Steel Excel and CoSine. Steel Excel acquired certain businesses in 2011, and is seeking to acquire additional business operations. CoSine is in the business of seeking to acquire one or more business operations. In addition, Corporate has investments in securities, investments in the SPII Liquidating Trust and, cash and cash equivalents. Steel Excel and CoSine are associated companies that we account for under the equity method of accounting, with Steel Excel reported at its fair value.
Basis of Presentation
Our financial statements include the consolidated financial results of SPH, WebFinancial (which was merged with and into SPH on December 31, 2008), and their subsidiaries for all periods presented. WebFinancial completed, through a merger transaction, its conversion into WebFinancial L.P., on December 31, 2008. Each share of WebFinancial was exchanged for limited partnership interests of WebFinancial L.P. designated as common units. WebFinancial L.P. was renamed Steel Partners Holdings L.P. in April 2009.
In the consolidated financial statements, the Diversified Industrial, Financial Services and Corporate segments are reported as “Diversified Industrial, Financial Services and Other” to denote the operations accounted for and reported on an operating company basis; the Investment Operations segment is reported as “Investment Operations” on the basis of the specialized GAAP prescribed in ASC 946, “Financial Services – Investment Companies” for all periods presented through July 15, 2009 to denote the operations accounted for and reported on an investment company basis. From July 16, 2009 forward, the Company operates in three segments, Diversified Industrial, Financial Services and Corporate, and uses one basis of accounting, the operating company basis. To present the change from reporting two bases of accounting to reporting one basis of accounting, the operating company basis, beginning July 16, 2009 the consolidated statements of operations, cash flows and changes in capital and comprehensive income (loss) have been presented in two periods, January 1, 2009 to July 15, 2009 and July 16, 2009 to December 31, 2009.
History
The Company entered into the Exchange Transaction pursuant to which SPII became a wholly-owned subsidiary of SPH without further condition on July 15, 2009 (see “Asset Acquisitions and Unit Issuance” below). The Exchange Transaction is accounted for as a transaction between entities under common control and as such SPII’s accounts are consolidated with SPH for all periods presented.
The Exchange Transaction, which initially occurred on January 1, 2009, was subject to being unwound, in whole or part, until July 15, 2009. Accordingly, the net assets of SPII on January 1, 2009 represented a redeemable interest of SPH, and are therefore presented as “Redeemable Partners’ Capital” in the consolidated financial statements for all periods presented until July 15, 2009. Redeemable Partners’ Capital accordingly only participated in 100% of the economic results of SPII and did not participate in the economic results of the Pre-Exchange Operations. At July 15, 2009, (i) certain assets of SPII were distributed in redemption of a portion of the Redeemable Partners’ Capital of equal value, (ii) the remaining net assets of SPII were then acquired by SPH in the Exchange Transaction as of July 15, 2009, and (iii) the unredeemed portion of the Redeemable Partners’ Capital (of equal value to the net assets of SPII then acquired) became nonredeemable and thereafter participates in an undivided interest in SPH and its economic results. See the consolidated statements of changes in capital and comprehensive income (loss) for 2009.
The SPII assets acquired by SPH in the Exchange Transaction as of July 15, 2009 were valued at fair value. The fair values of SPII assets acquired on July 15, 2009 established the initial carrying values from which operating company accounting principles began to be applied to such assets, including those applicable to accounting for investments and business combinations.
In the consolidated financial statements the primary difference between the operating company accounting policies of Diversified Industrial, Financial Services and Other operations and the investment company accounting policies of Investment Operations relate to accounting for investments:
|
|
·
|
SPH evaluates its investments and determines the appropriate classification as a consolidated subsidiary, an equity method investment, an available-for-sale security, or a held-to-maturity security each with a different financial reporting treatment. For investments that are accounted for under the fair value option that otherwise would be subject to the equity method, unrealized gains and losses are presented in the consolidated statement of operations. Unrealized changes in the fair value of available for-sale-securities are presented in other comprehensive income in the consolidated statement of changes in capital and comprehensive income (loss).
|
|
|
·
|
For Investment Operations, investments are accounted for in the consolidated financial statements at fair value with changes in fair value reported in the revenue section of the consolidated statements of operations as “change in unrealized gains (losses)” when they occur. Under investment company accounting, Investment Operations does not consolidate investments and it does not apply the equity method of accounting.
|
Asset Acquisitions and Unit Issuance
Acquisition of Assets of SPII
Effective as of July 15, 2009, SPH in effect acquired certain assets (the “Acquisition”) from certain former investors of the SPII Fund, which was managed by Steel Partners and its affiliates. Through this transaction SPH acquired from the SPII Fund net assets with a fair value of $454,262 as of July 15, 2009, which included interests in DGT, JPS, HNH, Steel Excel, various other companies and a 43.75% interest in the SPII Liquidating Trust and $251,547 in cash. In exchange, the contributing SPII Fund investors received 25,761,587 SPH common units. This was implemented though the Exchange Transaction discussed below. The transaction contemplated that as a result SPH would become a global diversified holding company.
Acquisition of HNH
As part of the Acquisition, SPH acquired a 32.8% interest in HNH valued at $11,390. Through open market purchases between July 16, 2009 and December 31, 2009, SPH acquired, in the aggregate, 5.8% of additional interests in HNH for $1,069 bringing its ownership interest in HNH to 38.6% at December 31, 2009. During 2010 and through December 31, 2011, SPH acquired an additional 16.9% interest in HNH for $15,889 through open market purchases bringing its ownership in HNH as of December 31, 2011 to approximately 55.5%. SPH’s ownership and control of HNH reached 50.3% on May 7, 2010 and HNH became a majority-owned subsidiary; beginning on this date HNH is accounted for as a consolidated subsidiary of SPH. As part of the Acquisition, SPH also acquired an indirect interest in certain debt held through the SPII Liquidating Trust of certain HNH subsidiaries valued at $29,296 at December 31, 2009 (representing its 43.75% pro rata interest). On October 15, 2010, HNH, through a newly formed subsidiary, Handy & Harman Group Ltd. (“H&H Group”), refinanced substantially all of its indebtedness in a simplified lending structure principally with its existing lenders or their affiliates, including the SPII Liquidating Trust. H&H Group refinanced the prior indebtedness of Handy & Harman (“H&H”) and Bairnco Corporation (“Bairnco”) to the SPII Liquidating Trust pursuant to which H&H Group made an approximately $6,000 cash payment in partial satisfaction of prior indebtedness to the SPII Liquidating Trust and exchanged the remainder of such prior obligations for units consisting of (a) $72,926 aggregate principal amount of Subordinated Notes issued by H&H Group and (b) Warrants to purchase an aggregate of 1,500,806 shares of HNH common stock. The Warrants have an exercise price of $11.00 per share and are exercisable beginning October 14, 2013. The Subordinated Notes bear interest at a rate of 10%, 6% of which is payable in cash and 4% of which is payable in-kind. The Subordinated Notes, together with any accrued and unpaid interest thereon is due on October 15, 2017. As a result, as a beneficiary of the SPII Liquidating Trust, SPH had an indirect interest in $31,905 of the Subordinated Notes and 656,605 of the Warrants. On December 14, 2010, the SPII Liquidating Trust distributed SPH’s indirect interest in the Subordinated Notes and Warrants to SPH. As described below, on October 14, 2011, HNH redeemed $25,000 face amount of its outstanding Subordinated Notes. Approximately $12,500 of this amount was paid to SPH to redeem its pro rata share of the Subordinated Notes. As of December 31, 2011, the Company directly held $20,715 of the Subordinated Notes and $620 of the Warrants.
Acquisition of BNS
SPII owned 50.2% of BNS at December 31, 2008. On July 14, 2009, SPH acquired for cash from SPII its 50.2% interest in BNS for $5,815, at the market price per share on that date. After July 15, 2009 SPH acquired 27,400 additional BNS shares for cash and owned 51.1% of BNS as of December 31, 2009. In addition, during 2010 SPH acquired for cash additional BNS shares through open market purchases and owns 84.9% of BNS as of December 31, 2011. SPH reports BNS as a consolidated subsidiary, including noncontrolling interests, from the July 14, 2009 purchase date. BNS operated primarily through its 80% ownership of Collins, which was sold on February 18, 2010. The Collins operations are classified in the consolidated financial statements as discontinued operations. BNS, subsequent to the sale of Collins, is currently in the business of seeking to acquire one or more new business operations. As part of the Acquisition, SPH also acquired an indirect interest from SPII in certain debt held through the SPII Liquidating Trust of BNS valued at $9,770 at December 31, 2009 (representing its 43.75% pro rata interest). This intercompany debt of BNS, related to Collins, is eliminated against the investment acquired from SPII. In connection with the sale of Collins, the intercompany debt held via the SPII Liquidating Trust was paid in full; all other debt was assumed by the acquirer of Collins. On February 2, 2011, BNS acquired all of the capital stock of SWH for an aggregate purchase price of $50,463 in cash. SWH owns all of the capital stock of Sun Well, its sole asset.
Acquisition of DGT
On July 5, 2011, SPH acquired for cash an additional 5% interest in DGT common stock for $1,933, bringing its total interest in DGT as of July 5, 2011 to 51.1%. Accordingly, the accounting for the investment in DGT has been changed from the equity method to a majority-owned controlled subsidiary and is consolidated with SPH from that date. Prior to July 5, 2011, SPH owned a 46.1% interest in DGT, which was acquired primarily between July 15, 2009 and March 2011.
Acquisition of API
We have an ownership of approximately 32.4% as of December 31, 2011 in API. Through December 31, 2011, the investment in API was reported under the equity method of accounting at fair value, at which date the investment was reclassified to an available-for sale security. SPH’s ownership interest in API exceeded 20% on September 1, 2010, and, accordingly, API was accounted for as an associated company using the fair value election from January 1, 2010. Effective December 31, 2011, the Company determined that it no longer had significant influence over the operating and financial polices of API, as a result of which the Company reclassified API to Investments at fair value on our Consolidated Balance Sheet. For additional information, see Note 5 – “Investments in Associated Companies” to the consolidated SPH financial statements found elsewhere in this Form 10-K.
Acquisition of CoSine
In two transactions on July 14, 2009 and July 15, 2009, SPH acquired for cash, in the aggregate, a 26.1% interest in CoSine from SPII for $4,211, at the market price per share on that date. On July 31, 2009, SPH acquired for cash from HNH an additional 18.8% interest in CoSine and on August 11, 2009, acquired an additional 2.5% interest in the open market for a total cost of $3,616. As of December 31, 2011, SPH’s ownership interest in CoSine was 46.8%.
Acquisition of JPS
On July 14, 2009, SPH acquired for cash an 18.2% interest in JPS from SPII for $6,427, at the market price per share on that date. As part of the Acquisition, SPH acquired an additional 11.3% interest in JPS valued at $4,722 at the Acquisition date. Through open market cash purchases between July 16, 2009 and December 31, 2009, SPH acquired, in the aggregate, 8.8% of additional interests in JPS for $2,742, bringing its ownership interest in JPS to 38.3% at December 31, 2009. Between January 1 and December 31, 2010, SPH acquired an additional 143,244 shares for cash for $560 through open market purchases. As of December 31, 2011 SPH’s ownership in JPS was 39.3%. Effective December 31, 2011, the Company determined that it no longer had significant influence over the operating and financial polices of JPS, as a result of which the Company reclassified JPS to Investments at fair value. For additional information, see Note 5 – “Investments in Associated Companies” to the consolidated SPH financial statements found elsewhere in this Form 10-K.
Acquisition of SLI
On July 14, 2009, SPH acquired for cash, in the aggregate, a 11.5% interest in SLI from SPII for $5,524. The investment in SLI is reported at fair value. The Company’s ownership interest in SLI exceeded 20% on December 31, 2010 and, accordingly, SLI has been accounted for as an associated company using the fair value option election from January 1, 2010. At December 31, 2011, SPH’s ownership of SLI is 21.7%.
Acquisition of Steel Excel
As part of the Acquisition, SPH acquired an 8.4% interest in Steel Excel valued at $27,168. Through open market purchases between July 16, 2009 and December 31, 2009, SPH acquired, in the aggregate, 11.1% of additional interests in Steel Excel for $42,061 bringing its ownership interest in Steel Excel to 19.5% at December 31, 2009. During 2010, SPH acquired an additional 13.5% interest in Steel Excel for $37,202 through open market purchases, bringing its ownership in Steel Excel as of December 31, 2010 to 33.0%. From January 1, 2011 to December 31, 2011, SPH acquired an additional 7.2% interest for cash in the open market for $21,931. As of December 31, 2011, SPH’s ownership interest in Steel Excel was 40.3%. On June 3, 2010, SPH ownership of Steel Excel reached 20% and Steel Excel became an associated company. Steel Excel is accounted for under the fair value option on a retroactive basis and is presented in SPH’s results as an associated company for all periods subsequent to July 15, 2009.
Results of Operations
Substantially all of our operations are affected by worldwide economic conditions. Poor economic conditions have reduced demand for the products and services of our diversified industrial businesses, resulted in additional loan losses in our financial services business and may adversely impact the value of our associated companies and other core companies. The discussions below consider the effect of current economic conditions on results of operations and financial position. Should current conditions worsen or the U.S. enters another recession, we believe all of our operations could be adversely affected.
For the periods presented prior to July 16, 2009, revenue and costs and expenses in the consolidated statements of operations are presented in two sections. The Diversified Industrial, Financial Services and Other section represents the Pre-Exchange Operations presented on an operating company basis and the Investment Operations section represents SPII’s investment operations (the Investment Operations segment) presented on an investment company basis.
|
|
·
|
The consolidated statements of operations, cash flows and changes in capital and comprehensive income (loss) for 2009 are presented in two periods, January 1, 2009 to July 15, 2009 and July 16, 2009 to December 31, 2009, reflecting the financial results and the applicable basis of accounting for the period in 2009 before and after the completion of the Exchange Transaction on July 15, 2009, respectively.
|
|
|
·
|
For all periods subsequent to July 15, 2009, Diversified Industrial, Financial Services and Other are presented on an operating company basis.
|
|
|
·
|
Investment Operations, representing SPII’s operations, for the period from January 1, 2009 to July 15, 2009, are presented on an investment company basis. Additionally, the net assets of the Investment Operations represented a redeemable interest in SPH which participated only in 100% of the economic results of the net assets of SPII. Accordingly, all of the net income or loss of Investment Operations is allocated to redeemable partners’ capital in determining net income attributable to common units.
|
The following presents a summary of SPH’s consolidated operating results:
|
July 16, 2009
|
January 1,
|
|||||||||||||||
|
to
|
to
|
|||||||||||||||
|
Year Ended December 31,
|
December 31,
|
July 15,
|
||||||||||||||
|
2011
|
2010
|
2009
|
2009
|
|||||||||||||
|
Revenues:
|
||||||||||||||||
|
Diversified industrial
|
$ | 700,969 | $ | 385,805 | $ | - | $ | - | ||||||||
|
Financial services
|
14,921 | 10,803 | 2,997 | 2,326 | ||||||||||||
|
Investment operations
|
- | - | - | (51,681 | ) | |||||||||||
|
Corporate
|
(3,668 | ) | 28,057 | 11,427 | (101 | ) | ||||||||||
|
Total Revenues
|
$ | 712,222 | $ | 424,665 | $ | 14,424 | $ | (49,456 | ) | |||||||
|
Net income from continuing operations before income taxes:
|
||||||||||||||||
|
Diversified industrial
|
$ | 55,545 | $ | 30,523 | $ | (2,141 | ) | $ | - | |||||||
|
Financial services
|
6,165 | 4,381 | (4,380 | ) | (3,809 | ) | ||||||||||
|
Investment operations
|
- | - | - | (54,064 | ) | |||||||||||
|
Corporate
|
(45,138 | ) | (13,931 | ) | 2,324 | (522 | ) | |||||||||
|
Totals
|
16,572 | 20,973 | (4,197 | ) | (58,395 | ) | ||||||||||
|
Income tax benefit (provision)
|
63,965 | (2,657 | ) | (57 | ) | 868 | ||||||||||
|
Net income (loss) from continuing operations
|
80,537 | 18,316 | (4,254 | ) | (57,527 | ) | ||||||||||
|
Income from discontinued operations
|
740 | 28,130 | 1,177 | - | ||||||||||||
|
Net loss attributable to redeemable partners' capital
|
- | - | - | 54,064 | ||||||||||||
|
Net (income) loss attributable to noncontrolling interests in consolidated entities
|
(45,808 | ) | (14,699 | ) | (442 | ) | - | |||||||||
|
Net income (loss) attributable to common unitholders
|
$ | 35,469 | $ | 31,747 | $ | (3,519 | ) | $ | (3,463 | ) | ||||||
|
Other comprehensive (loss) income
|
(19,499 | ) | (45,580 | ) | 53,374 | 247 | ||||||||||
|
Comprehensive income (loss) attributable to common unitholders
|
$ | 15,970 | $ | (13,833 | ) | $ | 49,855 | $ | (3,216 | ) | ||||||
Diversified Industrial
The following presents a summary of the Diversified Industrial segment operating results as reported in our consolidated financial statements:
|
Year Ended December 31,
|
||||||||||||
|
2011
|
2010 (1)
|
2009(2)
|
||||||||||
|
Revenue:
|
||||||||||||
|
HNH
|
$ | 664,017 | $ | 385,805 | $ | - | ||||||
|
BNS
|
32,984 | - | - | |||||||||
|
DGT
|
3,968 | - | - | |||||||||
|
Total Revenue
|
$ | 700,969 | $ | 385,805 | $ | - | ||||||
|
Net income (loss) from continuing operations before income taxes:
|
||||||||||||
|
HNH
|
$ | 40,696 | $ | 9,345 | $ | - | ||||||
|
BNS
|
6,558 | - | - | |||||||||
|
DGT
|
(421 | ) | - | - | ||||||||
|
Income of associated companies
|
8,712 | 21,178 | (2,141 | ) | ||||||||
|
Total
|
$ | 55,545 | $ | 30,523 | $ | (2,141 | ) | |||||
|
(1)
|
Includes HNH from May 7, 2010 through December 31, 2010.
|
|
(2)
|
Represents the period from July 16, 2009 through December 31, 2009.
|
Total revenue for the Diversified Industrial segment increased to $700,969 for the year ended December 31, 2011 as compared to $385,805 in the prior year period. This results from the consolidation of HNH effective May 7, 2010, the acquisition of SWH by BNS on February 2, 2011 and the acquisition of DGT on July 5, 2011.
Total revenue for the Diversified Industrial segment was $385,805 for the year ended December 31, 2010, which represents revenues of HNH for the period from May 7, 2010 through December 31, 2010. There was no revenue for this segment for the year ended December 31, 2009.
HNH
As noted above, we consolidated HNH effective May 7, 2010, the date that our interest in HNH exceeded 50%. For comparative purposes however, unaudited pro forma revenues and earnings of HNH are presented in the tables and discussion below for all periods indicated. We believe this presentation is more meaningful for management’s discussion and analysis in that it allows comparability to prior periods.
The pro forma results of HNH for the years ended December 31, 2010 and 2009 have been prepared as if the acquisition of the controlling interest in HNH had occurred on January 1, 2009. The pro forma information is not necessarily indicative of the results that actually would have occurred if the above transactions had been consummated for the periods, nor do they purport to represent the financial position and results of operations for future periods. The unaudited pro forma condensed combined statements of operations of HNH for the years ended December 31, 2010 and 2009 have been derived from the financial statements of HNH which are included as exhibit 99.1 in this Form 10-K. The pro forma adjustments are described below.
|
Year Ended December 31,
|
||||||||||||
|
2011
|
2010
|
2009
|
||||||||||
|
(Historical)
|
(Pro Forma)
|
(Pro Forma)
|
||||||||||
|
Sales
|
$ | 664,017 | $ | 568,212 | $ | 460,702 | ||||||
|
Cost of sales
|
493,026 | 417,383 | 353,741 | |||||||||
|
Gross profit
|
170,991 | 150,829 | 106,961 | |||||||||
|
Selling, general and administrative expenses
|
115,999 | 106,710 | 96,062 | |||||||||
|
Restructuring and impairment charges
|
460 | 507 | 3,378 | |||||||||
|
Interest expense, Net
|
11,926 | 13,808 | 14,881 | |||||||||
|
Derivative activity loss
|
397 | 5,983 | 777 | |||||||||
|
Other expense (income) , net
|
1,513 | (1,068 | ) | (4,013 | ) | |||||||
|
Net income (loss) from continuing operations before income taxes
|
$ | 40,696 | $ | 24,889 | $ | (4,124 | ) | |||||
Pro forma adjustments
Unaudited pro forma information in the above table includes adjustments to HNH’s operating results as reflected in the financial statements of HNH for the applicable periods. In accordance with ASC Topic 805, Business Combinations, the application of purchase accounting required us to allocate the total purchase price of HNH to the fair value of assets acquired and liabilities assumed based on their fair values at the acquisition date. Therefore, the amounts of assets, liabilities and expenses reflected for HNH at their acquisition date fair value in SPH’s consolidated financial statements differ in certain respects from that reflected in HNH’s separate financial statements. A summary of the key differences are as follows:
|
|
1.
|
Property, plant and equipment and intangible assets were increased to their fair value, which impacted selling, general and administrative expenses. During each of the years ended December 31, 2010 and 2009, SPH reflected pro forma additional depreciation and amortization expense amounts of approximately $680. In addition, asset impairment charges recorded by HNH of $1,643 and $1,860 in 2010 and 2009, respectively, were not required on the SPH basis due to a lower SPH value for certain specified assets.
|
|
|
2.
|
Inventory was increased to its fair value which resulted in an additional charge to cost of sales in 2009 of $7,395.
|
|
|
3.
|
Amortizable intangible assets were recognized at fair value that resulted in additional amortization expense of $5,159 and $5,170 in 2010 and 2009, respectively.
|
|
|
4.
|
Pension expense recorded by HNH was reduced by SPH due to the application of purchase accounting. As a result, the pro forma pension expense (income) reflected in the above table is $(4,573) and $859 for the years ended December 31, 2010 and 2009, respectively, which is included in selling, general and administrative expenses.
|
|
|
5.
|
Interest expense recorded by HNH of $12,502 and $10,860 in 2010 and 2009, respectively, relating to debt payable to two series of the SPII Liquidating Trust was eliminated.
|
Comparison of the Years ended December 31, 2011 and 2010
Net sales for the year ended December 31, 2011 increased by $95,805, or 16.9%, to $664,017, as compared to $568,212 for the year ended December 31, 2010. The higher sales volume from most of the Company’s segments was driven by both higher demand for HNH’s products, and the impact of higher silver prices, which accounted for approximately $46,300 of the increase in sales for the year ended December 31, 2011. Higher sales were also driven by the impact of a increase in the average market price of silver increased by 75.6% in 2011 ($35.40 per troy oz.) as compared to 2010 ($20.16 per troy oz).
In addition, incremental sales were driven by higher volume of commercial roofing products and fasteners, increased sales of printed circuit board materials related to the telecommunications infrastructure in China, increased sales of flex heater and coil insulation products for the general industrial market, and higher sales of tubing to the petrochemical and ship building markets and the medical industry markets. This was partially offset by weakness in tubing sales to the refrigeration market.
Gross profit for the year ended December 31, 2011 increased to $170,991 as compared to $150,829 million for the same period of 2010. Gross profit margin for the year ended December 31, 2011 decreased to 25.8% as compared to 26.5% during the same period of 2010. The lower gross margin was primarily due to higher silver costs from the Precious Metal segment. Since HNH’s precious metal inventory is hedged and the cost of silver is passed-through to the customer principally at market, higher silver prices generally result in moderation or, at times, a reduction in the Precious Metal segment’s gross profit margin.
SG&A expenses were $9,289 higher for the year ended December 31, 2011 compared to the same period of 2010, reflecting higher variable selling costs and non-cash restricted stock expense of approximately $3,100. SG&A as a percentage of net sales was 17.5% for the year ended December 31, 2011 as compared to 18.8% for the same period of 2010.
Realized and unrealized loss on derivatives totaled $397 for the year ended December 31, 2011, compared to a loss of $5,983 in the same period of 2010.
The lower loss in 2011 was primarily driven by a reduction in the amount of ounces under contract in 2011 as compared to 2010.
The derivative financial instruments utilized by HNH are precious metal forward and future contracts which are used to economically hedge HNH’s precious metal inventory against price fluctuations. The trend in the market price of silver could significantly affect the income from continuing operations of the Company. If there is a material increase in silver prices, it could reasonably be expected to cause a loss on HNH’s open silver derivatives contracts.
Interest expense was $11,926 for the year ended December 31, 2011, compared to $13,808 in the same period of 2010. The decrease was primarily due to lower interest rates as a result of the Company’s debt refinancing during the fourth quarter of 2010.
Comparison of the Years Ended December 31, 2010 and 2009
Net sales for the year ended December 31, 2010 increased by $107,510, or 23.3%, to $568,212, as compared to $460,702 for the year ended December 31, 2009. The higher sales volume across all segments was primarily driven by higher demand resulting from the improvement in the world-wide economy and strengthening in the markets served by HNH that began in the fourth quarter of 2009. Precious metal product sales rose in 2010 compared to 2009 due to more volume to the commercial construction and electrical markets, as well as the impact of a 37.0% increase in the average market price of silver in 2010 ($20.16 per troy oz.) as compared to 2009 ($14.72 per troy oz). In addition, incremental sales were also driven by higher volume of commercial roofing and branded fasteners, electro-galvanized rolled sheet steel, electrical and gas connector products, higher tubing sales to refrigeration, automotive, and HVAC markets along with strong sales from petrochemical and precision material markets. In addition, there were increased sales of flex heater and coil insulation products for the general industrial market as a result of the economic rebound and increased sales of printed circuit board materials related to the telecommunications infrastructure in China.
Gross profit for the year ended December 31, 2010 increased to $150,829 as compared to $106,961 for the same period of 2009. The 2009 period reflects a one-time charge of $7,395 to cost of sales related to the initial purchase accounting for HNH upon SPH acquiring a controlling interest. Gross profit margin for the year ended December 31, 2010 improved to 26.5% as compared to 23.2% during the same period of 2009 (25.0% in 2009 excluding the one-time adjustment), with improvement in all segments. Greater absorption of fixed manufacturing costs due to a higher volume of production, more profitable product mix, and greater manufacturing efficiencies were the primary drivers that contributed to improved gross profit margin.
SG&A expenses were $10,648 higher for the year ended December 31, 2010 compared to the same period of 2009, reflecting higher variable costs plus the reinstatement of certain employee compensation costs. The 2009 period reflected the suspension of these programs as well as a reduction in accruals related to incentive pay. These higher expenses were partially offset by a non-cash pension credit of ($4,573) for the year ended December 31, 2010, as compared to $859 of non-cash pension expense for the same period of 2009. The reduction in non-cash pension expense in 2010 as compared to 2009 primarily represented interest on pension assets in excess of the interest on the pension liability in 2010. SG&A as a percentage of net sales was 18.8% for the year ended December 31, 2010 as compared to 20.9% for the same period of 2009.
Interest expense was $13,808 for the year ended December 31, 2010, compared to $14,881 in the same period of 2009. The decrease was primarily due to lower interest rates during the fourth quarter of 2010 as a result of HNH’s debt refinancing.
Realized and unrealized losses on derivatives were $5,983 for the year ended December 31, 2010 compared to $777 in the same period of 2009. The higher loss was primarily driven by much higher silver prices during 2010 as compared to the same period of the prior year. The derivative financial instruments utilized by H&H are precious metal forward and future contracts which are used to economically hedge H&H’s precious metal inventory against price fluctuations.
For the year ended December 31, 2010, HNH recorded a gain of $1,292 from insurance proceeds related to a loss from a fire that occurred at its Indiana Tube Mexico location. In 2009, HNH recorded income totaling $4,035 from the settlement of insurance claims. In one matter, HNH reached a settlement agreement with an insurer for reimbursement of $3,000 in connection with five sites where H&H and/or its subsidiaries had incurred environmental remediation expenses. In another matter, HNH accrued a settlement reached with an insurance company related to an environmental site, and in January 2010, H&H received $1,035 as the final settlement.
BNS
Operating results for BNS for the year ended December 31, 2011 and pro forma results for 2010 are as follows:
|
Year Ended December 31,
|
||||||||
|
2011 (a)
|
2010
|
|||||||
|
(Historical)
|
(Pro Forma)
|
|||||||
|
Revenues
|
$ | 32,984 | $ | 26,015 | ||||
|
Cost of revenues
|
18,200 | 14,208 | ||||||
|
Gross profit
|
14,784 | 11,807 | ||||||
|
Selling, general and administrative expenses
|
7,906 | 6,239 | ||||||
|
Interest expense, net
|
509 | 1,307 | ||||||
|
Other income, net
|
(189 | ) | (134 | ) | ||||
|
Net income from continuing operations before income taxes
|
$ | 6,558 | $ | 4,395 | ||||
|
|
(a)
|
Includes the results of BNS’ corporate expenses for the year ended December 31, 2011 and Sun Well for the period from February 2, 2011 through December 31, 2011.
|
BNS’ operations include the results of its wholly-owned subsidiary, Sun Well, from its February 2, 2011 acquisition date. Sun Well’s revenue and income from continuing operations before income taxes included in the consolidated financial statements for the year ended December 31, 2011 are $32,984 and $8,100, respectively. Revenue for the period February 2, 2011 through December 31, 2011 grew by 26.8% as compared to the pro forma results for the full year ended December 31, 2010. The revenue increase is due to an increase in the average number of rigs in operation (17 in 2011 as compared to 14 in 2010) and an increase in the revenue per rig hour. Gross profit for the period February 2, 2011 through December 31, 2011 grew by 25.2% as compared to the pro forma results for the year ended December 31, 2010, consistent with the increase in revenue. Selling, general and administrative expenses for the period February 2, 2011 through December 31, 2011 grew by 32.4% as compared to the pro forma results for the year ended December 31, 2010, due primarily to $1,572 in retention payments made in June 2011 in connection with the February 2, 2011 acquisition agreement. Excluding the retention payments, selling, general and administrative expenses increased by 6.1% over the year ended December 31, 2010, due to increased customer demand.
DGT
As noted above, we consolidated DGT effective July 5, 2011, the date that our interest in DGT exceeded 50%. In addition, on November 3, 2011 DGT sold its Medical Systems Group, which comprised approximately 84% of DGT’s net sales of $67,921 for its fiscal year ended July 30, 2011. As a result, the operations of Villa are reflected as discontinued operations in our consolidated financial statements for the period from July 5, 2011. Revenues for DGT’s continuing operations, its Power Conversion Group, totaled $10,783 for the same period. Operating income reported by DGT for its Power Conversion Group for its fiscal year ended July 30, 2011 was $116. For the period July 5, 2011 through December 31, 2011, revenues and pretax loss from continuing operations reported in our consolidated financial statements relating to DGT were $3,968 and $(421), respectively.
Associated Companies
Income (loss) of associated companies included in the Diversified Industrial segment net income (loss) from continuing operations includes the following:
|
Ownership at December 31,
|
Year Ended December 31,
|
July 16, 2009
to
|
||||||||||||||
|
2011
|
2011
|
2010
|
2009
|
|||||||||||||
|
HNH (a)
|
55.5 | % | $ | - | $ | 8,670 | $ | (1,161 | ) | |||||||
|
DGT (b)
|
51.5 | % | 213 | 886 | (745 | ) | ||||||||||
|
JPS (c)
|
39.3 | % | - | 1,228 | (754 | ) | ||||||||||
|
API (c)
|
32.4 | % | 9,809 | 2,615 | 146 | |||||||||||
|
SLI
|
21.7 | % | (1,310 | ) | 7,779 | 373 | ||||||||||
| $ | 8,712 | $ | 21,178 | $ | (2,141 | ) | ||||||||||
______________
|
(a)
|
Effective May 7, 2010 we consolidated HNH. Prior to this date the investment in HNH was accounted for under the equity method at fair value.
|
|
(b)
|
Effective July 5, 2011, we consolidated DGT. Prior to this date the investment in DGT was accounted for under the equity method.
|
|
(c)
|
During 2011 we determined that we do not have significant influence over API and JPS. Accordingly, effective December 31, 2011 we have reclassified these investments from Investments in associated companies to Investments at fair value.
|
Income (loss) of associated companies includes income or loss we recognize on investments where we own between 20% and 50% of the outstanding equity and have the ability to exercise influence, but not control, over the investee. In 2009 we purchased certain investments from SPII, acquired additional investments on July 15, 2009 in connection with the Acquisition, and we purchased additional shares in the open market. We classify these investments as investments in associated companies, account for them using the equity method, report our share of their net income/loss in our consolidated statement of operations, report our share of their comprehensive income/loss in our consolidated statements of changes in capital and comprehensive income (loss) from the dates we reach 20% ownership. Through May 7, 2010, our investment in HNH is accounted for under the equity method at fair value.
In the consolidated statements of operations, we recognize the income of associated companies only from the date the investment qualifies for equity method accounting where the fair value option has not been elected. Investment purchases in our associated companies were made from July 14, 2009 through December 31, 2009 resulting in increasing ownership interests throughout the period. As a result, amounts in our consolidated statement of operations represent less than a full year of operating results for our equity-method investees where the fair value option has not been elected, and may have been included based on a lower percentage interest than that held at December 31, 2009.
Financial Services
For comparability purposes, in the following discussion, the revenue and costs and expenses for the periods from January 1, 2009 to July 15, 2009 and from July 16, 2009 to December 31, 2009 are combined. We believe this presentation is more meaningful for management’s discussion because the Financial Services segment is presented on an operating company basis for all periods, including all of 2009 and the segment existed prior to, and its basis of accounting was not changed, as a result of the Exchange Transaction. Accordingly, we believe that combining the two periods reported for 2009 for management’s discussion allows comparability to all prior periods presented.
The following presents a summary of the Financial Services segment:
|
Year Ended December 31,
|
||||||||||||
|
2011
|
2010
|
2009
|
||||||||||
|
Revenue:
|
||||||||||||
|
Interest income (including fees)
|
$ | 10,749 | $ | 8,055 | $ | 3,177 | ||||||
|
Non-interest income
|
4,172 | 2,748 | 2,146 | |||||||||
| 14,921 | 10,803 | 5,323 | ||||||||||
|
Costs and expenses:
|
||||||||||||
|
Interest
|
941 | 796 | 472 | |||||||||
|
Provision for (recovery of) loan losses
|
8 | (420 | ) | 6,645 | ||||||||
|
Selling, general and administrative
|
6,763 | 6,046 | 6,395 | |||||||||
|
Asset impairment charge (a)
|
1,044 | - | - | |||||||||
| 8,756 | 6,422 | 13,512 | ||||||||||
|
Net income (loss) from continuing operations before taxes
|
$ | 6,165 | $ | 4,381 | $ | (8,189 | ) | |||||
|
|
(a)
|
Represents impairment of investment securities held by WFAC.
|
Net Interest Income, Margin and Interest Rate Spreads
Net interest income is the difference between interest earned on interest-bearing assets and interest incurred on interest-bearing liabilities. By its nature, net interest income is especially vulnerable to changes in the mix and amounts of interest-earning assets and interest-bearing liabilities. In addition, changes in the interest rates and yields associated with these assets and liabilities can significantly impact net interest income. The following table summarizes the average balances, the amount of interest earned or incurred and the applicable yields for interest-earning assets and the costs of interest-bearing liabilities that generate net interest income. For purposes of calculating the yields in these schedules, the average loan balances also include the principal amounts of nonaccrual and restructured loans. However, interest received on nonaccrual loans is included in income only to the extent that cash payments have been received and not applied to principal reductions. In addition, interest on restructured loans is generally accrued at reduced rates.
|
Year Ended December 31,
|
||||||||||||||||||||||||||||||||||||
|
2011
|
2010
|
2009
|
||||||||||||||||||||||||||||||||||
|
Average
|
Interest
|
Average
|
Interest
|
Average
|
Interest
|
|||||||||||||||||||||||||||||||
|
Outstanding
|
Earned/
|
Yield/
|
Outstanding
|
Earned/
|
Yield/
|
Outstanding
|
Earned/
|
Yield/
|
||||||||||||||||||||||||||||
|
Balance
|
Paid
|
Rate
|
Balance
|
Paid
|
Rate
|
Balance
|
Paid
|
Rate
|
||||||||||||||||||||||||||||
|
Interest Earning Assets:
|
||||||||||||||||||||||||||||||||||||
|
Loans Receivable
|
$ | 39,666 | $ | 10,598 | 26.7 | % | $ | 35,819 | $ | 7,978 | 22.3 | % | $ | 34,502 | $ | 3,157 | 9.2 | % | ||||||||||||||||||
|
Mortgaged-Backed Security
|
1 | - | - | 1 | - | - | 2 | - | - | |||||||||||||||||||||||||||
|
Available for Sale Investments
|
507 | 19 | - | - | - | - | - | - | - | |||||||||||||||||||||||||||
|
Fed Funds Sold
|
1,438 | 2 | - | 4,854 | 8 | 0.2 | % | 5,838 | 19 | 0.3 | % | |||||||||||||||||||||||||
|
Interest Bearing Deposits in other Banks
|
52,916 | 130 | - | 28,369 | 69 | 0.2 | % | 1,220 | 1 | 0.1 | % | |||||||||||||||||||||||||
|
Total Interest-Earning Assets
|
94,528 | 10,749 | 11.4 | % | 69,043 | 8,055 | 11.7 | % | 41,562 | 3,177 | 7.6 | % | ||||||||||||||||||||||||
|
Non Interest-Earning Assets
|
865 | 984 | 128 | |||||||||||||||||||||||||||||||||
|
Total Assets
|
$ | 95,393 | $ | 70,027 | $ | 41,690 | ||||||||||||||||||||||||||||||
|
Interest-Bearing Liabilities:
|
||||||||||||||||||||||||||||||||||||
|
Money Market Accounts
|
$ | 8,902 | 31 | 0.3 | % | $ | 6,280 | 23 | 0.4 | % | 3,063 | 3 | 0.1 | % | ||||||||||||||||||||||
|
Time Deposits
|
61,476 | 910 | 1.5 | % | 45,510 | 773 | 1.7 | % | 25,233 | 469 | 1.9 | % | ||||||||||||||||||||||||
|
Other Borrowings
|
- | - | - | 10 | - | - | 3 | - | - | |||||||||||||||||||||||||||
|
Total Interest-Bearing Liabilities
|
70,378 | 941 | 1.3 | % | 51,800 | 796 | 1.5 | % | 28,299 | 472 | 1.7 | % | ||||||||||||||||||||||||
|
Other Non Interest-Bearing Liabilities
|
3,148 | 2,483 | 1,586 | |||||||||||||||||||||||||||||||||
|
Total Liabilities
|
73,526 | 54,283 | 29,885 | |||||||||||||||||||||||||||||||||
|
Shareholder's Equity
|
21,867 | 15,744 | 11,805 | |||||||||||||||||||||||||||||||||
|
Total Liabilities & Shareholder's Equity
|
$ | 95,393 | $ | 70,027 | $ | 41,690 | ||||||||||||||||||||||||||||||
|
Net Interest Income
|
$ | 9,808 | $ | 7,259 | $ | 2,705 | ||||||||||||||||||||||||||||||
|
Spread on Average Interest-Bearing Funds
|
10.1 | % | 10.1 | % | 6.0 | % | ||||||||||||||||||||||||||||||
|
Net Interest Margin
|
13.9 | % | 10.5 | % | 6.5 | % | ||||||||||||||||||||||||||||||
|
Return on Assets
|
7.5 | % | 6.2 | % | -14.2 | % | ||||||||||||||||||||||||||||||
|
Return on Equity
|
28.3 | % | 27.6 | % | -68.1 | % | ||||||||||||||||||||||||||||||
|
Equity to Assets
|
26.4 | % | 25.9 | % | 19.3 | % | ||||||||||||||||||||||||||||||
WebBank has several lending arrangements with companies where it originates private label credit card and other loans for consumers and small businesses. These loans are classified as held for sale and are typically sold a few days after origination. As part of these arrangements WebBank earns origination fees that are recorded in interest income, and which increase WebBank’s yield on loans.
Interest income increased by $2,694, or 33.4%, in 2011 compared to 2010 due primarily to a new lending program. The program began in the third quarter of 2010.
Interest income increased by $4,878, or 153.5%, in 2010 compared to 2009, due primarily to two new lending programs. One program began in the 4th quarter of 2009 and the other program began in the 3rd quarter of 2010. The entire loan portfolio (gross) decreased $5,550, or 16%, primarily due to the sale of $2,729 of nonperforming loans sold to a subsidiary of SPH and $1,541 in charge offs during 2010.
Interest income decreased by $276, or 8.0%, in 2009 compared to 2008, due primarily to an increase in nonaccrual loans and charge offs which reduced the net loan portfolio by 7.4% at December 31, 2009 compared to the prior year-end. Loan balances were relatively flat in 2009 as loan growth was offset by principal payments, charge offs, and reserves.
Interest expense represents interest accrued on WebBank depositor accounts. Interest expense increased $145, or 18.2%, for the year ended December 31, 2011, compared to 2010, largely due to growth in average deposits partially offset by a decrease in average interest rates on certificates of deposits. Deposits increased $34,003, or 54.9%, from December 31, 2010 to December 31, 2011. The increase in deposits occurred late in the third quarter in order to fund the increased liquidity needs of an existing lending program.
Interest expense increased $324, or 68.6%, in 2010 largely due to growth in average deposits partially offset by a decrease in average interest rates on certificates of deposit from 1.7% to 1.5%. Deposits increased $11,578, or 23.1%, in 2010 in order to fund the growth in assets. Interest expense decreased $611, or 56.4%, in 2009 largely due to a decline in average interest rates. The decline in interest rates is mostly due to the decline in overall interest rates, but is also due in part to shorter maturities in 2009, which carry lower rates. Average maturities on certificates of deposit were 3 months at December 31, 2008. By year end December 31, 2009 WebBank increased the average maturity to 22 months.
The following table presents the effects of changing rates and volumes on WebBank’s net interest income for the periods indicated. The rate column shows the effects attributable to changes in rate (changes in rate multiplied by prior volume). The volume column shows the effects attributable to changes in volume (changes in volume multiplied by prior rate). The total column represents the sum of the prior columns. For purposes of this table, changes attributable to both rate and volume, which cannot be segregated, have been allocated proportionately, based on the changes due to rate and the changes due to volume.
|
Year Ended December 31,
|
||||||||||||||||||||||||||||||||||||
|
2011 vs. 2010
|
2010 vs. 2009
|
2009 vs. 2008
|
||||||||||||||||||||||||||||||||||
|
Increase/
|
Increase/
|
Total
|
Increase/
|
Increase/
|
Total
|
Increase/
|
Increase/
|
Total
|
||||||||||||||||||||||||||||
|
Rate/Volume
|
(Decrease)
|
(Decrease)
|
Increase/
|
(Decrease)
|
(Decrease)
|
Increase/
|
(Decrease)
|
(Decrease)
|
Increase/
|
|||||||||||||||||||||||||||
|
Due to Volume
|
Due to Rate
|
(Decrease)
|
Due to Volume
|
Due to Rate
|
(Decrease)
|
Due to Volume
|
Due to Rate
|
(Decrease)
|
||||||||||||||||||||||||||||
|
Interest Earning Assets:
|
||||||||||||||||||||||||||||||||||||
|
Loans Receivable
|
$ | 917 | $ | 1,702 | $ | 2,619 | $ | 115 | $ | 4,706 | $ | 4,821 | $ | (46 | ) | $ | (189 | ) | $ | (235 | ) | |||||||||||||||
|
Available For Sale Investments
|
19 | - | 19 | - | - | - | - | - | - | |||||||||||||||||||||||||||
|
Fed Funds Sold
|
(5 | ) | (1 | ) | (6 | ) | (3 | ) | (7 | ) | (10 | ) | 298 | (340 | ) | (42 | ) | |||||||||||||||||||
|
Interest Bearing Deposits in other Banks
|
60 | 2 | 62 | 63 | 4 | 67 | 1 | - | 1 | |||||||||||||||||||||||||||
|
Total Interest-Earning Assets
|
991 | 1,703 | 2,694 | 175 | 4,703 | 4,878 | 253 | (529 | ) | (276 | ) | |||||||||||||||||||||||||
|
Interest-Bearing Liabilities:
|
||||||||||||||||||||||||||||||||||||
|
Money Market Accounts
|
9 | (1 | ) | 8 | 6 | 14 | 20 | (14 | ) | (40 | ) | (54 | ) | |||||||||||||||||||||||
|
Time Deposits
|
216 | (79 | ) | 137 | 340 | (36 | ) | 304 | 17 | (574 | ) | (557 | ) | |||||||||||||||||||||||
|
Total Interest-Bearing Liabilities
|
225 | (80 | ) | 145 | 346 | (22 | ) | 324 | 3 | (614 | ) | (611 | ) | |||||||||||||||||||||||
|
Net Effect on Net Interest Income
|
$ | 766 | $ | 1,783 | $ | 2,549 | $ | (171 | ) | $ | 4,725 | $ | 4,554 | $ | 250 | $ | 85 | $ | 335 | |||||||||||||||||
Noninterest Income
Noninterest income increased $1,424, or 51.8%, for the year ended December 30, 2011 compared to 2010, due primarily to increased fee income on existing lending programs and one new lending program.
Noninterest income increased $602, or 28.0%, in 2010 compared to 2009 primarily due to increased fee income from lending programs.
Noninterest income declined $934, or 30.3%, in 2009 compared to 2008 primarily due to gains on loan sales recorded in 2008. At the end of 2008, WebBank curtailed loan growth under the U.S. Small Business Administration program resulting in fewer loans sold in 2009 compared to 2008.
Provision for Loan Losses
Towards the end of 2008 and during 2009, WebBank made changes to its management team, suspended new loan activity in commercial real estate and addressed problem loans in its portfolio. Although WebBank started to increase its provision for nonperforming loans in the fourth quarter of 2008, it was necessary to continue to make substantial provisions for loan losses throughout 2009 due to the deteriorating economy.
At December 31, 2009, WebBank had an estimated $5,406 of impaired loans and an allowance for loan losses of $2,193. At December 31, 2010, WebBank had an estimated $2,627 of impaired loans and an allowance for loan losses of $1,541. The decrease in impaired loans of $2,779 from 2009 to 2010 was primarily related to the sale of nonperforming loans at the end of 2010 to a subsidiary of SPH, WF Asset Corp. (“WFAC”). At December 31, 2011 WebBank had an estimated $3,789 of impaired loans, of which $2,354 is guaranteed by the United States Department of Agriculture (
“
USDA
”
) or Small Business Administration (
“
SBA
”
), and an allowance for loan losses of $529.
WFAC was created for the purpose of purchasing a portfolio of loans, participations in loans and real estate property from WebBank, which is also an indirect wholly owned subsidiary of the Company. WebBank is an FDIC-insured depository institution, regulated by the FDIC and the Utah Department of Financial Institutions. Banking regulation and supervision favors the ownership by FDIC-insured depository institutions of high-quality assets. It is not uncommon for FDIC-insured depository institutions to sell to nonbank affiliates assets that have diminished in quality, such as impaired loans. The sale of such assets to an affiliate can benefit an FDIC-insured depository institution by improving the overall quality of its balance sheet, which has an indirect effect of minimizing risk to the FDIC deposit insurance fund.
The purchase of the impaired loans and real estate had no effect on total consolidated impaired loans, investments and other assets but did change their classification from loans to investments and other assets. When held by WebBank, such assets were classified as loans in accordance with WebBank’s financial reporting policies. WFAC classifies the loans and loan participations purchased from WebBank as investments in held-to-maturity securities and the real estate property owned is classified as other assets.
The provision for loan losses is primarily related to WebBank’s portfolio of local real estate loans. WebBank routinely obtains appraisals on underlying collateral of nonperforming loans and records a provision for losses if the value of the collateral declines below the value of the loans. The full impact of the negative effects of the recession resulted in the significant increase in the provision for loan losses in 2009. WebBank recorded a provision for loan losses of $6,645 for the year ended December 31, 2009. During 2011, WebBank was able to continue to recover previously charged off loans and workout or sell nonperforming loans resulting in net provision for loan losses of $8 for the year ended December 31, 2011.
Selling General and Administrative Expenses
The increase in selling, general and administrative expenses of $717, or 11.9% for the year ended December 31, 2011 compared to 2010 was due primarily to higher personnel expense in 2011 partially offset by no expense in 2011 as compared to $775 of expense in 2010 related to the reserve for off balance sheet credit exposures.
The decrease in 2010 selling, general and administrative expenses of $349, or 5.5% was due to reductions in the provisions to the reserve for off-balance sheet credit exposures to $775 as compared to $1,250 in 2009, partially offset by increased professional fees and other miscellaneous costs.
Balance Sheet Analysis
Loan Portfolio
As of December 31, 2011, net loans accounted for 35% of WebBank’s total assets compared to 32% at the end of 2010. The following table presents WebBank’s loans outstanding by type of loan as of December 31, 2011 and the five most recent year-ends.
|
December 31,
|
||||||||||||||||||||||||||||||||||||||||
|
2011
|
2010
|
2009
|
2008
|
2007
|
||||||||||||||||||||||||||||||||||||
|
Amount
|
%
|
Amount
|
%
|
Amount
|
%
|
Amount
|
%
|
Amount
|
%
|
|||||||||||||||||||||||||||||||
|
Real Estate Loans:
|
||||||||||||||||||||||||||||||||||||||||
|
Construction
|
$ | - | - | $ | 988 | 3.3 | % | $ | 3,646 | 10.2 | % | $ | 7,927 | 20.6 | % | $ | 2,669 | 13.5 | % | |||||||||||||||||||||
|
Commercial - Owner Occupied
|
8,340 | 18.8 | % | 9,546 | 31.9 | % | 10,425 | 29.3 | % | 10,978 | 28.5 | % | 10,843 | 54.8 | % | |||||||||||||||||||||||||
|
Commercial - Other
|
300 | 0.7 | % | 276 | 0.9 | % | 2,273 | 6.4 | % | 902 | 2.4 | % | 125 | 0.6 | % | |||||||||||||||||||||||||
|
Total Real Estate Loans
|
8,640 | 19.5 | % | 10,810 | 36.1 | % | 16,344 | 45.9 | % | 19,807 | 51.5 | % | 13,637 | 68.9 | % | |||||||||||||||||||||||||
|
Commercial and Industrial:
|
4,344 | 9.8 | % | 6,219 | 20.8 | % | 9,340 | 26.2 | % | 16,887 | 43.9 | % | 6,166 | 31.1 | % | |||||||||||||||||||||||||
|
Total Commercial and Industrial
|
4,344 | 9.8 | % | 6,219 | 20.8 | % | 9,340 | 26.2 | % | 16,887 | 43.9 | % | 6,166 | 31.1 | % | |||||||||||||||||||||||||
|
Consumer:
|
||||||||||||||||||||||||||||||||||||||||
|
Credit Cards
|
- | - | - | - | 517 | 1.5 | % | 568 | 1.5 | % | - | - | ||||||||||||||||||||||||||||
|
Total Consumer
|
- | - | - | - | 517 | 1.5 | % | 568 | 1.5 | % | - | - | ||||||||||||||||||||||||||||
|
Loans Held for Sale:
|
31,363 | 70.7 | % | 12,903 | 43.1 | % | 9,404 | 26.4 | % | 1,198 | 3.1 | % | - | - | ||||||||||||||||||||||||||
|
Total Loans
|
44,347 | 100.0 | % | 29,932 | 100.0 | % | 35,605 | 100.0 | % | 38,460 | 100.0 | % | 19,803 | 100.0 | % | |||||||||||||||||||||||||
|
Less:
|
||||||||||||||||||||||||||||||||||||||||
|
Deferred Fees and Discounts
|
(56 | ) | (64 | ) | (188 | ) | (263 | ) | (153 | ) | ||||||||||||||||||||||||||||||
|
Allowance for Loan Losses
|
(529 | ) | (1,541 | ) | (2,193 | ) | (2,302 | ) | (269 | ) | ||||||||||||||||||||||||||||||
|
Total Loans Receivable, Net
|
$ | 43,762 | $ | 28,327 | $ | 33,224 | $ | 35,895 | $ | 19,381 | ||||||||||||||||||||||||||||||
The following table includes a maturity profile for the loans that were outstanding at December 31, 2011, substantially all of which have floating or adjustable interest rates:
|
Due During Years Ending December 31,
|
Real Estate
|
Commercial & Industrial
|
Loans Held for Sale
|
|||||||||
|
2012
|
$ | 311 | $ | 3,731 | $ | 31,363 | ||||||
|
2013-2017
|
1,677 | 384 | - | |||||||||
|
2018 and following
|
6,652 | 229 | - | |||||||||
|
Total
|
$ | 8,640 | $ | 4,344 | $ | 31,363 | ||||||
Nonperforming Lending Related Assets
Total nonaccrual loans at December 31, 2011 decreased by $603 from December 31, 2010. The decrease included $988 for construction and land development loans and $322 for commercial and industrial loans. Nonaccrual loans increased $707 for commercial owner occupied loans.
|
December 31,
|
||||||||||||||||||||
|
2011
|
2010
|
2009
|
2008
|
2007
|
||||||||||||||||
|
Non-Accruing Loans:
|
||||||||||||||||||||
|
Commercial Real Estate - Construction
|
$ | - | $ | 988 | $ | 3,131 | $ | 544 | $ | - | ||||||||||
|
Commercial Real Estate - Owner Occupied
|
914 | 207 | 705 | 47 | - | |||||||||||||||
|
Commercial Real Estate - Other
|
- | - | 213 | 40 | - | |||||||||||||||
|
Commercial and Industrial
|
97 | 419 | 610 | 447 | - | |||||||||||||||
|
Other
|
- | - | 114 | - | - | |||||||||||||||
|
Total
|
1,011 | 1,614 | 4,773 | 1,078 | - | |||||||||||||||
|
Accruing Loans Delinquent :
|
||||||||||||||||||||
|
90 Days or More
|
- | - | 401 | 2,073 | 80 | |||||||||||||||
|
Total
|
- | - | 401 | 2,073 | 80 | |||||||||||||||
|
Restructured Loans:
|
||||||||||||||||||||
|
Commercial Real Estate - Owner Occupied
|
1 | 18 | - | - | - | |||||||||||||||
|
Commercial and Industrial
|
- | 7 | - | - | - | |||||||||||||||
|
Total
|
1 | 25 | - | - | - | |||||||||||||||
|
Foreclosed Assets:
|
||||||||||||||||||||
|
Commercial Real Estate - Construction
|
- | - | 232 | - | - | |||||||||||||||
|
Commercial Real Estate - Owner Occupied
|
333 | 38 | 170 | 432 | - | |||||||||||||||
|
Commercial and Industrial
|
- | 53 | - | - | - | |||||||||||||||
|
Other
|
- | - | 257 | 514 | - | |||||||||||||||
|
Total
|
333 | 91 | 659 | 946 | - | |||||||||||||||
|
Total Non-Performing Assets
|
$ | 1,345 | $ | 1,730 | $ | 5,833 | $ | 4,097 | $ | 80 | ||||||||||
|
Total as a Percentage of Total Assets
|
1.1 | % | 2.0 | % | 8.9 | % | 9.4 | % | 0.3 | % | ||||||||||
Nonaccrual loans also include nonperforming loans which have been restructured and classified as troubled debt restructured loans (TDRs).
TDRs are loans which have been modified to accommodate a borrower who is experiencing financial difficulties, and for which the Company has granted a concession that it would not otherwise consider. These modifications are structured on a loan-by-loan basis, and depending on the circumstances, may include extended payment terms, a modified interest rate, forgiveness of principal (on occasion), or other concessions. However, not all modifications are TDRs; modifications are also performed in the normal course of business for borrowers that are not experiencing financial difficulty, wherein WebBank meets the customer’s specific needs, comply with contractual commitments, as well as for competitive reasons.
WebBank considers many factors in determining whether to agree to a loan modification involving concessions, and seeks a solution that will both minimize potential loss to WebBank and attempt to help the borrower. WebBank evaluates the borrower’s current and forecasted future cash flows, their ability and willingness to make current contractual or proposed modified payments, the value of the underlying collateral (if applicable), the possibility of obtaining additional security, and the potential costs related to a repossession or foreclosure and the subsequent sale of the collateral.
TDRs are classified as either accrual or nonaccrual loans. If a nonaccrual loan is restructured as a TDR, it will remain on nonaccrual status until the borrower has proven the ability to perform under the modified structure for a minimum of six months, and there is evidence that such payments can and are likely to continue as agreed. Most often, loans are classified as nonaccrual according to our nonaccrual policy when restructured as a TDR.
Summary of Loan Loss Experience
In analyzing the adequacy of the allowance for loan losses, WebBank utilizes a comprehensive loan grading system to determine the risk potential in the portfolio and also considers the results of independent internal credit reviews. To determine the adequacy of the allowance, WebBank’s loan and lease portfolio is broken into segments based on loan type.
The following table summarizes activity in WebBank’s allowance for loan and lease losses for the periods indicated:
|
December 31,
|
||||||||||||||||||||
|
2011
|
2010
|
2009
|
2008
|
2007
|
||||||||||||||||
|
Balance at Beginning of Period
|
$ | 1,541 | $ | 2,193 | $ | 2,302 | $ | 269 | $ | 253 | ||||||||||
|
Charge Offs:
|
||||||||||||||||||||
|
Commercial Real Estate - Construction
|
(440 | ) | (80 | ) | (4,350 | ) | (56 | ) | - | |||||||||||
|
Commercial Real Estate - Owner Occupied
|
(422 | ) | (482 | ) | (500 | ) | (48 | ) | - | |||||||||||
|
Commercial Real Estate - Other
|
- | (268 | ) | (545 | ) | (7 | ) | - | ||||||||||||
|
Commercial and Industrial
|
(727 | ) | (714 | ) | (1,379 | ) | (795 | ) | (234 | ) | ||||||||||
|
Other
|
- | - | - | - | - | |||||||||||||||
|
Total Charge Offs
|
(1,589 | ) | (1,544 | ) | (6,774 | ) | (906 | ) | (234 | ) | ||||||||||
|
Recoveries:
|
||||||||||||||||||||
|
Commercial Real Estate - Construction
|
466 | 961 | - | - | - | |||||||||||||||
|
Commercial Real Estate - Owner Occupied
|
27 | 2 | - | - | 11 | |||||||||||||||
|
Commercial Real Estate - Other
|
44 | 18 | - | - | - | |||||||||||||||
|
Commercial and Industrial
|
32 | 331 | 20 | 31 | - | |||||||||||||||
|
Total Recoveries
|
569 | 1,312 | 20 | 31 | 11 | |||||||||||||||
|
Net (Charge Offs) Recoveries
|
(1,020 | ) | (232 | ) | (6,754 | ) | (875 | ) | (223 | ) | ||||||||||
|
Additions Charged to Operations
|
8 | (420 | ) | 6,645 | 2,908 | 239 | ||||||||||||||
|
Balance at End of Period
|
$ | 529 | $ | 1,541 | $ | 2,193 | $ | 2,302 | $ | 269 | ||||||||||
|
Ratio of Net Charge Offs During the Period to
|
||||||||||||||||||||
|
Average Loans Outstanding During the Period
|
2.6 | % | 0.7 | % | 19.6 | % | 2.5 | % | 1.3 | % | ||||||||||
The distribution of WebBank’s allowance for losses on loans at the dates indicated is summarized as follows:
|
December 31,
|
||||||||||||||||||||||||||||||||||||||||
|
2011
|
2010
|
2009
|
2008
|
2007
|
||||||||||||||||||||||||||||||||||||
|
Amount
|
% of Loans in Each Category of Total Loans
|
Amount
|
% of Loans in Each Category of Total Loans
|
Amount
|
% of Loans in Each Category of Total Loans
|
Amount
|
% of Loans in Each Category of Total Loans
|
Amount
|
% of Loans in Each Category of Total Loans
|
|||||||||||||||||||||||||||||||
|
Commercial Real Estate - Construction
|
$ | - | - | $ | 200 | 3.3 | % | $ | 85 | 10.2 | % | $ | 851 | 20.6 | % | $ | 40 | 13.5 | % | |||||||||||||||||||||
|
Commercial Real Estate - Owner Occupied
|
346 | 18.8 | % | 293 | 31.9 | % | 596 | 29.3 | % | 635 | 28.5 | % | 140 | 54.8 | % | |||||||||||||||||||||||||
|
Commercial Real Estate - Other
|
47 | 0.7 | % | 8 | 0.9 | % | 300 | 6.4 | % | 20 | 2.4 | % | 2 | 0.6 | % | |||||||||||||||||||||||||
|
Commercial and Industrial
|
136 | 9.8 | % | 565 | 20.8 | % | 737 | 26.2 | % | 665 | 43.9 | % | 87 | 31.1 | % | |||||||||||||||||||||||||
|
Credit Cards
|
- | - | - | - | - | 1.5 | % | 1 | 1.5 | % | - | - | ||||||||||||||||||||||||||||
|
Loans Held for Sale
|
- | 70.7 | % | - | 43.1 | % | - | 26.4 | % | - | 3.1 | % | - | - | ||||||||||||||||||||||||||
|
Unallocated
|
- | - | 475 | - | 475 | - | 130 | - | - | - | ||||||||||||||||||||||||||||||
|
Total Loans
|
$ | 529 | 100.0 | % | $ | 1,541 | 100.0 | % | $ | 2,193 | 100.0 | % | $ | 2,302 | 100.0 | % | $ | 269 | 100.0 | % | ||||||||||||||||||||
Investment Operations
The Investment Operations segment consisted of the operations of SPII, an entity of the SPII Fund acquired by SPH in the Exchange Transaction described in Note 23 – “Exchange Transaction” in the consolidated financial statements for the year ended December 31, 2010. The SPII operations are presented as the Investment Operations segment in the consolidated financial statements on an investment company basis for accounting and financial reporting purposes until July 15, 2009. From July 16, 2009, the Investment Operations segment ceased upon the completion of the Exchange Transaction when SPII’s net assets were acquired by and became part of SPH’s business and such assets were no longer managed as an investment fund. Under investment company accounting policies, the Investment Operations segment recognized unrealized appreciation or depreciation of investments in net income whereas under SPH’s accounting policies as an operating company, unrealized appreciation or depreciation of available-for-sale investments is reported in other comprehensive income as part of SPH capital. Under investment company accounting the Investment Operations segment did not consolidate investments in which it owned more than 50% and did not apply the equity method of accounting to investments that it owned between 20% and 50%.
The purpose of the Investment Operations segment until July 15, 2009 was to serve as the investment vehicle for the SPII Fund until July 15, 2009 before the completion of the Exchange Transaction. The SPII Fund had the objective of achieving capital appreciation by primarily investing in undervalued companies which it had the potential to exert a level of influence or control. It generally held its holdings for many years. The investment operations segment employed an active/value relationship strategy of investing in its companies and it worked constructively/cooperatively with management and boards to improve the businesses, through operational excellence programs to achieve higher returns on invested capital. When necessary to effect change at its companies to unlock value, SPII sought board representation and senior management roles.
SPII held a concentrated number of investments which often required a period of time for the value to be unlocked. Performance in any period was driven by the composition of SPII’s investments in any such period, which varied from period to period. The concentrated nature of SPII’s holdings and the timing of events with respect to particular companies often resulted in SPII’s performance in a period, which was based upon the change in the fair value of its holdings for financial reporting purposes, to be inconsistent from period to period, rather than when considered over the longer term horizon over which SPII generally owned its companies. Investment Operations’ past performance is not necessarily indicative of future results of SPH after its acquisition of SPII’s assets.
Effective as of July 15, 2009, the SPII Fund redeemed from SPH cash and securities held by SPII in order for SPII Fund to redeem its investors in full and establish reserves for certain SPII Fund entities pursuant to the Exchange Transaction and the SPII Fund Plan, leaving in SPII the cash and other assets related to SPII Fund investors that elected to exchange their pro rata share of such assets for our common units. See “Asset Acquisition and Unit Issuance – Exchange Transaction” above.
The following presents a summary of the Investment Operations segment performance:
|
January 1, 2009
|
||||
|
to
|
||||
|
July 15, 2009
|
||||
|
Investment income
|
$ | 12,014 | ||
|
Investment expenses
|
2,383 | |||
|
Investment income, net
|
9,631 | |||
|
Net realized and unrealized loss on investment transactions
|
(63,695 | ) | ||
|
Net loss attributable to redeemable partners’ capital
|
$ | (54,064 | ) | |
Discussion of the Investment Operations Segment’s Performance (through July 15, 2009)
The following presents a summary of the operations for the period from January 1, 2009 to July 15, 2009; and a general discussion of the Investment Operations segment performance during the period.
|
January 1, 2009
|
||||
|
to
|
||||
|
July 15, 2009
|
||||
|
Partners’ Capital (a)
|
$ | 466,000 | ||
|
Period return (b)
|
-7.74 | % | ||
|
Inception to date Return (b) (c)
|
11.51 | % | ||
_______________
|
(a)
|
For SPII.
|
|
(b)
|
As a result of a SPII Fund restructuring in 2007, the management and administration fees and incentive allocations to the SPII’s general partner (“SPII General Partner”) that were paid by SPII prior to 2007 were thereafter paid by other SPII Fund entities. The net return is for a limited partner that was admitted to SPII Onshore for the entire period in order to compare the results of Investment Operations for the period, along with the impact on such results of the management and administration fees paid by SPII Fund investors, with the inception to date return results.
|
|
(c)
|
Represents the annualized return net of all management and administrative fees paid to affiliates of the Manager and incentive allocations to the SPII General Partner by SPII and SPII Onshore, as the case may be, from October 1993, the “Inception Date”, through the stated period.
|
January 1, 2009 to July 15, 2009 Performance
Investment Operations had a net negative return of 7.74% for the period January 1, 2009 to July 15, 2009, representing a net loss of $54.1 million for the period.
2
The year began where 2008 left off with declining equity markets and debt markets that had virtually closed. This created many challenges for SPII’s companies as they struggled to refinance debt, negotiate debt covenants and raise additional equity. The effect on Investment Operations was a net negative return of 16.5% through March 2009,
3
while gaining during the remainder of the period to end with a net negative return of 7.74%.
4
Conseco Inc. (“Conseco”), GenCorp, Unisys Corporation (“Unisys”) and HNH, holdings of Investment Operations, came under extreme pressure during the period. The six months following the collapse of Lehman Brothers represented the worst performance over any six month period since SPII’s inception in October 1993.
2
As a result of a SPII Fund restructuring in 2007, the management and administration fees and incentive allocations to the SPII General Partner that were paid by SPII prior to 2007 were thereafter paid by other SPII Fund entities. The net return is for a limited partner that was admitted to SPII Onshore for the entire period in order to compare the results of Investment Operations for the period, along with the impact on such results of the management and administration fees paid by SPII Fund investors, with the inception to date return results.
While Conseco reported net income before net realized investment losses, taxes and discontinued operations of $49 million for its fourth quarter ending December 31, 2008 versus $27 million in the year-earlier quarter, it also announced that its auditor sought more information about its investment portfolio, liquidity and debt covenants. As a result, the company’s share price declined by approximately 95% from the beginning of the year through mid-March, and the company was forced to negotiate an amendment to its existing covenant agreements. These actions were received positively and the company’s share price recovered between March and July 15, 2009, up approximately six-fold from its March 2009 lows and ultimately Conseco’s market value declined by approximately 55% for the period.
HNH responded to declining sales and revenue by aggressively implementing significant cost containment and reduction actions across all of the company’s businesses, as well as the corporate headquarters. These initiatives significantly contributed to HNH achieving positive adjusted EBITDA (a non-GAAP measure) of $18.4 million for the first six months of 2009, as compared to $27.0 million for the same period in 2008, despite sales declines of up to 30% in many of its underlying businesses. HNH’s share price declined by approximately 65% during this period.
With a turnaround in most asset classes following their March 2009 lows, several SPII companies re-entered the debt and equity markets in an effort to improve their balance sheets. SPII worked closely with HNH and GenCorp on strategies to refinance their debt. During the period, Unisys announced an exchange offer for its senior bondholders that, if accepted, would improve its liquidity by extending the maturity of the majority of its debt beyond 2013. The proposed exchange offer was greeted as positive news by shareholders and, along with continued cost cutting by management and new contracts, the company’s stock appreciated approximately 100% for the period.
Comparison of Selected Financial Information for the Investment Operations Segment
Investment Income
Investment income, consisting primarily of interest and dividend income, for the period from January 1, 2009 to July 15, 2009 was $12,014. Investment income fluctuated depending upon the number and composition of securities held and the composition of securities sold, not yet purchased. Results for 2009 includes only six and a half months of investment income.
Interest income included in investment income for the period from January 1, 2009 to July 15, 2009 was $8,051. Other than the inclusion of only six and half months of interest income in 2009, the primary factors affecting interest income in the period ending July 15, 2009 was the repayment and reduction in the prime rate base rate for debt securities held by Investment Operations, together with a reduction in the number of securities sold, not yet purchased for which Investment Operations earned a rebate.
Dividend income for the period from January 1, 2009 to July 15, 2009 was $3,963. Other than the inclusion of only six and half months of dividend income in 2009, the dividend for a major holding is usually announced and recorded at the end of each year and therefore is not included in the six and a half months 2009 period.
Investment Expenses
Interest expense represents interest on margin account borrowings incurred for the purchase of securities and charges on certain securities sold, not yet purchased. Interest expense for the period from January 1, 2009 to July 15, 2009 was $710. Dividends represent dividends due on securities sold not yet purchased. Dividends were $782 in 2009.
Professional fees include expenses for administrators, legal, accounting, audit, tax and other consulting fees. Professional fees for the six and a half months ended July 15, 2009 were $891.
Corporate
For comparability purposes, revenue and costs and expenses for the periods from January 1, 2009 to July 15, 2009 and from July 16, 2009 to December 31, 2009 are combined.
The following presents a summary of the Corporate segment:
|
Year Ended December 31,
|
||||||||||||
|
2011
|
2010
|
2009
|
||||||||||
|
Revenue:
|
||||||||||||
|
Investment and other income
|
$ | 684 | $ | 4,007 | $ | 1,781 | ||||||
|
Net investment (losses) gains
|
(4,352 | ) | 24,050 | 9,545 | ||||||||
| (3,668 | ) | 28,057 | 11,326 | |||||||||
|
Costs and expenses:
|
||||||||||||
|
Interest
|
631 | 1,163 | 1,097 | |||||||||
|
Selling, general and administrative
|
9,477 | 12,933 | 4,181 | |||||||||
|
Management fees - related party
|
8,169 | 7,531 | 3,705 | |||||||||
|
(Decrease) Increase in deferred fee liability to related party
|
(6,107 | ) | 6,268 | 6,992 | ||||||||
|
Other income (a)
|
(8,978 | ) | - | - | ||||||||
| 3,192 | 27,895 | 15,975 | ||||||||||
|
(Loss) income from continuing operations before (loss) income from associated companies
|
(6,860 | ) | 162 | (4,649 | ) | |||||||
|
(Loss) income of associated companies
|
(22,535 | ) | (10,873 | ) | 9,411 | |||||||
|
Loss from other investment - related party
|
(15,743 | ) | (3,220 | ) | (2,960 | ) | ||||||
|
Net (loss) income from continuing operations
|
$ | (45,138 | ) | $ | (13,931 | ) | $ | 1,802 | ||||
|
(a)
|
Represents bargain purchase gain related to the acquisition of DGT (see Note 2 - “Acquisitions” to the financial statements of SPH for the years ended December 31, 2011, 2010 and 2009 included elsewhere in this Form 10-K for additional information).
|
Corporate consists of BNS (through February 2, 2011, the date BNS acquired SWH), as well as associated companies Steel Excel and CoSine. Steel Excel acquired certain businesses in 2011, and is seeking to acquire additional business operations. CoSine is in the business of seeking to acquire one or more business operations. In addition, Corporate has investments in securities, the SPII Liquidating Trust and cash and cash equivalents. We account for Cosine under the equity method of accounting, and have elected the fair value option to account for our investment in Steel Excel and the SPII Liquidating Trust. Corporate revenues primarily consist of investment and other income and investment gains and losses. Corporate assets, revenues and overhead expenses are not allocated to the segments. Corporate includes certain assets and the financial results for the period from July 16, 2009 to December 31, 2009 resulting from the Acquisition of SPII’s assets effective July 15, 2009. The SPII Liquidating Trust investments are accounted for under the fair value option; and changes in fair value are reported in the consolidated statement of operations and in the Corporate segment as “Loss from other investment - related party”. For comparability purposes, the revenue and costs and expenses for the periods from January 1, 2009 to July 15, 2009 and from July 16, 2009 to December 31, 2009 are combined. We believe this presentation is more meaningful for management’s discussion because corporate is presented on an operating company basis for all periods including all of 2009.
Revenue
Investment and other income is often based on a limited number of transactions, the timing and amounts of which are not always predictable. Net investment gains (losses) include realized gains and losses on sales of securities and write-downs of investments available-for-sale when there is deemed to be an other than temporary impairment. The Company’s decision to sell securities and realize gains or losses generally includes its evaluation of strategic considerations, an individual security’s value at the time and the prospect for changes in its value in the future. The timing of realized investment gains or losses is not predictable and does not follow any pattern from year to year. Interest and dividend income will vary depending on the type and amount of securities held from year to year.
Investment and other income was $684 for the year ended December 31, 2011 compared to $4,007 in the same period last year. The decrease in 2011 was primarily due to a decline in the fair value of investments, partially offset by interest income. The income in 2010 is comprised primarily of interest income.
Net investment (losses) gain for the year ended December 31, 2011 was $(4,352) compared to $24,050 in the same period of 2010. The net loss in the 2011 period was due to losses on certain derivative investments, partially offset by a gain on our investment in DGT of $7,921 resulting from the re-measurement of our investment upon the acquisition of a majority interest in DGT on July 5, 2011. See Note 2 to the financial statements of SPH for the year ended December 31, 2011 included elsewhere in this Form 10-K for further information. The net gain in the 2010 period was due to realized gains on the sales of certain equity and other investments.
Revenue for 2010 was $28,057 and revenue for 2009 was $11,326, of which $11,427 was generated during the period July 16, 2009 through December 31, 2009 from the investments acquired as part of the Acquisition.
Investment and other income for 2009 consisted of interest and dividend income earned on certain assets acquired as part of the Acquisition from July 16, 2009 through December 31, 2009. Our investments were $200,015 at December 31, 2009 and included corporate bonds and other debt instruments and preferred shares which provided $1,781 in interest and dividend income in 2009. Net investment gains of $9,545 for 2009 were realized on available-for-sale securities acquired as part of the Acquisition. The gains were due primarily to net gains on sale of certain debt and equity available-for-sale securities, net of losses from short sales. Total proceeds from sales in 2009, including short sales, were $333,270.
Interest Expense
In the ordinary course of business the Company may sell securities short and enter into foreign currency transactions which, in effect, in certain circumstances, may represent borrowings from the counterparty. Interest expense represents interest and other fees on such transactions.
Selling, General and Administrative Expenses
Selling, general and administrative expenses (“SG&A”) consist primarily of legal, accounting, audit, tax, professional fees and common unit option expense. SG&A expenses decreased from $12,933 in 2010 to $9,477 in 2011 primarily due to the reclassification of BNS to the Diversified Industrial segment in 2011, after BNS purchased SWH, which reduced 2011 Corporate SG&A expenses by approximately $1,500. In addition, the decrease in SG&A expenses was impacted by a decrease in expense related to the common unit option liability (see Note 17 – Capital and Comprehensive Income” in the SPH financial statements for the years ended December 31, 2011, 2010 and 2009, included elsewhere in this Form 10-K). These factors were partially offset by higher professional and consulting costs in 2011 compared to the same period in 2010.
SG&A expenses increased from $4,181 in 2009 to $12,933 in 2010 primarily due to higher general corporate expenses of approximately $2,000 and higher legal, audit and professional fees of approximately $5,400 related to the Company’s transition to a more complex and diversified operating company which included the acquisition of HNH, the sale of Collins, increasing ownership positions in associated companies and the sale of non-strategic investments. Also, the higher professional fees reflect a full year in 2010 in connection with the Exchange Transaction during 2009.
Management Fees to Related Party
Under a management agreement with the Manager effective January 1, 2009 and amended July 15, 2009, SPH pays a monthly management fee based on 1.5% per annum of the net asset value of the Company’s common units. When the common units are listed on a national securities exchange, the management fee will be based on the market capitalization of SPH. Effective January 1, 2012, SPH will pay a quarterly Management Fee at a rate of 1.5% of total partner’s capital, payable on the first day of each quarter and subject to quarterly adjustment. SPH also reimburses the Manager for any costs it incurs on behalf of the Company or in connection with its provision of services under the management agreement. See Note 14 – “Related Party Transactions” to the SPH financial statements found elsewhere in this Form 10-K. No management fees were payable under the management agreement prior to July 15, 2009.
Management fees – related party increased from $7,531 in 2010 to $8,169 in 2011 due to changes in net asset value of the Company’s common units. Management fees – related party increased from $3,705 in 2009 to $7,531 in 2010, primarily due to a full year of fees reflected in 2010 under the July 15, 2009 amended management agreement discussed above. Management fees – related party in 2009 became payable to the Manager after the Acquisition and were based on net asset value calculations for the period from July 16, 2009 to December 31, 2009.
(Decrease) Increase in Deferred Fee Liability to Related Party
(Decrease) increase in deferred fee liability to related party is an expense that arose beginning July 16, 2009 as a result of the assumption in connection with the Exchange Transaction of an obligation pursuant to a deferred fee agreement due to WGL, an affiliate of the Manager (“Deferred Fee Liability”). The decrease in the Deferred Fee Liability to related party of $6,107 recorded in 2011 was due to a decrease in an index related to the value of SPH.
The increase in the Deferred Fee Liability to related party of $6,268 recorded in 2010 was due to an increase in an index related to the value of SPH.
The expense included in the consolidated statement of operations of $6,992 in 2009 was calculated in accordance with the terms of the deferred fee agreement. The 2009 expense represents an increase in the Deferred Fee Liability from $51,594 at July 16, 2009 to $58,586 at December 31, 2009 resulting from an increase in an index related to the value of SPH in effect during the period.
Income (Loss) of Associated Companies
Income (loss) of associated companies included in the Corporate segment is as follows:
|
July 16, 2009
|
January 1,
|
|||||||||||||||||||
|
Ownership at
|
to
|
2009 to
|
||||||||||||||||||
|
December 31,
|
Year Ended December 31,
|
December 31,
|
July 15,
|
|||||||||||||||||
|
2011
|
2011
|
2010
|
2009
|
2009
|
||||||||||||||||
|
Steel Excel
|
40.3 | % | $ | (22,092 | ) | $ | (10,439 | ) | $ | 9,395 | $ | - | ||||||||
|
Cosine
|
46.8 | % | (385 | ) | (440 | ) | (127 | ) | - | |||||||||||
|
Other
|
(58 | ) | 6 | 80 | 63 | |||||||||||||||
| $ | (22,535 | ) | $ | (10,873 | ) | $ | 9,348 | $ | 63 | |||||||||||
Income (loss) of associated companies includes income or loss we recognize on investments where we own between 20% and 50% of the outstanding equity and have the ability to exercise influence, but not control, over the investee. In 2009, we purchased certain investments from SPII, acquired additional investments on July 15, 2009 in connection with the Acquisition, and we purchased additional shares in the open market. We classify these investments as investments in associated companies, account for them using the equity method, report our share of their net income/loss in our consolidated income statements, report our share of their comprehensive income/loss in our consolidated statements of changes in capital and comprehensive income (loss) from the dates we reach 20% ownership and have significant influence over the operating and financial decisions of the investee. Subsequent to December 31, 2009, the Company’s ownership in Steel Excel exceeded 20% and the equity method is being applied on a retroactive basis from the initial acquisition of Steel Excel shares in connection with the Exchange Transaction on July 15, 2009. Our investment in Steel Excel is accounted for under the equity method at fair value. Unrealized gain/loss on Steel Excel is reported in the consolidated statement of operations and is included in the above segment results.
In the consolidated statements of operations, we recognize the income of associated companies only from the date the investment qualifies for equity method accounting (where the fair value option has not been elected). Investment purchases in our associated companies were made from July 14, 2009 through December 31, 2009 resulting in increasing ownership interests throughout the period. As a result, amounts in our consolidated statement of operations represent less than a full year of operating results for our equity-method investees where the fair value option has not been elected, and may have been included based on a lower percentage interest than that held at December 31, 2009. The discussions below are based on the fiscal year annual reported results of the associated companies.
Steel Excel sold substantially all of its operating businesses on June 8, 2010. In 2011, Steel Excel acquired certain businesses and is currently seeking to acquire one or more additional businesses. This strategy may allow Steel Excel to realize future cash flow benefits from its net operating loss carryforwards (“NOLs”). At December 31, 2011, Steel Excel had NOLs of $208.7 million for federal and $154.3 million for state purposes that expire in various years beginning in 2019 for federal and 2011 for state purposes. No assurance can be given that Steel Excel will be able to utilize its existing NOLs. For the fiscal year ended December 31, 2011, Steel Excel incurred a net loss from continuing operations of $218 on net sales of $2,593, which sales resulted from acquisitions made in fiscal 2011. The net loss included $9,944 of selling, general and administrative expenses, offset by gross profit on sales of $1,116 and interest and other income of $8,358. Steel Excel also reported income from discontinued operations, net of taxes, of $6,915. On December 8, 2011, Steel Excel acquired the business and assets of Rogue Pressure Services, LLC. The purchase price for Rogue was approximately $29 million, which was paid in cash, with the sellers receiving the opportunity to earn additional consideration based upon Rogue’s achievement of certain performance levels pursuant to an earn-out. On pro forma basis, had the acquisition of Rogue occurred at the beginning of fiscal 2011, the combined results of Rogue and Steel Excel would have resulted in net revenues of $17,917 and income from continuing operations, net of taxes, of $1,409.
CoSine is a company currently seeking to acquire one or more new businesses. CoSine’s results for the periods indicated above reflect administrative costs and costs incurred in seeking acquisitions. CoSine’s strategic plan is to redeploy its existing resources to identify and acquire, or invest in, one or more operating businesses with the potential for generating taxable income and/or capital gains. This strategy may allow CoSine to realize future cash flow benefits from its NOLs. As of December 31, 2011, Cosine had federal NOLs of approximately $355.6 million, which will begin to expire in 2018 if not utilized and state NOLs of approximately $224.1 million, which will begin to expire in 2012 if not utilized. No assurance can be given that CoSine will be able to utilize its existing NOLs.
Loss From Other Investments – Related Party
Loss from other investments – related party includes income or loss we recognize on our 43.75% investment in each series of the SPII Liquidating Trust, as described in Note 6 – “Investments” of the consolidated financial statements. These investments were acquired and initially recorded as described in Note 3 “Acquisitions” in the consolidated financial statements in connection with the Exchange Transaction. See “Asset Acquisitions and Unit Issuance – Acquisition of Assets of SPII”. The Company elected to account for its investments in each series of the SPII Liquidating Trust under the equity method at fair value beginning July 16, 2009, the date these investments became subject to the equity method. Unrealized gain/loss on each series of the SPII Liquidating Trust is reported in the consolidated statement of operations.
Income Taxes
As a limited partnership, for periods after December 31, 2008, we are generally not responsible for federal and state income taxes and our profits and losses are passed directly to our limited partners for inclusion in their respective income tax returns. Provision has been made for federal, state, local or foreign income taxes on the results of operations generated by our corporate subsidiaries and these are reflected within continuing and discontinued operations. The difference between the effective tax rate and statutory federal rate of 35% is principally due to changes in the valuation allowances and partnership income not subject to taxation.
For the years ended December 31, 2011, 2010 and 2009 a tax benefit (provision) from continuing operations of $63,965, $(2,657) and $811 was recorded, respectively.
During 2011, the Company changed its judgment about the realizability of its deferred tax assets at certain subsidiaries. The Company considered factors such as future operating income of our subsidiaries, expected future taxable income, mix of taxable income, and available carryforward periods. As a result, the Company estimated that it is more likely than not that it will be able to realize the benefit of certain deferred tax assets. However, in certain jurisdictions, the Company does not consider it more likely than not that all of the state net operating loss carryforwards will be realized in future periods, and have retained a valuation allowance against those. Because the determination of the realizability of deferred tax assets is based upon management’s judgment of future events and uncertainties, the amount of the deferred tax assets realized could be reduced if actual future income or income tax rates are lower than estimated. In accordance with GAAP, the effect of a change in the beginning-of-the-year balance of a valuation allowance that results from a change in circumstances that causes a change in judgment about the realizability of the related deferred tax asset in future years should be included in income from continuing operations in the period of the change (see Note 20 – “Income Taxes” to the SPH financial statements found elsewhere in this Form 10-K). As a result, included in the Company’s tax benefit in 2011 is approximately $83,000 related to the release of valuation allowances primarily relating to NOL’s. Of this amount, approximately $73,000 was related to HNH and approximately $9,400 was related to BNS.
At December 31, 2011, HNH has U.S. federal NOLs of approximately $183,000 (approximately $64,100 tax-effected), as well as certain state NOLs. The U.S. federal NOLs expire between 2018 and 2029. In 2011, $1,641 of NOLs were utilized providing a tax benefit of $574.
At December 31, 2011, WebFinancial Holding Corporation has $108 of net operating loss carryforwards that are scheduled to expire beginning in 2026. In 2011, $4,117 of net operating loss carryforwards were utilized providing a tax benefit of $1,400.
At December 31, 2011, BNS has $21,188 of federal NOLs that are scheduled to expire from 2021 to 2028. In 2011, $2,119 of NOLs were utilized providing a tax benefit of $720.
At October 31, 2011, DGT has $52,161 of federal NOLs that expire at various times between July, 2020 and July, 2030.
Other Comprehensive Income
The following presents a summary of other comprehensive income:
|
July 16, 2009
|
January 1,
|
|||||||||||||||
|
to
|
2009 to
|
|||||||||||||||
|
Year Ended December 31,
|
December 31,
|
July 15,
|
||||||||||||||
|
2011
|
2010
|
2009
|
2009
|
|||||||||||||
|
Unrealized (loss) gain on available for sale investments
|
$ | 11,831 | $ | (37,436 | ) | $ | 57,989 | $ | 247 | |||||||
|
Currency translation adjustment
|
(3,502 | ) | 658 | 1,194 | - | |||||||||||
|
Change in net pension and other benefit obligations
|
(27,828 | ) | (8,802 | ) | (5,809 | ) | - | |||||||||
|
Other comprehensive (loss) income
|
$ | (19,499 | ) | $ | (45,580 | ) | $ | 53,374 | $ | 247 | ||||||
Other comprehensive income primarily represents the net unrealized gains and unrealized losses during the period on available-for-sale securities held at the end of each reporting period, adjusted for the reversal of unrealized gains and unrealized losses recognized in prior periods on available-for-sale securities sold during the period.
The Unrealized gain on available for sale securities for the year ended December 31, 2011 was due to the reclassification of unrealized losses from other comprehensive (loss) income to income from continuing operations that were recognized on the sales of certain investments and the increase in value of certain other securities. The majority of the Unrealized loss on available for sale securities for the twelve months ended 2010 was due to the reclassification of unrealized gains from other comprehensive income to income from continuing operations that were recognized on the sales of certain investments and the decline in value of certain other securities.
The Unrealized (loss) for the year ended December 31, 2010 was due to the reclassification of unrealized gains that were recognized on the sales of certain investments as well as the reclassification of certain investments from available-for-sale securities to associated companies in 2010. These decreases were partially offset by a net increase in the value of other investments. The increase in 2009 is primarily related to unrealized gains during the period July 16, 2009 to December 31, 2009 on available-for-sale securities acquired as part of the Acquisition, which as a result of an improvement in overall market conditions and company performance, resulted in an increase in the estimated fair value of our investments. In particular, GenCorp was a major contributor to this net increase in unrealized gains among our other core companies. The balance of the increase is driven by unrealized gains on available-for-sale securities that the Company holds pending redeployment of the capital for strategic purposes.
Liquidity and Capital Resources
Holding Company
SPH, excluding its operating subsidiaries, the “Holding Company,” is a global diversified holding company whose assets principally consist of the stock of its direct subsidiaries, cash and cash equivalents and other non-controlling investments in debt and equity securities. The Holding Company continuously evaluates the retention and disposition of its existing operations and investments and investigates possible acquisitions of new businesses in order to maximize unitholder value. Accordingly, further acquisitions, divestitures, investments and changes in capital structure are possible. Its principal potential sources of funds are available cash resources, investments, borrowings, public and private capital market transactions, repayment of subsidiary advances, distributions or dividends from subsidiaries, as well as dispositions of existing businesses and investments. The Holding Company’s investments are subject to changes that may result in amounts realized from any future sales that are, at times significantly different from the value we are reporting at December 31, 2011. These investments, including those accounted for under the equity method, can be impacted by market conditions, changes in the specific business environments of our investees or by the underlying performance of these businesses.
In addition to cash and cash equivalents, the Holding Company considers investments at fair value included in its consolidated balance sheet as being generally available to meet its liquidity needs. Investments at fair value are not as liquid as cash and cash equivalents, but they are generally convertible into cash within a reasonable period of time. As of December 31, 2011, the Holding Company had cash and cash equivalents of $13,417 and investments of $120,724. The Holding Company had $23,736 of restricted cash which serves as collateral with respect to foreign currency financial instruments. The Holding Company is not able to use these funds for other purposes, and the Holding Company does not consider this amount to be available to meet its liquidity needs.
The Holding Company generally does not have access to the cash flow generated by the Company’s operating businesses for its needs, and the operating businesses generally do not rely on the Holding Company to support their operating activities. The Holding Company’s available liquidity, and the investment income realized from the Holding Company’s cash, cash equivalents and marketable securities is used to meet the Holding Company’s recurring cash requirements, which are principally the payment of its overhead expenses. The Holding Company’s only long-term cash requirement is the payment of the Deferred Fee Liability which was valued at $58,747 as of December 31, 2011, and 1.9% of which is due in 2012, 8.5% of which is due in 2013, 19.6% of which is due in 2014, 12.4% of which is due in 2015 and 57.6% of which is due in 2016 through 2018. Assuming no increase or decrease in value of the Deferred Fee Liability as of December 31, 2011, $1,107 would be due in 2012, $5,005 would be due in 2013, $11,497 would be due in 2014, $7,287 would be due in 2015 and $33,851 would be due in 2016 through 2018, which would be payable in cash, unless WGL elects to have the amount paid through the issuance of common units. The Deferred Fee Liability may become immediately due and payable upon certain termination events as specified in the deferred fee agreement. The Holding Company also provides a $4,000 line of credit to WebBank, which was undrawn as of December 31, 2011.
The Holding Company and its operating businesses may use their available liquidity to make acquisitions of new businesses and other investments, but, the timing and cost of any future investments cannot be predicted. The Company may seek external debt or equity financing and will rely on its existing liquidity to fund corporate overhead expenses, the payment of the Deferred Fee Liability, and new acquisition opportunities. It may also dispose of existing businesses and investments. At December 31, 2011, the Holding Company and its consolidated subsidiaries had, in the aggregate, cash and cash equivalents of $127,027 available for operations in the ordinary course of business and for the acquisition of interests in businesses. In addition, a portion of the Holding Company’s investments at fair value, as may be determined from time to time not to be strategic, are also available to be sold and the proceeds of which may be used acquire interests in other businesses and finance operations in the ordinary course.
As of December 31, 2011, SPH’s associated companies, without giving effect to SPH’s ownership share of such companies, had, in the aggregate, approximately $377,000 of cash and marketable securities (including approximately $354,000 related to Steel Excel) available for operations in the ordinary course of business and potential acquisition of businesses. SPH does not have control of or access to this cash and marketable securities.
Discussion of Segment Liquidity and Capital Resources
Diversified Industrial
HNH
As of December 31, 2011, HNH’s current assets totaled $171.6 million and its current liabilities totaled $100.4 million. Therefore, its working capital was $71.2 million, as compared to working capital of $30.2 million as of December 31, 2010.
HNH generated $21.6 million and $44.8 million of positive cash flow from operating activities in 2011 and 2010, respectively. In our consolidated financial statements we reported recorded pre-tax income of $40,696 relating to HNH from continuing operations in 2011 and $99 million of net income from continuing operations, principally resulting from an approximately $58 million income tax benefit. The income tax benefit primarily reflected a non-recurring reversal of HNH’s deferred tax valuation allowance.
On September 12, 2011, HNH’s principal subsidiary, H&H Group, entered into an Amended and Restated Loan and Security Agreement (the “Ableco Refinancing”) with Ableco, L.L.C., one of its existing lenders, to increase the size of the total term loan thereunder from $25.0 million to up to $75.0 million (the “Ableco Facility”) and to amend certain covenants. The Ableco Facility now provides for three separate term loans (“Second Lien Term Loans”) at a maximum value of $25.0 million per Second Lien Term Loan. The first and second Second Lien Term Loans bear interest at the U.S. base rate (the prime rate) plus 4.5% or LIBOR (or, if greater, 1.50%) plus 6.00%. The third Second Lien Term Loan bears interest at the U.S. base rate (the prime rate) plus 7.50% or LIBOR (or, if greater, 1.75%) plus 9.00%. In September, an additional $50.0 million was borrowed under the Ableco Facility, making the outstanding total of the Second Lien Term Loans $75.0 million. All amounts outstanding under the Ableco Facility are due and payable in full on July 1, 2013.
In connection with the Ableco Refinancing on September 12, 2011, H&H Group amended the Loan and Security Agreement (the “Wells Fargo Facility”) dated October 15, 2010, as amended, by and between H&H Group, together with certain of its subsidiaries, and Wells Fargo Bank, National Association, as administrative agent for the lenders thereunder. The Wells Fargo Facility was amended to, among other things, permit the modification of the Ableco Facility, amend certain covenants and extend the maturity date of the Wells Fargo Facility to July 1, 2013.
On October 14, 2011, H&H Group redeemed $25.0 million principal amount of its outstanding Subordinated Notes on a pro-rata basis among all holders thereof at a redemption price of 102.8% of the principal amount and accrued but unpaid payment-in-kind-interest thereof, plus accrued and unpaid cash interest. Until October 14, 2013, the Subordinated Notes are not detachable from Warrants to purchase HNH’s common stock, exercisable beginning October 14, 2013, that were issued with the Subordinated Notes as units. Accordingly, a pro rata portion of Warrants were also redeemed on October 14, 2011. After giving effect to the redemption on October 14, 2011, the principal amount of the outstanding Subordinated Notes was approximately $40.6 million.
For HNH, the parent company, sources of cash flow consist of its cash on-hand, distributions from its principal subsidiary, H&H Group, and other discrete transactions. H&H Group’s credit facilities restrict H&H Group’s ability to transfer any cash or other assets to HNH, subject to the following exceptions: (i) unsecured loans for required payments to the WHX Pension Plan, a defined benefit pension plan sponsored by HNH, (ii) payments by H&H Group to HNH for the payment of taxes by HNH that are attributable to H&H Group and its subsidiaries, and (iii) unsecured loans, dividends or other payments for other uses in the aggregate principal amount, together with the aggregate amount of all other such loans, dividends and payments, not to exceed $60.0 million in the aggregate (a portion of which has been used). These exceptions are subject to the satisfaction of certain conditions, including the maintenance of minimum amounts of excess borrowing availability under the credit facilities. H&H Group’s credit facilities are collateralized by first priority liens on substantially all of the assets of H&H Group and its subsidiaries.
The ability of H&H Group to draw on its revolving line of credit under the Wells Fargo Facility (the “First Lien Revolver”) is limited by its borrowing base of accounts receivable and inventory. As of January 31, 2012 and December 31, 2011, HNH’s availability under the First Lien Revolver was $44.0 million and $40.4 million, respectively.
There can be no assurances that H&H Group will continue to have access to its lines of credit if financial performance of its subsidiaries do not satisfy the relevant borrowing base criteria and financial covenants set forth in the applicable financing agreements. If H&H Group does not meet certain of its financial covenants or satisfy the borrowing base criteria in its credit facilities, and if it is unable to secure necessary waivers or other amendments from the respective lenders on terms acceptable to management, its ability to access available lines of credit could be limited, its debt obligations could be accelerated by the respective lenders, and liquidity could be adversely affected.
HNH believes that it will be able to meet its cash requirements to fund its activities in the ordinary course of business for at least the next twelve months. However, that ability is dependent, in part, on HNH’s continuing ability to materially meet its business plans. There can be no assurance that the funds available from operations and under HNH’s credit facilities will be sufficient to fund its debt service costs, working capital demands, pension plan contributions, and environmental remediation costs. If HNH’s planned cash flow projections are not met, management could consider the additional reduction of certain discretionary expenses and the sale of certain assets and/or businesses.
Furthermore, if HNH’s cash needs are significantly greater than anticipated or HNH does not materially meet its business plans, HNH may be required to seek additional or alternative financing sources. There can be no assurance that such financing will be available or available on terms acceptable to HNH. HNH’s inability to generate sufficient cash flows from its operations or through financing could impair its liquidity, and would likely have a material adverse effect on its businesses, financial condition and results of operations.
BNS
As of December 31, 2011, BNS current assets totaled $15.3 million and its current liabilities were $9.1 million, for a working capital of $6.2 million as compared to working capital of $38.1 million at December 31, 2010. The decrease in working capital is due to the February 2, 2011 acquisition of SWH and its wholly owned subsidiary Sun Well. BNS funded the $50.4 million acquisition using its cash, supplemented by a $14.0 million loan from SPH, which was repaid in September 2011.
Sun Well entered into a credit agreement with Wells Fargo Bank, National Association in June 2011 that included a $20.0 million term loan and a revolving line of credit for up to $5.0 million. The term loan is repayable in $1.0 million quarterly installments from September 30, 2011 through June 30, 2015. The balance of the term loan at December 31, 2011 was $18.0 million, of which $4.0 million is shown as a current liability. There were no borrowings under the revolving line of credit during the year ended December 31, 2011.
Sun Well uses capitalized lease obligations to fund a portion of its capital acquisitions. At December 31, 2011 capitalized lease obligations were $2.1 million.
Sun Well paid a $20.0 million dividend to BNS in July 2011 and BNS used a portion of the proceeds to repay the $14.0 million loan, plus accrued interest, to SPH in September 2011. BNS incurred a total of $946 interest expense on such loan.
BNS source of cash flows are the cash flows generated by SWH and Sun Well. Sun Well uses its operating cash flows as well as the borrowings under its term loan and borrowings under capital leases to fund its operations and its debt obligations. The loan is secured by the assets of Sun Well and limits the amount of cash that it can distribute to BNS in the form of loans or dividends. The line of credit availability is limited based on Sun Well’s borrowing base assets (primarily accounts receivable), and is only available if Sun Well is in compliance with the terms of its loan agreements and has sufficient borrowing base assets. There can be no assurances that Sun Well will continue to have access to its line of credit if its financial performance does not satisfy the relevant borrowing base criteria and financial covenants set forth in the applicable financing agreement. If Sun Well does not meet certain of its financial covenants or satisfy the borrowing base criteria in its credit facilities, and if it is unable to secure necessary waivers or other amendments from the respective lenders on terms acceptable to Sun Well, its ability to access available lines of credit could be limited, its debt obligations could be accelerated by the respective lenders, and liquidity could be adversely affected.
BNS expects that it will be able to fund its activities in the ordinary course of business over at least the next twelve months.
DGT
At January 28, 2012, its most recent fiscal period reported to the SEC on Form 10-Q, DGT had $43.3 million in cash and cash equivalents. As discussed below, on November 3, 2011 DGT received $27.3 million in connection with the sale of Villa. DGT’s sources of capital include, but are not limited to, cash flow from operations and short-term credit facilities. DGT believes that available short-term and long-term capital resources are sufficient to fund DGT’s working capital requirements, scheduled debt payments, interest payments, capital expenditures and income tax obligations for the next 12 months.
During its fiscal year ended July 30, 2011, DGT completed a Rights Offering which provided $14.3 million, net of expenses. DGT also received proceeds of $2.5 million for a mortgage on its Bay Shore, NY facility. In addition, approximately $2.4 million of long-term debt was repaid, including the approximately $1.0 million for the purchase price of the manufacturing facility in Milan, Italy at the conclusion of its lease in April 2011.
On September 12, 2011, DGT entered into a share purchase agreement (the “Share Purchase Agreement”) with VIV s.r.l., a limited liability company incorporated under Italian law (“VIV”), pursuant to which DGT agreed to sell all of the shares of its Italian subsidiary, Villa, its medical and dental imaging systems segment, to VIV, subject to the terms and conditions set forth therein. The sale was consummated on November 3, 2011. As a result, the operations of Villa are reflected as discontinued operations in our consolidated financial statements for the period from July 5, 2011. In conjunction with the sale, immediately prior to the sale, Villa paid a dividend to DGT in the amount of $4,538. In consideration for the sale of the shares of Villa to VIV, DGT received $22,761 in cash and an unsecured subordinated promissory note (the “Note”) made by VIV in the amount of €500. The Note has a term of 5 years with interest accruing at a rate of 6% per annum beginning 18 months after issuance. The Note may be prepaid at any time and if prepayment in full occurs during the first 18 months following the date of issuance, the total principal amount will be reduced to €400. Payment of the Note will be subordinated to the repayment of the loan extended to VIV by Banca Intesa to provide financing for the Villa Sale.
Financial Services
WebBank manages its liquidity to provide adequate funds to meet anticipated financial obligations such as certificate of deposit maturities and to fund customer credit needs. WebBank had $77,285 and $51,756 in cash at the Federal Reserve Bank and in its Fed Funds account at its correspondent bank at December 31, 2011 and December 31, 2010, respectively. WebBank had a $5,500 and $3,000 line of credit from its correspondent bank at December 31, 2011 and 2010, respectively. WebBank had $2,116 and $3,199 available from the Federal Reserve discount window at December 31, 2011 and 2010, respectively. Additionally, WebBank has available a $4,000 line of credit from the Holding Company at December 31, 2011 and 2010. WebBank had a total of $88,901 and $61,955 in cash, lines of credit, and access to the Federal Reserve Bank discount window at December 31, 2011 and 2010, respectively, which represents approximately 71% and 73%, respectively, of WebBank’s total assets.
Contractual Obligations and Contingencies
Our consolidated contractual obligations as of December 31, 2011 are identified in the table below:
|
Payments Due By Period
|
||||||||||||||||||||||||||||
|
2012
|
2013
|
2014
|
2015
|
2016
|
Thereafter
|
Total
|
||||||||||||||||||||||
|
Debt Obligations
|
$ | 8,531 | $ | 91,235 | $ | 6,339 | $ | 12,370 | $ | 96 | $ | 20,916 | $ | 139,487 | ||||||||||||||
|
Estimated interest expense
|
7,665 | 5,522 | 4,162 | 4,157 | 4,153 | 7,775 | 33,434 | |||||||||||||||||||||
|
Deposits (1)
|
38,293 | 22,866 | 18,514 | 15,209 | - | - | 94,882 | |||||||||||||||||||||
|
Lease obligations
|
4,916 | 3,593 | 2,705 | 1,841 | 1,418 | 4,025 | 18,498 | |||||||||||||||||||||
|
Deferred fee liability to related party
|
1,107 | 5,005 | 11,497 | 7,287 | 22,444 | 11,407 | 58,747 | |||||||||||||||||||||
|
Uncertain tax positions (2)
|
2,306 | - | - | - | - | - | 2,306 | |||||||||||||||||||||
|
Pension and other postemployment benefit plans
|
20,000 | 19,400 | 23,800 | 19,500 | 14,800 | 26,400 | 123,900 | |||||||||||||||||||||
|
Capital expenditures
|
600 | - | - | - | - | - | 600 | |||||||||||||||||||||
|
Undisbursed Loan Commitments
|
113,350 | - | - | - | - | - | 113,350 | |||||||||||||||||||||
|
Total
|
$ | 196,768 | $ | 147,621 | $ | 67,017 | $ | 60,364 | $ | 42,911 | $ | 70,523 | $ | 585,204 | ||||||||||||||
|
|
(1)
|
Excludes interest. The weighted average interest rates on deposits are 1.48% in 2012, 0.84% in 2013, 0.90% in 2014 and 1.23% in 2015.
|
|
|
(2)
|
The Company is unable to predict the timing of payments related to uncertain tax positions.
|
The interest rates for the estimated interest expense were based on interest rates at December 31, 2011. At December 31, 2011 the Deferred Fee Liability, as described above, is indexed to the net asset value of SPH; however, the amount ultimately payable in each year will depend upon the index selected and its performance in future periods which may result in the amount paid being materially different from the value as of December 31, 2011. The Deferred Fee Liability can be paid in cash or, at the option of WGL, through the issuance of common units.
Certain of BNS’ and HNH’s facilities are environmentally impaired. BNS’ and HNH have estimated their liability to remediate these sites to be $635 and $6,524, respectively, at December 31, 2011. For further discussion regarding these commitments, among others, see Note 23, “Commitments and Contingencies,” to the consolidated financial statements for the year ended December 31, 2011 included elsewhere in this Form 10-K.
Deposits
Deposits at WebBank at December 31, 2011, 2010 and 2009 were as follows:
|
2011
|
2010
|
2009
|
||||||||||
|
Current
|
$ | 38,293 | $ | 29,102 | $ | 14,111 | ||||||
|
Long-term
|
56,589 | 32,690 | 36,103 | |||||||||
|
Total
|
$ | 94,882 | $ | 61,792 | $ | 50,214 | ||||||
The increase in deposits at December 31, 2011 compared with 2010 and 2009 is due to WebBank’s strategic decision to build its liquidity in relation to contractual lending programs. The average original maturity for time deposits at December 31, 2011 was 31 months compared with 25 months and 22 months at December 31, 2010 and 2009, respectively. The following table details the maturity of time deposits as of December 31, 2011:
|
Maturity
|
||||||||||||||||||||
|
< 3 Months
|
3 to 6 Months
|
6 to 12 Months
|
> 12 Months
|
Total
|
||||||||||||||||
|
(Dollars in Thousands)
|
||||||||||||||||||||
|
Certificate of Deposits less than $100,000
|
$ | 2,721 | $ | 5,967 | $ | 9,402 | $ | 52,709 | $ | 70,799 | ||||||||||
|
Certificate of Deposits of $100,00 or more
|
1,681 | 2,141 | 6,104 | 3,880 | 13,806 | |||||||||||||||
|
Total Certificates of Deposits
|
$ | 4,402 | $ | 8,108 | $ | 15,506 | $ | 56,589 | $ | 84,605 | ||||||||||
Off Balance Sheet Risk
It is not HNH’s usual business practice to enter into off-balance sheet arrangements such as guarantees on loans and financial commitments, indemnification arrangements, and retained interests in assets transferred to an unconsolidated entity for securitization purposes. Certain customers and suppliers of HNH’s Precious Metal segment choose to do business on a “pool” basis. Such customers or suppliers furnish precious metal to subsidiaries of H&H for return in fabricated form or for purchase from or return to the supplier. When the customer’s precious metal is returned in fabricated form, the customer is charged a fabrication charge. The value of pooled precious metal is not included in HNH’s balance sheet.
As of December 31, 2011, HNH’s customer metal consisted of 240,568 ounces of silver, 609 ounces of gold, and 1,396 ounces of palladium.
Securities sold, not yet purchased, at fair value represent obligations to deliver the specified security at the contracted price and, thereby, create a liability to repurchase the security in the market at prevailing prices. Accordingly, these transactions result in off-balance-sheet risk as SPH’s ultimate obligation to satisfy the sale of securities sold, not yet purchased, at fair value may exceed the amount recognized in the statement of financial condition. At December 31, 2011 and 2010, there were no outstanding securities sold, not yet purchased.
SPH uses the same credit policy in making commitments and conditional obligations as it does for on-balance sheet instruments.
WebBank is a party to financial instruments with off-balance sheet risk. In the normal course of business, these financial instruments include commitments to extend credit in the form of loans. Those instruments involve, to varying degrees, elements of credit and interest rate risk in excess of the amount recognized on the consolidated balance sheets. The contract amounts of those instruments reflect the extent of involvement WebBank has in particular classes of financial instruments.
WebBank’s exposure to credit loss in the event of nonperformance by the other party to the financial instrument for commitments to extend credit is represented by the contractual amount of those instruments.
At December 31, 2011 and 2010, WebBank’s undisbursed loan commitments totaled $113,350 and $57,488 respectively. Commitments to extend credit are agreements to lend to a customer provided there is no violation of any condition established in the contract. Commitments generally have fixed expiration dates or other termination clauses and may require payment of a fee. Since certain of the commitments are expected to expire without being drawn upon, the total commitment amounts do not necessarily represent future cash requirements. WebBank evaluates each customer’s credit worthiness on a case-by-case basis. The amount of collateral obtained if deemed necessary by WebBank upon extension of credit is based on management’s credit evaluation of the borrower.
As discussed above, we rely on our available liquidity to meet our short-term and long-term needs, and to make acquisitions of new businesses and additional investments in existing businesses. Except as otherwise disclosed herein, our operating businesses do not generally require material funds from us to support their operating activities, and we do not depend on positive cash flow from our operating segments to meet our liquidity needs. The components of our consolidated businesses and investments may change frequently as a result of acquisitions or divestitures, the timing of which is impossible to predict, but which often have a material impact on our consolidated statements of cash flows in any one period. Further, the timing and amounts of distributions from certain of our investments accounted for under the equity method are generally outside our control. As a result, reported cash flows from operating, investing and financing activities do not generally follow any particular pattern or trend, and reported results in the most recent period should not be expected to recur in any subsequent period.
The Acquisition of SPII is accounted for as a transaction between entities under common control and as such, cash flows of Investment Operations, acquired from SPII, are included in the consolidated statement of cash flows for all periods presented on an investment company basis through July 15, 2009. The cash flows from the Pre-Exchange Operations (Diversified Industrial, Financial Services and Other operations) are presented on an operating company basis for all periods presented. From July 16, 2009 forward all cash flow activity is reported on an operating company basis. The consolidated statements of cash flows for 2009 are presented in two periods, January 1, 2009 to July 15, 2009 and July 16, 2009 to December 31, 2009, reflecting the cash flows and the applicable basis of accounting for the period in 2009 before and after the completion of the Exchange Transaction on July 15 2009, respectively. Under investment company accounting, net unrealized gains and losses on investments from changes in fair values are reported in the consolidated statement of operations when they occur; and are reported as an adjustment to reconcile net income to net cash provided by operating activities in the consolidated statements of cash flow. Under investment company accounting, proceeds from sale of investments and purchases of investments are included in cash flows from operating activities; whereas under operating company accounting, these cash flows are investing activities.
Cash flow activity related to discontinued operations is combined and presented in separate captions on the consolidated statement of cash flows.
Cash Flows from Operating Activities
Net cash provided by operating activities for the year ended December 31, 2011 was $5,488. Net income of $81,277 was partially offset by $57,939 relating to changes in operating assets and liabilities (of which $12,172 was from an increase in accounts receivable, $29,253 was from a decrease in accounts payable and accrued and other liabilities and $18,460 was due to a net increase in loans held for sale), $6,107 relating to the decrease in the Deferred Fee Liability to related party and $2,265 relating to net cash used by operating activities of discontinued operations. The increase in accounts receivable relates primarily the increase in sales by HNH during 2011.
Net cash provided by operating activities for the year ended December 31, 2010 was $46,661. Significant items that increased cash flow from operations included $26,015 relating to changes in operating assets and liabilities (of which $27,400 was from reductions in accounts receivable), $6,267 relating to the increase in the Deferred Fee Liability to related party and $7,127 relating to net cash provided by operating activities of discontinued operations. The reduction in accounts receivable primarily relates to distributions received from the SPII Liquidating Trust and cash collected on receivables by HNH.
Net cash used in operating activities for the period from July 16, 2009 to December 31, 2009 was $7,572. The net cash used in operating activities was due primarily to a net loss of $3,077 for the period adjusted for non-cash items included in net income and by changes in operating assets and liabilities. Significant items that increased cash flow from operations included $3,001 from the provision for loan losses, $6,992 for the increase in the Deferred Fee Liability to related party, and $6,980 from an increase in operating assets of discontinued operations as a result of the sale of Collins. These increases to cash flows from operations were offset by a net increase in loans held for sale of $9,002 and investment gains of $9,568 arising from the sale of non-strategic investments and income from equity method investees of $7,207 driven primarily by the increase in the fair value of our investment in Steel Excel.
Net cash provided by operating activities was $135,261 for the period from January 1, 2009 to July 15, 2009. The amount provided was primarily due to a net loss of $57,527, of which $54,064 was attributed to Investment Operations’ negative performance during the period, which is offset by the proceeds from net investment activity of Investment Operations (purchases, proceeds, gains and losses) of $108,707 and a decrease in restricted cash related to a reduction in securities sold but not yet purchased and swaps held by Investment Operations. Investment Operations net investment activity of $108,707 is driven by the net proceeds of the sale of investments less purchases of $58,788 and related net realized losses of $85,823 offset by $35,904 change in unrealized gains.
Cash Flows from Investing Activities
Net cash used in investing activities for the year ended December 31, 2011 was $81,062. Significant items included net purchases of investments of $141,239, acquisitions, net of cash acquired of $35,751 and investments in associated companies of $23,072, offset in part by the release of restricted cash relating primarily to closing out foreign currency financial instruments of $119,962 and proceeds from the sale of discontinued operations of $26,532.
Net cash provided by investing activities for the year ended December 31, 2010 was $118,225 as the net proceeds from the sale of investments of $141,492 and proceeds from sale of discontinued operations of $64,693 was offset in part primarily by cash paid for investments in associated companies of $51,675, and the purchase of subsidiary shares from noncontrolling interests of $14,134.
Net cash provided by investing activities for the period from July 16, 2009 to December 31, 2009 was $43,203 as the net proceeds from the sale of investments of $93,279 more than offset cash paid for investments in associated companies of $51,573. For the period from January 1, 2009 to July 15, 2009 net cash used in investing activities was $12,915 due primarily to the purchase of associated companies’ shares.
Cash Flows from Financing Activities
Net cash provided by financing activities for the year ended December 31, 2011 was $22,192. This was due primarily to higher bank deposits held by WebBank of $33,189 and net proceeds from term loans and short term debt of $21,615, partially offset by a common unit cash distribution of $29,868.
Net cash used in financing activities for the year ended December 31, 2010 was $98,439. This was due primarily to a common unit cash distribution of $49,102, net repayment of debt in excess of borrowings by HNH of $36,415 and net repayment of debt relating to discontinued operations of $22,772.
Net cash used in financing activities for the period from July 16, 2009 to December 31, 2009 was $182,403. This was due primarily to the payments of redemptions from Redeemable Partners’ Capital of $204,403 in October 2009, which were determined as of July 15, 2009 and were related to the implementation of the Exchange Transaction and the SPII Fund Plan. Net cash provided by financing activities after adjusting for the capital redemptions was $22,000, primarily resulting from the net increase in deposits of $26,033 and cash proceeds of $4,487 from the assumption of the Deferred Fee Liability offset by the financing activities of discontinued operations.
The net cash used in financing activities for the period from January 1, 2009 to July 15, 2009 of $7,251 resulted from a decrease in deposits.
Critical Accounting Policies and Estimates
Use of Estimates
The discussion and analysis of our financial condition and results of operations are based on our consolidated financial statements, which have been prepared in accordance with GAAP, which require the Company to make estimates and assumptions that affect the amounts reported in the consolidated financial statements and in the accompanying notes. Actual results may differ from those estimates. A summary of our accounting policies is set forth in Note 3 to the consolidated financial statements. In our view, the policies that involve the most subjective judgment and that have the potential to materially affect our financial statements are set forth below.
Investments
For the Diversified Industrial, Financial Services and other operations, we evaluate our investments as consolidated subsidiaries, associated companies, core companies, available-for-sale, held-to-maturity, or trading securities. Held-to-maturity securities are those debt securities that the Company has the ability and intent to hold until maturity. Trading securities are purchased and held principally for the purpose of selling them in the near term. All other securities not included in held-to-maturity, trading, associated companies or core companies are classified as available-for-sale.
Held-to-maturity securities are recorded at amortized cost, adjusted for the amortization or accretion of premiums or discounts. Available-for-sale and trading securities are recorded at fair value. Unrealized holding gains or losses on available-for-sale securities are excluded from earnings and reported, until realized, in accumulated other comprehensive income (loss) as a separate component of SPH partners’ capital. Unrealized holding gains or losses on trading securities are recognized in the income statement. Associated companies and other investments – related party are accounted for using the equity method of accounting. In applying the equity method for the equity method investments where the fair value option has not been elected, SPH records the initial investment at cost and subsequently increases or decreases the investment by its proportionate share of the net income or loss of the investee. Dividends received from investees are recorded as reductions in the carrying value of the investment. For equity method investments which the Company has elected to measure at fair value, unrealized gains and losses are reported in the consolidated statement of operations as part of income (loss) from equity method investments and include income (loss) of certain associated companies and loss from other investments - related party.
Impairment of Investments
Investments including associated companies with an impairment in value considered to be other than temporary, are written down to estimated fair value. The write-downs are included in net securities gains in the consolidated operating statements. We evaluate our investments for impairment on a quarterly basis and disclose when appropriate if the potential for impairment exists. Our determination of whether a security is other than temporarily impaired incorporates both quantitative and qualitative information; GAAP requires the exercise of judgment in making this assessment, rather than the application of fixed mathematical criteria. We consider a number of factors including, but not limited to, the length of time and the extent to which the fair value has been less than cost, the financial condition and near-term prospects of the issuer, the reason for the decline in fair value, changes in fair value subsequent to the balance sheet date, the ability and intent to hold investments to maturity, and other factors specific to the individual investment. Our assessment involves a high degree of judgment and accordingly, actual results may differ materially from those estimates and judgments.
Use of Fair Value Estimates
Under GAAP, fair value is defined as the price that would be received to sell an asset or paid to transfer a liability in an orderly transaction between market participants at the measurement date. Further, a fair value hierarchy prioritizes inputs to valuation techniques into three broad levels. The fair value hierarchy gives the highest priority to unadjusted quoted prices in active markets for identical assets or liabilities (Level 1), the next priority to inputs that don’t qualify as Level 1 inputs but are nonetheless observable, either directly or indirectly, for the particular asset or liability (Level 2), and the lowest priority to unobservable inputs (Level 3).
In certain cases, the inputs used to measure fair value may fall into different levels of the fair value hierarchy. In such cases, an investment’s level within the fair value hierarchy is based on the lowest level of input that is significant to the fair value measurement. The assessment of the significance of a particular input to the fair value measurement in its entirety requires judgment and considers factors specific to the investment. The Company employs various methods within the market approach, income approach and/or cost approach and have also considered whether there were observable inputs. Certain discounts and other judgment factors were applied to arrive at the investments’ fair value. Accordingly, the estimates are not necessarily indicative of the amounts that the Company or holders of the instruments could realize in a current market exchange. The use of different assumptions and/or estimation methodologies may have a material effect on the estimated fair values.
Note 7 – “Fair Value Measurements” of the notes to the consolidated financial statements as of December 31, 2011 contains further information regarding the use of fair value estimates. The following table presents the amounts and percentages of financial assets and liabilities recorded at fair value:
|
December 31, 2011
|
Level 1
|
Level 2
|
Level 3
|
Total
|
||||||||||||
|
Assets:
|
||||||||||||||||
|
Equity securities - U.S.
|
$ | 87,907 | $ | 32,672 | $ | - | $ | 120,579 | ||||||||
|
Equity securities - International
|
15,819 | - | - | 15,819 | ||||||||||||
|
Total investments
|
103,726 | 32,672 | - | 136,398 | ||||||||||||
|
Financial instruments
|
- | - | - | - | ||||||||||||
|
Investments in associated companies
|
121,275 | - | - | 121,275 | ||||||||||||
|
Other investments - related party
|
- | - | 42,653 | 42,653 | ||||||||||||
|
Other investments
|
- | - | 13,623 | 13,623 | ||||||||||||
|
Total
|
$ | 225,001 | $ | 32,672 | $ | 56,276 | $ | 313,949 | ||||||||
|
Percentage to total assets
|
19.9 | % | 2.9 | % | 5.0 | % | 27.8 | % | ||||||||
|
Liabilities:
|
||||||||||||||||
|
Current portion of distribution payable
|
$ | - | $ | - | $ | - | $ | - | ||||||||
|
Financial instruments
|
- | 23,736 | - | 23,736 | ||||||||||||
|
Deferred fee liability to related party
|
- | - | 58,747 | 58,747 | ||||||||||||
|
Derivative features of subordinated notes
|
- | - | 694 | 694 | ||||||||||||
|
Commodity contracts on precious metals
|
165 | 64 | - | 229 | ||||||||||||
|
Total
|
$ | 165 | $ | 23,800 | $ | 59,441 | $ | 83,406 | ||||||||
|
Percentage to total liabilities
|
0.0 | % | 3.7 | % | 9.2 | % | 12.8 | % | ||||||||
Changes in the local and national economy, the federal and state legislative and regulatory environments for financial institutions, the stock market, interest rates and other external factors (such as natural disasters or significant world events) may occur from time to time, often with great unpredictability. Such factors may materially impact the
fair
value of our assets and liabilities. Based on their respective balances as of December 31, 2011, we estimate that in the event of a 10% adverse change in the fair values of equity securities, investments in associated companies, other investments and liabilities at fair value would decrease by $14 million, $12 million, $5 million and $8 million, respectively.
Business Combinations, Intangible Assets and Goodwill
When we acquire a business, we allocate the purchase price to the assets acquired, liabilities assumed and any noncontrolling interests based on their fair values at the acquisition date. Significant judgment may be used to determine these fair values including the use of appraisals, discounted cash flow models, market value for similar purchases, or other methods applicable to the circumstances. Once we finalize the purchase price allocation, any subsequent changes to it are reported in the operating statement. The excess of any purchase price we pay over the fair value of the net assets acquired is recorded as Goodwill, an asset that is not amortized but is subject to an impairment test at least annually and between annual testing dates if events or circumstances change that would more likely than not reduce the fair value of a reporting unit below its net book value. If the fair value of the net assets exceeds the purchase price the excess is treated as a bargain purchase and recognized in income. At December 31, 2011, the book value of goodwill was $42,797 and was not impaired when tested.
Subsequent to the finalization of the purchase price allocation, any adjustments to the recorded values of acquired assets and liabilities would be reflected in the Company’s consolidated statement of operations. Once final, the Company is not permitted to revise the allocation of the original purchase price, even if subsequent events or circumstances prove the Company’s original judgments and estimates to be incorrect. In addition, long-lived assets recorded in a business combination like property and equipment, amortizable intangibles and goodwill may be deemed to be impaired in the future resulting in the recognition of an impairment loss. The assumptions and judgments made by the Company when recording business combinations will have an impact on reported results of operations for many years into the future.
There were no impairments of intangible assets during 2011, 2010 and 2009.
Legal, Environmental and Other Contingencies
The outcomes of legal proceedings and claims brought against us are subject to significant uncertainty. An estimated loss from a loss contingency such as a legal proceeding or environmental remediation obligation or claim is accrued by a charge to income if it is probable that an asset has been impaired or a liability has been incurred and the amount of the loss can be reasonably estimated. Disclosure of a contingency is required if there is at least a reasonable possibility that a loss has been incurred. In determining whether a loss should be accrued we evaluate, among other factors, the degree of probability of an unfavorable outcome and the ability to make a reasonable estimate of the amount of loss. Changes in these factors could materially impact our financial statements.
Income Taxes
We converted into a limited partnership effective December 31, 2008. As a limited partnership, we are generally not responsible for federal and state income taxes and our profits and losses are passed directly to our limited partners for inclusion in their respective income tax returns. Our subsidiaries that are corporate subsidiaries are subject to federal and state income taxes. For the years ended prior to December 31, 2008, WebFinancial was a corporation which filed consolidated tax returns. Our tax provisions for the year ended December 31, 2009 reflect our prior status as a corporation and the tax provision of BNS from the date it became a consolidated subsidiary on July 15, 2009 and WebBank from January 1, 2009. The table in Note 20 – “Income Taxes” to our consolidated financial statements for the year ending December 31, 2011 included elsewhere in this Form 10-K reconciles a hypothetical calculation of federal income taxes based on the federal statutory rate of 34% applied to the (loss) / income from continuing operations before income taxes and associated companies. The tax effect of income passed through to common unitholders is subtracted from the hypothetical calculation.
Our subsidiaries that are subject to income taxes use the liability method of accounting for such taxes. Under the liability method, deferred tax assets and deferred tax liabilities are recognized for the future tax consequences attributable to differences between the financial statement carrying amounts of existing assets and liabilities and their respective tax bases and operating loss and tax credit carry forwards. Deferred tax assets and deferred tax liabilities are measured using enacted tax rates expected to apply to taxable income in the years in which those temporary differences are expected to be recovered or settled. The effect on deferred tax assets and deferred tax liabilities of a change in tax rates is recognized in income in the period that includes the enactment date. Our subsidiaries and associated companies evaluate the recoverability of deferred tax assets and establish a valuation allowance when it is more likely than not that some portion of the deferred tax assets will not be realized.
When tax returns are filed, it is highly certain that some positions taken would be sustained upon examination by the taxing authorities, while others are subject to uncertainty about the merits of the position taken or the amount of the position that would be ultimately sustained. The benefit of a tax position is recognized in the financial statements in the period during which, based on all available evidence, management believes it is more likely than not that the position will be sustained upon examination, including the resolution of appeals or litigation processes, if any. Tax positions taken are not offset or aggregated with other positions. Tax positions that meet the more-likely-than-not recognition threshold are measured as the largest amount of tax benefit that is more than 50% likely of being realized upon settlement with the applicable taxing authority. The portion of the benefits associated with tax positions taken that exceeds the amount measured as described above is reflected as a liability for unrecognized tax benefits in the accompanying balance sheet, along with any associated interest and penalties that would be payable to the taxing authorities upon examination.
In this “Quantitative and Qualitative Disclosure About Market Risk” section, all dollar amounts are in thousands, except for per share amounts.
Market risk is the risk of loss arising from adverse changes in market rates and prices, such as interest rates, foreign currency exchange rates and commodity prices. Our significant market risks are primarily associated with interest rates, equity prices and derivatives. The following sections address the significant market risks associated with our business activities.
SPH’s quantitative and qualitative disclosures about market risk include forward-looking statements with respect to management’s opinion about the risk associated with the Company’s financial instruments. These statements are based on certain assumptions with respect to market prices, interest rates and other industry-specific risk factors. To the extent these assumptions prove to be inaccurate, future outcomes may differ materially from those discussed herein.
Risks Relating to Investments
The Company’s investments are primarily classified as available-for-sale and consequently are recorded on the balance sheet at fair value with unrealized gains and losses reflected in equity. The Company evaluates its investments for impairment on a quarterly basis.
Included in the Company’s available-for-sale investments are equity securities, which are recorded in the balance sheet at an aggregate fair value of $150,020 and which comprised 100% of the Company’s total available-for-sale investments at December 31, 2011. These investments are subject to equity price risk.
In order to mitigate its equity price risk, the Company from time to time may engage in short sales. At December 31, 2011, SPH has $0 of securities sold, not yet purchased. Short sales represent obligations to deliver the specified security at the contracted price and, thereby, create a liability to repurchase the security in the market at prevailing prices. Accordingly, these transactions result in off-balance-sheet risk as the Company’s ultimate obligation to satisfy the sale of securities sold, not yet purchased, at fair value may exceed the amount recognized in the statement of financial condition.
The Company is also subject to price risk related to its investments in Steel Excel and SLI , for which it has elected the fair value option. At December 31, 2011, these investments are classified as investments in associated companies and carried at fair values of $105,226 and $16,049, respectively.
Risks Relating to Interest Rates
WebBank
The Company through its WebBank subsidiary derives a portion of its income from the excess of interest collected over interest paid. The rates of interest WebBank earns on assets and pays on liabilities generally are established contractually for a period of time. Market interest rates change over time. Accordingly, WebBank’s results of operations, like those of most financial institutions, are impacted by changes in interest rates and the interest rate sensitivity of its assets and liabilities. The risk associated with changes in interest rates and the ability to adapt to these changes is known as interest rate risk.
WebBank monitors and measures its exposure to changes in interest rates in order to comply with applicable government regulations and risk policies established by WebBank’s Board of Directors, and in order to preserve shareholder value. In monitoring interest rate risk, WebBank analyzes assets and liabilities based on characteristics including size, coupon rate, repricing frequency, maturity date, and likelihood of prepayment.
If WebBank’s assets mature or reprice more rapidly or to a greater extent than its liabilities, then net portfolio value and net interest income would tend to increase during periods of rising rates and decrease during periods of falling interest rates. Conversely, if WebBank’s assets mature or reprice more slowly or to a lesser extent than its liabilities, then net portfolio value and net interest income would tend to decrease during periods of rising interest rates and increase during periods of falling interest rates.
WebBank currently focuses lending efforts toward originating competitively priced adjustable-rate or fixed-rate loan products with short to intermediate terms to maturity, generally 5 years or less. This theoretically allows WebBank to maintain a portfolio of loans that will have relatively little sensitivity to changes in the level of interest rates, while providing a reasonable spread to the cost of liabilities used to fund the loans.
The principal objective of WebBank’s asset/liability management is to manage the sensitivity of Market Value of Equity (MVE) to changing interest rates. Asset/liability management is governed by policies reviewed and approved annually by WebBank’s Board of Directors. WebBank’s Board of Directors has delegated the responsibility to oversee the administration of these policies to WebBank’s asset/liability committee, or ALCO. The interest rate risk strategy currently deployed by ALCO is to primarily use “natural” balance sheet hedging (as opposed to derivative hedging). ALCO fine tunes the overall MVE sensitivity by recommending lending and deposit strategies. WebBank then executes the recommended strategy by increasing or decreasing the duration of the loan and deposit products, resulting in the appropriate level of market risk WebBank’s Board of Directors wants to maintain.
WebBank measures interest rate sensitivity as the difference between amounts of interest earning assets and interest-bearing liabilities that mature or reprice within a given period of time. The difference provides an indication of the extent to which an institution’s interest rate spread will be affected by changes in interest rates. If the amount of interest rate sensitive assets exceeds the amount of interest rate sensitive liabilities, then the bank is considered to be asset sensitive. If the amount of interest rate sensitive liabilities exceeds the amount of interest rate sensitive assets, then the bank is considered to be liability sensitive. In a rising interest rate environment, an institution that is asset sensitive would be in a better position than an institution that is liability sensitive because the yield on its assets would increase at a faster pace than the cost of its interest-bearing liabilities. During a period of falling interest rates, however, an institution that is asset sensitive would tend to have its assets reprice at a faster rate than its liabilities, which would tend to reduce the growth in its net interest income. The opposite is true if the institution is liability sensitive.
WebBank’s Board of Directors and relevant government regulations establish limits on the level of acceptable interest rate risk at WebBank, to which management adheres. There can be no assurance, however, that, in the event of an adverse change in interest rates, WebBank’s efforts to limit interest rate risk will be successful.
HNH
At HNH, fair value of cash and cash equivalents, receivables, short-term borrowings and accounts payable approximate their carrying values and are relatively insensitive to changes in interest rates due to the short-term maturity of the instruments or the variable nature of underlying interest rates.
At December 31, 2011, HNH’s portfolio of debt was comprised of variable rate and fixed rate instruments. An increase or decrease in interest expense from a 1% change in interest rates would be approximately $500 on an annual basis. Accordingly, the fair value of such instruments may be relatively sensitive to effects of interest rate fluctuations. In addition, the fair value of such instruments is also affected by investors’ assessments of the risks associated with industries in which HNH operates as well as its overall creditworthiness and ability to satisfy such obligations upon their maturity. HNH is subject to interest rate risk on its long-term fixed interest rate debt. Generally, the fair market value of debt securities with a fixed interest rate will increase as interest rates fall, and the fair market value will decrease as interest rates rise.
A reduction in long-term interest rates could materially increase HNH’s cash funding obligations to the HNH Pension Plan.
BNS
Sun Well entered into a credit agreement with a bank on June 30, 2011. The agreement includes a term loan of $20,000 and a revolving loan of up to $5,000. The loans are secured by the assets of Sun Well and bear interest at the greater of (a) the bank’s prime rate, (b) the Federal Funds rate plus 1.5%, or (c) the Daily One-Month LIBOR rate plus 1.50% for base rate loans, or Libor plus 3.5%. Sun Well is subject to interest rate risk on its debt.
Risks Relating to Commodity Prices
In the normal course of business, HNH and its subsidiaries are exposed to market risk or price fluctuations related to the purchase of natural gas, electricity, precious metal, steel products and certain non-ferrous metals used as raw material. HNH is also exposed to the effects of price fluctuations on the value of its commodity inventories, specifically, its precious metal inventories.
HNH’s market risk strategy has generally been to obtain competitive prices for its products and services and allow operating results to reflect market price movements dictated by supply and demand.
HNH enters into commodity futures and forwards contracts in order to economically hedge the portion of its precious metal inventory that is not subject to fixed price contracts with customers against price fluctuations. Future and forward contracts to sell or buy precious metal are the derivatives used for this objective. As these derivatives are not designated as accounting hedges under ASC 815, they are accounted for as derivatives with no hedge designation. These derivatives are marked to market and both realized and unrealized gains and losses on these derivatives are recorded in current period earnings as other income (loss). The unrealized gain or loss (open trade equity) on the derivatives is included in other current assets or other current liabilities.
As of December 31, 2011, HNH had entered into forward and future contracts,
with settlement dates ranging from February 2012 to March 2012,
for gold with a total value of $1,500 and for silver with a total value of $2,600.
Certain customers and suppliers of HNH’s subsidiary, H&H choose to do business on a “pool” basis. Such customers or suppliers furnish precious metal to subsidiaries of H&H for return in fabricated form or for purchase from or return to the supplier. When the customer’s precious metal is returned in fabricated form, the customer is charged a fabrication charge. The value of pooled precious metal is not included in HNH’s balance sheet.
As of December 31, 2011, HNH’s customer metal consisted of 240,568 ounces of silver, 609 ounces of gold, and 1,396 ounces of palladium.
Risks Relating to Foreign Currency Exchange
The Company, primarily through its HNH subsidiary, manufactures and sells its products in a number of countries throughout the world and, as a result, is exposed to movements in foreign currency exchange rates. The Company's major foreign currency exposures involve the markets in Asia, Europe, Canada and Mexico. The Company is subject to the risk of price fluctuations related to anticipated revenues and operating costs, firm commitments for capital expenditures and existing assets or liabilities denominated in currencies other than U.S. dollars. The Company and HNH have not generally used derivative instruments to manage these specific risks. However, the Company from time to time enters into foreign currency financial instruments for broader risk management purposes including hedges of net investments in international operations. During the years ended December 31, 2011 and 2010, the Company incurred losses from foreign currency financial instruments of $4,903 and $14,099, respectively. Included in these amounts were losses of $4,316 and $12,190 for these periods, respectively, from foreign currency financial instruments relating to hedging investment exposure that the Company has in Japan. Financial instruments include amounts payable in foreign currencies of $23,736 at December 31, 2011 and $137,823 at December 31, 2010, primarily relating to the GBP in 2011 and the Yen in 2010, which are subject to the risk of exchange rate changes. These financial instruments are collateralized by an equivalent amount included in restricted cash and have no maturity date.
INDEX TO CONSOLIDATED FINANCIAL STATEMENTS
|
Page
|
|
|
Report of Independent Registered Public Accounting Firm
|
76
|
|
Consolidated Financial Statements:
|
|
|
Consolidated Balance Sheets as of December 31, 2011 and 2010
|
79
|
|
Consolidated Statements of Operations for the years ended December 31, 2011, 2010 and the periods July 16, 2009 through December 31, 2009 and January 1, 2009 through July 15, 2009
|
81
|
|
Consolidated Statements of Cash Flows for the years ended December 31, 2011, 2010 and the periods July 16, 2009 through December 31, 2009 and January 1, 2009 through July 15, 2009
|
83
|
|
Consolidated Statements of Changes in Capital and Comprehensive (Loss) Income for the years ended December 31, 2011 and 2010 and the periods July 16, 2009 through December 31, 2009 and January 1, 2009 through July 15, 2009
|
86
|
|
Notes to Consolidated Financial Statements
|
88
|
|
Audit
l
Tax
l
Advisory
Grant Thornton LLP
666 Third Avenue, 13th Floor
New York, NY 10017-4011
T 212.599.0100
F 212.370.4520
www.GrantThornton.com
|
REPORT OF INDEPENDENT REGISTERED PUBLIC ACCOUNTING FIRM
To the Partners of
Steel Partners Holdings L.P.
We have audited the accompanying consolidated balance sheets of Steel Partners Holdings L.P. (a Delaware corporation) and subsidiaries (the “Company”) as of December 31, 2011 and 2010, and the related consolidated statements of operations, changes in capital and comprehensive income (loss), and cash flows for the years ended December 31, 2011 and 2010 as well as the periods July 16, 2009 through December 31, 2009 and January 1, 2009 through July 15, 2009. These consolidated financial statements are the responsibility of the Company’s management. Our responsibility is to express an opinion on these financial statements based on our audits. We did not audit the consolidated financial statements of WebFinancial Holding Corporation and Subsidiaries and WF Asset Corp, which statements reflect total assets of 11.3 percent as of December 31, 2011, and total revenues of 2.1 percent for the year ended December 31, 2011, of the consolidated totals. We did not audit the consolidated financial statements of WebFinancial Holding Corporation and Subsidiaries, which statements reflect total assets of 8.1 percent as of December 31, 2010, and total revenues of 2.6 percent for the year ended December 31, 2010, of the related consolidated totals. We did not audit the consolidated financial statements of WebBank and Subsidiary (a consolidated subsidiary), which statements reflect total revenues of 20.8 percent, and 4.7 percent for the period July 16, 2009 through December 31, 2009, and for the period January 1, 2009 through July 15, 2009, respectively, of the related consolidated totals. Those statements were audited by other auditors, whose reports thereon have been furnished to us, and our opinion, insofar as it relates to the amounts included for WebFinancial Holding Corporation and Subsidiaries, WF Asset Corp, and WebBank and Subsidiary is based solely on the reports of the other auditors.
We conducted our audits in accordance with the standards of the Public Company Accounting Oversight Board (United States). Those standards require that we plan and perform the audit to obtain reasonable assurance about whether the financial statements are free of material misstatement. The Company is not required to have, nor were we engaged to perform an audit of its internal control over financial reporting. Our audit included consideration of internal control over financial reporting as a basis for designing audit procedures that are appropriate in the circumstances, but not for the purpose of expressing an opinion on the effectiveness of the Company’s internal control over financial reporting. Accordingly, we express no such opinion. An audit also includes examining, on a test basis, evidence supporting the amounts and disclosures in the financial statements, assessing the accounting principles used and significant estimates made by management, as well as evaluating the overall financial statement presentation. We believe that our audits provide a reasonable basis for our opinion.
In our opinion, based on audits and the reports of other auditors, the consolidated financial statements referred to above present fairly, in all material respects, the financial position of Steel Partners Holdings L.P. and subsidiaries as of December 31, 2011 and 2010, and the results of their operations and their cash flows for the years ended December 31, 2011 and 2010 and the periods July 16, 2009 through December 31, 2009 and January 1, 2009 through July 15, 2009, in conformity with accounting principles generally accepted in the United States of America.
As discussed in Note 1 to the consolidated financial statements, effective July 16, 2009, the Company entered into a transaction that resulted in the retrospective combination of entities under common control.
/s/ GRANT THORNTON LLP
New York, New York
March 26, 2012
REPORT OF INDEPENDENT REGISTERED PUBLIC ACCOUNTING FIRM
To the Board of Directors and Stockholders
WebFinancial Holding Corporation and subsidiaries
We have audited the accompanying consolidated balance sheets of WebFinancial Holding Corporation and subsidiaries as of December 31, 2011 and 2010, and the related consolidated statements of operations, equity and cash flows for the years then ended. WebFinancial Holding Corporation’s management is responsible for these financial statements. Our responsibility is to express an opinion on these financial statements based on our audits.
We conducted our audits in accordance with the standards of the Public Company Accounting Oversight Board (United States). Those standards require that we plan and perform the audit to obtain reasonable assurance about whether the financial statements are free of material misstatement. The company is not required to have, nor were we engaged to perform, an audit of its internal control over financial reporting. Our audit included consideration of internal control over financial reporting as a basis for designing audit procedures that are appropriate in the circumstances, but not for the purpose of expressing an opinion on the effectiveness of the company’s internal control over financial reporting. Accordingly, we express no such opinion. An audit also includes examining, on a test basis, evidence supporting the amounts and disclosures in the financial statements, assessing the accounting principles used and significant estimates made by management, as well as evaluating the overall financial statement presentation. We believe that our audits provide a reasonable basis for our opinion.
In our opinion, the financial statements referred to above present fairly, in all material respects, the financial position of WebFinancial Holding Corporation as of December 31, 2011 and 2010, and the results of its operations and its cash flows for each of the years then ended in conformity with accounting principles generally accepted in the United States of America.
|
/s/
HANSEN, BARNETT & MAXWELL, P.C.
|
Salt Lake City, Utah
March 8, 2012
REPORT OF INDEPENDENT REGISTERED PUBLIC ACCOUNTING FIRM
To the Board of Directors and Stockholders
WF Asset Corp
We have audited the accompanying consolidated balance sheets of WF Asset Corp as of December 31, 2011 and 2010, and the related consolidated statements of operations, equity and cash flows for the years then ended. WF Asset Corp’s management is responsible for these financial statements. Our responsibility is to express an opinion on these financial statements based on our audits.
We conducted our audits in accordance with the standards of the Public Company Accounting Oversight Board (United States). Those standards require that we plan and perform the audit to obtain reasonable assurance about whether the financial statements are free of material misstatement. The company is not required to have, nor were we engaged to perform, an audit of its internal control over financial reporting. Our audit included consideration of internal control over financial reporting as a basis for designing audit procedures that are appropriate in the circumstances, but not for the purpose of expressing an opinion on the effectiveness of the company’s internal control over financial reporting. Accordingly, we express no such opinion. An audit also includes examining, on a test basis, evidence supporting the amounts and disclosures in the financial statements, assessing the accounting principles used and significant estimates made by management, as well as evaluating the overall financial statement presentation. We believe that our audits provide a reasonable basis for our opinion.
In our opinion, the financial statements referred to above present fairly, in all material respects, the financial position of WF Asset Corp as of December 31, 2011 and 2010, and the results of its operations and its cash flows for each of the years then ended in conformity with accounting principles generally accepted in the United States of America.
|
/s/ HANSEN, BARNETT & MAXWELL, P.C.
|
Salt Lake City, Utah
March 8, 2012
STEEL PARTNERS HOLDINGS L.P.
(in thousands except common units)
|
December 31,
|
||||||||
|
2011
|
2010
|
|||||||
|
ASSETS
|
||||||||
|
Current Assets:
|
||||||||
|
Cash and cash equivalents
|
$ | 127,027 | $ | 180,684 | ||||
|
Restricted cash
|
23,736 | 143,698 | ||||||
|
Financial Instruments
|
- | 13,772 | ||||||
|
Trade and other receivables (net of allowance for doubtful accounts of $2,504 in 2011 and $2,198 in 2010)
|
90,239 | 67,747 | ||||||
|
Receivable from related party
|
116 | 1,463 | ||||||
|
Loans receivable, net
|
34,820 | 16,408 | ||||||
|
Inventories
|
53,776 | 50,822 | ||||||
|
Deferred income taxes
|
20,038 | 4,700 | ||||||
|
Prepaid and other current assets
|
16,123 | 10,087 | ||||||
|
Assets of discontinued operations
|
35,387 | 33,306 | ||||||
|
Total current assets
|
401,262 | 522,687 | ||||||
|
Long-term loans receivable, net
|
8,942 | 11,919 | ||||||
|
Goodwill
|
42,797 | 16,212 | ||||||
|
Other intangibles, net
|
135,341 | 124,541 | ||||||
|
Deferred income taxes
|
70,625 | - | ||||||
|
Other non-current assets
|
22,143 | 19,518 | ||||||
|
Investments at fair value
|
150,020 | 79,540 | ||||||
|
Property, plant and equipment, net
|
127,842 | 91,625 | ||||||
|
Investment in associated companies
|
128,218 | 163,270 | ||||||
|
Other investments at fair value - related party
|
42,653 | 62,553 | ||||||
|
Total Assets
|
$ | 1,129,843 | $ | 1,091,865 | ||||
See accompanying Notes to Consolidated Financial Statements
STEEL PARTNERS HOLDINGS L.P.
Consolidated Balance Sheets
(in thousands except common units)
|
December 31,
|
||||||||
|
2011
|
2010
|
|||||||
|
LIABILITIES AND CAPITAL
|
||||||||
|
Accounts payable
|
$ | 37,843 | $ | 37,959 | ||||
|
Accrued liabilities
|
40,944 | 37,527 | ||||||
|
Current portion of distribution payable
|
- | 29,869 | ||||||
|
Financial instruments
|
23,736 | 143,917 | ||||||
|
Deposits
|
38,293 | 29,102 | ||||||
|
Payable to related parties
|
4,930 | 6,330 | ||||||
|
Current portion of deferred fee liability
|
1,107 | - | ||||||
|
Short-term debt
|
24,168 | 42,890 | ||||||
|
Current portion of long-term debt
|
8,531 | 4,452 | ||||||
|
Other current liabilities
|
3,975 | 5,721 | ||||||
|
Liabilities of discontinued operations
|
15,310 | 9,997 | ||||||
|
Total current liabilities
|
198,837 | 347,764 | ||||||
|
Long-term deposits
|
56,589 | 32,690 | ||||||
|
Deferred fee liability to related parties
|
57,640 | 64,854 | ||||||
|
Long-term debt
|
130,955 | 91,984 | ||||||
|
Accrued pension liability
|
186,212 | 113,004 | ||||||
|
Deferred income taxes
|
6,231 | 3,333 | ||||||
|
Other liabilities
|
12,959 | 7,924 | ||||||
|
Total Liabilities
|
649,423 | 661,553 | ||||||
|
Commitments and Contingencies
|
||||||||
|
Partner's capital (common units: 25,183,039 in 2011 and 25,251,554 in 2010 issued and outstanding, after deducting 2,808,725 and 2,726,030 held in treasury, at cost of $48,099 and $47,107 in 2011 and 2010, respectively).
|
427,534 | 397,970 | ||||||
|
Accumulated other comprehensive (loss) income
|
(11,737 | ) | 7,762 | |||||
|
Total Partners' Capital
|
415,797 | 405,732 | ||||||
|
Noncontrolling interests in consolidated entities
|
64,623 | 24,580 | ||||||
|
Total Capital
|
480,420 | 430,312 | ||||||
|
Total Liabilities and Capital
|
$ | 1,129,843 | $ | 1,091,865 | ||||
See accompanying Notes to Consolidated Financial Statements
STEEL PARTNERS HOLDINGS L.P.
Consolidated Statements of Operations
(in thousands except units and per unit data)
|
July 16, 2009 to
|
||||||||||||||||
|
Year Ended December 31,
|
December 31,
|
January 1, 2009 to
|
||||||||||||||
|
2011
|
2010
|
2009
|
July 15, 2009
|
|||||||||||||
|
Revenue:
|
||||||||||||||||
|
Diversified Industrial, Financial Services and Other:
|
||||||||||||||||
|
Diversified industrial net sales
|
$ | 700,969 | $ | 385,805 | $ | - | $ | - | ||||||||
|
Financial services revenue
|
14,921 | 10,803 | 2,997 | 2,326 | ||||||||||||
|
Investment and other income (loss)
|
684 | 4,007 | 1,859 | (78 | ) | |||||||||||
|
Net investment (losses) gain
|
(4,352 | ) | 24,050 | 9,568 | (23 | ) | ||||||||||
| 712,222 | 424,665 | 14,424 | 2,225 | |||||||||||||
|
Investment Operations (see Notes 2 and 23):
|
||||||||||||||||
|
Dividends, net of foreign dividend taxes withheld of $185 in 2009 :
|
||||||||||||||||
|
Non-affiliate investments
|
- | - | - | 191 | ||||||||||||
|
Affiliate investments
|
- | - | - | 1,329 | ||||||||||||
|
Control investments
|
- | - | - | 2,443 | ||||||||||||
|
Interest:
|
||||||||||||||||
|
Non-affiliate investments
|
- | - | - | - | ||||||||||||
|
Affiliate investments
|
- | - | - | 1,128 | ||||||||||||
|
Control investments
|
- | - | - | 6,790 | ||||||||||||
|
Other
|
- | - | - | 133 | ||||||||||||
|
Other income-Non-affiliate investments:
|
||||||||||||||||
|
Control investments
|
- | - | - | - | ||||||||||||
|
Other
|
- | - | - | - | ||||||||||||
|
Net realized gains (losses):
|
||||||||||||||||
|
Non-affiliate investments
|
- | - | - | 40,177 | ||||||||||||
|
Affiliate investments
|
- | - | - | (117,690 | ) | |||||||||||
|
Control investments
|
- | - | - | (8,310 | ) | |||||||||||
|
Other
|
- | - | - | 26,788 | ||||||||||||
|
Change in unrealized gains, investments
|
- | - | - | 35,904 | ||||||||||||
|
Change in unrealized losses, other
|
- | - | - | (40,564 | ) | |||||||||||
| - | - | - | (51,681 | ) | ||||||||||||
|
Total revenue
|
712,222 | 424,665 | 14,424 | (49,456 | ) | |||||||||||
|
Costs and Expenses
|
||||||||||||||||
|
Diversified Industrial, Financial Services and Other:
|
||||||||||||||||
|
Diversified industrial cost of goods sold
|
513,741 | 289,839 | - | - | ||||||||||||
|
Selling, general and administrative
|
142,031 | 88,250 | 7,915 | 2,661 | ||||||||||||
|
Asset impairment charges
|
1,505 | - | - | - | ||||||||||||
|
Finance interest
|
1,571 | 2,022 | 1,255 | 314 | ||||||||||||
|
Provision for loan losses (gains)
|
8 | (420 | ) | 3,001 | 3,644 | |||||||||||
|
Interest expense
|
12,424 | 12,123 | - | - | ||||||||||||
|
Realized and unrealized loss on derivatives
|
397 | 5,164 | - | - | ||||||||||||
|
Management fees - related party
|
8,169 | 7,531 | 3,705 | - | ||||||||||||
|
(Decrease) Increase in deferred fee liability to related party
|
(6,107 | ) | 6,268 | 6,992 | - | |||||||||||
|
Other income
|
(7,655 | ) | - | - | - | |||||||||||
| 666,084 | 410,777 | 22,868 | 6,619 | |||||||||||||
|
Investment Operations (see Notes 2 and 23):
|
||||||||||||||||
|
Interest
|
- | - | - | 710 | ||||||||||||
|
Dividends
|
- | - | - | 782 | ||||||||||||
|
Other professional fees
|
- | - | - | 891 | ||||||||||||
| - | - | - | 2,383 | |||||||||||||
|
Total costs and expenses
|
666,084 | 410,777 | 22,868 | 9,002 | ||||||||||||
See accompanying Notes to Consolidated Financial Statements
STEEL PARTNERS HOLDINGS L.P.
Consolidated Statements of Operations
(in thousands except units and per unit data)
(continued)
|
July 16, 2009 to
|
||||||||||||||||
|
Year Ended December 31,
|
December 31,
|
January 1, 2009 to
|
||||||||||||||
|
2011
|
2010
|
2009
|
July 15, 2009
|
|||||||||||||
|
Income from continuing operations before income taxes and equity method income (loss)
|
46,138 | 13,888 | (8,444 | ) | (58,458 | ) | ||||||||||
|
Income tax benefit (provision)
|
63,965 | (2,657 | ) | (57 | ) | 868 | ||||||||||
|
(Loss) income from equity method investments:
|
||||||||||||||||
|
(Loss) income of associated companies, net of tax
|
(13,823 | ) | 10,305 | 7,207 | 63 | |||||||||||
|
Loss from other investments-related party
|
(15,743 | ) | (3,220 | ) | (2,960 | ) | - | |||||||||
|
Net income (loss) from continuing operations
|
80,537 | 18,316 | (4,254 | ) | (57,527 | ) | ||||||||||
|
Discontinued Operations:
|
||||||||||||||||
|
(Loss) Income from discontinued operations, net of taxes
|
(231 | ) | (3,162 | ) | 1,177 | - | ||||||||||
|
Gain on sale of discontinued operations, net of taxes
|
971 | 31,292 | - | - | ||||||||||||
|
Income from discontinued operations
|
740 | 28,130 | 1,177 | - | ||||||||||||
|
Net income (loss)
|
81,277 | 46,446 | (3,077 | ) | (57,527 | ) | ||||||||||
|
Net loss attributable to redeemable partners’ capital
|
- | - | - | 54,064 | ||||||||||||
|
Net (income) loss attributable to noncontrolling interests in consolidated entities:
|
||||||||||||||||
|
Continuing operations
|
(45,461 | ) | (997 | ) | 114 | - | ||||||||||
|
Discontinued operations
|
(347 | ) | (13,702 | ) | (556 | ) | - | |||||||||
| (45,808 | ) | (14,699 | ) | (442 | ) | - | ||||||||||
|
Net income (loss) attributable to common unitholders
|
$ | 35,469 | $ | 31,747 | $ | (3,519 | ) | $ | (3,463 | ) | ||||||
|
Net income (loss) per common unit - basic
|
||||||||||||||||
|
Net income (loss) from continuing operations
|
$ | 1.39 | $ | 0.69 | $ | (0.16 | ) | $ | (1.59 | ) | ||||||
|
Net income from discontinued operations
|
0.02 | 0.57 | 0.02 | - | ||||||||||||
|
Net income (loss) attributable to common unitholders
|
$ | 1.41 | $ | 1.26 | $ | (0.14 | ) | $ | (1.59 | ) | ||||||
|
Net income (loss) per common unit - diluted
|
||||||||||||||||
|
Net income (loss) from continuing operations
|
$ | 0.98 | $ | 0.63 | $ | (0.16 | ) | $ | (1.59 | ) | ||||||
|
Net income from discontinued operations
|
0.01 | 0.53 | 0.02 | - | ||||||||||||
|
Net income (loss) attributable to common unitholders
|
$ | 0.99 | $ | 1.16 | $ | (0.14 | ) | $ | (1.59 | ) | ||||||
|
Weighted average number of common units outstanding - basic
|
25,232,985 | 25,234,827 | 25,219,420 | 2,183,366 | ||||||||||||
|
Weighted average number of common units outstanding - diluted
|
29,669,582 | 27,482,804 | 25,219,420 | 2,183,366 | ||||||||||||
See accompanying Notes to Consolidated Financial Statements
STEEL PARTNERS HOLDINGS L.P.
Consolidated Statements of Cash Flows
(in thousands)
|
July 16, 2009 to
|
||||||||||||||||
|
Year Ended December 31,
|
December 31,
|
January 1, 2009 to
|
||||||||||||||
|
2011
|
2010
|
2009
|
July 15, 2009
|
|||||||||||||
|
Cash flows from operating activities:
|
||||||||||||||||
|
Net income (loss)
|
$ | 81,277 | $ | 46,446 | $ | (3,077 | ) | $ | (57,527 | ) | ||||||
|
Adjustments to reconcile net income (loss) to net cash provided by (used in) operating activities:
|
||||||||||||||||
|
Investment losses (gains) and other than temporary impairment losses
|
4,352 | (24,050 | ) | (9,568 | ) | 23 | ||||||||||
|
Provision for loan losses
|
8 | (420 | ) | 3,001 | 3,644 | |||||||||||
|
Loss (Income) of associated companies
|
13,823 | (10,305 | ) | (7,207 | ) | (63 | ) | |||||||||
|
Loss from other investments - related party
|
15,743 | 3,220 | 2,960 | - | ||||||||||||
|
Gain on sale of discontinued operations
|
(1,372 | ) | (31,292 | ) | - | - | ||||||||||
|
Long-term interest on related party debt
|
- | 4,275 | - | - | ||||||||||||
|
Deferred income tax provision (benefit)
|
15,845 | (9 | ) | 156 | (868 | ) | ||||||||||
|
Income tax benefit from release of deferred tax valuation allowance
|
(82,731 | ) | - | - | - | |||||||||||
|
Non-cash interest and dividend income
|
- | (1,876 | ) | - | - | |||||||||||
|
Non-cash income from derivatives
|
(811 | ) | - | - | - | |||||||||||
|
Accrued interest not paid in cash
|
2,275 | |||||||||||||||
|
Depreciation and amortization
|
23,983 | 14,029 | 75 | 79 | ||||||||||||
|
(Gain) Loss on extinguishment of debt
|
(189 | ) | 1,210 | - | - | |||||||||||
|
Amortization of debt related costs
|
1,743 | 1,226 | ||||||||||||||
|
Gain on sale of loans
|
- | - | - | (22 | ) | |||||||||||
|
Accretion of loan origination fees, net
|
- | - | (64 | ) | (11 | ) | ||||||||||
|
Reclassification of net cash settlements on derivative instruments
|
1,047 | 5,124 | - | - | ||||||||||||
|
Stock based compensation
|
4,509 | 528 | - | - | ||||||||||||
|
Asset impairment charges
|
1,505 | - | - | - | ||||||||||||
|
Bargain purchase gain
|
(8,978 | ) | - | - | - | |||||||||||
|
Investment operations:
|
||||||||||||||||
|
Change in unrealized gains - investments
|
- | - | - | (35,904 | ) | |||||||||||
|
Gain on sale of investments
|
- | - | - | 85,823 | ||||||||||||
|
Proceeds from sale of investments
|
- | - | - | 438,080 | ||||||||||||
|
Purchases of investments
|
- | - | - | (379,292 | ) | |||||||||||
|
Other
|
(230 | ) | (854 | ) | - | - | ||||||||||
|
Net change in operating assets and liabilities:
|
||||||||||||||||
|
Trade and other receivables
|
(12,172 | ) | 27,400 | (2,076 | ) | (24,529 | ) | |||||||||
|
Receivable from related party
|
1,347 | - | (1,463 | ) | - | |||||||||||
|
Inventories
|
(23 | ) | 8,577 | - | - | |||||||||||
|
Dividends and interest receivable
|
- | 1,379 | 254 | 8,011 | ||||||||||||
|
Prepaid and other assets
|
571 | (1,350 | ) | (6,488 | ) | 88 | ||||||||||
|
Accounts payable, accrued and other liabilities
|
(29,253 | ) | (6,779 | ) | 5,026 | (1,373 | ) | |||||||||
|
Payable to related parties
|
51 | 606 | 5,908 | (342 | ) | |||||||||||
|
Dividends and interest payable
|
- | (319 | ) | 21 | (84 | ) | ||||||||||
|
(Decrease) Increase in deferred fee liability to related party
|
(6,107 | ) | 6,267 | 6,992 | - | |||||||||||
|
Net (increase) decrease in loans held for sale
|
(18,460 | ) | (3,499 | ) | (9,002 | ) | 796 | |||||||||
|
Unrealized gain on total return swap
|
- | - | - | 3,553 | ||||||||||||
|
Unrealized loss on forward contracts
|
- | - | - | 11,270 | ||||||||||||
|
Amount due on total return swaps
|
- | - | - | (22,519 | ) | |||||||||||
|
Restricted cash
|
- | - | - | 106,428 | ||||||||||||
|
Net cash (used in) provided by operating activities of discontinued operations
|
(2,265 | ) | 7,127 | 6,980 | - | |||||||||||
|
Net cash provided by (used in) operating activities
|
5,488 | 46,661 | (7,572 | ) | 135,261 | |||||||||||
See accompanying Notes to Consolidated Financial Statements
STEEL PARTNERS HOLDINGS L.P.
Consolidated Statements of Cash Flows
(in thousands)
|
July 16, 2009 to
|
||||||||||||||||
|
Year Ended December 31,
|
December 31,
|
January 1, 2009 to
|
||||||||||||||
|
2011
|
2010
|
2009
|
July 15, 2009
|
|||||||||||||
|
Cash flows from investing activities:
|
||||||||||||||||
|
Purchases of investments
|
(187,459 | ) | (359,575 | ) | (239,862 | ) | (3,362 | ) | ||||||||
|
Proceeds from sale of investments
|
46,220 | 501,067 | 333,141 | 129 | ||||||||||||
|
Net increase in time deposits placed and other short-term investments
|
851 | - | - | - | ||||||||||||
|
Proceeds from sale of loans
|
- | 2,054 | - | 895 | ||||||||||||
|
Net decrease (increase) in loans receivable
|
2,447 | 3,616 | (593 | ) | 3,779 | |||||||||||
|
Purchases of property and equipment
|
(22,137 | ) | (7,296 | ) | (13 | ) | (4 | ) | ||||||||
|
Reclassification of restricted cash
|
119,962 | (19,493 | ) | 1,774 | - | |||||||||||
|
Net cash settlements on derivative instruments
|
(1,047 | ) | (5,124 | ) | - | - | ||||||||||
|
Proceeds from sales of assets
|
1,648 | 457 | - | - | ||||||||||||
|
Acquisitions, net of cash acquired
|
(35,751 | ) | 2,115 | - | (3,715 | ) | ||||||||||
|
Purchase of subsidiary shares from noncontrolling interests
|
(8,827 | ) | (14,134 | ) | (111 | ) | - | |||||||||
|
Investments in associated companies
|
(23,072 | ) | (51,675 | ) | (51,573 | ) | (10,637 | ) | ||||||||
|
Proceeds from sale of discontinued operations
|
26,532 | 64,693 | - | - | ||||||||||||
|
Net cash (used in) provided by investing activities of discontinued operations
|
(41 | ) | 1,520 | 440 | - | |||||||||||
|
Other
|
(388 | ) | - | - | - | |||||||||||
|
Net cash (used in) provided by investing activities
|
(81,062 | ) | 118,225 | 43,203 | (12,915 | ) | ||||||||||
|
Cash flows from financing activities:
|
||||||||||||||||
|
Redemptions from redeemable partners' capital
|
- | - | (204,403 | ) | - | |||||||||||
|
Proceeds related to assumption of deferred fee liability to related party
|
- | - | 4,487 | - | ||||||||||||
|
Common unit cash distributions
|
(29,868 | ) | (49,102 | ) | - | - | ||||||||||
|
Proceeds from term loans - domestic
|
67,981 | 46,000 | - | - | ||||||||||||
|
Net revolver borrowings
|
(18,785 | ) | 11,136 | - | - | |||||||||||
|
Repayments of term loans - foreign
|
(707 | ) | (1,970 | ) | - | - | ||||||||||
|
Repayments of term loans - domestic
|
(26,874 | ) | (86,018 | ) | - | - | ||||||||||
|
Repayments of term loans - related party
|
- | (5,563 | ) | - | - | |||||||||||
|
Deferred finance charges
|
(2,395 | ) | (3,842 | ) | - | - | ||||||||||
|
Net change in overdrafts
|
95 | 2,088 | - | - | ||||||||||||
|
Net increase (decrease) in deposits
|
33,189 | 11,604 | 26,033 | (7,251 | ) | |||||||||||
|
Repayment of debt of discontinued operations
|
- | (22,772 | ) | - | - | |||||||||||
|
Net cash used in financing activities of discontinued operations
|
(219 | ) | - | (8,520 | ) | - | ||||||||||
|
Other
|
(225 | ) | - | - | - | |||||||||||
|
Net cash provided by (used in) financing activities
|
22,192 | (98,439 | ) | (182,403 | ) | (7,251 | ) | |||||||||
|
Net change for the period
|
(53,382 | ) | 66,447 | (146,772 | ) | 115,095 | ||||||||||
|
Effect of exchange rate changes on cash and cash equivalents
|
(275 | ) | (10 | ) | - | - | ||||||||||
|
Cash and cash equivalents at beginning of period/year
|
180,684 | 114,247 | 261,019 | 145,924 | ||||||||||||
|
Cash and cash equivalents at end of period/year
|
$ | 127,027 | $ | 180,684 | $ | 114,247 | $ | 261,019 | ||||||||
See accompanying Notes to Consolidated Financial Statements
STEEL PARTNERS HOLDINGS L.P.
Consolidated Statements of Cash Flows
(in thousands)
|
July 16, 2009 to
|
||||||||||||||||
|
Year Ended December 31,
|
December 31,
|
January 1, 2009 to
|
||||||||||||||
|
2011
|
2010
|
2009
|
July 15, 2009
|
|||||||||||||
|
Cash paid during the year for:
|
||||||||||||||||
|
Interest
|
$ | 13,591 | $ | 17,067 | $ | 334 | $ | 1,302 | ||||||||
|
Taxes
|
$ | 5,053 | $ | 4,026 | $ | - | $ | - | ||||||||
|
Non-cash investing activities:
|
||||||||||||||||
|
Investments acquired in Exchange Transaction on July 15, 2009
|
$ | - | $ | - | $ | - | $ | 404,982 | ||||||||
|
Reclassification of investment in associated company to cost of an acquisition
|
$ | 34,066 | $ | 26,084 | $ | - | $ | - | ||||||||
|
Sale of property for mortgage note receivable
|
$ | - | $ | 630 | $ | - | $ | - | ||||||||
|
Purchase of available-for-sale securities with funds on deposit
|
$ | - | $ | 5,932 | $ | - | $ | - | ||||||||
|
Net decrease (increase) in restricted cash from foreign currency financial instruments
|
$ | 114,087 | $ | (137,823 | ) | $ | - | $ | - | |||||||
|
Net transfers between loans and other assets
|
$ | 569 | $ | 1,157 | $ | - | $ | 247 | ||||||||
|
Reclassification from loans to other non-current assets
|
$ | - | $ | 2,729 | $ | - | $ | - | ||||||||
|
Offset of securities sold, not yet purchased with investments in available-for-sale securities
|
$ | - | $ | - | $ | 33,332 | $ | - | ||||||||
|
Purchase of equipment through capital lease obligations
|
$ | 969 | $ | - | $ | - | $ | - | ||||||||
|
Non-cash financing activities:
|
||||||||||||||||
|
Common units issued for directors compensation
|
$ | 275 | $ | 543 | $ | - | $ | - | ||||||||
|
Acquisition of 2,725,533 treasury units in assumption of deferred fee liability
|
$ | - | $ | - | $ | - | $ | (47,107 | ) | |||||||
|
Common unit distribution payable
|
$ | - | $ | - | $ | - | $ | (78,971 | ) | |||||||
|
Capital redemptions:
|
||||||||||||||||
|
Distribution of assets
|
$ | - | $ | - | $ | - | $ | (521,150 | ) | |||||||
|
Payable to related parties
|
$ | - | $ | - | $ | - | $ | (204,403 | ) | |||||||
|
Reduction of receivable from affiliated entities
|
$ | - | $ | - | $ | - | $ | (24,846 | ) | |||||||
|
Total capital redemption
|
$ | - | $ | - | $ | - | $ | (750,399 | ) | |||||||
See accompanying Notes to Consolidated Financial Statements
STEEL PARTNERS HOLDINGS L.P.
Consolidated Statements of Changes in Capital and Comprehensive Income
(in thousands except common unit data)
|
Common
|
Redeemable
Common
|
Accumulated
Other
|
Treasury Units
|
Partners’
|
Non-
controlling |
Total
|
Redeemable
Partners'
|
|||||||||||||||||||||||||||||||||
|
Units
|
Units
|
(Loss) Income
|
Units
|
Dollars
|
Capital
|
Total
|
Interest
|
Capital
|
Capital
|
|||||||||||||||||||||||||||||||
|
Balance at December 31, 2008
|
2,183,366 | - | $ | (279 | ) | - | $ | - | $ | 42,369 | $ | 42,090 | - | $ | 42,090 | $ | 1,258,725 | |||||||||||||||||||||||
|
Units issued to SPHGP on January 1, 2009
|
497 | (497 | ) | - | - | - | ||||||||||||||||||||||||||||||||||
|
Units issued for net assets in connection with exchange transaction on January 1, 2009
|
1,870,564 | 65,294,819 | $ | 1,258,725 | ||||||||||||||||||||||||||||||||||||
|
Comprehensive (loss):
|
||||||||||||||||||||||||||||||||||||||||
|
Net loss
|
(3,463 | ) | $ | (3,463 | ) | $ | (3,463 | ) | (54,064 | ) | ||||||||||||||||||||||||||||||
|
Unrealized gain on available-for sale investments
|
247 | 247 | 247 | |||||||||||||||||||||||||||||||||||||
|
Comprehensive loss
|
$ | (3,216 | ) | $ | - | $ | (3,216 | ) | ||||||||||||||||||||||||||||||||
|
BNS Holding, Inc. acquisition
|
13,581 | 13,581 | ||||||||||||||||||||||||||||||||||||||
|
Redemptions in connection with exchange transaction on July 15, 2009
|
(39,533,232 | ) | (750,399 | ) | ||||||||||||||||||||||||||||||||||||
|
Acquisition of treasury units for assumption of deferred fee liability to related party
|
(2,725,533 | ) | (47,107 | ) | (47,107 | ) | (47,107 | ) | (47,107 | ) | ||||||||||||||||||||||||||||||
|
Units cancelled in connection with exchange transaction on July 15, 2009
|
(1,870,564 | ) | ||||||||||||||||||||||||||||||||||||||
|
Net assets acquired in exchange transaction on July 15, 2009
|
25,761,587 | (25,761,587 | ) | 454,262 | 454,262 | 454,262 | (454,262 | ) | ||||||||||||||||||||||||||||||||
|
Common unit distribution
|
- | - | (78,971 | ) | (78,971 | ) | (78,971 | ) | ||||||||||||||||||||||||||||||||
|
Balance at July 15, 2009
|
27,945,450 | - | (32 | ) | (2,726,030 | ) | (47,107 | ) | 367,090 | 367,058 | 13,581 | 380,639 | $ | - | ||||||||||||||||||||||||||
|
Comprehensive income:
|
||||||||||||||||||||||||||||||||||||||||
|
Net (loss) income
|
(3,519 | ) | $ | (3,519 | ) | $ | 442 | $ | (3,077 | ) | ||||||||||||||||||||||||||||||
|
Unrealized (loss) gain on available-for-sale investments
|
57,989 | 57,989 | 57,989 | |||||||||||||||||||||||||||||||||||||
|
Currency translation adjustment
|
1,194 | 1,194 | 1,194 | |||||||||||||||||||||||||||||||||||||
|
Change in net pension liability
|
(5,809 | ) | (5,809 | ) | (5,809 | ) | ||||||||||||||||||||||||||||||||||
|
Comprehensive income
|
$ | 49,855 | $ | 442 | $ | 50,297 | ||||||||||||||||||||||||||||||||||
|
Purchase of subsidiary shares from noncontrolling interests
|
(111 | ) | (111 | ) | ||||||||||||||||||||||||||||||||||||
|
Issuance of subsidiary shares from non-controlling interests
|
16 | 16 | ||||||||||||||||||||||||||||||||||||||
|
Balance at December 31, 2009
|
27,945,450 | - | 53,342 | (2,726,030 | ) | (47,107 | ) | 363,571 | 416,913 | 13,928 | 430,841 | |||||||||||||||||||||||||||||
See accompanying Notes to Consolidated Financial Statements
STEEL PARTNERS HOLDINGS L.P.
Consolidated Statements of Changes in Capital and Comprehensive Income
(in thousands except common unit data)
|
Common
|
Redeemable
Common
|
Accumulated
Other
|
Treasury Units
|
Partners’
|
Non-
controlling |
Total
|
||||||||||||||||||||||||||||||
|
Units
|
Units
|
(Loss) Income
|
Units
|
Dollars
|
Capital
|
Total
|
Interest
|
Capital
|
||||||||||||||||||||||||||||
|
Units issued
|
32,134 | 543 | 543 | - | 543 | |||||||||||||||||||||||||||||||
|
Comprehensive income:
|
||||||||||||||||||||||||||||||||||||
|
Net income
|
31,747 | $ | 31,747 | $ | 14,699 | $ | 46,446 | |||||||||||||||||||||||||||||
|
Unrealized loss on available-for-sale investments
|
(37,436 | ) | (37,436 | ) | - | (37,436 | ) | |||||||||||||||||||||||||||||
|
Currency translation adjustment
|
658 | 658 | (101 | ) | 557 | |||||||||||||||||||||||||||||||
|
Change in net pension and other benefit obligations
|
(8,802 | ) | (8,802 | ) | (6,805 | ) | (15,607 | ) | ||||||||||||||||||||||||||||
|
Comprehensive (loss) income
|
$ | (13,833 | ) | $ | 7,793 | $ | (6,040 | ) | ||||||||||||||||||||||||||||
|
Acquisition
|
26,035 | 26,035 | ||||||||||||||||||||||||||||||||||
|
Sale of discontinued operations
|
(8,099 | ) | (8,099 | ) | ||||||||||||||||||||||||||||||||
|
Interests acquired
|
1,261 | 1,261 | (15,395 | ) | (14,134 | ) | ||||||||||||||||||||||||||||||
|
Other, net
|
848 | 848 | 318 | 1,166 | ||||||||||||||||||||||||||||||||
|
Balance at December 31, 2010
|
27,977,584 | - | 7,762 | (2,726,030 | ) | (47,107 | ) | 397,970 | 405,732 | 24,580 | 430,312 | |||||||||||||||||||||||||
|
Units issued
|
14,180 | 275 | 275 | 275 | ||||||||||||||||||||||||||||||||
|
Comprehensive income:
|
||||||||||||||||||||||||||||||||||||
|
Net income
|
35,469 | $ | 35,469 | $ | 45,808 | $ | 81,277 | |||||||||||||||||||||||||||||
|
Unrealized loss on available-for-sale investments
|
11,831 | 11,831 | 2,283 | 14,114 | ||||||||||||||||||||||||||||||||
|
Currency translation adjustment
|
(3,502 | ) | (3,502 | ) | (1,394 | ) | (4,896 | ) | ||||||||||||||||||||||||||||
|
Change in net pension and other benefit obligations
|
(35,149 | ) | (35,149 | ) | (28,217 | ) | (63,366 | ) | ||||||||||||||||||||||||||||
|
Change in net pension and retiree medical liability
|
7,321 | 7,321 | - | 7,321 | ||||||||||||||||||||||||||||||||
|
Comprehensive income
|
$ | 15,970 | $ | 18,480 | $ | 34,450 | ||||||||||||||||||||||||||||||
|
DGT acquisition
|
22,670 | 22,670 | ||||||||||||||||||||||||||||||||||
|
Purchases of treasury stock
|
(82,695 | ) | (992 | ) | (992 | ) | (992 | ) | - | (992 | ) | |||||||||||||||||||||||||
|
Issuance of subsidiary shares
|
3,088 | 3,088 | ||||||||||||||||||||||||||||||||||
|
Purchase of subsidiary shares from noncontrolling interests
|
(4,632 | ) | (4,632 | ) | (4,195 | ) | (8,827 | ) | ||||||||||||||||||||||||||||
|
Other, net
|
(556 | ) | (556 | ) | - | (556 | ) | |||||||||||||||||||||||||||||
|
Balance at December 31, 2011
|
27,991,764 | - | $ | (11,737 | ) | (2,808,725 | ) | $ | (48,099 | ) | $ | 427,534 | $ | 415,797 | $ | 64,623 | $ | 480,420 | ||||||||||||||||||
See accompanying Notes to Consolidated Financial Statements
87
STEEL PARTNERS HOLDINGS L.P.
Notes to Consolidated Financial Statements
(in thousands except per unit data)
Notes to Consolidated Financial Statements
(in thousands except per unit data)
1.
DESCRIPTION OF BUSINESS AND BASIS OF PRESENTATION
Description of Business
Steel Partners Holdings L.P. (“SPH” or the “Company”) is a global diversified holding company that engages in multiple businesses through consolidated subsidiaries, associated companies and other interests. The Company seeks to work with its companies to increase corporate value over the long term for all stakeholders and shareholders by implementing Steel Partners Operational Excellence programs, the Steel Partners Purchasing Council, Steel Partners Corporate Services, balance sheet improvements, capital allocation policies and growth initiatives.
The Company operates through consolidated subsidiaries and associated companies, which represent significant equity interests in operating businesses. SPH also owns interests directly and indirectly in other companies. As of December 31, 2011, the Company’s operations are conducted through its two primary segments: Diversified Industrial and Financial Services. The Company also reports certain other investments and investment activity and unallocated corporate expenses within its Corporate segment.
SPH, a Delaware limited partnership, formerly known as WebFinancial L.P., was formed on December 16, 2008 as a wholly-owned subsidiary of WebFinancial Corporation (“WebFinancial”), a Delaware corporation, which was a publicly traded financial holding company. SPH is the successor through a merger on December 31, 2008 with WebFinancial. The purpose of the merger was to convert the legal entity form of the business of WebFinancial from a corporation into a limited partnership. Steel Partners Holdings GP Inc. (f/k/a Steel Partners Holdings GP LLC) (“SPH GP”), a Delaware corporation, is the general partner of SPH and is wholly-owned by SPH. Until December 31, 2011, Steel Partners LLC (“SPLLC”) was the manager of SPH (the “Manager”). Effective January 1, 2012, SPLLC assigned its interest as the Manager to SP General Services LLC (“SPGS”), formerly an affiliate of SPLLC. The unitholders of SPH have limited liability with respect to their interest in the Company.
Diversified Industrial Operations
SPH’s diversified industrial operations are primarily conducted through its consolidated subsidiaries Handy & Harman Ltd. (“HNH”), BNS Holding, Inc. (“BNS”), and DGT Holdings Corp. (“DGT”). HNH is a holding company that owns a variety of manufacturing operations encompassing precious metals, tubing, engineered materials, electronic materials and cutting replacement products and services businesses. HNH became a consolidated, majority-owned subsidiary on May 7, 2010, when SPH’s ownership exceeded 50%; prior to that date HNH was an associated company accounted for under the equity method of accounting at fair value. BNS operates through its subsidiary Sun Well Services, Inc. (“Sun Well”), a provider of premium well services to exploration and production (“E&P”) companies operating primarily in the Williston Basin in North Dakota and eastern Montana. DGT operates, through its subsidiary, RFI Corporation (“RFI”), which designs, manufactures, markets and sells high voltage precision components and sub-assemblies and electronic noise suppression components for a variety of applications.
Diversified industrial operations are also conducted by (i) SL Industries, Inc., (“SLI”), an associated company accounted for using the equity method. SLI designs, manufactures and markets power electronics, motion control, power protection and specialized communication equipment, and (ii) the following other core companies: API Group PLC (“API”), a leading manufacturer of specialized materials for packaging and JPS Industries, Inc. (“JPS”), a manufacturer of extruded urethanes, polypropylenes and mechanically formed glass. Effective December 31, 2011, the Company’s investments in API and JPS were reclassified to Investments at fair value. Through December 31, 2011 they were associated companies.
Financial Services
SPH’s Financial Services are conducted through its consolidated, wholly-owned subsidiary, WebFinancial Holding Corporation whose wholly owned subsidiary, WebBank, is a Utah- chartered industrial bank (“WebBank”), which provides small business commercial and consumer loans and services. WebBank’s deposits are insured by the Federal Deposit Insurance Corporation (“FDIC”), and it is examined and regulated by the FDIC and the State of Utah Department of Financial Institutions (“UDFI”).
88
STEEL PARTNERS HOLDINGS L.P.
Notes to Consolidated Financial Statements
(in thousands except per unit data)
Notes to Consolidated Financial Statements
(in thousands except per unit data)
Corporate
Corporate operations are conducted by the following associated companies: Steel Excel Inc., formerly known as ADPT Corporation (“Steel Excel”) and CoSine Communications, Inc. (“CoSine “). Steel Excel owns certain businesses and is seeking to acquire one or more new business operations. CoSine is in the business of seeking to acquire one or more new business operations. Steel Excel and CoSine are accounted for under the equity method of accounting with Steel Excel reported at fair value.
Other direct and indirect core interests include Fox & Hound Restaurant Group (“Fox & Hound”), a privately held owner and operator of a chain of approximately 130 company-owned and 14 franchised social destination casual dining and entertainment based restaurants in 32 states, Barbican Group Holdings Limited (“Barbican”); a Guernsey based privately-held company which underwrites property and casualty insurance and reinsurance through its subsidiaries and its Lloyds of London syndicate, and GenCorp Inc. (“GenCorp”), a manufacturer of aerospace and defense systems that also has a real estate business, the activities of which include the entitlement, sale and leasing of its excess real estate assets.
Basis of Presentation
Certain prior period amounts in the Consolidated Balance Sheets and Statement of Cash Flows have been reclassified to conform to the comparable 2011 presentation.
SPH acquired Steel Partners II, L.P. (“SPII”), a Delaware limited partnership, which pursuant to an exchange transaction became a wholly-owned subsidiary of SPH without further condition on July 15, 2009 (the “Exchange Transaction”) (see Note 21 - “Exchange Transaction”). The Exchange Transaction was accounted for as a transaction between entities under common control and as such SPII’s accounts are consolidated with SPH for all periods presented. The Company presents the operations of SPII, which was an investment partnership and consisted of a portfolio of investments, in its consolidated financial statements as Investment Operations and is reported as a segment through July 15, 2009. From July 16, 2009 forward, upon the completion of the Exchange Transaction, SPH ceased reporting the results of SPII as a separate Investment Operations segment when SPII’s net assets were acquired by SPH.
The consolidated financial statements include the consolidated financial results of SPH and WebFinancial (which was merged with and into SPH on December 31, 2008), BNS, HNH, DGT and their subsidiaries. Acquired companies are presented from their dates of acquisition (see Note 2 - “Acquisitions” and Note 5 - “Investments in Associated Companies”). DGT’s fiscal year-end is July 31, 2011 and the Company has recorded their financial statements on a two-month lag. As a result, the statement of operations for the year ended December 31, 2011 includes DGT’s activity from July 5 through October 31, 2011 only. BNS has changed its fiscal year end from October 31 to December 31. The year ended December 31, 2011 includes two additional months for BNS, November and December of 2010. The change did not have a material effect on the consolidated financial statements. In 2010, the results of HNH are presented from May 7, 2010 through December 31, 2010.
SPH’s operations, those that existed prior to July 16, 2009 and continued thereafter (“Pre-Exchange Operations”), together with the operations related to the assets acquired as a result of the acquisition of SPII as of July 15, 2009 (see Note 3 - “Acquisitions”) are accounted for and presented on an operating company basis of accounting, in accordance with accounting principles generally accepted in the United States of America (“GAAP”). These operations are presented in the consolidated financial statements as “Diversified Industrial, Financial Services and Other”.
The Company accounts for the consolidation of SPII in the consolidated financial statements as “Investment Operations” on the basis of the specialized GAAP prescribed in the Financial Accounting Standards Board (“FASB”) Accounting Standards Codification (“ASC”) 946, “Financial Services - Investment Companies” for all periods presented through July 15, 2009. After July 15, 2009, the date which SPII became a subsidiary of SPH without further condition, SPH accounts for the assets it acquired as part of the Exchange Transaction in accordance with its accounting policies as an operating company, and therefore it does not report Investment Operations in its consolidated financial statements after July 15, 2009.
89
STEEL PARTNERS HOLDINGS L.P.
Notes to Consolidated Financial Statements
(in thousands except per unit data)
Notes to Consolidated Financial Statements
(in thousands except per unit data)
The Exchange Transaction, which initially occurred on January 1, 2009, was subject to being unwound, in whole or part, until July 15, 2009. Accordingly, the net assets of SPII until July 15, 2009 represented a redeemable interest of SPH, and are therefore presented as “Redeemable Partners’ Capital” in the consolidated financial statements for all periods presented until July 15, 2009. Redeemable Partners’ Capital accordingly only participated in 100% of the economic results of SPII and did not participate in the economic results of the Pre-Exchange Operations. At July 15, 2009, (i) certain assets of SPII were distributed in redemption of a portion of the Redeemable Partners’ Capital of equal value, (ii) the remaining net assets of SPII were then acquired by SPH in the Exchange Transaction as of July 15, 2009, and (iii) the unredeemed portion of the Redeemable Partners’ Capital (of equal value to the net assets of SPII then acquired) became nonredeemable and thereafter participates in an undivided interest in SPH and its economic results. (See Note 3 - “Acquisitions” and Note 21 - “Exchange Transaction”).
The SPII assets acquired by SPH in the Exchange Transaction as of July 15, 2009 were valued at fair value determined in accordance with ASC 946. The fair values of SPII assets acquired on July 15, 2009 established the initial carrying values from which operating company accounting principles began to be applied to such assets, including those applicable to accounting for investments and business combinations.
The primary difference between the operating company accounting policies of Diversified Industrial, Financial Services and Other operations and the investment company accounting policies of Investment Operations relate to accounting for investments:
|
|
·
|
SPH evaluates its Diversified Industrial, Financial Services and Other investments and determines the appropriate classification as a consolidated subsidiary, an equity method investment, an available-for-sale security, or a held-to-maturity security, each with a different financial reporting treatment. For investments that are accounted for under the equity method at fair value unrealized gains and losses are presented the consolidated statement of operations. Unrealized changes in the fair value of available for sale securities are presented in other comprehensive income in the consolidated statement of changes in capital and comprehensive income (loss) and not in the consolidated statement of operations.
|
|
|
·
|
For Investment Operations, investments are accounted for at fair value with changes in fair value of all investments reported in the revenue section of the consolidated statements of operations as “change in unrealized gains (losses), investments” when they occur. Under investment company accounting, Investment Operations does not consolidate investments and it does not apply the equity method of accounting.
|
|
|
·
|
For Investment Operations, proceeds from sale of investments and purchases of investments are included in cash flows from operating activities. For Diversified Industrial, Financial Services and Other, proceeds from sale of investments and purchases of investments are cash flows from investing activities.
|
Presentation of Financial Statements
With respect to Investment Operations assets that were acquired by the Company as of July 15, 2009 pursuant to the Exchange Transaction, the change in the basis of accounting and financial statement presentation from investment company accounting to operating company accounting has been accounted for prospectively from July 15, 2009, the date the SPII net assets were acquired in the Exchange Transaction and were no longer subject to redemption. Operating company accounting as described above, is in certain important aspects different in substance from investment company accounting. The consolidated financial statements have been presented in a manner to reflect the different basis of accounting for the Diversified Industrial, Financial Services and Other operations for all periods presented and the Investment Operations for the period January 1, 2009 to July 15, 2009, specifically as follows:
90
STEEL PARTNERS HOLDINGS L.P.
Notes to Consolidated Financial Statements
(in thousands except per unit data)
Notes to Consolidated Financial Statements
(in thousands except per unit data)
|
|
·
|
The consolidated balance sheets only presents Diversified Industrial, Financial Services and Other, as Investment Operations ceased on July 15, 2009 upon the completion of the Exchange Transaction and the net assets of SPII as of that date became part of the Company’s Diversified Industrial, Financial Services and Other operations beginning July 16, 2009.
|
|
|
·
|
From July 16, 2009 forward, the investments acquired as part of the Exchange Transaction (previously carried at fair value under investment company accounting) are included in Diversified Industrial, Financial Services and Other and are accounted for under the equity method and as available-for-sale securities. Operating company accounting was applied to the net assets acquired as part of the Exchange Transaction held by SPII using the fair values of the assets and liabilities on July 15, 2009 as the initial carrying values. See “Exchange Transaction” in Note 3 - “Acquisitions” for the fair values of the assets acquired and liabilities assumed.
|
|
|
·
|
The consolidated statements of operations, cash flows and changes in capital and comprehensive income (loss) for 2009 are presented in two periods, January 1, 2009 to July 15, 2009 and July 16, 2009 to December 31, 2009, reflecting the financial results and the applicable basis of accounting for the period in 2009 before and after the completion of the Exchange Transaction on July 15, 2009, respectively.
|
|
|
·
|
For the periods presented prior to July 16, 2009, revenue and costs and expenses in the consolidated statements of operations are presented in two sections. The Diversified Industrial, Financial Services and Other section represents the Pre-Exchange Operations presented on an operating company basis and the Investment Operations section represents SPII’s investment operations presented on an investment company basis.
|
|
|
·
|
For the years ended December 31, 2011 and 2010, both periods in 2009 (all of 2009), January 1, 2009 to July 15, 2009 and July 16, 2009 to December 31, 2009, Diversified Industrial, Financial Services and Other are presented on an operating company basis.
|
|
|
·
|
Investment Operations, representing SPII’s operations for the period from January 1, 2009 to July 15, 2009, are presented on an investment company basis.
|
|
|
·
|
From July 16, 2009 forward one basis of accounting, the operating company basis, is used for all operations and is presented as Diversified Industrial, Financial Services and Other.
|
2.
SUMMARY OF SIGNIFICANT ACCOUNTING POLICIES
The Company’s consolidated financial statements are prepared in accordance with accounting principles generally accepted in the United States of America (“GAAP”).
Principles of Consolidation
The consolidated financial statements include the accounts of SPH consolidated with the accounts of its subsidiaries. Acquired companies are presented for their dates of acquisition (see Note 3 – “Acquisitions” and Note 5 – “Investments in Associated Companies”). Significant inter-company accounts and transactions have been eliminated in consolidation.
91
STEEL PARTNERS HOLDINGS L.P.
Notes to Consolidated Financial Statements
(in thousands except per unit data)
Notes to Consolidated Financial Statements
(in thousands except per unit data)
With respect to Investment Operations for periods presented prior to July 15, 2009, the Company applied investment company accounting and did not consolidate its 50% or more owned investments.
Variable Interest Entities
For each Variable Interest Entity (“VIE”) in which it holds a variable interest, the Company initially determines whether it is the primary beneficiary of the VIE by performing a quantitative and qualitative analysis of the Company’s obligation to absorb expected losses and its right to receive expected residual benefits of the VIE and evaluating the VIE’s capital structure, the contractual terms affecting the management and operation of the VIE, related party relationships of SPH, and which interests create and absorb variability. The determination of whether the Company is the primary beneficiary of each variable interest entity is reviewed upon the occurrence of certain reconsideration events.
Discontinued Operations
On November 3, 2011, DGT completed a share purchase agreement (the “Share Purchase Agreement”) with VIV s.r.1., a limited liability company incorporated under Italian law (“VIV”), pursuant to which DGT has sold all of the shares of its Italian subsidiary, Villa, its medical and dental imaging systems segment, to VIV.
In 2011, HNH sold its stock of Euro-Kasco S.A.S. (“Euro-Kasco”), a part of its Kasco segment. In 2010, HNH exited the business of manufacturing adhesive films, specialty graphic films and engineered coated products known as Arlon CM and in 2011, sold the assets of these businesses.
The consolidated financial statements include the financial position, results of operations and cash flows of Arlon CM, which was acquired through the May 7, 2010 acquisition of HNH and is classified as a discontinued operation on a retrospective basis from the date of the HNH acquisition.
On February 18, 2010, BNS sold its interest in Collins Industries, Inc. (“Collins”) for net proceeds of $64,818 in cash net of $100 in fees. Collins was acquired through the July 14, 2009 acquisition of BNS and sold on February 18, 2010.
Prior to sale, the current assets and current liabilities of discontinued operations are combined into separate captions on the consolidated balance sheets as of December 31, 2011 and 2010. The consolidated statements of operations and cash flows of the discontinued operations are combined into separate captions through their respective sale dates.
Use of Estimates in Preparation of Consolidated Financial Statements
The preparation of the consolidated financial statements in conformity with U.S. GAAP requires management to make estimates and assumptions that affect the reported amount of assets and liabilities at the date of the financial statements and the reported amount of revenues, expenses, unrealized gains and losses during the reporting period. The more significant estimates include: (1) the valuation allowances of accounts receivable and inventory; (2) the valuation of goodwill, indefinite-lived intangible assets, long-lived assets and associated companies; (3) deferred tax assets; (4) environmental liabilities; (5) fair value of derivatives; (6) post-employment benefit liabilities; (7) estimates and assumptions used in the determination of fair value of certain securities, such as whether declines in value of securities are other than temporary; and (8) estimates of loan losses. Actual results may differ from the estimates used in preparing the consolidated financial statements; and, due to substantial holdings in and/or restrictions on certain investments, the value that may be realized could differ from the estimated fair value.
Revenue Recognition
Revenues are recognized when the title and risk of loss has passed to the customer. This condition is normally met when product has been shipped or the service performed. An allowance is provided for estimated returns and discounts based on experience. Cash received from customers prior to shipment of goods, or otherwise not yet earned, is recorded as deferred revenue. Rental revenues are derived from the rental of certain equipment to the food industry where customers prepay for the rental period - usually 3 to 6 month periods. For prepaid rental contracts, sales revenue is recognized on a straight-line basis over the term of the contract. Service revenues consist of repair and maintenance work performed on equipment used at mass merchants, supermarkets and restaurants.
92
STEEL PARTNERS HOLDINGS L.P.
Notes to Consolidated Financial Statements
(in thousands except per unit data)
Notes to Consolidated Financial Statements
(in thousands except per unit data)
HNH experiences a certain degree of sales returns that varies over time, but is able to make a reasonable estimation of expected sales returns based upon history. HNH records all shipping and handling fees billed to customers as revenue, and related costs are charged principally to cost of sales, when incurred. In limited circumstances, HNH is required to collect and remit sales tax on certain of its sales. HNH accounts for sales on a net basis, and as such sales taxes are not included in diversified industrial sales - net on the consolidated statements of operations.
Cash and Cash Equivalents
Cash and cash equivalents include cash and deposits in depository institutions, financial institutions and banks. Cash at December 31, 2011 and 2010 also includes $781 and $3,797, respectively of WebBank Federal Funds sold. The Company considers all highly liquid debt instruments with maturities of three months or less when purchased to be cash equivalents. Cash and cash equivalents exclude amounts where availability is restricted by loan agreements or other contractual provisions. Cash equivalents are stated at cost, which approximates market. There is a significant concentration of cash that, during the periods presented, exceeded the federally insured limit and exposed the Company to credit risk. A significant amount of cash is uninsured as of December 31, 2011 and 2010. The cash is held such that it is not subject to federal deposit insurance and where applicable exceeds the protection provided by the Securities Investor Protection Corporation. SPH does not anticipate any losses due to this concentration of cash at December 31, 2011. Restricted cash consists of collateral held against financial instruments including amounts payable in foreign currencies. Restricted cash is reported separately as a current asset in the consolidated balance sheets at December 31, 2011 and 2010.
Investments
SPH determines the appropriate classifications of Diversified Industrial, Financial Services and Other investments in debt and equity securities at the acquisition date and re-evaluates the classifications at each balance sheet date. SPH classifies its investments as held-to-maturity, available-for-sale, or trading. Held-to-maturity investments are carried at amortized cost. Trading investments, which are bought and held principally for the purpose of resale in the near future, are carried at estimated fair value with unrealized gains and losses reflected in results of operations. All other securities are classified as available-for-sale, which are recorded at estimated fair value with unrealized holding gains or losses excluded from earnings and reported, until realized, in accumulated other comprehensive income (loss) as a separate component of partners’ capital. If the Company believes a decline in the market value of any available-for-sale or held-to-maturity security below cost is other than temporary, a loss is charged to earnings which establish a new lower cost basis for the security. The impairment losses are included in Asset impairment charges in the consolidated statements of operations. SPH’s determination of whether a security is other than temporarily impaired incorporates both quantitative and qualitative information; GAAP requires the exercise of judgment in making this assessment, rather than the application of fixed mathematical criteria. The Company considers a number of factors including, but not limited to, the length of time and the extent to which the fair value has been less than cost, the financial condition and near-term prospects of the issuer, the reason for the decline in fair value, changes in fair value subsequent to the balance sheet date, the ability and intent to hold investments to maturity, and other factors specific to the individual investment. SPH’s assessment involves a high degree of judgment and accordingly, actual results may differ materially from those estimates and judgments. Dividend and interest income are recognized when earned. Realized gains and losses for investments classified as available-for-sale or held-to-maturity are included in earnings and are derived using the specific-identification method. Unrealized and realized gains or losses on securities sold, not yet purchased are included in earnings. Commission expense on purchases is included in the cost of investments in the consolidated balance sheets. Commission expense is recorded as a reduction of sales proceeds on investment transactions and is included in net investment gains in the consolidated statements of operations.
93
STEEL PARTNERS HOLDINGS L.P.
Notes to Consolidated Financial Statements
(in thousands except per unit data)
Notes to Consolidated Financial Statements
(in thousands except per unit data)
SPH uses the equity method of accounting with respect to Diversified Industrial, Financial Services and Other investments when it has the ability to exercise significant influence, but not control, over the operating and financial policies of the investee. Significant influence is generally presumed to exist if the Company has an ownership interest in the voting stock of the investee between 20% and 50%, although other factors, such as representation on the investee’s board of directors, are considered in determining whether the equity method of accounting is appropriate. For the equity method investments where the fair value option has not been elected, SPH records the investment at cost and subsequently increases or decreases the investment by its proportionate share of the net income or losses and other comprehensive income of the investee. Dividends received from investees are recorded as reductions in the carrying value of the investment. For equity method investments which the Company has elected to measure at fair value, unrealized gains and losses are reported in the consolidated statement of operations as part of income (loss) from equity method investments and include income (loss) of certain associated companies and loss from other investments - related party. In applying the equity method with respect to investments previously accounted for as available-for-sale at fair value, the carrying value of the investment is adjusted as if the equity method had been applied from the time the investment was first acquired.
Prior to July 16, 2009, Investment Operations investments were accounted for at estimated fair value. Realized and unrealized gains and losses on securities and on securities sold not yet purchased using the specific identification method are reported as revenue in the consolidated statements of operations. Dividend and interest income are recognized when earned. Commission expense on purchases is included in the cost of investments in the consolidated balance sheets. Commission expense is recorded as a reduction of sales proceeds on investment transactions and is included in net investment gains in the consolidated statements of operations.
Trade Accounts Receivable and Allowance for Doubtful Accounts
HNH extends credit to customers based on its evaluation of the customer’s financial condition. HNH does not require that any collateral be provided by its customers. HNH has established an allowance for accounts that may become uncollectible in the future. This estimated allowance is based primarily on management’s evaluation of the financial condition of the customer and historical experience. HNH monitors its accounts receivable and charges to expense an amount equal to its estimate of potential credit losses. Accounts that are outstanding longer than contractual payment terms are considered past due. HNH considers a number of factors in determining its estimates, including the length of time its trade accounts receivable are past due, HNH’s previous loss history and the customer’s current ability to pay its obligation. Trade accounts receivable balances are charged off against the allowance when it is determined that the receivable will not be recovered, and payments subsequently received on such receivables are credited to recovery of accounts written off. HNH does not charge interest on past due receivables.
The Company believes that the credit risk with respect to trade accounts receivable is limited due to HNH’s credit evaluation process, the allowance for doubtful accounts that has been established, and the diversified nature of its customer base.
Concentration of Revenue and Trade Accounts Receivable
In 2011, the 15 largest customers accounted for approximately 26% of the diversified industrial segment’s net sales and no customer accounted for more than 5% of revenue. For the period from May 7, 2010 (the date HNH was acquired) to December 31, 2010, the 15 largest customers accounted for approximately 31% of diversified industrial net sales and no customer accounted for more than 5% of revenue. As of December 31, 2011, the 15 largest diversified industrial customers accounted for 24% of the segment’s trade receivables.
For the years ended December 31, 2011 and 2010, two contractual lending programs accounted for 58% and 54%, respectively, of the financial services segment’s revenue.
94
STEEL PARTNERS HOLDINGS L.P.
Notes to Consolidated Financial Statements
(in thousands except per unit data)
Notes to Consolidated Financial Statements
(in thousands except per unit data)
Inventories
Inventories are stated at the lower of cost or market. Cost is determined by the last-in, first-out (“LIFO”) method for precious metal inventories. Non precious metal inventories are stated at the lower of cost (principally FIFO or average cost) or market. For precious metal inventories, no segregation among raw materials, work in process and finished goods is practicable.
Non-precious metal inventory is evaluated for estimated excess and obsolescence based upon assumptions about future demand and market conditions and is adjusted accordingly. If actual market conditions are less favorable than those projected, write-downs may be required.
Derivatives and Risks
Precious Metal Risk
HNH enters into commodity futures and forwards contracts on precious metals that are subject to market fluctuations in order to economically hedge its precious metal inventory against price fluctuations. Future and forward contracts to sell or buy precious metal are the derivatives used for this objective. The forward contracts entered into by HNH are with a counter party rated “A” by Standard & Poor’s, and the future contracts are exchange traded contracts through a third party broker. Accordingly, HNH has determined that there is minimal credit risk of default. HNH estimates the fair value of its derivative contracts through use of market quotes or broker valuations when market information is not available.
As these derivatives are not designated as accounting hedges under GAAP, they are accounted for as derivatives with no hedge designation. These derivatives are marked to market and both realized and unrealized gains and losses on these derivatives are recorded in the consolidated statement of operations. The unrealized gain or loss (open trade equity) on the derivatives is included in other current assets or other current liabilities, respectively. HNH’s hedging strategy is designed to protect it against normal volatility; therefore abnormal price increases in these commodity markets could negatively impact results of operations.
Financial Instruments
SPH invested in buying calls and selling puts in place of holding stock in two companies to create similar risk/reward characteristics of a direct investment in these companies. The option contracts were exchange traded in active markets and SPH estimates the fair value of the options through use of quoted prices obtained on internationally recognized exchanges. These derivative financial instruments are reported at fair value as financial instruments in the consolidated balance sheet and changes in fair value are reported in the consolidated statement of operations.
SPH common unit options issued to the Manager (see Note 17 - “Capital and Comprehensive Income”) are accounted for as a derivative financial instrument. The common unit option liability is recorded at fair value and reported in other current liabilities on the consolidated balance sheets. Changes in fair value of the common unit option liability are reported in selling, general and administrative expenses on the consolidated statements of operations.
Financial instruments include amounts payable denominated in foreign currency and are valued at fair value. Changes in fair value of the financial instruments are reported in net investment gains (losses) in the consolidated statements of operations.
95
STEEL PARTNERS HOLDINGS L.P.
Notes to Consolidated Financial Statements
(in thousands except per unit data)
Notes to Consolidated Financial Statements
(in thousands except per unit data)
Foreign Currency Exchange Rate Risk
Financial instruments include amounts payable in foreign currencies which are subject to the risk of exchange rate changes. These financial instruments resulted from transactions entered into for risk management purposes, are collateralized by an equivalent amount included in restricted cash and have no maturity date.
Loans Receivable
WebBank grants commercial and consumer loans to customers. Loans that WebBank has the intent and ability to hold for the foreseeable future or until maturity or pay-off generally are reported at their outstanding unpaid principal balances adjusted for charge-offs, the allowance for loan losses, and any deferred fees or costs on originated loans. Interest income is accrued on the unpaid principal balance. Loan origination fees, net of certain direct origination costs, are deferred and recognized as an adjustment of the related loan yield. The accrual of interest on loans is generally discontinued at the time the loan is 90 days delinquent unless the credit is well-secured and in process of collection. Loans are placed on nonaccrual or charged-off at an earlier date if collection of principal or interest is considered doubtful. All interest accrued but not collected for loans that are placed on nonaccrual is reversed against interest income. The interest on these loans is accounted for on the cash-basis or cost-recovery method, until qualifying for return to accrual. Loans are returned to accrual status when all the principal and interest amounts contractually due are brought current and future payments are reasonably assured.
WebBank has originated government guaranteed loans to customers under a United States Department of Agriculture (
“
USDA
”
) program and a Small Business Administration (
“
SBA
”
) program. The USDA program guarantees 70.0% to 90.0% of each loan and the SBA loans provide guarantees of 75.0% to 85.0% of each loan. Generally, WebBank sells the guaranteed portion of each loan to a third party and retains the unguaranteed portion in its own portfolio. Loans held for sale are carried at the lower of cost or estimated market value in the aggregate. WebBank is required to retain a minimum of 5.0% of each USDA loan sold and 15.0% of each SBA loan sold and to service the loan for the investor. Based on the specific loan sale agreement that WebBank enters into with the investor, the difference between the yield on the loan and the yield paid to the buyer is the servicing fee. Fees earned for servicing loans for others are reported as income when the related loan payments are collected, less amortization of the servicing asset. Loan servicing costs are charged to expense as incurred. Servicing assets represent the allocated value of retained servicing rights on loans sold.
Loan Impairment and Allowance for Loan Losses
A loan is considered impaired when, based on current information and events, it is probable that WebBank will be unable to collect the scheduled payments of principal and interest when due according to the contractual terms of the loan agreement. Factors considered by WebBank in determining impairment include payment status, collateral value, and the probability of collecting scheduled principal and interest payments when due. Loans that experience insignificant payment delays and payment shortfalls generally are not classified as impaired. WebBank determines the significance of payment delays and payment shortfalls on a case-by-case basis. Impairment is measured on a loan by loan basis by either the present value of expected future cash flows discounted at the loan’s effective interest rate, the loan’s observable fair value, or the fair value of the collateral, less any selling costs, if the loan is secured by collateral. Large groups of smaller balance homogeneous loans are collectively evaluated for impairment.
The allowance for loan losses is established as losses are estimated to have occurred through a provision for loan losses and is charged to earnings. Loan losses are charged against the allowance when WebBank believes the uncollectibility of a loan or receivable balance is confirmed. Subsequent recoveries, if any, are credited to the allowance. The allowance for loan losses is evaluated on a regular basis by WebBank and is inherently subjective as it requires estimates that are susceptible to significant revision as more information becomes available.
96
STEEL PARTNERS HOLDINGS L.P.
Notes to Consolidated Financial Statements
(in thousands except per unit data)
Notes to Consolidated Financial Statements
(in thousands except per unit data)
Servicing Assets
The servicing assets of WebBank represent the allocated value of retained servicing rights on loans sold. Servicing assets are expensed in proportion to, and over the period of, estimated net servicing revenues. Impairment is evaluated based on stratifying the underlying financial assets by date of origination and term. Fair value is based upon discounted cash flows using market-based assumptions. Any impairment, if temporary, of a grouping is reported as a valuation allowance, to the extent that fair value is less than the capitalized amount for the grouping. The Bank has one class of servicing assets; the sold guaranteed portion of USDA and SBA loans. Servicing fees are included in other noninterest income. When loans are charged off, the related servicing asset is also removed as a charge to operations.
Property, Plant and Equipment
Property, plant and equipment is recorded at cost. Depreciation of property, plant and equipment is provided principally on the straight line method over the estimated useful lives of the assets, which range as follows: machinery & equipment 3 to 15 years and buildings and improvements 10 to 30 years. Leasehold improvements are amortized over the shorter of the terms of the related leases or the estimated useful lives of the improvements, between three and five years. Interest cost is capitalized for qualifying assets during the assets’ acquisition period. Maintenance and repairs are charged to expense and renewals and betterments are capitalized. Profit or loss on dispositions is credited or charged to other expenses.
Goodwill, Intangibles and Long-Lived Assets
Goodwill is reviewed annually for impairment in accordance with GAAP. The Company uses judgment in assessing whether assets may have become impaired between annual impairment tests. Circumstances that could trigger an interim impairment test include but are not limited to: the occurrence of a significant change in circumstances, such as continuing adverse business conditions or legal factors; an adverse action or assessment by a regulator; unanticipated competition; loss of key personnel; the likelihood that a reporting unit or significant portion of a reporting unit will be sold or otherwise disposed; or results of testing for recoverability of a significant asset group within a reporting unit.
The testing of goodwill for impairment is performed at a level referred to as a reporting unit. Goodwill is allocated to each reporting unit based on actual goodwill valued in connection with each business combination consummated within each reporting unit. Reporting units of the Company have goodwill assigned to them.
Goodwill impairment testing consists of a two-step process. Step 1 of the impairment test involves comparing the fair values of the applicable reporting units with their carrying values, including goodwill. If the carrying amount of a reporting unit exceeds the reporting unit’s fair value, Step 2 of the goodwill impairment test is performed to determine the amount of impairment loss. Step 2 of the goodwill impairment test involves comparing the implied fair value of the affected reporting unit’s goodwill against the carrying value of that goodwill. In performing the first step of the impairment test, the Company also reconciles the aggregate estimated fair value of its reporting units to its enterprise value (which includes a control premium).
To estimate the fair value of reporting units, the Company uses an income approach and a market approach. The income approach is based on a discounted cash flow analysis (“DCF”) and calculates the fair value by estimating the after-tax cash flows attributable to a reporting unit and then discounting the after-tax cash flows to a present value using a risk-adjusted discount rate. Assumptions used in the DCF require the exercise of significant judgment, including judgment about appropriate discount rates and terminal values, growth rates, and the amount and timing of expected future cash flows. The forecasted cash flows are based on current plans and for years beyond that plan, the estimates are based on assumed growth rates. The Company believes the assumptions are consistent with the plans and estimates used to manage the underlying businesses. The discount rates, which are intended to reflect the risks inherent in future cash flow projections, used in the DCF are based on estimates of the weighted-average cost of capital (“WACC”) of a market participant. Such estimates are derived from an analysis of peer companies and considered the industry weighted average return on debt and equity from a market participant perspective. The Company believes the assumptions used to determine the fair value of reporting units are reasonable. If different assumptions were used, particularly with respect to forecasted cash flows or WACCs, different estimates of fair value may result and there could be the potential that an impairment charge could result. Actual operating results and the related cash flows of the reporting units could differ from the estimated operating results and related cash flows. The recoverability of goodwill may be impacted if estimated future operating cash flows are not achieved.
97
STEEL PARTNERS HOLDINGS L.P.
Notes to Consolidated Financial Statements
(in thousands except per unit data)
Notes to Consolidated Financial Statements
(in thousands except per unit data)
A market approach values a business by considering the prices at which shares of capital stock of reasonably comparable companies are trading in the public market, or the transaction price at which similar companies have been acquired.
Relative weights are then given to the results of each of these approaches, based on the facts and circumstances of the business being valued. The use of multiple approaches (the income and market approaches) is considered preferable to a single method. Significant weight is given to the income approach because it generally provides a reliable estimate of value for an ongoing business which has a reliable forecast of operations. The income approach closely parallels investors’ consideration of the future benefits derived from ownership of an asset.
For other intangible assets with indefinite lives, impairment occurs when the carrying amount of an asset is greater than its fair value. A charge is recorded for the difference between the carrying amount and the estimated fair value. The Company’s estimates of fair value are based primarily on a discounted cash flow approach that requires significant management judgment with respect to future revenue and expense growth rates, changes in working capital use, inflation and the selection of an appropriate discount rate.
Intangible assets with finite lives are amortized over their estimated useful lives. The Company also estimates the depreciable lives of property, plant and equipment. Property, plant and equipment and intangible assets with finite lives are reviewed for impairment if events, or changes in circumstances, indicate that we may not recover the carrying amount of an asset. Long-lived assets consisting of land and buildings used in previously operating businesses are carried at the lower of cost or fair value, and are included in other non-current assets in the consolidated balance sheets. A reduction in the carrying value of such long-lived assets used in previously operating businesses is recorded as an asset impairment charge in the consolidated statement of operations.
Comprehensive Income
Accounting principles generally require that recognized revenue, expenses, gains and losses be included in net income. Certain changes in assets and liabilities, such as unrealized gains and losses on securities available-for-sale, are reported as a separate component of the capital section of the consolidated balance sheets. Such items, along with net income, are components of comprehensive income (loss).
Fair Value of Financial Instruments
As defined under GAAP, fair value is the price received or paid between independent participants acting voluntarily in the principal or most advantageous markets for the assets or liabilities traded. A disclosure framework prioritizes and ranks the level of market price observability used in measuring investments at fair value (see Note 7 — “Fair Value Measurements”). Considerable judgment may be required in estimating fair value. Estimates of fair value are not necessarily indicative of the amounts that could be realized in a current or future transaction.
Environmental Liabilities
The Company accrues for losses associated with environmental remediation obligations when such losses are probable and reasonably estimable. Accruals for estimated losses from environmental remediation obligations generally are recognized no later than completion of the remedial feasibility study.
98
STEEL PARTNERS HOLDINGS L.P.
Notes to Consolidated Financial Statements
(in thousands except per unit data)
Notes to Consolidated Financial Statements
(in thousands except per unit data)
Such accruals are adjusted as further information develops or circumstances change. Costs of future expenditures for environmental remediation obligations are not discounted to their present value. Recoveries of environmental remediation costs from other parties are recorded as assets when their receipt is deemed probable.
Legal Contingencies
The Company provides for legal contingencies when the liability is probable and the amount of the associated costs is reasonably determinable. The Company regularly monitors the progress of legal contingencies and revises the amounts recorded in the period in which a change in estimate occurs.
Foreign Currency Translation
Revenues and expenses of foreign-based associated companies are translated into United States dollars using average exchange rates for the period. Assets and liabilities are translated at the exchange rate as of the end of the reporting period. Cumulative translation adjustments arising from the resulting translation are included in partners’ capital as a component of accumulated other comprehensive income. Gains and losses arising from transactions denominated in a currency other than the functional currency of the entity that is party to the transaction are included in earnings.
Fair Value Option
The Company has the one-time option to elect fair value for financial assets or liabilities as of the election date. Changes in fair value of these financial instruments are recorded as unrealized gain (loss) in the consolidated statements of operations. The factors considered in electing the fair value option include the availability of otherwise required financial information, differing fiscal year end of an investee and differing basis of financial reporting used by investee companies.
Income Taxes
SPH and certain of its subsidiaries, as limited partnerships, are generally not responsible for federal and state income taxes and their profits and losses are passed directly to their partners for inclusion in their respective income tax returns. SPH’s subsidiaries that are corporate entities are subject to federal and state income taxes and file corporate income tax returns.
SPH’s subsidiaries that are subject to income taxes use the liability method of accounting for such taxes. Under the liability method, deferred tax assets and deferred tax liabilities are recognized for the future tax consequences attributable to differences between the financial statement carrying amounts of existing assets and liabilities and their respective tax bases and operating loss and tax credit carryforwards. Deferred tax assets and deferred tax liabilities are measured using enacted tax rates expected to apply to taxable income in the years in which those temporary differences are expected to be recovered or settled. The effect on deferred tax assets and deferred tax liabilities of a change in tax rates is recognized in income in the period that includes the enactment date. Such subsidiaries evaluate the recoverability of deferred tax assets and establish a valuation allowance when it is more likely than not that some portion of the deferred tax assets will not be realized.
When tax returns are filed, it is highly certain that some positions taken would be sustained upon examination by the taxing authorities, while others are subject to uncertainty about the merits of the position taken or the amount of the position that would be ultimately sustained. The benefit of a tax position is recognized in the consolidated financial statements in the period during which, based on all available evidence, management believes it is more likely than not that the position will be sustained upon examination, including the resolution of appeals or litigation processes, if any. Tax positions taken are not offset or aggregated with other positions. Tax positions that meet the more-likely-than-not recognition threshold are measured as the largest amount of tax benefit that is more than 50% likely of being realized upon settlement with the applicable taxing authority. The portion of the benefits associated with tax positions taken that exceeds the amount measured as described above is provided for and reflected as a liability for unrecognized tax benefits in the accompanying consolidated balance sheets, along with any associated interest and penalties that would be payable to the taxing authorities upon examination.
99
STEEL PARTNERS HOLDINGS L.P.
Notes to Consolidated Financial Statements
(in thousands except per unit data)
Notes to Consolidated Financial Statements
(in thousands except per unit data)
SPH’s policy is to record estimated interest and penalties related to the underpayment of income taxes as income tax expense in the statements of operations.
In 2011, the Company recorded a tax benefit in continuing operations of approximately $83,000 associated with the reversal of its deferred tax valuation allowances primarily relating to NOLs. See Note 20 – “Income Taxes” for additional information.
Advertising Costs
Advertising costs consist of sales promotion literature, samples, cost of trade shows and general advertising costs, and are included in selling, general and administrative expenses on the consolidated statements of operations. Advertising, promotion and trade show costs totaled $2,823 and $2,320 for the years ended December 31, 2011 and 2010, respectively.
Other Taxes
Certain foreign dividend income is subject to a withholding tax. Such withholding tax is netted against dividend income in the consolidated statements of operations.
Net Income (Loss) per Common Unit
Net income (loss) per common unit - basic is computed by dividing net income (loss) by the weighted-average number of common units outstanding for the period. Net income (loss) per common unit - diluted gives effect to dilutive common units outstanding during the period.
Recently Adopted Accounting Standards
Credit Quality of Receivables and the Allowance for Credit Losses
- In July 2010, the FASB issued guidance which enhances the disclosure requirements relating to the credit risk of an entity’s portfolio of financing receivables and how that risk is analyzed and assessed in arriving at the allowance for credit losses. This guidance was effective for the interim period beginning January 1, 2011. Adoption of this guidance has not had a material effect on the Company’s consolidated financial statements.
Recently Issued Accounting Standards
Fair Value Measurement
– In May 2011, the FASB issued guidance related to fair value measurements. This guidance changes the wording used to describe many of the requirements in GAAP for measuring fair value and for disclosing information about fair value measurements. For many of the requirements, the guidance does not result in a change in the application of the current fair value measurement and disclosure requirements. Some of the amendments clarify the FASB’s intent about the application of existing fair value measurement requirements. Other amendments change a particular principle or requirement for measuring fair value or for disclosing information about fair value measurements. This guidance will be effective for interim and annual reporting periods beginning after December 15, 2011.
The guidance, which is effective during interim or annual periods beginning after December 15, 2011, is not expected to have a material impact on the Company’s consolidated financial
statements
.
Comprehensive Income (Topic 220): Presentation of Comprehensive Income
– In June 2011, the FASB issued guidance on presentation of comprehensive income. The new guidance eliminates the current option to report other comprehensive income and its components in the statement of changes in equity. Instead, an entity will be required to present either a continuous statement of net income and other comprehensive income or in two separate but consecutive statements. The new guidance will be effective for the Company beginning January 1, 2012 and will have presentation changes only.
100
STEEL PARTNERS HOLDINGS L.P.
Notes to Consolidated Financial Statements
(in thousands except per unit data)
Notes to Consolidated Financial Statements
(in thousands except per unit data)
Testing Goodwill for Impairment
– In September 2011, the FASB issued guidance relating to testing goodwill for impairment, to allow entities to use a qualitative approach to test goodwill for impairment. The new guidance permits an entity to first perform a qualitative assessment to determine whether it is more likely than not that the fair value of a reporting unit is less than its carrying value. If it is concluded that this is the case, it is necessary to perform the currently prescribed two-step goodwill impairment test. Otherwise, the two-step goodwill impairment test is not required. The guidance is effective for annual and interim goodwill impairment tests performed for fiscal years beginning after December 15, 2011 and earlier adoption is permitted. The Company will adopt this amendment in 2012. The adoption is not expected to have a material impact on the Company’s consolidated financial statements.
3.
ACQUISITIONS
In accordance with ASC Topic 805, Business Combinations , the application of purchase accounting requires that the total purchase price be allocated to the fair value of assets acquired and liabilities assumed based on their fair values at the acquisition date, with amounts exceeding the fair values recorded as goodwill. Goodwill represented the future economic benefit arising from other assets acquired that could not be individually identified and separately recognized. If the fair value of the assets acquired and liabilities assumed exceeds the fair value of the consideration given, a bargain purchase has occurred which is recorded as a gain on acquisition. The allocation process requires, among other things, an
analysis of acquired fixed assets, contracts, and contingencies to identify and record the fair value of all assets acquired and liabilities assumed. In allocating the purchase price to the fair value of the assets acquired and liabilities assumed, the Company utilized, in part, a third-party appraiser to assist us in assessing the fair values of certain components of the assets acquired and liabilities assumed.
Estimates of fair value are based on industry data and trends and by reference to relevant market rates and transactions, and discounted cash flow valuation methods, among other factors. The foregoing estimates and assumptions are inherently subject to significant uncertainties and contingencies beyond our reasonable control. Therefore, the provisional measurements of fair value reflected are subject to change and such changes could be significant. The Company expects to finalize the valuations and complete the purchase price allocations as soon as practicable but no later than one year from the acquisition date. Future adjustments may result from:
|
|
·
|
Completion of valuation reports associated with long-lived tangible and intangible assets which may result in further adjustments or recording of additional assets or liabilities; or
|
|
|
·
|
Adjustments to deferred tax assets and liabilities, which may be based upon additional information, including adjustments to fair value estimates of underlying assets or liabilities.
|
DGT
On July 5, 2011, SPH acquired for cash 193,305 additional shares of DGT common stock for $1,933, bringing total shares owned as of July 5, 2011 to 1,977,023 representing 51.1% of the outstanding shares. Accordingly, the accounting for the investment in DGT has been changed from the equity method to a majority-owned controlled subsidiary and is consolidated with SPH from that date. Prior to the July 5, 2011, SPH owned 1,783,718 shares of DGT (46.1% of the outstanding shares) which were acquired primarily between July 15, 2009 and March 2011. As of July 5, 2011, SPH’s investment had a carrying value of approximately $13,500. DGT manufactures and markets medical and dental imaging systems and power conversion subsystems and components. The acquisition of the controlling interest in DGT was to further the Company’s position as a global diversified holding company.
101
STEEL PARTNERS HOLDINGS L.P.
Notes to Consolidated Financial Statements
(in thousands except per unit data)
Notes to Consolidated Financial Statements
(in thousands except per unit data)
In connection with its acquisition of the additional 193,305 shares of DGT on July 5, 2010, the Company agreed to pay additional consideration to the selling shareholders in future periods if Villa Sistemi Medicali S.p.A. (“Villa”) or DGT are sold within certain time periods after the date of the transaction, resulting in a tangible book value per share of DGT above certain levels. As disclosed in Note 4, “Discontinued Operations,” Villa was sold on November 3, 2011, which was within the specified time period. Although the final determination of the liability will be measured at a future date, the Company has accrued $387 as a provisional amount of additional purchase consideration in connection with the sale of Villa.
The fair value of our equity interest in DGT was $21,389 prior to the 193,305 shares purchased on July 5, 2011. As a result of remeasuring our equity interest to fair value, the Company recognized an investment gain of $7,921 which is included in Net investment (loss) gain in the consolidated statements of operations.
The following table summarizes the preliminary fair value of the assets acquired and liabilities assumed, as well as the fair value of the non-controlling interest in DGT as of July 5, 2011:
|
Assets
|
Amount
|
|||
|
Cash and cash equivalents
|
$ | 23,207 | ||
|
Accounts receivable
|
16,348 | |||
|
Inventory
|
11,872 | |||
|
Prepaid expenses and other current assets
|
1,229 | |||
|
Property, plant and equipment
|
11,112 | |||
|
Identifiable intangible assets
|
13,420 | |||
|
Other assets
|
644 | |||
|
Total assets acquired
|
77,832 | |||
|
Liabilities
|
||||
|
Accounts payable and accrued liabilities
|
14,187 | |||
|
Current portion of long-term debt
|
286 | |||
|
Deferred tax liability
|
3,699 | |||
|
Long-term debt
|
2,373 | |||
|
Liability for employee termination indemnities
|
1,930 | |||
|
Total liabilities assumed
|
22,475 | |||
|
Fair value of net assets acquired
|
55,357 | |||
|
Fair value of noncontrolling interests
|
22,670 | |||
|
Fair value of net assets acquired by SPH
|
32,687 | |||
|
Less: acquisition-date fair value of previously held equity interest
|
21,389 | |||
|
Less: cost of shares of common stock purchased on July 5, 2011
|
2,320 | |||
|
Fair value basis upon acquisition of controlling interest in DGT
|
23,709 | |||
|
Gain on acquisition
|
$ | 8,978 | ||
Accounts receivable are recorded net of amounts not expected to be collected of approximately $1,056.
The Company’s previously held equity interest and the noncontrolling interests were calculated at fair value, which is their proportionate share of the fair value of DGT at the acquisition date, less a discount for lack of control and marketability. The fair value of DGT was estimated using the market and income approaches. These fair value measurements are based on significant inputs that are not observable in the market and, therefore, represent a Level 3 measurement as defined in ASC Topic 820, Fair Value Measurements and Disclosures. Key assumptions include (1) weighted average cost of capital rates of 20% and 14%, with a combined cost of capital of 16%, (2) a terminal value based on long-term sustainable growth rates of 3%, (3) financial multiples of companies deemed to be similar to DGT, and (4) adjustments for lack of control that market participants would consider when estimating the fair value of the noncontrolling interest in DGT.
The fair value of the identifiable net assets acquired by SPH of $32,687 exceeded the fair value of SPH’s basis upon acquisition of the controlling interest in DGT of $23,709. As a result, the Company reassessed the recognition and measurement of identifiable assets acquired and liabilities assumed and concluded that the valuation procedures and resulting measures were appropriate. Accordingly, the acquisition has been accounted for as a bargain purchase and, as a result, the Company recognized a gain of $8,978 associated with the acquisition. The gain is included in Other income in the consolidated statements of operations.
102
STEEL PARTNERS HOLDINGS L.P.
Notes to Consolidated Financial Statements
(in thousands except per unit data)
Notes to Consolidated Financial Statements
(in thousands except per unit data)
Based on the preliminary evaluation, the components of the $13,420 of acquired identifiable intangible assets listed in the above table are as follows:
|
Amount
|
Amortization Period
|
||||
|
Backlog
|
$ | 920 |
1 year
|
||
|
Customer Relationships
|
4,580 |
10 years
|
|||
|
Technology
|
3,740 |
10-30 years
|
|||
|
Tradename
|
3,800 |
Indefinite
|
|||
|
Tradename
|
380 |
10-15 years
|
|||
| $ | 13,420 | ||||
Amortization expense of $549 was recorded for the period from July 5, 2011 through December 31, 2011. The estimated amortization of intangibles from the acquisition will average approximately $864 annually for each of the next five years thereafter.
DGT’s operations are reported in the Diversified Industrial segment and its accounts are included in the SPH consolidated statement of operations beginning July 5, 2011. Revenue and net loss of DGT in the consolidated statement of operations from July 5, 2011 are $3,968 and $(599), respectively.
SWH
On February 2, 2011, BNS acquired all of the capital stock of SWH, Inc. (“SWH”) for an aggregate purchase price of $50,463 in cash. SWH owns all of the capital stock of Sun Well, its sole asset. Sun Well is a work-over rig provider to oil and gas exploration companies throughout the Williston Basin in North Dakota. SWH was acquired to further the Company’s position as a global diversified holding company.
The allocation of the purchase price to SWH’s assets acquired and liabilities assumed is summarized below.
|
Assets:
|
Amount
|
|||
|
Cash
|
$ | 2,153 | ||
|
Accounts receivable
|
5,040 | |||
|
Prepaid expenses
|
463 | |||
|
Deferred tax asset
|
410 | |||
|
Property, plant and equipment
|
18,258 | |||
|
Goodwill
|
24,836 | |||
|
Identifiable intangible assets
|
8,991 | |||
|
Other assets - restricted cash
|
2,572 | |||
|
Total assets acquired
|
62,723 | |||
|
Liabilities:
|
||||
|
Accounts payable and accrued liabilities
|
2,560 | |||
|
Capital lease obligations
|
1,106 | |||
|
Deferred tax liability, non current
|
8,594 | |||
|
Total liabilities acquired
|
12,260 | |||
|
Net assets acquired
|
$ | 50,463 | ||
Accounts receivable substantially represents the gross amount due and expected to be collected.
103
STEEL PARTNERS HOLDINGS L.P.
Notes to Consolidated Financial Statements
(in thousands except per unit data)
Notes to Consolidated Financial Statements
(in thousands except per unit data)
The components of the $8,991 of acquired identifiable intangible assets of SWH listed in the above table are as follows:
|
Amount
|
Amortization Period
|
||||
|
Products and customer relationships
|
$ | 3,220 |
10 years
|
||
|
Trademark/Brand name
|
4,990 |
Indefinite
|
|||
|
Favorable lease
|
141 |
2 years
|
|||
|
Non-compete agreement
|
640 |
5 years
|
|||
|
Total identifiable intangible assets
|
$ | 8,991 | |||
Amortization expense of $477 was recorded for the year ended December 31, 2011. The estimated amortization of intangibles from the acquisition will average approximately $440 annually for each of the next five years. The goodwill is not amortizable for income tax purposes.
SWH’s operations are reported in the Diversified Industrial segment and its accounts are included in the SPH consolidated financial statements beginning February 2, 2011 through the Company’s consolidation of BNS. Revenue and net income of SWH included in the consolidated statement of operations for the year ended December 31, 2011 are $32,984 and $4,536, respectively. (See Note 19 - “Segment Information” for a discussion of SPH’s segments).
Tiger Claw
On March 23, 2011, a subsidiary of HNH acquired for $8,507 in cash, certain assets and assumed certain liabilities of Tiger Claw, Inc. (“Tiger Claw”), a company that among other businesses, develops and manufactures hidden fastening systems for deck construction. HNH believes this acquisition enhances its product offerings of fastening systems for deck construction.
The allocation of the purchase price to Tiger Claw’s assets acquired and liabilities assumed is summarized below.
|
Amount
|
||||
|
Assets:
|
||||
|
Accounts receivable
|
$ | 589 | ||
|
Inventories
|
1,114 | |||
|
Prepaid expenses
|
18 | |||
|
Equipment
|
181 | |||
|
Identifiable intangible assets
|
5,830 | |||
|
Goodwill
|
1,753 | |||
|
Total assets acquired
|
9,485 | |||
|
Liabilities:
|
||||
|
Accrued liabilities
|
978 | |||
|
Net assets acquired
|
$ | 8,507 | ||
Accounts receivable substantially represents the gross amount due and expected to be collected.
The components of the $5,830 of acquired identifiable intangible assets listed in the above table are as follows:
104
STEEL PARTNERS HOLDINGS L.P.
Notes to Consolidated Financial Statements
(in thousands except per unit data)
Notes to Consolidated Financial Statements
(in thousands except per unit data)
|
Amount
|
Amortization Period
|
||||
|
Products and customer relationships
|
$ | 3,930 |
19 years
|
||
|
Trademark/Brand name
|
470 |
26 years
|
|||
|
Patents and patent applications
|
1,000 |
15 years
|
|||
|
Non-compete agreement
|
150 |
17 years
|
|||
|
Backlog
|
280 |
1 years
|
|||
|
Total identifiable intangible assets
|
$ | 5,830 | |||
Amortization expense of $400 was recorded for the year ended December 31, 2011. The estimated amortization of intangibles from the acquisition will be approximately $300 annually for each of the next five years. The goodwill is expected to be amortizable for income tax purposes.
Tiger Claw’s operations are reported with HNH in the Diversified Industrial segment and its accounts are included in the SPH consolidated statement of operations beginning March 23, 2011. Revenue and net income of Tiger Claw in the consolidated statement of operations for the year ended December 31, 2011 are $6,600 and $1,000, respectively.
There is additional contingent consideration that could be due from HNH under the Asset Purchase Agreement if the net sales of certain identified products exceed the parameters set forth in the Asset Purchase Agreement in 2011 and 2012. The additional consideration would be equal to 10% of the sales in excess of the specified parameters. No amount related to the contingent portion of the purchase price was recognized at the acquisition date, in accordance with ASC 805 - Business Combinations.
HNH Acquisition
On May 7, 2010, (the “Acquisition Date”), SPH acquired 57,801 shares of HNH which became a majority-owned controlled subsidiary and is consolidated with SPH from that date. Prior to obtaining a controlling interest on the Acquisition Date, SPH owned 6,066,075 shares (49.8% of the outstanding shares), which were acquired beginning July 15, 2009 as described in Note 5 - “Investments in Associated Companies” and were accounted for under the equity method at fair value. The additional shares of HNH purchased on May 7, 2010 brought the total number of shares owned by SPH to 6,123,876, representing 50.3% of the outstanding shares. After May 7, 2010, SPH acquired 201,393 shares for cash in the open market for $772, bringing total shares owned at December 31, 2010 to 6,325,269 (51.9% of outstanding shares).
On May 7, 2010, prior to the acquisition of a controlling interest, the fair value and carrying value of HNH was $26,084, which was included in investments in associated companies on the consolidated balance sheet. After the controlling shares were acquired on May 7, 2010, SPH’s investment in HNH was reclassified to the purchase price of HNH. An unrealized gain of $8,670 was recorded in income of associated companies on the consolidated statement of operations for the period from January 1, 2010 to May 7, 2010.
HNH, a Delaware corporation, is a diversified industrial holding company that owns and manages a group of businesses on a decentralized basis whose business encompasses: precious metal, tubing, engineered materials, electronic materials and cutting replacement products and services. SPH acquired HNH in order to further its business as a global diversified holding company.
The following table summarizes the consideration paid for the controlling interest in HNH, the estimated fair values of the assets acquired and liabilities assumed at the Acquisition Date, and the fair value of the noncontrolling interest in HNH on the Acquisition Date. The table is retrospectively adjusted for the discontinued operations of Euro-Kasco as described in Note 4 – “
Discontinued Operations
”.
105
STEEL PARTNERS HOLDINGS L.P.
Notes to Consolidated Financial Statements
(in thousands except per unit data)
Notes to Consolidated Financial Statements
(in thousands except per unit data)
|
Total Consideration paid for net assets:
|
Number of Shares
|
Average Price per Share
|
Cost
|
|||||||||
|
Shares purchased before May 7, 2010
|
6,066,075 | $ | 4.30 | $ | 26,084 | |||||||
|
Shares purchased on May 7, 2010
|
57,801 | $ | 4.41 | 255 | ||||||||
|
Total
|
6,123,876 | $ | 26,339 | |||||||||
|
Assets:
|
Amount
|
|||
|
Cash
|
$ | 8,487 | ||
|
Receivables
|
80,421 | |||
|
Inventories
|
58,893 | |||
|
Prepaid expenses and other current assets
|
8,149 | |||
|
Deferred tax
|
1,191 | |||
|
Assets of discontinued operations
|
41,162 | |||
|
Total current assets
|
198,303 | |||
|
Property, plant and equipment
|
93,580 | |||
|
Goodwill
|
16,131 | |||
|
Other intangibles
|
129,320 | |||
|
Other assets
|
12,673 | |||
|
Total assets acquired
|
450,007 | |||
|
Liabilities:
|
||||
|
Accounts payables
|
42,570 | |||
|
Accrued liabilities
|
28,146 | |||
|
Short-term debt and current portion of long-term debt
|
44,687 | |||
|
Other current liabilities
|
20,931 | |||
|
Total current liabilities
|
136,334 | |||
|
Long-term debt and accrued interest
|
154,109 | |||
|
Accrued pension liability
|
97,502 | |||
|
Other liabilities
|
9,688 | |||
|
Total liabilities assumed
|
397,633 | |||
|
Non-controlling interests
|
26,035 | |||
|
Net assets acquired
|
$ | 26,339 | ||
The valuation of the intangible assets acquired and related amortization periods are as follows:
|
Fair Value
|
Amortization Period
|
|||||||
|
(in years)
|
||||||||
|
Patents / technology
|
$ | 19,510 | 13 | |||||
|
Trademarks
|
20,140 | 26 | ||||||
|
Customer relationships
|
88,790 | 19 | ||||||
|
In-process research and development
|
80 | 7 | ||||||
|
Backlog
|
800 | 1 | ||||||
|
Total separately recognized intangible assets
|
$ | 129,320 | ||||||
The estimated amortization of intangibles from the acquisition will be approximately $6,800 annually for each of the next five years.
106
STEEL PARTNERS HOLDINGS L.P.
Notes to Consolidated Financial Statements
(in thousands except per unit data)
Notes to Consolidated Financial Statements
(in thousands except per unit data)
The purchase price allocation for the acquisition of HNH resulted in the recognition of $16,131 of goodwill. The goodwill represents the excess of consideration for the acquisition over the fair value of the net identifiable assets acquired less the fair value of the liabilities assumed less the fair value of the noncontrolling interest. The primary factors that comprise the recognized goodwill are the synergies related to becoming part of a larger diversified group of companies under common management. Goodwill is not deductible for tax purposes because SPH is not a taxpaying entity.
The fair value of the noncontrolling interests amounting to $26,035 was based on the number of shares held by noncontrolling shareholders at the acquisition date.
Long-term debt at May 7, 2010 includes a $71,828 loan payable to Steel Partners II Liquidating Series Trust - Series A & E (“SPII Liquidating Trust - A & E”), in which SPH had a 43.75% interest. SPH’s pro-rata interest of $31,425, representing SPH’s indirect intercompany interest, is eliminated in the 2010 consolidated financial statements. SPII Liquidating Trust - A & E held loans from HNH subsidiaries valued at $66,962 at December 31, 2009, in which the Company had a $29,296 indirect interest. On October 15, 2010 (as discussed in Note 15 - “Debt”), HNH, through a newly formed subsidiary, Handy & Harman Group Ltd. (“H&H Group”), refinanced substantially all of its indebtedness in a simplified lending structure principally with its existing lenders or their affiliates, including SPII Liquidating Trust - A & E. On October 15, 2010, H&H Group refinanced the prior indebtedness of Handy & Harman (“H&H”) and Bairnco Corporation (“Bairnco”) to SPII Liquidating Trust - A & E in accordance with the terms of an exchange Agreement, pursuant to which H&H Group made an approximately $6,000 cash payment in partial satisfaction of prior indebtedness to the SPII Liquidating Trust - A & E and exchanged the remainder of such prior obligations for units consisting of (a) $72,926 aggregate principal amount of 10% subordinated secured notes due 2017 (the “Subordinated Notes”) issued by H&H Group and (b) warrants (the “Warrants”) to purchase an aggregate of 1,500,806 shares of HNH common stock. The Warrants have an exercise price of $11.00 per share and are exercisable beginning October 14, 2013. The Subordinated Notes bear interest at a rate of 10%, 6% of which is payable in cash and 4% of which is payable in-kind. The Subordinated Notes, together with any accrued and unpaid interest thereon is due on October 15, 2017. As a result, as a beneficiary of the SPII Liquidating Trust - A & E, SPH had an indirect interest in $31,905 of the Subordinated Notes and approximately 656,605 of the Warrants at the date of the refinancing on October 15, 2010. On December 14, 2010, the SPII Liquidating Trust - A & E distributed SPH’s indirect interest in the Subordinated Notes and Warrants to SPH such that the Company directly holds $31,905 of the Subordinated Notes and approximately 656,605 of the Warrants. The $31,905 of Subordinated Notes held by the Company and related intercompany interest is eliminated in consolidation in connection with the HNH acquisition and consolidation.
HNH’s operations are included in the SPH consolidated financial statements beginning May 7, 2010. HNH is included in the Diversified Industrial segment for all periods including the period prior to the acquisition as an associated company. Revenue and net income of the acquiree included in the 2010 consolidated statement of operations from the acquisition date through December 31, 2010, are $385,806 and $1,405, respectively. Included in the 2010 net income is a one-time charge to cost of goods sold of $9,538 resulting from application of the acquisition method relating to acquired manufacturing profit in inventory at the Acquisition Date of which $7,825 is included in continuing operations. As of the acquisition date, receivables are net of an estimated $2,387 that are not expected to be collected.
BNS Acquisition
On July 14, 2009, SPH acquired 75,503 shares of BNS common stock (50.2% of outstanding shares) for cash from SPII for $5,815, the market price on that date. SPH acquired BNS to further its business as a global diversified holding company. After July 15, 2009, SPH acquired an additional 1,370 BNS shares (0.9% of outstanding shares) for cash in the open market valued at $111 bringing total BNS shares owned to 76,873 (51.1% of outstanding shares) at December 31, 2009. During 2010, SPH acquired 45,725 shares for cash in the open market for $11,084; and, BNS acquired shares for cash in the open market for $2,169. As a result, SPH owned 85.4% of BNS’ outstanding shares at December 31, 2010. The shares reflect a 1 for 1,000 reverse stock split followed by a 50 for 1 forward stock split on August 20, 2010.
107
STEEL PARTNERS HOLDINGS L.P.
Notes to Consolidated Financial Statements
(in thousands except per unit data)
Notes to Consolidated Financial Statements
(in thousands except per unit data)
BNS’s principal operations resulted from its 80% ownership of Collins which manufactures and markets specialty vehicles such as ambulances, school, activity and shuttle buses; and, terminal road construction equipment. BNS’s results of operations, reported on a 61 day lag, have been included in the 2009 consolidated financial statements from July 15, 2009 through October 31, 2009, and the Collins operations of BNS, which were sold on February 18, 2010, are classified as discontinued operations. Prior to July 14, 2009 BNS was reported by SPII as an investment carried at fair value. The fair value carried (based on the market price) by SPII was the amount SPH paid SPII in cash on July 14, 2009 to acquire the BNS net assets. The final allocation of the purchase price as of July 15, 2009 is summarized below:
|
Assets:
|
Amount
|
|||
|
Cash and cash equivalents
|
$ | 2,100 | ||
|
Restricted cash
|
243 | |||
|
Accounts receivable
|
18,623 | |||
|
Inventories
|
39,991 | |||
|
Prepaid and other current assets
|
1,285 | |||
|
Property, plant and equipment
|
26,963 | |||
|
Intangible assets
|
36,567 | |||
|
Goodwill
|
9,543 | |||
|
Other assets
|
2,177 | |||
|
Total assets acquired
|
137,492 | |||
|
Liabilities:
|
||||
|
Accounts payable and other current liabilities
|
33,057 | |||
|
Other liabilities
|
4,057 | |||
|
Long-term debt
|
80,982 | |||
|
Total liabilities assumed
|
118,096 | |||
|
Noncontrolling interests
|
13,581 | |||
|
Net assets acquired
|
$ | 5,815 | ||
The difference between the Company’s purchase price for BNS and the fair value allocated to the assets acquired and liabilities assumed of $9,543 was recorded as goodwill which represents the excess of purchase price over net assets (including identifiable intangible assets acquired). The Company determined as of July 14, 2009 the fair value assigned to the assets and liabilities of BNS which related primarily to Collins. Noncontrolling interests represent the values assigned to Collins and BNS noncontrolling shareholders. Long-term debt at July 15, 2009 includes a $20,991 loan payable to Steel Partners II Liquidating Series Trust - C (“SPII Liquidating Trust - C”), in which SPH had a 43.75% interest. SPH’s pro-rata interest of $9,184, representing SPH’s indirect intercompany interest, is eliminated in the 2009 consolidated financial statements. As discussed in Note 4 - “Discontinued Operations”, the BNS loan and accrued interest were paid in full in connection with the sale of Collins on February 18, 2010. The operations of Collins are accounted for as discontinued operations in the consolidated financial statements. With respect to the sale of Collins, BNS signed a letter of intent with a third party in November 2009. BNS’s sale of its interest in Collins, and its statement of operations and balance sheet information are described in Note 4.
CoSine and JPS Acquisitions
In two transactions on July 14, 2009 and July 15, 2009, SPH acquired for cash, in the aggregate, a 26.1% interest in CoSine from SPII for $4,211, at the market price per share on those dates. On July 31, 2009, SPH acquired for cash from HNH an additional 18.8% interest in CoSine, at the market price per share on that date, and on August 11, 2009, an additional 2.5% interest for cash in the open market for a total cost of $3,616, bringing its ownership interest to 47.4% at December 31, 2009. From July 14, 2009 forward, SPH began accounting for CoSine as an associated company under the equity method. CoSine is in the business of seeking to acquire one or more business operations.
108
STEEL PARTNERS HOLDINGS L.P.
Notes to Consolidated Financial Statements
(in thousands except per unit data)
Notes to Consolidated Financial Statements
(in thousands except per unit data)
On July 14, 2009, SPH acquired for cash an 18.2% interest in JPS from SPII for $6,427, at the market price per share on that date. As part of the Exchange Transaction, SPH acquired an additional 11.3% interest in JPS valued at $4,722, the market price at July 15, 2009. Through open market cash purchases between July 16, 2009 and December 31, 2009, SPH acquired, in the aggregate, 8.8% of additional interests in JPS for $2,742, bringing its ownership interest in JPS to 38.3% at December 31, 2009. From July 14, 2009 forward, SPH began accounting for JPS as an associated company under the equity method. JPS is a publicly traded company that manufactures a variety of products for specialty industrial applications.
Exchange Transaction
In connection with the acquisition of SPII on July 15, 2009 (see Note 21 - “Exchange Transaction”), 25,761,587 common units that had been subject to redemption became non-redeemable in exchange for the net assets of SPII which were recorded at fair value as follows:
|
Assets:
|
Amount
|
|||
|
Cash and cash equivalents
|
$ | 251,547 | ||
|
Investments
|
404,982 | |||
|
Other assets
|
2,279 | |||
|
Total assets acquired
|
658,808 | |||
|
Liabilities:
|
||||
|
Dividends and interest payable
|
137 | |||
|
Capital redemptions payable
|
204,403 | |||
|
Accrued expenses and other
|
6 | |||
|
Total liabilities assumed
|
204,546 | |||
|
Net assets acquired
|
$ | 454,262 | ||
On July 15, 2009, SPH recorded the $404,982 fair value of investments acquired from SPII in the Exchange Transaction as their initial carrying values. In the aggregate, the net assets acquired by SPH as a result of the Exchange Transaction of $454,262 consisted of $404,982 of investments, net cash of $47,144 (after considering the remaining cash capital redemptions payable in connection with the Exchange Transaction) and $2,136 of other net assets. From July 16, 2009 forward, SPH began accounting for these investments in accordance with its accounting policies. From that date, HNH, Steel Excel and DGT, acquired in the Exchange Transaction, are accounted for as associated companies under the equity method.
In connection with the Exchange Transaction the Company acquired interests, included in investments above, in each series of the Steel Partners II Liquidating Series Trust (“SPII Liquidating Trust”) (see Note 14 - “Related Party Transactions”) which are presented as other investments - related party on the consolidated balance sheet and are accounted for under the equity method. An indirect intercompany investment of $9,184 representing the Company’s interest through a series of the SPII Liquidating Trust, which held a loan receivable from BNS of $20,991 at July 15, 2009, was eliminated in the consolidated balance sheet. Investments at July 15, 2009 also include $26,584 of the Company’s indirect interests, through SPII Liquidating Trust - A and E, in $60,764 of loans receivable from HNH, which are included with other investments - related party in the December 31, 2009 consolidated balance sheet. As discussed above, these indirect interests were refinanced and SPH directly holds Subordinated Notes which are eliminated in consolidation at December 31, 2010.
The remaining investments acquired in the Exchange Transaction are accounted for as available-for-sale securities and other investments measured at fair value. SLI and API while initially classified as available-for-sale securities have been reclassified as associated companies. See Note 5 - “Investments in Associated Companies.”
Unaudited Pro Forma Results of Operations
The following presents certain unaudited pro forma consolidated statement of operations data for the years ended December 31, 2011 and 2010 as if the acquisitions of SWH, Tiger Claw and DGT were completed on the same terms at January 1, 2010. In addition, the following presents certain unaudited pro forma consolidated statement of operations data for the year ended December 31, 2010 as if the HNH acquisition was completed on the same terms at July 15, 2009 and January 1, 2010. As discussed in Note 1 - “Description of Business and Basis of Presentation”, SPH began using operating company accounting for investments it acquired in the Exchange Transaction on July 16, 2009; accordingly, the HNH
pro forma statement of operations data is not presented prior to that date.
109
STEEL PARTNERS HOLDINGS L.P.
Notes to Consolidated Financial Statements
(in thousands except per unit data)
Notes to Consolidated Financial Statements
(in thousands except per unit data)
|
Year Ended December 31,
|
||||||||
|
2011
|
2010
|
|||||||
|
(unaudited)
|
(unaudited)
|
|||||||
|
Revenue
|
$ | 721,985 | $ | 656,563 | ||||
|
Net income attributable to common unitholders
|
34,756 | 28,438 | ||||||
|
Net income per common unit - basic
|
1.38 | 1.13 | ||||||
|
Net income per common unit - diluted
|
0.97 | 1.03 | ||||||
4.
DISCONTINUED OPERATIONS
The following assets and liabilities of discontinued operations have been segregated in the accompanying consolidated balance sheets as of December 31, 2011 and 2010.
|
December 31,
|
||||||||
|
2011
|
2010
|
|||||||
|
Assets of discontinued operations:
|
||||||||
|
Trade and other receivables
|
$ | 13,256 | $ | 12,351 | ||||
|
Inventories
|
11,403 | 13,624 | ||||||
|
Other current assets
|
1,711 | 1,069 | ||||||
|
Other intangibles, net
|
8,469 | 2,650 | ||||||
|
Property, plant and equipment, net
|
499 | 3,378 | ||||||
|
Other assets
|
49 | 234 | ||||||
|
Total assets
|
$ | 35,387 | $ | 33,306 | ||||
|
Liabilities of discontinued operations:
|
||||||||
|
Trade payables and accrued liabilities
|
$ | 7,486 | $ | 9,341 | ||||
|
Other current liabilities
|
5,982 | - | ||||||
|
Other liabilities
|
1,842 | 656 | ||||||
|
Total liabilities
|
$ | 15,310 | $ | 9,997 | ||||
The consolidated statement of operations includes the following relating to discontinued operations:
|
Year Ended December 31,
|
||||||||||||
|
2011
|
2010
|
July 16, 2009 to December 31, 2009
|
||||||||||
|
Sales
|
$ | 33,514 | $ | 59,569 | $ | 60,163 | ||||||
|
Net (loss) income
|
(231 | ) | (3,162 | ) | 1,464 | |||||||
|
(Loss) income after taxes and noncontrolling interests
|
(133 | ) | (1,145 | ) | 621 | |||||||
|
Gain on sale of discontinued operations after taxes and noncontrolling interests
|
526 | 15,972 | - | |||||||||
110
STEEL PARTNERS HOLDINGS L.P.
Notes to Consolidated Financial Statements
(in thousands except per unit data)
Notes to Consolidated Financial Statements
(in thousands except per unit data)
DGT’s Discontinued Operations - Sale of Villa
On November 3, 2011, DGT completed a share purchase agreement (the “Share Purchase Agreement”) with VIV s.r.1., a limited liability company incorporated under Italian law (“VIV”), pursuant to which DGT has sold all of the shares of its Italian subsidiary, Villa, its medical and dental imaging systems segment, to VIV.
In consideration for the sale of the shares of Villa to VIV, DGT received $22,761 in cash of net proceeds and an unsecured subordinated promissory note (the “Note”) made by VIV in the amount of €500 (initially valued at $688). The Note has a term of 5 years with interest accruing at a rate of 6% per annum beginning 18 months after issuance. The Note may be prepaid at any time and if prepayment in full occurs during the first 18 months following the date of issuance, the total principal amount will be reduced to €400. Payment of the Note will be subordinated to the repayment of the loan extended to VIV by Banca Intesa to provide financing for the Villa Sale. DGT also repurchased 28,104 shares of common stock from two employees of Villa for $820. DGT also received, as part of the transaction, a dividend of cash held by Villa as of the closing date in the amount of $4,538. SPH’s net gain on the sale of Villa, which will be recorded in SPH’s first quarter of 2012 due to the recording of DGT’s results of operations on a two-month lag, was not material to SPH’s results of operations.
BNS’s Discontinued Operations
On February 18, 2010, BNS sold its interest in Collins for net proceeds of $64,818 in cash net of $100 in fees. BNS used a portion of the proceeds to repay the SPII Liquidating Trust - C Term Loan of $21,785 plus additional accrued interest of $982, of which SPH received $9,960 through an interest it holds in the SPII Liquidating Trust. The SPII Liquidating Trust terminated the series holding the SPII Liquidating Trust - C Term Loan and SPH received $10,332 on May 11, 2010 as a final distribution. The remaining BNS long-term debt was assumed by the acquirer. Collins paid BNS a $1,000 fee in exchange for the cancellation of a management services agreement and BNS paid the Manager $1,000 for investment banking services in connection with the sale transaction. SPH recorded a gain on sale of discontinued operations of $31,254 ($16,238 after noncontrolling interest) in the year ended December 31, 2010.
HNH’s Discontinued Operations
During the third quarter of 2011, HNH sold its stock of Euro-Kasco a part of its Kasco segment, to the former management team for one Euro plus 25% of any pre-tax earnings over the next three years. Additionally, Euro-Kasco, signed a 5 year supply agreement to purchase certain products from Kasco. As a result of the sale, the Company recorded an after tax loss of $266. Euro-Kasco has been included as a discontinued operation on a retroactive basis from the acquisition of HNH on May 7, 2010.
In 2010, HNH decided to exit the Arlon CM business of manufacturing adhesive films, specialty graphic films and engineered coated products. In February and March 2011, HNH sold assets in two separate asset sale transactions. These businesses comprised HNH’s Arlon Coated Materials (“CM”) segment.
On February 4, 2011, Arlon LLC (“Arlon”), an indirect wholly-owned subsidiary of HNH, sold substantially all of its assets and existing operations located primarily in the State of California related to its Adhesive Film Division for an aggregate sale price of $26,543. Net proceeds of approximately $24,200 from this sale were used to repay indebtedness under HNH’s revolving credit facility. A gain on the sale of these assets of $3,494, net of tax, was recorded in 2011.
On March 25, 2011, Arlon and its subsidiaries sold substantially all of their assets and existing operations located primarily in the State of Texas related to Arlon’s Engineered Coated Products Division and SignTech subsidiary for an aggregate sale price of $2,500. In addition, Arlon sold a coater machine to the same purchaser for a price of $500. A net loss of $2,256 was recorded on the sale of these assets. The net proceeds from these asset sales were used to repay indebtedness under HNH’s revolving credit facility.
111
STEEL PARTNERS HOLDINGS L.P.
Notes to Consolidated Financial Statements
(in thousands except per unit data)
Notes to Consolidated Financial Statements
(in thousands except per unit data)
Amounts held in escrow in connection with the asset sales, totaling $3,000, are recorded in Trade and other receivables on the condensed consolidated balance sheet as of December 31, 2011, and are due to be received by HNH in the second quarter of 2012.
The total gain of $972, net of tax, as a result of the sales of the California and Texas operations of Arlon CM, and Euro-Kasco, is reported in discontinued operations on the consolidated statements of operations in 2011. The discontinued operations had an aggregate loss in 2011 from their operations of $508, net of tax.
5. INVESTMENTS IN
ASSOCIATED COMPANIES
The
following
table provides combined summarized data with respect to the associated companies accounted for on the equity method:
|
December 31,
|
||||||||
|
2011
|
2010
|
|||||||
|
Investments in associated companies:
|
||||||||
|
API*
|
$ | - | $ | 6,009 | ||||
|
Steel Excel**
|
105,225 | 105,387 | ||||||
|
CoSine
|
6,944 | 7,260 | ||||||
|
DGT***
|
- | 12,817 | ||||||
|
JPS*
|
- | 8,367 | ||||||
|
SLI**
|
16,049 | 16,217 | ||||||
|
Other*
|
- | 7,213 | ||||||
| $ | 128,218 | $ | 163,270 | |||||
|
Summary of balance sheet amounts (unaudited):
|
||||||||
|
Current assets
|
$ | 443,740 | $ | 605,889 | ||||
|
Noncurrent assets
|
55,540 | 203,194 | ||||||
|
Total assets
|
$ | 499,280 | $ | 809,083 | ||||
|
Current liabilities
|
$ | 39,727 | $ | 117,436 | ||||
|
Noncurrent liabilities
|
26,504 | 159,152 | ||||||
|
Total liabilities
|
66,231 | 276,588 | ||||||
|
Parent equity
|
433,049 | 529,244 | ||||||
|
Noncontrolling interest
|
- | 3,251 | ||||||
|
Total liabilities and equity
|
$ | 499,280 | $ | 809,083 | ||||
_____________
|
*
|
API and JPS were reclassified to Investments at fair value as of December 31, 2011. See additional discussion regarding API and JPS below. Other associated company investments were reclassified to Other long-term assets in 2011 (see discussion below).
|
|
**
|
As discussed below, the Company elected to account for this investment at fair value commencing on the date the investment became subject to equity method accounting.
|
|
***
|
DGT was consolidated as of July 5, 2011. See Note 3 – “Acquisitions.”
|
112
STEEL PARTNERS HOLDINGS L.P.
Notes to Consolidated Financial Statements
(in thousands except per unit data)
Notes to Consolidated Financial Statements
(in thousands except per unit data)
|
July 16, 2009
|
January 1,
|
|||||||||||||||
|
to
|
2009
|
|||||||||||||||
|
Year Ended December 31,
|
December 31,
|
to July 15,
|
||||||||||||||
|
2011
|
2010
|
2009
|
2009
|
|||||||||||||
|
Summary income statement amounts (unaudited):
|
||||||||||||||||
|
Revenue
|
$ | 161,659 | $ | 787,347 | $ | 326,521 | $ | 230 | ||||||||
|
Gross profit
|
14,722 | 192,052 | 84,311 | - | ||||||||||||
|
(Loss) income from continuing operations
|
10,823 | (12,894 | ) | (15,586 | ) | 150 | ||||||||||
|
Net (loss) income after noncontrolling interests
|
1,153 | (19,661 | ) | (22,153 | ) | 170 | ||||||||||
|
Amounts recognized in the consolidated financial statements:
|
||||||||||||||||
|
SPH share of net income (loss)
|
(231 | ) | 1,680 | (1,546 | ) | 63 | ||||||||||
|
Unrealized gain on associated companies accounted for at fair value
|
(13,592 | ) | 8,625 | 8,753 | - | |||||||||||
|
SPH’s equity in other comprehensive loss
|
5,833 | (737 | ) | (4,644 | ) | - | ||||||||||
The Company’s investments in associated companies accounted for
under the equity method of accounting are initially recorded at their original cost, subsequently increased or decreased for SPH’s share of the investees’ earnings or losses and
other
comprehensive income, reduced for dividends received and impairment charges recorded, if any, and increased for any additional investment. The Company’s acquisition purchase price for equity method investments was less than book value at the dates acquired by $24,860 (the “basis difference”). No adjustments to earnings are made for the impact of the basis difference.
The Company elected to account for its investments in HNH, API (see additional discussion below regarding reclassification to Investments at fair value at December 31, 2011), ADPT, and SLI under the equity method at fair value beginning on the dates these investments became subject to the equity method of accounting. The Company is permitted to choose, at specified election dates, to measure many financial instruments and certain other items at fair value (the “fair value option”) that would not otherwise be required to be measured at fair value. If the fair value option is elected for a particular financial instrument, the Company is required to report unrealized gains and losses on those items in its consolidated statement of operations. The fair value elections for the Company’s investments in HNH,
Steel Excel
, API and SLI were made beginning July 16, 2009. HNH, API,
Steel Excel
and SLI are Level 1 investments measured and reported at fair value as described in Note 7 - “Fair Value Measurements.” Associated companies are included in
Diversified Industrial, Financial Services and Other from the dates of their acquisition. Certain associated companies have a fiscal year end that differs from December 31.
SPH’s associated companies previously or currently accounted for under the equity method are as follows:
HNH
At December 31, 2009, SPH owned 4,707,388 shares of HNH representing 38.6% of outstanding shares with an investment carrying value of $11,298. SPH recorded an unrealized loss in the consolidated statement of operations of $1,161 on its investment in HNH for the period from July 16, 2009 to December 31, 2009. Between January 1 and May 7, 2010 prior to acquiring a controlling interest, SPH acquired an additional 1,358,687 shares for cash in the open market for $6,116, bringing total HNH shares owned to 6,066,075 (49.8% of outstanding shares). SPH accounted for its investment in HNH under the equity method at fair value; and accordingly, SPH recorded an unrealized gain in the consolidated statement of operations of $8,670 on its investment in HNH from January 1, 2010 to May 7, 2010 prior to obtaining a controlling interest. The fair value of SPH’s investment in HNH was $26,084 as of May 7, 2010 immediately prior to SPH purchasing a controlling interest. SPH’s purchase on May 7, 2010 of 57,801 additional HNH shares for cash in the open market for $255 brought the total investment to $26,339 and total shares owned by SPH to 6,123,876 (50.3% of outstanding shares), and HNH became a majority-owned controlled subsidiary. HNH’s accounts are consolidated with the accounts of SPH from May 7, 2010 and accordingly, SPH’s investment in HNH has been removed from investments in associated companies on that date as described in Note 3 - “Acquisitions”.
113
STEEL PARTNERS HOLDINGS L.P.
Notes to Consolidated Financial Statements
(in thousands except per unit data)
Notes to Consolidated Financial Statements
(in thousands except per unit data)
API
At December 31, 2011 and 2010, SPH owned 32.4% of the shares of API a publically traded company which is a manufacturer of specialized materials for packaging. In September 2010, SPH is deemed to have acquired 12,652,878 additional API shares for $1,771 bringing total shares owned as of December 31, 2010 to 24,832,203 (32.4% of the outstanding shares). SPH acquired the additional shares in 2010 as a result of a modification of the SPII Fund Plan (as described in Note 21 - “Exchange Transaction”) which enabled SPII Fund investors, who were otherwise entitled to receive API shares from the SPII Fund under the plan, to elect to receive a cash distribution in lieu of each API share in which it had an indirect interest held by SPH. Consequently, the SPII Fund investors making such elections surrendered their right under the SPII Fund Plan to receive API shares by a way of a distribution from the SPII Fund. The Company’s ownership interest in API exceeded 20% on September 1, 2010; and, accordingly API has been accounted for as an associated company using the fair value election from January 1, 2010. For the years ended December 31, 2011 and 2010, SPH recorded unrealized gains in the consolidated statement of operations of $9,809 and $2,615, respectively, on its investment in API. The investment in API was reported under the equity method at fair value with an investment carrying value of $6,009 as of December 31, 2010. Effective December 31, 2011, the Company determined that it no longer had significant influence over the operating and financial polices of API, the Company discontinued the equity method of accounting at fair value for API and began classifying API as Investments at fair value and will continue to report changes in fair in the consolidated statement of operations. The aggregate fair value of the Company’s interest in API was $15,819 at December 31, 2011.
Steel Excel
At December 31, 2011 and 2010, SPH owned 40.3% and 33.0%, respectively, of the shares of Steel Excel, a publicly traded company. Steel Excel acquired certain businesses in 2011, and is seeking to acquire additional business operations. The identification of new business operations includes, but is not limited to, the oilfield servicing, sports, training, education, entertainment, and lifestyle businesses.
SPH recorded an unrealized gain in the consolidated statement of operations of $9,395 on its investment in Steel Excel for the period from July 16, 2009 to December 31, 2009. From January 1, 2010 to December 31, 2010, SPH acquired an additional 1,249,827 shares for cash in the open market for $37,202, bringing total Steel Excel shares owned to 3,596,811 (33.0% of total outstanding shares) at December 31, 2010. From January 1, 2011 to December 31, 2011, SPH acquired an additional 7.2% interest for cash in the open market for $21,931. The investment in Steel Excel is reported under the equity method at fair value with an investment carrying value of $105,226 and $105,387 as of December 31, 2011 and 2010, respectively. For the years ended December 31, 2011 and 2010, SPH recorded unrealized losses in the consolidated statement of operations of $22,092 and $10,439, respectively, on its investment in Steel Excel.
CoSine
As of December 31, 2011 and 2010, SPH owned 4,779,721 shares (46.8% and 47.4%, respectively, of the outstanding shares) of CoSine, a publicly traded company which is seeking to acquire one or more new businesses. The investment in CoSine was accumulated over several transactions. CoSine is accounted for under the equity method with an investment carrying value of $6,944 and $7,260 as of December 31, 2011 and 2010, respectively. SPH recorded a loss of $127 as its share of CoSine net loss and $5 as its share of other comprehensive loss for the period from July 16, 2009 to December 31, 2009. SPH has recorded a loss of $385 and $440 as its share of CoSine net loss and $68 and $6 as its share of capital changes for the years ended December 31, 2011 and 2010, respectively. The aggregate market value of the Company’s interest in CoSine was $9,320 and $9,081 at December 31, 2011 and 2010, respectively.
114
STEEL PARTNERS HOLDINGS L.P.
Notes to Consolidated Financial Statements
(in thousands except per unit data)
Notes to Consolidated Financial Statements
(in thousands except per unit data)
DGT
As of December 31, 2010, SPH owned 1,762,956 shares (46.2% of the outstanding shares) of DGT, a publicly traded company. SPH recorded a loss of $745 as its share of DGT net loss and $139 as its share of other comprehensive income for period from July 16, 2009 to December 31, 2009. During, 2010, SPH acquired an additional 1,259,757 shares for cash, primarily through participation of a rights offering in December 2010, for $9,600 bringing total DGT shares owned to 1,762,956 (46.2% of outstanding shares) at December 31, 2010. The investment carrying value in DGT reported under the equity method is $12,817 at December 31, 2010. SPH has recorded income of $886 as its share of DGT net income and $(113) as its share of capital changes including other comprehensive income / loss for the year ended December 31, 2010. The aggregate market value of the Company’s interest in DGT was $16,307 at December 31, 2010.
From January 1, 2011 to July 5, 2011, prior to acquiring a controlling interest, SPH acquired an additional 20,762 shares for cash in the open market for $207, bringing total DGT shares owned to 1,783,718 (46.1% of the outstanding shares). The fair value of SPH’s investment in DGT was $21,389 as of July 5, 2011 immediately prior to SPH purchasing a controlling interest. SPH’s purchase on July 5, 2011 of 193,305 additional DGT shares for cash on the open market for $1,933 brought total shares owned by SPH to 1,977,023 (51.1% of the outstanding shares), and DGT became a majority-owned controlled subsidiary. DGT’s accounts are consolidated with the accounts of SPH from July 5, 2011 and accordingly, SPH’s investment in DGT has been removed from investments in associated companies as of that date.
Prior to acquiring a controlling interest, SPH recorded income of $213 as its share of DGT net income and $231 as its share of capital changes including other comprehensive income/loss for the year ended December 31, 2011. SPH has recorded income of $886 as its share of DGT net income and $114 as its share of capital changes including other comprehensive income / loss for the year ended December 31, 2010.
See Note 3 - “
Acquisitions
” for additional information on the acquisition of DGT and the related acquisition accounting disclosures.
JPS
At December 31, 2011 and 2010, SPH owned 39.3% of JPS, a publicly traded company that manufactures a variety of products for specialty industrial applications. SPH recorded a loss of $754 as its share of JPS net loss and $5,836 as its share of comprehensive loss for the period from July 16, 2009 to December 31, 2009. During 2010, SPH acquired an additional 143,244 shares for cash in the open market for $560, bringing total JPS shares owned to 4,021,580 (39.3% of outstanding shares) at December 31, 2010. For the year ended December 31, 2010, SPH has recorded income of $1,228 as its share of JPS’s net income and $(722) as its share of JPS’s capital changes including other comprehensive loss and the investment carrying value in JPS reported under the equity method was $8,367 as of December 31, 2010. The aggregate market value of the Company’s interest in JPS was $19,665 at December 31, 2010. During the fourth quarter of 2011, the Company determined that it did not have significant influence over the operating and financial policies of JPS. Therefore, effective December 31, 2011 the Company discontinued the equity method of accounting for JPS and began classifying JPS as an available for sale security. The aggregate fair value of the Company’s interest in JPS was $29,760 at December 31, 2011. As a result of classifying JPS as an available for sale security, the Company recorded an unrealized gain of approximately $14,800 in other comprehensive income in 2011.
SLI
At December 31, 2011 and 2010, SPH owned 21.7% and 20.7%, respectively, of the shares of SLI, a publicly traded company that designs, manufactures and markets power electronics, motion control, power protection and specialized communication equipment. During 2010 SPH acquired an additional 223,511 shares for cash in the open market for $2,541, bringing total SLI shares owned to 927,231 (20.7% of total outstanding shares) at December 31, 2010. During 2011 SPH acquired an additional 63,432 shares for cash in the open market for $1,141, bringing total SLI shares owned to 990,663 (21.7% of total outstanding shares) at December 31, 2011. The investment in SLI is reported under the equity method at fair value with an investment carrying value of $16,049 and $16,217 as of December 31, 2011 and 2010, respectively. For the years ended December 31, 2011 and 2010, SPH recorded an unrealized loss of $1,310 and an unrealized gain of $7,779, respectively, in the consolidated statement of operations, on its investment in SLI. The Company’s ownership interest in SLI exceeded 20% on December 31, 2010; and, accordingly SLI has been accounted for as an associated company using the fair value election from January 1, 2010.
115
STEEL PARTNERS HOLDINGS L.P.
Notes to Consolidated Financial Statements
(in thousands except per unit data)
Notes to Consolidated Financial Statements
(in thousands except per unit data)
Other
The Company also has an investment in a Japanese real estate partnership. During the fourth quarter of 2011, the Company determined that it did not have significant influence over the operating and financial policies of the partnership. Therefore, effective December 31, 2011 the Company discontinued the equity method of accounting and began classifying this investment as an investment at cost, included in Other long-term assets in the 2011 consolidated balance sheet. The fair value of this investment exceeded its carrying value at December 31, 2011.
6.
INVESTMENTS
Investments
In 2011, JPS was reclassified to Investments at fair value and is accounted for as an available for sale security. Investments at fair value include available-for-sale securities at December 31, 2011 and 2010 as follows:
|
Cost
|
Gross Unrealized Gains
|
Gross Unrealized Losses
|
Fair value
|
|||||||||||||
|
December 31, 2011
|
||||||||||||||||
|
Equity securities - U.S.
|
||||||||||||||||
|
Computer Software and Services
|
$ | 27,649 | $ | 3,132 | $ | (2,146 | ) | $ | 28,635 | |||||||
|
Aerospace/Defense
|
10,746 | 10,884 | - | 21,630 | ||||||||||||
|
Manufacturing
|
16,495 | 14,960 | - | 31,455 | ||||||||||||
|
Restaurants
|
5,974 | 3,390 | - | 9,364 | ||||||||||||
|
Other
|
21,600 | 8,754 | (859 | ) | 29,495 | |||||||||||
|
Total investments
|
82,464 | 41,120 | (3,005 | ) | 120,579 | |||||||||||
|
December 31, 2010
|
||||||||||||||||
|
Debt securities - Corporate
|
||||||||||||||||
|
Insurance
|
$ | 14,921 | $ | 7,112 | $ | - | $ | 22,033 | ||||||||
|
Aerospace/Defense
|
13,203 | 2,130 | - | 15,333 | ||||||||||||
| 28,124 | 9,242 | - | 37,366 | |||||||||||||
|
Equity securities - U.S.
|
||||||||||||||||
|
Computer Software and Services
|
3,362 | - | (1,279 | ) | 2,083 | |||||||||||
|
Aerospace/Defense
|
10,700 | 10,268 | - | 20,968 | ||||||||||||
|
Manufacturing
|
1,603 | 1,633 | - | 3,236 | ||||||||||||
|
Restaurants
|
5,974 | 1,532 | - | 7,506 | ||||||||||||
|
Other
|
1,568 | 5 | (860 | ) | 713 | |||||||||||
| 23,207 | 13,438 | (2,139 | ) | 34,506 | ||||||||||||
|
Total investments
|
$ | 51,331 | $ | 22,680 | $ | (2,139 | ) | $ | 71,872 | |||||||
116
STEEL PARTNERS HOLDINGS L.P.
Notes to Consolidated Financial Statements
(in thousands except per unit data)
Notes to Consolidated Financial Statements
(in thousands except per unit data)
Investment information is summarized below for available-for-sale securities:
|
July 16, 2009
|
January 1, 2009
|
|||||||||||||||
|
Year Ended December 31,
|
to December 31,
|
to July 15,
|
||||||||||||||
|
2011
|
2010
|
2009
|
2009
|
|||||||||||||
|
Proceeds from sales
|
$ | 143,096 | $ | 262,934 | $ | 318,958 | $ | 129 | ||||||||
|
Gross gains from sales
|
$ | 20,850 | $ | 42,066 | $ | 24,627 | $ | - | ||||||||
|
Gross losses from sales
|
(2,439 | ) | (3,668 | ) | (15,462 | ) | (23 | ) | ||||||||
|
Other than temporary impairment
|
- | - | - | - | ||||||||||||
|
Net investment gain (loss)
|
$ | 18,411 | $ | 38,398 | $ | 9,165 | $ | (23 | ) | |||||||
|
Change in net unrealized holding (losses) gains included in other comprehensive income
|
$ | 17,575 | $ | (37,188 | ) | $ | 58,508 | $ | 247 | |||||||
For purposes of determining gross realized gains and losses, the cost of securities sold is based on specific identification. Gross unrealized gains and gross unrealized losses in the table are reported in accumulated other comprehensive income in the consolidated balance sheets.
Other Investments - Related Party
Other Investments - related party, classified as non-current assets at December 31, 2011 and 2010, consist of the Company’s investment in each series of the SPII Liquidating Trust (see Note 14 - “Related Party Transactions”) accounted for under the equity method. These investments were acquired and initially recorded as described in connection with the Exchange Transaction. The Company elected to account for its investments in each series of the SPII Liquidating Trust under the equity method at fair value beginning July 16, 2009, the date these investments became subject to the equity method. The Company is permitted to choose, at specified election dates, to measure many financial instruments and certain other items at fair value that would not otherwise be required to be measured at fair value. If the fair value option is elected for a particular financial instrument, the Company is required to report unrealized gains and losses on those items in its consolidated statement of operations.
Each series of the SPII Liquidating Trust is separate and distinct with respect to its assets, liabilities and net assets. Each individual series has no liability or claim with respect to the liabilities or assets, respectively, of the other series. Each series shares in the costs, assets and liabilities, if any, that are not specifically attributable to a particular series. Each series generally holds the securities related to a specific investment and cash for operating expenses of the series. The investments in the SPII Liquidating Trust are not redeemable and distributions will be received from the SPII Liquidating Trust as the underlying assets held are sold over a period which is not determinable. There are no unfunded capital commitments with respect to these investments. The fair values for the investments in the SPII Liquidating Trust have been estimated using the net asset value of such interests as reported by the SPII Liquidating Trust.
The following table provides combined summarized data with respect to the other investments - related party accounted for under the equity method, which as discussed above the Company elected to account for at fair value commencing on the date the investment became subject to equity method accounting:
117
STEEL PARTNERS HOLDINGS L.P.
Notes to Consolidated Financial Statements
(in thousands except per unit data)
Notes to Consolidated Financial Statements
(in thousands except per unit data)
|
December 31,
|
||||||||
|
2011
|
2010
|
|||||||
|
Other investments - related party:
|
||||||||
|
SPII Liquidating Trust - Series B (a)
|
$ | 16,408 | $ | 25,154 | ||||
|
SPII Liquidating Trust - Series D (b)
|
11,783 | 17,217 | ||||||
|
SPII Liquidating Trust - Series G (c)
|
9,552 | 11,579 | ||||||
|
SPII Liquidating Trust - Series H (d)
|
3,496 | 7,826 | ||||||
|
SPII Liquidating Trust - Series I (e)
|
1,414 | 777 | ||||||
|
Total
|
$ | 42,653 | $ | 62,553 | ||||
|
Summary of balance sheet amounts:
|
||||||||
|
Total assets
|
$ | 97,502 | $ | 143,037 | ||||
|
Total liabilities
|
- | 76 | ||||||
|
Net Asset Value
|
$ | 97,502 | $ | 142,961 | ||||
|
Year Ended December 31,
|
||||||||
|
2011
|
2010
|
|||||||
|
Summary income statement amounts:
|
||||||||
|
Realized loss, investments
|
$ | 690 | $ | - | ||||
|
Change in unrealized, loss from investments and others
|
(36,476 | ) | (8,990 | ) | ||||
|
Net investment income
|
(173 | ) | 11,747 | |||||
|
Net increase (decrease) in net assets from operations
|
(35,959 | ) | 2,757 | |||||
|
Amounts recognized in the consolidated financial statements:
|
||||||||
|
Loss from other investments - related party
|
$ | (15,743 | ) | $ | (3,220 | ) | ||
|
Proceeds from sales
|
4,156 | 13,494 | ||||||
|
Gross gains from sales
|
$ | - | $ | 810 | ||||
|
Gross losses from sales
|
- | - | ||||||
|
Net investment gain
|
$ | - | $ | 810 | ||||
(a) Represents the Company’s interest in the series of the SPII Liquidating Trust that holds preference shares and ordinary shares in Barbican.
(b) Represents the Company’s interest in the series of the SPII Liquidating Trust that holds common shares in F&H Acquisition Corp (“F&H”), which does business as Fox & Hound.
(c) Represents the Company’s indirect interest in the series of the SPII Liquidating Trust that holds the limited partnership interest in Steel Partners China Access I L.P. (“SPCA”) (see Note 14 - “Related Party Transactions”).
(d) Represents the Company’s interest in the series of the SPII Liquidating Trust that holds the limited partnership interest in Steel Partners Japan Strategic Fund, L.P. (“SPJSF”) (see Note 14 - “Related Party Transactions”).
(e) Represents the Company’s interest in the series of the SPII Liquidating Trust that holds certain other investments.
Variable Interest Entities
The Company holds variable interests in each series of the SPII Liquidating Trust (see “Other Investments -
Investments in
Related Party - Non-Current” above). The purpose of the SPII Liquidating Trust is to effect the orderly liquidation of certain assets previously held by SPII as part of the implementation of the SPII Fund Plan as discussed in Note 21 - “Exchange Transaction”. The Company determined that each VIE in which it held a variable interest since January 1, 2010 met the deferral criteria of ASC 810. Accordingly, these VIEs will continue to be assessed under the overall guidance on the consolidation of VIEs or other applicable guidance.
118
STEEL PARTNERS HOLDINGS L.P.
Notes to Consolidated Financial Statements
(in thousands except per unit data)
Notes to Consolidated Financial Statements
(in thousands except per unit data)
The Company has determined that it is not the primary beneficiary of any series of the SPII Liquidating Trust because it does not absorb a majority of the expected losses or receive a majority of the expected residual returns based on its equity ownership interests in each of the series. In addition, there are no related parties of SPH that, when considered together as a group, would cause the Company and its related party group to absorb a majority of expected losses or receive a majority of the expected residual returns. There are also no other contractual arrangements that would cause the Company to absorb a majority of the expected losses or receive a majority the expected residual returns. The Company also does not have a defacto agency relationship with any series of the SPII Liquidating Trust.
SPH’s financial position, financial performance and cash flows will be affected by the extent to which the operations of the SPII Liquidating Trust results in realized or unrealized gains (losses) and by distributions it makes in each reporting period.
The following table sets forth certain information regarding the series of the SPII Liquidating Trust, in the aggregate, in which the Company holds a variable interest as of December 31, 2011 and 2010 and is not a primary beneficiary. The amounts presented below are included in, and not in addition to, the other investments - related party tables above.
|
December 31,
|
||||||||
|
2011
|
2010
|
|||||||
|
Gross Assets
|
$ | 97,502 | $ | 143,037 | ||||
|
Financial Obligations (a)
|
- | - | ||||||
|
SPH Investment (b)
|
42,653 | 62,553 | ||||||
(a) The SPII Liquidating Trust did not have any financial obligations as of December 31, 2011 and 2010 and the Company did not have any financial obligation to the SPII Liquidating Trust as of such dates.
(b) Represents the Company’s maximum exposure to loss.
Net Investment Gains (Losses)
Net investment gains (losses) in the consolidated statement of operations consist of the following:
|
July 16, 2009
|
January 1, 2009
|
|||||||||||||||
|
Year Ended December 31,
|
to December 31,
|
to July 15,
|
||||||||||||||
|
2011
|
2010
|
2009
|
2009
|
|||||||||||||
|
Available-for-sale securities
|
$ | 18,411 | $ | 38,398 | $ | 9,165 | $ | (23 | ) | |||||||
|
Financial instruments
|
(29,573 | ) | (11,401 | ) | - | - | ||||||||||
|
Securities sold, not yet purchased
|
(1,408 | ) | (3,757 | ) | - | - | ||||||||||
|
Other investments - related party
|
- | 810 | 403 | - | ||||||||||||
|
Investment holding gain on DGT
|
8,177 | - | - | - | ||||||||||||
|
Other
|
41 | - | - | - | ||||||||||||
|
Total
|
$ | (4,352 | ) | $ | 24,050 | $ | 9,568 | $ | (23 | ) | ||||||
The losses from financial instruments are from call options, put options and foreign currency financial instruments described in Note 8 - “Financial Instruments”.
119
STEEL PARTNERS HOLDINGS L.P.
Notes to Consolidated Financial Statements
(in thousands except per unit data)
Notes to Consolidated Financial Statements
(in thousands except per unit data)
Investment Operations
Investment Operations investments were accounted for at fair value with changes in fair value reported in the revenue section of the consolidated statements of operations as “change in unrealized gains (losses)” when they occur. Under investment company accounting, Investment Operations did not consolidate investments and it did not apply the equity method of accounting.
7.
FAIR VALUE MEASUREMENTS
Investments and Other Financial Assets and Liabilities
The carrying value of cash and cash equivalents, receivables, prepaid and other current assets, accounts payable, other current liabilities and payables, is considered to be representative of their fair value, due to the short term nature of these instruments. The carrying amount of short-term and long-term debt does not differ materially from fair value because such debt is based on current market interest rates. The carrying value of loans receivable and deposits is considered to be representative of their fair values because the rates of interest on these instruments are not significantly different from market interest rates for instruments with similar maturities. The estimated fair values of the Company’s financial instruments as of December 31, 2011 and 2010 are shown in the following table.
|
Carrying Value
|
Fair Value
|
|||||||||||||||
|
2011
|
2010
|
2011
|
2010
|
|||||||||||||
|
Assets:
|
||||||||||||||||
|
Investments (see Note 6)
|
$ | 120,579 | $ | 71,872 | $ | 120,579 | $ | 71,872 | ||||||||
|
Financial instruments (see Note 8)
|
- | 13,772 | - | 13,772 | ||||||||||||
|
Loans receivable
|
43,762 | 28,327 | 44,031 | 28,084 | ||||||||||||
|
Investments in associated companies (a)
|
121,275 | 127,613 | 121,275 | 127,613 | ||||||||||||
|
Other investments - related party (b)
|
42,653 | 62,553 | 42,653 | 62,553 | ||||||||||||
|
Other investments (c)
|
29,442 | 7,668 | 29,442 | 7,668 | ||||||||||||
|
Total
|
$ | 357,711 | $ | 311,805 | $ | 357,980 | $ | 311,562 | ||||||||
|
Liabilities:
|
||||||||||||||||
|
Financial instruments (see Note 8)
|
$ | 23,736 | $ | 143,917 | $ | 23,736 | $ | 143,917 | ||||||||
|
Deposits
|
94,882 | 61,792 | 96,013 | 61,466 | ||||||||||||
|
Distribution payable (see Note 17)
|
- | 29,869 | - | 29,869 | ||||||||||||
|
Deferred fee liability to related party (see Note 14)
|
58,747 | 64,854 | 58,747 | 64,854 | ||||||||||||
|
Derivative features of subordinated notes (see Note 15)
|
694 | 2,866 | 694 | 2,866 | ||||||||||||
|
Common unit option liability (see Note 17)
|
- | 1,785 | - | 1,785 | ||||||||||||
|
Commodity contracts on precious metals
|
229 | - | 229 | - | ||||||||||||
|
Total
|
$ | 178,288 | $ | 305,083 | $ | 179,419 | $ | 304,757 | ||||||||
|
(a)
|
See Note 5 - “Investments in Associated Companies”. The Company elected the fair value option for HNH, API, Steel Excel and SLI. As described in Note 6 – “Investments”, at December 31, 2011 the investment in API was reclassified from investments in associated companies to Investments at fair value and is classified as Investments in the table above.
|
|
(b)
|
See Note 6 - “Investments” for description of Company’s fair value option election with respect to its other investments.
|
120
STEEL PARTNERS HOLDINGS L.P.
Notes to Consolidated Financial Statements
(in thousands except per unit data)
Notes to Consolidated Financial Statements
(in thousands except per unit data)
|
(c)
|
Represents the Company’s direct investment in the ordinary and preference shares of Barbican ($13,623 and $7,668 at December 31, 2011 and 2010, respectively), and the Company’s investment in API ($15,819), both of which are reported in Investments at fair value in the consolidated balance sheets.
|
ASC 820, “Fair Value Measurements and Disclosures”, requires enhanced disclosures about investments that are measured and reported at fair value. ASC 820 establishes a hierarchal disclosure framework that prioritizes and ranks the level of market price observability used in measuring investments at fair value. Market price observability is impacted by a number of factors, including the type of investment and the characteristics specific to the investment. Investments with readily available active quoted prices or for which fair value can be measured from actively quoted prices generally will have a higher degree of market price observability and a lesser degree of judgment used in measuring fair value.
Investments measured and reported at fair value are classified and disclosed in one of the following categories:
Level 1 - Quoted prices are available in active markets for identical investments as of the reporting date. The types of investments included in Level 1 are listed debt and equity securities.
Level 2 - Pricing inputs are other than quoted prices in active markets, which are either directly or indirectly observable as of the reporting date, and fair value is determined through the use of models or other valuation methodologies. Investments which are generally included in this category include corporate bonds and loans, less liquid and restricted equity securities.
Level 3 - Pricing inputs are unobservable for the investment and include situations where there is little, if any, market activity for the investment. The inputs into the determination of fair value require significant management judgment or estimation. Investments which are generally included in this category include private investments, non-exchange traded derivative contracts, and currency and interest rate swaps.
In certain cases, the inputs used to measure fair value may fall into different levels of the fair value hierarchy. In such cases, an investment’s level within the fair value hierarchy is based on the lowest level of input that is significant to the fair value measurement. The assessment of the significance of a particular input to the fair value measurement in its entirety requires judgment and considers factors specific to the investment.
The Company employs various methods within the market approach, income approach and/or cost approach and has also considered whether there were observable inputs. Certain discounts and other judgment factors were applied to arrive at the investments’ fair value. SPH’s private investments are valued utilizing unobservable pricing inputs. Management's determination of fair value is based upon the best information available for a given circumstance and may incorporate assumptions that are management's best estimates after consideration of a variety of internal and external factors. The valuation methodology applied for each is determined based on the nature of the investment. For private equity investments a market multiples approach that considers a specified financial measure (such as EBITDA or net tangible book value) and recent public market and private transactions and other available measures for valuing comparable companies may be used. A discounted cash flow approach may be used where significant assumptions and judgments are incorporated, including estimates of assumed growth rates, terminal values, discount rates, capital structure and other factors. For private debt investments, the valuation method considers comparable market yields for such instruments and recovery assumptions. The Company may utilize observable pricing inputs and assumptions in determining the fair value of our private investments. Observable and unobservable pricing inputs and assumptions may differ by investment and in the application of the valuation methodologies. The reported fair value estimates could vary materially if different unobservable pricing inputs and other assumptions were used.
121
STEEL PARTNERS HOLDINGS L.P.
Notes to Consolidated Financial Statements
(in thousands except per unit data)
Notes to Consolidated Financial Statements
(in thousands except per unit data)
Fair values recorded for non-financial assets acquired and liabilities assumed in acquisitions and when testing for impairment include values measured using Level 3 inputs including an income approach and/or a market approach to the measurements. The income approach is based on a discounted cash flow analysis (“DCF”) and calculates the fair value by estimating the after-tax cash flows attributable to reporting units and then discounting the after-tax cash flows to present value using a risk-adjusted discount rate. Assumptions used in the DCF require the exercise of significant judgment, including judgment about appropriate discount rates and terminal values, growth rates, and the amount and timing of expected future cash flows. The discount rates, which are intended to reflect the risks inherent in future cash flow projections, used in the DCF are based on estimates of the weighted-average cost of capital (“WACC”) of a market participant. Such estimates are derived from analysis of peer companies and consider the industry weighted average return on debt and equity from a market participant perspective. A market approach values a business by considering the prices at which shares of capital stock of reasonably comparable companies are trading in the public market, or the transaction price at which similar companies have been acquired. Relative weights are then given to the results of each of these approaches, based on the facts and circumstances of the business being valued. The use of multiple approaches (the income and market approaches) is considered preferable to a single method. Significant weight is given to the income approach because it generally provides a reliable estimate of value for an ongoing business which has a reliable forecast of operations. The income approach closely parallels investors’ consideration of the future benefits derived from ownership of an asset.
The financial instruments reported as current assets and current liabilities are valued and reported at fair value. The option contracts reported as financial instruments are traded on nationally recognized exchanges. The financial instruments payable in foreign currencies are entered into with a counterparty and are considered Level 2 measurements.
The derivative instruments that certain subsidiaries of HNH purchase, specifically commodity futures and forwards contracts on precious metal, are valued at fair value. The futures contracts are Level 1 measurements since they are traded on a commodity exchange. The forward contracts are entered into with a counterparty, and are considered Level 2 measurements.
Financial assets and liabilities measured at fair value on a recurring basis in the consolidated financial statements as of December 31, 2011 and 2010 are summarized by type of inputs applicable to the fair value measurements as follows:
|
December 31, 2011
|
Level 1
|
Level 2
|
Level 3
|
Total
|
||||||||||||
|
Assets:
|
||||||||||||||||
|
Equity securities - U.S. (a)
|
$ | 87,907 | $ | 32,672 | $ | - | $ | 120,579 | ||||||||
|
Investments in associated companies (b)
|
121,275 | - | - | 121,275 | ||||||||||||
|
Other investments - related party (c)
|
- | - | 42,653 | 42,653 | ||||||||||||
|
Other investments (d)
|
15,819 | - | 13,623 | 29,442 | ||||||||||||
|
Total
|
$ | 225,001 | $ | 32,672 | $ | 56,276 | $ | 313,949 | ||||||||
|
Liabilities:
|
||||||||||||||||
|
Current portion of distribution payable
|
$ | - | $ | - | $ | - | $ | - | ||||||||
|
Financial instruments
|
- | 23,736 | - | 23,736 | ||||||||||||
|
Deferred fee liability to related party
|
- | - | 58,747 | 58,747 | ||||||||||||
|
Derivative features of subordinated notes
|
- | - | 694 | 694 | ||||||||||||
|
Commodity contracts on precious metals
|
165 | 64 | - | 229 | ||||||||||||
|
Total
|
$ | 165 | $ | 23,800 | $ | 59,441 | $ | 83,406 | ||||||||
122
STEEL PARTNERS HOLDINGS L.P.
Notes to Consolidated Financial Statements
(in thousands except per unit data)
Notes to Consolidated Financial Statements
(in thousands except per unit data)
|
Level 1
|
Level 2
|
Level 3
|
Total
|
|||||||||||||
|
December 31, 2010
|
||||||||||||||||
|
Assets:
|
||||||||||||||||
|
Debt securities – corporate
|
$ | 15,333 | $ | 22,033 | $ | - | $ | 37,366 | ||||||||
|
Equity securities - U.S. (a)
|
28,979 | 5,527 | - | 34,506 | ||||||||||||
|
Total investments
|
44,312 | 27,560 | - | 71,872 | ||||||||||||
|
Financial instruments
|
- | 13,772 | - | 13,772 | ||||||||||||
|
Investments in associated companies (c)
|
105,387 | 22,226 | - | 127,613 | ||||||||||||
|
Other investments - related party (d)
|
- | - | 62,553 | 62,553 | ||||||||||||
|
Other investments
|
- | - | 7,668 | 7,668 | ||||||||||||
|
Total
|
$ | 149,699 | $ | 63,558 | $ | 70,221 | $ | 283,478 | ||||||||
|
Liabilities:
|
||||||||||||||||
|
Current portion of distribution payable
|
$ | - | $ | - | $ | 29,869 | $ | 29,869 | ||||||||
|
Financial instruments
|
- | 143,917 | - | 143,917 | ||||||||||||
|
Deferred fee liability to related party
|
- | - | 64,854 | 64,854 | ||||||||||||
|
Derivative features of subordinated notes
|
- | - | 2,866 | 2,866 | ||||||||||||
|
Common unit option liability
|
- | - | 1,785 | 1,785 | ||||||||||||
|
Total
|
$ | - | $ | 143,917 | $ | 99,374 | $ | 243,291 | ||||||||
______________
|
(a)
|
One security with a fair value of $209 was transferred from Level 2 to Level 1 at December 31, 2011 based on higher trading volume. Two securities included in Equity securities - U.S. with a fair value of $2,292 were transferred from Level 1 to Level 2 at December 31, 2010 based on lower trading volumes.
|
|
(b)
|
Investments in API and SLI were classified as Level 2 at December 31, 2010. At December 31, 2011, SLI was transferred to Level 1 based on higher trading volumes.
|
|
(c)
|
Other investments - related party are entirely comprised of the interests held by the Company in each series of the SPII Liquidating Trust (see Note 6 - “Investments” and Note 14 - “Related Party Transactions”). Each series of the SPII Liquidating Trust generally holds the securities related to a specific investment and cash for operating expenses of the series. The investments in the SPII Liquidating Trust are not redeemable and distributions will be received as the underlying assets of the SPII Liquidating Trust are liquidated over a period which is not determinable. There are no unfunded capital commitments with respect to these investments. The fair values for the investments in the SPII Liquidating Trust held by the Company have been estimated using the net asset value of such interests as reported by the SPII Liquidating Trust. Changes in the fair values of investments in the SPII Liquidating Trust are reported in the consolidated statement of operations as loss from other investments - related party.
|
|
(d)
|
As of December 31, 2011, API has been reclassified from investments in associated companies (Level 2) to investments at fair value (Level 1).
|
Realized and unrealized gains and (losses) for the years ended December 31, 2011 and 2010 on investments for which fair values were determined using reported net asset values were $636 and $(16,380) and $4,864 and $(7,274), respectively. Realized and unrealized gains and realized and unrealized (losses) for the period from July 16, 2009 to December 31, 2009 on investments for which fair values were determined using reported net asset values were $5,277 and $(7,834), respectively. Realized and unrealized gains and realized and unrealized (losses) of Investment Operations for the period from January 1, 2009 to July 15, 2009 were $11,233 and $(11,507), respectively, on investments for which fair values were determined using reported net asset values. These realized and unrealized gains and losses are reported in the consolidated statement of operations. Investments for which fair value is determined using net asset values as fair value are classified as Level 3 and are $42,653 and $62,553 at December 31, 2011 and 2010, respectively. The investments are reported in the consolidated balance sheet as other investments - related party.
The Company and the SPII Liquidating Trust use specific valuation metrics appropriate for each specific investment to estimate the fair value of their debt and equity securities measured using Level 3 inputs. The SPII Liquidating Trust estimates the value of its interests in SPCA, a limited partnership that holds an investment in a Chinese company, and SPJSF based on the net asset value of such funds, which hold investments all of which are valued based on Level 1 or Level 2 inputs. The investments held by the SPII Liquidating Trust in these two investment funds are not redeemable and distributions will be received from the SPII Liquidating Trust as the underlying assets held are sold over a period which is not determinable. SPCA’s term ends in May 2012 and may be extended for up to one additional year at the discretion of its general partner. There are no unfunded capital commitments with respect to these investments.
123
STEEL PARTNERS HOLDINGS L.P.
Notes to Consolidated Financial Statements
(in thousands except per unit data)
Notes to Consolidated Financial Statements
(in thousands except per unit data)
Following is a summary of changes in financial assets measured using Level 3 inputs:
|
Diversified Industrial, Financial Services and Other
|
||||||||||||||||
|
Other Investments - Related Party
|
Other Investments
|
Total
|
Investment Operations Investments
|
|||||||||||||
|
Assets
|
||||||||||||||||
|
Balance at December 31, 2008
|
$ | - | $ | - | $ | - | $ | 297,950 | ||||||||
|
Transfers in
|
- | - | - | 94 | (b) | |||||||||||
|
Purchases, sales, issuances and settlements
|
- | - | - | (36,004 | ) | |||||||||||
|
Unrealized gains
|
- | - | - | 32,740 | ||||||||||||
|
Unrealized losses
|
- | - | - | (11,702 | ) | |||||||||||
|
SPII Fund distributions
|
- | - | - | (159,231 | ) | |||||||||||
|
Transfer from investment operations (a)
|
123,847 | - | 123,847 | (123,847 | ) | |||||||||||
|
Elimination of indirect interest in BNS loan
|
(9,184 | ) | - | (9,184 | ) | - | ||||||||||
|
Balance at July 15, 2009
|
114,663 | - | 114,663 | $ | - | |||||||||||
|
Purchases, sales, issuances and settlements
|
(14,183 | ) | 8,334 | (5,849 | ) | |||||||||||
|
Realized gains
|
434 | - | 434 | |||||||||||||
|
Realized losses
|
(31 | ) | - | (31 | ) | |||||||||||
|
Unrealized gains
|
4,843 | - | 4,843 | |||||||||||||
|
Unrealized losses
|
(7,803 | ) | (254 | ) | (8,057 | ) | ||||||||||
|
Balance at December 31, 2009
|
97,923 | 8,080 | 106,003 | |||||||||||||
|
Purchases, sales, issuances and settlements
|
(13,493 | ) | - | (13,493 | ) | |||||||||||
|
Realized gains
|
810 | - | 810 | |||||||||||||
|
Unrealized gains
|
4,054 | - | 4,054 | |||||||||||||
|
Unrealized losses
|
(7,274 | ) | (412 | ) | (7,686 | ) | ||||||||||
|
Elimination of indirect interest in BNS and HNH amounts in consolidation
|
(19,467 | ) | - | (19,467 | ) | |||||||||||
|
Balance at December 31, 2010
|
62,553 | 7,668 | 70,221 | |||||||||||||
|
Purchases
|
- | 6,138 | 6,138 | |||||||||||||
|
Sales
|
(4,156 | ) | - | (4,156 | ) | |||||||||||
|
Realized gains
|
- | - | - | |||||||||||||
|
Unrealized gains
|
636 | - | 636 | |||||||||||||
|
Unrealized losses
|
(16,380 | ) | (183 | ) | (16,563 | ) | ||||||||||
|
Balance at December 31, 2011
|
$ | 42,653 | $ | 13,623 | $ | 56,276 | ||||||||||
______________
|
(a)
|
Represents the Level 3 investments held by Investment Operations that were retained by SPH in connection with the implementation of the Exchange Transaction as of July 15, 2009 and reclassified as Other Investments.
|
|
(b)
|
In connection with the Restructuring of the SPII Fund, Level 2 assets valued at $94 were transferred to the SPII Liquidating Trust and became Level 3 assets.
|
The change in unrealized gains (losses) for investments still held at December 31, 2011, 2010 and 2009 was reported in the consolidated statements of operations as follows:
124
STEEL PARTNERS HOLDINGS L.P.
Notes to Consolidated Financial Statements
(in thousands except per unit data)
Notes to Consolidated Financial Statements
(in thousands except per unit data)
|
Other Investments - Related Party
|
Other Investments
|
Total
|
||||||||||
|
December 31, 2011
|
||||||||||||
|
Gains
|
||||||||||||
|
Gains from other investments-related party
|
$ | 636 | $ | - | $ | 636 | ||||||
|
Losses
|
||||||||||||
|
Losses from other investments-related party
|
(16,380 | ) | - | (16,380 | ) | |||||||
|
Investment and other loss
|
- | (183 | ) | (183 | ) | |||||||
| (16,380 | ) | (183 | ) | (16,563 | ) | |||||||
|
Total
|
$ | (15,744 | ) | $ | (183 | ) | $ | (15,927 | ) | |||
|
December 31, 2010
|
||||||||||||
|
Gains
|
||||||||||||
|
Gains from other investments-related party
|
$ | 2,215 | $ | - | $ | 2,215 | ||||||
|
Losses
|
||||||||||||
|
Losses from other investments-related party
|
(6,334 | ) | - | (6,334 | ) | |||||||
|
Investment and other loss
|
- | (411 | ) | (411 | ) | |||||||
| (6,334 | ) | (411 | ) | (6,745 | ) | |||||||
|
Total
|
$ | (4,119 | ) | $ | (411 | ) | $ | (4,530 | ) | |||
|
December 31, 2009
|
||||||||||||
|
Gains
|
||||||||||||
|
Gains from investments - related party
|
$ | 4,843 | $ | - | $ | 4,843 | ||||||
|
Losses
|
||||||||||||
|
Losses from other investments - related party
|
(7,803 | ) | - | (7,803 | ) | |||||||
|
Investment and other loss
|
- | (254 | ) | (254 | ) | |||||||
| (7,803 | ) | (254 | ) | (8,057 | ) | |||||||
|
Total
|
$ | (2,960 | ) | $ | (254 | ) | $ | (3,214 | ) | |||
125
STEEL PARTNERS HOLDINGS L.P.
Notes to Consolidated Financial Statements
(in thousands except per unit data)
Notes to Consolidated Financial Statements
(in thousands except per unit data)
The realized and unrealized gains and losses in financial assets measured using Level 3 inputs are reported in the consolidated statement of operations as follows:
|
Realized Gains
|
Realized Losses
|
Unrealized Gains
|
Unrealized Losses
|
Total
|
||||||||||||||||
|
Diversified Industrial, Financial Services and Other
|
||||||||||||||||||||
|
Period from July 16, 2009 to December 31, 2009:
|
||||||||||||||||||||
|
Investment and other loss
|
$ | - | $ | - | $ | - | $ | (254 | ) | $ | (254 | ) | ||||||||
|
Net investment gains (losses)
|
434 | (31 | ) | - | - | 403 | ||||||||||||||
|
Income (loss) from other investments - related party
|
- | - | 4,843 | (7,803 | ) | (2,960 | ) | |||||||||||||
|
Total
|
$ | 434 | $ | (31 | ) | $ | 4,843 | $ | (8,057 | ) | $ | (2,811 | ) | |||||||
|
Year ended December 31, 2010:
|
||||||||||||||||||||
|
Investment and other loss
|
$ | - | $ | - | $ | - | $ | (412 | ) | $ | (412 | ) | ||||||||
|
Net investment gains
|
810 | - | - | - | 810 | |||||||||||||||
|
Income (loss) from other investments- related party
|
- | - | 4,054 | (7,274 | ) | (3,220 | ) | |||||||||||||
|
Total
|
$ | 810 | $ | - | $ | 4,054 | $ | (7,686 | ) | $ | (2,822 | ) | ||||||||
|
Year ended December 31, 2011:
|
||||||||||||||||||||
|
Investment and other loss
|
$ | - | $ | - | $ | - | $ | (183 | ) | $ | (183 | ) | ||||||||
|
Income (loss) from other investments- related party
|
- | - | 636 | (16,380 | ) | (15,744 | ) | |||||||||||||
|
Total
|
$ | - | $ | - | $ | 636 | $ | (16,563 | ) | $ | (15,927 | ) | ||||||||
|
Investment Operations
|
||||||||||||||||||||
|
Period from January 1, 2009 to July 15, 2009:
|
||||||||||||||||||||
|
Change in unrealized gains (losses), investments
|
$ | - | $ | - | $ | 32,740 | $ | (11,702 | ) | $ | 21,038 | |||||||||
|
Total
|
$ | - | $ | - | $ | 32,740 | $ | (11,702 | ) | $ | 21,038 | |||||||||
126
STEEL PARTNERS HOLDINGS L.P.
Notes to Consolidated Financial Statements
(in thousands except per unit data)
Notes to Consolidated Financial Statements
(in thousands except per unit data)
Following is a summary of changes in financial liabilities measured using Level 3 inputs:
|
Diversified Industrial, Financial Services and Other
|
||||||||||||||||||||
|
Distribution Payable (a)
|
Deferred Fee Liability to Related Party (b)
|
Derivative Feature of Subordinated Notes (c)
|
Common Unit Option Liability (d)
|
Total
|
||||||||||||||||
|
Balance at July 15, 2009
|
$ | 78,971 | $ | 51,594 | $ | - | $ | - | $ | 130,565 | ||||||||||
|
Increase in fair value reported in the consolidated statement of operations
|
- | 6,992 | - | 1,092 | 8,084 | |||||||||||||||
|
Balance at December 31, 2009
|
78,971 | 58,586 | - | 1,092 | 138,649 | |||||||||||||||
|
Cash distribution on April 1, 2010
|
(49,102 | ) | - | (49,102 | ) | |||||||||||||||
|
Embedded call feature of subordinated debt refinanced
|
- | - | 2,634 | - | 2,634 | |||||||||||||||
|
Increase in fair value reported in the consolidated statement of operations as income
|
- | 6,268 | 232 | 693 | 7,193 | |||||||||||||||
|
Balance at December 31, 2010
|
$ | 29,869 | $ | 64,854 | $ | 2,866 | $ | 1,785 | $ | 99,374 | ||||||||||
|
Decrease in fair value reported in the condensed consolidated statement of operations as income
|
- | (6,107 | ) | (839 | ) | (1,785 | ) | (8,731 | ) | |||||||||||
|
Cash distribution on April 6, 2011
|
(29,869 | ) | - | - | - | (29,869 | ) | |||||||||||||
|
Settlements
|
- | - | (1,333 | ) | - | (1,333 | ) | |||||||||||||
|
Balance at December 31, 2011
|
$ | - | $ | 58,747 | $ | 694 | $ | - | $ | 59,441 | ||||||||||
|
(a)
|
See Note 17 - “Capital and Comprehensive Income” Common Unit Distributions.
|
|
(b)
|
See Note 14 - “Related Party Transactions.”
|
|
(c)
|
See Note 15 - “Debt.”
|
|
(d)
|
See Note 17 - “Capital and Comprehensive Income” Common Unit Option Liability.
|
Assets Measured at Fair Value on a Nonrecurring Basis
The Company’s non-financial assets measured at fair value in 2011 and 2010 on a non-recurring basis include the assets acquired and liabilities assumed in the acquisitions described in Note 3 – “Acquisitions”. Significant judgments and estimates are made to determine the acquisition date fair values which may include the use of appraisals, discounted cash flow techniques or other information the Company considers relevant to the fair value measurement. Subsequent to initial measurement, the Company evaluates its long-lived assets for impairment whenever events or changes in circumstances indicate, in management’s judgment that carrying values may not be recoverable. Circumstances that could trigger an interim impairment test include but are not limited to: the occurrence of a significant change in circumstances, such as continuing adverse business conditions or legal factors; an adverse action or assessment by a regulator; unanticipated competition; loss of key personnel; the likelihood that a reporting unit or significant portion of a reporting unit will be sold or otherwise disposed; or results of testing for recoverability of a significant asset group within a reporting unit.
WebBank has impaired loans of $3,789, of which $2,354 is guaranteed by the USDA or SBA, and $2,627 at December 31, 2011 and 2010, respectively which are measured at fair value on a nonrecurring basis using Level 3 inputs. During the year ended December 31, 2011, WF Asset Corp. recorded impairment charges of $1,044. Loans are considered impaired when, based on current information and events, it is probable that WebBank will be unable to collect all amounts due according to the contractual terms of loan agreements, including scheduled interest payments. When a loan has been identified as being impaired, the amount of impairment is measured based on the present value of expected future cash flows discounted at the loan’s effective interest rate or, when appropriate, the loan’s observable fair value or the fair value of the collateral (less any selling costs) if the loan is collateral-dependent. If the measurement of the impaired loan is less than the recorded investment in the loan (including accrued interest, net of deferred loan fees or costs and unamortized premium or discount), an impairment is recognized by creating or adjusting an existing allocation of the allowance for loan losses, or by charging down the loan to its value determined in accordance with generally accepted accounting principles. Amounts charged against the allowance for loan losses were $1,589, $1,544, $5,524, $1,250, and $1,250 for the years ended December 31, 2011 and 2010, and for the periods January 1, 2009 to July 15, 2009 and July 16, 2009 to December 31, 2009, respectively.
127
STEEL PARTNERS HOLDINGS L.P.
Notes to Consolidated Financial Statements
(in thousands except per unit data)
Notes to Consolidated Financial Statements
(in thousands except per unit data)
8. FINANCIAL
INSTRUMENTS
Foreign Currency Exchange Rate Risk
Financial instruments include $23,736 and $137,823 at December 31, 2011 and 2010, respectively, of amounts payable in foreign currencies which are subject to the risk of exchange rate changes. These financial instruments resulted from transactions entered into for risk management purposes, are collateralized by an equivalent amount included in restricted cash and have no maturity date. The liabilities are accounted for at fair value on the balance sheet date with changes in fair value reported in the consolidated statement of operations included in net investment gain (loss). The liabilities are not designated as hedging instruments. The foreign currency financial instrument liabilities at December 31, 2011 and 2010 are as follows:
|
December 31, 2011
|
December 31, 2010
|
|||||||||||||||
|
Currency
|
Carrying Amount
|
Notional Amount
|
Carrying Amount
|
Notional Amount
|
||||||||||||
|
Japanese Yen
|
$ | 1,899 | ¥ | 146,241 | $ | 111,484 | ¥ | 9,052,504 | ||||||||
|
Euro
|
- | - | 10,715 | € | 8,005 | |||||||||||
|
Pound Sterling
|
21,837 | £ | 14,055 | 15,624 | £ | 10,008 | ||||||||||
|
Total
|
$ | 23,736 | $ | 137,823 | ||||||||||||
Information is summarized below for foreign currency financial liabilities and related restricted cash for the years ended December 31, 2011 and 2010:
|
Foreign exchange transactions:
|
||||||||
|
2011
|
2010
|
|||||||
|
Balance, beginning of year
|
$ | 137,823 | $ | - | ||||
|
Sales of foreign currency financial instruments
|
20,170 | 447,724 | ||||||
|
Purchases of foreign currency financial instruments
|
(138,522 | ) | (277,740 | ) | ||||
|
Net investment losses
|
4,903 | 14,099 | ||||||
|
Proceeds from sales of investments
|
(1,961 | ) | (45,087 | ) | ||||
|
Receipt of dividends, net of interest expense
|
518 | (1,173 | ) | |||||
|
Other
|
805 | - | ||||||
|
Balance of foreign currency financial instruments liability and related restricted cash, end of year
|
$ | 23,736 | $ | 137,823 | ||||
HNH business units are subject to the risk of price fluctuations related to anticipated revenues and operating costs, firm commitments for capital expenditures and existing assets or liabilities denominated in currencies other than U.S. dollars. HNH has not used derivative instruments to manage this risk.
Commodity Contracts
HNH enters into commodity futures and forwards contracts on precious metals that are subject to market fluctuations in order to economically hedge its precious metal inventory against price fluctuations.
As of December 31, 2011, HNH had entered into forward and future contracts for gold with a total value of $1,500 and for silver with a total value of $2,600.
As of December 31, 2011, HNH had the following outstanding forward or future contracts with settlement dates ranging from February 2012 to March 2012. .
128
STEEL PARTNERS HOLDINGS L.P.
Notes to Consolidated Financial Statements
(in thousands except per unit data)
Notes to Consolidated Financial Statements
(in thousands except per unit data)
|
Commodity
|
Amount
|
|
Silver
|
90,000 ounces
|
|
Gold
|
1,000 ounces
|
Option Contracts
SPH acquired the stock of two companies in conjunction with its acquisition of the assets of SPII on July 15, 2009. Subsequently, in place of these holdings, SPH invested in buying calls and selling puts in these two companies to create similar risk/reward characteristics of a direct risk management in the common stock of the two companies. As of December 31, 2010, the Company had entered into call option contracts with a total fair value of $13,772 reported on the consolidated balance sheet as financial instruments - current assets and put option contracts with a total value of $6,094 reported on the consolidated balance sheet as financial instruments-current liability. As of December 31, 2011 there are no call or put options outstanding. The option contracts were exchange traded in active markets and the Company estimates the fair value of the options through use of quoted prices obtained on internationally recognized exchanges.
Information is summarized below for the option contracts for the years ended December 31, 2011 and 2010:
|
Year Ended December 31,
|
||||||||
|
2011
|
2010
|
|||||||
|
Proceeds from sales
|
$ | 18,099 | $ | 23,751 | ||||
|
Realized gains (losses):
|
||||||||
|
Gross gains from sales
|
$ | 2,580 | $ | 4,081 | ||||
|
Gross losses from sales
|
(27,031 | ) | (8,354 | ) | ||||
|
Net realized investment loss
|
(24,451 | ) | (4,273 | ) | ||||
|
Unrealized gains (losses):
|
||||||||
|
Change in unrealized gains
|
1,982 | 8,441 | ||||||
|
Change in unrealized losses
|
(2,202 | ) | (1,480 | ) | ||||
|
Net unrealized investment gain
|
(220 | ) | 6,961 | |||||
|
Net investment (loss) gain
|
$ | (24,671 | ) | $ | 2,688 | |||
Securities sold, not yet purchased
There are no amounts outstanding at December 31, 2011 and 2010 for securities sold, not yet purchased. For risk management purposes during the year ended December 31, 2010, the Company sold securities short in order to economically hedge the risk of a decline in the stock market.
Securities sold, not yet purchased represent obligations of the Company to deliver the specified security at the contracted price and, thereby, create a liability to repurchase the security in the market at prevailing prices. Accordingly, these transactions result in off-balance-sheet risk as the Company’s ultimate obligation to satisfy the sale of securities sold, not yet purchased, at fair value may exceed the amount recognized in the consolidated balance sheet. The securities sold, not yet purchased are exchange traded in active markets and the Company estimates fair value of the securities through use of quoted prices obtained on internationally recognized exchanges.
Information is summarized below for securities sold, not yet purchased for the years ended December 31, 2011 and 2010:
129
STEEL PARTNERS HOLDINGS L.P.
Notes to Consolidated Financial Statements
(in thousands except per unit data)
Notes to Consolidated Financial Statements
(in thousands except per unit data)
|
Year Ended December 31,
|
||||||||
|
2011
|
2010
|
|||||||
|
Proceeds from sales
|
$ | 20,045 | $ | 200,888 | ||||
|
Gross gains from sales
|
$ | 14 | $ | 1,155 | ||||
|
Gross losses from sales
|
(1,422 | ) | (4,902 | ) | ||||
|
Net investment loss
|
$ | (1,408 | ) | $ | (3,747 | ) | ||
Subordinated Notes
As described in Note 15 - “Debt”, HNH’s Subordinated Notes have embedded call premiums and warrants associated with them. The Company has treated the fair value of these features together as both a discount and a derivative liability at inception of the loan agreement, valued at $2,634. The discount is being amortized over the life of the notes as an adjustment to interest expense, and the derivative liability is marked to market at each balance sheet date. As of December 31, 2011 and 2010, mark to market adjustments of $839 and $(232) were recorded as unrealized gains (losses) on derivatives, decreasing (increasing) the fair value of the derivative liability to $694 and $2,866, respectively. The Subordinated Notes and embedded call premiums and warrants in the SPH consolidated financial statements and in the footnotes are presented net of intercompany amounts eliminated in consolidation.
As the above described derivatives are not designated as accounting hedges under ASC 815, “Accounting for Derivative Instruments and Hedging Activities” (“ASC 815”), they are accounted for as derivatives with no hedge designation. The derivatives are marked to market and both realized and unrealized gains and losses are recorded in current period earnings in the Company's consolidated statement of operations. The Company’s
hedging strategy is designed to protect it against normal volatility. However, abnormal price changes in the commodity, foreign exchange and stock markets could
negatively impact the Company’s earnings.
Fair Value of Derivative Instruments in the Consolidated Balance Sheets:
|
December 31,
|
|||||||||
|
Derivative
|
Balance Sheet Location
|
2011
|
2010
|
||||||
|
Foreign currency financial instruments
|
Financial instruments - current liabilities
|
$ | 23,736 | $ | 137,823 | ||||
|
Commodity contracts
|
Other current liabilities
|
$ | 229 | $ | 40 | ||||
|
Call options
|
Financial instruments - current assets
|
$ | - | $ | 13,772 | ||||
|
Put options
|
Financial instruments - current liabilities
|
$ | - | $ | 6,094 | ||||
|
Derivative features of subordinated notes
|
Long-term debt
|
$ | 694 | $ | 2,866 | ||||
Effect of derivative instruments on the Consolidated Statements of Operations:
|
Year Ended December 31,
|
|||||||||
|
Derivative
|
Statement of Operations Location
|
2011
|
2010
|
||||||
|
Gain (loss)
|
Gain (loss)
|
||||||||
|
Foreign currency financial instruments
|
Net investment gain (loss)
|
$ | (4,903 | ) | $ | (14,099 | ) | ||
|
Commodity contracts
|
Realized and unrealized loss on derivatives
|
(1,236 | ) | (4,932 | ) | ||||
|
Call options
|
Net investment gain (loss)
|
(8,539 | ) | (4,974 | ) | ||||
|
Put options
|
Net investment gain (loss)
|
(16,131 | ) | 7,662 | |||||
|
Securities sold, not yet purchased
|
Net investment gain (loss)
|
(1,408 | ) | (3,747 | ) | ||||
|
Derivative features of subordinated notes
|
Realized and unrealized loss on derivatives
|
839 | (232 | ) | |||||
|
Total derivatives
|
$ | (31,378 | ) | $ | (20,322 | ) | |||
130
STEEL PARTNERS HOLDINGS L.P.
Notes to Consolidated Financial Statements
(in thousands except per unit data)
Notes to Consolidated Financial Statements
(in thousands except per unit data)
Financial Instruments with Off-balance Sheet Risk
WebBank is a party to financial instruments with off-balance sheet risk. In the normal course of business, these financial instruments include commitments to extend credit in the form of loans or through letters of credit. Those instruments involve to varying degrees, elements of credit and interest rate risk in excess of the amount recognized on the consolidated balance sheets. The contract amounts of those instruments reflect the extent of involvement WebBank has in particular classes of financial instruments.
At December 31, 2011 and 2010, WebBank’s undisbursed loan commitments totaled $113,350 and $57,488, respectively. Commitments to extend credit are agreements to lend to a customer provided there is no violation of any condition established in the contract. WebBank’s commitments generally have fixed expiration dates or other termination clauses and may require payment of a fee. Since certain of the commitments are expected to expire without being drawn upon, the total commitment amounts do not necessarily represent future cash requirements. WebBank evaluates each customer’s credit worthiness on a case-by-case basis. The amount of collateral obtained if deemed necessary by WebBank upon extension of credit is based on management’s credit evaluation of the borrower.
WebBank’s exposure to credit loss in the event of nonperformance by the other party to the financial instrument for commitments to extend credit is represented by the contractual amount of those instruments. WebBank uses the same credit policy in making commitments and conditional obligations as it does for on-balance sheet instruments.
WebBank also estimates an allowance for potential losses on off-balance sheet contingent credit exposure. WebBank determines an allowance for this contingent credit exposure based on historical experience and portfolio analysis. The allowance was $1,696 and $1,718 at December 31, 2011 and 2010, respectively, and is included with other current liabilities in the consolidated balance sheets. Increases or decreases in the allowance are included in selling, general and administrative expenses in the consolidated statements of operations. The amount included in selling, general and administrative expenses for credit losses on off-balance sheet contingent credit exposure was a benefit of $22 for the year ended December 31, 2011 and an expense of $775, $0, $1,250, for the year ended December 31, 2010 and for periods January 1, 2009 to July 15, 2009 and July 16, 2009 to December 31, 2009, respectively.
9. TRADE, OTHER AND LOANS
RECEIVABLE
Trade and Other Receivables
A summary of receivables is as follows:
|
December 31,
|
||||||||
|
2011
|
2010
|
|||||||
|
Trade accounts receivable, net of allowance for doubtful accounts
|
||||||||
|
of $2,504 in 2011 and $2,198 in 2010
|
$ | 84,987 | $ | 66,582 | ||||
|
Other receivables
|
5,252 | 1,165 | ||||||
|
Total
|
$ | 90,239 | $ | 67,747 | ||||
Loans Receivable
ASU 2010-20,
Disclosures about the Credit Quality of Financing Receivables and the Allowance for Credit Losses
, requires certain additional disclosures under ASC 310, Receivables, which became effective at December 31, 2010. Certain other disclosures were required beginning March 31, 2011 and relate to additional detail for the rollforward of the allowance for credit losses and for impaired loans. The new guidance is incorporated in the following discussion. It relates only to financial statement disclosures and does not affect the Company’s financial condition or results of operations.
131
STEEL PARTNERS HOLDINGS L.P.
Notes to Consolidated Financial Statements
(in thousands except per unit data)
Notes to Consolidated Financial Statements
(in thousands except per unit data)
Additional accounting guidance and disclosures for troubled debt restructurings (“TDRs”) are required for the Company beginning with the quarter ended September 30, 2011 in accordance with ASU 2011-02,
A Creditor’s Determination of Whether a Restructuring Is a Troubled Debt Restructuring
. ASU 2011-02 was issued April 5, 2011 and supersedes the deferral granted by ASU 2011-01 of the effective date of disclosures about TDRs which were included in ASU 2010-20. In addition to the required new disclosures, ASU 2011-02 provides criteria to evaluate if a TDR exists based on whether (1) the restructuring constitutes a concession by the creditor and (2) the debtor is experiencing financial difficulty. Adoption of this guidance has not had a material effect on the consolidated financial statements.
Major classification of WebBank’s loans receivable at December 31, 2011 and December 31, 2010 are as follows:
|
Total
|
Current
|
Non-current
|
||||||||||||||||||||||||||||||
|
December 31,
|
December 31,
|
December 31,
|
||||||||||||||||||||||||||||||
|
2011
|
%
|
2010
|
%
|
2011
|
2010
|
2011
|
2010
|
|||||||||||||||||||||||||
|
Real estate loans:
|
||||||||||||||||||||||||||||||||
|
Construction
|
$ | - | 0 | % | $ | 989 | 3 | % | $ | - | $ | 201 | $ | - | $ | 788 | ||||||||||||||||
|
Commercial - owner occupied
|
8,340 | 19 | % | 9,546 | 32 | % | 302 | 281 | 8,038 | 9,265 | ||||||||||||||||||||||
|
Commercial – other
|
300 | 0 | % | 276 | 1 | % | 9 | 8 | 291 | 268 | ||||||||||||||||||||||
|
Total real estate loans
|
8,640 | 19 | % | 10,811 | 36 | % | 311 | 490 | 8,329 | 10,321 | ||||||||||||||||||||||
|
Commercial and industrial
|
4,344 | 10 | % | 6,218 | 21 | % | 3,731 | 4,620 | 613 | 1,598 | ||||||||||||||||||||||
|
Loans held for sale
|
31,363 | 71 | % | 12,903 | 43 | % | 31,363 | 12,903 | - | - | ||||||||||||||||||||||
|
Total loans
|
44,347 | 100 | % | 29,932 | 100 | % | 35,405 | 18,013 | 8,942 | 11,919 | ||||||||||||||||||||||
|
Less:
|
||||||||||||||||||||||||||||||||
|
Deferred fees and discounts
|
(56 | ) | (64 | ) | (56 | ) | (64 | ) | - | - | ||||||||||||||||||||||
|
Allowance for loan losses
|
(529 | ) | (1,541 | ) | (529 | ) | (1,541 | ) | - | - | ||||||||||||||||||||||
|
Total loans receivable, net
|
$ | 43,762 | $ | 28,327 | $ | 34,820 | $ | 16,408 | $ | 8,942 | $ | 11,919 | ||||||||||||||||||||
Allowance for Loan and Lease Losses
The Allowance for Loan and Lease Losses (“ALLL”) represents an estimate of probable and estimable losses inherent in the loan and lease portfolio as of the balance sheet date. Losses are charged to the ALLL when recognized. Generally, commercial loans are charged off or charged down at the point at which they are determined to be uncollectible in whole or in part. The amount of the ALLL is established by analyzing the portfolio at least quarterly, and the provisions for loan losses is adjusted so that the ALLL is at an appropriate level at the balance sheet date.
The methodologies used to estimate the ALLL depend upon the impairment status and portfolio segment of the loan. For the commercial and commercial real estate segments, a comprehensive loan grading system is used to assign loss given default grades to each loan. The credit quality indicators discussed subsequently are based on this grading system. Loss given default grades are based on both financial and statistical models and loan officers’ judgment. Groupings of these grades are created for each loan class and calculate historic loss rates ranging from the previous 36 months.
After applying historic loss experience, as described above, we review the quantitatively derived level of ALLL for each segment using qualitative criteria. We track various risk factors that influence our judgment regarding the level of the ALLL across the portfolio segments. Primary qualitative factors that may be reflected in our quantitative models include:
132
STEEL PARTNERS HOLDINGS L.P.
Notes to Consolidated Financial Statements
(in thousands except per unit data)
Notes to Consolidated Financial Statements
(in thousands except per unit data)
• Asset quality trends
• Risk management and loan administration practices
• Risk identification practices
• Effect of changes in the nature and volume of the portfolio
• Existence and effect of any portfolio concentrations
• National economic and business conditions
• Regional and local economic and business conditions
• Data availability and applicability
We review changes in these factors to ensure that changes in the level of the ALLL are consistent with changes in these factors. The magnitude of the impact of each of these factors on our qualitative assessment of the ALLL changes from quarter to quarter according to the extent these factors are already reflected in historic loss rates and according to the extent these factors diverge from one another. We also consider the uncertainty inherent in the estimation process when evaluating the ALLL.
Changes in the allowance for loan and lease losses are summarized as follows:
|
Real Estate
|
||||||||||||||||||||||||
|
Construction
|
Commercial - Owner Occupied
|
Commercial - Other
|
Commercial & Industrial
|
Unallocated
|
Total
|
|||||||||||||||||||
|
Beginning balance - December 31, 2010
|
$ | 200 | $ | 294 | $ | 8 | $ | 565 | $ | 474 | $ | 1,541 | ||||||||||||
|
Charge-offs
|
(440 | ) | (422 | ) | - | (727 | ) | - | (1,589 | ) | ||||||||||||||
|
Recoveries
|
466 | 27 | 44 | 32 | - | 569 | ||||||||||||||||||
|
Provision
|
(226 | ) | 448 | (6 | ) | 266 | (474 | ) | 8 | |||||||||||||||
|
Ending Balance - December 31, 2011
|
$ | - | $ | 347 | $ | 46 | $ | 136 | $ | - | $ | 529 | ||||||||||||
133
STEEL PARTNERS HOLDINGS L.P.
Notes to Consolidated Financial Statements
(in thousands except per unit data)
Notes to Consolidated Financial Statements
(in thousands except per unit data)
The ALLL and outstanding loan balances according to the Company’s impairment method are summarized as follows at December 31, 2011:
|
Real Estate
|
||||||||||||||||||||
|
Construction
|
Commercial - Owner Occupied
|
Commercial - Other
|
Commercial & Industrial
|
Total
|
||||||||||||||||
|
Allowance for loan losses:
|
||||||||||||||||||||
|
Individually evaluated for impairment
|
$ | - | $ | 25 | $ | - | $ | - | $ | 25 | ||||||||||
|
Collectively evaluated for impairment
|
- | 321 | 47 | 136 | 504 | |||||||||||||||
|
Total
|
$ | - | $ | 346 | $ | 47 | $ | 136 | $ | 529 | ||||||||||
|
Outstanding Loan balances:
|
||||||||||||||||||||
|
Individually evaluated for impairment (1)
|
$ | - | $ | 3,568 | $ | - | $ | 221 | $ | 3,789 | ||||||||||
|
Collectively evaluated for impairment
|
- | 4,772 | 300 | 4,123 | 9,195 | |||||||||||||||
|
Total
|
$ | - | $ | 8,340 | $ | 300 | $ | 4,344 | $ | 12,984 | ||||||||||
(1) $2,354 is guaranteed by the USDA or SBA.
Nonaccrual and Past Due Loans
Loans are generally placed on nonaccrual status when payment in full of principal and interest is not expected, or the loan is 90 days or more past due as to principal or interest, unless the loan is both well secured and in the process of collection.
A nonaccrual loan may be returned to accrual status when all delinquent interest and principal become current in accordance with the terms of the loan agreement; and the loan, if secured, is well secured; the borrower has paid according to the contractual terms for a minimum of six months; and analysis of the borrower indicates a reasonable assurance of the ability to maintain payments. Payments received on nonaccrual loans are applied as a reduction to the principal outstanding.
Closed-end loans with payments scheduled monthly are reported as past due when the borrower is in arrears for two or more monthly payments. Similarly, open-end credit such as charge-card plans and other revolving credit plans are reported as past due when the minimum payment has not been made for two or more billing cycles. Other multipayment obligations (i.e., quarterly, semiannual, etc.), single payment, and demand notes are reported as past due when either principal or interest is due and unpaid for a period of 30 days or more.
Nonaccrual loans are summarized as follows:
|
December 31,
|
||||||||
|
2011
|
2010
|
|||||||
|
Real Estate Loans:
|
||||||||
|
Construction
|
$ | - | $ | 988 | ||||
|
Commercial - Owner Occupied
|
914 | 207 | ||||||
|
Commercial - Other
|
- | - | ||||||
|
Total Real Estate Loans
|
914 | 1,195 | ||||||
|
Commercial and Industrial
|
97 | 419 | ||||||
|
Total Loans
|
$ | 1,011 | $ | 1,614 | ||||
134
STEEL PARTNERS HOLDINGS L.P.
Notes to Consolidated Financial Statements
(in thousands except per unit data)
Notes to Consolidated Financial Statements
(in thousands except per unit data)
Past due loans (accruing and nonaccruing) are summarized as follows at December 31, 2011:
|
|
Current
|
30-89 days
past due
|
90+ days
past due
|
Total
past due (2)
|
Total
loans
|
Recorded
investment
in accruing
loans 90+
days past due
|
Nonaccrual
loans
that are
current (1)
|
|||||||||||||||||||||
|
Real Estate Loans:
|
||||||||||||||||||||||||||||
|
Construction
|
$ | - | $ | - | $ | - | $ | - | $ | - | $ | - | $ | - | ||||||||||||||
|
Commercial - Owner Occupied
|
5,263 | 2,275 | 802 | 3,077 | 8,340 | - | - | |||||||||||||||||||||
|
Commercial - Other
|
300 | - | - | - | 300 | - | - | |||||||||||||||||||||
|
Total Real Estate Loans
|
5,563 | 2,275 | 802 | 3,077 | 8,640 | - | - | |||||||||||||||||||||
|
Commercial and Industrial
|
4,247 | - | 97 | 97 | 4,344 | - | - | |||||||||||||||||||||
|
Total Loans
|
$ | 9,810 | $ | 2,275 | $ | 899 | $ | 3,174 | $ | 12,984 | $ | - | $ | - | ||||||||||||||
(1) Represents nonaccrual loans that are not past due more than 30 days; however, full payment of principal and interest is still not expected.
(2) $2,354 is guaranteed by the USDA or SBA.
In addition to the past due and nonaccrual criteria, we also analyze loans using a loan grading system. We generally assign internal grades to loans based on financial/statistical models and loan officer judgment. The Company reviews and grades all loans with unpaid principal balances of $100 or more once per year. Grades follow our definitions of Pass, Special Mention, Substandard, and Doubtful. The definitions of Pass, Special Mention, Substandard, and Doubtful are summarized as follows:
|
|
·
|
Pass
: A Pass asset is a higher quality asset and does not fit any of the other categories described below. The likelihood of loss is considered remote.
|
|
|
·
|
Special Mention
:
A receivable in this category has a specific weakness or problem but does not currently present a significant risk of loss or default as to any material term of the loan or financing agreement.
|
|
|
·
|
Substandard
: A substandard receivable has a developing or currently minor weakness or weaknesses that could result in loss or default if deficiencies are not corrected or adverse conditions arise.
|
|
|
·
|
Doubtful
: A doubtful receivable has an existing weakness or weaknesses that have developed into a serious risk of significant loss or default with regard to a material term of the financing agreement.
|
Outstanding loan balances (accruing and nonaccruing) categorized by these credit quality indicators are summarized as follows at December 31, 2011:
|
Pass
|
Special
Mention
|
Sub-
standard (1)
|
Doubtful
|
Total loans
|
||||||||||||||||
|
Real Estate Loans:
|
||||||||||||||||||||
|
Construction
|
$ | - | $ | - | $ | - | $ | - | $ | - | ||||||||||
|
Commercial - Owner Occupied
|
4,628 | 144 | 3,568 | - | 8,340 | |||||||||||||||
|
Commercial - Other
|
300 | - | - | - | 300 | |||||||||||||||
|
Total Real Estate Loans
|
4,928 | 144 | 3,568 | - | 8,640 | |||||||||||||||
|
Commercial and Industrial
|
4,123 | - | 221 | - | 4,344 | |||||||||||||||
|
Total Loans
|
$ | 9,051 | $ | 144 | $ | 3,789 | $ | - | $ | 12,984 | ||||||||||
(1) $2,354 is guaranteed by the USDA or SBA.
135
STEEL PARTNERS HOLDINGS L.P.
Notes to Consolidated Financial Statements
(in thousands except per unit data)
Notes to Consolidated Financial Statements
(in thousands except per unit data)
Impaired Loans
Loans are considered impaired when, based on current information and events, it is probable that the Bank will be unable to collect all amounts due according to the contractual terms of the loan agreement, including scheduled interest payments. When loans are impaired, we estimate the amount of the balance that is impaired and assign a specific reserve to the loan based on the estimated present value of the loan’s future cash flows discounted at the loan’s effective interest rate, the observable market price of the loan, or the fair value of the loan’s underlying collateral less the cost to sell. When we base the impairment amount on the fair value of the loan’s underlying collateral, we generally charge off the portion of the balance that is impaired, such that these loans do not have a specific reserve in the ALLL. Payments received on impaired loans that are accruing are recognized in interest income, according to the contractual loan agreement. Payments received on impaired loans that are on nonaccrual are not recognized in interest income, but are applied as a reduction to the principal outstanding. Payments are recognized when cash is received.
Information on impaired loans is summarized as follows at December 31, 2011:
|
|
Unpaid
|
Recorded investment
|
Total
|
Average
|
||||||||||||||||||||
|
principle
balance
|
with no
allowance
|
with
allowance
|
recorded
investment (1)
|
Related
Allowance
|
recorded
investment
|
|||||||||||||||||||
|
Real Estate Loans:
|
||||||||||||||||||||||||
|
Construction
|
$ | - | $ | - | $ | - | $ | - | $ | - | $ | 476 | ||||||||||||
|
Commercial - Owner Occupied
|
3,897 | 2,806 | 762 | 3,568 | 25 | 1,804 | ||||||||||||||||||
|
Commercial - Other
|
- | - | - | - | - | - | ||||||||||||||||||
|
Total Real Estate Loans
|
3,897 | 2,806 | 762 | 3,568 | 25 | 2,280 | ||||||||||||||||||
|
Commercial and Industrial
|
608 | 221 | - | 221 | 626 | |||||||||||||||||||
|
Total Loans
|
$ | 4,505 | $ | 3,027 | $ | 762 | $ | 3,789 | $ | 25 | $ | 2,906 | ||||||||||||
(1) $2,354 is guaranteed by the USDA or SBA.
10.
INVENTORIES
A summary of inventories is as follows:
|
December 31,
|
||||||||
|
2011
|
2010
|
|||||||
|
Finished products
|
$ | 20,527 | $ | 18,718 | ||||
|
In - Process
|
8,775 | 8,110 | ||||||
|
Raw materials
|
19,577 | 16,389 | ||||||
|
Fine and Fabricated precious metals in various stages of completion
|
8,658 | 12,151 | ||||||
| $ | 57,537 | $ | 55,368 | |||||
|
Inventory reserve
|
(3,761 | ) | (4,546 | ) | ||||
|
Total inventories
|
$ | 53,776 | $ | 50,822 | ||||
Fine and Fabricated Precious Metal Inventory
In order to produce certain of its products, HNH purchases, maintains and utilizes precious metal inventory. HNH records its precious metal inventory at LIFO cost, subject to lower of cost or market with any adjustments recorded through cost of goods sold. The market value of the precious metal inventory exceeded LIFO cost by $2,614 and $4,546 as of December 31, 2011 and 2010, respectively. The Company recorded favorable non-cash LIFO liquidation gains of $1,436 and $200 in 2011 and 2010, respectively.
136
STEEL PARTNERS HOLDINGS L.P.
Notes to Consolidated Financial Statements
(in thousands except per unit data)
Notes to Consolidated Financial Statements
(in thousands except per unit data)
Certain customers and suppliers of HNH choose to do business on a “toll” basis, and furnish precious metal to HNH for return in fabricated form (“customer metal”) or for purchase from or return to the supplier. When the customer metal is returned in fabricated form, the customer is charged a fabrication charge. The value of this customer metal is not included in the Company’s balance sheet. As of December 31, 2011, HNH’s customer metal consisted of 240,568 ounces of silver, 609 ounces of gold, and 1,396 ounces of palladium. As of December 31, 2010, HNH’s customer metal consisted of 166,637 ounces of silver, 557 ounces of gold, and 1,396 ounces of palladium.
|
Supplemental inventory information:
|
December 31, 2011
|
December 31, 2010
|
||||||
|
Precious metals stated at LIFO cost
|
$ | 6,044 | $ | 7,605 | ||||
|
Market value per ounce:
|
||||||||
|
Silver
|
$ | 27.95 | $ | 30.92 | ||||
|
Gold
|
$ | 1,565.80 | $ | 1,421.07 | ||||
|
Palladium
|
$ | 655.40 | $ | 797.00 | ||||
11.
PROPERTY, PLANT AND EQUIPMENT, NET
A summary of property, plant and equipment, net is as follows:
|
December 31,
|
||||||||
|
2011
|
2010
|
|||||||
|
Land
|
$ | 8,257 | $ | 8,117 | ||||
|
Buildings and Improvements
|
38,143 | 25,778 | ||||||
|
Machinery, equipment and other
|
95,602 | 65,527 | ||||||
|
Construction in progress
|
10,589 | 1,709 | ||||||
| 152,591 | 101,131 | |||||||
|
Accumulated depreciation and amortization
|
(24,749 | ) | (9,506 | ) | ||||
|
Net property and equipment
|
$ | 127,842 | $ | 91,625 | ||||
Depreciation expense was $15,321, $9,581, $26, and $25 for the years ended December 31, 2011, 2010, and for the periods from January 1, 2009 to July 15, 2009 and from July 16, 2009 to December 31, 2009, respectively.
12.
GOODWILL AND OTHER INTANGIBLES
Goodwill represents the excess of the purchase price over the fair value of identifiable net assets acquired in business acquisitions. Goodwill is reviewed for impairment in accordance with GAAP. The Company uses judgment in assessing whether assets may have become impaired by the occurrence of a significant change in circumstances, such as continuing adverse business conditions or legal factors; an adverse action or assessment by a regulator; unanticipated competition; loss of key personnel; the likelihood that a reporting unit or significant portion of a reporting unit will be sold or otherwise disposed of; or results of testing for recoverability of a significant asset group within a reporting unit.
The Company reviews its long-lived assets for impairment whenever events or changes in circumstances indicate that the carrying amount of an asset may not be recoverable. Recoverability of assets held and used is measured by a comparison of the carrying amount of the asset to future undiscounted net cash flows expected to be generated by the asset. If such assets are considered to be impaired, the impairment to be recognized is measured by the amount by which the carrying amount of the assets exceeds the fair value of the assets. Assets to be disposed of are reported at the lower of their carrying amount or fair value less cost to sell.
137
STEEL PARTNERS HOLDINGS L.P.
Notes to Consolidated Financial Statements
(in thousands except per unit data)
Notes to Consolidated Financial Statements
(in thousands except per unit data)
For other intangible assets with indefinite lives, impairment occurs when the carrying amount of an asset is greater than its fair value. A charge is recorded for the difference between the carrying amount and the estimated fair value. The Company’s estimates of fair value are based primarily on a discounted cash flow approach that requires significant management judgment with respect to future revenue and expense growth rates, changes in working capital use, inflation and the selection of an appropriate discount rate.
Intangible assets with finite lives are amortized over their estimated useful lives. Trademarks with indefinite lives as of December 31, 2011 and 2010 were $13,010 and $9,620, respectively, and are included in intangible assets. Intangible assets are reviewed for impairment if events or changes in circumstances indicate that the Company may not recover the carrying amount of an asset.
A reconciliation of the change in the gross carrying amount of goodwill is as follows:
|
Year Ended December 31,
|
||||||||
|
2011
|
2010
|
|||||||
|
Balance at beginning of year
|
$ | 16,212 | $ | 81 | ||||
|
Acquisition of HNH
|
- | 16,131 | ||||||
|
Acquisition of SWH
|
24,836 | - | ||||||
|
Acquisition of Tiger Claw
|
1,753 | - | ||||||
|
Other
|
(4 | ) | - | |||||
|
Balance at end of year
|
$ | 42,797 | $ | 16,212 | ||||
Goodwill includes $81 at both December 31, 2011 and 2010 related to a February 1, 2006 acquisition of a 7% minority interest in WebBank, whereby SPH gained 100% ownership of WebBank.
Intangible assets other than goodwill is summarized as follows:
|
December 31, 2011
|
December 31, 2010
|
|||||||||||||||
|
Gross Carrying
|
Accumulated
|
Gross Carrying
|
Accumulated
|
|||||||||||||
|
Amount
|
Amortization
|
Amount
|
Amortization
|
|||||||||||||
|
Customer Relationships
|
$ | 96,810 | $ | 8,959 | $ | 88,790 | $ | 3,321 | ||||||||
|
Trademarks
|
26,390 | 1,078 | 20,140 | 414 | ||||||||||||
|
Patents
|
21,432 | 2,868 | 20,119 | 1,098 | ||||||||||||
|
Other Intangibles
|
4,631 | 1,017 | 880 | 555 | ||||||||||||
| $ | 149,263 | $ | 13,922 | $ | 129,929 | $ | 5,388 | |||||||||
For information regarding the goodwill and intangible assets arising from the acquisitions of HNH, SWH and Tiger Claw, see Note 3 - “
Acquisitions
”. Amortization expense recognized in the consolidated statements of operations for the year ended December 31, 2011 and 2010 was $8,662 and $4,658, respectively. The estimated amortization expense for each of the five succeeding years and thereafter is as follows:
138
STEEL PARTNERS HOLDINGS L.P.
Notes to Consolidated Financial Statements
(in thousands except per unit data)
Notes to Consolidated Financial Statements
(in thousands except per unit data)
|
Products and
|
||||||||||||||||||||
|
Customer
|
Patents and
|
|||||||||||||||||||
|
Relationships
|
Trademarks
|
Technology
|
Other
|
Total
|
||||||||||||||||
|
2012
|
$ | 5,727 | $ | 664 | $ | 1,769 | $ | 402 | $ | 8,562 | ||||||||||
|
2013
|
5,727 | 664 | 1,769 | 338 | 8,498 | |||||||||||||||
|
2014
|
5,727 | 664 | 1,769 | 332 | 8,492 | |||||||||||||||
|
2015
|
5,727 | 664 | 1,769 | 332 | 8,492 | |||||||||||||||
|
2016
|
5,727 | 664 | 1,769 | 215 | 8,375 | |||||||||||||||
|
Thereafter
|
59,219 | 7,998 | 9,720 | 1,998 | 78,935 | |||||||||||||||
|
Total
|
$ | 87,854 | $ | 11,318 | $ | 18,565 | $ | 3,617 | $ | 121,354 | ||||||||||
13
. BANK DEPOSITS
WebBank has $94,882 and $61,792 of deposits at December 31, 2011 and 2010, respectively. A summary of WebBank deposits is as follows:
|
December 31,
|
||||||||
|
2011
|
2010
|
|||||||
|
Time deposits year of maturity:
|
||||||||
|
2011
|
$ | - | $ | 21,910 | ||||
|
2012
|
28,017 | 20,189 | ||||||
|
2013
|
22,866 | 12,501 | ||||||
|
2014
|
18,514 | - | ||||||
|
2015
|
15,209 | - | ||||||
|
Total time deposits
|
84,606 | 54,600 | ||||||
|
Money market deposits
|
10,276 | 7,192 | ||||||
|
Total deposits
|
$ | 94,882 | $ | 61,792 | ||||
|
Current
|
$ | 38,293 | $ | 29,102 | ||||
|
Long-term
|
56,589 | 32,690 | ||||||
|
Total deposits
|
$ | 94,882 | $ | 61,792 | ||||
|
Time deposit accounts under $100
|
$ | 70,800 | $ | 52,459 | ||||
|
Time deposit accounts $100 and over
|
13,806 | 2,141 | ||||||
|
Total time deposits
|
$ | 84,606 | $ | 54,600 | ||||
14.
RELATED PARTY TRANSACTIONS
Deferred Fee Liability to Related Party
Pursuant to an assignment and assumption agreement effective as of July 15, 2009, SPH assumed from Steel Partners II (Offshore) Ltd. (“SPII Offshore”), an entity previously affiliated with SPII, a liability due WGL Capital Corp. (“WGL”), an affiliate of the Manager, pursuant to a deferred fee agreement (the “Deferred Fee Liability”) in the amount of $51,594 as of July 15, 2009. In exchange for assuming the liability, SPH received consideration of equal value from SPII Offshore comprised of $4,487 in cash and 2,725,533 common units of SPH (valued at $17.28 per common unit as determined in connection with the implementation of the Exchange Transaction) which are held by SPH as treasury units.
139
STEEL PARTNERS HOLDINGS L.P.
Notes to Consolidated Financial Statements
(in thousands except per unit data)
Notes to Consolidated Financial Statements
(in thousands except per unit data)
The Deferred Fee Liability is scheduled to be paid on the distribution dates specified in the assignment and assumption agreement or immediately upon certain termination events as specified in the deferred fee agreement at the option of WGL in cash or SPH common units, or a combination thereof. The deferred fee is a fair value liability and a cash settlement is assumed. The number of SPH common units to be issued in lieu of the cash would be determined by applying a 15% discount to the market price if the SPH shares are publicly traded or to the net asset value per common unit. The maximum number of common units that could be issued in lieu of cash would be 4,049,286 at December 31, 2011 and 3,791,645 at December 31, 2010. The common units issued will be subject to a six month lock-up pursuant to which WGL cannot sell such common units for six months. The amount of the Deferred Fee Liability is indexed to the value of SPH. The amount of the deferred fee liability is indexed to the value of SPH. The Deferred Fee Liability is increased or decreased quarterly by the same percentage as the increase or decrease in the index from July 15, 2009 to each distribution date. The (decrease)/increase in the Deferred Fee Liability was $(6,107) and $6,268 for the years ended December 31, 2011 and 2010, respectively, and $6,992 for the period from July 16, 2009 to December 31, 2009 based on the change in the index and is reported in the consolidated statements of operations as (Decrease) increase in deferred fee liability to related party. For every $1.00 change in the index at December 31, 2011, the Deferred Fee Liability changes by $3,423. The fair value of the Deferred Fee Liability of $58,747 is reported on the consolidated balance sheet of which $58,433 is the amount that would be paid to WGL under the terms of the agreement as of December 31, 2011. Based on the value of the Deferred Fee Liability at December 31, 2011, the Deferred Fee Liability would be paid as follows: 2012 - $1,107; 2013 - $5,005; 2014 - $11,497; 2015 - $7,287; 2016 through 2018 - $33,851.
Under a Management Agreement entered into effective January 1, 2009 and amended as of July 14, 2009 (the “Management Agreement”), the Manager receives a monthly management fee at a rate of 1.5% per annum payable monthly (the “Management Fee”). Until such time as the common units are listed on a national securities exchange, the Management Fee will be calculated based on the sum of the net asset value of the common units and the Deferred Fee Liability as of the last day of the prior calendar month. Thereafter, the Management Fee will be based on the sum of the market capitalization of SPH and the Deferred Fee Liability as of the last day of the prior calendar month. The agreement continues until December 31, 2011 and is automatically renewed annually subject to not less than 180 days notice by SPH of termination prior to the end of each term. SPH will bear (or reimburse the Manager with respect to) all its reasonable costs and expenses of the managed entities, the Manager, SPH GP or their affiliates, including but not limited to: legal, tax, accounting, auditing, consulting, administrative, compliance, investor relations costs related to being a public entity rendered for SPH or SPH GP as well as expenses incurred by the Manager and SPH GP which are reasonably necessary for the performance by the Manager of its duties and functions under the Management Agreement and certain other expenses incurred by managers, officers, employees and agents of the Manager or its affiliates on behalf of SPH. For the year ended December 31, 2011, the Manager earned a Management Fee of $8,119, of which $2,205 remained unpaid and is included in payable to related party at December 31, 2011. For the year ended December 31, 2010, the Manager earned a Management Fee of $7,531, of which $676 remained unpaid and is included in payable to related party at December 31, 2010. From July 16, 2009 through December 31, 2009 the Manager earned a Management Fee of $3,705. No Management Fee was payable from January 1, 2009 through July 15, 2009. The Manager incurred $2,833, $2,209 and $452 of reimbursable expenses during the years end December 31, 2011 and 2010 and the period of July 16, 2009 to December 31, 2009, respectively, in connection with its provision of services under the Management Agreement, of which $1,488 and $1,145 remained unpaid at December 31, 2011 and 2010, respectively, and is included in related party payables.
On November 23, 2011, SPH, SPH Group LLC, a wholly owned subsidiary of SPH, and SPLLC entered into that certain Third Amended and Restated Management Agreement, effective as of January 1, 2012, to, among other things, revise the compensation to be paid to the Manager and to extend the term of the agreement. Effective January 1, 2012, the Manager will receive a quarterly Management Fee at a rate of 1.5% of total partner’s capital, payable on the first day of each quarter and subject to quarterly adjustment. The Management Agreement will continue until December 31, 2012 and will be automatically renewed thereafter for successive one-year terms unless otherwise determined at least 60 days prior to each renewal date by a majority of the independent directors.
On November 23, 2011, SPH entered into that certain Third Amended and Restated Agreement of Limited Partnership of SPH, dated as of July 14, 2009, to, among other things, amend the existing limited partnership agreement to provide for the incentive compensation to be paid to Manager pursuant to the Third Amended and Restated Management Agreement.
140
STEEL PARTNERS HOLDINGS L.P.
Notes to Consolidated Financial Statements
(in thousands except per unit data)
Notes to Consolidated Financial Statements
(in thousands except per unit data)
WGL Capital
Effective as of July 15, 2009, SPH entered into an investor services agreement with WGL, an affiliate of the Manager. Pursuant to the investor services agreement, WGL performs certain investor relations services on SPH’s behalf and SPH pays WGL a fee in an amount of $50 per year (the “Investor Services Fee”). The Management Fee payable to the Manager pursuant to the Management Agreement is offset and reduced on each payment date by the amount of the Investor Services Fee payable to WGL under the investor services agreement. In addition, SPH bears (or reimburses WGL with respect to) all reasonable costs and expenses of SPH, and WGL, or their affiliates relating to the investor relations services performed for SPH, including but not limited to all expenses actually incurred by WGL that are reasonably necessary for the performance by WGL of its duties and functions under the investor services agreement. For the year ended December 31, 2011, WGL earned an Investor Services Fee of $50, of which $12 remained unpaid and is included in payable to related party at December 31, 2011. For the year ended December 31, 2010 WGL earned an Investor Services Fee of $50, of which $4 remained unpaid and is included in payable to related party at December 31, 2010. From July 16, 2009 through December 31, 2009, WGL earned an Investor Services Fee of $23. No Investor Services Fee was payable from January 1, 2009 through July 15, 2009.
HNH Accounting Services
HNH provided certain accounting services to SPH until December 31, 2011. For the year ended December 31, 2011, SPH incurred $1,308 for accounting services of which $154 remained unpaid at December 31, 2011. Expenses for 2011 and unpaid amounts for December 31, 2011 are eliminated in consolidation. For the year ended December 31, 2010, SPH incurred $550 for accounting services (of which $502 is eliminated in consolidation for the period after May 7, 2010), and $494 remained unpaid at December 31, 2010 which is eliminated in consolidation. SPH expensed $91 for accounting services provided by HNH for the period July 16, 2009 to December 31, 2009.
SP Corporate Services Agreements
Pursuant to a services agreement (the “Services Agreement”) with SP Corporate Services, LLC (“SP Corporate”), an affiliate of the Manager, effective as of July 1, 2007, SP Corporate provided SPH with certain management, consulting and advisory services. The Services Agreement is automatically renewable on an annual basis unless terminated by either party on any anniversary date, upon at least 30 days written notice. Effective January 1, 2012, SP Corporate became a wholly owned subsidiary of the Company. See Note 24 – “Subsequent Events” for additional information. In consideration of the services rendered, a fixed annual fee totaling $310 was charged, adjustable annually upon agreement. Effective as of July 15, 2009, the Services Agreement was amended to provide for the provision of accounting, investor relations, compliance and other services related to the operation of SPH. The fee to be paid is agreed upon by the parties from time to time. For the year ended December 31, 2011, SP Corporate earned $1,038, of which $181 remained unpaid and is included in payable to related party at December 31, 2011. For the year ended December 31, 2010, SP Corporate earned $1,768, of which $494 remained unpaid and is included in payable to related party at December 31, 2010. SP Corporate earned $168 and $310 for the period January 1, 2009 to July 15, 2009 and July 16, 2009 to December 31, 2009, respectively.
On January 24, 2011, a special committee of the Board of Directors of HNH, composed entirely of independent directors, approved a management and services fee to be paid to SP Corporate in the amount of $1,950 for services performed in 2010. This fee was the only consideration paid for the services of the five directors who are associated with the Manager for their service on the Board of Directors of HNH and as the Chairman of the Board, the Vice Chairman and Chief Executive Officer, and the Vice President of HNH, as well as other assistance from SP Corporate and its affiliates. The services provided included management and advisory services with respect to operations, strategic planning, finance and accounting, sale and acquisition activities and other aspects of the businesses of HNH. For the year ended December 31, 2011, HNH incurred $1,740 under the management and services fee, which $435 was unpaid and included in payable to related parties at December 31, 2011. For the year ended December 31, 2010, HNH incurred $1,950 under the management and services fee, which was unpaid at December 31, 2010 and included in payable to related parties. Included in selling, general and administrative expenses in the statement of operations is $1,601 for the period from May 7, 2010 (the date of the HNH acquisition) to December 31, 2010.
141
STEEL PARTNERS HOLDINGS L.P.
Notes to Consolidated Financial Statements
(in thousands except per unit data)
Notes to Consolidated Financial Statements
(in thousands except per unit data)
On March 9, 2010, WebBank and SP Corporate entered into a servicing agreement. SP Corporate receives $63 quarterly and provides certain services to WebBank. The agreement is effective January 1, 2010, continues for three years and automatically renews for successive one year terms unless terminated in accordance with the agreement. For the year ended December 31, 2011, WebBank paid SP Corporate fees of $250, and $0 was unpaid and included in payable to related parties at December 31, 2011. For the year ended December 31, 2010, WebBank paid SP Corporate fees of $250, and $0 was unpaid and included in payable to related parties at December 31, 2010. On February 25, 2010, WebBank paid SP Corporate a fee of $250 for the provision of executive services for 2009.
Effective July 1, 2007, BNS contracted with SP Corporate to provide BNS with financial management and administrative services, including the services of a chief financial officer and corporate secretary. Under the terms of an amended and restated services agreement effective as of May 12, 2010, SP Corporate receives $42 monthly for the provision of officers, financial management and administrative services. BNS incurred $1,083 (includes $500 for assistance provided to BNS relating to a financing arrangement) for the period November 1, 2010 through December 31, 2011 (as discussed in Note 1 – “Description of Business and Basis of Presentation”, BNS changed its fiscal year to a calendar year and the year ended December 31, 2011 includes two additional months of statement of operations activity), with $0 unpaid as of December 31, 2011. BNS incurred $385 for the period November 1, 2009 through October 31, 2010 (its fiscal year), with $0 unpaid as of October 31, 2010 included in payable to related parties at December 31, 2010. BNS incurred $129 for the period from July 15, 2009 through October 31, 2009 (its fiscal year end), which is the period for which BNS is consolidated.
SP Corporate and SPLLC have agreements whereby for a fee they provide services to certain companies in which SPH has an interest. Certain officers of the Manager serve as directors of certain companies in which SPH has an interest and for which they receive compensation from those companies. Effective January 1, 2012, SP Corporate and SPLLC became wholly owned subsidiaries of the Company. See Note 24 – “Subsequent Events” for additional information.
SPII Liquidating Trust
On July 15, 2009, in connection with, and prior to, the implementation of the SPII Fund Plan and the SPII Fund Distribution, the SPII Liquidating Trust was established by SPII General Partner acting in its capacity as the liquidating trustee, an unaffiliated party as the Delaware trustee and SPII as the initial beneficiary and grantor. SPII then contributed to the SPII Liquidating Trust assets consisting of (i) $39,235 in cash and (ii) $243,844 in certain restricted or illiquid assets (the “Trust Assets”). Effective July 15, 2009, $159,232 of interests in the SPII Liquidating Trust was distributed to SPII Onshore by SPII as part of the distribution of assets pursuant to the SPII Fund Distribution. The Trust Assets were contributed by SPII to the SPII Liquidating Trust pursuant to an agreement whereby SPH continued to hold the Trust Assets for the benefit of the SPII Liquidating Trust and would act as its nominee until the Trust Assets could be assigned to the SPII Liquidating Trust. Until December 31, 2011, SPLLC was the investment manager of the Trust (the “Investment Manager”). Effective December 31, 2011, SP General Services LLC (“SPGS”), an affiliate of SPLLC, became the Investment Manager. The Liquidating Trustee and SPGS are under common control. The Liquidating Trustee and SPLLC were under common control until December 31, 2011. As of December 31, 2011 and 2010, SPH held no Trust Assets on behalf of the SPII Liquidating Trust.
Investment Operations (SPII) had an investment in SPJSF, a limited partnership which invests in Japanese companies and is co-managed by certain affiliates of the Manager. SPII’s investment in SPJSF was contributed to the SPII Liquidating Trust on July 15, 2009. Investment Operations recognized an unrealized loss of $11,507 on the SPJSF investment for the period January 1 through July 15, 2009. Such unrealized losses are included in the change in unrealized gains, investments for the periods in the consolidated statements of operations under Investment Operations. Effective January 1, 2009, SPII elected to exchange its limited partnership interest in SPJSF for a new series of limited partnership interest which provides for cash distributions to be made from time to time as SPII’s indirect pro rata share of the December 31, 2008 assets of SPJSF are sold over time. Such distributions would be reduced by SPII’s share of any outstanding SPJSF debt, fees or expenses, as applicable. During the period January 1, 2009 through July 15, 2009, SPII received cash distributions of approximately $49,700, and received a distribution-in-kind of securities of approximately $12,300, from SPJSF.
142
STEEL PARTNERS HOLDINGS L.P.
Notes to Consolidated Financial Statements
(in thousands except per unit data)
Notes to Consolidated Financial Statements
(in thousands except per unit data)
Investment Operations (SPII) had an investment in SPCA, which is co-managed by certain affiliates of the Manager. SPII’s investment in SPCA was contributed to the SPII Liquidating Trust on July 15, 2009. Investment Operations recognized an unrealized gain of $11,233 on the SPCA investment for the period January 1 through July 15, 2009. Such unrealized gains are included in the change in unrealized gains, investments for the periods in the consolidated statements of operations under Investment Operations. During the period January 1, 2009 through July 15, 2009, SPII received approximately $14,800 in cash distributions from SPCA.
Investment Operations (SPII) had an investment in SP Acquisition Holdings, Inc. (“SPAH”), a blank check company formed for the purpose of acquiring, through a merger, capital stock exchange, asset acquisition or other similar business combination, one or more businesses or assets (a “Business Combination”) controlled by an affiliate of the Manager. SPII’s investment in SPAH was contributed to the SPII Liquidating Trust on July 15, 2009. Pursuant to an agreement dated March 30, 2007, SPII acquired from SP Acq LLC (“SPAcq”), an affiliate of SPII General Partner, founder’s units of SPAH consisting of 668,988 common shares and 668,988 warrants, for an aggregate consideration of $2. The founder’s units were purchased at the same price and have the same terms as those purchased and retained by SPAcq from SPAH on March 22, 2007, including the same transfer restrictions, an agreement to vote its common shares in the same manner as a majority of the public stockholders of SPAH vote in connection with SPAH shareholder approval of a Business Combination, and to the extent a Business Combination did not occur by October 10, 2009, such common shares would not participate in SPAH’s liquidating distribution to its public shareholders which would render such common shares and warrants worthless. Investment Operations recognized aggregate unrealized losses of $44 for the period January 1 through July 15, 2009. Such unrealized losses are included in the change in unrealized gains, investments for the year in the consolidated statements of operations under Investment Operations. In addition, SPII had entered into an agreement with SPAH, which was assigned to the SPII Liquidating Trust on July 15, 2009, requiring it to purchase 3 million units (each unit consisting of a common share and a warrant) at a price of $10.00 per unit (an aggregate price of $30,000) from SPAH in a private placement that would occur immediately prior to SPAH’s consummation of a Business Combination (“Co-Investment Obligation”) which was assumed by the SPII Liquidating Trust as described above. These private placement units would be identical to, and would be purchased at the same price of, the units sold to the public in SPAH’s initial public offering on October 10, 2007.
As described above, SPH holds interests in the SPII Liquidating Trust, an entity that holds certain investments which it acquired in connection with the Exchange Transaction, which the Manager and its affiliate serve as the manager and liquidating trustee, respectively, without compensation other than reimbursement for out-of-pocket expenses. SPH’s interest in the SPII Liquidating Trust was $42,653 and $62,553 at December 31, 2011 and 2010, respectively, which is included in investments on the consolidated balance sheet.
The SPII Liquidating Trust has an investment in SPJSF and SPCA. From July 15, 2009 through October 10, 2009, the SPII Liquidating Trust had an investment in SPAH, SPH through the SPII Liquidating Trust had an interest in a co-investment obligation to SPAH should a Business Combination have taken place by October 10, 2009, which the SPII Liquidating Trust held sufficient cash to fund such obligation, that was terminated as a Business Combination was not completed, which rendered the investment held by SPII Liquidating Trust in SPAH worthless. SPAH was liquidated and SPII Liquidating Trust, and hence SPH, did not receive a distribution from SPAH upon liquidation. At December 31, 2011, SPH’s interest in the SPII Liquidating Trust related to SPJSF and SPCA was $3,496 and $9,552, respectively. At December 31, 2010, SPH’s interest in the SPII Liquidating Trust related to SPJSF and SPCA was $7,826 and $11,579, respectively. For the year ending December 31, 2011, SPH recorded an unrealized loss of $(4,330) on SPJSF and an unrealized loss of $(2,027) on SPCA. For the year ending December 31, 2010, SPH recorded an unrealized loss of $2,479 on SPJSF and an unrealized loss of $293 on SPCA. During the period July 16, 2009 to December 31, 2009, SPH recorded an unrealized loss of $268 on SPJSF, an unrealized gain of $2,059 on SPCA, a realized gain of $434 on SPCA and a realized loss of $31 on SPAH. SPH has no obligation to make any capital contributions to the SPII Liquidating Trust. On January 6, 2010, SPH received a cash distribution from the SPII Liquidating Trust related to SPCA and SPAH of $962 and $13,221, respectively, which is included in receivables in the consolidated financial statements as of December 31, 2009. The cash distribution from the SPII Liquidating Trust related to SPAH represented SPH’s share of the cash held by the SPII Liquidating Trust to fund its co-investment obligation to SPAH which terminated on October 10, 2009. On March 22, 2011, SPH received a cash distribution from the SPII Liquidating Trust related to SPJSF of $4,156.
143
STEEL PARTNERS HOLDINGS L.P.
Notes to Consolidated Financial Statements
(in thousands except per unit data)
Notes to Consolidated Financial Statements
(in thousands except per unit data)
In connection with the SPII Fund Distribution, certain assets that were deemed distributed to SPII Onshore continued to be held by SPH on behalf of SPII Onshore as its nominee. One asset was held pending its sale by SPH on behalf of SPII Onshore, which was then sold by SPH and the full net proceeds received by SPH were distributed to SPII Onshore on October 6, 2009. SPH held another asset on behalf of SPII Onshore until September 1, 2010 at which time SPH was no longer subject to any regulatory prohibitions with respect to its distribution to SPII Onshore.
On October 6, 2009, SPH distributed $204,403 of cash held by SPII to SPII Onshore with respect to the SPII Fund Distribution that was payable as of July 15, 2009.
Mutual Securities
Pursuant to the Management Agreement, the Manager was responsible for selecting executing brokers. Securities transactions for SPH are allocated to brokers on the basis of reliability and best price and execution. The Manager has selected Mutual Securities as an introducing broker and may direct a substantial portion of the managed entities’ trades to such firm among others. An officer of the Manager and SPH GP is affiliated with Mutual Securities. The Manager only uses Mutual Securities when such use would not compromise the Manager’s obligation to seek best price and execution. SPH has the right to pay commissions to Mutual Securities, which are higher than those that can be obtained elsewhere, provided that the Manager believes that the rates paid are competitive institutional rates. Mutual Securities also served as an introducing broker for SPII’s trades. The Commissions paid by SPH to Mutual securities were approximately $1,105, $1,006 and $900 for the years ended December 31, 2011 and 2010 and the period July 16, 2009 to through December 31, 2009, respectively. The commissions paid by SPII to Mutual Securities were approximately $860 for the period January 1 through July 15, 2009. Such commissions are included in the net realized and unrealized gain (loss) from investment transactions in the consolidated statements of operations under Investment Operations. The portion of the commission paid to Mutual Securities ultimately received by such officer is net of clearing and other charges.
Other
SPH has an arrangement whereby it holds an asset on behalf of a related party in which it has an investment. The asset had a fair value of $47,605 and $59,134 at December 31, 2011 and 2010, respectively. Under the terms of this arrangement, the related party is the sole beneficiary and SPH does not have an economic interest in the asset and SPH has no capital at risk with respect to such asset, other than indirectly through its indirect investment in such related party. For the years ended December 31, 2011 and 2010 and the period July 16, 2009 to December 31, 2009, SPH was indirectly compensated for providing this arrangement by the payment of a fee. For the period January 1, 2009 to July 15, 2009, SPII was indirectly compensated for providing this arrangement by the payment of a fee. The fees were not material.
The Company’s non-management directors receive an annual retainer of $150, of which $75 is paid in cash and $75 is paid in restricted common units of SPH. The restricted units vest over three year period. These directors are also paid fees of $1 for each board committee meeting attended. The chairmen of the Audit Committee, Corporate Governance and Nominating Committee and Compensation Committee are paid an additional fee of $15, $5 and $5 annually, respectively. For the year ended December 31, 2011, non-management directors’ fees expensed were $437, and were unpaid and included in payable to related parties at December 31, 2011. For the year ended December 31, 2010, non-management directors’ fees expensed were $560, and $275 was unpaid and included in payable to related parties at December 31, 2010. For the period July 16, 2009 to December 31, 2009, non-management directors’ fees were $258. During the year ended December 31, 2010, 32,134 common units valued at $543 were issued to non-management directors.
144
STEEL PARTNERS HOLDINGS L.P.
Notes to Consolidated Financial Statements
(in thousands except per unit data)
Notes to Consolidated Financial Statements
(in thousands except per unit data)
On July 14, 2009, SPH acquired for cash 8,415,362 shares of Selectica, Inc. from SPII for $3,353 at the market price on that date. The Company’s investment in Selectica, Inc. is included in Investments at fair value in the consolidated balance sheets.
In June 2010, a subsidiary of WebBank entered into an agreement with NOVT Corporation, a subsidiary of an affiliate of the Manager, to participate in a factoring facility up to $2,000. As of December 31, 2011 and 2010, the participation amount by NOVT was $0 and $2,000, respectively.
SPH has an estimated liability of $116 and $1,143 as of December 31, 2011 and 2010, respectively, included in other current liabilities which, pursuant to the Amended Exchange Agreement, is indemnified by SPII Onshore. As a result, the Company recorded an amount receivable from SPII Onshore reported as Receivable from related party in the Consolidated Balance Sheet.
Debt and capital lease obligations consists of the following:
|
December 31,
|
||||||||
|
2011
|
2010
|
|||||||
|
Short term debt:
|
||||||||
|
First Lien Revolver
|
$ | 23,850 | $ | 42,635 | ||||
|
Foreign
|
318 | 255 | ||||||
|
Total short-term debt
|
24,168 | 42,890 | ||||||
|
Long-term debt - non related party:
|
||||||||
|
First Lien Term Loans
|
36,518 | 20,300 | ||||||
|
Second Lien Term Loans
|
75,000 | 25,000 | ||||||
|
10% Subordinated Notes, net of unamortized discount
|
18,559 | 40,520 | ||||||
|
Other debt - domestic
|
7,034 | 7,286 | ||||||
|
Foreign loan facilities
|
2,000 | 2,750 | ||||||
|
Total debt to non related party
|
139,111 | 95,856 | ||||||
|
Less portion due within one year
|
8,531 | 4,452 | ||||||
|
Long-term debt to non related party
|
130,580 | 91,404 | ||||||
|
Long-term debt - related party:
|
||||||||
|
10% Subordinated Notes, net of unamortized discount
|
375 | 580 | ||||||
|
Total long-term debt
|
130,955 | 91,984 | ||||||
|
Total debt
|
$ | 163,654 | $ | 139,326 | ||||
|
Capital lease facility
|
||||||||
|
Current portion of capital lease
|
$ | 817 | $ | - | ||||
|
Long-term portion of capital lease
|
2,183 | - | ||||||
| $ | 3,000 | $ | - | |||||
The outstanding debt at December 31, 2011 relates to Sun Well, a subsidiary of BNS, HNH and DGT. All of the outstanding debt at December 31, 2010 relates to HNH. The above debt is collateralized by priority liens on all of the assets of the indebted subsidiaries, which approximates $407,761 as of December 31, 2011.
Long term debt and capital lease obligations as of December 31, 2011 matures in each of the next five years as follows:
145
STEEL PARTNERS HOLDINGS L.P.
Notes to Consolidated Financial Statements
(in thousands except per unit data)
Notes to Consolidated Financial Statements
(in thousands except per unit data)
|
Total
|
2012
|
2013
|
2014
|
2015
|
2016
|
Thereafter
|
||||||||||||||||||||||
|
Long-term debt - non - related parties
|
$ | 139,111 | $ | 8,531 | $ | 91,235 | $ | 6,339 | $ | 12,370 | $ | 96 | $ | 20,540 | ||||||||||||||
|
Long term debt - related party
|
375 | - | - | - | - | - | 375 | |||||||||||||||||||||
|
Total
|
$ | 139,486 | $ | 8,531 | $ | 91,235 | $ | 6,339 | $ | 12,370 | $ | 96 | $ | 20,915 | ||||||||||||||
|
Capital lease facility (1)
|
$ | 3,264 | $ | 921 | $ | 906 | $ | 837 | $ | 458 | $ | 142 | ||||||||||||||||
(1) Includes interest to be paid over the term of the leases of $264.
Sun Well Service Bank Loan Agreement
Sun Well, a wholly owned subsidiary of BNS, signed a credit agreement with a bank on June 30, 2011. The agreement includes a term loan of $20,000 and a revolving loan of up to $5,000. The loans are secured by the assets of Sun Well and bear interest at the greater of (a) the bank’s prime rate, (b) the Federal Funds rate plus 1.5%, or (c) the Daily One-Month LIBOR rate plus 1.50% for base rate loans, or Libor plus 3.5%. Both options are subject to leverage ratio adjustments. The term loan is repayable in $1,000 quarterly installments from September 30, 2011 to June 30, 2015. Borrowings under the revolving loan, which are determined based on eligible accounts receivable, mature on June 30, 2015. As of December 31, 2011, $18,000 is outstanding under the term loan of which, $4,000 is current and due within one year. There were no borrowings under the revolving line of credit (which bears interest at 3.875%) during the year ended December 31, 2011.
Under the agreement, Sun Well is subject to certain financial covenants. As of December 31, 2011, the Sun Well is in compliance with all such covenants.
HNH Credit Facilities
Wells Fargo Facility
On October 15, 2010, H&H Group, together with certain of its subsidiaries, entered into an Amended and Restated Loan and Security Agreement (the “Wells Fargo Facility”) with Wells Fargo Bank, National Association (“Wells Fargo”), as administrative agent for the lenders thereunder. The Wells Fargo Facility provides for a $21,000 senior term loan to H&H Group and certain of its Subsidiaries (the “First Lien Term Loan”) and established a revolving credit facility with borrowing availability of up to a maximum aggregate principal amount equal to $110,000 less the outstanding aggregate principal amount of the First Lien Term Loan (such amount, initially $89,000), dependent on the levels of and collateralized by eligible accounts receivable and inventory (the “First Lien Revolver”).
Under the terms of the Wells Fargo Facility, if excess availability falls below $25,000 (a “Cash Dominion Event”), all cash receipts will be swept daily to reduce borrowings outstanding under the credit facility. The Cash Dominion Event will conclude if HNH maintains excess availability in excess of $25,000 for a 30 day period following such an event. A Cash Dominion Event will be deemed permanent if HNH triggers three Cash Dominion Events within a consecutive 12 month period or six events within the term of the Wells Fargo Facility. As of December 31, 2011, H&H Group’s availability under its U.S. revolving credit facilities was $40,400.
The amounts outstanding under the Wells Fargo Facility bear interest at LIBOR plus applicable margins of between 2.25% and 3.50% (3.00% for the term loan and 2.25% for the revolver at December 31, 2011), or at the U.S. base rate (the prime rate) plus 0.25% to 1.50% (1.00% for the term loan and 0.25% for the revolver at December 31, 2011). The applicable margins for the First Lien Revolver and the First Lien Term Loan are dependent on H&H Group’s Quarterly Average Excess Availability for the prior quarter, as that term is defined in the agreement. As of December 31, 2011, the First Lien Term Loan bore interest at a weighted average interest rate of 3.55% and the First Lien Revolver bore interest at a weighted average interest rate of 3.15%. Principal payments of the First Lien Term Loan are due in equal monthly installments of approximately $350. All amounts outstanding under the Wells Fargo Facility are due and payable in full on July 1, 2013.
146
STEEL PARTNERS HOLDINGS L.P.
Notes to Consolidated Financial Statements
(in thousands except per unit data)
Notes to Consolidated Financial Statements
(in thousands except per unit data)
Obligations under the Wells Fargo Facility are collateralized of first priority security interests in and liens upon all present and future assets of H&H Group and substantially all of its subsidiaries.
Ableco Facility
On September 12, 2011, H&H Group refinanced the Ableco Facility to increase the size of the total term loan thereunder from $25,000 to up to $75,000 and to amend certain covenants. The Ableco Facility now provides for three separate Second Lien Term Loans at a maximum value of $25,000 per Second Lien Term Loan. The first and second Second Lien Term Loans bear interest at the U.S. base rate (the prime rate) plus 4.5% or LIBOR (or, if greater, 1.50%) plus 6.00%. The third Second Lien Term Loan bears interest at the U.S. base rate (the prime rate) plus 7.50% or LIBOR (or, if greater, 1.75%) plus 9.00%. In September, an additional $50,000 was borrowed under the Ableco Facility, making the outstanding total of the Second Lien Term Loans $75,000. All amounts outstanding under the Ableco Facility are due and payable in full on July 1, 2013.
Obligations under the Ableco Facility are collateralized by second priority security interests in and liens upon all present and future assets of H&H Group and substantially all of its subsidiaries.
Covenants
The Wells Fargo Facility and the Ableco Facility each has a cross-default provision. If H&H Group is deemed in default of one agreement, then it is in default of the other.
The Wells Fargo Facility and the Ableco Facility both contain covenants requiring minimum Trailing Twelve Months (“TTM”) Earnings before Interest, Taxes, Depreciation and Amortization (“EBITDA”) of $45,000. H&H Group is required to maintain TTM EBITDA of $45,000 under the Wells Fargo Facility until it is paid in full. As of June 30, 2012, the covenant under the Ableco Facility adjusts to $49,000 TTM EBITDA.
The Wells Fargo Facility and the Ableco Facility each contain a minimum TTM Fixed Charge Coverage Ratio of 1:1 which requires that Fixed Charges, as defined in the agreements, are at least equal to TTM EBITDA at the measurement date.
The Ableco Facility contains a maximum TTM Senior Leverage Ratio covenant which represents the ratio of senior debt to TTM EBITDA. The ratio declines by 5/100ths each quarter: December 2010, 2.95; March 2011, 2.90; June 2011, 2.85; September 2011, 2.80; December 2011, 2.75 and March 2012, 2.70. H&H Group is required to maintain a maximum TTM Senior Leverage Ratio covenant following the Ableco Facility schedule until such time as the Ableco Facility is paid in full.
The Wells Fargo Facility and the Ableco Facility each allow a maximum of $23,000 for capital expenditures over the preceding four quarter period.
HNH is in compliance with all of the debt covenants at December 31, 2011.
Subordinated Notes and Warrants
In addition, on October 15, 2010, H&H Group refinanced the prior indebtedness of H&H and Bairnco to the SPII Liquidating Series Trusts (Series A and Series E) (the “Steel Trusts”), each constituting a separate series of the SPII Liquidating Trust as successor-in-interest to SPII. In accordance with the terms of an Exchange Agreement entered into on October 15, 2010 by and among H&H Group, certain of its subsidiaries and the Steel Trusts (the “Exchange Agreement”), H&H Group made an approximately $6,000 cash payment in partial satisfaction of prior indebtedness to the Steel Trusts and exchanged the remainder of such prior obligations for units consisting of (a) $72,925 aggregate principal amount of 10% subordinated secured notes due 2017 (the “Subordinated Notes”) issued by H&H Group pursuant to an Indenture, dated as of October 15, 2010 (the “Indenture”), by and among H&H Group, the Guarantors party thereto and Wells Fargo, as trustee, and (b) warrants, exercisable beginning October 15, 2013, to purchase an aggregate of 1,500,806 shares of HNH’s common stock, with an exercise price of $11.00 per share (the “Warrants”). The Subordinated Notes and Warrants may not be transferred separately until October 15, 2013.
147
STEEL PARTNERS HOLDINGS L.P.
Notes to Consolidated Financial Statements
(in thousands except per unit data)
Notes to Consolidated Financial Statements
(in thousands except per unit data)
All obligations outstanding under the Subordinated Notes bear interest at a rate of 10% per annum, 6% of which is payable in cash and 4% of which is payable in-kind. The Subordinated Notes, together with any accrued and unpaid interest thereon, mature on October 15, 2017. All amounts owed under the Subordinated Notes are guaranteed by substantially all of H&H Group’s subsidiaries and are secured by substantially all of their assets. The Subordinated Notes are contractually subordinated in right of payment to the Wells Fargo Facility and the Ableco Facility. The Subordinated Notes are redeemable until October 14, 2013, at H&H Group’s option, upon payment of 100% of the principal amount of the Notes, plus all accrued and unpaid interest thereon and the applicable premium set forth in the Indenture (the “Applicable Redemption Price”). If H&H Group or its subsidiary guarantors undergo certain types of fundamental changes prior to the maturity date of the Subordinated Notes, holders thereof will, subject to certain exceptions, have the right, at their option, to require H&H Group to purchase for cash any or all of their Subordinated Notes at the Applicable Redemption Price.
The Subordinated Notes have embedded call premiums and warrants associated with them, as described above. HNH has treated the fair value of these features together as both a discount and a derivative liability at inception of the loan agreement, valued at $4,700. The discount is being amortized over the life of the notes as an adjustment to interest expense, and the derivative liability is marked to market at each balance sheet date.
The Subordinated Notes contain customary affirmative and negative covenants, certain of which only apply the event that the Wells Fargo Facility and the Ableco Facility and any refinancing indebtednesses with respect thereto are repaid in full, and events of default. HNH is in compliance with all of the debt covenants at December 31, 2011.
In connection with the issuance of the Subordinated Notes and Warrants, HNH and H&H Group also entered into a Registration Rights Agreement dated as of October 15, 2010 (the “Registration Rights Agreement”) with the Steel Trusts. Pursuant to the Registration Rights Agreement, HNH agreed to file with the Securities and Exchange Commission (the “SEC”) and use its reasonable best efforts to cause to become effective a registration statement under the Securities Act of 1933, as amended (the "Securities Act"), with respect to the resale of the Warrants and the shares of common stock of HNH issuable upon exercise of the Warrants. H&H Group also agreed, upon receipt of a request by holders of a majority in aggregate principal amount of the Subordinated Notes, to file with the SEC and use its reasonable best efforts to cause to become effective a registration statement under the Securities Act with respect to the resale of the Subordinated Notes.
A loss on debt extinguishment of $1,200 was recognized in the fourth quarter of 2010 in connection with the October 15, 2010 refinancing of HNH’a credit agreements. The loss on debt extinguishment consists of financing fees paid by HNH in connection with amendments to the extinguished debt.
On October 14, 2011, H&H Group redeemed $25,000 principal amount of its outstanding Subordinated Notes on a pro-rata basis among all holders thereof at a redemption price of 102.8% of the principal amount and accrued but unpaid payment-in-kind-interest thereof, plus accrued and unpaid cash interest. Until October 15, 2013, the Subordinated Notes are not detachable from the Warrants that were issued with the Subordinated Notes as units. Accordingly, a pro rata portion of Warrants were also redeemed on October 14, 2011. After giving effect to the redemption on October 14, 2011, the principal amount of the outstanding Subordinated Notes was approximately $40.6 million. During 2011, HNH redeemed a total of approximately $35,100, principal amount of Subordinated Notes, including the October redemption.
148
STEEL PARTNERS HOLDINGS L.P.
Notes to Consolidated Financial Statements
(in thousands except per unit data)
Notes to Consolidated Financial Statements
(in thousands except per unit data)
Other Debt
A subsidiary of H&H has a mortgage agreement on its facility which is collateralized by the real property. The mortgage balance was $7,000 as of December 31, 2011. The mortgage bore interest at LIBOR plus a margin of 2.7%, or 2.98%, at December 31, 2011. The maturity date is October 8, 2015.
The foreign loans reflect principally a $2,000 borrowing by one of HNH’s Chinese subsidiaries as of December 31, 2011, which is collateralized by a mortgage on its facility. The interest rate on the foreign loan was 5.25% at December 31, 2011.
HNH has approximately $3,800 of irrevocable standby letters of credit outstanding as of December 31, 2011 which are not reflected in the accompanying consolidated financial statements. $2,800 of the letters of credit guarantee various insurance activities and $1,000 are for environmental and other matters. These letters of credit mature at various dates and some have automatic renewal provisions subject to prior notice of cancellation.
Capital Lease
On September 22, 2011, HNH signed a Master Lease Agreement with TD Equipment Finance, Inc. (“TD Equipment”) that allows HNH to finance equipment by adding specific lease schedules for specific pieces of equipment. The equipment is sold to TD Equipment and leased back by HNH pursuant to the terms of the specific lease schedule signed. As of December 31, 2011, HNH has leased equipment for which the present value of the minimum lease payments is $1,300. The lease payments total approximately $400 each year through 2014 plus monthly interest at LIBOR plus 3.25%. At the end of the lease term, HNH has the option to purchase the equipment for $100.00. The equipment under this capital lease is included in Property, Plant and Equipment, and the capital lease obligation is included in current Accrued liabilities and Other long-term liabilities on the consolidated balance sheet as of December 31, 2011.
Interest
The new debt agreements that HNH entered into on October 15, 2010 represented a refinancing of substantially all of its prior indebtedness, principally with its existing lenders or their affiliates. The refinancing was effected through a newly formed, wholly-owned subsidiary of HNH, H&H Group, which is the direct parent of H&H and Bairnco. P
rior to the refinancing, H&H and Bairnco had separate credit arrangements: Interest rates on the refinanced debt are substantially less than those under the prior debt agreements and was the principal reason for a $10,000 reduction in interest expense in 2011 as compared to 2010.
As of December 31, 2011, the revolving and term loans under the Wells Fargo Facility bore interest at rates ranging from 2.82% to 4.25%; and the Ableco Facility bore interest at rates ranging from 7.50% to 10.75%. The Subordinated Notes bore interest at 10.00% as of December 31, 2011. Weighted average interest rates for the years ended December 31, 2011 and 2010 were 6.20% and 11.58%, respectively.
Cash interest paid in 2011 and 2010 was $11,200 and $10,100, respectively.
WebBank Credit Facilities
WebBank has an unsecured line of credit with a correspondent bank of $5,500. The line of credit bears interest at the federal funds rate plus a range of 20 to 30 basis points. In addition, SPH provides a $4,000 line of credit to WebBank, which bears interest at the federal funds rate plus 100 basis points. Interest expense on these lines of credit for the twelve months ended December 31, 2011 and 2010 was $0 for each of the periods.
WebBank has access to the Federal Reserve Bank (“FRB”) Discount Window to provide short-term liquidity if needed. WebBank can borrow from the FRB Discount Window based upon the amount of collateral pledged as security, discounted by the FRB advance rates. The cost to access the Discount Window was 0.75% at December 31, 2011 and 2010. As of December 31, 2011 and 2010, loans with a carrying value of $3,360 and $5,322, respectively, were pledged as security for borrowings under the Discount Window. As of December 31, 2011 and 2010, $2,116 and $3,199, respectively, was available for borrowing from the FRB based on advance rates for the loans pledged. There were no outstanding balances under the FRB Discount Window facility as of December 31, 2011 and 2010.
149
STEEL PARTNERS HOLDINGS L.P.
Notes to Consolidated Financial Statements
(in thousands except per unit data)
Notes to Consolidated Financial Statements
(in thousands except per unit data)
16.
PENSION BENEFIT PLANS
HNH maintains several qualified and non-qualified pension plans and other postretirement benefit plans. The plans are mostly frozen so as a result they cover mostly retirees and various groups of grandfathered employees. HNH’s significant pension, health care benefit and defined contribution plans are discussed below. HNH’s other defined contribution plans are not significant individually or in the aggregate.
Qualified Pension Plans
HNH sponsors a defined benefit pension plan, the WHX Pension Plan, covering many of H&H’s employees and certain employees of H&H’s former subsidiary, Wheeling-Pittsburgh Corporation, or (“WPC”). The WHX Pension Plan was established in May 1998 as a result of the merger of the former H&H plans, which covered substantially all H&H employees, and the WPC plan. The WPC plan, covering most USWA-represented employees of WPC, was created pursuant to a collective bargaining agreement ratified on August 12, 1997. Prior to that date, benefits were provided through a defined contribution plan, the Wheeling-Pittsburgh Steel Corporation Retirement Security Plan (“RSP Plan”). The assets of the RSP Plan were merged into the WPC plan as of December 1, 1997. Under the terms of the WHX Pension Plan, the benefit formula and provisions for the WPC and H&H participants continued as they were designed under each of the respective plans prior to the merger.
The qualified pension benefits under the WHX Pension Plan were frozen as of December 31, 2005 and April 30, 2006 for hourly and salaried non-bargaining participants, respectively, with the exception of a single operating unit. In 2011, the benefits were frozen for the remainder of the participants.
WPC employees ceased to be active participants in the WHX Pension Plan effective July 31, 2003 and as a result such employees no longer accrue benefits under the WHX Pension Plan.
Bairnco Corporation had several pension plans (“Bairnco Plans”), which covered substantially all of its employees. In 2006, Bairnco froze the Bairnco Corporation Retirement Plan and initiated employer contributions to its 401(k) plan. On June 2, 2008, two Bairnco plans (Salaried and Kasco) were merged into the WHX Pension Plan. The remaining plan that has not been merged with the WHX Pension Plan covers certain employees at a facility located in Bear, Delaware (the “Bear Plan”), and the pension benefits under the Bear Plan have been frozen.
Bairnco’s Canadian subsidiary provides retirement benefits for its employees through a defined contribution plan. In addition, HNH’s European subsidiaries provide retirement benefits for employees consistent with local practices. The foreign plans are not significant in the aggregate and therefore are not included in the following disclosures.
Pension benefits are based on years of service and the amount of compensation earned during the participants’ employment. However, as noted above, the qualified pension benefits have been frozen for all participants.
Pension benefits for the WPC bargained participants include both defined benefit and defined contribution features, since the plan includes the account balances from the RSP. The gross benefit, before offsets, is calculated based on years of service and the benefit multiplier under the plan. The net defined benefit pension plan benefit is the gross amount offset for the benefits payable from the RSP and benefits payable by the Pension Benefit Guaranty Corporation (“PBGC”) from previously terminated plans. Individual employee accounts established under the RSP are maintained until retirement. Upon retirement, participants who are eligible for the WHX Pension Plan and maintain RSP account balances will normally receive benefits from the WHX Pension Plan. When these participants become eligible for benefits under the WHX Pension Plan, their vested balances in the RSP Plan becomes assets of the WHX Pension Plan. Aggregate account balances held in trust in individual RSP Plan participants’ accounts totaled $23,000 at December 31, 2010. Such amounts were included on a net basis in the 2010 assets or liabilities of the plan in the table below. Although these RSP assets cannot be used to fund any of the net benefit that is the basis for determining the defined benefit plan’s net benefit obligation at the end of the year, the HNH has included the amount of the RSP accounts at December 31, 2011 of $28,900 on a gross basis as both assets and liabilities of the plan as of December 31, 2011.
150
STEEL PARTNERS HOLDINGS L.P.
Notes to Consolidated Financial Statements
(in thousands except per unit data)
Notes to Consolidated Financial Statements
(in thousands except per unit data)
Certain current and retired employees of H&H are covered by postretirement medical benefit plans which provide benefits for medical expenses and prescription drugs. Contributions from a majority of the participants are required, and for those retirees and spouses, HNH’s payments are capped. The measurement date for plan obligations is December 31. In 2010, benefits were discontinued under one of these postretirement medical plans, and as a result of the discontinuance of these benefits, HNH reduced its postretirement benefits expense by $700 in 2010.
The components of pension income for HNH’s benefit plans included the following:
|
Pension Benefits
|
||||||||
|
(in thousands)
|
2011
|
2010
|
||||||
|
Service cost
|
$ | 218 | $ | 138 | ||||
|
Interest cost
|
22,553 | 15,455 | ||||||
|
Expected return on plan assets
|
(27,246 | ) | (19,315 | ) | ||||
|
Total
|
$ | (4,475 | ) | $ | (3,722 | ) | ||
Actuarial assumptions used to develop the components of defined benefit pension income were as follows:
|
Pension Benefits
|
||||||||
|
2011
|
2010
|
|||||||
|
Discount rates:
|
||||||||
|
WHX Pension Plan
|
4.95 | % | 5.20 | % | ||||
|
Bear Plan
|
5.50 | % | 6.05 | % | ||||
|
Expected return on assets
|
8.00 | % | 8.50 | % | ||||
|
Rate of compensation increase
|
N/A | N/A | ||||||
The measurement date for plan obligations is December 31. The discount rate is the rate at which the plans’ obligations could be effectively settled and is based on high quality bond yields as of the measurement date.
Summarized below is a reconciliation of the funded status for HNH’s qualified defined benefit pension plans:
151
STEEL PARTNERS HOLDINGS L.P.
Notes to Consolidated Financial Statements
(in thousands except per unit data)
Notes to Consolidated Financial Statements
(in thousands except per unit data)
|
Pension Benefits
|
||||||||
|
(in thousands)
|
2011
|
2010
|
||||||
|
Change in benefit obligation:
|
||||||||
|
Benefit obligation at January 1
|
$ | 472,526 | $ | - | ||||
|
May 7, 2010 acquisition of HNH
|
- | 462,975 | ||||||
|
Service cost
|
218 | 138 | ||||||
|
Interest cost
|
22,553 | 15,455 | ||||||
|
Actuarial loss
|
47,186 | 12,080 | ||||||
|
Benefits paid
|
(33,920 | ) | (24,862 | ) | ||||
|
Inclusion of RSP
|
28,914 | - | ||||||
|
Transfers (to) from RSP
|
(4,858 | ) | 6,740 | |||||
|
Benefit obligation at December 31
|
$ | 532,619 | $ | 472,526 | ||||
|
Change in plan assets:
|
||||||||
|
Fair value of plan assets at January 1
|
$ | 359,543 | $ | - | ||||
|
Fair value of plan assets at May 7, 2010
|
- | 353,673 | ||||||
|
Actual returns on plan assets
|
(16,619 | ) | 14,668 | |||||
|
Benefits paid
|
(33,920 | ) | (24,862 | ) | ||||
|
Company contributions
|
15,328 | 6,276 | ||||||
|
Inclusion of RSP
|
28,914 | - | ||||||
|
Transfers (to) from RSP
|
(6,838 | ) | 9,788 | |||||
|
Fair value of plan assets at December 31
|
$ | 346,408 | $ | 359,543 | ||||
|
Funded status
|
$ | (186,211 | ) | $ | (112,983 | ) | ||
|
Accumulated benefit obligation (ABO) for qualified
|
||||||||
|
defined benefit pension plans :
|
||||||||
|
ABO at January 1
|
$ | 472,526 | $ | - | ||||
|
ABO at May 7, 2010
|
- | 462,975 | ||||||
|
ABO at December 31
|
$ | 532,619 | $ | 472,526 | ||||
|
Amounts Recognized in the Statement of Financial Position
|
||||||||
|
Current liability
|
- | - | ||||||
|
Noncurrent liability
|
(186,211 | ) | (112,983 | ) | ||||
|
Total
|
$ | (186,211 | ) | $ | (112,983 | ) | ||
152
STEEL PARTNERS HOLDINGS L.P.
Notes to Consolidated Financial Statements
(in thousands except per unit data)
Notes to Consolidated Financial Statements
(in thousands except per unit data)
The weighted average assumptions used in the valuations at December 31 were as follows:
|
Pension Benefits
|
||||||||
|
2011
|
2010
|
|||||||
|
Discount rates:
|
||||||||
|
WHX Pension Plan
|
4.15 | % | 4.95 | % | ||||
|
Bear Plan
|
4.55 | % | 5.50 | % | ||||
|
Rate of compensation increase
|
N/A | N/A | ||||||
Pretax amounts included in “Accumulated other comprehensive (loss) income” at December 31, 2011 and 2010 were as follows:
|
Pension Benefits
|
||||||||
|
(in thousands)
|
2011
|
2010
|
||||||
|
Net actuarial loss
|
$ | 106,710 | $ | 13,680 | ||||
|
Accumulated other comprehensive loss
|
$ | 106,710 | $ | 13,680 | ||||
The pretax amount of actuarial losses and prior service cost included in “Accumulated other comprehensive (loss) income” at December 31, 2011 that is expected to be recognized in net periodic benefit cost in 2012 is $2,510.
Other changes in plan assets and benefit obligations recognized in “Comprehensive loss” are as follows:
|
Pension Benefits
|
||||||||
|
(in thousands)
|
2011
|
2010
|
||||||
|
Curtailment/Settlement
|
$ | - | $ | - | ||||
|
Current year actuarial loss
|
93,030 | 13,680 | ||||||
|
Total recognized in comprehensive loss
|
$ | 93,030 | $ | 13,680 | ||||
The actuarial losses occurred principally because the investment returns on the assets of the WHX Pension Plan have been lower than the actuarial assumptions.
Benefit obligations were in excess of plan assets for all pension plans at both December 31, 2011 and 2010. The accumulated benefit obligation for all defined benefit pension plans was $532,600 and $472,500 at December 31, 2011 and 2010, respectively. Additional information for plans with accumulated benefit obligations in excess of plan assets:
|
Pension Benefits
|
||||||||
|
(in thousands)
|
2011
|
2010
|
||||||
|
Projected benefit obligation
|
$ | 532,619 | $ | 472,526 | ||||
|
Accumulated benefit obligation
|
532,619 | 472,526 | ||||||
|
Fair value of plan assets
|
346,408 | 359,543 | ||||||
In determining the expected long-term rate of return on assets, HNH evaluated input from various investment professionals. In addition, HNH considered its historical compound returns as well as HNH’s forward-looking expectations for the plan. HNH determines its actuarial assumptions for its pension and postretirement plans on December 31 of each year to calculate liability information as of that date and pension and postretirement expense for the following year. The discount rate assumption is derived from the rate of return on high-quality bonds as of December 31 of each year.
153
STEEL PARTNERS HOLDINGS L.P.
Notes to Consolidated Financial Statements
(in thousands except per unit data)
Notes to Consolidated Financial Statements
(in thousands except per unit data)
HNH’s investment policy is to maximize the total rate of return with a view to long-term funding objectives of the pension plan to ensure that funds are available to meet benefit obligations when due. The three to five year objective of the WHX Pension Plan is to achieve a rate of return that exceeds HNH’s expected earnings rate by 150 basis points at prudent levels of risk. Therefore the pension plan assets are diversified to the extent necessary to minimize risk and to achieve an optimal balance between risk and return. There are no target allocations. The WHX Pension Plan’s assets are diversified as to type of assets, investment strategies employed, and number of investment managers used. Investments may include equities, fixed income, cash equivalents, convertible securities, and private investment funds. Derivatives may be used as part of the investment strategy. HNH may direct the transfer of assets between investment managers in order to rebalance the portfolio in accordance with asset allocation guidelines established by the HNH.
The fair value of pension investments is defined by reference to one of the three following categories: Level 1 inputs are quoted prices in active markets for identical assets or liabilities that HNH has the ability to access at the measurement date. An active market for the asset or liability is a market in which transactions for the asset or liability occur with sufficient frequency and volume to provide pricing information on an ongoing basis. The valuation under this approach does not entail a significant degree of judgment (“Level 1”).
Level 2 inputs are inputs other than quoted prices included within Level 1 that are observable for the asset or liability, either directly or indirectly. Level 2 inputs include: quoted prices for similar assets or liabilities in active markets, inputs other than quoted prices that are observable for the asset or liability, (
e.g.,
interest rates and yield curves observable at commonly quoted intervals or current market) and contractual prices for the underlying financial instrument, as well as other relevant economic measures (“Level 2”).
Level 3 inputs are unobservable inputs for the asset or liability. Unobservable inputs are used to measure fair value to the extent that observable inputs are not available, thereby allowing for situations in which there is little, if any, market activity for the asset or liability at the measurement date (“Level 3”).
154
STEEL PARTNERS HOLDINGS L.P.
Notes to Consolidated Financial Statements
(in thousands except per unit data)
Notes to Consolidated Financial Statements
(in thousands except per unit data)
The WHX/Bear Pension Plan’s assets at December 31, 2011 and 2010, by asset category, are as follows:
|
WHX/Bear Pension Assets
|
||||||||||||||||
|
(in thousands)
|
||||||||||||||||
|
Fair Value Measurements as of December 31, 2011:
|
||||||||||||||||
|
Assets (Liabilities) at Fair Value as of December 31, 2011
|
||||||||||||||||
|
Asset Class
|
Level 1
|
Level 2
|
Level 3
|
Total
|
||||||||||||
|
Equity securities:
|
||||||||||||||||
|
U.S. large cap
|
$ | 13,473 | $ | - | $ | 593 | $ | 14,066 | ||||||||
|
U.S. mid-cap growth
|
38,602 | 2,367 | - | 40,969 | ||||||||||||
|
U.S. small-cap value
|
17,261 | 3 | - | 17,264 | ||||||||||||
|
International large cap value
|
17,121 | - | - | 17,121 | ||||||||||||
|
Emerging markets growth
|
- | 642 | 642 | |||||||||||||
|
Fixed income securities:
|
||||||||||||||||
|
Corporate bonds
|
2,474 | 35,437 | - | 37,911 | ||||||||||||
|
Bank debt
|
- | 839 | - | 839 | ||||||||||||
|
Other types of investments:
|
||||||||||||||||
|
Common trust funds (1)
|
- | 73,887 | - | 73,887 | ||||||||||||
|
Fund of funds (2)
|
- | 37,516 | - | 37,516 | ||||||||||||
|
Insurance contracts (3)
|
- | 8,513 | - | 8,513 | ||||||||||||
| 88,931 | 159,204 | 593 | 248,728 | |||||||||||||
|
Futures contracts, net
|
(56,850 | ) | (12,486 | ) | - | (69,336 | ) | |||||||||
|
Total
|
$ | 32,081 | $ | 146,718 | $ | 593 | 179,392 | |||||||||
|
Cash & cash equivalents
|
167,041 | |||||||||||||||
|
Net payables
|
(25 | ) | ||||||||||||||
|
Total pension assets
|
$ | 346,408 | ||||||||||||||
|
Fair Value Measurements as of December 31, 2010:
|
||||||||||||||||
|
Assets (Liabilities) at Fair Value as of December 31, 2010
|
||||||||||||||||
|
Asset Class
|
Level 1
|
Level 2
|
Level 3
|
Total
|
||||||||||||
|
Equity securities:
|
||||||||||||||||
|
U.S. large cap
|
$ | 20,475 | $ | 257 | $ | - | $ | 20,732 | ||||||||
|
U.S. mid-cap growth
|
37,493 | 902 | - | 38,395 | ||||||||||||
|
U.S. small-cap value
|
5,657 | - | 317 | 5,974 | ||||||||||||
|
International large cap value
|
17,602 | - | - | 17,602 | ||||||||||||
|
Emerging markets growth
|
3,831 | - | - | 3,831 | ||||||||||||
|
Equity contracts
|
608 | - | - | 608 | ||||||||||||
|
Fixed income securities:
|
- | |||||||||||||||
|
Corporate bonds
|
7,831 | 24,927 | 595 | 33,353 | ||||||||||||
|
Bank debt
|
- | 1,464 | - | 1,464 | ||||||||||||
|
Other types of investments:
|
||||||||||||||||
|
Common trust funds (1)
|
- | 97,258 | - | 97,258 | ||||||||||||
|
Fund of funds (2)
|
- | 32,416 | 31,658 | 64,074 | ||||||||||||
|
Insurance contracts (3)
|
- | 753 | 9,268 | 10,021 | ||||||||||||
| 93,497 | 157,977 | 41,838 | 293,312 | |||||||||||||
|
Futures contracts, net
|
(62,655 | ) | (158 | ) | - | (62,813 | ) | |||||||||
|
Total
|
$ | 30,842 | $ | 157,819 | $ | 41,838 | 230,499 | |||||||||
|
Cash & cash equivalents
|
131,248 | |||||||||||||||
|
Net payables
|
(2,204 | ) | ||||||||||||||
|
Total pension assets
|
$ | 359,543 | ||||||||||||||
(1) Common Trust Funds- Common trust funds are comprised of shares or units in commingled funds that are not publicly traded. The underlying assets in these funds are primarily publicly traded equity securities, fixed income securities, and commodity-related securities and are valued at their Net Asset Values (“NAVs”) that are calculated by the investment manager or sponsor of the fund and have daily or monthly liquidity.
155
STEEL PARTNERS HOLDINGS L.P.
Notes to Consolidated Financial Statements
(in thousands except per unit data)
Notes to Consolidated Financial Statements
(in thousands except per unit data)
(2) Fund of funds consist of fund-of-fund LLC or commingled fund structures. The underlying assets in these funds are primarily publicly traded equity securities, fixed income securities, and commodity-related securities. The LLCs are valued based on NAVs calculated by the fund and are not publicly available. In most cases, the liquidity for the LLCs is quarterly with advance notice and is subject to liquidity of the underlying funds. In some cases, there may be extended lock-up periods greater than 90 days or side-pockets for non-liquid assets.
(3) Insurance contracts contain general investments and money market securities. The fair value of insurance contracts is determined based on the cash surrender value which is determined based on such factors as the fair value of the underlying assets and discounted cash flow. These contracts are with a highly-rated insurance company.
HNH’s policy is to recognize transfers in and transfers out of Level 3 as of the date of the event or change in circumstances that caused the transfer.
The fair value measurements of the WHX/Bear Pension Plan assets using significant unobservable inputs (Level 3) changed during 2011 due to the following:
156
STEEL PARTNERS HOLDINGS L.P.
Notes to Consolidated Financial Statements
(in thousands except per unit data)
Notes to Consolidated Financial Statements
(in thousands except per unit data)
|
Changes in Fair Value Measurements Using Significant Unobservable Inputs (Level 3)
|
||||||||||||||||
|
Year Ended December 31, 2011
|
Fixed income securities
|
Fund of funds
|
Insurance contracts
|
U.S. Small Cap Value
|
||||||||||||
|
Beginning balance as of January 1, 2011
|
$ | 595 | $ | 31,658 | $ | 9,268 | $ | 317 | ||||||||
|
Transfers into Level 3 (a)
|
39 | - | - | 21 | ||||||||||||
|
Transfers out of Level 3 (b)
|
- | (31,542 | ) | (9,268 | ) | - | ||||||||||
|
Gains or losses included in changes in net assets
|
(41 | ) | (116 | ) | - | - | ||||||||||
|
Purchases, issuances, sales and settlements
|
- | |||||||||||||||
|
Purchases
|
- | - | - | 113 | ||||||||||||
|
Issuances
|
- | - | - | - | ||||||||||||
|
Sales
|
- | - | - | (451 | ) | |||||||||||
|
Settlements
|
- | - | - | - | ||||||||||||
|
Ending balance as of December 31, 2011
|
$ | 593 | $ | - | $ | - | $ | - | ||||||||
|
Net unrealized gains (losses) included in the changes in net assets, attributable to investments still held at the reporting date
|
$ | (41 | ) | $ | (116 | ) | $ | - | $ | - | ||||||
|
Year Ended December 31, 2010
|
Fixed income securities
|
Fund of funds
|
Insurance contracts
|
U.S. Small Cap Value
|
||||||||||||
|
Beginning balance as of January 1, 2010
|
$ | 124 | $ | 27,594 | $ | 9,361 | $ | - | ||||||||
|
Transfers into Level 3 (a)
|
- | - | - | 317 | ||||||||||||
|
Transfers out of Level 3 (b)
|
- | (229 | ) | - | - | |||||||||||
|
Gains or losses included in changes in net assets
|
471 | 4,293 | 1,115 | - | ||||||||||||
|
Purchases, issuances, sales and settlements
|
||||||||||||||||
|
Purchases
|
- | - | 9,008 | - | ||||||||||||
|
Issuances
|
- | - | - | - | ||||||||||||
|
Sales
|
- | - | - | - | ||||||||||||
|
Settlements
|
- | - | (10,216 | ) | - | |||||||||||
|
Ending balance as of December 31, 2010
|
$ | 595 | $ | 31,658 | $ | 9,268 | $ | 317 | ||||||||
|
Net unrealized gains (losses) included in the changes in net assets, attributable to investments still held at the reporting date
|
$ | 471 | $ | 4,293 | $ | 1,115 | $ | - | ||||||||
|
|
a)
|
Transferred from Level 2 to Level 3 because of lack of observable market data due to decreases in market activity for these securities.
|
|
|
b)
|
Transfers from Level 3 to Level 2 upon expiration of the restrictions.
|
The following table presents the category, fair value, redemption frequency, and redemption notice period for those assets whose fair value is estimated using the NAV per share (or its equivalents) as of December 31, 2011.
157
STEEL PARTNERS HOLDINGS L.P.
Notes to Consolidated Financial Statements
(in thousands except per unit data)
Notes to Consolidated Financial Statements
(in thousands except per unit data)
2011 Fair Value Estimated using NAV per Share (or its equivalent)
|
Class Name
|
Description
|
Fair Value December 31, 2011
|
Fair Value December 31, 2010
|
Redemption frequency
|
Redemption Notice Period
|
||||||
|
(in thousands)
|
|||||||||||
|
Fund of funds
|
Long Short Equity Fund
|
$ | 3,951 | $ | 4,488 |
Quarterly
|
45 day notice
|
||||
|
Fund of funds
|
Credit long short hedge fund
|
$ | - | $ | 31,087 |
2 year lock
|
90 day notice
|
||||
|
Fund of funds
|
Multi strategy hedge funds
|
$ | - | $ | 362 |
Quarterly
|
45 day notice
|
||||
|
Fund of funds
|
Fund of fund composites - side pocket
|
$ | - | $ | 571 |
None
|
Not determinable
|
||||
|
Fund of funds
|
Fund of fund composites
|
$ | 29,954 | $ | 27,566 |
Quarterly
|
45 day notice
|
||||
|
Common trust funds
|
Event driven hedge funds
|
$ | 58,683 | $ | 97,258 |
Quarterly
|
45 day notice
|
||||
|
Common trust funds
|
Event driven hedge funds
|
$ | 15,204 | $ | - |
Monthly
|
90 day notice
|
||||
HNH’s Pension Plans’ asset allocations at December 31, 2011 and 2010, by asset category, are as follows:
|
WHX/Bear Plans
|
||||||||
|
2011
|
2010
|
|||||||
|
Asset Category
|
||||||||
|
Cash and cash equivalents
|
49 | % | 35 | % | ||||
|
Equity securities
|
6 | % | 7 | % | ||||
|
Fixed income securities
|
11 | % | 10 | % | ||||
|
Insurance contracts
|
2 | % | 3 | % | ||||
|
Common trust funds
|
21 | % | 27 | % | ||||
|
Fund of funds
|
11 | % | 18 | % | ||||
|
Total
|
100 | % | 100 | % | ||||
Contributions
Employer contributions consist of funds paid from employer assets into a qualified pension trust account. HNH’s funding policy is to contribute annually an amount that satisfies the minimum funding standards of ERISA.
HNH expects to have required minimum contributions for the WHX Pension Plan for 2012 and 2013 of $20,000 and $19,400, respectively. Required future contributions are based upon assumptions such as discount rates on future obligations, assumed rates of return on plan assets and legislative changes. Pension costs and required funding obligations will be affected by changes in the factors and assumptions described in the previous sentence, as well as other changes such as any plan termination.
Benefit Payments
Estimated future benefit payments for the benefit plans over the next ten years are as follows (in thousands):
|
Pension
|
||||
|
Years
|
Benefits
|
|||
|
2012
|
$ | 34,858 | ||
|
2013
|
34,946 | |||
|
2014
|
34,918 | |||
|
2015
|
34,799 | |||
|
2016
|
34,645 | |||
|
2017-2021
|
168,021 | |||
158
STEEL PARTNERS HOLDINGS L.P.
Notes to Consolidated Financial Statements
(in thousands except per unit data)
Notes to Consolidated Financial Statements
(in thousands except per unit data)
Non-Qualified Pension Plans
In addition to the aforementioned benefit plans, H&H had a non-qualified pension plan for certain current and retired employees. Such plan adopted an amendment effective January 1, 2006 to freeze benefits under the plan. In 2009, H&H decided to cash out any remaining participants in the plan in 2010, and the final payout of participant balances was made in December 2010.
401(k) Plans
Certain employees participate in a HNH sponsored savings plan which qualifies under Section 401(k) of the Internal Revenue Code. This savings plan allows eligible employees to contribute from 1% to 75% of their income on a pretax basis. HNH presently makes a contribution to match 50% of the first 6% of the employee’s contribution. The charge to expense for HNH’s matching contribution amounted to $2,000 in 2011 and $975 in 2010.
17.
CAPITAL AND COMPREHENSIVE INCOME
Redeemable Partners’ Capital
The net assets received by SPH from SPII in the Exchange Transaction described in Note 3 - “Acquisitions” and Note 21 - “Exchange Transaction” were subject to redemption until July 15, 2009. Accordingly, the net assets of SPII received in the Exchange Transaction represented a redeemable interest in SPH and is therefore presented as “Redeemable Partners’ Capital” in the consolidated statements of changes in capital and comprehensive income (loss) for all periods presented until July 15, 2009. Redeemable Partners’ Capital accordingly only participated in 100% of the economic results of Investment Operations (the net assets of SPII) and did not participate in the economic results of the Pre-Exchange Operations. Net loss attributable to redeemable partners’ capital in the consolidated statements of operations for the period from January 1, 2009 to July 15, 2009 is presented as a reduction of the net loss in determining the net income or loss attributable to common unitholders.
Redeemable Partners’ Capital - Allocation of Net Income (Loss)
Through July 15, 2009, net income attributable to redeemable partners’ capital was allocated among those holding the redeemable interests in proportion to their respective capital accounts.
Common Unit Distributions
In connection with the Exchange Transaction, SPH agreed to distribute to the holders of its common units up to $87,506 (the “Target Distribution”), subject to certain limitations, during the period from July 16, 2009 to April 30, 2011. On April 1, 2010, SPH distributed to its unitholders of record as of March 26, 2010, $54,409 or $1.95 per common unit including $5,307 relating to treasury units. On April 6, 2011, SPH distributed to its unitholders of record as of March 25, 2011, $33,097 or $1.18 per common unit, including $3,228 relating to treasury units. At December 31, 2010, the April 6, 2011 distribution was payable within one year and is reported as current portion of the distribution payable. With the Target Distribution having been met, the Company may, at its option, make future distributions to unitholders, although it currently has no plan to make any future distributions.
159
STEEL PARTNERS HOLDINGS L.P.
Notes to Consolidated Financial Statements
(in thousands except per unit data)
Notes to Consolidated Financial Statements
(in thousands except per unit data)
Common Units Issuances
Effective as of March 21, 2011, SPH issued to its independent directors an aggregate of 7,315 common units at a per unit value of $18.80, which was determined based on the net asset value of SPH common units as of September 30, 2010 and an aggregate of 6,865 common units at a per unit value of $20.03, which was determined based on the net asset value of SPH common units as of December 31, 2010. For the year ended December 31, 2011 each director earned annual equity compensation in the amount of $75,000 in the form of restricted common units of SPH, with one-third of such restricted common units vesting on November 28, 2012, one-third of such restricted common units vesting on November 28, 2013 and one-third of such restricted common units vesting on November 28, 2014. The per unit value of such restricted common units is $13.80, determined based on the fair market value of SPH common units as of November 28, 2011. Total expense for the common units issued was $275.
Effective as of July 10, 2010, SPH issued an aggregate of 32,134 common units to its independent directors. Each independent director may elect to be paid his compensation in cash or have all or a portion paid in that number of common units having a value equal to two times the amount of compensation earned. For the year ended December 31, 2009 and the six months ended June 30, 2010 each independent director has elected to receive this compensation in common units. Such common units had a per unit value of $16.89, which was determined based on the net asset value of SPH common units as of June 30, 2010. Total expense for the common units in 2010 was $543.
As a result of these issuances of common units effective March 21, 2011, pursuant to the management agreement, effective March 21, 2011, the Company granted to the Manager (i) an option to purchase 5,671 common units at an exercise price of $16.89, per common unit, as based on the net asset value of the common units as of June 30, 2010 and the exercise price declined to $15.71 because of the April 6, 2011 distribution to unitholders, (ii) an option to purchase 1,291 common units at an exercise price of $18.80, per common unit, as determined based on the net asset value of the common units as of September 30, 2010 and the exercise price declined to $17.62 because of the April 6, 2011 distribution to unitholders, and (iii) an option to purchase 1,211 common units at an exercise price of $20.03, per common unit, as determined based on the net asset value of the common units as of December 31, 2010 and the exercise price declined to $18.85 because of the April 6, 2011 distribution to unitholders. As a result of the April 6, 2010 distribution to unitholders, the exercise price of the July 14, 2009 Options was adjusted to $28.68.
Common Unit Option Liability
The common unit options expired on December 31, 2011. The total common unit options outstanding at December 31, 2010 were 4,971,361. As of July 14, 2009, the Manager was granted an option to purchase 4,965,690 common units which is equal to 15% of the sum of common units outstanding and the number of notional common units attributable to the Deferred Fee Liability. The options are fully vested, currently exercisable and expire on December 31, 2011. The options have a per common unit exercise price of $31.81, which is subject to adjustment for any cash distributions, any distributions-in-kind and the release of any reserves by Steel Partners II (Onshore) LP (“SPII Onshore”) to its former limited partners. As of December 31, 2010, the exercise price declined to $29.86 because of the April 1, 2010 distribution to unitholders as described above. Moreover, if any issuance of common units, options, convertible securities or any other right to acquire common units of SPH results in an increase in the number of common units outstanding on a fully diluted basis as compared to the number outstanding as of the date of the most recent issuance (or, in the case of the first issuance, since the initial option grant date), the Manager will be issued additional options to purchase a number of common units so that as of the grant date of the additional option, after taking into account the number of outstanding common units on a fully diluted basis and all options granted since the initial option grant date, the Manager holds outstanding options (in the aggregate) to acquire 15% of the sum of outstanding common units on a fully diluted basis and the number of notional common units attributable to the Deferred Fee Liability. Each additional option will be immediately exercisable on the grant date, will have an exercise price per common unit equal to the fair market value of a common unit on the grant date and will otherwise be subject to the same terms as the initial option, unless the Manager otherwise agrees. Under these anti-dilution provisions, on July 10, 2010 the Company was obligated to issue 5,671 options to purchase common units at an exercise price of $16.89, per common unit, as based on the net asset value of the common units as of June 30, 2010 and the exercise price declined to $15.71 because of the April 6, 2011 distribution to unitholders, (ii) an option to purchase 1,291 common units at an exercise price of $18.80, per common unit, as determined based on the net asset value of the common units as of September 30, 2010 and the exercise price declined to $17.62 because of the April 6, 2011 distribution to unitholders, and (iii) an option to purchase 1,211 common units at an exercise price of $20.03, per common unit, as determined based on the net asset value of the common units as of December 31, 2010 and the exercise price declined to $18.85 because of the April 6, 2011 distribution to unitholders.
160
STEEL PARTNERS HOLDINGS L.P.
Notes to Consolidated Financial Statements
(in thousands except per unit data)
Notes to Consolidated Financial Statements
(in thousands except per unit data)
Because of the anti-dilution provisions, in 2010 the options were accounted for as a derivative liability reported in Payable to Related Parties on the consolidated balance sheets at fair value with changes in fair value recognized during the period reported in Selling, General and Administrative expenses in the consolidated statements of operations. The fair value of the options at December 31, 2010 was $1,785. The (decrease) increases in the derivative liability for the years ended December 31, 2011, 2010 and for the period from July 16, 2009 to December 31, 2009 of $(1,785), $693 and $676, respectively, were expensed in the consolidated statement of operations. The fair value was estimated using the Black Scholes option pricing model that used assumptions as of December 31, 2010 for volatility of 36.6%, a term of 1 year and 2 years, a risk free interest rate of .29% and 1.14% based on the U.S. Treasury bill yield, and an expected dividend of 0.0%. The intrinsic value of the options was $0 as of December 31, 2010. The net asset value used in the fair value estimate was
$18.27 at December 31, 2010, and was adjusted for a liquidity discount. Because the SPH common units have not significantly traded internally or in a public or non-public market, there is no practical means of estimating expected volatility. The volatility assumption was based on a calculated diversified industrial company peer group average of historical volatility.
Common Unitholders — Allocation of Net Income (Loss)
For each period presented net (loss) income attributable to common unit holders is allocated to the common unitholders on a pro rata basis based on the number of units held.
Accumulated Other Comprehensive (Loss) Income
The accumulated other comprehensive (loss) income balance represents the following:
|
December 31,
|
||||||||
|
2011
|
2010
|
|||||||
|
Unrealized gain on available-for-sale securities
|
$ | 32,351 | $ | 20,521 | ||||
|
Cumulative translation adjustment
|
(1,649 | ) | 1,852 | |||||
|
Change in net pension and other benefit obligations
|
(42,439 | ) | (14,611 | ) | ||||
| $ | (11,737 | ) | $ | 7,762 | ||||
Accumulated other comprehensive income at December 31, 2011 includes $(1,638) for associated companies accounted for under the equity for unrealized loss on available-for-sale securities. At December 31, 2010, Accumulated other comprehensive income includes amounts for associated companies accounted for under the equity of $(21) for unrealized loss on available-for-sale securities; $1,960 for cumulative translation adjustment; and, $(7,321) for change in net pension and retiree medical liability.
Noncontrolling Interests in Consolidated Entities
Noncontrolling interests in consolidated entities at December 31, 2011 represents the interests held by the noncontrolling shareholders of BNS, HNH and DGT. Noncontrolling interests in consolidated entities at December 31, 2010 represented the interests held by the noncontrolling shareholders of BNS and HNH.
161
STEEL PARTNERS HOLDINGS L.P.
Notes to Consolidated Financial Statements
(in thousands except per unit data)
Notes to Consolidated Financial Statements
(in thousands except per unit data)
18.
NET INCOME (LOSS) PER COMMON UNIT
The following data was used in computing net income (loss) per common unit shown in the consolidated statements of operations:
|
July 16, 2009 to
|
January 1, 2009
|
|||||||||||||||
|
Year ended December 31,
|
December 31,
|
to July 15,
|
||||||||||||||
|
2011
|
2010
|
2009
|
2009
|
|||||||||||||
|
Net income (loss)from continuing
|
||||||||||||||||
|
operations
|
$ | 80,537 | $ | 18,316 | $ | (4,254 | ) | $ | (57,527 | ) | ||||||
|
Net loss (income) attributable to
|
||||||||||||||||
|
redeemable partners' capital
|
- | - | - | 54,064 | ||||||||||||
|
Net (income) loss attributable to
|
||||||||||||||||
|
noncontrolling interests in
|
||||||||||||||||
|
consolidated entities
|
(45,461 | ) | (997 | ) | 114 | - | ||||||||||
|
Net income (loss) from continuing
|
||||||||||||||||
|
operations
|
35,076 | 17,319 | (4,140 | ) | (3,463 | ) | ||||||||||
|
Income from discontinued operations
|
740 | 28,130 | 1,177 | - | ||||||||||||
|
Net income attributable to
|
||||||||||||||||
|
noncontrolling interests
|
(347 | ) | (13,702 | ) | (556 | ) | - | |||||||||
| 393 | 14,428 | 621 | - | |||||||||||||
|
Net income (loss) attributable to common unitholders
|
$ | 35,469 | $ | 31,747 | $ | (3,519 | ) | $ | (3,463 | ) | ||||||
|
Net income (loss) per common unit - basic
|
||||||||||||||||
|
Net income (loss) from continuing operations
|
$ | 1.39 | $ | 0.69 | $ | (0.16 | ) | $ | (1.59 | ) | ||||||
|
Net income from discontinued operations
|
0.02 | 0.57 | 0.02 | - | ||||||||||||
|
Net income (loss) attributable to
|
||||||||||||||||
|
common unitholders
|
$ | 1.41 | $ | 1.26 | $ | (0.14 | ) | $ | (1.59 | ) | ||||||
|
Net income (loss) per common unit - diluted
|
||||||||||||||||
|
Net income (loss) from continuing operations
|
$ | 0.98 | $ | 0.63 | $ | (0.16 | ) | $ | (1.59 | ) | ||||||
|
Net income from discontinued operations
|
0.01 | 0.53 | 0.02 | - | ||||||||||||
|
Net income (loss) attributable to
|
||||||||||||||||
|
common unitholders
|
$ | 0.99 | $ | 1.16 | $ | (0.14 | ) | $ | (1.59 | ) | ||||||
|
Weighted average common units outstanding - basic
|
25,232,985 | 25,234,827 | 25,219,420 | 2,183,366 | ||||||||||||
|
Adjustment for deferred fee liability (a)
|
4,021,933 | - | - | - | ||||||||||||
|
Adjustment for distribution payable (b)
|
414,110 | 2,247,977 | - | - | ||||||||||||
|
Unvested restricted stock
|
554 | - | - | - | ||||||||||||
|
Denominator for net income per common unit - diluted
|
29,669,582 | 27,482,804 | 25,219,420 | 2,183,366 | ||||||||||||
______________
|
(a)
|
Includes common units assuming a common unit settlement of the deferred fee liability as described in Note 14 – “Related Parry Transactions.” As their effect would have been anti-dilutive, equivalent units of 3,655,217 in 2010, and 3,167,650 for the period July 16 to December 31, 2009 have been excluded from the diluted weighted average common units outstanding. There were no common unit equivalents for the period January 1, 2009 to July 15, 2009.
|
|
(b)
|
Includes common units assuming a common unit settlement of the distribution payable. The Target Distribution liability described in Note 17 may be settled in common units. As their effect would have been anti-dilutive, equivalent units of 4,566,638 for the period July 16 to December 31, 2009 have been excluded from the diluted weighted average common units outstanding. There were no common unit equivalents for the period January 1, 2009 to July 15, 2009.
|
162
STEEL PARTNERS HOLDINGS L.P.
Notes to Consolidated Financial Statements
(in thousands except per unit data)
Notes to Consolidated Financial Statements
(in thousands except per unit data)
19.
SEGMENT INFORMATION
SPH’s reportable segments consist of its operating units, Diversified Industrial, Financial Services, Investment Operations and Corporate which are managed separately and offer different products and services. The Diversified Industrial segment consists of HNH, API, DGT, JPS and SLI. HNH is a diversified holding company with strategic businesses encompassing precious metals, tubing, engineered materials, electronic materials, coated materials, and cutting replacement products and services. HNH became a consolidated subsidiary of SPH on May 7, 2010 and its results are consolidated with SPH from that date as described in Note 3 - “Acquisitions”. Through February 18, 2010, the Diversified Industrial segment included BNS, which principally operated Collins, a North American manufacturer of specialty vehicles. Collins was sold on February 18, 2010 and is presented in the consolidated financial statements as a discontinued operation. The Financial Services segment consists of WebBank. The Investment Operations segment consisted of the operations of SPII, an entity of the SPII Fund acquired by SPH in the Exchange Transaction described in Note 21 - “Exchange Transaction”. As described in Note 1 - “Basis of Presentation”, the SPII operations are presented as the Investment Operations segment in the consolidated financial statements on an investment company basis through July 15, 2009. From July 16, 2009, the Investment Operations segment ceased upon the completion of the Exchange Transaction when SPII’s net assets were acquired by and became part of SPH’s business and such assets were no longer managed as an investment fund. Corporate includes Steel Excel and CoSine, which are currently in the business of seeking to acquire one or more business. BNS was included in the Corporate segment through December 31, 2010. Corporate assets primarily consist of investments, including the SPII Liquidating Trust, and cash and cash equivalents, and corporate revenues consist of investment and other income and investment gains and losses. Corporate assets and selling, general and administrative expenses are not allocated to the other segments. Interest expense paid to deposit holders by WebBank is included in the Financial Services segment results and interest expense on debt is included in Diversified Industrial segment results.
Segment information for each of the most recent periods is presented below:
|
Year ended December 31,
|
||||||||||||||||
|
2011
|
2010
|
July 16, 2009 to December 31, 2009
|
January 1, 2009 to July 15, 2009
|
|||||||||||||
|
Revenue:
|
||||||||||||||||
|
Diversified industrial
|
$ | 700,969 | $ | 385,805 | $ | - | $ | - | ||||||||
|
Financial services
|
14,921 | 10,803 | 2,997 | 2,326 | ||||||||||||
|
Investment operations
|
- | - | - | (51,681 | ) | |||||||||||
|
Corporate
|
(3,668 | ) | 28,057 | 11,427 | (101 | ) | ||||||||||
|
Total
|
$ | 712,222 | $ | 424,665 | $ | 14,424 | $ | (49,456 | ) | |||||||
|
Income (loss) from continuing operations before income taxes:
|
||||||||||||||||
|
Diversified industrial
|
$ | 55,545 | $ | 30,523 | $ | (2,141 | ) | $ | - | |||||||
|
Financial services
|
6,165 | 4,381 | (4,380 | ) | (3,809 | ) | ||||||||||
|
Investment operations
|
- | - | - | (54,064 | ) | |||||||||||
|
Corporate
|
(45,138 | ) | (13,931 | ) | 2,324 | (522 | ) | |||||||||
|
Income (loss) from continuing operations before income taxes
|
16,572 | 20,973 | (4,197 | ) | (58,395 | ) | ||||||||||
|
Income tax benefit (provision)
|
63,965 | (2,657 | ) | (57 | ) | 868 | ||||||||||
|
Net income (loss) from continuing operations
|
$ | 80,537 | $ | 18,316 | $ | (4,254 | ) | $ | (57,527 | ) | ||||||
|
Income (loss) from equity method investments:
|
||||||||||||||||
|
Diversified industrial
|
$ | 8,712 | $ | 21,178 | $ | (2,141 | ) | $ | - | |||||||
|
Corporate
|
(38,278 | ) | (14,093 | ) | 6,388 | 63 | ||||||||||
|
Total
|
$ | (29,566 | ) | $ | 7,085 | $ | 4,247 | $ | 63 | |||||||
163
STEEL PARTNERS HOLDINGS L.P.
Notes to Consolidated Financial Statements
(in thousands except per unit data)
Notes to Consolidated Financial Statements
(in thousands except per unit data)
Additional segment information as follows:
|
Year ended December 31, 2011
|
||||||||||||||||
|
Capital
|
Depreciation and
|
December 31, 2011
|
||||||||||||||
|
Interest expense
|
expenditures
|
amortization
|
Goodwill
|
|||||||||||||
|
Diversified industrial
|
$ | 12,423 | $ | 22,242 | $ | 23,891 | $ | 42,716 | ||||||||
|
Financial services
|
941 | 399 | 92 | - | ||||||||||||
|
Corporate
|
631 | - | - | 81 | ||||||||||||
|
Total
|
$ | 13,995 | $ | 22,641 | $ | 23,983 | $ | 42,797 | ||||||||
|
Year ended December 31, 2010
|
||||||||||||||||
|
Capital
|
Depreciation and
|
December 31, 2010
|
||||||||||||||
|
Interest expense
|
expenditures
|
amortization
|
Goodwill
|
|||||||||||||
|
Diversified industrial
|
$ | 12,186 | $ | 7,252 | $ | 13,927 | $ | 16,131 | ||||||||
|
Financial services
|
796 | 44 | 102 | 81 | ||||||||||||
|
Corporate
|
1,163 | - | - | - | ||||||||||||
|
Total
|
$ | 14,145 | $ | 7,296 | $ | 14,029 | $ | 16,212 | ||||||||
|
December 31,
|
||||||||
|
2011
|
2010
|
|||||||
|
Identifiable Assets Employed:
|
||||||||
|
Diversified industrial
|
$ | 631,301 | $ | 431,210 | ||||
|
Financial services
|
126,208 | 84,632 | ||||||
|
Corporate
|
336,947 | 542,717 | ||||||
|
Segment totals
|
1,094,456 | 1,058,559 | ||||||
|
Discontinued operations
|
35,387 | 33,306 | ||||||
|
Total
|
$ | 1,129,843 | $ | 1,091,865 | ||||
The following table presents revenue and long-lived asset information as of and for the year ended December 31, 2011 and 2010. Long-lived assets in 2011 and 2010 consist of property, plant and equipment, plus approximately $7,669 in buildings in 2011 and $12,241 and $2,521, respectively, of land and buildings from previously operating businesses, and other non-operating assets that are included in other non-current assets on the consolidated balance sheets. Revenue for all of 2009 and Long-lived assets as of December 31, 2009 were based in the United States.
|
2011
|
2010
|
|||||||||||||||
|
Revenue
|
Long-lived assets
|
Revenue
|
Long-lived assets
|
|||||||||||||
|
Geographic information:
|
||||||||||||||||
|
United States
|
$ | 638,041 | $ | 113,766 | $ | 380,352 | $ | 88,127 | ||||||||
|
Foreign
|
74,181 | 21,745 | 44,313 | 18,549 | ||||||||||||
|
Total
|
$ | 712,222 | $ | 135,511 | $ | 424,665 | $ | 106,676 | ||||||||
Foreign revenue is based on the country in which the legal subsidiary is domiciled. Neither revenue nor long-lived assets from any single foreign country was material to the consolidated revenues of the Company.
164
STEEL PARTNERS HOLDINGS L.P.
Notes to Consolidated Financial Statements
(in thousands except per unit data)
Notes to Consolidated Financial Statements
(in thousands except per unit data)
20. INCOME
TAXES
Details of the benefit from (provision for) income taxes are follows:
|
Year Ended December 31,
|
||||||||||||||||
|
2011
|
2010
|
July 16, 2009 to December 31, 2009
|
January 1, 2009 to July 15, 2009
|
|||||||||||||
|
Income (loss) from continuing operations before income taxes and equity method income (loss):
|
||||||||||||||||
|
Domestic
|
$ | 37,992 | $ | 9,022 | $ | (10,612 | ) | $ | (51,333 | ) | ||||||
|
Foreign
|
8,146 | 4,866 | 2,168 | (7,125 | ) | |||||||||||
|
Total
|
$ | 46,138 | $ | 13,888 | $ | (8,444 | ) | $ | (58,458 | ) | ||||||
|
Income taxes:
|
||||||||||||||||
|
Current:
|
||||||||||||||||
|
Federal
|
$ | (490 | ) | $ | (225 | ) | $ | - | $ | - | ||||||
|
State
|
(1,550 | ) | (1,361 | ) | - | - | ||||||||||
|
Foreign
|
(1,287 | ) | (1,007 | ) | - | - | ||||||||||
|
Total income taxes, current
|
(3,327 | ) | (2,593 | ) | - | - | ||||||||||
|
Deferred:
|
||||||||||||||||
|
Federal
|
64,786 | (303 | ) | (52 | ) | 791 | ||||||||||
|
State
|
2,877 | 169 | (5 | ) | 77 | |||||||||||
|
Foreign
|
(371 | ) | 70 | - | - | |||||||||||
|
Total income taxes, deferred
|
67,292 | (64 | ) | (57 | ) | 868 | ||||||||||
|
Income tax benefit (provision)
|
$ | 63,965 | $ | (2,657 | ) | $ | (57 | ) | $ | 868 | ||||||
165
STEEL PARTNERS HOLDINGS L.P.
Notes to Consolidated Financial Statements
(in thousands except per unit data)
Notes to Consolidated Financial Statements
(in thousands except per unit data)
The following is a reconciliation of income tax expense computed at the federal statutory rate to the provision for income taxes:
|
Year Ended December 31,
|
||||||||||||||||
|
2011
|
2010
|
July 16, 2009 to December 31, 2009
|
January 1, 2009 to July 15, 2009
|
|||||||||||||
|
Income (loss) from continuing operations before income taxes and equity method income (loss)
|
$ | 46,138 | $ | 13,888 | $ | (8,444 | ) | $ | (58,458 | ) | ||||||
|
Federal income taxes benefit (provision) at statutory rate
|
$ | (16,042 | ) | $ | (4,732 | ) | $ | 2,879 | $ | 19,876 | ||||||
|
Income passed through to common unitholders (a)
|
(663 | ) | 862 | (1,389 | ) | (18,581 | ) | |||||||||
| (16,705 | ) | (3,870 | ) | 1,490 | 1,295 | |||||||||||
|
State income taxes
|
(1,454 | ) | (775 | ) | 144 | 126 | ||||||||||
|
Change in valuation allowance
|
82,731 | 1,711 | (2,105 | ) | (408 | ) | ||||||||||
|
Prior year true-ups
|
(439 | ) | - | 481 | - | |||||||||||
|
Foreign tax rate differences
|
227 | 767 | - | - | ||||||||||||
|
Dividend income
|
(929 | ) | (370 | ) | - | - | ||||||||||
|
Uncertain tax positions
|
(43 | ) | (233 | ) | - | - | ||||||||||
|
Permanent differences and other
|
577 | 113 | (67 | ) | (145 | ) | ||||||||||
|
Income tax benefit (provision)
|
$ | 63,965 | $ | (2,657 | ) | $ | (57 | ) | $ | 868 | ||||||
______________
|
(a)
|
Includes income that is not taxable to SPH and certain of its subsidiaries. Such income is directly taxable to SPH’s common unitholders.
|
Deferred income taxes result from temporary differences in the financial basis and tax basis of assets and liabilities. The amounts shown on the following table represent the tax effect of temporary differences between the consolidated tax return basis of assets and liabilities and the corresponding basis for financial reporting, as well as tax credit and operating loss carryforwards.
|
December 31,
|
||||||||
|
2011
|
2010
|
|||||||
|
Deferred tax assets:
|
||||||||
|
Operating loss carryforwards
|
$ | 94,563 | $ | 78,820 | ||||
|
Capital loss carryforwards
|
- | 2,148 | ||||||
|
Tax credit carryforwards
|
3,009 | 3,545 | ||||||
|
Pension liability and employee benefits
|
66,415 | 43,931 | ||||||
|
Accrued expenses
|
4,015 | 3,999 | ||||||
|
Impairment of long-lived assets
|
2,519 | 3,092 | ||||||
|
Inventories
|
3,817 | 2,957 | ||||||
|
Environmental costs
|
2,489 | 2,301 | ||||||
|
Allowance for doubtful accounts and loan losses
|
197 | 575 | ||||||
|
Allowance for credit losses on off balance sheet credit exposure
|
- | 641 | ||||||
|
Other
|
4,892 | 3,162 | ||||||
|
Total deferred tax assets
|
181,916 | 145,171 | ||||||
|
Valuation allowances
|
(15,536 | ) | (81,846 | ) | ||||
| 166,380 | 63,325 | |||||||
|
Deferred tax liabilities:
|
||||||||
|
Intangible assets
|
(50,998 | ) | (44,243 | ) | ||||
|
Property, plant and equipment
|
(27,501 | ) | (16,798 | ) | ||||
|
Unremitted foreign earnings
|
(8,560 | ) | (1,272 | ) | ||||
|
Other
|
5,111 | |||||||
|
Net deferred tax assets
|
$ | 84,432 | $ | 1,012 | ||||
166
STEEL PARTNERS HOLDINGS L.P.
Notes to Consolidated Financial Statements
(in thousands except per unit data)
Notes to Consolidated Financial Statements
(in thousands except per unit data)
During 2011, the Company changed its judgment about the realizability of its deferred tax assets at certain subsidiaries following an assessment of their domestic operations and of the likelihood that the deferred tax assets will be realized. The Company considered factors such as recent financial results, future operating income of our subsidiaries, expected future taxable income, mix of taxable income, and available carryforward periods. As a result, the Company estimated that it is more likely than not that it will be able to realize the benefit of certain deferred tax assets. However, in certain jurisdictions, the Company does not consider it more likely than not that all of the Company’s state net operating loss carryforwards will be realized in future periods, and have retained a valuation allowance against those. Because the determination of the realizability of deferred tax assets is based upon management’s judgment of future events and uncertainties, the amount of the deferred tax assets realized could be reduced if actual future income or income tax rates are lower than estimated. In accordance with GAAP under ASC 740, the effect of a change in the beginning-of-the-year balance of a valuation allowance that results from a change in circumstances that causes a change in judgment about the realizability of the related deferred tax asset in future years should be included in income from continuing operations in the period of the change.
Accordingly, in 2011, the Company recorded a tax benefit in continuing operations of approximately $83,000 associated with the reversal of its deferred tax valuation allowances primarily relating to NOLs.
On the consolidated balance sheet as of December 31, 2011, the increase in net deferred tax assets compared to December 31, 2010 was principally due to the reversal of the deferred tax valuation allowance, the 2011 net comprehensive loss recognized net of tax in AOCI, and acquisitions made in 2011.
Upon its emergence from bankruptcy in 2005, HNH experienced an ownership change as defined by Section 382 of the Internal Revenue Code upon its emergence from bankruptcy. Section 382 imposes annual limitations on the utilization of net operating carryforwards post-ownership change. HNH believes it qualifies for the bankruptcy exception to the general Section 382 limitations. Under this exception, the annual limitation imposed by Section 382 resulting from an ownership change will not apply; instead the NOLs must be reduced by certain interest expense paid to creditors who became stockholders as a result of the bankruptcy reorganization. Thus, HNH’s U.S. federal NOLs of $183.0 million as of December 31, 2011 include a reduction of $31.0 million ($10.8 million tax-effect).
As of December 31, 2011, HNH has a deferred income tax liability of $2,000 which relates to $4,800 of undistributed earnings of foreign subsidiaries. In addition, there were approximately $10.4 million of undistributed earnings of foreign subsidiaries that are deemed to be permanently reinvested, and thus, no deferred income taxes have been provided on these earnings.
At December 31, 2011, HNH has U.S. federal NOLs of approximately $183,000 (approximately $64,100 tax-effected), as well as certain state NOLs. The U.S. federal NOLs expire between 2018 and 2029. In 2011, $1,641 of NOLs were utilized providing a tax benefit of approximately $574. The reversal of HNH’s deferred tax valuation allowance related to NOLs had an impact of approximately $73,000 on SPHs consolidated tax benefit recorded in 2011.
At December 31, 2011, WebFinancial Holding Corporation has $108 of net operating loss carryforwards that are scheduled to expire beginning in 2026. In 2011, $4,178 of net operating loss carryforwards were utilized providing a tax benefit of $2,016. In addition, the valuation allowance decreased by approximately $1,262. From its inception, WebBank experienced a history of inconsistent earnings which made it “more likely than not” that some portion or all of its deferred tax assets would not be realized. Accordingly, a valuation allowance of approximately $337 has been established for the deferred tax assets related to net operating loss carryforwards and related party accrued interest at December 31, 2011.
At December 31, 2011, BNS has $21,188 of federal net operating loss carryforwards that are scheduled to expire from 2021 to 2028. In 2011, $2,119 of net operating loss carryforwards were utilized providing a tax benefit of $720. During 2011, BNS recorded a tax benefit of approximately $9,400 in continuing operations associated with the reversal of its deferred tax valuation allowance.
167
STEEL PARTNERS HOLDINGS L.P.
Notes to Consolidated Financial Statements
(in thousands except per unit data)
Notes to Consolidated Financial Statements
(in thousands except per unit data)
At December 31, 2011, DGT has $52,331 of federal net operating loss carryforwards that are scheduled to expire from 2020 to 2030. DGT has a deferred income tax liability of $6,577 relating to $19.3 million of undistributed earnings of a foreign subsidiary. Because of the uncertainty of future earnings of DGT, a valuation allowance of $12.2 million has been established for the net operating loss carryforwards and other net deferred tax assets at December 31, 2011.
GAAP provides that the tax effects from an uncertain tax position can be recognized in the financial statements only if the position is more likely than not of being sustained on audit, based on the technical merits of the position. At December 31, 2011, HNH had $2,306 of unrecognized tax benefits, all of which would affect the Company's effective tax rate if recognized. The change in the amount of unrecognized tax benefits for 2010 and 2011 for HNH was as follows:
|
Balance at May 7, 2010
|
$ | 2,111 | ||
|
Additions for tax positions related to current year
|
233 | |||
|
Additions due to interest accrued
|
101 | |||
|
Tax positions of prior years:
|
||||
|
Increases in liabilities, net
|
160 | |||
|
Payments
|
(72 | ) | ||
|
Due to lapsed statute of limitations
|
(267 | ) | ||
|
Balance at December 31, 2010
|
2,266 | |||
|
Additions for tax positions related to current year
|
325 | |||
|
Additions due to interest accrued
|
113 | |||
|
Tax positions of prior years:
|
- | |||
|
Increases in liabilities, net
|
7 | |||
|
Payments
|
(2 | ) | ||
|
Due to lapsed statute of limitations
|
(403 | ) | ||
|
Balance at December 31, 2011
|
$ | 2,306 |
HNH recognizes interest and penalties related to uncertain tax positions in income tax expense. As of December 31, 2011, approximately $305 of interest related to uncertain tax positions was accrued. No penalties were accrued. It is reasonably possible that the total amount of unrecognized tax benefits will decrease by as much as $500 during the next twelve months as a result of the lapse of the applicable statutes of limitations in certain taxing jurisdictions. For federal income tax purposes, the statute of limitations for audit by the IRS is open for years 2008 through 2011. In addition, NOLs generated in prior years are subject to examination and potential adjustment by the IRS upon their utilization in future years’ tax returns.
SPH’s subsidiaries file federal tax returns as well as state, local and foreign tax returns in various jurisdictions. Federal tax returns for all consolidated subsidiaries, including HNH, WebBank, BNS and DGT, remain open and subject to examination by the Internal Revenue Service for all tax years after 2006. In addition, net operating losses generated in prior years are subject to examination and potential adjustment by the Internal Revenue Service upon their utilization in future years' tax returns. State income tax returns for most jurisdictions remain open generally for all tax years after 2006. Certain state income tax returns remain open and subject to examination for tax years after 2003.
Net income taxes (receivable) payable totaled $(460) and $714 as of December 31, 2011 and 2010, respectively.
168
STEEL PARTNERS HOLDINGS L.P.
Notes to Consolidated Financial Statements
(in thousands except per unit data)
Notes to Consolidated Financial Statements
(in thousands except per unit data)
21.
EXCHANGE TRANSACTION
Overview
On December 9, 2008, redemptions from the entities through which investors invested in the net assets held by SPII, SPII Onshore and SPII Offshore (together, the “SPII Fund”), were temporarily suspended. On July 15, 2009, SPII Onshore lifted its temporary suspension of withdrawals and implemented a plan (the “SPII Fund Plan”) resulting in the full redemption of its limited partners, including SPII Offshore, where SPII Fund investors were entitled to receive in payment of their redemption their pro-rata share of SPII’s net cash and a pro-rata share of each other asset held by SPII as of July 15, 2009. Each SPII Fund investor elected whether to receive their redemption proceeds directly or to, in effect, contribute their redemption proceeds to SPH in exchange for SPH common units. On November 23, 2009, SPII Offshore lifted its temporary suspension of redemptions and implemented the SPII Fund Plan with respect to its shareholders, which were all then redeemed in full.
The aspects of the SPII Fund Plan relating to SPH and SPII were implemented through an exchange transaction (the “Exchange Transaction”) as described below. As a result of the implementation of the SPII Fund Plan and the Exchange Transaction as of July 15, 2009: (i) all SPII Fund investors from SPII Onshore (including SPII Offshore, a limited partner of SPII Onshore) were fully redeemed, (ii) $750,399 of assets of SPII were distributed to SPII Onshore to satisfy the redemption of the SPII Fund investors, pay expenses, settle inter-company advances and establish reserves for the SPII Fund, (iii) $454,262 of net assets remained in SPII which were no longer subject to redemption, and (iv) 25,761,587 SPH common units held by SPII Onshore were distributed to the redeeming SPII Fund investors reflecting the interest in the SPII net assets as of July 15, 2009 of those investors which elected to, in effect, contribute their SPII Fund redemption proceeds to SPH in exchange for SPH common units. This is reflected in the consolidated statements of changes in capital and comprehensive income (loss). As part of the full redemption, the SPII Fund also distributed pro rata to all of its investors 1,870,564 SPH common units it held that represented its original interest in SPH, which had been held through SPII prior to the Exchange Transaction.
As a result of the Exchange Transaction, as more fully described below, SPII became a subsidiary of SPH effective January 1, 2009, subject initially to being unwound at the sole option of SPII General Partner until June 30, 2009, and then as amended on June 29, 2009 to being unwound in whole or in part at the sole option of SPII General Partner until August 31, 2009. The January 1, 2009 Exchange Transaction is accounted for as a transaction between SPH and SPII as entities under common control. These results in SPII being included on a historical basis in the consolidated results of operations of SPH, as Investment Operations, for all periods presented; and no gain or loss was recognized in connection with the Exchange Transaction. The July 15, 2009 transactions that constituted the partial unwinding of the Exchange Transaction, as part of the implementation of the SPII Fund Plan, were transactions with respect to SPII Onshore as the unitholder of the redeemable partners’ capital of SPH, and therefore are treated as a redemption of capital from SPH as of July 15, 2009. After July 15, 2009 the right to unwind or partially unwind the Exchange Transaction terminated and SPII became a subsidiary of SPH without further conditions. The right of SPII Onshore as a SPH unitholder to redeem capital terminated on July 15, 2009. Accordingly, the net asset value of Investment Operations (SPII) for all periods presented prior to July 16, 2009 is reflected in SPH’s consolidated balance sheets and consolidated statements of changes in capital and comprehensive income (loss) as “Redeemable Partners Capital”.
169
STEEL PARTNERS HOLDINGS L.P.
Notes to Consolidated Financial Statements
(in thousands except per unit data)
Notes to Consolidated Financial Statements
(in thousands except per unit data)
Details of the Exchange Transaction
The Exchange Transaction consisted of a series of transactions which began as of January 1, 2009 and concluded as of July 15, 2009. In connection with the SPII Fund proposing an initial plan to its investors to enable it to lift its temporary suspension of redemptions, effective January 1, 2009, Steel Partners II Master L.P. (“SPII Master”), SPH, SPII General Partner, and Steel Partners LLC (“SPII Investment Manager”) entered into an exchange agreement dated January 1, 2009 (the “Exchange Agreement”). Under the terms of the Exchange Agreement, SPII Master agreed to contribute to SPH its entire ownership interest in SPII in exchange for SPH redeemable common units (“Redeemable Common Units”), resulting in the ownership by SPII Master of approximately 99.5% of the total outstanding Redeemable Common Units and non-redeemable common units of SPH (the “Original Exchange Transaction”). The total number of SPH Redeemable Common Units to be issued to SPII Master pursuant to the Exchange Agreement would be based upon the net asset value of SPII and the book value of SPH as of December 31, 2008. More specifically, SPII Master would receive SPH Redeemable Common Units relative to all SPH Redeemable common units and non-redeemable common units issued and outstanding in the same proportion as the fraction (a) the numerator of which is the net asset value of SPII (less the value of SPII’s interest in SPH) and (b) the denominator of which is the sum of (i) the net asset value of SPII (less the value of SPII’s interests in SPH) and (ii) the book value of SPH (the “Agreed Exchange Ratio”). Under the Exchange Agreement, SPII Master was issued 59,186,007 SPH Redeemable Common Units based on the Agreed Exchange Ratio as applied to the net asset value of SPII and the book value of SPH as of November 30, 2008. Pursuant to the Exchange Agreement, the initial number of SPH Redeemable Common Units of SPH issued to SPII Master were subject to adjustment based on the application of the Agreed Exchange Ratio to the net asset value of SPII and the book value of SPH as of December 31, 2008, by the issuance by SPH of additional SPH Redeemable Common Units to SPII Master or the cancellation by SPH of some of the SPH Redeemable Common Units in accordance with the Agreed Exchange Ratio (the “Adjustment”). As a result of the Adjustment an additional 6,108,812 SPH Redeemable Common Units were issued bringing the total number of Redeemable Common Units issued in the Exchange Transaction as of January 1, 2009 to 65,294,819. In addition, 1,870,564 SPH common units were issued to SPII Master on January 1, 2009 in exchange for an equal number of SPH common units that was held by SPII, which represented SPII Master’s interest in SPH prior to the Exchange Transaction.
Prior to the execution of the Exchange Agreement, SPII owned approximately an 86% equity interest in SPH. Those persons who held the minority interests of SPH prior to January 1, 2009 (the “SPH Minority Holders”) continued to hold the balance of the SPH common units, which represent approximately 0.5% of the SPH Redeemable Common Units and non-redeemable common units issued and outstanding as of January 1, 2009. Pursuant to the Exchange Agreement, SPII General Partner, in its capacity as general partner of SPII Master, had the right in its sole discretion at any time before June 30, 2009, to unwind the transactions contemplated by the Exchange Agreement, such that SPH would be obligated to return the interests in SPII contributed to it by SPII Master, and SPII Master would return the interests in SPH it received (“Unwind”). Thereafter, SPII and the SPH Minority Holders would retain identical interests in SPH as were held prior to January 1, 2009, subject to any SPH Minority Holders who had exercised their appraisal rights pursuant to the merger of WebFinancial with and into SPH, which occurred on December 31, 2008.
Pursuant to the terms of the Exchange Agreement, all fees paid to the SPII Investment Manager and any incentive allocation to the SPII General Partner from January 1, 2009, were to be paid as prescribed by the relevant agreements in effect prior to January 1, 2009, which remained in effect and were paid by SPII through the other SPII Fund entities until such time as the Exchange Agreement was unwound or the right to Unwind terminated. No compensation was to be paid to the SPII Investment Manager in its capacity as the manager of SPH with respect to its management agreement with SPH until such time as the Exchange Agreement was unwound or the right to Unwind terminated.
On June 29, 2009 the Exchange Agreement was amended, and was further amended on October 1, 2009 (together, the “Amended Exchange Agreement”), in order for the SPII Fund to implement the SPII Fund Plan. In conjunction with the amending of the Exchange Agreement SPII Master transferred the SPH Redeemable Common Units and non-redeemable common units it held and its rights and obligations pursuant to the Exchange Agreement and Amended Exchange Agreement to SPII Onshore. The effect of the Amended Exchange Agreement was to, in effect, unwind the Original Exchange Transaction and establish, in effect, an exchange transaction to be implemented effective as of the date that the SPII Fund Plan was to be implemented (the “New Exchange Transaction”). The Amended Exchange Agreement provided that SPII General Partner in its capacity as the general partner of SPII Onshore had the right in its sole discretion at any time before August 31, 2009 the right to Unwind or implement a Partial Unwind (as defined below) in order to implement the New Exchange Transaction. More specifically, the Amended Exchange Agreement gave SPII General Partner in its capacity as the general partner of SPII Onshore the ability to notify SPH of the effective date of implementing the New Exchange Transaction and the dollar amount of the related partial unwind and identify (i) the cash portion and (ii) which of the other assets of SPII that were to be distributed to SPII Onshore, and the outstanding loans or advances between SPII to the SPII Master, the SPII Onshore and SPII Offshore to be settled, and the amounts thereof, the value of which shall be determined as of the date of the partial unwind shall occur (the “Partial Unwind”). In connection with the Partial Unwind SPII Onshore would surrender, and SPH would cancel, certain of the SPH Redeemable Common Units held by SPII Onshore. The number of SPH Redeemable Common Units to be surrendered as a result of the Partial Unwind would be the difference between (a) the number of SPH Redeemable Common Units issued pursuant to Original Exchange Transaction and (b) the number of SPH Redeemable Common Units that would have been issued based on the New Exchange Transaction on the date of the Partial Unwind with the net asset value of SPII based on the value on the date of the Partial Unwind following any distributions, redemptions and settlement of any outstanding loans or advances between SPII to the SPII Master, SPII Onshore and SPII Offshore by SPII Onshore as of the date of the Partial Unwind and the book value of SPH based on the value as of as of the close of the last business day of the month immediately preceding the date on which the Partial Unwind would occur. In addition, the Amended Exchange Agreement provided for SPII Onshore to indemnify SPH and SPII with respect to costs and liabilities related to the Exchange Transaction and SPII’s business prior to July 16, 2009.
170
STEEL PARTNERS HOLDINGS L.P.
Notes to Consolidated Financial Statements
(in thousands except per unit data)
Notes to Consolidated Financial Statements
(in thousands except per unit data)
Effective as of July 15, 2009, the New Exchange Transaction was implemented through a Partial Unwind, the right to a further Partial Unwind or Unwind terminated, and SPII became a wholly-owned subsidiary of SPH without further condition. Pursuant to the Partial Unwind (i) SPH distributed $204,403 of cash (paid on October 6, 2009) and $521,150 of other assets from SPII to SPII Onshore (the “SPII Fund Distribution”) to enable it to implement the SPII Fund Plan, (ii) SPH settled $24,846 of advances outstanding from SPII Onshore to SPII, and (iii) and in exchange for (i) and (ii) SPII Onshore surrendered 39,533,232 SPH Redeemable Common Units to SPH, leaving SPII Onshore with 25,761,587 SPH Redeemable Common Units that on July 15, 2009 became non-redeemable common units, representing the net number of SPH common units issued by SPH in connection with the Exchange Transactions, which were distributed to the SPII Fund investors in conjunction with the implementation of the SPII Fund Plan. After implementation of the Partial Unwind, SPH retained $47,144 of cash (after considering the cash payment to SPII Onshore on October 6, 2009) and $407,261 of investments and other assets, representing the pro-rata share of the net cash and a pro-rata share of each asset held by SPII as of July 15, 2009 that certain SPII Fund investors elected to, in effect, contribute to SPH in exchange for SPH common units pursuant to the SPII Fund Plan. Effective July 15, 2009 in connection with the completion of the Exchange Transaction, SPH cancelled the 1,870,564 of its common units that were held by SPII.
22.
REGULATORY MATTERS
SPH
The Company historically has conducted its business so as not to be deemed an investment company under the Investment Company Act of 1940, as amended (the “Act”). The Company has filed with the SEC a request for an order under the Act to provide the additional time for the Company to restructure its holdings so as not to be required to register as an investment company under the Act. Under the terms of the requested order, the Company would be required to undertake transactions consistent with certain qualitative tests related to the Company’s assets and/or income and to refrain from trading for short-term speculative purposes. If the order is granted, the Company would be required to meet these tests (or otherwise not be subject to the Act) within one year following the order date. The SEC has not yet provided public notice that it intends to consider the application and there can be no assurance that the requested relief will be granted. If the Company is not able to obtain relief, is unable to bring itself into conformity with the relevant tests within the relief period and is unable to otherwise remain outside of the Act’s registration requirement, the Company would be forced to register as an investment company or seek other alternatives, such as making significant changes to the Company’s business model to avoid investment company registration. Such significant changes could have a material adverse effect on the Company’s performance.
WebBank
WebBank is subject to various regulatory capital requirements administered by federal banking agencies. Failure to meet minimum capital requirements can initiate certain actions by regulators that, if undertaken, could have a direct material effect on WebBank’s financial statements. Under capital adequacy guidelines and the regulatory framework for prompt corrective action, WebBank must meet specific capital guidelines that involve quantitative measures of its assets, liabilities, and certain off-balance sheet items as calculated under regulatory accounting practices. WebBank’s capital amounts and classification are also subject to qualitative judgments by the regulators about components, risk weightings, and other factors.
171
STEEL PARTNERS HOLDINGS L.P.
Notes to Consolidated Financial Statements
(in thousands except per unit data)
Notes to Consolidated Financial Statements
(in thousands except per unit data)
Quantitative measures established by regulation to ensure capital adequacy require WebBank to maintain minimum amounts and ratios of Total and Tier 1 capital (as defined in the regulations) to risk-weighted assets (as defined), and of Tier I capital (as defined) to average quarterly assets (as defined). As of December 31, 2011, WebBank exceeded all the capital adequacy requirements to which it is subject.
As of December 31, 2011, WebBank was categorized as well-capitalized under the regulatory framework for prompt corrective action. There are no conditions or events, since the most recent FDIC notification, which have changed WebBank’s prompt corrective action category. To remain categorized as well-capitalized, WebBank will have to maintain minimum total risk-based, Tier 1 risk-based, and Tier 1 leverage.
23.
COMMITMENTS AND CONTINGENCIES
Operating Lease Commitments
The Company leases certain facilities under non-cancelable operating lease arrangements. Rent expense recognized in the consolidated statement of operations for the years ended December 31, 2011 and 2010 was $6,679 and $5,930, respectively. Rent expense for HNH is included from May 7, 2010. Future minimum operating lease and rental commitments under non-cancelable operating leases for SPH consolidated operations are as follows:
|
Year
|
Amount
|
|||
|
2012
|
$ | 3,995 | ||
|
2013
|
2,687 | |||
|
2014
|
1,868 | |||
|
2015
|
1,383 | |||
|
2016
|
1,276 | |||
|
Thereafter
|
4,025 | |||
|
Total
|
$ | 15,234 | ||
HNH
HNH Environmental Matters
H&H, a subsidiary of HNH, has been working with the Connecticut Department of Environmental Protection (“CTDEP”) with respect to its obligations under a 1989 consent order that applies to a property in Connecticut that H&H sold in 2003 (“Sold Parcel”) and an adjacent parcel (“Adjacent Parcel”) that together with the Sold Parcel comprises the site of a former H&H manufacturing facility. Remediation of all soil conditions on the Sold Parcel was completed on April 6, 2007. H&H performed limited additional work on that site, solely in furtherance of now concluded settlement discussions between H&H and the purchaser of the Sold Parcel. Although no groundwater remediation is currently required, quarterly groundwater monitoring is required for up to two years to prove no groundwater impact to the Sold Parcel. On September 11, 2008, the CTDEP advised H&H that it had approved H&H’s December 28, 2007 Soil Remediation Action Report, as amended, thereby concluding the active remediation of the Sold Parcel. Approximately $29.0 million was expended through December 31, 2009, and the remaining remediation and monitoring costs for the Sold Parcel are expected to approximate $0.3 million. H&H previously received reimbursement of $2.0 million from an insurance company under a cost-cap insurance policy and in January 2010, H&H received $1.034 million, net of attorney’s fees, as the final settlement of H&H’s claim for additional insurance coverage relating to the Sold Parcel. H&H also has been conducting an environmental investigation of the Adjacent Parcel, and will be initiating a more comprehensive field study in 2012 with subsequent evaluation of various options for remediation of the Adjacent Parcel. Since the total remediation costs for the Adjacent Parcel cannot be reasonably estimated at this time, accordingly, there can be no assurance that the resolution of this matter will not be material to the financial position, results of operations and cash flow of H&H or the Company.
172
STEEL PARTNERS HOLDINGS L.P.
Notes to Consolidated Financial Statements
(in thousands except per unit data)
Notes to Consolidated Financial Statements
(in thousands except per unit data)
In 1986, Handy & Harman Electronics Material Corporation (“HHEM”), a subsidiary of H&H, entered into an administrative consent order (the “ACO”) with the New Jersey Department of Environmental Protection (“NJDEP”) with regard to certain property that it purchased in 1984 in New Jersey. The ACO involves investigation and remediation activities to be performed with regard to soil and groundwater contamination. Thereafter, in 1998, HHEM and H&H settled a case brought by the local municipality in regard to this site and also settled with certain of its insurance carriers. HHEM is actively remediating the property and continuing to investigate effective methods for achieving compliance with the ACO. A remedial investigation report was filed with the NJDEP in December 2007. By letter dated December 12, 2008, NJDEP issued its approval with respect to additional investigation and remediation activities discussed in the December 2007 remedial investigation report. HHEM anticipates entering into discussions with NJDEP to address that agency’s potential natural resource damage claims, the ultimate scope and cost of which cannot be estimated at this time. Pursuant to a settlement agreement with the former owner/operator of the site, the responsibility for site investigation and remediation costs, as well as any other costs, as defined in the settlement agreement, related to or arising from environmental contamination on the property (collectively, “Costs”) are contractually allocated 75% to the former owner/operator (with separate guaranties by the two joint venture partners of the former owner/operator for 37.5% each) and 25% jointly to HHEM and H&H after the first $1.0 million. The $1.0 million was paid solely by the former owner/operator. As of December 31, 2011, over and above the $1.0 million, total investigation and remediation costs of approximately $2.0 million and $0.6 million have been expended by the former owner/operator and HHEM, respectively, in accordance with the settlement agreement. Additionally, HHEM is currently being reimbursed indirectly through insurance coverage for a portion of the Costs for which HHEM is responsible. HHEM believes that there is additional excess insurance coverage, which it intends to pursue as necessary. HHEM anticipates that there will be additional remediation expenses to be incurred once a final remediation plan is agreed upon. There is no assurance that the former owner/operator or guarantors will continue to timely reimburse HHEM for expenditures and/or will be financially capable of fulfilling their obligations under the settlement agreement and the guaranties. The additional Costs cannot be reasonably estimated at this time, and accordingly, there can be no assurance that the resolution of this matter will not be material to the financial position, results of operations and cash flow of HHEM or the Company.
Certain subsidiaries of H&H Group have been identified as potentially responsible parties (“PRPs”) under the Comprehensive Environmental Response, Compensation and Liability Act (“CERCLA”) or similar state statutes at sites and are parties to administrative consent orders in connection with certain properties. Those subsidiaries may be subject to joint and several liabilities imposed by CERCLA on PRPs. Due to the technical and regulatory complexity of remedial activities and the difficulties attendant in identifying PRPs and allocating or determining liability among them, the subsidiaries are unable to reasonably estimate the ultimate cost of compliance with such laws.
In August 2006, H&H received a notice letter from the United States Environmental Protection Agency (“EPA”) formally naming H&H as a PRP at a superfund site in Massachusetts (the “Superfund site”). H&H is part of a group of thirteen (13) other PRPs (the “PRP Group”) to work cooperatively regarding remediation of the Superfund site. On June 13, 2008, H&H executed a participation agreement, consent decree and settlement trust that all of the other PRP’s have signed as well. In December 2008, the EPA lodged the consent decree with the United States District Court for the District of Massachusetts and the consent decree was entered on January 27, 2009, after no comments were received during the thirty-day comment period. With the entry and filing of the consent decree, H&H was required to make two payments in 2009: one payment of $182,053 relating to the “true-up” of monies previously expended for remediation and a payment of $308,380 for H&H’s share of the early action items for the remediation project. In addition, on March 11, 2009, HNH executed a financial guaranty of H&H’s obligations in connection with the Superfund site. The PRP Group has both chemical and radiological PRPs. H&H is a chemical PRP; not a radiological PRP. The remediation of radiological contamination at the Superfund site, under the direction of the Department of Energy (“DOE”), has been completed with the exception of the Final Status Survey. Until the Final Status Survey is approved by the EPA, DOE will not turn over and allow access to the Superfund site to the PRPs. It is currently anticipated that the DOE will turn over the Superfund site towards the end of 2012, allowing for mobilization in early 2013. Additional financial contributions will be required by the PRP Group when it obtains access to the Superfund site, which as noted above, is anticipated to be towards the end of 2012. H&H has recorded a significant liability in connection with this matter. There can be no assurance that the resolution of this matter will not be material to the financial position, results of operations and cash flow of H&H or the Company.
173
STEEL PARTNERS HOLDINGS L.P.
Notes to Consolidated Financial Statements
(in thousands except per unit data)
Notes to Consolidated Financial Statements
(in thousands except per unit data)
HHEM is continuing to comply with a 1987 consent order from the Massachusetts Department of Environmental Protection (“MADEP”) to investigate and remediate the soil and groundwater conditions at the MA Property that is the subject of the Arista Development litigation discussed above. On January 20, 2009, HHEM filed with MADEP a partial Class A-3 Response Action Outcome Statement (“RAO-P”) and an Activity & Use Limitation (“AUL”) for the MA Property. By letter dated March 24, 2009, MADEP advised HHEM that the RAO-P did not require a comprehensive audit. By letter dated April 16, 2009, the MADEP advised HHEM that a MADEP AUL Audit Inspection conducted on March 18, 2009 did not identify any violations of the requirements applicable to the AUL. Together, the March 24 and April 16 MADEP letters, combined with HHEM’s Licensed Site Professional’s partial RAO opinion constitute confirmation of the adequacy of the RAO-P and associated AUL. On March 31, 2010, the Massachusetts Attorney General executed a covenant not to sue (“CNTS”) to cover the MA Property. Following the execution of the CNTS, HHEM filed a Remedy Operation Status (“ROS”) on April 1, 2010. On June 30, 2010, HHEM filed a Class A-3 RAO to close the site since HHEM’s Licensed Site Professional concluded that groundwater monitoring demonstrated that the groundwater conditions have stabilized or continue to improve at the site. HHEM received notice on April 13, 2011 that the MADEP initiated a routine audit of the Class A-3 RAO. MADEP subsequently requested clarification of several items and HHEM’s Licensed Site Professional provided a response letter on July 11, 2011. HHEM anticipates resolution of the audit process before the end of 2012. In addition, HHEM has concluded settlement discussions with abutters of the MA Property and entered into settlement agreements with each of them. Therefore, HHEM does not expect that any claims from any additional abutters will be asserted, but there can be no such assurances.
As discussed above, certain subsidiaries of H&H Group have existing and contingent liabilities relating to environmental matters, including capital expenditures, costs of remediation and potential fines and penalties relating to possible violations of national and state environmental laws. Those subsidiaries have substantial remediation expenses on an ongoing basis, although such costs are continually being readjusted based upon the emergence of new techniques and alternative methods. The Company had approximately $6.5 million accrued related to estimated environmental remediation costs as of December 31, 2011. In addition, the Company has insurance coverage available for several of these matters and believes that excess insurance coverage may be available as well.
Based upon information currently available, the H&H Group subsidiaries do not expect their respective environmental costs, including the incurrence of additional fines and penalties, if any, to have a material adverse effect on them or that the resolution of these environmental matters will have a material adverse effect on the financial position, results of operations and cash flows of such subsidiaries or the Company, but there can be no such assurances. The Company anticipates that the H&H Group subsidiaries will pay any such amounts out of their respective working capital, although there is no assurance that they will have sufficient funds to pay them. In the event that the H&H Group subsidiaries are unable to fund their liabilities, claims could be made against their respective parent companies, including H&H Group and/or HNH, for payment of such liabilities.
HNH Litigation Matters
HNH and certain of its subsidiaries are defendants (“Subsidiary Defendants”) in numerous cases pending in a variety of jurisdictions relating to welding emissions. Generally, the factual underpinning of the plaintiffs’ claims is that the use of welding products for their ordinary and intended purposes in the welding process causes emissions of fumes that contain manganese, which is toxic to the human central nervous system. The plaintiffs assert that they were over-exposed to welding fumes emitted by welding products manufactured and supplied by the Subsidiary Defendants and other co-defendants. The Subsidiary Defendants deny any liability and are defending these actions. It is not possible to reasonably estimate the Subsidiary Defendants’ exposure or share, if any, of the liability at this time.
174
STEEL PARTNERS HOLDINGS L.P.
Notes to Consolidated Financial Statements
(in thousands except per unit data)
Notes to Consolidated Financial Statements
(in thousands except per unit data)
In addition to the foregoing cases, there are a number of other product liability, exposure, accident, casualty and other claims against HNH or certain of its subsidiaries in connection with a variety of products sold by such subsidiaries over several years, as well as litigation related to employment matters, contract matters, sales and purchase transactions and general liability claims, many of which arise in the ordinary course of business. It is not possible at this time to reasonably estimate the probability, range or share of any potential liability of the Company or its subsidiaries in any of these matters.
There is insurance coverage available for many of the foregoing actions, which are being litigated in a variety of jurisdictions. To date, HNH and its subsidiaries have not incurred and do not believe they will incur any significant liability with respect to these claims, which they are contesting vigorously in most cases. However, it is possible that the ultimate resolution of such litigation and claims could have a material adverse effect on the Company’s results of operations, financial position and cash flows when they are resolved in future periods.
BNS
BNS Sub Environmental Matters
A subsidiary of BNS (“BNS Sub”) had been notified by the Rhode Island Department of Environmental Management (“RIDEM”) that it was a potentially responsible party (“PRP”) with respect to the Cranston Sanitary Landfill site in Cranston, Rhode Island, a disposal site previously used by BNS Sub in its previous manufacturing businesses. The Company and 29 other PRPs formed a PRP Group and participated in the funding of a site remediation investigation and feasibility study that has now been completed. The closure project began in 2010 and was estimated to take five years to complete.
At December 31, 2010, BNS Sub accrued $220 as its best estimate of its obligation with respect to the Cranston Landfill site. On July 29, 2011, the Remedial Action Consent Decree (the “Consent Decree”) was approved and entered by the U.S. District Court for the District of Rhode Island. Pursuant to the terms of the Consent Decree BNS Sub paid its allocated agreed upon settlement value of $193 with respect to the site on August 16, 2011. As of December 31, 2011, BNS Sub no longer has any continuing obligations pursuant to the terms of the Consent Decree.
On August 12, 2008, BNS Sub was identified by the U.S. Environmental Protection Agency (“EPA”) as an alleged drum reconditioning customer (PRP) of New England Container Corp. (“NECC”). BNS Sub is presently investigating the matter and has joined a group of other alleged NECC drum reconditioning customers. The NECC drum reconditioning PRP’s have incurred and will continue to incur costs in the investigation and each PRP has been assessed a pro-rata fee for its cost share of the assessment. As of December 31, 2011 and 2010, respectively, BNS Sub has accrued $50 as its best estimate of the defense costs with respect to the site.
BNS Litigation Matters
BNS Sub has been named as a defendant in 1020 and 967 alleged asbestos-related toxic-tort claims as of December 31, 2011 and 2011, respectively. The claims were filed over a period beginning 1994 through December 31, 2011. In many cases these claims involved more than 100 defendants. Of the claims filed, 694 and 662 were dismissed, settled or granted summary judgment and closed as of December 31, 2011 and 2010, respectively. There can be no assurance that the number of future claims and the related costs of defense, settlements or judgments will be consistent with the experience to date of existing claims.
175
STEEL PARTNERS HOLDINGS L.P.
Notes to Consolidated Financial Statements
(in thousands except per unit data)
Notes to Consolidated Financial Statements
(in thousands except per unit data)
BNS Sub has insurance policies covering asbestos-related claims for years beginning 1974 through 1988 with estimated aggregate coverage limits of $183 million, with $2.22 million and $2.23 million at December 31, 2011 and 2010, respectively, in estimated remaining self insurance retention (deductible). There is secondary evidence of coverage from 1970 to 1973 although there is no assurance that the insurers will recognize that the coverage was in place. Policies issued for BNS Sub beginning in 1989 contained exclusions related to asbestos. Under certain circumstances, some of the settled claims may be reopened. Also, there may be a significant delay in receipt of notification by BNS Sub of the entry of a dismissal or settlement of a claim or the filing of a new claim. BNS Sub believes it has significant defenses to any liability for toxic-tort claims on the merits. None of these toxic-tort claims have gone to trial and, therefore, there can be no assurance that these defenses will prevail. In addition, there can be no assurance that the number of future claims and the related costs of defense, settlements or judgments will be consistent with the experience to date of existing claims; and, that BNS Sub will not need to increase significantly its estimated liability for the costs to settle these claims to an amount that could have a material effect on the consolidated financial statements.
BNS Sub annually receives retroactive billings or credits from its insurance carriers for any increase or decrease in claims accruals as claims are filed, settled or dismissed, or as estimates of the ultimate settlement and defense costs for the then-existing claims are revised. As of December 31, 2011 and 2010, respectively, BNS Sub has accrued $635 and $669 relating to the open and active claims against BNS Sub. This accrual represents the Company’s best estimate of the likely costs to defend against or settle these claims by BNS Sub beyond the amounts accrued by the insurance carriers and previously funded, through the retroactive billings by BNS Sub. However, there can be no assurance that BNS Sub will not need to take additional charges in connection with the defense, settlement or judgment of these existing claims or that the costs of future claims and the related costs of defense, settlements or judgments will be consistent with the experience to date relating to existing claims
.
24.
SUBSEQUENT EVENTS
SP Corporate
On January 1, 2012, SPH’s indirect wholly owned subsidiary, SP Corporate, entered into a Management Services Agreement (the “Management Services Agreement”) with HNH, effective January 1, 2012. Under the Management Services Agreement, SP Corporate will provide HNH with corporate and executive services including, without limitation, legal, tax, accounting, treasury, consulting, auditing, administration, compliance, environmental health and safety, human resources, marketing, investor relations and other similar services rendered for HNH and its subsidiaries. In addition, SP Corporate will provide HNH with the continued service of two of its representatives who serve as HNH’s Chief Executive Officer and Chief Financial Officer, and certain other employees and corporate services.
In connection with entering into the Management Services Agreement, HNH transferred to SP Corporate approximately 37 employees, as well as certain other assets that had previously been used or held for use by HNH and its subsidiaries in providing the subject services which SP Corporate will now be providing to HNH.
The Management Services Agreement was entered into in connection with the formation of SPH Services, Inc., a new subsidiary of SPH that was created to consolidate the executive and corporate functions of SPH and certain of its affiliates, including SP Corporate and SPLLC, to provide such services to other companies, including, without limitation, HNH. SPH Services, Inc. will operate through its wholly owned subsidiaries, SP Corporate and SPLLC. In addition to its Management Services Agreement with HNH, SP Corporate has management services agreements with other companies, including BNS, CoSine, DGT, NOVT Corporation, Ore Holdings, Inc., Steel Excel and WebBank.
Sale of Villa
On November 3, 2011, DGT completed the “Share Purchase Agreement” with VIV, a limited liability company incorporated under Italian law, pursuant to which DGT has sold all of the shares of its Italian subsidiary, Villa, its medical and dental imaging systems segment, to VIV.
176
STEEL PARTNERS HOLDINGS L.P.
Notes to Consolidated Financial Statements
(in thousands except per unit data)
Notes to Consolidated Financial Statements
(in thousands except per unit data)
In consideration for the sale of the shares of Villa to VIV, DGT received $22,761 in cash of net proceeds and an unsecured subordinated promissory note made by VIV in the amount of €500 (initially valued at $688). The Note has a term of 5 years with interest accruing at a rate of 6% per annum beginning 18 months after issuance. The Note may be prepaid at any time and if prepayment in full occurs during the first 18 months following the date of issuance, the total principal amount will be reduced to €400. Payment of the Note will be subordinated to the repayment of the loan extended to VIV by Banca Intesa to provide financing for the Villa Sale. DGT also repurchased 28,104 shares of common stock from two employees of Villa for $820. DGT also received, as part of the transaction, a dividend of cash held by Villa as of the closing date in the amount of $4,538. SPH’s net gain on the sale of Villa, which will be recorded in SPH’s first quarter of 2012 due to the recording of DGT’s results of operations on a two-month lag, was not material to SPH’s results of operations.
Incentive Compensation
Effective January 1, 2012, the Manager was granted incentive units which entitle the Manager to receive Class B common units of SPH, which Class B common units have the same rights as the common units, except that they may not be sold in the public market until the capital account allocable to such Class B common units is equal to the capital account allocable to the common units. The number of incentive units granted is equal to 100% of the sum of the common units outstanding and the number of notional units used to determine the deferred fee accounts in accordance with the Deferred Fee Agreement, each as of January 1, 2012
.
The Manager shall receive Class B common units, determined as of the last day of each fiscal year of SPH, representing 15% of the increase in equity value during the year. If equity value does not increase the Manager shall not receive Class B common units until there is an increase in equity value at the end of a fiscal year. SPH shall make any adjustment that it determines is equitably required by reason of the raising of new capital, including, without limitation, adding such new capital to the baseline equity value per common unit to the extent that the issue price of the new common units exceeds the baseline equity value per common unit.
If any issuance of common units, options, convertible securities or any other right to acquire common units by us results in an increase in the number of common units outstanding on a fully diluted basis as compared to the number outstanding as of the date of the most recent issuance (or, in the case of the first issuance, since the initial incentive unit grant date), the Manager will be issued additional incentive units so that as of the grant date of the additional incentive units, after taking into account the number of outstanding common units on a fully diluted basis and all incentive units granted since the initial incentive units grant date, the Manager holds outstanding incentive units (in the aggregate) equal to 100% of the sum of the common units outstanding and the number of notional units used to determine the deferred fee accounts in accordance with the Deferred Fee Agreement, on a fully diluted basis. Each additional incentive unit shall otherwise be subject to the same terms as the incentive units, unless the Manager otherwise agrees.
Acquisitions
Subsequent to December 31, 2011, SPH acquired for cash 15,104 additional shares of HNH common stock in the open market for $161 bringing the total shares owned as of March 16, 2012 to 7,029,840, representing 55.6% of the outstanding shares.
Fox & Hound
On March 19, 2012 we invested $10,923 to acquire an indirect interest in Fox & Hound of 10,923,420 shares of common stock of Fox & Hound as part of a recapitalization which involved the issuance by Fox & Hound of new common equity in conjunction with a long-term refinancing of Fox & Hound’s debt. As a result of the transaction, as of March 19, 2012 we have an indirect ownership interest of 43.6% in Fox & Hound. The net effect of the investment and Fox & Hound’s recapitalization, which will be recorded in the first quarter of 2012, is that the value of our indirect investment in F&H through the SPII Liquidating Trust – Series D, which is included in Other investments at fair value – related party on our consolidated balance sheet, will be diluted and reduced by approximately $11,200. We elected the fair value option to account for this new investment in Fox & Hound. The pro forma value of our new indirect investment of 10,923,420 shares is expected to be approximately $32,400 based on the valuation of Fox & Hound as of December 31, 2011. Such amount, subject to change based on any changes in the value of Fox & Hound as of March 31, 2012, will be included in Investments in associated companies on our consolidated balance sheet as of March 31, 2012.
Other
On February 13, 2012, BNS, a consolidated subsidiary of the Company, and Steel Excel Inc., an associated company, announced that they are engaged in preliminary discussions regarding a possible acquisition by Steel Excel Inc. of BNS. Each company’s independent directors are considering the transaction on behalf of its unaffiliated stockholders. At this time it is not known if an agreement between the parties can be reached or, if an agreement is reached, that any such transaction will be completed.
177
STEEL PARTNERS HOLDINGS L.P.
Notes to Consolidated Financial Statements
(in thousands except per unit data)
Notes to Consolidated Financial Statements
(in thousands except per unit data)
25. Quarterly Financial Data (unaudited)
|
Continuing Operations
|
Attributable to Common Unit Holders
|
|||||||||||||||||||||||||||
|
Quarter
|
Revenue
|
Net Income (Loss)
|
Per Common Unit Basic
|
Per Common Unit Diluted
|
Net Income (Loss)
|
Per Common Unit Basic
|
Per Common Unit Diluted
|
|||||||||||||||||||||
|
2011
|
||||||||||||||||||||||||||||
|
First
|
$ | 173,536 | $ | 12,806 | $ | 0.45 | $ | 0.39 | $ | 12,490 | $ | 0.49 | $ | 0.43 | ||||||||||||||
|
Second
|
197,180 | 21,974 | 0.50 | 0.50 | 12,596 | 0.50 | 0.50 | |||||||||||||||||||||
|
Third
|
173,211 | (7,119 | ) | (0.48 | ) | (0.74 | ) | (12,389 | ) | (0.50 | ) | (0.75 | ) | |||||||||||||||
|
Fourth
|
168,295 | 52,876 | 0.92 | 0.83 | 22,772 | 0.92 | 0.81 | |||||||||||||||||||||
| $ | 712,222 | $ | 80,537 | $ | 1.39 | $ | 0.98 | $ | 35,469 | $ | 1.41 | $ | 0.99 | |||||||||||||||
|
2010
|
||||||||||||||||||||||||||||
|
First
|
$ | 19,238 | $ | (120 | ) | $ | 0.01 | $ | 0.01 | $ | 15,802 | $ | 0.63 | $ | 0.54 | |||||||||||||
|
Second
|
104,352 | 5,189 | 0.20 | (0.01 | ) | 4,973 | 0.19 | (0.02 | ) | |||||||||||||||||||
|
Third
|
166,211 | 22,845 | 0.78 | 0.73 | 19,306 | 0.77 | 0.71 | |||||||||||||||||||||
|
Fourth
|
134,864 | (9,598 | ) | (0.30 | ) | (0.10 | ) | (8,334 | ) | (0.33 | ) | (0.07 | ) | |||||||||||||||
| $ | 424,665 | $ | 18,316 | $ | 0.69 | $ | 0.63 | $ | 31,747 | $ | 1.26 | $ | 1.16 | |||||||||||||||
Item
9.
Changes in and Disagreements with Accountants on Accounting and Financial Disclosure
None.
Disclosure Controls and Procedures
As required by Rule 13a-15(b) under the Exchange Act we conducted an evaluation under the supervision and with the participation of our management, including the Chief Executive Officer and the Chief Financial Officer, of the effectiveness of our disclosure controls and procedures as of the end of the period covered by this report. Based on that evaluation, the Chief Executive Officer and the Chief Financial Officer concluded that as of December 31, 2011 our disclosure controls and procedures are effective in ensuring that all information required to be disclosed in reports that we file or submit under the Exchange Act is recorded, processed, summarized and reported within the time periods specified in the SEC rules and forms and that such information is accumulated and communicated to our management, including our Chief Executive Officer and Chief Financial Officer, in a manner that allows timely decisions regarding required disclosure.
This annual report does not include a report of management's assessment regarding internal control over financial reporting or an attestation report of the Company’s registered public accounting firm due to a transition period established by rules of the SEC for newly public companies.
None.
Item 10.
Directors, Executive Officers and Corporate Governance
The names, offices held and ages of the members of the Board of Directors of the General Partner are set forth below. The Board of Directors consists of a majority of independent directors and the Manager has two representatives serving as directors (Warren G. Lichtenstein and Jack Howard) while the Management Agreement is in effect.
|
Name
|
Age
|
Position
|
||
|
Warren G. Lichtenstein
|
46
|
Chairman of the Board
|
||
|
Jack Howard
|
50
|
Director
|
||
|
Anthony Bergamo
(1)(2)(3)(6)
|
65
|
Director
|
||
|
John P. McNiff
(1)(4)(5)(6)
|
51
|
Director
|
||
|
Joseph L. Mullen
(1)(2)(6)(7)
|
65
|
Director
|
||
|
General Richard I. Neal
(1)(2)(4)
|
69
|
Director
|
||
|
Allan R. Tessler
(1)(4)
|
75
|
Director
|
_______________
|
(1)
|
Independent Director.
|
|
(2)
|
Member of Audit Committee.
|
|
(3)
|
Chairman of Audit Committee.
|
|
(4)
|
Member of Corporate Governance and Nominating Committee.
|
|
(5)
|
Chairman of Corporate Governance and Nominating Committee.
|
|
(6)
|
Member of Compensation Committee.
|
|
(7)
|
Chairman of Compensation Committee.
|
Warren G. Lichtenstein
has served as our Chairman of the Board and Chief Executive Officer since July 15, 2009. He has served as Chairman of the Board of HNH since July 2005. Mr. Lichtenstein is the Chairman and Chief Executive Officer of the Manager and has been associated with the Manager and its affiliates since 1990. He is a Co-Founder of Steel Partners Japan Strategic Fund (Offshore), L.P., a private investment partnership investing in Japan, and Steel Partners China Access I LP, a private equity partnership investing in China. He also co-founded SPII, a private investment partnership that is now our wholly-owned subsidiary, in 1993. Mr. Lichtenstein has served as a director of GenCorp Inc. since March 2008. Mr. Lichtenstein also served as the Chairman of the Board, President and Chief Executive Officer of SPAH, a company formed for the purpose of acquiring one or more businesses or assets, from February 2007 until October 2009. He has served as a director of SLI since March 2010. He previously served as a director (formerly Chairman of the Board) of SLI from January 2002 to May 2008 and served as Chief Executive Officer from February 2002 to August 2005. Mr. Lichtenstein has served as a director (currently Chairman of the Board) of Steel Excel, since October 2010. He served as a director of our predecessor, WebFinancial, a consumer and commercial lender, from 1996 to June 2005, as Chairman and Chief Executive Officer from December 1997 to June 2005 and as President from December 1997 to December 2003. From May 2001 to November 2007, Mr. Lichtenstein served as a director (formerly Chairman of the Board) of United Industrial Corporation (“United Industrial”), a company principally focused on the design, production and support of defense systems, which was acquired by Textron Inc. He served as a director of KT&G Corporation, South Korea’s largest tobacco company, from March 2006 to March 2008. Mr. Lichtenstein served as a director of Layne Christensen Company, a provider of products and services for the water, mineral, construction and energy markets, from January 2004 to October 2006. We believe Mr. Lichtenstein is qualified to serve as Chairman of the Board due to his expertise in corporate finance, record of success in managing private investment funds and his related service as a director of, and advisor to, a diverse group of public companies, including other companies having attributes similar to the Company.
Jack Howard
has served as our President since July 15, 2009 and has been a member of our Board of Directors since October 18, 2011. He also served as our Assistant Secretary from July 15, 2009 until September 19, 2011 and as our Secretary from September 19, 2011 until January 2012. He has been a registered principal of Mutual Securities, Inc., a FINRA registered broker-dealer, since 1989. Mr. Howard is the President of the Manager and has been associated with the Manager and its affiliates since 1993. Mr. Howard co-founded SPII in 1993. Mr. Howard has been a director of HNH since July 2005. He has been a director of Steel Excel since December 2007. Mr. Howard has also served as a director of DGT since September 2011. Mr. Howard served as Chairman of the Board of our predecessor, WebFinancial, from June 2005 to December 2008, as a director since 1996 and its Vice President since 1997. From 1997 to May 2000, he also served as Secretary, Treasurer and Chief Financial Officer of WebFinancial. Mr. Howard served as a director of SPAH from February 2007 until June 2007, and was Vice-Chairman from February 2007 until August 2007. He also served as Chief Operating Officer and Secretary of SPAH from June 2007 and February 2007, respectively, until October 2009. He currently holds the securities licenses of Series 7, Series 24, Series 55 and Series 63. We believe Mr. Howard is qualified to serve as a member of the Board due to his financial expertise and record of success as a director, chairman and top-level executive officer of numerous public companies.
Anthony Bergamo
has been a member of our Board of Directors since July 15, 2009. Mr. Bergamo held various positions with MB Real Estate, a property development and management company based in New York City and Chicago, since April 1996, including the position of Vice Chairman since May 2003. Mr. Bergamo served as Managing Director with Milstein Hotel Group, a hotel operator, since April 1996. He has also served as the Chief Executive Officer of Niagara Falls Redevelopment, LLC, a real estate development company, since August 1998. Mr. Bergamo was a director of Lone Star Steakhouse & Saloon, Inc., an owner and operator of restaurants, from May 2002 until December 2006, at which time such company was sold to a private equity fund. At the time of such sale, Mr. Bergamo was the Chairman of the Audit Committee of Lone Star Steakhouse & Saloon, Inc. He has also been a director since 1995, a Trustee since 1986 and currently is Chairman of the Audit Committee and a member of the Executive and Compensation Committees of Dime Community Bancorp. Mr. Bergamo is also the Founder of the Federal Law Enforcement Foundation, a foundation that provides economic assistance to both federal and local law enforcement officers suffering from serious illness and to communities recovering from natural disasters, and has served as its Chairman since 1988. Mr. Bergamo serves on the New York State Commission for Sentencing Reform, is a Board Member of New York Offtrack Betting Corporation and serves on the New York State Judicial Screening Committee. Mr. Bergamo serves as Chairman of the Audit Committee of the Board of Directors. He earned a B.S. in History from Temple University, and a J.D. from New York Law School. He is admitted to the New York, New Jersey and Federal Bars, the US Court of Appeals and the US Supreme Court. Mr. Bergamo’s qualifications to sit on our Board of Directors include his broad experience as chief executive officer and operating officer of public and private companies and his more than fifteen years of service on boards of public companies and various public service organizations.
John P. McNiff
has been a member of our Board of Directors since July 15, 2009. Mr. McNiff co-founded Mera Capital, an investment fund, in 2007. He has been chairman of Discovery Capital Management, LLC, a fund of funds, since 2004. Mr. McNiff has served as a director of ICM Insurance, a New York corporation, since 1999. In 1993, Mr. McNiff co-founded Longwood Investment Advisors, Inc., a Pennsylvania corporation, and served as President from 1993 until 2005. In 1991, Mr. McNiff also co-founded Radnor Holdings Corporation, a diversified chemical manufacturer, and served as its Senior Vice President, from 1991 until 2004. From 1988 until 1991, Mr. McNiff served as Vice President of Corporate Development of Airgas, a publicly traded New York Stock Exchange company. From 1986 until 1988, Mr. McNiff was an associate at the law firm of Davis Polk & Wardwell. Mr. McNiff has served on the boards of Colonial Penn Insurance Company, Lincoln Mortgage Company, Chartwell Investment Partners, Radnor Holdings Corporation, Insurance Capital Management, Cooke & Bieler, and Alliance Healthcare. He holds a B.A. from Yale University and a J.D. from New York University School of Law. Mr. McNiff is qualified to serve on our Board of Directors due to his extensive knowledge of securities law and financial management and his service on numerous boards.
Joseph L. Mullen
has been a member of our Board of Directors since July 15, 2009. Mr. Mullen served as a director of our predecessor entity WebFinancial Corporation from 1995 until December 2008. Since January 1994, Mr. Mullen has served as Managing Partner of Li Moran International, Inc., a management consulting company, and has functioned as a senior officer overseeing the merchandise and marketing departments for such companies as Leewards Creative Crafts Inc. and Office Depot of Warsaw, Poland. Mr. Mullen’s qualifications to sit on our board include his experience as a member of various audit committees, including membership on the audit committee of WebFinancial Corporation, as well as over 20 years experience working with various banks and retailers and as vice president of Hills Department Stores with line item responsibility.
General Richard I. Neal
has been a member of our Board of Directors since July 15, 2009. General Neal became President of Sisvel US, Inc. in 2010 and is President of Audio MPEG since 2003; both companies license intellectual property. Additionally, General Neal was President of IP Global and Safer Display, both IP licensing companies. He was the Senior Mentor for the United States Marine Corps for five years and has been a Senior Fellow for the National Defense University since his retirement from the Marines Corps in 1998. General Neal currently serves as a director of Humanetics Corporation and is a Trustee for Norwich University and on the Board of Overseers for Northeastern University. He was recently selected to be a Senior Fellow for the Institute for Defense and Business. He was a director for United Industrial Corporation and for AgustaWestland Inc. Following graduation from Northeastern University in 1965, he was commissioned as a Second Lieutenant in the Marine Corps. For the next thirty-five years, General Neal commanded at every level within the Marine Corps; battery, battalion, brigade and as the Second Marine Division Commander. He served two tours in the Republic of Vietnam. During Operation Desert Storm, General Neal served as the Director of Operations for U.S. Central Command and was also responsible for briefing the international press on the war. Before his retirement in 1998, General Neal’s last assignment was as the Assistant Commandant of the Marine Corps. General Neal holds a B.S. in History and Education from Northeastern University, and a M.Ed. from Tulane University and is a graduate of the National War College. General Neal’s unique experience in negotiating licensing agreements, developing financial settlements, and collecting and distributing royalties, along with his experience as Chairman of the 38-member Board of the Military Officers Association of America that represents a membership of 375,000 and is intimately involved in governance issues and policy development, make General Neal qualified to serve on our Board of Directors.
Allan R. Tessler
has been a member of our Board of Directors since July 15, 2009. Mr. Tessler has served as the Chairman and Chief Executive Officer of International Financial Group, Inc., an international merchant banking firm, since 1987. Mr. Tessler served as Chief Executive Officer of Epoch Holding Corporation, a publicly-held investment management company, from February 2000 until June 2004, and has served as Chairman of the Board since May 1994. Previously, he was Co-Chairman and Co-Chief Executive Officer of Interactive Data Corporation (formerly Data Broadcasting Corporation), a securities market data supplier, from June 1992 until February 2000. Mr. Tessler was co-founder and Chairman of the Board of Enhance Financial Services, Inc., a public insurance holding company, from 1986 until 2001, and was Chairman of the Board of Great Dane Holdings Inc., a private diversified holding company, from 1987 until 1996. He presently is lead director of Limited Brands, Inc. and director of TD Ameritrade Holding Corporation. He serves as Chairman of the Board of Trustees of the Hudson Institute and is a member of the Board of Governors of the Boys & Girls Clubs of America. Mr. Tessler received his undergraduate degree from Cornell University and L.L.B. from Cornell University Law School. As a result of his broad business experience and financial expertise, together with his involvement in various public policy issues, we believe Mr. Tessler is qualified to serve on our Board of Directors.
The names, offices held and ages of the executive officers of the General Partner are set forth below.
|
Name
|
Age
|
Position
|
||
|
Warren G. Lichtenstein
|
46
|
Chairman and Chief Executive Officer
|
||
|
Jack Howard
|
50
|
President
|
||
|
James F. McCabe, Jr.
|
49
|
Chief Financial Officer
|
||
|
Leonard J. McGill
|
54
|
Senior Vice President, General Counsel and Secretary
|
Please see above for biographical information of Warren G. Lichtenstein and Jack Howard.
James F. McCabe, Jr.
has been our Chief Financial Officer since October 18, 2011 and has been the Senior Vice President of each of HNH and H&H, since March 2007, and Chief Financial Officer of HNH, since August 2008. From July 2004 to February 2007, Mr. McCabe served as Vice President of Finance and Treasurer, Northeast Region, of American Water Works Company. From August 1991 to September 2003, he was with Teleflex Incorporated where he served in senior management positions including President of Teleflex Aerospace, President of Sermatech International, Chief Operating Officer of Sermatech International, President of Airfoil Technologies International and Chief Financial Officer of Teleflex Aerospace.
Leonard J. McGill
joined Steel Partners LLC in November 2011, and was appointed Senior Vice President, General Counsel and Secretary to SPH GP and Senior Vice President and Chief Legal Officer of HNH in January 2012. From May 2010 to October 2011 he was Senior Vice President, Secretary and General Counsel of Ameron International Corporation. Prior to joining Ameron, until April 2010, Mr. McGill was Senior Vice President, General Counsel and Secretary of Fleetwood Enterprises, Inc. Fleetwood Enterprises, Inc. filed for Chapter 11 bankruptcy protection in May 2009.
Section 16(A) Beneficial Ownership Reporting Compliance
Section 16(a) of the Exchange Act requires the Company’s directors and officers, and persons who own more than 10% of a registered class of its equity securities, to file reports of ownership and changes in ownership (typically, Forms 3, 4 and/or 5) of such equity securities with the SEC. Such entities are also required by SEC regulations to furnish the Company with copies of all such Section 16(a) reports. Based solely on a review of Forms 3 and 4 and amendments thereto furnished to the Company and written representations that no Form 5 or amendments thereto were required, the Company believes that during the fiscal year ended December 31, 2011, the directors and officers of the General Partner, and greater than 10% beneficial owners, have complied with all Section 16(a) filing requirements.
Code of Ethics
The General Partner has adopted a code of business conduct and ethics (the “Code of Conduct”) that applies to all of its directors, officers and employees. The Code of Conduct is reasonably designed to deter wrongdoing and to promote (i) honest and ethical conduct, including the ethical handling of actual or apparent conflicts of interest between personal and professional relationships, (ii) compliance with applicable governmental laws, rules and regulations, (iii) the prompt internal reporting of violations of the Code of Conduct to appropriate persons identified in the Code of Conduct, and (iv) accountability for adherence to the Code of Conduct. The Code of Conduct is available on the Company’s website at www.steelpartners.com/Corporate%20Governance/. Amendments to the Code of Conduct and any grant of a waiver from a provision of the Code of Conduct requiring disclosure under applicable SEC rules will be disclosed on the Company’s website at www.steelpartners.com/Corporate%20Governance/.
Audit Committee
The General Partner has a separately standing Audit Committee established in accordance with Section 3(a)(58)(A) of the Exchange Act. The Audit Committee has a charter, a current copy of which is available on the Company’s website, www.steelpartners.com/Corporate%20Governance/. The members of the Audit Committee are Anthony Bergamo, Joseph L. Mullen and General Richard I. Neal. Each of Messrs. Bergamo, Mullen and General Neal are non-employee members of the Board of Directors. After reviewing the qualifications of the current members of the Audit Committee, and any relationships they may have with the General Partner that might affect their independence from the General Partner, the Board of Directors has determined that (i) all current Audit Committee members are “independent” as that concept is defined in Section 10A of the Exchange Act, (ii) all current Audit Committee members are financially literate, and (iii) Mr. Bergamo qualifies as an “audit committee financial expert” under the applicable rules promulgated pursuant to the Exchange Act. The Audit Committee met 5 times during the fiscal year ended December 31, 2011.
Item
11.
Executive Compensation
Since our Management Agreement provides that the Manager is responsible for managing our affairs, our executive officers who are employees of the Manager or one or more of its affiliates, do not receive cash compensation from us or any of our subsidiaries for serving as our executive officers. Accordingly, the Manager has informed us that it cannot identify the portion of the compensation awarded to our executive officers by the Manager that relates solely to their services to us, as the Manager does not compensate its employees specifically for such service.
Under the Management Agreement, the Manager receives a quarterly Management Fee at a rate of 1.5% of total partner’s capital, payable on the first day of each quarter and subject to quarterly adjustment plus certain incentive compensation. Prior to January 1, 2012, the Manager received a monthly Management Fee at a rate of 1.5% per annum payable monthly. Warren G. Lichtenstein, our Chairman and Chief Executive Officer, is the Chief Executive Officer of the Manager. Jack L. Howard, our President and Secretary, is also President of the Manager.
Prior to January 1, 2012, the services of James F. McCabe, Jr. were provided to us pursuant to an arrangement with HNH as more fully described in “Certain Relationships and Related Party Transactions - HNH Accounting Services.” HNH cannot identify the portion of compensation awarded to Mr. McCabe by HNH that relates solely to us, as HNH does not compensate its employees specifically for such services. Effective January 1, 2012, Mr. McCabe became an employee of SP Corporate.
The Management Agreement
Under the Management Agreement, subject to the supervision of the Board of Directors, the Manager provides management services, including providing the services of the Chairman, Chief Executive Officer and President of the General Partner, to the managed entities, which includes: (i) us, (ii) SPII, and (iii) certain entities that the Manager designates as a managed entity from time to time.
Duties of the Manager
Pursuant to the terms of the Management Agreement, the Manager is responsible for the day-to day operations of the managed entities including, but not limited to:
|
|
·
|
acting as a consultant with respect to the periodic reviews of the managed entities’ business;
|
|
|
·
|
investigating, analyzing and implementing business opportunities for the managed entities;
|
|
|
·
|
negotiating with any and all counterparties with respect to business opportunities for the managed entities;
|
|
|
·
|
entering into agreements on behalf of the managed entities;
|
|
|
·
|
engaging independent contractors on behalf of the managed entities, including accountants, legal counsel, administrators and custodians;
|
|
|
·
|
providing executive and administrative personnel, office space and office services required to perform its obligations under the Management Agreement;
|
|
|
·
|
communicating with equity or debt interest holders in the managed entities;
|
|
|
·
|
counseling the managed entities in connection with policy decisions to be made by the Board of Directors or the relevant management team of the managed entities;
|
|
|
·
|
monitoring and reporting to the Board of Directors on the performance of the managed entities;
|
|
|
·
|
handling and resolving all claims, disputes or controversies (including all litigation, arbitration, settlement or other proceedings or negotiations) in which managed entities are involved arising out of the day-to-day operations of the managed entities;
|
|
|
·
|
performing any other services in relation to the managed entities as the Board of Directors may from time to time reasonably request;
|
|
|
·
|
appointing such other service providers, including any affiliates of the Manager, to provide services to the managed entities provided that if such services relate to services to be performed by the Manager under the Management Agreement and in respect of which Steel Partner receives the Management Fee, then the Manager must give prompt notice of such appointment to the independent directors of the Board of Directors;
|
|
|
·
|
retaining, for and on behalf of, and at our sole cost and expense of, or the managed entities, such accountants, legal counsel, appraisers, insurers, brokers, transfer agents registrars, developers, investment banks, financial advisors, banks and other lenders as it deems necessary or advisable and we or the managed entities will reimburse the Manager or its affiliates performing such services for the cost and expenses thereof, provided that such costs and reimbursements to affiliates of the Manager are no greater than those which would be payable to outside professionals or consultants engaged to perform such services pursuant to agreements negotiated on an arm’s-length basis; and
|
|
|
·
|
preparing or causing to be prepared such reports, financial or otherwise, with respect to us or the managed entities as may be reasonably required by the Board of Directors or required by law or regulation.
|
The Manager is not obligated to expend money in connection with the performance of its obligations in excess of any money available in any of our accounts or made available by the managed entities. Officers and other personnel of the Manager are entitled to serve as officers or personnel of the managed entities.
Devotion of Time and Additional Activities
The Manager must devote such time and personnel to the management of the managed entities as it reasonably deems necessary and appropriate from time to time. The Manager may provide services similar or identical to those it provides to us to other persons and entities including to those whose business is substantially similar to the managed entities.
The Manager and it members, officers, employees, agents and affiliates are not prevented from buying, selling or trading for its or their own account. The Manager and any person affiliated or associated with the Manager may contract and enter into transactions with the managed entities, and any unitholder, or any person the securities of which are held by or for the account of the managed entities, may be interested in any such transactions, except to the extent prohibited by applicable law.
Restrictions
The Manager may not, without the consent of the independent directors of the Board of Directors, consummate any transaction on behalf of the managed entities which would involve the purchase or sale by any of the managed entities of any interest or asset in which the Manager has a direct or indirect ownership interest or as would constitute an actual or potential conflict of interest for the Manager.
Term and Termination
The Management Agreement will continue until December 31, 2012 and will be automatically renewed thereafter for successive one-year terms unless otherwise determined at least 60 days prior to each renewal date by a majority of the independent directors.
We may terminate the Management Agreement effective upon 30 days’ prior written notice of termination from us to the Manager if (i) the Manager materially breaches any provision of the Management Agreement and such breach continues for a period of more than 30 days after written notice thereof specifying such breach and requesting that the same be remedied in such 30-day period, (ii) the Manager engages in any act of fraud, misappropriation of funds, or embezzlement against any managed entity, (iii) there is an event of gross negligence or willful misconduct on the part of the Manager in the performance of its duties under the Management Agreement, (iv) there is a commencement of any proceeding relating to the Manager’s bankruptcy or insolvency, (v) there is a dissolution of the Manager or (vi) there is a change of control of the Manager, not consented to by us pursuant to the Management Agreement.
The Manager may terminate the Management Agreement effective upon 60 days’ prior written notice of termination to us in the event that the managed entities default in the performance or observance of any material term, condition or covenant contained in the Management Agreement and such default continues for a period of 30 days after written notice thereof specifying such default and requesting that the same be remedied in such 30-day period.
The Manager may terminate the Management Agreement in the event any of the managed entities becomes regulated as an “investment company” under the Investment Company Act, with such termination deemed to have occurred immediately prior to such event.
The Manager may terminate the Management Agreement at any time immediately effective upon written notice of termination to us in the event that the election of the majority of the members of the Board of Directors that were originally elected and approved by the Manager no longer constitute a majority of the members of the Board of Directors, unless their replacements or successors were approved by the Manager.
Management Fees and Incentive Compensation
We do not employ personnel and therefore rely on the resources and personnel of the Manager to conduct our operations. For performing services under the Management Agreement, the Manager receives a Management Fee and incentive compensation based on our performance. The Manager also receives reimbursements for certain expenses.
Management Fee
Effective January 1, 2012, the Manager receives a quarterly Management Fee at a rate of 1.5% of the total partner’s capital, payable on the first day of each quarter and subject to quarterly adjustment. The Management Fee is calculated based on the total partners’ capital as of the last day of the most recently completed fiscal quarter. Prior to January 1, 2012, the Management Fee was at a rate of 1.5% per annum payable monthly. Until such time as the common units were listed on a national securities exchange, the Management Fee was calculated based on the sum of the net asset value of the common units and any amounts in the deferred fee accounts as of the last day of the prior calendar month. Thereafter, the Management Fee was to be based on the sum of the market capitalization of SPH and any amounts in the deferred fee accounts as of the last day of the prior calendar month.
From July 16, 2009 through December 31, 2009 and from January 1, 2010 through December 31, 2010, the Manager was paid a Management Fee of $3,705 and $7,531, respectively. No Management Fee was payable from January 1, 2009 through July 15, 2009. The Manager was to be reimbursed $452 and $2,209 for expenses incurred during the period of July 16, 2009 to December 31, 2009 and January 1, 2010 through December 31, 2010, respectively, as provided under the Management Agreement. For the years ended December 31, 2011 and 2010, the Manager earned a Management Fee of $8,119 and $7,531, respectively. The Manager incurred $2,833 and $2,209 of reimbursable expenses for the years ended December 31, 2011 and 2010, respectively, in connection with its provision of services under the Management Agreement.
The Manager will compute each installment of the Management Fee as of the last day of the immediately preceding quarter with respect to which the Management Fee is due. A copy of the computations made by the Manager to calculate such installment is to promptly be delivered to the Audit Committee of the Board of Directors for informational purposes only. At the request of the Manager, we are to, from time to time, advance to the Manager or its designees the amount of any Management Fee for such quarter based on the Manager’s good faith estimate of the Management Fee for the quarter pending the final determination of the Management Fee for such quarter. Upon such delivery of the final computation of the Management Fee for that quarter, after taking into account any advances to the Manager or its designees, the amount due (i) to the Manager or its designees by us or (ii) to us by the Manager or its designees is to be paid no later than the first day of the next fiscal quarter following the fiscal quarter in which the final Management Fee computation was delivered to us. Prior to January 1, 2012, each installment of the Management Fee was computed on a monthly basis.
Any services provided by an affiliate of the Manager or any officers or employees thereof (other than services specifically required to be provided by the Manager pursuant to the Management Agreement), to other than the managed entities will be provided under a separate agreement.
Reimbursement of Expenses
We or the managed entities will bear (or reimburse the Manager or its designees with respect to) all reasonable costs and expenses of the managed entities, the Manager, the General Partner or their affiliates, including but not limited to: legal, tax, accounting, auditing, consulting, administrative, compliance, investor relations costs related to being a public entity rendered for the managed entities or the General Partner as well as expenses incurred by the Manager and the General Partner which are reasonably necessary for the performance by the Manager of its duties and functions under the Management Agreement and certain other expenses incurred by managers, officers, employees and agents of the Manager or its affiliates on behalf of the managed entities.
The Manager will prepare and deliver from time to time a statement documenting the expenses of the managed entities and the expenses incurred by the Manager on behalf of the managed entities. The managed entities must reimburse expenses incurred by and payable to the Manager within 30 days following the date of delivery of such statement.
Incentive Compensation
Effective January 1, 2012, the Manager was granted incentive units which entitle the Manager to receive Class B common units of SPH, which Class B common units have the same rights as the common units, except that they may not be sold in the public market until the capital account allocable to such Class B common units is equal to the capital account allocable to the common units. The number of incentive units granted is equal to 100% of the sum of the common units outstanding and the number of notional units used to determine the deferred fee accounts in accordance with the Deferred Fee Agreement, each as of January 1, 2012. On the last day of each fiscal year SPH will issue to the Manager Class B common units, on a fully diluted basis. The Manager shall receive Class B common units, determined as of the last day of each fiscal year of SPH, representing 15% of the increase in equity value during the year. If equity value does not increase the Manager shall not receive Class B common units until there is an increase in equity value at the end of a fiscal year. SPH shall make any adjustment that it determines is equitably required by reason of the raising of new capital, including, without limitation, adding such new capital to the baseline equity value per common unit to the extent that the issue price of the new common units exceeds the baseline equity value per common unit.
If any issuance of common units, options, convertible securities or any other right to acquire common units by us results in an increase in the number of common units outstanding on a fully diluted basis as compared to the number outstanding as of the date of the most recent issuance (or, in the case of the first issuance, since the initial incentive unit grant date), the Manager will be issued additional incentive units so that as of the grant date of the additional incentive units, after taking into account the number of outstanding common units on a fully diluted basis and all incentive units granted since the initial incentive units grant date, the Manager holds outstanding incentive units (in the aggregate) equal to 100% of the sum of the common units outstanding and the number of notional units used to determine the deferred fee accounts in accordance with the Deferred Fee Agreement, on a fully diluted basis. Each additional incentive unit shall otherwise be subject to the same terms as the incentive units, unless the Manager otherwise agrees.
Prior to January 1, 2012, the Manager had been granted options to purchase an aggregate of 4,973,863 common units. The Manager was initially granted an option to purchase 4,965,690 common units, which is equal to 15% of the sum of the common units outstanding and the number of notional units used to determine the deferred fee accounts in accordance with that certain Second Amended and Restated Deferred Fee Agreement, effective as of July 15, 2009, between us and WGL, or the “Deferred Fee Agreement”, each as of July 15, 2009, on a fully diluted basis. The options had an initial per common unit exercise price of $31.81, which is subject to adjustment for any cash distributions, any distributions-in-kind and the release of any reserves by SPII Onshore to its former limited partners. The exercise price decreased by $1.95 per unit to $29.86 for the April 1, 2010 common unit distribution and further decreased by $1.18 per unit to $28.68 for the April 6, 2011 common unit distribution. On March 21, 2011, the Manager was granted an additional (i) option to purchase 5,671 common units at an exercise price of $16.89, per common unit, as based on the net asset value of the common units as of June 30, 2010 and the exercise price decreased by $1.18 per unit to $15.71 for the April 6, 2011 common unit distribution, (ii) option to purchase 1,291 common units at an exercise price of $18.80, per common unit, as determined based on the net asset value of the common units as of September 30, 2010 and the exercise price decreased by $1.18 per unit to $17.62 for the April 6, 2011 common unit distribution, and (iii) option to purchase 1,211 common units at an exercise price of $20.03, per common unit, as determined based on the net asset value of the common units as of December 31, 2010 and the exercise price decreased by $1.18 per unit to $18.85 for the April 6, 2011 common unit distribution. Such options expired on December 31, 2011.
License Agreement for Use of Trademarks
Pursuant to the terms of a license agreement, dated as of January 1, 2009, by and between the Manager and us, the Manager granted us a royalty-free, non-exclusive non-assignable license during the term of the license agreement to use the trademarks, “Steel Partners” and “SPII.” The term of the license agreement runs concurrently with the term of the Management Agreement and expires automatically upon expiration of the term of the Management Agreement or the termination of the Management Agreement, unless the license agreement is earlier terminated due to our breach of our material obligations thereunder.
Other
Certain employees of the Manager receive compensation in the form of directors’ fees and incentive compensation for services rendered, as directors, or otherwise, to certain of our affiliates.
Compensation Committee Interlocks and Insider Participation
The members of the Compensation Committee are Anthony Bergamo, Joseph L. Mullen and John P. McNiff. None of the members of the Compensation Committee is our current or former officer or employee. None of the members of the Compensation Committee had any relationship requiring disclosure by us under any paragraph of Item 404 of Regulation S-K.
None of our executive officers served as a director (including as a member of the compensation committee) of any entity that had one or more executive officers who served on our Board of Directors (including as a member of the Compensation Committee).
Compensation Committee Report
We have reviewed and discussed with management certain Director Compensation provisions to be included in this Annual Report on Form 10-K, filed pursuant to the Exchange Act. Based on the reviews and discussions referred to above, we recommend to the Board of Directors that the Director Compensation provisions referred to above be included in this Annual Report on Form 10-K.
Submitted by the Compensation Committee of the Board of Directors
Joseph L. Mullen, Chairman
Anthony Bergamo
John P. McNiff
This Compensation Committee Report is not deemed incorporated by reference by any general statement incorporating by reference this Annual Report into any filing under the Securities Act of 1933, as amended, or the Exchange Act, except to the extent that the Company specifically incorporates this information by reference, and shall not otherwise be deemed filed under either such Acts.
Director Compensation
Directors who are also executive officers are not separately compensated for their service as directors. Our non-management directors earned the following aggregate amounts of compensation for the year ended December 31, 2011.
|
Name
|
Fees Earned or Paid in Cash
(1)
($)
|
Stock Awards
(2)
($)
|
Total
($)
|
|||
|
(a)
|
(b)
|
(c)
|
(h)
|
|||
|
Anthony Bergamo
|
101,083
|
75,000
|
176,083
|
|||
|
John P. McNiff
|
83,583
|
75,000
|
158,583
|
|||
|
Joseph L. Mullen
|
91,083
|
75,000
|
166,083
|
|||
|
General Richard I. Neal
|
84,583
|
75,000
|
159,583
|
|||
|
Allan R. Tessler
|
77,083
|
75,000
|
152,083
|
_______________
|
(1)
|
For the year ended December 31, 2011 each director earned annual cash compensation in the amount of $75,000.
|
|
(2)
|
For the year ended December 31, 2011 each director earned annual equity compensation in the amount of $75,000 in the form of restricted common units of SPH, with one-third of such restricted common units vesting on November 28, 2012, one-third of such restricted common units vesting on November 28, 2013 and one-third of such restricted common units vesting on November 28, 2014. The per unit value of such restricted common units is $13.80, determined based on the fair market value of SPH common units as of November 28, 2011.
|
For the year ended December 31, 2011, our non-management directors received cash fees of $1,500 for each board committee meeting attended. The chairmen of the Audit Committee, Corporate Governance and Nominating Committee and Compensation Committee were paid an additional cash fee of $15,000, $5,000 and $5,000 annually, respectively.
Item
12.
Security Ownership of Certain Beneficial Owners and Management and Related Stockholder Matters
The following table sets forth certain information with respect to the beneficial ownership of our common units as of March 16, 2012 for (a) each director of the General Partner, (b) each executive officer of the General Partner, (c) each unitholder known to be the beneficial owner of more than five percent of any class of our voting securities, and (d) all directors and executive officers of the General Partner as a group. Beneficial ownership has been determined in accordance with Rule 13d-3 under the Exchange Act and does not necessarily bear on the economic incidents of ownership or the rights to transfer the common units described below. Unless otherwise indicated, (a) each unitholder has sole voting power and dispositive power with respect to the indicated common units and (b) the address of each unitholder who is a director or executive officer is c/o Steel Partners Holdings L.P., 590 Madison Avenue, 32nd Floor, New York, New York 10022. The percentage of common units owned is based on 25,183,039 common units outstanding as of March 16, 2012.
|
Name of Beneficial Owner
|
Number of Common Units Beneficially Owned
(1)
|
Percentage of Common Units Beneficially Owned
(1)
|
||||||
|
5% Unitholders
|
||||||||
|
Entities affiliated with Benchmark Plus Institutional Partners, L.L.C.
|
2,501,624 | (2) | 9.9 | % | ||||
|
Entities affiliated with Entrust Capital Diversified Fund Ltd
|
2,661,906 | (3) | 10.6 | % | ||||
|
Directors and Executive Officers
|
||||||||
|
Warren G. Lichtenstein
|
1,783,586 | (4) | 7.1 | % | ||||
|
Jack Howard
|
2,821,238 | (5) | 11.2 | % | ||||
|
Anthony Bergamo
|
10,840 | * | ||||||
|
John P. McNiff
|
144,489 | (6) | * | |||||
|
Joseph L. Mullen
|
11,061 | * | ||||||
|
General Richard I. Neal
|
8,616 | * | ||||||
|
Allan R. Tessler
|
8,498 | * | ||||||
|
James F. McCabe, Jr.
|
– | * | ||||||
|
All Directors and Executive Officers as a Group (8 persons)
|
4,788,328 | 19.0 | % | |||||
_______________
|
*
|
Less than 1%.
|
|
(1)
|
Beneficial ownership is determined in accordance with the rules of the SEC, based on factors including voting and investment power with respect to the common units.
|
|
(2)
|
Consists of the following: (i) 1,453,211 common units beneficially owned by Benchmark Plus Institutional Partners, L.L.C., (ii) 492,894 common units beneficially owned by Benchmark Plus Long Short Select Partners, LP; (iii) 356,548 common units beneficially owned by Benchmark Plus Long Short Partners, LP; and (iv) 198,971 common units beneficially owned by Aviva Alternative Funds – Alpha Optimum. The address for the entities listed in (i) through (iii) above is 800 A Street, Suite 700, Tacoma, WA 98402. The address for Aviva Alternative Funds – Alpha Optimum is 5 Rue Plaetis, Luxembourg, L-2338.
|
|
(3)
|
Consists of the following: (i) 1,936,033 common units beneficially owned by Entrust Capital Diversified Fund Ltd; (ii) 204,629 common units beneficially owned by Entrust Capital Diversified Fund LP; (iii) 127,992 common units beneficially owned by Entrust Capital Diversified Fund Ltd; (iv) 64,673 common units beneficially owned by Entrust Capital Diversified Fund II LP; (v) 59,168 common units beneficially owned by Entrust Diversified Select Equity Fund LP; (vi) 37,010 common units beneficially owned by Entrust Diversified Select Equity Fund Ltd; and (vii) 232,401 common units beneficially owned by Illinois State Board of Investment. The address for the entities listed in (i) through (iv) above is 1011 Centre Road, Suite 200, Wilmington, DE 19805. The address for Entrust Diversified Select Equity Fund LP is 375 Park Avenue, 24th Floor, New York, NY 10152. The address for Entrust Diversified Select Equity Fund Ltd is 90 Fort Street, Admiral Financial Center, 5th Floor, Grand Cayman, Cayman Islands, KY1-1208. The address for Illinois State Board of Investment is 180 North LaSalle Street, Suite 2015, Chicago, IL 60601. Absent banking regulatory approval, voting rights are forfeited with respect to all common units in excess of 9.9%, and such common units may not be voted on any matter and will not be considered to be outstanding when sending notices of a meeting of unitholders (unless otherwise required by law), calculating required votes, determining the presence of a quorum or for other similar purposes.
|
|
(4)
|
Consists of the following: (i) 1,565,169 common units held directly by Mr. Lichtenstein; (ii) 100,026 common units beneficially owned by WGL Capital Corp. (“WGL”); and (iii) 118,391 common units beneficially owned by Steel Partners, Ltd. (“SPL”). Mr. Lichtenstein is the majority shareholder and President of WGL and Chief Executive Officer and Chairman of the Board of SPL. Mr. Lichtenstein may be deemed to have sole investment and voting power with respect to the common units held by WGL and SPL. Mr. Lichtenstein disclaims beneficial ownership of such common units beneficially owned by WGL and SPL, except to the extent of his pecuniary interest therein.
|
|
(5)
|
Consists of the following: (i) 543,648 common units held directly by Mr. Howard; (ii) 1,519,552 common units beneficially owned by The II Trust; (iii) 747,938 common units beneficially owned by The III Trust; and (iv) 10,100 common units held by EMH Howard, LLC (“EMH”). Mr. Howard is the trustee for The II Trust and The III Trust and the managing member of EMH. Mr. Howard may be deemed to have investment and voting power with respect to the common units held by The II Trust, The III Trust and EMH. Mr. Howard disclaims beneficial ownership of such common units beneficially owned by The II Trust, The III Trust and EMH, except to the extent of his pecuniary interest therein. Absent banking regulatory approval, voting rights are forfeited with respect to all common units in excess of 9.9%, and such common units may not be voted on any matter and will not be considered to be outstanding when sending notices of a meeting of unitholders (unless otherwise required by law), calculating required votes, determining the presence of a quorum or for other similar purposes.
|
|
(6)
|
Consists of the following: (i) 54,937 common units in an account jointly owned by Mr. McNiff and his wife, Evelyn McNiff; (ii) 73,351 common units beneficially owned by the Evelyn B Olin Irrevocable Trust, or the “Olin Trust”; and (iii) 16,201 common units beneficially owned by the JNS Charitable Lead Annuity Trust, or the “JNS Trust”. Mr. McNiff is the co-trustee of each of the Olin Trust and the JNS Trust. Mr. McNiff may be deemed to have shared investment and voting power with respect to the common units held by the Olin Trust and the JNS Trust. Mr. McNiff disclaims beneficial ownership of such common units beneficially owned by the Olin Trust and the JNS Trust, except to the extent of his pecuniary interest therein.
|
Item
13.
Certain Relationships and Related Transactions, and Director Independence
All dollars used in this discussion are in thousands unless otherwise indicated.
Certain Relationships and Related Transactions
In this “Certain Relationships and Related Transactions” section, all dollar amounts are in thousands, except for per share amounts.
Exchange Transaction
See “Business -- History” for a description of the Exchange Transaction.
Deferred Fee Agreement
We entered into an assignment and assumption agreement, as of July 15, 2009, with SPII Offshore and WGL, pursuant to which we assumed all of SPII Offshore’s liabilities and obligations under the Deferred Fee Agreement, pursuant to which WGL deferred certain fees due to it under its management agreement with SPII Offshore. WGL is an entity controlled by Warren G. Lichtenstein, our Chairman and Chief Executive Officer. In connection with the assignment and assumption agreement, SPII Offshore transferred to us assets, consisting of cash and our common units, equal in the aggregate in value to the assumed liabilities. Pursuant to the Deferred Fee Agreement, WGL has the option, but not the obligation, to elect to be paid in cash or common units, or a combination thereof, which payment may become immediately due and payable upon certain termination events as specified in the deferred fee agreement. The number of our common units to be paid in lieu of the cash would be determined by applying a 15% discount to the market price or to the net asset value per common unit. The common units issued as payment will be subject to a six-month lock-up.
Management Agreement
See “Executive Compensation” for a description of the Management Agreement.
WGL Capital
Under an investor services agreement with WGL, an entity controlled by Warren G. Lichtenstein, our Chairman and Chief Executive Officer, WGL performs certain investor relations services on our behalf and we pay WGL a fee in an amount of $50 per year (the “Investor Services Fee”). The Management Fee payable to the Manager pursuant to the Management Agreement is offset and reduced on each payment date by the amount of the fee payable to WGL under the investor services agreement. In addition, we bear (or reimburse WGL with respect to) all reasonable costs and expenses of ours, and WGL, or their affiliates relating to the investor relations services performed for us, including but not limited to all expenses actually incurred by WGL that are reasonably necessary for the performance by WGL of its duties and functions under the investor services agreement. From July 16, 2009 through December 31, 2009, WGL earned an Investor Services Fee of $23. For the years end December 31, 2011 and 2010, WGL earned an Investor Services Fee of $50.
HNH Accounting Services
Commencing on July 16, 2009, HNH provided certain accounting services to SPH until December 31, 2011. HNH billed SPH $91 and $550 for services provided for the period July 16, 2009 to December 31, 2009 and year ended December 31, 2010, respectively. For the year ended December 31, 2011, SPH incurred $1,308 for these accounting services.
SPII Liquidating Trust
The SPII Liquidating Trust, a Delaware statutory trust, was formed and commenced operations on July 15, 2009. The purpose of the SPII Liquidating Trust is to effect the orderly liquidation of certain assets previously held by SPII in connection with the withdrawal of the limited partners of SPII Onshore. SPIIGP is the liquidating trustee, and along with a Delaware trustee, has responsibilities that are generally limited to providing certain services in connection with the administration of the SPII Liquidating Trust. The Manager is the investment manager of the SPII Liquidating Trust.
On July 15, 2009, SPII contributed $243,844 of non-cash assets and $39,235 of cash to the SPII Liquidating Trust and became the initial beneficiary of each series of the SPII Liquidating Trust. In connection with the full withdrawal of the limited partners of SPII Onshore on July 15, 2009, 56.25% of the beneficial interests of each series were transferred to certain of the withdrawing limited partners, and SPII retained 43.75% of the beneficial interests of each series. SPII held certain assets of the SPII Liquidating Trust for the benefit of the SPII Liquidating Trust as its nominee until such assets could be assigned to the SPII Liquidating Trust. After December 31, 2009, SPII held no assets on behalf of the SPII Liquidating Trust.
We currently hold interests in the SPII Liquidating Trust. Our interest in the SPII Liquidating Trust was $97,923, $62,553 and $42,653, at December 31, 2009, December 31, 2010 and December 31, 2011, respectively. The SPII Liquidating Trust has an investment in (i) SPJSF, (ii) SPCA, and (iii) SP Acquisition Holdings, Inc. (“SPAH”), a blank check company formed for the purpose of acquiring, through a merger, capital stock exchange, asset acquisition or other similar business combination, one or more businesses or assets controlled by an affiliate of the Manager. We, through the SPII Liquidating Trust, had an interest in a co-investment obligation to SPAH should a business combination involving SPAH have taken place by October 10, 2009. The SPII Liquidating Trust held sufficient cash to fund such obligation, but it was terminated because a business combination was not completed, rendering the investment held by the SPII Liquidating Trust in SPAH worthless. The capital commitment has been terminated and capital has been distributed to the investors in the SPAH, including the SPII Liquidating Trust. At December 31, 2009, our interest in the SPII Liquidating Trust related to SPJSF and SPCA was $10,305 and $11,872, respectively. At December 31, 2010, our interest in the SPII Liquidating Trust related to SPJSF and SPCA was $7,826 and $11,579, respectively. At December 31, 2011, SPH’s interest in the SPII Liquidating Trust related to SPJSF and SPCA was $3,496 and $9,552, respectively. We have no obligation to make any capital contributions to the SPII Liquidating Trust.
SP Corporate Services Agreements
Effective as of July 1, 2007, we entered into a services agreement, or the “Services Agreement”, with SP Corporate, an entity previously controlled by Warren G. Lichtenstein, our Chairman and Chief Executive Officer. Pursuant to the Services Agreement, SP Corporate provided SPH with certain management, consulting and advisory services. The Services Agreement is automatically renewable on an annual basis unless terminated by either party on any anniversary date, upon at least 30 days written notice. Effective January 1, 2012, SP Corporate Services became a wholly owned subsidiary of the Company. For additional information, see Note 24 – “Subsequent Events” to the SPH financial statements found elsewhere in this Form 10-K. In consideration of the services rendered, a fixed annual fee totaling $310 was charged, adjustable annually upon agreement. Effective as of July 15, 2009, the Services Agreement was amended to provide for the provision of accounting, investor relations, compliance and other services related to our operation. The fee to be paid is agreed upon by SP Corporate and us from time to time. SP Corporate earned $478, $1,768 and $1,038 for the years ended December 31, 2009, 2010 and 2011, respectively, under the Services Agreement. Effective January 1, 2012, SP Corporate became our indirect wholly owned subsidiary.
On each of March 26, 2010, January 24, 2011 and March 10, 2011, a special committee of the Board of Directors of HNH, composed entirely of independent directors, approved a management and services fee to be paid to SP Corporate in the amount of $950 and $1,950 for services performed in 2009 and 2010, respectively, and of $1,740 for services to be performed in 2011. In each of 2009, 2010 and 2011 this fee was paid as consideration for the services of Warren G. Lichtenstein, as Chairman of the Board, Glen M. Kassan, as Chief Executive Officer and Vice Chairman, John J. Quicke, as Vice President and, until December 2010, as director, and Jack L. Howard and John H. services with respect to operations, strategic planning, finance and accounting, sale and acquisition activities and other aspects of the businesses of HNH. HNH does not have a written agreement with SP Corporate relating to the services described above.
Effective January 1, 2012, SP Corporate entered into a Management Services Agreement (the “Management Services Agreement”) with HNH. Under the Management Services Agreement, SP Corporate will provide HNH with corporate and executive services including, without limitation, legal, tax, accounting, treasury, consulting, auditing, administration, compliance, environmental health and safety, human resources, marketing, investor relations and other similar services rendered for HNH and its subsidiaries. In addition, SP Corporate will provide HNH with the continued service of Glen Kassan, as HNH’s Chief Executive Officer, Jim McCabe, as HNH’s Chief Financial Officer, and certain other employees and corporate services. In connection with the execution of the Management Services Agreement, HNH transferred to SP Corporate approximately 37 employees, as well as certain other assets that had previously been used or held for use by HNH and its subsidiaries in providing the subject services which SP Corporate will now be providing to HNH.
On February 5, 2010, WebBank paid SP Corporate a fee of $250 for the provision of executive services, including provision of a chairman of the board, for 2009. On March 9, 2010, WebBank and SP Corporate entered into a servicing agreement under which SP Corporate receives $63 quarterly and provides certain services to WebBank. The agreement is effective January 1, 2010, continues for three years and automatically renews for successive one year terms unless terminated in accordance with the agreement. For the year ended December 31, 2011, WebBank paid SP Corporate fees of $250.
Effective as of July 1, 2007, SP Corporate entered into services agreements with each of BNS and CoSine. Pursuant to the terms of the services agreements, of which the services agreement with BNS was amended on May 12, 2010, SP Corporate initially provided each of BNS and CoSine with certain services and each of BNS and CoSine pays SP Corporate a monthly fee of $42 and $17, respectively, which fees are adjustable annually upon agreement by the parties or at other times upon amendment to the services agreements. In addition, each of BNS and CoSine are obligated to reimburse SP Corporate for certain expenses, including legal expenses, as well as all reasonable and necessary business expenses, incurred on behalf of each of BNS and CoSine. Services provided under the services agreements include the non-exclusive services of persons to perform accounting, tax, administrative, compliance and investor relations services. BNS incurred $129 for the period from July 15, 2009 through October 31, 2009 (its fiscal year end), which is the period for which BNS is consolidated for the period from July 15, 2009 through December 31, 2009 and $385 for the year ended October 31, 2010 (its fiscal year end), which is the period for which BNS is consolidated for the period from January 1, 2010 through December 31, 2010. Under the terms of an amended and restated services agreement effective as of May 12, 2010, SP Corporate receives a monthly fee of $42 monthly from BNS. BNS incurred $1,083 (includes $500 for assistance provided to BNS related to a financing arrangement) for the period from November 1, 2010 to December 31, 2011 (as discussed in Note 1 – “Description of Business and Basis of Presentation”, BNS changed its fiscal year to a calendar year and the year ended December 31, 2011 includes two additional months of statement of operations activity).
Effective as of September 1, 2009, SP Corporate entered into a management services agreement with DGT. Pursuant to the terms of the management services agreement, which was amended on October 1, 2011, SP Corporate provides DGT with certain services and DGT pay SP Corporate a monthly fee of $48, which fee is adjustable annually upon agreement by the parties or at other times upon amendment to the management services agreement. In addition, DGT is obligated to reimburse SP Corporate for certain expenses, including legal expenses, as well as all reasonable and necessary business expenses, incurred on behalf of DGT. Services provided under the management services agreement include the non-exclusive services of persons, including a chief executive officer and chief financial officer, to perform certain management and leadership services.
Effective as of September 1, 2011, SP Corporate entered into a management services agreement with Steel Excel. Pursuant to the terms of the management services agreement, SP Corporate provides Steel Excel with certain services and Steel Excel pays SP Corporate a monthly fee of $35, which fee is adjustable annually upon agreement by the parties and such additional amounts as are payable for the provision of certain accounting, finance, human resources, operational and other services upon agreement by the parties. In addition, Steel Excel is obligated to reimburse SP Corporate for certain expenses, including legal expenses, as well as all reasonable and necessary business expenses, incurred on behalf of Steel Excel. Services provided under the management services agreement include the non-exclusive services of a chief financial officer and a financial reporting manager.
Mutual Securities
Pursuant to the Management Agreement, the Manager is responsible for selecting executing brokers. Securities transactions for us are allocated to brokers on the basis of reliability and price and execution. The Manager has selected Mutual Securities as an introducing broker and may direct a substantial portion of the managed entities’ trades to such firm among others. Jack L. Howard, our President, is a registered principal of Mutual Securities. The commissions paid by us to Mutual Securities were approximately $1,760, $1,006 and 1,105 for the years ended December 31, 2009, 2010 and 2011, respectively.
SPL Management Agreement
SPL, an entity of which Warren G. Lichtenstein, our Chairman and Chief Executive Officer, is the Chief Executive Officer and Chairman of the Board, was a party to a management agreement with SLI from January 23, 2002 until the agreement was terminated on May 18, 2010, effective January 31, 2010, for a one-time payment of $150. Pursuant to the terms of the management agreement, SPL provided SLI with certain services and SLI paid SPL an annual fee of $475, payable monthly. In addition, SLI was obligated to reimburse SPL for certain expenses, including legal expenses, as well as all reasonable and necessary business expenses, incurred on behalf of SLI. Services provided to SLI under the management agreement included certain management, advisory and consulting services, including provision of a chairman of the board.
WebBank
In June 2010, a subsidiary of WebBank entered into an agreement with NOVT, a subsidiary of an affiliate of the Manager, to participate in a factoring facility in the amount of up to $2,000. As of December 31, 2010, the participation amount by NOVT was $2,000.
Review, Approval or Ratification of Transactions with Related Persons
The Partnership Agreement generally provides that affiliated transactions and resolutions of conflicts of interest between the Manager or its affiliates, or any director of the Board of Directors, on the one hand, and us, on the other, must be approved by a majority of the disinterested directors of the Board of Directors or a conflicts committee established by the Board of Directors and must be on terms no less favorable to us than those generally provided to or available from unrelated third parties or “fair and reasonable” to us, taking into account the totality of the relationships between the parties involved.
In addition, we have a written Related Person Transaction Policy, which is administered by the Audit Committee. The Related Person Transaction Policy provides that the Audit Committee is to consider all relevant factors when determining whether the terms of a related person transaction are fair and reasonable to us and whether to approve or ratify a related person transaction; provided however that these requirements will be deemed satisfied and not a breach of any duty as to any transaction (i) approved by the Audit Committee; (ii) approved by the vote of the holders of a majority of the voting power of outstanding voting units (excluding voting units owned by us, the General Partner and persons that we and the General Partner control); (iii) the terms of which are no less favorable to us than those generally being provided to or available from unrelated third parties; or (iv) that is fair and reasonable to us, taking into account the totality of the relationships between the parties involved (including other transactions that may be or have been particularly favorable or advantageous to us). Among other relevant factors, the Audit Committee will consider the size of the transaction and the amount payable to a related person, the nature of the interest of the applicable related person, whether the transaction may involve a conflict of interest and whether the transaction involves the provision of goods or services to us that are available from unaffiliated third parties.
Under the Related Person Transaction Policy, a related person means:
(1) any person who was, at any time since the beginning of our last fiscal year, a director, director nominee or executive officer of the General Partner, even if the person was not a director, director nominee or executive officer of the General Partner at the time of the transaction;
(2) any person who was, at any time since the beginning of our last fiscal year, an immediate family member of a director, director nominee or executive officer of the General Partner and any person (other than a tenant or employee) sharing the household of such director, director nominee or executive officer of the General Partner, even if the person was not an immediate family member of such director, director nominee or executive officer of the General Partner at the time of the transaction;
(3) any unitholder that was, at the time the transaction in question occurred or existed, a holder of 5% or more of our voting units;
(4) any person who was, at the time the transaction in question occurred or existed, an immediate family member of a holder of 5% or more of our voting units and any person (other than a tenant or employee) sharing the household of such unitholder;
(5) an entity in which any of the persons identified in (1) through (4) above acts as an officer or general partner of or otherwise controls such entity or in which such person, together with any other persons identified in clauses (1) through (4) above, holds an aggregate ownership interest of at least 10%.
Under the Related Person Transaction Policy, a related person transaction includes any transaction or currently proposed transaction that occurred since the beginning of our most recent fiscal year in which we were or are to be a participant, a related person had or will have a direct or indirect material interest and the amount involved exceeds or reasonably can be expected to exceed $120,000. Under the Related Person Transaction Policy, a transaction includes, but is not limited to, any financial transaction, arrangement or relationship or any series of similar transactions, arrangements or relationships.
Director Independence
Although the common units are not yet listed on any national securities exchange, the Board has determined that Messrs. Bergamo, McNiff, Mullen and Tessler and General Neal are “independent” as defined in the currently applicable listing standards of the New York Stock Exchange (“NYSE”). The NYSE’s listing standards require that all listed companies have a majority of independent directors. For a director to be “independent” under the NYSE listing standards, the board of directors of a listed company must affirmatively determine that the director has no material relationship with the company, or its subsidiaries or affiliates, either directly or as a partner, shareholder or officer of an organization that has a relationship with the company or its subsidiaries or affiliates. In accordance with the NYSE listing standards, the Board has affirmatively determined that each of Messrs. Bergamo, McNiff, Mullen and Tessler and General Neal have no material relationships with the Company, either directly or as a partner, shareholder or officer of an organization that has a relationship with the Company.
Additionally, each of Messrs. Bergamo, McNiff, Mullen and Tessler and General Neal has been determined to be “independent” under the NYSE listing standards as none of such directors meet the following criteria:
·
the director is, or has been within the last three years, an employee of the Company, or an immediate family member is, or has been within the last three years, an executive officer, of the Company;
·
the director has received, or has an immediate family member who has received, during any twelve-month period within the last three years, more than $120,000 in direct compensation from the Company, other than director and committee fees and pension or other forms of deferred compensation for prior service (provided such compensation is not contingent in any way on continued service);
·
(a) the director is a current partner or employee of a firm that is the Company’s internal or external auditor; (b) the director has an immediate family member who is a current partner of such a firm; (c) the director has an immediate family member who is a current employee of such a firm and personally works on the Company’s audit; or (d) the director or an immediate family member was within the last three years (but is no longer) a partner or employee of such a firm and personally worked on the Company’s audit within that time;
·
the director or an immediate family member is, or has been within the last three years, employed as an executive officer of another company where any of the Company’s present executive officers at the same time serves or served on that company’s compensation committee; or
·
the director is a current employee, or an immediate family member is a current executive officer, of a company that has made payments to or received payments from, the Company for property or services in an amount which, in any of the last three fiscal years, exceeds the greater of $1 million, or 2% of such other company’s consolidated gross revenues.
Audit Fees
We incurred $3,140 and $2,484 in audit fees and expenses from Grant Thornton LLP for the fiscal years ended December 31, 2011 and 2010, respectively. We include in the category of audit fees such services related to the audit of annual consolidated financial statements and internal controls, review of quarterly financial statements, review of reports filed with the SEC and other services, including services related to consents and registration statements filed with the SEC.
Audit-Related Fees
We incurred $97 in audit-related fees and expenses from Grant Thornton LLP for fiscal 2011 relating primarily to services provided in connection with offering memorandums, potential acquisitions and employee benefit plans. We incurred $52 of audit-related fees in fiscal 2010, relating principally to assistance and services pertaining to audits of the financial statements of various of the Company’s pension and benefit plans.
Tax Fees
We incurred $249 and $378 for tax services from Grant Thornton LLP for fiscal 2011 and 2010, respectively, relating principally to tax compliance, advice and planning.
All Other Fees
There were no fees for other professional services from Grant Thornton LLP rendered during fiscal 2011 and 2010.
The Audit Committee’s policy is to pre-approve services to be performed by the Company’s independent public accountants in the categories of audit services, audit-related services, tax services and other services. Additionally, the Audit Committee will consider on a case-by-case basis and, if appropriate, approve specific engagements that are not otherwise pre-approved. The Audit Committee has approved all fees and advised us that it has determined that the non-audit services rendered by Grant Thornton LLP during our most recent fiscal year are compatible with maintaining the independence of such auditors.
Item 15.
Exhibits and Financial Statement Schedules
|
(a)
Financial Statements
The following financial statements of Steel Partners Holdings L.P., and subsidiaries, are included in Part II, Item 8 of this report:
Consolidated Balance Sheets as of December 31, 2011 and 2010
Consolidated Statement of Operations for the years ended December 31, 2011 and 2010, and the periods July 16, 2009 to December 31, 2009 and January 1, 2009 to July 15, 2009
Consolidated Statements of Cash Flows for the years ended December 31, 2011 and 2010, and the periods July 16, 2009 to December 31, 2009 and January 1, 2009 to July 15, 2009
Consolidated Statements of Changes in Capital and Comprehensive Income (loss) for the years ended December 31, 2011 and 2010, and the periods July 16, 2009 to December 31, 2009 and January 1, 2009 to July 15, 2009
Notes to Consolidated Financial Statements
|
(b)
Exhibits.
The following documents are filed as exhibits hereto:
|
Exhibit No.
|
Description
|
|
3.1
|
Certificate of Limited Partnership (incorporated by reference to Exhibit 3.1 to Steel Partners Holdings L.P.’s Registration Statement on Form 10 filed December 15, 2011).
|
|
3.2
|
Amendment to the Certificate of Limited Partnership, dated April 2, 2009 (incorporated by reference to Exhibit 3.2 to Steel Partners Holdings L.P.’s Registration Statement on Form 10 filed December 15, 2011).
|
|
3.3
|
Amendment to the Certificate of Limited Partnership, dated January 20, 2010 (incorporated by reference to Exhibit 3.3 to Steel Partners Holdings L.P.’s Registration Statement on Form 10 filed December 15, 2011).
|
|
3.4
|
Amendment to the Certificate of Limited Partnership, dated October 15, 2010 (incorporated by reference to Exhibit 3.4 to Steel Partners Holdings L.P.’s Registration Statement on Form 10 filed December 15, 2011).
|
|
3.5
|
Third Amended and Restated Limited Partnership Agreement of Steel Partners Holdings L.P., dated as of July 14, 2009 (incorporated by reference to Exhibit 3.5 to Steel Partners Holdings L.P.’s Registration Statement on Form 10 filed December 15, 2011).
|
|
10.1
*
|
Third Amended and Restated Management Agreement by and between Steel Partners Holdings L.P. and Steel Partners LLC, dated January 1, 2012.
|
|
10.2
|
License Agreement by and between Steel Partners LLC and Steel Partners Holdings L.P., dated January 1, 2009 (incorporated by reference to Exhibit 10.3 to Steel Partners Holdings L.P.’s Registration Statement on Form 10 filed December 15, 2011).
|
|
10.3
|
Assignment and Assumption Agreement by and among Steel Partners II (Offshore) Ltd., WGL Capital Corp. and Steel Partners Holdings L.P., dated July 15, 2009 (incorporated by reference to Exhibit 10.4 to Amendment No. 1 of Steel Partners Holdings L.P.’s Registration Statement on Form 10 filed January 20, 2012).
|
|
10.4
|
Second Amended and Restated Deferred Fee Agreement, dated as of October 31, 2002, as amended and restated as of January 1, 2005, and as further amended and restated as of July 15, 2009, by and between Steel Partners Holdings L.P. and WGL Capital Corp (incorporated by reference to Exhibit 10.5 to Amendment No. 1 of Steel Partners Holdings L.P.’s Registration Statement on Form 10 filed January 20, 2012).
|
|
10.5
|
Investor Services Agreement by and among Steel Partners Holdings L.P., Steel Partners LLC and WGL Capital Corp., dated July 15, 2009 (incorporated by reference to Exhibit 10.6 to Steel Partners Holdings L.P.’s Registration Statement on Form 10 filed December 15, 2011).
|
|
10.6
|
Advance Agreement by and between Steel Partners Holdings L.P. and Steel Partners II Master Fund L.P., dated June 28, 2009 (incorporated by reference to Exhibit 10.7 to Steel Partners Holdings L.P.’s Registration Statement on Form 10 filed December 15, 2011).
|
|
10.7
|
Amended and Restated Services Agreement by and between Steel Partners Holdings L.P. and SP Corporate Services, LLC, effective as of dated July 15, 2009 (incorporated by reference to Exhibit 10.8 to Amendment No. 1 of Steel Partners Holdings L.P.’s Registration Statement on Form 10 filed January 20, 2012).
|
* Filed herewith.
|
10.8
|
Letter Agreement by and between Steel Partners Holdings L.P. and Steel Partners II GP LLC, dated July 15, 2009 (incorporated by reference to Exhibit 10.9 to Steel Partners Holdings L.P.’s Registration Statement on Form 10 filed December 15, 2011).
|
|
10.9
|
Management Services Agreement by and between SP Corporate Services LLC and Handy & Harman Ltd. and Handy & Harman Group Ltd., dated as of January 1, 2012 (incorporated by reference to Exhibit 10.10 to Amendment No. 1 of Steel Partners Holdings L.P.’s Registration Statement on Form 10 filed January 20, 2012).
|
|
21
|
Subsidiaries of Steel Partners Holdings L.P. (incorporated by reference to Exhibit 21 to Amendment No. 1 of Steel Partners Holdings L.P.’s Registration Statement on Form 10 filed January 20, 2012).
|
|
24
*
|
Power of Attorney (included in the signature page)
|
|
31.1
*
|
Certification by the Chief Executive Officer Pursuant to Section 302 of the Sarbanes-Oxley Act of 2002.
|
|
31.2
*
|
Certification by the Chief Financial Officer Pursuant to Section 302 of the Sarbanes-Oxley Act of 2002.
|
|
32.1
*
|
Certification by the Chief Executive Officer Pursuant to 18 U.S.C. Section 1350, as Adopted Pursuant to Section 906 of the Sarbanes-Oxley Act of 2002.
|
|
32.2
*
|
Certification by the Chief Financial Officer Pursuant to 18 U.S.C. Section 1350, as Adopted Pursuant to Section 906 of the Sarbanes-Oxley Act of 2002.
|
|
99.1
|
Financial Statements of Handy & Harman Ltd.( incorporated by reference to Exhibit 10.1 to Steel Partners Holdings L.P.’s Registration Statement on Form 10 filed on December 15, 2011).
|
|
99.2
*
|
Financial Statements of Steel Excel Inc.
|
|
99.3
**
|
Financial Statements of SL Industries, Inc.
|
|
99.4
**
|
Financial Statements of Steel Partners II Liquidating Series Trust.
|
* Filed herewith.
**
To be filed by amendment.
Pursuant to the requirements of Section 13 or 15(d) of the Securities Exchange Act of 1934, the registrant has duly caused this registration statement to be signed on its behalf by the undersigned, thereunto duly authorized.
|
Dated: March 26, 2012
|
STEEL PARTNERS HOLDINGS L.P.
|
|
|
By:
|
Steel Partners Holdings GP Inc.
|
|
|
Its General Partner
|
||
|
By:
|
/s/ Warren G. Lichtenstein
|
|
|
Warren G. Lichtenstein
|
||
|
Chairman and Chief Executive Officer
|
||
POWER OF ATTORNEY
Steel Partners Holdings L.P. and each of the undersigned do hereby appoint Warren G. Lichtenstein and James F. McCabe, Jr., and each of them severally, its or his true and lawful attorney to execute on behalf of Steel Partners Holdings L.P. and the undersigned any and all amendments to this Annual Report on Form 10-K and to file the same with all exhibits thereto and other documents in connection therewith, with the Securities and Exchange Commission; each of such attorneys shall have the power to act hereunder with or without the other.
Pursuant to the requirements of the Securities Exchange Act of 1934, this report has been signed below by the following persons in the capacities indicated with respect to Steel Partners Holdings GP Inc., the general partner of Steel Partners Holdings L.P., and on behalf of the registrant and on the dates indicated below by the following persons in the capacities and on the dates indicated.
|
By:
|
/s/ Warren G. Lichtenstein
|
March 26, 2012
|
|
|
Warren G. Lichtenstein, Chairman of the Board
|
Date
|
||
|
By:
|
/s/ James F. McCabe, Jr.
|
March 26, 2012
|
|
|
James F. McCabe, Jr., Chief Financial Officer
|
Date
|
||
|
(Principal Accounting Officer)
|
|||
|
By:
|
/s/ Jack L. Howard
|
March 26, 2012
|
|
|
Jack L. Howard, Director
|
Date
|
||
|
By:
|
/s/ Anthony Bergamo
|
March 26, 2012
|
|
|
Anthony Bergamo, Director
|
Date
|
||
|
By:
|
/s/ John P. McNiff
|
March 26, 2012
|
|
|
John P. McNiff, Director
|
Date
|
||
|
By:
|
/s/ Joseph L. Mullen
|
March 26, 2012
|
|
|
Joseph L. Mullen, Director
|
Date
|
||
|
By:
|
/s/ General Richard I. Neal
|
March 26, 2012
|
|
|
General Richard I. Neal, Director
|
Date
|
||
|
By:
|
/s/ Allan R. Tessler
|
March 26, 2012
|
|
|
Allan R. Tessler, Director
|
Date
|
198
TABLE OF CONTENTS
Part IItem 1. BusinessItem 1A. Risk FactorsItem 1B. Unresolved Staff CommentsItem 2. PropertiesItem 3. Legal ProceedingsItem 4. Mine Safety DisclosuresPart IIItem 5. Market For The Registrant S Common Equity and Related Stockholder Matters and Issuer Purchases Of Equity SecuritiesItem 6. Selected Financial DataItem 7. Management S Discussion and Analysis Of Financial Condition and Results Of OperationsItem 7A. Quantitative and Qualitative Disclosures About Market RiskItem 8. Financial Statements and Supplementary DataItem 9. Changes in and Disagreements with Accountants on Accounting and Financial DisclosureItem 9A. Controls and ProceduresItem 9B. Other InformationPart IIIItem 10. Directors, Executive Officers and Corporate GovernanceItem 11. Executive CompensationItem 12. Security Ownership Of Certain Beneficial Owners and Management and Related Stockholder MattersItem 13. Certain Relationships and Related Transactions, and Director IndependenceItem 14. Principal Accountant Fees and ServicesPart IVItem 15. Exhibits and Financial Statement Schedules