STEEL PARTNERS HOLDINGS L.P.
10-Ks and 10-Qs
|
|
|
|
|
|
|
|
|
|
|
|
|
|
|
|
|
|
|
|
|
|
|
|
|
|
|
|
|
|
|
|
|
|
|
|
|
|
|
|
|
|
|
|
|
|
|
|
|
|
|
|
|
UNITED STATES SECURITIES AND EXCHANGE COMMISSION
Washington, D.C. 20549
FORM 10-K
(Mark One)
|
þ
|
ANNUAL REPORT PURSUANT TO SECTION 13 OR 15(d) OF THE SECURITIES EXCHANGE ACT OF 1934
|
For The Fiscal Year Ended
December 31, 2014
OR
|
¨
|
TRANSITION REPORT PURSUANT TO SECTION 13 OR 15(d) OF THE SECURITIES EXCHANGE ACT OF 1934
|
Commission File Number: 001-35493
______________
STEEL PARTNERS HOLDINGS L.P.
(Exact name of registrant as specified in its charter)
|
Delaware
|
13-3727655
|
|
(State of Incorporation)
|
(I.R.S. Employer Identification No.)
|
|
590 Madison Avenue, 32
nd
Floor
|
|
|
New York, New York
|
10022
|
|
(Address of principal executive offices)
|
(Zip Code)
|
Registrant’s telephone number, including area code:
(212) 520-2300
Securities registered pursuant to Section 12(b) of the Act:
|
|
Name of each exchange on
|
|
Title of each class
|
which registered
|
|
Common units, $0 par
|
New York Stock Exchange
|
Securities registered pursuant to Section 12(g) of the Act:
Common Units, no par value
Indicate by check mark if the Registrant is a well-known seasoned issuer, as defined in Rule 405 of the Securities Act. Yes
¨
No
þ
Indicate by check mark if the Registrant is not required to file reports pursuant to Section 13 or Section 15(d) of the Act. Yes
¨
No
þ
Indicate by check mark whether the registrant: (1) has filed all reports required to be filed by Section 13 or 15(d) of the Securities Exchange Act of 1934 during the preceding 12 months (or for such shorter period that the registrant was required to file such reports), and (2) has been subject to such filing requirements for the past 90 days. Yes
þ
No
¨
Indicate by check mark whether the registrant has submitted electronically and posted on its corporate Web site, if any, every Interactive Data File required to be submitted and posted pursuant to Rule 405 of Regulation S-T (§232.405) during the preceding 12 months (or for such shorter period that the registrant was required to submit and post such files). Yes
þ
No
¨
Indicate by check mark if disclosure of delinquent filers pursuant to Item 405 of Regulation S-K is not contained herein, and will not be contained, to the best of registrant’s knowledge, in definitive proxy or information statements incorporated by reference in Part III of this Form 10-K or any amendment to this Form 10-K.
þ
Indicate by check mark whether the Registrant is a large accelerated filer, an accelerated filer, a non-accelerated filer or a smaller reporting company. See definition of “accelerated filer and large accelerated filer” in Rule 12b-2 of the Exchange Act. (Check one):
|
Large accelerated filer
|
o
|
Non-accelerated filer
|
o
|
|
|
Accelerated filer
|
þ
|
Smaller reporting company
|
o
|
|
Indicate by check mark whether the registrant is a shell company (as defined by Rule 12b-2 of the Exchange Act). Yes
o
No
þ
The aggregate market value of our common units held by non-affiliates of registrant as of June 30, 2014 was approximately
$323.9
million.
On
March 9, 2015
, there were
27,521,280
common units outstanding.
DOCUMENTS INCORPORATED BY REFERENCE
The information required by Items 10, 11, 12, 13 and 14 of Part III will be incorporated by reference to certain portions of a definitive proxy statement, which will be filed by the Registrant within 120 days after the close of its fiscal year.
STEEL PARTNERS HOLDINGS L.P.
TABLE OF CONTENTS
|
PART I
|
||
|
Item 1.
|
||
|
Item 1A.
|
||
|
Item 1B.
|
||
|
Item 2.
|
||
|
Item 3.
|
||
|
Item 4.
|
||
|
|
||
|
PART II
|
||
|
Item 5.
|
||
|
Item 6.
|
||
|
Item 7.
|
||
|
Item 7A.
|
||
|
Item 8.
|
||
|
Item 9.
|
||
|
Item 9A.
|
||
|
Item 9B.
|
||
|
|
||
|
PART III
|
||
|
Item 10.
|
||
|
Item 11.
|
||
|
Item 12.
|
||
|
Item 13.
|
||
|
Item 14.
|
||
|
|
||
|
PART IV
|
||
|
Item 15.
|
||
As used in this Form 10-K, unless the context otherwise requires the terms “we,” “us,” “our,” “SPLP” and the “Company” refer to Steel Partners Holdings L.P., a Delaware limited partnership.
FORWARD-LOOKING STATEMENTS
This report includes “forward-looking statements” within the meaning of Section 27A of the Securities Act of 1933, as amended (the “Securities Act”), and Section 21E of the Securities Exchange Act of 1934, as amended (the “Exchange Act”), including, in particular, forward-looking statements under the headings “Item 7- Management’s Discussion and Analysis of Financial Condition and Results of Operations” and “Item 8 - Financial Statements and Supplementary Data.” These statements appear in a number of places in this report and include statements regarding the Company’s intent, belief or current expectations with respect to (i) its financing plans, (ii) trends affecting its financial condition or results of operations, and (iii) the impact of competition. The words “expect,” “anticipate,” “intend,” “plan,” “believe,” “seek,” “estimate,” and similar expressions are intended to identify such forward-looking statements; however, this report also contains other forward-looking statements in addition to historical information.
Item 1.
Business
All monetary amounts used in this discussion are in thousands unless otherwise indicated.
Who We Are
Steel Partners Holdings L.P. ("SPLP" or the "Company") is a global diversified holding company that engages in multiple businesses, including diversified industrial products, energy, defense, supply chain management and logistics, banking, food products and services, sports, training, education, and the entertainment and lifestyle industries.
Each of our companies has its own management team with significant experience and proven success in their industries. Our subsidiary, SP Corporate Services LLC (“SP Corporate”), through Management Services Agreements, provides services to us and some of our companies which include assignment of C-Level management personnel, as well as a variety of services including legal, tax, accounting, treasury, consulting, auditing, administrative, compliance, environmental health and safety, human resources, marketing, investor relations and other similar services.
We work with our businesses to increase corporate value over the long term for our unitholders and all stakeholders by implementing our unique strategy discussed in more detail below.
Our History
SPLP is a limited partnership formed in the State of Delaware on December 16, 2008. SPLP is the successor through a merger on December 31, 2008 with WebFinancial Corporation ("Webfinancial"), a Delaware corporation that was incorporated in 1997. Webfinancial acquired WebBank in 1998.
In December 2008, in order to preserve an investment strategy that successfully served both the company and its investors since its inception, Steel Partners restructured its business. The result was the creation of Steel Partners Holdings L.P., a limited partnership formed in the State of Delaware in December 2008.
Effective July 15, 2009, the Company completed an exchange transaction in which we acquired the limited partnership interest of Steel Partners II, L.P. (“SPII”) pursuant to which we acquired net assets of $454,300 that were held by SPII, consisting of holdings in a variety of companies, in exchange for our common units which were distributed to certain former indirect investors in SPII (the “Exchange Transaction”). As a result, we became a global diversified holding company, with partners' capital of $367,100 as of July 15, 2009, which has increased to
$494,859
as of
December 31, 2014
. Since July 15, 2009, we have concentrated our holdings into a select number of businesses.
On April 10, 2012, after fulfilling stringent regulatory and financial reporting requirements, the company became listed on the New York Stock Exchange (NYSE: SPLP).
2
Our Structure
SPLP is managed by SP General Services LLC (the “Manager”), pursuant to the terms of an amended and restated management agreement (the “Management Agreement”) discussed in further detail in Note 13 – "Related Party Transactions" to the SPLP consolidated financial statements found elsewhere in this Form 10-K. From its founding in 1990, the Manager and its affiliates have focused on increasing value for investors in the entities it has managed, including SPLP and SPII.
Our wholly-owned subsidiary, Steel Partners Holdings GP Inc., formerly known as Web LLC and Steel Partners Holdings GP LLC, or the “General Partner”, is our general partner. The General Partner converted from a limited liability company to a corporation on September 21, 2010. The General Partner has a board of directors (the “Board of Directors”). The Board of Directors is currently comprised of seven members, five of whom are elected annually by our unitholders and two of whom are appointed by the Manager. Warren G. Lichtenstein, the Executive Chairman of our Manager, serves as the Chairman of the Board of Directors.
Our Strategy
We continuously evaluate the retention and disposition of existing operations and investigate possible acquisitions of new businesses, often focusing on businesses that are selling substantially below intrinsic value. We consider possible synergies and economies of scale in operating and/or making determinations to acquire or dispose of companies. We seek additional means to reduce costs and to encourage integration of operations and the building of business relationships among our companies consistent with our desire that our unitholders benefit from the diversified holding company structure.
We strive to enhance the business operations of our companies and increase long-term value for unitholders and stakeholders through balance sheet improvements, strategic allocation of capital and operational and growth initiatives. Our operational initiatives include creating efficiencies through consolidated purchasing and materials sourcing provided by the
Steel Partners Purchasing Council,
which arranges shared purchasing programs and is reducing costs for, and providing other benefits to, a number of our companies. We are reducing our companies' operational costs, and enhancing growth and profitability, through the implementation of
Steel Partners Operational Excellence Programs
, which include the deployment of Lean Manufacturing, Design for Six Sigma, Six Sigma and Strategy Deployment. We are focused on reducing corporate overhead of our companies by centralizing certain administrative and corporate services through
Steel Partners Corporate Services
that provides management, consulting and advisory services.
Generally, we seek to actively acquire and maintain control over our companies through our ability to influence their policies. Depending on the size of our ownership interests in any given company, this may be achieved by obtaining board representation and overseeing and providing assistance to the existing management team. We generally view our companies as long-term holdings and we expect to realize value by operating them with a view towards fostering growth and maximizing their value rather than through the sale of ownership interests. The securities of some of the companies in which we have interests are traded on national securities exchanges, while others are privately held or not actively traded.
The following table presents the composition of our operating segments, which include the operations of our consolidated subsidiaries, as well as income or loss from equity method investments and other investments.
|
Diversified Industrial
|
Energy
|
Financial Services
|
Corporate and Other
|
|
Handy & Harman Ltd. ("HNH")
(1)
|
Steel Excel Inc. ("Steel Excel")
(1)
|
WebBank
(1)
|
SPH Services, Inc. ("SPH Services")
(1)
|
|
SL Industries, Inc. ("SLI")
(2)
|
BNS Holding, Inc. ("BNS")
(1), (3)
|
DGT Holdings Corp. ("DGT")
(1)
|
|
|
JPS Industries, Inc. ("JPS")
(2)
|
BNS Holdings Liquidating Trust ("BNS Liquidating Trust")
(1), (3)
|
||
|
ModusLink Global Solutions, Inc.
(2)
|
|||
|
CoSine Communications, Inc. ("CoSine")
(2)
|
|||
|
SPII Liquidating Trust
(2)
|
|||
|
Other Investments
(4)
|
|||
|
(1)
|
Consolidated subsidiary
|
|
(2)
|
Equity method investment
|
|
(3)
|
The operations of BNS are included in the Energy segment through June 30, 2012. The results of the BNS Liquidating Trust are included in the Corporate and Other segment beginning July 1, 2012.
|
|
(4)
|
Other investments classified in the Corporate and Other segment include various investments in available-for-sale securities in the Aerospace/Defense, Restaurant and Manufacturing industries.
|
3
Our Businesses - Consolidated Subsidiaries
Handy & Harman Ltd.
SPLP's Ownership Interest
SPLP has an ownership interest of approximately
66.2%
as of
December 31, 2014
in HNH. (NASDAQ (CM): HNH), formerly known as WHX Corporation, a Delaware corporation. On May 7, 2010, our ownership interest in HNH exceeded 50%, and as a result, HNH became a controlled subsidiary of SPLP and is consolidated from that date. Four of our representatives serve on HNH's eight-member board of directors, one of whom serves as Chairman. Our representatives also serve as the Executive Chairman (Principal Executive Officer), Chief Financial Officer (Principal Accounting Officer), Chief Legal Officer and as various Vice Presidents of HNH.
Description of Business
HNH is a diversified manufacturer of engineered niche industrial products with leading market positions in many of the markets it serves. Through its wholly-owned subsidiaries, HNH focuses on high margin products and innovative technology and serves customers across a wide range of end markets. HNH sells its products and services through direct sales forces, distributors and manufacturer's representatives. HNH owns Handy & Harman Group Ltd. ("H&H Group"), which owns Handy & Harman ("H&H") and Bairnco LLC, formerly Bairnco Corporation. HNH manages its group of businesses on a decentralized basis with operations principally in North America. For the years ended
December 31, 2014
,
2013
and
2012
, HNH generated net sales of
$600,468
,
$571,164
and
$498,713
, respectively, which comprised
71%
,
79%
and
79%
of SPLP's consolidated revenues, respectively.
In 2014 HNH entered into an agreement to sell Arlon LLC ("Arlon") which operations comprised substantially all of HNH's former Arlon Electronic Materials business. The sale was finalized in January 2015.
HNH Products and Product Mix
Joining Materials
HNH's Joining Materials business primarily fabricates precious metals and their alloys into brazing alloys. Brazing alloys are used to join similar and dissimilar metals, as well as specialty metals and some ceramics, with strong, hermetic joints. The Joining Materials business offers these metal joining products in a wide variety of alloys, including gold, silver, palladium, copper, nickel, aluminum and tin. These brazing alloys are fabricated into a variety of engineered forms and are used in many industries, including electrical, appliance, transportation, construction and general industrial, where dissimilar material and metal joining applications are required. Operating income from precious metal products is principally derived from the "value added" of processing and fabricating and not from the purchase and resale of precious metals. The Joining Materials business enters into commodity futures and forward contracts to mitigate the impact of price fluctuations on its precious and certain non-precious metal inventories that are not subject to fixed price contracts. HNH believes that the business unit that comprises the Joining Materials business is the North American market leader in many of the markets that it serves.
Tubing
HNH's Tubing business manufactures a wide variety of steel tubing products. HNH believes that its Tubing business manufactures the world's longest continuous seamless stainless steel tubing coils, in excess of 5,000 feet, serving the petrochemical infrastructure and shipbuilding markets. In addition, HNH also believes it is the number one supplier of small diameter (less than 3 mm) coil tubing to industry leading specifications serving the aerospace, defense and semiconductor fabrication markets. This unit also manufactures welded carbon steel tubing in coiled and straight lengths with a primary focus on products for the transportation, appliance and heating and oil and gas industries. In addition to producing bulk tubing, it produces value added fabrications for several of these industries.
Building Materials
HNH's Building Materials business manufactures and supplies products primarily to the commercial construction and building industries. It manufactures fasteners and fastening systems for the U.S. commercial low slope roofing industry, which are sold to building and roofing material wholesalers, roofing contractors and private label roofing system manufacturers, and a line of engineered specialty fasteners for the building products industry for fastening applications in the remodeling and
4
construction of homes, decking and landscaping. HNH believes that its primary business unit in the Building Materials business is the market leader in fasteners and accessories for commercial low-slope roofing applications and that the majority of the net sales for the segment are for the commercial construction repair and replacement market.
Kasco Blades and Route Repair Services
HNH's Kasco Blades and Route Repair Services business provides meat-room blade products, repair services and resale products for the meat and deli departments of supermarkets, restaurants, meat and fish processing plants, and for distributors of electrical saws and cutting equipment, principally in North America and Europe. Kasco also provides wood cutting blade products for the pallet manufacturing, pallet recycler and portable saw mill industries in North America.
Business Strategy
HNH's business strategy is to enhance the growth and profitability of the HNH business units and to build upon their strengths through internal growth and strategic acquisitions. HNH expects to continue to focus on high margin products and innovative technology. HNH also will continue to evaluate, from time to time, the sale of certain businesses and assets, as well as strategic and opportunistic acquisitions.
HNH uses a set of tools and processes called the HNH Business System to drive operational and sales efficiencies across each of its business units. The HNH Business System is designed to drive strategy deployment and sales and marketing based on lean principles. HNH pursues a number of ongoing strategic initiatives intended to improve its performance, including objectives relating to manufacturing improvement, idea generation, product development and global sourcing of materials and services. HNH utilizes lean tools and philosophies in operations and commercialization activities to increase sales, improve business processes, and reduce and eliminate waste, coupled with the tools targeted at variation reduction.
Customers
HNH is diversified across industrial markets and customers. HNH sells to customers in the construction, electrical, transportation, utility, medical, oil and gas exploration and food industries.
No customer accounted for more than 10% of HNH's consolidated net sales in
2014
,
2013
or
2012
. HNH's 15 largest customers accounted for approximately 31% of consolidated HNH net sales in 2014.
Foreign Revenue
The following table presents HNH revenue for the periods indicated:
|
Revenue
|
|||||||||||
|
Year Ended December 31,
|
|||||||||||
|
2014
|
2013
|
2012
|
|||||||||
|
U.S.
|
$
|
550,071
|
|
$
|
518,631
|
|
$
|
446,387
|
|
||
|
Foreign (a)
|
50,397
|
|
52,533
|
|
52,326
|
|
|||||
|
Total
|
$
|
600,468
|
|
$
|
571,164
|
|
$
|
498,713
|
|
||
|
(a)
|
Foreign revenue is based on the country in which the legal subsidiary generating the revenue is domiciled.
|
Raw Materials
Besides precious metals, the raw materials used in the operations of the Joining Materials, Tubing, Building Materials and Kasco operations consist principally of stainless, galvanized and carbon steel, copper, tin, nickel alloys, a variety of high-performance alloys and various plastic compositions. HNH purchases all such raw materials at open market prices from domestic and foreign suppliers. HNH has not experienced any significant problem in obtaining the necessary quantities of raw materials. Prices and availability, particularly of raw materials purchased from foreign suppliers, are affected by world market conditions and government policies. The raw materials used by HNH in its non-precious metal products are generally readily available from more than one source.
5
Capital Investments
HNH believes that in order to be and remain competitive, its businesses must continuously strive to improve productivity and product quality, and control and/or reduce manufacturing costs. Accordingly, HNH expects to continue to incur capital investments that reduce overall manufacturing costs, improve the quality of products produced and broaden the array of products offered to the industries HNH serves, as well as replace equipment as necessary to maintain compliance with environmental, health and safety laws and regulations. HNH's capital expenditures for
2014
,
2013
and
2012
for continuing operations were $12,700, $11,700 and $15,200, respectively. HNH anticipates funding its capital expenditures in 2015 from funds generated by operations and borrowed funds. HNH anticipates its capital expenditures to be in the range between $15,000 and $31,000 per year for the next several years.
HNH requires significant amounts of electricity and natural gas to operate its facilities and is subject to price changes in these commodities. A shortage of electricity or natural gas, or a government allocation of supplies resulting in a general reduction in supplies, could increase costs of production and could cause some curtailment of production.
Employees
As of
December 31, 2014
HNH employed 1,925 employees worldwide. Of these employees, 377 were sales employees, 479 were office employees, 148 were covered by collective bargaining agreements, and 921 were non-union operating employees. A total of 321 employees are associated with HNH's Arlon business.
Competition
There are many companies, larger and smaller, domestic and foreign, which manufacture products of the type HNH manufactures. Some of these competitors are larger than HNH and have financial resources greater than it does. Some of these competitors enjoy certain other competitive advantages, including greater name recognition, greater financial, technical, marketing and other resources, a larger installed base of customers and well-established relationships with current and potential customers. Competition is based on quality, technology, service, and price, and in some industries, new product introduction.
Sales Channels
HNH distributes products to customers through its sales personnel, outside sales representatives and distributors in North and South America, Europe, Australia, Asia and several other international markets.
Patents and Trademarks
HNH owns patents and registered trademarks under which certain of its products are sold. In addition, HNH owns a number of U.S. and foreign mechanical patents related to certain of its products, as well as a number of design patents. HNH does not believe that the loss of any or all of these patents or trademarks would have a material adverse effect on its businesses. HNH's patents have remaining durations ranging from less-than-one year to 18 years, with expiration dates occurring at various times in 2015 through 2033.
Environmental Regulation
HNH is subject to laws and regulations relating to the protection of the environment. HNH does not presently anticipate that compliance with currently applicable environmental regulations and controls will significantly change its competitive position, capital spending or earnings during 2015. HNH believes it is in compliance with all orders and decrees it has consented to with environmental regulatory agencies. Please see "Item 1A - Risk Factors," "Item 3 - Legal Proceedings" and Note 21 - "Commitments and Contingencies" to the SPLP consolidated financial statements included in "Item 8 - Financial Statements and Supplementary Data."
6
Steel Excel Inc.
Our Ownership Interest
We have an ownership interest of approximately
57.9%
as of
December 31, 2014
in Steel Excel, a Delaware corporation formerly known as ADPT Corporation (OTC: SXCL.PK). On May 31, 2012, our ownership percentage exceeded 50%, and Steel Excel became a majority-owned subsidiary and is consolidated from that date forward (see Note 3 - "Acquisitions" to the SPLP consolidated financial statements found elsewhere in this Form 10-K). Three of our representatives serve on Steel Excel's six-member board of directors, one of whom serves as Chairman and another of whom serves as the Chief Executive Officer. Our representatives also serve as Chief Financial Officer and General Counsel. Steel Excel is part of our Energy segment. Energy segment revenues totaled
$210,148
,
$120,029
and
$92,834
for the years ended
December 31, 2014
,
2013
and
2012
, respectively, which comprised
25%
,
17%
and
15%
of SPLP's consolidated revenues, respectively.
Description of Business
Through its wholly-owned subsidiary Steel Energy Ltd. ("Steel Energy"), Steel Excel’s Energy business
provides drilling and production services to the oil and gas industry. Through its wholly-owned subsidiary Steel Sports Inc., Steel Excel’s Sports business provides event-based sports services and other health-related services. Steel Excel also makes significant non-controlling investments in entities in industries related to its existing businesses as well as entities in other unrelated industries and continues to identify business acquisition opportunities in both the Energy and Sports industries as well as in other unrelated industries.
Sales
Steel Excel relies primarily on its local operations to sell and market its services. Because they have conducted business together over several years, the members of its local operations have established strong working relationships with certain of their clients. These strong client relationships provide a better understanding of region-specific issues and enable Steel Excel to better address customer needs. In 2014, Steel Excel had two customers, that made up 20% or more of its net revenues, and its top 15 customers made up 81%, 81% and 89% of its net revenues for the years ended
December 31, 2014
,
2013
, and during the seven month period owned by SPLP in 2012, respectively.
Competition
Steel Excel's business operates in a highly competitive industry that is influenced by price, capacity, reputation, and experience. When oil and natural gas prices and drilling activities are at high levels, service companies are ordering new equipment to expand their capacity as they are seeing increased demand for their services and attractive returns on investment. When oil and natural gas prices are declining, service companies may be willing to provide their services at reduced prices to be able to cover their equipment and other fixed costs. To be successful, Steel Excel must provide quality services that meet the specific needs of oil and gas exploration and production companies at competitive prices. In addition, we need to maintain a safe work environment and a well-trained work force to remain competitive.
Steel Excel's energy services are affected by seasonal factors, such as inclement weather, fewer daylight hours, and holidays during the winter months. Heavy snow, ice, wind, or rain can make it difficult to operate and to move equipment between work sites, which can reduce its ability to provide services and generate revenues. These seasonal factors affect Steel Excel's competitors as well. Demand for services in the industry as a whole fluctuates with the supply and demand for oil and natural gas. In general, the need for Steel Excel's services increases when demand exceeds supply. The oil and gas exploration and production companies attempt to take advantage of a higher-priced environment when demand exceeds supply, which leads to an increased need for Steel Excel's services. Conversely, as supply equals or exceeds demand, the oil and gas exploration and production companies will cut back on their production resulting in a decline in their well servicing needs or seek pricing concessions from us and other service providers when the price of oil declines.
The market for the Steel Excel's Sports business’ baseball facility services and soccer camps and leagues is very fragmented, and its competitors are primarily small local or regional operations. The market for its strength and conditioning services is fragmented, and its competitors vary from large national providers of such services to local providers of comparable or other niche services. The baseball facility services and soccer camps and leagues are affected by seasonal factors, with business volume declining from late autumn through early spring as a result of colder temperatures and fewer daylight hours. In addition, inclement weather during peak seasons can have an adverse effect on the business since fields may not be available to reschedule any canceled events. In 2013, Steel Excel completed the construction of an indoor baseball facility to enable it to
7
provide year-round baseball services to partially mitigate the revenue declines experienced in non-peak months and during periods of inclement weather.
Government Regulation
Steel Excel's businesses are subject to multiple federal, state, and local laws and regulations pertaining to worker safety, the handling of hazardous materials, transportation standards, and the environment. Among the various environmental laws Steel Excel is subject to, the Clean Water Act established the basic structure for regulating discharges of pollutants into the waters of the United States and quality standards for surface waters. Steel Excel's businesses could be required to obtain permits for the discharge of wastewater or stormwater. In addition, the Oil Pollution Act of 1990 imposed a multitude of requirements on responsible parties related to the prevention of oil spills and liability for damages resulting from such spills in the waters of the United States. These and comparable state laws provide for administrative, civil, and criminal penalties for unauthorized discharges and impose stringent requirements for spill prevention and response planning, as well as considerable potential liability for the costs of removal and damages in connection with unauthorized discharges.
The Comprehensive Environmental Response, Compensation and Liability Act, as amended, and comparable state
laws (“CERCLA” or “Superfund”) impose liability without regard to fault or the legality of the original conduct on certain defined parties, including current and prior owners or operators of a site where a release of hazardous substances occurred and entities that disposed or arranged for the disposition of the hazardous substances found at the site. Under CERCLA, these parties may be subject to joint and several liability for the costs of cleaning up the hazardous substances that were released into the environment and for damages to natural resources. Further, claims may be filed for personal injury and property damages allegedly caused by the release of hazardous substances and other pollutants. We may encounter materials that are considered hazardous substances in the course of our operations. As a result, Steel Excel may incur CERCLA liability for cleanup costs and be subject to related third-party claims. Steel Excel also may be subject to the requirements of the Resource Conservation and Recovery Act, as amended, and comparable state statutes (“RCRA”) related to solid wastes. Under CERCLA or RCRA, Steel Excel could be required to clean up contaminated property (including contaminated groundwater) or to perform remedial activities to prevent future contamination.
Steel Excel's businesses are also subject to the Clean Air Act, as amended, and comparable state laws and regulations that restrict the emission of air pollutants and impose various monitoring and reporting requirements. These laws and regulations may require Steel Excel to obtain approvals or permits for construction, modification, or operation of certain projects or facilities and may require use of emission controls. Various scientific studies suggest that emissions of greenhouse gases, including, among others, carbon dioxide and methane, contribute to global warming. While it is not possible to predict how legislation or new regulations that may be adopted to address greenhouse gas emissions would impact Steel Excel's business, any new restrictions on emissions that are imposed could result in increased compliance costs for, or additional operating restrictions on, its customers and, which could have an adverse effect on its business.
Steel Excel is also subject to the Occupational Safety and Health Act, as amended, (“OSHA”) and comparable state laws that regulate the protection of employee health and safety. OSHA’s hazard communication standard requires that information about hazardous materials used or produced in its operations be maintained and provided to employees and state and local government authorities. Steel Excel believes they are in substantial compliance with OSHA and comparable state law requirements, including general industry standards, record keeping requirements, and monitoring of occupational exposure to regulated substances.
Steel Excel cannot predict the level of enforcement or the interpretation of existing laws and regulations by enforcement agencies in the future, or the substance of future court rulings or permitting requirements. In addition, Steel Excel cannot predict what additional laws and regulations may be put in place in the future, or the effect of those laws and regulations on its business and financial condition. Steel Excel believes it is in substantial compliance with applicable environmental laws and regulations. While Steel Excel does not believe that the cost of compliance is material to our business or financial condition, it is possible that substantial costs for compliance or penalties for non-compliance may be incurred in the future.
Employees
As of
December 31, 2014
, Steel Excel had 1,000 employees, of which 923 were full-time employees and 77 were part-time employees. All of Steel Excel's employees are located in the United States. Steel Excel also hires additional full-time and part-time employees during peak seasonal periods. None of Steel Excel's employees are covered by collective bargaining agreements. Steel Excel considers its employee relations to be satisfactory.
8
WebBank
Our Ownership Interest
SPLP's wholly owned subsidiary, WebFinancial Holding Corporation, conducts financial operations through its wholly-owned subsidiary, WebBank (“WebBank”). WebBank is part of our Financial Services segment. For the years ended
December 31, 2014
,
2013
and
2012
the Financial Services segment had revenues of
$36,647
,
$28,185
and
$21,155
, respectively, which comprised
4%
,
4%
and
3%
of SPLP's consolidated revenues, respectively.
Description of Business
WebBank is a Utah chartered industrial bank subject to comprehensive regulation, examination, and supervision of the Federal Deposit Insurance Corporation (“FDIC”) and the State of Utah Department of Financial Institutions (“UDFI”). WebBank is not considered a “bank” for Bank Holding Company Act purposes and, as such, SPLP is not regulated as a bank holding company. WebBank, whose deposits are insured by the FDIC, generates commercial and consumer loans.
WebBank continues to evaluate its different business lines and consider various alternatives to maximize the aggregate value of its businesses and increase value, including seeking acquisitions and/or merger transactions, as well as product line extensions, additions and/or divestitures.
Sales
WebBank generates revenue through a combination of interest income and non-interest income. Interest income is primarily derived from interest and origination fees earned on loans and investments. Non-interest income is primarily derived from minimum activity fee income on contractual lending arrangements, premiums on the sale of loans, and loan servicing fees. For the years ended
December 31, 2014
,
2013
and
2012
, two contractual lending programs accounted for 35%, 46% and 56%, respectively, of WebBank's total revenue.
Government Regulation
WebBank is subject to regulatory capital requirements administered by the FDIC. Under capital adequacy guidelines and the regulatory framework for prompt corrective action, WebBank must meet specific capital guidelines that involve quantitative measures of WebBank’s assets, liabilities, and certain off-balance sheet items as calculated under regulatory accounting practices. WebBank’s capital amounts and classification are also subject to qualitative judgments by the regulators about components, risk weightings, and other factors. Failure to meet minimum capital requirements can initiate certain actions by regulators that, if undertaken, could have a direct material adverse effect on WebBank’s financial statements. In addition, federal banking laws and regulations generally would prohibit WebBank from making any capital distribution (including payment of a dividend) if WebBank would be under-capitalized thereafter. Undercapitalized depository institutions are subject to growth limitations and must submit a capital restoration plan, which must be guaranteed by the institution’s holding company. In addition, an undercapitalized institution is subject to increased monitoring and greater regulatory approval requirements.
Currently, WebBank meets or exceeds all applicable regulatory capital requirements.
Competition
WebBank competes with a broad range of banks across its various lines of business.
Employees
As of
December 31, 2014
, WebBank had 38 employees.
BNS Liquidating Trust
Our Ownership Interest
We have an ownership interest of approximately
84.9%
as of
December 31, 2014
in BNS Liquidating Trust (previously BNS Holding, Inc.). In June 2012, BNS, in accordance with its shareholder approval plan, distributed its assets and commenced its liquidation. See "Description of Business" section below for additional details.
9
Description of Business
BNS was a holding company whose operations ceased as of June 1, 2012 due to the sale of Sun Well Service, Inc. ("Sun Well") to Steel Excel on May 31, 2012 (see Note 3 - "Acquisitions" to the SPLP consolidated financial statements found elsewhere in this Form 10-K). BNS' results include the operations of Sun Well (originally acquired by BNS on February 2, 2011) through the date of sale to Steel Excel. On June 18, 2012, BNS completed a distribution to its shareholders, pursuant to shareholder approval, and distributed cash of approximately $10,300 to its minority shareholders and 2,027,500 shares of Steel Excel common stock to its majority shareholder. No further distributions are anticipated. In June 2012, BNS formed a liquidating trust, the BNS Liquidating Trust, assigned its assets and liabilities to the Trust and initiated its dissolution. The Trust is owned by the BNS former shareholders in the same proportion as their former ownership in BNS.
Employees
The BNS Liquidating Trust had no employees as of
December 31, 2014
.
DGT Holdings Corp.
Our Ownership Interest
We have an ownership interest of approximately
82.7%
as of
December 31, 2014
in DGT (OTC: DGTC.OB), a New York corporation. On July 5, 2011, our ownership interest in DGT exceeded 50%, and as a result, DGT became a controlled subsidiary of SPLP and is consolidated from that date. Two of our representatives serve on DGT's four-member board of directors, one of which serves as DGT's President, Chief Executive Officer and Chief Financial Officer, and one is Chairman.
Description of Business
DGT's operations currently consist of a real estate business from the rental of a building retained from the sale of its Medical Systems Group on November 3, 2011 (for additional information, see Note 4 - "Discontinued Operations" to the SPLP consolidated financial statements found elsewhere in this Form 10-K). Continuing operations consist of the real estate business, investments, and general and administrative expenses.
Employees
As of
December 31, 2014
, DGT had no employees.
SPH Services, Inc.
Our Ownership Interest
SPH Services, Inc. (“SPH Services”) is our wholly-owned subsidiary. Three of our representatives serve as members, including Chairman, of the board of directors of SPH Services. These representatives also serve as SPH Services' Chief Executive Officer, President, Secretary, Chief Financial Officer and Treasurer.
Description of Business
SPH Services, which commenced operations on January 1, 2012, was created to consolidate the executive and corporate functions of SPLP and certain of our affiliates, including SP Corporate and Steel Partners LLC, to provide legal, tax, accounting, treasury, consulting, auditing, administration, compliance, environmental health and safety, human resources, marketing, investor relations and similar services, to other affiliated companies. In connection with the formation of SPH Services, we acquired SP Corporate and Steel Partners LLC, our former manager, as well as certain assets from HNH.
SP Corporate has management services agreements with HNH, Steel Excel, WebBank, BNS, DGT and other related companies. Services provided to SPLP and its consolidated subsidiaries are eliminated in consolidation. For additional information on these service agreements see Note 13 - "Related Party Transactions" to the SPLP consolidated financial statements found elsewhere in this Form 10-K.
By consolidating corporate overhead and back office functions, SPLP believes it will achieve cost savings over time for its affiliated companies while delivering more efficient and effective services. As a result of the synergies associated with SP
10
Corporate's specialization and capabilities across a broad range of corporate and executive functions that are provided to SPLP and other companies, SP Corporate believes that it will be able to create high value business partnerships by delivering higher quality services and more efficient transaction processing which will result in significant cost savings that can be achieved through standardization, clear processes and procedures, the elimination of non-value adding activities and economies of scale.
Employees
As of
December 31, 2014
, SPH Services had 65 employees.
Our Business - Equity Method Investments
Associated Companies
Associated companies are investments in operating companies in which we own between 20% and 50% of the outstanding equity and have the ability to exercise significant influence, but not control, over the investee. As such, the investments in these operating companies are accounted for under the equity method of accounting (see Note 2 - "Summary of Significant Accounting Policies" - to the SPLP consolidated financial statements found elsewhere in this Form 10-K). The investments in associated companies are classified as Long-term investments in the Consolidated Balance Sheets (see Note 5 - "Investments" to the SPLP consolidated financial statements found elsewhere in this Form 10-K).
Accounted for at fair value, as of
December 31, 2014
:
ModusLink Global Solutions, Inc.
We have an ownership interest of approximately
27.7%
as of
December 31, 2014
in MLNK (NASDAQ: MLNK), a Delaware corporation. MLNK provides supply chain and logistics services to companies in consumer electronics, communications, computing, medical devices, software, luxury goods and retail. In March 2013, pursuant to an agreement between the Company and MLNK, SPLP purchased
7,500,000
shares of MLNK common stock for $4.00 per share. This investment, plus the 6,481,185 MLNK shares already owned by the Company and its subsidiaries, gave the Company a
27.1%
ownership interest in MLNK common stock. Accordingly the investment, which was previously classified as an available-for-sale security, was reclassified to an associated company as of March 12, 2013. Two members of SPLP's management team serve on the five-member MLNK board of directors, one of whom serves as chairman. SPLP elected the fair value option to account for MLNK in order to more appropriately reflect the value of MLNK in its financial statements and records any unrealized gains and losses in earnings.
SL Industries, Inc.
We have an ownership interest of approximately
24.0%
as of
December 31, 2014
in SLI (AMEX:SLI), a New Jersey corporation. SLI designs, manufactures and markets power electronics, motion control, power protection and specialized communication equipment. SLI's products are used in a variety of medical, commercial and military aerospace, computer, datacom, industrial, telecom, transportation, utility, rail and highway equipment applications. Two of our representatives serve on SLI's five-member board of directors, one of whom serves as Chairman. SPLP elected the fair value option to account for SLI in order to more appropriately reflect the value of SLI in its financial statements and records any unrealized gains and losses in earnings.
JPS Industries, Inc.
We have an ownership interest of approximately
38.7%
as of
December 31, 2014
in JPS (OTC: JPST.PK), a Delaware corporation. JPS is a major U.S. manufacturer of extruded urethanes, ethylene vinyl acetates and mechanically formed glass and aramid substrate materials for specialty applications in a wide expanse of markets requiring highly engineered components. JPS’s products are used in a wide range of applications including: printed electronic circuit boards; advanced composite materials; civilian and military aerospace components; filtration and insulation products; specialty commercial construction substrates; high performance glass laminates for security and transportation applications; photovoltaic solar modules; paint protection films; plasma display screens; medical, automotive and industrial components; and soft body armor for civilian and military applications.
During the second quarter of 2013, JPS stockholders elected
2
members of SPLP's management team to their board to serve
1
-year terms, one of which will serve as chairman. As a result of the foregoing events, the investment in JPS, which was
11
previously classified as an available-for-sale security in 2012, was reclassified to an associated company as of June 30, 2013. SPLP elected the fair value option to account for JPS in order to more appropriately reflect the value of JPS in its financial statements and records any unrealized gains and losses in earnings.
On January 26, 2015, HNH announced its has commenced a tender offer to purchase up to 10,028,724 shares, or approximately 96.5% of the outstanding shares, of common stock of JPS at a price of $10.00 per share in cash to all stockholders other than SPLP and with respect to the 4,021,580 JPS shares owned by SPLP, in exchange for common stock of HNH. If all shares are tendered, HNH would exchange approximately $60,100 in cash and 863,946 shares of its common stock.
Fox & Hound Restaurant Group
We previously had an indirect ownership interest in Fox & Hound Restaurant Group, a Delaware corporation (“Fox & Hound”). Fox & Hound is a privately held owner and operator of a chain of approximately 130 company-owned and 14 franchised social destination casual dining and entertainment-based restaurants in 32 states. Two of our representatives served on Fox & Hound's four-member board of directors. During the third quarter of 2013, due to the current and projected operating performance of Fox & Hound, the Company wrote its investment down to zero. On December 15, 2013, Fox & Hound filed voluntary petitions for relief under chapter 11 of title 11 of the United States Code in the United States Bankruptcy Court for the District of Delaware. The Bankruptcy Court approved a plan to sell the assets of Fox & Hound and the sale closed on March 12, 2014. The Company did not receive a distribution at the conclusion of the chapter 11 process.
Other
The Company has an investment in a Japanese real estate partnership. In the second quarter of 2013, the Company reclassified this investment to an associated company.
API Technologies Corp. ("API Tech")
In May 2014 our subsidiary Steel Excel, acquired an ownership interest of approximately 20.6% in API Tech. API Tech is a designer and manufacturer of high performance systems, subsystems, modules, and components. Effective as of that date the investment in API Tech has been accounted for as an equity method investment using the fair value option. Steel Excel elected the fair value option to account for its investment in API Tech in order to more appropriately reflect the value of API Tech in its financial statements. Prior to such time, the investment in API Tech was accounted for as an available-for-sale security.
Accounted for under the traditional equity method as of
December 31, 2014
:
CoSine Communications, Inc.
We have an ownership interest of approximately
48.3%
as of
December 31, 2014
in CoSine (OTC: COSN.PK), a Delaware corporation. Two of our representatives serve on CoSine's four-member board of directors, one of whom serves as the Chief Executive Officer and Chief Financial Officer. CoSine is currently in the business of seeking to acquire one or more business operations. In January 2015, the Company increased its ownership in CoSine to approximately 80% and CoSine became a controlled subsidiary. For additional information see Note 22 - "Subsequent Events" to the SPLP consolidated financial statements found elsewhere in this Form 10-K.
Other
Steel Excel has a
40.0%
ownership interest in a fitness equipment company and a
46.9%
ownership interest in iGo, Inc. ("iGo"), a mobile device accessories provider company.
SP II Liquidating Trust
The Company's investment in each series of the SPII Liquidating Trust is accounted for at fair value under the equity method (see Note 2 - "Summary of Significant Accounting Policies" and Note 13 - “Related Party Transactions” to the SPLP consolidated financial statements found elsewhere in this Form 10-K). The purpose of the SPII Liquidating Trust is to effect the orderly liquidation of certain assets previously held by SPII. SPLP's financial position, financial performance and cash flows will be affected to the extent SPII Liquidating Trust's results in realized or unrealized gains (losses) and by distributions it makes in each reporting period. These investments are classified as Long-term investments in the Consolidated Balance Sheets and the
12
gains or losses are recorded in Income (Loss) from other investments - related party in the Consolidated Statements of Operations (see Note 5 - "Investments" to the SPLP consolidated financial statements found elsewhere in this Form 10-K).
Our Common Units
Our common units are quoted on the New York Stock Exchange (NYSE) under the symbol "SPLP".
Other Information
Our business address is 590 Madison Avenue, 32
nd
Floor, New York, New York 10022, and our telephone number is (212) 520-2300. Our website is www.steelpartners.com. The information contained in, or that can be accessed through, the website is not part of this Form 10-K.
This Form 10-K, quarterly reports on Form 10-Q, current reports on Form 8-K, and all amendments to those reports, are available to you free of charge through our website as soon as reasonably practicable after those materials have been electronically filed with, or furnished to, the SEC.
Our business is subject to a number of risks. You should carefully consider the following risk factors, together with all of the other information included or incorporated by reference in this report, before you decide whether to purchase our common units. These factors are not intended to represent a complete list of the general or specific risks that may affect us. It should be recognized that other risks may be significant, presently or in the future, and the risks set forth below may affect us to a greater extent than indicated. If any of the following risks occur, our business, financial condition and results of operations could be materially adversely affected. In such case, the trading price of our common units could decline, and you may lose all or part of your investment.
Risks Related to Our Structure
The unitholders have limited recourse to maintain actions against the General Partner, the Board of Directors, our officers and the Manager.
The Limited Partnership Agreement of SPLP, or the “Partnership Agreement,” contains broad indemnification and exculpation provisions that limit the right of a unitholder to maintain an action against the General Partner, the Board of Directors, our officers and the Manager, or to recover losses or costs incurred by us as a result of their actions or failures to act.
Our Partnership Agreement contains certain limitations on the voting rights of unitholders.
Our Partnership Agreement contains specific provisions that are intended to comply with regulatory limitations on the ownership of our securities as a result of our ownership of WebBank. Under the Partnership Agreement, a person or group that acquires beneficial ownership of 10% or more of the common units without the prior approval of the Board of Directors may lose voting rights with respect to all of its common units in excess of 9.9%.
We may have conflicts of interest with the minority shareholders of our businesses and decisions may need to be made by disinterested directors, without the participation of directors or officers associated with the Manager and the Company, which may be different from the decisions we would make. Companies in which we have interests but we do not control may make decisions that do not serve our interests and those of our unitholders.
The boards of directors and officers of our respective businesses, including directors and officers associated with our Manager and the Company, have fiduciary duties to their shareholders. As a result, they may make decisions that are in the best interests of their shareholders generally but which are not necessarily in the best interest of our unitholders. In dealings with us, the directors and officers of our businesses may have conflicts of interest and decisions may have to be made without their participation. Such decisions may be different from the decisions we would make and may not be in the best interests of our common unitholders, which may have an adverse effect on our business and results of operations.
13
There are certain interlocking relationships among us and certain affiliates of Warren G. Lichtenstein, our Executive Chairman, which may present potential conflicts of interest.
Warren G. Lichtenstein, our Executive Chairman and a substantial unitholder, is the Chief Executive Officer of our Manager. As of
December 31, 2014
, Mr. Lichtenstein directly owned approximately 9% of our outstanding common units. In addition, affiliates of our Manager beneficially own approximately 24% of our outstanding units, although Mr. Lichtenstein disclaims beneficial ownership of any common units not directly held by him. We have entered into transactions and/or agreements with these entities. There can be no assurance that such entities will not have interests in conflict with our own.
Certain members of our management team may be involved in other business activities that may involve conflicts of interest.
Certain individual members of our management team may, from time to time, be involved in the management of other businesses, including those owned or controlled by our Manager and its affiliates. Accordingly, these individuals may focus a portion of their time and attention on managing these other businesses. Conflicts may arise in the future between our interests and the interests of the other entities and business activities in which such individuals are involved.
We, as a diversified holding company, may have substantial limitations on our ability to sell interests in the underlying operating companies.
We accumulate significant positions in underlying operating companies and have a significant role in the management of various underlying operating companies. As a result, we may face significant legal and market restrictions on selling our interests in the underlying operating companies. For example, employees of the Manager and SPH Services may also serve as managers or members of the board of directors of the underlying operating companies, and, thus, may receive material and confidential information concerning the operating companies that would preclude us, under federal securities laws, from trading securities of the relevant operating company. Some privately held businesses may be subject to shareholders agreements which may limit our ability to sell our interests in such companies. In addition, we may be limited in our ability to sell securities in an underlying operating company in light of the size of our ownership interest and the absence of liquidity in the market to absorb our ownership interest, or, alternatively, may be required to sell our ownership interest at a discounted and unfavorable price.
Being classified as an “investment company” would subject us to numerous restrictions and requirements that would be inconsistent with the manner in which we operate our business, and could have a material adverse effect on our business and operations.
We plan to continue to conduct our business and operations in such a manner as not to be deemed an investment company under the Investment Company Act of 1940, as amended (the “Investment Company Act”).
Investment companies are subject to extensive, restrictive and potentially adverse regulations relating to, among other things, operating methods, management, capital structure, dividends and transactions with affiliates. An entity may generally be deemed to be an investment company for purposes of the Investment Company Act if (a) it is or holds itself out as being engaged primarily in the business of investing, reinvesting or trading in securities; or (b) absent an applicable exemption, it owns investment securities having a value exceeding 40% of certain assets (the “40% Test”). As a result of the Exchange Transaction, on July 14, 2009, we could no longer definitively conclude that we passed the 40% Test or were able to rely on any exception from the definition of an investment company.
The Company has taken actions, including liquidating certain of our assets and acquiring additional interests in existing or new subsidiaries or controlled companies, to comply with the 40% Test, or a relevant exception. Also, since the Company operates as a diversified holding company engaged in a variety of operating businesses, we do not believe we are primarily engaged in an investment company type business, nor do we propose to primarily engage in such a business. Our intent to operate as a diversified holding company, and comply with the 40% test, may limit our ability to make certain investments, compel us to divest certain holdings, or to take or forego certain actions that could otherwise be beneficial to us.
If we were deemed to be an investment company under the Investment Company Act, we may need to further adjust our business strategy and assets, including divesting certain desirable assets immediately to fall outside of the definition or within an exemption, to register as an investment company (and subject to the aforementioned restrictions and requirements) or to cease operations.
14
Risks Related to Our Business
We conduct operations or own interests in companies with operations outside of the U.S., which may expose us to additional risks not typically associated with companies that operate solely in the U.S.
We have operations or own interests in securities of companies with operations located outside the U.S. These holdings have additional risks, including risks relating to currency exchange matters, less developed or efficient financial markets than in the U.S., absence of uniform accounting, auditing and financial reporting standards, differences in the legal and regulatory environment, different publicly available information in respect of companies in non-U.S. markets, economic and political risks, and possible imposition of non-U.S. taxes. There can be no assurance that adverse developments with respect to such risks will not adversely affect our assets that are held in certain countries or the returns from these assets.
Our businesses rely, and may rely, on their intellectual property and licenses to use others' intellectual property, for competitive advantage. If our businesses are unable to protect their intellectual property, are unable to obtain or retain licenses to use others' intellectual property, or if they infringe upon or are alleged to have infringed upon others' intellectual property, it could have a material adverse effect on their financial condition, business and results of operations.
The success of each of our businesses depends in part on its, or licenses to use others', brand names, proprietary technology and manufacturing techniques. These businesses rely on a combination of patents, trademarks, copyrights, trade secrets, confidentiality procedures and contractual provisions to protect their intellectual property rights. The steps they have taken to protect their intellectual property rights may not prevent third parties from using their intellectual property without their authorization or independently developing intellectual property that is similar. In addition, the laws of foreign countries may not protect our businesses' intellectual property rights effectively. Stopping unauthorized use of proprietary information and intellectual property, and defending claims of unauthorized use of others' proprietary information or intellectual property, may be difficult, time-consuming and costly and could subject our businesses to significant liability for damages and invalidate their property rights. Such unauthorized use could reduce or eliminate any competitive advantage our businesses have developed, cause them to lose sales or otherwise harm their business.
We are dependent on digital technologies to conduct our daily operations and maintain confidential information.
The Company relies on information technology systems to both manage its daily operations and to secure its intellectual property. We use various protective measures to secure our systems from unauthorized access. However, a failure in or breach of operational or informational security systems or infrastructure, or those of our third party vendors and other service providers, as a result of information system failures or cyber attack, could disrupt business, result in the disclosure or misuse of confidential or proprietary information, including customer and vendor lists, damage our reputation and investor confidence, increase security and remediation costs and cause losses, including potential lawsuits, all of which could have a material adverse effect on our businesses, financial condition and results of operations.
Our businesses are and may be subject to federal, state and foreign environmental laws and regulations that expose them to potential financial liability. Complying with applicable environmental laws requires significant resources, and if our businesses fail to comply, they could be subject to substantial liability.
Some of the facilities and operations of our businesses are, and may be, subject to a variety of federal, state and foreign environmental laws and regulations, including laws and regulations pertaining to the handling, storage and transportation of raw materials, products and wastes, and hazardous materials and wastes, which require and will continue to require significant expenditures to remain in compliance with such laws and regulations. Any material violations of these laws can lead to substantial liability, revocations of discharge permits, fines or penalties, which could negatively impact our financial condition, business and results of operations.
Some of our businesses are subject to certain risks associated with the movement of businesses offshore.
Some of our businesses are potentially at risk of losing business to competitors operating in lower cost countries. An additional risk is the movement offshore of some of our businesses' customers, leading them to procure products or services from more closely located companies. Either of these factors could negatively impact our financial condition, business and results of operations.
15
Our business strategy includes acquisitions which entail numerous risks.
Our business strategy and the strategy of our businesses includes acquisitions and entails several risks, including the diversion of management's attention from other business concerns and the need to finance such acquisitions with additional equity and/or debt. Any future acquisitions may also result in material changes in the composition of our assets and liabilities or the assets and liabilities of our businesses and if unsuccessful could reduce the value of our common units. In addition, once found, acquisitions entail further risks, including unanticipated costs and liabilities of the acquired businesses that could materially adversely affect our results of operations; difficulties in assimilating acquired businesses; negative effects on existing business relationships with suppliers and customers and losing key employees of the acquired businesses.
HNH sponsors a defined benefit pension plan which could subject it to substantial cash funding requirements in the future.
HNH's ongoing operating cash flow requirements include arranging for the funding of the minimum requirements of the WHX Corporation Pension Plan ("WHX Pension Plan"). The performance of the financial markets and interest rates, as well as health care trends and associated mortality rates, impact our defined benefit pension plan expense and funding obligations. Significant changes in these factors, including adverse changes in discount rates, investment losses on plan assets and increases in participant life expectancy, may increase our funding obligations and adversely impact our financial statements. Required future contributions are determined based upon assumptions regarding such matters as discount rates on future obligations, assumed rates of return on plan assets and legislative changes. Actual future pension costs and required funding obligations will be affected by changes in the factors and assumptions described in the previous sentence, as well as other changes such as any plan termination or other acceleration events. See Liquidity and Capital Resources section of this Form 10-K for additional information.
WebBank operates in a highly regulated environment. Recent and ongoing legislative and regulatory actions may significantly affect our liquidity or financial condition.
On July 21, 2010, President Barack Obama signed the Dodd-Frank Act into law. The Dodd-Frank Act is intended primarily to overhaul the financial regulatory framework following the global financial crisis and impacts all financial institutions, including WebBank. The Dodd-Frank Act, among other things, established the Bureau of Consumer Financial Protection and Financial Stability Oversight Council, consolidated certain federal bank regulators and imposed increased corporate governance and executive compensation requirements. While many of the provisions in the Dodd-Frank Act are aimed at financial institutions significantly larger than ours, the amount and complexity of regulations has increased our regulatory compliance burden and therefore has increased the Bank’s regulatory risk.
In addition, the Dodd-Frank Act added a new Section 13 to the Bank Holding Company Act, the so-called “Volcker Rule,” which generally restricts certain banking entities (including affiliates of depository institutions) from engaging in proprietary trading activities and owning equity in or sponsoring any private equity or hedge fund (collectively, "covered funds"). The Volcker Rule became effective July 21, 2012. The implementing regulations for the Volcker Rule were finalized by various regulatory agencies on December 10, 2013, although thereafter the Federal Reserve extended the conformance period until July 21, 2015. On December 18, 2014, the Federal Reserve further extended the conformance period until July 21, 2016 with respect to investments in, and relationships with, covered funds and foreign funds subject to the Volcker Rule that were in place prior to December 31, 2013. The Federal Reserve also indicated that it eventually intends to grant a final one-year extension of the conformance period for investments in, and relationships with, such funds, until July 21, 2017. The end of the conformance period for proprietary trading activities and investments in, and relationships with, covered funds entered into on or after December 31, 2013 remains July 21, 2015. Under the regulations, following the end of each applicable conformance period, we (and our affiliates) are restricted from engaging in proprietary trading, investing in covered funds or sponsoring new covered funds unless our activities qualify for specified exemption under the rule or satisfy certain requirements under the rule. While we are a banking entity under the Volcker Rule, we do not expect the Volcker Rule to have a material impact on our business
Furthermore, under the Dodd-Frank Act, all companies that directly or indirectly control an FDIC-insured bank are required to serve as a source of financial strength for such institution. As a result, SPLP could be called upon by the FDIC to infuse additional capital into WebBank to the extent that WebBank fails to satisfy its capital requirements, even if doing so may adversely affect SPLP’s ability to meet its other obligations. Currently, WebBank meets or exceeds all such requirements.
16
The U.S. Congress and state legislatures and federal and state regulatory authorities continually review banking laws, regulations and policies for possible changes. We cannot predict whether additional legislation will be enacted and, if enacted, the effect that it would have on our business, financial condition or results of operations.
WebBank may be subject to more stringent capital requirements.
In July 2013, the Federal Reserve Board and the FDIC, issued rules that implemented the Basel III changes to the international regulatory capital framework and revised the U.S. risk-based and leverage capital requirements for U.S. banking organizations in order to strengthen identified areas of weakness in capital rules and to address relevant provisions of the Dodd-Frank Act. The rules apply to WebBank.
Effective January 1, 2015 for WebBank, FDIC regulations implementing the Basel III Accord modified WebBank’s minimum capital requirements by adding a 4.5% Common Equity Tier 1 ratio and increased the Tier 1 capital ratio requirement from 4% to 6%. Additionally, a Capital Conservation Buffer (composed solely of common equity Tier 1 capital) equal to 2.5% above the new regulatory minimum capital requirements will be phased in starting January 1, 2016 until fully implemented on January 1, 2019. A failure of WebBank to maintain the aggregate minimum capital requirements and Capital Conservation Buffer will impair its ability to make certain distributions (including dividends and stock repurchases) and discretionary bonus payments to executive officers.
Although the Company currently cannot predict the specific impact and long-term effects that Basel III will have on WebBank and the banking industry more generally, WebBank is currently within the new regulations.
Increased volatility in raw materials costs and availability may reduce revenues and profitability in our diversified industrial businesses.
Certain of our Diversified Industrial operations are subject to risks associated with increased volatility in raw material prices and availability of key raw materials. If the price for raw materials continues to increase and our operations are not able to pass these price increases to their customers, or are unable to obtain key raw materials, our results of operations may be negatively impacted.
Our energy segment is highly dependent on the activity level of the North American oil and gas industry. Our markets may be adversely affected by industry conditions that are beyond our control.
The level of oil and natural gas exploration and production activity in the United States is volatile. Reduced discovery rates of new oil and natural gas reserves, or a decrease in the development rate of reserves in our market areas, weakness in oil and natural gas prices, or our customers' perceptions that oil and natural gas prices will decrease in the future, could result in a reduction in the utilization of our equipment and result in lower revenues or rates for the services of our Energy segment. Our customers' willingness to undertake these activities depends largely upon prevailing industry conditions that are influenced by many factors over which we have no control.
We and our businesses operate in highly competitive markets.
We operate in a variety of competitive industries and market sectors. Many of our businesses' competitors are substantially larger and have considerably greater financial, technical and marketing resources than we do. Some competitors may have a lower cost of funds than we or our businesses do and access to financing sources that may not be available to us or our businesses. In addition, some of our competitors and the competitors of our businesses may have higher risk tolerances or different risk assessments, which could allow them to consider a wider variety of business opportunities than we or our businesses can.
Risks Related to Our Manager
We depend on Warren G. Lichtenstein, the Chairman and Chief Executive Officer of the Manager, and Jack Howard, the President of the Manager, in running our businesses. The loss of their services could have a material adverse effect on our business, results and financial condition.
Our success depends on the efforts, skills, reputation and business contacts of Warren G. Lichtenstein, the Chairman and Chief Executive Officer of the Manager and Jack Howard, the President of the Manager. While the key members of the Manager have worked for the Manager and its affiliates for many years, our Manager does not have any employment agreements
17
with any of the key members of its management team and their continued service is not guaranteed. The loss of the services of Mr. Lichtenstein or Mr. Howard could have a material adverse effect on our asset value, revenues, net income and cash flows and could harm our ability to maintain or grow our existing operations or pursue additional opportunities in the future.
The interests of our Manager may not be aligned with our interests or those of our unitholders.
Our Manager receives an annual Management Fee at a rate of 1.5% of total partner's capital, payable on the first day of each quarter, subject to quarterly adjustment. Our Manager is entitled to receive a Management Fee regardless of our net income. In addition, our Manager was granted partnership profits interests in the form of incentive units which may be classified into Class C common units of SPLP. The Manager may consider entering into or recommending riskier transactions that represent a potential higher reward in order for the Manager's units to be profitable. Any such riskier investment decisions or recommendations, if unsuccessful, could result in losses to us and a decline in the value of the common units.
We cannot determine the amount of the Management Fee that will be paid over time with any certainty.
The Management Fee is calculated by reference in part to our total partners' capital. Our total partners' capital will be impacted by the performance of our businesses and other businesses we may acquire in the future, as well as the issuance of additional common units. Changes in our total partners' capital and in the resulting Management Fee could be significant, resulting in a material adverse effect on our results of operations. In addition, if our performance declines, assuming our total partners' capital remains the same, the Management Fee will increase as a percentage of our net income.
Our Manager's liability is limited under the Management Agreement, and we have agreed to indemnify our Manager against certain liabilities. Such indemnification may incentivize our Manager to take unnecessary risks with respect to actions for which it will be indemnified.
Under the Management Agreement, our Manager, its members, officers, employees, affiliates, agents and legal representatives are not liable for, and we have agreed to indemnify such persons from, any loss or expense, including without limitations, any judgment, settlement, reasonable attorneys' fees and other costs and expenses incurred in connection with the defense of any actual or threatened proceeding, other than losses resulting from willful misconduct or gross negligence in the performance of such indemnified person's obligations and duties. Such indemnification may incentivize our Manager to take unnecessary risks with respect to actions for which it will be indemnified.
Risks Related to our Common Units
We may issue additional common units in the future without the consent of unitholders and at a discount to the market price of such common units. In particular, sales of significant amounts of the common units may cause the price of the common units to decline.
Under the terms of the Partnership Agreement, additional common units may be issued without the consent of unitholders at a discount to the market price. In addition, other classes of securities may be issued with rights that are senior to or which otherwise have preferential rights to the rights of the common units. Sales of significant amounts of the common units in the public market or the perception that such sales of significant amounts may occur could adversely affect its market price. Moreover, the perceived risk of any potential dilution could cause common unit holders to attempt to sell their common units and investors to “short” the common units, a practice in which an investor sells common units that he or she does not own at prevailing market prices, hoping to purchase common units later at a lower price to cover the sale. Any event that would cause the number of common units being offered for sale to increase would likely cause the common units' market price to further decline. These sales might also make it more difficult for us to sell additional common units in the future at a time and price that we deem appropriate.
Risks Related to Taxation
All statutory references in this section are to the Internal Revenue Code of 1986, as amended, or the “Code.”
Our unitholders may be subject to U.S. federal, state and other income tax on their share of our taxable income, regardless of whether they receive any cash distributions from us.
The Company operates, for U.S. federal income tax purposes, as a partnership and not a publicly traded partnership taxable as a corporation. Our unitholders will be subject to U.S. federal, state, local and possibly, in some cases, foreign income
18
tax on their allocable share of our taxable income, whether or not they receive cash distributions from us. We do not anticipate making any cash distributions or paying any cash dividends. Accordingly, our unitholders may be required to make tax payments in connection with their ownership of common units that significantly exceed their cash distributions in any given year.
Our tax treatment is not assured. If we are taxed as a corporation, it could adversely impact our results of operations.
A partnership is not a taxable entity and distributions by a partnership to a partner are generally not taxable to the partnership or the partner unless the amount of cash distributed to such partner exceeds the partner's adjusted basis in its partnership interest. Section 7704 provides that generally publicly traded partnerships are taxed as corporations. However, an exception, referred to as the “Qualifying Income Exception,” exists with respect to publicly traded partnerships of which 90 percent or more of the gross income for every taxable year consists of “qualifying income” as defined in the Code. We expect that we will meet the Qualifying Income Exception. However, the Qualifying Income Exception will not apply if we register, or are required to register, as an investment company under the Investment Company Act.
If the Qualifying Income Exception is not available to us, then we will be treated as a corporation instead of a partnership. In that event, the deemed incorporation of SPLP should be tax-free, unless the corporation is an investment company for tax purposes and the partners are treated as diversifying their interests. If we were taxed as a corporation, (i) our net income would be taxed at corporate income tax rates, thereby substantially reducing our profitability, (ii) our unitholders would not be allowed to deduct their share of losses of SPLP and (iii) distributions to our unitholders, other than liquidating distributions, would constitute dividends to the extent of our current or accumulated earnings and profits, and would be taxable as such.
Our structure involves complex provisions of U.S. federal income tax law for which no clear precedent or authority may be available.
The U.S. federal income tax treatment of our unitholders depends in some instances on interpretations of complex provisions of U.S. federal income tax law for which no clear precedent or authority may be available. Our Partnership Agreement permits our General Partner to modify it from time to time, including the allocation of items of income, gain, loss and deduction (including unrealized gain and unrealized loss to the extent allowable under U.S. federal income tax law), without the consent of our unitholders, to address certain changes in U.S. federal income tax regulations, legislation or interpretation or to preserve the uniformity of our common units. In some circumstances, such revisions could have a material adverse impact on some or all unitholders. In addition, we formed a subsidiary partnership, to which we contributed certain of our assets ("the “Subsidiary Partnership”). To preserve the uniformity of common units, we (but not the Subsidiary Partnership) will make an election permitted under Section 754 and we will adopt the remedial allocation method under Section 704(c) with respect to items of income, gain, loss and deduction attributable to assets contributed to us (which we will contribute to the Subsidiary Partnership), to account for any difference between the tax basis and fair market value of such assets at the time of contribution, or attributable to the “book-up” or “book-down” of our assets prior to their contribution to the Subsidiary Partnership, or while they were held by the Subsidiary Partnership, to account for the difference between the tax basis and fair market value of such assets at the time of a mark-to-market event. We intend generally to make allocations under Section 704(c) to our unitholders in accordance with their respective percentage interests. However, built-in gain or built-in loss in existence and allocable to the assets we contributed to the Subsidiary Partnership, when recognized, will be allocated to our unitholders as of the contribution date. We intend to prepare our tax returns on the basis that buyers of common units from such unitholders will not inherit such unitholders' built-in gains or built-in losses as of that date as a result of the election under Section 754. However, it is not clear whether this position will be upheld if challenged by the IRS. While we believe it represents the right result, there is no law directly on point.
Tax-exempt entities face unique tax issues from owning common units that may result in adverse tax consequences to them.
A holder of common units that is a tax-exempt organization may be subject to U.S. federal income taxation to the extent that its allocable share of our income consists of unrelated business taxable income (“UBTI”). We may borrow money. A tax-exempt partner of a partnership may be treated as earning UBTI if the partnership regularly engages in a trade or business that is unrelated to the exempt function of the tax-exempt partner, if the partnership derives income from debt-financed property or if the tax-exempt organization's partnership interest itself is debt-financed.
None.
All dollars used in this discussion are in thousands.
HNH
As of
December 31, 2014
, HNH had 23 active operating plants in the United States, Canada, China, United Kingdom, Germany, France, Poland and Mexico, with a total area of approximately 1,576,838 square feet, including warehouse, office, sales, service and laboratory space. HNH also owns or leases sales, service, office and warehouse facilities at 8 other locations in the United States, which have a total area of approximately 225,330 square feet, and owns or leases 5 non-operating locations with a total area of approximately 321,150 square feet. Manufacturing facilities are located in: Camden and Bear, Delaware; Evansville, Indiana; Agawam, Massachusetts; Middlesex, New Jersey; Arden, North Carolina; Rancho Cucamonga, California; St. Louis, Missouri; Cudahy, Wisconsin; Itasca, Illinois; Warwick, Rhode Island; Toronto and Montreal, Canada; Matamoros, Mexico; Gwent, Wales, United Kingdom; Pansdorf, Germany; Riberac, France; Gliwice, Poland; and Suzhou, China. All plants are owned except for the Middlesex, Arden, Rancho Cucamonga, Montreal, Gliwice and one of two Suzhou plants, which are leased. The Bear, Delaware, Rancho Cucamonga, California, and Suzhou, China facilities, with a total area of approximately 340,481 square feet, are associated with the Company's former Arlon business.
HNH considers its manufacturing plants and service facilities to be well maintained and efficiently equipped, and therefore suitable for the work being done. The productive capacity and extent of utilization of its facilities is dependent in some cases on general business conditions and in other cases on the seasonality of the utilization of its products. Capacity can be expanded at some locations.
Steel Excel
Steel Excel's Energy business owns four buildings in Williston, ND, including one that serves as its headquarters and operations hub in the Bakken basin along with separate buildings with office and shop space. To support its other operations, the Energy business owns shop space Texas and leases shop space in Colorado under an arrangement that expires in 2015. The Energy business also leases shop space and office space under month-to-month arrangements on an as needed basis and owns and leases housing for temporary living arrangements for certain of its employees.
Steel Excel's Sports business has a lease for office space in Hermosa Beach, CA, that expires in June 2015, which serves as its headquarters. Steel Excel's Sports business has a lease for approximately 27.9 acres of land in Yaphank, NY, for its baseball services operation that expires in December 2016. Under this lease Steel Excel has two extension options and a right of first refusal to purchase the parcel. The Sports business also has a lease for 2,300 square feet for its CrossFit® facility in Hermosa Beach, CA, that expires in July 2015 and a lease for 9,940 square feet for its CrossFit® facility in Torrance, CA, that expires in March 2023. In addition, the Sports business has leases in various states for small administrative offices to
support its youth soccer operation.
BNS
As of
December 31, 2014
, BNS did not own or lease any properties.
DGT
As discussed elsewhere in this Form 10-K, on August 16, 2012 DGT completed the sale of its RFI Corporation ("RFI") subsidiary and sold the related manufacturing and office property in the first quarter of 2015. In addition, as discussed elsewhere in this Form 10-K, on November 3, 2011 DGT completed the sale of Villa Sistemi Medicali S.p.A. ("Villa"), its former Italian subsidiary. DGT continues to own 67,000 square feet of design and manufacturing space in Milan, Italy and currently leases the building to the buyer of Villa.
19
WebBank
As of
December 31, 2014
, WebBank leases 8,000 square feet of office space headquartered in Salt Lake City, Utah. The term of the lease expires in March 2017. WebBank also leases office space in New Jersey through March 2017. WebBank believes that these facilities are adequate for its current needs and that suitable additional space will be available as required.
SPH Services
As of
December 31, 2014
, SPH Services leases 20,764 square feet of office space headquartered in New York City, New York. The term of the lease expires in December 2025. SPH Services also leases office space in Los Gatos, California through January 2017.
20
The information set forth under Note 21 - "Commitments and Contingencies" of our Notes to Consolidated Financial Statements, included in Part II, Item 8, Financial Statements, of this Report, is incorporated herein by reference. For an additional discussion of certain risks associated with legal proceedings, see the section entitled Part I, Item 1A, Risk Factors, of this Report.
Not applicable.
Market Information
As of
December 31, 2014
, we had
27,566,200
common units issued and outstanding. Our common units, no par value, are quoted on the NYSE under the symbol “SPLP”. The following table sets forth the information on the high and low sales prices of our common units during
2014
and
2013
.
|
Fiscal year ending December 31, 2014
|
High
|
Low
|
||||||
|
First Quarter
|
$
|
17.57
|
|
$
|
15.70
|
|
||
|
Second Quarter
|
$
|
17.21
|
|
$
|
15.91
|
|
||
|
Third Quarter
|
$
|
16.92
|
|
$
|
16.27
|
|
||
|
Fourth Quarter
|
$
|
18.55
|
|
$
|
15.65
|
|
||
|
Fiscal year ending December 31, 2013
|
High
|
Low
|
||||||
|
First Quarter
|
$
|
13.62
|
|
$
|
11.51
|
|
||
|
Second Quarter
|
$
|
13.77
|
|
$
|
12.90
|
|
||
|
Third Quarter
|
$
|
15.47
|
|
$
|
13.80
|
|
||
|
Fourth Quarter
|
$
|
17.59
|
|
$
|
14.88
|
|
||
Holders
As of
December 31, 2014
, there were approximately 140 unitholders of record.
Distributions
In connection with the Exchange Transaction, we agreed to distribute to the holders of our common units the Target Distribution, subject to certain limitations, during the period from July 16, 2009 to the Final Distribution Date. On April 6, 2011, we distributed to our unitholders of record as of March 25, 2011, approximately $29,868 (net of approximately $3,229 to treasury units), or $1.18 per common unit, representing the final required distribution in full satisfaction of the Target Distribution.
We may, at our option, make further distributions to the unitholders although we currently have no plan to make any distributions in excess of the Target Distribution.
21
Unit Performance Graph
The following graph compares the cumulative total return provided to unitholders on our common units since the common units began trading on April 19, 2011, relative to the cumulative total returns of the Russell 2000 index, and a customized peer group of seven companies that includes: Blackstone Group L.P., Leucadia National Corporation, Apollo Investment Corporation, Compass Diversified Holdings LLC, Gladstone Capital Corporation, Knights Capital Group, Inc. and Main Street Capital Corporation. An investment of $100 (with reinvestment of all dividends) is assumed to have been made in our common units, in the peer group, and the index on April 19, 2011 and its relative performance is tracked through December 31, 2014. We did not declare or pay any dividends during the comparison period.
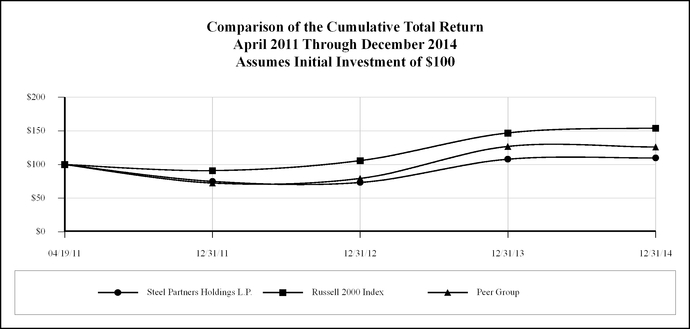
|
|
4/19/2011
|
12/31/2011
|
12/31/2012
|
12/31/2013
|
12/31/2014
|
||||||||||||||
|
Steel Partners Holdings L.P.
|
$
|
100
|
|
$
|
74.92
|
|
$
|
73.30
|
|
$
|
107.87
|
|
$
|
109.80
|
|
||||
|
Russell 2000 Index
|
$
|
100
|
|
$
|
90.96
|
|
$
|
105.83
|
|
$
|
146.91
|
|
$
|
154.11
|
|
||||
|
Peer Group
|
$
|
100
|
|
$
|
72.48
|
|
$
|
79.34
|
|
$
|
126.85
|
|
$
|
126.08
|
|
||||
The unit price performance included in this graph is not necessarily indicative of future unit price performance
The performance graph shall not be deemed to be incorporated by reference by means of any general statement incorporating by reference this Form 10-K into any filing under the Securities Act or the Exchange Act, except to the extent that we specifically incorporate such information by reference, and shall not otherwise be deemed filed under such acts.
Issuer Purchases of Equity Securities
On December 24, 2013, the Board of Directors of the general partner of the Company approved the repurchase of up to an aggregate of
$5,000
of the Company's common units (the “Repurchase Program”). Any purchases made under the Repurchase Program will be made from time to time on the open market at prevailing market prices or in negotiated transactions off the market, in compliance with applicable laws and regulations. In connection with the Repurchase Program, the Company entered into a Stock Purchase Plan which expired on March 26, 2014. The Repurchase Program has no termination date.
22
|
(a)
|
(b)
|
(c)
|
(d)
|
||||||
|
Period
|
Total Number of Shares (or Units) Purchased (1)
|
Average Price Paid per Share (or Unit)
|
Total Number of Shares (or Units) Purchased as part of Publicly Announced Plans or Programs
|
Maximum Number (or Approximate Dollar Value) of Shares (or Units) that May Yet Be Purchased Under the Plans or Programs
|
|||||
|
October 1, 2014 through October 31, 2014
|
23,155
|
$
|
15.32
|
|
—
|
|
$
|
2,430
|
|
|
November 1, 2014 through November 30, 2014
|
2,041
|
$
|
16.78
|
|
—
|
|
$
|
2,430
|
|
|
December 1, 2014 through December 31, 2014
|
11,367
|
$
|
17.34
|
|
—
|
|
$
|
2,430
|
|
|
Total
|
36,563
|
—
|
|
|
|
||||
(1) All units were purchased by DGT, an affiliate of the Company, in open market transactions for its own account.
Item 6.
Selected Financial Data
The following table contains our selected historical consolidated financial data, which should be read in conjunction with our consolidated financial statements and the related notes thereto, and Management’s Discussion and Analysis of Financial Condition and Results of Operations contained in this Annual Report on Form 10-K. The selected financial data as of and for the years ended
December 31, 2014
,
2013
and
2012
have been derived from our audited consolidated financial statements at those dates and for those periods, contained elsewhere in this Annual Report on Form 10-K. The historical selected financial data as of and for the years ended December 31, 2011 and 2010 have been derived from our audited consolidated financial statements adjusted for discontinued operations at those dates and for those periods, not contained in this Annual Report on Form 10-K.
The table below presents discontinued operations as follows:
|
•
|
The year ended December 31, 2014 includes the operations of HNH's Arlon business.
|
|
•
|
The year ended December 31, 2013 includes the operations of HNH's businesses: Arlon, Continental Industries ("Continental"), Canfield Metal Coating Corporation ("CMCC") and Indiana Tube de Mexico, S. De R.L. de C.V. ("ITM") through their respective sale dates, as well as one of Steel Excel's sports businesses.
|
|
•
|
The year ended December 31, 2012 includes the aforementioned HNH operations, as well as DGT's RFI subsidiary and DGT's Villa subsidiary through their respective sale dates.
|
|
•
|
The year ended December 31, 2011 includes the aforementioned operations, as well as DGT's operations from July 5, 2011.
|
|
•
|
The year ended December 31, 2010 includes the aforementioned HNH discontinued operations (from May 7, 2010 through December 31, 2010) as well as the gain on sale of BNS' former subsidiary, Collins Industries, Inc. ("Collins"), which was sold on February 18, 2010.
|
23
|
Year Ended December 31,
|
|||||||||||||||||||
|
|
2014
|
2013
|
2012
|
2011
|
2010
|
||||||||||||||
|
(in thousands, except common unit and per common unit data)
|
|||||||||||||||||||
|
STATEMENTS OF OPERATIONS DATA (a)
|
|
|
|||||||||||||||||
|
Revenues:
|
|
|
|||||||||||||||||
|
Diversified Industrial, Energy, Financial Services and Corporate and Other
|
$
|
849,530
|
|
$
|
721,114
|
|
$
|
630,771
|
|
$
|
542,902
|
|
$
|
320,716
|
|
||||
|
Net (loss) income from continuing operations
|
$
|
(17,572
|
)
|
$
|
38,374
|
|
$
|
43,736
|
|
$
|
71,298
|
|
$
|
12,557
|
|
||||
|
Income from discontinued operations
|
10,304
|
|
6,446
|
|
20,029
|
|
9,979
|
|
33,889
|
|
|||||||||
|
Net (loss) income
|
(7,268
|
)
|
44,820
|
|
63,765
|
|
81,277
|
|
46,446
|
|
|||||||||
|
Less: Net income attributable to non-controlling interests:
|
(287
|
)
|
(25,360
|
)
|
(22,747
|
)
|
(45,808
|
)
|
(14,699
|
)
|
|||||||||
|
Net (loss) income attributable to common unitholders
|
$
|
(7,555
|
)
|
$
|
19,460
|
|
$
|
41,018
|
|
$
|
35,469
|
|
$
|
31,747
|
|
||||
|
Net (loss) income per common unit - basic:
|
|
|
|
|
|||||||||||||||
|
Net (loss) income from continuing operations
|
$
|
(0.48
|
)
|
$
|
0.51
|
|
$
|
1.01
|
|
$
|
1.19
|
|
$
|
0.57
|
|
||||
|
Net income from discontinued operations
|
0.21
|
|
0.14
|
|
0.37
|
|
0.22
|
|
0.69
|
|
|||||||||
|
Net (loss) income attributable to common unitholders
|
$
|
(0.27
|
)
|
$
|
0.65
|
|
$
|
1.38
|
|
$
|
1.41
|
|
$
|
1.26
|
|
||||
|
Basic weighted average common units outstanding
|
28,710,220
|
|
29,912,993
|
|
29,748,746
|
|
25,232,985
|
|
25,234,827
|
|
|||||||||
|
Net (loss) income per common unit - diluted:
|
|
|
|
|
|||||||||||||||
|
Net (loss) income from continuing operations
|
$
|
(0.48
|
)
|
$
|
0.49
|
|
$
|
1.01
|
|
$
|
0.81
|
|
$
|
0.52
|
|
||||
|
Net income from discontinued operations
|
0.21
|
|
0.14
|
|
0.37
|
|
0.18
|
|
0.64
|
|
|||||||||
|
Net (loss) income attributable to common unitholders
|
$
|
(0.27
|
)
|
$
|
0.63
|
|
$
|
1.38
|
|
$
|
0.99
|
|
$
|
1.16
|
|
||||
|
Diluted weighted average common units outstanding
|
28,710,220
|
|
30,798,113
|
|
29,774,527
|
|
29,669,582
|
|
27,482,804
|
|
|||||||||
(a) Statement of operations data includes the consolidation of the results of acquired entities from their respective acquisition dates: primarily, the acquisition of HNH effective May 7, 2010, the acquisition of SWH, Inc. ("SWH") by BNS on February 2, 2011, the acquisition of DGT on July 5, 2011, the acquisition of Steel Excel on May 31, 2012, HNH's acquisition of Wolverine Joining Technologies in April 2013 and Steel Excel's acquisition of the assets of Black Hawk Energy Services, Inc. in December 2013.
|
|
December 31,
|
||||||||||||||||||
|
|
2014
|
2013
|
2012
|
2011
|
2010
|
||||||||||||||
|
BALANCE SHEET DATA
|
(In thousands, except per common unit data)
|
||||||||||||||||||
|
Diversified Industrial, Energy, Financial Services and Corporate and Other:
|
|
|
|||||||||||||||||
|
Cash and cash equivalents
|
$
|
188,983
|
|
$
|
203,980
|
|
$
|
198,027
|
|
$
|
127,027
|
|
$
|
180,684
|
|
||||
|
Marketable securities
|
138,457
|
|
178,485
|
|
199,128
|
|
—
|
|
—
|
|
|||||||||
|
Long-term investments
|
311,951
|
|
295,440
|
|
199,865
|
|
320,891
|
|
235,142
|
|
|||||||||
|
Total assets
|
1,492,905
|
|
1,522,245
|
|
1,378,359
|
|
1,129,843
|
|
1,091,865
|
|
|||||||||
|
Long-term debt
|
296,282
|
|
223,355
|
|
140,065
|
|
130,955
|
|
91,984
|
|
|||||||||
|
SPLP Partners’ capital
|
494,859
|
|
616,582
|
|
527,344
|
|
415,797
|
|
405,732
|
|
|||||||||
|
SPLP Partners’ capital per common unit
|
$
|
17.95
|
|
$
|
19.81
|
|
$
|
17.13
|
|
$
|
16.51
|
|
$
|
16.07
|
|
||||
24
The following discussion and analysis of our financial condition and results of operations should be read in conjunction with our consolidated financial statements and related notes thereto that are available elsewhere in this Annual Report on Form 10-K. The following is a discussion and analysis of SPLP's consolidated results of operations for the years ended
December 31, 2014
,
2013
and
2012
. In addition to historical consolidated financial information, the following discussion contains forward-looking statements that reflect our plans, estimates and beliefs. Our actual results could differ materially from those discussed in the forward-looking statements. Factors that could cause or contribute to these differences include those discussed below and elsewhere in this Annual Report on Form 10-K, particularly in “Risk Factors” in Item 1A. All monetary amounts used in this discussion are in thousands except common units and share amounts.
Overview
Steel Partners Holdings L.P. ("SPLP" or the "Company") is a global diversified holding company that engages in multiple businesses, including diversified industrial products, energy, defense, supply chain management and logistics, banking, food products and services, sports, training, education, and the entertainment and lifestyle industries.
Segment Information
The following table presents the composition of our segments, which include the operations of our consolidated subsidiaries, as well as income or loss from equity method investments and other investments. Our segments are managed separately and offer different products and services.
|
Diversified Industrial
|
Energy
|
Financial Services
|
Corporate
|
|
Handy & Harman Ltd. ("HNH")
(1)
|
Steel Excel Inc. ("Steel Excel")
(1)
|
WebBank
(1)
|
SPH Services, Inc. ("SPH Services")
(1)
|
|
SL Industries, Inc. ("SLI")
(2)
|
BNS Holding, Inc. ("BNS")
(1), (3)
|
DGT Holdings Corp. ("DGT")
(1)
|
|
|
JPS Industries, Inc. ("JPS")
(2)
|
BNS Holdings Liquidating Trust ("BNS Liquidating Trust")
(1), (3)
|
||
|
ModusLink Global Solutions, Inc.
(2)
|
|||
|
CoSine Communications, Inc. ("CoSine")
(2)
|
|||
|
SPII Liquidating Trust
(2)
|
|||
|
Other Investments
(4)
|
|||
|
(1)
|
Consolidated subsidiary
|
|
(2)
|
Equity method investment
|
|
(3)
|
The operations of BNS are included in the Energy segment through June 30, 2012. The results of the BNS Liquidating Trust are included in the Corporate and Other segment beginning July 1, 2012.
|
|
(4)
|
Other investments classified in Corporate and Other include various investments in available-for-sale securities in the Aerospace/Defense, Restaurant and Manufacturing industries.
|
25
RESULTS OF OPERATIONS
CONSOLIDATED RESULTS OF OPERATIONS
|
Year Ended December 31,
|
|||||||||||
|
2014
|
2013
|
2012
|
|||||||||
|
Revenues
|
$
|
849,530
|
|
$
|
721,114
|
|
$
|
630,771
|
|
||
|
Cost of goods sold
|
587,069
|
|
496,757
|
|
416,826
|
|
|||||
|
Selling, general and administrative expenses
|
189,495
|
|
202,121
|
|
155,522
|
|
|||||
|
Goodwill impairment
|
41,450
|
|
—
|
|
—
|
|
|||||
|
All other expenses
|
6,243
|
|
5,711
|
|
26,461
|
|
|||||
|
Total costs and expenses
|
824,257
|
|
704,589
|
|
598,809
|
|
|||||
|
Income from continuing operations before income taxes
and equity method income (loss) |
25,273
|
|
16,525
|
|
31,962
|
|
|||||
|
Income tax provision
|
24,288
|
|
6,477
|
|
13,068
|
|
|||||
|
Income (Loss) from equity method investments and investments held at fair value:
|
|||||||||||
|
(Loss) Income of associated companies, net of taxes
|
(3,379
|
)
|
27,786
|
|
14,204
|
|
|||||
|
Income (Loss) from other investments - related party
|
891
|
|
(271
|
)
|
(8,329
|
)
|
|||||
|
(Loss) Income from investments held at fair value
|
(16,069
|
)
|
811
|
|
18,967
|
|
|||||
|
Net (loss) income from continuing operations
|
(17,572
|
)
|
38,374
|
|
43,736
|
|
|||||
|
Income from discontinued operations
|
10,304
|
|
6,446
|
|
20,029
|
|
|||||
|
Net (loss) income
|
(7,268
|
)
|
44,820
|
|
63,765
|
|
|||||
|
Net income attributable to noncontrolling interests in consolidated entities
|
(287
|
)
|
(25,360
|
)
|
(22,747
|
)
|
|||||
|
Net (loss) income attributable to common unitholders
|
$
|
(7,555
|
)
|
$
|
19,460
|
|
$
|
41,018
|
|
||
Revenues
Revenues in
2014
increased
$128,416
, or
17.8%
, as compared to
2013
due to growth from acquisitions of
15.1%
and core growth of
6.1%
, partially offset by a decrease of
3.4%
, due to other factors, primarily precious metal prices. Acquisition growth was due to PAM Fastening Technology, Inc. ("PAM") (acquired November 2013) and Wolverine Joining Technologies, LLC ("Wolverine Joining") (acquired April 2013) in the Diversified Industrial segment and the acquisition of the assets of Black Hawk Energy Services, Inc. ("Black Hawk Inc.") (acquired December 2013) and UK Elite Soccer, Inc. ("UK Elite") (acquired June 2013) in the Energy segment.
Revenues in
2013
increased
$90,343
, or
14.3%
, as compared to
2012
due to growth from acquisitions of
11.9%
and core growth of
8.2%
, partially offset by a decrease of
5.8%
, due to reduced investment revenues and other factors, primarily precious metal prices. The acquisition growth in the year ended
December 31, 2013
was primarily due to Wolverine Joining and W.P. Hickman Company ("Hickman") (acquired December 2012) in the Diversified Industrial segment. In addition, the acquisition growth was impacted by the inclusion of a full year of Energy segment results in 2013 due to the May 2012 acquisition of Steel Excel, as well as the impact from Steel Excel's 2013 acquisitions of the assets of Black Hawk Inc. and UK Elite.
Costs and Expenses
Costs and expenses in
2014
increased
$78,218
, or
11.1%
, as compared to
2013
and increased
$105,780
, or
17.7%
in
2013
, as compared to
2012
, primarily due to an increase in cost of goods sold and Selling, general and administrative expenses ("SG&A").
26
Cost of Goods Sold
Cost of goods sold in
2014
increased
$90,312
, or
18.2%
, as compared to
2013
primarily due to increases in our Diversified Industrial and Energy segments principally as a result of the acquisitions of Wolverine Joining, PAM and the assets of Black Hawk Inc., as well as additional costs due to core growth.
Cost of goods sold in
2013
increased
$79,931
, or
19.2%
, as compared to
2012
primarily due to increases in our Diversified Industrial and Energy segments principally as a result of the acquisitions of Wolverine Joining, Hickman and the impact of the inclusion of a full year of Energy segment results in 2013 due to the May 2012 acquisition of Steel Excel, as well as the impact from Steel Excel's 2013 acquisitions of the assets of Black Hawk Inc. and UK Elite.
Selling, General and Administrative Expenses
SG&A expenses in
2014
decreased
$12,626
, or
6.2%
, as compared to
2013
primarily due to a decrease in the Corporate and Other segment due to lower non-cash incentive unit expense recorded in 2014, compared to 2013, as well as a decrease in the Diversified Industrial segment. The Diversified Industrial decrease was due to a decrease from HNH's core business primarily due to the recording of insurance reimbursements, as well as lower benefit costs and reduced business development expenses, which were partially offset by higher incremental expenses from the Wolverine Joining and PAM acquisitions. These decreases were partially offset by an increase in our Financial Services segment due to higher personnel costs and an increase in our Energy segment principally as a result of the acquisition of the assets of Black Hawk Inc., additional costs due to core growth, higher business development costs and certain non-recurring benefits that were recorded in the prior year period.
SG&A expenses in
2013
increased
$46,599
, or
30.0%
, as compared to
2012
primarily due to an increase in the Corporate and Other segment due to higher non-cash incentive unit expense recorded in 2013, compared to 2012 and an increase in the Diversified Industrial segment due to the Wolverine and Hickman acquisitions. Additionally, SG&A expenses increased in our Energy segment due to the impact of the inclusion of a full year of Energy segment results in 2013 due to the May 2012 acquisition of Steel Excel, as well as the impact from Steel Excel's 2013 acquisitions of the assets of Black Hawk Inc. and UK Elite.
Goodwill Impairment
In connection with its annual goodwill impairment test, the Company recognized an impairment charge of
$41,450
in the fourth quarter of 2014 related to the goodwill associated with its Energy segment. The impairment resulted from the adverse effects the decline in energy prices had on the oil services industry and the projected results of operations of the Energy segment.
All Other Expenses
All other expenses increased
$532
in
2014
, compared to
2013
, primarily from higher interest expense. All other expenses decreased
$20,750
in
2013
, compared to
2012
, primarily from the non-recurring expense for the deferred fee liability to related party recorded in 2012, lower interest expense in 2013 and higher income from investment sales by Steel Excel in 2013, partially offset by higher asset impairment charges recorded in 2013.
(Loss) Income of Associated Companies
The (Loss) Income of associated companies in
2014
decreased by
$31,165
, compared to
2013
, primarily due to a higher reduction in the 2014 period in the fair value of MLNK of approximately $46,100 and a higher reduction in the 2014 period in the fair value of certain investments held by Steel Excel of approximately $5,200, partially offset by higher increases in the fair value of JPS of approximately $5,100 and SLI of approximately $3,000 and the non-recurrence of a reduction in fair value recorded in the 2013 period of approximately $11,500 related to Fox & Hound (see Note 5 – "Investments" to the SPLP consolidated financial statements found elsewhere in this Form 10-K for additional information).
The Income (Loss) of associated companies in
2013
increased by
$13,582
, compared to
2012
, primarily due to increases in the 2013 period in the fair value of MLNK, JPS and SLI of approximately $23,000, $9,000 and $7,000, respectively. The Company began accounting for MLNK and JPS as associated companies recorded at fair value in 2013. These increases were partially offset by an increased reduction in the fair value of Fox & Hound of approximately $11,000 in 2013 and the non-recurrence of an approximately $13,000 increase in fair value of Steel Excel recorded in the 2012 period, prior to Steel Excel becoming a consolidated subsidiary (see Note 5 – "Investments" to the SPLP consolidated financial statements found elsewhere in this Form 10-K for additional information).
27
(Loss) Income from Investment Held at Fair Value
(Loss) Income from investments held at fair value for the years ended December 31, 2014 and 2013 includes income or loss that the Company recognizes on its direct investment in API Group plc ("API'') and its investment in ModusLink warrants (see Note 5 - "Investments" to the SPLP consolidated financial statements found elsewhere in this Form 10-K). (Loss) Income from investments held at fair value for the year ended December 31, 2012 included income or loss that the Company recognized on its direct investment in API and Barbican Group Holdings Limited ("Barbican").
28
SEGMENT RESULTS OF OPERATIONS
The following is a summary of SPLP’s consolidated operating results by segment:
|
Year Ended December 31,
|
|||||||||||
|
2014
|
2013
|
2012
|
|||||||||
|
Revenue:
|
|||||||||||
|
Diversified industrial
|
$
|
600,468
|
|
$
|
571,164
|
|
$
|
498,713
|
|
||
|
Energy
|
210,148
|
|
120,029
|
|
92,834
|
|
|||||
|
Financial services
|
36,647
|
|
28,185
|
|
21,155
|
|
|||||
|
Corporate and other
|
2,267
|
|
1,736
|
|
18,069
|
|
|||||
|
Total Revenue
|
$
|
849,530
|
|
$
|
721,114
|
|
$
|
630,771
|
|
||
|
Net income (loss) by segment:
|
|||||||||||
|
Diversified industrial
|
$
|
65,543
|
|
$
|
51,900
|
|
$
|
27,437
|
|
||
|
Energy
|
(26,254
|
)
|
12,641
|
|
25,034
|
|
|||||
|
Financial services
|
24,251
|
|
17,668
|
|
12,913
|
|
|||||
|
Corporate
|
(56,824
|
)
|
(37,358
|
)
|
(8,580
|
)
|
|||||
|
Net income from continuing operations before income taxes
|
6,716
|
|
44,851
|
|
56,804
|
|
|||||
|
Income tax provision
|
24,288
|
|
6,477
|
|
13,068
|
|
|||||
|
Net (loss) income from continuing operations
|
(17,572
|
)
|
38,374
|
|
43,736
|
|
|||||
|
Income from discontinued operations
|
10,304
|
|
6,446
|
|
20,029
|
|
|||||
|
Net income attributable to noncontrolling interests in consolidated entities
|
(287
|
)
|
(25,360
|
)
|
(22,747
|
)
|
|||||
|
Net (loss) income attributable to common unitholders
|
(7,555
|
)
|
19,460
|
|
41,018
|
|
|||||
|
Other comprehensive (loss) income
|
(38,779
|
)
|
59,446
|
|
(6,125
|
)
|
|||||
|
Comprehensive (loss) income attributable to common unitholders
|
$
|
(46,334
|
)
|
$
|
78,906
|
|
$
|
34,893
|
|
||
Diversified Industrial Segment
Our Diversified Industrial segment consists of the operations of
HNH, a diversified holding company that owns a variety of manufacturing operations encompassing joining materials, tubing, building materials and cutting replacement products and services businesses. In addition, the segment results include income or loss from equity method investments held by SPLP.
The following presents a summary of the Diversified Industrial segment operating results as reported in our consolidated financial statements:
|
Year Ended December 31,
|
|||||||||||
|
2014
|
2013
|
2012
|
|||||||||
|
Net Sales
|
$
|
600,468
|
|
$
|
571,164
|
|
$
|
498,713
|
|
||
|
Cost of sales
|
436,914
|
|
411,859
|
|
356,561
|
|
|||||
|
Gross profit
|
163,554
|
|
159,305
|
|
142,152
|
|
|||||
|
Selling, general and administrative expenses
|
116,394
|
|
117,920
|
|
103,295
|
|
|||||
|
Asset impairment charges
|
1,314
|
|
—
|
|
—
|
|
|||||
|
Interest expense
|
7,544
|
|
8,593
|
|
14,134
|
|
|||||
|
Derivative activity income
|
(1,307
|
)
|
(1,195
|
)
|
(1,353
|
)
|
|||||
|
Other expense, net
|
181
|
|
344
|
|
435
|
|
|||||
|
Net income from continuing operations before income taxes
|
39,428
|
|
33,643
|
|
25,641
|
|
|||||
|
Income from associated companies:
|
|||||||||||
|
JPS
|
14,277
|
|
9,204
|
|
—
|
|
|||||
|
SLI
|
11,838
|
|
9,053
|
|
1,796
|
|
|||||
|
Total Segment Income
|
$
|
65,543
|
|
$
|
51,900
|
|
$
|
27,437
|
|
||
29
Comparison of the Years ended December 31, 2014 and 2013
Net sales in 2014 increased by
$29,304
, or
5.1%
when compared to 2013. The change in net sales reflects approximately $26,700 in incremental sales associated with HNH's recent acquisitions and a net increase from core growth of approximately $27,800, which were partially offset by a reduction of approximately $25,200 in net sales due to lower average precious metal prices, principally due to silver. The acquisitions of Wolverine Joining and PAM, net of sales volume transferred to or from the acquired business units as part of HNH's integration activities, provided incremental net sales of approximately $16,700 and $10,000, respectively, during the year ended December 31, 2014. Excluding the impact of these acquisitions, value added sales, defined as net sales less revenue from the direct purchase and resale of precious metals, increased by approximately $27,800 on higher volume, primarily from the Building Materials and Joining Materials groups, which were partially offset by lower sales volume from the Tubing group. The average silver market price was approximately $19.05 per troy ounce in 2014, as compared to $23.79 per troy ounce in 2013.
Gross profit in 2014 increased by $
4,249
, or
2.7%
, when compared to 2013, and, as a percentage of net sales, decreased to
27.2%
as compared to
27.9%
in 2013. The decrease was principally due to unfavorable production variances in the Tubing group driven by lower sales volume, along with higher international freight costs and a change in product mix in the Building Materials group, which were partially offset by favorable sales mix in the Joining Materials group. The change in gross profit reflects approximately $4,000 in incremental gross profit associated with HNH's recent acquisitions and a net increase from core growth of approximately $4,000, which were partially offset by a reduction of approximately $3,000 in gross profit due to lower average precious metal prices. The acquisitions of Wolverine Joining and PAM, net of sales volume transferred to or from the acquired business units as part of HNH's integration activities, provided incremental gross profit of approximately $1,200 and $2,800, respectively, for the year ended December 31, 2014. Higher sales volume from the Building Materials and Joining Materials groups led to the increase in gross profit from our core business, which was partially offset by unfavorable production variances, leading to a decline in gross profit margin, in the Tubing group due to lower sales volume.
Selling, general and administrative ("SG&A") expenses decreased by
$1,526
, or
1.3%
, in 2014, compared to
2013
. The lower SG&A expense in 2014 was driven by a decrease of approximately $3,400 from HNH's core business in 2014, primarily due to the recording of insurance reimbursements totaling $3,100, as compared to similar reimbursements of $1,100 in 2013, as well as lower benefit costs and reduced business development expenses, which were partially offset by approximately $3,100 in incremental expenses from the Wolverine Joining and PAM acquisitions.
In the fourth quarter of 2014, non-cash asset impairment charge of $700 was recorded related to certain equipment owned by the Company's Joining Materials group located in Toronto, Canada, which will either be sold or scrapped as part of HNH's continued integration activities associated with the Wolverine Joining acquisition. In addition, HNH recorded a $600 asset impairment charge associated with certain unused, real property owned by one of HNH's businesses located in Atlanta, Georgia in the fourth quarter of 2014.
Interest expense decreased by $
1,049
, or
12.2%
, in 2014, compared to 2013. Interest expense for 2013 included a loss associated with HNH's redemption of its 10% subordinated secured notes due 2017 ("Subordinated Notes"), including the redemption premium and the write-off of remaining deferred finance costs and unamortized debt discounts. HNH's average interest rate was also lower for 2014 principally due to HNH's redemption of the Subordinated Notes and a decrease in the applicable interest rate margin associated with HNH's new senior credit facility, but was offset by increased average borrowing levels in the second half of 2014.
Derivative activity income was
$1,307
in 2014 and
$1,195
in 2013. The income in 2014 was attributable to HNH's commodity contracts, driven by a 19.9% average silver price decrease during the year. Of the income in 2013, approximately $1,988 was attributable to precious metal contracts driven by a 23.7% average silver price decrease during the year, partially offset by a loss of $793 on the embedded derivative features of HNH's Subordinated Notes and related warrants.
Comparison of the Years ended December 31, 2013 and 2012
Net sales in 2013 increased by
$72,451
, or
14.5%
when compared to 2012. Value added sales increased by $92,200 on higher volume, primarily from HNH's Joining Materials group, including the acquisition of Wolverine Joining, the Tubing group and the Building Materials group, and were partially offset by the impact of lower average precious metal prices of approximately $19,800, principally due to silver. The average silver market price was approximately $23.79 per troy ounce in 2013, as compared to $31.17 per troy ounce in 2012. The acquisition of Wolverine Joining provided incremental net sales of approximately $39,800 in the year ended December 31, 2013 and the December 31, 2012 acquisition of Hickman provided incremental net sales of $17,100 in 2013.
30
Gross profit in 2013 increased by
$17,153
, or
12.1%
, when compared to 2012, and, as a percentage of net sales, decreased to
27.9%
as compared to
28.5%
in the same period in 2012. The decrease was due to unfavorable product mix and reduced profit generated on the material portion of HNH's products in the Joining Materials group, due principally to lower precious metal prices, which were partially offset by favorable product mix in the Tubing group and increased sales of higher-margin branded fasteners in the Building Materials group. The acquisition of Wolverine Joining provided incremental gross profit of approximately $3,600 during the year ended December 31, 2013, and the acquisition of Hickman provided incremental gross profit of approximately $7,500 in 2013.
Selling, general and administrative ("SG&A") expenses increased by
$14,625
, or
14.2%
, in 2013, compared to 2012. This increase was primarily due to HNH's recent acquisitions, including related integrations costs and acquisition fees, as well as overall higher sales volume in 2013. Incremental costs directly associated with the recent acquisitions totaled approximately $7,200. These increases were partially offset by an insurance reimbursement of $1,100 received for previously incurred environmental remediation costs.
Interest expense decreased by
$5,541
, or
39.2%
, in 2013, compared to 2012. Interest expense for the year ended December 31, 2013 included a loss associated with the redemption of HNH's Subordinated Notes, including the redemption premium and the write-off of remaining deferred finance costs and unamortized debt discounts. This loss was offset by a lower average interest rate in the year ended December 31, 2013, principally due to HNH's debt refinancing in the fourth quarter of 2012, which resulted in the write-off of $1,100 in prior debt issuance costs in that period, and the redemption of the Subordinated Notes.
Derivative activity income was
$1,195
in 2013, and
$1,353
in 2012. Of the income in 2013, approximately $1,988 was attributable to precious metal contracts, partially offset by a loss of $793 on the embedded derivative features of HNH's Subordinated Notes and related warrants. Of the income in 2012, approximately $522 was attributable to precious metal contracts and approximately $831 was attributable to embedded derivative features of HNH's Subordinated Notes and related warrants.
Energy Segment
The results of SPLP's Energy segment for the years ended December 31, 2014 and 2013 consists of its consolidated subsidiary Steel Excel. The results for the year ended December 31, 2012 include Steel Excel, from its acquisition date of May 31, 2012, and the results of BNS which include the results of Sun Well prior to its sale to Steel Excel. Steel Excel provides drilling and production services to the oil and gas industry. Through its wholly-owned subsidiary Steel Sports Inc., Steel Excel focuses on providing event-based sports and other health-related services. SXCL also makes significant non-controlling investments in entities in industries related to its businesses as well as entities in other unrelated industries and continues to identify business acquisition opportunities in both the Energy and Sports industries as well as in other unrelated industries.The operations of Steel Sports are not considered material to SPLP and are included in our Energy segment.
31
The following presents a summary of the Energy segment operating results:
|
Year Ended December 31,
|
|||||||||||
|
2014
|
2013
|
2012 (a)
|
|||||||||
|
Net revenues
|
$
|
210,148
|
|
$
|
120,029
|
|
$
|
92,834
|
|
||
|
Cost of sales
|
149,923
|
|
84,197
|
|
60,075
|
|
|||||
|
Gross profit
|
60,225
|
|
35,832
|
|
32,759
|
|
|||||
|
Selling, general and administrative expenses
|
42,798
|
|
27,591
|
|
21,115
|
|
|||||
|
Goodwill impairment
|
41,450
|
|
—
|
|
—
|
|
|||||
|
Interest expense
|
3,177
|
|
1,725
|
|
737
|
|
|||||
|
Other income, net
|
(7,016
|
)
|
(6,988
|
)
|
(988
|
)
|
|||||
|
Net (loss) income from continuing operations before income taxes
|
(20,184
|
)
|
13,504
|
|
11,895
|
|
|||||
|
(Loss) Income from associated companies (b)
|
(6,070
|
)
|
(863
|
)
|
13,139
|
|
|||||
|
Total segment (loss) income
|
$
|
(26,254
|
)
|
$
|
12,641
|
|
$
|
25,034
|
|
||
(a) Pro forma revenue and segment income for 2012 was $123,876 and $27,998, respectively and includes the results of Steel Excel prior to SPLP's acquisition of Steel Excel in May 2012.
(b) Amount in 2014 represents Steel Excel's investments in API Tech, a sports business and iGo.
Amount in 2013 represents Steel Excel's investments in a sports business and iGo.
Amount in 2012 represents equity method income related to SPLP's investment in Steel Excel, prior to acquiring a majority interest on May 31, 2012.
Recent developments in the oil services industry will have a significant adverse effect on the results of operations of
the Company's Energy segment in 2015. The decline in energy prices, particularly the significant decline in oil prices, has
resulted in our customers, the oil and gas exploration and production companies (the "E&P Companies"), cutting back on their planned capital expenditure budgets for 2015, which will result in significantly reduced drilling activity. In addition, the E&P Companies are seeking price concessions from their service providers to offset their drop in revenue. Such actions on the part of the E&P Customers had little impact on the Energy segment's operations in 2014, but have had an adverse effect on its operations beginning in the early part of 2015. The Energy segment has experienced a decline in rig utilization in all of its operations and prices for its services have declined. Steel Excel has taken certain actions and instituted cost-reduction measures in an effort to mitigate these adverse effects. The Energy segment's results of operations going forward will be dependent on the price of oil in the future, the resulting drilling rig counts in the basins in which it operates, and Steel Excel's ability to return to the pricing and service levels of the past as oil prices increase. Although the impact on the Energy segment's results of operations in 2015 is very uncertain, the drilling rig count in North America has declined 35% in the early part of 2015 from its high mark
in 2014, which has directly impacted the segment's rig utilization, and the pricing for the segment's services has declined in the
low-to-mid double-digit teens levels in the early part of 2015. As a result, Steel Excel expects the Energy business to experience a significant decline in operating income in 2015 as compared to the 2014 results. As a result of the adverse effects the decline in energy prices had on the oil services industry and the projected results of operations of the Energy segment, the Company recognized a goodwill impairment charge of
$41,450
in the fourth quarter of 2014. After the impairment charge, the carrying value of the goodwill in the Energy segment was
$19,571
at December 31, 2014. A change in assumptions, including lower long-term growth rates, higher operating costs, or higher discount rates could cause a change in the estimated fair value of the Energy segment, and therefore could result in an additional impairment of goodwill, which would have an adverse effect on our results of operations.
Comparison of the Years ended December 31, 2014 and 2013
In 2014, net revenues increased
$90,119
, or
75.1%
, when compared to 2013. The increase was primarily due to $75,500 in revenues from the acquisition of the assets of Black Hawk Inc., which was acquired in December 2013, and an increase in revenues of $6,500 in other energy operations due primarily to an increase in rig utilization for its snubbing services and an increase in revenues from its flow back services related to new equipment purchased in 2014. Net revenues from Steel Excel's sports businesses increased by $8,100 primarily as a result of $6,800 in revenues from UK Elite, which was acquired in June 2013, and an increase in revenues of $1,100 from baseball operations.
Gross profit in 2014, increased by
$24,393
, or
68.1%
, as compared to 2013, and as a percentage of revenue declined slightly to
28.7%
from
29.9%
. Gross profit from Steel Excel's energy businesses increased by $21,100, and as a percentage of revenue declined slightly to 26.5% in 2014 from 27.0% in 2013. The gross profit increase was as a result of $22,400 in gross
32
profit from the acquisition of the assets of Black Hawk Inc., which was acquired in December 2013, partially offset by a decrease in gross profit of $1,200 in Steel Excel's other energy operations. Gross profit from Steel Excel's sports businesses in the 2014 period increased by $3,400 primarily as a result of $2,700 in gross profit from UK Elite and an increase in gross profit of $600 from baseball operations.
SG&A expenses in 2014 increased by
$15,207
, as compared to 2013. SG&A expenses in Steel Excel's energy businesses increased by $3,100 as a result of $3,000 of costs incurred at Black Hawk Inc. in the 2014 period, whose assets were acquired in December 2013. SG&A expenses in Steel Excel's sports businesses increased by $3,800 primarily as a result of costs incurred at UK Elite, including costs associated with operating the businesses acquired in the current period. Other SG&A expenses increased by $6,100 primarily as a result of increased costs incurred for services provided by affiliates of Steel Excel and an increase in stock-based compensation expense in 2014.
A goodwill impairment charge of
$41,450
was recorded in the fourth quarter of 2014 as a result of the adverse effects the decline in energy prices had on the oil services industry and the projected results of operations of the Energy segment.
Interest expense of
$3,177
in 2014 decreased by
$1,452
, as compared to 2013, primarily as a result of the borrowings under Steel Excel's Amended Credit Agreement being outstanding for the full year in 2014.
Other income, net of
$7,016
in 2014 primarily represented investment income of $6,600 and realized gains on the sale of marketable securities of $3,800, partially offset by a loss of $1,800 recognized on financial instrument obligations, a loss of $600 recognized upon initially accounting for an investment under the equity method of accounting at fair value, and a foreign exchange loss of $1,100.
Comparison of the Years ended December 31, 2013 and 2012
Net revenues in 2013 increased
$27,195
, or
29.3%
, when compared to 2012. The increase was primarily due to full year of Steel Excel's results in 2013 due to the May 2012 acquisition of Steel Excel, as well as the impact from Steel Excel's 2013 acquisitions of the assets of Black Hawk Inc. and UK Elite.
Gross profit in 2013 increased by
$3,073
, or
9.4%
, as compared to 2012, and as a percentage of revenue declined to
29.9%
from
35.3%
. The increase in gross profit was commensurate with the increase in revenues as explained above.
SG&A expenses in 2013 increased by
$6,476
, as compared to 2012. The increase in SG&A expenses was commensurate with the increase in revenues as explained above.
Interest expense of
$1,725
in 2013 increased by
$988
, as compared to 2013, primarily as a result of increased interest expense primarily associated with the borrowings under the Steel Energy Credit Agreement.
Other income, net in 2013 and 2012 primarily represented realized gains and losses on the sale of marketable securities.
33
Financial Services Segment
The Financial Services segment, for financial reporting purposes, consists of our consolidated and wholly-owned subsidiary, WebFinancial Holding Corporation, which conducts financial operations through its wholly-owned subsidiary, WebBank (which operates in niche banking markets), and WF Asset Corp (which consists of a portfolio of investments). WebBank provides commercial and consumer loans and services. WebBank's deposits are insured by the FDIC up to the current limits, and the bank is examined and regulated by the FDIC and UDFI.
The following presents a summary of the Financial Services segment
operating results as reported in our consolidated financial statements
:
|
Year Ended December 31,
|
|||||||||||
|
2014
|
2013
|
2012
|
|||||||||
|
Revenue:
|
|||||||||||
|
Interest income (including fees)
|
$
|
24,640
|
|
$
|
18,898
|
|
$
|
16,051
|
|
||
|
Non-interest income
|
12,007
|
|
9,287
|
|
5,104
|
|
|||||
|
36,647
|
|
28,185
|
|
21,155
|
|
||||||
|
Costs and expenses:
|
|||||||||||
|
Selling, general and administrative expenses
|
11,808
|
|
9,933
|
|
7,700
|
|
|||||
|
Interest expense
|
638
|
|
496
|
|
957
|
|
|||||
|
Recovery of loan losses
|
(50
|
)
|
(80
|
)
|
(416
|
)
|
|||||
|
Asset impairment charge
|
—
|
|
168
|
|
1
|
|
|||||
|
12,396
|
|
10,517
|
|
8,242
|
|
||||||
|
Total segment income
|
$
|
24,251
|
|
$
|
17,668
|
|
$
|
12,913
|
|
||
Net Interest Income, Margin and Interest Rate Spreads
Net interest income is the difference between interest earned on interest-bearing assets and interest incurred on interest-bearing liabilities. By its nature, net interest income is especially vulnerable to changes in the mix and amounts of interest-earning assets and interest bearing liabilities. In addition, changes in the interest rates and yields associated with these assets and liabilities can significantly impact net interest income. The following table summarizes the average balances, the amount of interest earned or incurred and the applicable yields for interest earning assets and the costs of interest-bearing liabilities that generate net interest income. For purposes of calculating the yields in these schedules, the average loan balances also include the principal amounts of nonaccrual and restructured loans. However, interest received on nonaccrual loans is included in income only to the extent that cash payments have been received and not applied to principal reductions. In addition, interest on restructured loans is generally accrued at reduced rates.
34
|
Year Ended December 31,
|
||||||||||||||||||||||||||
|
2014
|
2013
|
2012
|
||||||||||||||||||||||||
|
Average
|
Interest
|
Average
|
Interest
|
Average
|
Interest
|
|||||||||||||||||||||
|
Outstanding
|
Earned/
|
Yield/
|
Outstanding
|
Earned/
|
Yield/
|
Outstanding
|
Earned/
|
Yield/
|
||||||||||||||||||
|
Balance
|
Paid
|
Rate
|
Balance
|
Paid
|
Rate
|
Balance
|
Paid
|
Rate
|
||||||||||||||||||
|
Interest Earning Assets:
|
||||||||||||||||||||||||||
|
Loans Receivable
|
$
|
94,484
|
|
$
|
24,433
|
|
25.9
|
%
|
$
|
62,110
|
|
$
|
18,704
|
|
30.1
|
%
|
$
|
45,377
|
|
$
|
15,822
|
|
34.8
|
%
|
||
|
Mortgaged-Backed Security
|
70
|
|
—
|
|
—
|
%
|
58
|
|
—
|
|
0.1
|
%
|
—
|
|
—
|
|
—
|
%
|
||||||||
|
Available for Sale Investments
|
566
|
|
14
|
|
2.5
|
%
|
577
|
|
13
|
|
2.3
|
%
|
523
|
|
16
|
|
3.1
|
%
|
||||||||
|
Fed Funds Sold
|
637
|
|
1
|
|
0.1
|
%
|
692
|
|
1
|
|
0.1
|
%
|
1,634
|
|
2
|
|
0.1
|
%
|
||||||||
|
Interest Bearing Deposits in other Banks
|
87,820
|
|
192
|
|
0.2
|
%
|
73,345
|
|
180
|
|
0.3
|
%
|
83,127
|
|
211
|
|
0.3
|
%
|
||||||||
|
Total Interest-Earning Assets
|
183,577
|
|
24,640
|
|
13.4
|
%
|
136,782
|
|
18,898
|
|
11.4
|
%
|
130,661
|
|
16,051
|
|
11.7
|
%
|
||||||||
|
Non Interest-Earning Assets
|
1,811
|
|
1,286
|
|
1,240
|
|
||||||||||||||||||||
|
Total Assets
|
$
|
185,388
|
|
$
|
138,068
|
|
$
|
131,901
|
|
|||||||||||||||||
|
Interest-Bearing Liabilities:
|
||||||||||||||||||||||||||
|
Money Market Accounts
|
$
|
58,232
|
|
87
|
|
0.2
|
%
|
$
|
29,312
|
|
62
|
|
0.2
|
%
|
$
|
13,789
|
|
59
|
|
0.4
|
%
|
|||||
|
Time Deposits
|
88,344
|
|
551
|
|
0.6
|
%
|
72,754
|
|
434
|
|
0.6
|
%
|
70,677
|
|
900
|
|
1.3
|
%
|
||||||||
|
Other Borrowings
|
—
|
|
—
|
|
—
|
|
—
|
|
—
|
|
—
|
|
—
|
|
—
|
|
—
|
|
||||||||
|
Total Interest-Bearing Liabilities
|
146,576
|
|
638
|
|
0.4
|
%
|
102,066
|
|
496
|
|
1.3
|
%
|
84,466
|
|
959
|
|
1.5
|
%
|
||||||||
|
Other Non Interest-Bearing Liabilities
|
3,923
|
|
3,347
|
|
18,887
|
|
||||||||||||||||||||
|
Total Liabilities
|
150,499
|
|
105,413
|
|
103,353
|
|
||||||||||||||||||||
|
Shareholder's Equity
|
34,889
|
|
32,655
|
|
28,548
|
|
||||||||||||||||||||
|
Total Liabilities & Shareholder's Equity
|
$
|
185,388
|
|
$
|
138,068
|
|
$
|
131,901
|
|
|||||||||||||||||
|
Net Interest Income
|
$
|
24,002
|
|
$
|
18,402
|
|
$
|
15,092
|
|
|||||||||||||||||
|
Spread on Average Interest-Bearing Funds
|
13
|
%
|
13.3
|
%
|
11.2
|
%
|
||||||||||||||||||||
|
Net Interest Margin
|
13.1
|
%
|
13.5
|
%
|
11.6
|
%
|
||||||||||||||||||||
|
Return on Assets
|
8.4
|
%
|
8.2
|
%
|
6.2
|
%
|
||||||||||||||||||||
|
Return on Equity
|
44.5
|
%
|
29.5
|
%
|
24.4
|
%
|
||||||||||||||||||||
|
Equity to Assets
|
18.8
|
%
|
23.2
|
%
|
21.5
|
%
|
||||||||||||||||||||
WebBank has several lending arrangements with companies where it originates private label credit card and other loans for consumers and small businesses. These loans are classified as held for sale and are typically sold after origination. As part of these arrangements WebBank earns origination fees that are recorded in interest income, and which increase WebBank's yield on loans.
Interest Income
Interest income increased by
$5,742
, or
30.4%
, in
2014
, compared to 2013 due primarily to the addition of new lending programs and to increased volume in the existing lending programs.
Interest income increased by $2,847, or 17.7%, in 2013, compared to 2012, due primarily to the addition of two new lending programs with favorable rates.
Interest Expense
Interest expense represents interest accrued on WebBank depositor accounts.
35
Interest expense increased
$142
, or
28.6%
, in
2014
, compared to 2013, primarily due to a larger deposit balance to support loan growth.
Interest expense decreased $461, or 48.2%, in 2013, compared to 2012, due to primarily due to a decrease in interest rates.
The following table presents the effects of changing rates and volumes on WebBank’s net interest income for the periods indicated. The rate column shows the effects attributable to changes in rate (changes in rate multiplied by prior volume). The volume column shows the effects attributable to changes in volume (changes in volume multiplied by prior rate). The total column represents the sum of the prior columns. For purposes of this table, changes attributable to both rate and volume, which cannot be segregated, have been allocated proportionately, based on the changes due to rate and the changes due to volume.
|
Year Ended December 31,
|
|||||||||||||||||||||||||||||
|
2014 vs 2013
|
2013 vs 2012
|
2012 vs. 2011
|
|||||||||||||||||||||||||||
|
Increase/
|
Increase/
|
Total
|
Increase/
|
Increase/
|
Total
|
Increase/
|
Increase/
|
Total
|
|||||||||||||||||||||
|
Rate/Volume
|
(Decrease)
|
(Decrease)
|
Increase/
|
(Decrease)
|
(Decrease)
|
Increase/
|
(Decrease)
|
(Decrease)
|
Increase/
|
||||||||||||||||||||
|
Due to Volume
|
Due to Rate
|
(Decrease)
|
Due to Volume
|
Due to Rate
|
(Decrease)
|
Due to Volume
|
Due to Rate
|
(Decrease)
|
|||||||||||||||||||||
|
Interest Earning Assets:
|
|||||||||||||||||||||||||||||
|
Loans Receivable
|
$
|
7,860
|
|
$
|
(2,130
|
)
|
$
|
5,730
|
|
$
|
4,572
|
|
$
|
(1,691
|
)
|
$
|
2,881
|
|
$
|
1,675
|
|
$
|
3,549
|
|
$
|
5,224
|
|
||
|
Available For Sale Investments
|
—
|
|
1
|
|
1
|
|
5
|
|
(8
|
)
|
(3
|
)
|
—
|
|
—
|
|
—
|
|
|||||||||||
|
Fed Funds Sold
|
—
|
|
—
|
|
—
|
|
(1
|
)
|
1
|
|
—
|
|
—
|
|
—
|
|
—
|
|
|||||||||||
|
Interest Bearing Deposits in other Banks
|
26
|
|
(15
|
)
|
11
|
|
(24
|
)
|
(5
|
)
|
(29
|
)
|
75
|
|
1
|
|
76
|
|
|||||||||||
|
Total Interest-Earning Assets
|
7,886
|
|
(2,144
|
)
|
5,742
|
|
4,552
|
|
(1,703
|
)
|
2,849
|
|
1,750
|
|
3,550
|
|
5,300
|
|
|||||||||||
|
Interest-Bearing Liabilities:
|
|
|
|||||||||||||||||||||||||||
|
Money Market Accounts
|
36
|
|
(11
|
)
|
25
|
|
10
|
|
(5
|
)
|
5
|
|
19
|
|
6
|
|
25
|
|
|||||||||||
|
Time Deposits
|
97
|
|
21
|
|
118
|
|
27
|
|
(493
|
)
|
(466
|
)
|
(139
|
)
|
130
|
|
(9
|
)
|
|||||||||||
|
Total Interest-Bearing Liabilities
|
133
|
|
10
|
|
143
|
|
37
|
|
(498
|
)
|
(461
|
)
|
(120
|
)
|
136
|
|
16
|
|
|||||||||||
|
Net Effect on Net Interest Income
|
$
|
7,753
|
|
$
|
(2,154
|
)
|
$
|
5,599
|
|
$
|
4,515
|
|
$
|
(1,205
|
)
|
$
|
3,310
|
|
$
|
1,870
|
|
$
|
3,414
|
|
$
|
5,284
|
|
||
Noninterest Income
Noninterest income increased
$2,720
, or
29.3%
in
2014
, compared to 2013, due primarily to the addition of new lending programs and increased volume in the existing lending programs.
Noninterest income increased $4,183, or 82.0% in 2013, compared to 2012, due primarily to increased fee income from a new lending program.
Recovery of Loan Losses
At
December 31, 2014
, WebBank had an estimated $57 of impaired loans, of which $4 is guaranteed by the USDA or SBA, and an allowance for loan losses of $558. At December 31, 2013 WebBank had an estimated $2,564 of impaired loans, of which $2,121 was guaranteed by USDA or SBA, and an allowance for loan losses of $424.
The recovery of provision for loan losses is primarily related to WebBank's portfolio of local real estate loans. WebBank routinely obtains appraisals on underlying collateral of nonperforming loans and records a provision for losses if the value of the collateral declines below the value of the loans. WebBank was able to recover previously charged off loans and workout or sell nonperforming loans resulting in net benefit in the provision for loan losses of
$50
,
$80
and $416 in
2014
,
2013
and 2012 respectively.
Selling General and Administrative Expenses
The increase in SG&A expenses of
$1,875
, or
18.9%
, in
2014
, compared to
2013
, was due primarily to higher personnel expense in 2014 due to growth in the business.
36
The increase in SG&A expenses of $2,233, or 29.0%, in 2013, compared to 2012, was due primarily to higher personnel expense in 2013, partially offset by a benefit in the reserve for off balance sheet credit exposures of $175, lower professional fees and lower other miscellaneous costs.
Loan Portfolio
As of
December 31, 2014
, net loans accounted for 52% of WebBank's total assets compared to 44% at the end of
2013
. The following table presents WebBank's loans outstanding by type of loan as of
December 31, 2014
and the five most recent year-ends.
|
As of December 31,
|
|||||||||||||||||||||||||||||
|
2014
|
2013
|
2012
|
2011
|
2010
|
|||||||||||||||||||||||||
|
Amount
|
%
|
Amount
|
%
|
Amount
|
%
|
Amount
|
%
|
Amount
|
%
|
||||||||||||||||||||
|
Real Estate Loans:
|
|||||||||||||||||||||||||||||
|
Construction
|
$
|
—
|
|
—
|
|
$
|
—
|
|
—
|
|
$
|
—
|
|
—
|
|
$
|
—
|
|
—
|
%
|
$
|
988
|
|
3.3
|
%
|
||||
|
Commercial - Owner Occupied
|
1,650
|
|
1.4
|
%
|
4,671
|
|
6.1
|
%
|
6,724
|
|
9.8
|
%
|
8,340
|
|
18.8
|
%
|
9,546
|
|
31.9
|
%
|
|||||||||
|
Commercial - Other
|
264
|
|
0.2
|
%
|
242
|
|
0.3
|
%
|
318
|
|
0.5
|
%
|
300
|
|
0.7
|
%
|
276
|
|
0.9
|
%
|
|||||||||
|
Total Real Estate Loans
|
1,914
|
|
1.6
|
%
|
4,913
|
|
6.4
|
%
|
7,042
|
|
10.3
|
%
|
8,640
|
|
19.5
|
%
|
10,810
|
|
36.1
|
%
|
|||||||||
|
Commercial and Industrial:
|
75,706
|
|
63.9
|
%
|
46,702
|
|
60.9
|
%
|
9,832
|
|
14.4
|
%
|
4,344
|
|
9.8
|
%
|
6,219
|
|
20.8
|
%
|
|||||||||
|
Total Commercial and Industrial
|
75,706
|
|
63.9
|
%
|
46,702
|
|
60.9
|
%
|
9,832
|
|
14.4
|
%
|
4,344
|
|
9.8
|
%
|
6,219
|
|
20.8
|
%
|
|||||||||
|
Loans Held for Sale:
|
40,886
|
|
34.5
|
%
|
25,125
|
|
32.7
|
%
|
51,505
|
|
75.3
|
%
|
31,363
|
|
70.7
|
%
|
12,903
|
|
43.1
|
%
|
|||||||||
|
Total Loans
|
118,506
|
|
100.0
|
%
|
76,740
|
|
100
|
%
|
68,379
|
|
100
|
%
|
44,347
|
|
100
|
%
|
29,932
|
|
100
|
%
|
|||||||||
|
Less:
|
|||||||||||||||||||||||||||||
|
Deferred Fees and Discounts
|
(20
|
)
|
—
|
|
21
|
|
(56
|
)
|
(64
|
)
|
|||||||||||||||||||
|
Allowance for Loan Losses
|
(557
|
)
|
(424
|
)
|
(285
|
)
|
(529
|
)
|
(1,541
|
)
|
|||||||||||||||||||
|
Total Loans Receivable, Net
|
$
|
117,929
|
|
$
|
76,316
|
|
$
|
68,115
|
|
$
|
43,762
|
|
$
|
28,327
|
|
||||||||||||||
The following table includes a maturity profile for the loans that were outstanding at
December 31, 2014
, substantially all of which have floating or adjustable interest rates:
|
Due During Years Ending December 31,
|
Real Estate
|
Commercial & Industrial
|
Loans Held for Sale
|
||||||||
|
2015
|
$
|
96
|
|
$
|
1,142
|
|
$
|
40,886
|
|
||
|
2016-2020
|
654
|
|
31,970
|
|
—
|
|
|||||
|
2021 and following
|
1,164
|
|
42,594
|
|
—
|
|
|||||
|
Total
|
$
|
1,914
|
|
$
|
75,706
|
|
$
|
40,886
|
|
||
Nonperforming Lending Related Asset
Total nonaccrual loans at December 31, 2014 decreased by $121 from December 31, 2013. The decrease included $28
for commercial owner occupied loans and $93 for commercial and industrial loans.
37
|
December 31,
|
|||||||||||||||||||
|
2014
|
2013
|
2012
|
2011
|
2010
|
|||||||||||||||
|
Non-Accruing Loans:
|
|||||||||||||||||||
|
Commercial Real Estate - Construction
|
$
|
—
|
|
$
|
—
|
|
$
|
—
|
|
$
|
—
|
|
$
|
988
|
|
||||
|
Commercial Real Estate - Owner Occupied
|
374
|
|
403
|
|
147
|
|
914
|
|
207
|
|
|||||||||
|
Commercial and Industrial
|
16
|
|
109
|
|
94
|
|
97
|
|
419
|
|
|||||||||
|
Total
|
390
|
|
512
|
|
241
|
|
1,011
|
|
1,614
|
|
|||||||||
|
Accruing Loans Delinquent:
|
|||||||||||||||||||
|
90 Days or More
|
52
|
|
—
|
|
2,581
|
|
—
|
|
—
|
|
|||||||||
|
Total
|
52
|
|
—
|
|
2,581
|
|
—
|
|
—
|
|
|||||||||
|
Restructured Loans:
|
|||||||||||||||||||
|
Commercial Real Estate - Owner Occupied
|
—
|
|
—
|
|
—
|
|
1
|
|
18
|
|
|||||||||
|
Commercial and Industrial
|
—
|
|
—
|
|
—
|
|
—
|
|
7
|
|
|||||||||
|
Total
|
—
|
|
—
|
|
—
|
|
1
|
|
25
|
|
|||||||||
|
Foreclosed Assets:
|
|||||||||||||||||||
|
Commercial Real Estate - Owner Occupied
|
111
|
|
149
|
|
68
|
|
333
|
|
38
|
|
|||||||||
|
Commercial and Industrial
|
—
|
|
—
|
|
—
|
|
—
|
|
53
|
|
|||||||||
|
Total
|
111
|
|
149
|
|
68
|
|
333
|
|
91
|
|
|||||||||
|
Total Non-Performing Assets
|
$
|
553
|
|
$
|
661
|
|
$
|
2,890
|
|
$
|
1,345
|
|
$
|
1,730
|
|
||||
|
Total as a Percentage of Total Assets
|
0.2
|
%
|
0.4
|
%
|
2.1
|
%
|
1.1
|
%
|
2
|
%
|
|||||||||
Summary of Loan Loss Experience
The methodologies used to estimate the Allowance for Loan Losses ("ALLL") depend upon the impairment status and portfolio segment of the loan. Loan groupings are created for each loan class and are then graded against historical and industry loss rates.
After applying historic loss experience, as described above, we review the quantitatively derived level of ALLL for each segment using qualitative criteria. We track various risk factors that influence our judgment regarding the level of the ALLL across the portfolio segments.
38
The following table summarizes activity in WebBank's allowance for loan and lease losses for the periods indicated:
|
December 31,
|
|||||||||||||||||||
|
2014
|
2013
|
2012
|
2011
|
2010
|
|||||||||||||||
|
Balance at Beginning of Period
|
$
|
424
|
|
$
|
285
|
|
$
|
529
|
|
$
|
1,541
|
|
$
|
2,193
|
|
||||
|
Charge Offs:
|
|||||||||||||||||||
|
Commercial Real Estate - Construction
|
—
|
|
—
|
|
—
|
|
(440
|
)
|
(80
|
)
|
|||||||||
|
Commercial Real Estate - Owner Occupied
|
—
|
|
—
|
|
(1
|
)
|
(422
|
)
|
(482
|
)
|
|||||||||
|
Commercial Real Estate - Other
|
—
|
|
—
|
|
—
|
|
—
|
|
(268
|
)
|
|||||||||
|
Commercial and Industrial
|
(3
|
)
|
(64
|
)
|
—
|
|
(727
|
)
|
(714
|
)
|
|||||||||
|
Total Charge Offs
|
(3
|
)
|
(64
|
)
|
(1
|
)
|
(1,589
|
)
|
(1,544
|
)
|
|||||||||
|
Recoveries:
|
|||||||||||||||||||
|
Commercial Real Estate - Construction
|
—
|
|
—
|
|
—
|
|
466
|
|
961
|
|
|||||||||
|
Commercial Real Estate - Owner Occupied
|
65
|
|
23
|
|
48
|
|
27
|
|
2
|
|
|||||||||
|
Commercial Real Estate - Other
|
40
|
|
44
|
|
44
|
|
44
|
|
18
|
|
|||||||||
|
Commercial and Industrial
|
81
|
|
216
|
|
80
|
|
32
|
|
331
|
|
|||||||||
|
Total Recoveries
|
186
|
|
283
|
|
172
|
|
569
|
|
1,312
|
|
|||||||||
|
Net (Charge Offs) Recoveries
|
183
|
|
219
|
|
171
|
|
(1,020
|
)
|
(232
|
)
|
|||||||||
|
Additions Charged to Operations
|
(50
|
)
|
(80
|
)
|
(415
|
)
|
8
|
|
(420
|
)
|
|||||||||
|
Balance at End of Period
|
$
|
557
|
|
$
|
424
|
|
$
|
285
|
|
$
|
529
|
|
$
|
1,541
|
|
||||
|
Ratio of Net Charge Offs During the Period to Average Loans Outstanding During the Period
|
(0.2
|
)%
|
(0.4
|
)%
|
(0.4
|
)%
|
2.6
|
%
|
0.7
|
%
|
|||||||||
The distribution of WebBank's allowance for losses on loans at the dates indicated is summarized as follows:
|
December 31,
|
|||||||||||||||||||||||||||||
|
2014
|
2013
|
2012
|
2011
|
2010
|
|||||||||||||||||||||||||
|
Amount
|
% of Loans in Each Category of Total Loans
|
Amount
|
% of Loans in Each Category of Total Loans
|
Amount
|
% of Loans in Each Category of Total Loans
|
Amount
|
% of Loans in Each Category of Total Loans
|
Amount
|
% of Loans in Each Category of Total Loans
|
||||||||||||||||||||
|
Commercial Real Estate - Construction
|
$
|
—
|
|
—
|
%
|
$
|
—
|
|
—
|
%
|
$
|
—
|
|
—
|
%
|
$
|
—
|
|
—
|
%
|
$
|
200
|
|
3.3
|
%
|
||||
|
Commercial Real Estate - Owner Occupied
|
64
|
|
1.4
|
%
|
77
|
|
6.1
|
%
|
187
|
|
9.8
|
%
|
346
|
|
18.8
|
%
|
293
|
|
31.9
|
%
|
|||||||||
|
Commercial Real Estate - Other
|
12
|
|
0.2
|
%
|
28
|
|
0.3
|
%
|
34
|
|
0.5
|
%
|
47
|
|
0.7
|
%
|
8
|
|
0.9
|
%
|
|||||||||
|
Commercial and Industrial
|
481
|
|
63.9
|
%
|
319
|
|
60.9
|
%
|
64
|
|
14.4
|
%
|
136
|
|
9.8
|
%
|
565
|
|
20.8
|
%
|
|||||||||
|
Loans Held for Sale
|
—
|
|
34.5
|
%
|
—
|
|
32.7
|
%
|
—
|
|
75.3
|
%
|
—
|
|
70.7
|
%
|
—
|
|
43.1
|
%
|
|||||||||
|
Unallocated
|
—
|
|
—
|
%
|
—
|
|
—
|
%
|
—
|
|
—
|
%
|
—
|
|
—
|
|
475
|
|
—
|
%
|
|||||||||
|
Total Loans
|
$
|
557
|
|
100
|
%
|
$
|
424
|
|
100
|
%
|
$
|
285
|
|
100
|
%
|
$
|
529
|
|
100
|
%
|
$
|
1,541
|
|
100
|
%
|
||||
39
Corporate and Other
The Corporate and Other segment consists of several consolidated subsidiaries as well as various investments and cash and cash equivalents. Corporate revenues primarily consist of investment and other income, investment gains and losses and rental income. See Note 5 - "Investments" to the SPLP consolidated financial statements included elsewhere in this Form 10-K for additional information on the equity method investments and other investments classified within this segment.
SPH services provides legal, tax, accounting, treasury, consulting, auditing, administration, compliance, environmental health and safety, human resources, marketing, investor relations and similar services, to other affiliated companies.
DGT's operations currently consist of a real estate business from a rental building retained from the sale of its Medical Systems Group on November 3, 2011. The expenses related to the BNS Liquidating Trust are included in Corporate and Other from July 1, 2012 through December 31, 2012. For additional information on the BNS Liquidating Trust, see Note 16 - "Capital and Accumulated Other Comprehensive Income" to the SPLP consolidated financial statements included elsewhere in this Form 10-K.
The following presents a summary of Corporate and Other segment
operating results as reported in our consolidated financial statements
:
|
Year Ended December 31,
|
|||||||||||
|
2014
|
2013
|
2012
|
|||||||||
|
Revenue:
|
|||||||||||
|
Investment and other income
|
$
|
1,346
|
|
$
|
665
|
|
$
|
2,347
|
|
||
|
Net investment gains
|
921
|
|
1,071
|
|
15,722
|
|
|||||
|
2,267
|
|
1,736
|
|
18,069
|
|
||||||
|
Costs and expenses:
|
|||||||||||
|
Selling, general and administrative expenses
|
18,494
|
|
46,677
|
|
23,414
|
|
|||||
|
Interest expense
|
529
|
|
338
|
|
152
|
|
|||||
|
Asset impairment charges
|
1,223
|
|
2,520
|
|
1,409
|
|
|||||
|
Deferred fee liability to related party - increase
|
—
|
|
—
|
|
11,448
|
|
|||||
|
Other expense
|
243
|
|
491
|
|
133
|
|
|||||
|
20,489
|
|
50,026
|
|
36,556
|
|
||||||
|
Loss from continuing operations before income (loss) from equity method investments and investments held at fair value
|
(18,222
|
)
|
(48,290
|
)
|
(18,487
|
)
|
|||||
|
Equity Method Investments:
|
|||||||||||
|
Associated Companies:
|
|||||||||||
|
MLNK
|
(22,940
|
)
|
23,154
|
|
—
|
|
|||||
|
CoSine
|
(405
|
)
|
(418
|
)
|
(328
|
)
|
|||||
|
Fox & Hound Acquisition Corp. ("Fox & Hound")
|
—
|
|
(11,521
|
)
|
(403
|
)
|
|||||
|
Other
|
(79
|
)
|
(823
|
)
|
—
|
|
|||||
|
Income (Loss) from other investments - related party
|
891
|
|
(271
|
)
|
(8,329
|
)
|
|||||
|
Total (loss) income from equity method investments
|
(22,533
|
)
|
10,121
|
|
(9,060
|
)
|
|||||
|
(Loss) Income from investments held at fair value
|
(16,069
|
)
|
811
|
|
18,967
|
|
|||||
|
Total segment loss
|
$
|
(56,824
|
)
|
$
|
(37,358
|
)
|
$
|
(8,580
|
)
|
||
Revenue
Investment and other income is often based on a limited number of transactions, the timing and amounts of which are not always predictable. Net investment gains (losses) include realized gains and losses on sales of securities and write-downs of investments available-for-sale when there is deemed to be an other than temporary impairment. The Company’s decision to sell securities and realize gains or losses generally includes its evaluation of strategic considerations, an individual security’s value at the time and the prospect for changes in its value in the future. The timing of realized investment gains or losses is not predictable and does not follow any pattern from year to year. Interest and dividend income will vary depending on the type and amount of securities held from year to year.
40
Investment and other income increased by $
681
or
102.4%
in
2014
, compared to 2013 due to higher dividends received in 2014 compared to 2013. Investment and other income decreased by $1,682 or 71.7% in 2013, compared to 2012 due to higher dividend income recorded in 2012 as a result of an approximately $2,000 dividend from SLI (see Note 5 - "Investments" to the SPLP consolidated financial statements found elsewhere in this Form 10-K for additional information).
Net investment gains in 2014 were
$921
compared to
$1,071
in 2013. The net gains in 2014 were due to income from foreign currency instruments. The net gains in 2013 were primarily due to gains of approximately $1,200 on the sales of certain available-for-sale securities, partially offset by losses from foreign currency instruments.
Net investment gains in 2013 were $1,071 compared to $15,722 in 2012. The net gains in 2013 were primarily due to gains of approximately $1,200 on the sales of certain available-for-sale securities, partially offset by losses from foreign currency instruments. The net gains in 2012 were primarily due to the gain on the Company's investment in Steel Excel of approximately $13,500 resulting from remeasuring our investment to fair value upon acquisition of the majority interest in Steel Excel on May 31, 2012. See Note 3 - "Acquisitions" to the SPLP consolidated financial statements found elsewhere in this Form 10-K for further information.
Interest Expense
Interest expense increased in 2014 compared to 2013 primarily due to borrowings under the credit agreement with PNC Bank, National Association (“PNC”) (the “Amended Credit Facility”). In April 2014, the Company borrowed $47,500 under the Amended Credit Facility in connection with a tender offer for its common units (see Note 16 - "Capital and Accumulated Other Comprehensive Income" to the SPLP consolidated financial statements found elsewhere in this Form 10-K). The amounts outstanding under the Credit Facility were approximately $33,800 and $0 as of December 31, 2014 and 2013, respectively (see Note 14 - Debt and Capital Lease Obligations" to the SPLP consolidated financial statements found elsewhere in this Form 10-K).
Interest expense in 2013 and 2012 was primarily due to foreign currency transactions that the Company entered into which, in effect, in certain circumstances, may have represented borrowings from the counterparty. Interest expense represents interest and other fees on such transactions.
Selling, General and Administrative Expenses
SG&A expenses consist primarily of legal, accounting, audit, tax, professional fees, management fees and expense related to the Company's incentive units in all periods (see Note 16 - "Capital and Accumulated Other Comprehensive Income" to the SPLP consolidated financial statements found elsewhere in this Form 10-K).
SG&A expenses decreased by
$28,183
or
60.4%
in
2014
, compared to 2013, primarily due to lower non-cash incentive unit expense (see Note 16 - "Capital and Accumulated Other Comprehensive Income" to the SPLP consolidated financial statements found elsewhere in this Form 10-K).
SG&A expenses increased by
$23,263
or
99.4%
in 2013, compared to 2012, primarily due to non-cash incentive unit expense (see Note 16 - "Capital and Accumulated Other Comprehensive Income" to the SPLP consolidated financial statements found elsewhere in this Form 10-K).
Impairment Charges
In 2014, the Company recorded an impairment charge of $1,223 to record an asset held for sale by DGT to its net realizable value.
In 2013, the Company recorded an impairment charge of $1,510 related to its investment in a Japanese real estate partnership and an impairment charge of approximately $1,010 related to an other-than-temporary decline in an available-for-sale security (see Note 5 - "Investments" to the SPLP consolidated financial statements found elsewhere in this Form 10-K).
In 2012, the Company recorded an impairment charge of $580 related to its investment in a Japanese real estate partnership (see Note 5 - "Investments" to the SPLP consolidated financial statements found elsewhere in this Form 10-K). In addition, the Company recorded an other than temporary impairment of $829 related to an available for sale security.
41
Deferred Fee Liability to Related Party - Increase
Deferred fee liability to related party - increase arose as a result of the assumption, in connection with the Exchange Transaction, of an obligation pursuant to a deferred fee agreement due to the Investment Manager, an affiliate of the Manager ("Deferred Fee Liability"). The increase in Deferred Fee Liability to related party of $11,448 recorded in 2012 was due to an increase in an index related to the value of SPLP. On April 11, 2012, the Company and the Investment Manager terminated the Investor Services Agreement by mutual consent. As a result of the termination of the Investor Services Agreement the full amount in the Deferred Fee Liability became immediately payable. As a result, on April 11 and May 11, 2012, 6,403,002 and 536,645 class B common units, respectively, were issued to the Investment Manager. In connection with the termination of the Investor Services Agreement, the Investment Manager agreed not to sell any of the common units issued as payment for the deferred fee during the one year period following the Termination Date. For additional information, see Note 13 - "Related Party Transactions" to the SPLP consolidated financial statements found elsewhere in this Form 10-K.
Equity Method Investments
Associated Companies
We record income or loss on investments where we own between 20% and 50% of the outstanding equity and have the ability to exercise influence, but not control, over the investee.
As noted in the table above, the change within the Corporate and Other segment in 2014 was primarily due to greater reductions in the 2014 period related to the fair value of MLNK, partially offset by the non-recurring loss recorded in 2013 related to Fox & Hound (see Note 5 – "Investments" to the SPLP consolidated financial statements found elsewhere in this Form 10-K for additional information). The change in 2013 was due to income recorded in 2013 related to the the increase in fair value of MLNK, which became an associated company in 2013, partially offset by a higher loss in 2013 related to Fox & Hound.
Income (Loss) From Other Investments - Related Party
Income (Loss) from other investments - related party represents the change in fair value that we recognize on our 43.75% investment in each series of the SPII Liquidating Trust (for additional information see Note 5 - “Investments” to the SPLP consolidated financial statements found elsewhere in this Form 10-K). The income in 2014 was primarily due to the series of the SPII Liquidating Trust that holds an interest in Steel Partners China Access I L.P. The loss for the year ended December 31, 2013 was not significant. The loss in 2012 was primarily due to the series of the SPII Liquidating Trust that held an interest in Fox & Hound Restaurant Group ("F&H"). On March 19, 2012, in conjunction with a long-term refinancing of its debt, Fox & Hound issued new common equity. As a result of the transaction, our interest in F&H through the SPII Liquidating Trust was diluted and reduced by approximately $11,200, which was recorded in the first quarter of 2012.
(Loss) Income From Investments Held at Fair Value
(Loss) Income from investments held at fair value for the years ended December 31, 2014 and 2013 includes income or loss that the Company recognizes on its direct investment in API and its investment in ModusLink warrants (see Note 5 - "Investments" to the SPLP consolidated financial statements found elsewhere in this Form 10-K). (Loss) Income from investments held at fair value for the year ended December 31, 2012 included income or loss that the Company recognized on its direct investment in API and Barbican.
Income Taxes
As a limited partnership, we are generally not responsible for federal and state income taxes and our profits and losses are passed directly to our limited partners for inclusion in their respective income tax returns. Provision has been made for federal, state, local or foreign income taxes on the results of operations generated by our corporate subsidiaries and these are reflected within continuing and discontinued operations. The difference between the effective tax rate and statutory federal rate of 35% is principally due to changes in the valuation allowances, various permanent differences included in the provisions of our subsidiaries, and partnership income not subject to taxation. The Company’s tax provision represents the income tax expense or benefit of its consolidated subsidiaries. The Company's consolidated subsidiaries have recorded deferred tax valuation allowances to the extent that they believe that it is more likely than not that the benefits of its deferred tax assets will not be realized in future periods.
42
For the years ended
December 31, 2014
,
2013
and
2012
tax provisions of $
24,288
,
$6,477
and
$13,068
from continuing operations were recorded. The increase in the effective tax rate in 2014 was impacted by the tax effect of the non-deductible portion of the goodwill impairment recorded in the fourth quarter of 2014 (see Note 11 - "Goodwill and Other Intangible Assets, Net" of the SPLP financial statements found elsewhere in this Form 10-K ).
At
December 31, 2014
, HNH has U.S. federal NOLs of approximately $82,400 (approximately $28,800 tax-effected), as well as certain state NOLs. The U.S. federal NOLs expire between 2026 and 2029. Also included in deferred income tax assets are tax credit carryforwards of $3,700. HNH's net tax provisions from continuing and discontinued operations reflects utilization of approximately $23,800 of Federal NOLs in 2014.
Steel Excel had Federal net operating loss carryforwards of approximately $113,000 that expire in 2014 through 2031, and domestic state net operating loss carryforwards of approximately $159,900 that expire in 2014 through 2031. Steel Excel also had Federal research and development credit carryforwards of approximately $30,300 that expire in 2018 through 2029, and domestic state research and development credit carryforwards of approximately $17,700 that do not expire. Steel Excel’s ability to utilize its net operating loss and other credit carryforwards would be subject to limitation upon a change in control.
During 2013 and 2012 WebFinancial had significant earnings and utilized the vast majority of its Federal and state NOLS. Accordingly, WebFinancial recorded tax benefits in continuing operations of approximately $1,034 associated with the reversals of its deferred tax valuation allowances.
At October 31, 2014, DGT had $28,818 of federal net operating loss carryforwards that are scheduled to expire from 2021 to 2031. Because of the uncertainty of future earnings of DGT, a valuation allowance has been established for the net operating loss carryforwards. As described in Note 1 - “Nature of the Business and Basis of Presentation” included in the SPLP financial statements found elsewhere this Form 10-K, the Consolidated Balance Sheet as of and for the twelve months ended December 31, 2014 includes DGT’s activity as of and for its twelve months ended October 31, 2014.
FINANCIAL CONDITION
We rely on our available liquidity to meet our short-term and long-term needs, and to make acquisitions of new businesses and additional investments in existing businesses. Except as otherwise disclosed herein, our operating businesses do not generally require material funds from us to support their operating activities, and we do not depend on positive cash flow from our operating segments to meet our liquidity needs. The components of our consolidated businesses and investments may change frequently as a result of acquisitions or divestitures, the timing of which is impossible to predict, but which often have a material impact on our consolidated statements of cash flows in any one period. Further, the timing and amounts of distributions from certain of our investments accounted for under the equity method are generally outside our control. As a result, reported cash flows from operating, investing and financing activities do not generally follow any particular pattern or trend, and reported results in the most recent period should not be expected to recur in any subsequent period.
Cash Flow Summary
|
Year Ended December 31,
|
|||||||||||
|
2014
|
2013
|
2012
|
|||||||||
|
Net cash provided by operating activities
|
$
|
78,033
|
|
$
|
94,952
|
|
$
|
65,498
|
|
||
|
Net cash (used in) provided by investing activities
|
(63,058
|
)
|
(154,322
|
)
|
74,765
|
|
|||||
|
Net cash (used in) provided by by financing activities
|
(29,667
|
)
|
65,450
|
|
(69,531
|
)
|
|||||
|
Change in period
|
$
|
(14,692
|
)
|
$
|
6,080
|
|
$
|
70,732
|
|
||
Cash Flows from Operating Activities
Net cash provided by operating activities for the twelve months ended December 31, 2014 was
$78,033
. Net loss from continuing operations of
$17,572
was impacted by certain non-cash items and a decrease of
$43,581
relating to changes in certain operating assets and liabilities. Of this working capital decrease,
$21,172
was from a decrease in accounts payable and accrued and other liabilities,
$17,251
was due to an increase on loans held for sale,
$3,056
was from an increase in accounts receivable and
$4,697
was from an increase in inventories, partially offset by a decrease of
$2,109
in prepaid and other assets. Net cash provided by operating activities was also impacted by
$18,588
in cash provided by operating activities of discontinued operations.
43
Net cash provided by operating activities for the twelve months ended December 31, 2013 was
$94,952
. Net income form continuing operations of
$38,374
was impacted by certain non-cash items and an increase of
$11,125
relating to changes in certain operating assets and liabilities. Of this working capital increase,
$26,379
was due to a decrease in loans held for sale,
$7,875
was from an decrease in accounts receivable,
$698
was from an decrease in prepaid and other assets,
$2,812
was from an decrease in inventories, partially offset by
$25,107
from a decrease in accounts payable and accrued and other liabilities. Net cash provided by operating activities was also impacted by
$9,699
in cash provided by operating activities of discontinued operations.
Net cash provided by operating activities for the twelve months ended December 31, 2012 was
$65,498
. Net income from continuing operations of
$43,736
was partially offset by a decrease of
$24,305
relating to changes in operating assets and liabilities. Of this working capital decrease,
$20,142
was from an increase on loans held for sale,
$15,220
was from a decrease in accounts payable and accrued and other liabilities, partially offset by a decrease in accounts receivable of
$13,618
, and a decrease in inventories of
$458
. The decrease in accounts receivable relates primarily to principally due to the impact of lower silver prices on HNH in 2012, compared with rising prices in 2011. Net income from continuing operations was also impacted by
$11,448
relating to the increase in the Deferred Fee Liability to related party. Net cash provided by operating activities was also impacted by
$32,802
relating to net cash provided by operating activities of discontinued operations.
Cash Flows from Investing Activities
Net cash used in investing activities for the twelve months ended December 31, 2014 was
$63,058
. Significant items included cash paid for acquisitions made by HNH and Steel Excel, of
$517
, investments in associated companies of
$1,643
, which primarily relates to our investment in ModusLink and Steel Excel's investment in an associated company, a net increase in loans receivable of
$25,805
, purchases of property plant and equipment of
$28,769
and settlements of financial instruments of
$24,429
. These cash uses from investing activities were partially offset by cash increases due to proceeds from the sales of discontinued operations of
$3,732
and net proceeds from investment sales and maturities of
$12,941
.
Net cash used in investing activities for the twelve months ended December 31, 2013 was
$154,322
. Significant items included cash paid for acquisitions made by HNH and Steel Excel, of
$130,528
, investments in associated companies of
$36,018
, which primarily relates to our investment in ModusLink and Steel Excel's investment in an associated company, a net increase in loans receivable of
$34,619
and purchases of property plant and equipment of
$20,885
. These cash uses from investing activities were partially offset by cash increases due to proceeds from the sales of discontinued operations of
$45,334
and net proceeds from investment sales and maturities of
$24,488
.
Net cash provided by investing activities for the twelve months ended December 31, 2012 was
$74,765
. Significant items included net cash acquired in acquisitions of
$29,941
, primarily from the acquisition of Steel Excel, proceeds from the sales of discontinued operations of
$33,505
and investment sales net of purchases of
$61,747
. These cash increases were partially offset by investments in associated companies of
$16,628
, which represents our investment in Fox & Hound and additional investment in Steel Excel, and purchases of property plant and equipment of
$30,569
.
Cash Flows from Financing Activities
Net cash used in financing activities for the twelve months ended December 31, 2014 was
$29,667
. This was due primarily to repayments of term loans of
$182,080
and repurchases of subordinated notes of
$346
, subsidiary repurchases of their treasury stock of
$78,488
, treasury purchases of SPLP units of
$51,465
primarily due to the tender offer for SPLP units in 2014, subsidiary's purchases of the Company's common units of
$7,921
, partially offset by proceeds from term loans of
$52,600
, proceeds from revolver borrowings of
$196,212
and a net increase in deposits of
$46,654
.
Net cash provided by financing activities for the twelve months ended December 31, 2013 was
$65,450
. This was due primarily to proceeds from term loans of
$105,000
, proceeds from revolver borrowings of
$30,950
and a net increase in deposits of
$39,567
, partially offset by subsidiary repurchases of their treasury stock of
$50,144
, repayments of term loans of
$27,582
, subsidiary's purchases of the Company's common units of
$15,690
and repurchases of subordinated notes of
$11,323
.
Net cash used in financing activities for the twelve months ended December 31, 2012 was
$69,531
. This was due primarily to distributions paid to noncontrolling interest holders of BNS of
$10,316
, subsidiary's purchases of the Company's common units of
$15,082
, repayments of term loans of
$95,833
, lower bank deposits held by WebBank of
$16,273
, repurchases of subordinated notes of
$10,847
and net revolver payments of
$23,849
, partially offset by proceeds from term loans of
$116,838
.
44
LIQUIDITY AND CAPITAL RESOURCES
Holding Company
SPLP (excluding its operating subsidiaries, the “Holding Company”) is a global diversified holding company whose assets principally consist of the stock of its direct subsidiaries, cash and cash equivalents and other non-controlling investments in equity securities. Its principal potential sources of funds are available cash resources, investments, borrowings, public and private capital market transactions, distributions or dividends from subsidiaries, as well as dispositions of existing businesses and investments. The Holding Company’s investments are subject to changes that may result in amounts realized from any future sales that are at times significantly different from the value we are reporting at
December 31, 2014
. These investments, including those accounted for under the equity method, can be impacted by market conditions, changes in the specific business environments of our investees or by the underlying performance of these businesses.
In addition to cash and cash equivalents, the Holding Company considers certain investments at fair value included in its consolidated balance sheet as being generally available to meet its liquidity needs. These investments are not as liquid as cash and cash equivalents, but they are generally convertible into cash within a reasonable period of time. As of
December 31, 2014
, the Holding Company had cash and cash equivalents of approximately
$10,500
and investments of approximately
$257,400
.
The Holding Company generally does not have access to the cash flow generated by the Company’s operating businesses for its needs, and the operating businesses generally do not rely on the Holding Company to support their operating activities. The Holding Company’s available liquidity, income from management services agreements and the investment income realized from the Holding Company’s cash, cash equivalents and marketable securities is used to meet the Holding Company’s recurring cash requirements, which are principally the payment of its overhead expenses (see Note 13 - "Related Party Transactions" to the SPLP consolidated financial statements found elsewhere in this Form 10-K).
The Holding Company and its operating businesses may use their available liquidity to make acquisitions of new businesses and other investments, but the timing and cost of any future investments cannot be predicted. The Company may seek external debt or equity financing and will rely on its existing liquidity to fund corporate overhead expenses and new acquisition opportunities. It may also dispose of existing businesses and investments. At
December 31, 2014
, the Holding Company and its consolidated subsidiaries had, in the aggregate, cash and cash equivalents of
$188,983
available for operations in the ordinary course of business and for the acquisition of interests in businesses.
The Holding Company's Amended Credit Facility provides for a revolving credit facility with borrowing availability of up to
$75,000
and additional flexibility to allow one or more new lenders to join and become a party to the Amended Credit Facility with a minimum revolving credit commitment amount of not less than
$10,000
, and not to exceed a total commitment of
$100,000
. Amounts outstanding under the Amended Credit Facility bear interest at
LIBOR
plus
1.25%
, and are collateralized by first priority security interests of certain of the Company's deposit accounts and publicly traded securities. The interest rate on the Amended Credit Facility was
1.7%
as of
December 31, 2014
. The Amended Credit Facility requires a commitment fee to be paid on unused borrowings and also contains customary affirmative and negative covenants, including a minimum cash balance covenant, restrictions against the payment of dividends and customary events of default. Any amounts outstanding under the Amended Credit Facility are due and payable in full on October 23, 2017.
The Amended Credit Facility also includes provisions for the issuance of letters of credit up to
$10,000
, with any such issuances reducing total borrowing availability. There were no letters of credit outstanding at December 31, 2014.
In April 2014, the Company borrowed
$47,500
under the Amended Credit Facility in connection with a tender offer for its common units (see Note 16 - "Capital and Accumulated Other Comprehensive Income"). The amounts outstanding under the Credit Facility were approximately
$33,788
and
$0
as of
December 31, 2014
and
2013
, respectively.
Discussion of Segment Liquidity and Capital Resources
HNH
HNH's principal source of liquidity is its cash flows from operations. As of
December 31, 2014
, HNH’s current assets totaled
$258,544
, its current liabilities totaled
$77,461
, and its working capital was
$181,083
, as compared to working capital of
$147,667
as of
December 31, 2013
.
45
HNH generated
$50,689
of positive cash flow from operating activities in the
twelve
months ended
December 31, 2014
and
$49,163
of positive cash flow from operating activities in the comparable
2013
period. SPLP's consolidated financial statements reflect pre-tax income from continuing operations of
$39,428
and
$33,643
relating to HNH for the
twelve
months ended
December 31, 2014
and
2013
, respectively.
HNH's debt is principally held by H&H Group, a wholly-owned subsidiary of HNH. HNH's subsidiaries borrow funds in order to finance capital expansion programs and for working capital needs. The terms of certain of those financing arrangements place restrictions on distributions of funds to HNH, the parent company, subject to certain exceptions including required pension payments to the WHX Pension Plan. HNH does not expect these restrictions to have an impact on it's ability to meet its cash obligations. HNH's ongoing operating cash flow requirements consist primarily of arranging for the funding of the minimum requirements of the WHX Pension Plan and paying HNH's administrative costs. HNH expects to have required minimum contributions to the WHX Pension Plan for 2015, 2016, 2017, 2018, 2019 and for the five years thereafter of $17,000, $13,900, $14,800, $17,000, $18,600 and $59,500, respectively. Such required contributions are estimated based upon assumptions regarding such matters as discount rates on future obligations, assumed rates of return on plan assets and legislative changes. Actual future pension costs and required funding obligations will be affected by changes in the factors and assumptions described in the previous sentence, as well as other changes such as any plan termination or other acceleration events.
HNH believes it has access to adequate resources to meet its needs for normal operating costs, capital expenditures, mandatory debt redemptions and working capital for its existing business. These resources include cash and cash equivalents, cash provided by operating activities and unused lines of credit. On August 29, 2014, H&H Group entered into an amended and restated senior credit agreement, which provides for an up to $365,000 senior secured revolving credit facility. As of December 31, 2014, H&H Group's availability under its senior secured revolving credit facility was $101,000 and as of January 31, 2015, it was 178,200, reflecting the sale of Arlon. HNH's ability to satisfy its debt service obligations, to fund planned capital expenditures and required pension payments, and to make acquisitions will depend upon its future operating performance, which will be affected by prevailing economic conditions in the markets in which it operates, as well as financial, business and other factors, some of which are beyond its control. In addition, HNH's senior secured revolving credit facility is subject to certain mandatory prepayment provisions and restrictive and financial covenants. There can be no assurances that H&H Group will continue to have access to its lines of credit if its financial performance does not satisfy the financial covenants set forth in the financing agreements. If H&H Group does not meet certain of its financial covenants, and if it is unable to secure necessary waivers or other amendments from the respective lenders on terms acceptable to management, its ability to access available lines of credit could be limited, its debt obligations could be accelerated by the respective lenders and liquidity could be adversely affected.
HNH's management is utilizing the following strategies to continue to enhance liquidity: (1) continuing to implement improvements, using the HNH Business System, throughout all of HNH's operations to increase sales and operating efficiencies, (2) supporting profitable sales growth both internally and potentially through acquisitions and (3) evaluating from time to time and as appropriate, strategic alternatives with respect to its businesses and/or assets. HNH continues to examine all of its options and strategies, including acquisitions, divestitures and other corporate transactions, to increase cash flow and stockholder value.
Consistent with this philosophy, HNH has commenced a tender offer to purchase up to 10,028,724 shares, or approximately 96.5% of the outstanding shares, of JPS at a price of $10.00 per share in cash to all stockholders other than SPLP, and with respect shares owned by SPLP, in exchange for common stock of HNH. If all shares are tendered, HNH would exchange approximately $60,100 in cash and 863,946 shares of its common stock. On March 4, 2015, HNH announced
that it was extending the expiration of the tender offer from March 9, 2015 to March 23, 2015. The extension of the tender offer is intended to facilitate the discussions between the Company and JPS regarding a potential negotiated transaction. There is no assurance that HNH and JPS will enter into a definitive agreement.
In addition, HNH entered into an agreement in December 2014 to sell Arlon, which operations comprised substantially all of HNH's former Arlon business for $157,000 in cash, subject to a working capital adjustment and certain potential reductions as provided in the purchase agreement. The closing of the sale occurred in January 2015.
DGT
At October 31, 2014, its most recent fiscal period, DGT had approximately
$2,400
in cash and cash equivalents and approximately
$51,000
of investments. DGT's operations currently consist of a real estate business from a rental building retained from the sale of its Medical Systems Group on November 3, 2011. Continuing operations consist of the real estate business, investments, and general and administrative expenses.
46
47
Steel Excel
As of
December 31, 2014
, Steel Excel's working capital was
$197,294
. Steel Excel's principal source of liquidity is cash, cash equivalents and marketable securities on hand.
At
December 31, 2014
, Steel Excel had
$190,367
in cash and marketable securities. The marketable securities included short-term deposits, corporate debt and equity instruments, United States government securities, and securities of government agencies. In the future, Steel Excel may make additional acquisitions of businesses, and may use a significant portion of its available cash balances for such acquisitions or for working capital needs thereafter.
Steel Excel's credit agreement, entered into in July 2013 and amended in December 2013 (the “Amended Credit Agreement”), with Wells Fargo Bank National Association, RBS Citizens, N.A., and Comerica Bank provided for a borrowing capacity of $105,000 consisting of a $95,000 secured term loan (the “Term Loan”) and up to $10,000 in revolving loans (the “Revolving Loans”) subject to a borrowing base of 85% of the eligible accounts receivable. At December 31, 2014, the Company had $10,000 of borrowing capacity under the Revolving Loans, all of which was available as no Revolving Loans were outstanding. As of December 31, 2104 Steel Excel had $79,300 outstanding under the Term Loan.
Borrowings under the Amended Credit Agreement are collateralized by substantially all the assets of Steel Energy Services Ltd. ("Steel Energy") and its wholly-owned subsidiaries Sun Well Service, Inc. (“Sun Well”), Rogue Pressure Services, LLC (“Rogue”), and Black Hawk Energy Services Ltd. (Black Hawk Ltd.), and a pledge of all of the issued and outstanding shares of capital stock of Sun Well, Rogue, and Black Hawk Ltd. Borrowings under the Amended Credit Agreement are fully guaranteed by Sun Well, Rogue, and Black Hawk Ltd.
The Amended Energy Credit Agreement runs through July 2018, with the Term Loan amortizing in quarterly installments of $3,300 and a balloon payment due on the maturity date. Borrowings under the Amended Credit Agreement bear interest at annual rates of either (i) the Base Rate plus an applicable margin of 1.50% to 2.25% or (ii) LIBOR plus an applicable margin of 2.50% to 3.25%. The “Base Rate” is the greatest of (i) the prime lending rate, (ii) the Federal Funds Rate plus 0.5%, and (iii) the one-month LIBOR plus 1.0%. The applicable margin for both Base Rate and LIBOR is determined based on the leverage ratio calculated in accordance with the Amended Credit Agreement. LIBOR-based borrowings are available for interest periods of one, three, or six months. In addition, Steel Excel is required to pay commitment fees of between 0.375% and 0.50% per annum on the daily unused amount of the Revolving Loans.
The Amended Credit Agreement contains certain financial covenants, including (i) a leverage ratio not to exceed 3.00:1
for quarterly periods through June 15, 2015, 2.75:1 for quarterly periods through June 30, 2017, and 2.5:1 thereafter and (ii) a
fixed charge coverage ratio of 1.15:1 for quarterly periods through December 31, 2016, and 1.25:1 thereafter. Steel Excel was in compliance with all financial covenants as of December 31, 2014.
The Amended Credit Agreement also contains standard representations, warranties, and non-financial covenants. The
repayment of the Term Loan can be accelerated upon (i) a change in control, which would include Steel Energy Services
owning less than 100% of the equity of Sun Well or Rogue or SPLP owning, directly or indirectly, less than 35% of Steel Energy Services or (ii) other events of default, including payment failure, false representations, covenant breaches, and bankruptcy.
Steel Excel believes that its cash balances will be sufficient to satisfy its anticipated cash needs for working capital and capital expenditures for at least the next twelve months. Steel Excel anticipates making additional acquisitions and investments, and it may be required to use a significant portion of its available cash balances for such acquisitions and investments or for working capital needs thereafter. The consummation of additional acquisitions, prevailing economic conditions, and financial, business and other factors beyond its control could adversely affect Steel Excel's estimates of its future cash requirements. As such, Steel Excel could be required to fund our cash requirements by alternative financing. In these instances, Steel Excel may seek to raise such additional funds through public or private equity or debt financings or from other sources. As a result, Steel Excel may not be able to obtain adequate or favorable equity financing, if needed, due in part to its shares of common stock currently trading on the OTCQB Market. Any equity financing we obtain may dilute existing ownership interests, and any debt financing could contain covenants that impose limitations on the conduct of Steel Excel's business. There can be no assurance that additional financing, if needed, would be available on terms acceptable to Steel Excel or at all.
WebBank
48
WebBank manages its liquidity to provide adequate funds to meet anticipated financial obligations such as certificate of deposit maturities and to fund customer credit needs. WebBank had
$96,829
and
$90,452
in cash at the Federal Reserve Bank and in its Fed Funds account at its correspondent bank at
December 31, 2014
and
2013
, respectively. WebBank had
$17,400
and
$13,400
in lines of credit from its correspondent banks at
December 31, 2014
and
2013
, respectively. WebBank had
$42,011
and
$29,055
available from the Federal Reserve discount window at
December 31, 2014
and
2013
, respectively. WebBank had a total of
$156,240
and
$132,907
in cash, lines of credit, and access to the Federal Reserve Bank discount window at
December 31, 2014
and
2013
, respectively, which represents approximately 69% and 77%, respectively, of WebBank's total assets.
Contractual Commitments and Contingencies
Our consolidated contractual obligations as of
December 31, 2014
are identified in the table below:
|
Payments Due By Period
|
||||||||||||||||||||
|
Less Than 1 Year
|
1 - 3 Years
|
3 - 5 Years
|
Thereafter
|
Total
|
||||||||||||||||
|
Debt obligations
|
$
|
20,194
|
|
$
|
63,264
|
|
$
|
233,018
|
|
$
|
—
|
|
$
|
316,476
|
|
|||||
|
Estimated interest expense
(1)
|
7,907
|
|
14,043
|
|
10,122
|
|
—
|
|
32,072
|
|
||||||||||
|
Deposits
(2)
|
87,804
|
|
77,056
|
|
—
|
|
—
|
|
164,860
|
|
||||||||||
|
Operating lease obligations
|
7,147
|
|
11,027
|
|
7,632
|
|
8,855
|
|
34,661
|
|
||||||||||
|
Capital lease obligations
|
486
|
|
288
|
|
—
|
|
774
|
|
||||||||||||
|
Deferred compensation
|
220
|
|
3,489
|
|
—
|
|
3,709
|
|
||||||||||||
|
Pension and other post-employment benefit plans
|
17,100
|
|
28,700
|
|
35,600
|
|
59,500
|
|
140,900
|
|
||||||||||
|
Total
|
$
|
140,858
|
|
$
|
197,867
|
|
$
|
286,372
|
|
$
|
68,355
|
|
$
|
693,452
|
|
|||||
(1) The interest rates for the estimated interest expense were based on interest rates at December 31, 2014.
(2) Excludes interest.
Environmental Liabilities
Certain of BNS' and HNH's facilities are environmentally impaired. BNS and HNH have estimated their liability to remediate these sites to be
$3,822
and
$4,622
, respectively, at
December 31, 2014
. For further discussion regarding these commitments, among others, see Note 21, “Commitments and Contingencies,” to the SPLP consolidated financial statements included elsewhere in this Form 10-K.
Deposits
Deposits at WebBank at
December 31, 2014
, and
2013
were as follows:
|
2014
|
2013
|
|||||||
|
Current
|
$
|
87,804
|
|
$
|
87,319
|
|
||
|
Long-term
|
77,056
|
|
30,887
|
|
||||
|
Total
|
$
|
164,860
|
|
$
|
118,206
|
|
||
The increase in deposits at
December 31, 2014
compared with
2013
is due to WebBank's strategic decision to increase its excess liquidity in relation to contractual lending programs and anticipated growth. The average original maturity for time deposits at
December 31, 2014
was 30 months compared with 22 months at
December 31, 2013
. The following table details the maturity of time deposits as of
December 31, 2014
:
|
Maturity
|
|||||||||||||||
|
< 3 Months
|
3 to 6 Months
|
6 to 12 Months
|
> 12 Months
|
Total
|
|||||||||||
|
(Dollars in Thousands)
|
|||||||||||||||
|
Certificate of Deposits less than $100
|
$
|
—
|
|
$
|
7,712
|
|
$
|
6,592
|
|
$
|
71,970
|
|
$
|
86,274
|
|
|
Certificate of Deposits of $100 or more
|
—
|
|
4,356
|
|
8,341
|
|
5,087
|
|
17,784
|
|
|||||
|
Total Certificates of Deposits
|
$
|
—
|
|
$
|
12,068
|
|
$
|
14,933
|
|
$
|
77,057
|
|
$
|
104,058
|
|
49
Off-Balance Sheet Risk
It is not the Company's usual business practice to enter into off-balance sheet arrangements such as guarantees on loans and financial commitments, indemnification arrangements, and retained interests in assets transferred to an unconsolidated entity for securitization purposes. Certain customers and suppliers of HNH's Joining Materials business choose to do business on a “pool” basis. Such customers or suppliers furnish precious metal to subsidiaries of H&H for return in fabricated form or for purchase from or return to the supplier. When the customer's precious metal is returned in fabricated form, the customer is charged a fabrication charge. The value of pooled precious metal is not included in HNH's balance sheet. As of
December 31, 2014
, customer metal in H&H's custody consisted of
191,217
ounces of silver,
518
ounces of gold, and
1,392
ounces of palladium. The market value per ounce of silver, gold and palladium as of December 31, 2014 was $15.75, $1,199.25, and $798.00, respectively.
SPLP uses the same credit policy in making commitments and conditional obligations as it does for on-balance sheet instruments.
WebBank is a party to financial instruments with off-balance sheet risk. In the normal course of business, these financial instruments include commitments to extend credit in the form of loans as part of WebBank's lending arrangements. Those instruments involve, to varying degrees, elements of credit and interest rate risk in excess of the amount recognized on the consolidated balance sheets. The contract amounts of those instruments reflect the extent of involvement WebBank has in particular classes of financial instruments.
WebBank's exposure to credit loss in the event of nonperformance by the other party to the financial instrument for commitments to extend credit is represented by the contractual amount of those instruments.
At
December 31, 2014
and
2013
, WebBank's undisbursed commitments under these instruments totaled
$82,788
and
$28,011
, respectively. Commitments to extend credit are agreements to lend to a borrower who meets the lending criteria through one of the WebBank's lending agreements, provided there is no violation of any condition established in the contract with the counterparty to the lending arrangement. Commitments generally have fixed expiration dates or other termination clauses and may require payment of a fee. Since certain of the commitments are expected to expire without the credit being extended, the total commitment amounts do not necessarily represent future cash requirements. WebBank evaluates each prospective borrower's credit worthiness on a case-by-case basis. The amount of collateral obtained if deemed necessary by WebBank upon extension of credit is based on management's credit evaluation of the borrower and WebBank's counterparty.
Critical Accounting Policies
A summary of our accounting policies is set forth in Note 2 - "Summary of Significant Accounting Policies" to the SPLP consolidated financial statements found elsewhere in this Form 10-K. In our view, the policies that involve the most subjective judgment or that have the potential to materially affect our financial statements are set forth below.
Investments
For the Diversified Industrial, Energy, Financial Services and other operations, we evaluate our investments as consolidated subsidiaries, associated companies, available-for-sale or held-to-maturity. Held-to-maturity securities are those debt securities that the Company has the ability and intent to hold until maturity. Associated companies are companies where our ownership is between 20% and 50% of the outstanding equity and have the ability to exercise influence, but not control, over the investee. All other securities not included in held-to-maturity or associated companies are classified as available-for-sale.
Held-to-maturity securities are recorded at amortized cost, adjusted for the amortization or accretion of premiums or discounts. Available-for-sale securities are recorded at fair value. Unrealized holding gains or losses on the majority of available-for-sale securities are excluded from earnings and reported, until realized, in accumulated other comprehensive income (loss) as a separate component of SPLP partners' capital. Associated companies and other investments - related party are accounted for using the equity method of accounting. In applying the equity method for investments where the fair value option has not been elected, SPLP records the initial investment at cost and subsequently increases or decreases the investment by its proportionate share of the net income or loss of the investee. Dividends received from investees are recorded as reductions in the carrying value of the investment. For equity method investments which the Company has elected to measure at fair value, unrealized gains and losses are reported in the consolidated statement of operations as part of Income from equity method investments and include (Loss) Income of associated companies, net of taxes and Income (Loss) from other investments - related party.
50
Impairment of Investments
We evaluate our investments for impairment on a quarterly basis and disclose when appropriate if the potential for impairment exists. Our determination of whether a security is other than temporarily impaired incorporates both quantitative and qualitative information; U.S. GAAP requires the exercise of judgment in making this assessment, rather than the application of fixed mathematical criteria. We consider a number of factors including, but not limited to, the length of time and the extent to which the fair value has been less than cost, the financial condition and near-term prospects of the issuer, the reason for the decline in fair value, changes in fair value subsequent to the balance sheet date, the ability and intent to hold investments to maturity, and other factors specific to the individual investment. Our assessment involves a high degree of judgment and accordingly, actual results may differ materially from those estimates and judgments.
Changes in the local and national economy, the federal and state legislative and regulatory environments for financial institutions, the stock market, interest rates and other external factors (such as natural disasters or significant world events) may occur from time to time, often with great unpredictability. Such factors may materially impact the fair value of our assets and liabilities. Based on their respective balances as of
December 31, 2014
, we estimate that in the event of a 10% adverse change in the fair values of our marketable securities and long-term investments, the fair values would decrease by approximately
$13,800
and
$31,000
, respectively.
Impairment Testing
We review all of our long-lived assets, including goodwill and other intangible assets, for impairment indicators throughout the year and we perform impairment testing for goodwill and indefinite-lived assets annually and for all other long-lived assets whenever impairment indicators are present. If necessary, we record impairments of long-lived assets for the amount by which the fair value is less than the carrying value of these assets.
Goodwill
SPLP performs its annual impairment test in the fourth quarter of its fiscal year, and would perform testing for impairment between annual tests if an event occurs or circumstances change that would more likely than not reduce the fair value of a reporting unit below its carrying amount.
Under ASC 350, an entity can choose between two testing approaches.
|
a.
|
Step 0 or Qualitative approach - An entity may assess qualitative factors to determine whether it is more likely than not (that is, a likelihood of more than 50 percent) that the fair value of a reporting unit is less than its carrying amount, including goodwill. In evaluating whether it is more likely than not that the fair value of a reporting unit is less than its carrying amount, an entity shall assess relevant events and circumstances. Examples of such events and circumstances would include pertinent macroeconomic conditions, industry and market considerations, overall financial performance and other factors.
|
An entity has an unconditional option to bypass this qualitative assessment for any reporting unit in any period and proceed directly to performing the first step of the goodwill impairment test. An entity may resume performing the qualitative assessment in any subsequent period.
|
b.
|
Step 1 or Quantitative approach - The fair value of a reporting unit is calculated and compared with its carrying amount. If the fair value of a reporting unit exceeds its carrying amount, there is no indication of impairment and further testing is not required. If the carrying amount of a reporting unit exceeds its fair value, then a second step of testing is required (“Step 2”). The second step of the goodwill impairment test compares the implied fair value of the reporting unit’s goodwill with the carrying amount of that goodwill.
|
The testing of goodwill for impairment is performed at a level referred to as a reporting unit. Goodwill is allocated to each reporting unit based on the goodwill valued in connection with each business combination consummated within each reporting unit. Four reporting units of the Company, have goodwill assigned to them.
In evaluating whether it is more likely than not that the fair value of a reporting unit is less than its carrying amount, the Company assesses relevant events and circumstance, including: macroeconomic conditions; industry and market considerations; cost factors; overall financial performance; and other entity-specific events. The Company's current expectations associated with such factors could differ from future results, and the recoverability of goodwill may be impacted if the Company's estimated future operating cash flows are not achieved. The Company also uses judgment in assessing whether
51
assets may have become impaired between annual impairment tests. Circumstances that could trigger an interim impairment test include, but are not limited to: the occurrence of a significant change in circumstances, such as continuing adverse business conditions or legal factors; an adverse action or assessment by a regulator; unanticipated competition; loss of key personnel; the likelihood that a reporting unit or significant portion of a reporting unit will be sold or otherwise disposed; or results of testing for recoverability of a significant asset group within a reporting unit. The Company utilized a qualitative approach to assess its goodwill at three of its reporting units and used the two-step quantitative test for one of its reporting units as of its most recent assessment date.
During
2014
, the adverse effect on the Energy business of declining oil prices resulted in a goodwill impairment charge of
$41,450
recorded by our Energy segment. We estimated the fair value of our Energy segment based on valuations, which relied on certain assumptions we made including projections of future revenues based on assumed long-term growth rates, estimated costs, and the appropriate discount rates. The estimates we used for long-term revenue growth and future costs are based on historical data, various internal estimates, and a variety of external sources, and were developed as part our long-range assessment of our Energy business given the recent developments in the oil services industry. After the impairment charge, the carrying value of the goodwill in the Energy segment was
$19,571
at December 31, 2014. A change in assumptions, including lower long-term growth rates, higher operating costs, or higher discount rates could cause a change in the estimated fair value of the Energy segment, and therefore could result in an additional impairment of goodwill, which would have an adverse effect on our results of operations.
In
2013
we recorded a goodwill impairment of approximately $3,600 in discontinued operations and in 2012 we recorded a goodwill impairment of $192. Both impairments were recorded by the Energy segment. There were no impairments of intangible assets in 2013 or 2012.
Other Long-Lived Asset Impairment testing
Intangible assets with finite lives are amortized over their estimated useful lives. The Company also estimates the depreciable lives of property, plant and equipment, and reviews long-lived assets for impairment whenever events, or changes in circumstances, indicate the carrying amount of such assets may not be recoverable. If the carrying values of the long-lived assets exceed the sum of the undiscounted cash flows, an impairment charge is recognized in the amount by which the carrying values exceeds their fair values.
The Company performs such assessments at the lowest level for which identifiable cash flows are largely independent of the cash flows of other assets and liabilities, which is generally at the plant level or the reporting unit level, dependent on the level of interdependencies in the Company's operations. Impairment losses are recorded on long-lived assets when indicators of impairment are present and the undiscounted cash flows estimated to be generated by those assets are less than the assets' carrying amounts. The impairment loss is measured by comparing the fair value of the asset to its carrying amount. The Company considers various factors in determining whether an impairment test is necessary, including among other things: a significant or prolonged deterioration in operating results and projected cash flows; significant changes in the extent or manner in which assets are used; technological advances with respect to assets which would potentially render them obsolete; the Company's strategy and capital planning; and the economic climate in the markets it serves. When estimating future cash flows and if necessary, fair value, the Company makes judgments as to the expected utilization of assets and estimated future cash flows related to those assets. The Company considers historical and anticipated future results, general economic and market conditions, the impact of planned business and operational strategies and other information available at the time the estimates are made. The Company believes these estimates are reasonable; however, changes in circumstances or conditions could have a significant impact on its estimates, which might result in material impairment charges in the future.
In 2014, the adverse effect on the Energy business of declining oil prices resulted in the need for the Company to assess the recoverability of certain of its finite-lived intangible assets and property and equipment in its Energy segment. The undiscounted cash flows expected to be generated by such assets exceeded their carrying value, and therefore the Company has not recognized any impairment charges on its long-lived assets in its Energy segment. A change in the business climate in the Company's Energy segment in future periods, including an inability to effectively integrate new businesses in which significant investments have been made or a general downturn in the Company’s Energy segment could lead to a required assessment of the recoverability of the long-lived assets in its Energy segment, which may subsequently result in an impairment charge.
Long-lived assets consisting of land and buildings used in previously operating businesses are carried at the lower of cost or fair value and are included primarily in other non-current assets on the consolidated balance sheet. A reduction in the carrying value of such long-lived assets used in previously operating businesses is recorded as an asset impairment charge in the consolidated statement of operations.
52
Business Combinations
When we acquire a business, we allocate the purchase price to the assets acquired, liabilities assumed and any noncontrolling interests based on their fair values at the acquisition date. Significant judgment may be used to determine these fair values including the use of appraisals, discounted cash flow models, market value for similar purchases, or other methods applicable to the circumstances. The excess of any purchase price we pay over the fair value of the net assets acquired is recorded as Goodwill. If the fair value of the net assets exceeds the purchase price the excess is treated as a bargain purchase and recognized in income. Transaction costs are expensed as incurred.
Subsequent to the finalization of the purchase price allocation, any adjustments to the recorded values of acquired assets and liabilities would be reflected in the Company's consolidated statement of operations. Once final, the Company is not permitted to revise the allocation of the original purchase price, even if subsequent events or circumstances prove the Company's original judgments and estimates to be incorrect.
In addition, long-lived assets recorded in a business combination such as property and equipment, intangible assets and goodwill may be deemed to be impaired in the future resulting in the recognition of an impairment loss. The assumptions and judgments made by the Company when recording business combinations will have an impact on reported results of operations in the future.
Fair Value Measurements
Fair value is defined as the price that would be received to sell an asset or paid to transfer a liability (i.e. the "exit price") in an orderly transaction between market participants at the measurement date. Fair value measurements are classified into three levels based on the reliability of inputs as follows:
Level 1 inputs are quoted prices in active markets for identical assets or liabilities that the Company has the ability to access at the measurement date. An active market for the asset or liability is a market in which transactions for the asset or liability occur with sufficient frequency and volume to provide pricing information on an ongoing basis. The valuation under this approach does not entail a significant degree of judgment (“Level 1”).
Level 2 inputs are inputs other than quoted prices included within Level 1 that are observable for the asset or liability, either directly or indirectly. Level 2 inputs include: quoted prices for similar assets or liabilities in active markets, quoted prices for identical assets or liabilities in markets that are not active, inputs other than quoted prices that are observable for the asset or liability (e.g. interest rates and yield curves observable at commonly quoted intervals or current market) and contractual prices for the underlying financial instrument, as well as other relevant economic measures ("Level 2").
Level 3 inputs are unobservable inputs for the asset or liability. Unobservable inputs are used to measure fair value to
the extent that observable inputs are not available, thereby allowing for situations in which there is little, if any, market activity
for the asset or liability at the measurement date ("Level 3").
In certain cases, the inputs used to measure fair value may fall into different levels of the fair value hierarchy. In such cases, an investment’s level within the fair value hierarchy is based on the lowest level of input that is significant to the fair value measurement. The assessment of the significance of a particular input to the fair value measurement in its entirety requires judgment and considers factors specific to the investment. Significant transfers, if any, between the levels within the fair value hierarchy are recognized at the beginning of the reporting period.
Legal, Environmental and Other Contingencies
The outcomes of legal proceedings and claims brought against us are subject to significant uncertainty. An estimated loss from a loss contingency such as a legal proceeding or environmental remediation obligation or claim is accrued by a charge to income if it is probable that an asset has been impaired or a liability has been incurred and the amount of the loss can be reasonably estimated. Disclosure of a contingency is required if there is at least a reasonable possibility that a loss has been incurred. In determining whether a loss should be accrued we evaluate, among other factors, the degree of probability of an unfavorable outcome and the ability to make a reasonable estimate of the amount of loss. Changes in these factors could materially impact our financial statements.
53
Income Taxes
As a limited partnership, we are generally not responsible for federal and state income taxes and our profits and losses are passed directly to our limited partners for inclusion in their respective income tax returns. Our subsidiaries that are corporate subsidiaries are subject to federal and state income taxes. The table in Note 19 - “Income Taxes” to the SPLP consolidated financial statements, found elsewhere in this Form 10-K, reconciles a hypothetical calculation of federal income taxes based on the federal statutory rate of 35% applied to the (loss) or income from continuing operations before income taxes and associated companies. The tax effect of income passed through to common unitholders is subtracted from the hypothetical calculation.
Our subsidiaries that are subject to income taxes use the liability method of accounting for such taxes. Under the liability method, deferred tax assets and deferred tax liabilities are recognized for the future tax consequences attributable to differences between the financial statement carrying amounts of existing assets and liabilities and their respective tax bases and operating loss and tax credit carryforwards. Deferred tax assets and deferred tax liabilities are measured using enacted tax rates expected to apply to taxable income in the years in which those temporary differences are expected to be recovered or settled. The effect on deferred tax assets and deferred tax liabilities of a change in tax rates is recognized in income in the period that includes the enactment date. Our subsidiaries and associated companies evaluate the recoverability of deferred tax assets and establish a valuation allowance when it is more likely than not that some portion of the deferred tax assets will not be realized.
When tax returns are filed, it is highly certain that most positions taken would be sustained upon examination by the taxing authorities, while others are subject to uncertainty about the merits of the position taken or the amount of the position that would be ultimately sustained. The benefit of a tax position is recognized in the financial statements in the period during which, based on all available evidence, management believes it is more likely than not that the position will be sustained upon examination, including the resolution of appeals or litigation processes, if any. Tax positions taken are not offset or aggregated with other positions. Tax positions that meet the more-likely-than-not recognition threshold are measured as the largest amount of tax benefit that is more than 50% likely of being realized upon settlement with the applicable taxing authority. The portion of the benefits associated with tax positions taken that exceeds the amount measured as described above is reflected as a liability for unrecognized tax benefits in the accompanying balance sheet, along with any associated interest and penalties that would be payable to the taxing authorities upon examination.
Recent Accounting Standards
See Note 2 - “Summary of Significant Accounting Policies" to the SPLP consolidated financial statements found elsewhere in this Form 10-K for information on recent accounting standards.
54
In this “Quantitative and Qualitative Disclosure About Market Risk” section, all dollar amounts are in thousands, except for per share amounts.
Market risk is the risk of loss arising from adverse changes in market rates and prices, such as interest rates, foreign currency exchange rates and commodity prices. Our significant market risks are primarily associated with interest rates, equity prices and, to a lesser extent, derivatives. The following sections address the significant market risks associated with our business activities.
SPLP's quantitative and qualitative disclosures about market risk include forward-looking statements with respect to management's opinion about the risk associated with the Company's financial instruments. These statements are based on certain assumptions with respect to market prices, interest rates and other industry-specific risk factors. To the extent these assumptions prove to be inaccurate, future outcomes may differ materially from those discussed herein.
Risks Relating to Investments
The Company's investments are primarily classified as marketable securities or long-term investments and are primarily recorded on the balance sheet at fair value. These investments are subject to equity price risk. The Company evaluates its investments for impairment on a quarterly basis.
At December 31, 2014, marketable securities aggregated approximately $138,457, of which $108,800 represented mutual funds and corporate equities that are reported at fair value. A change in the equity price of these securities would result in a change in value of such securities in future periods.
Included in the Company's Long-term investments are available-for-sale equity securities and certain associated company investments which are both subject to equity price risk.
|
•
|
The available-for-sale securities are recorded in the balance sheet at an aggregate fair value of
$131,094
(see Note 5 - "Investments" to the SPLP consolidated financial statements found elsewhere in this Form 10-K). A change in the equity price of these securities would result in a change in value of such securities in future periods.
|
|
•
|
The Company's associated company investments include its investments in ModusLink, SLI, JPS and API Tech, for which it has elected the fair value option. At
December 31, 2014
, these investments are carried at a total fair value of
$155,646
(see Note 5 - "Investments" to the SPLP consolidated financial statements found elsewhere in this Form 10-K). A change in the equity price of our investment in these securities would result in a change in value of such securities and would impact our results in future periods.
|
Risks Relating to Interest Rates
WebBank
The Company through its WebBank subsidiary derives a portion of its income from the excess of interest collected over interest paid. The rates of interest WebBank earns on assets and pays on liabilities generally are established contractually for a period of time. Market interest rates change over time. Accordingly, WebBank’s results of operations, like those of most financial institutions, are impacted by changes in interest rates and the interest rate sensitivity of its assets and liabilities. The risk associated with changes in interest rates and the ability to adapt to these changes is known as interest rate risk.
WebBank monitors and measures its exposure to changes in interest rates in order to comply with applicable government regulations and risk policies established by WebBank’s Board of Directors, and in order to preserve shareholder value. In monitoring interest rate risk, WebBank analyzes assets and liabilities based on characteristics including size, coupon rate, repricing frequency, maturity date, and likelihood of prepayment.
If WebBank’s assets mature or reprice more rapidly or to a greater extent than its liabilities, then net portfolio value and net interest income would tend to increase during periods of rising rates and decrease during periods of falling interest rates. Conversely, if WebBank’s assets mature or reprice more slowly or to a lesser extent than its liabilities, then net portfolio value and net interest income would tend to decrease during periods of rising interest rates and increase during periods of falling interest rates.
55
WebBank currently focuses lending efforts toward originating competitively priced adjustable-rate or fixed-rate loan products with short to intermediate terms to maturity, generally 7 years or less. This theoretically allows WebBank to maintain a portfolio of loans that will have relatively little sensitivity to changes in the level of interest rates, while providing a reasonable spread to the cost of liabilities used to fund the loans.
The principal objective of WebBank’s asset/liability management is to manage the sensitivity of Market Value of Equity (MVE) to changing interest rates. Asset/liability management is governed by policies reviewed and approved annually by WebBank’s Board of Directors. WebBank’s Board of Directors has delegated the responsibility to oversee the administration of these policies to WebBank’s asset/liability committee, or ALCO. The interest rate risk strategy currently deployed by ALCO is to primarily use “natural” balance sheet hedging (as opposed to derivative hedging). ALCO fine tunes the overall MVE sensitivity by recommending lending and deposit strategies. WebBank then executes the recommended strategy by increasing or decreasing the duration of the loan and deposit products, resulting in the appropriate level of market risk WebBank’s Board of Directors wants to maintain.
WebBank measures interest rate sensitivity as the difference between amounts of interest earning assets and interest-bearing liabilities that mature or reprice within a given period of time. The difference provides an indication of the extent to which an institution’s interest rate spread will be affected by changes in interest rates. If the amount of interest rate sensitive assets exceeds the amount of interest rate sensitive liabilities, then the bank is considered to be asset sensitive. If the amount of interest rate sensitive liabilities exceeds the amount of interest rate sensitive assets, then the bank is considered to be liability sensitive. In a rising interest rate environment, an institution that is asset sensitive would be in a better position than an institution that is liability sensitive because the yield on its assets would increase at a faster pace than the cost of its interest bearing liabilities. During a period of falling interest rates, however, an institution that is asset sensitive would tend to have its assets reprice at a faster rate than its liabilities, which would tend to reduce the growth in its net interest income. The opposite is true if the institution is liability sensitive.
WebBank’s Board of Directors and relevant government regulations establish limits on the level of acceptable interest rate risk at WebBank, to which management adheres. There can be no assurance, however, that, in the event of an adverse change in interest rates, WebBank’s efforts to limit interest rate risk will be successful.
HNH
At HNH, the fair value of cash and cash equivalents, trade and other receivables, trade payables and short-term borrowings approximate their carrying values and are relatively insensitive to changes in interest rates due to the short-term maturities of these instruments or the variable nature of the associated interest rates.
At
December 31, 2014
, HNH's portfolio of long-term debt was comprised primarily of variable rate instruments. Accordingly, the fair value of such instruments may be relatively sensitive to effects of interest rate fluctuations. An increase or decrease in interest expense from a 1% change in interest rates would be approximately $2,000 on an annual basis based on HNH's total debt outstanding as of
December 31, 2014
. In addition, the fair value of such instruments is also affected by investors' assessments of the risks associated with industries in which HNH operates, as well as its overall creditworthiness and ability to satisfy such obligations upon their maturity.
To manage their interest rate risk exposure, HNH entered into two interest rate swap agreements to reduce our exposure to interest rate fluctuations. The terms of these agreements are described in Note 14 - "Debt and Capital Lease Obligations" to the SPLP consolidated financial statements found elsewhere in this Form 10-K.
A reduction in long-term interest rates could also materially increase HNH's cash funding obligations to the WHX Pension Plan.
Steel Excel
Steel Excel is exposed to interest rate risk in connection with its borrowings under a credit facility that aggregated $79,300 at December 31, 2014. Interest rates on funds borrowed under the credit facility vary based on changes to the prime rate, LIBOR, or the Federal funds rate. A change in interest rates of 1.0% would result in an annual change in income before taxes of $800 based on the outstanding balance under the credit facility at December 31, 2014.
Steel Excel is also exposed to interest rate risk related to certain of its investments in marketable securities. At December 31, 2014, Steel Excel's marketable securities aggregated $138,457, of which $29,600 represented corporate
56
obligations that pay a fixed rate of interest and are reported at fair value. A change in interest rates would result in a change in the value of such securities in future periods. Although a change in interest rates in future periods will not affect the amount of interest income earned on the specific securities held at December 31, 2014, a change in interest rates of 1.0% would result in an annual change in income before taxes of $300 in future periods if comparable amounts were invested in similar securities.
Risks Relating to Commodity Prices
In the normal course of business, HNH and its subsidiaries are exposed to market risk or price fluctuations related to the purchase of natural gas, electricity, precious metals, steel products and certain non-ferrous metals used as raw materials. HNH is also exposed to the effects of price fluctuations on the value of its commodity inventories, in particular, its precious metal inventory. The raw materials and energy which we use are largely commodities, subject to price volatility caused by changes in global supply and demand and governmental controls.
HNH's market risk strategy has generally been to obtain competitive prices for its products and services, sourced from more than one vendor, and allow operating results to reflect market price movements dictated by supply and demand.
HNH enters into commodity futures and forward contracts to mitigate the impact of price fluctuations on its precious and certain non-precious metal inventories that are not subject to fixed price contracts. The Company's hedging strategy is designed to protect it against normal volatility; therefore, abnormal price changes in these commodities or markets could negatively impact HNH's earnings. Certain of these derivatives are not designated as accounting hedges under Accounting Standards Codification Subtopic 815-10,
Derivatives and Hedging
. As of December 31, 2014, HNH had entered into futures contracts, with settlement dates ranging from February 2015 to March 2015, for silver with a total value of $10,500, for gold with a total value of $2,000, for copper with a total value of $800 and for tin with a total value of $700.
Certain customers and suppliers of HNH choose to do business on a “pool” basis. Such customers or suppliers furnish precious metal to subsidiaries of H&H for return in fabricated form ("customer metal") or for purchase from or return to the supplier. When the customer's precious metal is returned in fabricated form, the customer is charged a fabrication charge. The value of pooled precious metal is not included in the Company's Consolidated Balance Sheets. As of
December 31, 2014
, customer metal in H&H's custody consisted of
191,217
ounces of silver,
518
ounces of gold, and
1,392
ounces of palladium.
To the extent that we have not mitigated our exposure to rising raw material and energy prices, we may not be able to increase our prices to our customers to offset such potential raw material or energy price increases, which could have a material adverse effect on our results of operations and operating cash flows.
Risks Relating to Foreign Currency Exchange
The Company, primarily through its HNH subsidiary, manufactures and sells its products in a number of countries throughout the world and, as a result, is exposed to movements in foreign currency exchange rates. The Company's major foreign currency exposures involve the markets in Asia, Europe, Canada and Mexico. The Company is subject to the risk of price fluctuations related to anticipated revenues and operating costs, firm commitments for capital expenditures and existing assets or liabilities denominated in currencies other than the U.S. dollar. The Company and HNH have not generally used derivative instruments to manage these specific risks. For the year ended
December 31, 2014
the Company recorded a gain from foreign currency financial instruments of $838 and incurred losses $174 and $787 for the years ended December 31,
2013
and
2012
, respectively.
57
INDEX TO CONSOLIDATED FINANCIAL STATEMENTS
|
|
|
|
|
Page
|
|
|
|
|
Report of Independent Registered Public Accounting Firm
|
|
|
Consolidated Financial Statements:
|
|
|
Consolidated Balance Sheets as of December 31, 2014 and 2013
|
|
|
Consolidated Statements of Operations for the years ended December 31, 2014, 2013 and 2012
|
|
|
Consolidated Statements of Comprehensive (Loss) Income for the years ended December 31, 2014, 2013 and 2012
|
|
|
Consolidated Statements of Cash Flows for the years ended December 31, 2014, 2013 and 2012
|
|
|
Consolidated Statements of Changes in Capital for the years ended December 31, 2014, 2013 and 2012
|
|
|
Notes to Consolidated Financial Statements
|
|
58
REPORT OF INDEPENDENT REGISTERED PUBLIC ACCOUNTING FIRM
Board of Directors and Shareholders
Steel Partners Holdings L.P.
New York, New York
We have audited the accompanying consolidated balance sheets of Steel Partners Holdings L.P. and subsidiaries (the "Company") as of December 31, 2014 and 2013 and the related consolidated statements of operations, comprehensive (loss) income, changes in capital and cash flows for the years then ended. These financial statements are the responsibility of the Company’s management. Our responsibility is to express an opinion on these financial statements based on our audits.
We conducted our audits in accordance with the standards of the Public Company Accounting Oversight Board (United States). Those standards require that we plan and perform the audit to obtain reasonable assurance about whether the financial statements are free of material misstatement. An audit includes examining, on a test basis, evidence supporting the amounts and disclosures in the financial statements, assessing the accounting principles used and significant estimates made by management, as well as evaluating the overall financial statement presentation. We believe that our audits provide a reasonable basis for our opinion.
In our opinion, the consolidated financial statements referred to above present fairly, in all material respects, the financial position of Steel Partners Holdings L.P. and subsidiaries at December 31, 2014 and 2013, and the results of their operations and their cash flows for the years then ended in conformity with accounting principles generally accepted in the United States of America.
We also have audited, in accordance with the standards of the Public Company Accounting Oversight Board (United States), Steel Partners Holdings L.P.’s internal control over financial reporting as of December 31, 2014, based on criteria established in
Internal
Control - Integrated Framework (2013)
issued by the Committee of Sponsoring Organizations of the Treadway Commission, and our report dated March 16, 2015 expressed an unqualified opinion thereon.
/s/ BDO USA, LLP
New York, New York
March 16, 2015
59
REPORT OF INDEPENDENT REGISTERED PUBLIC ACCOUNTING FIRM
Board of Directors and Shareholders
Steel Partners Holdings L.P.
New York, New York
We have audited Steel Partners Holdings L.P.'s internal control over financial reporting as of December 31, 2014, based on criteria established in
Internal Control-Integrated Framework (2013)
issued by the Committee of Sponsoring Organizations of the Treadway Commission (the COSO criteria). Steel Partners Holdings L.P.'s management is responsible for maintaining effective internal control over financial reporting and for its assessment of the effectiveness of internal control over financial reporting, included in the accompanying Management’s Report on Internal Control over Financial Reporting appearing under Item 9A. Our responsibility is to express an opinion on the Company’s internal control over financial reporting based on our audit.
We conducted our audit in accordance with the standards of the Public Company Accounting Oversight Board (United States). Those standards require that we plan and perform the audit to obtain reasonable assurance about whether effective internal control over financial reporting was maintained in all material respects. Our audit included obtaining an understanding of internal control over financial reporting, assessing the risk that a material weakness exists, and testing and evaluating the design and operating effectiveness of internal control based on the assessed risk. Our audit also included performing such other procedures as we considered necessary in the circumstances. We believe that our audit provides a reasonable basis for our opinion.
A company’s internal control over financial reporting is a process designed to provide reasonable assurance regarding the reliability of financial reporting and the preparation of financial statements for external purposes in accordance with generally accepted accounting principles. A company’s internal control over financial reporting includes those policies and procedures that (1) pertain to the maintenance of records that, in reasonable detail, accurately and fairly reflect the transactions and dispositions of the assets of the company; (2) provide reasonable assurance that transactions are recorded as necessary to permit preparation of financial statements in accordance with generally accepted accounting principles, and that receipts and expenditures of the company are being made only in accordance with authorizations of management and directors of the company; and (3) provide reasonable assurance regarding prevention or timely detection of unauthorized acquisition, use, or disposition of the company’s assets that could have a material effect on the financial statements.
Because of its inherent limitations, internal control over financial reporting may not prevent or detect misstatements. Also, projections of any evaluation of effectiveness to future periods are subject to the risk that controls may become inadequate because of changes in conditions, or that the degree of compliance with the policies or procedures may deteriorate.
In our opinion, Steel Partners Holdings L.P. maintained, in all material respects, effective internal control over financial reporting as of December 31, 2014, based on the COSO criteria.
We also have audited, in accordance with the standards of the Public Company Accounting Oversight Board (United States), the consolidated balance sheets of Steel Partners Holdings L.P. as of December 31, 2014 and 2013 and the related consolidated statements of operations, comprehensive (loss) income, changes in capital and cash flows for the years then ended, and our report dated March 16, 2015 expressed an unqualified opinion thereon.
/s/ BDO USA, LLP
New York, New York
March 16, 2015
60
REPORT OF INDEPENDENT REGISTERED PUBLIC ACCOUNTING FIRM
Board of Directors and Shareholders
Steel Partners Holdings, L.P.
We have audited the consolidated balance sheet of Steel Partners Holdings, L.P. (a Delaware corporation) and subsidiaries (the “Company”) as of December 31, 2012 (not presented herein), and the related consolidated statements of operations, comprehensive (loss) income, changes in capital, and cash flows for the year then ended. These financial statements are the responsibility of the Company’s management. Our responsibility is to express an opinion on these financial statements based on our audit. We did not audit the financial statements of Steel Excel Inc. and Subsidiaries (from May 31, 2012, date of consolidation through December 31, 2012), WebFinancial Holding Corporation and WF Asset Corp., which statements reflect total assets constituting $563 million of the consolidated total assets as of December 31, 2012 (not presented herein), and total revenues of $93.6 million of the consolidated total revenues for the year then ended. Those statements were audited by other auditors, whose reports have been furnished to us, and our opinion, insofar as it relates to the amounts included for Steel Excel Inc. and Subsidiaries, WebFinancial Holding Corporation and WF Asset Corp., is based solely on the reports of the other auditors.
We conducted our audit in accordance with the standards of the Public Company Accounting Oversight Board (United States). Those standards require that we plan and perform the audit to obtain reasonable assurance about whether the financial statements are free of material misstatement. The Company is not required to have, nor were we engaged to perform an audit of its internal control over financial reporting. Our audit included consideration of internal control over financial reporting as a basis for designing audit procedures that are appropriate in the circumstances, but not for the purpose of expressing an opinion on the effectiveness of the Company’s internal control over financial reporting. Accordingly, we express no such opinion. An audit also includes examining, on a test basis, evidence supporting the amounts and disclosures in the financial statements, assessing the accounting principles used and significant estimates made by management, as well as evaluating the overall financial statement presentation. We believe that our audit provides a reasonable basis for our opinion.
In our opinion, based on our audit and the reports of the other auditors, the consolidated financial statements referred to above present fairly, in all material respects, the financial position of Steel Partners Holdings, L.P. and subsidiaries as of December 31, 2012, and the results of their operations and their cash flows for the year then ended in conformity with accounting principles generally accepted in the United States of America.
/s/ GRANT THORNTON LLP
New York, New York
March 21, 2013 (except Note 4, as to which the date is March 16, 2015)
61
REPORT OF INDEPENDENT REGISTERED PUBLIC ACCOUNTING FIRM
Board of Directors and Stockholders
Steel Excel, Inc.
San Ramon, California
We have audited the consolidated balance sheet of Steel Excel Inc. (formerly ADPT Corporation) as of December 31, 2012 and the
related
consolidated statements of operations, comprehensive income (loss), stockholders’ equity and cash flows for the year then ended (not presented herein). These financial statements are the responsibility of the Company’s management. Our responsibility is to express an opinion on these financial statements based on our audit.
We
conducted our audit in accordance with the standards of the Public Company Accounting Oversight Board (United States). Those standards require that we plan and perform the audit to obtain reasonable assurance about whether the financial statements are free of material misstatement. An audit includes examining, on a test basis, evidence supporting the amounts and disclosures in the financial statements, assessing the accounting principles used and significant estimates made by management, as well as evaluating the overall financial statement presentation. We believe that our audit provides a reasonable basis for our opinion.
In
our opinion, the consolidated financial statements referred to above present fairly, in all material respects, the financial position of Steel Excel Inc. at December 31, 2012, and the results of its operations and its cash flows for the year then ended in conformity with accounting principles generally accepted in the United States of America.
/s/ BDO USA, LLP
San Jose, California
March 8, 2013
62

REPORT OF INDEPENDENT REGISTERED PUBLIC ACCOUNTING FIRM
To the Board of Directors and Stockholders
WebFinancial Holding Corporation and subsidiaries
We have audited the accompanying consolidated balance sheet of WebFinancial Holding Corporation and subsidiaries as of December 31, 2012 (not presented herein) and the related consolidated statements of operations, equity and cash flows for the year then ended. WebFinancial Holding Corporation’s management is responsible for these financial statements. Our responsibility is to express an opinion on these financial statements based on our audit.
We conducted our audit in accordance with the standards of the Public Company Accounting Oversight Board (United States). Those standards require that we plan and perform the audit to obtain reasonable assurance about whether the financial statements are free of material misstatement. The company is not required to have, nor were we engaged to perform, an audit of its internal control over financial reporting. Our audit included consideration of internal control over financial reporting as a basis for designing audit procedures that are appropriate in the circumstances, but not for the purpose of expressing an opinion on the effectiveness of the company’s internal control over financial reporting. Accordingly, we express no such opinion. An audit also includes examining, on a test basis, evidence supporting the amounts and disclosures in the financial statements, assessing the accounting principles used and significant estimates made by management, as well as evaluating the overall financial statement presentation. We believe that our audit provides a reasonable basis for our opinion.
In our opinion, the financial statements referred to above present fairly, in all material respects, the financial position of WebFinancial Holding Corporation as of December 31, 2012 and the results of its operations and its cash flows for the year then ended in conformity with accounting principles generally accepted in the United States of America.
/s/HANSEN, BARNETT & MAXWELL P.C.
Salt Lake City, Utah
February 21, 2013

63
REPORT OF INDEPENDENT REGISTERED PUBLIC ACCOUNTING FIRM
To the Board of Directors and Stockholders
WF Asset Corp
We have audited the accompanying consolidated balance sheet of WF Asset Corp as of December 31, 2012 (not presented herein) and the related consolidated statements of operations, equity and cash flows for the year then ended. WF Asset Corp’s management is responsible for these financial statements. Our responsibility is to express an opinion on these financial statements based on our audit.
We conducted our audit in accordance with the standards of the Public Company Accounting Oversight Board (United States). Those standards require that we plan and perform the audit to obtain reasonable assurance about whether the financial statements are free of material misstatement. The company is not required to have, nor were we engaged to perform, an audit of its internal control over financial reporting. Our audit included consideration of internal control over financial reporting as a basis for designing audit procedures that are appropriate in the circumstances, but not for the purpose of expressing an opinion on the effectiveness of the company’s internal control over financial reporting. Accordingly, we express no such opinion. An audit also includes examining, on a test basis, evidence supporting the amounts and disclosures in the financial statements, assessing the accounting principles used and significant estimates made by management, as well as evaluating the overall financial statement presentation. We believe that our audit provides a reasonable basis for our opinion.
In our opinion, the financial statements referred to above present fairly, in all material respects, the financial position of WF Asset Corp as of December 31, 2012 and the results of its operations and its cash flows for the year then ended in conformity with accounting principles generally accepted in the United States of America.
/s/HANSEN, BARNETT & MAXWELL P.C.
Salt Lake City, Utah
February 21, 2013

64
STEEL PARTNERS HOLDINGS L.P.
Consolidated Balance Sheets
(in thousands except common units)
|
December 31, 2014
|
December 31, 2013
|
||||||
|
ASSETS
|
|||||||
|
Current assets:
|
|||||||
|
Cash and cash equivalents
|
$
|
188,983
|
|
$
|
203,980
|
|
|
|
Restricted cash
|
21,311
|
|
26,340
|
|
|||
|
Marketable securities
|
138,457
|
|
178,485
|
|
|||
|
Trade and other receivables (net of allowance for doubtful accounts of $2,149 in 2014 and $1,981 in 2013)
|
87,440
|
|
88,640
|
|
|||
|
Receivable from related parties
|
838
|
|
1,050
|
|
|||
|
Loans receivable, net
|
41,547
|
|
26,360
|
|
|||
|
Inventories, net
|
64,084
|
|
60,059
|
|
|||
|
Deferred tax assets - current
|
30,262
|
|
21,722
|
|
|||
|
Prepaid and other current assets
|
15,082
|
|
17,218
|
|
|||
|
Assets of discontinued operations
|
76,418
|
|
76,295
|
|
|||
|
Total current assets
|
664,422
|
|
700,149
|
|
|||
|
Long-term loans receivable, net
|
76,382
|
|
49,956
|
|
|||
|
Goodwill
|
45,951
|
|
87,362
|
|
|||
|
Other intangible assets, net
|
118,550
|
|
131,121
|
|
|||
|
Deferred tax assets - non-current
|
45,669
|
|
33,096
|
|
|||
|
Other non-current assets
|
45,666
|
|
43,013
|
|
|||
|
Property, plant and equipment, net
|
184,314
|
|
182,108
|
|
|||
|
Long-term investments
|
311,951
|
|
295,440
|
|
|||
|
Total Assets
|
$
|
1,492,905
|
|
$
|
1,522,245
|
|
|
See accompanying Notes to Consolidated Financial Statements
65
STEEL PARTNERS HOLDINGS L.P.
Consolidated Balance Sheets
(in thousands except common units)
(continued)
|
December 31, 2014
|
December 31, 2013
|
||||||
|
LIABILITIES AND CAPITAL
|
|||||||
|
Current liabilities:
|
|||||||
|
Accounts payable
|
$
|
34,686
|
|
$
|
33,804
|
|
|
|
Accrued liabilities
|
41,133
|
|
41,784
|
|
|||
|
Financial instruments
|
21,311
|
|
25,090
|
|
|||
|
Deposits
|
87,804
|
|
87,319
|
|
|||
|
Payable to related parties
|
3,404
|
|
2,572
|
|
|||
|
Short-term debt
|
602
|
|
650
|
|
|||
|
Current portion of long-term debt
|
19,592
|
|
26,033
|
|
|||
|
Deferred tax liabilities - current
|
271
|
|
3,045
|
|
|||
|
Other current liabilities
|
8,250
|
|
4,586
|
|
|||
|
Liabilities of discontinued operations
|
13,201
|
|
12,237
|
|
|||
|
Total current liabilities
|
230,254
|
|
237,120
|
|
|||
|
Long-term deposits
|
77,056
|
|
30,887
|
|
|||
|
Long-term debt
|
296,282
|
|
223,355
|
|
|||
|
Accrued pension liability
|
208,390
|
|
142,540
|
|
|||
|
Deferred tax liabilities - non-current
|
5,301
|
|
3,218
|
|
|||
|
Other liabilities
|
11,516
|
|
12,465
|
|
|||
|
Total Liabilities
|
828,799
|
|
649,585
|
|
|||
|
Commitments and Contingencies
|
—
|
|
—
|
|
|||
|
Capital:
|
|||||||
|
Partners’ capital common units: 27,566,200 and 31,129,065 issued and outstanding (after deducting 8,964,049 and 5,373,241 held in treasury, at cost of $138,363 and $78,977) at December 31, 2014 and December 31, 2013, respectively
|
492,054
|
|
574,998
|
|
|||
|
Accumulated other comprehensive income
|
2,805
|
|
41,584
|
|
|||
|
Total Partners’ Capital
|
494,859
|
|
616,582
|
|
|||
|
Noncontrolling interests in consolidated entities
|
169,247
|
|
256,078
|
|
|||
|
Total Capital
|
664,106
|
|
872,660
|
|
|||
|
Total Liabilities and Capital
|
$
|
1,492,905
|
|
$
|
1,522,245
|
|
|
See accompanying Notes to Consolidated Financial Statements
66
STEEL PARTNERS HOLDINGS L.P.
(in thousands except common units and per common unit data)
|
Year Ended December 31,
|
|||||||||||
|
2014
|
2013
|
2012
|
|||||||||
|
Revenue
|
|
|
|||||||||
|
Diversified industrial net sales
|
$
|
600,468
|
|
$
|
571,164
|
|
$
|
498,713
|
|
||
|
Energy net sales
|
210,148
|
|
120,029
|
|
92,834
|
|
|||||
|
Financial services revenue
|
36,647
|
|
28,185
|
|
21,155
|
|
|||||
|
Investment and other income
|
1,346
|
|
665
|
|
2,347
|
|
|||||
|
Net investment gains
|
921
|
|
1,071
|
|
15,722
|
|
|||||
|
Total revenue
|
849,530
|
|
721,114
|
|
630,771
|
|
|||||
|
Costs and expenses
|
|||||||||||
|
Cost of goods sold
|
587,069
|
|
496,757
|
|
416,826
|
|
|||||
|
Selling, general and administrative expenses
|
189,495
|
|
202,121
|
|
155,522
|
|
|||||
|
Goodwill impairment
|
41,450
|
|
—
|
|
—
|
|
|||||
|
Asset impairment charges
|
2,537
|
|
2,689
|
|
1,602
|
|
|||||
|
Finance interest expense
|
815
|
|
698
|
|
1,176
|
|
|||||
|
Recovery of loan losses
|
(50
|
)
|
(80
|
)
|
(415
|
)
|
|||||
|
Interest expense
|
11,073
|
|
10,454
|
|
14,804
|
|
|||||
|
Realized and unrealized gain on derivatives
|
(1,307
|
)
|
(1,195
|
)
|
(1,352
|
)
|
|||||
|
Deferred fee liability to related party - increase
|
—
|
|
—
|
|
11,448
|
|
|||||
|
Other income, net
|
(6,825
|
)
|
(6,855
|
)
|
(802
|
)
|
|||||
|
Total costs and expenses
|
824,257
|
|
704,589
|
|
598,809
|
|
|||||
|
Income from continuing operations before income taxes
and equity method income (loss) |
25,273
|
|
16,525
|
|
31,962
|
|
|||||
|
Income tax provision
|
24,288
|
|
6,477
|
|
13,068
|
|
|||||
|
Income from equity method investments and investments held at fair value:
|
|||||||||||
|
(Loss) Income of associated companies, net of taxes
|
(3,379
|
)
|
27,786
|
|
14,204
|
|
|||||
|
Income (Loss) from other investments - related party
|
891
|
|
(271
|
)
|
(8,329
|
)
|
|||||
|
(Loss) Income from investments held at fair value
|
(16,069
|
)
|
811
|
|
18,967
|
|
|||||
|
Net (loss) income from continuing operations
|
(17,572
|
)
|
38,374
|
|
43,736
|
|
|||||
|
Discontinued operations:
|
|||||||||||
|
Income (Loss) from discontinued operations, net of taxes
|
10,262
|
|
(227
|
)
|
12,866
|
|
|||||
|
Gain on sale of discontinued operations, net of taxes
|
42
|
|
6,673
|
|
7,163
|
|
|||||
|
Income from discontinued operations
|
10,304
|
|
6,446
|
|
20,029
|
|
|||||
|
Net (loss) income
|
(7,268
|
)
|
44,820
|
|
63,765
|
|
|||||
|
Net loss (income) attributable to noncontrolling interests in consolidated entities:
|
|||||||||||
|
Continuing operations
|
3,882
|
|
(23,227
|
)
|
(13,589
|
)
|
|||||
|
Discontinued operations
|
(4,169
|
)
|
(2,133
|
)
|
(9,158
|
)
|
|||||
|
(287
|
)
|
(25,360
|
)
|
(22,747
|
)
|
||||||
|
Net (loss) income attributable to common unitholders
|
$
|
(7,555
|
)
|
$
|
19,460
|
|
$
|
41,018
|
|
||
|
Net (loss) income per common unit - basic
|
|||||||||||
|
Net (loss) income from continuing operations
|
$
|
(0.48
|
)
|
$
|
0.51
|
|
$
|
1.01
|
|
||
|
Net income from discontinued operations
|
0.21
|
|
0.14
|
|
0.37
|
|
|||||
|
Net (loss) income attributable to common unitholders
|
$
|
(0.27
|
)
|
$
|
0.65
|
|
$
|
1.38
|
|
||
|
Net (loss) income per common unit - diluted
|
|||||||||||
|
Net (loss) income from continuing operations
|
$
|
(0.48
|
)
|
$
|
0.49
|
|
$
|
1.01
|
|
||
|
Net income from discontinued operations
|
0.21
|
|
0.14
|
|
0.37
|
|
|||||
|
Net (loss) income attributable to common unitholders
|
$
|
(0.27
|
)
|
$
|
0.63
|
|
$
|
1.38
|
|
||
|
Weighted average number of common units outstanding - basic
|
28,710,220
|
|
29,912,993
|
|
29,748,746
|
|
|||||
|
Weighted average number of common units outstanding - diluted
|
28,710,220
|
|
30,798,113
|
|
29,774,527
|
|
|||||
See accompanying Notes to Consolidated Financial Statements
67
STEEL PARTNERS HOLDINGS L.P.
Consolidated Statements of Comprehensive (Loss) Income
(in thousands)
|
Year Ended December 31,
|
|||||||||||
|
2014
|
2013
|
2012
|
|||||||||
|
Net (loss) income
|
$
|
(7,268
|
)
|
$
|
44,820
|
|
$
|
63,765
|
|
||
|
Other comprehensive income (loss), net of tax:
|
|||||||||||
|
Unrealized (losses) gains on available for sale securities, net of tax (a)
|
(11,312
|
)
|
44,193
|
|
8,337
|
|
|||||
|
Currency translation adjustments
|
(2,090
|
)
|
(2,812
|
)
|
(477
|
)
|
|||||
|
Change in net pension liability and post-retirement benefit obligations, net of tax (b)
|
(55,412
|
)
|
39,147
|
|
(32,881
|
)
|
|||||
|
Other comprehensive (loss) income
|
(68,814
|
)
|
80,528
|
|
(25,021
|
)
|
|||||
|
Comprehensive (loss) income
|
(76,082
|
)
|
125,348
|
|
38,744
|
|
|||||
|
Comprehensive loss (income) attributable to non-controlling interests
|
29,748
|
|
(46,442
|
)
|
(3,851
|
)
|
|||||
|
Comprehensive (loss) income attributable to common unit holders
|
$
|
(46,334
|
)
|
$
|
78,906
|
|
$
|
34,893
|
|
||
(a) There was
no
tax benefit recorded in 2014. Includes a net tax benefit of
$6,565
and a net tax provision of
$5,826
for the twelve months ended December 31, 2013 and 2012, respectively.
(b) Includes a net tax benefit of
$33,993
, for the twelve months ended December 31, 2014, a net tax provision of
$28,773
for the twelve months ended December 31, 2013 and a net tax benefit of
$16,635
, for the
twelve
months ended
2012
.
See accompanying Notes to Consolidated Financial Statements
68
STEEL PARTNERS HOLDINGS L.P.
(in thousands)
|
Year Ended December 31,
|
|||||||||||
|
2014
|
2013
|
2012
|
|||||||||
|
Cash flows from operating activities:
|
|||||||||||
|
Net (loss) income
|
$
|
(7,268
|
)
|
$
|
44,820
|
|
$
|
63,765
|
|
||
|
Income from discontinued operations
|
(10,304
|
)
|
(6,446
|
)
|
(20,029
|
)
|
|||||
|
Adjustments to reconcile net income to net cash provided by (used in) operating activities:
|
|||||||||||
|
Net investment gains
|
(921
|
)
|
(1,071
|
)
|
(15,722
|
)
|
|||||
|
Recovery of loan losses
|
(50
|
)
|
(80
|
)
|
(415
|
)
|
|||||
|
Loss (Income) of associated companies
|
3,379
|
|
(27,786
|
)
|
(14,204
|
)
|
|||||
|
(Income) Loss from other investments - related party
|
(891
|
)
|
271
|
|
8,329
|
|
|||||
|
Loss (Income) from investments held at fair value
|
16,069
|
|
(811
|
)
|
(18,967
|
)
|
|||||
|
Deferred income taxes
|
12,289
|
|
5,653
|
|
11,439
|
|
|||||
|
Income tax benefit from release of deferred tax valuation allowance
|
(45
|
)
|
(7,236
|
)
|
(5,500
|
)
|
|||||
|
Non-cash (income) loss from derivatives
|
(213
|
)
|
1,051
|
|
(1,379
|
)
|
|||||
|
Accrued interest not paid in cash
|
—
|
|
—
|
|
(125
|
)
|
|||||
|
Depreciation and amortization
|
38,438
|
|
30,990
|
|
24,750
|
|
|||||
|
Loss on extinguishment of debt
|
—
|
|
1,782
|
|
—
|
|
|||||
|
Amortization of debt related costs
|
1,480
|
|
852
|
|
2,551
|
|
|||||
|
Reclassification of net cash settlements on derivative instruments
|
(1,093
|
)
|
(2,346
|
)
|
(193
|
)
|
|||||
|
Stock based compensation
|
8,470
|
|
34,282
|
|
7,452
|
|
|||||
|
Asset impairment charges
|
2,537
|
|
2,689
|
|
1,602
|
|
|||||
|
Goodwill impairment
|
41,450
|
|
—
|
|
—
|
|
|||||
|
Other
|
(301
|
)
|
(2,486
|
)
|
2,199
|
|
|||||
|
Net change in operating assets and liabilities:
|
|||||||||||
|
Receivables
|
(3,268
|
)
|
8,672
|
|
13,190
|
|
|||||
|
Receivables from related parties
|
212
|
|
(797
|
)
|
428
|
|
|||||
|
Inventories
|
(4,697
|
)
|
2,812
|
|
(458
|
)
|
|||||
|
Prepaid and other assets
|
2,109
|
|
(698
|
)
|
1,642
|
|
|||||
|
Accounts payable, accrued and other liabilities
|
(21,172
|
)
|
(25,107
|
)
|
(15,220
|
)
|
|||||
|
Payable to related parties
|
486
|
|
(136
|
)
|
(3,745
|
)
|
|||||
|
Increase in deferred fee liability to related party
|
—
|
|
—
|
|
11,448
|
|
|||||
|
Net (increase) decrease in loans held for sale
|
(17,251
|
)
|
26,379
|
|
(20,142
|
)
|
|||||
|
Net cash provided by operating activities continuing operations
|
59,445
|
|
85,253
|
|
32,696
|
|
|||||
|
Net cash provided by operating activities of discontinued operations
|
18,588
|
|
9,699
|
|
32,802
|
|
|||||
|
Net cash provided by operating activities
|
78,033
|
|
94,952
|
|
65,498
|
|
|||||
|
Cash flows from investing activities:
|
|||||||||||
|
Purchases of investments
|
(111,648
|
)
|
(226,548
|
)
|
(201,587
|
)
|
|||||
|
Proceeds from sales of investments
|
120,235
|
|
104,545
|
|
263,334
|
|
|||||
|
Maturities of marketable securities
|
4,354
|
|
146,491
|
|
—
|
|
|||||
|
Net increase in loans receivable
|
(25,805
|
)
|
(34,619
|
)
|
(3,796
|
)
|
|||||
|
Purchases of property and equipment
|
(28,769
|
)
|
(20,885
|
)
|
(30,569
|
)
|
|||||
|
Reclassification of restricted cash
|
3,780
|
|
(1,554
|
)
|
(1,006
|
)
|
|||||
|
Settlements of financial instruments
|
(24,429
|
)
|
—
|
|
—
|
|
|||||
|
Net cash settlements on derivative instruments
|
1,093
|
|
2,346
|
|
193
|
|
|||||
|
Proceeds from sale of assets
|
2,457
|
|
1,081
|
|
7,731
|
|
|||||
|
Acquisitions, net of cash acquired
|
(517
|
)
|
(130,528
|
)
|
29,941
|
|
|||||
|
Investments in associated companies
|
(1,643
|
)
|
(36,018
|
)
|
(16,628
|
)
|
|||||
|
Proceeds from sales of discontinued operations
|
3,732
|
|
45,334
|
|
33,505
|
|
|||||
|
Net cash used in investing activities of discontinued operations
|
(2,902
|
)
|
(4,584
|
)
|
(5,687
|
)
|
|||||
|
Other
|
(2,996
|
)
|
617
|
|
(666
|
)
|
|||||
|
Net cash (used in) provided by investing activities
|
(63,058
|
)
|
(154,322
|
)
|
74,765
|
|
|||||
See accompanying Notes to Consolidated Financial Statements
69
STEEL PARTNERS HOLDINGS L.P.
Consolidated Statements of Cash Flows (continued)
(in thousands)
|
Year Ended December 31,
|
|||||||||||
|
2014
|
2013
|
2012
|
|||||||||
|
Cash flows from financing activities:
|
|||||||||||
|
Proceeds from term loans
|
52,600
|
|
105,000
|
|
116,838
|
|
|||||
|
Repurchases of Subordinated Notes
|
(346
|
)
|
(11,323
|
)
|
(10,847
|
)
|
|||||
|
Net revolver borrowings
|
196,212
|
|
30,950
|
|
(23,849
|
)
|
|||||
|
Net borrowings of term loans - foreign
|
315
|
|
—
|
|
454
|
|
|||||
|
Repayments of term loans - foreign
|
—
|
|
(424
|
)
|
—
|
|
|||||
|
Repayments of term loans - domestic
|
(182,080
|
)
|
(27,158
|
)
|
(95,833
|
)
|
|||||
|
Return of capital paid to noncontrolling interest holders
|
—
|
|
—
|
|
(10,316
|
)
|
|||||
|
Subsidiary's purchases of the Company's common units
|
(7,921
|
)
|
(15,690
|
)
|
(15,082
|
)
|
|||||
|
Purchases of treasury units
|
(51,465
|
)
|
(106
|
)
|
—
|
|
|||||
|
Subsidiary's purchases of their common stock
|
(78,488
|
)
|
(50,144
|
)
|
(2,776
|
)
|
|||||
|
Purchase of subsidiary shares from non-controlling interests
|
(3,045
|
)
|
(917
|
)
|
(5,452
|
)
|
|||||
|
Deferred finance charges
|
(3,175
|
)
|
(2,139
|
)
|
(2,743
|
)
|
|||||
|
Net change in overdrafts
|
186
|
|
1,761
|
|
(1,365
|
)
|
|||||
|
Net increase (decrease) in deposits
|
46,654
|
|
39,567
|
|
(16,273
|
)
|
|||||
|
Net cash used in financing activities of discontinued operations
|
—
|
|
(3,093
|
)
|
1,093
|
|
|||||
|
Other
|
886
|
|
(834
|
)
|
(3,380
|
)
|
|||||
|
Net cash provided by (used in) financing activities
|
(29,667
|
)
|
65,450
|
|
(69,531
|
)
|
|||||
|
Net change for the period
|
(14,692
|
)
|
6,080
|
|
70,732
|
|
|||||
|
Effect of exchange rate changes on cash and cash equivalents
|
(305
|
)
|
(127
|
)
|
268
|
|
|||||
|
Cash and cash equivalents at beginning of period
|
203,980
|
|
198,027
|
|
127,027
|
|
|||||
|
Cash and cash equivalents at end of period
|
$
|
188,983
|
|
$
|
203,980
|
|
$
|
198,027
|
|
||
|
Cash paid during the period for:
|
|||||||||||
|
Interest
|
$
|
11,471
|
|
$
|
12,103
|
|
$
|
13,185
|
|
||
|
Taxes
|
$
|
12,194
|
|
$
|
16,720
|
|
$
|
6,611
|
|
||
|
Non-cash investing activities:
|
|||||||||||
|
Reclassification of available-for-sale securities to equity method investment
|
$
|
27,647
|
|
$
|
—
|
|
$
|
—
|
|
||
|
Reclassification of investment in associated company to cost of an acquisition
|
$
|
—
|
|
$
|
—
|
|
$
|
137,532
|
|
||
|
Securities received in exchange for financial instrument obligations
|
$
|
20,007
|
|
$
|
—
|
|
$
|
—
|
|
||
|
Securities delivered in exchange for settlement of financial instrument obligations
|
$
|
520
|
|
$
|
—
|
|
$
|
—
|
|
||
|
Net decrease (increase) in restricted cash from purchase of foreign currency financial instruments
|
$
|
25,090
|
|
$
|
(377
|
)
|
$
|
(1,006
|
)
|
||
|
Net transfers between loans and other assets
|
$
|
—
|
|
$
|
119
|
|
$
|
—
|
|
||
|
Non-cash financing activities:
|
|||||||||||
|
Sale of property for mortgage note receivable
|
$
|
—
|
|
$
|
—
|
|
$
|
842
|
|
||
|
Contribution of note payable by non-controlling interest
|
$
|
268
|
|
$
|
—
|
|
$
|
—
|
|
||
|
Subsidiary restricted stock awards returned in connection with net-share settlement upon vesting
|
$
|
120
|
|
$
|
—
|
|
$
|
—
|
|
||
See accompanying Notes to Consolidated Financial Statements
70
STEEL PARTNERS HOLDINGS L.P.
Consolidated Statements of Changes in Capital
(in thousands except common units and treasury units)
|
Steel Partners Holdings L.P. Common Unit Holders
|
|||||||||||||||||||||||||||||
|
Common
|
Treasury Units
|
Partners’
|
Accumulated
Other Comprehensive |
Total Partners'
|
Non-controlling Interests in Consolidated
|
Total
|
|||||||||||||||||||||||
|
Units
|
Units
|
Dollars
|
Capital
|
Income (Loss)
|
Capital
|
Entities
|
Capital
|
||||||||||||||||||||||
|
Balance at December 31, 2011
|
27,991,764
|
|
(2,808,725
|
)
|
$
|
(48,099
|
)
|
$
|
427,534
|
|
$
|
(11,737
|
)
|
$
|
415,797
|
|
$
|
64,623
|
|
$
|
480,420
|
|
|||||||
|
Net income
|
|
|
|
|
|
|
41,018
|
|
41,018
|
|
22,747
|
|
63,765
|
|
|||||||||||||||
|
Unrealized gain on available-for-sale investments
|
|
|
|
|
|
|
|
|
12,170
|
|
12,170
|
|
(3,833
|
)
|
8,337
|
|
|||||||||||||
|
Currency translation adjustment
|
|
|
|
|
|
|
|
|
(214
|
)
|
(214
|
)
|
(263
|
)
|
(477
|
)
|
|||||||||||||
|
Changes in pension liabilities and post-retirement benefit obligations
|
(18,081
|
)
|
(18,081
|
)
|
(14,800
|
)
|
(32,881
|
)
|
|||||||||||||||||||||
|
Deferred fee liability settlement
|
6,939,647
|
|
|
|
|
|
70,195
|
|
70,195
|
|
—
|
|
70,195
|
|
|||||||||||||||
|
Vesting of restricted units
|
9,060
|
|
—
|
|
—
|
|
—
|
|
|||||||||||||||||||||
|
Steel Excel acquisition
|
|
|
|
|
|
|
|
|
—
|
|
189,598
|
|
189,598
|
|
|||||||||||||||
|
Return of capital to noncontrolling interest holders
|
|
|
|
|
|
|
|
|
—
|
|
(10,316
|
)
|
(10,316
|
)
|
|||||||||||||||
|
Excess of fair value received over carrying value of Sun Well in the Steel Excel acquisition
|
|
|
|
|
|
|
22,278
|
|
22,278
|
|
3,959
|
|
26,237
|
|
|||||||||||||||
|
Subsidiary's purchases of the Company's common units
|
|
|
(1,345,646
|
)
|
(15,082
|
)
|
(15,082
|
)
|
(15,082
|
)
|
—
|
|
(15,082
|
)
|
|||||||||||||||
|
Purchases of subsidiary shares, net of issuances
|
|
|
|
|
|
|
(3,223
|
)
|
(3,223
|
)
|
(2,237
|
)
|
(5,460
|
)
|
|||||||||||||||
|
Other, net
|
|
|
|
|
|
|
2,486
|
|
2,486
|
|
(75
|
)
|
2,411
|
|
|||||||||||||||
|
Balance at December 31, 2012
|
34,940,471
|
|
(4,154,371
|
)
|
(63,181
|
)
|
545,206
|
|
(17,862
|
)
|
527,344
|
|
249,403
|
|
776,747
|
|
|||||||||||||
|
Net income
|
19,460
|
|
19,460
|
|
25,360
|
|
44,820
|
|
|||||||||||||||||||||
|
Unrealized gain on available-for-sale investments
|
39,422
|
|
39,422
|
|
4,771
|
|
44,193
|
|
|||||||||||||||||||||
|
Currency translation adjustment
|
(1,504
|
)
|
(1,504
|
)
|
(1,308
|
)
|
(2,812
|
)
|
|||||||||||||||||||||
|
Changes in pension liabilities and post-retirement benefit obligations
|
21,528
|
|
21,528
|
|
17,619
|
|
39,147
|
|
|||||||||||||||||||||
|
Acquisition by subsidiary
|
—
|
|
2,896
|
|
2,896
|
|
|||||||||||||||||||||||
|
Incentive units and vesting of restricted units
|
1,561,835
|
|
26,957
|
|
26,957
|
|
—
|
|
26,957
|
|
|||||||||||||||||||
|
Equity compensation - subsidiaries
|
4,391
|
|
4,391
|
|
3,547
|
|
7,938
|
|
|||||||||||||||||||||
|
Subsidiary's purchases of the Company's common units
|
(1,212,855
|
)
|
(15,690
|
)
|
(15,690
|
)
|
(15,690
|
)
|
—
|
|
(15,690
|
)
|
|||||||||||||||||
|
Purchases of treasury units
|
(6,015
|
)
|
(106
|
)
|
(106
|
)
|
(106
|
)
|
—
|
|
(106
|
)
|
|||||||||||||||||
|
Subsidiary's purchases of their treasury stock
|
(3,553
|
)
|
(3,553
|
)
|
(46,591
|
)
|
(50,144
|
)
|
|||||||||||||||||||||
|
Purchases of subsidiary shares from noncontrolling interests
|
(1,299
|
)
|
(1,299
|
)
|
383
|
|
(916
|
)
|
|||||||||||||||||||||
|
Other, net
|
(368
|
)
|
(368
|
)
|
(2
|
)
|
(370
|
)
|
|||||||||||||||||||||
|
Balance at December 31, 2013
|
36,502,306
|
|
(5,373,241
|
)
|
(78,977
|
)
|
574,998
|
|
41,584
|
|
616,582
|
|
256,078
|
|
872,660
|
|
|||||||||||||
|
Net (loss) income
|
(7,555
|
)
|
(7,555
|
)
|
287
|
|
(7,268
|
)
|
|||||||||||||||||||||
|
Unrealized loss on available-for-sale investments
|
(806
|
)
|
(806
|
)
|
(10,506
|
)
|
(11,312
|
)
|
|||||||||||||||||||||
|
Currency translation adjustment
|
(1,324
|
)
|
(1,324
|
)
|
(766
|
)
|
(2,090
|
)
|
|||||||||||||||||||||
|
Changes in pension liabilities and post-retirement benefit obligations
|
(36,649
|
)
|
(36,649
|
)
|
(18,763
|
)
|
(55,412
|
)
|
|||||||||||||||||||||
|
Vesting of restricted units
|
27,943
|
|
420
|
|
420
|
|
—
|
|
420
|
|
|||||||||||||||||||
|
Equity compensation - subsidiaries
|
4,628
|
|
4,628
|
|
3,134
|
|
7,762
|
|
|||||||||||||||||||||
|
Subsidiary's purchases of the Company's common units
|
(473,054
|
)
|
(7,921
|
)
|
(7,921
|
)
|
(7,921
|
)
|
—
|
|
(7,921
|
)
|
|||||||||||||||||
|
Purchases of treasury units
|
(3,117,754
|
)
|
(51,465
|
)
|
(51,465
|
)
|
(51,465
|
)
|
—
|
|
(51,465
|
)
|
|||||||||||||||||
|
Subsidiary's purchases of their treasury stock
|
(32,682
|
)
|
(32,682
|
)
|
(45,806
|
)
|
(78,488
|
)
|
|||||||||||||||||||||
|
Purchases of subsidiary shares from noncontrolling interests
|
11,643
|
|
11,643
|
|
(14,688
|
)
|
(3,045
|
)
|
|||||||||||||||||||||
|
Other, net
|
(12
|
)
|
(12
|
)
|
277
|
|
265
|
|
|||||||||||||||||||||
|
Balance at December 31, 2014
|
36,530,249
|
|
(8,964,049
|
)
|
$
|
(138,363
|
)
|
$
|
492,054
|
|
$
|
2,805
|
|
$
|
494,859
|
|
$
|
169,247
|
|
$
|
664,106
|
|
|||||||
See accompanying Notes to Consolidated Financial Statements
71
STEEL PARTNERS HOLDINGS L.P.
Notes to Consolidated Financial Statements
(dollars in thousands except per unit data)
1. NATURE OF THE BUSINESS AND BASIS OF PRESENTATION
Nature of the Business
Steel Partners Holdings L.P. ("SPLP" or the "Company") is a global diversified holding company that engages in multiple businesses, including diversified industrial products, energy, defense, supply chain management and logistics, banking, food products and services, sports, training, education, and the entertainment and lifestyle industries.
The Company works with its businesses to increase corporate value for all stakeholders and shareholders by utilizing Steel Partners Operational Excellence programs, the Steel Partners Purchasing Council, Steel Partners Corporate Services, balance sheet improvements, capital allocation policies and growth initiatives. All of the Company's programs are focused on helping SPLP companies strengthen their competitive advantage and increase their profitability, while enabling them to achieve operational excellence and enhanced customer satisfaction.
SPLP operates through the following segments: Diversified Industrial, Energy, Financial Services, and Corporate and Other which are managed separately and offer different products and services. For additional details related to the Company's reportable segments see Note 18 - "Segment Information."
Steel Partners Holdings GP Inc. (“SPH GP”), a Delaware corporation, is the general partner of SPLP and is wholly-owned by SPLP. The Company is managed by SP General Services LLC (the “Manager”), pursuant to the terms of an amended and restated management agreement (the “Management Agreement”) discussed in further detail in Note 13 - "Related party Transactions" and Note 22 - "Subsequent Events".
Basis of Presentation
The consolidated financial statements include the accounts of the Company and its majority or wholly-owned subsidiaries, which include the following:
|
Ownership as of December 31,
|
|||||
|
2014
|
2013
|
||||
|
BNS Holding, Inc. ("BNS") and BNS Liquidating Trust ("BNS Liquidating Trust")
|
84.9
|
%
|
84.9
|
%
|
|
|
DGT Holdings Corp. ("DGT") (a)
|
82.7
|
%
|
76.7
|
%
|
|
|
Handy & Harman Ltd. ("HNH")
|
66.2
|
%
|
54.9
|
%
|
|
|
SPH Services, Inc. ("SPH Services")
|
100.0
|
%
|
100.0
|
%
|
|
|
Steel Excel Inc. ("Steel Excel")
|
57.9
|
%
|
55.1
|
%
|
|
|
WebFinancial Holding Corporation ("WebFinancial")
|
100.0
|
%
|
100.0
|
%
|
|
(a) DGT’s financial statements are recorded on a two-month lag, and as a result the balance sheet and statement of operations as of and for the twelve months ended
December 31, 2014
includes DGT’s activity as of and for its
twelve
months ended October 31, 2014.
Acquired companies are presented from their dates of acquisition (see Note 3 - “Acquisitions”). Significant inter-company accounts and transactions have been eliminated in consolidation. The results of operations for businesses that have been disposed of are eliminated from the results of the Company's continuing operations and classified as discontinued operations for each period presented in the Company's consolidated income statement. Similarly, the assets and liabilities of such businesses are reclassified from continuing operations and presented as discontinued operations for each period presented in the Company's consolidated balance sheet (see note 4 - "Discontinued Operations" for additional information).
Certain prior period amounts in the Consolidated Statements of Operations, Balance Sheets and Statement of Cash Flows have been reclassified to conform to the comparable
2014
presentation.
72
STEEL PARTNERS HOLDINGS L.P.
Notes to Consolidated Financial Statements
(dollars in thousands except per unit data)
2. SUMMARY OF SIGNIFICANT ACCOUNTING POLICIES
The Company's consolidated financial statements are prepared in accordance with accounting principles generally accepted in the United States of America (“U.S. GAAP”).
Use of Estimates in Preparation of Consolidated Financial Statements
The preparation of the consolidated financial statements in conformity with U.S. GAAP requires management to make estimates and assumptions that affect the reported amount of assets and liabilities at the date of the financial statements and the reported amount of revenues, expenses, unrealized gains and losses during the reporting period. The more significant estimates include: (1) the valuation allowances of accounts receivable and inventory; (2) the valuation of goodwill, indefinite-lived intangible assets, long-lived assets and associated companies; (3) deferred tax assets; (4) environmental liabilities; (5) fair value of derivatives; (6) post-employment benefit liabilities; (7) estimates and assumptions used in the determination of fair value of certain securities, such as whether declines in value of securities are other than temporary; and (8) estimates of loan losses. Actual results may differ from the estimates used in preparing the consolidated financial statements; and, due to substantial holdings in and/or restrictions on certain investments, the value that may be realized could differ from the estimated fair value.
Cash and Cash Equivalents
Cash and cash equivalents include cash and deposits in depository institutions, financial institutions and banks. Cash at
December 31, 2014
and
2013
also includes
$368
and
$1,483
, respectively, of WebBank Federal Funds sold. The Company considers all highly liquid debt instruments with maturities of three months or less when purchased to be cash equivalents. Cash and cash equivalents exclude amounts where availability is restricted by loan agreements or other contractual provisions. Cash equivalents are stated at cost, which approximates market. There is a significant concentration of cash that, during the periods presented, exceeded the federal deposit insurance limits and exposed the Company to credit risk. SPLP does not anticipate any losses due to this concentration of cash at
December 31, 2014
.
Restricted Cash
Restricted cash at December 31, 2014 primarily represents cash collateral for certain short sales of corporate securities and at December 31, 2013 primarily represented cash collateral for foreign currency forward positions (see Note 7 - "Financial Instruments" for additional information). Restricted cash is reported separately as a current asset in the consolidated balance sheets at
December 31, 2014
and
2013
.
Trade Accounts Receivable and allowance for Doubtful Accounts
The Company’s subsidiaries extend credit to customers in the normal course of business. Collateral is not generally required for trade accounts receivable. Allowances for accounts that may become uncollectible are made and such amounts are charged to the statement of operations. This estimated allowance is based primarily on management's evaluation of the financial condition of the customer, historical experience, credit quality, whether any amounts are currently past due, the length of time accounts may be past due, previous loss history and management’s determination of a customer’s current ability to pay its obligations. Trade accounts receivable balances are charged off against the allowance when it is determined that the receivable will not be recovered, and payments subsequently received on such receivables are credited to recovery of accounts written off. Interest is generally not charged on past due receivables. The Company believes that the credit risk with respect to trade accounts receivable is limited due to this credit evaluation process, the allowance for doubtful accounts that has been established, and the diversified nature of its customer base. As of
December 31, 2014
, the top
10
of the Company's largest customer balances accounted for
32.2%
of the Company's trade receivables.
Loans Receivable
WebBank’s loan activities include several lending arrangements with companies where it originates private label credit card and other loans for consumers and small businesses. These loans are classified as Loans receivable, net and are typically sold after origination. As part of these arrangements WebBank earns origination fees that are recorded in interest income. Minimum activity fees earned from these lending arrangements are recorded as fee income. WebBank also purchases participations in commercial and industrial loans through loan syndications. Loans that management has the intent and ability to hold for the foreseeable future or until maturity or pay-off generally are reported at their outstanding unpaid principal balances adjusted for charge-offs, the allowance for loan losses, and any deferred fees or costs on originated loans. Interest income is
73
STEEL PARTNERS HOLDINGS L.P.
Notes to Consolidated Financial Statements
(dollars in thousands except per unit data)
accrued on the unpaid principal balance. Loan origination fees, net of certain direct origination costs, are deferred and recognized as an adjustment of the related loan yield over the estimated life of the loan.
Loans receivable, net are carried at the lower of cost or estimated market value in the aggregate. A valuation allowance is recorded when cost exceeds fair value based on our determination at the time of reclassification and periodically thereafter. Gains and losses are recorded in noninterest income based on the difference between sales proceeds and carrying value and impairments from reductions in carrying value.
Loans are reported as past due when either principal or interest is due and unpaid for a period of 30 days or more. The accrual of interest on loans is discontinued at the time the loan is
90
days delinquent unless the loan is well-secured and in process of collection. In all cases, loans are placed on nonaccrual or charged-off at an earlier date if collection of principal or interest is considered doubtful.
All interest accrued but not collected for loans that are placed on nonaccrual or charged off is reversed against interest income. The interest on these loans is accounted for on the cash-basis or cost-recovery method, until qualifying for return to accrual. Loans are returned to accrual status when all the principal and interest amounts contractually due are brought current and future payments are reasonably assured.
Loan Impairment and Allowance for Loan Losses
A loan is considered impaired when, based on current information and events, it is probable that WebBank will be unable to collect all amounts due according to the contractual terms of the loan agreement, including schedules interest payments. When a loan has been identified as being impaired, the amount of impairment is measured based on the present value of expected future cash flows discounted at the loan’s effective interest rate or, when appropriate, the loan’s observable fair value or the fair value of the collateral (less any selling costs) if the loan is collateral-dependent. If the measurement of the impaired loan is less than the recorded investment in the loan (including accrued interest, net of deferred loan fees or costs and unamortized premium or discount), an impairment is recognized by creating or adjusting an existing allocation of the allowance for loan losses, or by charging down the loan to its value determined in accordance with generally accepted accounting principles.
The allowance for loan losses is established as losses are estimated to have occurred through a provision for loan losses charged to earnings. Loan losses are charged against the allowance when the uncollectibility of a loan or receivable balance is confirmed. Subsequent recoveries, if any, are credited to the allowance. The allowance for loan losses is evaluated on a regular basis and is based upon a periodic review of the collectability of the amounts due in light of historical experience, the nature and volume of the loan portfolio, adverse situations that may affect the borrower’s ability to repay, estimated value of any underlying collateral and prevailing economic conditions. This evaluation is inherently subjective as it requires estimates that are susceptible to significant revision as more information becomes available. The allowance consists of specific and general components. The specific component relates to loans that are classified as doubtful, substandard, or loss. For such loans that are classified as impaired, an allowance is established when the discounted cash flows (or collateral value or observable market price) of the impaired loan is lower than the carrying value of that loan. The general component covers non-classified loans and is based on historical loss experience and is adjusted for qualitative factors to cover uncertainties that could affect the estimate of probable losses. The allowance for loan losses is increased by charges to income and decreased by charge-offs (net of recoveries). The periodic evaluation of the adequacy of the allowance is based on WebBank’s past loss experience, known and inherent risks in the portfolio, adverse situations that may affect the debtor’s ability to repay, the estimated value of any underlying collateral and current economic conditions.
Investments
Debt and Equity Securities
SPLP determines the appropriate classifications of its investments in debt and equity securities at the acquisition date and re-evaluates the classifications at each balance sheet date. SPLP classifies its investments as held-to-maturity or available-for-sale. Held-to-maturity investments are carried at amortized cost. All other securities are classified as available-for-sale, which are recorded at estimated fair value with unrealized holding gains or losses excluded from earnings and reported, until realized, in accumulated other comprehensive income (loss) as a separate component of partners' capital.
74
STEEL PARTNERS HOLDINGS L.P.
Notes to Consolidated Financial Statements
(dollars in thousands except per unit data)
Dividend and interest income are recognized when earned. Realized gains and losses on securities are included in earnings and are derived using the specific-identification method. Commission expense is recorded as a reduction of sales proceeds on investment sales. Commission expense on purchases is included in the cost of investments in the consolidated balance sheets.
Other Than Temporary Impairment
If the Company believes a decline in the market value of any available-for-sale or held-to-maturity security below cost is other than temporary, a loss is charged to earnings, which establishes a new cost basis for the security. Impairment losses are included in Asset impairment charges in the consolidated statements of operations. SPLP's determination of whether a security is other than temporarily impaired incorporates both quantitative and qualitative information; U.S. GAAP requires the exercise of judgment in making this assessment, rather than the application of fixed mathematical criteria. The Company considers a number of factors including, but not limited to, the length of time and the extent to which the fair value has been less than cost, the financial condition and near-term prospects of the issuer, the reason for the decline in fair value, changes in fair value subsequent to the balance sheet date, the ability and intent to hold investments to maturity, and other factors specific to the individual investment. SPLP's assessment involves a high degree of judgment and accordingly, actual results may differ materially from those estimates and judgments.
Equity Method Investments
SPLP uses the equity method of accounting for investments where it has the ability to exercise significant influence, but not control, over the operating and financial policies of the investee. Significant influence is generally presumed to exist if the Company has an ownership interest in the voting stock of the investee between
20%
and
50%
, although other factors, such as representation on the investee's board of directors, are considered in determining whether the equity method of accounting is appropriate. For the equity method investments where the fair value option has not been elected, SPLP records the investment at cost and subsequently increases or decreases the investment by its proportionate share of the net income or losses and other comprehensive income of the investee. Dividends received from investees are recorded as reductions in the carrying value of the investment. For equity method investments where the fair value option has been elected, unrealized gains and losses are reported in the consolidated statement of operations as part of income (loss) from equity method investments and includes income (loss) of certain associated companies and income (loss) from other investments - related party. In applying the equity method with respect to investments previously accounted for as available-for-sale, and if the fair value option has not been elected, the carrying value of the investment is adjusted as if the equity method had been applied from the time the investment was first acquired.
Variable Interest Entities
For each Variable Interest Entity (“VIE”) in which it holds a variable interest, the Company initially determines whether it is the primary beneficiary of the VIE by performing a quantitative and qualitative analysis of the Company's obligation to absorb expected losses and its right to receive expected residual benefits of the VIE and evaluating the VIE's capital structure, the contractual terms affecting the management and operation of the VIE, related party relationships of SPLP, and which interests create and absorb variability. The determination of whether the Company is the primary beneficiary of each variable interest entity is reviewed upon the occurrence of certain reconsideration events.
The Company holds variable interests in each series of the SPII Liquidating Trust (see Note 5 - “Investments"). The purpose of the SPII Liquidating Trust is to effect the orderly liquidation of certain assets previously held by SPII. The Company determined that each VIE in which it held a variable interest since January 1, 2010 met the deferral criteria of Accounting Standards Codification ("ASC") 810. Accordingly, these VIEs will continue to be assessed under the overall guidance on the consolidation of VIEs or other applicable guidance.
The Company has determined that it is not the primary beneficiary of any series of the SPII Liquidating Trust because it does not absorb a majority of the expected losses or receive a majority of the expected residual returns based on its equity ownership interests in each of the series. In addition, there are no related parties of SPLP that, when considered together as a group, would cause the Company and its related party group to absorb a majority of expected losses or receive a majority of the expected residual returns. There are also no other contractual arrangements that would cause the Company to absorb a majority of the expected losses or receive a majority the expected residual returns. The Company also does not have a defacto agency relationship with any series of the SPII Liquidating Trust.
75
STEEL PARTNERS HOLDINGS L.P.
Notes to Consolidated Financial Statements
(dollars in thousands except per unit data)
Inventories
Inventories are stated at the lower of cost or market. Cost is determined by the last-in, first-out (“LIFO”) method for certain precious metal inventory held in the United States. Non-precious metal inventories and remaining precious metal inventory are stated at the lower of cost (determined by the first-in, first-out method or average cost method) or market. For precious metal inventory, no segregation among raw materials, work in process and finished products is practicable.
Non-precious metal inventories are evaluated for estimated excess and obsolescence based upon assumptions about future demand and market conditions and are adjusted accordingly. If actual market conditions are less favorable than those projected, future write-downs may be required.
Derivatives and Risks
Precious Metals Risk
H&H's precious metal and commodity inventories are subject to market price fluctuations. H&H enters into commodity futures and forward contracts to mitigate the impact of price fluctuations on its precious and certain non-precious metal inventories that are not subject to fixed price contracts. The Company's hedging strategy is designed to protect it against normal volatility; therefore, abnormal price changes in these commodities or markets could negatively impact H&H's earnings. H&H does not enter into derivatives or other financial instruments for trading or speculative purposes. H&H accounts for these contracts as either fair value hedges or economic hedges under the guidance in ASC 815,
Derivatives and Hedging
.
Fair Value Hedges
. The fair values of these derivatives are recognized as derivative assets and liabilities on the consolidated balance sheet. The net change in fair value of the derivative assets and liabilities and the change in the fair value of the underlying hedged inventory are recognized in the consolidated income statement, and such amounts principally offset each other due to the effectiveness of the hedges. The fair value hedges are associated primarily with HNH's precious metal inventory carried at fair value.
Economic Hedges.
As these derivatives are not designated as accounting hedges under ASC 815, they are accounted for as derivatives with no hedge designation. The derivatives are marked to market and both realized and unrealized gains and losses are recorded in current period earnings in the consolidated income statement. The economic hedges are associated primarily with the Company's precious metal inventory valued using the LIFO method.
Interest Rate Risk
HNH enters into interest rate swap agreements in order to economically hedge a portion of its debt, which is subject to variable interest rates. As these derivatives are not designated as accounting hedges under U.S. GAAP, they are accounted for as derivatives with no hedge designation. HNH records the gains and losses both from the mark-to-market adjustments and net settlements in interest expense in the consolidated income statement as the hedges are intended to offset interest rate movements.
Financial Instruments/Foreign Currency Exchange Rate Risk
The Company recognizes a liability for short sale transactions on certain financial instruments in which the Company receives proceeds from the sale of such financial instruments and incurs obligations to deliver or purchase securities at a later date. Subsequent changes in the fair value of such obligations, determined based on the closing market price of the financial instruments, are recognized currently as gains or losses, with a comparable reclassification made between the amounts of the Company's unrestricted and restricted cash.
HNH is subject to the risk of price fluctuations related to anticipated revenues and operating costs, firm commitments for capital expenditures and existing assets or liabilities denominated in currencies other than U.S. dollars. HNH has not generally used derivative instruments to manage this risk.
76
STEEL PARTNERS HOLDINGS L.P.
Notes to Consolidated Financial Statements
(dollars in thousands except per unit data)
Goodwill and Other Intangibles, net
Goodwill represents the difference between the purchase price and the fair value of net assets acquired in a business combination. Goodwill and certain other intangible assets deemed to have indefinite lives are not amortized. Intangible assets with finite lives are amortized over their estimated useful lives.
Property, Plant and Equipment
Property, plant and equipment is recorded at cost. Depreciation of property, plant and equipment is recorded principally on the straight line method over the estimated useful lives of the assets, which range is as follows: machinery & equipment
3
to
15
years and buildings and improvements
10
to
30
years. Leasehold improvements are amortized over the shorter of the terms of the related leases or the estimated useful lives of the improvements. Interest cost is capitalized for qualifying assets during the assets' acquisition period. Maintenance and repairs are charged to expense and renewals and betterments are capitalized. Gain or loss on dispositions is recorded in other income.
Impairment Testing
All of the Company's long-lived assets, including goodwill and other intangible assets, are reviewed for impairment indicators throughout the year. Impairment testing is performed for goodwill and indefinite-lived assets annually in the Company's fourth quarter, and for all other long-lived assets whenever impairment indicators are present. The Company also uses judgment in assessing whether assets may have become impaired between annual impairment tests. Circumstances that could trigger an interim impairment test include, but are not limited to: the occurrence of a significant change in circumstances, such as continuing adverse business conditions or legal factors; an adverse action or assessment by a regulator; unanticipated competition; loss of key personnel; the likelihood that a reporting unit or significant portion of a reporting unit will be sold or otherwise disposed; or results of testing for recoverability of a significant asset group within a reporting unit.
Goodwill Impairment Testing
The testing of goodwill for impairment is performed at a level referred to as a reporting unit. Goodwill is allocated to each reporting unit based on actual goodwill valued in connection with each business combination consummated within each reporting unit. Four reporting units of the Company have goodwill assigned to them. SPLP performs its annual impairment test in the 4th quarter of its fiscal year, and would perform testing for impairment between annual tests if an event occurs or circumstances change that would more likely than not reduce the fair value of a reporting unit below its carrying amount. Under ASC 350, an entity can choose between two testing approaches.
a. Step 0 or Qualitative approach - An entity may assess qualitative factors to determine whether it is more likely than not (that is, a likelihood of more than 50 percent) that the fair value of a reporting unit is less than its carrying amount, including goodwill. In evaluating whether it is more likely than not that the fair value of a reporting unit is less than its carrying amount, an entity shall assess relevant events and circumstances. Examples of such events and circumstances would include pertinent macroeconomic conditions, industry and market considerations, overall financial performance and other factors.
An entity has an unconditional option to bypass this qualitative assessment for any reporting unit in any period and proceed directly to performing the first step of the goodwill impairment test. An entity may resume performing the qualitative assessment in any subsequent period.
b. Step 1 or Quantitative approach - The fair value of a reporting unit is calculated and compared with its carrying amount. If the fair value of a reporting unit exceeds its carrying amount, there is no indication of impairment and further testing is not required. If the carrying amount of a reporting unit exceeds its fair value, then a second step of testing is required (“Step 2”). The second step of the goodwill impairment test compares the implied fair value of the reporting unit’s goodwill with the carrying amount of that goodwill.
For 2014, the Company utilized a qualitative approach for
three
of its reporting units to assess its goodwill as of its most recent assessment date and used the quantitative approach to test the goodwill of one of its reporting units, Energy. As a result of the assessment of the Energy reporting unit, we recorded a goodwill impairment in our Energy segment in the fourth quarter of 2014 (see Note 11 - "Goodwill and Intangible Assets" for additional information).
Other Long-Lived Asset Impairment testing
77
STEEL PARTNERS HOLDINGS L.P.
Notes to Consolidated Financial Statements
(dollars in thousands except per unit data)
Intangible assets with finite lives are amortized over their estimated useful lives. The Company also estimates the depreciable lives of property, plant and equipment, and reviews long-lived assets for impairment whenever events, or changes in circumstances, indicate the carrying amount of such assets may not be recoverable. If the carrying values of the long-lived assets exceed the sum of the undiscounted cash flows, an impairment charge is recognized in the amount by which the carrying values exceeds their fair values.
The Company performs such assessments at the lowest level for which identifiable cash flows are largely independent of the cash flows of other assets and liabilities, which is generally at the plant level or the reporting unit level, dependent on the level of interdependencies in the Company's operations. Impairment losses are recorded on long-lived assets when indicators of impairment are present and the undiscounted cash flows estimated to be generated by those assets are less than the assets' carrying amounts. The impairment loss is measured by comparing the fair value of the asset to its carrying amount. The Company considers various factors in determining whether an impairment test is necessary, including among other things: a significant or prolonged deterioration in operating results and projected cash flows; significant changes in the extent or manner in which assets are used; technological advances with respect to assets which would potentially render them obsolete; the Company's strategy and capital planning; and the economic climate in the markets it serves. When estimating future cash flows and if necessary, fair value, the Company makes judgments as to the expected utilization of assets and estimated future cash flows related to those assets. The Company considers historical and anticipated future results, general economic and market conditions, the impact of planned business and operational strategies and other information available at the time the estimates are made. The Company believes these estimates are reasonable; however, changes in circumstances or conditions could have a significant impact on its estimates, which might result in material impairment charges in the future.
Long-lived assets consisting of land and buildings used in previously operating businesses are carried at the lower of cost or fair value and are included primarily in other non-current assets on the consolidated balance sheet. A reduction in the carrying value of such long-lived assets used in previously operating businesses is recorded as an asset impairment charge in the consolidated statement of operations.
Impairment Testing of Indefinite-Lived Intangible Assets
For intangible assets with indefinite lives, the Company calculates fair value using a discounted cash flow approach that requires significant management judgment with respect to future revenue and expense growth rates, changes in working capital use, inflation and the selection of an appropriate discount rate. Any excess of carrying value over the estimated fair value is recognized as an impairment loss.
Accounting Standards Update ("ASU") 2012-02 provides an entity the option to first assess qualitative factors to determine whether the existence of events or circumstances leads to a determination that it is more likely than not (more than 50%) that the estimated fair value of indefinite-lived intangible assets is less than their carrying amounts. If an entity elects to perform a qualitative assessment and determines that an impairment is more likely than not, the entity is then required to calculate the fair value as described above; otherwise no further analysis is required. An entity also may elect not to perform the qualitative assessment and, instead, proceed directly to a quantitative impairment test. The ultimate outcome of the impairment testing is the same whether an entity chooses to perform the qualitative assessment or proceeds directly to the quantitative impairment test.
The Company utilized a qualitative approach as prescribed in ASU 2012-02 to assess its indefinite-lived assets as of its most recent assessment date and the results indicated no impairments in 2014.
Testing Approaches
The income approach is based on a discounted cash flow analysis ("DCF") and calculates the fair value by estimating the after-tax cash flows attributable to a reporting unit and then discounting the after-tax cash flows to a present value using a risk-adjusted discount rate. The discount rates, which are intended to reflect the risks inherent in future cash flow projections, used in the DCF are based on estimates of the weighted-average cost of capital of a market participant. Such estimates are derived from our analysis of peer companies and considered the industry weighted-average return on debt and equity from a market participant perspective.
A market approach values a business by considering the prices at which shares of capital stock, or related underlying assets, of reasonably comparable companies are trading in the public market, or the transaction price at which similar companies have been acquired.
78
STEEL PARTNERS HOLDINGS L.P.
Notes to Consolidated Financial Statements
(dollars in thousands except per unit data)
Relative weights are then given to the results of each of these approaches, based on the facts and circumstances of the business being valued. The use of multiple approaches (income and market approaches) is considered preferable to a single method. The Company gives more weight to the income approach because it generally provides a reliable estimate of value for an ongoing business which has a reliable forecast of operations, and suitable comparable public companies are generally not available to be used under the market approach.
Business Combinations
When the Company acquires a business, it allocates the purchase price to the assets acquired, liabilities assumed and any noncontrolling interests based on their fair values at the acquisition date. Significant judgment may be used to determine these fair values including the use of appraisals, discounted cash flow models, market value for similar purchases, or other methods applicable to the circumstances. The excess of any purchase price we pay over the fair value of the net assets acquired is recorded as Goodwill. If the fair value of the net assets exceeds the purchase price the excess is treated as a bargain purchase and recognized in income. Transaction costs are expensed as incurred.
Subsequent to the finalization of the purchase price allocation, any adjustments to the recorded values of acquired assets and liabilities would be reflected in the Company's consolidated statement of operations. Once final, the Company is not permitted to revise the allocation of the original purchase price, even if subsequent events or circumstances prove the Company's original judgments and estimates to be incorrect.
In addition, long-lived assets recorded in a business combination such as property and equipment, intangible assets and goodwill may be deemed to be impaired in the future resulting in the recognition of an impairment loss. The assumptions and judgments made by the Company when recording business combinations will have an impact on reported results of operations in the future.
Revenue Recognition
HNH recognizes revenue when the title and risk of loss has passed to the customer, the price is fixed or determinable and collection is reasonably assured. This condition is normally met when product has been shipped or the service performed. An allowance is provided for estimated returns and discounts based on experience. Cash received from customers prior to shipment of goods, or otherwise not yet earned, is recorded as deferred revenue. Rental revenues are derived from the rental of production facilities and certain equipment to the food industry where customers prepay for the rental period - usually
3
to
6
month periods. For prepaid rental contracts, sales revenue is recognized on a straight-line basis over the term of the contract. Service revenues consist of repair and maintenance work performed on equipment used at mass merchants, supermarkets and restaurants.
HNH experiences a certain degree of sales returns that varies over time, but is able to make a reasonable estimation of expected sales returns based upon history. HNH records all shipping and handling fees billed to customers as revenue, and related costs are charged principally to cost of goods sold, when incurred. HNH has also entered into agreements with certain customers under which the Company has agreed to pay rebates to such customers. These programs are typically structured to incentivize the customers to increase their annual purchases from HNH. The rebates are usually calculated as a percentage of the purchase amount, and such percentages may increase as the customer’s level of purchases rise. Rebates are recorded as a reduction of net sales in the consolidated income statement and are accounted for on an accrual basis. As of December 31, 2014 and 2013, accrued rebates payable totaled
$6,100
and
$5,400
, respectively, and are included in accrued liabilities on the consolidated balance sheet. In limited circumstances, HNH is required to collect and remit sales tax on certain of its sales. HNH accounts for sales taxes on a net basis, and such sales taxes are not included in net sales in the consolidated income statement.
Steel Excel recognizes revenue upon providing the product or service related to its energy or sports businesses. Steel Excel recognizes revenue when persuasive evidence of an arrangement exists, delivery has occurred or services have been rendered, the price is fixed or determinable and collection is reasonably assured. Revenue is recognized net of estimated allowances. Revenue is generated by short-term projects, most of which are governed by master service agreements (“MSAs”) that are short-term in nature. The MSAs establish per day or per usage rates for equipment services. Revenue related to its energy business is recognized daily on a proportionate performance method, based on services rendered. Revenue is reported net of sales tax collected. For sports services revenues, Steel Excel does not recognize revenue until the tournament or league occurs. For sports products, Steel Excel recognizes revenue upon shipment.
79
STEEL PARTNERS HOLDINGS L.P.
Notes to Consolidated Financial Statements
(dollars in thousands except per unit data)
Concentration of Revenue
No single customer accounted for 5% or more of the Company's consolidated revenues in 2014, 2013 or 2012. In
2014
, 2013 and 2012 the 10 largest customers accounted for approximately
28%
,
20%
and
21%
, respectively, of the Company's consolidated revenues.
Fair Value Measurements
The Company measures certain assets and liabilities at fair value (see Note 6 - "Fair Value Measurements"). Fair value is defined as the price that would be received to sell an asset or paid to transfer a liability (i.e. the "exit price") in an orderly transaction between market participants at the measurement date. Fair value measurements are classified into three levels based on the reliability of inputs as follows:
Level 1 inputs are quoted prices in active markets for identical assets or liabilities that the Company has the ability to access at the measurement date. An active market for the asset or liability is a market in which transactions for the asset or liability occur with sufficient frequency and volume to provide pricing information on an ongoing basis. The valuation under this approach does not entail a significant degree of judgment (“Level 1”).
Level 2 inputs are inputs other than quoted prices included within Level 1 that are observable for the asset or liability, either directly or indirectly. Level 2 inputs include: quoted prices for similar assets or liabilities in active markets, quoted prices for identical assets or liabilities in markets that are not active, inputs other than quoted prices that are observable for the asset or liability (e.g. interest rates and yield curves observable at commonly quoted intervals or current market) and contractual prices for the underlying financial instrument, as well as other relevant economic measures ("Level 2").
Level 3 inputs are unobservable inputs for the asset or liability. Unobservable inputs are used to measure fair value to the extent that observable inputs are not available, thereby allowing for situations in which there is little, if any, market activity for the asset or liability at the measurement date ("Level 3").
Investments in equity securities are classified as Level 1 or Level 2 based on its trading activity in the period. Investments may move between Level 1 and Level 2 if the market activity increases or decreases in the period.
In certain cases, the inputs used to measure fair value may fall into different levels of the fair value hierarchy. In such cases, an investment’s level within the fair value hierarchy is based on the lowest level of input that is significant to the fair value measurement. The assessment of the significance of a particular input to the fair value measurement in its entirety requires judgment and considers factors specific to the investment. Significant transfers, if any, between the levels within the fair value hierarchy are recognized at the beginning of the reporting period.
Fair Value Option
The Company has the one-time option to elect fair value for financial assets or liabilities as of the election date. Changes in fair value of these financial instruments are recorded as unrealized gain (loss) in the consolidated statements of operations. The factors considered in electing the fair value option include the availability of otherwise required financial information, differing fiscal year end of an investee and differing basis of financial reporting used by investee companies.
Stock-Based Compensation
The Company accounts for stock options and restricted stock units granted to employees and non-employee directors as compensation expense, which is recognized in exchange for the services received. The compensation expense is based on the fair value of the equity instruments on the grant-date and is recognized as an expense over the service period of the recipients.
Income Taxes
SPLP and certain of its subsidiaries, as limited partnerships, are generally not responsible for federal and state income taxes and their profits and losses are passed directly to their partners for inclusion in their respective income tax returns. SPLP's subsidiaries that are corporate entities are subject to federal and state income taxes and file corporate income tax returns.
80
STEEL PARTNERS HOLDINGS L.P.
Notes to Consolidated Financial Statements
(dollars in thousands except per unit data)
SPLP's subsidiaries that are subject to income taxes use the liability method of accounting for such taxes. Under the liability method, deferred tax assets and deferred tax liabilities are recognized for the future tax consequences attributable to differences between the financial statement carrying amounts of existing assets and liabilities and their respective tax bases and operating loss and tax credit carryforwards. Deferred tax assets and deferred tax liabilities are measured using enacted tax rates expected to apply to taxable income in the years in which those temporary differences are expected to be recovered or settled. The effect on deferred tax assets and deferred tax liabilities of a change in tax rates is recognized in income in the period that includes the enactment date. Such subsidiaries evaluate the recoverability of deferred tax assets and establish a valuation allowance when it is more likely than not that some portion of the deferred tax assets will not be realized.
When tax returns are filed, it is highly certain that most positions taken would be sustained upon examination by the taxing authorities, while others are subject to uncertainty about the merits of the position taken or the amount of the position that would be ultimately sustained. The benefit of a tax position is recognized in the consolidated financial statements in the period during which, based on all available evidence, management believes it is more likely than not that the position will be sustained upon examination, including the resolution of appeals or litigation processes, if any. Tax positions taken are not offset or aggregated with other positions. Tax positions that meet the more-likely-than-not recognition threshold are measured as the largest amount of tax benefit that is more than
50%
likely of being realized upon settlement with the applicable taxing authority. The portion of the benefits associated with tax positions taken that exceeds the amount measured as described above is provided for and reflected as a liability for unrecognized tax benefits in the accompanying consolidated balance sheets, along with any associated interest and penalties that would be payable to the taxing authorities upon examination.
SPLP's policy is to record estimated interest and penalties related to the underpayment of income taxes as income tax expense in the statements of operations.
Other Taxes
Certain foreign dividend income is subject to a withholding tax. Such withholding tax is netted against dividend income in the consolidated statements of operations.
Net Income (Loss) per Common Unit
Net income (loss) per common unit - basic is computed by dividing net income (loss) by the weighted-average number of common units outstanding for the period. Net income (loss) per common unit - diluted gives effect to potentially dilutive units as if they had been outstanding during the period.
Foreign Currency Translation
Assets and liabilities of foreign subsidiaries are translated at current exchange rates and related revenues and expenses are translated at average rates of exchange in effect during the year. Resulting cumulative translation adjustments are recorded as a separate component of Accumulated other comprehensive income (loss).
Advertising Costs
Advertising costs consist of sales promotion literature, samples, cost of trade shows and general advertising costs, and are included in selling, general and administrative expenses on the consolidated statements of operations. Advertising, promotion and trade show costs totaled approximately
$3,400
,
$2,777
and
$2,335
for the years ended
December 31, 2014
,
2013
and
2012
, respectively.
Legal Contingencies
The Company provides for legal contingencies when the liability is probable and the amount of the associated costs is reasonably estimable. The Company regularly monitors the progress of legal contingencies and revises the amounts recorded in the period in which a change in estimate occurs.
81
STEEL PARTNERS HOLDINGS L.P.
Notes to Consolidated Financial Statements
(dollars in thousands except per unit data)
Environmental Liabilities
The Company accrues for losses associated with environmental remediation obligations when such losses are probable and reasonably estimable. Accruals for estimated losses from environmental remediation obligations generally are recognized no later than completion of the remedial feasibility study.
Such accruals are adjusted as further information develops or circumstances change. Costs of future expenditures for environmental remediation obligations are not discounted to their present value. Recoveries of environmental remediation costs from other parties are recorded as assets when their receipt is deemed probable.
Recently Issued Accounting Standards
In April 2014, the Financial Accounting Standards Board ("FASB") issued Accounting Standards Update ("ASU") No. 2014-08,
Presentation of Financial Statements (Topic 205) and Property, Plant, and Equipment (Topic 360): Reporting Discontinued Operations and Disclosures of Disposals of Components of an Entity.
Under the new guidance, only disposals representing a strategic shift in operations should be presented as discontinued operations. Those strategic shifts should have a major effect on an organization's operations and financial results. In addition, the new guidance requires expanded disclosures about discontinued operations that will provide financial statement users with more information about the assets, liabilities, income and expenses of discontinued operations. The new guidance also requires disclosure of the pre-tax income attributable to a disposal of a significant part of an organization that does not qualify for discontinued operations reporting. The ASU is effective for fiscal years beginning after December 15, 2014, with early adoption allowed.
In May 2014, the FASB issued ASU No. 2014-09,
Revenue from Contracts with Customers (Topic 606)
. The core principle of the guidance is that an entity should recognize revenue to depict the transfer of promised goods or services to customers in an amount that reflects the consideration to which the entity expects to be entitled in exchange for those goods or services, and the guidance defines a five step process to achieve this core principle. The ASU is effective for the Company's 2017 fiscal year and may be applied either (i) retrospectively to each prior reporting period presented with an election for certain specified practical expedients, or (ii) retrospectively with the cumulative effect of initially applying the ASU recognized at the date of initial application, with additional disclosure requirements. The Company is evaluating the potential impact of this new guidance, but does not currently anticipate that the application of ASU No. 2014-09 will have a significant effect on its financial condition, results of operations or its cash flows. We have not yet determined the method by which we will adopt the standard in 2017.
3. ACQUISITIONS
2014 Acquisitions
There were no significant acquisitions during the year ended December 31, 2014.
2013 Acquisitions
Wolverine Joining Technologies, LLC
On April 16, 2013, HNH and its indirect subsidiary, Lucas-Milhaupt Warwick LLC (collectively, the "Buyer"), entered into an asset purchase agreement ("Purchase Agreement") with Wolverine Tube, Inc. ("Wolverine") and its subsidiary, Wolverine Joining Technologies, LLC ("Wolverine Joining" and, together with Wolverine, "Seller"), pursuant to which the Buyer agreed to purchase substantially all of the assets of the Seller used in the business of Wolverine Joining, consisting of assets used for the development, manufacturing and sale of brazing, flux and soldering products and the alloys for electrical, catalyst and other industrial specialties, other than certain leased real property, and to assume certain liabilities related to such business. By acquiring Wolverine Joining, HNH increased its capacity to produce brazing filler metals and fluxes, and broadened its platform for continued global expansion. The purchase price for the acquisition was approximately
$59,700
, reflecting a final working capital adjustment and certain other reductions totaling approximately
$300
as provided in the Purchase Agreement. The closing of this transaction occurred on April 26, 2013. Funding of the purchase price for the acquisition was from cash on hand and borrowings under HNH's then existing senior secured credit facility, which was amended in connection with the acquisition.
In connection with the acquisition of Wolverine Joining, HNH incurred employee termination charges totaling
approximately
$400
associated with HNH's integration activities which were primarily recorded and paid in fiscal 2013 and reflected in Selling, General and Administrative expenses.
The following table summarizes the amounts of the assets acquired and liabilities assumed recognized at the acquisition date:
|
Trade and other receivables
|
$
|
9,491
|
|
|
Inventories
|
17,864
|
|
|
|
Prepaid and other current assets
|
81
|
|
|
|
Property, plant and equipment
|
5,549
|
|
|
|
Goodwill
|
14,767
|
|
|
|
Other intangibles
|
13,657
|
|
|
|
Total assets acquired
|
61,409
|
|
|
|
Trade payables
|
(1,167
|
)
|
|
|
Accrued liabilities
|
(495
|
)
|
|
|
Net assets acquired
|
$
|
59,747
|
|
The goodwill of
$14,767
arising from the acquisition consists largely of the synergies expected from combining the operations of the Buyer and Seller. All of the goodwill is assigned to SPLP's Diversified Industrial segment and is expected to be deductible for income tax purposes. Other intangibles consist primarily of acquired trade names of
$4,600
and customer relationships of
$9,000
. The intangible assets have been assigned
20
-year useful lives based on the long operating history, broad market recognition and continued demand for the associated brands, and the limited turnover and long-standing relationships Wolverine Joining has with its existing customer base. The valuation of acquired trade names was performed utilizing a relief from royalty method, and significant assumptions used in the valuation included the royalty rate assumed and the expected level of future sales. The acquired customer relationships were valued using an excess earnings approach, and significant assumptions used in the valuation included the customer attrition rate assumed and the expected level of future sales.
The amount of net sales and operating income of the acquired business, net of sales volume transferred to or from the acquired business unit as part of the Company's integration activities, included in the consolidated income statement for the twelve months ended December 31, 2013 was approximately
$43,300
and
$1,600
, respectively, including
$3,500
of intercompany sales which were eliminated in consolidation. The results of operations of the acquired business are reported within the Company's Diversified Industrial segment.
PAM Fastening Technology, Inc.
On November 7, 2013, HNH, through its indirect subsidiary, OMG, Inc., acquired
100%
of the stock of PAM Fastening Technology, Inc. ("PAM") for a cash purchase price of
$9,200
, net of cash acquired. PAM is a distributor of screw guns, collated screws and hot melt systems to the manufacturing and building industries in North America. The assets acquired and liabilities assumed included net working capital of trade receivables, inventories and trade payables; property, plant and equipment; and intangible assets, primarily trade names and customer relationships, valued at
$2,500
,
$200
and
$5,000
, respectively. This acquisition provides HNH with an add on product category to its existing fastening system product line. The amount of net sales and operating income of the acquired business included in the consolidated income statement for the year ended December 31, 2013 was approximately
$1,500
and
$200
, respectively. The results of operations of the acquired business are reported within the Company's Diversified Industrial segment. In connection with the PAM acquisition, HNH has recorded goodwill totaling approximately
$3,500
, which is not expected to be deductible for income tax purposes, as well as deferred income tax liabilities associated with the acquired intangible assets of approximately
$2,000
.
Steel Excel - Black Hawk Acquisition
On December 16, 2013, Steel Excel acquired the business and substantially all of the assets of Black Hawk Energy Services, Inc. (“Black Hawk”), a provider of drilling and production services to the oil and gas industry, for approximately
$59,600
in cash, subject to a post-closing working capital adjustment. The acquisition was funded with approximately
$34,600
from Steel Excel's cash reserves and
$25,000
in proceeds from additional borrowings under an existing credit facility (see Note 14 - "Debt and Capital Lease Obligations"). Steel Excel acquired Black Hawk to further solidify its presence in North Dakota in the Bakken basin and to expand its business into other regions, including Texas and New Mexico.
82
STEEL PARTNERS HOLDINGS L.P.
Notes to Consolidated Financial Statements
(dollars in thousands except per unit data)
The estimated fair value of the assets and liabilities acquired in connection with the Black Hawk transaction was as
follows:
|
Amount
|
|||
|
Accounts receivable
|
$
|
10,114
|
|
|
Prepaid expenses and other current assets
|
319
|
|
|
|
Property and equipment
|
30,088
|
|
|
|
Intangible Assets
|
12,210
|
|
|
|
Accounts payable
|
(1,584
|
)
|
|
|
Accrued expenses
|
(2,160
|
)
|
|
|
Total net identifiable assets
|
48,987
|
|
|
|
Goodwill
|
10,576
|
|
|
|
Net assets acquired
|
$
|
59,563
|
|
The goodwill recognized, which is fully deductible for tax purposes, arose from the growth potential Steel Excel anticipates along with expected synergies within Steel Excel's Energy business. The intangible assets acquired represented customer relationships, a trade name, and a non-compete arrangement all of which are being amortized over five-year periods. The fair value of trade accounts receivable was based on their carrying value at the date of acquisition and was expected to be fully collected.
Steel Excel - Sports Acquisitions
During 2013, Steel Excel's sports business made
two
acquisitions totaling
$3,250
that were not material to SPLP's operations. Steel Excel has determined that
one
of these acquisitions is a variable interest entity and that Steel Excel is the primary beneficiary. Accordingly, Steel Excel accounts for its acquisition of its
30%
membership interest as a business combination and has consolidated this company in accordance with ASC 805.
2012 Acquisitions
Steel Excel Acquisition
On May 31, 2012, (the "Acquisition Date") Steel Excel acquired all of the capital stock of SWH, Inc. ("SWH"), a wholly owned subsidiary of BNS and the parent company of Sun Well Services, Inc. ("Sun Well"), for a net acquisition price of
$68,747
. The acquisition price was paid through a combination of
2,027,500
shares of common stock of Steel Excel and
$7,922
in cash. The
$68,747
exceeded the carrying value of Sun Well by
$26,237
. Pursuant to ASC 810-10-45-23 this was deemed a transaction between entities under common control, and accordingly the excess of fair value received over the carrying value of Sun Well of
$26,237
was credited to Capital. Also, Sun Well's assets and liabilities were maintained at their historical basis in the consolidated financial statements.
As a result of the transaction, Steel Excel became a majority-owned controlled subsidiary and is consolidated with SPLP from that date. Prior to obtaining a controlling interest on the Acquisition Date, SPLP owned
4,584,399
shares of Steel Excel (
42.0%
of the outstanding shares), and its investment was accounted for under the equity method at fair value. The additional shares of Steel Excel acquired on the Acquisition Date brought the total number of shares owned by SPLP to
6,611,899
, representing
51.1%
of the outstanding shares of Steel Excel.
The Company's previously held equity interest and the noncontrolling interest in Steel Excel were valued at
$30
per share, which is the fair value of Steel Excel shares specified in the Share Acquisition Agreement.
The acquisition-date fair value of the Company's equity interest in Steel Excel was
$137,532
prior to the
2,027,500
shares acquired on the Acquisition Date. As a result of remeasuring our equity interest to fair value, the Company recognized an investment gain of
$13,524
in 2012 which is included in Net investment (loss) gain in the consolidated statements of operations.
83
STEEL PARTNERS HOLDINGS L.P.
Notes to Consolidated Financial Statements
(dollars in thousands except per unit data)
The following table summarizes the consideration paid for the controlling interest in Steel Excel:
|
Consideration Paid
|
|||
|
Acquisition-date fair value of previously held equity interest
|
$
|
137,532
|
|
|
Fair value of SWH transferred to Steel Excel
|
68,747
|
|
|
|
Less: cash received from Steel Excel for SWH
|
(7,922
|
)
|
|
|
Total
|
$
|
198,357
|
|
The following table summarizes the fair values of the assets acquired and liabilities assumed at the Acquisition Date and the fair value of the noncontrolling interest in Steel Excel on the Acquisition Date:
|
Amount
|
|||
|
Assets:
|
|||
|
Cash and cash equivalents
|
$
|
41,963
|
|
|
Marketable securities
|
217,526
|
|
|
|
Accounts receivable
|
23,435
|
|
|
|
Prepaid expenses and other current assets
|
3,129
|
|
|
|
Property, plant and equipment
|
74,880
|
|
|
|
Goodwill
|
48,468
|
|
|
|
Identifiable intangible assets
|
22,793
|
|
|
|
Other assets
|
4,088
|
|
|
|
Total assets acquired
|
$
|
436,282
|
|
|
Liabilities:
|
|||
|
Accounts payable and accrued liabilities
|
$
|
10,842
|
|
|
Debt
|
17,968
|
|
|
|
Other long-term liabilities
|
19,517
|
|
|
|
Total liabilities assumed
|
48,327
|
|
|
|
Fair value of non-controlling interests
|
189,598
|
|
|
|
Net assets acquired
|
$
|
198,357
|
|
In the fourth quarter of 2014, the Company recognized a goodwill impairment charge related to the goodwill from the Steel Excel acquisition (see Note 11 - "Goodwill and Other Intangible Assets, Net" for additional information).
HNH Acquisitions
Zaklad Przetwórstwa Metali INMET Sp. z o.o.
On November 5, 2012, a subsidiary of Handy & Harman ("H&H") acquired
100%
of the stock of Zaklad Przetwórstwa Metali INMET Sp. z o.o., a Polish manufacturer of brazing alloys and contact materials, for a cash purchase price of
$4,000
, net of cash acquired. The assets acquired and liabilities assumed included net working capital of accounts receivable, inventories and trade payables totaling
$3,100
; property, plant and equipment of
$2,200
; as well as assumed debt of
$1,600
. This acquisition provides H&H with a new family of fabricated joining materials and a broader presence in the European market. The amount of net sales and operating loss of the acquired business included in the consolidated income statement was
$1,700
and
$100
, respectively, for the period from acquisition through December 31, 2012, including
$1,200
of intercompany sales which were eliminated in consolidation. The results of operations of the acquired business are reported within the Company's Diversified Industrial segment.
84
STEEL PARTNERS HOLDINGS L.P.
Notes to Consolidated Financial Statements
(dollars in thousands except per unit data)
W.P. Hickman Company
On December 31, 2012, a subsidiary of H&H acquired substantially all of the assets of W.P. Hickman Company ("Hickman"), a North American manufacturer of perimeter metal roof edges for low slope roofs. The initial purchase price was
$8,400
, which reflects proceeds from a final working capital adjustment of
$300
received in February 2013. The assets acquired and liabilities assumed included net working capital of accounts receivable, inventories and trade payables; property, plant and equipment; and intangible assets, primarily trade names and customer relationships, valued at
$2,600
,
$1,200
and
$1,800
, respectively. This acquisition provides H&H with an add on product category to its existing roofing business. The amount of net sales and operating income of the acquired business included in the consolidated income statement for the year ended December 31, 2013 was approximately
$17,100
and
$1,300
, respectively. The results of operations of the acquired business are reported within the Company's Building Materials segment. In connection with the Hickman acquisition, HNH has recorded goodwill totaling
$2,800
which is expected to be deductible for income tax purposes.
There is additional contingent consideration that could be due from the Company under the Hickman asset purchase agreement if the combined net sales of certain identified products exceed the parameters set forth in the asset purchase agreement in 2013 and 2014. In no event shall the additional contingent consideration exceed
$1,500
. In accordance with ASC 805, Business Combinations, the estimated fair value,
$200
, related to the contingent portion of the purchase price was recognized at the acquisition date. There was no significant change in the estimated fair value of this liability during the year ended December 31, 2013.
Pro Forma Results
The following unaudited pro forma results of operations for the years ended December 31,
2013
and
2012
assumes that the above acquisitions were made at the beginning of the year prior to acquisition. This unaudited pro forma information does not purport to be indicative of the results that would have been obtained if the acquisitions had actually occurred at the beginning of the year prior to acquisition, nor of the results that may be reported in the future. The 2013 supplemental pro forma earnings reflect adjustments to exclude
$600
of acquisition-related costs incurred in 2013 and
$500
of nonrecurring expense related to the fair value adjustment to acquisition-date inventories. The 2012 supplemental pro forma earnings were adjusted to include these charges.
|
Year Ended December 31,
|
|||||||
|
2013
|
2012
|
||||||
|
Revenue
|
$
|
806,517
|
|
$
|
777,454
|
|
|
|
Net income attributable to common unitholders
|
26,190
|
|
46,624
|
|
|||
|
Net income per common unit - basic
|
0.88
|
|
1.57
|
|
|||
|
Net income per common unit - diluted
|
0.85
|
|
1.57
|
|
|||
85
STEEL PARTNERS HOLDINGS L.P.
Notes to Consolidated Financial Statements
(dollars in thousands except per unit data)
4. DISCONTINUED OPERATIONS
Assets and Liabilities of discontinued operations at
December 31, 2014
and 2013 include assets and liabilities relating to HNH's discontinued operations, primarily Arlon LLC ("Arlon"), a sports business owned by Steel Excel and a building owned by DGT, which is held for sale.
|
December 31,
|
|||||||
|
2014
|
2013
|
||||||
|
Assets of discontinued operations:
|
|||||||
|
Trade and other receivables
|
$
|
16,044
|
|
$
|
14,224
|
|
|
|
Inventories
|
8,294
|
|
6,580
|
|
|||
|
Other current assets
|
811
|
|
1,266
|
|
|||
|
Goodwill
|
6,582
|
|
6,582
|
|
|||
|
Other intangibles, net
|
14,230
|
|
15,306
|
|
|||
|
Property, plant and equipment, net
|
30,457
|
|
32,273
|
|
|||
|
Other assets
|
—
|
|
64
|
|
|||
|
Total assets
|
$
|
76,418
|
|
$
|
76,295
|
|
|
|
Liabilities of discontinued operations:
|
|||||||
|
Trade payables and accrued liabilities
|
$
|
6,702
|
|
$
|
6,857
|
|
|
|
Other current liabilities
|
3,986
|
|
3,533
|
|
|||
|
Accrued pension liability
|
1,794
|
|
1,165
|
|
|||
|
Other liabilities
|
719
|
|
682
|
|
|||
|
Total liabilities
|
$
|
13,201
|
|
$
|
12,237
|
|
|
Summary results for our discontinued operations included in the Company's Consolidated Statements of Operations are detailed in the table below.
|
Year Ended December 31,
|
|||||||||||
|
2014 (a)
|
2013 (b)
|
2012 (c)
|
|||||||||
|
Sales
|
$
|
103,392
|
|
$
|
105,194
|
|
$
|
178,279
|
|
||
|
Net income (loss) from operations
|
10,262
|
|
(227
|
)
|
12,866
|
|
|||||
|
Gain after taxes and noncontrolling interests
|
6,112
|
|
703
|
|
6,844
|
|
|||||
|
Gain on sale of discontinued operations after taxes and noncontrolling interests
|
23
|
|
3,610
|
|
4,026
|
|
|||||
(a) Includes the operations of Arlon.
(b) Includes the operations of Arlon, Continental, CMCC and ITM through their respective sale dates as well as the operations of a sports business owned by Steel Excel.
(c) Includes the operations of Arlon, Continental, CMCC and ITM. Also includes DGT's RFI Corporation ("RFI") subsidiary and DGT's Villa Sistemi Medicali S.p.A. ("Villa") subsidiary through their respective sale dates. SPLP's net gain on the sale of RFI, which was recorded in SPLP's fourth quarter of 2012 due to the recording of DGT's results of operations on a two-month lag, was approximately
$4,600
. SPLP’s net after-tax gain on the sale of Villa, which was recorded in SPLP’s year ended December 31, 2012, was
$2,585
.
HNH’s Discontinued Operations
Arlon
On December 18, 2014, HNH entered into a contract to sell its Arlon business for
$157,000
in cash, subject to a working capital adjustment and certain potential reductions as provided in the stock purchase agreement. The operations of Arlon, which manufactures high performance materials for the printed circuit board industry and silicone rubber-based materials, were part of SPLP's Diversified Industrial reporting segment. The closing of the sale occurred in January 2015 (see Note 22 - "Subsequent Events").
86
STEEL PARTNERS HOLDINGS L.P.
Notes to Consolidated Financial Statements
(dollars in thousands except per unit data)
Continental Industries
In January 2013, HNH divested substantially all of the assets and existing operations of its Continental Industries business unit for a cash sales price totaling approximately
$37,400
less transaction fees, reflecting a working capital adjustment of approximately
$100
paid in the third quarter of 2013. Proceeds of
$3,700
were held in escrow as of December 31, 2013 pending resolution of certain indemnification provisions contained in the sales agreement and were included in Trade and other receivables in the Company's Consolidated Balance Sheet. This escrow balance was released and received in July 2014. Continental Industries manufactures plastic and steel fittings and connectors for natural gas, propane and water distribution service lines along with exothermic welding products for electrical grounding, cathodic protection and lightning protection. It was part of SPLP's Diversified Industrial reporting segment.
Canfield Metal Coating Corporation
In June 2013, HNH divested substantially all of the assets and existing operations of its CMCC business unit for a cash sales price totaling approximately
$9,500
less transaction fees, reflecting a preliminary working capital adjustment of approximately
$500
. CMCC manufactured electro-galvanized and painted cold rolled sheet steel products primarily for the construction, entry door, container and appliance industries. It was part of SPLP's Diversified Industrial reporting segment.
Indiana Tube Mexico
In July 2013, HNH divested substantially all of the equipment owned or utilized by ITM for the manufacture of refrigeration condensers for a cash sales price totaling $
3,700
, less transaction fees. ITM's operations were part of SPLP's Diversified Industrial segment.
In connection with the shut-down of ITM's operations, HNH initiated a series of restructuring activities, which will include the termination of all of ITM's employees and certain building lease termination costs. The total cost of these restructuring activities was $
900
. Payment for the majority of these costs occurred during the third quarter of 2013, and the remaining restructuring payments were completed by the end of 2013.
Indiana Tube Denmark
In 2008, the HNH decided to exit the welded specialty tubing market in Europe and close its Indiana Tube Danmark
A/S subsidiary ("ITD"). During 2009, ITD ceased operations and sold or disposed of its inventory and most of its equipment. HNH completed the final liquidation of ITD in July 2013 and recognized $
2,600
in foreign currency translation gains in earnings during the third quarter of 2013, which were previously reported in Accumulated other comprehensive loss on the Consolidated Balance Sheet.
5. INVESTMENTS
A. Short-Term Investments
Marketable Securities
The Company's short-term investments primarily consist of its marketable securities portfolio held by its subsidiary, Steel Excel. Steel Excel's marketable securities as of
December 31, 2014
, and
2013
, were classified as "available-for-sale" securities, with changes in fair value recognized in stockholders' equity as Other comprehensive income (loss). Classification of marketable securities as a current asset is based on the intended holding period and realizability of the investment.
87
STEEL PARTNERS HOLDINGS L.P.
Notes to Consolidated Financial Statements
(dollars in thousands except per unit data)
The Company's portfolio of marketable securities at
December 31, 2014
and
2013
was as follows:
|
December 31, 2014
|
December 31, 2013
|
||||||||||||||||||||||||||||||
|
Cost
|
Gross Unrealized Gains
|
Gross Unrealized Losses
|
Fair value
|
Cost
|
Gross Unrealized Gains
|
Gross Unrealized Losses
|
Fair value
|
||||||||||||||||||||||||
|
Available for sale securities
|
|||||||||||||||||||||||||||||||
|
Short-term deposits
|
$
|
42,681
|
|
$
|
—
|
|
$
|
—
|
|
$
|
42,681
|
|
$
|
60,909
|
|
$
|
—
|
|
$
|
—
|
|
$
|
60,909
|
|
|||||||
|
Mutual funds
|
17,030
|
|
4,262
|
|
(322
|
)
|
20,970
|
|
15,723
|
|
5,060
|
|
—
|
|
20,783
|
|
|||||||||||||||
|
United States government securities
|
—
|
|
—
|
|
—
|
|
—
|
|
50,356
|
|
23
|
|
—
|
|
50,379
|
|
|||||||||||||||
|
Equity securities
|
103,761
|
|
7,821
|
|
(23,732
|
)
|
87,850
|
|
69,720
|
|
10,020
|
|
(5,181
|
)
|
74,559
|
|
|||||||||||||||
|
Commercial paper
|
—
|
|
—
|
|
—
|
|
—
|
|
1,799
|
|
—
|
|
—
|
|
1,799
|
|
|||||||||||||||
|
Corporate obligations
|
32,486
|
|
592
|
|
(3,441
|
)
|
29,637
|
|
31,356
|
|
885
|
|
(276
|
)
|
31,965
|
|
|||||||||||||||
|
Total marketable securities
|
195,958
|
|
12,675
|
|
(27,495
|
)
|
181,138
|
|
229,863
|
|
15,988
|
|
(5,457
|
)
|
240,394
|
|
|||||||||||||||
|
Amounts classified as cash equivalents
|
(42,681
|
)
|
—
|
|
—
|
|
(42,681
|
)
|
(61,909
|
)
|
—
|
|
—
|
|
(61,909
|
)
|
|||||||||||||||
|
Amounts classified as marketable securities
|
$
|
153,277
|
|
$
|
12,675
|
|
$
|
(27,495
|
)
|
$
|
138,457
|
|
$
|
167,954
|
|
$
|
15,988
|
|
$
|
(5,457
|
)
|
$
|
178,485
|
|
|||||||
Proceeds from sales of marketable securities were
$116,300
,
$75,800
and
$192,380
in
2014
,
2013
and the seven months ended December 31, 2012, respectively. The Company determines gains and losses from sales of marketable securities based on specific identification of the securities sold. Gross realized gains and losses from sales of marketable securities, all of which are reported as a component of Other income, net in the consolidated statements of operations, were as follows:
|
Year Ended December 31,
|
|||||||||||
|
2014
|
2013
|
2012
|
|||||||||
|
Gross realized gains
|
$
|
8,065
|
|
$
|
6,984
|
|
$
|
500
|
|
||
|
Gross realized losses
|
(4,300
|
)
|
(4,376
|
)
|
(340
|
)
|
|||||
|
Realized gains, net
|
$
|
3,765
|
|
$
|
2,608
|
|
$
|
160
|
|
||
The fair value of marketable securities with unrealized losses at December 31, 2014, all of which had unrealized losses for periods of twelve months or less, were as follows:
|
Fair Value
|
Gross Unrealized Losses
|
||||||
|
Corporate securities
|
$
|
39,869
|
|
$
|
(23,732
|
)
|
|
|
Corporate obligations
|
13,530
|
|
(3,441
|
)
|
|||
|
Mutual funds
|
4,873
|
|
(322
|
)
|
|||
|
Total
|
$
|
58,272
|
|
$
|
(27,495
|
)
|
|
88
STEEL PARTNERS HOLDINGS L.P.
Notes to Consolidated Financial Statements
(dollars in thousands except per unit data)
The fair value of the Company’s marketable securities with unrealized losses at December 31, 2013, and the duration
of time that such losses had been unrealized, were as follows:
|
Less than 12 Months
|
12 Months or Greater
|
Total
|
|||||||||||||||||||||
|
Fair Value
|
Gross Unrealized Losses
|
Fair Value
|
Gross Unrealized Losses
|
Fair Value
|
Gross Unrealized Losses
|
||||||||||||||||||
|
Corporate securities
|
$
|
15,609
|
|
$
|
(4,730
|
)
|
$
|
803
|
|
$
|
(451
|
)
|
$
|
16,412
|
|
$
|
(5,181
|
)
|
|||||
|
Corporate obligations
|
10,477
|
|
(276
|
)
|
—
|
|
—
|
|
10,477
|
|
(276
|
)
|
|||||||||||
|
Total
|
$
|
26,086
|
|
$
|
(5,006
|
)
|
$
|
803
|
|
$
|
(451
|
)
|
$
|
26,889
|
|
$
|
(5,457
|
)
|
|||||
Gross unrealized losses primarily related to losses on corporate securities. The Company has evaluated such
securities, which primarily consist of investments in equity securities of publicly-traded entities, as of December 31, 2014, and
has determined that there was no indication of other-than-temporary impairments. This determination was based on several
factors, including the length of time and extent to which fair value has been less than the cost basis, the financial condition and
near-term prospects of the entity, and the Company's intent and ability to hold the corporate securities for a period of time
sufficient to allow for any anticipated recovery in market value.
The amortized cost and estimated fair value of available-for-sale debt securities and marketable securities with no contractual maturities as of
December 31, 2014
, by contractual maturity, were as follows:
|
Cost
|
Estimated Fair Value
|
||||||
|
Mature in one year or less
|
$
|
212
|
|
$
|
186
|
|
|
|
Mature after one year through three years
|
—
|
|
—
|
|
|||
|
Mature after three years
|
32,274
|
|
29,451
|
|
|||
|
Total debt securities
|
32,486
|
|
29,637
|
|
|||
|
Securities with no contractual maturities
|
163,472
|
|
151,501
|
|
|||
|
$
|
195,958
|
|
$
|
181,138
|
|
||
89
STEEL PARTNERS HOLDINGS L.P.
Notes to Consolidated Financial Statements
(dollars in thousands except per unit data)
B. Long-Term Investments
The following table summarizes the Company's long-term investments as of
December 31, 2014
and
2013
. For those investments at fair value, the carrying amount of the investment equals its respective fair value.
|
Investment Balance
|
Income (Loss) Recorded in Statement of Operations
|
||||||||||||||||||||||
|
Year Ended December 31,
|
|||||||||||||||||||||||
|
December 31, 2014
|
December 31, 2013
|
2014
|
2013
|
2012
|
|||||||||||||||||||
|
(A) AVAILABLE-FOR-SALE SECURITIES
|
|||||||||||||||||||||||
|
Fair Value Changes Recorded in OCI:
|
|||||||||||||||||||||||
|
Equity securities - U.S. (1), (2)
|
|||||||||||||||||||||||
|
Computer Software and Services
|
$
|
—
|
|
$
|
2,665
|
|
|||||||||||||||||
|
Aerospace/Defense
|
76,512
|
|
75,341
|
|
|||||||||||||||||||
|
Restaurants
|
35,637
|
|
22,456
|
|
|||||||||||||||||||
|
Other
|
572
|
|
558
|
|
|||||||||||||||||||
|
112,721
|
|
101,020
|
|
||||||||||||||||||||
|
Fair Value Changes Recorded in Consolidated Statement of Operations:
|
|||||||||||||||||||||||
|
API Group plc ("API")(1)
|
18,373
|
|
30,841
|
|
$
|
(12,437
|
)
|
$
|
(1,837
|
)
|
$
|
16,859
|
|
||||||||||
|
Barbican Group Holdings Limited ("Barbican")
|
—
|
|
—
|
|
—
|
|
—
|
|
2,108
|
|
|||||||||||||
|
131,094
|
|
131,861
|
|
$
|
(12,437
|
)
|
$
|
(1,837
|
)
|
$
|
18,967
|
|
|||||||||||
|
(B) EQUITY METHOD INVESTMENTS
|
|||||||||||||||||||||||
|
Investments in Associated Companies:
|
December 31, 2014
|
December 31, 2013
|
|||||||||||||||||||||
|
At Cost:
|
Ownership
|
||||||||||||||||||||||
|
CoSine
|
48.3
|
%
|
48.6
|
%
|
5,521
|
|
5,876
|
|
$
|
(405
|
)
|
$
|
(418
|
)
|
$
|
(328
|
)
|
||||||
|
Other (7)
|
5,705
|
|
8,339
|
|
(2,634
|
)
|
(863
|
)
|
—
|
|
|||||||||||||
|
At Fair Value:
|
|||||||||||||||||||||||
|
ModusLink Global Solutions, Inc. ("MLNK") (1)
|
27.7
|
%
|
27.1
|
%
|
54,086
|
|
79,972
|
|
(22,940
|
)
|
23,154
|
|
—
|
|
|||||||||
|
SL Industries, Inc. ("SLI") (1)
|
24.0
|
%
|
24.1
|
%
|
38,799
|
|
26,960
|
|
11,838
|
|
9,053
|
|
1,796
|
|
|||||||||
|
JPS Industries, Inc. ("JPS") (1)
|
38.7
|
%
|
39.3
|
%
|
38,406
|
|
24,129
|
|
14,277
|
|
9,204
|
|
—
|
|
|||||||||
|
Fox & Hound (3)
|
—
|
%
|
50.0
|
%
|
—
|
|
—
|
|
—
|
|
(11,521
|
)
|
(403
|
)
|
|||||||||
|
API Technologies Corp. ("API Tech") (1)
|
20.6
|
%
|
—
|
%
|
24,355
|
|
—
|
|
(3,436
|
)
|
—
|
|
—
|
|
|||||||||
|
Other (3)
|
43.8
|
%
|
43.8
|
%
|
2,163
|
|
2,243
|
|
(79
|
)
|
(823
|
)
|
—
|
|
|||||||||
|
Steel Excel (1)
|
—
|
%
|
55.1
|
%
|
—
|
|
—
|
|
—
|
|
—
|
|
13,139
|
|
|||||||||
|
169,035
|
|
147,519
|
|
$
|
(3,379
|
)
|
$
|
27,786
|
|
$
|
14,204
|
|
|||||||||||
|
Other Investments at Fair Value - Related Party:
|
|||||||||||||||||||||||
|
SPII Liquidating Trust - Series B (Barbican) (3)
|
—
|
|
—
|
|
$
|
—
|
|
$
|
(16
|
)
|
$
|
2,382
|
|
||||||||||
|
SPII Liquidating Trust - Series D ( Fox & Hound)(3)
|
—
|
|
507
|
|
(3
|
)
|
(35
|
)
|
(11,242
|
)
|
|||||||||||||
|
SPII Liquidating Trust - Series G (SPCA) (3), (4)
|
6,811
|
|
5,771
|
|
1,040
|
|
(245
|
)
|
489
|
|
|||||||||||||
|
SPII Liquidating Trust - Series H (SPJSF) (3), (5)
|
2,812
|
|
3,950
|
|
(146
|
)
|
60
|
|
394
|
|
|||||||||||||
|
SPII Liquidating Trust - Series I (3), (6)
|
—
|
|
—
|
|
—
|
|
(35
|
)
|
(352
|
)
|
|||||||||||||
|
9,623
|
|
10,228
|
|
$
|
891
|
|
$
|
(271
|
)
|
$
|
(8,329
|
)
|
|||||||||||
|
(C) OTHER INVESTMENTS
|
|||||||||||||||||||||||
|
ModusLink Warrants (3)
|
2,199
|
|
5,832
|
|
$
|
(3,632
|
)
|
$
|
2,648
|
|
$
|
—
|
|
||||||||||
|
Total Long-Term Investments
|
$
|
311,951
|
|
$
|
295,440
|
|
|||||||||||||||||
(1) Level 1 investment. Equity securities totaling
$112,721
and
$98,355
were classified as Level 1 investments as of
December 31, 2014
and
2013
, respectively.
90
STEEL PARTNERS HOLDINGS L.P.
Notes to Consolidated Financial Statements
(dollars in thousands except per unit data)
(2) Level 2 investment. Equity securities totaling
$0
and
$2,665
were classified as Level 2 investments as of
December 31, 2014
and
2013
, respectively.
(3) Level 3 investment. For additional information related to the Company's Level 3 investments, see Note 6 - "Fair Value Measurements."
(4) Steel Partners China Access I L.P.
(5) Steel Partners Japan Strategic Fund, L.P.
(6) Sold in the second quarter of 2013. See Note 13 - "Related Party Transactions" for additional information.
(7) Represents Steel Excel's investments in a sports business and iGo, Inc. ("iGo") of
40%
and
46.9%
, respectively, at December 31, 2014.
The following table presents activity for the available-for-sale securities presented in the table above for the years ended
December 31, 2014
,
2013
and
2012
:
|
Year Ended December 31,
|
|||||||||||
|
2014
|
2013
|
2012
|
|||||||||
|
(A) AVAILABLE-FOR-SALE SECURITIES
|
|||||||||||
|
Fair Value Changes Recorded in OCI:
|
|||||||||||
|
Proceeds from sales
|
$
|
2,394
|
|
$
|
3,964
|
|
$
|
29,317
|
|
||
|
Gross gains from sales
|
$
|
98
|
|
$
|
1,245
|
|
$
|
2,985
|
|
||
|
Gross losses from sales
|
(16
|
)
|
—
|
|
—
|
|
|||||
|
Net investment gain
|
$
|
82
|
|
$
|
1,245
|
|
$
|
2,985
|
|
||
|
Change in net unrealized holding gains included in other comprehensive income
|
$
|
14,273
|
|
$
|
53,955
|
|
$
|
336
|
|
||
|
Reclassified out of Accumulated other comprehensive income:
|
|||||||||||
|
Unrealized gains
|
$
|
261
|
|
$
|
14,217
|
|
$
|
3,118
|
|
||
|
Unrealized losses
|
—
|
|
(2,632
|
)
|
(828
|
)
|
|||||
|
Total
|
$
|
261
|
|
$
|
11,585
|
|
$
|
2,290
|
|
||
(A) AVAILABLE-FOR-SALE SECURITIES
Fair Value Changes Recorded in OCI
For purposes of determining gross realized gains and losses, the cost of securities sold is based on specific identification. Gross unrealized gains and gross unrealized losses are reported in Accumulated other comprehensive income (loss) in the consolidated balance sheets. In 2013 and 2012 the Company recognized other than temporary impairment losses of approximately
$1,010
and
$829
, respectively related to two available-for-sale securities which are included in Asset impairment charges in the Consolidated Statements of Operations. In January 2015 the Company contributed Nathan’s Famous, Inc. (“Nathan’s”), one if its available -for-sale securities, to CoSine in exchange for additional CoSine equity (see Note - 22 - "Subsequent Events" for additional information).
The cost basis and unrealized gains and losses related to our available for sale securities is as follows:
|
December 31, 2014
|
December 31, 2013
|
||||||||||||||||||||||||
|
Cost
|
Gross Unrealized Gains
|
Gross Unrealized Losses
|
Fair Value
|
Cost
|
Gross Unrealized Gains
|
Gross Unrealized Losses
|
Fair Value
|
||||||||||||||||||
|
Computer Software and Services
|
$
|
—
|
|
$
|
—
|
|
$
|
—
|
|
$
|
—
|
|
$
|
2,312
|
|
$
|
353
|
|
$
|
—
|
|
$
|
2,665
|
|
|
|
Aerospace/Defense
|
11,675
|
|
64,837
|
|
—
|
|
76,512
|
|
11,675
|
|
63,666
|
|
—
|
|
75,341
|
|
|||||||||
|
Restaurants
|
5,974
|
|
29,663
|
|
—
|
|
35,637
|
|
5,974
|
|
16,482
|
|
—
|
|
22,456
|
|
|||||||||
|
Other
|
575
|
|
—
|
|
(3
|
)
|
572
|
|
575
|
|
—
|
|
(17
|
)
|
558
|
|
|||||||||
|
$
|
18,224
|
|
$
|
94,500
|
|
$
|
(3
|
)
|
$
|
112,721
|
|
$
|
20,536
|
|
$
|
80,501
|
|
$
|
(17
|
)
|
$
|
101,020
|
|
||
91
STEEL PARTNERS HOLDINGS L.P.
Notes to Consolidated Financial Statements
(dollars in thousands except per unit data)
Fair Value Changes Recorded in Consolidated Statement of Operations
Available for sale securities also includes the Company's investment in API. In January 2015 the Company contributed this investment to CoSine in exchange for additional CoSine equity (see Note - 22 - "Subsequent Events" for additional information). The investment in Barbican was sold in the fourth quarter of 2012. Changes in the fair value of these investments were reported in the consolidated statement of operations as (Loss) Income from investments held at fair value.
(B) EQUITY METHOD INVESTMENTS
Investments in Associated Companies
The Company’s investments in associated companies are accounted for under the equity method of accounting (see Note 2 - "Summary of Significant Accounting Policies" for additional information). The Company elected to record certain investments under the equity method at fair value beginning on the dates these investments became subject to the equity method of accounting. Associated companies are included in either the Diversified Industrial, Energy or Corporate and Other segments. Certain associated companies have a fiscal year end that differs from December 31. Additional information for each of SPLP's investments in associated companies that have impacted the Consolidated Statement of Operations during
2014
,
2013
or
2012
follows:
Equity Method:
|
•
|
CoSine is currently in the business of seeking to acquire one or more business operations. SPLP recorded
$50
,
$(373)
and
$52
as its share of capital changes for the twelve months ended
December 31, 2014
,
2013
and
2012
, respectively. The aggregate market value of the Company’s interest in CoSine was
$9,559
and
$9,894
at
December 31, 2014
and
2013
, respectively. In January 2015 the Company increased its ownership in CoSine to approximately
80%
. For additional information see Note 22 - "Subsequent Events".
|
|
•
|
Steel Excel has an investment in a sports business and in iGo, a mobile device accessories provider company. These investments are being accounted for under the traditional equity method as associated companies. Based on the closing market price of iGo's publicly-traded shares, the value of the investment in iGo was approximately
$3,400
at December 31, 2014.
|
Equity Method, At Fair Value:
|
•
|
MLNK provides supply chain and logistics services to companies in consumer electronics, communications, computing, medical devices, software, luxury goods and retail. In March 2013, pursuant to an agreement (“Investment Agreement”) between the Company and MLNK, SPLP purchased
7,500,000
shares of MLNK common stock. This investment, plus the MLNK shares already owned by the Company and its subsidiaries, gave the Company a
27.1%
ownership interest in MLNK common stock. Also, at its annual meeting on March 12, 2013, the MLNK shareholders elected two members of SPLP's management team to the MLNK board of directors, one of which serves as chairman.
|
As a result of the foregoing events, SPLP concluded it had significant influence over the operating and financial policies of MLNK and therefore its investment is subject to the equity method of accounting. SPLP elected the fair value option to account for MLNK in order to more appropriately reflect the value of MLNK in its financial statements, and records unrealized gains and losses in earnings. Accordingly the investment, which was previously classified as an available-for-sale security, was reclassified to an associated company as of March 12, 2013. Approximately $
2,900
of unrealized losses were reclassified out of Accumulated other comprehensive income (loss) and recorded in Income (loss) of associated companies, net of taxes in the Consolidated Statement of Operations in the year ended December 31, 2013.
MLNK also issued the Company warrants to purchase an additional
2,000,000
shares at
$5.00
per share. See the "Other Investments" section of this Note for a further description of these warrants and their valuation for financial statement reporting.
In connection with the purchase of the MLNK common stock, SPLP agreed that for a period of
two years
, SPLP and its affiliates' ownership may not exceed
30%
of MLNK’s outstanding common stock in the aggregate, except for any acquisitions of common stock in connection with the exercise of the aforementioned
2,000,000
warrants.
92
STEEL PARTNERS HOLDINGS L.P.
Notes to Consolidated Financial Statements
(dollars in thousands except per unit data)
|
•
|
SLI is a publicly traded company that designs, manufactures and markets power electronics, motion control, power protection, power quality electromagnetic and specialized communication equipment. In 2012, the Company received a dividend of approximately
$2,000
from SLI which is recorded in Investment and other income in the Consolidated Statement of Operations.
|
|
•
|
JPS is a U.S. manufacturer of extruded urethanes, ethylene vinyl acetates and mechanically formed glass and aramid substrate materials for specialty applications in a wide expanse of markets requiring highly engineered components. During the second quarter of 2013, JPS stockholders elected
two
members of SPLP's management team to their board to serve
one
-year terms, one of which will serve as chairman. As a result of the foregoing events, SPLP concluded that it had significant influence over the operating and financial policies of JPS and therefore its investment is subject to the equity method of accounting. Accordingly, the investment in JPS, which was previously classified as an available-for-sale security, was reclassified to an associated company as of June 30, 2013. Approximately
$13,200
of unrealized gains were reclassified out of Accumulated other comprehensive income (loss) and recorded in Income (loss) of associated companies, net of taxes in the Consolidated Statement of Operations in the year ended December 31, 2013.
|
SPLP elected the fair value option to account for JPS in order to more appropriately reflect the value of JPS in its financial statements and records unrealized gains and losses in earnings.
On January 26, 2015, HNH announced its has commenced a tender offer to purchase up to
10,028,724
shares, or approximately
96.5%
of the outstanding shares, of common stock of JPS at a price of
$10.00
per share in cash to all stockholders other than SPLP and with respect to the
4,021,580
JPS shares owned by SPLP, in exchange for common stock of HNH. If all shares are tendered, HNH would exchange approximately
$60,100
in cash and
863,946
shares of its common stock. For additional information see Note 22 - "Subsequent Events".
|
•
|
On December 15, 2013, Fox & Hound filed voluntary petitions for relief under chapter 11 of title 11 of the United States Code in the United States Bankruptcy Court for the District of Delaware. The Bankruptcy Court approved a plan to sell the assets of Fox & Hound and the sale closed on March 12, 2014. The Company did not receive a distribution at the conclusion of the chapter 11 process. The investment in Fox & Hound was recorded under the equity method at fair value. During the third quarter of 2013 the Company wrote its investment down to zero.
|
|
•
|
The Company has an investment in a Japanese real estate partnership. In the second quarter of 2013, the Company reclassified this investment to an associated company. SPLP has elected the fair value option to account for this investment in order to more appropriately reflect the value of the investment in its financial statements and will record future unrealized gains and losses in earnings. Prior to the second quarter of 2013, this investment was accounted for as an investment at cost. During the years ended December 31, 2013 and 2012, due to declines observed in this business, the Company recorded impairments of $
1,510
and $
581
, respectively, which are included in Asset impairment charges in the Consolidated Statements of Operations.
|
|
•
|
In May 2014, Steel Excel increased its holdings of the common stock of API Tech to
20.6%
. API Tech is a designer and manufacturer of high performance systems, subsystems, modules, and components. Effective as of that date, the investment in API Tech has been accounted for as an equity method investment using the fair value option. Steel Excel elected the fair value option to account for its investment in API Tech in order to more appropriately reflect the value of API Tech in its financial statements. Prior to such time, the investment in API Tech was accounted for as an available-for-sale security, and upon the change in classification the Company recognized a loss of approximately
$600
that had previously been included as a component of Accumulated other comprehensive income.
|
|
•
|
During the second quarter of 2012, SPLP acquired an additional
2,227,500
shares of Steel Excel, a publicly traded company. As a result SPLP's ownership increased to
51.1%
of the outstanding shares and Steel Excel became a majority-owned controlled subsidiary (for additional information on the transaction between Steel Excel and BNS, see Note 3 - "Acquisitions").
|
93
STEEL PARTNERS HOLDINGS L.P.
Notes to Consolidated Financial Statements
(dollars in thousands except per unit data)
Associated Company Information
The below summary balance sheet amounts are for the nearest practicable period. The below summary income statement amounts include results for associated companies for the periods in which they were accounted for as an associated company, or the nearest practicable corresponding period. This summary data may be derived from unaudited financial statements and may contain a lag.
|
December 31,
|
|||||||||||
|
2014
|
2013
|
||||||||||
|
Summary of balance sheet amounts:
|
|||||||||||
|
Current assets
|
$
|
556,571
|
|
$
|
477,886
|
|
|||||
|
Noncurrent assets
|
160,202
|
|
179,295
|
|
|||||||
|
Total assets
|
$
|
716,773
|
|
$
|
657,181
|
|
|||||
|
Current liabilities
|
$
|
257,559
|
|
$
|
269,629
|
|
|||||
|
Noncurrent liabilities
|
113,217
|
|
77,260
|
|
|||||||
|
Total liabilities
|
370,776
|
|
346,889
|
|
|||||||
|
Parent equity
|
345,997
|
|
310,292
|
|
|||||||
|
Total liabilities and equity
|
$
|
716,773
|
|
$
|
657,181
|
|
|||||
|
Year Ended December 31,
|
|||||||||||
|
2014
|
2013
|
2012
|
|||||||||
|
Summary income statement amounts:
|
|||||||||||
|
Revenue
|
$
|
1,102,133
|
|
$
|
922,579
|
|
$
|
488,852
|
|
||
|
Gross profit
|
175,793
|
|
152,364
|
|
74,070
|
|
|||||
|
Loss from continuing operations
|
(170
|
)
|
(4,262
|
)
|
(4,788
|
)
|
|||||
|
Net income (loss)
|
7,952
|
|
(5,663
|
)
|
(13,477
|
)
|
|||||
Other Investments at Fair Value - Related Party
Other investments at fair value - related party, consist of the Company’s investment in each series of the SPII Liquidating Trust (see Note 13 - “Related Party Transactions”) accounted for under the equity method. During the year ended December 31, 2014, the Company received approximately
$504
and
$992
in cash distributions from Trusts D and H, respectively. In February 2015, the SPII Liquidating Trust comprising Trust H was fully liquidated (see Note 22 - "Subsequent Events").
The purpose of the SPII Liquidating Trust is to effect the orderly liquidation of certain assets previously held by Steel Partners II, L.P. ("SPII"). SPLP’s financial position, financial performance and cash flows will be affected by the extent to which the operations of the SPII Liquidating Trust results in realized or unrealized gains (losses) and by distributions it makes in each reporting period. The Company holds variable interests in each series of the SPII Liquidating Trust.
Each series of the SPII Liquidating Trust is separate and distinct with respect to its assets, liabilities and net assets. Each individual series has no liability or claim with respect to the liabilities or assets of the other series. Each series shares in the costs, assets and liabilities, if any, that are not specifically attributable to a particular series. Each series generally holds the securities related to a specific investment and cash for operating expenses of the series. The investments in the SPII Liquidating Trust are not redeemable and distributions will be received from the SPII Liquidating Trust as the underlying assets held are sold over a period which is not determinable. There are no unfunded capital commitments with respect to these investments. The fair values for the investments in the SPII Liquidating Trust have been estimated using the net asset value of such interests as reported by the SPII Liquidating Trust.
94
STEEL PARTNERS HOLDINGS L.P.
Notes to Consolidated Financial Statements
(dollars in thousands except per unit data)
The following tables provide combined summarized data with respect to the other investments - related party accounted for under the equity method, at fair value:
|
December 31,
|
|||||||||||
|
2014
|
2013
|
||||||||||
|
Summary of balance sheet amounts:
|
|||||||||||
|
Total assets
|
$
|
21,996
|
|
$
|
23,412
|
|
|||||
|
Total liabilities
|
—
|
|
(34
|
)
|
|||||||
|
Net Asset Value
|
$
|
21,996
|
|
$
|
23,378
|
|
|||||
|
Year Ended December 31,
|
|||||||||||
|
2014
|
2013
|
2012
|
|||||||||
|
Summary income statement amounts:
|
|||||||||||
|
Net increase (decrease) in net assets from operations
|
$
|
2,038
|
|
$
|
(1,077
|
)
|
$
|
(18,996
|
)
|
||
(C) OTHER INVESTMENTS
In connection with the acquisition of ModusLink common shares in March 2013, the Company received warrants ("ModusLink Warrants") to acquire an additional
2,000,000
shares at an exercise price of
$5.00
per share. The ModusLink Warrants are accounted for as an asset at fair value with changes in fair value recognized each period in (Loss) Income from investments at fair value in the Company's Consolidated Statements of operations. The warrants have a life of
5 years
and were valued using the Black-Scholes option pricing model. Assumptions used in the current valuation were as follows: 1) volatility of
53.2%
2) term of approximately
3.2
years 3) risk free interest rate of
1.65%
based on the U.S. Treasury bill yield, and 4) an expected dividend of
$0
.
LIMITED PARTNERSHIP INVESTMENT AND PROMISSORY NOTE
In July 2013, Steel Excel invested
$25,000
in a cost-method investment in a limited partnership that co-invested with other private investment funds in a public company. Such investment had an approximate fair value of
$28,600
and
$26,000
at
December 31, 2014
and
2013
, respectively, based on the net asset value included in the monthly statement it receives from the partnership. Steel Excel's other investments at
December 31, 2014
, also include investments in
two
venture capital funds totaling
$500
and a promissory note with an amortized cost of
$3,000
, which approximates fair value at
December 31, 2014
. These amounts are included in Other non-current assets in the Company's Consolidated Balance Sheets.
6. FAIR VALUE MEASUREMENTS
Financial assets and liabilities measured at fair value on a recurring basis in the consolidated financial statements as of
December 31, 2014
and
2013
are summarized by type of inputs applicable to the fair value measurements as follows:
|
December 31, 2014
|
Level 1
|
Level 2
|
Level 3
|
Total
|
|||||||||||
|
Assets:
|
|||||||||||||||
|
Marketable securities (a)
|
$
|
93,768
|
|
$
|
10,793
|
|
$
|
33,896
|
|
$
|
138,457
|
|
|||
|
Long-term investments (a)
|
286,740
|
|
—
|
|
13,985
|
|
300,725
|
|
|||||||
|
Investments in certain funds
|
—
|
|
—
|
|
525
|
|
525
|
|
|||||||
|
Precious metal and commodity inventories recorded at fair value
|
13,249
|
|
—
|
|
—
|
|
13,249
|
|
|||||||
|
Commodity contracts on precious metal and commodity inventories
|
764
|
|
—
|
|
—
|
|
764
|
|
|||||||
|
Total
|
$
|
394,521
|
|
$
|
10,793
|
|
$
|
48,406
|
|
$
|
453,720
|
|
|||
|
Liabilities:
|
|||||||||||||||
|
Financial instruments
|
$
|
—
|
|
$
|
21,311
|
|
$
|
—
|
|
$
|
21,311
|
|
|||
|
Interest rate swap agreement
|
—
|
|
138
|
|
—
|
|
138
|
|
|||||||
|
Total
|
$
|
—
|
|
$
|
21,449
|
|
$
|
—
|
|
$
|
21,449
|
|
|||
95
STEEL PARTNERS HOLDINGS L.P.
Notes to Consolidated Financial Statements
(dollars in thousands except per unit data)
|
December 31, 2013
|
Level 1
|
Level 2
|
Level 3
|
Total
|
|||||||||||
|
Assets:
|
|||||||||||||||
|
Marketable securities (a)
|
$
|
139,786
|
|
$
|
15,334
|
|
$
|
23,365
|
|
$
|
178,485
|
|
|||
|
Long-term investments (a)
|
209,168
|
|
53,754
|
|
18,303
|
|
281,225
|
|
|||||||
|
Investments in certain funds
|
—
|
|
—
|
|
844
|
|
844
|
|
|||||||
|
Precious metal and commodity inventories recorded at fair value
|
14,766
|
|
—
|
|
—
|
|
14,766
|
|
|||||||
|
Commodity contracts on precious metals and commodity inventories
|
1,620
|
|
—
|
|
—
|
|
1,620
|
|
|||||||
|
Total
|
$
|
365,340
|
|
$
|
69,088
|
|
$
|
42,512
|
|
$
|
476,940
|
|
|||
|
Liabilities:
|
|||||||||||||||
|
Financial instruments
|
$
|
—
|
|
$
|
25,090
|
|
$
|
—
|
|
$
|
25,090
|
|
|||
|
Interest rate swap agreement
|
—
|
|
214
|
|
—
|
|
214
|
|
|||||||
|
Total
|
$
|
—
|
|
$
|
25,304
|
|
$
|
—
|
|
$
|
25,304
|
|
|||
(a) For additional detail of the marketable securities and long-term investments see Note 5 - "Investments."
During the twelve months ended December 31, 2014, investments with a fair value of
$58,666
were transferred from Level 2 to Level 1 based upon change in trading volume.
The fair value of the Company's financial instruments, such as cash and cash equivalents, trade and other receivables and trade payables, approximate carrying value due to the short-term maturities of these assets and liabilities. Carrying cost approximates fair value for long-term debt which has variable interest rates.
The precious metal and commodity inventories associated with HNH's fair value hedges (see Note 7 - "Financial Instruments") are reported at fair value. Fair value of these inventories is based on quoted market prices on commodity exchanges and are considered Level 1 measurements. The derivative instruments that HNH purchases in connection with its precious metal and commodity inventories, specifically commodity futures and forwards contracts, are also valued at fair value. The futures contracts are Level 1 measurements since they are traded on a commodity exchange. The forward contracts are entered into with a counterparty and are considered Level 2 measurements.
Interest rate swap agreements are considered Level 2 measurements as the inputs are observable at commonly quoted intervals. Prior to the redemption of the Subordinated Notes and related Warrants, the embedded derivative features of the Subordinated Notes and Warrants (see Note 14 - "Debt and Capital Lease Obligations") were valued at fair value on a recurring basis and were considered Level 3 measurements.
96
STEEL PARTNERS HOLDINGS L.P.
Notes to Consolidated Financial Statements
(dollars in thousands except per unit data)
Following is a summary of changes in financial assets measured using Level 3 inputs:
|
Long - Term Investments
|
|||||||||||||||||||||||
|
Investments in Associated Companies (a)
|
Other Investments - Related Party (b)
|
ModusLink Warrants (c)
|
Marketable Securities and Other (d)
|
Other Investments
|
Total
|
||||||||||||||||||
|
Assets
|
|||||||||||||||||||||||
|
Balance at December 31, 2011
|
$
|
—
|
|
$
|
42,653
|
|
$
|
—
|
|
$
|
—
|
|
$
|
13,623
|
|
$
|
56,276
|
|
|||||
|
Purchases
|
10,923
|
|
—
|
|
—
|
|
2,804
|
|
—
|
|
13,727
|
|
|||||||||||
|
Sales
|
—
|
|
(23,061
|
)
|
—
|
|
—
|
|
(15,731
|
)
|
(38,792
|
)
|
|||||||||||
|
Unrealized gains
|
—
|
|
3,265
|
|
—
|
|
—
|
|
2,108
|
|
5,373
|
|
|||||||||||
|
Unrealized losses
|
(402
|
)
|
(11,594
|
)
|
—
|
|
—
|
|
—
|
|
(11,996
|
)
|
|||||||||||
|
Balance at December 31, 2012
|
$
|
10,521
|
|
$
|
11,263
|
|
$
|
—
|
|
$
|
2,804
|
|
$
|
—
|
|
$
|
24,588
|
|
|||||
|
Additions - fair value elections in 2013
|
3,065
|
|
—
|
|
—
|
|
—
|
|
—
|
|
3,065
|
|
|||||||||||
|
Purchases
|
1,000
|
|
—
|
|
3,184
|
|
45,383
|
|
—
|
|
49,567
|
|
|||||||||||
|
Sales
|
—
|
|
(764
|
)
|
—
|
|
(23,034
|
)
|
—
|
|
(23,798
|
)
|
|||||||||||
|
Realized gain on sale
|
—
|
|
—
|
|
—
|
|
1,556
|
|
—
|
|
1,556
|
|
|||||||||||
|
Unrealized gains
|
—
|
|
60
|
|
3,578
|
|
—
|
|
—
|
|
3,638
|
|
|||||||||||
|
Unrealized losses
|
(12,343
|
)
|
(331
|
)
|
(930
|
)
|
(2,500
|
)
|
—
|
|
(16,104
|
)
|
|||||||||||
|
Balance at December 31, 2013
|
2,243
|
|
10,228
|
|
5,832
|
|
24,209
|
|
—
|
|
42,512
|
|
|||||||||||
|
Purchases
|
—
|
|
—
|
|
—
|
|
13,294
|
|
—
|
|
13,294
|
|
|||||||||||
|
Sales
|
—
|
|
(1,496
|
)
|
—
|
|
(5,001
|
)
|
—
|
|
(6,497
|
)
|
|||||||||||
|
Realized loss on sale
|
—
|
|
—
|
|
—
|
|
(129
|
)
|
—
|
|
(129
|
)
|
|||||||||||
|
Unrealized gains
|
—
|
|
2,411
|
|
99
|
|
2,048
|
|
—
|
|
4,558
|
|
|||||||||||
|
Unrealized losses
|
(80
|
)
|
(1,520
|
)
|
(3,732
|
)
|
—
|
|
—
|
|
(5,332
|
)
|
|||||||||||
|
Balance at December 31, 2014
|
$
|
2,163
|
|
$
|
9,623
|
|
$
|
2,199
|
|
$
|
34,421
|
|
$
|
—
|
|
$
|
48,406
|
|
|||||
(a) Unrealized losses are recorded in (Loss) Income of associated companies, net of taxes in the Company's Consolidated Statements of Operations.
(b) Unrealized gains and losses are recorded in Income (Loss) from other investments-related party in the Company's Consolidated Statements of Operations.
(c) Unrealized gains and losses are recorded in (Loss) Income from investments held at fair value in the Company's Consolidated Statements of Operations.
(d) Realized gains and losses on sale is recorded in Other income, net in the Company's Consolidated Statements of Operations.
Level 3 Liabilities
During the year ended December 31, 2013, the Company recognized a
$184
decrease in fair value for the derivative features of the HNH Subordinated notes. As of December 31, 2014 and December 31, 2013, the Company did not hold any financial liabilities that are measured using Level 3 inputs.
Long-Term Investments - Valuation Techniques
The Company primarily uses two valuation methods to estimate the fair value of its equity securities measured using Level 3 inputs. The Company estimates the value of its investments in associated companies primarily using a discounted cash flow method adjusted for additional information related to debt covenants, solvency issues, etc. The Company estimates the value of Other investments - related party, which represents its interest in the SPII Liquidating Trust, based on the net asset value of each series of the Trust. The ModusLink Warrants are valued using the Black-Scholes option pricing model (for additional information see Note 5 - "Investments").
Marketable Securities and Other - Valuation Techniques
97
STEEL PARTNERS HOLDINGS L.P.
Notes to Consolidated Financial Statements
(dollars in thousands except per unit data)
The Company uses the net asset value included in quarterly statements it receives in arrears from a venture capital fund to determine the fair value of such fund. The Company determines the fair value of certain corporate securities and corporate obligations by incorporating and reviewing prices provided by third-party pricing services based on the specific features of the underlying securities.
Assets Measured at Fair Value on a Nonrecurring Basis
The Company’s non-financial assets measured at fair value in
2014
and
2013
on a non-recurring basis include the assets acquired and liabilities assumed in the acquisitions described in Note 3 – “Acquisitions”. Significant judgments and estimates are made to determine the acquisition date fair values which may include the use of appraisals, discounted cash flow techniques or other information the Company considers relevant to the fair value measurement. See Note 2 - "Summary of Significant Accounting Policies" for discussion on significant estimates and impairment testing.
As of
December 31, 2014
and
2013
, WebBank has impaired loans of
$458
of which
$4
is guaranteed by the USDA or SBA and
$2,564
, of which
$2,196
is guaranteed by the USDA or SBA, respectively. These loans are measured at fair value on a nonrecurring basis using Level 3 inputs. See the Impaired Loans section of Note 8 - "Trade, Other and Loans Receivable" for additional discussion of loan impairment measurements.
7. FINANCIAL INSTRUMENTS
Financial instrument liabilities and related restricted cash consist of the following:
|
December 31, 2014
|
December 31, 2013
|
||||||
|
Foreign currency financial instruments
|
$
|
—
|
|
$
|
25,090
|
|
|
|
Short sales of corporate securities
|
21,311
|
|
—
|
|
|||
|
$
|
21,311
|
|
$
|
25,090
|
|
||
Activity is summarized below for financial instrument liabilities and related restricted cash:
|
Year Ended December 31,
|
||||||||
|
2014
|
2013
|
|||||||
|
Balance, beginning of period
|
$
|
25,090
|
|
$
|
24,742
|
|
||
|
Settlement of foreign currency financial instruments
|
(24,429
|
)
|
—
|
|
||||
|
Short sales of corporate securities
|
19,467
|
|
—
|
|
||||
|
Net investment losses
|
1,006
|
|
174
|
|
||||
|
Receipt of dividends, net of interest expense
|
177
|
|
203
|
|
||||
|
Other
|
—
|
|
(29
|
)
|
||||
|
Balance of financial instrument liabilities and related restricted cash, end of period
|
$
|
21,311
|
|
$
|
25,090
|
|
||
Foreign Currency Exchange Rate Risk
Financial instruments include
$25,090
at
December 31, 2013
, of amounts payable in foreign currencies which are subject to the risk of exchange rate changes. The foreign currency financial liabilities were settled in the fourth quarter of 2014. These financial instruments resulted from transactions entered into for risk management purposes, were collateralized by an equivalent amount that was included in restricted cash. These liabilities were accounted for at fair value on the balance sheet date with changes in fair value reported in the consolidated statement of operations included in Net investment gains (losses). The financial instruments payable in foreign currencies were entered into with a counterparty and were considered Level 2 measurements. The liabilities were not designated as hedging instruments. The foreign currency financial instrument liabilities at
December 31, 2013
were as follows:
98
STEEL PARTNERS HOLDINGS L.P.
Notes to Consolidated Financial Statements
(dollars in thousands except per unit data)
|
December 31, 2013
|
||||||
|
Currency
|
Carrying Amount
|
Notional Amount
|
||||
|
Japanese Yen
|
$
|
1,374
|
|
¥144,717
|
||
|
Pound Sterling
|
23,716
|
|
£14,311
|
|||
|
Total
|
$
|
25,090
|
|
|||
Short Sales of Corporate Securities
In 2014, Steel Excel entered into short sale transactions on certain corporate securities in which Steel Excel received proceeds from the sale of such securities and incurred obligations to deliver such securities at a later date. Upon initially entering into such short sale transactions Steel Excel recognizes a liability equal to the fair value of the obligation, with a comparable amount of cash and cash equivalents reclassified as restricted cash. Subsequent changes in the fair value of such obligations, determined based on the closing market price of the securities, are recognized currently as gains or losses, with a comparable adjustment made between unrestricted and restricted cash.
Precious Metal and Commodity Inventories
As of
December 31, 2014
, HNH had the following outstanding futures contracts with settlement dates ranging from
February 2015
to
March 2015
. There were no forward contracts outstanding at December 31, 2014.
|
Commodity
|
Amount
|
Notional Value
|
||
|
Silver
|
675,000 ounces
|
$
|
10,500
|
|
|
Gold
|
200 ounces
|
$
|
200
|
|
|
Copper
|
300,000 pounds
|
$
|
800
|
|
|
Tin
|
35 metric tons
|
$
|
700
|
|
Of the total futures contracts outstanding,
610,000
ounces of silver and substantially all of the copper contracts are designated and accounted for as fair value hedges. The remaining outstanding futures contracts for silver, and all of the contracts
for gold and tin, are accounted for as economic hedges.
The futures contracts are exchange traded contracts acquired through a third party broker. Accordingly, HNH has determined that there is minimal credit risk of default. HNH estimates the fair value of its derivative contracts through the use of market quotes or broker valuations when market information is not available. HNH maintains collateral on account with the third-party broker. Such collateral consists of both cash that varies in amount depending on the value of open futures contracts, as well as ounces of precious metal held on account by the broker.
Debt Agreements
As discussed in Note 14 - "Debt and Capital Lease Obligations," Handy & Harman Group Ltd. ("H&H Group") has entered into two interest rate swap agreements to reduce its exposure to interest rate fluctuations.
HNH's Subordinated Notes had call premiums as well as Warrants associated with them. HNH treated the fair value of these features together as both a discount on the debt and a derivative liability at inception of the loan agreement. The discount was being amortized over the life of the notes as an adjustment to interest expense, and the derivative was marked to market at each balance sheet date. As discussed in Note 14 - "Debt and Capital lease Obligations," on March 26, 2013, HNH discharged its obligations associated with the Subordinated Notes and Warrants, and therefore, all discounts and derivative accounts related to the Subordinated Notes and Warrants are now zero.
Fair Value of Derivative Instruments in the Consolidated Balance Sheets:
99
STEEL PARTNERS HOLDINGS L.P.
Notes to Consolidated Financial Statements
(dollars in thousands except per unit data)
|
December 31,
|
||||||||||
|
Derivative
|
Balance Sheet Location
|
2014
|
2013
|
|||||||
|
Commodity contracts (a), (b)
|
Prepaid and other current assets
|
$
|
667
|
|
$
|
1,778
|
|
|||
|
Commodity contracts (a)
|
Prepaid and other current assets/Accrued liabilities
|
$
|
97
|
|
$
|
(158
|
)
|
|||
|
Interest rate swap agreements
|
Other current liabilities
|
$
|
(138
|
)
|
$
|
(214
|
)
|
|||
(a) Carrying amount equals fair value.
(b) Designated as hedging instruments as of
December 31, 2014
.
Effect of derivative instruments on the Consolidated Statements of Operations:
|
Year Ended December 31,
|
||||||||||||||
|
2014
|
2013
|
2012
|
||||||||||||
|
Derivative
|
Statement of Operations Location
|
Gain (loss)
|
Gain (loss)
|
Gain (loss)
|
||||||||||
|
Commodity contracts (a)
|
Cost of goods sold
|
$
|
2,655
|
|
$
|
2,620
|
|
$
|
—
|
|
||||
|
Commodity contracts
|
Cost of goods sold
|
131
|
|
(92
|
)
|
—
|
|
|||||||
|
Commodity contracts
|
Realized and unrealized gain on derivatives
|
1,307
|
|
1,988
|
|
521
|
|
|||||||
|
Interest rate swap agreements
|
Interest expense
|
(156
|
)
|
(328
|
)
|
—
|
|
|||||||
|
Derivative features of subordinated notes
|
Realized and unrealized (loss) gain on derivatives
|
—
|
|
(793
|
)
|
831
|
|
|||||||
|
Total derivatives
|
$
|
3,937
|
|
$
|
3,395
|
|
$
|
1,352
|
|
|||||
(a) Designated as hedging instruments as of
December 31, 2014
.
Financial Instruments with Off-Balance Sheet Risk
WebBank is a party to financial instruments with off-balance sheet risk. In the normal course of business, these financial instruments include commitments to extend credit in the form of loans as part of WebBank’s lending arrangements. Those instruments involve to varying degrees, elements of credit and interest rate risk in excess of the amount recognized on the balance sheet. The contract amounts of those instruments reflect the extent of involvement WebBank has in particular classes of financial instruments.
At
December 31, 2014
and
2013
, WebBank’s undisbursed loan commitments totaled
$82,788
and
$28,011
, respectively. Commitments to extend credit are agreements to lend to a borrower who meets the lending criteria through one of the Bank’s lending agreements, provided there is no violation of any condition established in the contract with the counterparty to the lending arrangement.
Commitments generally have fixed expiration dates or other termination clauses and may require payment of a fee. Since certain of the commitments are expected to expire without the credit being extended, the total commitment amounts do not necessarily represent future cash requirements. WebBank evaluates each prospective borrower’s credit worthiness on a case-by-case basis. The amount of collateral obtained if deemed necessary by WebBank upon extension of credit is based on management's credit evaluation of the borrower and WebBank’s counterparty.
WebBank’s exposure to credit loss in the event of nonperformance by the other party to the financial instrument for commitments to extend credit is represented by the contractual amount of those instruments. WebBank uses the same credit policy in making commitments and conditional obligations as it does for on-balance sheet instruments.
WebBank estimates an allowance for potential losses on off-balance sheet contingent credit exposures related to the guaranteed amount of its SBA and USDA loans and whether or not the SBA/USDA honors the guarantee. WebBank determines the allowance for these contingent credit exposures based on historical experience and portfolio analysis. The allowance is included with other liabilities in the consolidated balance sheet, with any related increases or decreases in the reserve included in the statement of income. The allowance was
$188
and
$465
at
December 31, 2014
and
2013
, respectively, and is included within Other current liabilities in the consolidated balance sheets. Increases or decreases in the allowance are included in Selling, general and administrative expenses in the consolidated statements of operations. The amount included in Selling,
100
STEEL PARTNERS HOLDINGS L.P.
Notes to Consolidated Financial Statements
(dollars in thousands except per unit data)
general and administrative expenses for credit losses on off-balance sheet contingent credit exposure was a benefit of
$277
,
$175
and
$440
for the years ended
December 31, 2014
,
2013
and
2012
, respectively.
8. TRADE, OTHER AND LOANS RECEIVABLE
Trade and Other Receivables
|
December 31,
2014 |
December 31,
2013 |
||||||
|
Trade and other receivables (net of allowance for doubtful accounts of $2,149 in 2014 and $1,981 in 2013)
|
$
|
85,553
|
|
$
|
82,963
|
|
|
|
Other receivables
|
1,887
|
|
5,677
|
|
|||
|
Total
|
$
|
87,440
|
|
$
|
88,640
|
|
|
Loans Receivable
Major classification of WebBank’s loans receivable at
December 31, 2014
and
2013
are as follows:
|
Total
|
Current
|
Non-current
|
|||||||||||||||||||||||||||
|
December 31, 2014
|
%
|
December 31, 2013
|
%
|
December 31, 2014
|
December 31, 2013
|
December 31, 2014
|
December 31, 2013
|
||||||||||||||||||||||
|
Real estate loans:
|
|||||||||||||||||||||||||||||
|
Commercial - owner occupied
|
$
|
1,650
|
|
1
|
%
|
$
|
4,671
|
|
6
|
%
|
$
|
96
|
|
$
|
197
|
|
$
|
1,554
|
|
$
|
4,474
|
|
|||||||
|
Commercial – other
|
264
|
|
—
|
%
|
242
|
|
—
|
%
|
—
|
|
—
|
|
264
|
|
242
|
|
|||||||||||||
|
Total real estate loans
|
1,914
|
|
1
|
%
|
4,913
|
|
6
|
%
|
96
|
|
197
|
|
1,818
|
|
4,716
|
|
|||||||||||||
|
Commercial and industrial
|
75,706
|
|
64
|
%
|
46,702
|
|
61
|
%
|
1,142
|
|
1,462
|
|
74,564
|
|
45,240
|
|
|||||||||||||
|
Loans held for sale
|
40,886
|
|
35
|
%
|
25,125
|
|
33
|
%
|
40,886
|
|
25,125
|
|
—
|
|
—
|
|
|||||||||||||
|
Total loans
|
118,506
|
|
100
|
%
|
76,740
|
|
100
|
%
|
42,124
|
|
26,784
|
|
76,382
|
|
49,956
|
|
|||||||||||||
|
Less:
|
|||||||||||||||||||||||||||||
|
Deferred fees and discounts
|
(20
|
)
|
—
|
|
(20
|
)
|
—
|
|
—
|
|
—
|
|
|||||||||||||||||
|
Allowance for loan losses
|
(557
|
)
|
(424
|
)
|
(557
|
)
|
(424
|
)
|
—
|
|
—
|
|
|||||||||||||||||
|
Total loans receivable, net (a)
|
$
|
117,929
|
|
$
|
76,316
|
|
$
|
41,547
|
|
$
|
26,360
|
|
$
|
76,382
|
|
$
|
49,956
|
|
|||||||||||
(a) The carrying value is considered to be representative of fair value because the rates of interest are not significantly different from market interest rates for instruments with similar maturities. The fair value of loans receivable, net was
$117,346
and
$76,303
at
December 31, 2014
and
2013
, respectively.
Allowance for Loan Losses
The Allowance for Loan Losses (“ALLL”) represents an estimate of probable and estimable losses inherent in the loan portfolio as of the balance sheet date. Losses are charged to the ALLL when incurred. Generally, commercial loans are charged off or charged down at the point at which they are determined to be uncollectible in whole or in part, or when
180
days past due unless the loan is well secured and in the process of collection. The amount of the ALLL is established by analyzing the portfolio at least quarterly and a provision for or reduction of loan losses is recorded so that the ALLL is at an appropriate level at the balance sheet date.
The methodologies used to estimate the ALLL depend upon the impairment status and portfolio segment of the loan. Loan groupings are created for each loan class, and are then graded against historical and industry loss rates.
After applying historic loss experience, the quantitatively derived level of ALLL is reviewed for each segment using qualitative criteria is performed. Various risk factors are tracked that influence judgment regarding the level of the ALLL across the portfolio segments. Primary qualitative factors that may be reflected in the quantitative models include:
•
Asset quality trends
•
Risk management and loan administration practices
•
Risk identification practices
•
Effect of changes in the nature and volume of the portfolio
101
STEEL PARTNERS HOLDINGS L.P.
Notes to Consolidated Financial Statements
(dollars in thousands except per unit data)
•
Existence and effect of any portfolio concentrations
•
National economic and business conditions
•
Regional and local economic and business conditions
•
Data availability and applicability
Changes in these factors are reviewed to ensure that changes in the level of the ALLL are consistent with changes in these factors. The magnitude of the impact of each of these factors on the qualitative assessment of the ALLL changes from quarter to quarter according to the extent these factors are already reflected in historic loss rates and according to the extent these factors diverge from one another. Also considered is the uncertainty inherent in the estimation process when evaluating the ALLL.
Changes in the allowance for loan losses are summarized as follows:
|
Real Estate
|
||||||||||||||||||||
|
Commercial - Owner Occupied
|
Commercial - Other
|
Commercial & Industrial
|
Unallocated
|
Total
|
||||||||||||||||
|
December 31, 2012
|
$
|
187
|
|
$
|
34
|
|
$
|
64
|
|
$
|
—
|
|
285
|
|
||||||
|
Charge-offs
|
—
|
|
—
|
|
(64
|
)
|
—
|
|
(64
|
)
|
||||||||||
|
Recoveries
|
22
|
|
44
|
|
217
|
|
—
|
|
283
|
|
||||||||||
|
Provision
|
(132
|
)
|
(50
|
)
|
102
|
|
—
|
|
(80
|
)
|
||||||||||
|
December 31, 2013
|
77
|
|
28
|
|
319
|
|
—
|
|
424
|
|
||||||||||
|
Charge-offs
|
—
|
|
—
|
|
(3
|
)
|
—
|
|
(3
|
)
|
||||||||||
|
Recoveries
|
66
|
|
40
|
|
80
|
|
—
|
|
186
|
|
||||||||||
|
Provision
|
(79
|
)
|
(56
|
)
|
85
|
|
—
|
|
(50
|
)
|
||||||||||
|
December 31, 2014
|
$
|
64
|
|
$
|
12
|
|
$
|
481
|
|
$
|
—
|
|
$
|
557
|
|
|||||
The ALLL and outstanding loan balances according to the Company’s impairment method are summarized as follows:
|
Real Estate
|
||||||||||||||||
|
December 31, 2014
|
Commercial - Owner Occupied
|
Commercial - Other
|
Commercial & Industrial
|
Total
|
||||||||||||
|
Allowance for loan losses:
|
||||||||||||||||
|
Individually evaluated for impairment
|
$
|
—
|
|
$
|
—
|
|
$
|
52
|
|
$
|
52
|
|
||||
|
Collectively evaluated for impairment
|
64
|
|
12
|
|
429
|
|
505
|
|
||||||||
|
Total
|
$
|
64
|
|
$
|
12
|
|
$
|
481
|
|
$
|
557
|
|
||||
|
Outstanding Loan balances:
|
||||||||||||||||
|
Individually evaluated for impairment (1)
|
$
|
374
|
|
$
|
—
|
|
$
|
84
|
|
$
|
458
|
|
||||
|
Collectively evaluated for impairment
|
1,276
|
|
264
|
|
75,622
|
|
77,162
|
|
||||||||
|
Total
|
$
|
1,650
|
|
$
|
264
|
|
$
|
75,706
|
|
$
|
77,620
|
|
||||
(1)
$4
is guaranteed by the USDA or SBA.
102
STEEL PARTNERS HOLDINGS L.P.
Notes to Consolidated Financial Statements
(dollars in thousands except per unit data)
|
Real Estate
|
||||||||||||||||
|
December 31, 2013
|
Commercial - Owner Occupied
|
Commercial - Other
|
Commercial & Industrial
|
Total
|
||||||||||||
|
Allowance for loan losses:
|
||||||||||||||||
|
Individually evaluated for impairment
|
$
|
—
|
|
$
|
—
|
|
$
|
—
|
|
$
|
—
|
|
||||
|
Collectively evaluated for impairment
|
77
|
|
28
|
|
319
|
|
424
|
|
||||||||
|
Total
|
$
|
77
|
|
$
|
28
|
|
$
|
319
|
|
$
|
424
|
|
||||
|
Outstanding Loan balances:
|
||||||||||||||||
|
Individually evaluated for impairment (1)
|
$
|
2,426
|
|
$
|
—
|
|
$
|
138
|
|
$
|
2,564
|
|
||||
|
Collectively evaluated for impairment
|
2,245
|
|
242
|
|
46,564
|
|
49,051
|
|
||||||||
|
Total
|
$
|
4,671
|
|
$
|
242
|
|
$
|
46,702
|
|
$
|
51,615
|
|
||||
(1)
$2,196
is guaranteed by the USDA or SBA.
Nonaccrual and Past Due Loans
Loans are generally placed on nonaccrual status when payment in full of principal and interest is not expected, or the loan is
90
days or more past due as to principal or interest, unless the loan is both well secured and in the process of collection.
A nonaccrual loan may be returned to accrual status when all delinquent interest and principal become current in accordance with the terms of the loan agreement; and the loan, if secured, is well secured; the borrower has paid according to the contractual terms for a minimum of
six
months; and analysis of the borrower indicates a reasonable assurance of the ability to maintain payments. Payments received on nonaccrual loans are applied as a reduction to the principal outstanding.
Loans are reported as past due when either principal or interest is due and unpaid for a period of
30
days or more. Loans past due
90
days or more and still accruing interest were
$52
and
$0
at
December 31, 2014
and
2013
, respectively.
Nonaccrual loans are summarized as follows:
|
December 31,
2014 |
December 31,
2013 |
||||||
|
Real Estate Loans:
|
|||||||
|
Commercial - Owner Occupied
|
$
|
374
|
|
$
|
402
|
|
|
|
Total Real Estate Loans
|
374
|
|
402
|
|
|||
|
Commercial and Industrial
|
16
|
|
109
|
|
|||
|
Total Loans
|
$
|
390
|
|
$
|
511
|
|
|
Past due loans (accruing and nonaccruing) are summarized as follows:
|
December 31, 2014
|
Current
|
30-89 days
past due |
90+ days
past due |
Total
past due (2) |
Total
loans |
Recorded
investment in accruing loans 90+ days past due |
Nonaccrual
loans that are current (1) |
|||||||||||||||||||||
|
Real Estate Loans:
|
||||||||||||||||||||||||||||
|
Commercial - Owner Occupied
|
$
|
1,228
|
|
$
|
49
|
|
$
|
373
|
|
$
|
422
|
|
$
|
1,650
|
|
$
|
—
|
|
$
|
—
|
|
|||||||
|
Commercial - Other
|
264
|
|
—
|
|
—
|
|
—
|
|
264
|
|
—
|
|
—
|
|
||||||||||||||
|
Total Real Estate Loans
|
1,492
|
|
49
|
|
373
|
|
422
|
|
1,914
|
|
—
|
|
—
|
|
||||||||||||||
|
Commercial and Industrial
|
75,635
|
|
3
|
|
68
|
|
71
|
|
75,706
|
|
52
|
|
—
|
|
||||||||||||||
|
Total Loans
|
$
|
77,127
|
|
$
|
52
|
|
$
|
441
|
|
$
|
493
|
|
$
|
77,620
|
|
$
|
52
|
|
$
|
—
|
|
|||||||
(1) Represents nonaccrual loans that are not past due more than 30 days; however, full payment of principal and interest is still not expected.
(2)
$4
is guaranteed by the USDA or SBA.
103
STEEL PARTNERS HOLDINGS L.P.
Notes to Consolidated Financial Statements
(dollars in thousands except per unit data)
|
December 31, 2013
|
Current
|
30-89 days
past due |
90+ days
past due |
Total
past due (2) |
Total
loans |
Recorded
investment in accruing loans 90+ days past due |
Nonaccrual
loans that are current (1) |
|||||||||||||||||||||
|
Real Estate Loans:
|
||||||||||||||||||||||||||||
|
Commercial - Owner Occupied
|
$
|
4,668
|
|
$
|
—
|
|
$
|
3
|
|
$
|
3
|
|
$
|
4,671
|
|
$
|
—
|
|
$
|
399
|
|
|||||||
|
Commercial - Other
|
242
|
|
—
|
|
—
|
|
—
|
|
242
|
|
—
|
|
—
|
|
||||||||||||||
|
Total Real Estate Loans
|
4,910
|
|
—
|
|
3
|
|
3
|
|
4,913
|
|
—
|
|
399
|
|
||||||||||||||
|
Commercial and Industrial
|
46,536
|
|
57
|
|
109
|
|
166
|
|
46,702
|
|
—
|
|
—
|
|
||||||||||||||
|
Total Loans
|
$
|
51,446
|
|
$
|
57
|
|
$
|
112
|
|
$
|
169
|
|
$
|
51,615
|
|
$
|
—
|
|
$
|
399
|
|
|||||||
(1) Represents nonaccrual loans that are not past due more than 30 days; however, full payment of principal and interest is still not expected.
(2)
$90
is guaranteed by the USDA or SBA.
Credit Quality Indicators
In addition to the past due and nonaccrual criteria, loans are analyzed using a loan grading system. Generally, internal grades are assigned to loans based on financial/statistical models and loan officer judgment. The Company reviews and grades all loans with unpaid principal balances of
$100
or more once per year. Grades follow definitions of Pass, Special Mention, Substandard, and Doubtful. The definitions of Pass, Special Mention, Substandard, and Doubtful are summarized as follows:
|
•
|
Pass
: A Pass asset is a higher quality asset and does not fit any of the other categories described below. The likelihood of loss is considered remote.
|
|
•
|
Special Mention
: A receivable in this category has a specific weakness or problem but does not currently present a significant risk of loss or default as to any material term of the loan or financing agreement.
|
|
•
|
Substandard
: A substandard receivable has a developing or currently minor weakness or weaknesses that could result in loss or default if deficiencies are not corrected or adverse conditions arise.
|
|
•
|
Doubtful
: A doubtful receivable has an existing weakness or weaknesses that have developed into a serious risk of significant loss or default with regard to a material term of the financing agreement.
|
Outstanding loan balances (accruing and nonaccruing) categorized by these credit quality indicators are summarized as follows:
|
December 31, 2014
|
Pass
|
Special
Mention |
Sub-
standard (1) |
Doubtful
|
Total loans
|
|||||||||||||||
|
Real Estate Loans:
|
||||||||||||||||||||
|
Commercial - Owner Occupied
|
$
|
1,258
|
|
$
|
19
|
|
$
|
373
|
|
—
|
|
$
|
1,650
|
|
||||||
|
Commercial - Other
|
264
|
|
—
|
|
—
|
|
—
|
|
264
|
|
||||||||||
|
Total Real Estate Loans
|
1,522
|
|
19
|
|
373
|
|
—
|
|
1,914
|
|
||||||||||
|
Commercial and Industrial
|
74,439
|
|
1,183
|
|
84
|
|
—
|
|
75,706
|
|
||||||||||
|
Total Loans
|
$
|
75,961
|
|
$
|
1,202
|
|
$
|
457
|
|
$
|
—
|
|
$
|
77,620
|
|
|||||
(1)
$4
is guaranteed by the USDA or SBA.
104
STEEL PARTNERS HOLDINGS L.P.
Notes to Consolidated Financial Statements
(dollars in thousands except per unit data)
|
December 31, 2013
|
Pass
|
Special
Mention |
Sub-
standard (1) |
Doubtful
|
Total loans
|
|||||||||||||||
|
Real Estate Loans:
|
||||||||||||||||||||
|
Commercial - Owner Occupied
|
2,246
|
|
—
|
|
2,425
|
|
—
|
|
4,671
|
|
||||||||||
|
Commercial - Other
|
242
|
|
—
|
|
—
|
|
—
|
|
242
|
|
||||||||||
|
Total Real Estate Loans
|
2,488
|
|
—
|
|
2,425
|
|
—
|
|
4,913
|
|
||||||||||
|
Commercial and Industrial
|
44,176
|
|
2,387
|
|
139
|
|
—
|
|
46,702
|
|
||||||||||
|
Total Loans
|
$
|
46,664
|
|
$
|
2,387
|
|
$
|
2,564
|
|
$
|
—
|
|
$
|
51,615
|
|
|||||
(1)
$2,196
is guaranteed by the USDA or SBA.
Impaired Loans
Loans are considered impaired when, based on current information and events, it is probable that WebBank will be unable to collect all amounts due according to the contractual terms of the loan agreement, including scheduled interest payments. When loans are impaired, an estimate of the amount of the balance that is impaired is made and a specific reserve is assigned to the loan based on the estimated present value of the loan’s future cash flows discounted at the loan’s effective interest rate, the observable market price of the loan, or the fair value of the loan’s underlying collateral less the cost to sell. When the impairment is based on amount on the fair value of the loan’s underlying collateral, the portion of the balance that is impaired is charged off, such that these loans do not have a specific reserve in the ALLL. Payments received on impaired loans that are accruing are recognized in interest income, according to the contractual loan agreement. The Bank recognized
$60
,
$121
, and
$215
on impaired loans for the years ended December 31, 2014, 2013, and 2012, respectively.
Payments received on impaired loans that are on nonaccrual are not recognized in interest income, but are applied as a reduction to the principal outstanding. Payments are recognized when cash is received.
Information on impaired loans is summarized as follows:
|
Recorded investment
|
||||||||||||||||||||||||
|
December 31, 2014
|
Unpaid principle
balance |
with no
allowance |
with
allowance |
Total recorded
investment (1) |
Related
Allowance |
Average recorded
investment |
||||||||||||||||||
|
Real Estate Loans:
|
||||||||||||||||||||||||
|
Commercial - Owner Occupied
|
$
|
430
|
|
$
|
374
|
|
$
|
—
|
|
$
|
374
|
|
$
|
—
|
|
$
|
750
|
|
||||||
|
Total Real Estate Loans
|
430
|
|
374
|
|
—
|
|
374
|
|
—
|
|
750
|
|
||||||||||||
|
Commercial and Industrial
|
193
|
|
28
|
|
56
|
|
84
|
|
52
|
|
131
|
|
||||||||||||
|
Total Loans
|
$
|
623
|
|
$
|
402
|
|
$
|
56
|
|
$
|
458
|
|
$
|
52
|
|
$
|
881
|
|
||||||
(1)
$4
is guaranteed by the USDA or SBA.
|
Recorded investment
|
||||||||||||||||||||||||
|
December 31, 2013
|
Unpaid principal
balance |
with no
allowance |
with
allowance |
Total recorded
investment (1) |
Related
Allowance |
Average recorded
investment |
||||||||||||||||||
|
Real Estate Loans:
|
||||||||||||||||||||||||
|
Commercial - Owner Occupied
|
$
|
2,626
|
|
$
|
2,425
|
|
$
|
—
|
|
$
|
2,425
|
|
$
|
—
|
|
$
|
2,555
|
|
||||||
|
Total Real Estate Loans
|
2,626
|
|
2,425
|
|
—
|
|
2,425
|
|
—
|
|
2,555
|
|
||||||||||||
|
Commercial and Industrial
|
354
|
|
129
|
|
10
|
|
139
|
|
—
|
|
150
|
|
||||||||||||
|
Total Loans
|
$
|
2,980
|
|
$
|
2,554
|
|
$
|
10
|
|
$
|
2,564
|
|
$
|
—
|
|
$
|
2,705
|
|
||||||
(1)
$2,196
is guaranteed by the USDA or SBA.
105
STEEL PARTNERS HOLDINGS L.P.
Notes to Consolidated Financial Statements
(dollars in thousands except per unit data)
9. INVENTORIES, NET
A summary of Inventories, net is as follows:
|
December 31,
2014 |
December 31,
2013 |
||||||
|
Finished products
|
$
|
24,424
|
|
$
|
20,378
|
|
|
|
In – process
|
10,310
|
|
8,111
|
|
|||
|
Raw materials
|
12,346
|
|
11,904
|
|
|||
|
Fine and fabricated precious metal in various stages of completion
|
17,094
|
|
19,802
|
|
|||
|
64,174
|
|
60,195
|
|
||||
|
LIFO reserve
|
(90
|
)
|
(136
|
)
|
|||
|
Total
|
$
|
64,084
|
|
$
|
60,059
|
|
|
Fine and Fabricated Precious Metal Inventory
In order to produce certain of its products, HNH purchases, maintains and utilizes
precious
metal inventory. HNH records certain
precious
metal inven
tory at the lower of last-in, first-out ("LIFO") cost or market, with any adjustments recorded through cost of goods sold. Remaining precious metal inventory is accounted for primarily at fair value.
Certain customers and suppliers of HNH choose to do business on a “pool” basis, and furnish
precious
metal to HNH for return in fabricated form (“customer metal”) or for purchase from or return to the supplier. When the customer metal is returned in fabricated form, the customer is charged a fabrication charge. The value of this customer metal is not included in the Company’s Consolidated Balance Sheets. To the extent HNH is able to utilize customer precious metal in its production process, such customer metals replaces the need for HNH to purchase its own inventory. As of
December 31, 2014
, customer metal in H&H's custody consisted of
191,217
ounces of silver,
518
ounces of gold, and
1,392
ounces of palladium. As of
December 31, 2013
, HNH’s customer metal consisted of
247,103
ounces of silver,
576
ounces of gold, and
1,392
ounces of palladium.
|
December 31,
2014 |
December 31,
2013 |
||||||
|
Supplemental inventory information:
|
|||||||
|
Precious metals stated at LIFO cost
|
$
|
4,839
|
|
$
|
5,978
|
|
|
|
Precious metals stated under non-LIFO cost methods, primarily at fair value
|
12,165
|
|
13,687
|
|
|||
|
Market value per ounce:
|
|||||||
|
Silver
|
15.75
|
|
19.49
|
|
|||
|
Gold
|
1,199.25
|
|
1,201.50
|
|
|||
|
Palladium
|
798.00
|
|
711.00
|
|
|||
10. PROPERTY, PLANT AND EQUIPMENT, NET
A summary of property, plant and equipment, net is as follows:
|
December 31,
2014 |
December 31,
2013 |
||||||
|
Land
|
$
|
9,523
|
|
$
|
9,690
|
|
|
|
Buildings and improvements
|
53,742
|
|
51,966
|
|
|||
|
Machinery, equipment and other
|
194,356
|
|
169,169
|
|
|||
|
Construction in progress
|
4,738
|
|
5,035
|
|
|||
|
262,359
|
|
235,860
|
|
||||
|
Accumulated depreciation and amortization
|
(78,045
|
)
|
(53,752
|
)
|
|||
|
Net property, plant and equipment
|
$
|
184,314
|
|
$
|
182,108
|
|
|
Depreciation expense was
$24,745
,
$20,036
and
$15,876
for the
twelve
months ended
December 31, 2014
,
2013
and
2012
, respectively.
106
STEEL PARTNERS HOLDINGS L.P.
Notes to Consolidated Financial Statements
(dollars in thousands except per unit data)
11. GOODWILL AND OTHER INTANGIBLE ASSETS, NET
A reconciliation of the change in the carrying value of goodwill is as follows:
|
December 31, 2014
|
|||||||||||||||
|
Diversified
|
Energy
|
Corporate
|
Total
|
||||||||||||
|
Balance at beginning of year
|
|||||||||||||||
|
Gross Goodwill
|
$
|
26,260
|
|
$
|
64,790
|
|
$
|
81
|
|
$
|
91,131
|
|
|||
|
Accumulated impairments
|
—
|
|
(3,769
|
)
|
—
|
|
(3,769
|
)
|
|||||||
|
Net Goodwill
|
26,260
|
|
61,021
|
|
81
|
|
87,362
|
|
|||||||
|
Acquisitions
|
—
|
|
—
|
|
—
|
|
—
|
|
|||||||
|
Impairment
|
—
|
|
(41,450
|
)
|
—
|
|
(41,450
|
)
|
|||||||
|
Currency translation adjustment
|
(37
|
)
|
—
|
|
—
|
|
(37
|
)
|
|||||||
|
Other adjustments (b)
|
76
|
|
—
|
|
—
|
|
76
|
|
|||||||
|
Balance at end of period
|
|
|
|
|
|||||||||||
|
Gross Goodwill
|
26,299
|
|
64,790
|
|
81
|
|
91,170
|
|
|||||||
|
Accumulated impairments
|
—
|
|
(45,219
|
)
|
—
|
|
(45,219
|
)
|
|||||||
|
Net Goodwill
|
$
|
26,299
|
|
$
|
19,571
|
|
$
|
81
|
|
$
|
45,951
|
|
|||
In connection with its annual goodwill impairment test and the adverse effects of the recent developments in the oil
services industry, the Company recognized an impairment charge of
$41,450
in the fourth quarter of 2014 related to the goodwill associated with its Energy segment. The impairment resulted from the adverse effects the decline in energy prices had on the oil services industry and the projected results of operations of the Energy segment. The fair values of the reporting units used in determining the goodwill impairment were based on valuations using a combination of the income approach (discounted cash flows) and the market approach (guideline public company method and guideline transaction method).
|
December 31, 2013
|
|||||||||||||||
|
Diversified
|
Energy
|
Corporate
|
Total
|
||||||||||||
|
Balance at beginning of year
|
|||||||||||||||
|
Gross Goodwill
|
$
|
8,531
|
|
$
|
47,408
|
|
$
|
81
|
|
$
|
56,020
|
|
|||
|
Accumulated impairments
|
—
|
|
(192
|
)
|
—
|
|
(192
|
)
|
|||||||
|
Net Goodwill
|
8,531
|
|
47,216
|
|
81
|
|
55,828
|
|
|||||||
|
Acquisitions
|
18,169
|
|
17,382
|
|
—
|
|
35,551
|
|
|||||||
|
Impairment (a)
|
—
|
|
(3,577
|
)
|
—
|
|
(3,577
|
)
|
|||||||
|
Currency translation adjustment
|
14
|
|
—
|
|
—
|
|
14
|
|
|||||||
|
Other adjustments (b)
|
(454
|
)
|
—
|
|
—
|
|
(454
|
)
|
|||||||
|
Balance at end of year
|
|||||||||||||||
|
Gross Goodwill
|
26,260
|
|
64,790
|
|
81
|
|
91,131
|
|
|||||||
|
Accumulated impairments
|
—
|
|
(3,769
|
)
|
—
|
|
(3,769
|
)
|
|||||||
|
Net Goodwill
|
$
|
26,260
|
|
$
|
61,021
|
|
$
|
81
|
|
$
|
87,362
|
|
|||
(a) Represents an impairment related to one of Steel Excel's sports businesses recorded in Income (Loss) from discontinued operations, net of taxes in the 2013 Consolidated Statement of Operations .
(b) Represents final purchase price allocation adjustments, including a final working capital adjustment, associated with the prior year HNH acquisition of W.P. Hickman Company. For additional information, see Note 3 - "Acquisitions."
107
STEEL PARTNERS HOLDINGS L.P.
Notes to Consolidated Financial Statements
(dollars in thousands except per unit data)
A summary of other intangible assets is as follows:
|
December 31, 2014
|
December 31, 2013
|
||||||||||||||||||||||
|
Gross Carrying Amount
|
Accumulated Amortization
|
Net
|
Gross Carrying Amount
|
Accumulated Amortization
|
Net
|
||||||||||||||||||
|
Product and customer relationships
|
$
|
113,952
|
|
$
|
29,726
|
|
$
|
84,226
|
|
$
|
113,114
|
|
$
|
19,824
|
|
$
|
93,290
|
|
|||||
|
Trademarks
|
28,803
|
|
5,856
|
|
22,947
|
|
28,785
|
|
3,813
|
|
24,972
|
|
|||||||||||
|
Patents and technology
|
16,773
|
|
6,023
|
|
10,750
|
|
16,398
|
|
4,627
|
|
11,771
|
|
|||||||||||
|
Other
|
2,426
|
|
1,799
|
|
627
|
|
2,609
|
|
1,521
|
|
1,088
|
|
|||||||||||
|
$
|
161,954
|
|
$
|
43,404
|
|
$
|
118,550
|
|
$
|
160,906
|
|
$
|
29,785
|
|
$
|
131,121
|
|
||||||
Trademarks with indefinite lives as of
December 31, 2014
and
2013
were
$8,020
. Amortization expense related to intangible assets was
$13,693
,
$10,954
and
$8,874
for the
twelve
months ended
December 31, 2014
,
2013
and
2012
, respectively.
The estimated amortization expense for each of the five succeeding years and thereafter is as follows:
|
Products and
|
||||||||||||
|
Customer
|
Patents and
|
|||||||||||
|
Relationships
|
Trademarks
|
Technology
|
Other
|
|||||||||
|
2015
|
$
|
9,530
|
|
$
|
2,025
|
|
$
|
1,297
|
|
$
|
546
|
|
|
2016
|
9,190
|
|
2,016
|
|
1,297
|
|
35
|
|
||||
|
2017
|
8,810
|
|
1,339
|
|
1,297
|
|
24
|
|
||||
|
2018
|
8,438
|
|
905
|
|
1,297
|
|
22
|
|
||||
|
2019
|
6,204
|
|
747
|
|
1,297
|
|
—
|
|
||||
|
Thereafter
|
42,054
|
|
7,895
|
|
4,265
|
|
—
|
|
||||
|
Total
|
$
|
84,226
|
|
$
|
14,927
|
|
$
|
10,750
|
|
$
|
627
|
|
108
STEEL PARTNERS HOLDINGS L.P.
Notes to Consolidated Financial Statements
(dollars in thousands except per unit data)
12. BANK DEPOSITS
A summary of WebBank deposits is as follows:
|
December 31,
2014 |
December 31,
2013 |
||||||
|
Time deposits year of maturity:
|
|||||||
|
2014
|
$
|
—
|
|
$
|
47,372
|
|
|
|
2015
|
27,001
|
|
14,284
|
|
|||
|
2016
|
50,386
|
|
13,625
|
|
|||
|
2017
|
26,671
|
|
—
|
|
|||
|
Total time deposits
|
104,058
|
|
75,281
|
|
|||
|
Money market deposits
|
60,802
|
|
42,925
|
|
|||
|
Total deposits (a)
|
$
|
164,860
|
|
$
|
118,206
|
|
|
|
Current
|
$
|
87,804
|
|
$
|
87,319
|
|
|
|
Long-term
|
77,056
|
|
30,887
|
|
|||
|
Total deposits
|
$
|
164,860
|
|
$
|
118,206
|
|
|
|
Time deposit accounts under $100
|
$
|
86,274
|
|
$
|
63,515
|
|
|
|
Time deposit accounts $100 and over
|
17,784
|
|
11,766
|
|
|||
|
Total time deposits
|
$
|
104,058
|
|
$
|
75,281
|
|
|
(a) The carrying value is considered to be representative of fair value because the rates of interest are not significantly different from market interest rates for instruments with similar maturities. The fair value of Deposits was
$165,381
and
$118,698
at
December 31, 2014
and
2013
, respectively.
13. RELATED PARTY TRANSACTIONS
Management Agreement with SP General Services LLC
The Manager receives a fee at an annual rate of
1.5%
of total partner’s capital ("Management Fee"), payable on the first day of each quarter and subject to quarterly adjustment. In addition, SPLP issued to the Manager partnership profits interests in the form of incentive units, which will be classified as Class C common units of SPLP upon the attainment of certain specified performance goals by SPLP which are determined as of the last day of each fiscal year (see Note 16 - "Capital and Accumulated other Comprehensive Income" for additional information on the incentive units). The Management Agreement, which was amended in January 2015 (see Note 22 - "Subsequent Events"), is automatically renewed each December 31 for successive
one
-year terms unless otherwise determined at least
60
days prior to each renewal date by a majority of the independent directors. For the
twelve
months ended
December 31, 2014
,
2013
and
2012
, the Manager earned a Management Fee of
$8,775
,
$8,178
and
$7,412
, respectively, which is recorded in Selling, general and administrative expenses in the Company's Consolidated Statements of Operations. Unpaid amounts for management fees included in Payable to related parties were
$0
and
$2,049
at
December 31, 2014
and
2013
, respectively.
SPLP will bear (or reimburse the Manager with respect to) all its reasonable costs and expenses of the managed entities, the Manager, SPH GP or their affiliates, including but not limited to: legal, tax, accounting, auditing, consulting, administrative, compliance, investor relations costs related to being a public entity rendered for SPLP or SPH GP as well as expenses incurred by the Manager and SPH GP which are reasonably necessary for the performance by the Manager of its duties and functions under the Management Agreement and certain other expenses incurred by managers, officers, employees and agents of the Manager or its affiliates on behalf of SPLP. The Manager incurred
$3,100
,
$1,310
and
$1,179
of reimbursable expenses during the
twelve
months ended
December 31, 2014
,
2013
and
2012
, respectively, in connection with its provision of services under the Management Agreement. Unpaid amounts for reimbursable expenses were
$1,504
and
$477
at
December 31, 2014
and
2013
, respectively, and are included in Payable to related parties.
109
STEEL PARTNERS HOLDINGS L.P.
Notes to Consolidated Financial Statements
(dollars in thousands except per unit data)
Corporate Services
SPH Services, a subsidiary of SPLP, was created to consolidate the executive and corporate functions of the Company and certain of its affiliates, and to provide such services to SPLP and other portfolio companies. SP Corporate Services LLC ("SP Corporate"), through management services agreements with these companies, provides services which include assignment of C-Level management personnel, as well as a variety of services including legal, tax, accounting, treasury, consulting, auditing, administrative, compliance, environmental health and safety, human resources, marketing, investor relations and other similar services. The fees payable under these agreements are initially based on the level of services expected to be provided. They are subject to annual review and adjustment and are approved by the respective company's board of directors. The agreements automatically renew for successive one-year periods unless and until terminated in accordance with agreement. Under certain circumstances, the termination may result in payment of a termination fee to SP Corporate.
Consolidated companies that have agreements with SP Corporate include HNH, Steel Excel, SPLP, DGT, WebBank and BNS. Annual amounts to be billed to these companies are
$8,885
,
$8,038
,
$3,000
,
$476
,
$250
and
$204
, respectively, and are eliminated in consolidation.
In addition to its servicing agreements with SPLP and its consolidated subsidiaries, SP Corporate has management services agreements with other companies considered to be related parties, including CoSine, NOVT, Ore Holdings, Inc., J. Howard Inc., SL Industries, Inc., Steel Partners, Ltd. and iGo. In total, SP Corporate will charge approximately
$1,721
annually to these companies. Effective January 1, 2015 SP Corporate entered into a management services agreement with MLNK and WebFinancial Holding Corporation (see Note - 22 "Subsequent Events").
SPII Liquidating Trust
SPLP holds interests in the SPII Liquidating Trust, an entity that holds certain investments which it acquired in connection with the Exchange Transaction, which the Manager and its affiliate serve as the manager and liquidating trustee, respectively, without compensation other than reimbursement for out-of-pocket expenses. The SPII Liquidating Trust has an investment in Steel Partners Japan Strategic Fund, L.P. and in Steel Partners China Access I L.P. See Note 5 -
"Investments" for additional information.
In 2013, the SPII Liquidating Trust sold its remaining investments comprising Trust I to a related party, Steel Partners Ltd. The Company received proceeds of
$764
representing its proportionate interest in the Trust. There was no gain or loss on the transaction.
Mutual Securities
Pursuant to the Management Agreement, the Manager was responsible for selecting executing brokers. Securities transactions for SPLP are allocated to brokers on the basis of reliability and best price and execution. The Manager has selected Mutual Securities as an introducing broker and may direct a substantial portion of the managed entities’ trades to such firm among others. An officer of the Manager and SPH GP is affiliated with Mutual Securities. The Manager only uses Mutual Securities when such use would not compromise the Manager’s obligation to seek best price and execution. SPLP has the right to pay commissions to Mutual Securities, which are higher than those that can be obtained elsewhere, provided that the Manager believes that the rates paid are competitive institutional rates. Mutual Securities also served as an introducing broker for SPLP’s trades. The Commissions paid by SPLP to Mutual securities were approximately
$352
,
$310
and
$239
for the
twelve
months ended
December 31, 2014
,
2013
and
2012
, respectively. Such commissions are included in the net investment gains (losses) in the consolidated statements of operations. The portion of the commission paid to Mutual Securities ultimately received by such officer is net of clearing and other charges.
Other
On March 31, 2012, Steel Partners, Ltd. assigned its rights, obligations and title to its New York City office lease to SPH Services. In connection with the assignment, Steel Partners, Ltd. agreed to remit
$3,286
to SPH Services, subject to adjustment, which represents the present value of the lease payment obligations over the fair value of the leased facilities. The remaining amount of this lease payment obligation is included in Other liabilities in the Consolidated Balance Sheets as of
December 31, 2014
and 2013. In addition, for a total consideration of
$1,203
, Steel Partners, Ltd. sold to SPH Services the fixed assets held by it relating to the New York City location, which includes furniture, equipment and leasehold improvements and the Company agreed to reimburse Steel Partners, Ltd.
$254
for occupancy costs for the three months ended March 31, 2012. Both of these amounts were paid to Steel Partners, Ltd in the third quarter of 2012.
110
STEEL PARTNERS HOLDINGS L.P.
Notes to Consolidated Financial Statements
(dollars in thousands except per unit data)
SPLP has an arrangement whereby it holds an asset on behalf of a related party in which it has an investment. The asset had a fair value of
$34,280
and
$28,515
at
December 31, 2014
and
2013
, respectively. Under the terms of this arrangement, the related party is the sole beneficiary and SPLP does not have an economic interest in the asset and SPLP has no capital at risk with respect to such asset, other than indirectly through its indirect investment in such related party. No amounts related to this arrangement are recorded on the Consolidated balance sheet. For the
twelve
months ended
December 31, 2014
and
2013
, SPLP was indirectly compensated for providing this arrangement by the payment of a fee. The fees were not material.
The Company’s non-management directors receive an annual retainer of
$150
, of which
$75
is paid in cash and
$75
is paid in restricted common units of SPLP. The restricted units vest over a
three
year period. These directors are also paid fees of
$1
for each board committee meeting attended. The chairmen of the Audit Committee, Corporate Governance and Nominating Committee and Compensation Committee are paid an additional fee of
$60
(effective May 1, 2013),
$5
and
$5
annually, respectively. For the
twelve
months ended
December 31, 2014
,
2013
and
2012
non-management directors’ fees expensed were
$931
,
$855
and
$570
, respectively. Unpaid non-management directors’ fees are included in Payable to related parties and were
$46
and
$46
at
December 31, 2014
and
2013
, respectively.
At
December 31, 2014
and
2013
, several related parties and consolidated subsidiaries had deposits totaling
$14,875
and
$19,229
, respectively, in WebBank.
$12,391
and
$17,195
of these deposits have been eliminated in consolidation as of
December 31, 2014
and
2013
, respectively. The deposits held at WebBank earned
$104
,
$159
and
$146
in interest for the years ended
December 31, 2014
,
2013
and 2012, respectively.
$89
,
$150
and
$112
of this interest has been eliminated in consolidation.
SPLP has an estimated liability of
$116
as of
December 31, 2014
and
2013
included in other current liabilities which, pursuant to the Amended Exchange Agreement, is indemnified by Steel Partners II (Onshore) LP (“SPII Onshore”). As a result, the Company recorded an amount receivable from SPII Onshore reported as Receivable from related parties in the Company's Consolidated Balance Sheets.
Deferred Fee Liability to Related Party
Pursuant to an assignment and assumption agreement effective as of July 15, 2009, SPLP assumed from Steel Partners II (Offshore) Ltd. (“SPII Offshore”), an entity previously affiliated with SPII, a liability due WGL Capital Corp. (the "Investment Manager") an affiliate of the Manager, pursuant to a deferred fee agreement (the “Deferred Fee Liability”), in the amount of
$51,594
. In exchange for assuming the liability, SPLP received consideration of equal value from SPII Offshore comprised of
$4,487
in cash and
2,725,533
common units of SPLP (valued at
$17.28
per common unit as determined in connection with the implementation of the Exchange Transaction) which are held by SPLP as treasury units.
The amount of the Deferred Fee Liability was indexed to the value of SPLP. The deferred fee was a fair value liability and increased or decreased quarterly by the same percentage as the increase or decrease in the index. The Deferred Fee Liability increased
$11,448
in the year ended December 31, 2012, and is reported in the consolidated statements of operations as Deferred fee liability to related party-increase. On April 11, 2012 (the "Termination Date"), the Company and the Investment Manager terminated the Investor Services Agreement by mutual consent. Instead of receiving the deferred fee in cash, the Investment Manager elected for the total amount to be paid in common units of the Company. For additional information see Note 16 - "Capital and Accumulated Other Comprehensive Income." In December 2014, SPLP assumed an additional liability due to the Investment Manager of approximately
$1,800
, and received consideration of an equal amount of cash from SPII Offshore for final settlement of the Deferred Fee Liability. The liability is included in Payable to related parties in the Company's Consolidated Balance Sheet as of December 31, 2014.
Investment Manager
SPLP was a party to an investor services agreement (the “Investor Services Agreement”) through April 11, 2012, the day in which the Company and the Investment Manager terminated the Investor Services Agreement by mutual consent - See "
Deferred Fee Liability to Related Party"
section above. Pursuant to the Investor Services Agreement, the Investment Manager performed certain investor relations services on SPLP’s behalf and SPLP paid the Investment Manager a fee in an amount of
$50
per year (the “Investor Services Fee”). The Management Fee payable to the Manager pursuant to the Management Agreement was offset and reduced on each payment date by the amount of the Investor Services Fee payable to the Investment Manager. The Investment Manager earned an Investor Services Fee of
$13
for the
twelve
months ended
December 31, 2012
.
111
STEEL PARTNERS HOLDINGS L.P.
Notes to Consolidated Financial Statements
(dollars in thousands except per unit data)
Debt and capital lease obligations consists of the following:
|
December 31,
2014 |
December 31,
2013 |
||||||
|
Short term debt:
|
|||||||
|
Foreign
|
$
|
602
|
|
$
|
304
|
|
|
|
3/4% Convertible Senior Subordinated Notes
|
—
|
|
346
|
|
|||
|
Total short-term debt
|
602
|
|
650
|
|
|||
|
Long-term debt:
|
|||||||
|
HNH Senior Term Loans
|
—
|
|
116,000
|
|
|||
|
Steel Excel Term Loan
|
79,285
|
|
92,500
|
|
|||
|
HNH Revolving facilities
|
193,375
|
|
30,950
|
|
|||
|
SPLP Revolving facility
|
33,788
|
|
—
|
|
|||
|
Other debt - domestic
|
8,014
|
|
8,280
|
|
|||
|
Foreign loan facilities
|
1,412
|
|
1,658
|
|
|||
|
Subtotal
|
315,874
|
|
249,388
|
|
|||
|
Less portion due within one year
|
19,592
|
|
26,033
|
|
|||
|
Long-term debt
|
296,282
|
|
223,355
|
|
|||
|
Total debt
|
$
|
316,476
|
|
$
|
250,038
|
|
|
|
Capital lease facility
|
|||||||
|
Current portion of capital lease
|
$
|
486
|
|
$
|
953
|
|
|
|
Long-term portion of capital lease
|
288
|
|
734
|
|
|||
|
$
|
774
|
|
$
|
1,687
|
|
||
Long-term debt obligations as of
December 31, 2014
matures in each of the next five years as follows:
|
Total
|
2015
|
2016
|
2017
|
2018
|
2019
|
Thereafter
|
||||||||||||||||||||
|
Long-term debt
|
$
|
315,874
|
|
$
|
19,592
|
|
$
|
14,712
|
|
$
|
48,552
|
|
$
|
39,643
|
|
$193,375
|
$
|
—
|
|
|||||||
SPLP Revolving Credit Facility
On December 15, 2014 the Company amended its Credit Agreement (the “Amended Credit Facility”) with PNC Bank, National Association (“PNC”), as administrative agent for the lenders thereunder. The Amended Credit Facility will provide for a revolving credit facility with borrowing availability of up to
$75,000
and will provide additional flexibility to allow one or more new lenders to join and become a party to the Amended Credit Facility with a minimum revolving credit commitment amount of not less than
$10,000
, and not to exceed a total commitment of
$100,000
. Amounts outstanding under the Amended Credit Facility bear interest at
LIBOR
plus
1.25%
, and are collateralized by first priority security interests of certain of the Company's deposit accounts and publicly traded securities. The interest rate on the Amended Credit Facility was
1.7%
as of
December 31, 2014
. The Amended Credit Facility requires a commitment fee to be paid on unused borrowings and also contains customary affirmative and negative covenants, including a minimum cash balance covenant, restrictions against the payment of dividends and customary events of default. Any amounts outstanding under the Amended Credit Facility are due and payable in full on October 23, 2017.
The Amended Credit Facility also includes provisions for the issuance of letters of credit up to
$10,000
, with any such issuances reducing total borrowing availability. There were no letters of credit outstanding at December 31, 2014.
In April 2014, the Company borrowed
$47,500
under the Amended Credit Facility in connection with a tender offer for its common units (see Note 16 - "Capital and Accumulated Other Comprehensive Income"). The amount outstanding under the Credit Facility was
$33,788
and
$0
as of
December 31, 2014
and
2013
, respectively.
112
STEEL PARTNERS HOLDINGS L.P.
Notes to Consolidated Financial Statements
(dollars in thousands except per unit data)
HNH Debt
Senior Credit Facility
On August 29, 2014, H&H Group, a wholly owned subsidiary of HNH, entered into amended and restated senior credit facility ("Senior Credit Facility") which provides for an up to
$365,000
senior secured revolving credit facility, including a
$20,000
sublimit for the issuance of letters of credit and a
$20,000
sublimit for the issuance of swing loans. On November 24, 2014, H&H Group, entered into an amendment to its Senior Credit Facility, solely for the purpose of modifying and clarifying the definition of the term "Guarantee." Borrowings under the Senior Credit Facility bear interest at H&H Group's option, at either
LIBOR
or the
Base Rate
, as defined, plus an applicable margin as set forth in a the loan agreement (
2.25%
and
1.25%
, respectively, for
LIBOR
and
Base Rate
borrowings at December 31, 2014), and the revolving facility provides for a commitment fee to be paid on unused borrowings. The weighted average interest rate on the revolving facility was
2.46%
at December 31, 2014. At December 31, 2014, letters of credit totaling
$3,000
had been issued under the Senior Credit Facility, including
$2,900
of the letters of credit guaranteeing various insurance activities, and
$100
for environmental and other matters. H&H Group's availability under the Senior Credit Facility was
$101,000
as of December 31, 2014.
The Senior Credit Facility will expire, with remaining outstanding balances due and payable, on August 29, 2019. The Senior Credit Facility is guaranteed by substantially all existing and thereafter acquired or created domestic and Canadian wholly-owned subsidiaries of H&H Group, and obligations under the Senior Credit Facility are collateralized by first priority security
interests in and liens upon all present and future assets of H&H Group and these subsidiaries, which approximated
$353,000
at December 31, 2014. The Senior Credit Facility restricts H&H Group's ability to transfer cash or other assets to HNH, subject to certain exceptions including required pension payments to the WHX Corporation Pension Plan ("WHX Pension Plan"). The Senior Credit Facility is subject to certain mandatory prepayment provisions and restrictive and financial covenants, which include a maximum ratio limit on Total Leverage and a minimum ratio limit on Fixed Charge Coverage, as defined, as well as a minimum liquidity level. HNH was in compliance with all debt covenants at
December 31, 2014
.
HNH's prior senior credit facility, as amended, consisted of a revolving credit facility in an aggregate principal amount not to exceed
$110,000
and a senior term loan. On August 5, 2014, this agreement was further amended to, among other things permit a new
$40,000
term loan and permit H&H Group to make a distribution to HNH of up to
$80,000
. The revolving facility provided for a commitment fee to be paid on unused borrowings. Borrowings under the senior credit facility bore interest, at H&H Group's option, at a rate based on
LIBOR
or the
Base Rate
, as defined, plus an applicable margin as set forth in the loan agreement. On August 29, 2014, all amounts outstanding under this agreement were repaid.
Interest Rate Swap Agreements
In connection with lending requirements under the Senior Credit Facility, H&H Group entered into an interest rate swap agreement in February 2013 to reduce its exposure to interest rate fluctuations. Under the interest rate swap, HNH receives
one-month
LIBOR in exchange for a fixed interest rate of
0.569%
over the life of the agreement on an initial
$56,400
notional amount of debt, with the notional amount decreasing by
$1,100
,
$1,800
and
$2,200
per quarter in 2013, 2014 and 2015, respectively. The agreement expires in February 2016. In connection with the amendments made to the Senior Credit Facility in connection with the Wolverine Joining acquisition, H&H Group entered into a second interest rate swap agreement in June 2013 to reduce its exposure to interest rate fluctuations. Under the interest rate swap, HNH receives
one-month LIBOR
in exchange for a fixed interest rate of
0.598%
over the life of the agreement on an initial
$5,000
notional amount of debt, with the notional amount decreasing by
$100
,
$200
and
$200
per quarter in 2013, 2014 and 2015, respectively. The agreement expires in February 2016.
WHX CS Loan
On June 3, 2014, WHX CS Corp., a wholly-owned subsidiary of HNH, entered into a credit agreement ("WHX CS Loan"), which provided for a term loan facility with borrowing availability of up to a maximum aggregate principal amount of
$15,000
. The amounts outstanding under the WHX CS Loan bore interest at
LIBOR
plus
1.25%
. On August 29, 2014, the WHX CS Loan was terminated and all outstanding amounts thereunder were repaid.
Subordinated Notes
On March 26, 2013, H&H Group instructed Wells Fargo Bank, National Association ("Wells Fargo"), as trustee and collateral agent, to deliver an irrevocable notice of H&H Group's election to redeem all of its outstanding
10%
Subordinated Secured Notes ("Subordinated Notes") to the holders of the Subordinated Notes. Pursuant to the terms of that certain amended
113
STEEL PARTNERS HOLDINGS L.P.
Notes to Consolidated Financial Statements
(dollars in thousands except per unit data)
and restated indenture, dated as of December 13, 2010, as amended ("Indenture"), by and among H&H Group, the guarantors named therein and Wells Fargo, as trustee and collateral agent, H&H Group has instructed Wells Fargo to redeem, on April 25, 2013, approximately
$31,800
principal amount of Subordinated Notes, representing all of the outstanding Subordinated Notes, at a redemption price equal to
112.6%
of the principal amount and accrued but unpaid payment-in-kind-interest thereof, plus accrued and unpaid cash interest. As indicated above, the Subordinated Notes were part of a unit , and accordingly the Warrants which comprised a portion of the Units were also redeemed. On March 26, 2013, H&H Group irrevocably deposited with Wells Fargo funds totaling
$36,900
for such redemption and interest payment in order to satisfy and discharge its obligations under the Indenture from both a legal and accounting perspective. Approximately
$25,000
of this deposit related to SPLP's holdings of the Subordinated Notes. SPLP received the proceeds on April 26, 2013. Interest expense in 2013 included a
$5,700
loss associated with the redemption of the Subordinated Notes, including the redemption premium and the write-off of remaining deferred finance costs and unamortized debt discounts. The obligations outstanding under the Subordinated Notes bore interest at a rate of
10%
per annum,
6%
of which was payable in cash and
4%
of which was payable in-kind.
In 2012, H&H Group repurchased an aggregate
$10,800
of Subordinated Notes, plus accrued interest. A loss of
$1,400
on repurchases of the Subordinated Notes is included in interest expense in the Consolidated Statement of Operations for the year ended December 31, 2012.
Other Debt
A subsidiary of H&H has two mortgage agreements, each collateralized by real property. The mortgage balance on the first facility was
$6,300
and
$6,500
at December 31, 2014 and 2013, respectively. The mortgage bears interest at LIBOR plus a margin of
2.70%
, or
2.86%
at December 31, 2014, and matures in 2015. The mortgage balance on the second facility was
$1,700
at both December 31, 2014 and 2013. The mortgage bears interest at LIBOR plus a margin of
2.70%
, or
2.87%
at December 31, 2014, and matures in 2017.
Steel Excel Term Loan
In 2013, Steel Excel's energy business entered into a credit agreement (“Energy Credit Agreement”) with Wells Fargo Bank National Association, RBS Citizens, N.A., and Comerica Bank. The Energy Credit agreement as amended, ("Amended Credit Agreement") provides for a borrowing capacity of
$105,000
consisting of a
$95,000
secured term loan (the “Term Loan”) and up to
$10,000
in revolving loans (the “Revolving Loans”) subject to a borrowing base of
85%
of the eligible accounts receivable.
The Company incurred fees totaling approximately
$1,400
in connection with the Amended Credit Agreement that are being amortized over the life of the arrangement as a component of interest expense.
Borrowings under the Amended Credit Agreement are collateralized by substantially all the assets of Steel Excel's wholly-owned subsidiary, Steel Energy Services Ltd. ("Steel Energy") and its wholly-owned subsidiaries Sun Well Service, Inc. ("Sun Well"), Rogue Pressure Services, LLC ("Rogue"), and Black Hawk Energy Services Ltd. (Black Hawk Ltd.), and a pledge of all of the issued and outstanding shares of capital stock of Sun Well, Rogue and Black Hawk Ltd. Borrowings under the Amended Credit Agreement are fully guaranteed by Sun Well, Rogue and Black Hawk Ltd. The carrying value as of
December 31, 2014
of the assets pledged as collateral by Steel Energy and its subsidiaries under the Amended Credit Agreement was approximately
$189,300
.
The Amended Credit Agreement has a term that runs through July 2018, with the Term Loan amortizing in quarterly installments of
$3,300
and a balloon payment due on the maturity date. At
December 31, 2014
,
$79,300
was outstanding under the Term Loan and no amount was outstanding under the Revolving Loans.
Borrowings under the Amended Credit Agreement bear interest at annual rates of either (i) the
Base Rate
plus an applicable margin of
1.50%
to
2.25%
or (ii)
LIBOR
plus an applicable margin of
2.50%
to
3.25%
. The “Base Rate” is the greatest of (i) the prime lending rate, (ii) the
Federal Funds Rate
plus
0.5%
, and (iii) the
one-month LIBOR
plus
1.0%
. The applicable margin for both Base Rate and LIBOR is determined based on the leverage ratio calculated in accordance with the Amended Credit Agreement. LIBOR-based borrowings are available for interest periods of one, three, or six months. In addition, Steel Excel is required to pay commitment fees of between
0.375%
and
0.50%
per annum on the daily unused amount of the Revolving Loans. The interest rate on the borrowings under the Amended Credit Agreement was
2.8%
at December 31, 2014. For the year ended December 31, 2014 and 2013, Steel Excel incurred interest expense of
$3,000
and
$1,400
, respectively, in connection with the Amended Credit Agreement.
114
STEEL PARTNERS HOLDINGS L.P.
Notes to Consolidated Financial Statements
(dollars in thousands except per unit data)
The Amended Credit Agreement contains certain financial covenants, including (i) a leverage ratio not to exceed
3.00
:1 for quarterly periods through June 15, 2015,
2.75
:1 for quarterly periods through June 30, 2017, and
2.5
:1 thereafter and (ii) a fixed charge coverage ratio of
1.15
:1 for quarterly periods through December 31, 2016, and
1.25
:1 thereafter. Steel Excel was in compliance with all financial covenants as of December 31, 2014.
The Amended Credit Agreement also contains representations, warranties and covenants, including, among other things, covenants relating to (i) financial reporting and notification, (ii) payment of obligations, (iii) compliance with law, (iv) maintenance of properties and (v) payment of restricted payments. The repayment of the Term Loan can be accelerated upon (i) a change in control, which would include Steel Energy owning less than
100%
of the equity of Sun Well, Rogue, or Black Hawk Ltd. or SPLP owning, directly or indirectly, less than
35%
of Steel Excel's energy business or (ii) other events of default, including payment failure, false representations, covenant breaches, and bankruptcy.
Sun Well Debt
Sun Well, a wholly owned operating subsidiary of Steel Excel, Inc. previously had a credit agreement with Wells Fargo Bank, National Association that included a term loan of
$20,000
and a revolving line of credit for up to
$5,000
. All amounts due under the Sun Well Credit Agreement were fully repaid in 2013 and the facility was terminated as of July 3, 2013, upon closing of the Energy Credit Agreement. For the year ended December 31, 2013, Steel Excel incurred interest expense of
$300
in connection with the Sun Well Credit Agreement. Upon termination of the Sun Well Credit Agreement, the Company recognized a loss on extinguishment of
$500
from the write off of unamortized deferred financing costs, which was reported as a component of Other income in the consolidated statements of operations for the year ended December 31, 2013.
15. PENSION BENEFIT PLAN
HNH maintains several qualified and non-qualified pension plans and other post-retirement benefit plans. HNH’s significant pension, health care benefit and defined contribution plans are discussed below. HNH’s other pension and post-retirement plans are not significant individually or in the aggregate.
Qualified Pension Plans
HNH sponsors a defined benefit pension plan, the WHX Pension Plan, covering many of H&H’s employees and certain employees of H&H’s former subsidiary, Wheeling-Pittsburgh Corporation (“WPC”). The WHX Pension Plan was established in May 1998 as a result of the merger of the former H&H plans, which covered substantially all H&H employees, and the WPC plan. The WPC plan, covering most USWA-represented employees of WPC, was created pursuant to a collective bargaining agreement ratified on August 12, 1997. Prior to that date, benefits were provided through a defined contribution plan, the Wheeling-Pittsburgh Steel Corporation Retirement Security Plan (“RSP Plan”). The assets of the RSP Plan were merged into the WPC plan as of December 1, 1997. Under the terms of the WHX Pension Plan, the benefit formula and provisions for the WPC and H&H participants continued as they were designed under each of the respective plans prior to the merger.
The qualified pension benefits under the WHX Pension Plan were frozen as of December 31, 2005 and April 30, 2006 for hourly and salaried non-bargaining participants, respectively, with the exception of a single operating unit. In 2011, the benefits were frozen for the remainder of the participants.
WPC employees ceased to be active participants in the WHX Pension Plan effective July 31, 2003, and as a result such employees no longer accrue benefits under the WHX Pension Plan.
Bairnco had several pension plans, which covered substantially all of its employees. In 2006, Bairnco froze the Bairnco Corporation Retirement Plan and initiated employer contributions to its 401(k) plan. On June 2, 2008, two Bairnco plans (Salaried and Kasco) were merged into the WHX Pension Plan.
Some of the Company's foreign subsidiaries provide retirement benefits for their employees through defined contribution plans or otherwise provide retirement benefits for employees consistent with local practices. The foreign plans are not significant in the aggregate and therefore are not included in the following disclosures.
Pension benefits are based on years of service and the amount of compensation earned during the participants’ employment. However, as noted above, the qualified pension benefits have been frozen for all participants.
115
STEEL PARTNERS HOLDINGS L.P.
Notes to Consolidated Financial Statements
(dollars in thousands except per unit data)
Pension benefits for the WPC bargained participants include both defined benefit and defined contribution features, since the plan includes the account balances from the RSP Plan. The gross benefit, before offsets, is calculated based on years of service and the benefit multiplier under the plan. The net defined benefit pension plan benefit is the gross amount offset for the benefits payable from the RSP Plan and benefits payable by the Pension Benefit Guaranty Corporation from previously terminated plans. Individual employee accounts established under the RSP Plan are maintained until retirement. Upon retirement, participants who are eligible for the WHX Pension Plan and maintain RSP Plan account balances will normally receive benefits from the WHX Pension Plan. When these participants become eligible for benefits under the WHX Pension Plan, their vested balances in the RSP Plan becomes assets of the WHX Pension Plan. Although these RSP Plan assets cannot be used to fund any of the net benefit that is the basis for determining the defined benefit plan’s net benefit obligation at the end of the year, the HNH has included the amount of the RSP Plan accounts of
$17,700
and
$19,400
on a gross basis as both assets and liabilities of the plan as of
December 31, 2014
and
2013
, respectively.
Certain current and retired employees of H&H are covered by post-retirement medical benefit plans, which provide benefits for medical expenses and prescription drugs. Contributions from a majority of the participants are required, and for those retirees and spouses, HNH’s payments are capped. The measurement date for plan obligations is December 31.
Actuarial losses are being amortized over the average future lifetime of the participants, which is expected to be approximately
20 years
. HNH believes that use of the future lifetime of the participants is appropriate because the WHX Pension Plan is completely inactive.
The following table presents the components of pension expense of other post-retirement benefit (income) expense for the HNH benefit plans included the following:
|
Pension Benefits
|
Other Post-Retirement Benefits
|
||||||||||||||||||||||
|
Year Ended December 31,
|
Year Ended December 31,
|
||||||||||||||||||||||
|
2014
|
2013
|
2012
|
2014
|
2013
|
2012
|
||||||||||||||||||
|
Interest cost
|
$
|
20,518
|
|
$
|
18,447
|
|
$
|
21,505
|
|
$
|
49
|
|
$
|
98
|
|
$
|
163
|
|
|||||
|
Expected return on plan assets
|
(24,157
|
)
|
(23,900
|
)
|
(26,939
|
)
|
—
|
|
—
|
|
—
|
|
|||||||||||
|
Amortization of prior service cost
|
—
|
|
—
|
|
—
|
|
(103
|
)
|
—
|
|
—
|
|
|||||||||||
|
Amortization of actuarial loss
|
1,878
|
|
5,026
|
|
2,832
|
|
34
|
|
8
|
|
86
|
|
|||||||||||
|
Total
|
$
|
(1,761
|
)
|
$
|
(427
|
)
|
$
|
(2,602
|
)
|
$
|
(20
|
)
|
$
|
106
|
|
$
|
249
|
|
|||||
Actuarial assumptions used to develop the components of defined benefit pension expense and other post-retirement benefit expense were as follows:
|
|
Pension Benefits
|
Other Post-Retirement Benefits
|
|||||||||||||||
|
|
2014
|
2013
|
2012
|
2014
|
2013
|
2012
|
|||||||||||
|
Discount rates:
|
|
|
|||||||||||||||
|
WHX Pension Plan
|
4.40
|
%
|
3.50
|
%
|
4.15
|
%
|
N/A
|
|
N/A
|
|
N/A
|
|
|||||
|
Other post-retirement benefit plans
|
N/A
|
|
N/A
|
|
N/A
|
|
4.10
|
%
|
3.65
|
%
|
4.20
|
%
|
|||||
|
Expected return on assets
|
7.00
|
%
|
7.50
|
%
|
8.00
|
%
|
N/A
|
|
N/A
|
|
N/A
|
|
|||||
|
Health care cost trend rate - initial
|
N/A
|
|
N/A
|
|
N/A
|
|
7.00
|
%
|
7.25
|
%
|
7.50
|
%
|
|||||
|
Health care cost trend rate - ultimate
|
N/A
|
|
N/A
|
|
N/A
|
|
5.00
|
%
|
5.00
|
%
|
5.00
|
%
|
|||||
|
Year ultimate reached
|
N/A
|
|
N/A
|
|
N/A
|
|
2022
|
|
2022
|
|
2022
|
|
|||||
The measurement date for plan obligations is December 31. The discount rate is the rate at which the plans’ obligations could be effectively settled and is based on high quality bond yields as of the measurement date.
116
STEEL PARTNERS HOLDINGS L.P.
Notes to Consolidated Financial Statements
(dollars in thousands except per unit data)
Summarized below is a reconciliation of the funded status for HNH’s qualified defined benefit pension plan and other post-retirement benefit plan:
|
|
Pension Benefits
|
Other Post-Retirement Benefits
|
||||||||||||||
|
2014
|
2013
|
2014
|
2013
|
|||||||||||||
|
Change in benefit obligation:
|
|
|
||||||||||||||
|
Benefit obligation at January 1
|
$
|
494,272
|
|
$
|
543,799
|
|
$
|
1,084
|
|
$
|
4,208
|
|
||||
|
Service cost
|
—
|
|
—
|
|
—
|
|
—
|
|
||||||||
|
Interest cost
|
20,518
|
|
18,447
|
|
49
|
|
98
|
|
||||||||
|
Actuarial (gain) loss
|
51,274
|
|
(34,269
|
)
|
293
|
|
(1,403
|
)
|
||||||||
|
Participant contributions
|
—
|
|
—
|
|
1
|
|
4
|
|
||||||||
|
Plan change
|
—
|
|
—
|
|
—
|
|
(1,506
|
)
|
||||||||
|
Benefits paid
|
(34,276
|
)
|
(34,429
|
)
|
(71
|
)
|
(317
|
)
|
||||||||
|
Transfer from Canfield Salaried SEPP
|
36
|
|
724
|
|
—
|
|
—
|
|
||||||||
|
Benefit obligation at December 31
|
$
|
531,824
|
|
$
|
494,272
|
|
$
|
1,356
|
|
$
|
1,084
|
|
||||
|
Change in plan assets:
|
|
|
|
|
||||||||||||
|
Fair value of plan assets at January 1
|
$
|
351,869
|
|
$
|
328,726
|
|
$
|
—
|
|
$
|
—
|
|
||||
|
Actual returns on plan assets
|
(14,676
|
)
|
43,742
|
|
—
|
|
—
|
|
||||||||
|
Participant contributions
|
—
|
|
—
|
|
1
|
|
4
|
|
||||||||
|
Benefits paid
|
(34,276
|
)
|
(34,429
|
)
|
(71
|
)
|
(317
|
)
|
||||||||
|
Company contributions
|
20,540
|
|
13,106
|
|
70
|
|
313
|
|
||||||||
|
Transfer from Canfield Salaried SEPP
|
36
|
|
724
|
|
—
|
|
—
|
|
||||||||
|
Fair value of plan assets at December 31
|
323,493
|
|
351,869
|
|
—
|
|
—
|
|
||||||||
|
Funded status
|
$
|
(208,331
|
)
|
$
|
(142,403
|
)
|
$
|
(1,356
|
)
|
$
|
(1,084
|
)
|
||||
|
Accumulated benefit obligation ("ABO") for qualified
|
|
|
|
|
||||||||||||
|
defined benefit pension plans :
|
|
|
|
|
||||||||||||
|
ABO at January 1
|
$
|
494,272
|
|
$
|
543,799
|
|
$
|
1,084
|
|
$
|
4,208
|
|
||||
|
ABO at December 31
|
$
|
531,824
|
|
$
|
494,272
|
|
$
|
1,356
|
|
$
|
1,084
|
|
||||
|
Amounts recognized in the statement of financial position:
|
|
|
|
|
||||||||||||
|
Current liability
|
$
|
—
|
|
$
|
—
|
|
$
|
(124
|
)
|
$
|
(111
|
)
|
||||
|
Noncurrent liability
|
(208,331
|
)
|
(142,403
|
)
|
(1,232
|
)
|
(973
|
)
|
||||||||
|
Total
|
$
|
(208,331
|
)
|
$
|
(142,403
|
)
|
$
|
(1,356
|
)
|
$
|
(1,084
|
)
|
||||
The weighted average assumptions used in the valuations at December 31 were as follows:
|
|
Pension Benefits
|
Other Post-Retirement Benefits
|
|||||||||
|
|
2014
|
2013
|
2014
|
2013
|
|||||||
|
Discount rates:
|
|
|
|||||||||
|
WHX Pension Plan
|
3.70
|
%
|
4.40
|
%
|
N/A
|
|
N/A
|
|
|||
|
Other post-retirement benefit plans
|
N/A
|
|
N/A
|
|
3.55
|
%
|
4.10
|
%
|
|||
|
Health care cost trend rate - initial
|
N/A
|
|
N/A
|
|
6.75
|
%
|
7.25
|
%
|
|||
|
Health care cost trend rate - ultimate
|
N/A
|
|
N/A
|
|
5.00
|
%
|
5.00
|
%
|
|||
|
Year ultimate reached
|
N/A
|
|
N/A
|
|
2022
|
|
2022
|
|
|||
The effect of a
1%
increase (decrease) in health care cost trend rates on other post-retirement benefits obligations is not significant.
117
STEEL PARTNERS HOLDINGS L.P.
Notes to Consolidated Financial Statements
(dollars in thousands except per unit data)
Pretax amounts included in “Accumulated other comprehensive income” at
December 31, 2014
and
2013
were as follows:
|
|
Pension Benefits
|
Other Post-Retirement Benefits
|
||||||||||||||
|
2014
|
2013
|
2014
|
2013
|
|||||||||||||
|
Prior service credit
|
$
|
—
|
|
$
|
—
|
|
$
|
(1,402
|
)
|
$
|
(1,506
|
)
|
||||
|
Net actuarial loss
|
183,927
|
|
95,699
|
|
698
|
|
440
|
|
||||||||
|
Accumulated other comprehensive loss (income)
|
$
|
183,927
|
|
$
|
95,699
|
|
$
|
(704
|
)
|
$
|
(1,066
|
)
|
||||
The pretax amount of actuarial losses included in “Accumulated other comprehensive loss” at
December 31, 2014
that is expected to be recognized in net periodic benefit cost in 2015 is
$11,320
Other changes in plan assets and benefit obligations recognized in “Comprehensive (loss) income" are as follows:
|
|
Pension Benefits
|
Other Post-Retirement Benefits
|
||||||||||||||||||||||
|
2014
|
2013
|
2012
|
2014
|
2013
|
2012
|
|||||||||||||||||||
|
Current year actuarial (income) loss
|
$
|
90,106
|
|
$
|
(54,111
|
)
|
$
|
51,882
|
|
$
|
293
|
|
$
|
(1,403
|
)
|
$
|
150
|
|
||||||
|
Amortization of actuarial loss
|
(1,878
|
)
|
(5,026
|
)
|
(2,832
|
)
|
(34
|
)
|
(8
|
)
|
(86
|
)
|
||||||||||||
|
Current year prior service credit
|
—
|
|
—
|
|
—
|
|
—
|
|
(1,506
|
)
|
—
|
|
||||||||||||
|
Amortization of prior service cost (credit)
|
—
|
|
—
|
|
—
|
|
103
|
|
—
|
|
—
|
|
||||||||||||
|
Total recognized in comprehensive (income) loss
|
$
|
88,228
|
|
$
|
(59,137
|
)
|
$
|
49,050
|
|
$
|
362
|
|
$
|
(2,917
|
)
|
$
|
64
|
|
||||||
The actuarial losses in 2014 occurred principally due to a decline in discount rates based on changes in corporate bond yields, an increase in participant life expectancy reflected in revised mortality assumptions, and also because the investment returns on the assets of the WHX Pension Plan were lower than actuarial assumptions.
Benefit obligations were in excess of plan assets for both the pension plan and the other post-retirement benefit plan at both
December 31, 2014
and
2013
. Additional information for the plans with accumulated benefit obligations in excess of plan assets:
|
|
Pension Benefits
|
Other Post-Retirement Benefits
|
||||||||||||||
|
2014
|
2013
|
2014
|
2013
|
|||||||||||||
|
Projected benefit obligation
|
$
|
531,824
|
|
$
|
494,272
|
|
$
|
1,356
|
|
$
|
1,084
|
|
||||
|
Accumulated benefit obligation
|
$
|
531,824
|
|
$
|
494,272
|
|
$
|
1,356
|
|
$
|
1,084
|
|
||||
|
Fair value of plan assets
|
$
|
323,493
|
|
$
|
351,869
|
|
$
|
—
|
|
$
|
—
|
|
||||
In determining the expected long-term rate of return on assets, HNH evaluated input from various investment professionals. In addition, HNH considered its historical compound returns as well as HNH’s forward-looking expectations. HNH determines its actuarial assumptions for its pension and other post-retirement benefit plans on December 31 of each year to calculate liability information as of that date and pension and other post-retirement benefit expense for the following year. The discount rate assumption is derived from the rate of return on high-quality bonds as of December 31 of each year.
HNH’s investment policy is to maximize the total rate of return with a view to long-term funding objectives of the pension plan to ensure that funds are available to meet benefit obligations when due. Pension plan assets are diversified to the extent necessary to minimize risk and to achieve an optimal balance between risk and return. There are no target allocations. The WHX Pension Plan’s assets are diversified as to type of assets, investment strategies employed and number of investment managers used. Investments may include equities, fixed income, cash equivalents, convertible securities, and private investment funds. Derivatives may be used as part of the investment strategy. HNH may direct the transfer of assets between investment managers in order to re-balance the portfolio in accordance with asset allocation guidelines established by the HNH.
118
STEEL PARTNERS HOLDINGS L.P.
Notes to Consolidated Financial Statements
(dollars in thousands except per unit data)
The fair value of pension investments is defined by reference to one of three categories (Level 1, Level 2 or Level 3) based on the reliability of inputs, as such terms are defined in Note 2 - "Summary of Significant Accounting Policies."
The WHX Pension Plan assets at
December 31, 2014
and
2013
, by asset category, are as follows:
|
Fair Value Measurements as of December 31, 2014:
|
|
|
|
|
||||||||||||
|
|
Assets (Liabilities) at Fair Value as of December 31, 2014
|
|||||||||||||||
|
Asset Class
|
Level 1
|
Level 2
|
Level 3
|
Total
|
||||||||||||
|
Equity securities:
|
|
|
|
|
||||||||||||
|
U.S. large cap
|
$
|
9,548
|
|
$
|
—
|
|
$
|
—
|
|
$
|
9,548
|
|
||||
|
U.S. mid-cap growth
|
36,771
|
|
—
|
|
—
|
|
36,771
|
|
||||||||
|
U.S. small-cap value
|
18,207
|
|
2,626
|
|
—
|
|
20,833
|
|
||||||||
|
International large cap value
|
10,058
|
|
—
|
|
—
|
|
10,058
|
|
||||||||
|
Emerging markets growth
|
375
|
|
—
|
|
—
|
|
375
|
|
||||||||
|
Equity contracts
|
240
|
|
2,330
|
|
—
|
|
2,570
|
|
||||||||
|
Fixed income securities:
|
|
|
|
|
||||||||||||
|
Corporate bonds and loans
|
—
|
|
50,895
|
|
—
|
|
50,895
|
|
||||||||
|
Other types of investments:
|
|
|
|
|
|
|
|
|
||||||||
|
Common trust funds (1)
|
—
|
|
122,628
|
|
—
|
|
122,628
|
|
||||||||
|
Fund of funds (2)
|
—
|
|
41,831
|
|
—
|
|
41,831
|
|
||||||||
|
|
75,199
|
|
220,310
|
|
—
|
|
295,509
|
|
||||||||
|
Shorts
|
(46,909
|
)
|
(206
|
)
|
—
|
|
(47,115
|
)
|
||||||||
|
Total
|
$
|
28,290
|
|
$
|
220,104
|
|
$
|
—
|
|
248,394
|
|
|||||
|
Cash & cash equivalents
|
|
|
|
|
|
|
75,099
|
|
||||||||
|
Total pension assets
|
|
|
|
|
|
|
$
|
323,493
|
|
|||||||
|
Fair Value Measurements as of December 31, 2013:
|
||||||||||||||||
|
|
Assets (Liabilities) at Fair Value as of December 31, 2013
|
|||||||||||||||
|
Asset Class
|
Level 1
|
Level 2
|
Level 3
|
Total
|
||||||||||||
|
Equity securities:
|
|
|
|
|
|
|
|
|
||||||||
|
U.S. large cap
|
$
|
27,226
|
|
$
|
593
|
|
$
|
—
|
|
$
|
27,819
|
|
||||
|
U.S. mid-cap growth
|
62,106
|
|
—
|
|
—
|
|
62,106
|
|
||||||||
|
U.S. small-cap value
|
14,374
|
|
2,019
|
|
—
|
|
16,393
|
|
||||||||
|
International large cap value
|
16,258
|
|
—
|
|
—
|
|
16,258
|
|
||||||||
|
Equity contracts
|
95
|
|
—
|
|
—
|
|
95
|
|
||||||||
|
Fixed income securities:
|
|
|
|
|
|
|
||||||||||
|
Corporate bonds and loans
|
33
|
|
63,028
|
|
500
|
|
63,561
|
|
||||||||
|
Bank debt
|
—
|
|
—
|
|
—
|
|
—
|
|
||||||||
|
Other types of investments:
|
|
|
|
|
|
|
|
|
||||||||
|
Common trust funds (1)
|
—
|
|
98,024
|
|
—
|
|
98,024
|
|
||||||||
|
Fund of funds (2)
|
—
|
|
41,648
|
|
—
|
|
41,648
|
|
||||||||
|
|
120,092
|
|
205,312
|
|
500
|
|
325,904
|
|
||||||||
|
Shorts
|
(62,404
|
)
|
(932
|
)
|
—
|
|
(63,336
|
)
|
||||||||
|
Total
|
$
|
57,688
|
|
$
|
204,380
|
|
$
|
500
|
|
262,568
|
|
|||||
|
Cash & cash equivalents
|
|
|
|
|
|
|
93,571
|
|
||||||||
|
Net payables
|
|
|
|
|
|
|
(4,270
|
)
|
||||||||
|
Total pension assets
|
|
|
|
|
|
|
$
|
351,869
|
|
|||||||
(1) Common trust funds are comprised of shares or units in commingled funds that are not publicly traded. The underlying assets in these funds are primarily publicly traded equity securities, fixed income securities and commodity-related
119
STEEL PARTNERS HOLDINGS L.P.
Notes to Consolidated Financial Statements
(dollars in thousands except per unit data)
securities and are valued at their net asset values ("NAV") that are calculated by the investment manager or sponsor of the fund and have daily or monthly liquidity.
(2) Fund of funds consist of fund-of-fund LLC or commingled fund structures. The underlying assets in these funds are primarily publicly traded equity securities, fixed income securities and commodity-related securities. The LLCs are valued based on NAVs calculated by the fund and are not publicly available. In most cases, the liquidity for the LLCs is quarterly with advance notice and is subject to liquidity of the underlying funds. In some cases, there may be extended lock-up periods greater than 90 days or side-pockets for non-liquid assets.
HNH’s policy is to recognize transfers in and transfers out of Level 3 as of the date of the event or change in circumstances that caused the transfer. Changes in the WHX Pension Plan assets for which fair value is determined using significant unobservable inputs (Level 3) were as follows during
2014
and
2013
:
|
Changes in Fair Value Measurements Using Significant Unobservable Inputs (Level 3)
|
|
|
||||||
|
Year Ended December 31, 2014
|
Corporate Bonds and Loans
|
|||||||
|
Beginning balance as of January 1, 2014
|
$
|
500
|
|
|||||
|
Transfers into Level 3
|
—
|
|
||||||
|
Transfers out of Level 3
|
—
|
|
||||||
|
Gains or losses included in changes in net assets
|
73
|
|
||||||
|
Purchases, issuances, sales and settlements
|
|
|
||||||
|
Purchases
|
—
|
|
||||||
|
Issuances
|
—
|
|
||||||
|
Sales
|
(573
|
)
|
||||||
|
Settlements
|
—
|
|
||||||
|
Ending balance as of December 31, 2014
|
$
|
—
|
|
|||||
|
Year Ended December 31, 2013
|
U.S. Mid Cap Growth
|
Corporate Bonds and Loans
|
||||||
|
Beginning balance as of January 1, 2013
|
$
|
208
|
|
$
|
545
|
|
||
|
Transfers into Level 3
|
—
|
|
—
|
|
||||
|
Transfers out of Level 3
|
—
|
|
—
|
|
||||
|
Gains or losses included in changes in net assets
|
23
|
|
84
|
|
||||
|
Purchases, issuances, sales and settlements
|
|
|
|
|
||||
|
Purchases
|
—
|
|
—
|
|
||||
|
Issuances
|
—
|
|
—
|
|
||||
|
Sales
|
(231
|
)
|
(129
|
)
|
||||
|
Settlements
|
—
|
|
—
|
|
||||
|
Ending balance as of December 31, 2013
|
$
|
—
|
|
$
|
500
|
|
||
120
STEEL PARTNERS HOLDINGS L.P.
Notes to Consolidated Financial Statements
(dollars in thousands except per unit data)
The following table presents the category, fair value, redemption frequency, and redemption notice period for those assets whose fair value is estimated using the NAV per share (or its equivalents) as of
December 31, 2014
and
2013
.
Fair Value Estimated using NAV per Share (or its equivalent)
|
Class Name
|
Description
|
Fair Value December 31, 2014
|
Fair Value December 31, 2013
|
Redemption frequency
|
Redemption Notice Period
|
|||||||||
|
|
|
|
|
|
||||||||||
|
Fund of funds
|
Equity long/short hedge funds
|
$
|
5,479
|
|
$
|
5,673
|
|
Quarterly
|
45 day notice
|
|||||
|
Fund of funds
|
Fund of fund composites
|
$
|
36,352
|
|
$
|
—
|
|
Daily
|
None
|
|||||
|
Fund of funds
|
Fund of fund composites
|
$
|
—
|
|
$
|
35,975
|
|
Quarterly
|
45 day notice
|
|||||
|
Common trust funds
|
Equity long/short hedge funds
|
$
|
59,727
|
|
$
|
—
|
|
Annually
|
45 day notice
|
|||||
|
Common trust funds
|
Event driven hedge funds
|
$
|
—
|
|
$
|
68,843
|
|
Annually
|
45 day notice
|
|||||
|
Common trust funds
|
Event driven hedge funds
|
$
|
50,131
|
|
$
|
16,621
|
|
Monthly
|
90 day notice
|
|||||
|
Common trust funds
|
Equity long/short hedge funds
|
$
|
12,770
|
|
$
|
12,560
|
|
Annually
|
90 day notice
|
|||||
|
Separately managed fund
|
Separately managed fund
|
$
|
28,917
|
|
$
|
34,783
|
|
Monthly
|
30 day notice
|
|||||
|
Separately managed fund
|
Separately managed fund
|
$
|
66,851
|
|
$
|
76,634
|
|
Quarterly
|
45 day notice
|
|||||
Contributions
Employer contributions consist of funds paid from employer assets into a qualified pension trust account. HNH’s funding policy is to contribute annually an amount that satisfies the minimum funding standards of the Employee Retirement Income Security Act.
HNH expects to have required minimum contributions for 2015, 2016, 2017, 2018, 2019, and thereafter of
$17,100
,
$13,900
,
$14,800
,
$17,000
,
$18,600
, and
$59,500
, respectively. Required future contributions are estimated based upon assumptions such as discount rates on future obligations, assumed rates of return on plan assets and legislative changes. Actual future pension costs and required funding obligations will be affected by changes in the factors and assumptions described in the previous sentence, as well as other changes such as any plan termination.
Benefit Payments
Estimated future benefit payments for the benefit plans over the next ten years are as follows:
|
|
Pension
|
Other Post-Retirement
|
|||||
|
Years
|
Benefits
|
Benefits
|
|||||
|
2015
|
$
|
34,961
|
|
$
|
124
|
|
|
|
2016
|
34,828
|
|
118
|
|
|||
|
2017
|
34,660
|
|
110
|
|
|||
|
2018
|
34,446
|
|
104
|
|
|||
|
2019
|
34,195
|
|
104
|
|
|||
|
2020-2024
|
164,091
|
|
399
|
|
|||
401(k) Plans
Beginning January 1, 2012, certain employees participate in a SPLP sponsored savings plan which qualifies under Section 401(k) of the Internal Revenue Code. SPLP presently makes a contribution to match
50%
if the first
6%
of the employees contribution. The charge to expense for SPLP's matching contribution totaled
$243
,
$220
and
$248
for the years ended
December 31, 2014
,
2013
and
2012
, respectively.
121
STEEL PARTNERS HOLDINGS L.P.
Notes to Consolidated Financial Statements
(dollars in thousands except per unit data)
In addition, certain employees participate in a HNH sponsored savings plan which qualifies under Section 401(k) of the Internal Revenue Code. This savings plan allows eligible employees to contribute from
1%
to
75%
of their income on a pretax basis. HNH presently makes a contribution to match
50%
of the first
6%
of the employee’s contribution. The charge to expense for HNH’s matching contribution amounted to
$2,000
in
2014
,
$1,600
in
2013
and
$1,500
in
2012
.
16. CAPITAL AND ACCUMULATED OTHER COMPREHENSIVE INCOME
As of
December 31, 2014
, the Company has only one class of common units, totaling
27,566,200
outstanding. As of December 31, 2013, the Company had three classes of common units - regular Common Units, Class B Common Units and Class C Common Units, which totaled
22,647,345
,
6,939,647
and
1,542,073
, respectively. Class B Common Units and Class C Common Units were identical to the regular Common Units in all respect except that net tax losses were not allocated to a holder of Class B Common Units or Class C Common Units, liquidating distributions made by the Company to such holder were not to exceed the amount of its capital account allocable to such Common Units, and such holder could not sell such Common Units in the public market. As a result of the tender offer, described in further detail below, the capital accounts of the Company's common units were aligned with each of the previously issued Class B and Class C units. Accordingly, the outstanding Class B and Class C units were automatically converted to common units on May 1, 2014.
Tender Offer for SPLP Units
On March 25, 2014, the Company commenced a modified "Dutch Auction" tender offer (the "Offer") to purchase for cash up to
$49,000
in value of its common units, no par value, at a price per unit of not less than
$16.50
nor greater than
$17.50
per unit, which expired on April 23, 2014.
The modified Dutch Auction allowed SPLP's unitholders to tender their units at a price within the specified range of not less than
$16.50
nor greater than
$17.50
per unit. Based on the number of units tendered and the prices specified by the tendering unitholders, SPLP selected a single price per unit of
$16.50
(the "Purchase Price") that enabled it to purchase approximately
$49,000
in value of its common units pursuant to the Offer. All units accepted in the Offer were purchased at the same price per unit even if a unitholder tendered at a lower price. At the Purchase Price selected by SPLP of
$16.50
per unit, SPLP purchased
2,969,696
common units. The Company funded the Offer with
$1,500
cash on hand and
$47,500
of borrowings under its existing credit facility with PNC (see Note 14 – "Debt and Capital Lease Obligations").
Common Unit Repurchase Program
On December 24, 2013, the Board of Directors of the general partner of the Company, approved the repurchase of up to an aggregate of
$5,000
of the Company's common units (the “Repurchase Program”). Any purchases made under the Repurchase Program will be made from time to time on the open market at prevailing market prices or in negotiated transactions off the market, in compliance with applicable laws and regulations. In connection with the Repurchase Program, the Company has entered into a Stock Purchase Plan which will continue through March 26, 2014. The Repurchase Program has no termination date. In total in 2014 and 2013, the company has purchased
154,073
units for a total purchase price of approximately
$2,571
under the Repurchase Program.
Common Units Issuance - Directors
For the years ended
December 31, 2014
,
2013
and
2012
each of the Company's non-management directors received equity compensation in the amount of
$75
in the form of restricted common units of the Company. The restrictions vest over a three year period, with one-third of the units vesting on the anniversary date of the grants. The total value of the units granted was
$375
in
2014
,
2013
and
2012
. Total expense for the vesting of the restricted common units issued was approximately
$490
,
$344
and $
120
for the twelve months ended
December 31, 2014
,
2013
and
2012
, respectively.
Common Units Issuance - Deferred Fee Liability
On April 11, 2012, the Company and the Investment Manager terminated the Investor Services Agreement, dated as of July 15, 2009, by mutual consent. Instead of receiving the deferred fee in cash, the Investment Manager elected for the total amount to be paid in common units of the Company. Under the Deferred Fee Agreement, the number of common units issued is determined by applying a
15%
discount to the market price of the common units, which represents the fair value of the common units giving effect to the discount for lack of marketability. As a result, on April 11 and May 11, 2012,
6,403,002
and
536,645
class B common units, respectively, were issued to the Investment Manager. In connection with the termination of the Investor
122
STEEL PARTNERS HOLDINGS L.P.
Notes to Consolidated Financial Statements
(dollars in thousands except per unit data)
Services Agreement, the Investment Manager agreed not to sell any of the common units issued as payment for the deferred fee during the one year period following the Termination Date. In December 2014, SPLP assumed an additional liability due to the Investment Manager of approximately
$1,800
, and received consideration of an equal amount of cash from SPII Offshore for final settlement of the Deferred Fee Liability. The liability is included in Payable to related parties in the Company's Consolidated Balance Sheet as of December 31, 2014.
Common Unitholders — Allocation of Net Income (Loss)
For each period presented net (loss) income attributable to common unit holders is allocated to the common unitholders on a pro rata basis based on the number of units held.
Accumulated Other Comprehensive Income
Changes, net of tax, in Accumulated other comprehensive income are as follows:
|
Unrealized gain on available-for-sale securities
|
Cumulative translation adjustment
|
Change in net pension and other benefit obligations
|
Total
|
||||||||||||
|
Balance at December 31, 2012
|
$
|
44,521
|
|
$
|
(1,863
|
)
|
$
|
(60,520
|
)
|
$
|
(17,862
|
)
|
|||
|
Current period other comprehensive income (a)
|
53,289
|
|
33
|
|
21,528
|
|
74,850
|
|
|||||||
|
Reclassification adjustments (b), (c)
|
(13,867
|
)
|
(1,537
|
)
|
—
|
|
(15,404
|
)
|
|||||||
|
Net other comprehensive income (loss) attributable to common unit holders
|
39,422
|
|
(1,504
|
)
|
21,528
|
|
59,446
|
|
|||||||
|
Balance at December 31, 2013
|
83,943
|
|
$
|
(3,367
|
)
|
$
|
(38,992
|
)
|
$
|
41,584
|
|
||||
|
Current period other comprehensive income (d)
|
2,197
|
|
(1,324
|
)
|
(36,649
|
)
|
(35,776
|
)
|
|||||||
|
Reclassification adjustments (e)
|
(3,003
|
)
|
—
|
|
—
|
|
(3,003
|
)
|
|||||||
|
Net other comprehensive loss attributable to common unit holders (f)
|
(806
|
)
|
(1,324
|
)
|
(36,649
|
)
|
(38,779
|
)
|
|||||||
|
Balance at December 31, 2014
|
$
|
83,137
|
|
$
|
(4,691
|
)
|
$
|
(75,641
|
)
|
$
|
2,805
|
|
|||
(a) Net of tax provision of approximately
$18,660
.
(b) Net of tax provision of approximately
$529
.
(c) Includes a net reclassification gain to Other income of
$1,559
, a reclassification of net unrealized gain of
$11,507
to Income (loss) of associated companies, net of tax, a reclassification of
$991
to Net investment gains (losses) and a reclassification of
$1,347
to Gain on sale of discontinued operations.
(d) Net of tax benefit of approximately
$18,645
.
(e) Includes a net reclassification gain to Other income, net of
$2,742
and a reclassification of
$261
to Net investment gains.
(f) Does not include amounts attributable to noncontrolling interests for unrealized gain on available-for sale securities of
$10,506
, cumulative translation adjustment loss of
$766
and change in net pension and other benefit obligations of
$18,763
.
There was
no
impact on comprehensive income related to companies accounted for under the equity method in 2014. For the
twelve
months ended December 31, 2013, the impact on comprehensive income related to companies accounted for under the traditional equity method was
$3
. For the
twelve
months ended December 31, 2012, there was
no
impact on comprehensive income related to companies accounted for under the equity method.
Noncontrolling Interests in Consolidated Entities
Noncontrolling interests in consolidated entities at
December 31, 2014
and
2013
represent the interests held by the noncontrolling shareholders of the HNH, Steel Excel, DGT and the BNS Liquidating Trust.
Incentive Unit Expense
Effective January 1, 2012, SPLP issued to the Manager partnership profits interests in the form of incentive units, a portion of which will be classified as Class C common units of SPLP upon the attainment of certain specified performance goals by SPLP which are determined as of the last day of each fiscal year. If the performance goals are not met for a fiscal year, no portion of the incentive units will be classified as Class C common units for that year. The number of outstanding incentive
123
STEEL PARTNERS HOLDINGS L.P.
Notes to Consolidated Financial Statements
(dollars in thousands except per unit data)
units is equal to
100%
of the common units outstanding, including common units held by non-wholly owned subsidiaries. The performance goals and expense related to the classification of a portion of the incentive units as Class C units is measured on an annual basis, but is accrued on a quarterly basis. Accordingly, the expense accrued is adjusted to reflect the fair value of the Class C common units on each interim calculation date. In the event the cumulative incentive unit expense calculated quarterly or for the full year is an amount less than the total previously accrued, the Company would record a negative incentive unit expense in the quarter when such over accrual is determined. The expense is recorded in Selling, general and administrative expenses in the consolidated statement of operations. Incentive unit expense of approximately
$0
,
$26,600
and
$100
, representing the classification of approximately
0
,
1,534,000
and
8,000
Class C common units with respect to the incentive units, was recorded for the twelve months ended
December 31, 2014
,
2013
and
2012
, respectively.
BNS Liquidating Trust
On June 18, 2012, following BNS' sale of SWH to Steel Excel (see Note 3 - "Acquisitions"), BNS completed a distribution to its shareholders, pursuant to shareholder approval noted above, and distributed cash of approximately
$10,300
to its minority shareholders and
2,027,500
shares of Steel Excel common stock to its majority shareholder. In June 2012, BNS formed the BNS Liquidating Trust, assigned its assets and liabilities to the Liquidating Trust, and BNS initiated its dissolution. The BNS Liquidating Trust is owned by the BNS former shareholders, in the same proportion as their former shareholdings. The BNS Liquidating Trust will continue to be included in the consolidated financial statements of SPLP, as SPLP owned approximately
84.9%
of the BNS Liquidating Trust and of BNS as of December 31, 2014 and 2013, respectively. SPLP has provided a contingent promissory note to the Liquidating Trust in an amount not to exceed
$3,000
. This note will only be funded to the extent that the Liquidating Trust is unable to meet its ongoing obligations and is eliminated in SPLP's consolidated financial statements. The Liquidating Trust had assets of approximately
$3,898
and liabilities of approximately
$2,255
at
December 31, 2014
.
Subsidiary Purchases of the Company's Common Units
During the
twelve
months ended
December 31, 2014
,
2013
and
2012
, a subsidiary of the Company purchased
473,054
,
1,212,855
and
1,345,646
, respectively, of the Company's common units at a total cost of
$7,921
,
$15,690
and
$15,082
, respectively. The purchases of these units are reflected as treasury unit purchases in the Company's consolidated financial statements.
124
STEEL PARTNERS HOLDINGS L.P.
Notes to Consolidated Financial Statements
(dollars in thousands except per unit data)
17. NET (LOSS) INCOME PER COMMON UNIT
The following data was used in computing net (loss) income per common unit shown in the consolidated statements of operations:
|
Year Ended December 31,
|
|||||||||||
|
2014
|
2013
|
2012
|
|||||||||
|
Net (loss) income from continuing operations
|
$
|
(17,572
|
)
|
$
|
38,374
|
|
$
|
43,736
|
|
||
|
Net loss (income) from continuing operations attributable to noncontrolling interests in consolidated entities
|
3,882
|
|
(23,227
|
)
|
(13,589
|
)
|
|||||
|
Net (loss) income from continuing operations attributable to common unit holders
|
(13,690
|
)
|
15,147
|
|
30,147
|
|
|||||
|
Net income from discontinued operations
|
10,304
|
|
6,446
|
|
20,029
|
|
|||||
|
Net income from discontinued operations attributable to noncontrolling interests in consolidated entities
|
(4,169
|
)
|
(2,133
|
)
|
(9,158
|
)
|
|||||
|
Net income from discontinued operations attributable to common unit holders
|
6,135
|
|
4,313
|
|
10,871
|
|
|||||
|
Net (loss) income attributable to common unitholders
|
$
|
(7,555
|
)
|
$
|
19,460
|
|
$
|
41,018
|
|
||
|
Net (loss) income per common unit - basic
|
|||||||||||
|
Net (loss) income from continuing operations
|
$
|
(0.48
|
)
|
$
|
0.51
|
|
$
|
1.01
|
|
||
|
Net income from discontinued operations
|
0.21
|
|
0.14
|
|
0.37
|
|
|||||
|
Net (loss) income attributable to common unitholders
|
$
|
(0.27
|
)
|
$
|
0.65
|
|
$
|
1.38
|
|
||
|
Net (loss) income per common unit – diluted
|
|||||||||||
|
Net (loss) income from continuing operations
|
$
|
(0.48
|
)
|
$
|
0.49
|
|
$
|
1.01
|
|
||
|
Net income from discontinued operations
|
0.21
|
|
0.14
|
|
0.37
|
|
|||||
|
Net (loss) income attributable to common unitholders
|
$
|
(0.27
|
)
|
$
|
0.63
|
|
$
|
1.38
|
|
||
|
Weighted average common units outstanding - basic
|
28,710,220
|
|
29,912,993
|
|
29,748,746
|
|
|||||
|
Incentive units
|
—
|
|
826,986
|
|
—
|
|
|||||
|
Unvested restricted units
|
—
|
|
58,134
|
|
25,781
|
|
|||||
|
Denominator for net income per common unit - diluted
(a)
|
28,710,220
|
|
30,798,113
|
|
29,774,527
|
|
|||||
|
(a)
|
The diluted (loss) income per unit calculation was based on the basic weighted average units only since the impact of
32,566
common units, assuming a common unit settlement of the deferred fee liability (see Note 13 - "Related Party Transactions"), and
13,728
of unvested restricted stock units would have been anti-dilutive.
|
18. SEGMENT INFORMATION
The following table presents the composition of our segments, which include the operations of our consolidated subsidiaries, as well as income or loss from equity method investments and other investments. Our segments are managed separately and offer different products and services. No single customer accounted for 10% or more of the Company's consolidated revenues during the years ended
December 31, 2014
,
2013
and
2012
.
125
STEEL PARTNERS HOLDINGS L.P.
Notes to Consolidated Financial Statements
(dollars in thousands except per unit data)
|
Diversified Industrial
|
Energy
|
Financial Services
|
Corporate and Other
|
|
Handy & Harman Ltd. ("HNH")
(1)
|
Steel Excel Inc. ("Steel Excel")
(1)
|
WebBank
(1)
|
SPH Services, Inc. ("SPH Services")
(1)
|
|
SL Industries, Inc. ("SLI")
(2)
|
BNS Holding, Inc. ("BNS")
(1), (3)
|
DGT Holdings Corp. ("DGT")
(1)
|
|
|
JPS Industries, Inc. ("JPS")
(2)
|
BNS Holdings Liquidating Trust ("BNS Liquidating Trust")
(1), (3)
|
||
|
Modus Link Global Solutions, Inc.
(2)
|
|||
|
CoSine Communications, Inc. ("CoSine")
(2)
|
|||
|
Fox & Hound Acquisition Corp. ("Fox & Hound")
(2)
|
|||
|
SPII Liquidating Trust
(2)
|
|||
|
Other Investments
(4)
|
|||
|
(1)
|
Consolidated subsidiary
|
|
(2)
|
Equity method investment
|
(3) The operations of BNS are included in the Energy segment through June 30, 2012. The results of the BNS Liquidating Trust are included in the Corporate and Other segment beginning July 1, 2012.
(4) Other investments classified in Corporate and Other include various investments in available-for-sale securities in the Aerospace/Defense, Restaurant and Manufacturing industries.
Diversified Industrial
HNH is a diversified holding company that owns a variety of manufacturing operations encompassing joining materials, tubing, engineered materials and cutting replacement products and services businesses. See Note 5 - "Investments" for additional information on the equity method investments classified within this segment.
Energy
Steel Excel's Energy business provides drilling and production services to the oil and gas industry. Through its wholly-owned subsidiary Steel Sports Inc., Steel Excel focuses on providing event-based sports and entertainment services and other health-related services, including baseball facility services, baseball and soccer camps and leagues, and strength and conditioning services. Steel Excel also continues to identify other new business acquisition opportunities. The operations of Steel Sports are not considered material and are included in the Energy segment. Steel Excel was previously accounted for as an associated company at fair value prior to SPLP increasing its ownership over 50%. Seven months of Steel Energy's results are included in the Energy segment for the year ended December 31, 2012.
BNS is currently a holding company with no operations as of June 1, 2012 due to the sale of Sun Well to Steel Excel on May 31, 2012 (see Note 3 - "Acquisitions"). BNS' results include the operations of Sun Well prior to the sale of Sun Well to Steel Excel on May 31, 2102.
Financial Services
The Financial Services segment primarily consists of our consolidated and wholly-owned subsidiary WebBank, which operates in niche banking markets. WebBank provides commercial and consumer loans and services. WebBank’s deposits are insured by the FDIC, and the bank is examined and regulated by the FDIC and UDFI.
Corporate and Other
Corporate assets, revenues and overhead expenses are not allocated to the segments. Corporate revenues primarily consist of investment and other income, investment gains and losses and rental income. See Note 5 - "Investments" for additional information on the equity method investments and other investments classified within this segment.
SPH services provides legal, tax, accounting, treasury, consulting, auditing, administration, compliance, environmental health and safety, human resources, marketing, investor relations and similar services, to other affiliated companies. In each of
2014
and
2013
SPH Services charged the Diversified Industrial, Energy and Financial services segments approximately
$8,900
,
$8,000
and
$250
, respectively for these services. In
2012
SPH Services charged the Diversified Industrial, Energy and Financial
126
STEEL PARTNERS HOLDINGS L.P.
Notes to Consolidated Financial Statements
(dollars in thousands except per unit data)
services segments approximately
$11,000
,
$2,000
and
$250
respectively for these services. These amounts are eliminated in consolidation.
DGT's operations currently consist of a real estate business from a rental building retained from the sale of its Medical Systems Group on November 3, 2011. Continuing operations consist of the real estate business,
investments, and general and administrative expenses.
The expenses related to the BNS Liquidating Trust are included in Corporate and Other from July 1, 2012 through December 31, 2012. For additional information on the BNS Liquidating Trust, see Note 16 - "Capital and Accumulated Other Comprehensive Income."
Prior to December 31, 2012, the Corporate and Other segment also included the Company's direct and indirect investment in Barbican (which was sold in October 2012). Segment information is presented below:
|
Year Ended December 31,
|
|||||||||||
|
2014
|
2013
|
2012
|
|||||||||
|
Revenue:
|
|||||||||||
|
Diversified industrial
|
$
|
600,468
|
|
$
|
571,164
|
|
$
|
498,713
|
|
||
|
Energy
|
210,148
|
|
120,029
|
|
92,834
|
|
|||||
|
Financial services
|
36,647
|
|
28,185
|
|
21,155
|
|
|||||
|
Corporate and other
|
2,267
|
|
1,736
|
|
18,069
|
|
|||||
|
Total
|
$
|
849,530
|
|
$
|
721,114
|
|
$
|
630,771
|
|
||
|
Income (loss) from continuing operations before income taxes:
|
|||||||||||
|
Diversified industrial
|
$
|
65,543
|
|
$
|
51,900
|
|
$
|
27,437
|
|
||
|
Energy
|
(26,254
|
)
|
12,641
|
|
25,034
|
|
|||||
|
Financial services
|
24,251
|
|
17,668
|
|
12,913
|
|
|||||
|
Corporate and other
|
(56,824
|
)
|
(37,358
|
)
|
(8,580
|
)
|
|||||
|
Income from continuing operations before income taxes
|
6,716
|
|
44,851
|
|
56,804
|
|
|||||
|
Income tax provision
|
24,288
|
|
6,477
|
|
13,068
|
|
|||||
|
Net (loss) income from continuing operations
|
$
|
(17,572
|
)
|
$
|
38,374
|
|
$
|
43,736
|
|
||
|
Income (loss) from equity method investments:
|
|||||||||||
|
Diversified industrial
|
$
|
26,115
|
|
$
|
18,257
|
|
$
|
1,796
|
|
||
|
Energy
|
(6,070
|
)
|
(863
|
)
|
13,139
|
|
|||||
|
Corporate and other
|
(22,533
|
)
|
10,121
|
|
(9,060
|
)
|
|||||
|
Total
|
$
|
(2,488
|
)
|
$
|
27,515
|
|
$
|
5,875
|
|
||
127
STEEL PARTNERS HOLDINGS L.P.
Notes to Consolidated Financial Statements
(dollars in thousands except per unit data)
Additional segment information as follows:
|
|
Year ended December 31, 2014
|
|
||||||||||||||
|
Interest expense
|
Capital
expenditures
|
Depreciation and
amortization
|
December 31, 2014
Goodwill
|
|||||||||||||
|
Diversified industrial
|
$
|
7,544
|
|
$
|
12,658
|
|
$
|
17,659
|
|
$
|
26,299
|
|
||||
|
Energy
|
3,177
|
|
15,939
|
|
19,992
|
|
19,571
|
|
||||||||
|
Financial services
|
638
|
|
40
|
|
117
|
|
—
|
|
||||||||
|
Corporate and other
|
529
|
|
132
|
|
670
|
|
81
|
|
||||||||
|
Total
|
$
|
11,888
|
|
$
|
28,769
|
|
$
|
38,438
|
|
$
|
45,951
|
|
||||
|
|
Year ended December 31, 2013
|
|
|
|||||||||||||
|
|
Interest expense
|
Capital
expenditures
|
Depreciation and
amortization
|
December 31, 2012
Goodwill
|
||||||||||||
|
Diversified industrial
|
$
|
8,593
|
|
$
|
11,744
|
|
$
|
16,197
|
|
$
|
26,260
|
|
||||
|
Energy
|
1,725
|
|
8,932
|
|
13,492
|
|
61,021
|
|
||||||||
|
Financial services
|
496
|
|
57
|
|
125
|
|
—
|
|
||||||||
|
Corporate and other
|
338
|
|
152
|
|
1,176
|
|
81
|
|
||||||||
|
Total
|
$
|
11,152
|
|
$
|
20,885
|
|
$
|
30,990
|
|
$
|
87,362
|
|
||||
|
|
Year ended December 31, 2012
|
|
|
|||||||||||||
|
|
Interest expense
|
Capital Expenditures
|
Depreciation and Amortization
|
|||||||||||||
|
Diversified industrial
|
$
|
14,134
|
|
$
|
15,182
|
|
$
|
14,572
|
|
|||||||
|
Energy
|
737
|
|
14,027
|
|
9,227
|
|
||||||||||
|
Financial services
|
957
|
|
37
|
|
131
|
|
||||||||||
|
Corporate and other
|
152
|
|
1,323
|
|
820
|
|
||||||||||
|
Total
|
$
|
15,980
|
|
$
|
30,569
|
|
$
|
24,750
|
|
|||||||
|
|
December 31,
|
|||||||
|
|
2014
|
2013
|
||||||
|
Identifiable Assets Employed:
|
|
|
||||||
|
Diversified industrial
|
$
|
518,035
|
|
$
|
525,695
|
|
||
|
Energy
|
445,899
|
|
502,929
|
|
||||
|
Financial services
|
228,264
|
|
173,861
|
|
||||
|
Corporate and other
|
224,289
|
|
243,465
|
|
||||
|
Segment totals
|
1,416,487
|
|
1,445,950
|
|
||||
|
Discontinued operations
|
76,418
|
|
76,295
|
|
||||
|
Total
|
$
|
1,492,905
|
|
$
|
1,522,245
|
|
||
The following table presents geographic revenue and long-lived asset information as of and for the year ended
December 31, 2014
and
2013
. In addition to property, plant and equipment, the amounts in
2014
and
2013
include
$8,400
and
$9,100
, respectively, of inactive properties from previous operating businesses, and other non-operating assets that are carried at the lower of cost or fair value and are included primarily in other non-current assets in the consolidated balance sheets.
128
STEEL PARTNERS HOLDINGS L.P.
Notes to Consolidated Financial Statements
(dollars in thousands except per unit data)
|
|
2014
|
2013
|
2012
|
|||||||||||||||||
|
|
Revenue
|
Long-lived assets
|
Revenue
|
Long-lived assets
|
Revenue
|
|||||||||||||||
|
Geographic information:
|
|
|
|
|
||||||||||||||||
|
United States
|
$
|
798,663
|
|
$
|
171,582
|
|
$
|
668,131
|
|
$
|
167,990
|
|
$
|
578,338
|
|
|||||
|
Foreign
|
50,867
|
|
12,732
|
|
52,983
|
|
14,118
|
|
52,433
|
|
||||||||||
|
Total
|
$
|
849,530
|
|
$
|
184,314
|
|
$
|
721,114
|
|
$
|
182,108
|
|
$
|
630,771
|
|
|||||
Foreign revenue is based on the country in which the legal subsidiary is domiciled. Neither revenue nor long-lived assets from any single foreign country was material to the consolidated revenues of the Company.
19. INCOME TAXES
Details of the provision for income taxes are follows:
|
|
Year Ended December 31,
|
|||||||||||
|
|
2014
|
2013
|
2012
|
|||||||||
|
Income from continuing operations before income taxes and equity method income (loss):
|
|
|
|
|||||||||
|
Domestic
|
$
|
25,137
|
|
$
|
16,648
|
|
$
|
29,447
|
|
|||
|
Foreign
|
136
|
|
(123
|
)
|
2,515
|
|
||||||
|
Total
|
$
|
25,273
|
|
$
|
16,525
|
|
$
|
31,962
|
|
|||
|
Income taxes:
|
|
|
|
|
||||||||
|
Current:
|
|
|
|
|
||||||||
|
Federal
|
$
|
7,706
|
|
$
|
4,178
|
|
$
|
1,718
|
|
|||
|
State
|
1,912
|
|
3,940
|
|
5,395
|
|
||||||
|
Foreign
|
1,360
|
|
(6,709
|
)
|
(728
|
)
|
||||||
|
Total income taxes, current
|
10,978
|
|
1,409
|
|
6,385
|
|
||||||
|
Deferred:
|
|
|
|
|
||||||||
|
Federal
|
13,208
|
|
1,834
|
|
5,627
|
|
||||||
|
State
|
419
|
|
1,982
|
|
948
|
|
||||||
|
Foreign
|
(317
|
)
|
1,252
|
|
108
|
|
||||||
|
Total income taxes, deferred
|
13,310
|
|
5,068
|
|
6,683
|
|
||||||
|
Income tax provision
|
$
|
24,288
|
|
$
|
6,477
|
|
$
|
13,068
|
|
|||
129
STEEL PARTNERS HOLDINGS L.P.
Notes to Consolidated Financial Statements
(dollars in thousands except per unit data)
The following is a reconciliation of income tax expense computed at the federal statutory rate to the provision for income taxes:
|
|
Year Ended December 31,
|
|||||||||||
|
|
2014
|
2013
|
2012
|
|||||||||
|
Income from continuing operations before income taxes and equity method income (loss)
|
$
|
25,273
|
|
$
|
16,525
|
|
$
|
31,962
|
|
|||
|
Federal income tax provision at statutory rate
|
$
|
8,846
|
|
$
|
5,771
|
|
$
|
10,728
|
|
|||
|
Loss passed through to common unitholders (a)
|
5,842
|
|
12,268
|
|
3,512
|
|
||||||
|
|
14,688
|
|
18,039
|
|
14,240
|
|
||||||
|
State income taxes
|
3,189
|
|
2,180
|
|
2,725
|
|
||||||
|
Change in valuation allowance
|
(7,730
|
)
|
(7,320
|
)
|
(7,245
|
)
|
||||||
|
Foreign tax rate differences
|
605
|
|
171
|
|
(112
|
)
|
||||||
|
Elimination of deferred tax assets upon corporate subsidiary liquidation
|
—
|
|
—
|
|
7,236
|
|
||||||
|
Uncertain tax positions
|
(116
|
)
|
(6,110
|
)
|
8
|
|
||||||
|
Permanent differences and other (b)
|
13,652
|
|
(483
|
)
|
(3,784
|
)
|
||||||
|
Income tax provision
|
$
|
24,288
|
|
$
|
6,477
|
|
$
|
13,068
|
|
|||
______________
(a) Represents taxes at statutory rate on loss for which no tax benefit is recognizable by SPLP and certain of its subsidiaries which are taxed as pass-through entities. Such loss is allocable directly to SPLP’s common unitholders.
(b) Amount in 2014 includes the tax effect of the non-deductible portion of the goodwill impairment recorded in the fourth quarter of 2014 (see Note 11 - "Goodwill and Other Intangible Assets, Net").
Deferred income taxes result from temporary differences in the financial basis and tax basis of assets and liabilities. The amounts shown on the following table represent the tax effect of temporary differences between the consolidated tax return basis of assets and liabilities and the corresponding basis for financial reporting, as well as tax credit and operating loss carryforwards.
130
STEEL PARTNERS HOLDINGS L.P.
Notes to Consolidated Financial Statements
(dollars in thousands except per unit data)
|
|
December 31,
|
|||||||
|
|
2014
|
2013
|
||||||
|
Deferred Tax Assets:
|
|
|
||||||
|
Operating loss carryforwards
|
$
|
90,958
|
|
$
|
113,749
|
|
||
|
Postretirement and postemployment employee benefits
|
84,628
|
|
59,405
|
|
||||
|
Tax credit carryforwards
|
37,220
|
|
36,749
|
|
||||
|
Accrued costs
|
7,131
|
|
5,564
|
|
||||
|
Unrealized losses on investments
|
5,265
|
|
—
|
|
||||
|
Inventories
|
2,168
|
|
2,064
|
|
||||
|
Foreign tax credits
|
201
|
|
—
|
|
||||
|
Environmental costs
|
913
|
|
1,220
|
|
||||
|
Impairment of long-lived assets
|
529
|
|
2,636
|
|
||||
|
Other
|
11,216
|
|
7,698
|
|
||||
|
Gross deferred tax assets
|
240,229
|
|
229,085
|
|
||||
|
|
||||||||
|
Deferred Tax Liabilities:
|
||||||||
|
Intangible assets
|
(39,321
|
)
|
(47,616
|
)
|
||||
|
Fixed assets
|
(37,010
|
)
|
(31,880
|
)
|
||||
|
Unremitted foreign earnings
|
(903
|
)
|
(7,569
|
)
|
||||
|
Unrealized gains on investments
|
—
|
|
(3,704
|
)
|
||||
|
Other
|
(870
|
)
|
(7,717
|
)
|
||||
|
Gross deferred tax liabilities
|
(78,104
|
)
|
(98,486
|
)
|
||||
|
Valuation allowance
|
(91,766
|
)
|
(82,044
|
)
|
||||
|
Net deferred tax assets
|
$
|
70,359
|
|
$
|
48,555
|
|
||
|
|
||||||||
|
Classified in the Consolidated Balance Sheets as follows:
|
||||||||
|
Deferred tax assets - current
|
$
|
30,262
|
|
$
|
21,722
|
|
||
|
Deferred tax assets - non-current
|
45,669
|
|
33,096
|
|
||||
|
Deferred tax liabilities - current
|
271
|
|
3,045
|
|
||||
|
Deferred tax liabilities - non-current
|
5,301
|
|
3,218
|
|
||||
|
$
|
70,359
|
|
$
|
48,555
|
|
|||
During 2014, 2013 and 2012, the Company changed its judgment about the realizability of its deferred tax assets at certain subsidiaries. In accordance with U.S. GAAP under ASC 740, the effect of a change in the beginning-of-the-year balance of a valuation allowance that results from a change in circumstances that causes a change in judgment about the realizability of the related deferred tax asset in future years should be included in income from continuing operations in the period of the change. As described in more detail below, in 2014, 2013 and 2012, the Company recorded tax benefits in continuing operations of approximately
$7,730
,
$7,320
and
$5,500
associated with the reversal of its deferred tax valuation allowances at certain subsidiaries.
HNH
At
December 31, 2014
, HNH has U.S. federal NOLs of approximately
$82,400
(approximately
$28,800
tax-effected), as well as, certain state NOLs. The U.S. federal NOLs expire between 2026 and 2029. Upon its emergence from bankruptcy in 2005, HNH experienced an ownership change as defined by Section 382 of the Internal Revenue Code. Section 382 imposes annual limitations on the utilization of net operating loss carryforwards post-ownership change. HNH believes it qualifies for the bankruptcy exception to the general Section 382 limitations. Under this exception, the annual limitation imposed by Section 382 resulting from an ownership change will not apply; instead the NOLs must be reduced by certain interest expense paid to creditors who became stockholders as a result of the bankruptcy reorganization. Thus, HNH's U.S. federal NOLs of
$82,400
as
131
STEEL PARTNERS HOLDINGS L.P.
Notes to Consolidated Financial Statements
(dollars in thousands except per unit data)
of
December 31, 2014
include a reduction of
$31,000
(
$10,800
tax-effect). HNH's 2014 tax provision from continuing and discontinued operations reflect utilization of approximately
$23,800
of Federal NOLs. Also included in deferred income tax assets are tax credit carryforwards of
$3,700
.
HNH provides income taxes on the undistributed earnings of non-U.S. corporate subsidiaries except to the extent that such earnings are permanently invested outside the United States. As of December 31, 2014,
$5,400
of accumulated undistributed earnings of non-U.S. corporate subsidiaries were permanently invested. At existing applicable income tax rates, additional taxes of approximately
$2,100
would need to be provided if such earnings were remitted.
Steel Excel
At
December 31, 2014
, Steel Excel had Federal net operating loss carryforwards of approximately
$113,000
that expire in 2021 through 2031, and domestic state net operating loss carryforwards of approximately
$159,900
that will expire in 2014 through 2031. Steel Excel also has federal research and development credit carryforwards of approximately
$30,300
that expire in 2018 through 2029, and domestic state research and development credit carryforwards of approximately
$17,700
that do not expire. Of the total Federal net operating loss carryforwards, approximately
$10,500
related to deductions for stock-based compensation, the tax benefit of which will be credited to additional paid-in capital when realized. Steel Excel's ability to utilize its net operating loss and other credit carryforwards would be subject to limitation upon a change in control. Federal income taxes and foreign withholding taxes associated with the repatriation of earnings of foreign subsidiaries have been fully provided.
Steel Excel established a valuation allowance to reserve its net deferred tax assets at December 31, 2014 and 2013 based on its assessment that it is more likely than not that such benefit will not be fully realized. This assessment was based on, but not limited to, Steel Excel’s operating results for the past three years, uncertainty in Steel Excel’s projections of taxable income, uncertainty in general economic conditions in general and in the oil and gas industry in particular, and the effects of multiple acquisitions and Steel Excel's ability to effectively integrate the acquired entities.
WebFinancial
During 2013 and 2012 WebFinancial had significant earnings and utilized the vast majority of its Federal and state NOLS. Accordingly, WebFinancial recorded tax benefits in continuing operations of approximately
$1,034
associated with the reversals of its deferred tax valuation allowances.
DGT
As of October 31, 2014 DGT had approximately
$28,818
of federal net operating loss carryforwards that are scheduled to expire from 2021 to 2031. Because of the uncertainty of future earnings of DGT, a valuation allowance has been established for the net operating loss carryforwards.
As described in Note 1 - “Nature of the Business and Basis of Presentation,” the Consolidated Balance Sheet as of and for the twelve months ended December 31, 2014 includes DGT’s activity as of and for its twelve months ended October 31, 2014.
132
STEEL PARTNERS HOLDINGS L.P.
Notes to Consolidated Financial Statements
(dollars in thousands except per unit data)
Unrecognized Tax Benefits
U.S. GAAP provides that the tax effects from an uncertain tax position can be recognized in the financial statements only if the position is more likely than not of being sustained on audit, based on the technical merits of the position. The change in the amount of unrecognized tax benefits (related solely to HNH and Steel Excel) for
2014
and
2013
was as follows:
|
Balance at December 31, 2012
|
$
|
28,692
|
|
|
Additions for tax positions related to current year
|
404
|
|
|
|
Additions due to interest accrued
|
80
|
|
|
|
Payments
|
(890
|
)
|
|
|
Reductions due to lapsed statute of limitations
|
(7,786
|
)
|
|
|
Other
|
(35
|
)
|
|
|
Balance at December 31, 2013
|
20,465
|
|
|
|
Additions for tax positions related to current year
|
144
|
|
|
|
Additions due to interest accrued
|
61
|
|
|
|
Reductions due to lapsed statute of limitations
|
(320
|
)
|
|
|
Balance at December 31, 2014
|
$
|
20,350
|
|
HNH Unrecognized Tax Benefits
At
December 31, 2014
and
2013
, HNH had approximately
$1,274
and
$1,344
, respectively, of unrecognized tax benefits, all of which would affect the Company's effective tax rate if recognized.
HNH recognizes interest and penalties related to uncertain tax positions in its income tax expense. As of
December 31, 2014
and
2013
, approximately
$100
of interest related to uncertain tax positions was accrued. No penalties were accrued. It is reasonably possible that the total amount of unrecognized tax benefits will decrease by as much as
$300
during the next twelve months as a result of the lapse of the applicable statutes of limitations in certain taxing jurisdictions. Adjustments to the reserve could occur in light of changing facts and circumstances with respect to the on-going examinations discussed below.
HNH is generally no longer subject to federal, state or local income tax examinations by tax authorities for any year prior to 2011, except as set forth below. However, NOLs generated in prior years are subject to examination and potential adjustment by the Internal Revenue Service ("IRS") upon their utilization in future years' tax returns.
The IRS initiated an examination of HNH's federal consolidated income tax return for 2010 in the second quarter of 2012, which was settled during 2013 with minor adjustments. In 2014, the IRS conducted a limited review of HNH's 2012 federal consolidated income tax return. HNH does not currently believe an increase in the reserve for uncertain tax positions is necessary. In addition, certain subsidiaries were examined by the Commonwealth of Massachusetts ("Commonwealth") for the years 2003 to 2005, and HNH settled that examination during 2013 for approximately
$300
. The Commonwealth also examined the 2008 tax return and issued an assessment for approximately
$300
which HNH is disputing. Examinations of 2009 and 2010 are also being conducted by the Commonwealth, as well as examinations by the State of New York and the State of Missouri for 2009 to 2011. These examinations are currently in progress, and HNH does not believe an increase in the reserve for uncertain tax positions is necessary.
Steel Excel Unrecognized Tax Benefits
Steel Excel's total gross unrecognized tax benefits were
$19,076
and
$19,121
at
December 31, 2014
and
2013
, respectively, of which
$100
, if recognized, would affect the provision for income taxes. In 2014, Steel Excel reversed approximately
$45,000
of reserves for for foreign taxes upon the expiration of the statute of limitations. In 2013, Steel Excel reversed approximately
$7,300
of reserves for foreign taxes upon the expiration of the statute of limitations. Steel Excel recognizes interest and penalties related to uncertain tax positions in its income tax provision. For the years ended
December 31, 2014
,
2013
and
2012
, the amount of such interest and penalties recognized was immaterial.
Steel Excel is subject to U.S. federal income tax as well as income taxes in many domestic states and foreign jurisdictions in which they operate or formerly operated in. As of
December 31, 2014
, fiscal years 1999 onward remain open to examination by the U.S. taxing authorities. In 2014, tax examinations were completed for fiscal years 2009 through 2013 in
133
STEEL PARTNERS HOLDINGS L.P.
Notes to Consolidated Financial Statements
(dollars in thousands except per unit data)
Singapore, resulting in a refund to the Company of
$1,700
. The Company is not currently under tax examination in any foreign jurisdictions.
Other Subsidiaries
SPLP's other subsidiaries file federal tax returns as well as state, local and foreign tax returns in various jurisdictions. Federal tax returns for all consolidated subsidiaries, including WFHC, BNS, DGT, and SPH Services remain open and subject to examination by the Internal Revenue Service for all tax years after 2009. In addition, net operating losses generated in prior years are subject to examination and potential adjustment by the Internal Revenue Service upon their utilization in future years' tax returns. State income tax returns for most jurisdictions remain open generally for all tax years after 2009. Certain state income tax returns remain open and subject to examination for tax years after 2007.
20. REGULATORY MATTERS
WebBank
WebBank is subject to various regulatory capital requirements administered by federal banking agencies. Failure to meet minimum capital requirements can initiate certain actions by regulators that, if undertaken, could have a direct material effect on WebBank’s financial statements. Under capital adequacy guidelines and the regulatory framework for prompt corrective action, WebBank must meet specific capital guidelines that involve quantitative measures of its assets, liabilities, and certain off-balance sheet items as calculated under regulatory accounting practices. WebBank’s capital amounts and classification are also subject to qualitative judgments by the regulators about components, risk weightings, and other factors.
Quantitative measures established by regulation to ensure capital adequacy require WebBank to maintain minimum amounts and ratios of Total and Tier 1 capital (as defined in the regulations) to risk-weighted assets (as defined), and of Tier I capital (as defined) to average quarterly assets (as defined). As of
December 31, 2014
, WebBank exceeded all the capital adequacy requirements to which it is subject.
As of
December 31, 2014
, WebBank was categorized as well-capitalized under the regulatory framework for prompt corrective action. There are no conditions or events, since the most recent FDIC notification, which have changed WebBank’s prompt corrective action category. To remain categorized as well-capitalized, WebBank will have to maintain minimum total risk-based, Tier 1 risk-based, and Tier 1 leverage capital as disclosed in the table below:
|
Amount of Capital Required
|
|||||||||||||||||||||
|
For capital
|
To be well capitalized under
|
||||||||||||||||||||
|
Actual
|
adequacy purposes
|
prompt corrective provisions
|
|||||||||||||||||||
|
As of December 31, 2014
|
Amount
|
Ratio
|
Amount
|
Ratio
|
Amount
|
Ratio
|
|||||||||||||||
|
Total Capital
|
|||||||||||||||||||||
|
(to risk-weighted assets)
|
$
|
42,861
|
|
24.99
|
%
|
$
|
13,720
|
|
8
|
%
|
$
|
17,150
|
|
10
|
%
|
||||||
|
Tier 1 Capital
|
|||||||||||||||||||||
|
(to risk-weighted assets)
|
$
|
42,116
|
|
24.56
|
%
|
$
|
6,860
|
|
4
|
%
|
$
|
10,290
|
|
6
|
%
|
||||||
|
Tier 1 Capital
|
|||||||||||||||||||||
|
(to average assets)
|
$
|
42,116
|
|
19.53
|
%
|
$
|
8,627
|
|
4
|
%
|
$
|
10,784
|
|
5
|
%
|
||||||
|
As of December 31, 2013
|
|||||||||||||||||||||
|
Total Capital
|
|||||||||||||||||||||
|
(to risk-weighted assets)
|
$
|
32,982
|
|
34.78
|
%
|
$
|
7,586
|
|
8
|
%
|
$
|
9,482
|
|
10
|
%
|
||||||
|
Tier 1 Capital
|
|||||||||||||||||||||
|
(to risk-weighted assets)
|
$
|
32,093
|
|
33.85
|
%
|
$
|
3,793
|
|
4
|
%
|
$
|
5,689
|
|
6
|
%
|
||||||
|
Tier 1 Capital
|
|||||||||||||||||||||
|
(to average assets)
|
$
|
32,093
|
|
23.03
|
%
|
$
|
5,573
|
|
4
|
%
|
$
|
6,967
|
|
5
|
%
|
||||||
134
STEEL PARTNERS HOLDINGS L.P.
Notes to Consolidated Financial Statements
(dollars in thousands except per unit data)
SPLP
The Company historically has conducted its business, and continues to conduct its business and operations, in such a manner so as not to be deemed an investment company under the Investment Company Act of 1940, as amended (the “Act”).
Under the Act, the Company is required to meet certain qualitative tests related to the Company’s assets and/or income, and to refrain from trading for short-term speculative purposes. The Company has taken actions, including liquidating certain of our assets and acquiring additional interests in existing or new subsidiaries or controlled companies, to comply with these tests, or a relevant exception. Also, since the Company operates as a diversified holding company engaged in a variety of operating businesses, we do not believe we are primarily engaged in an investment company type business, nor do we propose to primarily engage in such a business.
If we were deemed to be an investment company under the Investment Company Act, we may need to further adjust our business strategy and assets, including divesting certain desirable assets immediately to fall outside of the definition or within an exemption, to register as an investment company or to cease operations.
135
STEEL PARTNERS HOLDINGS L.P.
Notes to Consolidated Financial Statements
(dollars in thousands except per unit data)
21. COMMITMENTS AND CONTINGENCIES
Operating Lease Commitments
The Company has certain facilities under non-cancelable operating lease arrangements. Rent expense recognized in the consolidated statement of operations for the years ended
December 31, 2014
,
2013
and 2012 was
$8,501
and
$7,631
,
$7,423
respectively. Future minimum operating lease and rental commitments under non-cancelable operating leases for SPLP consolidated operations are as follows:
|
Payments due by period
|
Amount
|
||
|
Less than 1 year
|
$
|
7,147
|
|
|
1-3 years
|
11,027
|
|
|
|
3-5 years
|
7,632
|
|
|
|
More than 5 years
|
8,855
|
|
|
|
Total
|
$
|
34,661
|
|
In addition, the Company is the lessor for one property. Future non-cancelable leases on that property provide for rent of approximately
$490
for each of the next four years.
Environmental Matters
As discussed in more detail below, HNH and BNS have been designated as potentially responsible parties ("PRPs") by federal and state agencies with respect to certain sites with which they may have had direct or indirect involvement. These claims are in various stages of administrative or judicial proceedings and include demands for recovery of past governmental costs and for future investigations and remedial actions. In many cases, the dollar amounts of the claims have not been specified and, with respect to a number of the PRP claims, have been asserted against a number of other entities for the same cost recovery or other relief as was asserted against the HNH and BNS. The Company accrues costs associated with environmental matters, on an undiscounted basis, when they become probable and reasonably estimable. As of
December 31, 2014
, and
2013
, on a consolidated basis, the Company has accrued
$3,822
and
$4,622
, respectively, which represents its current estimate of the probable cleanup liabilities, including remediation and legal costs. In addition, the Company has insurance coverage available for several of these matters and believes that excess insurance coverage may be available as well.
Estimates of the Company's liability for remediation of a particular site and the method and ultimate cost of remediation require a number of assumptions that are inherently difficult to make, and the ultimate outcome may be materially different from current estimates.
HNH Environmental Matters
Certain H&H Group subsidiaries have existing and contingent liabilities relating to environmental matters, including capital expenditures, costs of remediation and potential fines and penalties relating to possible violations of national and state environmental laws. Those subsidiaries have substantial remediation expenses on an ongoing basis, although such costs are continually being readjusted based upon the emergence of new techniques and alternative methods. HNH had approximately
$2,400
accrued related to estimated environmental remediation costs as of
December 31, 2014
. HNH also has insurance coverage available for several of these matters and believes that excess insurance coverage may be available as well. During the years ended
December 31, 2014
and 2013, HNH recorded insurance reimbursements of
$3,100
and
$1,100
, respectively, for previously incurred remediation costs.
In addition, certain H&H Group subsidiaries have been identified as PRPs under the Comprehensive Environmental Response, Compensation and Liability Act ("CERCLA") or similar state statutes at sites and are parties to administrative consent orders in connection with certain properties. Those subsidiaries may be subject to joint and several liabilities imposed by CERCLA on PRPs. Due to the technical and regulatory complexity of remedial activities and the difficulties attendant in identifying PRPs and allocating or determining liability among them, the subsidiaries are unable to reasonably estimate the ultimate cost of compliance with such laws.
136
STEEL PARTNERS HOLDINGS L.P.
Notes to Consolidated Financial Statements
(dollars in thousands except per unit data)
Based upon information currently available, however, the H&H Group subsidiaries do not expect that their respective environmental costs, including the incurrence of additional fines and penalties, if any, will have a material adverse effect on them or that the resolution of these environmental matters will have a material adverse effect on the financial position, results of operations or cash flows of such subsidiaries or HNH, but there can be no such assurances. HNH anticipates that the H&H Group subsidiaries will pay any such amounts out of their respective working capital, although there is no assurance that they will have sufficient funds to pay them. In the event that the H&H Group subsidiaries are unable to fund their liabilities, claims could be made against their respective parent companies, including H&H Group and/or HNH, for payment of such liabilities.
Among the sites where certain H&H Group subsidiaries may have more substantial environmental liabilities are the following:
H&H has been working with the Connecticut Department of Energy and Environmental Protection ("CTDEEP") with respect to its obligations under a 1989 consent order that applies to a property in Connecticut that H&H sold in 2003 ("Sold Parcel") and an adjacent parcel ("Adjacent Parcel") that together with the Sold Parcel comprises the site of a former H&H manufacturing facility. Remediation of all soil conditions on the Sold Parcel was completed on April 6, 2007. On September 11, 2008, the CTDEEP advised H&H that it had approved H&H's December 28, 2007 Soil Remediation Action Report, as amended, thereby concluding the active remediation of the Sold Parcel. The remaining remediation, monitoring and regulatory administrative costs for the Sold Parcel are expected to approximate
$100
. With respect to the Adjacent Parcel, an ecological risk assessment has been completed and the results, along with proposed clean up goals will be submitted to the CTDEEP for their review and approval. The total remediation costs for the Adjacent Parcel cannot be reasonably estimated at this time. Accordingly, there can be no assurance that the resolution of this matter will not be material to the financial position, results of operations or cash flows of H&H or HNH.
In 1986, Handy & Harman Electronic Materials Corporation ("HHEM"), a subsidiary of H&H, entered into an administrative consent order ("ACO") with the New Jersey Department of Environmental Protection ("NJDEP") with regard to certain property that it purchased in 1984 in New Jersey. The ACO involves investigation and remediation activities to be performed with regard to soil and groundwater contamination. Thereafter, in 1998, HHEM and H&H settled a case brought by the local municipality in regard to this site and also settled with certain of its insurance carriers. HHEM is actively remediating the property and continuing to investigate effective methods for achieving compliance with the ACO. A remedial investigation report was filed with the NJDEP in December 2007. By letter dated December 12, 2008, the NJDEP issued its approval with respect to additional investigation and remediation activities discussed in the December 2007 remedial investigation report. HHEM anticipates entering into discussions with the NJDEP to address that agency's potential natural resource damage claims, the ultimate scope and cost of which cannot be estimated at this time. Pursuant to a settlement agreement with the former owner/operator of the site, the responsibility for site investigation and remediation costs, as well as any other costs, as defined in the settlement agreement, related to or arising from environmental contamination on the property (collectively, "Costs") are contractually allocated
75%
to the former owner/operator (with separate guaranties by the two joint venture partners of the former owner/operator for
37.5%
each) and
25%
jointly to HHEM and H&H after the first
$1,000
. The
$1,000
was paid solely by the former owner/operator. As of
December 31, 2014
, over and above the
$1,000
, total investigation and remediation costs of approximately
$4,500
and
$1,500
have been expended by the former owner/operator and HHEM, respectively, in accordance with the settlement agreement. Additionally, HHEM is currently being reimbursed indirectly through insurance coverage for a portion of the Costs for which HHEM is responsible. HHEM believes that there is additional excess insurance coverage, which it intends to pursue as necessary. HHEM anticipates that there will be additional remediation expenses to be incurred once a final remediation plan is agreed upon. There is no assurance that the former owner/operator or guarantors will continue to timely reimburse HHEM for expenditures and/or will be financially capable of fulfilling their obligations under the settlement agreement and the guaranties. The final Costs cannot be reasonably estimated at this time, and accordingly, there can be no assurance that the resolution of this matter will not be material to the financial position, results of operations or cash flows of HHEM or HNH.
HHEM is continuing to comply with a 1987 consent order from the Massachusetts Department of Environmental Protection ("MADEP") to investigate and remediate the soil and groundwater conditions at a commercial/industrial property in Massachusetts. On June 30, 2010, HHEM filed a Response Action Outcome report to close the site since HHEM's licensed site professional concluded that groundwater monitoring demonstrated that the groundwater conditions have stabilized or continue to improve at the site. On June 20, 2013, HHEM received the MADEP's Notice of Audit Findings and Notice of Noncompliance ("Notice"). HHEM and its consultant held meetings with the MADEP to resolve differences identified in the Notice. As a result of those meetings and subsequent discussions, HHEM will conduct additional sampling, testing, site investigations and install additional off-site wells. The additional work is expected to be completed in the first quarter of 2015, with a follow-up response report submitted to the MADEP thereafter. The cost of this additional work is estimated at
$200
.
137
STEEL PARTNERS HOLDINGS L.P.
Notes to Consolidated Financial Statements
(dollars in thousands except per unit data)
Additional costs could result from these testing activities and final acceptance of the remediation plan by the MADEP, which cannot be reasonably estimated at this time.
BNS Sub Environmental Matters
On June 4, 2013 BNS LLC, a wholly-owned subsidiary of the BNS Liquidating Trust, was identified by the U.S. Environmental Protection Agency (“EPA”) as a PRP as an alleged waste generator that disposed of wastes at the Operable Unit Two of the Peterson/Puritan, Inc. Superfund Site which includes the J.M. Mills Landfill in Cumberland, RI.
On August 12, 2008, a then-subsidiary of BNS (“BNS Sub”) was identified as a PRP by the EPA as an alleged drum reconditioning customer of New England Container Corp. (“NECC”). BNS Sub is presently investigating the matter and has joined a group of other alleged NECC drum reconditioning customers, The group have agreed with the EPA to perform test sampling and analysis of a targeted portion of the site per agreement with the EPA in accordance with a Record of Decision and an Administrative Settlement Agreement and Order on Consent. The NECC drum reconditioning PRP group has incurred and will continue to incur costs in the investigation and each PRP has been assessed a fee for its pro-rata share of the costs of performing the assessment. The liability accrual is part of the BNS Liquidating Trust.
Based upon information currently available, BNS Liquidating Trust and and BNS Sub do not expect that their respective environmental costs or that the resolution of these environmental matters will have a material adverse effect on the financial position, results of operations or cash flows of the Company, but there can be no such assurances to this effect.
Litigation Matters
HNH Litigation Matters
In the ordinary course of business, HNH is subject to periodic lawsuits, investigations, claims and proceedings, including, but not limited to, contractual disputes, employment, environmental, health and safety matters, as well as claims associated with HNH's historical acquisitions and divestitures. There is insurance coverage available for many of the foregoing actions. Although HNH cannot predict with certainty the ultimate resolution of lawsuits, investigations, claims and proceedings asserted against it, they do not believe any currently pending legal proceeding to which they are a party will have a material adverse effect on their business, prospects, financial condition, cash flows, results of operations or liquidity.
BNS Litigation Matters
BNS Sub has been named as a defendant in
1,326
and
1,234
alleged asbestos-related toxic-tort claims as of
December 31, 2014
and
2013
, respectively. The claims were filed over a period beginning 1994 through
December 31, 2014
. In many cases these claims involved more than
100
defendants. Of the claims filed,
1,108
and
1,023
were dismissed, settled or granted summary judgment and closed as of
December 31, 2014
and
2013
, respectively. Of the claims settled, the average settlement was less than
$3
. There remained
218
and
211
pending asbestos claims as of
December 31, 2014
and
2013
, respectively. There can be no assurance that the number of future claims and the related costs of defense, settlements or judgments will be consistent with the experience to date of existing claims.
BNS Sub has insurance policies covering asbestos-related claims for years beginning 1974 through 1988 with estimated aggregate coverage limits of
$183,000
, with
$2,102
and
$2,082
at
December 31, 2014
and
2013
,respectively, in estimated remaining self insurance retention (deductible). There is secondary evidence of coverage from 1970 to 1973 although there is no assurance that the insurers will recognize that the coverage was in place. Policies issued for BNS Sub beginning in 1989 contained exclusions related to asbestos. Under certain circumstances, some of the settled claims may be reopened. Also, there may be a significant delay in receipt of notification by BNS Sub of the entry of a dismissal or settlement of a claim or the filing of a new claim. BNS Sub believes it has significant defenses to any liability for toxic-tort claims on the merits. None of these toxic-tort claims has gone to trial and, therefore, there can be no assurance that these defenses will prevail. In addition, there can be no assurance that the number of future claims and the related costs of defense, settlements or judgments will be consistent with the experience to date of existing claims, and that BNS Sub will not need to increase significantly its estimated liability for the costs to settle these claims to an amount that could have a material effect on the consolidated financial statements.
BNS Sub annually receives retroactive billings or credits from its insurance carriers for any increase or decrease in claims accruals as claims are filed, settled or dismissed, or as estimates of the ultimate settlement and defense costs for the then-
138
STEEL PARTNERS HOLDINGS L.P.
Notes to Consolidated Financial Statements
(dollars in thousands except per unit data)
existing claims are revised. As of
December 31, 2014
and
2013
, BNS Sub has accrued
$1,422
relating to the open and active claims against BNS Sub. This accrual represents the Company’s best estimate of the likely costs to defend against or settle these claims by BNS Sub beyond the amounts accrued by the insurance carriers and previously funded, through the retroactive billings by BNS Sub. However, there can be no assurance that BNS Sub will not need to take additional charges in connection with the defense, settlement or judgment of these existing claims or that the costs of future claims and the related costs of defense, settlements or judgments will be consistent with the experience to date relating to existing claims
.
These claims are now being managed by the BNS Liquidating Trust (see Note 16 -
"
Capital and Accumulated Other Comprehensive Income").
22. SUBSEQUENT EVENTS
CoSine/API Group plc Transaction
On January 20, 2015, the Company entered into a contribution agreement (the “Contribution Agreement”) with CoSine. Pursuant to the Contribution Agreement, SPH Group Holdings LLC ("SPH Holdings") contributed (i)
24,807,203
ordinary shares of API and (ii)
445,456
shares of common stock of Nathan’s to CoSine in exchange for
16,500,000
shares of newly issued CoSine common stock and
12,761
shares of newly issued
7.5%
series B non-voting preferred stock, which increased our ownership of CoSine to approximately
80%
. This was the first step in a plan for a wholly owned UK subsidiary of CoSine ("BidCo") to make an offer (the “Offer”) to acquire all of the issued and to be issued shares in API for
60
pence in cash per API share not already owned by BidCo. API is a manufacturer and distributor of foils, films and laminates used to enhance the visual appeal of products and packaging.
As a result of the above transaction, CoSine became a majority-owned controlled subsidiary and will be consolidated with SPLP in the first quarter of 2015. Prior to obtaining a controlling interest, SPLP owned approximately
48%
of the outstanding shares of CoSine, and its investment was accounted for under the traditional equity method.
The Company's previously held common equity interest in CoSine was valued at approximately
$2.50
per share, for a total fair value of approximately
$12,000
. As a result of remeasuring the previously held common equity interest to fair value, the Company expects to recognize an investment gain of approximately
$6,300
in the first quarter of 2015.
The total fair value of the consideration paid for SPLP's controlling interest in CoSine was approximately
$66,200
, which includes the fair value of our previously held equity interest of
$12,000
and the fair value of the newly issued common and preferred CoSine stock of approximately
$54,200
.
On January 20, 2015, SPH Holdings provided a loan to BidCo in the aggregate principal amount of
$37,000
, secured by all assets of BidCo (the “Loan”), pursuant to the terms and conditions of a Secured Promissory Note. The proceeds of the Loan will be used by BidCo solely to fund the Offer.
On January 22, 2015, Bidco issued an announcement under Rule 2.7 of the United Kingdom City Code on Takeovers and Mergers announcing the Offer. The Offer was commenced on February 4, 2015. As of March 5, 2015, BidCo owned approximately
71.2%
of API. Also on March 5, 2015 BidCo announced its intention to close the Offer, effective March 19, 2015.
HNH Tender Offer for JPS
On December 30, 2014, HNH issued a press release announcing that it had sent a letter to JPS stating its willingness to enter into a definitive merger agreement with JPS to acquire all of the outstanding shares of common stock of JPS not already owned by the Company’s parent, SPLP, for
$10.00
per share in cash. On January 26, 2015, HNH issued a press release announcing that HNH Group Acquisition LLC, a newly formed subsidiary of H&H Group, has commenced a tender offer to purchase up to
10,028,724
shares, or approximately
96.5%
of the outstanding shares, of common stock of JPS at a price of
$10.00
per share in cash to all stockholders other than SPLP, and with respect to the
4,021,580
JPS shares owned by SPLP, in exchange for common stock of HNH. If all shares are tendered, HNH would exchange approximately
$60,100
in cash and
863,946
shares of its common stock. On January 22, 2015, H&H Group, and certain subsidiaries of H&H Group, entered into a second amendment ("Second Amendment") to its Senior Credit Facility to, among other things, provide for the consent of the administrative agent and the lenders, subject to compliance with certain conditions, for the tender offer by HNH Group Acquisition LLC for the shares of JPS, including the use of up to
$71,000
under the Senior Credit Facility to purchase such shares, and certain transactions related thereto. In addition, HNH Group Acquisition LLC and HNH Acquisition LLC, another newly formed subsidiary of H&H Group, will become guarantors under the Senior Credit Facility pursuant to the Second Amendment.
139
STEEL PARTNERS HOLDINGS L.P.
Notes to Consolidated Financial Statements
(dollars in thousands except per unit data)
On March 4, 2015, HNH announced that it was extending the expiration of the tender offer from March 9, 2015
to March 23, 2015. The extension of the tender offer is intended to facilitate the discussions between the Company and JPS regarding a potential negotiated transaction. There is no assurance that HNH and JPS will enter into a definitive agreement.
Management Services Agreement with MLNK and WebFinancial Holding Corporation
On December 24, 2014, SP Corporate entered into a Management Services Agreement, which was effective as of January 1, 2015, (the “Management Services Agreement”) with MLNK, an associated company investment of the Company (see Note 5 - Investments"). Pursuant to the Management Services Agreement, SP Corporate will provide MLNK and its subsidiaries with the services of certain employees, including certain executive officers, and other corporate services. The Management Services Agreement provides that MLNK will pay SP Corporate a fixed monthly fee of
$175
in consideration of the services defined in the Management Services Agreement. The Management Services Agreement will continue through June 30, 2015 unless and until terminated under the terms of the Management Services Agreement.
Effective as of January 1, 2015, SP Corporate also entered into a Management Services Agreement with WebFinancial Holding Corporation. The agreement provides that WebFinancial Holding Corporation shall pay to SP Corporate the sum of
$2,000
per annum. The Management Services Agreement will continue through December 31, 2015, and shall automatically renew for successive one year unless and until terminated by either party, on any anniversary date, upon not less than thirty days prior written notice to the other.
Management Agreement
On January 7, 2015, SP Corporate and the Manager entered into an amended Management Agreement effective as of January 1, 2015, to assign the rights and obligations of the Company and SPH Group LLC, a directly and indirectly wholly owned subsidiary of the Company, to SP Corporate to assist SP Corporate in connection with the services it renders to the Managed Entities (as defined in the Management Agreement) and to remove the provisions related to the Incentive Units (as defined in the Management Agreement), which are restated in a separate agreement. Also, on January 7, 2015, SPH GP entered into the Fifth Amended and Restated Agreement of Limited Partnership of the Company (the “Limited Partnership Agreement”) to reflect certain clarifications, including changes consistent with the revisions to the Management Agreement.
SPII Liquidating Trust
In February 2015, the SPII Liquidating Trust comprising Trust H was fully liquidated. As a result, the Company received its proportional interest of the cash and investments in Trust H totaling approximately
$2,730
. There was no gain or loss recorded on the transaction.
140
STEEL PARTNERS HOLDINGS L.P.
Notes to Consolidated Financial Statements
(dollars in thousands except per unit data)
23. QUARTERLY FINANICIAL DATA (unaudited)
|
|
|
Net (Loss) Income From Continuing Operations Attributable to Common Unit Holders
|
Net (Loss) Income Attributable to Common Unit Holders
|
|||||||||||||||||||||||||
|
Quarter
|
Revenue
|
Net (Loss) Income From Continuing Operations
|
Per Common Unit Basic
|
Per Common Unit Diluted
|
Net (Loss)Income Attributable to Common Unit Holders
|
Per Common Unit Basic
|
Per Common Unit Diluted
|
|||||||||||||||||||||
|
2014
|
|
|
|
|
|
|
|
|||||||||||||||||||||
|
First
|
$
|
187,857
|
|
$
|
(14,357
|
)
|
$
|
(0.46
|
)
|
$
|
(0.46
|
)
|
$
|
(12,706
|
)
|
$
|
(0.41
|
)
|
$
|
(0.41
|
)
|
|||||||
|
Second
|
228,003
|
|
17,573
|
|
0.27
|
|
0.27
|
|
9,795
|
|
0.34
|
|
0.34
|
|
||||||||||||||
|
Third
|
234,523
|
|
18,545
|
|
0.46
|
|
0.46
|
|
14,027
|
|
0.50
|
|
0.50
|
|
||||||||||||||
|
Fourth (a)
|
199,147
|
|
(39,333
|
)
|
(0.72
|
)
|
(0.72
|
)
|
(18,671
|
)
|
(0.68
|
)
|
(0.68
|
)
|
||||||||||||||
|
|
$
|
849,530
|
|
$
|
(17,572
|
)
|
|
|
|
|
$
|
(7,555
|
)
|
|
|
|
|
|||||||||||
|
2013
|
|
|
|
|
|
|
|
|
|
|
|
|
|
|
||||||||||||||
|
First
|
$
|
162,158
|
|
$
|
(15,306
|
)
|
$
|
(0.52
|
)
|
$
|
(0.52
|
)
|
$
|
(11,950
|
)
|
$
|
(0.40
|
)
|
$
|
(0.40
|
)
|
|||||||
|
Second
|
197,373
|
|
22,577
|
|
0.51
|
|
0.51
|
|
16,097
|
|
0.53
|
|
0.53
|
|
||||||||||||||
|
Third
|
191,588
|
|
(12,871
|
)
|
(0.53
|
)
|
(0.53
|
)
|
(15,446
|
)
|
(0.52
|
)
|
(0.52
|
)
|
||||||||||||||
|
Fourth
|
169,995
|
|
43,974
|
|
1.05
|
|
0.99
|
|
30,759
|
|
1.04
|
|
0.99
|
|
||||||||||||||
|
|
$
|
721,114
|
|
$
|
38,374
|
|
|
|
|
|
$
|
19,460
|
|
|
|
|
|
|||||||||||
(a) In the fourth quarter of 2014, the Company recorded a goodwill impairment of
$41,450
related to the goodwill associated with its Energy segment (see Note 11 - "Goodwill and Other Intangible Assets, Net").
141
None.
Item 9A
.
Controls and Procedures
Disclosure Controls and Procedures
As required by Rule 13a-15(b) under the Exchange Act, we conducted an evaluation under the supervision and with the participation of our management, including the Chief Executive Officer and the Chief Financial Officer, of the effectiveness of our disclosure controls and procedures as of the end of the period covered by this report. Based on that evaluation, the Chief Executive Officer and the Chief Financial Officer concluded that as of
December 31, 2014
our disclosure controls and procedures are effective in ensuring that all information required to be disclosed in reports that we file or submit under the Exchange Act is recorded, processed, summarized and reported within the time periods specified in the SEC rules and forms and that such information is accumulated and communicated to our management, including our Chief Executive Officer and Chief Financial Officer, in a manner that allows timely decisions regarding required disclosure.
Management's Report on Internal Control Over Financial Reporting
Management of the Company is responsible for establishing and maintaining adequate internal control over financial reporting, as such term is defined in Rule 13a-15(f) under the Exchange Act. Our internal control over financial reporting is a process designed to provide reasonable assurance regarding the reliability of financial reporting and the preparation of the Company's consolidated financial statements for external reporting purposes in accordance with U.S. generally accepted accounting principles.
Under the supervision and with the participation of the Company's management, including the Company's Chief Executive Officer and Chief Financial Officer, the Company conducted an evaluation of the effectiveness of the internal control over financial reporting of the Company as referred to above as of
December 31, 2014
as required by Rule 13a-15(c) under the Exchange Act. In making this assessment, the Company used the criteria set forth in the framework in Internal Control - Integrated Framework issued by the Committee of Sponsoring Organizations of the Treadway Commission. Based on its evaluation under the framework in Internal Control - Integrated Framework (2013), management concluded that the Company's internal control over financial reporting was effective as of
December 31, 2014
.
BDO USA, LLP, the independent registered public accounting firm who audited the Company's
2014
consolidated financial statements included in this Annual Report on Form 10-K, has issued a report on the effectiveness of the Company's internal control over financial reporting as of
December 31, 2014
, which is included herein.
Changes in Internal Control over Financial Reporting
No change in internal control over financial reporting occurred during the quarter ended
December 31, 2014
that has materially affected, or is reasonably likely to materially affect, the Company ’s internal control over financial reporting.
Inherent Limitations Over Controls
Because of its inherent limitations, internal control over financial reporting may not prevent or detect misstatements. Also, projections of any evaluation of effectiveness to future periods are subject to the risk that controls may become inadequate because of changes in conditions, or that the degree of compliance with the policies or procedures may deteriorate.
None.
142
|
Item 10.
|
Directors, Executive Officers and Corporate Governance
|
The Company’s definitive proxy statement which will be filed with the SEC pursuant to Registration 14A within 120 days of the end of the Company's fiscal year is incorporated herein by reference.
|
Item 11.
|
Executive Compensation
|
The Company’s definitive proxy statement which will be filed with the SEC pursuant to Registration 14A within 120 days of the end of the Company's fiscal year is incorporated herein by reference.
|
Item 12.
|
Security Ownership of Certain Beneficial Owners and Management and Related Stockholder Matters
|
The Company’s definitive proxy statement which will be filed with the SEC pursuant to Registration 14A within 120 days of the end of the Company's fiscal year is incorporated herein by reference.
|
Item 13.
|
Certain Relationships and Related Transactions, and Director Independence
|
The Company’s definitive proxy statement which will be filed with the SEC pursuant to Registration 14A within 120 days of the end of the Company's fiscal year is incorporated herein by reference.
The Company’s definitive proxy statement which will be filed with the SEC pursuant to Registration 14A within 120 days of the end of the Company's fiscal year is incorporated herein by reference.
Item 15.
Exhibits and Financial Statement Schedules
(a) Financial Statements
The following financial statements of Steel Partners Holdings L.P., and subsidiaries, are included in Part II, Item 8 of this report:
|
Consolidated Balance Sheets as of December 31, 2014 and 2013
|
|
Consolidated Statements of Operations for the years ended December 31, 2014, 2013 and 2012
|
|
Consolidated Statements of Comprehensive (Loss) Income for the years ended December 31, 2014, 2013 and 2012
|
|
Consolidated Statements of Cash Flows for the years ended December 31, 2014, 2013 and 2012
|
|
Consolidated Statements of Changes in Capital for the years ended December 31, 2014, 2013 and 2012
|
|
Notes to Consolidated Financial Statements
|
(b)
Exhibits.
The following documents are filed as exhibits hereto:
|
Exhibit No.
|
Description
|
|
2.1
|
Share Acquisition Agreement, dated as of April 30, 2012, by and among Steel Excel Inc., BNS Holding, Inc., SWH, Inc. and SPH Group Holdings LLC. (incorporated by reference to Exhibit 2.1 of Steel Partners Holdings L.P.'s Current Report on Form 8-K, filed June 6, 2012).
|
|
2.2
|
Asset Purchase Agreement between F&H Acquisition Corp. and Cerberus Business Finance, LLC (incorporated by reference to Exhibit 2.1 of Steel Partners Holdings L.P.'s Current Report on Form 8-K, filed March 14, 2014).
|
143
|
3.1
|
Certificate of Limited Partnership (incorporated by reference to Exhibit 3.1 to Steel Partners Holdings L.P.'s Registration Statement on Form 10 filed December 15, 2011).
|
|
3.2
|
Amendment to the Certificate of Limited Partnership, dated April 2, 2009 (incorporated by reference to Exhibit 3.2 to Steel Partners Holdings L.P.'s Registration Statement on Form 10 filed December 15, 2011).
|
|
3.3
|
Amendment to the Certificate of Limited Partnership, dated January 20, 2010 (incorporated by reference to Exhibit 3.3 to Steel Partners Holdings L.P.'s Registration Statement on Form 10 filed December 15, 2011).
|
|
3.4
|
Amendment to the Certificate of Limited Partnership, dated October 15, 2010 (incorporated by reference to Exhibit 3.4 to Steel Partners Holdings L.P.'s Registration Statement on Form 10 filed December 15, 2011).
|
|
3.5
|
Fourth Amended and Restated Agreement of Limited Partnership of Steel Partners Holdings L.P. dated as of July 14, 2009. (incorporated by reference to Exhibit 10.2 to Steel Partners Holdings L.P.'s Current Report on Form 8-K, filed October 15, 2013).
|
|
4.1
|
Credit Agreement, dated as of October 23, 2013, by and among SPH Group Holdings LLC, Steel Partners Holdings L.P., the lenders thereunder and PNC Bank, National Association, in its capacity as administrative agent for the lenders thereunder (incorporated by reference to Exhibit 99.1 to Steel Partners Holdings L.P.'s Current Report on Form 8-K, filed October 28, 2013).
|
|
4.2
|
First Amendment, dated as of December 15, 2014, to the Credit Agreement. dated as of October 13, 2013 by and among SPH Group Holdings LLC, Steel Partners Holdings L.P., the lenders thereunder and PNC Bank, National Association, in its capacity as administrative agent for the lenders thereunder (incorporated by reference to Exhibit 4.1 to Steel Partners Holdings L.P.'s Current Report on Form 8-K, filed December 15, 2014).
|
|
10.1
|
License Agreement by and between Steel Partners LLC and Steel Partners Holdings L.P., dated January 1, 2009 (incorporated by reference to Exhibit 10.3 to Steel Partners Holdings L.P.'s Registration Statement on Form 10 filed December 15, 2011).
|
|
10.2
|
Assignment and Assumption Agreement by and among Steel Partners II (Offshore) Ltd., WGL Capital Corp. and Steel Partners Holdings L.P., dated July 15, 2009 (incorporated by reference to Exhibit 10.4 to Amendment No. 1 of Steel Partners Holdings L.P.'s Registration Statement on Form 10 filed January 20, 2012).
|
|
10.3
|
Second Amended and Restated Deferred Fee Agreement, dated as of October 31, 2002, as amended and restated as of January 1, 2005, and as further amended and restated as of July 15, 2009, by and between Steel Partners Holdings L.P. and WGL Capital Corp (incorporated by reference to Exhibit 10.5 to Amendment No. 1 of Steel Partners Holdings L.P.'s Registration Statement on Form 10 filed January 20, 2012).
|
|
10.4
|
Investor Services Agreement by and among Steel Partners Holdings L.P., Steel Partners LLC and WGL Capital Corp., dated July 15, 2009 (incorporated by reference to Exhibit 10.6 to Steel Partners Holdings L.P.'s Registration Statement on Form 10 filed December 15, 2011).
|
|
10.5
|
Advance Agreement by and between Steel Partners Holdings L.P. and Steel Partners II Master Fund L.P., dated June 28, 2009 (incorporated by reference to Exhibit 10.7 to Steel Partners Holdings L.P.'s Registration Statement on Form 10 filed December 15, 2011).
|
|
10.6
|
Amended and Restated Services Agreement by and between Steel Partners Holdings L.P. and SP Corporate Services, LLC, effective as of dated July 15, 2009 (incorporated by reference to Exhibit 10.8 to Amendment No. 1 of Steel Partners Holdings L.P.'s Registration Statement on Form 10 filed January 20, 2012).
|
|
10.7
|
Letter Agreement by and between Steel Partners Holdings L.P. and Steel Partners II GP LLC, dated July 15, 2009 (incorporated by reference to Exhibit 10.9 to Steel Partners Holdings L.P.'s Registration Statement on Form 10 filed December 15, 2011).
|
|
10.8
|
Management Services Agreement by and between SP Corporate Services LLC and Handy & Harman Ltd. and Handy & Harman Group Ltd., dated as of January 1, 2012 (incorporated by reference to Exhibit 10.10 to Amendment No. 1 of Steel Partners Holdings L.P.'s Registration Statement on Form 10 filed January 20, 2012).
|
|
10.9***
|
Employment Agreement by and among WHX Corporation, Handy & Harman, and James McCabe, Jr. dated as of February 1, 2007 (incorporated by reference to Exhibit 10.1 of Steel Partners Holdings L.P.'s Form 10-Q, filed May 15, 2012).
|
|
10.10***
|
Amendment to Employment Agreement by and among WHX Corporation, Handy & Harman, and James F. McCabe, Jr., effective January 1, 2009 (incorporated by reference to Exhibit 10.2 of Steel Partners Holdings L.P.'s Form 10-Q, filed May 15, 2012).
|
144
|
10.11***
|
Second Amendment to Employment Agreement by and among WHX Corporation, Handy & Harman, and James F. McCabe, Jr., effective January 4, 2009 (incorporated by reference to Exhibit 10.3 of Steel Partners Holdings L.P.'s Form 10-Q, filed May 15, 2012).
|
|
10.12
|
First Amendment to Management Services Agreement between Handy & Harman Ltd., Handy & Harman Group Ltd. and SP Corporate Services LLC (incorporated by reference to Exhibit 10.1 to Steel Partners Holdings L.P.'s Current Report on Form 8-K filed April 2, 2013).
|
|
10.13
|
Fifth Amended and Restated Management Agreement by and among Steel Partners Holdings L.P., SPH Group LLC and SP General Services LLC, dated as of May 11, 2012. (incorporated by reference to Exhibit 10.1 to Steel Partners Holdings L.P.'s Current Report on Form 8-K, filed October 15, 2013).
|
|
10.14
|
Management Services Agreement between SP Corporate Services LLC and iGo, Inc. effective October 1, 2013. (incorporated by reference to Exhibit 10.3 to Steel Partners Holdings L.P.'s Current Report on Form 8-K, filed October 15, 2013).
|
|
10.15
|
Pledge Agreement, dated as of October 23, 2013, by and among SPH Group Holdings LLC, Steel Partners Holdings L.P., and PNC Bank, National Association, as agent for the benefit of the lenders (incorporated by reference to Exhibit 99.2 to Steel Partners Holdings L.P.'s Current Report on Form 8-K, filed October 28, 2013).
|
|
10.16
|
Amended and Restated Management Services Agreement between SP Corporate Services LLC and Steel Excel Inc. (incorporated by reference to Exhibit 10.1 to Steel Partners Holdings L.P.'s Current Report on Form 8-K, filed January 14, 2014).
|
|
10.17
|
Amendment No. 1 to Amended and Restated Management Services Agreement (incorporated by reference to Exhibit 10.2 to Steel Partners Holdings L.P.'s Current Report on Form 8-K, filed January 14, 2014).
.
|
|
10.18
|
Amendment No. 2 to Amended and Restated Management Services Agreement (incorporated by reference to Exhibit 10.3 to Steel Partners Holdings L.P.'s Current Report on Form 8-K, filed January 14, 2014).
|
|
10.19
|
Amendment No. 3 to the Amended and Restated Management Services Agreement between Steel Excel Inc. and SP Corporate Services LLC, dated as of January 1, 2014 (incorporated by reference to Exhibit 10.1 to Steel Partners Holdings L.P.'s Quarterly Report on Form 10-Q, filed November 6, 2014).
|
|
21*
|
Subsidiaries of Steel Partners Holdings L.P.
|
|
24*
|
Power of Attorney (included in the signature page)
|
|
31.1*
|
Certification by the Chief Executive Officer Pursuant to Section 302 of the Sarbanes-Oxley Act of 2002.
|
|
31.2*
|
Certification by the Chief Financial Officer Pursuant to Section 302 of the Sarbanes-Oxley Act of 2002.
|
|
32.1*
|
Certification by the Chief Executive Officer Pursuant to 18 U.S.C. Section 1350, as Adopted Pursuant to Section 906 of the Sarbanes-Oxley Act of 2002.
|
|
32.2*
|
Certification by the Chief Financial Officer Pursuant to 18 U.S.C. Section 1350, as Adopted Pursuant to Section 906 of the Sarbanes-Oxley Act of 2002.
|
|
99.1
|
2012, 2011 and 2010 Financial Statements of Steel Excel Inc. (incorporated by reference to Exhibit 99.2 of Steel Partners Holdings L.P.'s Form 10-K, filed March 23, 2013).
|
|
99.2**
|
Financial Statements of SL Industries, Inc.
|
|
99.3*
|
Financial Statements of JPS Industries, Inc.
|
|
99.4*
|
2014 Financial Statements of Steel Partners II Liquidating Series Trust.
|
|
99.5
|
2013 Financial Statements of Steel Partners II Liquidating Series Trust (incorporated by reference to Exhibit 99.4 of Steel Partners Holdings L.P.'s Form 10-K, filed March 12, 2014).
|
|
99.6
|
2012 Financial Statements of Steel Partners II Liquidating Trust (incorporated by reference to Exhibit 99.4 of Steel Partners Holdings L.P.'s Form 10-K, filed March 23, 2013).
|
|
99.7*
|
Financial Statements of ModusLink Global Solutions, Inc.
|
|
Exhibit 101.INS*
|
XBRL Instance Document
|
|
Exhibit 101.SCH*
|
XBRL Taxonomy Extension Schema
|
|
Exhibit 101.CAL*
|
XBRL Taxonomy Extension Calculation Linkbase
|
|
Exhibit 101.DEF*
|
XBRL Taxonomy Extension Definition Linkbase
|
|
Exhibit 101.LAB*
|
XBRL Taxonomy Extension Label Linkbase
|
145
|
Exhibit 101.PRE*
|
XBRL Taxonomy Extension Presentation Linkbase
|
* Filed herewith
** To be filed by amendment
*** Management contract or compensatory plan or arrangement
146
SIGNATURES
Pursuant to the requirements of Section 13 or 15(d) of the Securities Exchange Act of 1934, the registrant has duly caused this registration statement to be signed on its behalf by the undersigned, thereunto duly authorized.
|
Dated:
|
STEEL PARTNERS HOLDINGS L.P.
|
|
|
March 16, 2015
|
||
|
By:
|
Steel Partners Holdings GP Inc.
|
|
|
Its General Partner
|
||
|
/s/ Warren G. Lichtenstein
|
||
|
By:
|
Warren G. Lichtenstein
|
|
|
Executive Chairman
|
||
POWER OF ATTORNEY
Steel Partners Holdings L.P. and each of the undersigned do hereby appoint Warren G. Lichtenstein and James F. McCabe, Jr., and each of them severally, its or his true and lawful attorney to execute on behalf of Steel Partners Holdings L.P. and the undersigned any and all amendments to this Annual Report on Form 10-K and to file the same with all exhibits thereto and other documents in connection therewith, with the Securities and Exchange Commission; each of such attorneys shall have the power to act hereunder with or without the other.
Pursuant to the requirements of the Securities Exchange Act of 1934, this report has been signed below by the following persons in the capacities indicated with respect to Steel Partners Holdings GP Inc., the general partner of Steel Partners Holdings L.P., and on behalf of the registrant and on the dates indicated below by the following persons in the capacities and on the dates indicated.
|
By:
|
/s/ Warren G. Lichtenstein
|
March 16, 2015
|
|
|
Warren G. Lichtenstein, Executive Chairman
|
Date
|
||
|
(Principal Executive Officer)
|
|||
|
By:
|
/s/ James F. McCabe, Jr.
|
March 16, 2015
|
|
|
James F. McCabe, Jr., Chief Financial Officer
|
Date
|
||
|
(Principal Accounting Officer)
|
|||
|
By:
|
/s/ Jack L. Howard
|
March 16, 2015
|
|
|
Jack L. Howard, Director
|
Date
|
||
|
By:
|
/s/ Anthony Bergamo
|
March 16, 2015
|
|
|
Anthony Bergamo, Director
|
Date
|
||
|
By:
|
/s/ John P. McNiff
|
March 16, 2015
|
|
|
John P. McNiff, Director
|
Date
|
||
|
By:
|
/s/ Joseph L. Mullen
|
March 16, 2015
|
|
|
Joseph L. Mullen, Director
|
Date
|
||
|
By:
|
/s/ General Richard I. Neal
|
March 16, 2015
|
|
|
General Richard I. Neal, Director
|
Date
|
||
|
By:
|
/s/ Allan R. Tessler
|
March 16, 2015
|
|
|
Allan R. Tessler, Director
|
Date
|
||
147
TABLE OF CONTENTS
Part IItem 1. BusinessItem 1A. Risk FactorsItem 1B. Unresolved Staff CommentsItem 2. PropertiesItem 3. Legal ProceedingsItem 4. Mine Safety DisclosuresPart IIItem 5. Market For The Registrant S Common Equity, Related Stockholder Matters and Issuer Purchases Of Equity SecuritiesItem 6. Selected Financial DataItem 7. Management S Discussion and Analysis Of Financial Condition and Results Of OperationsItem 7. Management S Discussion and Analysis Of Financial Condition and ResultsItem 7A. Quantitative and Qualitative Disclosures About Market RiskItem 8. Financial Statements and Supplementary DataItem 9. Changes in and Disagreements with Accountants on Accounting and Financial DisclosureItem 9A. Controls and ProceduresItem 9B. Other InformationPart IIIItem 10. Directors, Executive Officers and Corporate GovernanceItem 11. Executive CompensationItem 12. Security Ownership Of Certain Beneficial Owners and Management and Related Stockholder MattersItem 13. Certain Relationships and Related Transactions, and Director IndependenceItem 14. Principal Accountant Fees and ServicesPart IVItem 15. Exhibits and Financial Statement Schedules