SIRIUSPOINT LTD
10-Ks and 10-Qs
|
|
|
|
|
|
|
|
|
|
|
|
|
|
|
|
|
|
|
|
|
|
|
|
|
|
|
|
|
|
|
|
|
|
|
|
|
|
|
|
|
UNITED STATES SECURITIES AND EXCHANGE COMMISSION
WASHINGTON, D.C. 20549
____________________________
FORM 10-K
(Mark One)
|
x
|
ANNUAL REPORT PURSUANT TO SECTION 13 OR 15(d)
OF THE SECURITIES EXCHANGE ACT OF 1934
For the fiscal year ended December 31, 2014
|
OR
|
¨
|
TRANSITION REPORT PURSUANT TO SECTION 13 OR 15(d)
OF THE SECURITIES EXCHANGE ACT OF 1934
For the transition period from to
|
Commission File Number 001-35039
THIRD POINT REINSURANCE LTD.
(Exact name of registrant as specified in its charter)
|
Bermuda
|
98-1039994
|
|
|
(State or other jurisdiction of incorporation or organization)
|
(I.R.S. Employer Identification No.)
|
|
The Waterfront, Chesney House
96 Pitts Bay Road
Pembroke HM 08, Bermuda
+1 441 542-3300
(Address, including Zip Code and Telephone Number, including Area Code of Registrant’s Principal Executive Office)
Securities registered pursuant to Section 12(b) of the Act:
|
Title of each class
|
Name of each exchange on which registered
|
|
|
Common Shares, $0.10 par value
|
New York Stock Exchange
|
|
Securities registered pursuant to Section 12(g) of the Act: None.
Indicate by check mark if the registrant is a well-known seasoned issuer, as defined in Rule 405 of the Securities Act.
Yes
x
No
¨
Indicate by check mark if the registrant is not required to file reports pursuant to Section 13 or Section 15(d) of the Act.
Yes
¨
No
x
Note - Checking the box above will not relieve any registrant required to file reports pursuant to Section 13 or 15(d) of the Exchange Act from their obligations under those sections.
Indicate by check mark whether the registrant (1) has filed all reports required to be filed by Section 13 or 15(d) of the Securities Exchange Act of 1934 during the preceding 12 months (or for such shorter period that the registrant was required to file such reports), and (2) has been subject to such filing requirements for the past 90 days.
Yes
x
No
¨
Indicate by check mark whether the registrant has submitted electronically and posted on its corporate Web site, if any, every Interactive Data File required to be submitted and posted pursuant to Rule 405 of Regulation S-T (§232.405 of this chapter) during the preceding 12 months (or for such shorter period that the registrant was required to submit and post such files).
Yes
x
No
¨
Indicate by check mark if disclosure of delinquent filers pursuant to Item 405 of Regulation S-K (§229.405 of this chapter) is not contained herein, and will not be contained, to the best of registrant’s knowledge, in definitive proxy or information statements incorporated by reference in Part III of this Form 10-K or any amendment to this Form 10-K.
Yes
¨
No
x
Indicate by check mark whether the registrant is a large accelerated filer, an accelerated filer, a non-accelerated filer or a smaller reporting company. See definitions of “large accelerated filer,” “accelerated filer” and “smaller reporting company” in Rule 12b-2 of the Exchange Act.
|
Large accelerated filer
|
x
|
Accelerated filer
|
¨
|
|
Non-accelerated filer (do not check if a smaller reporting company)
|
¨
|
Smaller reporting company
|
¨
|
Indicate by check mark whether the registrant is a shell company (as defined in Rule 12b-2 of the Exchange Act).
Yes
¨
No
x
The aggregate market value of the shares of the voting and non-voting common equity held by non-affiliates of the registrant as of June 30, 2014 was
$884.4 million
.
As of February 25, 2015, there were
104,585,030
common shares of the registrant’s common shares issued and outstanding, including
694,360
restricted shares.
DOCUMENTS INCORPORATED BY REFERENCE
Part III incorporates information from certain portions of the registrant’s definitive proxy statement to be filed with the Securities and Exchange Commission within 120 days after the fiscal year ended December 31, 2014.
Third Point Reinsurance Ltd.
INDEX
|
Page
|
|
INTRODUCTORY NOTE
Unless the context otherwise indicates or requires, as used in this Annual Report on Form 10-K references to “we,” “our,” “us,” and the “Company,” refer to Third Point Reinsurance Ltd. and its directly and indirectly owned subsidiaries, including Third Point Reinsurance Company Ltd. (“Third Point Re”) and Third Point Reinsurance (USA) Ltd. (“Third Point Re USA”), as a combined entity, except where otherwise stated or where it is clear that the terms mean only Third Point Reinsurance Ltd. exclusive of its subsidiaries. We refer to Third Point Reinsurance Investment Management Ltd. as the “Catastrophe Fund Manager,” Third Point Reinsurance Opportunities Fund Ltd. as the “Catastrophe Fund” and Third Point Re Cat Ltd. as the “Catastrophe Reinsurer.” “Fiscal,” when used in reference to any twelve-month period ended December 31, refers to our fiscal years ended December 31. Unless otherwise indicated, information contained in this Annual Report is as of December 31, 2014. We have made rounding adjustments to reach some of the figures included in this Annual Report and, unless otherwise indicated, percentages presented in this Annual Report are approximate.
Cautionary Note Regarding Forward-Looking Statements
Certain statements contained or incorporated in this Annual Report include forward-looking statements. These forward-looking statements include, without limitation, statements regarding our industry, business strategy, plans, goals and expectations concerning our market position, international expansion, future operations, margins, profitability, future efficiencies, capital expenditures, liquidity and capital resources and other financial and operating information. When used in this discussion, the words “may,” “believes,” “intends,” “seeks,” “anticipates,” “plans,” “estimates,” “expects,” “should,” “assumes,” “continues,” “could,” “will,” “future” and the negative of these or similar terms and phrases are intended to identify forward-looking statements in this Annual Report on Form 10-K.
Forward-looking statements reflect our current expectations regarding future events, results or outcomes. These expectations may or may not be realized. Although we believe the expectations reflected in the forward-looking statements are reasonable, we can give you no assurance these expectations will prove to have been correct. Some of these expectations may be based upon assumptions, data or judgments that prove to be incorrect. Actual events, results and outcomes may differ materially from our expectations due to a variety of known and unknown risks, uncertainties and other factors. Although it is not possible to identify all of these risks and factors, they include, among others, the following:
|
•
|
limited historical information about us;
|
|
•
|
operational structure currently is being developed;
|
|
•
|
fluctuation in results of operations;
|
|
•
|
more established competitors;
|
|
•
|
losses exceeding reserves;
|
|
•
|
downgrades or withdrawal of ratings by rating agencies;
|
|
•
|
dependence on key executives;
|
|
•
|
dependence on letter of credit facilities that may not be available on commercially acceptable terms;
|
|
•
|
potential inability to pay dividends;
|
|
•
|
inability to service our indebtedness;
|
|
•
|
limited cash flow and liquidity due to our indebtedness;
|
1
|
•
|
unavailability of capital in the future;
|
|
•
|
fluctuations in market price of our common shares;
|
|
•
|
dependence on clients’ evaluations of risks associated with such clients’ insurance underwriting;
|
|
•
|
suspension or revocation of our reinsurance license;
|
|
•
|
potentially being deemed an investment company under U.S. federal securities law;
|
|
•
|
potential characterization of Third Point Reinsurance Ltd. and/or Third Point Reinsurance Company Ltd. as a PFIC;
|
|
•
|
dependence on Third Point LLC to implement our investment strategy;
|
|
•
|
termination by Third Point LLC of our investment management agreements;
|
|
•
|
risks associated with our investment strategy being greater than those faced by competitors;
|
|
•
|
increased regulation or scrutiny of alternative investment advisers affecting our reputation;
|
|
•
|
Third Point Reinsurance Ltd. potentially becoming subject to United States federal income taxation;
|
|
•
|
Third Point Reinsurance Ltd. potentially becoming subject to U.S. withholding and information reporting requirements under the FATCA provisions;
|
|
•
|
other risks and factors listed under “Item 1A. Risk Factors” and elsewhere in this Annual Report.
|
Any one of these factors or a combination of these factors could materially affect our financial condition or future results of operations and could influence whether any forward-looking statements contained in this report ultimately prove to be accurate. Our forward-looking statements are not guarantees of future performance, and you should not place undue reliance on them. All forward-looking statements speak only as of the date made and we undertake no obligation to update or revise publicly any forward-looking statements, whether as a result of new information, future events or otherwise.
In addition, while we do, from time to time, communicate with security analysts, it is against our policy to disclose to them any material non-public information or other confidential information. Accordingly, shareholders should not assume that we agree with any statement or report issued by any analyst irrespective of the content of the statement or report. Thus, to the extent that reports issued by securities analysts contain any projections, forecasts, or opinions, such reports are not our responsibility.
Overview
We are a holding company domiciled in Bermuda. Through our reinsurance subsidiaries, we provide property and casualty reinsurance coverage to insurance and reinsurance companies on a worldwide basis. Our goal is to deliver attractive equity returns to shareholders by combining profitable reinsurance underwriting with superior investment management provided by Third Point LLC, our investment manager. We believe that our reinsurance and investment strategy differentiates us from our competitors.
2
Our reinsurance strategy is to be highly opportunistic and disciplined. During periods of extremely competitive or soft reinsurance market conditions, we intend to be selective with regard to the amount and type of reinsurance we write and conserve our risk-taking capital for periods when market conditions are more favorable to us from a pricing and terms and conditions perspective.
Substantially all of our investable assets are managed by our investment manager, Third Point LLC, which is wholly owned by Daniel S. Loeb, one of our founding shareholders. Third Point LLC is an SEC-registered investment adviser headquartered in New York, managing $16.8 billion in assets as of
December 31, 2014
. We directly own our investments, which are held in separate accounts and are managed by Third Point LLC on substantially the same basis as its main hedge funds, including Third Point Partners L.P., the original Third Point LLC hedge fund.
We were incorporated on October 6, 2011 and completed our initial capitalization transaction on December 22, 2011 with $784.3 million of equity capital, and commenced underwriting business on January 1, 2012. In January 2012, we received an A- (Excellent) financial strength rating from A.M. Best Company, Inc., or A.M. Best.
On August 20, 2013, we completed an initial public offering (“IPO”) of 24,832,484 common shares at an offering price of $12.50 per share. The net proceeds to us of the offering were $286.0 million, after deducting offering costs. Our common shares are listed on the New York Stock Exchange (“NYSE”) under the symbol “TPRE”.
On June 15, 2012, Third Point Reinsurance Opportunities Fund Ltd. (the “Catastrophe Fund”), Third Point Reinsurance Investment Management Ltd. (the “Catastrophe Fund Manager”), and Third Point Re Cat Ltd. (the “Catastrophe Reinsurer”) were incorporated in Bermuda. We subsequently announced a strategic arrangement with Hiscox Insurance Company (Bermuda) Limited (“Hiscox”) to launch a collateralized catastrophe reinsurance underwriting fund management business through these entities. The Catastrophe Fund Manager, a Bermuda exempted company, is the investment manager of the Catastrophe Fund. In December 2014, we announced that we would no longer accept investments in the Catastrophe Fund, that no new business would be written in the Catastrophe Reinsurer and that we would be redeeming all existing investments in the Catastrophe Fund. The Catastrophe Fund Manager will continue to manage the runoff of the remaining exposure in the Catastrophe Fund.
On August 2, 2012, we established a wholly-owned subsidiary in the United Kingdom, Third Point Re Marketing (UK) Limited (“TPRUK”). On May 20, 2013, TPRUK was licensed as an insurance intermediary by the UK Financial Conduct Authority.
In February 2015, we began reinsurance operations in the United States through Third Point Re USA, a Bermuda company licensed as a Class 4 insurer and a wholly owned operating subsidiary of Third Point Re (USA) Holdings Inc. (“TPRUSA”). Third Point Re USA has not conducted any operations to date and TPRUSA’s only operations to date relate to accessing financing on behalf of Third Point Re USA. As a result, Third Point Re USA and TPRUSA have a limited operating history and are exposed to volatility in their results of operations. Period to period comparisons of their results of operations may not be meaningful. Third Point Re USA expects to provide reinsurance products that are substantially similar to the reinsurance products currently provided by Third Point Re. Third Point Re USA’s U.S. presence is a strategic component of our overall growth strategy. As a result of Third Point Re USA’s U.S. presence, we expect to strengthen our relationships with U.S. cedents and brokers. We also expect to develop a firsthand understanding of cedent underwriting and claims capabilities that will benefit our underwriting practices.
Our management team is led by John R. Berger, a highly-respected reinsurance industry veteran with over 30 years of experience, the majority of which was spent as the principal executive officer of three successful reinsurance companies. In addition, we have recruited a management team around Mr. Berger that also has significant senior leadership and underwriting experience in the reinsurance industry. We believe that our experience and longstanding relationships with our insurance company clients, senior reinsurance brokers, insurance regulators and credit rating agencies are an important competitive advantage.
For the years ended
December 31, 2014
,
2013
and
2012
, we generated net income of
$50.4 million
,
$227.3 million
and
$99.4 million
, respectively, which represented a return on beginning shareholders’ equity attributable to shareholders of
3.6%
,
23.4%
and
13.0%
, respectively. For the years ended
December 31, 2014
,
2013
and
2012
, our
3
gross premiums written totaled
$613.3 million
,
$401.9 million
and
$190.4 million
, respectively. Our combined ratio for our property and casualty reinsurance segment for the years ended
December 31, 2014
,
2013
and
2012
was
102.2%
,
107.5%
and
129.7%
, respectively. As of
December 31, 2014
and
2013
, we had net investments managed by Third Point LLC of
$1,802.2 million
and
$1,559.4 million
, respectively, and shareholders’ equity attributable to shareholders of $
1,451.9 million
and
$1,391.7 million
, respectively.
Segment Information
Under U.S. Generally Accepted Accounting Principles (“GAAP”), operating segments are based on the internal information that management uses for allocating resources and assessing performance as the source of our reportable segments. We report two operating segments - Property and Casualty Reinsurance and Catastrophe Risk Management. We have also identified a corporate function that includes our investment results and certain general and administrative expenses related to corporate activities. For more information, see
Note 22
of our audited consolidated financial statements included elsewhere in this Annual Report.
U.S. Operations
In February 2015, we began reinsurance operations in the United States through Third Point Re USA, a Bermuda company licensed as a Class 4 insurer and a wholly owned operating subsidiary of TPRUSA. TPRUSA is a wholly owned subsidiary of Third Point Re (UK) Holdings Ltd., a private company limited by shares organized under the laws of England and Wales and our direct wholly owned subsidiary.
Third Point Re USA has not conducted any operations to date and TPRUSA’s only operations to date relate to accessing financing on behalf of Third Point Re USA. As a result, Third Point Re USA and TPRUSA have a limited operating history and are exposed to volatility in their results of operations. Period to period comparisons of their results of operations may not be meaningful.
Third Point Re USA expects to provide reinsurance products that are substantially similar to the reinsurance products currently provided by Third Point Re. In order to support these new reinsurance operations, Third Point Re USA expects to enter into a quota share reinsurance agreement with Third Point Re, pursuant to which Third Point Re would assume 75% of premium and losses for Third Point Re USA’s portfolio of reinsurance contracts. Third Point Re USA also has entered into a net worth maintenance agreement with the Company, pursuant to which the Company has agreed to commit funds sufficient to maintain a minimum level of capital at Third Point Re USA of $250 million. In addition, Third Point Re USA expects to enter into a services agreement with the Company, pursuant to which the Company would agree to provide certain finance, legal and general and administrative support services.
Third Point Re USA has entered into a joint venture and investment management agreement with Third Point LLC and Third Point Advisors LLC under substantially similar terms to the current investment management agreement with Third Point Re. In addition, Third Point Re USA has become a party to the Founders Agreement dated as of December 22, 2011 among Third Point Re and several affiliates of the Company.
Third Point Re USA’s U.S. presence is a strategic component of our overall growth strategy. As a result of Third Point Re USA’s U.S. presence, we expect to strengthen our relationships with U.S. cedents and brokers. We also expect to develop a firsthand understanding of cedent underwriting and claims capabilities that will benefit our underwriting practices.
As a result of Third Point Re USA’s activities in the United States, we expect that Third Point Re USA will be subject to U.S. federal income taxation on its net income. However, we believe that our current activities, notwithstanding activities conducted through Third Point Re USA, will not cause the Company to be treated as engaging in a U.S. trade or business and will not cause the Company otherwise to be subject to current U.S. federal income taxation on its consolidated net income.
4
Reinsurance Strategy
Our reinsurance strategy is to build a portfolio that generates stable underwriting profits, with margins commensurate with the amount of risk assumed, by opportunistically targeting sub-sectors of the market and specific situations where reinsurance capacity and alternatives may be constrained. Our management team has differentiated expertise that allows us to identify profitable reinsurance opportunities. The level of volatility in our reinsurance portfolio will be determined by market conditions, but will typically be lower than that of most other reinsurance companies. We manage reinsurance volatility by focusing on lines of business that have historically demonstrated more stable return characteristics, such as limited catastrophe exposed property, which we refer to as “property quota share”, auto, workers’ compensation quota share, and certain segments of multi-line specialty. These lines of business are often characterized as having exposure to higher frequency and lower severity claims activity. We seek to further manage the volatility of our reinsurance results by writing reinsurance contracts on a quota share basis, where we assume an agreed percentage of premiums and losses for a portfolio of insurance policies. We also make use of contractual terms and conditions within our reinsurance contracts that include individual or aggregate loss occurrence limits, which limit the dollar amount of loss that we can incur from a particular occurrence or series of occurrences within the term of a reinsurance contract; loss ratio caps, which limit the maximum loss we can incur pursuant to a contract to a defined loss ratio; sliding scale commissions that vary in accordance with the client’s performance; and sub-limits and exclusions for specific risks not covered by a particular reinsurance contract.
We also write reinsurance contracts that provide protection against adverse development on loss reserves where we provide an incremental amount of additional coverage limit. We typically provide coverage where we agree with the client’s reserving practices and reserve levels or where we believe there are structural or contractual safeguards in place. While these transactions are usually recorded at or close to a 100% composite ratio (combined ratio before general and administrative expenses) and therefore do not initially generate underwriting income, they produce premiums equal to the reserves at the inception of the contract. In some instances, the level of risk in the reserve cover contract or the risk mitigating features within the contract including limitations on the amount and timing of loss payments require us to account for the contract as a deposit liability contract. Using the deposit method of accounting, a deposit liability, rather than written premium, is initially recorded based upon the consideration received less any explicitly identified premiums or fees. In subsequent periods, the deposit liability is adjusted by calculating the effective yield on the deposit to reflect actual payments to date and future expected payments.
We typically write larger customized reinsurance contracts that require significant interaction during the course of negotiations between the client, intermediaries and us. We take a lead underwriting position on most of our reinsurance contracts, meaning that we establish the pricing and terms and conditions of the reinsurance contract. In certain instances, we will follow terms and conditions established by our competitors if we believe the opportunity meets our return hurdles and helps us balance our reinsurance portfolio.
Our property and casualty reinsurance operations generate excess cash flows, or float, which we track in managing our business. We believe that continuing to seek net investment income from float is a key part of our reinsurance strategy and an important consideration in evaluating the overall contribution of our property and casualty reinsurance operations to our consolidated results.
Despite challenging market conditions, we have grown our underwriting due to the strength of our relationships. We began underwriting on January 1, 2012 and continue to cultivate our underwriting relationships with intermediaries and reinsurance buyers and, as a result, we believe submission flow remains strong. We write a small number of large contracts and, as a result individual renewals or new business can have a significant impact on premiums recognized in a period. In addition, our contracts are subject to significant judgment in the amount of premiums that we expect to recognize. Changes in premium estimates are recorded in the period they are determined and can significantly alter the expected value of a particular reinsurance contract. We also offer customized solutions to our clients, including adverse development covers, which are considered retroactive reinsurance contracts, on which we will not have a regular renewal opportunity. Furthermore, we record gross premiums written and earned for adverse development covers at the inception of the contract. Together these factors can impact the comparability of premiums earned in a period and trends from period to period and year over year.
5
As we expand our business over time, we expect that the proportion of total gross premiums written represented by individual contracts will decline. See Note 22 to our audited consolidated financial statements included elsewhere in this Annual Report for a breakdown of contracts that individually contributed more than 10% of total gross premiums written.
We intend to grow our book of business by underwriting a mix of short to medium tail personal and commercial lines. We intend to increase our geographic spread over time by adding reinsurance programs from Europe, Asia and other regions; however, we expect that a majority of our reinsurance business will continue to be composed of U.S. exposure. See Note 22 to our audited consolidated financial statements included elsewhere in this Annual Report for a breakdown of gross premiums written by domicile of ceding companies.
Many of our clients buy reinsurance from us for capital management purposes, primarily to increase their capacity to write insurance premium and maintain or improve their credit ratings. The most common form of reinsurance used for this purpose is quota share reinsurance. Many of the clients that buy these contracts are growing as a result of securing primary rate increases and an increase in the number of policies they write. Because quota share reinsurance typically includes structural and contractual features that limit the amount of risk assumed by the reinsurer, it therefore carries relatively lower expected margins than excess of loss reinsurance and other more volatile forms of reinsurance. During periods of less favorable market conditions, margins on quota share reinsurance written for the capital management purposes of our clients typically remain relatively stable and are sufficient to support our business plan. As market conditions improve, we may expand the lines of business and forms of reinsurance on which we focus to increase our risk-adjusted returns.
In contrast to many reinsurers with whom we compete, we have elected to limit our underwriting of property catastrophe exposures. Through December 2014, we wrote excess of loss catastrophe reinsurance through the Catastrophe Fund, which is a separately capitalized reinsurance fund vehicle. In December 2014, we announced that we would no longer accept investments in the Catastrophe Fund, that no new business would be written in the Catastrophe Reinsurer and that we would be redeeming all existing investments in the Catastrophe Fund. As of December 31, 2014, our financial exposure to the higher volatility and liquidity risks associated with property catastrophe losses was generally limited to our investment in the Catastrophe Fund, which as of December 31, 2014 was
$59.5 million
. In January 2015, we received $21.1 million from a partial redemption of our investment in the Catastrophe Fund.
On December 18, 2014, we entered into a subscription agreement with the Kiskadee Diversified Fund Ltd. (“Kiskadee Fund”) to invest up to
$25.0 million
in Hiscox’s separately managed insurance-linked securities platform, Kiskadee Re Ltd. The Kiskadee Fund is a fund vehicle managed by Hiscox. The Kiskadee Fund invests in property catastrophe exposures through collateralized reinsurance transactions and other insurance-linked investments. On January 2, 2015, we funded
$5.0 million
of this commitment. The remaining
$20.0 million
commitment is due to be funded on June 1, 2015.
As there are no additional guarantees or recourse to us from these funds beyond the amounts of our investments, we anticipate that our property catastrophe exposures will consistently remain relatively low when compared to our competitors.
Since we focus on lines of business that have historically demonstrated more stable return characteristics and limit our underwriting of property catastrophe exposure, we do not manage our reinsurance portfolio to any particular breakdown by line of business. The following table provides a breakdown by line of business of gross premiums written for the years ended December 31, 2014, 2013 and 2012:
6
|
2014
|
2013
|
2012
|
||||||||||||||||||
|
Amount
|
Percentage of Total
|
Amount
|
Percentage of Total
|
Amount
|
Percentage of Total
|
|||||||||||||||
|
($ in thousands)
|
||||||||||||||||||||
|
Property
|
$
|
106,834
|
|
17.4
|
%
|
$
|
67,612
|
|
16.8
|
%
|
$
|
103,174
|
|
54.2
|
%
|
|||||
|
Workers’ Compensation
|
76,032
|
|
12.4
|
%
|
93,755
|
|
23.3
|
%
|
17,500
|
|
9.2
|
%
|
||||||||
|
Auto
|
136,246
|
|
22.2
|
%
|
116,262
|
|
28.9
|
%
|
27,200
|
|
14.3
|
%
|
||||||||
|
General Liability
|
54,485
|
|
8.9
|
%
|
—
|
|
—
|
%
|
—
|
|
—
|
%
|
||||||||
|
Casualty
|
266,763
|
|
43.5
|
%
|
210,017
|
|
52.2
|
%
|
44,700
|
|
23.5
|
%
|
||||||||
|
Agriculture
|
110
|
|
—
|
%
|
31,843
|
|
7.9
|
%
|
42,500
|
|
22.3
|
%
|
||||||||
|
Credit & Financial lines
|
10,387
|
|
1.7
|
%
|
36,366
|
|
9.1
|
%
|
—
|
|
—
|
%
|
||||||||
|
Multi-line
|
217,211
|
|
35.4
|
%
|
47,750
|
|
11.9
|
%
|
—
|
|
—
|
%
|
||||||||
|
Specialty
|
227,708
|
|
37.1
|
%
|
115,959
|
|
28.9
|
%
|
42,500
|
|
22.3
|
%
|
||||||||
|
Total property and casualty reinsurance
|
601,305
|
|
98.0
|
%
|
393,588
|
|
97.9
|
%
|
190,374
|
|
100.0
|
%
|
||||||||
|
Catastrophe risk management
|
11,995
|
|
2.0
|
%
|
8,349
|
|
2.1
|
%
|
—
|
|
—
|
%
|
||||||||
|
$
|
613,300
|
|
100.0
|
%
|
$
|
401,937
|
|
100.0
|
%
|
$
|
190,374
|
|
100.0
|
%
|
||||||
Investment Strategy
Our investment strategy distinguishes us from most other reinsurers, who typically concentrate their investment portfolios on long-only, investment grade, shorter-term, fixed income securities. As implemented by our investment manager, Third Point LLC, our investment strategy is intended to achieve superior risk-adjusted returns by deploying capital in both long and short investments with favorable risk/reward characteristics across select asset classes, sectors and geographies. Third Point LLC identifies investment opportunities via a bottom-up, value-oriented approach to single security analysis supplemented by a top-down view of portfolio and risk management. Third Point LLC seeks dislocations in certain areas of the capital markets or in the pricing of particular securities and supplements single security analysis with an approach to portfolio construction that includes sizing each investment based on upside/downside calculations, all with a view towards appropriately positioning and managing overall exposures. Dislocations in capital markets refer to any major movements in prices of the capital markets as a whole, certain segments of the market, or a specific security. If Third Point LLC has what it considers to be a differentiated view from the perceived market sentiment with respect to such movement, Third Point LLC may trade securities in our investment account based on that differentiated view. If the ultimate market reaction with respect to the event or movement ultimately proves to be closer to Third Point LLC’s original viewpoint, we may have investment gains in our investment portfolio as a result of the shift in market sentiment. Through our investment manager, Third Point LLC, we make investments globally, in both developed and emerging markets, in all sectors, and in equity, credit, commodity, currency, options and other instruments.
Third Point LLC has historically favored event-driven situations, in which it believes that a catalyst, either intrinsic or extrinsic, will unlock value or alter the lens through which the greater market values a particular investment. Third Point LLC attempts to apply this event framework to each of its single security investments and this approach informs the timing and risk of each investment.
As our investment manager, Third Point LLC has the contractual right to manage substantially all of our investable assets pursuant to an investment management agreement that has an initial term expiring on December 22, 2016, subject to automatic renewal for additional successive three-year terms unless a party notifies the other parties of its intention to terminate at least six months prior to the end of a term. We expect that this agreement will be renewed
7
in 2016. On January 28, 2015, we entered into a second investment management agreement for Third Point Re USA on substantially the same terms and conditions as our existing investment management agreement for Third Point Re. See “Joint Venture and Investment Management Agreements.” Under these two investment management agreements, Third Point LLC is required to follow our investment guidelines and to act in a manner that is fair and equitable in allocating investment opportunities to us. However, it is not otherwise restricted with respect to the nature or timing of making investments for our separate accounts. Our investment guidelines require Third Point LLC to manage our investment portfolio on a substantially equivalent basis to its main funds; but in any event to keep at least 60% of the investment portfolio in debt and equity securities, cash, cash equivalents or precious metals; limit single position concentration to no more than 15% of the portfolio assets managed; and limit net exposure to no greater than 1.5 times portfolio assets managed for more than 10 trading days in any 30-day period. Net exposure represents the short exposure subtracted from the long exposure in a given category. We have the contractual right to withdraw funds from our managed accounts to pay claims and expenses as needed. The net investment return on investments managed by Third Point LLC for the year ended December 31, 2014 was
5.1%
(
2013
-
23.9%
and
2012
-
17.7%
).
Property and Casualty Segment Products
Our underwriting team has extensive experience in underwriting many forms of property and casualty reinsurance products. In the current market, which we categorize as being highly competitive, we expect that our focus will continue to be on property and casualty quota share treaties which may consist of broadly syndicated surplus relief quota share contracts, which we commonly refer to as traditional quota shares, as well as more opportunistic business opportunities. We also consider loss portfolio transfers, aggregate stop loss covers and other forms of reserve covers where we are able to apply our investment capabilities. Expected margins on traditional quota share reinsurance, which are generally purchased for capital management purposes by our clients, are typically lower than on opportunistic business contracts’ but are commensurate with the level of risk underwritten. However, quota share margins remain relatively stable and are sufficient to support our business plan even during periods of less favorable market conditions such as those being experienced currently. We have generally achieved higher margins from opportunistic contracts where we are providing capital to a dislocated market, such as workers’ compensation in certain states, mortgage insurance or where we can address a unique client problem. We believe there is less competition on reserve covers due to limited willingness of traditional reinsurers, who have historically experienced lower investment returns on investable assets backing reserves, to pursue these lower margin products. Margins on this business are determined through bilateral negotiations and comparing the cost of the reserve cover to non-reinsurance solutions such as raising additional equity or debt capital. As market conditions improve, we may expand the lines of business and forms of reinsurance on which we focus to increase our risk-adjusted returns.
While we expect to establish a diversified portfolio, our allocation of risk will vary based on our perception of the opportunities available in each line of business. Moreover, our focus on certain lines will fluctuate based upon market conditions and we may only offer or underwrite a limited range of lines in any given period. We intend to:
•
target markets where capacity and alternatives are underserved or capacity constrained;
•
employ strict underwriting discipline;
•
select reinsurance opportunities with favorable economics over the life of the contract; and
•
potentially offer lines that are not identified in this Form 10-K.
Through December 31, 2014, we wrote reinsurance contracts covering the following product lines:
Property
. This line of business primarily consists of homeowners’ insurance coverage. Homeowners’ insurance coverage combines various personal insurance protections, which can include losses occurring to one’s home, their contents, loss of use (including additional living expenses), or loss of other personal possessions of the homeowner, as well as liability insurance for accidents that may happen at covered homes or at the hands of the homeowners. Third Point Re provides quota share reinsurance, which limits the amount of catastrophic losses that can be recovered; in many cases, hurricanes and other serious natural events are excluded. There are also often other loss sensitive features that vary the cost of the reinsurance as results improve or deteriorate, buffering the potential volatility to us.
8
Workers’ Compensation
. Workers’ compensation insurance provides wage replacement and medical benefits to employees injured in the course of employment in exchange for the mandatory relinquishment of the employee’s right to sue the employer for negligence. While plans differ among jurisdictions, provisions can be made for payments in place of wages (functioning as a form of disability insurance), compensation for economic loss (past and future), reimbursement or payment of medical and like expenses (functioning as a form of health insurance), and benefits payable to dependents of workers killed during employment (functioning as a form of life reinsurance). General damages for pain and suffering and punitive damages for employer negligence are not generally available in workers’ compensation plans. Our approach to workers’ compensation is very selective and targets insurance companies that are very specialized within the workers compensation line and geographically focused. We limit the volatility of this line of business by capping our per occurrence exposures.
Auto
. Personal automobile insurance is purchased for individually owned or leased cars designed to provide the insured with financial protection against bodily injury or physical damage resulting from traffic accidents and against liability that could arise from such occurrences. In addition, automobile insurance may offer financial protection against theft or damage of the vehicle from incidents other than collisions. Each state has different rules and regulations in place for compulsory coverage and the specific terms of automobile insurance policies will vary from company to company. Third Point Re generally focuses on providing proportional reinsurance to small, single state and regional carriers that specialize in minimum financial responsibility limits required by their respective states. This business is often referred to as “non-standard” automobile business and was historically underserved by standard markets. More recently, however, standard companies have expanded their appetite for such business and it is written by a broad range of carriers.
General Liability
. General liability insurance policies are issued to business organizations to protect them against liability claims for bodily injury and property damage arising out of premises, operations, products, and completed operations; and advertising and personal injury liability.
Agriculture
. Agriculture insurance on growing crops in the United States provides protection to farmers for crop losses caused by weather, disease, and insects. Two types of policies are available. Multiple peril crop insurance, or MPCI, is subsidized by the U.S. Department of Agriculture and covers most natural perils. Additionally, farmers can purchase single peril policies such as hail insurance. These products are not subsidized and the farmer pays the entire premium. Other single peril policies cover perils such as wind, freeze, and excess rain. We predominantly underwrite MPCI business. At the end of 2013, we decided to stop underwriting Agriculture business and this line of business, with the limited number of contracts previously bound, is now in runoff.
Credit & Financial Lines
. Credit & Financial Lines primarily consists of mortgage insurance policies. Mortgage insurance is an insurance policy that compensates lenders or investors for losses due to the default of a mortgage loan. Mortgage insurance can refer to private mortgage insurance (“PMI”), mortgage life insurance or mortgage title insurance. Third Point Re focuses on PMI, which is normally required by lenders when a borrower’s down payment or equity is less than 20% of the loan value. Not all lenders will require PMI but those that follow the Fannie Mae and Freddie Mac guidelines for home loan approval require PMI. In addition to mortgage insurance, policies classified as Credit & Financial Lines may include political risk, trade credit, surety and title insurance.
Multi-line
. Multi-line reinsurance is reinsurance of an underlying portfolio of several different types of insurance risks. Third Point Re focuses on multi-line reinsurance opportunities where it has expertise in the underlying lines of business or where the terms and conditions of the reinsurance contract minimize the volatility of the more difficult to analyze classes of business in the portfolio. Contracts which cover more than one line of business will be designated as multi-line even if a portion of the underlying business is covered by one of the lines of business listed above. A significant portion of our multi-line contracts are reserve-based covers such as loss portfolio transfers. The most significant lines of business we include in multi-line that we do not write on a standalone basis are
Extended Warranty Insurance
and
Professional Liability
, descriptions of which are included below.
Extended Warranty Insurance.
Extended warranty insurance compensates individuals or businesses for correction or repair necessary as a result of mechanical or electrical breakdown. It covers a variety of units from motor vehicles, vans, trucks, construction equipment and agricultural equipment, and the coverage varies according to the product, the age and the usage. The insurance is offered on a multi-year basis, generally with a maximum period of
9
three years on risk, and can cover either new units after a period of warranty offered by the manufacturer or used units once the manufacturer’s warranty has expired. All the extended warranty insurance business we have written excludes manufacturer defect and product recall. The auto warranty business we have written is captured within the multi-line product line because the reinsurance agreements also cover other lines of business
Professional Liability.
Professional liability is a form of liability insurance that helps protect professional advice- and service-providing individuals and companies from bearing the full cost of defending against a negligence claim made by a client and damages awarded in a civil lawsuit. The coverage focuses on alleged failure to perform on the part of, financial loss caused by, and error or omission in the service provided by the policyholder. These are potential causes for legal action that would not be covered by a more general liability insurance policy, which addresses more direct forms of harm The professional liability business we have written to date is captured within the multi-line product line because the reinsurance contract also covers other lines of business.
Marketing
The majority of our business is sourced through reinsurance brokers. Broker distribution channels provide us with access to an efficient, variable cost, global distribution system without the significant time and expense that would be incurred in creating a wholly-owned distribution network. We believe that our financial strength rating, well known and respected management team, and responsive client service enhance our working relationships with clients and brokers.
Our objective is to build long-term relationships with senior individuals at reinsurance brokers and with our clients. We meet frequently with brokers, senior representatives of existing clients and prospective clients, and encourage clients to visit our executive offices in order to help distinguish us and to develop mutually beneficial understandings of our respective businesses. As evidenced by rates of submission flow, open dialogue, and successful closing of targeted accounts, we believe we have successfully leveraged the underwriting experience and relationships of our management team. Reinsurance brokers receive a brokerage commission that is usually a percentage of gross premiums written. We seek to become the first choice of brokers and clients by providing:
|
•
|
creative solutions that address the specific business needs of our clients;
|
|
•
|
rapid and substantive responses to structuring and pricing quote requests;
|
|
•
|
financial security; and
|
|
•
|
clear indication of risks we will and will not underwrite.
|
10
The following table sets forth our premiums written by brokers or placed directly for the years ended
December 31, 2014
,
2013
and
2012
:
|
|
2014
|
2013
|
2012
|
|||||||||||||||||
|
|
Premiums written
|
% of Total
|
Premiums written
|
% of Total
|
Premiums written
|
% of Total
|
||||||||||||||
|
|
($ in thousands)
|
|||||||||||||||||||
|
Name of broker
|
|
|
|
|
||||||||||||||||
|
JLT Re
|
$
|
199,563
|
|
32.5
|
%
|
$
|
—
|
|
—
|
%
|
$
|
—
|
|
—
|
%
|
|||||
|
Guy Carpenter & Company, LLC
|
110,063
|
|
17.9
|
%
|
89,125
|
|
22.2
|
%
|
65,073
|
|
34.2
|
%
|
||||||||
|
Aon Benfield - a division of Aon plc
|
80,535
|
|
13.1
|
%
|
111,865
|
|
27.8
|
%
|
22,000
|
|
11.6
|
%
|
||||||||
|
Willis Re
|
61,777
|
|
10.1
|
%
|
22,871
|
|
5.7
|
%
|
—
|
|
—
|
%
|
||||||||
|
Advocate Reinsurance Partners, LLC
|
58,616
|
|
9.6
|
%
|
57,994
|
|
14.4
|
%
|
22,473
|
|
11.8
|
%
|
||||||||
|
Other brokers
|
57,403
|
|
9.4
|
%
|
63,470
|
|
15.8
|
%
|
38,328
|
|
20.2
|
%
|
||||||||
|
Total broker placed
|
567,957
|
|
92.6
|
%
|
345,325
|
|
85.9
|
%
|
147,874
|
|
77.8
|
%
|
||||||||
|
Other
|
45,343
|
|
7.4
|
%
|
56,612
|
|
14.1
|
%
|
42,500
|
|
22.2
|
%
|
||||||||
|
$
|
613,300
|
|
100.0
|
%
|
$
|
401,937
|
|
100.0
|
%
|
$
|
190,374
|
|
100.0
|
%
|
||||||
We believe that the number of brokers with whom we do business will continue to expand over time, and by maintaining close working relationships with brokers, we are able to increase our chances of successfully growing and accessing a broader range of potential clients.
Underwriting
We have established a senior team of underwriters and actuaries to develop and manage our reinsurance business. We believe that their experience, industry presence, and long-standing relationships will allow us to tailor our portfolio to specific market segments. Our approach to underwriting will allow us to deploy our capital in a variety of lines of business and to capitalize on opportunities that we believe offer favorable returns on equity over the long term. Our underwriters and actuaries have expertise in a number of lines of business and we will also look to outside consultants to help us with niche areas of expertise when we deem it appropriate. From time to time, we may consider investment income in our underwriting and pricing of a particular transaction.
We generally apply the following underwriting management principles:
Team Approach
Each submission is assigned to an underwriter. If the program meets our underwriting criteria, the actuarial team participates in the process. The underwriter and actuary work in concert to evaluate the opportunity, determine the optimal structure, and price the deal. When capital is committed to any transaction, the evaluation team creates a deal analysis memorandum that highlights the key components of the proposed transaction and presents the proposed transaction to a senior group of staff including our senior executives and representatives of the underwriting, actuarial and finance teams. This group must agree that the transaction meets or exceeds our profitability requirements before we submit a binding proposal. The Presidents of Third Point Re and Third Point Re USA have exclusive authority to bind contracts on behalf of their respective companies.
Actuarial Pricing
We have developed proprietary actuarial models and also use several commercially available tools to assist in pricing our business. Our analysis considers the data and information provided by the potential cedent as well as relevant industry data, where appropriate. We use this cedent specific and industry data to develop our own point estimate of the expected losses under each potential contract. We also use a stochastic model to simulate a distribution
11
of potential loss outcomes and the impact of any contractual features that may exist such as sliding scale ceding commissions or profit commissions.
One of the key metrics that we consider as a result of this process is the expected combined ratio on a particular transaction. We also consider the projected outcomes at various percentiles, with a specific focus on outcomes in the tail. As a part of this process, we also specifically test each transaction to determine if there is sufficient risk transfer to qualify for reinsurance accounting. The results of this pricing process are shared with the underwriter on a contract, and if a deal is bound, summary exhibits are attached to a memo summarizing the actuarial pricing analysis that was performed.
Act as Lead Underwriter
Typically, one or two reinsurers will act as the lead or co-lead parties in developing and negotiating treaty pricing, terms and conditions of reinsurance contracts. We act as the lead underwriter for the majority of the premium that we underwrite. We believe that lead underwriting is a critically important factor in achieving long-term success, as lead underwriters have greater control of overall economics of their programs. In addition, we believe that reinsurers that lead policies are generally solicited for a broader range of business and have greater access to attractive risks.
Alignment of Interests
We seek to ensure that every contract we underwrite aligns our interests with our client’s interest. Specifically, we may seek to:
|
•
|
require our clients to maintain a meaningful risk position in their business;
|
|
•
|
pay our clients a commission based upon their actual expenses and offer an additional commission as an incentive based upon profitability;
|
|
•
|
include deficit carry-forward provisions in our multi-year contracts that allows us to potentially offset underwriting losses from one year to the next;
|
|
•
|
charge the client a premium for reinstatement of the amount of reinsurance coverage to the full amount reduced as a result of a reinsurance loss payment, which we refer to as a reinstatement premium;
|
|
•
|
require specific levels of rate increases on the underlying insurance policies; and
|
|
•
|
credit interest income on actual cash received into a notional experience account whereby the experience account is credited to the ceding company at the maturity of the contract if underwriting results are realized as initially expected.
|
We believe these tools help us align our risk with the risk of the client and provide incentive to clients to manage our mutual interests. We also believe that aligning our interests with our client’s interests promotes profitability, accurate reporting of information, timely settling and management of claims, and limits the potential for disputes. Adjustments to profit commissions and other participating features are recorded in our financial statements based on our estimate of losses and the contractual provisions of the reinsurance contract.
During the years ended
December 31, 2014
,
2013
and
2012
, loss and loss adjustment expenses incurred totaled
$283.1 million
,
$139.8 million
and
$80.3 million
, respectively, which includes
$3.6 million
,
$4.7 million
and $nil of net favorable development, respectively. Subsequent adjustments to our loss reserves for these contracts may result in corresponding adjustments to profit commission and other participating features based upon the structure of the contract, the level of losses accounted for in our financial statements and the timing of the subsequent changes. As part of our quarterly reserving process, profit commissions and other participating features are calculated on an individual contract basis. Profit commissions and other participating features are considered probable when our actuarial loss estimate results in estimated profit commission based on the terms of the contract.
12
Underwriting Operations
As Chief Executive Officer of the Company, John Berger sets underwriting strategy, establishes underwriting policies and has appointed the underwriting teams for each of Third Point Re and Third Point Re USA. Each of our underwriting teams consists of underwriters that have in excess of 25 years of experience, on average, in the reinsurance business. The Presidents of Third Point Re and Third Point Re USA have exclusive authority to bind contracts on behalf of their respective companies.
Detailed Underwriting Diligence
We employ selective underwriting criteria in the contracts we choose to underwrite and spend a significant amount of time with our clients and brokers to understand the risks and appropriately structure the contracts. We usually obtain significant amounts of data from our clients to conduct a thorough actuarial modeling analysis. As part of our pricing and underwriting process, we assess among other factors:
|
•
|
the client’s and industry historical loss data and current market conditions;
|
|
•
|
the business purpose served by a proposed contract;
|
|
•
|
the client’s pricing and underwriting strategies;
|
|
•
|
the expected duration for claims to fully develop;
|
|
•
|
the geographic areas in which the client is doing business and its market share;
|
|
•
|
the reputation and financial strength of the client;
|
|
•
|
the reputation and expertise of the broker;
|
|
•
|
proposed contract terms and conditions; and
|
|
•
|
reports provided by independent industry specialists.
|
Retrocessional Coverage
Retrocessional coverage consists of reinsurance purchased to cover a portion of the risks that we reinsure on behalf of our clients. We purchased a small amount of retrocessional coverage in 2014, and we may continue to do so in the future. From time to time, we consider purchases of retrocessional coverage for one or more of the following reasons: to manage our overall exposure, to reduce our net liability on individual risks, to obtain additional underwriting capacity and to balance our underwriting portfolio. Additionally, retrocession can be used as a mechanism to share the risks and rewards of business written and therefore can be used as a tool to align our interests with those of our counterparties. We currently have coverage that provides for recovery of a portion of loss and loss adjustment expenses incurred on one crop contract written in 2013.
Loss and loss adjustment expenses recoverable from the retrocessionaires are recorded as assets. For the year ended
December 31, 2014
, loss and loss adjustment expenses incurred and reported on the consolidated statements of income are net of loss and loss expenses recovered of
$0.4 million
(2013 -
$9.3
million and 2012 - nil).
Retrocession contracts do not relieve us from our obligations to the insureds. Failure of retrocessionaires to honor their obligations could result in losses to us. As of
December 31, 2014
and 2013, we had loss and loss adjustment expenses recoverable of
$0.8 million
and
$9.3
million, respectively, with one retrocessionaire who was rated “A (Excellent)” by A.M. Best. We regularly evaluate the financial condition of our retrocessionaires to assess the ability of the retrocessionaires to honor their obligations.
Claims Management
Our claims management process begins upon receipt of periodic contract reports from brokers or clients. These statements are reviewed on an individual basis, evaluated against our expectations and entered in our management system for portfolio analysis and reporting purposes. In addition to analyzing report statements and results, claims
13
audits are performed on specific contracts based on results and management direction to ensure the clients are reporting and reserving their claims accurately and appropriately.
Reserves
On a quarterly basis, our actuaries produce an actuarial central estimate of the gross and net loss reserves for all contracts bound as of the evaluation date. The reserves are calculated on an undiscounted basis with regards to future investment income. The projections also include estimates of loss-sensitive contingent terms such as additional premium features, profit commissions and sliding scale ceding commissions. All calculations are done on a contract-by-contract basis and reflect the most recent premium and loss information provided by our cedents.
In estimating our loss and loss adjustment reserves, it is necessary to project future loss and loss adjustment expense payments. It is certain that actual future losses and loss adjustment expenses will not develop exactly as projected and may, in fact, significantly vary from the projections. Further, the projections make no provision for extraordinary future emergence of new classes of losses or types of losses not sufficiently represented in our or the applicable cedent’s historical database or which are not yet quantifiable.
The following table represents the activity in the loss and loss adjustment expense reserves for the years ended
December 31, 2014
,
2013
and
2012
:
|
2014
|
2013
|
2012
|
|||||||||
|
($ in thousands)
|
|||||||||||
|
Gross reserves for loss and loss adjustment expenses, beginning of year
|
$
|
134,331
|
|
$
|
67,271
|
|
$
|
—
|
|
||
|
Less: loss and loss adjustment expenses recoverable, beginning of year
|
(9,277
|
)
|
—
|
|
—
|
|
|||||
|
Net reserves for loss and loss adjustment expenses, beginning of year
|
125,054
|
|
67,271
|
|
—
|
|
|||||
|
Increase (decrease) in net loss and loss adjustment expenses incurred in respect of losses occurring in:
|
|
||||||||||
|
Current year
|
286,706
|
|
144,509
|
|
80,306
|
|
|||||
|
Prior years’
|
(3,559
|
)
|
(4,697
|
)
|
—
|
|
|||||
|
Total incurred loss and loss adjustment expenses
|
283,147
|
|
139,812
|
|
80,306
|
|
|||||
|
Net loss and loss adjustment expenses paid in respect of losses occurring in:
|
|
||||||||||
|
Current year
|
(70,562
|
)
|
(27,528
|
)
|
(13,035
|
)
|
|||||
|
Prior years’
|
(61,091
|
)
|
(54,501
|
)
|
—
|
|
|||||
|
Total net paid losses
|
(131,653
|
)
|
(82,029
|
)
|
(13,035
|
)
|
|||||
|
Net reserve for loss and loss adjustment expenses, end of year
|
276,548
|
|
125,054
|
|
67,271
|
|
|||||
|
Plus: loss and loss adjustment expenses recoverable, end of year
|
814
|
|
9,277
|
|
—
|
|
|||||
|
Gross reserve for loss and loss adjustment expenses, end of year
|
$
|
277,362
|
|
$
|
134,331
|
|
$
|
67,271
|
|
||
The
$3.6 million
decrease in prior years’ reserves for the year ended December 31, 2014 reflects
$0.7 million
of net favorable reserve development and
$2.9 million
resulting from decreases in premium estimates on certain contracts. The changes in loss and loss adjustment expense reserves related to premium estimate changes were accompanied by similar offsetting changes in the premium earned for those contracts, resulting in minimal impact to net underwriting income.
The
$4.7 million
decrease in prior years’ reserves for the year ended December 31, 2013 reflects
$1.3 million
of favorable loss experience on several contracts and
$3.4 million
resulting from decreases in premium estimates on certain contracts, primarily related to one crop contract. The reduction in loss and loss adjustment expense reserves related to premium estimates was accompanied by an equal decrease in the premium written and earned for that contract, resulting in a minimal impact to net underwriting income.
We started our underwriting activities in 2012, and as a result, there were no loss and loss adjustment expenses incurred or paid in respect of losses occurring in prior years.
14
Current loss and loss adjustment reserves
The following table represents the development of GAAP balance sheet reserves for loss and loss adjustment expense reserves, net of loss and loss adjustment expenses recoverable as of December 31, 2014, 2013 and 2012. This table does not present policy or accident year development data. The top line of the table shows our gross loss and loss adjustment expense reserves as of the balance sheet date for each of the indicated years. This represents the estimated amounts of gross and net loss and loss adjustment expense reserves arising in the current year and all prior years that are unpaid as of the balance sheet date, including incurred but not reported (“IBNR”) reserves. The table also shows the re-estimated amount of the previously recorded loss and loss adjustment expense reserves based on experience as of the end of each succeeding year. The estimates change as more information becomes known about the frequency and severity of claims for individual years. The “cumulative redundancy” represents the aggregate change to date from the original estimate. The table also shows the cumulative paid amounts as of successive years with respect to the loss and loss adjustment expense reserves.
|
2012
|
2013
|
2014
|
|||||||||
|
($ in thousands)
|
|||||||||||
|
Loss and loss adjustment expense reserves
|
$
|
67,271
|
|
$
|
134,331
|
|
$
|
277,362
|
|
||
|
Less: Loss and loss adjustment expenses recoverable
|
—
|
|
(9,277
|
)
|
(814
|
)
|
|||||
|
Loss and loss adjustment expense reserves, net of loss and loss adjustment expenses recoverable
|
67,271
|
|
125,054
|
|
276,548
|
|
|||||
|
Net loss and loss adjustment expense reserves estimated as of:
|
|||||||||||
|
1 Year Later
|
62,574
|
|
121,495
|
|
—
|
|
|||||
|
2 Years Later
|
63,401
|
|
—
|
|
—
|
|
|||||
|
Cumulative redundancy on net loss and loss adjustment expense reserves
|
3,870
|
|
3,559
|
|
—
|
|
|||||
|
Cumulative net loss and loss adjustments expenses paid:
|
|
|
|
||||||||
|
1 Year Later
|
54,501
|
|
61,091
|
|
—
|
|
|||||
|
2 Years Later
|
$
|
60,554
|
|
$
|
—
|
|
$
|
—
|
|
||
Collateral Arrangements and Letter of Credit Facilities
Third Point Re and Third Point Re USA are not licensed or admitted as an insurer in any jurisdiction other than Bermuda. Many jurisdictions such as the United States do not permit clients to take credit for reinsurance on their statutory financial statements if such reinsurance is obtained from unlicensed or non-admitted insurers without appropriate collateral or, in some states, unless they have investment grade financial strength rating from two recognized rating agencies. As a result, we anticipate that all of our U.S. clients and a portion of our non-U.S. clients will require us to provide collateral for the contracts we bind with them. We expect this collateral to take the form of funds withheld, trust arrangements or letters of credit. As of
December 31, 2014
, we had in place letter of credit facilities for an aggregate amount of
$400.0 million
and have issued letters of credit totaling $
218.5 million
in favor of clients. The failure to maintain, replace or increase our letter of credit facilities on commercially acceptable terms may significantly and negatively affect our ability to implement our business strategy. See “Risk Factors-Risks Relating to Our Business--Our failure to obtain sufficient letter of credit facilities or to increase our letter of credit capacity on commercially acceptable terms as we grow could significantly and negatively affect our ability to implement our business strategy.”
In addition, we have
$89.8 million
of restricted cash held in trust accounts to secure obligations under certain reinsurance contracts. Certain of our reinsurance contracts require that we post collateral in the form of letters of credit or trust agreements to secure obligations under the contract.
Competition
The reinsurance industry is highly competitive. We expect to compete with major reinsurers, most of which are well established, have a significant operating history and strong financial strength ratings and have developed long-standing client relationships.
15
Although we seek to provide coverage where capacity and alternatives are limited, we directly compete with larger companies due to the breadth of their coverage across the property and casualty market in substantially all lines of business. We also compete with smaller companies and other niche reinsurers. While we have a limited operating history, we believe that our unique approach to underwriting and extensive relationships will allow us to be successful in underwriting transactions against more established competitors.
Risk Management
We have developed a comprehensive risk management strategy that is governed by an articulated vision of risk appetite and control that is conveyed throughout the organization and measured in a transparent and consistent manner. Our risk management strategy, metrics and progress are summarized in a report that is presented to the board of directors on a quarterly basis. Our internal capital model incorporates statistics from the pricing, reserving and investment processes to produce an estimate of the amount of capital used at set points in time (e.g., each quarter-end) as well as the overall variability in the prospective financial results. We work closely with the risk management personnel of Third Point LLC, as our investment manager, to measure and report the variability of results from our investment portfolio. We also monitor the contractual exposure to catastrophic losses as aggregated across all bound reinsurance contracts.
Ratings
Each of our reinsurance subsidiaries has an A- (Excellent) financial strength rating with a stable outlook from A.M. Best, which is the fourth highest of 15 ratings. We believe that a strong rating is an important factor in the marketing of reinsurance products to clients and brokers. This rating reflects the rating agency’s opinion of our financial strength, operating performance and ability to meet obligations. It is not an evaluation directed toward the protection of investors or a recommendation to buy, sell or hold our common shares.
Joint Venture and Investment Management Agreements
On December 22, 2011, we entered into the investment management agreement with Third Point LLC, Third Point Re, and Third Point Advisors LLC (“TP GP”) (Third Point Re and TP GP, together with any other party admitted in the future as a participant, the “Participants” and each a “Participant”) pursuant to which the parties created a joint venture (an “Account”) whereby Third Point LLC manages the assets of Third Point Re and TP GP as well as our assets and, as except as described below, any of our subsidiaries’ assets, if any, in accordance with the terms and subject to the conditions set forth in the investment management agreement.
On January 28, 2015, we entered into another investment management agreement with Third Point LLC, Third Point Re USA and TPGP pursuant to which the parties created a separate managed account (an “Account”) whereby Third Point LLC manages the assets of Third Point Re USA and TP GP under substantially the same terms and conditions as our existing investment management agreement for Third Point Re.
Management Fee
Pursuant to each investment management agreement, Third Point LLC is entitled to receive a monthly payment in advance by each Participant (other than TP GP) and is equal to (i) 0.1667% (2.0% annualized) of the capital account of such Participant (before accounting for any accrual of the Performance Allocation (as defined in the applicable investment management agreement)) minus (ii) the aggregate amount of Founders payments paid for such month pursuant to the Founders Agreement, in each case pro-rated for intra-month withdrawals or contributions. This payment is debited against the capital account of each relevant Participant and paid in cash to Third Point LLC.
Performance Allocation
As further set out in each investment management agreement, each Account has established one or more capital accounts to which capital contributions, withdrawals, net profit and net loss will be allocated in respect of each Participant. At the end of each fiscal year, the Performance Allocation (equal to 20% of the net profit allocable to the capital account of each Participant) will be reallocated to the capital account of TP GP from the capital account of each other Participant, provided, however, that a Performance Allocation will not be made with respect to such capital account until such capital account has recouped the amount of any unrecouped net capital loss in its Loss Recovery Account
16
(as defined in the investment management agreement). If a Participant withdraws all or a portion of its capital account other than at the end of a fiscal year, the Performance Allocation accrued and attributable to the portion withdrawn will be debited against such Participant’s capital account and credited to TP GP’s capital account at the time of withdrawal.
Under each investment management agreement, Third Point LLC is required to maintain a Loss Recovery Account in respect of each Participant, the opening balance of which will be zero. Thereafter, for any fiscal year, the Loss Recovery Account balance shall be the sum of all prior year net loss amounts allocated to the Participant and not subsequently offset by prior year net profit amounts allocated to such Participant; provided that the Loss Recovery Account balance will be reduced proportionately to reflect any withdrawals made by such Participant. TP GP may waive or reduce the Performance Allocation, in its sole discretion. Third Point LLC and TP GP may elect, at the beginning of each fiscal year to restructure the Performance Allocation as a performance fee to Third Point LLC with the same terms as the Performance Allocation.
Investment Guidelines
As detailed in each investment management agreement, Third Point LLC is required to adhere to the following investment guidelines:
|
•
|
Composition of Investments
: At least 60% of the applicable investment portfolio will be held in debt or equity securities (including swaps) of publicly traded companies (or their subsidiaries) and governments of OECD (the Organization of Economic Co-operation and Development) high income countries, asset-backed securities, cash, cash equivalents and gold and other precious metals. Except with the prior written consent of the Investment and Finance committee, none of the assets in the investment portfolio will be held in illiquid investments traditionally considered “venture capital” or private equity investments. In addition, no investments in third party managed funds or other investment vehicles will be made without the consent of the Investment and Finance committee.
|
|
•
|
Concentration of Investments
: Other than cash, cash equivalents and United States government obligations, no single investment in the investment portfolio will constitute more than 15% of the portfolio.
|
|
•
|
Liquidity
: Assets will be invested in such fashion that Third Point Re and, with respect to our second investment management agreement, Third Point Re USA, has a reasonable expectation that it can meet any of its liabilities as they become due. We review the liquidity of the Third Point LLC portfolio on a periodic basis.
|
|
•
|
Net Exposure Limits
: The investment portfolio may not employ greater than 1.5 times portfolio assets managed for more than 10 trading days in any 30-trading day period.
|
Term
The original investment management agreement for Third Point Re has an initial term of five years, subject to automatic renewal for additional successive three-year terms unless a party notifies the other parties at least six months prior to the end of a term that it wishes to terminate the investment management agreement at the end of such term. The second investment management agreement entered into in January 2015 has an expiration date that coincides with the expiration date of the original investment management agreement and is subject to similar renewal provisions.
We may also terminate either investment management agreement upon the death, long-term disability or retirement of Daniel S. Loeb, or the occurrence of other circumstances in which Mr. Loeb is no longer directing the investment program of Third Point LLC.
17
We may also withdraw as participants under the investment management agreements prior to the expiration of the investment management agreements’ term at any time only “for cause”, which is defined under both investment management agreements as:
|
•
|
a material violation of applicable law relating to Third Point LLC’s advisory business;
|
|
•
|
Third Point LLC’s fraud, gross negligence, willful misconduct or reckless disregard of its obligations under the investment management agreement;
|
|
•
|
a material breach by Third Point LLC of our investment guidelines that is not cured within a 15-day period;
|
|
•
|
a conviction or, a plea of guilty or nolo contendere to a felony or a crime affecting the asset management business of Third Point LLC by certain senior officers of Third Point LLC;
|
|
•
|
any act of fraud, material misappropriation, material dishonesty, embezzlement, or similar conduct against or involving us by senior officers of Third Point LLC; or
|
|
•
|
a formal administrative or other legal proceeding before the SEC, the CFTC, the FINRA, or any other U.S. or non-U.S. regulatory or self-regulatory organization against Third Point LLC; or certain key personnel which would likely have a material adverse effect on us.
|
In addition, we may withdraw as a participant under the investment management agreements prior to the expiration of their term if net investment performance of Third Point LLC has (a) (i) incurred a loss in two successive calendar years and (ii) underperformed the S&P 500 Index by at least 10 percentage points for such two successive calendar years, taken as a whole, or (b) (i) incurred a cumulative loss of 10% or more during any 24-month period and (ii) underperformed the S&P 500 Index by at least 15 percentage points for such 24-month period. We may not withdraw or terminate the investment management agreements on the basis of performance other than as provided above. If we become dissatisfied with the results of the investment performance of Third Point LLC, we will be unable to hire new investment managers until the investment management agreements expire by their terms or are terminated for cause.
The following table sets forth management fees and performance fees incurred for the years ended
December 31, 2014
,
2013
and
2012
under the original investment management agreement, all of which were paid in respect of Third Point Re’s investment portfolio:
|
For the year ended December 31,
|
|||||||||||
|
2014
|
2013
|
2012
|
|||||||||
|
($ in thousands)
|
|||||||||||
|
Management fees - Third Point LLC
|
$
|
5,037
|
|
$
|
3,651
|
|
$
|
2,444
|
|
||
|
Management fees - Founders
|
28,544
|
|
20,686
|
|
13,854
|
|
|||||
|
Performance fees - Third Point Advisors LLC
|
19,935
|
|
62,996
|
|
33,913
|
|
|||||
|
$
|
53,516
|
|
$
|
87,333
|
|
$
|
50,211
|
|
|||
Investments
Investment Strategy
As our investment manager, Third Point LLC has the contractual right to manage substantially all of our investable assets until December 22, 2016, and is required to follow our investment guidelines and to act in a manner that is fair and equitable in allocating investment opportunities to us. However, it is not otherwise restricted with respect to the nature or timing of making investments for our account. We have the contractual right to withdraw funds from our managed accounts to pay claims and expenses as needed.
Investment Portfolio
18
The following table represents the total long, short and net exposure of our investment portfolio as managed by Third Point LLC, as of December 31, 2014 and 2013 by strategy and geography:
|
|
2014 Exposure
|
2013 Exposure
|
|||||||||||||||
|
|
Long
|
Short
|
Net
|
Long
|
Short
|
Net
|
|||||||||||
|
Long/Short Equity
|
|
|
|
|
|
|
|||||||||||
|
Consumer
|
7
|
%
|
—
|
%
|
7
|
%
|
8
|
%
|
—
|
%
|
8
|
%
|
|||||
|
Energy & Utility
|
5
|
%
|
(1
|
)%
|
4
|
%
|
5
|
%
|
—
|
%
|
5
|
%
|
|||||
|
Financial
|
8
|
%
|
—
|
%
|
8
|
%
|
12
|
%
|
(2
|
)%
|
10
|
%
|
|||||
|
Healthcare
|
17
|
%
|
—
|
%
|
17
|
%
|
4
|
%
|
—
|
%
|
4
|
%
|
|||||
|
Industries & Commodities
|
18
|
%
|
(1
|
)%
|
17
|
%
|
21
|
%
|
(2
|
)%
|
19
|
%
|
|||||
|
Technology, Media and Telecommunications
|
13
|
%
|
(1
|
)%
|
12
|
%
|
25
|
%
|
(2
|
)%
|
23
|
%
|
|||||
|
Market Hedges
|
5
|
%
|
(8
|
)%
|
(3
|
)%
|
1
|
%
|
(2
|
)%
|
(1
|
)%
|
|||||
|
Total Long/Short Equity
|
73
|
%
|
(11
|
)%
|
62
|
%
|
76
|
%
|
(8
|
)%
|
68
|
%
|
|||||
|
Credit
|
|||||||||||||||||
|
Distressed
|
3
|
%
|
—
|
%
|
3
|
%
|
5
|
%
|
—
|
%
|
5
|
%
|
|||||
|
Performing
|
5
|
%
|
(6
|
)%
|
(1
|
)%
|
8
|
%
|
(5
|
)%
|
3
|
%
|
|||||
|
Asset Backed Securities (1)
|
22
|
%
|
(1
|
)%
|
21
|
%
|
18
|
%
|
(1
|
)%
|
17
|
%
|
|||||
|
Total Credit
|
30
|
%
|
(7
|
)%
|
23
|
%
|
31
|
%
|
(6
|
)%
|
25
|
%
|
|||||
|
Macro
|
|||||||||||||||||
|
Government
|
7
|
%
|
(3
|
)%
|
4
|
%
|
2
|
%
|
(9
|
)%
|
(7
|
)%
|
|||||
|
Tail Risk
|
4
|
%
|
(8
|
)%
|
(4
|
)%
|
3
|
%
|
(2
|
)%
|
1
|
%
|
|||||
|
Total Macro
|
11
|
%
|
(11
|
)%
|
—
|
%
|
5
|
%
|
(11
|
)%
|
(6
|
)%
|
|||||
|
114
|
%
|
(29
|
)%
|
85
|
%
|
112
|
%
|
(25
|
)%
|
87
|
%
|
||||||
(1) Includes residential mortgage-backed securities, commercial mortgage-backed securities, and related indices.
|
|
2014 Exposure
|
2013 Exposure
|
|||||||||||||||
|
|
Long
|
Short
|
Net
|
Long
|
Short
|
Net
|
|||||||||||
|
Americas
|
92
|
%
|
(17
|
)%
|
75
|
%
|
78
|
%
|
(13
|
)%
|
65
|
%
|
|||||
|
Europe, Middle East and Africa
|
10
|
%
|
(8
|
)%
|
2
|
%
|
15
|
%
|
(7
|
)%
|
8
|
%
|
|||||
|
Asia
|
12
|
%
|
(4
|
)%
|
8
|
%
|
19
|
%
|
(5
|
)%
|
14
|
%
|
|||||
|
114
|
%
|
(29
|
)%
|
85
|
%
|
112
|
%
|
(25
|
)%
|
87
|
%
|
||||||
In managing our investment portfolio, Third Point LLC assigns every investment position a sector, strategy and particular geographic category. The dollar exposure of each position under each category is aggregated and the exposure percentages listed in the exposure table represent the aggregate market exposure of a given category against the total net asset value of the account. Long and short exposure percentages represent the aggregate relative value of all long and short positions in a given category, respectively. Net exposure represents the short exposure subtracted from the long exposure in a given category. Third Point LLC reports the composition of our total managed portfolio on a market exposure basis, which it believes is the appropriate manner in which to assess the exposure and profile of investments and is the way in which it manages the portfolio. Under this methodology, the exposure for equity swaps and futures contracts are reported at their full notional amount. The notional amount of any derivative contract is the underlying value upon which payment obligations are computed. For an equity total return swap, for example, the notional amount is the number of shares underlying the swap multiplied by the market price of those shares. Options are reported at their delta adjusted basis. The delta of an option is the sensitivity of the option price to the underlying stock price. The delta adjusted basis is the number of shares underlying the option multiplied by the delta and the underlying stock price. Credit derivatives are reported in accordance with their equivalent underlying security exposure. Cash and cash equivalents are excluded from exposure calculations.
19
Investment Returns
A summary of our net investment income for the years ended
December 31, 2014
,
2013
and
2012
is as follows:
|
2014
|
2013
|
2012
|
||||||||||
|
($ in thousands)
|
||||||||||||
|
Net realized gains on investments and investment derivatives
|
$
|
193,957
|
|
$
|
236,333
|
|
$
|
55,632
|
|
|||
|
Net unrealized gains (losses) on investments and investment derivatives
|
(83,146
|
)
|
78,950
|
|
113,422
|
|
||||||
|
Net gain (loss) on foreign currencies
|
2,581
|
|
21,106
|
|
(219
|
)
|
||||||
|
Dividend and interest income
|
31,750
|
|
14,233
|
|
25,284
|
|
||||||
|
Dividends paid on securities sold, not yet purchased
|
(120
|
)
|
(722
|
)
|
(1,629
|
)
|
||||||
|
Management and performance fees
|
(53,516
|
)
|
(87,333
|
)
|
(50,211
|
)
|
||||||
|
Other expenses
|
(7,151
|
)
|
(8,863
|
)
|
(5,411
|
)
|
||||||
|
Net investment income on investments managed by Third Point LLC
|
84,355
|
|
253,704
|
|
136,868
|
|
||||||
|
Investment income on cash held by the Catastrophe Reinsurer and Catastrophe Fund
|
101
|
|
86
|
|
—
|
|
||||||
|
Net gain on catastrophe bond held by Catastrophe Reinsurer
|
144
|
|
—
|
|
—
|
|
||||||
|
Net gain on reinsurance contract derivatives written by the Catastrophe Reinsurer
|
982
|
|
4,335
|
|
—
|
|
||||||
|
$
|
85,582
|
|
$
|
258,125
|
|
$
|
136,868
|
|
||||
The investment return is based on the total assets in Third Point Reinsurance Company Ltd.’s investment account managed by Third Point LLC, which includes the majority of our equity capital and float generated by our reinsurance operations. Investment returns for the years ended
December 31, 2014
,
2013
and
2012
, net of all fees and expenses, is as follows:
(1)
|
2014
|
2013
|
2012
|
|||||||
|
Third Point Reinsurance Ltd.
|
5.1
|
%
|
23.9
|
%
|
17.7
|
%
|
|||
|
S&P 500
|
13.7
|
%
|
32.4
|
%
|
16.0
|
%
|
|||
|
(1)
|
Past performance is not necessarily indicative of future results.
|
Our investment manager, Third Point LLC, manages several funds and may manage other client accounts besides ours, some of which have, or may have, objectives and investment portfolio compositions similar to ours. Because of the similarity or potential similarity of our investment portfolio to these others, and because, as a matter of ordinary course, Third Point LLC provides its clients, including us, and investors in its main hedge funds with results of their respective investment portfolios following the last day of each month, those other clients or investors indirectly may have material nonpublic information regarding our investment portfolio. To address this issue, and to comply with Regulation FD, we will continue to post on our website under the heading Investment Portfolio Returns located in the Investors section of the website, following the close of trading on the New York Stock Exchange on the last business day of each month, our preliminary monthly investment results for that month, with additional information regarding our monthly investment results to be posted following the close of trading on the New York Stock Exchange on the first business day of the following month.
Investment Regulatory Concerns and Restrictions
Third Point LLC is involved regularly in trading activities that involve a broad number of U.S. and foreign securities law regimes, including laws governing trading on inside information, market manipulation and a broad number of technical trading requirements that involve fundamental market regulation policies. Violation of such laws could result in severe restrictions on Third Point LLC’s activities and, indirectly, damage to our investment portfolio and/or reputation as each investment management agreement has limited termination provisions.
20
Third Point LLC’s failure to comply with applicable laws or regulations could result in fines, censure, suspensions of personnel or other sanctions. The regulations that Third Point LLC is subject to are designed primarily to ensure the integrity of the financial markets. They are not designed to protect us or, indirectly, you. Even if a sanction imposed against Third Point LLC or one of its personnel by a regulator was for a small monetary amount, the adverse publicity related to such sanction against Third Point LLC by regulators could harm its reputation and, possibly, ours.
In recent years, there has been debate in both the U.S. and foreign governments about new rules or regulations to be applicable to alternative investment advisers, like Third Point LLC.
In August 2007, the SEC adopted a new rule intended to clarify the SEC’s authority to bring enforcement actions against investment advisers for fraud against investors and prospective investors in their funds (as opposed to fraud against the funds themselves). Although we do not believe the SEC’s rule has directly affected us, Third Point LLC and, accordingly, our investment strategy, may be adversely affected if new or revised legislation or regulations are enacted or by changes to existing rules and regulations of U.S. or foreign governmental regulatory authorities or self-regulatory organizations that supervise the financial markets.
It is possible that increased regulation of alternative investment advisers could adversely affect Third Point LLC’s ability to manage our investment portfolio or its ability to manage our portfolio pursuant to our existing investment strategy, which could cause us to alter our existing investment strategy and could significantly and negatively affect our business and results of operations. In addition, adverse publicity regarding alternative investment strategies generally, or Third Point LLC or its affiliates specifically, could negatively affect our business reputation and attractiveness as a counterparty to brokers and clients.
Other Trading Restrictions
Third Point LLC may from time to time place it or its affiliates’ representatives on creditors committees or boards of certain companies in which our portfolio is invested. While such representation may enable Third Point LLC to enhance the value of our investments, it may place trading restrictions on certain securities included in our investment portfolio.
Regulation
Bermuda Insurance Regulation
The Insurance Act of 1978
The Insurance Act of 1978, as amended, and related regulations of Bermuda (the “Insurance Act”), which regulates the insurance business of Third Point Re, Third Point Re USA and the Catastrophe Reinsurer, provides that no person shall carry on any insurance business in or from within Bermuda unless registered as an insurer under the Insurance Act by the BMA. Under the Insurance Act, insurance business includes reinsurance business. The BMA, in deciding whether to grant registration, has broad discretion to act as it thinks fit in the public interest. The BMA is required by the Insurance Act to determine whether the applicant is a fit and proper body to be engaged in the insurance business and, in particular, whether it has, or has available to it, adequate knowledge and expertise. The registration of an applicant as an insurer is subject to its complying with the terms of its registration and such other conditions as the BMA may impose from time to time. The Insurance Act also grants to the BMA powers to supervise, investigate and intervene in the affairs of insurance companies.
An insurance advisory committee appointed by the Bermuda Minister of Finance advises the BMA on matters connected with the discharge of the BMA’s functions and sub-committees thereof supervise and review the law and practice of insurance in Bermuda, including reviews of accounting and administrative procedures.
The Insurance Act imposes on Bermuda insurance companies solvency and liquidity standards and auditing and reporting requirements and grants to the BMA powers to supervise, investigate and intervene in the affairs of insurance companies. Certain significant aspects of the Bermuda insurance regulatory framework are set forth below.
21
Classification of Insurers
The Insurance Act distinguishes between insurers carrying on long-term business, insurers carrying on general business and insurers carrying on special purpose business. There are six classifications of insurers carrying on general business, ranging from Class 1 insurers (pure captives) to Class 4 insurers (very large commercial underwriters). There is only one classification of special purpose insurer. Third Point Re and Third Point Re USA are registered as Class 4 insurers and the Catastrophe Reinsurer is registered as a special purpose insurer.
Classification as a Class 4 Insurer
A body corporate is registrable as a Class 4 insurer where (i) it has at the time of its application for registration, or will have before it carries on insurance business, a total statutory capital and surplus of not less than $100,000,000; and (ii) it intends to carry on general insurance business, including excess liability business or property catastrophe reinsurance business. Class 4 insurers are required to maintain fully paid-up share capital of $1,000,000.
Classification as a Special Purpose Insurer
A special purpose insurer (“SPI”) means an insurer that carries on special purpose business. Special purpose business is defined under the Insurance Act as insurance business under which an insurer fully funds its liabilities to the persons insured through (a) the proceeds of any one or more of (i) a debt issuance where the repayment rights of the providers of such debt are subordinated to the rights of the person insured, or (ii) some other financing mechanism approved by the BMA; (b) cash; and (c) time deposits.
Principal Representative and Principal Office
Third Point Re, Third Point Re USA and the Catastrophe Reinsurer are each required to maintain a principal office and to appoint and maintain a principal representative in Bermuda. For the purpose of the Insurance Act, the principal office of Third Point Re and Third Point Re USA is at our principal executive offices in Bermuda. Third Point Re’s principal representative is John Berger and Third Point Re USA’s principal representative is Christopher Coleman. The principal office of the Catastrophe Reinsurer is at The Waterfront, Chesney House, 96 Pitts Bay Road, Pembroke HM 08 Bermuda and the Catastrophe Reinsurer’s principal representative is Prime Management Limited. Without a reason acceptable to the BMA, an insurer may not terminate the appointment of its principal representative, and the principal representative may not cease to act as such, unless 30 days’ notice in writing to the BMA is given of the intention to do so.
It is the duty of the principal representative to forthwith notify the BMA where the principal representative believes there is a likelihood of the insurer (for which the principal representative acts) becoming insolvent or that a reportable “event” has, to the principal representative’s knowledge, occurred or is believed to have occurred. Examples of a reportable “event” include a failure by Third Point Re or Third Point Re USA to comply substantially with a condition imposed upon it by the BMA relating to a solvency margin or a liquidity or other ratio, a significant loss likely to cause the insurer to fail to comply with its enhanced capital requirement (discussed below) and the occurrence of a “material change” (as such term is defined under the Insurance Act) in its business operations.
Within 14 days of such notification to the BMA, the principal representative must furnish the BMA with a written report setting out all the particulars of the case that are available to the principal representative.
Loss Reserve Specialist
As Class 4 insurers, Third Point Re and Third Point Re USA must each appoint an individual approved by the BMA to be its loss reserve specialist. In order to qualify as an approved loss reserve specialist, the applicant must be an individual and possess adequate professional qualifications as a casualty actuary and/or possess adequate experience to assess the sufficiency of insurance reserves of the insurer. The Class 4 insurers are required to submit annually an opinion of their approved loss reserve specialists with their statutory financial return in respect of their loss and loss expense provisions.
As an SPI, the Catastrophe Reinsurer is not required to appoint a loss reserve specialist.
22
Annual Financial Statements
As Class 4 insurers, Third Point Re and Third Point Re USA must prepare and submit, on an annual basis, both audited U.S. GAAP and statutory financial statements.
The Catastrophe Reinsurer, as an SPI, must prepare and submit annual statutory financial statements, unless an application has been filed under the Insurance Act to have the statutory filing requirement waived. Where such a waiver has been granted, the BMA will accept unaudited management accounts from the SPI prepared in accordance with GAAP or international financial reporting standards that apply in Bermuda, Canada, the United Kingdom or the United States of America. The Catastrophe Reinsurer is also required to provide the BMA with a copy of the unaudited management statement accounts as soon as practicable after the same have been submitted to the participants and, at a minimum, within four months of the end of each financial year.
The Insurance Act prescribes rules for the preparation and substance of statutory financial statements (which include, in statutory form, a balance sheet, income statement, a statement of capital and surplus, and notes thereto). The statutory financial statements include detailed information and analysis regarding premiums, claims, reinsurance and investments of the insurer. In addition, as Class 4 insurers, Third Point Re and Third Point Re USA are also required to prepare and submit to the BMA financial statements which have been prepared under generally accepted accounting principles or international financial reporting standards (“GAAP financial statements”).
As Class 4 insurers, Third Point Re and Third Point Re USA’s annual U.S. GAAP and statutory financial statements are required to be filed with the BMA within four months from the end of the relevant financial year (unless specifically extended).
The statutory financial statements do not form part of the public records maintained by the BMA but the GAAP financial statements for both Third Point Re and Third Point Re USA are available for public inspection.
Annual Statutory Financial Return and Annual Capital and Solvency Return
Third Point Re and Third Point Re USA, as Class 4 insurers, and the Catastrophe Reinsurer, as an SPI, are required to file with the BMA a statutory financial return no later than four months after their respective financial year end (unless specifically extended) unless, in the case of the Catastrophe Reinsurer, the Catastrophe Reinsurer has filed and obtained a waiver, as outlined above. The statutory financial return includes, among other matters, a report of the approved independent auditor on the statutory financial statements of the insurer, a general business, or special purpose business, as applicable, solvency certificate, the statutory financial statements themselves and the opinion of the loss reserve specialist.
The principal representative and at least two directors of the insurer must sign the solvency certificate. The directors are required to certify whether the minimum solvency margin has been met, and the independent approved auditor is required to state whether in its opinion it was reasonable for the directors to make this certification.
Where an insurer’s accounts have been audited for any purpose other than compliance with the Insurance Act, a statement to that effect must be filed with the statutory financial return.
In addition, each year Third Point Re and Third Point Re USA, as a Class 4 insurers, are also required to file with the BMA a capital and solvency return along with their annual financial statutory returns. The prescribed form of capital and solvency return comprises the insurer’s Bermuda Solvency Capital Requirement (“BSCR”) model or an approved internal capital model in lieu thereof (more fully described below), a schedule of fixed income investments by rating categories, a schedule of net loss and loss expense provisions by line of business, a schedule of premiums written by line of business, a schedule of risk management, a schedule of fixed income securities, a schedule of commercial insurer’s solvency self assessment (“CISSA”), a schedule of catastrophe risk return, a schedule of loss triangles or reconciliation of net loss reserves and a schedule of eligible capital.
Neither the statutory financial return nor the capital and solvency return is available for public inspection.
Quarterly Financial Statements
Third Point Re and Third Point Re USA, as Class 4 insurers not being otherwise subject to group supervision (described below), are each required to prepare and file quarterly financial returns with the BMA on or before the last
23
day of the months May, August and November of each year. The quarterly financial returns consist of (i) quarterly unaudited financial statements for each financial quarter (which must minimally include a balance sheet and income statement and must also be recent and not reflect a financial position that exceeds two months) and (ii) a list and details of material intra-group transactions and risk concentrations that have materialized since the most recent quarterly or annual financial returns, details surrounding all intra-group reinsurance and retrocession arrangements and other intra-group risk transfer insurance business arrangements that have materialized since the most recent quarterly or annual financial returns and details of the ten largest exposures to unaffiliated counterparties and any other unaffiliated counterparty exposures exceeding 10% of the insurer’s statutory capital and surplus. Quarterly financial statements are not required where the Class 4 insurer is subject to group supervision.
Independent Approved Auditor
Third Point Re and Third Point Re USA, as Class 4 insurers, must each appoint an independent auditor who will annually audit and report on the insurer’s GAAP financial statements, its statutory financial statements and its statutory financial returns, each of which are required to be filed annually with the BMA. The auditor must be approved by the BMA as the independent auditor of the insurer. If the insurer fails to appoint an approved auditor or at any time fails to fill a vacancy for such auditor, the BMA may appoint an approved auditor for the insurer and shall fix the remuneration to be paid to the approved auditor within 14 days, if not agreed sooner by the insurer and the auditor.
The Catastrophe Reinsurer, as an SPI, may file an application under the Insurance Act to have this requirement waived, as outlined above.
Non-insurance Business
Third Point Re and Third Point Re USA, as Class 4 insurers may not engage in non-insurance business unless that non-insurance business is ancillary to their core insurance business. Non-insurance business means any business other than insurance business and includes carrying on investment business, managing an investment fund as operator, carrying on business as a fund administrator, carrying on banking business, underwriting debt or securities or otherwise engaging in investment banking, engaging in commercial or industrial activities and carrying on the business of management, sales or leasing of real property. Third Point Re, as a Class 4 insurer registered before December 31, 2012, will be permitted to continue engaging in non-insurance business but must discontinue doing so not later than year-end 2016.
Minimum Liquidity Ratio
The Insurance Act provides a minimum liquidity ratio for general business. As an insurer engaged in general business, Third Point Re and Third Point Re USA are each required to maintain the value of their relevant assets at not less than 75% of the amount of their relevant liabilities. Relevant assets include cash and time deposits, quoted investments, unquoted bonds and debentures, first liens on real estate, investment income due and accrued, accounts and premiums receivable, reinsurance balances receivable and funds held by ceding reinsurers.
There are certain categories of assets that, unless specifically permitted by the BMA, do not automatically qualify as relevant assets, such as unquoted equity securities, investments in and advances to affiliates and real estate and collateral loans.
The relevant liabilities are total general business insurance reserves and total other liabilities less deferred income tax and sundry liabilities (by interpretation, those not specifically defined) and letters of credit and guarantees.
Minimum Solvency Margin and Enhanced Capital Requirements
The Insurance Act provides that the value of the statutory assets of a Class 4 insurer must exceed the value of its statutory liabilities by an amount greater than its prescribed minimum solvency margin (“MSM”).
The MSM that must be maintained by a Class 4 insurer with respect to its general business is the greater of (i) $100 million, or (ii) 50% of net premium written (with a credit for reinsurance ceded not exceeding 25% of gross premiums) or (iii) 15% of net discounted aggregate loss and loss expense provisions and other insurance reserves.
24
The Insurance Act provides that an SPI is required to maintain a minimum solvency margin by which the value of the special purpose business assets must exceed its special purpose business liabilities by at least $1.
Class 4 insurers are also required to maintain available statutory capital and surplus at a level equal to or in excess of its enhanced capital requirement (“ECR”) which is established by reference to either the BSCR model or an approved internal capital model.
The BSCR model is a risk-based capital model which provides a method for determining an insurer’s capital requirements (statutory capital and surplus) by taking into account the risk characteristics of different aspects of the insurer’s business. The BSCR formulae establish capital requirements for eight categories of risk: fixed income investment risk, equity investment risk, interest rate/liquidity risk, premium risk, reserve risk, credit risk, catastrophe risk and operational risk. For each category, the capital requirement is determined by applying factors to asset, premium, reserve, creditor, probable maximum loss and operation items, with higher factors applied to items with greater underlying risk and lower factors for less risky items.
While not specifically referred to in the Insurance Act, the BMA has also established a target capital level (“TCL”) for each Class 4 insurer equal to 120% of its ECR. While a Class 4 insurer is not currently required to maintain its statutory capital and surplus at this level, the TCL serves as an early warning tool for the BMA and failure to maintain statutory capital at least equal to the TCL will likely result in increased regulatory oversight.
Any Class 4 insurer that at any time fails to meet its MSM requirements must, upon becoming aware of such failure, immediately notify the BMA and, within 14 days thereafter, file a written report with the BMA containing particulars of the circumstances that gave rise to the failure and setting out its plan detailing specific actions to be taken and the expected timeframe in which the company intends to rectify the failure.
Any Class 4 insurer that at any time fails to meet its enhanced capital requirement applicable to it shall upon becoming aware of that failure, or of having reason to believe that such a failure has occurred, immediately notify the BMA in writing and within 14 days of such notification file with the BMA a written report containing particulars of the circumstances leading to the failure; and a plan detailing the manner, specific actions to be taken and time within which the insurer intends to rectify the failure and within 45 days of becoming aware of that failure, or of having reason to believe that such a failure has occurred, furnish the BMA with (i) unaudited interim statutory financial statements covering such period as the BMA may require; (ii) the opinion of a loss reserve specialist where applicable; (iii) a general business solvency certificate in respect of the financial statements; and (iv) a capital and solvency return reflecting an enhanced capital requirement prepared using post failure data where applicable.
Eligible Capital
To enable the BMA to better assess the quality of the insurer’s capital resources, a Class 4 insurer is required to disclose the makeup of its capital in accordance with the recently introduced ‘3-tiered capital system’. Under this system, all of the insurer’s capital instruments will be classified as either basic or ancillary capital which in turn will be classified into one of 3 tiers based on their “loss absorbency” characteristics. Highest quality capital will be classified as Tier 1 Capital, lesser quality capital will be classified as either Tier 2 Capital or Tier 3 Capital. Under this regime, up to certain specified percentages of Tier 1, Tier 2 and Tier 3 Capital may be used to support the insurer’s MSM, ECR and TCL.
The characteristics of the capital instruments that must be satisfied to qualify as Tier 1, Tier 2 and Tier 3 Capital are set out in the Insurance (Eligible Capital) Rules 2012, and any amendments thereto. Under these rules, Tier 1, Tier 2 and Tier 3 Capital may, until January 1, 2024, include capital instruments that do not satisfy the requirement that the instrument be non-redeemable or settled only with the issuance of an instrument of equal or higher quality upon a breach, or if it would cause a breach, of the ECR.
Where the BMA has previously approved the use of certain instruments for capital purposes, the BMA’s consent will need to be obtained if such instruments are to remain eligible for use in satisfying the MSM and the ECR.
25
Code of Conduct
Every Bermuda registered insurer must comply with the Insurance Code of Conduct (the “Code”), which prescribes the duties and standards that must be complied with to ensure sound corporate governance, risk management and internal controls are implemented. The BMA will assess an insurer’s compliance with the Code in a proportionate manner relative to the nature, scale and complexity of its business. Failure to comply with the requirements of the Code will be taken into account by the BMA in determining whether an insurer is conducting its business in a sound and prudent manner as prescribed by the Insurance Act and may result in the BMA exercising its powers of intervention and investigation (see below) and, in the case of Third Point Re and Third point Re USA, as Class 4 insurers, will be a factor in calculating the operational risk charge under the insurer’s BSCR or approved internal model.
Restrictions on Dividends and Distributions
A Class 4 insurer is prohibited from declaring or paying a dividend if it is in breach of its MSM, ECR or minimum liquidity ratio or if the declaration or payment of such dividend would cause such a breach. An SPI is prohibited from declaring or paying any dividend during any financial year if it is in breach of its minimum solvency margin or if the declaration or payment of such dividends would cause it to fail to meet such minimum margin. Where a Class 4 insurer fails to meet its MSM or minimum liquidity ratio or an SPI fails to meet its minimum solvency margin on the last day of any financial year, it is prohibited from declaring or paying any dividends during the next financial year without the approval of the BMA.
In addition, a Class 4 insurer is prohibited from declaring or paying in any financial year dividends of more than 25% of its total statutory capital and surplus (as shown on its previous financial year’s statutory balance sheet) unless it files (at least seven days before payment of such dividends) with the BMA an affidavit signed by at least 2 directors (one of whom must be a Bermuda resident director if any of the insurer’s directors are resident in Bermuda) and the principal representative stating that it will continue to meet its solvency margin and minimum liquidity ratio. Where such an affidavit is filed, it shall be available for public inspection at the offices of the BMA.
Reduction of Capital
Neither Third Point Re nor Third Point Re USA, as general business insurers, may reduce its total statutory capital by 15% or more, as set out in their respective previous year’s financial statements, unless it has received the prior approval of the BMA. Total statutory capital consists of the insurer’s paid in share capital, its contributed surplus (sometimes called additional paid in capital) and any other fixed capital designated by the BMA as statutory capital (such as letters of credit).
As Class 4 insurers, where either of Third Point Re or Third Point Re USA seek to reduce their statutory capital by 15% or more, as set out in their respective previous year’s financial statements, they must also submit an affidavit signed by at least two directors (one of whom must be a Bermuda resident director if any of the company’s directors are resident in Bermuda) and the principal representative stating that the proposed reduction will not cause the company to fail its relevant margins. Where such an affidavit is filed, it shall be available for public inspection at the offices of the BMA.
Fit and Proper Controllers
The BMA maintains supervision over the controllers of all registered insurers in Bermuda. A controller includes (i) the managing director of the registered insurer or its parent company; (ii) the chief executive of the registered insurer or of its parent company; (iii) a shareholder controller; and, (iv) any person in accordance with whose directions or instructions the directors of the registered insurer or of its parent company are accustomed to act.
The definition of shareholder controller is set out in the Insurance Act but generally refers to (i) a person who holds 10% or more of the shares carrying rights to vote at a shareholders’ meeting of the registered insurer or its parent company, or (ii) a person who is entitled to exercise 10% or more of the voting power at any shareholders’ meeting of such registered insurer or its parent company, or (iii) a person who is able to exercise significant influence over the
26
management of the registered insurer or its parent company by virtue of its shareholding or its entitlement to exercise, or control the exercise of, the voting power at any shareholders’ meeting.
A shareholder controller that owns 10% or more but less than 20% of the shares as described above is defined as a 10% shareholder controller; a shareholder controller that owns 20% or more but less than 33% of the shares as described above is defined as a 20% shareholder controller; a shareholder controller that owns 33% or more but less than 50% of the shares as described above is defined as a 33% shareholder controller; and a shareholder controller that owns 50% or more of the shares as described above is defined as a 50% shareholder controller.
Where the shares of the shareholder of a registered insurer, or the shares of its parent company, are traded on a recognised stock exchange, and such person becomes a 10%, 20%, 33% or 50% shareholder controller of the insurer, that person shall, within 45 days, notify the BMA in writing that he has become such a controller.
Where the shares of a shareholder or prospective shareholder of an insurer, or the shares of its parent company, are
not
traded on a recognised stock exchange (i.e. private companies), the Insurance Act prohibits such person from becoming a shareholder controller unless he has first served on the BMA notice in writing stating that he intends to become such a controller and the BMA has either, before the end of 45 days following the date of notification, provided notice to the proposed controller that it does not object to his becoming such a controller or the full 45 days has elapsed without the BMA filing an objection.
Any person who contravenes the Insurance Act by failing to give notice or knowingly becoming a controller of any description before the required 45 days has elapsed is guilty of an offence and liable to a fine of $25,000 on summary conviction.
The BMA may file a notice of objection to any person who has become a controller of any description where it appears that such person is not, or is no longer, a fit and proper person to be a controller of the registered insurer. Before issuing a notice of objection, the BMA is required to serve upon the person concerned a preliminary written notice stating the BMA’s intention to issue formal notice of objection. Upon receipt of the preliminary written notice, the person served may, within 28 days, file written representations with the BMA, which shall be taken into account by the BMA in making its final determination. Any person who continues to be a controller of any description after having received a notice of objection shall be guilty of an offence and shall be liable on summary conviction to a fine of $25,000 (and a continuing fine of $500 per day for each day that the offence is continuing) or, if convicted on indictment, to a fine of $100,000 and/or two years in prison.
Notification by Registered Person of Change of Controllers and Officers
All registered insurers are required to give written notice to the BMA of the fact that a person has become, or ceased to be, a controller or officer of the registered insurer within 45 days of becoming aware of such fact. An officer in relation to a registered insurer means a director, chief executive or senior executive performing duties of underwriting, actuarial, risk management, compliance, internal audit, finance or investment matters.
Notification of Material Changes
All registered insurers are required to give notice to the BMA of their intention to effect a material change within the meaning of the Insurance Act. For the purposes of the Insurance Act, the following changes are material: (i) the transfer or acquisition of insurance business being part of a scheme falling under section 25 of the Insurance Act or section 99 of the Companies Act, (ii) the amalgamation with or acquisition of another firm, (iii) engaging in unrelated business that is retail business, (iv) the acquisition of a controlling interest in an undertaking that is engaged in non-insurance business that offers services and products to persons who are not affiliates of the insurer, (v) outsourcing all or substantially all of the company’s actuarial, risk management and internal audit functions, (vi) outsourcing all or a material part of an insurer’s underwriting activity, (vii) the transfer other than by way of reinsurance of all or substantially all of a line of business, and (viii) the expansion into a material new line of business.
No registered insurer shall take any steps to give effect to a material change unless it has first served notice on the BMA that it intends to effect such material change and before the end of 14 days, either the BMA has notified
27
such company in writing that it has no objection to such change or that period has lapsed without the BMA having issued a notice of objection.
Before issuing a notice of objection, the BMA is required to serve upon the person concerned a preliminary written notice stating the BMA’s intention to issue formal notice of objection. Upon receipt of the preliminary written notice, the person served may, within 28 days, file written representations with the BMA, which shall be taken into account by the BMA in making its final determination.
Group Supervision
The BMA may, in respect of an insurance group, determine whether it is appropriate for it to act as its group supervisor. An insurance group is defined as a group of companies that conducts exclusively, or mainly, insurance business. The BMA may make such determination where it ascertains that (i) the group is headed by a “specified insurer” (that is to say, it is headed by either a Class 3A, Class 3B or Class 4 general business insurer or a Class C, Class D or Class E long term insurer or another class of insurer designated by order of the BMA); or (ii) where the insurance group is not headed by a “specified insurer”, where it is headed by a parent company that is incorporated in Bermuda or (iii) where the parent company of the group is not a Bermuda company, in circumstances where the BMA is satisfied that the insurance group is directed and managed from Bermuda or the insurer with the largest balance sheet total is a specified insurer.
Where the BMA determines that it should act as the group supervisor, it shall designate a specified insurer that is a member of the insurance group to be the designated insurer (the “Designated Insurer”) and it shall give to the Designated Insurer and other competent authorities written notice of its intention to act as group supervisor. Once the BMA has been designated as group supervisor, the Designated Insurer must ensure that an approved group actuary is appointed to provide an opinion as to the adequacy of the insurance group’s insurance reserves as reported in its group statutory financial statements.
Pursuant to its powers under the Insurance Act, the BMA will maintain a register of particulars for every insurance group for which it acts as the group supervisor detailing, among other things, the names and addresses of the Designated Insurer; each member company of the insurance group falling within the scope of group supervision; the principal representative of the insurance group in Bermuda; other competent authorities supervising other member companies of the insurance group; and the insurance group auditors. The Designated Insurer must notify the BMA of any changes to the above details entered on the register of an insurance group.
As group supervisor, the BMA will perform a number of supervisory functions including (i) coordinating the gathering and dissemination of information which is of importance for the supervisory task of other competent authorities; (ii) carrying out a supervisory review and assessment of the insurance group; (iii) carrying out an assessment of the insurance group’s compliance with the rules on solvency, risk concentration, intra-group transactions and good governance procedures; (iv) planning and coordinating, with other competent authorities, supervisory activities in respect of the insurance group, both as a going concern and in emergency situations; (v) coordinating any enforcement action that may need to be taken against the insurance group or any of its members; and (vi) planning and coordinating meetings of colleges of supervisors (consisting of insurance regulators) in order to facilitate the carrying out of the functions described above.
In carrying out its functions, the BMA may make rules for (i) assessing the financial situation and the solvency position of the insurance group and/or its members and (ii) regulating intra-group transactions, risk concentration, governance procedures, risk management and regulatory reporting and disclosure.
We are not currently subject to group supervision, but the BMA may exercise its authority to act as our group supervisor in the future.
Supervision, Investigation, Intervention and Disclosure
The BMA may, by notice in writing served on an insurer or a designated insurer (as described in “Group Supervision” above), require the insurer or designated insurer to provide such information and/or documentation as the BMA may reasonably require with respect to matters that are likely to be material to the performance of its supervisory
28
functions under the Insurance Act. In addition, it may require such person’s auditor, underwriter, accountant or any other person with relevant professional skill to prepare a report on any aspect pertaining thereto. In the case of a report, the person so appointed shall immediately give the BMA written notice of any fact or matter of which he becomes aware or which indicates to him that any condition attaching to his registration under the Insurance Act is not or has not or may not be or may not have been fulfilled and that such matters are likely to be material to the performance of its functions under the Insurance Act. If it appears to the BMA to be desirable in the interests of the clients of an insurer or relevant insurance group, the BMA may also exercise these powers in relation to subsidiaries, parent companies and other affiliates of the insurer or designated insurer.
If the BMA deems it necessary to protect the interests of the policyholders or potential policyholders of an insurer or insurance group, it may appoint one or more competent persons to investigate and report on the nature, conduct or state of the insurer’s or the insurance group’s business, or any aspect thereof, or the ownership or control of the insurer or insurance group. If the person so appointed thinks it necessary for the purposes of his investigation, he may also investigate the business of any person who is or has been at any relevant time, a member of the insurance group or of a partnership of which the person being investigated is a member. In this regard, it shall be the duty of every person who is or was a controller, officer, employee, agent, banker, auditor, accountant, barrister and attorney or insurance manager to produce to the person appointed such documentation as he may reasonably require for purposes of his investigation, and to attend and answer questions relevant to the investigation and to otherwise provide such assistance as may be necessary in connection therewith.
Where the BMA suspects that a person has failed to properly register under the Insurance Act or that an insurer or designated insurer has failed to comply with a requirement of the Insurance Act or that a person is not, or is no longer, a fit and proper person to perform functions in relation to a regulated activity, it may, by notice in writing, carry out an investigation into such person (or any other person connected thereto). In connection therewith, the BMA may require every person who is or was a controller, officer, employee, agent, banker, auditor, accountant, barrister and attorney or insurance manager to make a report and produce such documents in his care, custody and control and to attend before the BMA to answer questions relevant to the BMA’s investigation and to take such actions as the BMA may direct. The BMA may also enter any premises for the purposes of carrying out its investigation and may petition the court for a warrant if it believes a person has failed to comply with a notice served on him or there are reasonable grounds for suspecting the completeness of any information or documentation produced in response to such notice or that its directions will not be complied with or that any relevant documents would be removed, tampered with or destroyed.
If it appears to the BMA that the business of the insurer is being so conducted that there is a significant risk of the insurer becoming insolvent, or that the insurer is in breach of the Insurance Act or any conditions imposed upon its registration, or the minimum criteria stipulated in the Insurance Act is not or has not been fulfilled in respect of a registered insurer, or that a person has become a controller without providing the BMA with the appropriate notice or in contravention of a notice of objection, or the registered insurer is in breach of its ECR, or that a designated insurer is in breach of any provision of the Insurance Act or the regulations or rules applicable to it, the BMA may issue such directions as appear desirable for safeguarding the interests of policyholders or potential policyholders of the insurer or the insurance group. The BMA may direct an insurer, for itself and in its capacity as designated insurer of the insurance group of which it is a member, (1) not to take on any new insurance business, (2) not to vary any insurance contract if the effect would be to increase the insurer’s liabilities, (3) not to make certain investments, (4) to realize certain investments, (5) to maintain in, or transfer to the custody of, a specified bank, certain assets, (6) not to declare or pay any dividends or other distributions or to restrict the making of such payments, (7) to limit its premium income, (8) not to enter into specified transactions with any specified person or persons of a specified class, (9) to provide such written particulars relating to the financial circumstances of the insurer as the BMA thinks fit, (10) (as an individual insurer only and not in its capacity as designated insurer) to obtain the opinion of a loss reserve specialist and submit it to the BMA and/or (11) to remove a controller or officer.
The BMA has the power to assist other regulatory authorities, including foreign insurance regulatory authorities, with their investigations involving insurance and reinsurance companies in Bermuda if it is satisfied that the assistance being requested is in connection with the discharge of regulatory responsibilities and that such cooperation is in the public interest. The grounds for disclosure by the BMA to a foreign regulatory authority without consent of the insurer are limited and the Insurance Act provides for sanctions for breach of the statutory duty of confidentiality.
29
Cancellation of Insurer’s Registration
An insurer’s registration may be canceled by the BMA on certain grounds specified in the Insurance Act. Failure by the insurer to comply with its obligations under the Insurance Act or if, the BMA believes that the insurer has not been carrying on business in accordance with sound, could result in our registration to be canceled.
In addition to powers under the Insurance Act to investigate the affairs of an insurer, the BMA may require certain information from an insurer (or certain other persons) to be produced to the BMA. Further, the BMA has been given powers to assist other regulatory authorities, including foreign insurance regulatory authorities, with their investigations involving insurance and reinsurance companies in Bermuda but subject to restrictions. For example, the BMA must be satisfied that the assistance being requested is in connection with the discharge of regulatory responsibilities of the foreign regulatory authority. Further, the BMA must consider whether cooperation is in the public interest. The grounds for disclosure are limited and the Insurance Act provides for sanctions for breach of the statutory duty of confidentiality.
Certain Other Bermuda Law Considerations
All Bermuda “exempted companies” are exempt from certain Bermuda laws restricting the percentage of share capital that may be held by non-Bermudians. However, exempted companies may not participate in certain business transactions, including (i) the acquisition or holding of land in Bermuda except that required for their business and held by way of lease or tenancy for terms of not more than 50 years or, with the consent of the Minister of Finance, land which is used to provide accommodation or recreational facilities for officers and our employees for a term not exceeding 21 years, (ii) the taking of mortgages on land in Bermuda to secure an amount in excess of $50,000 without the consent of the Minister, (iii) the acquisition of any bonds or debentures secured by any land in Bermuda, other than certain types of Bermuda government securities or securities issued by Bermuda public authorities or, (iv) the carrying on of business of any kind in Bermuda, except in furtherance of the business carried on outside Bermuda or under license granted by the Minister. Generally it is not permitted without a special license granted by the Minister to insure Bermuda domestic risks or risks of persons of, in or based in Bermuda.
All Bermuda companies must comply with the provisions of the Companies Act regulating the payment of dividends and making distributions from contributed surplus. A company may not declare or pay a dividend, or make a distribution out of contributed surplus, if there are reasonable grounds for believing that: (i) the company is, or would after the payment be, unable to pay its liabilities as they become due; or (ii) the realizable value of the company’s assets would thereby be less than its liabilities.
United States Insurance Regulation
Third Point Re and Third Point Re USA are licensed in Bermuda to write reinsurance and are not admitted to do business in any jurisdiction in the United States or in any country other than Bermuda. The insurance laws of each state of the United States and of many foreign countries regulate the sale of insurance and reinsurance within their jurisdictions by alien insurers and reinsurers, such as Third Point Re and Third Point Re USA.
Third Point Re and Third Point Re USA currently intend to conduct their business so as not to be subject to the licensing requirements of insurance regulators in the United States or elsewhere (other than Bermuda). Many aspects of the activities of Third Point Re and Third Point Re USA are similar to those employed by other non-admitted reinsurers that provide reinsurance to U.S. and other ceding companies. There can be no assurance, however, that insurance regulators in the United States or elsewhere will not review the activities of Third Point Re or Third Point Re USA and claim that Third Point Re or Third Point Re USA is subject to such jurisdiction’s licensing requirements.
In addition to the regulatory requirements imposed by the jurisdictions in which they are licensed, reinsurers are subject to indirect regulatory requirements imposed by jurisdictions in which their ceding companies are licensed through the “credit for reinsurance” mechanism. In general, a ceding company which obtains reinsurance from a reinsurer that is licensed, accredited or approved by the jurisdiction or state in which the insurer files statutory financial statements is permitted to reflect in its statutory financial statements a credit in an aggregate amount equal to the liability for unearned premiums and loss reserves and loss adjustment expense reserves ceded to the reinsurer.
30
In the United States, many states allow credit for reinsurance ceded to a reinsurer that is domiciled and licensed in another state of the United States and meets certain financial requirements. A few states do not allow credit for reinsurance ceded to non-licensed reinsurers except in certain limited circumstances and others impose additional requirements that make it difficult to become accredited. The great majority of states, however, permit the reduction in statutory surplus resulting from reinsurance obtained from a non-licensed or non-accredited reinsurer to be offset to the extent that the reinsurer provides a letter of credit or other acceptable security arrangement, and a few states reduce the amount of security to be posted based on a number of factors, including the credit rating given to a reinsurer from a U.S.-nationally recognised statistical rating organization.
Information Technology
We have a disaster recovery plan with respect to our information technology infrastructure that includes arrangements with an offshore data center. Our secondary off-island location for data systems back-up and recovery is located in Toronto, Canada, due to its non-correlated nature with Bermuda. The environment is configured to be live within one hour of a disaster scenario and supports all of the business capabilities of our primary Bermuda site.
Employees
As of December 31, 2014, we had 23 employees, 20 of whom were based in Bermuda, two of whom were based in the United States and one of whom was based in the United Kingdom. We believe that our employee relations are good. None of our employees are subject to collective bargaining agreements, and we are not aware of any current efforts to implement such agreements.
Available Information
Third Point Reinsurance Ltd. is incorporated in Bermuda and its corporate offices are located at The Waterfront, Chesney House, 96 Pitts Bay Road, Pembroke HM 08, Bermuda. Its telephone number is +1 (441) 542-3300. Third Point Re USA’s principal executive offices are located at 51 JFK Parkway, First Floor West, Short Hills, New Jersey 07078. Its telephone number is (908) 608-8970.
Third Point Reinsurance Ltd. files annual, quarterly and current reports and other information with the SEC. You may read and copy any documents that we file at the SEC’s public reference room at 100 F Street, N.E., Washington, D.C. 20549. You may call the SEC at 1-800-SEC-0330 to obtain further information about the public reference room. In addition, the SEC maintains an Internet website (
www.sec.gov
) that contains reports, proxy and information statements and other information regarding registrants that file electronically with the SEC, including us. You may also access, free of charge, our reports filed with the SEC (for example, our Annual Report on Form 10-K, our Quarterly Reports on Form 10-Q and our Current Reports on Form 8-K and any amendments to those forms) through the “Investors” portion of our Internet website (
www.thirdpointre.bm
). Reports filed with or furnished to the SEC will be available as soon as reasonably practicable after they are filed with or furnished to the SEC. Our website is included in this Annual Report as an inactive textual reference only. The information found on our website is not part of this or any other report filed with or furnished to the SEC.
Because Third Point Reinsurance Ltd. has fully and unconditionally guaranteed the debt securities issued by TPRUSA in February 2015, no separate filings are made by TPRUSA with the SEC. See Note 25 to our audited consolidated financial statements included elsewhere in this Annual Report for information regarding TPRUSA.
You should consider and read carefully all of the risks and uncertainties described below, as well as other information included in this Annual Report, including our consolidated financial statements and related notes. The risks described below are not the only ones facing us. The occurrence of any of the following risks or additional risks and uncertainties not presently known to us or that we currently believe to be immaterial could materially and adversely affect our business, financial condition or results of operations. This Annual Report also contains forward-looking statements and estimates that involve risks and uncertainties. Our actual results could differ materially from those
31
anticipated in the forward-looking statements as a result of specific factors, including the risks and uncertainties described below.
Risks Related to Our Business
We are a three year old company with limited historical information available for investors to evaluate our performance or a potential investment in our shares.
We have a limited history of operations. We were incorporated on October 6, 2011 and began underwriting reinsurance transactions on January 1, 2012. TPREUSA and Third Point Re USA were formed in the fourth quarter of 2014 and, as of the date of this Annual Report, Third Point Re USA has not yet begun to write reinsurance contracts. Third Point Re USA was capitalized in February 2015 and is expected to begin underwriting operations in March 2015. As a result, there is limited historical information available to help prospective investors evaluate our performance or an investment in our shares.
In general, reinsurance and insurance companies in their initial stages of development present substantial business and financial risks and may suffer significant losses. They must develop business relationships, establish operating procedures, hire staff, install information technology systems, implement management processes and complete other tasks appropriate for the conduct of their intended business activities. In particular, our ability to implement our reinsurance underwriting strategy will depend on, among other things:
|
•
|
our ability to attract clients;
|
|
•
|
our ability to attract and retain personnel with sufficient underwriting, actuarial, accounting and finance expertise;
|
|
•
|
our ability to maintain at least an A- (Excellent) rating from A.M. Best or a similar financial strength rating from one or more other ratings agencies;
|
|
•
|
our ability to evaluate the risks we assume under reinsurance contracts that we write;
|
|
•
|
our reliance on third parties, including Third Point LLC, to provide certain services; and
|
|
•
|
the risk of Third Point Reinsurance Ltd. being deemed a passive foreign investment company or an investment company if we are deemed to not be in the active conduct of an insurance business or to not be predominantly engaged in an insurance business. See “Risks Relating to Insurance and Other Regulations--We are subject to the risk of becoming an investment company under U.S. federal securities law” and “Risks Relating to Taxation-United States persons who own our shares may be subject to United States federal income taxation on our undistributed earnings and may recognize ordinary income upon disposition of shares.”
|
We cannot assure you that there will be sufficient demand for the reinsurance products we write and plan to write to support our planned level of operations, or that we will accomplish the tasks necessary to implement our business strategy.
Our operational structure is not fully developed.
We are continuing to develop and implement our operational structure and enterprise framework, including exposure management, financial reporting, information technology and internal controls, with which we will conduct our business activities. Our operations are currently supplemented by manual processes, and we expect to migrate over time to a more automated control system. While we use manual processes, our controls may not be adequate to identify or eliminate risks. There can be no assurance that the development of our operational structure or the implementation
32
of our enterprise risk management framework will proceed smoothly or on our projected timetable or achieve the aforementioned goals.
The preparation of our financial statements requires us to make many estimates and judgments, which are even more difficult than those made in a mature company, and that, if inaccurate, could cause additional volatility in our results.
Our consolidated financial statements have been prepared in accordance with U.S. GAAP. Management believes the item that requires the most subjective and complex estimates is the reserve for losses and loss expenses. Due to our relatively short operating history, loss experience is limited and reliable evidence of changes in trends of numbers of claims incurred, average settlement amounts, numbers of claims outstanding and average losses per claim may take years to develop. In addition, the possibility of future litigation or legislative change that may affect interpretation of policy terms further increases the degree of uncertainty in the reserving process. The uncertainties inherent in the reserving process, together with the potential for unforeseen developments, including changes in laws and the prevailing interpretation of policy terms, may result in losses and loss expenses materially different from the reserves initially established. Changes to prior year reserves will affect current underwriting results by increasing net income if the prior year reserves prove to be redundant or by decreasing net income if the prior year reserves prove to be insufficient. We expect volatility in results in periods in which significant loss events occur because U.S. GAAP does not permit insurers or reinsurers to reserve for loss events until they have occurred and are expected to give rise to a claim. As a result, we are not allowed to record contingency reserves to account for expected future losses. We anticipate that claims arising from future events may require the establishment of substantial reserves from time to time.
Our results of operations fluctuate from period to period and may not be indicative of our long-term prospects.
The performance of our reinsurance operations and our investment portfolio fluctuate from period to period. Fluctuations result from a variety of factors, including:
|
•
|
reinsurance contract pricing;
|
|
•
|
our assessment of the quality of available reinsurance opportunities;
|
|
•
|
the volume and mix of reinsurance products we underwrite;
|
|
•
|
loss experience on our reinsurance liabilities;
|
|
•
|
our ability to assess and integrate our risk management strategy properly; and
|
|
•
|
the performance of our investment portfolio.
|
In particular, we seek to underwrite products and make investments to achieve favorable return on equity over the long term. In addition, our opportunistic nature and focus on long-term growth in book value result in fluctuations in total premiums written from period to period as we concentrate on underwriting contracts that we believe will generate better long-term, rather than short-term, results. Accordingly, our short-term results of operations may not be indicative of our long-term prospects.
Established competitors with greater resources may make it difficult for us to effectively market our products or offer our products at a profit.
The reinsurance industry is highly competitive. We compete with major reinsurers, many of which have substantially greater financial, marketing and management resources than we do, as well as other potential providers of capital willing to assume insurance or reinsurance risk. Competition in the types of business that we underwrite is based on many factors, including:
33
|
•
|
price of reinsurance coverage;
|
|
•
|
the general reputation and perceived financial strength of the reinsurer;
|
|
•
|
relationships with reinsurance brokers;
|
|
•
|
terms and conditions of products offered;
|
|
•
|
ratings assigned by independent rating agencies;
|
|
•
|
speed of claims payment and reputation; and
|
|
•
|
the experience and reputation of the members of our underwriting team in the particular lines of reinsurance we seek to underwrite.
|
Our competitors include, among others, ACE Limited, Alleghany Corporation, Arch Capital Group Ltd., AXIS Capital Holdings Ltd., Catlin Group Ltd., Endurance Specialty Holdings Ltd., Everest Re Group, Ltd., Hamilton Insurance Group Ltd., Hannover Rückversicherung AG, Maiden Holdings Ltd., Münchener Rückversicherungs-Gesellschaft AG., PartnerRe Ltd., Swiss Re Limited and Tokio Marine Holdings, Inc. In addition, Greenlight Reinsurance, Ltd. has a business model similar to ours, and we expect to compete with them in many lines of business and geographies. In the future, we may also have to compete for the type of reinsurance we intend to underwrite with new start-up companies that have a business model similar to ours.
We cannot assure you that we will be able to compete successfully in the reinsurance market. Our failure to compete effectively would significantly and negatively affect our financial condition and results of operations and may increase the likelihood that we are deemed to be a passive foreign investment company or an investment company. See “Risks Relating to Insurance and Other Regulations-We are subject to the risk of becoming an investment company under U.S. federal securities law” and “Risks Relating to Taxation-United States persons who own our shares may be subject to United States federal income taxation on our undistributed earnings and may recognize ordinary income upon disposition of shares.”
If actual renewals of our existing contracts do not meet expectations, our premiums written in future years and our future results of operations could be materially adversely affected.
Many of our contracts are generally written for a one-year term. In our financial forecasting process, we make assumptions about the renewal of our prior year’s contracts. The insurance and reinsurance industries have historically been cyclical businesses with periods of intense competition, often based on price. If actual renewals do not meet expectations or if we choose not to write on a renewal basis because of pricing conditions, our premiums written in future years and our future operations would be materially adversely affected.
The inherent uncertainty of models and the use of such models as a tool to evaluate risk may have an adverse effect on our financial results.
We make use of quantitative models to evaluate potential reinsurance transactions, to reserve for transactions once they are bound and to assess our risk related to our reinsurance portfolio. These models have been developed internally and in some cases they make use of third party software. The construction of these models and the selection of assumptions requires significant actuarial judgment. Furthermore, these models typically rely on either cedent or industry data, both of which may be incomplete or may be subject to errors. Given the inherent uncertainty in these models as well as the underlying assumptions and data, the results of our models may not accurately address the emergence of a variety of matters which might impact certain of our coverages. Accordingly, these models may understate the exposures we are assuming and our financial results may be adversely impacted, perhaps significantly. Any such impact could also be felt across our reinsurance contract portfolio, since similar models and judgment are used in analyzing the majority of our transactions.
34
Operational risks, including human or systems failures, are inherent in our business.
Operational risks and losses can result from many sources including fraud, errors by employees, failure to document transactions properly or to obtain proper internal authorization, failure to comply with regulatory requirements or information technology failures.
We believe our modeling, underwriting and information technology and application systems are critical to our business and reputation. Moreover, our technology and applications are an important part of our underwriting process and our ability to compete successfully. We have licensed certain systems and data from third parties. We cannot be certain that we will have access to these, or comparable systems, or that our technology or applications will continue to operate as intended. In addition, we cannot be certain that we would be able to replace these systems without slowing our underwriting response time. A major defect or failure in our internal controls or information technology and application systems could result in management distraction, harm to our reputation, a loss or delay of revenues or increased expense.
Technology breaches or failures, including those resulting from a malicious cyber-attack on us or our business partners and service providers, could disrupt or otherwise negatively impact our business.
We rely on information technology systems to process, transmit, store and protect the electronic information, financial data and proprietary models that are critical to our business. Furthermore, a significant portion of the communications between our employees and our business, banking and investment partners depends on information technology and electronic information exchange. Like all companies, our information technology systems are vulnerable to data breaches, interruptions or failures due to events that may be beyond our control, including, but not limited to, natural disasters, theft, terrorist attacks, computer viruses, hackers and general technology failures.
We believe that we have established and implemented appropriate security measures, controls and procedures to safeguard our information technology systems and to prevent unauthorized access to such systems and any data processed or stored in such systems, and we periodically evaluate and test the adequacy of such systems, controls and procedures. In addition, we have established a business continuity plan which is designed to ensure that we are able to maintain all aspects of our key business processes functioning in the midst of certain disruptive events, including any disruptions to or breaches of our information technology systems. Our business continuity plan is routinely tested and evaluated for adequacy. Despite these safeguards, disruptions to and breaches of our information technology systems are possible and may negatively impact our business.
It is possible that insurance policies we have in place with third parties would not entirely protect us in the event that we experienced a breach, interruption or widespread failure of our information technology systems. Furthermore, we have not secured insurance coverage designed to specifically protect us from an economic loss resulting from such events.
Although we have never experienced any known or threatened cases involving unauthorized access to our information technology systems or unauthorized appropriation of the data contained within such systems, we have no assurance that such technology breaches will not occur in the future.
We may not be able to manage our growth effectively.
We intend to continue to grow our business in the future. In February 2015, we began reinsurance operations in the United States through Third Point Re USA. This expansion, and future expansions and new physical presence, could require additional capital, systems development and skilled personnel. We cannot assure you that we will be able to meet our capital needs, expand our systems effectively, allocate our human resources optimally, identify and hire qualified employees or incorporate effectively the components of any businesses we may acquire in our effort to achieve growth. Additionally, as we grow, the ability of our management to source sufficient reasonably priced reinsurance business in the segments we target may be limited. The failure to manage our growth effectively could have a material adverse effect on our business, financial condition, and results of operations.
35
Our losses may exceed our loss reserves, which could significantly and negatively affect our business.
Our results of operations and financial condition depends upon our ability to assess accurately the potential losses associated with the risks we reinsure. Reserves are estimates of claims an insurer ultimately expects to pay, based upon facts and circumstances known at the time, predictions of future events, estimates of future trends in claim severity and other variable factors. The inherent uncertainties of estimating loss reserves generally are greater for reinsurance companies as compared to primary insurers, primarily due to:
|
•
|
the lapse of time from the occurrence of an event to the reporting of the claim and the ultimate resolution or settlement of the claim;
|
|
•
|
the diversity of development patterns among different types of reinsurance treaties; and
|
|
•
|
heavier reliance on the client for information regarding claims.
|
Actual losses and loss adjustment expenses paid may deviate substantially from the estimates of our loss reserves, to our detriment. If we determine our loss reserves to be inadequate, we will increase our loss reserves with a corresponding reduction in our net income in the period in which we identify the deficiency. Such a reduction would negatively affect our results of operations. If our losses exceed our loss reserves, our financial condition may be significantly and negatively affected.
As a recently formed reinsurance company, we do not have the benefit of extended loss experience with our cedents. With additional time, we may determine that our cedents’ loss emergence, incurred and payment patterns are different from those implied in the original submission data. Consequently, we may experience greater than average deviation in our loss reserve estimates when compared to our more established competitors.
The failure of any of the loss limitation methods we employ could have a material adverse effect on our financial condition and results of operations.
Although we seek to mitigate our loss exposure through a variety of methods, property and casualty reinsurance risk is inherently unpredictable. It is difficult to predict the timing, frequency and severity of loss events with statistical certainty or estimate the amount of loss any given occurrence will generate. It is not possible to completely eliminate our exposure to unforecasted or unpredictable events and, to the extent that losses from such risks occur, our financial condition and results of operations could be materially adversely affected.
We seek to manage reinsurance volatility by focusing on lines of business that have historically demonstrated more stable return characteristics, such as property quota share, auto, and workers’ compensation. These lines of business are often characterized as having exposure to higher frequency and lower severity claims activity, although this has not always been the case. We seek to further manage the volatility of our reinsurance results by writing policies on a quota share basis and through the use of contractual terms and conditions, such as loss ratio caps, within our reinsurance contracts. However, there can be no assurance that these terms and conditions will be effective in mitigating our exposure. The failure or ineffectiveness of any of our terms and conditions could have a material adverse effect on our financial condition and results of operations.
In addition, in contrast to many reinsurers with whom we compete, we have elected to limit our underwriting of property catastrophe exposures. Through December 2014, we wrote excess of loss catastrophe reinsurance through the Catastrophe Fund, which is a separately capitalized reinsurance fund vehicle. In December 2014, we announced that we would no longer accept investments in the Catastrophe Fund, that no new business would be written in the Catastrophe Reinsurer and that we would be redeeming all existing investments in the Catastrophe Fund. The Catastrophe Fund Manager will continue to manage the runoff of the remaining exposure in the Catastrophe Fund.
We also write reinsurance contracts that seek to provide protection against adverse development on loss reserves. We seek to provide this type of coverage only on relatively stable reserves where we agree with the client’s reserving practices and actuarially determined reserve levels.
36
The property and casualty reinsurance industry is highly cyclical, and we expect to continue to experience periods characterized by excess underwriting capacity and unfavorable premium rates.
Historically, reinsurers have experienced significant fluctuations in operating results due to competition, frequency of occurrence or severity of catastrophic events, levels of capacity, general economic conditions, changes in equity, debt and other investment markets, changes in legislation, case law and prevailing concepts of liability and other factors. In particular, demand for reinsurance is influenced significantly by the underwriting results of primary insurers and prevailing general economic conditions. The supply of reinsurance is related to prevailing prices and levels of surplus capacity that, in turn, may fluctuate in response to changes in rates of return being realized in the reinsurance industry on both underwriting and investment sides.
As a result, the reinsurance business historically has been a cyclical industry characterized by periods of intense price competition due to high levels of available underwriting capacity as well as periods when shortages of capacity have permitted favorable premium levels and changes in terms and conditions. The supply of available reinsurance capital has increased over the past several years and may increase further, either as a result of capital provided by new entrants or by the commitment of additional capital by existing insurers or reinsurers.
Continued increases in the supply of reinsurance may have consequences for us and for the reinsurance insurance generally, including fewer contracts written, lower premium rates, increased expenses for customer acquisition and retention, and less favorable policy terms and conditions. As a result, we may be unable to fully execute our reinsurance strategy of selling lower-volatility business. The effects of cyclicality could significantly and negatively affect our financial condition and results of operations and could limit their comparability from period to period and year over year.
The effect of emerging claim and coverage issues on our business is uncertain.
As industry practices and legal, judicial and regulatory conditions change, unexpected issues related to claims and coverage may emerge. Various provisions of our contracts, such as limitations or exclusions from coverage or choice of forum, may be difficult to enforce in the manner we intend, due to, among other things, disputes relating to coverage and choice of legal forum. These issues may adversely affect our business by either extending coverage beyond the period that we intended or by increasing the number or size of claims. In some instances, these changes may not manifest themselves until many years after we have issued insurance or reinsurance contracts that are affected by these changes. As a result, we may not be able to ascertain the full extent of our liabilities under our insurance or reinsurance contracts for many years following the issuance of our contracts. The effects of unforeseen development or substantial government intervention could adversely impact our ability to adhere to our goals.
A downgrade or withdrawal of our A.M. Best rating would significantly and negatively affect our ability to implement our business strategy successfully.
Companies, insurers and reinsurance brokers use ratings from independent ratings agencies as an important means of assessing the financial strength and quality of reinsurers. A.M. Best has assigned each of our reinsurance company subsidiaries a financial strength rating of A- (Excellent), which is the fourth highest of 15 ratings that A.M. Best issues. This rating reflects the rating agency’s opinion of the applicable insurer’s financial strength, operating performance and ability to meet obligations. It is not an evaluation directed toward the protection of investors or a recommendation to buy, sell or hold our shares. A.M. Best periodically reviews our rating, and may revise it downward or revoke it at its sole discretion based primarily on its analysis of our balance sheet strength, operating performance and business profile. Factors which may affect such an analysis include:
|
•
|
if we change our business practices from our organizational business plan in a manner that no longer supports A.M. Best’s initial rating;
|
|
•
|
if unfavorable financial or market trends impact us;
|
•
if losses exceed loss reserves;
37
|
•
|
if we are unable to retain our senior management and other key personnel;
|
|
•
|
if our investment portfolio incurs significant losses; or
|
|
•
|
if A.M. Best alters its capital adequacy assessment methodology in a manner that would adversely affect the rating of Third Point Re or Third Point Re USA.
|
If A.M. Best downgrades the rating of either of Third Point Re or Third Point Re USA below A- (Excellent), places either reinsurer on credit watch or withdraws its rating, we could be severely limited or prevented from writing any new reinsurance contracts from the affected reinsurer which would significantly and negatively affect our ability to implement our business strategy. A downgrade may also require us to establish trusts or post letters of credit for ceding company clients. In addition, almost all of our reinsurance contracts provide the client with the right to terminate the agreement or require us to transfer premiums on a funds withheld basis if our A- (Excellent) A.M. Best rating is downgraded. The contracts containing such a termination right represented approximately 76.4% of gross premiums written during 2014, 86.0% of gross premiums written during 2013 and 95.8% of gross premiums written during 2012.
In February 2015, Third Point Re (USA) Holdings Inc., our wholly owned subsidiary, completed a public offering of $115.0 million in aggregate principal amount of 7.00% senior notes due 2025 (the “Senior Notes”) for which, A.M. Best has assigned a debt rating of bbb-. The Senior Notes are fully and unconditionally guaranteed (the “Guarantee”) by Third Point Reinsurance Ltd. In certain circumstances, a downgrade of the rating assigned to the Senior Notes would result in an increase in the annual interest rate payable on the Senior Notes or, if a change of control of TPRE has also occurred, an obligation for us to make an offer to repurchase the Senior Notes at a premium. Either of these outcomes would require use of cash that we might otherwise use in operating our business; further, we may not have sufficient funds to satisfy these obligations, which could result in an event of default under the indenture governing the Senior Notes. See “-Inability to service our indebtedness could adversely affect our liquidity and financial condition and could potentially result in a downgrade or withdrawal of our credit ratings, any of which would adversely affect our ability to implement our business strategy.”
A significant decrease in our capital or surplus could enable certain clients to terminate reinsurance agreements or to require additional collateral.
Certain of our reinsurance contracts contain provisions that permit our clients to cancel the contract or require additional collateral in the event of a downgrade in our ratings below specified levels or a reduction of our capital or surplus below specified levels over the course of the agreement. Whether a client would exercise such cancellation rights would likely depend, among other things, on the reason the provision is triggered, the prevailing market conditions, the degree of unexpired coverage and the pricing and availability of replacement reinsurance coverage.
If any such provisions were to become exercisable, we cannot predict whether or how many of our clients would actually exercise such rights or the extent to which they would have a significant and negative effect on our financial condition, results of operations or future prospects but they could have a significant adverse effect on our operations.
We are dependent on key executives, the loss of whom could adversely affect our business.
Our future success depends to a significant extent on the efforts of our senior management, in particular Mr. Berger, and other key personnel, such as our President and Chief Operating Officer, Chief Financial Officer, our Chief Reserving Actuary, our Chief Risk Officer and our senior underwriting executives, to implement our business strategy. We believe there are only a limited number of available and qualified executives with substantial experience in our industry. Accordingly, the loss of the services of one or more of the members of our senior management, in particular Mr. Berger, or other key personnel could delay or prevent us from fully implementing our business strategy and, consequently, significantly and negatively affect our business.
38
We do not currently maintain key man life insurance with respect to any of our senior management. If any member of senior management dies or becomes incapacitated, or leaves the company to pursue employment opportunities elsewhere, we would be solely responsible for locating an adequate replacement for such senior management and for bearing any related cost. To the extent that we are unable to locate an adequate replacement or are unable to do so within a reasonable period of time, our business may be significantly and negatively affected.
In addition, our business operations require the services of a number of specialized employees to carry out day-to-day business operations. There can be no assurance that we can attract and retain the necessary employees to conduct our business activities on a timely basis or at all.
Our inability to provide collateral to certain counterparties on commercially acceptable terms as we grow could significantly and negatively affect our ability to implement our business strategy.
Neither Third Point Re nor Third Point Re USA is licensed or admitted as a reinsurer in any jurisdiction other than Bermuda. Certain jurisdictions, including in the United States, do not permit insurance companies to take statutory credit for reinsurance obtained from unlicensed or non-admitted insurers unless appropriate security measures are implemented. Consequently, certain clients require us to obtain a letter of credit or provide other collateral through funds withheld or trust arrangements. In connection with obtaining letter of credit facilities, we are typically required to provide customary collateral to the letter of credit provider in order to secure our obligations under the facility. Our ability to provide collateral, and the costs at which we provide collateral, is primarily dependent on the composition of our investment portfolio.
Typically, both letters of credit and collateral trust agreements are collateralized with cash or fixed-income securities. Banks may be willing to accept our investment portfolio as collateral, but on terms that may be less favorable to us than reinsurance companies that invest solely or predominantly in fixed-income securities. The inability to renew, maintain or obtain letters of credit or to source acceptable collateral for letters of credit or collateral trust agreements may significantly limit the amount of reinsurance we can write or require us to modify our investment strategy.
We may need additional collateral capacity as we grow, and if we are unable to renew, maintain or increase our collateral capacity or are unable to do so on commercially acceptable terms, such a development could significantly and negatively affect our ability to implement our business strategy.
Our ability to pay dividends may be constrained by our holding company structure and certain regulatory and other factors.
Third Point Reinsurance Ltd. is a holding company that conducts no reinsurance operations of its own. The majority of our reinsurance operations are currently conducted through our wholly-owned operating subsidiary, Third Point Re, and Third Point Re may also receive income relating to its investment in the Catastrophe Fund. In December 2014, we announced that we would no longer accept investments in the Catastrophe Fund, that no new business would be written in the Catastrophe Reinsurer and that we would be redeeming all existing investments in the Catastrophe Fund. In the future, we expect that a significant portion of our operations will be conducted through Third Point Re USA, our indirect wholly owned subsidiary that focuses on U.S. reinsurance business. Our cash flows currently consist primarily of dividends and other permissible payments from Third Point Re. In the future, we expect that a portion of our cash flows will consist of dividends and other permissible payments from Third Point Re USA. Third Point Reinsurance Ltd. depends on such payments to receive funds to meet its obligations, including the payment of any dividends and other distributions to our shareholders and any payment obligations in respect of its guarantee of the senior notes issued by TPRUSA in February 2015. See “Inability to service our indebtedness could adversely affect our liquidity and financial condition and could potentially result in a downgrade or withdrawal of our credit ratings, any of which would adversely affect our ability to implement our business strategy.”
Third Point Reinsurance Ltd. is indirectly subject to Bermuda regulatory constraints placed on Third Point Re, Third Point Re USA, and the Catastrophe Reinsurer, which is the licensed special purpose insurer that historically wrote reinsurance contracts for the Catastrophe Fund. This affects our ability to pay dividends on the shares and make
39
other payments. Under the Insurance Act, Third Point Re and Third Point Re USA, as Class 4 insurers, are prohibited from declaring or paying a dividend if it is in breach of its minimum solvency margin (“MSM”), enhanced capital ratio (“ECR”) or minimum liquidity ratio or if the declaration or payment of such dividend would cause such a breach. Where either Third Point Re or Third Point USA, as Class 4 insurers, fails to meet its MSM or minimum liquidity ratio on the last day of any financial year, they are prohibited from declaring or paying any dividends during the next financial year without the approval of the BMA.
In addition, Third Point Re and Third Point Re USA, as Class 4 insurers, are prohibited from declaring or paying in any financial year dividends of more than 25% of their respective total statutory capital and surplus (as shown on its previous financial year’s statutory balance sheet) unless they file (at least seven days before payment of such dividends) with the BMA an affidavit signed by at least two directors (one of whom must be a Bermuda resident director if any of the insurer’s directors are resident in Bermuda) and the principal representative stating that they will continue to meet their solvency margin and minimum liquidity ratios. Where such an affidavit is filed, it shall be available for public inspection at the offices of the BMA.
The Catastrophe Reinsurer, as a special purpose insurer, is prohibited from declaring or paying any dividends during any financial year if it is in breach of its minimum solvency margin or if the declaration or payment of such dividends would cause it to fail to meet such minimum margin. If the Catastrophe Reinsurer, as a special purpose insurer, were to fail to meet its minimum solvency margin on the last day of any financial year, it would be prohibited from declaring or paying any dividends during the next financial year without the approval of the BMA.
In addition, under the Bermuda Companies Act 1981, as amended (the “Companies Act”), Bermuda companies such as Third Point Reinsurance Ltd., Third Point Re, Third Point Re USA and the Catastrophe Reinsurer may not declare or pay a dividend if there are reasonable grounds for believing that the relevant Bermuda company is, or would after the payment be, unable to pay its liabilities as they become due or that the realizable value of its assets would thereby be less than its liabilities.
Inability to service our indebtedness could adversely affect our liquidity and financial condition and could potentially result in a downgrade or withdrawal of our credit ratings, any of which would adversely affect our ability to implement our business strategy.
In February 2015, Third Point Re (USA) Holdings Inc., our wholly owned subsidiary, completed a public offering of $115.0 million in aggregate principal amount of Senior Notes. The Senior Notes are fully and unconditionally guaranteed (the “Guarantee”) by Third Point Reinsurance Ltd.
The Senior Notes are an obligation of TPRUSA, and the Guarantee is an obligation of TPRE. Each of TPRUSA and TPRE is a holding company and, accordingly, conduct substantially all operations through their respective operating subsidiaries. As a result, TPRUSA’s cash flow and its ability to service its debt, as well as TPRE’s ability to satisfy its obligations pursuant to the Guarantee, depend upon the earnings of their respective operating subsidiaries and on the distribution of earnings, loans or other payments from such subsidiaries to TPRUSA or TPRE, as applicable. See “Risk Factors-Our ability to pay dividends may be constrained by our holding company structure and certain regulatory and other factors.”
The operating subsidiaries of TPRUSA and TPRE are separate and distinct legal entities and have no obligation to pay any amounts due on the Senior Notes or the Guarantee or to provide TPRUSA or TPRE with funds for their respective payment obligations, whether by dividends, distributions, loans or other payments. There can be no assurance that our operating subsidiaries will generate sufficient cash flow from operations, or that future financing sources will be available to us in amounts sufficient to satisfy our obligations under our indebtedness, to refinance our indebtedness on acceptable terms or at all, or to fund our other business needs. In addition to being limited by the financial condition and operating requirements of such subsidiaries, any payment of dividends, distributions, loans or advances by TPRUSA’s or TPRE’s subsidiaries to TPRUSA or TPRE could be subject to statutory or contractual restrictions. Moreover, since certain of TPRUSA’s and TPRE’s respective subsidiaries are insurance companies, their ability to pay dividends to TPRUSA or TPRE, as applicable, is subject to regulatory limitations. See “Business-Regulation.”
40
To the extent that either TPRUSA or TPRE needs funds but its subsidiaries are restricted from making such distributions under applicable law or regulation, or are otherwise unable to distribute funds, the liquidity and financial condition of TPRUSA or TPRE, as applicable, would be adversely affected and we would potentially be unable to satisfy our obligations under the Senior Notes, the Guarantee or any other indebtedness. If we cannot service our indebtedness, the implementation of our business strategy would be impeded, and we could be prevented from entering into transactions that would otherwise benefit our business.
The rights of TPRUSA and TPRE to receive any assets of any of their respective subsidiaries upon liquidation or reorganization of such subsidiaries, and therefore the rights of the holders of the Senior Notes, to participate in those assets, will be structurally subordinated to the claims of such subsidiary’s creditors. In addition, even if TPRUSA or TPRE were a creditor of any of their respective subsidiaries, the rights of TPRUSA or TPRE, as applicable, as a creditor would be subordinate to any security interest in the assets of such subsidiaries and any indebtedness of such subsidiaries senior to that held by it. The Senior Notes and the Guarantee would also be structurally subordinated to the rights of the holders of any preferred stock or shares issued by the subsidiaries of either TPRUSA or TPRE, as applicable, whether currently outstanding or issued hereafter. Moreover, the rights of shareholders of TPRE to receive any assets of TPRE upon liquidation or reorganization of TPRE would be subordinate to all of the foregoing claims.
Our indebtedness may limit cash flow available to invest in the ongoing needs of our business, and may otherwise place us at a competitive disadvantage compared to our competitors.
We could in the future incur additional indebtedness in addition to the Senior Notes. The indenture governing the Senior Notes does not limit the amount of additional indebtedness we may incur. Our debt combined with our other financial obligations and contractual commitments could have significant adverse consequences, including:
|
•
|
requiring us to dedicate a substantial portion of cash flow from operations to the payment of interest on, and principal of, our debt, which will reduce the amounts available to fund working capital, the expansion of our business and other general corporate purposes;
|
|
•
|
increasing our vulnerability to adverse changes in general economic, industry and market conditions, and exposing us to the risk of increased interest rates;
|
|
•
|
obligating us to additional restrictive covenants that may reduce our ability to take certain corporate actions or obtain further debt or equity financing;
|
|
•
|
making it more difficult for us to make payments on our existing or future obligations;
|
|
•
|
limiting our flexibility in planning for, or reacting to, changes in our business and the industry in which we compete; and
|
|
•
|
placing us at a competitive disadvantage compared to our competitors that have less debt or better debt servicing options.
|
In addition, a failure to comply with the covenants under our debt instruments could result in an event of default under those instruments. In the event of an acceleration of amounts due under our debt instruments as a result of an event of default, we may not have sufficient funds and may be unable to arrange for additional financing to repay our indebtedness, and the lenders could seek to enforce security interests in the collateral securing such indebtedness.
We may not have the ability to raise the funds necessary to pay the principal of or interest on the Senior Notes.
At maturity, the entire principal amount of the Senior Notes then outstanding, plus any accrued and unpaid interest, will become due and payable. TPRUSA must pay interest in cash on the Senior Notes on and of each year, beginning August 13, 2015. The amount of interest payable on the Senior Notes is subject to increase from time to time in the event of a downgrade of the rating assigned to the Senior Notes or in connection with certain other events. In addition, upon the occurrence of a change of control triggering event described in the indenture governing the Senior Notes, unless we have exercised our right to redeem the Senior Notes in accordance with their terms, each holder of Senior Notes will have the right to require us to repurchase all or any part of such holder’s Senior Notes for a payment in cash described in the indenture governing the Senior Notes.
41
We may not have enough available cash or be able to obtain sufficient financing at the time we are required to make these payments. Furthermore, our ability to make these payments may be limited by law, by regulatory authority or by agreements governing future indebtedness. Our failure to pay interest when due, if uncured for 30 days, or our failure to pay the principal amount when due, will constitute an event of default under the indenture governing the Senior Notes. A default under the indenture could also lead to a default under agreements governing future indebtedness. If the repayment of that indebtedness is accelerated as a result, then we may not have sufficient funds to repay that indebtedness or to pay the principal of or interest on the Senior Notes.
We may need additional capital in the future in order to operate our business, and such capital may not be available to us or may not be available to us on acceptable terms. Furthermore, additional capital raising could dilute your ownership interest in our company and may cause the value of the shares to decline.
We may need to raise additional capital in the future through offerings of debt or equity securities or otherwise to:
|
•
|
fund liquidity needs caused by underwriting or investment losses;
|
|
•
|
replace capital lost in the event of significant reinsurance losses or adverse reserve developments;
|
|
•
|
satisfy letters of credit or guarantee bond requirements that may be imposed by our clients or by regulators;
|
|
•
|
meet rating agency or regulatory capital requirements; or
|
|
•
|
respond to competitive pressures.
|
In February 2015, we completed a public offering of $115.0 million in aggregate principal amount of Senior Notes issued by TPRUSA and guaranteed by Third Point Reinsurance Ltd. pursuant to a registration statement on Form S-3. These Senior Notes are structurally senior to claims that any holders of our common shares may have on the assets of Third Point Reinsurance Ltd.
Additional capital may not be available on terms favorable to us, or at all. Further, any additional capital raised through the sale of equity could dilute your ownership interest in our company and may cause the value of our shares to decline. Additional capital raised through the issuance of debt may result in creditors having rights, preferences and privileges senior or otherwise superior to those of the holders of our shares.
Changing climate conditions may adversely affect our financial condition, profitability or cash flows.
Climate change, to the extent it produces extreme changes in temperatures and changes in weather patterns, could affect the frequency or severity of weather events. Further, it could reduce the affordability and availability of homeowners insurance, which could have an effect on pricing. Changes in weather patterns could also affect the frequency and severity of other natural catastrophe events to which we may be exposed. For example, due to the severe drought that impacted most of the U.S. farm belt in 2012, we suffered a $10.0 million underwriting loss on $42.5 million of earned crop premium.
Our reinsurance operations may make us vulnerable to losses from catastrophes and may cause our results of operations to vary significantly from period to period.
While neither Third Point Re nor Third Point Re USA, our Class 4 reinsurers, currently directly underwrites catastrophe exposed reinsurance business on an excess of loss basis, in 2012 we launched an open-ended catastrophe reinsurance fund with an exposure to a diversified portfolio of peak zone natural catastrophe risk. Involvement in catastrophe exposed excess of loss reinsurance through our investment in the Catastrophe Fund exposes us to claims arising out of unpredictable catastrophic events, such as hurricanes, hailstorms, tornadoes, windstorms, severe winter weather, earthquakes, floods, droughts, fires, explosions, volcanic eruptions, acts of war or terrorism or political unrest
42
and other natural or man-made disasters. The incidence and severity of catastrophes are inherently unpredictable but the loss experience of property catastrophe reinsurers has been generally characterized as low frequency and high severity. Claims from catastrophic events could reduce our earnings and cause heightened volatility in our results of operations for any fiscal quarter or year.
In December 2014, we announced that we would no longer accept investments in the Catastrophe Fund, that no new business would be written in the Catastrophe Reinsurer and that we would be redeeming all existing investments in the Catastrophe Fund. As of December 31, 2014, our financial exposure to the higher volatility and liquidity risks associated with property catastrophe losses was generally limited to our investment in the Catastrophe Fund, which as of December 31, 2014 was $59.5 million. As there are no additional guarantees or recourse to us beyond these investments, we anticipate that our property catastrophe exposures will consistently remain relatively low when compared to our competitors. However, there can be no assurance that this business will not experience losses associated with contracts currently bound.
On December 18, 2014, we entered into a subscription agreement with the Kiskadee Fund to invest up to
$25.0 million
in Hiscox’s separately managed insurance-linked securities platform, Kiskadee Re Ltd. The Kiskadee Fund is a fund vehicle managed by Hiscox. The Kiskadee Fund invests in property catastrophe exposures through collateralized reinsurance transactions and other insurance-linked investments.
In addition, we are exposed to the impact of catastrophic events, in some cases, through the multi-line reinsurance contracts written by Third Point Re, as significant disasters or weather events can result in increased claims under certain lines of business. If a natural or man-made disaster, including industrial accidents, acts of wars or terrorism or political unrest or systemic cyber-security events, were to significantly increase the amount of claims payable under the types of property and casualty reinsurance written by Third Point Re, our consolidated results of operation could be materially and adversely affected.
We depend on our clients’ evaluations of the risks associated with their insurance underwriting, which may subject us to reinsurance losses.
In most of our quota share reinsurance business we do not separately evaluate each of the original individual risks assumed under these reinsurance contracts. We instead evaluate the underwriting processes and environment at the ceding companies we work with to assess the risks associated with their portfolios.Therefore, we are dependent on the original underwriting decisions made by ceding companies. We are subject to the risk that the clients may not have adequately evaluated the insured risks and that the premiums ceded may not adequately compensate us for the risks we assume. We also do not separately evaluate each of the individual claims made on the underlying insurance contracts. Therefore, we are dependent on the original claims decisions made by our clients. We are subject to the risk that the client may pay invalid claims, which could result in reinsurance losses for us.
The involvement of reinsurance brokers subjects us to their credit risk.
In accordance with industry practice, we frequently pay amounts owed on claims under our policies to reinsurance brokers, and these brokers, in turn, remit these amounts to the ceding companies that have reinsured a portion of their liabilities with us. In some jurisdictions, if a broker fails to make such a payment, we might remain liable to the client for the deficiency notwithstanding the broker’s obligation to make such payment. Conversely, in certain jurisdictions, when the client pays premiums for policies to reinsurance brokers for payment to us, these premiums are considered to have been paid and the client will no longer be liable to us for these premiums, whether or not we have actually received them. Consequently, we assume a degree of credit risk associated with reinsurance brokers around the world.
43
The inability to obtain business provided from brokers could adversely affect our business strategy and results of operations.
We market our reinsurance worldwide primarily through reinsurance brokers. Business placed by our top three reinsurance brokers, Guy Carpenter & Company, LLC, Aon Benfield, and JLT Re, accounted for approximately 21.9%, 17.8% and 16.6% of our gross premiums written since inception. Affiliates of several brokers have also co-sponsored the formation of Bermuda reinsurance companies that may compete with us, and these brokers may favor their own reinsurers over other companies. Loss of all or a substantial portion of the business provided by one or more of these brokers could have a material adverse effect on our business.
We may be unable to purchase reinsurance for the liabilities we reinsure, and if we successfully purchase such reinsurance, we may be unable to collect, which could adversely affect our business, financial condition and results of operations.
While we did not purchase retrocessional coverage in 2012, we began to do so in 2013 and 2014 and may continue to do so in the future, in order to mitigate the effect of a potential concentration of losses upon our financial condition. The insolvency or inability or refusal of a reinsurer to make payments under the terms of its agreement with us could have an adverse effect on us because we remain liable to our client. From time to time, market conditions have limited, and in some cases have prevented, reinsurers from obtaining the types and amounts of retrocession that they consider adequate for their business needs. Accordingly, we may not be able to obtain our desired amounts of retrocessional coverage or negotiate terms that we deem appropriate or acceptable or obtain retrocession from entities with satisfactory creditworthiness. Our failure to establish adequate retrocessional arrangements or the failure of our retrocessional arrangements to protect us from overly concentrated risk exposure could significantly and negatively affect our business, financial condition and results of operations.
Currency fluctuations could result in exchange rate losses and negatively impact our business.
Our functional currency is the U.S. dollar. Starting in 2014, we wrote a portion of our business and received premiums in currencies other than the U.S. dollar. In addition, our investment manager, Third Point LLC, invests a portion of our portfolio in assets denominated in currencies other than the U.S. dollar. Consequently, we may experience exchange rate losses to the extent our foreign currency exposure is not hedged or is not sufficiently hedged, which could significantly and negatively affect our business. If we do seek to hedge our foreign currency exposure through the use of forward foreign currency exchange contracts or currency swaps, we may be subject to the risk that our counterparties to the arrangements fail to perform.
Our ability to implement our business strategy could be delayed or adversely affected by Bermuda employment restrictions relating to the ability to obtain and retain work permits for key employees in Bermuda.
Under Bermuda law, non-Bermudians (other than spouses of Bermudians and permanent resident’s certificate holders) may not engage in any gainful occupation in Bermuda without an appropriate governmental work permit. A work permit may be granted or renewed upon showing that, after proper public advertisement, no Bermudian (or spouse of a Bermudian or a holder of a permanent resident’s certificate or holder of a working resident’s certificate) is available who meets the minimum standards reasonably required by the employer. A work permit is issued with an expiry date (up to ten years) and no assurances can be given that any work permit will be issued or, if issued, renewed upon the expiration of the relevant term. Our success depends in part on the continued services of key employees in Bermuda, and our Chief Executive Officer, our President and Chief Operating Officer, Chief Reserving Actuary and some of our senior underwriting executives are not Bermudians, spouses of Bermudians or permanent resident certificate holders. If work permits are not obtained, or are not renewed, for our principal employees, we would lose their services, which could materially affect our businesses.
We face risks arising from future strategic transactions such as acquisitions, dispositions, mergers or joint ventures.
44
We may pursue strategic transactions in the future, which could involve acquisitions or dispositions of businesses or assets. Any future strategic transactions could have an adverse impact on our reputation, business, results of operation or financial condition. We face a number of risks arising from these types of transaction, including financial, accounting, tax and regulatory challenges; difficulties with integration, business retention, execution of strategy, unforeseen liabilities or market conditions; and other managerial or operating risks and challenges. Any future transactions could also subject us to risks such as failure to obtain appropriate value, post-closing claims being levied against us and disruption to our other businesses during the negotiation or execution process or thereafter. Accordingly, these risks and difficulties may prevent us from realizing the expected benefits from the strategic transactions we enter into. For example, the businesses that we acquire or our strategic alliances or joint ventures may underperform relative to the price paid or resources committed by us; we may not achieve anticipated cost savings; or we may otherwise be adversely affected by transaction-related charges.
Through our strategic transactions, we may also assume unknown or undisclosed business, operational, tax, regulatory and other liabilities, fail to properly assess known contingent liabilities, or assume businesses with internal control deficiencies. Risk-mitigating provisions that we put in place in the course of negotiating and executing these transactions, such as due diligence efforts and indemnification provisions, may not be sufficient to fully address these liabilities and contingencies.
Risks Relating to Our Investment Strategy and Investment Manager
We have limited control over how our investment portfolio is allocated, and its performance depends on the ability of our investment manager, Third Point LLC, to select and manage appropriate investments.
We have engaged Third Point LLC to act as our exclusive investment manager for substantially all of our investment portfolio and to recommend appropriate investment opportunities. Although Third Point LLC is contractually obligated to follow our investment guidelines, we cannot assure shareholders as to exactly how assets will be allocated to different investment opportunities, including long and short positions and derivatives trading, which could increase the level of risk in our investment.
The performance of our investment portfolio depends to a great extent on the ability of Third Point LLC, as our investment manager to select and manage appropriate investments. We have entered into two investment management agreements with Third Point LLC which terminate on December 22, 2016 and are subject to automatic renewal for additional successive three-year terms unless a party notifies the other parties at least six months prior to the end of a term that it wishes to terminate the investment management agreement at the end of such term. We have limited ability to terminate the investment management agreements earlier. We cannot assure you that Third Point LLC will be successful in meeting our investment objectives. The failure of Third Point LLC to perform adequately could significantly and negatively affect our business, results of operations and financial condition.
The historical performance of Third Point LLC should not be considered as indicative of the future results of our investment portfolio or of our future results or of any returns expected on our common shares.
The historical returns of the funds managed by Third Point LLC are not directly linked to returns on our common shares. Although as our investment manager, Third Point LLC has agreed to invest our portfolio on substantially the same basis as Third Point LLC’s hedge funds, results for our investment portfolio could differ from results of the funds managed by Third Point LLC as a result of restrictions imposed by our investment guidelines. In addition, even if our investment portfolio generates investment income in a given period, our overall performance could be adversely affected by losses generated by our reinsurance operations. Poor performance of our investment portfolio will cause a decline in our revenue from that portfolio and will therefore have a negative effect on our financial performance.
Moreover, with respect to the historical performance of funds or accounts managed by Third Point LLC, including our investment portfolio:
45
|
•
|
the historical performance of funds managed by Third Point LLC should not be considered indicative of the future results that should be expected from our investment portfolio; and
|
|
•
|
the returns of funds managed by Third Point LLC have benefited historically from investment opportunities and general market conditions that currently may not exist and may not repeat themselves, and there can be no assurance that Third Point LLC will be able to avail itself of profitable investment opportunities in the future.
|
The risks associated with Third Point LLC’s strategy in managing our investment portfolio may be substantially greater than the investment risks faced by other reinsurers with whom we compete.
We may derive a significant portion of our income from our investment portfolio. As a result, our operating results depend in part on the performance of our investment portfolio. We cannot assure you that Third Point LLC, as our investment manager, will successfully structure our investments in relation to our anticipated liabilities. Failure to do so could force us to liquidate investments at a significant loss or at prices that are not optimal, which could significantly and adversely affect our financial results.
The risks associated with Third Point LLC’s investment strategy may be substantially greater than the risks associated with traditional fixed-income investment strategies employed by many reinsurers with whom we compete. Third Point LLC makes investments globally, in both developed and emerging markets, in all sectors, and in equity, credit, commodity, currency, option and other instruments with a focus on event-driven situations, in which Third Point LLC believes that a catalyst, either intrinsic or extrinsic, will unlock value or alter the lens through which the greater market values a particular investment. Making long equity investments in an up or rising market may increase the risk of not generating profits on these investments and we may incur losses if the market declines. Similarly, making short equity investments in a down or falling market may increase the risk of not generating profits on these investments and we may incur losses if the market rises. The market price of our common shares may be volatile and the risk of loss may be greater when compared with other reinsurance companies.
Although we conduct our business through our Class 4 Bermuda licensed insurance subsidiaries as operating reinsurance businesses actively engaged in writing property and casualty coverage, because our investment portfolio as managed by Third Point LLC may include a very small number of futures, options on futures, swaps and other commodity interests from time to time, we are exposed to the risk that the U.S. Commodity Futures Trading Commission (the “CFTC”) could assert that our business has been operated for the purpose of trading commodity interests and that we are, therefore, a commodity pool. If this were to occur, our investment strategy and our business could be disrupted as we would be required to have a registered commodity pool operator in order to continue to include investments in commodity interests in our investment portfolio. Registered commodity pool operators are subject to disclosure, reporting and record keeping requirements with respect to the pools they operate. In addition, if it were established that we were a commodity pool, the CFTC could pursue remedies against the party or parties it deems to be the commodity pool operator, and we could under certain circumstances be required to indemnify those individuals or entities.
The termination by Third Point LLC of either our investment management agreements at the end of its term or any successive term could materially adversely affect our investment results.
We depend upon Third Point LLC, our investment manager, to implement our investment strategy. The investment management agreements, each of which terminates on December 22, 2016, are subject to automatic renewal for additional successive three-year terms unless a party notifies the other parties at least six months prior to the end of a term that it wishes to terminate either investment management agreement in question at the end of such term. If Third Point LLC chooses to terminate either investment management agreement at the end of such term, there is no assurance that we could find a suitable replacement.
46
Potential conflicts of interest with Third Point LLC may exist that could adversely affect us.
Neither Third Point LLC nor its principals, including Daniel S. Loeb, who is one of our shareholders, are obligated to devote any specific amount of time to our affairs. Affiliates of Third Point LLC manage, and expect to continue to manage, other client accounts, some of which have objectives similar to ours, including collective investment vehicles managed by Third Point LLC’s affiliates and in which Third Point LLC or its affiliates may have an equity interest. Pursuant to our investment management agreements with Third Point LLC, Third Point LLC has the exclusive right to manage our investment portfolio and is required to follow our investment guidelines and act in a manner that is fair and equitable in allocating investment opportunities to us, but the agreements do not otherwise impose any specific obligations or requirements concerning allocation of time, effort or investment opportunities to us or any restriction on the nature or timing of investments for our account and for Third Point LLC’s own account or other accounts that Third Point LLC or its affiliates may manage. Third Point LLC’s interest and the interests of its affiliates, may at times conflict, possibly to Third Point LLC’s detriment, which may potentially adversely affect our investment opportunities and returns.
Our investment portfolio may contain significant positions, which could result in large losses.
Our investment guidelines provide that as our investment manager, Third Point LLC may commit up to 15% of our assets under management to any one investment. Our investment portfolio could be subject to significant losses if it holds a relatively large position in a single issuer, industry, market or a particular type of investment that declines in value, and the losses could increase even further if the investments cannot be liquidated without adverse market reaction or are otherwise adversely affected by changes in market conditions or circumstances. As of December 31, 2014 and 2013, the net exposure of our portfolio was 85% and 87%, respectively, and the largest ten long and short positions comprised an aggregate of 45% and 12% and 40% and 11%, respectively, of our investment portfolio. Since our investment portfolio may not be widely diversified at times, it may be subject to more rapid changes in value than would be the case if the investment portfolio were required to maintain a wide diversification among companies, securities and types of securities.
We are exposed to credit risk from the possibility that counterparties may default on their obligations.
To the extent that transactions in our investment portfolio are entered into directly and not through a broker or clearinghouse, including, but not limited to, forward foreign currency transactions, swap transactions, and the purchase and sale of bonds and other fixed income securities directly from the current holder thereof, we must rely on the creditworthiness of the counterparty to the extent it is unable to immediately deliver the promised asset or cash flows in the case of cash settled transactions, net of any collateral that has been posted by or to the counterparty. The bankruptcy or insolvency of these counterparties could also result in a loss of any collateral posted against these transactions.
In addition, any prime broker or custodian through whom transactions are effected in our investment portfolio will each have a lien over assets held in a margin account with such counterparty. Further, should a prime broker or custodian become insolvent, those assets may become unavailable for redemption and potentially classified as belonging to the defaulting party. The insolvency of any such prime broker or custodian could result in the loss of a substantial portion or all of the assets held with such counterparty. Assets which are deposited with brokers as collateral against margin loss may become available to the creditors of the brokers in the event of the bankruptcy or insolvency of the broker to the extent that it is needed to satisfy obligations to the insolvent party. Any reduction in our assets as a result of a default by a prime broker could negatively affect the net asset value of our investment portfolio.
If Third Point LLC’s risk management systems are ineffective, we may be exposed to material unanticipated losses.
Third Point LLC continually refines its risk management techniques, strategies and assessment methods. However, its risk management techniques and strategies do not fully mitigate the risk exposure of its funds and managed accounts, including our investment portfolio, in all economic or market environments, or against all types of risk,
47
including risks that they might fail to identify or anticipate. Some of Third Point LLC’s strategies for managing risk are based upon its use of historical market behavior statistics. Any failures in Third Point LLC’s risk management techniques and strategies to accurately quantify such risk exposure could limit the risk-adjusted returns of our investment portfolio. In addition, any risk management failures could cause losses in the portfolios managed by Third Point LLC, including our managed accounts, to be significantly greater than the historical measures predict. Third Point LLC’s approach to managing those risks could prove insufficient, exposing us to material unanticipated losses in our investment portfolio.
In managing our investment portfolio, Third Point LLC may trade on margin and use other forms of financial leverage, which could potentially adversely affect our revenues.
Our investment guidelines provide Third Point LLC with the ability to trade on margin and use other forms of financial leverage. Fluctuations in the market value of our investment portfolio could have a disproportionately large effect in relation to our capital. As of December 31, 2014, our investment account had $286.9 million of margin debt at its brokers primarily related to borrowings to fund collateral arrangements. A common metric used to determine financial leverage for accounts such as our investment portfolio is the “gross exposure” of our managed accounts. The “gross exposure” is shown as a percentage of the Net Asset Value (“NAV”) of the account, and represents the market exposure in the account (long and short) versus the NAV. In other words, if the NAV of an account is $100, and the account holds securities “long” with an aggregate market exposure of $100 (100% long), and has sold short securities with an aggregate market exposure of $25 (25% short), then the gross exposure would be 125% (i.e., $125 of investments against $100 of NAV). As of December 31, 2014, the gross exposure of our investment portfolio was 143%. Any event which may adversely affect the value of positions we hold could significantly and negatively affect the net asset value of our investment portfolio and thus our results of operations.
In managing our investment portfolio, Third Point LLC engages in short sales that may subject us to unlimited loss potential.
As our investment manager, Third Point LLC routinely enters into transactions for our account in which it sells a security that we do not own, which we refer to as a short sale, in anticipation of a decline in the market value of the security. Short sales for our account theoretically will involve unlimited loss potential since the market price of securities sold short may continuously increase. If the market price of the subject security increases considerably, Third Point LLC might have to cover short sales at suboptimal prices. As of December 31, 2014, short exposure in our investment portfolio was $527.9 million over 124 debt, equity and index positions, including $52.5 million over 16 positions in the equity portfolio.
Third Point LLC’s representatives’ service on boards and committees may place trading restrictions on our investments.
Third Point LLC may from time to time place its or its affiliates’ representatives on creditors’ committees or boards of certain companies in which our portfolio is invested. While such representation may enable Third Point LLC to enhance the sale value of our investments, it may also place trading restrictions on our investments.
As of the date hereof, representatives of Third Point LLC sat on the board of directors of both Enphase Energy , Inc. and Sotheby’s, whose securities are publicly traded and included in our investment portfolio.
The ability to use ‘’soft dollars’’ may provide Third Point LLC with an incentive to select certain brokers that may take into account benefits to be received by Third Point LLC.
Under certain circumstances and subject to compliance with the safe harbor provided by section 28(e) of the Exchange Act, Third Point LLC is entitled to use so-called “soft dollars” generated by commissions paid in connection with transactions for our investment portfolio to pay for certain categories of expenses relating to research and related services provide by brokers. Soft dollars are a means of paying brokerage firms for their services through commission
48
revenue, rather than through direct payments. Third Point LLC’s right to use soft dollars may give Third Point LLC an incentive to select brokers or dealers for our transactions, or to negotiate commission rates or other execution terms, in a manner that takes into account the soft dollar benefits received by Third Point LLC rather than giving exclusive consideration to the interests of our investment portfolio and, accordingly, may create a conflict.
Our investment management agreements have limited termination provisions.
Our investment management agreements with Third Point LLC have limited termination provisions which restrict our ability to manage our investment portfolio outside of Third Point LLC. Because the investment management agreements contain exclusivity and limited termination provisions, we are unable to use investment managers other than Third Point LLC for so long as the agreement is in effect. The original investment management agreement was entered into on December 22, 2011 and has an initial term of five years, subject to automatic renewal for additional successive three-year terms unless a party notifies the other parties at least six months prior to the end of a term that it wishes to terminate the investment management agreement at the end of such term. The second investment management agreement was entered into in January 2015 and has an expiration date that coincides with the expiration date of the original investment management agreement, as well as corresponding renewal provisions. We may also terminate either investment management agreement upon the death, long-term disability or retirement of Daniel S. Loeb, or the occurrence of other circumstances in which Mr. Loeb is no longer directing the investment program of Third Point LLC.
We may also withdraw as participants under either investment management agreement prior to the expiration of the relevant investment management agreement’s term at any time only “for cause”, which is defined as:
|
•
|
a material violation of applicable law relating to Third Point LLC’s advisory business;
|
|
•
|
Third Point LLC’s fraud, gross negligence, willful misconduct or reckless disregard of its obligations under the relevant investment management agreement;
|
|
•
|
a material breach by Third Point LLC of our investment guidelines that is not cured within a 15-day period;
|
|
•
|
a conviction or, a plea of guilty or nolo contendere to a felony or a crime affecting the asset management business of Third Point LLC by certain senior officers of Third Point LLC;
|
|
•
|
any act of fraud, material misappropriation, material dishonesty, embezzlement, or similar conduct against or involving us by senior officers of Third Point LLC; or
|
|
•
|
a formal administrative or other legal proceeding before the SEC, the CFTC, FINRA, or any other U.S. or non-U.S. regulatory or self-regulatory organization against Third Point LLC or certain key personnel which would likely have a material adverse effect on us.
|
In addition, we may withdraw as a participant under either investment management agreement prior to the expiration of its term if our portfolio underperforms as measured against specified benchmarks.
We may not withdraw or terminate either investment management agreement on the basis of performance other than as provided above. If we become dissatisfied with the results of the investment performance of Third Point LLC as our investment manager but the contractually specified termination threshold has not been met, we will be unable to hire new investment managers until the relevant investment management agreement expires by its terms or is terminated for cause.
49
Certain of our investments may have limited liquidity and lack valuation data, which could create a conflict of interest.
Our investment guidelines provide Third Point LLC, as our investment manager, with the flexibility to invest in certain securities with limited liquidity or no public market. This lack of liquidity may adversely affect the ability of Third Point LLC to execute trade orders at desired prices. To the extent that Third Point LLC invests our investable assets in securities or instruments for which market quotations or other independent pricing sources are not readily available, under the terms of the investment management agreements the valuation of such securities and instruments for purposes of compensation to Third Point LLC will be determined by Third Point LLC, whose determination, subject to audit verification, will be conclusive and binding in the absence of bad faith or manifest error. Because the investment management agreements give Third Point LLC the power to determine the value of securities with no readily discernible market value, and because the calculation of Third Point LLC’s fee is based on the value of the investment account, a conflict of interest may exist or arise.
The U.S. and global economic downturns could harm the performance of our investment portfolio, our liquidity and financial condition and our share price.
Volatility in the United States and other securities markets may adversely affect our investment portfolio. The ability of Third Point LLC to manage our investment portfolio profitably is dependent upon conditions in the global financial markets and economic and geopolitical conditions throughout the world that are outside of our control and difficult to predict. Factors such as equity prices, equity market volatility, asset or market correlations, interest rates, counterparty risks, availability of credit, inflation rates, economic uncertainty, changes in laws or regulation (including laws relating to the financial markets generally or the taxation or regulation of the hedge fund industry), trade barriers, commodity prices, interest rates, currency exchange rates and controls, and national and international political circumstances (including governmental instability, wars, terrorist acts or security operations) can have a material impact on the value of our investment portfolio.
If Third Point LLC, as our investment manager, fails to react appropriately to difficult market, economic and geopolitical conditions, our investment portfolio could incur material losses.
Third Point LLC’s use of hedging and derivative transactions in executing trades for our account may not be successful, which could materially adversely affect our investment results.
In managing our investment portfolio, Third Point LLC may use various financial instruments both for investment purposes and for risk management purposes in order to protect against possible changes in the market value of our investment portfolio resulting from fluctuations in the securities markets and changes in interest rates, protect unrealized gains in the value of our investment portfolio, facilitate the sale of any such investments, enhance or preserve returns, spreads or gains on any investment in our investment portfolio, hedge the interest rate or currency exchange rate on certain liabilities or assets, protect against any increase in the price of any securities Third Point LLC anticipates purchasing for our account at a later date or for any other reason that Third Point LLC, as our investment manager, deems appropriate. The success of such hedging strategy will be subject to Third Point LLC’s ability to correctly assess the degree of correlation between the performance of the instruments used in the hedging strategy and the performance of the investments in the portfolio being hedged. Since the characteristics of many securities change as markets change or time passes, the success of such hedging strategy will also be subject to Third Point LLC’s ability to continually recalculate, readjust and execute hedges in an efficient and timely manner. While Third Point LLC may enter into hedging transactions for our account to seek to reduce risk, such transactions may result in a poorer overall performance for our investment portfolio than if it had not engaged in any such hedging transactions. For a variety of reasons, in managing our investment portfolio Third Point LLC may not seek to establish a perfect correlation between such hedging instruments and the portfolio holdings being hedged. Any such imperfect correlation may prevent Third Point LLC from achieving the intended hedge or expose our investment portfolio to risk of loss.
50
Our investment portfolio includes investments in mortgage-backed securities and other asset-backed securities, whose investment characteristics differ from corporate debt securities.
Our investment portfolio may from time to time be invested in mortgage-backed securities and other asset-backed securities, whose investment characteristics differ from corporate debt securities. As of December 31, 2014, the fair value of asset-backed securities in our investment portfolio was
$400.2 million
. Among the major differences are that interest and principal payments are made more frequently, usually monthly, and that principal may be prepaid at any time because the underlying mortgage loans or other assets generally may be prepaid at any time. Mortgage-backed securities and asset-backed securities may also be subject to call risk and extension risk. For example, because homeowners have the option to prepay their mortgages, the duration of a security backed by home mortgages can either shorten or lengthen.
In general, if interest rates on new mortgage loans fall sufficiently below the interest rates on existing outstanding mortgage loans, the rate of prepayment would be expected to increase. Conversely, if mortgage loan interest rates rise above the interest rates on existing outstanding mortgage loans, the rate of prepayment would be expected to decrease. In either case, a change in the prepayment rate can result in losses to investors. If our investment portfolio includes securities that are subordinated to other interests in the same mortgage pool, we may only receive payments after the pool’s obligations to other investors have been satisfied. In addition, our investment portfolio may, from time to time, be invested in structures commonly known as “Re-REMICS,” in which case a trust is further split between a senior tranche and a junior tranche. Third Point LLC usually buys the junior tranche for its funds and the accounts it manages in such circumstances. An unexpectedly high rate of default on mortgages held by a mortgage pool may limit substantially the pool’s ability to make payments to holders of such securities, reducing the value of those securities or rendering them worthless. The risk of such defaults is generally higher in the case of mortgage pools that include “sub-prime” mortgages. Changes in laws and other regulatory developments relating to mortgage loans may impact the investments of our portfolio in mortgage-backed securities in the future.
Our investment portfolio may include investments in securities of issuers based outside the United States, including emerging markets, which may be riskier than securities of U.S. issuers.
Under our investment guidelines, Third Point LLC may invest in securities of issuers organized or based outside the United States that may involve heightened risks in comparison to the risks of investing in domestic securities, including unfavorable changes in currency rates and exchange control regulations, reduced and less reliable information about issuers and markets, less stringent accounting standards, illiquidity of securities and markets, higher brokerage commissions, transfer taxes and custody fees, local economic or political instability and greater market risk in general. In particular, investing in securities of issuers located in emerging market countries involves additional risks, such as exposure to economic structures that are generally less diverse and mature than, and to political systems that can be expected to have less stability than, those of developed countries. Other characteristics of emerging market countries that may affect investment in their markets include certain national policies that may restrict investment by foreigners in issuers or industries deemed sensitive to relevant national interests and the absence of developed legal structures governing private and foreign investments and private property. The typically small size of the markets for securities of issuers located in emerging markets and the possibility of a low or nonexistent volume of trading in those securities may also result in a lack of liquidity and in price volatility of those securities. In addition, dividend and interest payments from and capital gains in respect of certain foreign securities may be subject to foreign taxes that may or may not be reclaimable. Finally, many transactions in these markets are executed as a “total return swap” or other derivative transaction with a financial institution counterparty, and as a result our investment portfolio has counterparty credit risk with respect to such counterparty.
In addition,
the Euro-zone remains a significant market concern given the recent Greek elections and related volatility. Furthermore, the continued devaluation of the Euro could lead to significant decline in the value of our Euro-denominated investment portfolio. As of December 31, 2014, our investment portfolio had $143.6 million of market exposure denominated in Euros. As a result of our foreign currency hedging strategies, the portfolio had net short exposure in Euro currency of $24.1 million at December 31, 2014.
51
Third Point LLC’s role as an engaged investor in special situation and distressed investments may subject us or Third Point Re to increased risks including the incurrence of additional legal or other expenses.
As our investment manager, Third Point LLC may invest a portion of our investment portfolio in special situation companies. This generally involves investments in securities of companies in event-driven special situations such as acquisitions, tender offers, bankruptcies, recapitalizations, spinoffs, corporate and financial restructurings, litigation or other liability impairments, turnarounds, management changes, consolidating industries and other catalyst-oriented situations. Third Point LLC may also invest our portfolio in securities of issuers in weak financial condition, experiencing poor operating results, having substantial financial needs or negative net worth or facing special competitive or product obsolescence issues or that are involved in bankruptcy reorganization proceedings, liquidation or other corporate restructuring. Investments of this type involve substantial financial business risks that can result in substantial or total losses. Among the problems involved in assessing and making investments in troubled issuers is that fact that it frequently may be difficult to obtain information as to the condition of such issuer. The market prices of the securities of such issuers are also subject to abrupt and erratic market movements and above average price volatility and the spread between the bid and asked prices of such securities may be greater than normally expected. It may take a number of years for the market prices of such securities to reflect their intrinsic values, if at all. It is anticipated that some of such securities may not be widely traded, and that a position in such securities may be substantial in relation to the market for such securities.
As a consequence of Third Point LLC’s role as an engaged investor in special situation and distressed investments, our investment portfolio may be subject to increased risk of incurring additional legal, indemnification or other expenses, even if we are not named in any action. In distressed or special situations litigation often follows when disgruntled shareholders, creditors, and other parties seek to recover losses from poorly performing investments. The enhanced litigation risk for distressed companies is further elevated by the potential that Third Point LLC may have controlling or influential positions in the companies. Some of the claims that can be asserted against Third Point LLC as a distressed investor include: aiding and abetting breach of fiduciary duty; equitable subordination of the investor’s claims; recharacterization of the investor’s claims; and preference or fraudulent transfer claims. Third Point LLC’s use of short-selling for its funds and the accounts it manages has subjected, and may continue to subject Third Point LLC and the short sellers to increased risk of litigation. Lawsuits can be brought against short sellers of a company’s stock to discourage short selling. Among other claims, these suits may allege libel, conspiracy, and market manipulation.
Third Point LLC’s diminution or loss of service or loss of key employees could materially adversely affect our investment results.
We depend upon Third Point LLC, as our investment manager, to implement our investment strategy. All investment decisions with respect to our investment portfolio are made by Third Point LLC, subject to our investment guidelines, under the general supervision of Daniel S. Loeb. As a result, the success of our investment strategy depends largely upon the abilities of Mr. Loeb. While we may terminate our investment management agreements with Third Point LLC upon the death, long-term disability or retirement of Mr. Loeb, or the occurrence of other circumstances in which Mr. Loeb is no longer directing the investment program of Third Point LLC, no assurance can be given that a suitable replacement could be found.
The compensation arrangements of Third Point LLC, as our investment manager, may create an incentive to effect transactions that are risky or speculative.
Our investment management agreements each provide for the following two forms of compensation to be paid to Third Point LLC and TP GP:
|
•
|
Third Point LLC is entitled to a management fee of 2% annually (less the Founders payment paid to the Lead Investors and Dowling, each defined below, as described in each investment management agreement), charged monthly, based on net assets under management; and
|
52
|
•
|
TP GP is entitled to performance compensation based on the appreciation, including unrealized appreciation, in the value of our investment portfolio equal to 20% of net profits, subject to a loss carryforward provision.
|
While the performance compensation arrangement provides that losses will be carried forward as an offset against net profits in subsequent periods, Third Point LLC generally will not otherwise be penalized for realized losses or decreases in the value of our portfolio. These performance compensation arrangements may create an incentive for Third Point LLC as our investment manager to engage in transactions that focus on the potential for short-term gains rather than long-term growth or that are particularly risky or speculative.
Increased regulation or scrutiny of alternative investment advisers and certain trading methods such as short selling may affect Third Point LLC’s ability to manage our investment portfolio or affect our business reputation.
The regulatory environment for investment managers is evolving, and changes in the regulation of managers may adversely affect the ability of Third Point LLC to effect transactions in our investment portfolio that utilize leverage or to pursue its trading strategies in managing our investment portfolio. In addition, the securities and futures markets are subject to comprehensive statutes, regulations and margin requirements. The SEC, other regulators and self-regulatory organizations and exchanges are authorized to take extraordinary actions in the event of market emergencies. The regulation of derivatives transactions and funds that engage in such transactions is an evolving area of law and is subject to modification by government and judicial action. Any future regulatory change could have a significant negative impact on our financial condition and results of operations.
In addition, a number of states and municipal pension plans have adopted so-called “pay-to-play” laws, regulations or policies which prohibit, restrict or require disclosure of payments to (and/or certain contacts with) state officials by individuals and entities seeking to do business with state entities, including investments by public retirement funds. The SEC also has adopted rules that, among other things, prohibit an investment adviser from providing advisory services for compensation to a government client for a period of up to two years after the adviser or certain of its executives or employees make a contribution to certain elected officials or candidates. If Third Point LLC, its employees or affiliates or any service providers acting on their behalf, including, without limitation, a placement agent, fail to comply with such pay-to-play laws, regulations or policies, such non-compliance could have an adverse effect on Third Point LLC and our investment portfolio.
As our investment manager, Third Point LLC routinely engages in short selling for our account in managing our investments. Short sale transactions have been subject to increased regulatory scrutiny, including the imposition of restrictions on short selling certain securities and reporting requirements. Third Point LLC’s ability to execute a short selling strategy in managing our investment portfolio may be materially and adversely impacted by temporary or new permanent rules, interpretations, prohibitions, and restrictions adopted in response to these adverse market events. Temporary restrictions or prohibitions on short selling activity may be imposed by regulatory authorities with little or no advance notice and may impact prior and future trading activities of our investment portfolio. Additionally, the SEC, its non-U.S. counterparts, other governmental authorities or self-regulatory organizations may at any time promulgate permanent rules or interpretations consistent with such temporary restrictions or that impose additional or different permanent or temporary limitations or prohibitions. The SEC might impose different limitations or prohibitions on short selling from those imposed by various non-U.S. regulatory authorities. These different regulations, rules or interpretations might have different effective periods.
Regulatory authorities may, from time to time, impose restrictions that adversely affect our ability to borrow certain securities in connection with short sale transactions. In addition, traditional lenders of securities may be less likely to lend securities under certain market conditions. As a result, Third Point LLC may not be able to effectively pursue a short selling strategy due to a limited supply of securities available for borrowing. We may also incur additional costs in connection with short sale transactions effected in our investment portfolio, including in the event that Third Point LLC is required to enter into a borrowing arrangement for our account in advance of any short sales. Moreover, the ability to continue to borrow a security is not guaranteed and our account will be subject to strict delivery requirements. The inability to deliver securities within the required time frame may subject us to mandatory close out
53
by the executing broker-dealer. A mandatory close out may subject us to unintended costs and losses. Certain action or inaction by third parties, such as executing broker-dealers or clearing broker-dealers, may materially impact our ability to effect short sale transactions in our investment portfolio.
An increase in Third Point LLC’s assets under management may adversely affect the returns of our investment portfolio.
It is possible that if the amount of assets Third Point LLC manages for us, in its funds and for other accounts it manages were to increase materially, it could be more difficult for Third Point LLC to invest profitably for those accounts because of the difficulty of trading larger positions without adversely affecting prices and managing risks associated with larger positions. In addition, there can be no assurance that there will be appropriate investment opportunities to accommodate future increase in assets under management, which may force Third Point LLC to modify its investment decisions for the accounts it manages because it cannot deploy all the assets in a manner it desires. Furthermore, due to the overlap of strategies and investments across many of the portfolios managed by Third Point LLC, including its hedge funds, the accounts may be adversely affected in the event of rapid or large liquidations of investment positions held by the accounts due to a lack of liquidity resulting from large position sizes in the same investments held by the other accounts. While the hedge funds managed by Third Point LLC are currently closed for new investment subject to limited exceptions, Third Point LLC may revisit this decision based on market conditions and any increase in assets under management could adversely affect the returns of our investment portfolio.
Risks Relating to Insurance and Other Regulations
Any suspension or revocation of our subsidiaries’ reinsurance licenses would materially impact our ability to do business and implement our business strategy.
Our subsidiaries Third Point Re and Third Point Re USA are licensed as reinsurers only in Bermuda and we do not plan to seek licenses in any other jurisdiction. The suspension or revocation of Third Point Re or Third Point Re USA’s license to do business as a reinsurance company in Bermuda for any reason would mean that we would not be able to enter into any new reinsurance contracts until the suspension ended or Third Point Re or Third Point Re USA became licensed in another jurisdiction. Any such suspension or revocation of our license would negatively impact our reputation in the reinsurance marketplace and could have a material adverse effect on our results of operations.
If we become subject to insurance statutes and regulations in jurisdictions other than Bermuda or there is a change to Bermuda law or regulations or application of Bermuda law or regulations, there could be a significant and negative impact on our business.
Third Point Re and Third Point Re USA, our wholly owned operating subsidiaries, are registered Bermuda Class 4 insurers. As such, they are subject to regulation and supervision in Bermuda. Bermuda insurance statutes, regulations and policies of the BMA require each of Third Point Re and Third Point Re USA, among other things, to:
|
•
|
maintain a minimum level of capital, surplus and liquidity;
|
|
•
|
satisfy solvency standards;
|
|
•
|
restrict dividends and distributions;
|
|
•
|
obtain prior approval of ownership and transfer of shares;
|
|
•
|
maintain a principal office and appoint and maintain a principal representative in Bermuda; and
|
|
•
|
provide for the performance of certain periodic examinations of Third Point Re and Third Point Re USA and their financial condition.
|
These statutes and regulations may, in effect, restrict our ability to write reinsurance policies, to distribute funds and to pursue our investment strategy.
54
The process of obtaining licenses is very time consuming and costly, and we may not be able to become licensed in a jurisdiction other than Bermuda even in the event we choose to do so. The modification of the conduct of our business resulting from our becoming licensed in certain jurisdictions could significantly and negatively affect our business. In addition, our inability to comply with insurance statutes and regulations of any particular jurisdiction could significantly and adversely affect our business by limiting our ability to conduct business in that jurisdiction and by subjecting us to penalties and fines.
In addition, the BMA could revoke or suspend Third Point Re or Third Point Re USA’s license in certain circumstances, including circumstances in which (i) it is shown that false, misleading or inaccurate information has been supplied to the BMA by Third Point Re or Third Point Re USA or on their behalf for the purposes of any provision of the Insurance Act; (ii) Third Point Re and Third Point Re USA has ceased to carry on business; (iii) Third Point Re or Third Point Re USA has persistently failed to pay fees due under the Insurance Act; (iv) Third Point Re or Third Point Re USA has been shown to have not complied with a condition attached to its registration or with a requirement made of them under the Insurance Act; (v) we are convicted of an offence against a provision of the Insurance Act; (vi) Third Point Re or Third Point Re USA is, in the opinion of the BMA, found not to have been carrying on business in accordance with sound insurance principles; or (vii) if any of the minimum criteria for registration under the Insurance Act is not or will not have been fulfilled. If the BMA were to suspend or revoke Third Point Re or Third Point Re USA’s licenses we could lose our exception under the U.S. Investment Company Act of 1940, as amended, or the “Investment Company Act”. See “We are subject to the risk of becoming an investment company under U.S. federal securities law.”
We are subject to the risk of becoming an investment company under U.S. federal securities law.
The Investment Company Act, regulates certain companies that invest in or trade securities. We rely on an exception under the Investment Company Act that is available to a company organized and regulated as a foreign insurance company which is engaged primarily and predominantly in the reinsurance of risks on insurance agreements. The law in this area has not been well developed and there is a lack of guidance as to the meaning of “primarily and predominantly” under the relevant exception under the Investment Company Act. For example, there is no standard for the amount of premiums that need be written relative to the level of a company’s capital in order to qualify for the exception. If this exception were deemed inapplicable to us, we would have to seek to register under the Investment Company Act as an investment company, which, under the Investment Company Act, would require an order from the SEC. Our inability to obtain such an order could have a significant adverse impact on our business.
Assuming that we were permitted to register as an investment company, registered investment companies are subject to extensive, restrictive and potentially adverse regulation relating to, among other things, operating methods, management, capital structure, our ability to raise additional debt and equity securities or issue stock options or warrants (which could impact our ability to compensate key employees), financial leverage, dividends, board of director composition and transactions with affiliates. Accordingly, if we were required to register as an investment company we would not be able to operate our business as it is currently conducted, nor would we be permitted to have many of the relationships that we have with our affiliated companies. Accordingly, we likely would not be permitted to engage Third Point LLC as our investment manager, unless we obtained the board and shareholder approvals required under the Investment Company Act. If Third Point LLC were not our investment manager, we would potentially be required to liquidate our investment portfolio and we would seek to identify and retain another investment manager with a similar investment philosophy. If we could not identify or retain such an advisor, we would be required to make substantial modifications to our investment strategy. Any such changes to our investment strategy could significantly and negatively impact our investment results, financial condition and our ability to implement our business strategy.
If at any time it were established that we had been operating as an investment company in violation of the Investment Company Act, there would be a risk, among other material adverse consequences, that we could become subject to monetary penalties or injunctive relief, or both, that we could be unable to enforce contracts with third parties or that third parties could seek to obtain rescission of transactions undertaken during the period in which it was established that we were an unregistered investment company. If, subsequently, we were not permitted or were unable to register as an investment company, it is likely that we would be forced to cease operations.
55
To the extent that the laws and regulations change in the future so that contracts we write are deemed not to be reinsurance contracts, we will be at greater risk of not qualifying for the Investment Company Act exception. Additionally, it is possible that our classification as an investment company would result in the suspension or revocation of our reinsurance license.
Insurance regulators in the United States or elsewhere may review our activities and claim that we are subject to additional licensing requirements.
We do not presently expect that we will be admitted to do business in any jurisdiction other than Bermuda. In general, Bermuda insurance statutes, regulations and the policies of the BMA are less restrictive than United States state insurance statutes and regulations. We conduct business in the United States through our indirect subsidiary, TPUSA. We do not believe that our U.S.-based operations subject us to licensing requirements in any state in which we operate. However, we cannot assure you that insurance regulators in the United States or elsewhere will not review our activities and claim that we are subject to such jurisdiction’s licensing requirements. In addition, we will be subject to indirect regulatory requirements imposed by jurisdictions that may limit our ability to provide reinsurance. For example, our ability to write reinsurance may be subject, in certain cases, to arrangements satisfactory to applicable regulatory bodies and proposed legislation and regulations may have the effect of imposing additional requirements upon, or restricting the market for, non-U.S. reinsurers such as us.
If in the future we were to become subject to regulation under the laws of any state in the United States or the laws of the United States or of any other country, we may consider various alternatives to our operations. If we attempt to become licensed in another jurisdiction, for instance, we may not be able to do so and the modification of the conduct of our business or the non-compliance with insurance statutes and regulations could significantly and negatively affect our business.
Our reinsurance subsidiaries are subject to minimum capital and surplus requirements, and our failure to meet these requirements could subject us to regulatory action.
In 2008, the BMA introduced risk-based capital standards for insurance companies as a tool to assist the BMA both in measuring risk and in determining appropriate levels of capitalization. The amended Bermuda insurance statutes and regulations pursuant to the risk-based supervisory approach required additional filings by insurers to be made to the BMA. The required statutory capital and surplus of our Bermuda-based operating subsidiaries increased under the Bermuda Solvency Capital Requirement model. While Third Point Re and Third Point Re USA, as they currently operate, currently have excess capital and surplus under these new requirements, there can be no assurance that such requirement or similar regulations, in their current form or as may be amended in the future, will not have a material adverse effect on our business, financial condition or results of operations. Any failure to meet applicable requirements or minimum statutory capital requirements could subject us to further examination or corrective action by regulators, including restrictions on dividend payments, limitations on our writing of additional business or engaging in finance activities, supervision or liquidation. Further, any changes in existing risk based capital requirements or minimum statutory capital requirements may require us to increase our statutory capital levels, which we might be unable to do.
Changes in law or regulations could cause a significant and negative impact on our reinsurance business.
From time to time, various regulatory and legislative changes have been proposed in the insurance and reinsurance industry. The extreme turmoil in the financial markets has increased the likelihood of changes in the way the financial services industry is regulated. Governmental authorities worldwide have become increasingly interested in potential risks posed by the insurance industry as a whole, and to commercial and financial systems in general. While we cannot predict the exact nature, timing or scope of possible governmental initiatives, there may be increased regulatory intervention in our industry in the future.
Our exposure to potential regulatory initiatives could be heightened by the fact that we are domiciled in, and operate exclusively from, Bermuda. Bermuda is a small jurisdiction and may be disadvantaged when participating in global or cross-border regulatory matters as compared with larger jurisdictions such as the United States or the larger European Union countries.
56
Because we are a Bermuda company, we are subject to changes in Bermuda law and regulation that may have an adverse impact on our operations, including through the imposition of tax liability or increased regulatory supervision. In addition, we will be exposed to any changes in the political environment in Bermuda.
The Bermuda insurance and reinsurance regulatory framework recently has become subject to increased scrutiny in many jurisdictions. As a result, the BMA has recently implemented and imposed additional requirements on the companies it regulates, such as Third Point Re and Third Point Re USA, as part of its efforts to achieve equivalence under Solvency II, the EU regulatory regime enacted in November 2009 and that imposes new solvency and governance requirements across all EU Member States. Although Solvency II was originally supposed to have become effective by November 1, 2012, a proposed Omnibus II directive was to set revised dates for transposition and implementation of Solvency II by the EU Member States. However, there have been a series of delays in the European Parliament vote to approve the Omnibus II directive. Further delay in the implementation of Solvency II is likely, but the extent and nature of the delay is uncertain. The detail of the Solvency II project will be set out in “delegated acts” and binding technical standards which will be issued by the European Commission and will be legally binding. No official drafts for any of these measures have been released. As a result of the delay in implementation of Solvency II, it is unclear when the European Commission will take a final decision on whether or not it will recognize the solvency regime in Bermuda to be equivalent to that laid down in Solvency II.
While we cannot predict the future impact on our operations of changes in the laws and regulation to which we are or may become subject, any such changes could have a material adverse effect on our business, financial condition and results of operations.
Bermuda insurance laws regarding the change of control of insurance companies may limit the acquisition of our shares.
Under Bermuda law, for so long as we have an insurance subsidiary registered under the Insurance Act, the BMA may at any time, by written notice, object to a person holding 10% or more of our common shares if it appears to the BMA that the person is not or is no longer fit and proper to be such a holder. In such a case, the BMA may require the shareholder to reduce its holding of our common shares and direct, among other things, that such shareholder’s voting rights attaching to the common shares shall not be exercisable. A person who does not comply with such a notice or direction from the BMA will be guilty of an offence. This may discourage potential acquisition proposals and may delay, deter or prevent a change of control of our company, including through transactions, and in particular unsolicited transactions, that some or all of our shareholders might consider to be desirable.
Changes in accounting principles and financial reporting requirements could result in material changes to our reported results and financial condition.
U.S. GAAP and related financial reporting requirements are complex, continually evolving and may be subject to varied interpretation by the relevant authoritative bodies. Such varied interpretations could result from differing views related to specific facts and circumstances. Changes in U.S. GAAP and financial reporting requirements, or in the interpretation of U.S. GAAP or those requirements, could result in material changes to our reported results and financial condition. Moreover, the SEC is currently evaluating IFRS to determine whether IFRS should be incorporated into the financial reporting system for U.S. issuers. In addition, U.S. GAAP and IFRS standard setters continue to discuss possible changes to accounting for insurance contracts. Certain of these standards could result in material changes to our reported results of operation. See
Note 2
to the consolidated financial statements included elsewhere in this Form 10-K for a summary of pending changes in accounting principles or financial reporting requirements that could affect our results and disclosures.
Risks Relating to Taxation
In addition to the risk factors discussed below, we advise you to read “Certain Tax Considerations” and to consult your own tax advisor regarding the tax consequences to you of your investment in our shares.
57
We may be subject to United States federal income taxation.
We are incorporated under the laws of Bermuda and we believe that our activities, as currently conducted (including through our U.S.-based subsidiary, TPRUSA) and as contemplated, will not cause us to be treated as engaging in a United States trade or business and will not cause us to be subject to current United States federal income taxation on our net income, except with respect to TPRUSA, which is treated as a domestic corporation for U.S. federal income tax purposes. However, because there are no definitive standards provided by the Internal Revenue Code of 1986 as amended or the Code, regulations or court decisions as to the specific activities that constitute being engaged in the conduct of a trade or business within the United States, and as any such determination is essentially factual in nature and must be made annually, we cannot assure you that the United States Internal Revenue Service, or the IRS, will not successfully assert that we are engaged in a trade or business in the United States or, if applicable under the income tax treaty between the U.S. and Bermuda (the “Bermuda Treaty”), engaged in a trade or business in the United States through a permanent establishment, and thus are subject to current United States federal income taxation. If we were deemed to be engaged in a trade or business in the United States (and, if applicable under the Bermuda Treaty, were deemed to be so engaged through a permanent establishment), Third Point Re generally would become subject to United States federal income tax on its income “effectively connected” (or treated as effectively connected) with the U.S. trade or business, and would become subject to the “branch profits” tax on its earnings and profits that are both effectively connected with the U.S. trade or business and deemed repatriated out of the United States. Any such federal tax liability could materially adversely affect our results of operations.
United States persons who own our shares may be subject to United States federal income taxation on our undistributed earnings and may recognize ordinary income upon disposition of shares.
PFIC
. Significant potential adverse U.S. federal income tax consequences generally apply to any United States person who owns shares in a PFIC. In general, either we and/or Third Point Re would be a PFIC for a taxable year if 75% or more of its income constitutes “passive income” or 50% or more of its assets were held to produce “passive income.” Passive income generally includes interest, dividends and other investment income but does not include income derived in the active conduct of an insurance business by a corporation predominantly engaged in an insurance business. This exception for insurance companies is intended to ensure that a bona fide insurance company’s income is not treated as passive income, except to the extent such income is attributable to financial reserves in excess of the reasonable needs of the insurance business. However, there is very little authority as to what constitutes the active conduct of an insurance business for purposes of the PFIC rules. The IRS has notified taxpayers in IRS Notice 2003-34 that it intends to scrutinize the activities of certain insurance companies located outside of the United States, including reinsurance companies that invest a significant portion of their assets in alternative investment strategies, to determine whether such companies qualify for the active insurance company exception in the PFIC rules.
We believe that our financial reserves are consistent with industry standards and are not in excess of the reasonable needs of our insurance business, and that we are actively engaged in insurance activities that involve sufficient transfer of risk. However, we cannot assure you the IRS will agree with our position and will not successfully assert that we do not qualify for the insurance exception. Moreover, our expectation with respect to any taxable year is based on the amount of risk that we expect to underwrite during that year. If we are unable to underwrite sufficient amount of risk for any taxable year, we and/or Third Point Re might be treated as a PFIC. Furthermore, in certain circumstances, we may seek to manage the volatility of our reinsurance results by writing policies that contain certain contractual terms and conditions (such as loss ratio caps), which may cause the IRS to assert that such policies lack sufficient risk transfer to constitute insurance for United States federal income tax purposes, increasing the risk that we and/or Third Point Re may be treated as a PFIC. Counsel to the Company and its subsidiaries (the “Group”) have never provided an opinion regarding the Group’s PFIC status due to the absence of applicable authority regarding the active insurance company exception and the dependence of the Group’s PFIC status on the actual operational results and other relevant facts for each taxable year. Readers are urged to consult their own tax advisors to assess their tolerance of this risk.
Recently proposed legislation (The Tax Reform Act of 2014) would modify the insurance exception to require that, for any year (1) our premiums constitute more than 50% of our gross receipts and (2) the amount of our insurance related liabilities (generally, unearned premium reserves and loss and loss adjustment expenses) constitute more than 35% of our assets. If enacted in its current form, no assurance can be given that we would be able to operate in a manner
58
to satisfy these requirements in any given year. No assurance can be given as to whether such legislation will be adopted and if so, in what form. In addition, the IRS has expressed intent to promulgate rules relating to the insurance exception, and there can be no assurance as to the content of any such guidance or the manner in which it may apply to our business.
If a “United States person” holds our shares as “capital assets” within the meaning of section 1221 of the Code during any taxable year in which we and/or Third Point Re are treated as PFICs, such shares will generally be treated as stock in a PFIC for all subsequent years. Certain elections designed to mitigate the adverse consequences of owning shares in a PFIC, including a “Protective QEF Election,” may be available. If you are a United States. person, we advise you to consult your own tax advisor concerning the potential tax consequences to you under the PFIC rules, the advisability of making one of these elections and to assess your tolerance of this risk.
CFC
. United States persons who, directly or indirectly or through attribution rules, own 10% or more of the voting power of our shares, which we refer to as United States 10% shareholders, may be subject to the CFC rules. Under the CFC rules, each United States 10% shareholder must annually include its pro rata share of the CFC’s “subpart F income,” even if no distributions are made. In general (subject to the special rules applicable to “related person insurance income” described below), a foreign insurance company will be treated as a CFC only if United States 10% shareholders collectively own more than 25% of the total combined voting power or total value of the company’s shares for an uninterrupted period of 30 days or more during any year. We believe that the restrictions placed on the voting power of our shares should generally prevent shareholders who acquire shares from being treated as United States 10% shareholders of a CFC. We cannot assure you, however, that these rules will not apply to you. If you are a United States. person we strongly urge you to consult your own tax advisor concerning the controlled foreign corporation rules.
Related Person Insurance Income
. If (a) our gross income attributable to insurance or reinsurance policies pursuant to which the direct or indirect insureds are our direct or indirect United States shareholders or persons related to such United States shareholders equals or exceeds 20% of our gross insurance income in any taxable year; and (b) direct or indirect insureds and persons related to such insureds own directly or indirectly 20% or more of the voting power or value of our shares, a United States. person who owns any shares directly or indirectly on the last day of the taxable year would most likely be required to include its allocable share of our related person insurance income for the taxable year in its income, even if no distributions are made. We do not expect that it is likely that either or both of the 20% gross insurance income threshold or the 20% direct or indirect ownership threshold will be met. However, we cannot assure you that this will be the case. Consequently, we cannot assure you that a person who is a direct or indirect United States shareholder will not be required to include amounts in its income in respect of related person insurance income in any taxable year.
Dispositions of Our Shares.
If a United States shareholder is treated as disposing of shares in a CFC of which it is a United States 10% shareholder, or of shares in a foreign insurance corporation that has related person insurance income and in which United States persons collectively own 25% or more of the voting power or value of the company’s share capital, any gain from the disposition will generally be treated as a dividend to the extent of the United States shareholder’s portion of the corporation’s undistributed earnings and profits, as the case may be, that were accumulated during the period that the U.S. shareholder owned the shares. In addition, the shareholder will be required to comply with certain reporting requirements, regardless of the amount of shares owned by the direct or indirect United States shareholder. Although not free from doubt, we believe it would be reasonable for a United States person to take the position that these rules should not apply to dispositions of our shares because we should not have any United States 10% shareholders and will not be directly engaged in the insurance business. We cannot assure you, however, that the IRS will interpret the proposed regulations potentially applicable to such dispositions in this manner or that the proposed regulations will not be promulgated in final form in a manner that would cause these rules to apply to dispositions of our shares.
United States tax-exempt organizations who own our shares may recognize unrelated business taxable income.
A United States tax-exempt organization may recognize unrelated business taxable income if a portion of our subpart F insurance income is allocated to it. In general, subpart F insurance income will be allocated to a tax-exempt organization owning (or treated as owning) our shares if we are a CFC as discussed above and it is a United States 10% shareholder or we earn related person insurance income and the exceptions described above do not apply. We cannot
59
assure you that United States persons holding our shares (directly or indirectly) will not be allocated subpart F insurance income. United States tax-exempt organizations should consult their own tax advisors regarding the risk of recognizing unrelated business taxable income as a result of the ownership of our shares.
We may become subject to U.S. withholding and information reporting requirements under the Foreign Account Tax Compliance Act (“FATCA”) provisions.
The Foreign Account Tax Compliance provisions of the Code (“FATCA”) generally impose a 30% withholding tax regime with respect to (i) certain U.S. source income (including interest and dividends) and gross proceeds from any sale or other disposition after December 31, 2016, of property that can produce U.S. source interest or dividends (“withholdable payments”) and (ii) “foreign passthru payments” made by foreign financial institutions (“FFIs”). As a general matter, FATCA was designed to require U.S. persons’ direct and indirect ownership of certain non-U.S. accounts and non-U.S. entities to be reported to the IRS. The FATCA withholding rules have become applicable as of July 1, 2014, with withholding on foreign passthru payments made by FFIs taking effect no earlier than 2017.
On December 19, 2013, the Bermuda Government entered into a “Model 2” intergovernmental agreement (“IGA”) with the United States to implement FATCA. If we, Third Point Re and/or Third Point Re USA are treated as FFIs for the purposes of FATCA, under the Model 2 IGA, we, Third Point Re and/or Third Point Re USA will be directed to ‘register’ with the IRS by July 1, 2014 and required to comply with the requirements of FATCA, including due diligence, reporting and withholding. Assuming registration and compliance with the terms of an agreement with the IRS (an “FFI Agreement”) pursuant to a Model 2 IGA, an FFI would be treated as FATCA compliant and not subject to withholding. An FFI that satisfies the eligibility, information reporting and other requirements of the IGA will not be subject to the regular FATCA reporting and withholding obligations discussed below.
If the Company, Third Point Re and/or Third Point Re USA are treated as FFIs for purposes of FATCA, withholdable payments and foreign passthru payments made to the Company, Third Point Re and/or Third Point Re USA will be subject to a 30% withholding tax unless an FFI Agreement is in effect, pursuant to which the Company, Third Point Re and/or Third Point Re USA would be required to provide information regarding its U.S. direct or indirect owners and to comply with other reporting, verification, due diligence and other procedures established by the IRS, including a requirement to seek waivers of non-U.S. laws that would prevent the reporting of such information. The IRS may terminate the FFI Agreement if the IRS notifies the Company, Third Point Re and/or Third Point Re USA that it is out of compliance with the FFI Agreement and the Company and/or Third Point Re does not remediate the compliance failure. Even if the Company, Third Point Re and/or Third Point Re USA are subject to an FFI Agreement, distributions to an investor that are treated as foreign passthru payments generally will be subject to a 30% withholding tax (a) if the investor fails to provide information or take other actions required for the the Company, Third Point Re and/or Third Point Re USA to comply with the FFI Agreement including, in the case of a non-U.S. investor, providing information regarding certain U.S. direct and indirect owners of the investor (and, in certain circumstances, obtaining waivers of non-U.S. law to permit such reporting), or (b) if the investor is an FFI, unless the investor (i) is subject to an FFI Agreement, (ii) establishes that an exemption applies or (iii) is required to comply with FATCA under an applicable IGA.
Under the regulations implementing FATCA, a foreign insurance company (or foreign holding company of an insurance company) that issues or is obligated to make payments with respect to an account is a foreign financial institution. For this purpose, insurance contracts treated as having “cash value” and annuity contracts issued or maintained by a financial institution are considered accounts, and certain term life insurance contracts are not considered accounts. Insurance companies that issue only property and casualty insurance contracts, or that only issue life insurance contracts lacking cash value (or that provide for limited cash value) generally would not be considered FFIs under the final regulations. However, a holding company may be treated as an FFI if it is formed in connection with or availed of by a collective investment vehicle, mutual fund, exchange traded fund, hedge fund, venture capital fund, leveraged buyout fund, or any similar investment vehicle established with an investment strategy of investing, reinvesting, or trading in financial assets. Moreover, a company may be treated as an FFI if its gross income is primarily attributable to investing, reinvesting, or trading in financial assets and the entity is managed by an FFI, or the entity functions or holds itself out as an investment vehicle established with an investment strategy of investing, reinvesting, or trading in financial assets. Even if the Company, Third Point Re and/or Third Point Re USA are not treated as FFIs, then
60
depending on whether the shares of the Company are treated as “regularly traded on one or more more established securities markets” under the FATCA rules and whether the income and assets of Third Point Re meet the requirements for the treatment of Third Point Re as an “active NFFE,” withholdable payments to the Company, Third Point Re and/or Third Point Re USA may be subject to a 30% withholding tax unless the Company, Third Point Re and/or Third Point Re USA provide information regarding its U.S. direct or indirect owners.
At this early stage, there can be no certainty as to whether the Company, Third Point Re and/or Third Point Re USA will be subject to the requirements imposed on FFIs under FACTA. We will use reasonable efforts to avoid the imposition of a withholding tax under FACTA, which may include the entering into of an FFI Agreement.
Potential additional application of the Federal Insurance Excise Tax.
The IRS, in Revenue Ruling 2008-15, has formally announced its position that the U.S. federal insurance excise tax (the “FET”) is applicable (at a 1% rate on premiums) to all reinsurance cessions or retrocessions of risks by non‑U.S. insurers or reinsurers to non-U.S. reinsurers where the underlying risks are either (i) risks of a U.S. entity or individual located wholly or partly within the U.S. or (ii) risks of a non-U.S. entity or individual engaged in a trade or business in the U.S. which are located within the U.S. (“U.S. Situs Risks”), even if the FET has been paid on prior cessions of the same risks. The legal and jurisdictional basis for, and the method of enforcement of, the IRS’s position is unclear. A recent judicial decision, which is under appeal, has held that the FET is not applicable to retrocessions. We have not determined if the FET should be applicable with respect to risks ceded to us by, or by us to, a non-U.S. insurance company. If the FET is applicable, it should apply at a 1% rate on premium for all U.S. Situs Risks ceded to us by a non-U.S. insurance company, or by us to a non-U.S. insurance company, even though the FET also applies at a 1% rate on premium ceded to us with respect to such risks.
Change in United States tax laws may be retroactive and could subject us and/or United States persons who own our shares to United States income taxation on our undistributed earnings.
The tax laws and interpretations thereof regarding whether a company is engaged in a United States trade or business, is a CFC, has related party insurance income or is a PFIC are subject to change, possibly on a retroactive basis. There are currently no regulations regarding the application of the passive foreign investment company rules to an insurance company and the regulations regarding related party insurance income are in proposed form. New regulations or pronouncements interpreting or clarifying such rules may be forthcoming from the IRS. We are not able to predict if, when or in what form such guidance will be provided and whether such guidance will have a retroactive effect.
We may become subject to taxes in Bermuda after March 31, 2035, which may have a material adverse effect on our results of operations and your investment.
The Bermuda Minister of Finance, under the Exempted Undertakings Tax Protection Act 1966 of Bermuda, as amended, has given us an assurance that if any legislation is enacted in Bermuda that would impose tax computed on profits or income, or computed on any capital asset, gain or appreciation, or any tax in the nature of estate duty or inheritance tax, then the imposition of any such tax will not be applicable to us or any of our operations, shares, debentures or other obligations until March 31, 2035, except insofar as such tax applies to persons ordinarily resident in Bermuda or to any taxes payable by us in respect of real property owned or leased by us in Bermuda. Given the limited duration of the Bermuda Minister of Finance’s assurance, we cannot assure you that we will not be subject to any Bermuda tax after March 31, 2035.
61
Risks Relating to Our Common Shares
Future sales of shares by existing shareholders could cause our share price to decline, even if our business is performing well.
Sales of substantial amounts of our common shares in the public market could occur at any time. These sales, or the perception that these sales could occur, could cause the market price of our common shares to decline.
A significant number of our common shares are currently restricted as a result of applicable securities laws, but are eligible for sale subject to the applicable volume, manner of sale, holding period and other limitations of Rule 144. As of December 31, 2014, we also had reserved for issuance common shares underlying certain warrants to purchase, in the aggregate, up to 4,651,163 common shares. In addition, certain of our significant shareholders may distribute shares that they hold to their investors who themselves may then sell into the public market. Such sales may not be subject to the volume, manner of sale, holding period and other limitations of Rule 144. As resale restrictions end, the market price of our common shares could decline if the holders of those shares sell them or are perceived by the market as intending to sell them.
Certain existing holders of our common shares also have registration rights, subject to some conditions, to require us to file registration statements covering the sale of their shares or to include their shares in registration statements that we may file for ourselves or other shareholders in the future. In the event that we register the common shares for the holders of registration rights, they can be freely sold in the public market upon issuance, subject to certain limitations applicable to affiliates.
As of December 31, 2014, a total of 22,252,206 common shares were reserved for issuance under our current share incentive plans and in connection with restricted share award agreements entered into between us and certain of our employees and directors. As of December 31, 2014, there were share options outstanding which are exercisable (subject to vesting) for 10,990,841 common shares. We have registered on a Form S-8 registration statement these shares and all common shares that we may in future issue under our equity compensation plans. As a result, these shares can be freely sold in the public market upon issuance, subject to certain limitations applicable to affiliates.
In the future, we may issue additional common shares or other equity or debt securities convertible into common shares in connection with a financing, acquisition, litigation settlement or employee arrangement or otherwise. Any of these issuances could result in substantial dilution to our existing shareholders and could cause the trading price of our common shares to decline.
If securities analysts or industry analysts downgrade our ordinary shares, publish negative research or reports or fail to publish reports about our business, our share price and trading volume could decline.
The trading market for our common shares is influenced by the research and reports that industry or securities analysts publish about us, our business and our market. If one or more analysts adversely changes their recommendation regarding our stock or our competitors’ stock, our share price would likely decline. If one or more analysts cease coverage of us or fail to regularly publish reports on us, we could lose visibility in the financial markets which in turn could cause our share price or trading volume to decline.
If the ownership of our common shares continues to be highly concentrated, it could prevent you and other shareholders from influencing significant corporate decisions.
Third Point Reinsurance Ltd. was incorporated on October 6, 2011. On December 22, 2011, KIA TP Holdings, L.P. and KEP TP Holdings, L.P., which are affiliates of Kelso & Company (collectively, “Kelso”) and Pine Brook LVR, L.P., an affiliate of Pine Brook Road Partners, LLC (collectively, “Pine Brook”, and Pine Brook and together with Kelso, the “Lead Investors” and each individually, a “Lead Investor”), Dowling Capital Partners I, L.P., an affiliate of Dowling Capital Management, LLC (collectively, “Dowling”), P RE Opportunities Ltd. (“PROL”), Third Point LLC, Daniel S. Loeb and affiliates associated with Mr. Loeb (collectively, the “Loeb Entities”) and our Chief Executive
62
Officer John R. Berger (collectively, the “Founders”), together with certain members of management, committed $533.0 million to capitalize Third Point Reinsurance Ltd. As of December 31, 2014, Kelso, Pine Brook, the Loeb Entities, the Company’s directors and named executive officers, as defined in the proxy statement, and PROL, own approximately 24.9%, 12.4%, 7.9%, 6.4 %, and 5.0% of our issued and outstanding common shares, respectively, on an as converted basis after giving effect to the issuance of vested warrants and options representing the right to purchase 9,758,289 common shares. As a result, the Founders, directors and named executive officers could exercise significant influence over all matters requiring shareholder approval for the foreseeable future, including approval of significant corporate transactions, which may reduce the market price of our common shares.
The interests of our existing shareholders may conflict with the interests of our other shareholders. Our board of directors has adopted corporate governance guidelines that, among other things, addressed potential conflicts between a director’s interests and our interests. In addition, we have adopted a Code of Business Conduct and Ethics that, among other things, required our employees to avoid actions or relationships that might conflict or appear to conflict with their job responsibilities or our interests and to disclose their outside activities, financial interests or relationships that may present a possible conflict of interest or the appearance of a conflict to our general counsel. These corporate governance guidelines and Code of Business Conduct and Ethics will not, by themselves, prohibit transactions with our Founders.
Fulfilling our obligations incident to being a public company, including with respect to the requirements of and related rules under the Sarbanes-Oxley Act of 2002, is expensive and time-consuming, and any delays or difficulties in satisfying these obligations could have a material adverse effect on our future results of operations and our share price.
We are required to file annual, quarterly and other reports with the SEC. We need to prepare and timely file financial statements that comply with SEC reporting requirements. We are also subject to other reporting and corporate governance requirements, under the listing standards of the NYSE and the Sarbanes-Oxley Act of 2002, which impose significant compliance costs and obligations upon us. Being a public company requires a significant commitment of resources and management oversight which increases our operating costs, including as a result of our engagement of a third party to assist us in developing our internal audit function. Such requirements also place significant additional demands on our finance and accounting staff and on our financial accounting and information systems. Other expenses associated with being a public company include auditing, accounting and legal fees and expenses, investor relations expenses, increased directors’ fees and director and officer liability insurance costs, registrar and transfer agent fees and listing fees, as well as other expenses. As a public company, we are required, among other things, to:
|
•
|
prepare and file periodic reports, and distribute other shareholder communications, in compliance with the federal securities laws and NYSE rules;
|
|
•
|
maintain comprehensive compliance, investor relations and internal audit functions; and
|
|
•
|
evaluate and maintain our system of internal control over financial reporting, and report on management’s assessment thereof, in compliance with rules and regulations of the SEC and the Public Company Accounting Oversight Board.
|
In particular, the Sarbanes-Oxley Act of 2002 requires us to document and test the effectiveness of our internal control over financial reporting in accordance with an established internal control framework, and to report on our conclusions as to the effectiveness of our internal controls. Likewise, our independent registered public accounting firm is required to provide an attestation report on the effectiveness of our internal control over financial reporting pursuant to Section 404(b) of the Sarbanes-Oxley Act of 2002. In addition, we are required under the Securities Exchange Act of 1934, as amended (the “Exchange Act”), to maintain disclosure controls and procedures and internal control over financial reporting. Any failure to implement required new or improved controls, or difficulties encountered in their implementation, could harm our operating results or cause us to fail to meet our reporting obligations. If we are unable to conclude that we have effective internal control over financial reporting, investors could lose confidence in the reliability of our financial statements. This could result in a decrease in the value of our common shares. Failure to comply with the Sarbanes-Oxley Act of 2002 could potentially subject us to sanctions or investigations by the SEC, the NYSE, or other regulatory authorities.
63
The market price of our common shares may fluctuate significantly.
The market price of our common shares may fluctuate significantly. Among the factors that could affect our share price are:
|
•
|
industry or general market conditions;
|
|
•
|
domestic and international economic factors unrelated to our performance;
|
|
•
|
changes in our clients’ needs;
|
|
•
|
new regulatory pronouncements and changes in regulatory guidelines;
|
|
•
|
lawsuits, enforcement actions and other claims by third parties or governmental authorities;
|
|
•
|
actual or anticipated fluctuations in our quarterly operating results;
|
|
•
|
changes in securities analysts' estimates of our financial performance or lack of research and reports by industry analysts;
|
|
•
|
action by institutional shareholders or other large shareholders (including the Founders), including future sales;
|
|
•
|
speculation in the press or investment community;
|
|
•
|
investor perception of us and our industry;
|
|
•
|
changes in market valuations or earnings of similar companies;
|
|
•
|
announcements by us or our competitors of significant contracts, acquisitions or strategic partnerships;
|
|
•
|
any future sales of our common shares or other securities; and
|
|
•
|
additions or departures of key personnel.
|
The stock markets have experienced extreme volatility in recent years that has been unrelated to the operating performance of particular companies. These broad market fluctuations may adversely affect the market price of our common shares. In the past, following periods of volatility in the market price of a company's securities, class action litigation has often been instituted against such company. Any litigation of this type brought against us could result in substantial costs and a diversion of management's attention and resources, which would harm our business, operating results and financial condition.
We do not intend to pay dividends on our common shares and, consequently, your ability to achieve a return on your investment will depend on appreciation in the price of our common shares.
We do not intend to declare and pay dividends on our share capital for the foreseeable future. We currently intend to invest our future earnings, if any, to fund our growth. Therefore, you are not likely to receive any dividends on your common shares for the foreseeable future and the success of an investment in our common shares will depend upon any future appreciation in their value. There is no guarantee that our common shares will appreciate in value or even maintain the price at which our shareholders have purchased their shares.
We may repurchase our common shares without our shareholders’ consent.
Under our bye-laws and subject to Bermuda law, we have the option, but not the obligation, to require a shareholder to sell to us at fair market value the minimum number of common shares which is necessary to avoid or cure any adverse tax consequences or materially adverse legal or regulatory treatment to us, our subsidiaries or our shareholders if our board of directors reasonably determines, in good faith, that failure to exercise our option would result in such adverse consequences or treatment.
Holders of our shares may have difficulty effecting service of process on us or enforcing judgments against us in the United States.
We are incorporated pursuant to the laws of Bermuda and our business is based in Bermuda. In addition, certain of our directors and officers reside outside the United States, and all or a substantial portion of our assets are located in jurisdictions outside the United States. As such, we have been advised that there is doubt as to whether:
64
|
•
|
a holder of our shares would be able to enforce, in the courts of Bermuda, judgments of United States courts against persons who reside in Bermuda based upon the civil liability provisions of the United States federal securities laws;
|
|
•
|
a holder of our shares would be able to enforce, in the courts of Bermuda, judgments of United States courts based upon the civil liability provisions of the United States federal securities laws;
|
|
•
|
a holder of our shares would be able to bring an original action in the Bermuda courts to enforce liabilities against us or our directors and officers who reside outside the United States based solely upon United States federal securities laws.
|
Further, we have been advised that there is no treaty in effect between the United States and Bermuda providing for the enforcement of judgments of United States courts, and there are grounds upon which Bermuda courts may not enforce judgments of United States courts. Because judgments of United States courts are not automatically enforceable in Bermuda, it may be difficult for you to recover against us based upon such judgments.
U.S. persons who own our shares may have more difficulty in protecting their interests than U.S. persons who are shareholders of a U.S. corporation.
The Companies Act, which applies to us, differs in certain material respects from laws generally applicable to U.S. corporations and their shareholders. Set forth below is a summary of certain significant provisions of the Companies Act and our bye-laws which differ in certain respects from provisions of Delaware corporate law. Because the following statements are summaries, they do not discuss all aspects of Bermuda law that may be relevant to us and our shareholders.
Interested Directors
: Bermuda law provides that we cannot void any transaction we enter into in which a director has an interest, nor can such director be liable to us for any profit realized pursuant to such transaction, provided the nature of the interest is disclosed at the first opportunity at a meeting of directors, or in writing, to the directors. Under Delaware law such transaction would not be voidable if:
|
•
|
the material facts as to such interested director’s relationship or interests were disclosed or were known to the board of directors and the board of directors had in good faith authorized the transaction by the affirmative vote of a majority of the disinterested directors;
|
|
•
|
such material facts were disclosed or were known to the shareholders entitled to vote on such transaction and the transaction were specifically approved in good faith by vote of the majority of shares entitled to vote thereon; or
|
|
•
|
the transaction were fair as to the corporation as of the time it was authorized, approved or ratified. Under Delaware law, the interested director could be held liable for a transaction in which the director derived an improper personal benefit.
|
Business Combinations with Large Shareholders or Affiliates
: As a Bermuda company, we may enter into business combinations with our large shareholders or affiliates, including mergers, asset sales and other transactions in which a large shareholder or affiliate receives, or could receive, a financial benefit that is greater than that received, or to be received, by other shareholders, without obtaining prior approval from our board of directors or from our shareholders. If we were a Delaware corporation, we would need prior approval from our board of directors or a super-majority of our shareholders to enter into a business combination with an interested shareholder for a period of three years from the time the person became an interested shareholder, unless we opted out of the relevant Delaware statute. Our bye-laws include a provision restricting business combinations with interested shareholders consistent with the corresponding Delaware statute.
Shareholders’ Suits
: The rights of shareholders under Bermuda law are not as extensive as the rights of shareholders in many United States jurisdictions. Class actions and derivative actions are generally not available to shareholders
65
under the laws of Bermuda. However, the Bermuda courts ordinarily would be expected to follow English case law precedent, which would permit a shareholder to commence an action in the name of the company to remedy a wrong done to the company where an act is alleged to be beyond the corporate power of the company, is illegal or would result in the violation of our memorandum of association or bye-laws. Furthermore, a court would consider acts that are alleged to constitute a fraud against the minority shareholders or where an act requires the approval of a greater percentage of our shareholders than actually approved it. The winning party in such an action generally would be able to recover a portion of attorneys’ fees incurred in connection with such action. Our bye-laws provide that shareholders waive all claims or rights of action that they might have, individually or in the right of the company, against any director or officer for any act or failure to act in the performance of such director’s or officer’s duties, except with respect to any fraud or dishonesty of such director or officer. Class actions and derivative actions generally are available to shareholders under Delaware law for, among other things, breach of fiduciary duty, corporate waste and actions not taken in accordance with applicable law. In such actions, the court has discretion to permit the winning party to recover attorneys’ fees incurred in connection with such action.
Indemnification of Directors
: We have entered into indemnification agreements with our directors. The indemnification agreements provide that we will indemnify our directors or officers or any person appointed to any committee by the board of directors acting in their capacity as such in relation to any of our affairs for any loss arising or liability attaching to them by virtue of any rule of law in respect of any negligence, default, breach of duty or breach of trust of which such person may be guilty in relation to the company other than in respect of his own fraud or dishonesty. Under Delaware law, a corporation may indemnify a director or officer of the corporation against expenses (including attorneys’ fees), judgments, fines and amounts paid in settlement actually and reasonably incurred in defense of an action, suit or proceeding by reason of such position if such director or officer acted in good faith and in a manner he or she reasonably believed to be in or not be opposed to the best interests of the corporation and, with respect to any criminal action or proceeding, such director or officer had no reasonable cause to believe his or her conduct was unlawful.
Provisions in our bye-laws may reduce or increase the voting rights of our shares.
In general, and except as provided under our bye-laws and as described below, the common shareholders have one vote for each common share held by them and are entitled to vote, on a non-cumulative basis, at all meetings of shareholders. However, if, and so long as, the shares of a shareholder are treated as “controlled shares” (as determined pursuant to sections 957 and 958 of the Code of any United States person (that owns shares directly or indirectly through non-U.S. entities) and such controlled shares constitute 9.5% or more of the votes conferred by our issued shares, the voting rights with respect to the controlled shares owned by such United States person will be limited, in the aggregate, to a voting power of less than 9.5%, under a formula specified in our bye-laws. The formula is applied repeatedly until the voting power of all 9.5% U.S. shareholders has been reduced to less than 9.5%. In addition, our board of directors may limit a shareholder’s voting rights when it deems it appropriate to do so to (i) avoid the existence of any 9.5% U.S. shareholder; and (ii) avoid certain material adverse tax, legal or regulatory consequences to us, any of our subsidiaries or any direct or indirect shareholder or its affiliates. “Controlled shares” include, among other things, all shares that a United States person is deemed to own directly, indirectly or constructively (within the meaning of section 958 of the Code). The amount of any reduction of votes that occurs by operation of the above limitations will generally be reallocated proportionately among our other shareholders whose shares were not “controlled shares” of the 9.5% U.S. shareholder so long as such reallocation does not cause any person to become a 9.5% U.S. Shareholder.
Under these provisions, certain shareholders may have their voting rights limited, while other shareholders may have voting rights in excess of one vote per share. Moreover, these provisions could have the effect of reducing the votes of certain shareholders who would not otherwise be subject to the 9.5% limitation by virtue of their direct share ownership.
We are authorized under our bye-laws to request information from any shareholder for the purpose of determining whether a shareholder’s voting rights are to be reallocated under the bye-laws. If any holder fails to respond to this request or submits incomplete or inaccurate information, we may, in our sole discretion, eliminate the shareholder’s voting rights. Any shareholder must give notice to us within ten days following the date it owns 9.5% of our common shares.
66
Our bye-laws contain provisions that could discourage takeovers and business combinations that our shareholders might consider in their best interests.
Our bye-laws include certain provisions that could have the effect of delaying, deterring, preventing or rendering more difficult a change in control of us that our shareholders might consider in their best interests.
For example, our bye-laws:
|
•
|
provide the right of shareholders to act by majority written consent for so long as the Lead Investors and the Loeb Entities collectively hold at least 35% of our issued and outstanding common shares;
|
|
•
|
establish a classified board of directors;
|
|
•
|
require advance notice of shareholders’ proposals in connection with annual general meetings;
|
|
•
|
authorize our board to issue “blank cheque” preferred shares;
|
|
•
|
prohibit us from engaging in a business combination with a person who acquires at least 15% of our common shares for a period of three years from the date such person acquired such common shares unless board and shareholder approval is obtained prior to the acquisition;
|
|
•
|
require that directors only be removed from office for cause by majority shareholder vote once the Lead Investors and the Loeb Entities cease to collectively hold at least 35% of our issued and outstanding shares;
|
|
•
|
provide that vacancies on the board, including newly-created directorships, may be filled only by a majority vote of directors then in office;
|
|
•
|
allow each of Kelso and Pine Brook to appoint one director for so long as they hold not less than 25% of the number of shares respectively held as of December 22, 2011;
|
|
•
|
require a supermajority vote of shareholders to effect certain amendments to our memorandum of association and bye-laws; and
|
|
•
|
provide a consent right on the part of Kelso, Pine Brook and Daniel S. Loeb to any amendments to our bye-laws or memorandum of association which would have a material adverse effect on their rights for so long as they hold not less than 25% of the number of shares respectively held as of December 22, 2011.
|
Any such provision could prevent our shareholders from receiving the benefit from any premium to the market price of our common shares offered by a bidder in a takeover context. Even in the absence of a takeover attempt, the existence of any of these provisions could adversely affect the prevailing market price of our common shares if they were viewed as discouraging takeover attempts in the future.
None.
We do not own any facilities or real estate. We lease office space for our headquarters at Chesney House in Pembroke, Bermuda, and also lease office space in Short Hills, New Jersey for Third Point Re USA’s operations. We believe for the foreseeable future this office space will be sufficient for us to conduct our operations and that we would be able to renew or replace these leases upon expiration on terms reasonably acceptable to us.
67
We are not currently involved in any litigation or arbitration. We anticipate that, similar to the rest of the reinsurance industry, we will be subject to litigation and arbitration from time to time in the ordinary course of business.
If we are subject to disputes in the ordinary course of our business we anticipate engaging in discussions with the parties to the applicable contract to seek to resolve the matter. If such discussions are unsuccessful, we anticipate invoking the dispute resolution provisions of the relevant contract, which typically provide for the parties to submit to arbitration or litigation, as applicable, to resolve the dispute.
Not applicable.
Executive Officers of the Registrant
Set forth below is information, as of
February 27, 2015
, concerning the Company’s executive officers.
|
Name
|
Age
|
Position
|
|
John R. Berger
|
62
|
Chairman of the Board, Chief Executive Officer and Chief Underwriting Officer
|
|
J. Robert Bredahl
|
52
|
President and Chief Operating Officer
|
|
Christopher S. Coleman
|
41
|
Chief Financial Officer
|
|
Manoj K. Gupta
|
39
|
SVP, Underwriting; and Lead Portfolio Manager, Third Point Reinsurance Investment Management Ltd.
|
|
Daniel V. Malloy
|
55
|
Executive Vice President - Underwriting
|
|
Tonya L. Marshall
|
43
|
Executive Vice President, General Counsel and Secretary
|
|
Michael McKnight (1)
|
54
|
Chief Actuary and Chief Risk Officer
|
|
Jonathan Norton
|
56
|
Chief Reserving Actuary, Third Point Reinsurance Ltd. and Chief Actuary, Third Point Reinsurance (USA) Ltd.
|
|
Anthony Urban
|
54
|
Executive Vice President - Underwriting
|
|
Thomas C. Wafer
|
59
|
Director of the Board and President, Third Point Reinsurance (USA) Ltd.
|
|
(1)
|
Mr. McKnight retired on November 5, 2014.
|
John R. Berger -
M
r. Berger is our Chairman, Chief Executive Officer and Chief Underwriting Officer and has served in this position since December 22, 2011. Mr. Berger will no longer serve as our Chief Underwriting Officer after February 28, 2015. Mr. Berger is an insurance industry veteran with over thirty years of experience, the majority of which was spent as the principal executive officer of three successful reinsurance companies. Mr. Berger served as Chief Executive Officer, Reinsurance and Vice Chairman of the Board of Alterra Capital Holdings Limited (previously known as Max Capital Group Ltd.) from May 2010 until August 2011. He also served as Chairman of Alterra Reinsurance Limited (previously known as Harbor Point Re Limited), Chief Executive Officer of Alterra Capital Services Inc. (previously known as Harbor Point Services, Inc.), and as a Director of Alterra Agency Limited (Harbor Point Agency Limited), New Point III Limited and New Point Re III Limited. He was the President and Chief Executive Officer of Harbor Point Ltd. from December 2005 until May 2010. From August 1998 to December 2005, he was the Chief Executive Officer and President of Chubb Re, Inc. From November 1983 to August 1998, he held various positions at F&G Re, including Chief Executive Officer and President. Following the acquisition of USF&G by The St. Paul Companies, from April 1998 until August 1998 he served as President of the North American Treaty operation of St. Paul Re and President of F&G Re. Prior to 1983, Mr. Berger was an Underwriter at General Re and Prudential Reinsurance. Mr. Berger is a Member of the Board of Directors of the Reinsurance Association of America. He earned an undergraduate degree in Economics from Princeton University and an MBA from Rutgers University.
J. Robert Bredahl -
Mr. Bredahl is our President and Chief Operating Officer and has served in this position since November 10, 2014 prior to which Mr. Bredahl served as the Chief Financial Officer and Chief Operating Officer of the Company from January 26, 2012. With effect from March 1, 2015, Mr. Bredahl will also serve as the Chief
68
Underwriting Officer of Third Point Reinsurance Company Ltd. Prior to joining the Company, Mr. Bredahl was the Chief Executive Officer of Aon Benfield Securities, Aon's Investment Banking Group, and the President of the Americas division of Aon Benfield, the premier reinsurance intermediary and capital advisor, from November 2008 to January 2012. Prior to Aon's acquisition of Benfield in November 2008, Mr.Bredahl held various senior level positions at Benfield and at the time of acquisition was Chief Executive Officer of Benfield U.S. Inc. and of Benfield Advisory. Prior to joining Benfield in March 2002, he served as Chief Executive Officer of Inreon PLC and Managing Director and Head of U.S. Derivative Sales for Barclays Capital. Mr.Bredahl earned a Bachelor of Arts degree in Economics from Middlebury College. While at Aon Benfield Securities he held several securities licenses, including the Series 24, Series 7, and Series 63.
Christopher S. Coleman -
Mr. Coleman is our Chief Financial Officer and has served in this position since November 10, 2014, prior to which Mr. Coleman was the Chief Accounting Officer of the Company, in which position he served from April 1, 2013. Prior to joining the Company Mr. Coleman was the Chief Financial Officer of Alterra Bermuda Limited, the principal operating subsidiary of Alterra Capital Holdings Limited ("Alterra"). Prior to Max Capital Group Ltd.'s acquisition of Harbor Point Limited to form Alterra in May 2010, Mr. Coleman was the Senior Vice President, Chief Accounting Officer of Harbor Point Limited. Mr. Coleman joined Harbor Point Limited in March 2006. From 2002 to 2006, Mr. Coleman worked for PricewaterhouseCoopers in Bermuda as a Senior Manager within the audit and advisory practice specializing in clients in the insurance and reinsurance industry. Mr. Coleman started his career with Arthur Andersen in 1995 working in the Hartford office before relocating to the Bermuda office in 2001. Mr. Coleman graduated from Central Connecticut State University in 1995 with a Bachelor of Science degree in Accounting. Mr. Coleman is a Certified Public Accountant and a Chartered Accountant and is a member of the American Institute of Certified Public Accountants and the Institute of Chartered Accounts of Bermuda.
Manoj K. Gupta -
Mr. Gupta is our Senior Vice President, Underwriting and has served in this position since April 16, 2012. Mr. Gupta has also served as Lead Portfolio Manager of Third Point Reinsurance Investment Management Ltd. since June 15, 2012. Prior to joining the Company Mr.Gupta was the lead portfolio manager for catastrophe reinsurance at Goldman Sachs Asset Management ("GSAM"), one of the world's largest asset management firms and a subsidiary of Goldman Sachs Group. During his tenure at GSAM from October 2006 until April 2012, Mr.Gupta launched three standalone catastrophe risk funds and also placed reinsurance risk within the firm's multi-strategy hedge funds. Prior to joining GSAM, Mr.Gupta was a leader of reinsurance broker Benfield's alternative capacity and credit risk solutions efforts. Prior to joining Benfield in April 2003, Mr.Gupta was head of business development and strategic planning at Inreon, a reinsurance trading platform co-sponsored by Swiss Re and Munich Re, and a management consultant for McKinsey & Company. Mr. Gupta graduated from University of Waterloo with a Bachelor of Applied Science in Electrical Engineering.
Daniel V. Malloy -
Mr. Malloy is our Executive Vice President-Underwriting, and has served in that position since January 23, 2012. Prior to joining the Company, Mr. Malloy worked at Aon Benfield from 2003 where he co-led the Specialty Lines practice groups, which were responsible for providing clients and brokers with primary and reinsurance market updates, peer analytics, new product ideas, growth initiatives and placement assistance. Specialty Lines includes the casualty, professional liability, surety, workers' compensation, property risk, environmental, structured reinsurance and MGA practices. Mr.Malloy has almost 33 years of reinsurance experience including 10 years of structured reinsurance underwriting. Before joining Aon Benfield, he was President and a board member of Stockton Reinsurance Ltd. in Bermuda from 1998 to 2003. His experience with structured reinsurance began when he served as President of Centre Re Bermuda where he was employed from 1993 to 1998. Mr.Malloy began his reinsurance career in 1981 working as a reinsurance broker for Sedgwick Re for twelve years. Mr.Malloy holds a Bachelor of Arts degree in biology from Dartmouth College.
Tonya L. Marshall -
Ms. Marshall is our Executive Vice President, General Counsel and Secretary, and she has served in that position since February 13, 2012. She is responsible for the group legal function and acts as our corporate secretary. Prior to joining the Company, Ms. Marshall was the General Counsel and Board Secretary for The Bank of N.T. Butterfield & Son Limited, an international banking, asset and wealth management group headquartered in Bermuda, where she was responsible for the group’s legal function and acted as corporate secretary to the group’s holding company from November 2008 to January 2012. Prior to joining Butterfield in 2008, Ms. Marshall was employed by the international law firm of Conyers Dill & Pearman Limited ("Conyers") from September 1998 to August 2008, where her practice included all aspects of corporate and commercial law with a particular focus on public company
69
and insurance/reinsurance company matters. In the course of her employment with Conyers, Ms. Marshall also served as a director or alternative director to various Bermuda companies for which Conyers provided legal advice, corporate secretarial and registered office services. Ms. Marshall holds a B.Comm from Dalhousie University, an LL.B. from the University of Buckingham and a Diploma in Legal Practice from the Oxford Institute of Legal Practice.
Michael McKnight -
Mr. McKnight was our Chief Actuary and Chief Risk Officer and served in these positions from February 1, 2012 until November 2014. He was the Chief Actuary of Reinsurance for Alterra Capital Holdings Limited (previously known as "Max Capital Group Ltd.") from August 2004 until September 2010. In that position, he reviewed and approved new and renewal reinsurance transactions, analyzed all bound reinsurance contracts and projected ultimate loss and reserve values, and maintained and updated the company’s Return on Equity (ROE) models. Prior to Alterra, Mr. McKnight was Managing Director & Chief Underwriting Officer of Gerling Global International Reinsurance Co. Ltd. (Barbados). In addition to his underwriting duties, he completed loss and expense actuarial reserve studies on all bound business, and set reserves at required levels. From July 1994 until August 2001, Mr. McKnight was a Consulting Actuary and Profit Center Manager for the actuarial firm of Milliman, USA. He worked on a wide variety of actuarial projects, including pricing, reserving, mergers and acquisitions and Dynamic Financial Analysis. He worked in the Atlanta and London offices, before taking over the Bermuda practice in February 1998. Mr. McKnight began his actuarial career in 1985 at Atlanta International Insurance Company (an Alexander & Alexander company - now Aon). He also worked at two personal lines companies (Integon & Direct Response Group) where he was responsible for pricing and reserving for a variety of books, including auto, homeowners and warranty. Mr. McKnight has a Bachelor of Science in Applied Mathematics from Valdosta State University. He is an Associate of the Casualty Actuarial Society and a Member of the American Academy of Actuaries. He is the former president of the Casualty Actuaries of Bermuda. Mr. McKnight retired on November 5, 2014.
Jonathan Norton -
Mr. Norton serves as the Chief Reserving Actuary of Third Point Reinsurance Ltd. and as Chief Actuary of Third Point Reinsurance (USA) Ltd. Prior to joining Third Point Reinsurance Ltd. in December 2014, Mr. Norton served as Chief Actuary of Alterra Reinsurance USA Inc. from its inception in May 2010 until completion of the Markel acquisition in May 2013. Mr. Norton was previously Chief Actuary of Harbor Point Services, Inc. from its inception in December 2005 until its merger with Max Capital in May 2010. Mr. Norton was the Chief Actuary of Chubb Re, Inc. from June 1999 through the creation of Harbor Point Services, Inc. in December 2005. Prior to Chubb Re, Mr. Norton worked for the actuarial and analytical unit within Guy Carpenter from 1988 to 1999 where he was a Managing Director and held the position of Chief Actuary. Mr. Norton also has prior experience within the consulting arms of PricewaterhouseCoopers and Ernst & Young (1981 - 1988). Mr. Norton holds a Bachelor's Degree in Civil Engineering from Duke University and a MBA from Emory University.
Anthony Urban -
In 2014, Mr. Urban served as our Executive Vice President - Underwriting, which position he held from inception of the Company until February 28, 2015. With effect from March 1, 2015, Mr. Urban will join Third Point Reinsurance (USA) Ltd. as Chief Underwriting Officer. He is the former President and Chief Executive Officer of JRG Reinsurance Company, Ltd. ("JRG Re"), a Bermuda based reinsurance company which he helped establish in January 2008 with an initial capitalization of $250 million. Prior to JRG Re, from December 2002 to July 2007, Mr. Urban was the Chief Underwriting Officer and Head of Reinsurance Operations of Endurance Reinsurance Corporation of America. Prior to Endurance, from November 2000 to November 2002, Mr. Urban served as the Executive Vice President and Chief Underwriting Officer of AXA Corporate Solutions Reinsurance Company ("AXA"), where he managed a reinsurance portfolio of approximately $500 million in premium and a program book of business of approximately $300 million in premium. Prior to AXA, from June 1986 to October 2000, Mr. Urban was employed as a Senior Vice President and Chief Production Officer at Constitution Reinsurance Corporation. Mr. Urban started his career as a Pricing Analyst at North American Reinsurance (Swiss Re) in September 1983. Mr. Urban has a Bachelor of Arts degree from Dartmouth College.
Thomas C. Wafer -
Mr. Wafer is the President and a Director of Third Point Reinsurance (USA) Ltd. and has served in this position since December 1, 2014. Prior to joining Third Point Re, Mr. Wafer served as Chairman of Global Reinsurance for Alterra from March 2012 until the close of the Markel transaction in May 2013. Mr. Wafer was previously the Chief Executive Officer of Reinsurance and President for Alterra Reinsurance USA Inc. from July 2011 until March 2012. Mr. Wafer was President of Harbor Point Re U.S. and Harbor Point Services, Inc. since November 2009. From December 2005 until November 2009 he was Managing Director of International Underwriting for Harbor Point Re Limited and New Point Re in Bermuda. From September 1998 until December 2005 he was Managing Director
70
of International Underwriting and Marketing at Chubb Re, Inc. From July 1980 until September 1998 Mr. Wafer held various positions for Willcox, Inc. and Guy Carpenter, most recently as Managing Director and head of the International Division of Guy Carpenter New York. From 1979 to 1980 he was an underwriter in the Commercial Property Division, Chubb Group of Insurance Companies. Mr. Wafer attended Manhattanville College where he earned a BA in Economics. He also holds an MBA in Marketing from Fordham University.
71
Market Information
Our common shares began trading on the NYSE on August 15, 2013. On February 25, 2015, the latest practicable date, the last reported sale price of our common shares was $13.92 per share and there were 87 holders of our common shares. This number does not include shareholders for whom our shares were held in “street” name.
The following table sets forth, for the periods indicated, the high and low sales price per share of our common shares as reported by the NYSE:
|
2014
|
High
|
Low
|
|
1st Quarter
|
$18.26
|
$15.00
|
|
2nd Quarter
|
$16.84
|
$14.77
|
|
3rd Quarter
|
$16.02
|
$14.55
|
|
4th Quarter
|
$15.35
|
$13.77
|
|
Fiscal 2013
|
High
|
Low
|
|
3rd Quarter (starting on August 15, 2013)
|
$14.58
|
$12.88
|
|
4th Quarter
|
$18.71
|
$14.44
|
Dividends
We do not currently expect to declare or pay dividends on our common shares for the foreseeable future. Instead, we intend to retain earnings to finance the growth and development of our business and for working capital and general corporate purposes. Any payment of dividends will be at the discretion of our board of directors and will depend upon various factors then existing, including earnings, financial condition, results of operations, capital requirements, level of indebtedness, contractual restrictions with respect to payment of dividends, restrictions imposed by applicable law, general business conditions and other factors that our board of directors may deem relevant. See “Management’s Discussion and Analysis of Financial Condition and Results of Operations-Liquidity and Capital Resources.” In addition, under the Companies Act, we may not declare or pay a dividend if there are reasonable grounds for believing that we are, or would after the payment be, unable to pay our liabilities as they become due or that the realized value of our assets would thereafter be less than our liabilities.
Recent Sales of Unregistered Securities
None.
Issuer Purchases of Equity Securities
None.
72
Equity Compensation Plans
The following table presents information concerning the securities authorized for issuance pursuant to our equity compensation plans as of December 31, 2014:
|
Number of Securities to Be Issued Upon Exercise of Outstanding Options Warrants and Rights (1)
|
Weighted Average Exercise Price of Outstanding Options, Warrants and Rights (2)
|
Number of Securities Available for Future Issuance Under Equity Compensation Plans (excluding Securities Reflected in Column 1)
|
|||||
|
Equity compensation plans approved by shareholders
|
10,990,841
|
|
$13.41
|
10,052,579
|
|
||
|
Equity compensation plans not approved by shareholders
|
—
|
|
N/A
|
—
|
|
||
|
Total
|
10,990,841
|
|
$13.41
|
10,052,579
|
|
||
|
(1) Represents the number of shares associated with options outstanding as of December 31, 2014.
|
|||||||
|
(2) Represents the weighted average exercise price of options disclosed
|
|||||||
|
(3) Represents the number of shares remaining available for issuance with respect to future awards under our Omnibus
Equity Incentive Plan.
|
|||||||
Performance
The following graph compares the cumulative total shareholder return on our common shares from the date of the Company’s initial public offering on August 15th, 2013 through to December 31, 2014 to the cumulative total return of (1) S&P 500 Composite Stock Index (“S&P 500 Index”) and (2) the Dow Jones Property & Casualty Insurance Index. The share price performance presented below is not necessarily indicative of future results.
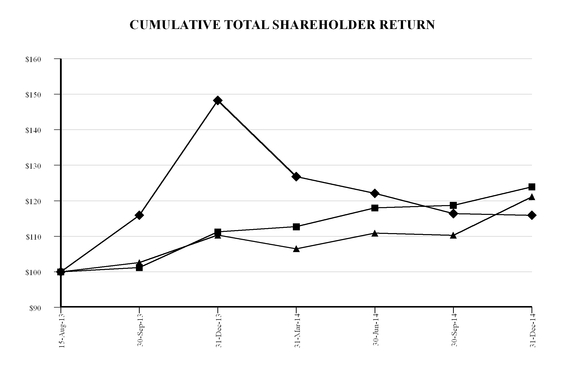
73
|
Base Period
|
|||||||||||||||||||||
|
Company Name/Index
|
15-Aug-13
|
30-Sep-13
|
31-Dec-13
|
31-Mar-14
|
30-Jun-14
|
30-Sep-14
|
31-Dec-14
|
||||||||||||||
|
t
Third Point Reinsurance Ltd - TPRE
|
$
|
100.00
|
|
$
|
115.92
|
|
$
|
148.24
|
|
$
|
126.80
|
|
$
|
122.08
|
|
$
|
116.40
|
|
$
|
115.97
|
|
|
■
S&P 500 Index
|
$
|
100.00
|
|
$
|
101.22
|
|
$
|
111.26
|
|
$
|
112.70
|
|
$
|
117.99
|
|
$
|
118.72
|
|
$
|
123.93
|
|
|
p
Dow Jones U.S. P & C Insurance Index
|
$
|
100.00
|
|
$
|
102.60
|
|
$
|
110.31
|
|
$
|
106.50
|
|
$
|
110.87
|
|
$
|
110.30
|
|
$
|
121.12
|
|
|
1.
|
The above graph assumes that the value of the investment was $100 on August 15, 2013.
|
|
2.
|
This graph is not “soliciting material,” is not deemed filed with the SEC and is not to be incorporated by reference in any filing by us under the Securities Act of 1933 or the Securities and Exchange Act of 1934, whether made before or after the date hereof and irrespective of any general incorporation language in any such filing.
|
The selected consolidated statements of operations data for the fiscal years ended December 31, 2014, 2013, 2012 and the period from October 6, 2011 (date of incorporation) to December 31, 2011, and the selected consolidated balance sheet data as of December 31, 2014, 2013, 2012 and 2011 have been derived from our audited consolidated financial statements. Our historical results are not necessarily indicative of the results that may be expected for any future period. The selected financial data should be read in conjunction with Part II, Item 7. “Management’s Discussion and Analysis of Financial Condition and Results of Operations” and our consolidated financial statements and related notes included elsewhere in this Annual Report.
74
|
2014
|
2013
|
2012
|
2011
|
|||||||||||||
|
(In thousands, except share and per share data)
|
||||||||||||||||
|
Selected Statement of Income Data:
|
||||||||||||||||
|
Gross premiums written
|
$
|
613,300
|
|
$
|
401,937
|
|
$
|
190,374
|
|
$
|
—
|
|
||||
|
Gross premiums ceded
|
(150
|
)
|
(9,975
|
)
|
—
|
|
—
|
|
||||||||
|
Net premiums written
|
613,150
|
|
391,962
|
|
190,374
|
|
—
|
|
||||||||
|
Change in net unearned premium reserves
|
(168,618
|
)
|
(171,295
|
)
|
(93,893
|
)
|
—
|
|
||||||||
|
Net premiums earned
|
444,532
|
|
220,667
|
|
96,481
|
|
—
|
|
||||||||
|
Net investment income
|
85,582
|
|
258,125
|
|
136,868
|
|
—
|
|
||||||||
|
Total revenues
|
530,114
|
|
478,792
|
|
233,349
|
|
—
|
|
||||||||
|
Loss and loss adjustment expenses incurred, net
|
283,147
|
|
139,812
|
|
80,306
|
|
—
|
|
||||||||
|
Acquisition costs, net
|
137,206
|
|
67,944
|
|
24,604
|
|
—
|
|
||||||||
|
General and administrative expenses
|
40,008
|
|
33,036
|
|
27,376
|
|
1,130
|
|
||||||||
|
Other expenses (1)
|
7,395
|
|
4,922
|
|
446
|
|
—
|
|
||||||||
|
Total expenses
|
467,756
|
|
245,714
|
|
132,732
|
|
1,130
|
|
||||||||
|
Income (loss) before income tax expense
|
62,358
|
|
233,078
|
|
100,617
|
|
(1,130
|
)
|
||||||||
|
Income tax expense
|
(5,648
|
)
|
|
|
—
|
|
|
|
||||||||
|
Income (loss) including non-controlling interests
|
56,710
|
|
233,078
|
|
100,617
|
|
(1,130
|
)
|
||||||||
|
Income (loss) attributable to non-controlling interests
|
(6,315
|
)
|
(5,767
|
)
|
(1,216
|
)
|
—
|
|
||||||||
|
Net income (loss)
|
$
|
50,395
|
|
$
|
227,311
|
|
$
|
99,401
|
|
$
|
(1,130
|
)
|
||||
|
Earnings (loss) per share (2):
|
||||||||||||||||
|
Basic
|
$
|
0.48
|
|
$
|
2.58
|
|
$
|
1.26
|
|
$
|
(0.01
|
)
|
||||
|
Diluted
|
$
|
0.47
|
|
$
|
2.54
|
|
$
|
1.26
|
|
$
|
(0.01
|
)
|
||||
|
Weighted average number of common shares:
|
||||||||||||||||
|
Basic
|
103,287,693
|
|
87,505,540
|
|
78,432,132
|
|
78,432,132
|
|
||||||||
|
Diluted
|
106,391,058
|
|
88,970,531
|
|
78,598,236
|
|
78,432,132
|
|
||||||||
|
Property and Casualty Reinsurance Segment - Selected Ratios (3):
|
||||||||||||||||
|
Loss ratio (4)
|
65.5
|
%
|
65.7
|
%
|
83.2
|
%
|
n/a
|
|||||||||
|
Acquisition cost ratio (5)
|
31.5
|
%
|
31.5
|
%
|
25.5
|
%
|
n/a
|
|||||||||
|
General and administrative expense ratio (6)
|
5.2
|
%
|
10.3
|
%
|
21.0
|
%
|
n/a
|
|||||||||
|
Combined ratio (7)
|
102.2
|
%
|
107.5
|
%
|
129.7
|
%
|
n/a
|
|||||||||
|
Net investment return on investments managed by TP LLC (8)
|
5.1
|
%
|
23.9
|
%
|
17.7%
|
|
n/a
|
|||||||||
(1) Prior to 2014, deposit liabilities and reinsurance contracts investment expense and changes in estimated fair value of embedded derivatives were recorded in net investment income. As these amounts have become more prominent, the presentation has been modified and deposit liabilities and reinsurance contracts investment expense and changes in the estimated fair value of embedded derivatives are now recorded in other expenses in the consolidated statements of income (loss). As a result, investment expenses of $4.9 million and $0.4 million, that were previously reported in net investment income for the years ended December 31, 2013 and 2012, respectively, are now being reported in other expenses to conform to the current year’s presentation.
(2) Basic earnings per share is based on the weighted average number of common shares and participating securities outstanding during the period. The weighted average number of common shares excludes any dilutive effect of outstanding warrants, options and convertible securities such as unvested restricted shares. Diluted earnings per share are based on the weighted average number of common shares and share equivalents including any dilutive effects of warrants, options and other awards under stock plans using the treasury stock method. U.S. GAAP requires that unvested share awards that contain non-forfeitable rights to dividends or dividend equivalents, whether paid or unpaid (referred to as ‘’participating securities”), be included in the number of shares outstanding for both basic and diluted earnings per share calculations. We treat certain of our unvested restricted stock as participating securities. In the event of a net loss, the participating securities are excluded from the calculation of both basic and diluted loss per share.
(3) Underwriting ratios are for the property and casualty reinsurance segment only. See additional information in
Note 22
of the Notes to Consolidated Financial Statements.
(4) Loss ratio is calculated by dividing loss and loss adjustment expenses incurred, net, by net premiums earned.
(5) Acquisition cost ratio is calculated by dividing acquisition costs, net by net premiums earned.
75
(6) General and administrative expense ratio is calculated by dividing general and administrative expenses related to underwriting activities by net premiums earned.
(7) Combined ratio is calculated by dividing the sum of loss and loss adjustment expenses incurred, net, acquisition costs, net and general and administrative expenses related to underwriting activities by net premiums earned.
(8) The net investment return on investments managed by Third Point LLC is the percentage change in value of a dollar invested over the reporting period on our investment assets managed by Third Point LLC, net of non-controlling interest. The stated return is net of withholding taxes, which are presented as a component of income tax expense in our consolidated statements of income. Net investment return is the key indicator by which we measure the performance of Third Point LLC, our investment manager.
76
|
2014
|
2013
|
2012
|
2011
|
|||||||||||||
|
(In thousands, except per share data)
|
||||||||||||||||
|
Selected Balance Sheet Data:
|
||||||||||||||||
|
Total investments in securities and commodities
|
$
|
1,830,838
|
|
$
|
1,460,864
|
|
$
|
937,690
|
|
$
|
—
|
|
||||
|
Cash and cash equivalents (1)
|
28,734
|
|
31,625
|
|
34,005
|
|
603,841
|
|
||||||||
|
Restricted cash and cash equivalents
|
417,307
|
|
193,577
|
|
77,627
|
|
—
|
|
||||||||
|
Securities purchased under and agreement to sell
|
29,852
|
|
38,147
|
|
60,408
|
|
—
|
|
||||||||
|
Reinsurance balances receivable, net
|
303,649
|
|
191,763
|
|
84,280
|
|
—
|
|
||||||||
|
Deferred acquisition costs, net
|
155,901
|
|
91,193
|
|
45,383
|
|
—
|
|
||||||||
|
Loss and loss adjustment expenses recoverable
|
814
|
|
9,277
|
|
—
|
|
—
|
|
||||||||
|
Total assets
|
2,852,580
|
|
2,159,890
|
|
1,402,017
|
|
605,263
|
|
||||||||
|
Reinsurance balances payable
|
27,040
|
|
9,081
|
|
—
|
|
—
|
|
||||||||
|
Deposit liabilities (2)
|
145,430
|
|
120,946
|
|
50,446
|
|
—
|
|
||||||||
|
Unearned premium reserves
|
433,809
|
|
265,187
|
|
93,893
|
|
—
|
|
||||||||
|
Loss and loss adjustment expense reserves
|
277,362
|
|
134,331
|
|
67,271
|
|
—
|
|
||||||||
|
Total liabilities
|
1,300,532
|
|
649,494
|
|
473,696
|
|
19,838
|
|
||||||||
|
Shareholders’ equity attributable to shareholders (3)
|
1,451,913
|
|
1,391,661
|
|
868,544
|
|
585,425
|
|
||||||||
|
Non-controlling interests
|
100,135
|
|
118,735
|
|
59,777
|
|
—
|
|
||||||||
|
Total shareholders’ equity
|
$
|
1,552,048
|
|
$
|
1,510,396
|
|
$
|
928,321
|
|
$
|
585,425
|
|
||||
|
Book value per share data:
|
||||||||||||||||
|
Book value per share (4)
|
$
|
14.04
|
|
$
|
13.48
|
|
$
|
11.07
|
|
$
|
9.73
|
|
||||
|
Diluted book value per share (5)
|
$
|
13.55
|
|
$
|
13.12
|
|
$
|
10.89
|
|
$
|
9.73
|
|
||||
|
Selected ratios:
|
||||||||||||||||
|
Growth in diluted book value per share (6)
|
3.3
|
%
|
20.5
|
%
|
11.9
|
%
|
n/a
|
|||||||||
|
Return on beginning shareholders’ equity (7)
|
3.6
|
%
|
23.4
|
%
|
13.0
|
%
|
n/a
|
|||||||||
(1) Cash and cash equivalents consists of cash held in banks and other short-term, highly liquid investments with original maturity dates of ninety days or less.
(2) Using the deposit method of accounting, a deposit liability, rather than written premium, is initially recorded based upon the consideration received less any explicitly identified premiums or fees. In subsequent periods, the deposit liability is adjusted by calculating the effective yield on the deposit to reflect actual payments to date and future expected payments.
(3) Shareholders’ equity attributable to shareholders and total shareholders’ equity as of December 31, 2011 is reflected net of subscriptions receivable of $177.5 million in accordance with SEC Regulation S-X.
(4) Book value per share is a non-GAAP financial measure. Book value per share is calculated by dividing shareholders’ equity attributable to shareholders, adjusted for subscriptions receivable, by the number of issued and outstanding shares at period end. See the reconciliation under “Management’s Discussion and Analysis of Financial Condition and Results of Operations - Book Value Per Share and Diluted Book Value Per Share.”
(5) Diluted book value per share is a non-GAAP financial measure. Diluted book value per share is calculated by dividing shareholders’ equity attributable to shareholders, adjusted for subscriptions receivable, and adjusted to include unvested restricted shares and the exercise of all in-the-money options and warrants. See the reconciliation under “Management’s Discussion and Analysis of Financial Condition and Results of Operations - Book Value Per Share and Diluted Book Value Per Share.”
(6) Growth in diluted book value per share is calculated by taking the change in diluted book value per share divided by the beginning of period diluted book value per share.
(7) Return on beginning shareholders’ equity as presented is a non-GAAP financial measure. Return on beginning shareholders’ equity is calculated by dividing net income by the beginning of year shareholders’ equity attributable to shareholders. For purposes of determining December 31, 2011 shareholders’ equity attributable to shareholders, we add back the impact of subscriptions receivable to shareholders’ equity attributable to shareholders. For the year ended December 31, 2013, we have also adjusted the beginning shareholders’ equity for the impact of the issuance of shares in our IPO on a weighted average basis. These adjustments lower the stated returns on beginning shareholders’ equity. See the reconciliation under “Management’s Discussion and Analysis of Financial Condition and Results of Operations - Return on Beginning Shareholders’ Equity.”
The following discussion and analysis is intended to help the reader understand our business, financial condition, results of operations, liquidity and capital resources. You should read this discussion in conjunction with Part II, Item 6. “Selected Financial Data”, and our consolidated financial statements and the related notes contained elsewhere in this Annual Report on Form 10-K for the fiscal year ended December 31, 2014 (“Annual Report”).
77
The statements in this discussion regarding business outlook, our expectations regarding our future performance, liquidity and capital resources and other non-historical statements in this discussion are forward-looking statements. These forward-looking statements are subject to numerous risks and uncertainties, including, but not limited to our Introductory Note to this Annual Report and the risks and uncertainties described in Part I, Item 1A “Risk Factors.” Our actual results may differ materially from those contained in or implied by any forward-looking statements.
Our fiscal year ends December 31 and, unless otherwise noted, references to years or fiscal are for fiscal years ended December 31.
Overview
We are a holding company domiciled in Bermuda. Through our reinsurance subsidiaries, we provide property and casualty reinsurance coverage to insurance and reinsurance companies on a worldwide basis. Our goal is to deliver attractive equity returns to shareholders by combining profitable reinsurance underwriting with superior investment management provided by Third Point LLC, our investment manager. We believe that our reinsurance and investment strategy differentiates us from our competitors.
We manage our business on the basis of two operating segments: Property and Casualty Reinsurance and Catastrophe Risk Management. We also have a corporate function that includes our net investment income on capital and certain general and administrative expenses related to corporate activities.
Property and Casualty Reinsurance
We provide reinsurance products to insurance and reinsurance companies, government entities, and other risk bearing vehicles. Contracts can be written on an excess of loss basis or quota share basis, although the majority of contracts written to date have been on a quota share basis. In addition, we write contracts on both a prospective basis and a retroactive basis. Prospective reinsurance contracts cover losses incurred as a result of future insurable events. Retroactive reinsurance contracts cover the potential for changes in estimates of loss and loss adjustment expense reserves related to loss events that have occurred in the past. Retroactive reinsurance contracts can be an attractive type of contract for us as they can generate an underwriting profit should the ultimate loss and loss adjustment expenses settle for less than the initial estimate of reserves and the premiums received at the inception of the contract generate insurance float. The product lines that we currently underwrite for this operating segment are: property, casualty and specialty. We assume a limited amount of catastrophe risk within the property and casualty segment. We anticipate that our property catastrophe exposures will consistently remain relatively low when compared to many other reinsurers with whom we compete.
In February 2015, we began reinsurance operations in the United States through Third Point Re USA, a Bermuda company licensed as a Class 4 insurer and a wholly owned operating subsidiary of TPRUSA. For future periods, the results of Third Point Re USA will be reflected in the results of the Property and Casualty Reinsurance segment. Third Point Re USA has not conducted any operations to date and TPRUSA’s only operations to date relate to accessing financing on behalf of Third Point Re USA. As a result, Third Point Re USA and TPRUSA have a limited operating history and are exposed to volatility in their results of operations. Period to period comparisons of their results of operations may not be meaningful. Third Point Re USA expects to provide reinsurance products that are substantially similar to the reinsurance products currently provided by Third Point Re. Third Point Re USA’s U.S. presence is a strategic component of our overall growth strategy. As a result of Third Point Re USA’s U.S. presence, we expect to strengthen our relationships with U.S. cedents and brokers. We also expect to develop a firsthand understanding of cedent underwriting and claims capabilities that will benefit our underwriting practices.
Insurance float is an important aspect of our property and casualty reinsurance operation. In an insurance or reinsurance operation, float arises because premiums from reinsurance contracts and consideration received for deposit accounted contracts are collected before losses are paid on reinsurance contracts and proceeds are returned on deposit accounting contracts. In some instances, the interval between cash receipts and payments can extend over many years. During this time interval, we invest the cash received and seek to generate investment returns. Although float can be calculated using numbers determined under U.S. GAAP, float is a non-GAAP financial measure and, therefore, there is no comparable U.S. GAAP measure.
78
We believe that our property and casualty reinsurance segment will contribute to our results by both generating underwriting income as well as generating float. In addition, we expect that float will grow over time as our reinsurance operations expand.
Catastrophe Risk Management
In contrast to many reinsurers with whom we compete, we have elected to limit our underwriting of property catastrophe exposures. On June 15, 2012, Third Point Reinsurance Opportunities Fund Ltd. (the “Catastrophe Fund”), Third Point Reinsurance Investment Management Ltd. (the “Catastrophe Fund Manager”), and Third Point Re Cat Ltd. (the “Catastrophe Reinsurer”) were incorporated in Bermuda. We subsequently announced a strategic arrangement with Hiscox Insurance Company (Bermuda) Limited (“Hiscox”) to launch a collateralized catastrophe reinsurance underwriting fund management business through these entities. The Catastrophe Fund Manager, a Bermuda exempted company, is the investment manager of the Catastrophe Fund. In December 2014, we announced that we would no longer accept investments in the Catastrophe Fund, that no new business would be written in the Catastrophe Reinsurer and that we would be redeeming all existing investments in the Catastrophe Fund. Despite the Catastrophe Fund’s solid investment returns from its inception, we are winding it down due to challenging market conditions and competition with other collateralized reinsurance and insurance-liked securities vehicles. Catastrophe reinsurance pricing and the fees available to manage catastrophe risk have decreased significantly in the past two years. The Catastrophe Fund Manager will continue to manage the runoff of the remaining exposure in the Catastrophe Fund.
As of
December 31, 2014
, the Catastrophe Fund had a net asset value of
$119.7 million
(
December 31, 2013
-
$104.0 million
), and our investment in the Catastrophe Fund was
$59.5 million
(December 31, 2013 -
$54.8 million
). There are no additional guarantees by us and no recourse to us beyond this investment.
Investment Management
Our investment strategy is implemented by our investment manager, Third Point LLC, under a long-term investment management contract. We directly own the investments that are held in a separate account and managed by Third Point LLC on substantially the same basis as Third Point LLC’s main hedge funds
.
Limited Operating History and Comparability of Results
We were incorporated on October 6, 2011 and completed our initial capitalization on December 22, 2011. We began underwriting business on January 1, 2012. We completed an initial public offering of common shares on August 20, 2013 (the “IPO”). As a result, we have a limited operating history and are exposed to volatility in our results of operations. Period to period comparisons of our results of operations may not be meaningful.
In addition, the amount of premiums written may vary from year to year and from period to period as a result of several factors, including changes in market conditions and our view of the long-term profit potential of individual lines of business.
Non-GAAP Financial Measures
We have included financial measures that are not calculated under standards or rules that comprise GAAP. Such measures, including net investment income on float, book value per share, diluted book value per share and return on beginning shareholders’ equity, are referred to as non-GAAP financial measures. These non-GAAP financial measures may be defined or calculated differently by other companies. We believe these measures allow for a more complete understanding of the underlying business. These measures are used to monitor our results and should not be viewed as a substitute for those determined in accordance with GAAP. Reconciliations of such measures to the most comparable GAAP figures are referenced below.
Key Performance Indicators
We believe that by combining a disciplined and opportunistic approach to reinsurance underwriting with investment results from the active management of our investment portfolio, we will be able to generate attractive returns for our shareholders. The key financial measures that we believe are most meaningful in analyzing our performance
79
are: net underwriting income (loss) for our property and casualty reinsurance segment, combined ratio for our property and casualty reinsurance segment, net investment income, net investment return on investments managed by Third Point LLC, book value per share, diluted book value per share, growth in diluted book value per share and return on beginning shareholders’ equity.
The table below shows the key performance indicators for our consolidated business for the years ended
December 31, 2014
,
2013
and
2012
:
|
2014
|
2013
|
2012
|
|||||||||
|
(In thousands, except for per share data and ratios)
|
|||||||||||
|
Key underwriting metrics for Property and Casualty Reinsurance segment:
|
|||||||||||
|
Net underwriting loss (1)
|
$
|
(9,552
|
)
|
$
|
(15,828
|
)
|
$
|
(28,719
|
)
|
||
|
Combined ratio (1)
|
102.2
|
%
|
107.5
|
%
|
129.7
|
%
|
|||||
|
Key investment return metrics:
|
|||||||||||
|
Net investment income
|
$
|
85,582
|
|
$
|
258,125
|
|
$
|
136,868
|
|
||
|
Net investment return on investments managed by Third Point LLC
|
5.1
|
%
|
23.9
|
%
|
17.7
|
%
|
|||||
|
Key shareholders’ value creation metrics:
|
|||||||||||
|
Book value per share (2)
|
$
|
14.04
|
|
$
|
13.48
|
|
$
|
11.07
|
|
||
|
Diluted book value per share (2)
|
$
|
13.55
|
|
$
|
13.12
|
|
$
|
10.89
|
|
||
|
Growth in diluted book value per share (2)
|
3.3
|
%
|
20.5
|
%
|
11.9
|
%
|
|||||
|
Return on beginning shareholders’ equity (3)
|
3.6
|
%
|
23.4
|
%
|
13.0
|
%
|
|||||
(1) See
Note 22
to the accompanying consolidated financial statements for an explanation and calculation of net underwriting loss and combined ratio.
(2) Book value per share and diluted book value per share are non-GAAP financial measures. See reconciliation below for calculation of book value per share and diluted book value per share.
(3) Return on beginning shareholders’ equity is a non-GAAP financial measure. See reconciliation below for calculation of return on beginning shareholders’ equity.
Net Underwriting Income (Loss) for Property and Casualty Reinsurance Segment
One way that we evaluate the performance of our property and casualty reinsurance results is by measuring net underwriting income or loss. We do not measure performance based on the amount of gross premiums written. Net underwriting income or loss is calculated from net premiums earned, less net loss and loss adjustment expenses, acquisition costs and general and administrative expenses related to the underwriting activities.
Combined Ratio for Property and Casualty Reinsurance Segment
Combined ratio is calculated by dividing the sum of loss and loss adjustment expenses incurred, net, acquisition costs, net and general and administrative expenses related to underwriting activities by net premiums earned. The combined ratio compares the amount of net premiums earned to the amount incurred in claims and underwriting related expenses. This ratio is a key indicator of a reinsurance company’s profitability. A combined ratio greater than 100% means that loss and loss adjustment expenses, acquisition costs and general and administrative expenses related to underwriting activities exceeded net premiums earned. See additional information in Note 22 to our consolidated financial statements.
Net Investment Income
Net investment income is an important measure that affects overall profitability. Net investment income is affected by the performance of Third Point LLC as our exclusive investment manager and the amount of investable cash, or float, generated by our reinsurance operation. Pursuant to our investment management agreements, Third Point LLC
80
is required to manage our investment portfolio on substantially the same basis as its main hedge funds, subject to certain conditions set forth in our investment guidelines. These conditions include limitations on investing in private securities, a limitation on portfolio leverage, and a limitation on portfolio concentration in individual securities. Our investment management agreements allow us to withdraw cash from our investment account with Third Point LLC at any time with three days’ notice to pay claims and with five days’ notice to pay expenses.
We track excess cash flows generated by our property and casualty reinsurance operation, or float, in a separate account that allows us to also track the net investment income generated on the float. We believe that net investment income generated on float is an important consideration in evaluating the overall contribution of our property and casualty reinsurance operation to our consolidated results. It is also explicitly considered as part of the evaluation of management’s performance for purposes of incentive compensation. Net income on float as presented is a non-GAAP financial measure. See the table below for a reconciliation of net investment income on float to net investment income.
Net investment income for the years ended
December 31, 2014
,
2013
and
2012
was comprised of the following:
|
2014
|
2013
|
2012
|
||||||||||
|
($ in thousands)
|
||||||||||||
|
Net investment income on float
|
$
|
11,305
|
|
$
|
26,953
|
|
$
|
4,901
|
|
|||
|
Net investment income on capital
|
73,050
|
|
226,751
|
|
131,967
|
|
||||||
|
Net investment income on investments managed by Third Point LLC
|
84,355
|
|
253,704
|
|
136,868
|
|
||||||
|
Net investment income on cash collateral held by the Catastrophe Reinsurer
|
101
|
|
86
|
|
—
|
|
||||||
|
Net gain on reinsurance contract derivatives written by the Catastrophe Reinsurer
|
982
|
|
4,335
|
|
—
|
|
||||||
|
Net gain on catastrophe bond held by the Catastrophe Reinsurer
|
144
|
|
—
|
|
—
|
|
||||||
|
Net investment income
|
$
|
85,582
|
|
$
|
258,125
|
|
$
|
136,868
|
|
|||
Prior to 2014, deposit liabilities and reinsurance contracts investment expense and changes in the estimated fair value of embedded derivatives were recorded in net investment income. As these amounts have become more prominent, the presentation has been modified, and deposit liabilities and reinsurance contracts investment expense and changes in the estimated fair value of embedded derivatives are now recorded in other expenses in the condensed consolidated statements of income. As a result, investment expenses of $4.9 million and $0.4 million that were previously reported in net investment income for the years ended December 31, 2013 and 2012, respectively, are now reported in other expenses to conform to the current period’s presentation.
Net Investment Return on Investments Managed by Third Point LLC
Net investment return represents the return on our investments managed by Third Point LLC, net of fees. The net investment return on investments managed by Third Point LLC is the percentage change in value of a dollar invested over the reporting period on our investment assets managed by Third Point LLC, net of non-controlling interest. The stated return is net of withholding taxes, which are presented as a component of income tax expense in our consolidated statements of income. Net investment return is the key indicator by which we measure the performance of Third Point LLC, our investment manager.
Return on Beginning Shareholders’ Equity
Return on beginning shareholders’ equity as presented is a non-GAAP financial measure. Return on beginning of year shareholders’ equity is calculated by dividing net income by the beginning shareholders’ equity attributable to shareholders. For purposes of determining December 31, 2011 shareholders’ equity attributable to shareholders, we add back the impact of subscriptions receivable to shareholders’ equity attributable to shareholders. For the year ended December 31, 2013, we have also adjusted the beginning shareholders’ equity for the impact of the issuance of shares in our IPO on a weighted average basis. These adjustments lower the stated returns on beginning shareholders’ equity. We believe this metric is used by investors to supplement measures of our profitability.
81
Return on beginning shareholders’ equity for the years ended
December 31, 2014
,
2013
and
2012
was calculated as follows:
|
2014
|
2013
|
2012
|
||||||||||
|
($ in thousands)
|
||||||||||||
|
Net income
|
$
|
50,395
|
|
$
|
227,311
|
|
$
|
99,401
|
|
|||
|
Shareholders’ equity attributable to shareholders - beginning of period
|
1,391,661
|
|
868,544
|
|
585,425
|
|
||||||
|
Subscriptions receivable
|
—
|
|
—
|
|
177,507
|
|
||||||
|
Impact of weighting related to shareholders’ equity from IPO
|
—
|
|
104,502
|
|
—
|
|
||||||
|
Adjusted shareholders’ equity attributable to shareholders - beginning of period
|
$1,391,661
|
$
|
973,046
|
|
$
|
762,932
|
|
|||||
|
Return on beginning shareholders’ equity
|
3.6
|
%
|
23.4
|
%
|
13.0
|
%
|
||||||
Book Value Per Share and Diluted Book Value Per Share
Book value per share and diluted book value per share are non-GAAP financial measures. Book value per share is calculated by dividing shareholders’ equity attributable to shareholders, adjusted for subscriptions receivable, by the number of issued and outstanding shares at period end. Diluted book value per share is calculated by dividing shareholders’ equity attributable to shareholders, adjusted for subscriptions receivable, and adjusted to include unvested restricted shares and the exercise of all in-the-money options and warrants. For unvested restricted shares with a performance condition, we include the unvested restricted shares that we consider vesting to be probable. Prior to TPRE’s initial public offering, the market share price was assumed to be equal to the fully diluted book value per share. We believe that long-term growth in diluted book value per share is the most important measure of our financial performance because it allows our management and investors to track over time the value created by the retention of earnings. In addition, we believe this metric is used by investors because it provides a basis for comparison with other companies in our industry that also report a similar measure.
For the year ended
December 31, 2014
, book value per share increased by $
0.56
per share, or
4.2%
, to
$14.04
per share from
$13.48
per share as of
December 31, 2013
. For the year ended December 31, 2013, book value per share increased by $2.41 per share, or 21.8%, to $13.48 per share from $11.07 per share as of December 31, 2012.
For the year ended
December 31, 2014
, diluted book value per share increased by $
0.43
per share, or
3.3%
, to
$13.55
per share from
$13.12
per share as of
December 31, 2013
. For the year ended December 31, 2013, diluted book value per share increased by $2.23 per share, or 20.5%, to $13.12 per share from $10.89 per share as of December 31, 2012.
The increase in basic and diluted book value per share for the year ended December 31, 2014 compared to the year ended December 31, 2013 was primarily due to net income during the year. The increase in basic and diluted book value per share for the year ended December 31, 2013 compared to the year ended December 31, 2012 was driven primarily by net income partially offset by the offering costs incurred with our IPO.
The growth in diluted book value per share in both years was also impacted by warrants and share compensation issued to our Founders, employees, directors and an advisor, including the additional warrants and options that became exercisable as a result of meeting the performance condition after the IPO.
82
The following table sets forth the computation of basic and diluted book value per share as of
December 31, 2014
, 2013 and 2012:
|
2014
|
2013
|
2012
|
|||||||||
|
Basic and diluted book value per share numerator:
|
(In thousands, except share and per share amounts)
|
||||||||||
|
Total shareholders’ equity
|
$
|
1,552,048
|
|
$
|
1,510,396
|
|
$
|
928,321
|
|
||
|
Less: non-controlling interests
|
(100,135
|
)
|
(118,735
|
)
|
(59,777
|
)
|
|||||
|
Shareholders’ equity attributable to shareholders
|
1,451,913
|
|
1,391,661
|
|
868,544
|
|
|||||
|
Effect of dilutive warrants issued to Founders and an advisor
|
46,512
|
|
46,512
|
|
36,480
|
|
|||||
|
Effect of dilutive share options issued to directors and employees
|
61,705
|
|
101,274
|
|
51,670
|
|
|||||
|
Diluted book value per share numerator:
|
$
|
1,560,130
|
|
$
|
1,539,447
|
|
$
|
956,694
|
|
||
|
Basic and diluted book value per share denominator:
|
|
||||||||||
|
Issued and outstanding shares
|
103,397,542
|
|
103,264,616
|
|
78,432,132
|
|
|||||
|
Effect of dilutive warrants issued to Founders and an advisor
|
4,651,163
|
|
4,651,163
|
|
3,648,006
|
|
|||||
|
Effect of dilutive share options issued to directors and employees
|
6,151,903
|
|
8,784,861
|
|
5,167,045
|
|
|||||
|
Effect of dilutive restricted shares issued to directors and employees (1)
|
922,610
|
|
657,156
|
|
619,300
|
|
|||||
|
Diluted book value per share denominator:
|
115,123,218
|
|
117,357,796
|
|
87,866,483
|
|
|||||
|
|
|
||||||||||
|
Basic book value per share
|
$
|
14.04
|
|
$
|
13.48
|
|
$
|
11.07
|
|
||
|
Diluted book value per share
|
$
|
13.55
|
|
$
|
13.12
|
|
$
|
10.89
|
|
||
(1) As of December 31, 2014, the effect of dilutive restricted shares issued to directors and employees was comprised of
616,114
of restricted shares with a service condition only and 306,496 restricted shares with a service and performance condition that were considered probable of vesting.
Revenues
We derive our revenues from two principal sources:
|
•
|
premiums from property and casualty reinsurance business assumed; and
|
|
•
|
income from investments.
|
Premiums from our property and casualty reinsurance business assumed are directly related to the number, type and pricing of contracts we write. Premiums are earned over the contract period based on the exposure period of the underlying contracts of the ceding company.
Income from our investments is primarily comprised of interest income, dividends, and net realized and unrealized gains on investment securities included in our investment portfolio.
Expenses
Our expenses consist primarily of the following:
|
•
|
loss and loss adjustment expenses;
|
|
•
|
acquisition costs;
|
|
•
|
investment-related expenses; and
|
|
•
|
general and administrative expenses.
|
Loss and loss adjustment expenses are a function of the amount and type of reinsurance contracts we write and loss experience of the underlying coverage. Loss and loss adjustment expenses are based on an actuarial analysis of the estimated losses, including losses incurred during the period and changes in estimates from prior periods. Depending on the nature of the contract, loss and loss adjustment expenses may be paid over a number of years.
83
Acquisition costs consist primarily of brokerage fees, ceding commissions, premium taxes and other direct expenses that relate to our writing reinsurance contracts and are presented net of commissions ceded under reinsurance contracts. We amortize deferred acquisition costs in the same proportion that the premiums are earned.
Investment-related expenses primarily consist of management fees we pay to our investment manager, Third Point LLC, and certain of our Founders, pursuant to our investment management agreements and performance fees we pay to Third Point Advisors LLC. A 2% management fee calculated on assets under management is paid monthly to Third Point LLC and certain of our Founders, and a performance fee equal to 20% of the net investment income is paid annually to Third Point Advisors LLC. We include these expenses in net investment income in our consolidated statement of income.
General and administrative expenses consist primarily of salaries, benefits and related payroll costs, including costs associated with our incentive compensation plan, share compensation expenses, legal and accounting fees, travel and client entertainment, fees relating to our letter of credit facilities, information technology, occupancy and other general operating expenses.
Critical Accounting Policies and Estimates
See
Note 2
to our notes to consolidated financial statements included elsewhere in this Annual Report on Form 10-K for a summary of our significant accounting and reporting policies.
Our consolidated financial statements are prepared in accordance with U.S. GAAP, which requires management to make estimates and assumptions. We believe that the accounting policies that require the most significant judgments and estimations by management are (1) premium revenue recognition including evaluation of risk transfer, (2) loss and loss adjustment expense reserves, and (3) fair value measurements related to our investments. If actual events differ significantly from the underlying judgments or estimates used by management in the application of these accounting policies, there could be a material adverse effect on our results of operations and financial condition.
Premium Revenue Recognition including evaluation of Risk Transfer
For each contract that we write, we estimate the ultimate premiums for the entire contract period and record this estimate at the inception of the contract, to the extent the amount of written premium is estimable. For contracts where the full written premium is not estimable at inception, we record written premium for the portion of the contract period for which the amount is estimable. These estimates are based primarily on information in the underlying contracts as well as information provided by our clients and/or brokers. See
Note 2
to our consolidated financial statements for additional information on premium revenue recognition.
Changes in premium estimates are expected and may result in adjustments in any reporting period. These estimates change over time as additional information regarding the underlying business volume is obtained. Along with uncertainty regarding the underlying business volume, our contracts also contain a number of contractual features that can significantly impact the amount of premium that we ultimately recognize. These include commutation provisions, multi-year contracts with cancellation provisions and provisions to return premium at the expiration of the contract in certain circumstances. In certain contracts, these provisions can be exercised by the client, in some cases provisions can be exercised by us and in other cases by mutual consent. In addition, we write a small number of large contracts and the majority of our property and casualty reinsurance segment premiums written to date has been quota share business. As a result, we may be subject to greater volatility around our premium estimates compared to other property and casualty companies. We continuously monitor the premium estimate of each of our contracts considering the cash premiums received, reported premiums, discussions with our clients regarding their premium projections as well as evaluating the potential impact of contractual features. Any subsequent adjustments arising on such estimates are recorded in the period in which they are determined.
Changes in premium estimates may not result in a direct impact to net income or shareholders’ equity since changes in premium estimates do not necessarily impact the amount of net premiums earned at the time of the premium estimate change and would generally be offset by proportional changes in acquisition costs and net loss and loss adjustment expenses.
84
During the year ended
December 31, 2014
, we recorded $(12.1) million of changes in premium estimates on prior years’ contracts, (2013 - $(35.7) million). There was insignificant impact on net income of these changes in premium estimates for the years ended
December 31, 2014
and 2013. The 2014 changes in premium estimates were primarily due to clients writing less business than initially expected. The 2013 changes in premium estimates were primarily due to return premiums on contracts that expired in 2013 and that included a contractual provision to return the unearned premiums at expiration. There were no changes in premium estimates for the year ended December 31, 2012 because we commenced our underwriting activities in 2012.
Determining whether or not a reinsurance contract meets the condition for risk transfer requires judgment. The determination of risk transfer is critical to reporting premiums written and is based, in part, on the use of actuarial and pricing models and assumptions and evaluating contractual features that could impact the determination of whether a contract meets risk transfer. If we determine that a reinsurance contract does not transfer sufficient risk, we use deposit accounting. See
Note 11
to our consolidated financial statements for additional information on deposit contracts entered into to date.
Loss and Loss Adjustment Expense Reserves
Our loss and loss adjustment expense reserves include case reserves and reserves for losses incurred but not yet reported (“IBNR reserves”). Case reserves are established for losses that have been reported, but not yet paid, based on loss reports from brokers and ceding companies. IBNR reserves represent the estimated loss and loss adjustment expenses that have been incurred by insureds and reinsureds but not yet reported to the insurer or reinsurer, including unknown future developments on loss and loss adjustment expenses that are known to us. IBNR reserves are established by management based on actuarially determined estimates of ultimate loss and loss adjustment expenses.
Inherent in the estimate of ultimate loss and loss adjustment expenses are expected trends in claim severity and frequency and other factors that may vary significantly as claims are settled. Accordingly, ultimate loss and loss adjustment expenses may differ materially from the amounts recorded in the financial statements. These estimates are reviewed regularly and, as experience develops and new information becomes known, the reserves are adjusted as necessary. Such adjustments, if any, are recorded in the consolidated statement of income in the period in which they become known.
We perform an actuarial projection of our reserves quarterly and have a third-party actuarial review performed annually. All reserves are estimated on an individual contract basis; there is no aggregation of contracts for projection of ultimate loss or reserves.
We initially reserve every individual contract to the expected loss and loss expense ratio in the pricing analysis.
As loss information is received from the cedents, we incorporate other actuarial methods in our projection of ultimate losses and, hence, reserves. In our pricing analysis, we typically use a significant amount of information unique to the individual client and, when necessary, supplement the analysis with industry data. Industry data primarily takes the form of paid and incurred development patterns from statutory financial statements and statistical agencies. For our actuarial reserve projections, the relevant information we receive from our reinsurance clients include premium estimates, paid loss and loss adjustment expenses and case reserves. We review the data for reasonableness and research any anomalies. On each contract, we compare the expected paid and incurred amounts at each quarter-end with actual amounts reported. We also compare premiums received with projected premium receipts at each quarter end.
There is a time lag between when a covered loss event occurs and when it is actually reported to our cedents. The actuarial methods that we use to estimate losses have been designed to address this lag in loss reporting. There is also a time lag between reinsurance clients paying claims, establishing case reserves and re-estimating their reserves, and notifying us of the payments and/or new or revised case reserves. This reporting lag is typically 60 to 90 days after the end of a reporting period, but can be longer in some cases. We use techniques that adjust for this type of lag. While it would be unusual to have lags that extend beyond 90 days, our actuarial techniques are designed to adjust for such a circumstance.
85
The principal actuarial methods (and associated key assumptions) we use to perform our quarterly loss reserve analysis may include one or more of the following methods:
A Priori Loss Ratio Method
. To estimate ultimate losses under the
a priori
loss ratio method, we multiply earned premiums by an expected loss ratio. The expected loss ratio is selected as part of the pricing and utilizes individual client data, supplemented by industry data where necessary. This method is often useful when there is limited historical data due to few losses being incurred.
Paid Loss Development Method
. This method estimates ultimate losses by calculating past paid loss development factors and applying them to exposure periods with further expected paid loss development. The paid loss development method assumes that losses are paid at a rate consistent with the historical rate of payment. It provides an objective test of reported loss projections because paid losses contain no reserve estimates. For some lines of business, claim payments are made slowly and it may take many years for claims to be fully reported and settled.
Incurred Loss Development Method
. This method estimates ultimate losses by using past incurred loss development factors and applying them to exposure periods with further expected incurred loss development. Since incurred losses include payments and case reserves, changes in both of these amounts are incorporated in this method. This approach provides a larger volume of data to estimate ultimate losses than paid loss methods. Thus, incurred loss patterns may be less varied than paid loss patterns, especially for coverages that have historically been paid out over a long period of time but for which claims are incurred relatively early and case loss reserve estimates are established.
Bornhuetter-Ferguson Paid and Incurred Loss Methods
. These methods are a weighted average of the
a priori
loss ratio and the relevant development factor method. The weighting between the two methods depends on the maturity of the business. This means that for the more recent years a greater weight is placed on the
a priori
loss ratio, while for the more mature years a greater weight is placed on the development factor methods. These methods avoid some of the distortions that could result from a large development factor being applied to a small base of paid or incurred losses to calculate ultimate losses. This method will react slowly if actual paid or incurred loss experience develops differently than historical paid or incurred loss experience because of major changes in rate levels, retentions or deductibles, the forms and conditions of coverage, the types of risks covered or a variety of other factors.
IBNR to Outstanding Ratio Method
. This method is used in selected cases typically for very mature years that still have open claims. This method assumes that the estimated future loss development is indicated by the current level of case reserves.
Key to the projection of ultimate loss is the amount of credibility or weight assigned to each actuarial method. Each method has advantages and disadvantages, and those can change depending on numerous factors including the reliability of the underlying data. For most actuaries, the selection and weighting of the projection methods is a highly subjective process. In order to achieve a desirable amount of consistency from study to study and between contracts, we have implemented a weighting scheme that incorporates numerous “rules” for the weighting of actuarial methods. These rules attempt to effectively codify the judgmental process used for selecting weights for the various methods. There can be circumstances where the rules would be modified for a specific reinsurance contract; examples would include a large market event or new information on historical years that may cause us to increase our
a priori
loss ratio.
As part of our quarterly reserving process, loss-sensitive contingent expenses (e.g., profit commissions, sliding-scale ceding commissions, etc.) are calculated on an individual contract basis. These expense calculations are based on the updated ultimate loss estimates derived from our quarterly reserving process.
Our reserving methodologies use a loss reserving model that calculates a point estimate for our ultimate losses. Although we believe that our assumptions and methodologies are reasonable, the ultimate payments may vary, potentially materially, from the estimates that we have made.
Sensitivity Analysis
The table below shows the impact on our loss and loss adjustment expense reserves, net, acquisition costs, net income and shareholders’ equity as of and for the year ended December 31, 2014 of reasonably likely changes to the actuarial assumption used to estimate our December 31, 2014 loss and loss adjustments expenses incurred. Since many
86
contracts that we write have sliding scale commissions or other loss mitigating features that adjust with the loss and loss adjustment expenses incurred, we consider this contractual feature to be important in understanding the sensitivity of our results to changes in loss ratio assumptions.
The following table illustrates the aggregate impact of a ten percent increase and decrease applied to the ultimate loss and loss adjustment expenses incurred, net for each in-force contract in the property and casualty reinsurance segment. These increases and decreases are only applied to contracts which currently have material reserves outstanding (where material is defined as more than 10% of ultimate loss and loss adjustment expenses incurred, net). Ultimate losses and loss adjustment expenses incurred, net represents the sum we will be obligated to pay for fully developed claims (i.e., paid losses plus outstanding reported losses and IBNR losses). The ultimate loss and loss adjustment expenses incurred, net includes all related loss adjustment expenses less recoveries made from inuring reinsurance, salvage, and subrogation.
|
10% increase in ultimate loss and loss adjustment expenses
|
10% decrease in ultimate loss and loss adjustment expenses
|
||||||
|
($ in thousands)
|
|||||||
|
Impact on:
|
|
|
|
|
|||
|
Loss and loss adjustment expense reserves, net
|
$
|
38,643
|
|
$
|
(38,643
|
)
|
|
|
Acquisition costs, net
|
(8,645
|
)
|
17,816
|
|
|||
|
Decrease (increase) in net underwriting income
|
29,998
|
|
(20,827
|
)
|
|||
|
Total shareholders’ equity
|
$
|
1,552,048
|
|
$
|
1,552,048
|
|
|
|
Increase (decrease) in shareholders’ equity
|
(1.9
|
)%
|
1.3
|
%
|
|||
Fair value measurements
Our investments are managed by Third Point LLC and are carried at fair value. Our investment manager, Third Point LLC, has a formal valuation policy that sets forth the pricing methodology for investments to be used in determining the fair value of each security in our portfolio. The valuation policy is updated and approved at least on an annual basis by Third Point LLC’s valuation committee (the “Committee”), which is comprised of officers and employees who are senior business management personnel of Third Point LLC. The Committee meets on a monthly basis. The Committee’s role is to review and verify the propriety and consistency of the valuation methodology to determine the fair value of investments. The Committee also reviews any due diligence performed and approves any changes to current or potential external pricing vendors.
Securities and commodities listed on a national securities or commodities exchange or quoted on NASDAQ are valued at their last sales price as of the last business day of the period. Listed securities with no reported sales on such date and over-the-counter (“OTC”) securities are valued at their last closing bid price if held long by us, and last closing ask price if held short by us.
Private securities are not registered for public sale and are carried at an estimated fair value at the end of the period, as determined by Third Point LLC. Valuation techniques, used by Third Point LLC, may include market approach, last transaction analysis, liquidation analysis and/or using discounted cash flow models where the significant inputs could include but are not limited to additional rounds of equity financing, financial metrics such as revenue multiples or price-earnings ratio, discount rates and other factors. In addition, we or Third Point LLC may employ third party valuation firms to conduct separate valuations of such private securities. The third party valuation firms provide us or Third Point LLC with a written report documenting their recommended valuation as of the determination date for the specified investments.
Due to the inherent uncertainty of valuation for private securities, the estimated fair value may differ materially from the values that would have been used had a ready market existed for these investments. The actual value at which these securities could actually be sold or settled with a willing buyer or seller may differ from our estimated fair values
87
depending on a number of factors including, but not limited to, current and future economic conditions, the quantity sold or settled, the presence of an active market and the availability of a willing buyer or seller.
Our derivatives are recorded at fair value. Third Point LLC values exchange-traded derivative contracts at their last sales price on the exchange where it is primarily traded. OTC derivatives, which include swap, option, swaption, forward, future and contract for differences, are valued by industry recognized pricing vendors when available; otherwise, fair values are obtained from broker quotes that are based on pricing models that consider the time value of money, volatility, and the current market and contractual prices of the underlying financial instruments.
As an extension of our underwriting activities, the Catastrophe Reinsurer historically has sold derivative instruments that provide reinsurance-like protection to third parties for specific loss events associated with certain lines of business. These derivatives are recorded in the consolidated balance sheets at fair value, with changes in the fair value of these derivatives recorded in net investment income in the consolidated statements of income. These contracts are valued on the basis of models developed by us, which approximates fair value.
In the second quarter of 2014, the Catastrophe Reinsurer purchased a catastrophe bond. This catastrophe bond is recorded in the consolidated balance sheet at fair value, with changes in the fair value recorded in net investment income in the consolidated statements of income. This catastrophe bond is valued using the average of the bids from a minimum of two broker-dealers or other market makers.
We also have derivatives embedded in non-derivative host contracts that are required to be separated from the host contracts and accounted for at fair value with changes in fair value of the embedded derivative reported in net income. Our embedded derivatives relate to interest crediting features in certain reinsurance and deposit contracts that vary based on the returns on our investments managed by Third Point LLC. We determine the value of the embedded derivatives using models developed internally, which approximates fair value.
Our holdings in asset-backed securities (“ABS”) are substantially invested in residential mortgage-backed securities (“RMBS”). The balance of our holdings in ABS was in commercial mortgage-backed securities, collateralized debt obligations and student loan asset-backed securities. These investments are valued using dealer quotes or recognised third-party pricing vendors. All of these classes of ABS are sensitive to changes in interest rates and any resulting change in the rate at which borrowers sell their properties, refinance, or otherwise pre-pay their loans. As an investor in these classes of ABS, we may be exposed to the credit risk of underlying borrowers not being able to make timely payments on loans or the likelihood of borrowers defaulting on their loans. In addition, we may be exposed to significant market and liquidity risks.
We value our investments in affiliated investment funds at fair value, which is an amount equal to the sum of the capital account in the limited partnership generally determined from financial information provided by the investment manager of the investment funds. The resulting net gains or net losses are reflected in the consolidated statements of income.
The fair values of investments are estimated using prices obtained from third-party pricing services, whe
n
available. However,
situations may arise where we believe that the fair value provided by the third-party pricing service does not represent current market conditions. In those situations, Third Point LLC may use dealer quotes to value the investments. For securities that we are unable to obtain fair values from a pricing service or broker, fair values are estimated using information obtained from Third Point LLC.
We perform several processes to ascertain the reasonableness of the valuation of all of our investments comprising our investment portfolio, including securities that are categorized as Level 2 and Level 3 within the fair value hierarchy. These processes include (i) obtaining and reviewing weekly and monthly investment portfolio reports from Third Point LLC, (ii) obtaining and reviewing monthly NAV and investment return reports received directly from our third-party fund administrator, which are compared to the reports noted in (i), and (iii) monthly update discussions with Third Point LLC regarding the investment portfolio, including, their process for reviewing and validating pricing obtained from outside service providers.
For the years ended
December 31, 2014
,
2013
and
2012
, there were no changes in the valuation techniques as it relates to the above.
88
Monetary assets and liabilities denominated in foreign currencies are translated at the closing rates of exchange as of
December 31, 2014
. Transactions during the period are translated at the rate of exchange prevailing on the date of the transaction. We do not isolate that portion of the results of operations resulting from changes in foreign exchange rates on investments, dividends and interest from the fluctuations arising from changes in fair values of securities and derivatives held. Periodic payments received or paid on swap agreements are recorded as realized gain or loss on investment transactions. Such fluctuations are included within net investment income in the consolidated statement of income.
U.S. GAAP disclosure requirements establish a framework for measuring fair value, including a three-level hierarchy for fair value measurements based upon the transparency of inputs to the valuation of an asset or liability.
In certain cases, the inputs used to measure fair value may fall into different levels of the fair value hierarchy. In such cases, an investment’s level within the fair value hierarchy is based on the lowest level of input that is significant to the fair value measurement. Our assessment of the significance of a particular input to the fair value measurement in its entirety requires judgment, and considers factors specific to the investment.
The key inputs for corporate, government and sovereign bond valuation are coupon frequency, coupon rate and underlying bond spread. The key inputs for asset-backed securities are yield, probability of default, loss severity and prepayment. Key inputs for OTC valuations vary based on the type of underlying security on which the contract was written.
See
Note 5
to our consolidated financial statements for additional information on the framework for measuring fair value established by U.S. GAAP disclosure requirements.
Business Outlook
The reinsurance markets in which we operate have historically been cyclical. During periods of excess underwriting capacity, as defined by the availability of capital, competition can result in lower pricing and less favorable policy terms and conditions for insurers and reinsurers. During periods of reduced underwriting capacity, pricing and policy terms and conditions are generally more favorable for insurers and reinsurers. Historically, underwriting capacity has been impacted by several factors, including industry losses, the impact of catastrophes, changes in legal and regulatory guidelines, new entrants, investment results including interest rate levels and the credit ratings and financial strength of competitors.
While management believes pricing remains adequate for the types of business on which we focus, there is significant underwriting capacity currently available. As a result, we believe market conditions will remain challenging in the near term and may worsen. The segment with the greatest pricing pressure is property catastrophe reinsurance due to an influx of capacity from collateralized reinsurance and other insurance-linked securities vehicles and the absence of significant catastrophe events during 2013 and 2014. As a result of challenging market conditions and competition with other collateralized reinsurance and insurance-linked securities vehicles, we announced that we would no longer accept investments in the Catastrophe Fund, that no new business would be written in the Catastrophe Reinsurer and that we would be redeeming all existing investments in the Catastrophe Fund.
The Catastrophe Fund Manager will continue to manage the runoff of the remaining exposure in the Catastrophe Fund.
In non-catastrophe lines of business, we focus on segments and clients where we believe we benefit from relatively more attractive pricing opportunities due to the strength of our relationships, the tailored nature of our reinsurance solutions or an acute need for reinsurance capital as result of a client’s growth or historically poor performance. Most of our senior management team have spent decades within the reinsurance market and as they cultivate their relationships with intermediaries and reinsurance buyers, we are seeing an increased flow of submissions in the lines and types of reinsurance we target. Although we are typically presented by brokers with proposed structures on syndicated deals, we seek to customize the proposed solution for the client while improving our risk and return profile and establishing our position as the lead reinsurer in the transaction. We also look for non-syndicated opportunities where a highly customized solution is needed. These solutions may take the form of aggregate stop loss covers, loss portfolio transfers or adverse development reserve covers where clients seek capital relief and enhanced investment returns on their loss and unearned premium reserves. We continue to see strong submission flow in this space.
89
In February 2015, we began reinsurance operations in the United States through Third Point Re USA, a Bermuda company licensed as a Class 4 insurer and a wholly owned operating subsidiary of TPRUSA. Third Point Re USA has not conducted any operations to date and TPRUSA’s only operations to date relate to accessing financing on behalf of Third Point Re USA. As a result, Third Point Re USA and TPRUSA have a limited operating history and are exposed to volatility in their results of operations. Period to period comparisons of their results of operations may not be meaningful. Third Point Re USA expects to provide reinsurance products that are substantially similar to the reinsurance products currently provided by Third Point Re. Third Point Re USA’s U.S. presence is a strategic component of our overall growth strategy. As a result of Third Point Re USA’s U.S. presence, we expect to strengthen our relationships with U.S. cedents and brokers. We also expect to develop a firsthand understanding of cedent underwriting and claims capabilities that will benefit our underwriting practices.
Consolidated Results of Operations—Years ended
December 31, 2014
,
2013
and
2012
:
2014 compared to 2013
For the year ended
December 31, 2014
, our net income decreased by
$176.9 million
, or
77.8%
, to
$50.4 million
, compared to net income of
$227.3 million
for the year ended
December 31, 2013
.
The change in net income for the the year ended December 31, 2014 compared to the year ended December 31, 2013 was primarily due to the following:
|
•
|
For the year ended
December 31, 2014
, we recorded net investment income of $
85.6 million
, compared to $
258.1 million
for the year ended
December 31, 2013
. The return on investments managed by Third Point LLC was
5.1%
for the year ended
December 31, 2014
compared to
17.7%
for the year ended
December 31, 2013
. The decrease in net investment income from lower returns was partially offset by higher average investments managed by Third Point LLC.
|
|
•
|
The net underwriting loss from our property and casualty reinsurance segment for the year ended
December 31, 2014
was
$9.6 million
, compared to a net underwriting loss of
$15.8 million
for the year ended
December 31, 2013
. The combined ratio for the year ended December 31, 2014 was
102.2%
compared to
107.5%
for the year ended December 31, 2013. The improvement in the net underwriting loss is due to a higher in-force book of business for 2014 on a relatively consistent composite ratio. The lower combined ratio is primarily due to a lower general and administrative expense ratio, which has continued to decrease due to proportionately higher net premiums earned.
|
|
•
|
Our catastrophe risk management segment contributed net income of
$4.6 million
for the year ended December 31, 2014 compared to net income of
$3.4 million
for the year ended December 31, 2013 due to higher assets under management and fewer losses in 2014.
|
2013 compared to 2012
For the year ended December 31, 2013, our net income increased by $127.9 million, or 128.7%, to $227.3 million, compared to net income of $99.4 million for the year ended December 31, 2012.
The increase in net income for the year ended December 31, 2013 compared to the year ended December 31, 2012 was primarily due to the following:
|
•
|
For the year ended December 31, 2013, we recorded net investment income of $258.1 million, compared to $136.9 million for the year ended December 31, 2012. The return on investments managed by Third Point LLC was 23.9% for the year ended December 31, 2013 compared to 17.7% for the year ended December 31, 2012.
|
|
•
|
The net underwriting loss from our property and casualty reinsurance segment for the year ended December 31, 2013 was $15.8 million, compared to a net underwriting loss of $28.7 million for the year ended December 31, 2012.
The combined ratio for the year ended December 31, 2013 was
|
90
107.5% compared to 129.7% for the year ended December 31, 2012. The underwriting results for the year ended December 31, 2012 included a $10.0 million underwriting loss on one crop contract.
|
•
|
Our catastrophe risk management segment contributed net income of $3.4 million for the year ended December 31, 2013 compared to a net loss of $1.5 million for the year ended December 31, 2012. The Catastrophe Reinsurer wrote no business before January 1, 2013. The year ended December 31, 2012 included certain start-up related expenses related to formation of this segment.
|
Segment Results—Years ended
December 31, 2014
,
2013
and 2012
The determination of our reportable segments is based on the manner in which management monitors the performance of our operations. For the periods presented, our business comprises two operating segments - Property and Casualty Reinsurance and Catastrophe Risk Management. We have also identified a corporate function that includes net investment income on capital and general and administrative expenses related to our corporate activities.
Effective January 1, 2014, we modified the presentation of our operating segments to allocate net investment income from float to the property and casualty reinsurance segment. The property and casualty reinsurance operations generate excess cash flows, or float, which the Company tracks in managing the business. The Company considers net investment income on float in evaluating the overall contribution of the property and casualty reinsurance segment. Prior period segment results have been adjusted to conform to this presentation.
Property and Casualty Reinsurance
Gross premiums written
. Gross premiums written increased by $
207.7 million
, or
52.8%
, to
$601.3 million
for the year ended
December 31, 2014
from
$393.6 million
for year ended
December 31, 2013
. Gross premiums written increased by $203.2 million, or 106.7%, to $393.6 million for the year ended December 31, 2013 from $190.4 million for year ended December 31, 2012.
We began underwriting on January 1, 2012 and continue to cultivate our underwriting relationships with intermediaries and reinsurance buyers and, as a result, we believe submission flow remains strong. We write a small number of large contracts so individual renewals or new business can have a significant impact on premiums recognized in a period. Despite challenging market conditions, we have managed to grow rapidly due to the strength of our relationships. In addition, our reinsurance contracts are subject to significant judgment in the amount of premiums that we expect to recognize. Changes in premium estimates are recorded in the period they are determined and can be significant. We also offer customized solutions to our clients, including adverse development covers, on which we will not have a regular renewal opportunity. Furthermore, we record gross premiums written and earned for adverse development covers, which are considered retroactive reinsurance contracts, at the inception of the contract. This premium recognition policy can further impact the comparability of premiums earned in a period.
As a result of these factors, we may experience volatility in the amount of gross premiums written and earned and period to period comparisons may not be meaningful. For future periods, the results of our Property and Casualty Reinsurance segment will include the results of Third Point Re USA, which may further impact comparability of results.
The following table provides a breakdown of our property and casualty reinsurance segment’s gross premiums written by line of business for the years ended
December 31, 2014
,
2013
and 2012:
|
2014
|
2013
|
2012
|
||||||||||||||||||
|
($ in thousands)
|
||||||||||||||||||||
|
Property
|
$
|
106,834
|
|
17.8
|
%
|
$
|
67,612
|
|
17.2
|
%
|
$
|
103,174
|
|
54.2
|
%
|
|||||
|
Casualty
|
266,763
|
|
44.4
|
%
|
210,017
|
|
53.4
|
%
|
44,700
|
|
23.5
|
%
|
||||||||
|
Specialty
|
227,708
|
|
37.8
|
%
|
115,959
|
|
29.4
|
%
|
42,500
|
|
22.3
|
%
|
||||||||
|
$
|
601,305
|
|
100.0
|
%
|
$
|
393,588
|
|
100.0
|
%
|
$
|
190,374
|
|
100.0
|
%
|
||||||
The change in gross premiums written for the year ended
December 31, 2014
compared to the year ended
December 31, 2013
was driven by:
91
Factors resulting in increases:
|
•
|
We wrote $370.1 million of new business for the year ended
December 31, 2014
, consisting of $221.5 million of new specialty business, $105.7 million of new casualty business and $42.9 million of new property business.
|
|
•
|
Changes in renewal premiums during the year ended
December 31, 2014
resulted in increased premiums of $34.5 million. Premiums can change on renewals of contracts for a number of factors including: changes in our line size or participation, changes in the underlying premium volume of the client’s program, pricing trends as well as other contractual terms and conditions.
|
|
•
|
One contract written in the year ended December 31, 2013 was canceled and re-written in 2014 with increased participation and an extended coverage period, resulting in $16.5 million of additional premiums recognized in 2014.
|
|
•
|
Other changes, such as amendments to existing contracts to increase coverage or to add other terms resulted in additional premiums of $12.9 million in the year ended December 31, 2014 compared to additional premiums of $8.0 million for similar reasons for the year ended December 31, 2013.
|
|
•
|
Reductions in premium estimates relating to prior years’ contracts were $12.1 million and $35.7 million for the years ended
December 31, 2014
and 2013, respectively. The changes in estimates for the year ended December 31, 2014 were primarily due to clients writing less business than expected. For the year ended December 31, 2013, the decrease in premium was primarily due to return premiums on contracts that expired during the period, which included provisions within the contract to return the unearned premiums at expiration. For contracts that renewed or were written in 2013 and 2014 with these provisions, we considered the expected return premium in determining our initial premium estimates.
|
Factors resulting in decreases:
|
•
|
We recognized $140.9 million of premium in the year ended December 31, 2013 that did not renew in the year ended
December 31, 2014
, primarily due to multi-year contracts written that were not subject to renewal, or which we elected not to renew, in the comparable current year period.
|
|
•
|
We did not renew five reinsurance contracts accounting for $101.0 million of premiums for the year ended December 31, 2013, primarily as a result of pricing and other changes in reinsurance contract structure, terms and conditions.
|
The change in gross premiums written for the year ended December 31, 2013 compared to the year ended December 31, 2012 was driven by:
Factors resulting in increases:
|
•
|
We wrote $269.0 million of new business for the year ended December 31, 2013, consisting of $19.5 million of new property business, $143.4 million of new casualty business and $106.1 million of new specialty business.
|
|
•
|
Changes in renewal premiums during the year ended December 31, 2013 resulted in increased premiums of $21.7 million. Premiums can change on renewals of contracts for a number of factors including: changes in our line size or participation, changes in the underlying premium volume of the client’s program, pricing trends as well as other contractual terms and conditions. The increase was primarily due to one contract that was written for one year in 2012 and renewed as a two year contract in 2013 with other generally offsetting changes on other renewal business.
|
|
•
|
We amended two existing contracts to increase coverage resulting in $21.0 million of premium.
|
Factors resulting in decreases:
|
•
|
Reductions in premium estimates relating to prior years’ contracts were $35.7 million for the year ended December 31, 2013 primarily due to return premiums on contracts, which expired during the period, which included provisions within the contract to return the unearned premiums at expiration. For contracts that renewed or were written in 2013 with these provisions, we considered the expected return premium in determining our initial premium estimates.
|
92
|
•
|
We did not renew four reinsurance contracts accounting for $72.8 million of premiums for the year ended December 31, 2012, with three of the contracts not renewing as a result of pricing and other changes in reinsurance contract structure, terms and conditions. In addition, our crop contract, which accounted for $42.5 million of premium for the year ended December 31, 2012, was written in 2013 with a new counterparty and is included as $35.0 million of new business above.
|
Premiums ceded
. Premiums ceded for the year ended December 31, 2014 were
$0.2 million
(2013 -
$10.0 million
and 2012 - $nil). We purchased one retrocessional protection in 2014 to limit our catastrophe risk on one contract. The 2013 premiums ceded of $10.0 million related to the purchase of retrocessional protection related to our one assumed crop contract that did not renew in 2014.
Net premiums earned
. Net premiums earned for the year ended
December 31, 2014
increased $
219.7 million
, or
103.3%
, to
$432.3 million
. Net premiums earned for the year ended December 31, 2013 increased $116.1 million, or 120.3%, to $212.6 million. The year ended December 31, 2014 reflects net premiums earned on a larger in-force underwriting portfolio, including new business written and increased premiums from renewals, compared to the years ended December 31, 2013 and 2012. In addition, the year ended December 31, 2014, includes net premiums earned of
$83.1 million
(2013 -
$39.8 million
and 2012 - $nil) related to retroactive exposure in reinsurance contracts where we recorded the gross premiums written and earned at the inception of the contract.
Net investment income
. Net investment income allocated to the Property and Casualty Reinsurance segment consists of net investment income on float and was
$11.3 million
for the year ended
December 31, 2014
compared to
$27.0 million
for the year ended
December 31, 2013
. The decrease in net investment income on float for the year ended December 31, 2014 compared to the year ended December 31, 2013 was due to lower investment returns on investments managed by Third Point LLC partially offset by an increase in the total amount of the investments attributable to float managed by Third Point LLC. See the net investment income discussion below under “Corporate function” for explanations of the investment returns on investments managed by Third Point LLC and total net investment income for the periods presented.
Net loss and loss adjustment expenses
. The reinsurance contracts we write have a wide range of initial loss ratio estimates. As a result, our net loss and loss expense ratio can vary significantly from period to period depending on the mix of business. For example, property quota share contracts have a lower initial loss ratio compared to other casualty and specialty lines of business. In general, our contracts have similar expected composite ratios (combined ratio before general and administrative expenses); therefore, contracts with higher initial loss ratio estimates have lower acquisition cost ratios and contracts with lower initial loss ratios have higher acquisition cost ratios. Retroactive reinsurance contracts have a higher initial loss ratio since the premiums are generally based on the net loss and loss adjustment reserves and do not include acquisition related and other expenses. In addition, we record the gross premiums written and earned and the net losses as incurred for retroactive reinsurance contracts at the inception of the contract, which can also impact the mix of premiums earned in a particular period.
2014 compared to 2013
Net loss and loss adjustment expenses for the year ended
December 31, 2014
were
$283.2 million
, or
65.5%
of net premiums earned, compared to
$139.6 million
, or
65.7%
of net premiums earned, for the year ended
December 31, 2013
.
For the year ended December 31, 2014, we recorded
$0.7 million
of net favorable prior years’ reserve development and
$2.9 million
of net favorable development resulting from decreases in premium estimates on certain contracts. For the year ended December 31, 2013, we recorded net favorable prior year’s reserve development of
$1.3 million
and
$3.4 million
of net favorable development resulting from decreases in premium estimates on certain contracts, primarily related to one crop contract. The reserve and premium estimate changes generally offset resulting in no material impact to net underwriting income or net loss ratio for the years ended December 31, 2014 and 2013.
2013 compared to 2012
Net loss and loss expenses for the year ended
December 31, 2013
was $
139.6 million
, or
65.7%
of net premiums earned, compared to $
80.3 million
, or
83.2%
of net premiums earned, for the year ended
December 31, 2012
.
93
The decrease in the loss ratio for the year ended December 31, 2013 was primarily due to the crop losses that were recorded in the year ended December 31, 2012. During the year ended December 31, 2012, we increased our crop loss from our initial loss estimate by $13.4 million.
This crop reinsurance contract accounted for $10.0 million of net underwriting loss for the year ended December 31, 2012.
As noted above, we recorded $1.3 million of net favorable prior years’ reserve development for the year ended December 31, 2013. We commenced underwriting in 2012 and therefore did not have any prior years’ reserve development for the 2012 year.
Acquisition costs
. Acquisition costs include commissions, brokerage and excise taxes. Acquisition costs are presented net of commissions ceded under reinsurance contracts. Acquisition costs for the year ended
December 31, 2014
were
$136.2 million
(2013 -
$67.0 million
and 2012 -
$24.6 million
), or
31.5%
of net premiums earned (2013 -
31.5%
and 2012 -
25.5%
). The acquisition cost ratio for the year ended December 31, 2013 was higher than the year ended December 31, 2012 due to a change in business mix.
The reinsurance contracts we write have a wide range of acquisition cost ratios. As a result, our acquisition cost ratio can vary significantly from period to period depending on the mix of business. For example, our property quota share contracts have a higher initial acquisition cost ratio compared to other casualty and specialty lines of business due to inuring catastrophe reinsurance, which increases the acquisition cost ratio on those contracts. Our property quota share contracts are structured to limit the amount of property catastrophe exposure we assume. As a result, inuring catastrophe reinsurance for the property catastrophe exposure reduces the amount of premium we assume relative to the acquisition costs or is an additional component of the acquisition costs. In general, our contracts have similar expected composite ratios (combined ratio before general and administrative expenses); therefore, contracts with higher initial loss ratio estimates have lower acquisition cost ratios and contracts with lower initial loss ratios have higher acquisition cost ratios. Retroactive reinsurance contracts generally have a low initial acquisition cost ratio. In addition, we record the gross premiums written and earned for retroactive reinsurance contracts at the inception of the contract, which can also impact the mix of premiums earned in a particular period. Furthermore, a number of our contracts have a sliding scale commission or profit commission feature that will vary depending on the expected loss expense for the contract. As a result, changes in
estimates of loss and loss adjustment expenses on a contract can result in changes in the sliding scale commissions or profit commissions and a contract’s overall acquisition cost ratio.
General and administrative expenses
. General and administrative expenses for the year ended
December 31, 2014
were
$22.5 million
(2013 -
$21.8 million
and 2012 -
$20.3 million
), or
5.2%
of net premiums earned (2013 -
10.3%
and 2012 -
21.0%
).
The increase in general and administrative expenses for the year ended
December 31, 2014
compared to the prior year was primarily due to increased headcount and related employee costs partially offset by lower stock compensation expense as a result of the IPO which occurred in the year ended December 31, 2013. The increase in general and administrative expenses for the year ended December 31, 2013 compared to the year ended December 31, 2012 was primarily due to additional share compensation expense as a result of the performance condition applicable to option awards having been met in conjunction with the completion of the IPO. In addition, we had increased headcount and related staff costs as we continued to build out our management team and infrastructure throughout 2012 and 2013. These increases were partially offset by signing bonuses included in the year ended December 31, 2012.
Although general and administrative expenses increased in each year, the general and administrative expense ratio has continued to decrease due to proportionately higher net premiums earned during the corresponding periods.
Catastrophe Risk Management
The Catastrophe Reinsurer wrote no business before January 1, 2013. From January 1, 2013, the underwriting results of the Catastrophe Reinsurer as well as results of the Catastrophe Fund, the entities for which the Catastrophe Fund Manager underwrites and manages catastrophe risk, are captured with the Catastrophe Fund Manager in this segment. In December 2014, we announced that we would no longer accept investments in the Catastrophe Fund, that no new business would be written in the Catastrophe Reinsurer and that we would be redeeming all existing investments in the Catastrophe Fund. Despite the Catastrophe Fund’s solid investment returns from its inception, we are winding it down due to challenging market conditions and competition with other collateralized reinsurance and insurance-
94
linked securities vehicles. Catastrophe reinsurance pricing and the fees available to manage catastrophe risk have decreased significantly in the past two years. The Catastrophe Fund Manager will continue to manage the runoff of the remaining exposure in the Catastrophe Fund.
Gross premiums written.
Gross premiums written were
$12.0 million
for the year ended
December 31, 2014
compared to
$8.3 million
for the year ended
December 31, 2013
.
Net premiums earned.
Net premiums earned were
$12.2 million
for the year ended
December 31, 2014
compared to
$8.1 million
for the year ended
December 31, 2013
.
Net investment income
. Net investment income of
$1.2 million
for the year ended
December 31, 2014
compared to
$4.4 million
for the year ended
December 31, 2013
. The net investment income for both periods relates primarily to gains on derivative reinsurance contracts written by the Catastrophe Reinsurer. The Catastrophe Reinsurer wrote fewer contracts in the form of derivatives in 2014 compared to 2013.
Net loss and loss adjustment expenses.
There were nil net loss and loss adjustment expenses for the year ended
December 31, 2014
. Net loss and loss adjustment expenses were
$0.2 million
for the year ended December 31, 2013, related to tornadoes, hail and severe thunderstorms that occurred in the United States in 2013.
Acquisition costs.
Acquisition costs include commissions, brokerage and excise taxes. Acquisition costs for the year ended
December 31, 2014
were
$1.1 million
compared to
$1.0 million
for the year ended
December 31, 2013
.
General and administrative expenses.
General and administrative expenses consist of costs associated with the employee leasing agreement, catastrophe modeling and legal and accounting expenses. General and administrative expenses for the year ended
December 31, 2014
were
$3.1 million
(2013 -
$3.9 million
and 2012 -
$1.5 million
). The decrease is primarily attributable to reduced allocations of costs to this segment for 2014. We will continue to incur general and administrative expenses during 2015 because the Catastrophe Fund Manager will continue to manage the runoff of the remaining exposure in the Catastrophe Fund.
Corporate function
Investment results
For the year ended
December 31, 2014
, we recorded net investment income of
$73.1 million
(2013 -
$226.8 million
and 2012 -
$132.0 million
).
The primary driver of our net investment income is the returns generated by our investment portfolio managed by our investment manager, Third Point LLC. The following is a summary of the net investment return on investments managed by Third Point LLC by investment strategy:
|
|
2014
|
2013
|
2012
|
|||||
|
Long/short equities
|
2.7
|
%
|
|
17.5
|
%
|
7.8
|
%
|
|
|
Asset-backed securities
|
2.5
|
%
|
|
3.0
|
%
|
2.3
|
%
|
|
|
Corporate credit
|
0.5
|
%
|
|
2.1
|
%
|
3.2
|
%
|
|
|
Macro and other
|
(0.6
|
)%
|
|
1.3
|
%
|
4.4
|
%
|
|
|
|
5.1
|
%
|
|
23.9
|
%
|
17.7
|
%
|
|
|
|
|
|||||||
|
S&P 500
|
13.7
|
%
|
32.4
|
%
|
16.0
|
%
|
||
The returns for the year ended
December 31, 2014
were largely attributable to Third Point LLC’s equity and structured credit strategies. Within equities, healthcare and industrials and commodities were the strongest performing sectors, accounting for nearly half of total returns for the year. Investments in Third Point LLC’s performing credit and macro strategies both detracted moderately from 2014 net investment income. Net investment income for the year ended December 31, 2014 benefited from higher average investments managed by Third Point LLC compared to the prior year period due to the float contributed by our property and casualty reinsurance operations.
The returns for the year ended December 31, 2013 were driven primarily by equity positions and to a lesser
95
extent by gains in structured credit, corporate credit and macro positions. Net investment income for the year ended
December 31, 2013 benefited from higher average investments managed by Third Point LLC compared to the prior year periods due to the net proceeds generated by our IPO and float contributed by our property and casualty
reinsurance operations.
For the year ended December 31, 2012, the performance of our investment portfolio, as managed by Third Point LLC, was driven by positive results across all investment strategies coupled with strong gains in several core holdings, particularly large positions in Greek government bonds and Yahoo! Inc.
All of our assets managed by Third Point LLC are held in separate accounts and managed under two investment management agreements whereby Third Point Advisors LLC, an affiliate of Third Point LLC, has a non-controlling interest in the assets held in the separate accounts. The value of the non-controlling interest is equal to the amounts invested by Third Point Advisors LLC, plus performance fees paid by us to Third Point Advisors LLC and investment gains and losses thereon.
Our investment manager, Third Point LLC, manages several funds and may manage other client accounts besides ours, some of which have, or may have, objectives and investment portfolio compositions similar to ours. Because of the similarity or potential similarity of our investment portfolio to these others, and because, as a matter of ordinary course, Third Point LLC provides its clients, including us, and investors in its main hedge funds with results of their respective investment portfolios following the last day of each month, those other clients or investors indirectly may have material nonpublic information regarding our investment portfolio. To address this issue, and to comply with Regulation FD, we will continue to post on our website under the heading Investment Portfolio Returns located in the Investors section of the website, following the close of trading on the New York Stock Exchange on the last business day of each month, our preliminary monthly investment results for that month, with additional information regarding our monthly investment results to be posted following the close of trading on the New York Stock Exchange on the first business day of the following month.
General and administrative expenses related to corporate activities
General and administrative expenses allocated to our corporate function include allocations of payroll and related costs for certain executives and non-underwriting staff that spend a portion of their time on corporate activities. We also allocate a portion of overhead and other related costs based on a related headcount analysis. For the year ended
December 31, 2014
, general and administrative expenses allocated to the corporate function were
$14.4 million
(
2013
-
$7.3 million
and
2012
-
$5.6 million
). The increase compared to the prior year periods was primarily due to greater payroll and related expenses as a result of increased headcount and increased legal and other professional advisor expenses as a result of operating as a public company.
Liquidity and Capital Resources
Our investment portfolio is concentrated in tradeable securities and is marked to market each day. Pursuant to our investment guidelines as specified in our two investment management agreements with Third Point LLC, at least 60% of our portfolio must be invested in securities of publicly traded companies and governments of OECD high income countries, asset-backed securities, cash, cash equivalents and gold and other precious metals. We can liquidate all or a portion of our investment portfolio at any time with not less than three days’ notice to pay claims on our reinsurance contracts, and with not less than five days’ notice to pay for expenses, and on not less than 30 days’ notice in order to satisfy a requirement of A.M. Best. Since we do not write excess of loss property catastrophe contracts or other types of reinsurance contracts that are typically subject to sudden, acute, liquidity demands, we believe the liquidity provided by our investment portfolio will be sufficient to satisfy all our liquidity requirements.
General
Third Point Reinsurance Ltd. is a holding company and has no substantial operations of its own and has moderate cash needs, most of which are related to the payment of corporate expenses. Its assets consist primarily of its investments in subsidiaries. Third Point Reinsurance Ltd.’s ability to pay dividends or return capital to shareholders will depend upon the availability of dividends or other statutorily permissible distributions from those subsidiaries.
96
We and our Bermuda subsidiaries are subject to Bermuda regulatory constraints that affect our ability to pay dividends. Under the Companies Act, as amended, a Bermuda company may declare or pay a dividend out of distributable reserves only if it has reasonable grounds for believing that it is, or would after the payment, be able to pay its liabilities as they become due and if the realizable value of its assets would thereby not be less than its liabilities. Under the Insurance Act, Third Point Re and Third Point Re USA, as Class 4 insurers, are prohibited from declaring or paying a dividend if it is in breach of their respective minimum solvency margin (“MSM”), enhanced capital ratio (“ECR”) or minimum liquidity ratio or if the declaration or payment of such dividend would cause such a breach. Where either Third Point Re or Third Point Re USA, as a Class 4 insurer, fails to meet its MSM or minimum liquidity ratio on the last day of any financial year, it is prohibited from declaring or paying any dividends during the next financial year without the approval of the Bermuda Monetary Authority (“BMA”).
In addition, each of Third Point Re and Third Point Re USA, as a Class 4 insurer, is prohibited from declaring or paying in any financial year dividends of more than 25% of its respective total statutory capital and surplus (as shown on its previous financial year’s statutory balance sheet) unless it files (at least seven days before payment of such dividends) with the BMA an affidavit signed by at least 2 directors (one of whom must be a Bermuda resident director if any of the insurer’s directors are resident in Bermuda) and the principal representative stating that it will continue to meet its solvency margin and minimum liquidity ratio.
As of December 31, 2014, Third Point Re could pay dividends to the Company of approximately
$324.0
million (2013 -
$325.9 million
). On February 26, 2015, Third Point Re declared and paid a dividend of $158.0 million to Third Point Reinsurance Ltd. These funds were ultimately used to partially capitalize Third Point Re USA.
Liquidity and Cash Flows
Historically, our sources of funds have primarily consisted of premiums written, reinsurance recoveries, investment income and proceeds from sales and redemptions of investments. Cash is used primarily to pay loss and loss adjustment expenses, reinsurance premiums, acquisition costs and general and administrative expenses and to purchase investments.
Our cash flows from operations generally represent the difference between: (l) premiums collected and investment earnings realized and (2) loss and loss expenses paid, reinsurance purchased and underwriting and other expenses paid. Net cash provided by underwriting activities results from excluding investment earnings realized from our operating cash flows results in net cash provided by underwriting activities. Cash flows from operations may differ substantially from net income and may be volatile from period to period depending on the underwriting opportunities available to us. Due to the nature of our underwriting portfolio, the potential for large claim payments can be substantial and unpredictable and may need to be made within relatively short periods of time. Claim payments can also be required several months or years after premiums are collected.
Operating, investing and financing cash flows for the years ended December 31, 2014, 2013 and 2012 were as follows:
|
2014
|
2013
|
2012
|
||||||||||
|
($ in thousands)
|
||||||||||||
|
Net cash provided by (used in) operating activities
|
$
|
122,430
|
|
$
|
19,709
|
|
$
|
(30,892
|
)
|
|||
|
Net cash used in investing activities
|
(119,053
|
)
|
(427,144
|
)
|
(806,098
|
)
|
||||||
|
Net cash provided by (used in) financing activities
|
(6,268
|
)
|
405,055
|
|
267,154
|
|
||||||
|
Net decrease in cash and cash equivalents
|
(2,891
|
)
|
(2,380
|
)
|
(569,836
|
)
|
||||||
|
Cash and cash equivalents at beginning of year
|
31,625
|
|
34,005
|
|
603,841
|
|
||||||
|
Cash and cash equivalents at end of year
|
$
|
28,734
|
|
$
|
31,625
|
|
$
|
34,005
|
|
|||
Cash flows from operating activities generally represent net premiums collected less loss and loss adjustment expenses, acquisition costs and general and administrative expenses paid. As our underwriting activities have continued
97
to increase from our start of operation in January 2012, we have generated increasing cash flows from operating activities as the collection of premiums has exceeded the payment of loss and loss adjustment expenses and general and administrative expenses. Excess cash generated through our operating activities is then invested by Third Point LLC, which is reflected in the cash used in investing activities.
For the years ended December 31, 2014, 2013 and 2012, we contributed $163.0 million, $124.0 million and $59.0 million, respectively, to our separate account managed by Third Point LLC from float generated from our reinsurance operations. These amounts do not necessarily correspond to the net cash provided by operating activities as presented in the consolidated statements of cash flows prepared in accordance with US GAAP.
Cash flows used in investment activities primarily reflects investment activities related to our separate account managed by Third Point LLC. Cash flows used in investing activities for the year ended December 31, 2014 reflects the investment of float generated from our reinsurance operations. Cash flows used in investing activities for the year ended December 31, 2013 reflects the investment of the net proceeds from our IPO and the investment of float generated by our reinsurance operations. Cash flows used in investing activities for the year ended December 31, 2012, reflected the initial investment of our portfolio after the initial capitalization of the Company.
The cash flows from financing activities for the year ended December 31, 2014 consisted primarily of an increase in the non-controlling interest in the Catastrophe Fund and an increase in deposit liabilities. Cash flows from financing activities for the year ended December 31, 2013 relate primarily to the net proceeds generated by our IPO and an increase in deposit liabilities. The cash flows from financing activities for the year ended December 31, 2012 consisted of the receipt of subscriptions receivable, net of costs.
In February 2015, we completed a public offering of senior notes issued by TPRUSA and guaranteed by Third Point Reinsurance Ltd. pursuant to a registration statement on Form S-3, from which we received net proceeds of approximately $114.3 million, after deducting underwriting discounts and other offering costs. We used the net proceeds to TPRUSA from this offering, together with a capital contribution received indirectly from TPRE, to fund an aggregate contribution of $265.0 million for the initial capitalization of Third Point Re USA, TPRUSA’s wholly owned insurance subsidiary. TPREUSA may also receive additional contributions from time to time, indirectly from TPRE, to pay certain operating expenses of TPRUSA.
For the period from inception until
December 31, 2014
, we have had sufficient cash flow from proceeds of our initial capitalization and IPO, from our offering of senior notes issued by TPRUSA in February 2015, and from our operations to meet our liquidity requirements. We expect that projected operating and capital expenditure requirements and debt service requirements for at least the next twelve months will be met by our balance of cash, cash flows generated from underwriting activities and investment income. We may incur additional indebtedness in the future if we determine that it would be an efficient part of our capital structure.
In addition, we expect that the net proceeds from our IPO in August 2013, proceeds from the issuance of senior notes in February 2015 and cash flow from operations will provide us with the financial flexibility to execute our strategic objectives. Our ability to generate cash, however, is subject to our performance, general economic conditions, industry trends and other factors. To the extent that the net proceeds from our IPO and our February 2015 issuance of senior notes, combined with existing cash and cash equivalents, investment returns and operating cash flow, are insufficient to fund our future activities and requirements, we may need to raise additional funds through public or private equity or debt financing. If we issue equity securities in order to raise additional funds, substantial dilution to existing shareholders may occur. If we raise cash through the issuance of additional indebtedness, we may be subject to additional contractual restrictions on our business. There is no assurance that we would be able to raise the additional funds on favorable terms or at all. There are regulatory and contractual restrictions on the ability of our reinsurance subsidiaries to pay dividends to their respective parent companies, including for purposes of servicing TPRUSA’s debt obligations. See Business--Regulation--Bermuda Insurance Regulation--Restrictions on Dividends and Distributions.
We do not believe that inflation has had a material effect on our consolidated results of operations to date. The effects of inflation are considered implicitly in pricing our reinsurance contracts. Loss reserves are established to recognize likely loss settlements at the date payment is made. Those reserves inherently recognize the effects of
98
inflation. However, the actual effects of inflation on our results cannot be accurately known until claims are ultimately resolved.
Cash and restricted cash and cash equivalents
Cash and cash equivalents consist of cash held in banks and other short-term, highly liquid investments with original maturity dates of ninety days or less.
Restricted cash and cash equivalents consist of cash held in trust accounts with the Catastrophe Reinsurer, securing collateralized reinsurance contracts written, trust accounts securing obligations under certain reinsurance contracts and cash held with brokers securing letters of credit issued under credit facilities.
Letter of Credit Facilities
As of
December 31, 2014
, we had entered into the following letter of credit facilities, which automatically renew annually unless terminated by either party in accordance with the required notice period:
|
Facility (3)
|
Renewal date
|
||||
|
($ in thousands)
|
|||||
|
BNP Paribas (1)
|
$
|
100,000
|
|
February 15, 2015
|
|
|
Citibank (2)
|
250,000
|
|
January 23, 2015
|
||
|
J.P. Morgan
|
50,000
|
|
August 22, 2014
|
||
|
$
|
400,000
|
|
|||
|
(1)
|
Effective February 15, 2015, the BNP Paribas facility was renewed until February 15, 2016.
|
|
(2)
|
Effective January 23, 2015, the Citibank facility was renewed until January 23, 2016.
|
|
(3)
|
On February 26, 2015, we entered into a letter of credit facility with Lloyds Bank for
$150.0 million
.
|
As of
December 31, 2014
, $
218.5 million
(
December 31, 2013
-
$127.3 million
) of letters of credit, representing
54.6%
of the total available facilities, had been drawn upon (
December 31, 2013
–
42.4%
(based on total available facilities of $300 million)).
Under the facilities, we provide collateral that may consist of equity securities, repurchase agreements, restricted cash, and cash and cash equivalents. As of
December 31, 2014
, total cash and cash equivalents with a fair value of
$219.0 million
(
December 31, 2013
- $
100.6 million
) were pledged as security against the letters of credit issued. These amounts are included in restricted cash and cash equivalents in the consolidated balance sheets. Each of the facilities contain customary events of default and restrictive covenants, including but not limited to, limitations on liens on collateral, transactions with affiliates, mergers and sales of assets, as well as solvency and maintenance of certain minimum pledged equity requirements, A.M. Best Company rating of “A-“ or higher. Each restricts issuance of any debt without the consent of the letter of credit provider. Additionally, if an event of default exists, as defined in the letter of credit facilities, we will be prohibited from paying dividends. We were in compliance with all of the covenants as of
December 31, 2014
.
Financial Condition
Shareholders’ equity
As of
December 31, 2014
, total shareholders’ equity was
$1,552.0 million
compared to
$1,510.4 million
as of
December 31, 2013
. This increase was primarily due to net income of
$50.4 million
offset by net distributions and contributions of non-controlling interests of
$31.1 million
, primarily related to our investment in our joint venture with Third Point LLC.
99
Investments
As of
December 31, 2014
, total cash and net investments managed by Third Point LLC at fair value was
$1,802.2 million
compared to
$1,559.4 million
as of
December 31, 2013
. The increase was primarily due to float of
$163.0 million
million generated by our reinsurance operations and net investment income for the year ended
December 31, 2014
.
Contractual Obligations
As of December 31, 2014:
|
Total
|
Less than 1 year
|
1-3 years
|
3-5 years
|
More than 5 years
|
|||||||||||||||
|
($ in thousands)
|
|||||||||||||||||||
|
Loss and loss adjustment expense reserves (1)
|
$
|
277,362
|
|
$
|
104,458
|
|
$
|
78,654
|
|
$
|
78,908
|
|
$
|
15,342
|
|
||||
|
Other operating agreements (2)
|
1,323
|
|
660
|
|
663
|
|
—
|
|
—
|
|
|||||||||
|
Rental leases (3)
|
411
|
|
411
|
|
—
|
|
—
|
|
—
|
|
|||||||||
|
Deposit liabilities (4)
|
145,430
|
|
734
|
|
60,989
|
|
40,779
|
|
42,928
|
|
|||||||||
|
$
|
424,526
|
|
$
|
106,263
|
|
$
|
140,306
|
|
$
|
119,687
|
|
$
|
58,270
|
|
|||||
|
(1)
|
We have estimated the expected payout pattern of the loss and loss adjustment expense reserves by applying estimated payout patterns by contract. The amount and timing of actual loss payments could differ materially from the estimated payouts in the table above. Please refer to “Critical Policies and Accounting Estimates - Loss and Loss Adjustment Expense Reserves” for additional information.
|
|
(2)
|
On December 20, 2011, Third Point Re acquired from Netjets Sales Inc. (“Netjets”), two 12.5%, five year, undivided interests in two aircraft. On September 3, 2014, Third Point Re acquired an undivided 6.25% interest in one additional aircraft for a five year period, with a minimum commitment period of two and a half years. The agreement with Netjets provides for monthly management fees, occupied hourly fees and other fees.
|
|
(3)
|
We lease office space at Chesney House in Bermuda. This two year lease is scheduled to expire on November 30, 2015, with an option to renew for an additional three years. We also lease office space in New Jersey, U.S.A. This 6 months lease expires on July 31, 2015 and will be extended automatically for successive periods of six months until terminated.
|
|
(4)
|
See
Note 11
to our consolidated financial statements for detailed information on deposit liability contracts. For purposes of this contractual obligations table, we have included estimates of future interest accruals and what we expect the deposit liability contracts would settle for at their probable commutation dates.
|
The contractual obligations table above does not include an estimate of the period of cash settlement of our uncertain tax positions with the respective taxing authorities given that we cannot make a reasonable reliable estimate of the timing of cash settlements.
Off-Balance Sheet Commitments and Arrangements
We have no obligations, assets or liabilities, other than those derivatives in our investment portfolio and disclosed in our notes to consolidated financial statements, which would be considered off-balance sheet arrangements. We do not participate in transactions that create relationships with unconsolidated entities or financial partnerships, often referred to as variable interest entities, which would have been established for the purpose of facilitating off-balance sheet arrangements.
As of December 31, 2014, we had an unfunded capital commitment of
$4.2 million
related to our investment in the Hellenic Fund (see
Note 17
for additional information) and an unfunded capital commitment of $25.0 million related to our investment in the Kiskadee Fund (See
Note 5
to our consolidated financial statements for additional information). On January 2, 2014, we funded $5.0 million of our $25.0 million commitment to the Kiskadee Fund, and expect to fund the remainder in June 2015.
We believe we are principally exposed to the following types of market risk:
|
•
|
equity price risk;
|
100
|
•
|
foreign currency risk;
|
|
•
|
interest rate risk;
|
|
•
|
commodity price risk;
|
|
•
|
credit risk; and
|
|
•
|
political risk.
|
Equity Price Risk
Our investment manager, Third Point LLC, continually tracks the performance and exposures of our entire investment portfolio, each strategy and sector, and selective individual securities. A particular focus is placed on “beta” exposure, which is the portion of the portfolio that is directly correlated to risks and movements of the equity market as a whole (usually represented by the S&P 500 index) as opposed to idiosyncratic risks and factors associated with a specific position. Further, the performance of our investment portfolio has historically been compared to several market indices, including the S&P 500, CS/Tremont Event Driven Index, HFRI Event Driven Index, and others.
As of
December 31, 2014
, our investment portfolio included long and short equity securities, along with certain equity-based derivative instruments, the carrying values of which are primarily based on quoted market prices. Generally, market prices of common equity securities are subject to fluctuation, which could cause the amount to be realized upon the closing of the position to differ significantly from their current reported value. This risk is partly mitigated by the presence of both long and short equity securities in our investment portfolio. As of
December 31, 2014
, a 10% decline in the value of all equity and equity-linked derivatives would result in a loss of $116.5 million, or 6.3% in the fair value of our total net investments managed by Third Point LLC.
Computations of the prospective effects of hypothetical equity price changes are based on numerous assumptions, including the maintenance of the existing level and composition of investment securities and should not be relied on as indicative of future results.
Foreign Currency Risk
Reinsurance contracts
We have foreign currency exposure related to non-U.S. dollar denominated reinsurance contracts. We wrote non-U.S. dollar denominated reinsurance contracts for the first time during in the year ended December 31, 2014. Of our gross premiums written from inception, $48.5 million, or 4.1%, were written in currencies other than the U.S. dollar. For these contracts, non-U.S. dollar assets generally offset liabilities in the same non-U.S. dollar currencies resulting in minimal net exposure. As of December 31, 2014, loss and loss adjustment expense reserves included $6.1 million in foreign currencies.
Investments
Third Point LLC continually measures foreign currency exposures in the investment portfolio and compares current exposures to historical movement within the relevant currencies. Within the typical course of business, Third Point LLC may decide to hedge foreign currency risk within our investment portfolio by using short-term forward contracts; however, from time to time Third Point LLC may determine not to hedge based on its views of the likely movements of the underlying currency.
We are exposed to foreign currency risk through cash, forwards, options and investments in securities denominated in foreign currencies. Foreign currency exchange rate risk is the potential for adverse changes in the U.S. dollar value of investments (long and short) and foreign currency derivative instruments, which we employ from both a speculative and risk management perspective, due to a change in the exchange rate of the foreign currency in which cash and financial instruments are denominated. As of December 31, 2014, our total net short exposure to foreign denominated securities represented 3.4% (
December 31, 2013
- net short exposure of 6.2%) of our investment portfolio including cash and cash equivalents, was $61.0 million (
December 31, 2013
- net short exposure $97.7 million).
101
The following table summarizes the net impact that 10% increase and decrease in the value of the U.S. dollar against select foreign currencies would have had on the value of our investment portfolio as of December 31, 2014:
|
10% increase in U.S. dollar
|
10% decrease in U.S. dollar
|
||||||||||||
|
Foreign Currency
|
Change in fair value
|
Change in fair value as % of investment portfolio
|
Change in fair value
|
Change in fair value as % of investment portfolio
|
|||||||||
|
($ in thousands)
|
|||||||||||||
|
Euro
|
$
|
2,418
|
|
0.13
|
%
|
$
|
(2,418
|
)
|
(0.13
|
)%
|
|||
|
Japanese Yen
|
322
|
|
0.02
|
%
|
(322
|
)
|
(0.02
|
)%
|
|||||
|
British Pound
|
25
|
|
—
|
%
|
(25
|
)
|
—
|
%
|
|||||
|
Other
|
3,335
|
|
0.18
|
%
|
(3,335
|
)
|
(0.18
|
)%
|
|||||
|
Total
|
$
|
6,100
|
|
0.33
|
%
|
$
|
(6,100
|
)
|
(0.33
|
)%
|
|||
Interest Rate Risk
Our investment portfolio includes interest rate sensitive securities, such as corporate and sovereign debt instruments, asset-backed securities (“ABS”), and interest rate options. One key market risk exposure for any debt instrument is interest rate risk. As interest rates rise, the fair value of our long fixed-income portfolio falls, and the opposite is also true as interest rates fall. Additionally, some of our corporate and sovereign debt instruments, ABS and derivative investments may also be credit sensitive and their value may indirectly fluctuate with changes in interest rates.
The effects of interest rate movement have historically not had a material impact on the performance of our investment portfolio as managed by Third Point LLC. However, our investment manager monitors the potential effects of interest rate shifts by performing stress tests against the portfolio composition using a proprietary in-house risk system.
The following table summarizes the impact that a 100 basis point increase or decrease in interest rates would have on the value of our investment portfolio as of
December 31, 2014
:
|
100 basis point increase in interest rates
|
100 basis point decrease in interest rates
|
||||||||||||
|
Change in fair value
|
Change in fair value as % of investment portfolio
|
Change in fair value
|
Change in fair value as % of investment portfolio
|
||||||||||
|
($ in thousands)
|
|||||||||||||
|
Corporate and Sovereign Debt Instruments
|
$
|
(10,486
|
)
|
(0.60
|
)%
|
$
|
11,836
|
|
0.60
|
%
|
|||
|
Asset Backed Securities
(1)
|
(10,521
|
)
|
(0.60
|
)%
|
12,485
|
|
0.70
|
%
|
|||||
|
Net exposure to interest rate risk
|
$
|
(21,007
|
)
|
(1.20
|
)%
|
$
|
24,321
|
|
1.30
|
%
|
|||
|
(1)
|
Includes instruments for which durations are available on
December 31, 2014
. Includes a convexity adjustment if convexity is available. Not included are mortgage hedges which would reduce the impact of rate changes.
|
For the purposes of the above tables, the hypothetical impact of changes in interest rates on debt instruments, ABS, and interest rate options was determined based on the interest rates and credit spreads applicable to each instrument individually. We and our investment manager periodically monitor our net exposure to interest rate risk and generally do not expect changes in interest rates to have a materially adverse impact on our operations.
102
Commodity Price Risk
In managing our investment portfolio, Third Point LLC periodically monitors and actively trades to take advantage of, and/or seeks to minimize any damage from, fluctuations in commodity prices. As our investment manager, Third Point LLC may choose to opportunistically make a long or short investment in a commodity or in a security directly impacted by the price of a commodity as a response to market developments. From time to time, we invest in commodities or commodities exposures in the form of derivative contracts from both a speculative and risk management perspective. Generally, market prices of commodities are subject to fluctuation. As of December 31, 2014, a 10% decline in the price of each of these commodities and commodity-linked securities would have resulted in a loss of $0.0 million in total net investments managed by Third Point LLC. Generally, market prices of commodities are subject to fluctuation.
As of
December 31, 2014
, our investment portfolio included de minimis exposure to changes in commodity prices, through ownership of physical commodities and commodity-linked securities.
We and our investment manager periodically monitor our exposure to commodity price fluctuations and generally do not expect changes in commodity prices to have a materially adverse impact on our operations.
Credit Risk
We are exposed to credit risk from our clients relating to balances receivable under our reinsurance contracts, including premiums receivable, and the possibility that counterparties may default on their obligations to us. The risk of counterparty default is partially mitigated by the fact that any amount owed to us from a reinsurance counterparty is netted against any claims related losses we would pay in the future. We monitor the collectability of these balances on a regular basis.
We are also exposed to credit risk through our investment activities related to our separate accounts managed by Third Point LLC. Third Point LLC typically performs intensive fundamental analysis on the broader markets, credit spreads, security-specific information, and the underlying issuers of debt securities that are contained in our investment portfolio.
In addition, the securities, commodities, and cash in our investment portfolio are held with several prime brokers, subjecting us to the related credit risk from the possibility that one or more of them may default on their obligations to us. Our investment manager closely and regularly monitors the concentration of credit risk with each broker and if necessary, transfers cash or securities among brokers to diversify and mitigate our credit risk.
We also have credit risk exposure in several reinsurance contracts with companies that write credit risk insurance.
Political Risk
We are exposed to political risk to the extent our investment manager trades securities that are listed on various U.S. and foreign exchanges and markets. The governments in any of these jurisdictions could impose restrictions, regulations or other measures, which may have a material impact on our investment strategy and underwriting operations.
In managing our investment portfolio, Third Point LLC routinely monitors and assesses relative levels of risks associated with local political and market conditions and focuses its investments primarily in countries in which it believes the rule of law is respected and followed, thereby affording more predictable outcomes of investments in that country.
We also have political risk exposure in several reinsurance contracts with companies that write political risk insurance.
103
Recent Accounting Pronouncements
Please refer to
Note 2
to our consolidated financial statements for the year ended
December 31, 2014
included in Item 8 of this Annual Report on Form 10-K for details of recently issued accounting standards.
See our consolidated financial statements and notes thereto and required financial statement schedules commencing on page F-1.
Not applicable.
(a)
Evaluation of Disclosure Controls and Procedures
Management, with the participation of our Chief Executive Officer and the Chief Financial Officer, evaluated the effectiveness of the design and operation of the Company’s disclosure controls and procedures (as defined in Rules 13a-15(e) and 15d-15(e) of the Securities Exchange Act of 1934, as amended) as of
December 31, 2014
. Based upon this evaluation, our Chief Executive Officer and the Chief Financial Officer have concluded that our disclosure controls and procedures were effective as of
December 31, 2014
.
(b) Changes in Internal Control over Financial Reporting
There have been no material changes to our internal control over financial reporting in connection with the evaluation required by Rules 13a-15(f) and 15d-15(f) under the Exchange Act during the most recent fiscal quarter that have materially affected, or are reasonably likely to materially affect, our internal control over financial reporting.
(c) Management’s Annual Report on Internal Control Over Financial Reporting
Our management is responsible for establishing and maintaining adequate internal control over financial reporting for the company. Internal control over financial reporting is defined in Rule 13a-15(f) or 15d-15(f) promulgated under the Securities Exchange Act of 1934 as a process designed by, or under the supervision of, the company’s principal executive and principal financial officers and effected by the company’s board of directors, management and other personnel, to provide reasonable assurance regarding the reliability of financial reporting and the preparation of financial statements for external purposes in accordance with generally accepted accounting principles and includes those policies and procedures that:
|
•
|
pertain to the maintenance of records that in reasonable detail accurately and fairly reflect the transactions and dispositions of the assets of the company;
|
|
•
|
provide reasonable assurance that transactions are recorded as necessary to permit preparation of financial statements in accordance with generally accepted accounting principles, and that receipts and expenditures of the company are being made only in accordance with authorizations of management and directors of the company; and
|
|
•
|
provide reasonable assurance regarding prevention or timely detection of unauthorized acquisition, use or disposition of the company’s assets that could have a material effect on the financial statements.
|
Because of its inherent limitations, internal control over financial reporting may not prevent or detect misstatements. Therefore, even those systems determined to be effective can provide only reasonable assurance with respect to financial statement preparation and presentation. Projections of any evaluation of effectiveness to future periods are subject to the risk that controls may become inadequate because of changes in conditions, or that the degree of compliance with the policies or procedures may deteriorate.
104
Our management assessed the effectiveness of our internal control over financial reporting as of December 31, 2014. In making this assessment, management used the criteria set forth by the Internal Control - Integrated Framework issued by the Committee of Sponsoring Organizations of the Treadway Commission (2013 Framework). Based on its assessment, management concluded that, as of December 31, 2014, our internal control over financial reporting is effective based on those criteria.
Ernst & Young Ltd., an independent registered public accounting firm, which has audited and reported on the consolidated financial statements contained in this Annual Report on Form 10-K, has issued its written attestation report on its assessment of our internal control over financial reporting, which follows this report.
(d) Report of Independent Registered Public Accounting Firm
The Board of Directors and Shareholders of Third Point Reinsurance Ltd.
We have audited Third Point Reinsurance Ltd.’s internal control over financial reporting as of December 31, 2014, based on criteria established in Internal Control - Integrated Framework issued by the Committee of Sponsoring Organizations of the Treadway Commission (2013 framework) (the “COSO criteria”). Third Point Reinsurance Ltd.’s management is responsible for maintaining effective internal control over financial reporting, and for its assessment of the effectiveness of internal control over financial reporting included in the accompanying Management’s Annual Report on Internal Control Over Financial Reporting. Our responsibility is to express an opinion on the Company’s internal control over financial reporting based on our audit.
We conducted our audit in accordance with the standards of the Public Company Accounting Oversight Board (United States). Those standards require that we plan and perform the audit to obtain reasonable assurance about whether effective internal control over financial reporting was maintained in all material respects. Our audit included obtaining an understanding of internal control over financial reporting, assessing the risk that a material weakness exists, testing and evaluating the design and operating effectiveness of internal control based on the assessed risk, and performing such other procedures as we considered necessary in the circumstances. We believe that our audit provides a reasonable basis for our opinion.
A company’s internal control over financial reporting is a process designed to provide reasonable assurance regarding the reliability of financial reporting and the preparation of financial statements for external purposes in accordance with generally accepted accounting principles. A company’s internal control over financial reporting includes those policies and procedures that (1) pertain to the maintenance of records that, in reasonable detail, accurately and fairly reflect the transactions and dispositions of the assets of the company; (2) provide reasonable assurance that transactions are recorded as necessary to permit preparation of financial statements in accordance with generally accepted accounting principles, and that receipts and expenditures of the company are being made only in accordance with authorizations of management and directors of the company; and (3) provide reasonable assurance regarding prevention or timely detection of unauthorized acquisition, use, or disposition of the company’s assets that could have a material effect on the financial statements.
Because of its inherent limitations, internal control over financial reporting may not prevent or detect misstatements. Also, projections of any evaluation of effectiveness to future periods are subject to the risk that controls may become inadequate because of changes in conditions, or that the degree of compliance with the policies or procedures may deteriorate.
In our opinion, Third Point Reinsurance Ltd. maintained, in all material respects, effective internal control over financial reporting as of December 31, 2014, based on the COSO criteria.
We also have audited, in accordance with the standards of the Public Company Accounting Oversight Board (United States), the consolidated balance sheets of Third Point Reinsurance Ltd. as of December 31, 2014 and 2013, and the related consolidated statements of income, shareholders’ equity and cash flows for each of the three years in the period ended December 31, 2014, and our report dated February 27, 2015 expressed an unqualified opinion thereon.
/s/ Ernst & Young Ltd.
105
Hamilton, Bermuda
February 27, 2015
On February 26, 2015, the parties to the Founders’ Agreement (the “Founders’ Agreement”), dated as of December 22, 2011, by and among Third Point Reinsurance Company Ltd., KEP TP Bermuda Ltd., KIA TP Bermuda Ltd., Pine Brook LVR, L.P., P RE Opportunities Ltd. and Dowling Capital Partners I, L.P. amended and restated their agreement to add Third Point Reinsurance (USA) Ltd. as a “Payor” under the Founders’ Agreement and to make certain related technical amendments. The foregoing description of the amendment and restatement of the Founders’ Agreement is qualified in its entirety by reference to the Amended and Restated Founders’ Agreement (the “Amended and Restated Founders’ Agreement”), by and among Third Point Reinsurance Company Ltd., Third Point Reinsurance (USA) Ltd., KEP TP Bermuda Ltd., KIA TP Bermuda Ltd., Pine Brook LVR, L.P., P RE Opportunities Ltd. and Dowling Capital Partners I, L.P., a copy of which is attached as Exhibit 4.9 to this Annual Report on Form 10-K and is incorporated herein by reference. The foregoing description of the Amended and Restated Founders’ Agreement does not purport to be complete and is qualified in its entirety by reference to the full text of such agreement.
Certain of the information required by this item relating to the executive officers of the Company may be found starting at page 65. The balance of the information required by this item is omitted because a definitive proxy statement that involves the election of directors will be filed with the Securities and Exchange Commission not later than 120 days after the close of the fiscal year pursuant to Regulation 14A, which proxy statement is incorporated herein by reference.
This item is omitted because a definitive proxy statement that involves the election of directors will be filed with the Securities and Exchange Commission not later than 120 days after the close of the fiscal year pursuant to Regulation 14A, which proxy statement is incorporated herein by reference.
Information relating to this item is set forth in this Annual Report under the caption “Item 5. Market for Registrant’s Common Equity, Related Shareholder Matters and Issuer Purchases of Equity Securities - Equity Compensation Plan Information”.
The balance of the information required by this item is omitted because a definitive proxy statement that involves the election of directors will be filed with the Securities and Exchange Commission not later than 120 days after the close of the fiscal year pursuant to Regulation 14A, which proxy statement is incorporated herein by reference.
This item is omitted because a definitive proxy statement that involves the election of directors will be filed with the Securities and Exchange Commission not later than 120 days after the close of the fiscal year pursuant to Regulation 14A, which proxy statement is incorporated herein by reference.
106
This item is omitted because a definitive proxy statement that involves the election of directors will be filed with the Securities and Exchange Commission not later than 120 days after the close of the fiscal year pursuant to Regulation 14A, which proxy statement is incorporated herein by reference.
107
|
1.1
|
Underwriting Agreement, dated February 10, 2015, among Third Point Re (USA) Holdings Inc., Third Point Reinsurance Ltd., Deutsche Bank Securities Inc. and Credit Suisse Securities (USA) LLC
|
|
3.1*
|
Memorandum of Association of Third Point Reinsurance Ltd.
|
|
3.1.1
|
Certificate of Deposit of Memorandum of Increase of Share Capital of Third Point Reinsurance Ltd. (incorporated by reference to Exhibit 3.1.1 to the Company’s Annual Report on Form 10-K filed with the SEC on February 28, 2014)
|
|
3.2
|
Bye-laws of Third Point Reinsurance Ltd. (incorporated by reference to Exhibit 3.2 to the Company’s Annual Report on Form 10-K filed with the SEC on February 28, 2014)
|
|
3.3
|
Certificate of Incorporation of Third Point Re (USA) Holdings Inc.
|
|
3.4
|
Bylaws of Third Point Re (USA) Holdings Inc. (incorporated by reference to Exhibit 3.2 to the Company’s Current Report on Form 8-K filed with the SEC on January 20, 2015)
|
|
4.1*
|
Specimen Common Share Certificate
|
|
4.2*
|
Registration Rights Agreement, by and among the Third Point Reinsurance Ltd. and each of the Members, dated as of December 22, 2011
|
|
4.3*
|
Warrant to Purchase Common Shares issued to KEP TP Holdings, L.P., dated as of December 22, 2011
|
|
4.4*
|
Warrant to Purchase Common Shares issued to KIA TP Holdings, L.P., dated as of December 22, 2011
|
|
4.5*
|
Warrant to Purchase Common Shares issued to Pine Brook LVR, L.P., dated as of December 22, 2011
|
|
4.6*
|
Warrant to Purchase Common Shares issued to P RE Opportunities Ltd., dated as of December 22, 2011
|
|
4.7*
|
Warrant Subscription Agreement, by and among Third Point Reinsurance Ltd. and each of the signatories thereto, dated as of December 22, 2011
|
|
4.8*
|
Agreement among Members by and among Third Point Reinsurance Ltd. and each of the Members, dated as of December 22, 2011
|
|
4.9
|
Amended and Restated Founders Agreement, by and among Third Point Reinsurance Company Ltd., Third Point Reinsurance (USA) Ltd., KEP TP Bermuda Ltd., KIA TP Bermuda Ltd., Pine Brook LVR, L.P., P RE Opportunities Ltd. and Dowling Capital Partners I, L.P. dated as of February 25, 2015
|
|
4.10
|
Senior Indenture, dated as of February 13, 2015, among Third Point Re (USA) Holdings Inc., as issuer, Third Point Reinsurance Ltd., as guarantor, and The Bank of New York Mellon, as Trustee (incorporated by reference to Exhibit 4.1 to the Company’s Current Report on From 8-K filed with the SEC on February 13, 2015)
|
|
4.11
|
First Supplemental Indenture, dated as of February 13, 2015, among Third Point Re (USA) Holdings Inc., as issuer, Third Point Reinsurance Ltd., as guarantor, and The Bank of New York Mellon, as Trustee (incorporated by reference to Exhibit 4.2 to the Company’s Current Report on From 8-K filed with the SEC on February 13, 2015)
|
|
4.12
|
7.00% Senior Note due 2025 (incorporated by reference to Exhibit 4.3 to the Company’s Current Report on From 8-K filed with the SEC on February 13, 2015)
|
|
10.1*
|
Joint Venture and Investment Management Agreement, by and among Third Point Reinsurance Ltd., Third Point Reinsurance Company, Ltd., Third Point Advisors LLC and Third Point LLC, dated as of December 22, 2011
|
|
10.1.1
|
Joint Venture and Investment Management Agreement by and among Third Point Reinsurance (USA) Ltd., Third Point Advisors LLC and Third Point LLC, dated as of January 28, 2015
|
|
10.2***
|
Employment Agreement between Third Point Reinsurance Ltd. and John R. Berger, dated as of December 22, 2011
|
E-1
|
10.2.1**
|
Amendment No. 1 to Employment Agreement between Third Point Reinsurance Ltd. and John Berger, dated as of December 22, 2014
|
|
10.3***
|
Employment Agreement between Third Point Reinsurance Ltd. and J. Robert Bredahl, dated as of January 26, 2012
|
|
10.3.1**
|
Amendment No. 1 to Employment Agreement between Third Point Reinsurance Ltd. and J. Robert Bredahl, dated as of November 10, 2014
|
|
10.4***
|
Employment Agreement between Third Point Reinsurance Ltd. and Daniel Victor Malloy III, dated as of January 23, 2012
|
|
10.5***
|
Share Incentive Plan
|
|
10.6***
|
Form of Restricted Share Award Agreement
|
|
10.6.1**
|
Form of Director Service Restricted Share Award Agreement (incorporated by reference to Exhibit 10.6.1 to the Company’s Annual Report on Form 10-K filed with the SEC on February 28, 2014)
|
|
10.6.2**
|
Form of Employee Restricted Share Award Agreement (incorporated by reference to Exhibit 10.1 to the Company’s Current Report on Form 8-K/A filed with the SEC on January 6, 2015)
|
|
10.6.3**
|
Form of Employee Performance Restricted Shares Agreement
|
|
10.7***
|
Form of Nonqualified Share Option Agreement under the Share Incentive Plan
|
|
10.8**
|
Form of Director Service Agreement (Adopted November 2013) (incorporated by reference to Exhibit 10.8.1 to the Company’s Annual Report on Form 10-K filed with the SEC on February 28, 2014)
|
|
10.8.1**
|
Schedule of Signatories to the Director Service Agreement
|
|
10.9***
|
Management Compensation Cash Bonus Pool
|
|
10.10***
|
Third Point Reinsurance Ltd. 2013 Omnibus Incentive Plan
|
|
10.11***
|
Third Point Reinsurance Ltd. Annual Incentive Plan
|
|
10.22*
|
Trademark License Agreement between Third Point LLC and Third Point Reinsurance Ltd., dated as of December 22, 2011
|
|
10.23*
|
Trademark License Agreement between Third Point LLC and Third Point Reinsurance Company Ltd., dated as of December 22, 2011
|
|
10.24*
|
Net Retained Lines Quota Share Reinsurance Contract issued to Narragansett Bay Insurance Company, dated as of January 31, 2013
|
|
10.25*
|
Shareholders Agreement between Third Point Reinsurance Investment Management Ltd., Third Point Reinsurance Ltd. and Hiscox Insurance Company (Bermuda) Limited, dated as of December 11, 2012
|
|
10.26*†
|
Letter Agreement dated as of December 22, 2011
|
|
10.27***
|
Section 409A Specified Employee Policy
|
|
10.28***
|
Director and Officer Indemnification Agreement
|
|
10.28.1**
|
Schedule of Signatories to the Director and Officer Indemnification Agreement
|
|
10.29**
|
Director Compensation Policy (incorporated by reference to Exhibit 10.29 to the Company’s Annual Report on Form 10-K filed with the SEC on February 28, 2014)
|
|
10.30**
|
Amended and Restated Employment Agreement between Third Point Reinsurance Ltd. and Christopher S. Coleman, dated as of November 10, 2014
|
|
10.31**
|
Employment Agreement between Third Point Reinsurance Ltd. and Anthony Urban, dated as of October 28, 2011
|
|
10.32**
|
Employment Agreement between Third Point Reinsurance Ltd. and Manoj Gupta, dated as of March 27, 2012
|
|
12.1
|
Computation of Ratio of Earnings to Fixed Charges
|
|
21.1
|
List of Subsidiaries
|
|
23.1
|
Consent of Independent Registered Public Accounting Firm
|
|
24.1
|
Power of Attorney signed by each of the members of the Board of Directors on February 26, 2015
|
E-2
|
31.1
|
Certification of Chief Executive Officer pursuant to Rule 13a-14(a) of the Exchange Act, as amended, as adopted pursuant to Section 302 of the Sarbanes-Oxley Act of 2002.
|
|
31.2
|
Certification of Chief Financial Officer pursuant to Rule 13a-14(a) of the Exchange Act, as amended, as adopted pursuant to Section 302 of the Sarbanes-Oxley Act of 2002.
|
|
32.1±
|
Certification of Principal Executive Officer and Principal Financial Officer pursuant to 18 U.S.C. Section 1350, as adopted pursuant to Section 906 of the Sarbanes-Oxley Act of 2002.
|
|
32.2±
|
Certification of Chief Financial Officer pursuant to 18 U.S.C. Section 1350, as adopted pursuant to Section 906 of the Sarbanes-Oxley Act of 2002.
|
|
101.INS††
|
XBRL Instance Document
|
|
101.SCH††
|
XBRL Taxonomy Extension Schema Document
|
|
101.CAL††
|
XBRL Taxonomy Extension Calculation Linkbase Document
|
|
101.LAB††
|
XBRL Taxonomy Extension Labels Linkbase Document
|
|
101.PRE††
|
XBRL Taxonomy Extension Presentation Linkbase Document
|
|
101.DEF††
|
XBRL Taxonomy Extension Definition Linkbase Document
|
|
*
|
Incorporated by reference to the exhibit of the same number filed as part of the Company’s registration statement on Form S-1 (File No. 333-189960) which was declared effective by the Securities and Exchange Commission on August 14, 2013.
|
|
**
|
Management contracts or compensatory plans or arrangements
|
|
±
|
This certification accompanies the Form 10-K to which it relates, is not deemed filed with the Securities and Exchange Commission and is not to be incorporated by reference into any filing of the Registrant under the Securities Act of 1933, as amended, or the Securities Exchange Act of 1934, as amended (whether made before or after the date of the Form 10-K), irrespective of any general incorporation language contained in such filing.
|
|
†
|
Registrant has omitted portions of the referenced exhibit pursuant to a request for confidential treatment under Rule 406 promulgated under the Securities Act of 1933, as amended (Securities Act).
|
|
††
|
In accordance with Rule 406T of Regulation S-T, the information in these exhibits is furnished and deemed not filed or part of a registration statement or prospectus for purposes of sections 11 or 12 of the Securities Act of 1933, is deemed not filed for purposes of section 18 of the Exchange Act of 1934, and otherwise is not subject to liability under these sections.
|
E-3
SIGNATURES
Pursuant to the requirements of Section 13 or 15(d) of the Securities Exchange Act of 1934, the registrant has duly caused this report to be signed on its behalf by the undersigned, thereunto duly authorized, in Pembroke, Bermuda, on this 27th day of February, 2015.
THIRD POINT REINSURANCE LTD.
(Registrant)
|
By:
|
/s/ John R. Berger
|
Name: John R. Berger
|
Title:
|
Chief Executive Officer and Chairman
|
of the Board
Pursuant to the requirements of the Securities Act of 1933, as amended, this report has been signed below by the following persons on behalf of the registrant and in the capacities and on the dates indicated.
|
Signature
|
Title
|
Date
|
||
|
/s/ John R. Berger
|
Chief Executive Officer and Chairman of the Board
(Principal Executive Officer)
|
February 27, 2015
|
||
|
John R. Berger
|
||||
|
/s/ Christopher S. Coleman
|
Chief Financial Officer
(Principal Financial Officer and Principal Accounting Officer)
|
February 27, 2015
|
||
|
Christopher S. Coleman
|
||||
|
*
|
Director
|
February 27, 2015
|
||
|
Christopher L. Collins
|
||||
|
*
|
Director
|
February 27, 2015
|
||
|
Steven E. Fass
|
||||
|
*
|
Director
|
February 27, 2015
|
||
|
Rafe de la Gueronniere
|
||||
|
*
|
Director
|
February 27, 2015
|
||
|
Mary R. Hennessy
|
||||
|
*
|
Director
|
February 27, 2015
|
||
|
Neil McConachie
|
||||
|
*
|
Director
|
February 27, 2015
|
||
|
Mark Parkin
|
||||
|
*
|
Director
|
February 27, 2015
|
||
|
William Spiegel
|
||||
|
*
|
Director
|
February 27, 2015
|
||
|
Gary D. Walters
|
||||
|
*
|
Director
|
February 27, 2015
|
||
|
Joshua L. Targoff
|
||||
|
* By:
|
/s/ Tonya L. Marshall
|
|||
|
Name:
Title:
|
Name: Tonya L. Marshall
Attorney-in-Fact
|
|||
E-4
THIRD POINT REINSURANCE LTD.
INDEX TO CONSOLIDATED FINANCIAL STATEMENTS AND SUPPLEMENTAL DATA
|
|
Page
|
|
Audited Consolidated Financial Statements
|
|
|
Report of Independent Registered Public Accounting Firm
|
F-2
|
|
Consolidated Balance Sheets as of December 31, 2014 and 2013
|
F-3
|
|
Consolidated Statements of Income for the years ended December 31, 2014, 2013 and 2012
|
F-4
|
|
Consolidated Statements of Changes in Shareholders’ Equity for the years ended December 31, 2014, 2013 and 2012
|
F-5
|
|
Consolidated Statements of Cash Flows for the years ended December 31, 2014, 2013 and 2012
|
F-6
|
|
Notes to the Consolidated Financial Statements
|
F-7
|
|
Schedule I - Summary of Investments - Other than Investments in Related Parties
|
F-59
|
|
Schedule III - Supplementary Insurance Information
|
F-60
|
|
Schedule IV - Reinsurance
|
F-61
|
All other schedules and notes specified under Regulation S-X are omitted because they are either not applicable, not required or the information called for therein appears in response to the items in the Consolidated Financial Statements and the related Notes to Consolidated Financial Statements of Third Point Reinsurance Ltd. and its subsidiaries listed on the above index.
F-1
Report of Independent Registered Public Accounting Firm
The Board of Directors and Shareholders of Third Point Reinsurance Ltd.
We have audited the accompanying consolidated balance sheets of Third Point Reinsurance Ltd. as of December 31, 2014 and 2013, and the related consolidated statements of income, shareholders’ equity and cash flows for each of the three years in the period ended December 31, 2014. Our audits also included the financial statement schedules listed in the Index at Item 15. These financial statements and schedules are the responsibility of the Company’s management. Our responsibility is to express an opinion on these financial statements and schedules based on our audits.
We conducted our audits in accordance with the standards of the Public Company Accounting Oversight Board (United States). Those standards require that we plan and perform the audit to obtain reasonable assurance about whether the financial statements are free of material misstatement. An audit also includes examining, on a test basis, evidence supporting the amounts and disclosures in the financial statements, assessing the accounting principles used and significant estimates made by management, and evaluating the overall financial statement presentation. We believe that our audits provide a reasonable basis for our opinion.
In our opinion, the financial statements referred to above present fairly, in all material respects, the consolidated financial position of Third Point Reinsurance Ltd. at December 31, 2014 and 2013, and the consolidated results of its operations and its cash flows for each of the three years in the period ended December 31, 2014, in conformity with U.S. generally accepted accounting principles. Also, in our opinion, the related financial statement schedules, when considered in relation to the basic financial statements taken as a whole, present fairly in all material respects the information set forth therein.
We also have audited, in accordance with the standards of the Public Company Accounting Oversight Board (United States), Third Point Reinsurance Ltd.’s internal control over financial reporting as of December 31, 2014, based on criteria established in Internal Control-Integrated Framework issued by the Committee of Sponsoring Organizations of the Treadway Commission (2013 framework), and our report dated February 27, 2015 expressed an unqualified opinion thereon.
/s/ Ernst & Young Ltd.
Hamilton, Bermuda
February 27, 2015
F-2
THIRD POINT REINSURANCE LTD.
As of
December 31, 2014
and 2013
(expressed in thousands of U.S. dollars, except per share and share amounts)
|
December 31, 2014
|
December 31, 2013
|
||||||
|
Assets
|
|||||||
|
Equity securities, trading, at fair value (cost - $1,078,859; 2013 - $824,723)
|
$
|
1,177,796
|
|
$
|
954,111
|
|
|
|
Debt securities, trading, at fair value (cost - $546,933; 2013 - $408,754)
|
569,648
|
|
441,424
|
|
|||
|
Other investments, at fair value
|
83,394
|
|
65,329
|
|
|||
|
Total investments in securities and commodities
|
1,830,838
|
|
1,460,864
|
|
|||
|
Cash and cash equivalents
|
28,734
|
|
31,625
|
|
|||
|
Restricted cash and cash equivalents
|
417,307
|
|
193,577
|
|
|||
|
Due from brokers
|
58,241
|
|
98,386
|
|
|||
|
Securities purchased under an agreement to sell
|
29,852
|
|
38,147
|
|
|||
|
Derivative assets, at fair value
|
21,130
|
|
39,045
|
|
|||
|
Interest and dividends receivable
|
2,602
|
|
2,615
|
|
|||
|
Reinsurance balances receivable
|
303,649
|
|
191,763
|
|
|||
|
Deferred acquisition costs, net
|
155,901
|
|
91,193
|
|
|||
|
Loss and loss adjustment expenses recoverable
|
814
|
|
9,277
|
|
|||
|
Other assets
|
3,512
|
|
3,398
|
|
|||
|
Total assets
|
$
|
2,852,580
|
|
$
|
2,159,890
|
|
|
|
Liabilities and shareholders’ equity
|
|||||||
|
Liabilities
|
|||||||
|
Accounts payable and accrued expenses
|
$
|
10,085
|
|
$
|
9,456
|
|
|
|
Reinsurance balances payable
|
27,040
|
|
9,081
|
|
|||
|
Deposit liabilities
|
145,430
|
|
120,946
|
|
|||
|
Unearned premium reserves
|
433,809
|
|
265,187
|
|
|||
|
Loss and loss adjustment expense reserves
|
277,362
|
|
134,331
|
|
|||
|
Securities sold, not yet purchased, at fair value
|
82,485
|
|
56,056
|
|
|||
|
Due to brokers
|
312,609
|
|
44,870
|
|
|||
|
Derivative liabilities, at fair value
|
11,015
|
|
8,819
|
|
|||
|
Interest and dividends payable
|
697
|
|
748
|
|
|||
|
Total liabilities
|
1,300,532
|
|
649,494
|
|
|||
|
Commitments and contingent liabilities
|
|
|
|||||
|
Shareholders’ equity
|
|||||||
|
Preference shares (par value $0.10; authorized, 30,000,000; none issued)
|
—
|
|
—
|
|
|||
|
Common shares (par value $0.10; authorized, 300,000,000; issued and outstanding, 104,473,402 (2013: 103,888,916))
|
10,447
|
|
10,389
|
|
|||
|
Additional paid-in capital
|
1,065,489
|
|
1,055,690
|
|
|||
|
Retained earnings
|
375,977
|
|
325,582
|
|
|||
|
Shareholders’ equity attributable to shareholders
|
1,451,913
|
|
1,391,661
|
|
|||
|
Non-controlling interests
|
100,135
|
|
118,735
|
|
|||
|
Total shareholders’ equity
|
1,552,048
|
|
1,510,396
|
|
|||
|
Total liabilities and shareholders’ equity
|
$
|
2,852,580
|
|
$
|
2,159,890
|
|
|
|
The accompanying Notes to the Consolidated Financial Statements are
|
|||||||
|
an integral part of the Consolidated Financial Statements.
|
|||||||
F-3
THIRD POINT REINSURANCE LTD.
For the years ended
December 31, 2014
,
2013
and 2012
(expressed in thousands of U.S. dollars, except per share and share amounts)
|
2014
|
2013
|
2012
|
||||||||||
|
Revenues
|
||||||||||||
|
Gross premiums written
|
$
|
613,300
|
|
$
|
401,937
|
|
$
|
190,374
|
|
|||
|
Gross premiums ceded
|
(150
|
)
|
(9,975
|
)
|
—
|
|
||||||
|
Net premiums written
|
613,150
|
|
391,962
|
|
190,374
|
|
||||||
|
Change in net unearned premium reserves
|
(168,618
|
)
|
(171,295
|
)
|
(93,893
|
)
|
||||||
|
Net premiums earned
|
444,532
|
|
220,667
|
|
96,481
|
|
||||||
|
Net investment income
|
85,582
|
|
258,125
|
|
136,868
|
|
||||||
|
Total revenues
|
530,114
|
|
478,792
|
|
233,349
|
|
||||||
|
Expenses
|
||||||||||||
|
Loss and loss adjustment expenses incurred, net
|
283,147
|
|
139,812
|
|
80,306
|
|
||||||
|
Acquisition costs, net
|
137,206
|
|
67,944
|
|
24,604
|
|
||||||
|
General and administrative expenses
|
40,008
|
|
33,036
|
|
27,376
|
|
||||||
|
Other expenses
|
7,395
|
|
4,922
|
|
446
|
|
||||||
|
Total expenses
|
467,756
|
|
245,714
|
|
132,732
|
|
||||||
|
Income before income tax expense
|
62,358
|
|
233,078
|
|
100,617
|
|
||||||
|
Income tax expense
|
(5,648
|
)
|
—
|
|
—
|
|
||||||
|
Income including non-controlling interests
|
56,710
|
|
233,078
|
|
100,617
|
|
||||||
|
Income attributable to non-controlling interests
|
(6,315
|
)
|
(5,767
|
)
|
(1,216
|
)
|
||||||
|
Net income
|
$
|
50,395
|
|
$
|
227,311
|
|
$
|
99,401
|
|
|||
|
Earnings per share
|
||||||||||||
|
Basic
|
$
|
0.48
|
|
$
|
2.58
|
|
$
|
1.26
|
|
|||
|
Diluted
|
$
|
0.47
|
|
$
|
2.54
|
|
$
|
1.26
|
|
|||
|
Weighted average number of common shares used in the determination of earnings per share
|
||||||||||||
|
Basic
|
103,287,693
|
|
87,505,540
|
|
78,432,132
|
|
||||||
|
Diluted
|
106,391,059
|
|
88,970,531
|
|
78,598,236
|
|
||||||
|
The accompanying Notes to the Consolidated Financial Statements are
|
||||||||||||
|
an integral part of the Consolidated Financial Statements.
|
||||||||||||
F-4
THIRD POINT REINSURANCE LTD.
CONSOLIDATED STATEMENTS OF SHAREHOLDERS’ EQUITY
For the years ended
December 31, 2014
,
2013
and 2012
(expressed in thousands of U.S. dollars, except share amounts)
|
2014
|
2013
|
2012
|
|||||||||
|
Common shares
|
|||||||||||
|
Balance, beginning of period
|
103,888,916
|
|
78,432,132
|
|
78,432,132
|
|
|||||
|
Issuance of common shares
|
584,486
|
|
25,456,784
|
|
—
|
|
|||||
|
Balance, end of period
|
104,473,402
|
|
103,888,916
|
|
78,432,132
|
|
|||||
|
Common shares
|
|||||||||||
|
Balance, beginning of period
|
$
|
10,389
|
|
$
|
7,843
|
|
$
|
7,843
|
|
||
|
Issuance of common shares
|
58
|
|
2,546
|
|
—
|
|
|||||
|
Balance, end of period
|
10,447
|
|
10,389
|
|
7,843
|
|
|||||
|
Additional paid-in capital
|
|||||||||||
|
Balance, beginning of period
|
1,055,690
|
|
762,430
|
|
756,219
|
|
|||||
|
Issuance of common shares, net
|
541
|
|
283,460
|
|
(197
|
)
|
|||||
|
Fair value of Founder and advisor warrants
|
—
|
|
3,747
|
|
—
|
|
|||||
|
Fair value of warrants qualifying as shareholders’ equity
|
—
|
|
(3,747
|
)
|
—
|
|
|||||
|
Share compensation expense
|
9,258
|
|
9,800
|
|
6,408
|
|
|||||
|
Balance, end of period
|
1,065,489
|
|
1,055,690
|
|
762,430
|
|
|||||
|
Subscriptions receivable
|
|||||||||||
|
Balance, beginning of period
|
—
|
|
—
|
|
(177,507
|
)
|
|||||
|
Receipt of subscriptions due from shareholders
|
—
|
|
—
|
|
177,507
|
|
|||||
|
Balance, end of period
|
—
|
|
—
|
|
—
|
|
|||||
|
Retained earnings
|
|||||||||||
|
Balance, beginning of period
|
325,582
|
|
98,271
|
|
(1,130
|
)
|
|||||
|
Income including non-controlling interests
|
56,710
|
|
233,078
|
|
100,617
|
|
|||||
|
Income attributable to non-controlling interests
|
(6,315
|
)
|
(5,767
|
)
|
(1,216
|
)
|
|||||
|
Balance, end of period
|
375,977
|
|
325,582
|
|
98,271
|
|
|||||
|
Shareholders’ equity attributable to shareholders
|
1,451,913
|
|
1,391,661
|
|
868,544
|
|
|||||
|
Non-controlling interests
|
|||||||||||
|
Balance, beginning of period
|
118,735
|
|
59,777
|
|
—
|
|
|||||
|
Non-controlling interest in investment affiliate, net
|
(31,066
|
)
|
27,867
|
|
38,913
|
|
|||||
|
Non-controlling interest in Catastrophe Fund
|
6,151
|
|
25,324
|
|
19,646
|
|
|||||
|
Non-controlling interest in Catastrophe Manager
|
—
|
|
—
|
|
2
|
|
|||||
|
Income attributable to non-controlling interests
|
6,315
|
|
5,767
|
|
1,216
|
|
|||||
|
Balance, end of period
|
100,135
|
|
118,735
|
|
59,777
|
|
|||||
|
Total shareholders’ equity
|
$
|
1,552,048
|
|
$
|
1,510,396
|
|
$
|
928,321
|
|
||
|
The accompanying Notes to the Consolidated Financial Statements are
|
|||||||||||
|
an integral part of the Consolidated Financial Statements.
|
|||||||||||
F-5
THIRD POINT REINSURANCE LTD.
For the years ended
December 31, 2014
,
2013
and 2012
(expressed in thousands of U.S. dollars, except per share and share amounts)
|
2014
|
2013
|
2012
|
|||||||||
|
Operating activities
|
|||||||||||
|
Income including non-controlling interests
|
$
|
56,710
|
|
$
|
233,078
|
|
$
|
100,617
|
|
||
|
Adjustments to reconcile income including non-controlling interests to net cash provided by (used in) operating activities
|
|
||||||||||
|
Share compensation expense
|
9,258
|
|
9,800
|
|
6,408
|
|
|||||
|
Interest expense on deposit liabilities
|
4,346
|
|
4,271
|
|
296
|
|
|||||
|
Net unrealized (gain) loss on investments and derivatives
|
85,057
|
|
(78,490
|
)
|
(113,271
|
)
|
|||||
|
Net realized gain on investments and derivatives
|
(193,957
|
)
|
(236,333
|
)
|
(55,632
|
)
|
|||||
|
Amortization of premium and accretion of discount, net
|
(1,044
|
)
|
(262
|
)
|
(2,434
|
)
|
|||||
|
Changes in assets and liabilities:
|
|
||||||||||
|
Reinsurance balances receivable
|
(111,886
|
)
|
(107,483
|
)
|
(84,280
|
)
|
|||||
|
Deferred acquisition costs, net
|
(64,708
|
)
|
(45,810
|
)
|
(45,383
|
)
|
|||||
|
Loss and loss adjustment expenses recoverable
|
8,463
|
|
(9,277
|
)
|
—
|
|
|||||
|
Other assets
|
(114
|
)
|
(275
|
)
|
(1,701
|
)
|
|||||
|
Interest and dividends receivable, net
|
(38
|
)
|
(1,034
|
)
|
(833
|
)
|
|||||
|
Unearned premium reserves
|
168,622
|
|
171,294
|
|
93,893
|
|
|||||
|
Loss and loss adjustment expense reserves
|
143,031
|
|
67,060
|
|
67,271
|
|
|||||
|
Accounts payable and accrued expenses
|
629
|
|
4,089
|
|
4,157
|
|
|||||
|
Reinsurance balances payable
|
18,061
|
|
9,081
|
|
—
|
|
|||||
|
Net cash provided by (used in) operating activities
|
122,430
|
|
19,709
|
|
(30,892
|
)
|
|||||
|
Investing activities
|
|||||||||||
|
Purchases of investments
|
(3,114,906
|
)
|
(2,172,077
|
)
|
(2,317,234
|
)
|
|||||
|
Proceeds from sales of investments
|
2,857,404
|
|
1,943,655
|
|
1,521,110
|
|
|||||
|
Purchases of investments to cover short sales
|
(232,568
|
)
|
(407,965
|
)
|
(535,443
|
)
|
|||||
|
Proceeds from short sales of investments
|
278,569
|
|
290,770
|
|
729,182
|
|
|||||
|
Change in due to/from brokers, net
|
307,884
|
|
12,162
|
|
(65,678
|
)
|
|||||
|
Increase (decrease) in securities purchased under an agreement to sell
|
8,294
|
|
22,261
|
|
(60,408
|
)
|
|||||
|
Change in restricted cash and cash equivalents
|
(223,730
|
)
|
(115,950
|
)
|
(77,627
|
)
|
|||||
|
Net cash used in investing activities
|
(119,053
|
)
|
(427,144
|
)
|
(806,098
|
)
|
|||||
|
Financing activities
|
|||||||||||
|
Proceeds from issuance of common shares, net of costs
|
599
|
|
286,095
|
|
158,593
|
|
|||||
|
Increase in deposit liabilities
|
18,048
|
|
65,769
|
|
50,000
|
|
|||||
|
Non-controlling interest in investment affiliate, net
|
(31,066
|
)
|
27,867
|
|
38,913
|
|
|||||
|
Non-controlling interest in Catastrophe Fund
|
6,151
|
|
25,324
|
|
19,646
|
|
|||||
|
Non-controlling interest in Catastrophe Manager
|
—
|
|
—
|
|
2
|
|
|||||
|
Net cash provided by (used in) financing activities
|
(6,268
|
)
|
405,055
|
|
267,154
|
|
|||||
|
Net decrease in cash and cash equivalents
|
(2,891
|
)
|
(2,380
|
)
|
(569,836
|
)
|
|||||
|
Cash and cash equivalents at beginning of period
|
31,625
|
|
34,005
|
|
603,841
|
|
|||||
|
Cash and cash equivalents at end of period
|
$
|
28,734
|
|
$
|
31,625
|
|
$
|
34,005
|
|
||
|
Supplementary information
|
|||||||||||
|
Interest paid in cash
|
$
|
3,237
|
|
$
|
4,221
|
|
$
|
1,823
|
|
||
|
Income taxes paid in cash
|
$
|
3,056
|
|
$
|
—
|
|
$
|
—
|
|
||
|
The accompanying Notes to the Consolidated Financial Statements are
|
|||||||||||
|
an integral part of the Consolidated Financial Statements.
|
|||||||||||
F-6
Third Point Reinsurance Ltd.
Notes to the Consolidated Financial Statements
(Expressed in United States Dollars)
1. Organization
Third Point Reinsurance Ltd. (together with its wholly and majority owned subsidiaries, the “Company”) was incorporated under the laws of Bermuda on October 6, 2011. Through its reinsurance subsidiaries, the Company is a provider of global specialty property and casualty reinsurance products. The Company operates through two licensed reinsurance subsidiaries, Third Point Reinsurance Company Ltd. (“Third Point Re”), a Bermuda reinsurance company that commenced operations in January 2012, and Third Point Reinsurance (USA) Ltd. (“Third Point Re USA”).
Third Point Re USA is a Bermuda reinsurance company that was incorporated on November 21, 2014 and commenced operations in February 2015. Third Point Re USA made an election under Section 953d of the Internal Revenue Code to be taxed as a U.S. entity. Third Point Re USA will price and underwrite U.S. domiciled reinsurance business from an office in the United States. Third Point Re USA is a wholly owned subsidiary of Third Point Re (USA) Holdings, Inc. (“TPRUSA”), an intermediate holding company based in the U.S., which is a wholly owned subsidiary of Third Point Re (UK) Holdings Ltd. (“Third Point Re UK”), an intermediate holding company based in the United Kingdom. Third Point Re UK is a wholly owned subsidiary of Third Point Reinsurance Ltd.
On June 15, 2012, Third Point Reinsurance Opportunities Fund Ltd. (the “Catastrophe Fund”), Third Point Reinsurance Investment Management Ltd. (the “Catastrophe Fund Manager”), and Third Point Re Cat Ltd. (the “Catastrophe Reinsurer”) were incorporated in Bermuda. The Company subsequently announced a strategic arrangement with Hiscox Insurance Company (Bermuda) Limited (“Hiscox”) to launch a collateralized catastrophe reinsurance underwriting fund management business through these entities. The Catastrophe Fund Manager, a Bermuda exempted company, is the investment manager of the Catastrophe Fund. In December 2014, the Company announced that it would no longer accept investments in the Catastrophe Fund and that no new business would be written in the Catastrophe Reinsurer and that the Company would be redeeming all existing investments in the Catastrophe Fund. The Catastrophe Fund Manager will continue to manage the run off of the remaining exposure in the Catastrophe Fund.
On August 2, 2012, the Company established a wholly-owned subsidiary in the United Kingdom, Third Point Re Marketing (UK) Limited (“TPRUK”). On May 20, 2013, TPRUK was licensed as an insurance intermediary by the UK Financial Conduct Authority.
On August 20, 2013, the Company completed an initial public offering (“IPO”) of
24,832,484
common shares at an offering price of
$12.50
per share. The net proceeds of the offering were
$286.0 million
, after deducting offering costs. The Company’s common shares are listed on the New York Stock Exchange under the symbol “TPRE”.
These consolidated financial statements include the results of the Company and its wholly and majority owned subsidiaries and have been prepared in accordance with accounting principles generally accepted in the United States of America (“U.S. GAAP”). All significant intercompany accounts and transactions have been eliminated.
2. Significant accounting policies
The following is a summary of the significant accounting and reporting policies adopted by the Company:
Use of estimates
The preparation of consolidated financial statements in conformity with U.S. GAAP requires management to make estimates and assumptions that affect the reported and disclosed amounts of assets and liabilities and the disclosure of contingent assets and liabilities at the date of the consolidated financial statements and the reported amounts of revenues and expenses during the reporting period. Actual results could differ from those estimates. The major estimates reflected in the Company’s consolidated financial statements include, but are not limited to, the loss and loss adjustment expense reserves, estimates of written and earned premiums and fair value of financial instruments.
F-7
Cash and restricted cash and cash equivalents
Cash and cash equivalents consist of cash held in banks and other short-term, highly liquid investments with original maturity dates of ninety days or less.
Restricted cash and cash equivalents consist of cash held in trust accounts with the Catastrophe Reinsurer, securing collateralized reinsurance contracts written, trust accounts securing obligations under certain reinsurance contracts and cash held with brokers securing letters of credit issued under credit facilities.
Premium revenue recognition
To the extent that the amount of written premium is estimable, the Company estimates the ultimate premiums for the entire contract period and records this estimate at the inception of the contract. For contracts where the full written premium is not estimable at inception, the Company records written premium for the portion of the contract period for which the amount is estimable. These estimates are based primarily on information in the underlying contracts as well as information provided by clients and/or brokers.
Premiums written are earned over the exposure period in proportion to the period of risk covered. Unearned premiums represent the portion of premiums written that relate to the remaining term of the underlying policies in force.
Premiums for retroactive exposures in reinsurance contracts are earned at the inception of the contract, as all of the underlying loss events covered by these exposures occurred in the past. Any underwriting profit at inception related to retroactive exposures in a reinsurance contract is deferred and recognised over the estimated future payout of the loss and loss adjustment expenses reserves. Any underwriting loss at inception related to retroactive exposures in a reinsurance contract is recognised immediately.
Changes in premium estimates are expected and may result in adjustments in any reporting period. These estimates change over time as additional information regarding the underlying business volume is obtained. Any subsequent adjustments arising on such estimates are recorded in the period in which they are determined.
Reinsurance premiums ceded
From time to time the Company reduces the risk of losses on business written by reinsuring certain risks and exposures with other reinsurers. The Company remains liable to the extent that any retrocessionaire fails to meet its obligations and to the extent that the Company does not hold sufficient security for their unpaid obligations. Ceded premiums are written during the period in which the risks incept and are expensed over the contract period in proportion to the period of risk covered. Unearned premiums ceded consist of the unexpired portion of reinsurance ceded.
Deferred acquisition costs
Acquisition costs consist of commissions, brokerage and excise taxes that are related directly to the successful acquisition of new or renewal reinsurance contracts. These costs are deferred and amortized over the period in which the related premiums are earned. The Company evaluates the recoverability of deferred acquisition costs by determining if the sum of future earned premiums and anticipated investment income is greater than expected future loss and loss adjustment expenses and acquisition costs. If a loss is probable on the unexpired portion of contracts in force, a premium deficiency loss is recognized. As of
December 31, 2014
, deferred acquisition costs are considered to be fully recoverable and
no
premium deficiency has been recorded.
Acquisition costs also include profit commissions that are expensed when incurred. Profit commissions are calculated and accrued based on the expected loss experience for contracts and recorded when the current loss estimate indicates that a profit commission is probable under the contract terms.
F-8
Loss and loss adjustment expense reserves
The Company’s loss and loss adjustment expense reserves include case reserves and reserves for losses incurred but not yet reported (“IBNR reserves”). Case reserves are established for losses that have been reported, but not yet paid. IBNR reserves represent the estimated loss and loss adjustment expenses that have been incurred by insureds and reinsureds but not yet reported to the insurer or reinsurer, including unknown future developments on loss and loss adjustment expenses that are known to the insurer or reinsurer. IBNR reserves are established by management based on actuarially determined estimates of ultimate loss and loss adjustment expenses.
Inherent in the estimate of ultimate loss and loss adjustment expenses are expected trends in claim severity and frequency and other factors that may vary significantly as claims are settled. Accordingly, ultimate loss and loss adjustment expenses may differ materially from the amounts recorded in the consolidated financial statements. These estimates are reviewed regularly and, as experience develops and new information becomes known, the reserves are adjusted as necessary. Such adjustments, if any, are recorded in the consolidated statements of income in the period in which they become known.
Deposit liabilities
Certain contracts do not transfer sufficient insurance risk and are accounted for using the deposit method of accounting. Using the deposit method of accounting, a deposit liability, rather than written premium, is initially recorded based upon the consideration received less any explicitly identified premiums or fees. In subsequent periods, the deposit liability is adjusted by calculating the effective yield on the deposit to reflect actual payments to date and future expected payments.
Fair value measurement
The Company determines the fair value of financial instruments in accordance with current accounting guidance, which defines fair value and establishes a three level fair value hierarchy based upon the transparency of inputs used in the valuation of an asset or liability. Fair value is defined as the price that the Company would receive to sell an asset or would pay to transfer a liability in an orderly transaction between market participants at the measurement date. The Company determines the estimated fair value of each individual security utilizing the highest level inputs available.
The fair value of the Company’s assets and liabilities, which qualify as financial instruments, approximates the carrying amounts presented in the consolidated balance sheets.
Investments
The Company’s investments are classified as “trading securities” and are carried at fair value with changes in fair value included in earnings in the consolidated statements of income.
The fair value of the Company’s investments are based on quoted market prices, or when such prices are not available, by reference to broker or underwriter bid indications, industry recognized pricing vendors, and/or internal pricing valuation techniques. Investment transactions are recorded on a trade date basis with balances pending settlement included in due to/from brokers in the consolidated balance sheets.
Realized gains and losses are determined using cost calculated on a specific identification basis. Dividends are recorded on the ex-dividend date. Income and expense are recorded on the accrual basis including interest and premiums amortized and discounts accreted.
Derivatives
Underwriting
The Catastrophe Reinsurer enters into certain contracts under which the potential loss payments are triggered exclusively by reference to a specified index, such as an industry loss. These contracts are considered derivatives. The Company
F-9
records the fair value of these contracts in derivative liabilities, at fair value, in the consolidated balance sheet. Changes in the fair value of these contracts are recorded in net investment income in the consolidated statement of income.
Investments
Derivative instruments within our investment assets managed by our investment manager Third Point LLC, are recorded in the consolidated balance sheets at fair value, with changes in fair values and realized gains and losses recognised in net investment income in the consolidated statements of income.
Derivatives serve as a key component of the Company’s investment strategy and are utilized primarily to structure the portfolio, or individual investments, and to economically match the investment objectives of the Company.
The Company’s derivatives do not qualify as hedges for financial reporting purposes and are recorded in the consolidated balance sheets on a gross basis and not offset against any collateral pledged or received. Pursuant to the International Swaps and Derivatives Association (“ISDA”) master agreements, securities lending agreements and other derivatives agreements, the Company and its counterparties typically have the ability to net certain payments owed to each other in specified circumstances. In addition, in the event a party to one of the ISDA master agreements, securities lending agreements or other derivatives agreements defaults, or a transaction is otherwise subject to termination, the non-defaulting party generally has the right to set off against payments owed to the defaulting party or collateral held by the non defaulting party.
The Company enters into derivative contracts to manage credit risk, interest rate risk, currency exchange risk, and other exposure risks. The Company uses derivatives in connection with its risk-management activities to economically hedge certain risks and to gain exposure to certain investments. The utilization of derivative contracts also allows for an efficient means by which to trade certain asset classes.
Fair values of derivatives are determined by using quoted market prices, industry recognized pricing vendors, and counterparty quotes when available; otherwise fair values are based on pricing models that consider the time value of money, volatility, and the current market and contractual prices of underlying financial instruments.
Embedded derivatives
Certain of the Company’s deposit and reinsurance contracts contain interest crediting features that vary based on the net investment return on investments managed by Third Point LLC. These contractual features are considered embedded derivatives in accordance with U.S. GAAP. We include the estimated fair value of these embedded derivatives in the consolidated balance sheets with the host contract in order to reflect the expected settlement of these features with the host contract. Prior to 2014, the changes in estimated fair value of these embedded derivatives were recorded in net investment income. As these embedded derivatives have become more prominent, the presentation has been modified and changes in the estimated fair value of embedded derivatives are now recorded in other expenses in the consolidated statements of income. In addition, fixed interest crediting features on these contracts that were recorded in net investment income are now classified in other expenses in the consolidated statements of income. As a result, investment expense of
$4.9 million
and
$0.4 million
that was previously reported in net investment income for the years ended December 31, 2013 and 2012, respectively, is now being reported in other expenses to conform to the current year presentation.
Share-based compensation
The Company accounts for its share-based compensation transactions using the fair value of the award at the grant date. Determining the fair value of share purchase options at the grant date requires estimation and judgment. The Company uses an option-pricing model (Black-Scholes) to calculate the fair value of share purchase options.
For share purchase options or restricted share awards granted that contain both a service and performance condition, the Company recognizes share compensation expense only for the portion of the options or restricted share awards that are considered probable of vesting. Share compensation for share purchase options or restricted share awards considered probable of vesting is expensed over the service (vesting) period on a graded vesting basis. The probability of share purchase options or restricted share awards vesting is evaluated at each reporting period. When the share purchase options or restricted share awards are considered probable of vesting, the Company records a true up of share
F-10
compensation expense from the grant date (service inception date) to the current reporting period end based on the fair value of the options or restricted share awards at the grant date.
The Company measures grant date fair value for restricted share awards, with a service condition only, based on the price of its common shares at the grant date and the expense is recognised on a straight-line basis over the vesting period.
Warrants
The Company accounts for warrant contracts issued to certain of its founding investors (“Founders”) in conjunction with the initial capitalization of the Company by using either the physical settlement or net-share settlement methods. The fair value of these warrants was recorded in equity as additional paid-in capital. The fair value of warrants issued are estimated on the grant date using the Black-Scholes option-pricing model.
The Company accounts for certain warrant contracts issued to an advisor, where services have been received by the Company, in part, in exchange for equity instruments, based on the fair value of such services. The associated cost of these warrants has been recorded as capital raise costs and is included in additional paid in capital in the consolidated statements of shareholders’ equity.
Offering costs
Equity
Offering costs incurred in connection with the IPO, which included underwriters’ fees, legal and accounting fees, printing and other fees were deducted from the gross proceeds of the offering. The proceeds from the issuance of shares net of offering costs is included in additional paid in capital in the consolidated statements of shareholders’ equity.
Debt
Costs incurred in issuing debt, which includes underwriters’ fees, legal and accounting fees, printing and other fees are capitalized and amortized over the term of the debt. The amortization of these costs is included in interest expense in the consolidated statements of income. As of
December 31, 2014
, the Company had capitalized
$0.6 million
of costs associated with the February 2015 debt issuance.
Foreign currency transactions
The Company’s functional currency is the U.S. dollar. Transactions in foreign currencies are recorded in U.S. dollars at the exchange rate in effect on the transaction date. Monetary assets and liabilities in foreign currencies are remeasured at the exchange rates in effect at the reporting date and foreign exchange gains and losses are included in the consolidated statements of income.
Income taxes and uncertain tax positions
Under current Bermuda law, the Company and its Bermuda subsidiaries are not subject to any income or capital gains taxes. In the event that such taxes are imposed, the Company and its Bermuda subsidiaries would be exempted from any such taxes until March 2035 under the Tax Assurance Certificates issued to such entities pursuant to the Bermuda Exempted Undertakings Tax Protection Act of 1966, as amended.
The Company has an operating subsidiary in the United Kingdom, TPRUK, which is subject to relevant taxes in that jurisdiction. On July 17, 2013, the United Kingdom government passed the Finance Act 2013, which reduced the corporate income tax rate from
23%
to
21%
(effective April 1, 2014) and provided for a further reduction in the corporate income tax rate from
21%
to
20%
(effective April 1, 2015). For the year ended
December 31, 2014
, the Company recorded
$0.02 million
for income taxes relating to TPRUK.
F-11
The Company is subject to withholding tax obligations related to dividends, capital gains and interest on certain investments. Prior to the second quarter of 2014, these withholding tax obligations were recorded as deductions to net investment income. As these withholding tax obligations have increased, the Company began presenting the relevant amounts in income tax expense in the consolidated statements of income. As a result, withholding taxes of
$3.0 million
have been recorded in income tax expense for the year ended December 31, 2014. Withholding taxes of
$1.1 million
and
$1.8 million
were previously recorded as deductions to net investment income for the years ended December 31, 2013 and 2012, respectively.
As of and for the year ended
December 31, 2014
, the Company had recorded a
$2.6 million
provision for uncertain tax positions related to investment transactions in certain foreign jurisdictions.
Non-controlling interests
The Company consolidates the results of entities in which it has a controlling financial interest. The Company records the portion of shareholders’ equity attributable to non-controlling interests as a separate line within shareholders’ equity in the consolidated balance sheets. The Company records the portion of income attributable to non-controlling interests as a separate line within the consolidated statements of income.
Earnings per share
Basic earnings per share is based on the weighted average number of common shares and participating securities outstanding during the period. The weighted average number of common shares excludes any dilutive effect of outstanding warrants, options and convertible securities such as unvested restricted shares. Diluted earnings per share is based on the weighted average number of common shares and share equivalents including any dilutive effects of warrants, options and other awards under share plans and are determined using the treasury stock method. U.S. GAAP requires that unvested share awards that contain non-forfeitable rights to dividends or dividend equivalents, whether paid or unpaid (referred to as “participating securities”), be included in the number of shares outstanding for both basic and diluted earnings per share calculations. The Company treats certain of its unvested restricted shares as participating securities. In the event of a net loss, the participating securities are excluded from the calculation of both basic and diluted loss per share.
Leases
Leases in which substantially all of the risks and rewards of ownership are retained by the lessor are classified as operating leases. Payments made under operating leases (net of any incentives received from the lessor) are recognised in the consolidated statements of income on a straight-line basis over the term of the lease.
Comprehensive income
The Company has no comprehensive income other than net income disclosed in the consolidated statements of income.
Segment information
Under U.S. GAAP, operating segments are based on the internal information that management uses for allocating resources and assessing performance of the Company. The Company reports
two
operating segments – Property and Casualty Reinsurance and Catastrophe Risk Management. The Company also has a corporate function that includes the Company’s investment results and certain general and administrative expenses related to its corporate activities.
Prior year changes in the presentation of consolidated statements of cash flows
The Company had previously excluded income attributable to non-controlling interests from cash flows provided by operating activities and included these amounts in cash flows used in investing activities and provided by financing activities. For the year ended December 31, 2014, the Company began including income from non-controlling interests in cash flows provided by operating activities. In addition, cash flows related to the non-controlling interest in investment affiliate were previously included in net cash used in investing activities and is now being included in net cash provided
F-12
by financing activities. Lastly, we are now including the interest expense on deposit liabilities and change in fair value of embedded derivatives in deposit liability contracts as non-cash adjustments in operating activities. These changes did not impact the consolidated balance sheet or consolidated income statement for the prior periods. The Company has corrected the presentation of its consolidated statements of cash flows for the prior year periods.
Recently issued accounting standards
Issued and effective as of
December 31, 2014
In January 2013, the Financial Accounting Standards Board (“FASB”) issued Accounting Standards Update No. 2013-01,
Clarifying the Scope of Disclosures about Offsetting Assets and Liabilities
(ASU 2013-01). The objective of ASU 2013-01 is to address implementation issues about the scope of ASU 2011-11,
Disclosures about Offsetting Assets and Liabilities.
The amendments clarify that the scope of ASU 2011-11 applies to derivatives, including bifurcated embedded derivatives, repurchase agreements and reverse repurchase agreements, and securities borrowing and securities lending transactions. Entities with other types of financial assets and financial liabilities subject to a master netting arrangement or similar agreement also are affected because these amendments make them no longer subject to the disclosure requirements in ASU 2011-11. ASU 2013-01 is effective for interim and annual periods beginning on or after January 1, 2013. The Company adopted ASU 2013-01 effective with its IPO and has included the required disclosures in
Note 8
of the notes to the consolidated financial statements.
In February 2013, the FASB issued Accounting Standards Update No. 2013-02,
Comprehensive Income
(ASU 2013-02). The objective of ASU 2013-02 is to improve the reporting of reclassifications out of other comprehensive income. ASU 2013-02 is effective for periods subsequent to December 15, 2012. The adoption of this guidance had no impact on the Company’s consolidated financial statements.
In June 2013, the FASB issued Accounting Standards Update No. 2013-08,
Financial Services - Investment Companies - Amendments to the Scope, Measurement, and Disclosure Requirements
(ASU 2013-08). The amendments in this update change the assessment of whether an entity is an investment company by developing a new two-tiered approach for that assessment, which requires an entity to possess certain fundamental characteristics while allowing judgment in assessing other typical characteristics. The new approach requires an entity to assess all of the characteristics of an investment company and consider its purpose and design to determine whether it is an investment company. ASU 2013-08 is effective prospectively for periods subsequent to December 15, 2013. Early adoption was prohibited. The Company adopted ASU 2013-08 in the first quarter of 2014, and the adoption of this guidance did not have a material impact on the Company’s consolidated financial statements.
Issued but not yet effective as of
December 31, 2014
In April 2014, the FASB issued Accounting Standards Update 2014-08,
Reporting Discontinued Operations and Disclosures of Disposals of Components of an Entity
(ASU 2014-08). ASU 2014-08 changes the requirements for reporting discontinued operations, such that a disposal of a component of the Company’s operations is required to be reported as discontinued operations if the disposal represents a strategic shift that has, or will have, a major effect on the Company’s operations and financial results. ASU 2014-08 is effective for all disposals that occur after January 1, 2015, with early adoption permitted. The Company does not expect this new pronouncement to have a material impact on the Company’s consolidated financial statements.
In May 2014, the FASB issued Accounting Standards Update 2014-09,
Revenue from Contracts with Customers
(ASU 2014-09). ASU 2014-09 provides a framework, through a five-step process, for recognizing revenue from customers, improves comparability and consistency of recognizing revenue across entities, industries, jurisdictions and capital markets, and requires enhanced disclosures. Certain contracts with customers are specifically excluded from the scope of ASU 2014-09, including amongst others, insurance contracts accounted for under Accounting Standard Codification 944,
Financial Services - Insurance
. ASU 2014-09 is effective on January 1, 2017 with retrospective adoption required for the comparative periods. The Company is currently evaluating the impact of this guidance, however, it is not expected to have a material impact on the Company’s consolidated financial statements.
F-13
In June 2014, the FASB issued Accounting Standards Update No. 2014-11,
Transfers and Servicing (Topic 860): Repurchase-to Maturity Transactions, Repurchase Financings, and Disclosures
(ASU 2014-11)
.
ASU 2014-11 amends the accounting guidance for “repo-to-maturity” transactions and repurchase agreements executed as repurchase financings. In addition, the new standard requires a transferor to disclose more information about certain transactions, including those in which it retains substantially all of the exposure to the economic returns of the underlying transferred asset over the transaction’s term. For repurchase agreements and securities lending agreements accounted for as secured borrowings as of a reporting date, the new standard requires obligors (transferors of collateral) to disaggregate the related gross obligation by class of collateral pledged, and to disclose the remaining contractual maturity of the agreements, and to discuss the potential risks of these arrangements and related collateral pledged, including the risks stemming from a decline in the value of the pledged collateral and how such risks are managed. Additionally, as a result of the new accounting guidance, repo-to-maturity transactions will be reported as secured borrowings. Transferors will also no longer apply the current “linked” accounting model to repurchase agreements executed contemporaneously with the initial transfer of the underlying financial asset with the same counterparty. ASU 2014-11 is effective prospectively for periods subsequent to December 15, 2014. The Company is currently evaluating the impact of this guidance, however, it is not expected to have a material impact on the Company’s consolidated financial statements.
In August 2014, the FASB issued Accounting Standards Update 2014-15,
Presentation of Financial Statements- Going Concern
(ASU 2014-15). ASU 2014-15 requires management to evaluate, for each annual and interim reporting period, whether there are conditions or events that raise substantial doubt about an entity’s ability to continue as a going concern within one year after the date that the financial statements are issued. If conditions or events raise substantial doubt about an entity’s ability to continue as a going concern, the entity will be required to disclose information that enables the users of the financial statements to understand the principal conditions or events, management’s evaluation of the significance of those events or conditions and management’s plans that alleviate substantial doubt about the entity’s ability to continue as a going concern. ASU 2014-1 becomes effective for the annual period ending after December 15, 2016. The Company does not expect this new guidance to have a material impact on the Company’s consolidated financial statements.
In February 2015, the FASB issued Accounting Standard Update 2015-02,
Consolidation (Topic 810) Amendments to the Consolidation Analysis
(ASU 2015-02). ASU 2015-02 requires management to evaluate whether limited partnerships and similar legal entities are variable interest entities (VIEs) or voting interest entities. ASU- 2015-02 eliminates the presumption that a general partner should consolidate a limited partnership and affects the consolidation analysis of reporting entities that are involved with VIEs, particularly those that have fee arrangements and related party relationships. ASU 2015-02 also provides a scope exception from consolidation guidance for reporting entities with interests in legal entities that are required to comply with or operate in accordance with requirements that are similar to those in Rule 2a-7 of the Investment Company Act of 1940 for registered money market funds. The amendments in this Update are effective for interim and annual periods beginning after December 15, 2015. Early adoption is permitted. The Company is currently evaluating the impact of this guidance on the Company’s consolidated financial statements.
3. Restricted cash and cash equivalents
Restricted cash and cash equivalents as of
December 31, 2014
and
2013
consisted of the following:
|
December 31,
2014 |
December 31,
2013 |
||||||
|
($ in thousands)
|
|||||||
|
Restricted cash securing collateralized reinsurance contracts written by the Catastrophe Reinsurer (1)
|
$
|
108,544
|
|
$
|
93,014
|
|
|
|
Restricted cash securing letter of credit facilities (2)
|
218,963
|
|
100,563
|
|
|||
|
Restricted cash securing other reinsurance contracts (3)
|
89,800
|
|
—
|
|
|||
|
$
|
417,307
|
|
$
|
193,577
|
|
||
F-14
(1) Restricted cash securing collateralized reinsurance contracts written by the Catastrophe Reinsurer cannot be released until the contract’s exposure has expired and the cedant agrees to release the collateral. All remaining exposures being collateralized by these amounts are expected to expire by July 2015, upon which, the restricted cash will be released.
(2) Restricted cash securing letter of credit facilities pertain to letters of credit issued to clients and cash securing these obligations which the Company will not be released from until the underlying reserves have been settled. The time period for which the Company expects these letters of credit to be in place varies from contract to contract but, can last several years.
(3) Restricted cash securing other reinsurance contracts pertain to trust accounts securing the Company’s contractual obligation under certain reinsurance contracts which the Company will not be released from until all underlying risks have expired or have been settled. The time period for which the Company expects these trust accounts to be in place varies from contract to contract but, can last several years.
4. Reinsurance premiums ceded
The Company from time to time purchases retrocessional coverage for one or more of the following reasons: to manage its overall exposure, to reduce its net liability on individual risks, to obtain additional underwriting capacity and to balance its underwriting portfolio. Additionally, retrocession can be used as a mechanism to share the risks and rewards of business written and therefore can be used as a tool to align the Company’s interests with those of its counterparties. The Company currently has coverage that provides for recovery of a portion of loss and loss adjustment expenses incurred on one crop contract written in 2013 and one new contract entered into in the third quarter of 2014 (
2012
- none). Loss and loss adjustment expenses recoverable from the retrocessionaires are recorded as assets. For the year ended
December 31, 2014
, loss and loss adjustment expenses incurred and reported on the consolidated statements of income are net of loss and loss expenses recovered of
$0.4 million
(2013 -
$9.3
million and 2012 -
nil
). Retrocession contracts do not relieve the Company from its obligations to the insureds. Failure of retrocessionaires to honor their obligations could result in losses to the Company. As of
December 31, 2014
and 2013, the Company had loss and loss adjustment expenses recoverable of
$0.8 million
and
$9.3
million, respectively, with
one
retrocessionaire who was rated “A (Excellent)” by A.M. Best Company. The Company regularly evaluates the financial condition of its retrocessionaires to assess the ability of the retrocessionaires to honor their obligations.
5. Investments
The Company’s investments are managed by its investment manager, Third Point LLC (“Third Point LLC” or the “Investment Manager”), under a long-term investment management contract. The Company directly owns the investments that are held in a separate account and managed by Third Point LLC. The following is a summary of the separate account managed by Third Point LLC:
F-15
|
December 31,
2014 |
December 31,
2013 |
||||||
|
Assets
|
($ in thousands)
|
||||||
|
Total investments in securities and commodities
|
$
|
1,828,761
|
|
$
|
1,460,864
|
|
|
|
Cash and cash equivalents
|
3
|
|
869
|
|
|||
|
Restricted cash and cash equivalents (1)
|
308,763
|
|
100,563
|
|
|||
|
Due from brokers
|
58,241
|
|
98,386
|
|
|||
|
Securities purchased under an agreement to sell
|
29,852
|
|
38,147
|
|
|||
|
Derivative assets
|
21,130
|
|
39,045
|
|
|||
|
Interest and dividends receivable
|
2,590
|
|
2,604
|
|
|||
|
Other assets
|
325
|
|
933
|
|
|||
|
Total assets
|
$
|
2,249,665
|
|
$
|
1,741,411
|
|
|
|
Liabilities and non-controlling interest
|
|||||||
|
Accounts payable and accrued expenses
|
$
|
464
|
|
$
|
1,759
|
|
|
|
Securities sold, not yet purchased, at fair value
|
82,485
|
|
56,056
|
|
|||
|
Due to brokers
|
312,609
|
|
44,870
|
|
|||
|
Derivative liabilities
|
10,985
|
|
8,819
|
|
|||
|
Interest and dividends payable
|
697
|
|
748
|
|
|||
|
Non-controlling interest
|
40,242
|
|
69,717
|
|
|||
|
Total liabilities and non-controlling interest
|
447,482
|
|
181,969
|
|
|||
|
Total net investments managed by Third Point LLC
|
$
|
1,802,183
|
|
$
|
1,559,442
|
|
|
|
(1)
|
Includes amounts advanced to Third Point Re to fund collateral held in trust accounts.
|
The Company’s Investment Manager has a formal valuation policy that sets forth the pricing methodology for investments to be used in determining the fair value of each security in the Company’s portfolio. The valuation policy is updated and approved at least on an annual basis by Third Point LLC’s valuation committee (the “Committee”), which is comprised of officers and employees who are senior business management personnel of Third Point LLC. The Committee meets monthly. The Committee’s role is to review and verify the propriety and consistency of the valuation methodology to determine the fair value of investments. The Committee also reviews any due diligence performed and approves any changes to current or potential external pricing vendors.
Investments are carried at fair value. The fair values of investments are estimated using prices obtained from either third-party pricing services or broker quotes. The methodology for valuation is generally determined based on the investment’s asset class per the Company’s Investment Manager’s valuation policy. For investments that the Company is unable to obtain fair values from a pricing service or broker, fair values are estimated using information obtained from the Company’s Investment Manager.
Securities and commodities listed on a national securities or commodities exchange or quoted on NASDAQ are valued at their last sales price as of the last business day of the period. Listed securities with no reported sales on such date and over-the-counter (“OTC”) securities are valued at their last closing bid price if held long by the Company, and last closing ask price if held short by the Company. As of
December 31, 2014
, securities valued at
$434.4
million (
December 31, 2013
-
$483.2 million
), representing
23.5%
(
December 31, 2013
–
33.1%
) of investments in securities and commodities and derivative assets, and
$1.3
million (
December 31, 2013
-
$41.0 million
), representing
1.4%
(
December 31, 2013
–
73.1%
) of securities sold, not yet purchased and derivative liabilities, are valued based on broker quotes or other quoted market prices for similar securities.
Private securities are not registered for public sale and are carried at an estimated fair value at the end of the period, as determined by the Company’s Investment Manager. Valuation techniques used by the Company’s Investment Manager may include market approach, last transaction analysis, liquidation analysis and/or using discounted cash flow models where the significant inputs could include but are not limited to additional rounds of equity financing, financial metrics such as revenue multiples or price-earnings ratio, discount rates and other factors. In addition, the Company or the Company’s Investment Manager may employ third party valuation firms to conduct separate valuations of such private
F-16
securities. The third party valuation firms provide the Company or the Company’s Investment Manager with a written report documenting their recommended valuation as of the determination date for the specified investments.
As of
December 31, 2014
, the Company had
$2.3
million (
December 31, 2013
-
$3.3 million
) of private securities fair valued by a third party valuation firm using information obtained from the Company’s Investment Manager. Private securities represented less than
1%
of total investments in securities, commodities and derivative assets. The actual value at which these securities could actually be sold or settled with a willing buyer or seller may differ from the Company’s estimated fair values depending on a number of factors including, but not limited to, current and future economic conditions, the quantity sold or settled, the presence of an active market and the availability of a willing buyer or seller.
The Company’s free standing derivatives are recorded at fair value, and are included in the consolidated balance sheets in derivative assets and derivative liabilities. The Company values exchange-traded derivatives at their last sales price on the exchange where it is primarily traded. OTC derivatives, which include swap, option, swaption, forward, future and contract for differences, are valued by third party sources when available; otherwise, fair values are obtained from broker quotes that are based on pricing models that consider the time value of money, volatility, and the current market and contractual prices of the underlying financial instruments.
As an extension of its underwriting activities, the Catastrophe Reinsurer may sell derivative instruments that provide reinsurance-like protection to third parties for specific loss events associated with certain lines of business. These derivatives are recorded in the consolidated balance sheets at fair value, with changes in the fair value of these derivatives recorded in net investment income in the consolidated statements of income. These contracts are valued on the basis of models developed by the Company, which approximates fair value.
During 2014, the Catastrophe Reinsurer purchased a catastrophe bond. This catastrophe bond is recorded in the consolidated balance sheet at fair value, with changes in the fair value recorded in net investment income in the consolidated statements of income. This catastrophe bond is valued using quotes from broker-dealers or other market makers.
The Company also has derivatives embedded in non-derivative host contracts that are required to be separated from the host contracts and accounted for at fair value with changes in fair value of the embedded derivative reported in net investment income. The Company’s embedded derivatives relate to interest crediting features in certain reinsurance and deposit contracts that vary based on the returns on our investments managed by Third Point LLC. The Company determines the fair value of the embedded derivatives using models developed by the Company, which approximates fair value. See discussion of accounting policy for embedded derivatives in
Note 2
for additional information.
The Company’s holdings in asset-backed securities (“ABS”) are substantially invested in residential mortgage-backed securities (“RMBS”). The balance of the ABS positions was held in commercial mortgage-backed securities, collateralized debt obligations and student loan asset-backed securities. These investments are valued using broker quotes or a recognised third-party pricing vendor. All of these classes of ABS are sensitive to changes in interest rates and any resulting change in the rate at which borrowers sell their properties, refinance, or otherwise pre-pay their loans. As an investor in these classes of ABS, the Company may be exposed to the credit risk of underlying borrowers not being able to make timely payments on loans or the likelihood of borrowers defaulting on their loans. In addition, the Company may be exposed to significant market and liquidity risks.
The Company values its investments in limited partnerships at fair value, which is estimated based on the Company’s share of the net asset value of the limited partnerships as provided by the investment managers of the underlying investment funds. The resulting net gains or net losses are reflected in the consolidated statements of income.
On December 18, 2014, we entered into a subscription agreement with the Kiskadee Diversified Fund Ltd. (“Kiskadee Fund”) to invest up to
$25.0 million
in Hiscox’s separately managed insurance-linked securities platform, Kiskadee Re Ltd. The Kiskadee Fund is a fund vehicle managed by Hiscox. The Kiskadee Fund invests in property catastrophe exposures through collateralized reinsurance transactions and other insurance-linked investments. On January 2, 2015, we funded
$5.0 million
of this commitment. The remaining
$20.0 million
commitment is due to be funded on June 1, 2015. This investment will be recorded on the consolidated balance sheet at fair value, which is estimated based on
F-17
the Company’s share of the net asset value in the Kiskadee Fund, as provided by the investment manager. The resulting net gains or net losses are reflected in the consolidated statements of income.
The Company performs several processes to ascertain the reasonableness of the valuation of all of the Company’s investments comprising the Company’s investment portfolio, including securities that are categorized as Level 2 and Level 3 within the fair value hierarchy. These processes include i) obtaining and reviewing weekly and monthly investment portfolio reports from the Investment Manager, ii) obtaining and reviewing monthly Net Asset Value (“NAV”) and investment return reports received directly from the Company’s third-party fund administrator, which are compared to the reports noted in (i), and iii) monthly update discussions with the Company’s Investment Manager regarding the investment portfolio, including, their process for reviewing and validating pricing obtained from third party service providers.
For the years ended
December 31, 2014
,
2013
and
2012
, there were no changes in the valuation techniques as it relates to the above.
Monetary assets and liabilities denominated in foreign currencies are translated at the closing rates of exchange. Transactions during the period are translated at the rate of exchange prevailing on the date of the transaction. The Company does not isolate that portion of the net investment income resulting from changes in foreign exchange rates on investments, dividends and interest from the fluctuations arising from changes in fair values of securities and derivatives held. Periodic payments received or paid on swap agreements are recorded as realized gain or loss on investment transactions. Such fluctuations are included within net investment income in the consolidated statements of income (loss).
U.S. GAAP disclosure requirements establish a framework for measuring fair value, including a three-level hierarchy for fair value measurements based upon the transparency of inputs to the valuation of an asset or liability. The three-level hierarchy of inputs is summarized below:
|
•
|
Level 1 – Quoted prices available in active markets/exchanges for identical investments as of the reporting date.
|
|
•
|
Level 2 – Observable inputs to the valuation methodology other than unadjusted quoted market prices for identical assets or liabilities in active markets. Level 2 inputs include, but are not limited to, prices quoted for similar assets or liabilities in active markets/exchanges, prices quoted for identical or similar assets or liabilities in markets that are not active and fair values determined through the use of models or other valuation methodologies.
|
|
•
|
Level 3 – Pricing inputs unobservable for the investment and include activities where there is little, if any, market activity for the investment. The inputs applied in the determination of fair value require significant management judgment and estimation.
|
Observable inputs are inputs that reflect the assumptions market participants would use in pricing the asset or liability based on market data obtained from sources other than those of the reporting entity. Unobservable inputs are inputs that reflect the reporting entity’s own assumptions about the assumptions market participants would use in pricing the asset or liability developed based on the best information available in the circumstances.
In certain cases, the inputs used to measure fair value may fall into different levels of the fair value hierarchy. In such cases, an investment’s level within the fair value hierarchy is based on the lowest level of input that is significant to the fair value measurement. The Company’s assessment of the significance of a particular input to the fair value measurement in its entirety requires judgment, and considers factors specific to the investment.
The key inputs for corporate, government and sovereign bond valuation are coupon frequency, coupon rate and underlying bond spread. The key inputs for asset-backed securities are yield, probability of default, loss severity and prepayment.
Key inputs for over-the-counter (“OTC”) valuations vary based on the type of underlying security on which the contract was written:
|
•
|
The key inputs for most OTC option contracts include notional, strike price, maturity, payout structure, current foreign exchange forward and spot rates, current market price of underlying and volatility of underlying.
|
F-18
|
•
|
The key inputs for most forward contracts include notional, maturity, forward rate, spot rate, various interest rate curves and discount factor.
|
|
•
|
The key inputs for swap valuation will vary based on the type of underlying on which the contract was written. Generally, the key inputs for most swap contracts include notional, swap period, fixed rate, credit or interest rate curves, current market or spot price of the underlying and the volatility of the underlying.
|
The following tables present the Company’s investments, categorized by the level of the fair value hierarchy as of
December 31, 2014
and
2013
:
|
December 31, 2014
|
|||||||||||||||
|
Quoted prices in active markets
|
Significant other observable inputs
|
Significant unobservable inputs
|
Total
|
||||||||||||
|
(Level 1)
|
(Level 2)
|
(Level 3)
|
|||||||||||||
|
Assets
|
($ in thousands)
|
||||||||||||||
|
Equity securities
|
$
|
1,158,428
|
|
$
|
15,207
|
|
$
|
—
|
|
$
|
1,173,635
|
|
|||
|
Private common equity securities
|
—
|
|
2,718
|
|
1,443
|
|
4,161
|
|
|||||||
|
Total equities
|
1,158,428
|
|
17,925
|
|
1,443
|
|
1,177,796
|
|
|||||||
|
Asset-backed securities
|
—
|
|
395,514
|
|
4,720
|
|
400,234
|
|
|||||||
|
Bank debts
|
—
|
|
2,395
|
|
—
|
|
2,395
|
|
|||||||
|
Corporate bonds
|
—
|
|
56,795
|
|
3,799
|
|
60,594
|
|
|||||||
|
Municipal bonds
|
—
|
|
3,094
|
|
—
|
|
3,094
|
|
|||||||
|
Sovereign debt
|
—
|
|
103,331
|
|
—
|
|
103,331
|
|
|||||||
|
Total debt securities
|
—
|
|
561,129
|
|
8,519
|
|
569,648
|
|
|||||||
|
Investments in limited partnerships
|
—
|
|
55,756
|
|
6,354
|
|
62,110
|
|
|||||||
|
Options
|
3,205
|
|
3,791
|
|
—
|
|
6,996
|
|
|||||||
|
Rights and warrants
|
1,843
|
|
—
|
|
—
|
|
1,843
|
|
|||||||
|
Trade claims
|
—
|
|
10,368
|
|
—
|
|
10,368
|
|
|||||||
|
Catastrophe bond
|
—
|
|
2,077
|
|
—
|
|
2,077
|
|
|||||||
|
Total other investments
|
5,048
|
|
71,992
|
|
6,354
|
|
83,394
|
|
|||||||
|
Derivative assets (free standing)
|
380
|
|
20,750
|
|
—
|
|
21,130
|
|
|||||||
|
Total assets
|
$
|
1,163,856
|
|
$
|
671,796
|
|
$
|
16,316
|
|
$
|
1,851,968
|
|
|||
|
Liabilities
|
|||||||||||||||
|
Equity securities
|
$
|
33,222
|
|
$
|
—
|
|
$
|
—
|
|
$
|
33,222
|
|
|||
|
Sovereign debt
|
—
|
|
29,350
|
|
—
|
|
29,350
|
|
|||||||
|
Corporate bonds
|
—
|
|
13,312
|
|
—
|
|
13,312
|
|
|||||||
|
Options
|
3,755
|
|
2,846
|
|
—
|
|
6,601
|
|
|||||||
|
Total securities sold, not yet purchased
|
36,977
|
|
45,508
|
|
—
|
|
82,485
|
|
|||||||
|
Derivative liabilities (free standing)
|
505
|
|
9,548
|
|
962
|
|
11,015
|
|
|||||||
|
Derivative liabilities (embedded)
|
—
|
|
—
|
|
9,289
|
|
9,289
|
|
|||||||
|
Total liabilities
|
$
|
37,482
|
|
$
|
55,056
|
|
$
|
10,251
|
|
$
|
102,789
|
|
|||
F-19
|
As of December 31, 2013
|
|||||||||||||||
|
Quoted prices in active markets
|
Significant other observable inputs
|
Significant unobservable inputs
|
Total
|
||||||||||||
|
(Level 1)
|
(Level 2)
|
(Level 3)
|
|||||||||||||
|
Assets
|
($ in thousands)
|
||||||||||||||
|
Equity securities
|
$
|
839,903
|
|
$
|
17,914
|
|
$
|
—
|
|
$
|
857,817
|
|
|||
|
Private common equity securities
|
—
|
|
94,282
|
|
2,012
|
|
96,294
|
|
|||||||
|
Total equities
|
839,903
|
|
112,196
|
|
2,012
|
|
954,111
|
|
|||||||
|
Asset-backed securities
|
—
|
|
325,133
|
|
400
|
|
325,533
|
|
|||||||
|
Bank debts
|
—
|
|
8,017
|
|
—
|
|
8,017
|
|
|||||||
|
Corporate bonds
|
—
|
|
82,139
|
|
4,610
|
|
86,749
|
|
|||||||
|
Municipal bonds
|
—
|
|
10,486
|
|
—
|
|
10,486
|
|
|||||||
|
Sovereign debt
|
—
|
|
10,639
|
|
—
|
|
10,639
|
|
|||||||
|
Total debt securities
|
—
|
|
436,414
|
|
5,010
|
|
441,424
|
|
|||||||
|
Investments in limited partnerships
|
—
|
|
29,286
|
|
5,292
|
|
34,578
|
|
|||||||
|
Options
|
6,284
|
|
6,785
|
|
—
|
|
13,069
|
|
|||||||
|
Rights and warrants
|
1
|
|
—
|
|
—
|
|
1
|
|
|||||||
|
Trade claims
|
—
|
|
17,681
|
|
—
|
|
17,681
|
|
|||||||
|
Total other investments
|
6,285
|
|
53,752
|
|
5,292
|
|
65,329
|
|
|||||||
|
Derivative assets
|
321
|
|
38,724
|
|
—
|
|
39,045
|
|
|||||||
|
Total assets
|
$
|
846,509
|
|
$
|
641,086
|
|
$
|
12,314
|
|
$
|
1,499,909
|
|
|||
|
Liabilities
|
|
|
|
|
|||||||||||
|
Equity securities
|
$
|
5,207
|
|
$
|
—
|
|
$
|
—
|
|
$
|
5,207
|
|
|||
|
Sovereign debt
|
—
|
|
37,592
|
|
—
|
|
37,592
|
|
|||||||
|
Corporate bonds
|
—
|
|
3,372
|
|
—
|
|
3,372
|
|
|||||||
|
Options
|
4,714
|
|
5,171
|
|
—
|
|
9,885
|
|
|||||||
|
Total securities sold, not yet purchased
|
9,921
|
|
46,135
|
|
—
|
|
56,056
|
|
|||||||
|
Derivative liabilities (free standing)
|
441
|
|
8,378
|
|
—
|
|
8,819
|
|
|||||||
|
Derivative liabilities (embedded)
|
—
|
|
—
|
|
4,430
|
|
4,430
|
|
|||||||
|
Total liabilities
|
$
|
10,362
|
|
$
|
54,513
|
|
$
|
4,430
|
|
$
|
69,305
|
|
|||
During the year ended
December 31, 2014
, the Company reclassified
$86.6
million of private common equity securities from Level 2 to Level 1 equity securities. This reclassification is the result of the issuer’s IPO, with quoted prices having become available in an active market as of the reporting date. During the years ended
December 31, 2013
and
2012
, the Company made no significant reclassifications of assets or liabilities between Levels 1 and 2.
F-20
The following table presents the reconciliation for all investments measured at fair value using significant unobservable inputs (Level 3) for the years ended
December 31, 2014
and
2013
:
|
January 1,
2014 |
Transfers in to (out of) Level 3
|
Purchases
|
Sales
|
Realized and Unrealized Gains(Losses) (1)
|
December 31,
2014 |
||||||||||||||||||
|
($ in thousands)
|
|||||||||||||||||||||||
|
Assets
|
|||||||||||||||||||||||
|
Asset-backed securities
|
$
|
400
|
|
$
|
2,062
|
|
$
|
5,257
|
|
$
|
(2,898
|
)
|
$
|
(101
|
)
|
$
|
4,720
|
|
|||||
|
Corporate bonds
|
4,610
|
|
—
|
|
822
|
|
(776
|
)
|
(857
|
)
|
3,799
|
|
|||||||||||
|
Private common equity securities
|
2,012
|
|
393
|
|
—
|
|
—
|
|
(962
|
)
|
1,443
|
|
|||||||||||
|
Investments in limited partnerships
|
5,292
|
|
—
|
|
2,916
|
|
—
|
|
(1,854
|
)
|
6,354
|
|
|||||||||||
|
Total assets
|
$
|
12,314
|
|
$
|
2,455
|
|
$
|
8,995
|
|
$
|
(3,674
|
)
|
$
|
(3,774
|
)
|
$
|
16,316
|
|
|||||
|
Liabilities
|
|||||||||||||||||||||||
|
Derivative liabilities (free standing)
|
$
|
—
|
|
$
|
—
|
|
$
|
—
|
|
$
|
(1,135
|
)
|
$
|
173
|
|
$
|
(962
|
)
|
|||||
|
Derivative liabilities (embedded)
|
(4,430
|
)
|
—
|
|
—
|
|
(2,871
|
)
|
(1,988
|
)
|
(9,289
|
)
|
|||||||||||
|
Total liabilities
|
$
|
(4,430
|
)
|
$
|
—
|
|
$
|
—
|
|
$
|
(4,006
|
)
|
$
|
(1,815
|
)
|
$
|
(10,251
|
)
|
|||||
|
January 1,
2013 |
Transfers in to (out of) Level 3
|
Purchases
|
Sales
|
Realized and Unrealized Gains(Losses) (1)
|
December 31,
2013 |
||||||||||||||||||
|
($ in thousands)
|
|||||||||||||||||||||||
|
Assets
|
|||||||||||||||||||||||
|
Asset-backed securities
|
$
|
—
|
|
$
|
133
|
|
$
|
552
|
|
$
|
(12
|
)
|
$
|
(273
|
)
|
$
|
400
|
|
|||||
|
Bank debt
|
54
|
|
(54
|
)
|
—
|
|
—
|
|
—
|
|
—
|
|
|||||||||||
|
Corporate bonds
|
1,046
|
|
—
|
|
4,094
|
|
(1,392
|
)
|
862
|
|
4,610
|
|
|||||||||||
|
Private common equity securities
|
2,757
|
|
(2,757
|
)
|
2,031
|
|
—
|
|
(19
|
)
|
2,012
|
|
|||||||||||
|
Investments in limited partnerships
|
—
|
|
—
|
|
4,690
|
|
(342
|
)
|
944
|
|
5,292
|
|
|||||||||||
|
Total assets
|
$
|
3,857
|
|
$
|
(2,678
|
)
|
$
|
11,367
|
|
$
|
(1,746
|
)
|
$
|
1,514
|
|
$
|
12,314
|
|
|||||
|
Liabilities
|
|||||||||||||||||||||||
|
Derivative liabilities (free standing)
|
$
|
—
|
|
$
|
—
|
|
$
|
—
|
|
$
|
(4,335
|
)
|
$
|
4,335
|
|
$
|
—
|
|
|||||
|
Derivative liabilities (embedded)
|
(2,510
|
)
|
—
|
|
—
|
|
(1,460
|
)
|
(460
|
)
|
(4,430
|
)
|
|||||||||||
|
Total liabilities
|
$
|
(2,510
|
)
|
$
|
—
|
|
$
|
—
|
|
$
|
(5,795
|
)
|
$
|
3,875
|
|
$
|
(4,430
|
)
|
|||||
(1) Total change in realized and unrealized gain (loss) recorded on Level 3 financial instruments are included in net investment income in the consolidated statements of income (loss).
Total unrealized gains related to fair value assets using significant unobservable inputs (Level 3) for the year ended
December 31, 2014
was
$(7.4)
million (2013 -
$1.0 million
and 2012 -
$(0.7) million
).
For assets and liabilities that were transferred into Level 3 during the period, gains (losses) are presented as if the assets or liabilities had been transferred into Level 3 at the beginning of the period; similarly, for assets and liabilities that were transferred out of Level 3 during the year, gains (losses) are presented as if the assets or liabilities had been
F-21
transferred out of Level 3 at the beginning of the year. The Company held no Level 3 investments where quantitative unobservable inputs are produced by the Company itself when estimating fair value.
6. Securities purchased under an agreement to sell
The Company may enter into repurchase and reverse repurchase agreements with financial institutions in which the financial institution agrees to resell or repurchase and the Company agrees to repurchase or resell such securities at a mutually agreed price upon maturity. As of
December 31, 2014
, the Company held outstanding reverse repurchase agreements valued at
$29.9
million (
December 31, 2013
-
$38.1 million
). As of
December 31, 2014
, the total value of securities and cash received as collateral by the Company was
$29.6
million (
December 31, 2013
-
$37.6 million
). As the Company held only reverse repurchase agreements as of December 31, 2014 and 2013, these positions are not impacted by master netting agreements. Interest expense and income related to these transactions are included in interest payable and receivable in the consolidated balance sheets. For the year ended
December 31, 2014
, foreign currency loss of
$4.1
million (
2013
– gains of
$1.9
million and 2012 - gains of
$0.6 million
) on reverse repurchase agreements are included in net investment income in the consolidated statements of income. Generally, reverse repurchase agreements mature within
30
to
90 days
.
7. Due from/to brokers
The Company holds substantially all of its investments through its prime brokers pursuant to agreements between the Company and each prime broker. The brokerage arrangements differ from broker to broker, but generally cash and investments in securities and commodities balances are available as collateral against investments in securities sold, not yet purchased and derivative positions, if required.
Due from/to brokers include cash balances maintained with the Company’s prime brokers, margin debt balances, receivables and payables from unsettled trades and proceeds from securities sold, not yet purchased. In addition, due from and to brokers includes cash collateral received and posted from OTC and repurchase agreement counterparties. As of
December 31, 2014
, the Company’s due from/to brokers includes a total non-U.S. currency balance of $
1.1
million (
December 31, 2013
- payable of
$268.5 million
).
The Company uses prime brokerage arrangements to provide cash collateral for its letter of credit facilities and to fund trust accounts securing certain reinsurance contracts. As of December 31, 2014, the Company had
$308.8 million
of restricted cash securing letter of credit facilities and certain reinsurance contracts. Margin debt at the brokers primarily relates to borrowings to fund collateral arrangements. These amounts are callable upon demand by the prime broker, are secured by assets of the Company held by the prime broker and incur interest based on the Company’s negotiated rates. The interest expense incurred is reflected in net investment income in the consolidated statements of income.
8. Derivatives
The following tables identify the listing currency, fair value and notional amounts of derivative instruments included in the consolidated balance sheets, categorized by primary underlying risk. Balances are presented on a gross basis.
F-22
|
As of December 31, 2014
|
|||||||||
|
Listing currency (1)
|
Fair Value
|
Notional Amounts (2)
|
|||||||
|
Derivative Assets by Primary Underlying Risk
|
($ in thousands)
|
||||||||
|
Commodity Price
|
|||||||||
|
Commodity Future Options - Sold
|
USD
|
$
|
269
|
|
$
|
25,168
|
|
||
|
Credit
|
|||||||||
|
Credit Default Swaps - Protection Purchased
|
USD
|
9,456
|
|
89,772
|
|
||||
|
Credit Default Swaps - Protection Sold
|
USD
|
205
|
|
2,084
|
|
||||
|
Equity Price
|
|||||||||
|
Contracts for Differences - Long Contracts
|
USD
|
263
|
|
3,080
|
|
||||
|
Contracts for Differences - Short Contracts
|
AUD/EUR
|
186
|
|
6,428
|
|
||||
|
Total Return Swaps - Long Contracts
|
USD
|
43
|
|
1,874
|
|
||||
|
Total Return Swaps - Short Contracts
|
USD
|
34
|
|
9,763
|
|
||||
|
Interest Rates
|
|||||||||
|
Commodity Futures - Short Contracts
|
USD
|
78
|
|
186,280
|
|
||||
|
Foreign Currency Exchange Rates
|
|||||||||
|
Foreign Currency Forward
|
CAD/EUR/GBP/JPY
|
4,241
|
|
228,416
|
|
||||
|
Foreign Currency Options - Purchased
|
EUR/JPY/KRW/SAR
|
6,355
|
|
283,439
|
|
||||
|
Total Derivative Assets
|
$
|
21,130
|
|
$
|
836,304
|
|
|||
|
Listing currency (1)
|
Fair Value
|
Notional Amounts (2)
|
|||||||
|
Derivative Liabilities by Primary Underlying Risk
|
($ in thousands)
|
||||||||
|
Commodity Price
|
|||||||||
|
Commodity Future Options - Purchased
|
USD
|
285
|
|
12,012
|
|
||||
|
Credit
|
|
||||||||
|
Credit Default Swaps - Protection Purchased
|
USD
|
3,230
|
|
49,465
|
|
||||
|
Credit Default Swaps - Protection Sold
|
USD
|
1,319
|
|
5,142
|
|
||||
|
Equity Price
|
|
||||||||
|
Contracts for Differences - Long Contracts
|
EUR/GBP/USD
|
1,404
|
|
48,152
|
|
||||
|
Contracts for Differences - Short Contracts
|
AUD/NOK
|
130
|
|
3,070
|
|
||||
|
Total Return Swaps - Long Contracts
|
USD
|
590
|
|
11,233
|
|
||||
|
Interest Rates
|
|
||||||||
|
Commodity Futures - Short Contracts
|
USD
|
220
|
|
467,956
|
|
||||
|
Treasury Futures - Short Contracts
|
USD
|
280
|
|
10,119
|
|
||||
|
Foreign Currency Exchange Rates
|
|
||||||||
|
Foreign Currency Options - Sold
|
EUR/JPY/KRW
|
3,527
|
|
144,257
|
|
||||
|
Catastrophe Risk derivatives
|
USD
|
30
|
|
6,000
|
|
||||
|
Total Derivative Liabilities (free standing)
|
$
|
11,015
|
|
$
|
757,406
|
|
|||
|
Embedded derivative liabilities in reinsurance contracts (3)
|
USD
|
2,769
|
|
15,000
|
|
||||
|
Embedded derivative liabilities in deposit contracts (4)
|
USD
|
6,520
|
|
75,000
|
|
||||
|
Total Derivative Liabilities (embedded)
|
$
|
9,289
|
|
$
|
90,000
|
|
|||
(1) AUD = Australian Dollar, CAD = Canadian Dollar, EUR = Euro, GBP = British Pound, HKD = Hong Kong Dollar, JPY = Japanese Yen, KRW = South Korean Won, NOK = Norwegian Krone, SAR = Saudi Arabian Riyal, USD = US Dollar
(2) The absolute notional exposure represents the Company’s derivative activity as of
December 31, 2014
, which is representative of the volume of derivatives held during the period.
(3) The fair value of embedded derivatives in reinsurance contracts is included in reinsurance balances payable in the consolidated balance sheet.
(4) The fair value of embedded derivatives in deposit contracts is included in deposit liabilities in the consolidated balance sheet.
F-23
|
As of December 31, 2013
|
|||||||||
|
Listing currency (1)
|
Fair Value
|
Notional Amounts (2)
|
|||||||
|
Derivative Assets by Primary Underlying Risk
|
($ in thousands)
|
||||||||
|
Commodity Price
|
|||||||||
|
Commodity Future Options - Purchased
|
USD
|
$
|
256
|
|
$
|
12,325
|
|
||
|
Credit
|
|||||||||
|
Credit Default Swaps - Protection Purchased
|
USD
|
15,397
|
|
109,520
|
|
||||
|
Credit Default Swaps - Protection Sold
|
USD
|
1,157
|
|
9,557
|
|
||||
|
Equity Price
|
|||||||||
|
Contracts for Differences - Long Contracts
|
CHF/EUR/GBP/USD
|
10,549
|
|
62,847
|
|
||||
|
Contracts for Differences - Short Contracts
|
NOK
|
67
|
|
2,758
|
|
||||
|
Total Return Swaps - Long Contracts
|
BRL/JPY/USD
|
2,950
|
|
68,044
|
|
||||
|
Total Return Swaps - Short Contracts
|
USD
|
3
|
|
290
|
|
||||
|
Interest Rates
|
|||||||||
|
Bond Futures - Short Contracts
|
JPY
|
212
|
|
40,847
|
|
||||
|
Interest Rate Swaps
|
EUR
|
182
|
|
212,594
|
|
||||
|
Interest Rate Swaptions
|
EUR/JPY/USD
|
1,269
|
|
54,884
|
|
||||
|
Treasury Futures - Short Contracts
|
USD
|
108
|
|
6,544
|
|
||||
|
Foreign Currency Exchange Rates
|
|||||||||
|
Foreign Currency Forward
|
AUD/CAD/JPY/TRY
|
1,332
|
|
59,925
|
|
||||
|
Foreign Currency Options - Purchased
|
USD
|
5,563
|
|
240,062
|
|
||||
|
Total Derivative Assets
|
$
|
39,045
|
|
$
|
880,197
|
|
|||
|
Listing currency (1)
|
Fair Value
|
Notional Amounts (2)
|
|||||||
|
Derivative Liabilities by Primary Underlying Risk
|
($ in thousands)
|
||||||||
|
Commodity Price
|
|||||||||
|
Commodity Future Options - Sold
|
USD
|
$
|
148
|
|
$
|
35,484
|
|
||
|
Credit
|
|||||||||
|
Credit Default Swaps - Protection Purchased
|
EUR/USD
|
2,634
|
|
59,446
|
|
||||
|
Credit Default Swaps - Protection Sold
|
USD
|
348
|
|
875
|
|
||||
|
Equity Price
|
|||||||||
|
Contracts for Differences - Long Contracts
|
EUR
|
66
|
|
14,607
|
|
||||
|
Contracts for Differences - Short Contracts
|
DKK
|
425
|
|
7,253
|
|
||||
|
Total Return Swaps - Long Contracts
|
BRL/JPY/USD
|
1,385
|
|
24,807
|
|
||||
|
Total Return Swaps - Short Contracts
|
USD
|
140
|
|
5,037
|
|
||||
|
Index
|
|||||||||
|
Index Futures - Short Contracts
|
USD
|
441
|
|
8,888
|
|
||||
|
Interest Rates
|
|||||||||
|
Interest Rate Swaps
|
EUR/USD
|
821
|
|
465,560
|
|
||||
|
Interest Rate Swaptions
|
USD/JPY
|
174
|
|
99,587
|
|
||||
|
Foreign Currency Exchange Rates
|
|||||||||
|
Foreign Currency Forward
|
EUR/GBP
|
709
|
|
189,030
|
|
||||
|
Foreign Currency Options - Sold
|
USD
|
1,528
|
|
178,476
|
|
||||
|
Total Derivative Liabilities
|
$
|
8,819
|
|
$
|
1,089,050
|
|
|||
|
Embedded derivative liabilities in deposit contracts (3)
|
USD
|
4,430
|
|
75,000
|
|
||||
|
Total Derivative Liabilities (embedded)
|
$
|
4,430
|
|
$
|
75,000
|
|
|||
(1) USD = US dollar, JPY = Japanese yen, EUR = Euro, GBP = British pound, BRL = Brazilian real, NOK = Norwegian krone, AUD = Australian dollar, DKK = Danish krone, CAD = Canadian dollar, CHF = Swiss Franc, TRY Turkish Lira
F-24
(2) The absolute notional exposure represents the Company’s derivative activity as of
December 31, 2013
, which is representative of the volume of derivatives held during the period.
(3) The fair value of embedded derivatives in deposit contracts is included in deposit liabilities in the consolidated balance sheet.
The following table sets forth, by major risk type, the Company’s realized and unrealized gains (losses) relating to derivative trading activities for the years ended
December 31, 2014
,
2013
and
2012
. Realized and unrealized gains (losses) related to free standing derivatives are included in net investment income in the consolidated statements of income. Realized and unrealized gains (losses) related to embedded derivatives are included in other expenses in the consolidated statements of income.
|
December 31, 2014
|
December 31, 2013
|
December 31, 2012
|
|||||||||||||||||||||
|
Primary Underlying Risk
|
Realized Gain (Loss)
|
Unrealized Gain (Loss)*
|
Realized Gain (Loss)
|
Unrealized Gain (Loss)*
|
Realized Gain (Loss)
|
Unrealized Gain (Loss)*
|
|||||||||||||||||
|
Commodity Price
|
($ in thousands)
|
||||||||||||||||||||||
|
Commodities Futures - Long Contracts
|
$
|
—
|
|
$
|
—
|
|
$
|
—
|
|
$
|
—
|
|
$
|
1,710
|
|
$
|
—
|
|
|||||
|
Commodity Future Options - Purchased
|
(470
|
)
|
(289
|
)
|
264
|
|
15
|
|
(17
|
)
|
(10
|
)
|
|||||||||||
|
Commodity Future Options - Sold
|
364
|
|
101
|
|
(81
|
)
|
168
|
|
—
|
|
—
|
|
|||||||||||
|
Credit
|
|||||||||||||||||||||||
|
Credit Default Swaps - Protection Purchased
|
(5,627
|
)
|
1,018
|
|
4,243
|
|
(10,943
|
)
|
1,239
|
|
265
|
|
|||||||||||
|
Credit Default Swaps - Protection Sold
|
1,362
|
|
(830
|
)
|
(4,845
|
)
|
10,690
|
|
—
|
|
(212
|
)
|
|||||||||||
|
Equity Price
|
|||||||||||||||||||||||
|
Contracts for Differences - Long Contracts
|
(1,869
|
)
|
(11,621
|
)
|
8,900
|
|
6,172
|
|
288
|
|
4,203
|
|
|||||||||||
|
Contracts for Differences - Short Contracts
|
(3,873
|
)
|
413
|
|
1,219
|
|
(341
|
)
|
931
|
|
(29
|
)
|
|||||||||||
|
Total Return Swaps - Long Contracts
|
18,782
|
|
(2,112
|
)
|
1,026
|
|
1,786
|
|
(4,666
|
)
|
(221
|
)
|
|||||||||||
|
Total Return Swaps - Short Contracts
|
(795
|
)
|
171
|
|
(557
|
)
|
76
|
|
2,569
|
|
(103
|
)
|
|||||||||||
|
Index
|
|||||||||||||||||||||||
|
Index Futures - Long Contracts
|
(840
|
)
|
—
|
|
(2,413
|
)
|
—
|
|
—
|
|
—
|
|
|||||||||||
|
Index Futures - Short Contracts
|
(253
|
)
|
441
|
|
1,169
|
|
(441
|
)
|
(314
|
)
|
—
|
|
|||||||||||
|
Interest Rates
|
|||||||||||||||||||||||
|
Bond Futures - Short Contracts
|
(1,077
|
)
|
(212
|
)
|
(289
|
)
|
(36
|
)
|
—
|
|
248
|
|
|||||||||||
|
Commodities Futures - Short Contracts
|
(11
|
)
|
(143
|
)
|
437
|
|
(212
|
)
|
127
|
|
212
|
|
|||||||||||
|
Interest Rate Swaps
|
(743
|
)
|
639
|
|
949
|
|
(255
|
)
|
312
|
|
(383
|
)
|
|||||||||||
|
Interest Rate Swaptions
|
(455
|
)
|
(918
|
)
|
(170
|
)
|
913
|
|
665
|
|
5
|
|
|||||||||||
|
Sovereign Debt Futures - Short Contracts
|
—
|
|
—
|
|
—
|
|
—
|
|
(970
|
)
|
—
|
|
|||||||||||
|
Treasury Futures - Long Contracts
|
—
|
|
—
|
|
(119
|
)
|
—
|
|
—
|
|
—
|
|
|||||||||||
|
Treasury Futures - Short Contracts
|
(1,163
|
)
|
(388
|
)
|
830
|
|
(456
|
)
|
(1,233
|
)
|
564
|
|
|||||||||||
|
Foreign Currency Exchange Rates
|
|||||||||||||||||||||||
|
Foreign Currency Forward
|
16,891
|
|
3,617
|
|
5,385
|
|
(1,255
|
)
|
(1,270
|
)
|
1,879
|
|
|||||||||||
|
Foreign Currency Options
|
—
|
|
—
|
|
—
|
|
—
|
|
38
|
|
—
|
|
|||||||||||
|
Foreign Currency Options - Purchased
|
(265
|
)
|
941
|
|
5,920
|
|
1,069
|
|
(145
|
)
|
198
|
|
|||||||||||
|
Foreign Currency Options - Sold
|
(1,438
|
)
|
63
|
|
(3,787
|
)
|
(109
|
)
|
—
|
|
(87
|
)
|
|||||||||||
|
Reinsurance contract derivatives
|
—
|
|
982
|
|
1,250
|
|
3,085
|
|
—
|
|
—
|
|
|||||||||||
|
$
|
18,520
|
|
$
|
(8,127
|
)
|
$
|
19,331
|
|
$
|
9,926
|
|
$
|
(736
|
)
|
$
|
6,529
|
|
||||||
|
Embedded Derivatives
|
|||||||||||||||||||||||
|
Embedded derivatives in reinsurance contracts
|
$
|
—
|
|
$
|
102
|
|
$
|
—
|
|
$
|
—
|
|
$
|
—
|
|
$
|
—
|
|
|||||
|
Embedded derivatives in deposit contracts
|
—
|
|
(2,090
|
)
|
—
|
|
(460
|
)
|
—
|
|
(150
|
)
|
|||||||||||
|
Total Derivative Liabilities (embedded)
|
$
|
—
|
|
$
|
(1,988
|
)
|
$
|
—
|
|
$
|
(460
|
)
|
$
|
—
|
|
$
|
(150
|
)
|
|||||
*Unrealized gain (loss) relates to derivatives still held at reporting date.
The Company’s ISDA agreements with its counterparties provide for various termination events including decline in the NAV of the Company’s investments over a certain period, key man provisions, document delivery schedules, and
F-25
Employment Retirement Income Security Act and bankruptcy provisions. Upon the triggering of a termination event, a counterparty may avail itself of various remedies including, but not limited to, waiver of the termination event, request for additional collateral, renegotiation of the ISDA agreement, or immediate settlement of positions.
The Company obtains/provides collateral from/to various counterparties for OTC derivative contracts in accordance with bilateral collateral agreements. As of
December 31, 2014
, the Company posted collateral in the form of cash of
$27.6
million (
December 31, 2013
-
$35.4 million
) to certain counterparties to cover collateral requirements for open OTC derivatives.
The Company does not offset its derivative instruments and presents all amounts in the consolidated balance sheets on a gross basis. The Company has pledged cash collateral to counterparties to support the current value of amounts due to the counterparties based on the value of the underlying security. As of
December 31, 2014
and
2013
, the gross and net amounts of derivative instruments that are subject to enforceable master netting arrangements or similar agreements were as follows:
|
Gross Amounts not Offset in the Consolidated Balance Sheet
|
||||||||||||||||
|
December 31, 2014 Counterparty
|
Gross Amounts of Assets Presented in the Consolidated Balance Sheet
|
Financial Instruments
|
Cash Collateral Received
|
Net Amount
|
||||||||||||
|
($ in thousands)
|
||||||||||||||||
|
Counterparty 1
|
$
|
911
|
|
$
|
911
|
|
$
|
—
|
|
$
|
—
|
|
||||
|
Counterparty 2
|
1,915
|
|
371
|
|
—
|
|
1,544
|
|
||||||||
|
Counterparty 3
|
8,423
|
|
3,711
|
|
—
|
|
4,712
|
|
||||||||
|
Counterparty 4
|
368
|
|
368
|
|
—
|
|
—
|
|
||||||||
|
Counterparty 5
|
2,218
|
|
130
|
|
—
|
|
2,088
|
|
||||||||
|
Counterparty 6
|
5,832
|
|
2,866
|
|
2,420
|
|
546
|
|
||||||||
|
Counterparty 7
|
745
|
|
144
|
|
—
|
|
601
|
|
||||||||
|
Counterparty 8
|
40
|
|
40
|
|
—
|
|
—
|
|
||||||||
|
Counterparty 9
|
655
|
|
461
|
|
—
|
|
194
|
|
||||||||
|
Counterparty 10
|
23
|
|
—
|
|
—
|
|
23
|
|
||||||||
|
Total
|
$
|
21,130
|
|
$
|
9,002
|
|
$
|
2,420
|
|
$
|
9,708
|
|
||||
|
Gross Amounts not Offset in the Consolidated Balance Sheet
|
||||||||||||||||
|
December 31, 2014 Counterparty
|
Gross Amounts of Liabilities Presented in the Consolidated Balance Sheet
|
Financial Instruments
|
Cash Collateral Pledged
|
Net Amount (1)
|
||||||||||||
|
($ in thousands)
|
||||||||||||||||
|
Counterparty 1
|
$
|
1,606
|
|
$
|
911
|
|
$
|
512
|
|
$
|
183
|
|
||||
|
Counterparty 2
|
371
|
|
371
|
|
—
|
|
—
|
|
||||||||
|
Counterparty 3
|
3,711
|
|
3,711
|
|
—
|
|
—
|
|
||||||||
|
Counterparty 4
|
932
|
|
368
|
|
564
|
|
—
|
|
||||||||
|
Counterparty 5
|
130
|
|
130
|
|
—
|
|
—
|
|
||||||||
|
Counterparty 6
|
2,866
|
|
2,866
|
|
—
|
|
—
|
|
||||||||
|
Counterparty 7
|
144
|
|
144
|
|
—
|
|
—
|
|
||||||||
|
Counterparty 8
|
764
|
|
40
|
|
724
|
|
—
|
|
||||||||
|
Counterparty 9
|
461
|
|
461
|
|
—
|
|
—
|
|
||||||||
|
Total
|
$
|
10,985
|
|
$
|
9,002
|
|
$
|
1,800
|
|
$
|
183
|
|
||||
(1) Net amount as at December 31, 2014 is a result of options not being included as derivative instruments.
F-26
|
Gross Amounts not Offset in the Consolidated Balance Sheet
|
||||||||||||||||
|
December 31, 2013
Counterparty
|
Gross Amounts of Assets Presented in the Consolidated Balance Sheet
|
Financial Instruments
|
Cash Collateral Received
|
Net Amount
|
||||||||||||
|
($ in thousands)
|
||||||||||||||||
|
Counterparty 1
|
$
|
1,128
|
|
$
|
1,041
|
|
$
|
—
|
|
$
|
87
|
|
||||
|
Counterparty 2
|
4,998
|
|
400
|
|
1,629
|
|
2,969
|
|
||||||||
|
Counterparty 3
|
16,066
|
|
3,509
|
|
—
|
|
12,557
|
|
||||||||
|
Counterparty 4
|
1,351
|
|
1,351
|
|
—
|
|
—
|
|
||||||||
|
Counterparty 5
|
3,198
|
|
1,054
|
|
—
|
|
2,144
|
|
||||||||
|
Counterparty 6
|
12,234
|
|
492
|
|
10,465
|
|
1,277
|
|
||||||||
|
Counterparty 7
|
2
|
|
2
|
|
—
|
|
—
|
|
||||||||
|
Counterparty 8
|
—
|
|
—
|
|
—
|
|
—
|
|
||||||||
|
Counterparty 9
|
68
|
|
68
|
|
—
|
|
—
|
|
||||||||
|
Total
|
$
|
39,045
|
|
$
|
7,917
|
|
$
|
12,094
|
|
$
|
19,034
|
|
||||
|
Gross Amounts not Offset in the Consolidated Balance Sheet
|
||||||||||||||||
|
December 31, 2013
Counterparty
|
Gross Amounts of Liabilities Presented in the Consolidated Balance Sheet
|
Financial Instruments
|
Cash Collateral Pledged
|
Net Amount
|
||||||||||||
|
($ in thousands)
|
||||||||||||||||
|
Counterparty 1
|
$
|
1,041
|
|
$
|
1,041
|
|
$
|
—
|
|
$
|
—
|
|
||||
|
Counterparty 2
|
400
|
|
400
|
|
—
|
|
—
|
|
||||||||
|
Counterparty 3
|
3,509
|
|
3,509
|
|
—
|
|
—
|
|
||||||||
|
Counterparty 4
|
1,360
|
|
1,351
|
|
9
|
|
—
|
|
||||||||
|
Counterparty 5
|
1,054
|
|
1,054
|
|
—
|
|
—
|
|
||||||||
|
Counterparty 6
|
492
|
|
492
|
|
—
|
|
—
|
|
||||||||
|
Counterparty 7
|
59
|
|
2
|
|
57
|
|
—
|
|
||||||||
|
Counterparty 8
|
—
|
|
—
|
|
—
|
|
—
|
|
||||||||
|
Counterparty 9
|
904
|
|
68
|
|
836
|
|
—
|
|
||||||||
|
Total
|
$
|
8,819
|
|
$
|
7,917
|
|
$
|
902
|
|
$
|
—
|
|
||||
9. Loss and loss adjustment expense reserves
As of
December 31, 2014
and
2013
, loss and loss adjustment expense reserves in the consolidated balance sheets was comprised of the following:
|
December 31,
2014 |
December 31,
2013 |
||||||
|
($ in thousands)
|
|||||||
|
Case loss and loss adjustment expense reserves
|
$
|
64,343
|
|
$
|
34,307
|
|
|
|
Incurred but not reported loss and loss adjustment expense reserves
|
213,019
|
|
100,024
|
|
|||
|
$
|
277,362
|
|
$
|
134,331
|
|
||
The following table represents the activity in the reserve for losses and loss adjustment expenses for the years ended
December 31, 2014
,
2013
and
2012
:
F-27
|
2014
|
2013
|
2012
|
|||||||||
|
($ in thousands)
|
|||||||||||
|
Gross reserves for loss and loss adjustment expenses, beginning of year
|
$
|
134,331
|
|
$
|
67,271
|
|
$
|
—
|
|
||
|
Less: loss and loss adjustment expenses recoverable, beginning of year
|
(9,277
|
)
|
—
|
|
—
|
|
|||||
|
Net reserves for loss and loss adjustment expenses, beginning of year
|
125,054
|
|
67,271
|
|
—
|
|
|||||
|
Increase (decrease) in net loss and loss adjustment expenses incurred in respect of losses occurring in:
|
|||||||||||
|
Current year
|
286,706
|
|
144,509
|
|
80,306
|
|
|||||
|
Prior years'
|
(3,559
|
)
|
(4,697
|
)
|
—
|
|
|||||
|
Total incurred loss and loss adjustment expenses
|
283,147
|
|
139,812
|
|
80,306
|
|
|||||
|
Net loss and loss adjustment expenses paid in respect of losses occurring in:
|
|||||||||||
|
Current year
|
(70,562
|
)
|
(27,528
|
)
|
(13,035
|
)
|
|||||
|
Prior years'
|
(61,091
|
)
|
(54,501
|
)
|
—
|
|
|||||
|
Total net paid losses
|
(131,653
|
)
|
(82,029
|
)
|
(13,035
|
)
|
|||||
|
Net reserve for loss and loss adjustment expenses, end of year
|
276,548
|
|
125,054
|
|
67,271
|
|
|||||
|
Plus: loss and loss adjustment expenses recoverable, end of year
|
814
|
|
9,277
|
|
—
|
|
|||||
|
Gross reserve for loss and loss adjustment expenses, end of year
|
$
|
277,362
|
|
$
|
134,331
|
|
$
|
67,271
|
|
||
The
$3.6 million
decrease in prior years’ reserves for the year ended December 31, 2014 reflects
$0.7 million
of net favorable reserve development and
$2.9 million
resulting from decreases in premium estimates on certain contracts. The changes in loss and loss adjustment expense reserves related to premium estimate changes were accompanied by similar changes in the premium earned for those contracts, resulting in minimal impact to net underwriting income in the period.
The
$4.7 million
decrease in prior years’ reserves for the year ended December 31, 2013 reflects
$1.3 million
of favorable loss experience on several contracts and
$3.4 million
related to decreases in premium estimates, primarily related to one crop contract. The reduction in loss and loss adjustment expense reserves related to premium estimates was accompanied by an equal decrease in the premium written and earned for that contract, resulting in a minimal impact to net underwriting income.
The Company started its underwriting activities in 2012, as a result, there were
no
loss and loss adjustment expenses incurred or paid in respect of losses occurring in prior years for that period.
10. Management, performance and founders fees
The Company and Third Point Re are party to a Joint Venture and Investment Management Agreement (the “Investment Agreement”) with Third Point LLC and Third Point Advisors LLC under which Third Point LLC manages certain jointly held assets.
Pursuant to the Investment Agreement, Third Point Advisors LLC receives an annual performance fee allocation equal to
20%
of the net investment income of the Company’s share of the investment assets managed by Third Point LLC, subject to a loss carry forward provision. Additionally, a total management fee equal to
2%
annually of the Company’s share of the investment assets managed by Third Point LLC is paid to Third Point LLC and various Founders of the Company. Management fees are paid monthly, whereas performance fees are paid annually, in arrears.
F-28
Investment fee expenses related to the Investment Agreement, which are included in net investment income in the consolidated statements of income for the years ended
December 31, 2014
,
2013
and
2012
are as follows:
|
2014
|
2013
|
2012
|
|||||||||
|
($ in thousands)
|
|||||||||||
|
Management fees - Third Point LLC
|
$
|
5,037
|
|
$
|
3,651
|
|
$
|
2,444
|
|
||
|
Management fees - Founders
|
28,544
|
|
20,686
|
|
13,854
|
|
|||||
|
Performance fees - Third Point Advisors LLC
|
19,935
|
|
62,996
|
|
33,913
|
|
|||||
|
$
|
53,516
|
|
$
|
87,333
|
|
$
|
50,211
|
|
|||
As of
December 31, 2014
,
$19.9 million
(December 31, 2013 -
$63.0 million
) was included in non-controlling interests related to the performance fee payable to Third Point Advisors LLC. Since the performance fee allocation is based on annual performance, the performance fees are included in total liabilities until the performance fee is determined at year end and allocated to Third Point Advisors LLC’s capital account, in accordance with the Investment Agreement.
11. Deposit contracts
Deposit liability contracts each contain a fixed interest crediting rate. Certain deposit contracts also contain a variable interest crediting feature based on actual investment returns realized by the Company that can increase the overall effective interest crediting rate on those contracts. These variable interest crediting features are considered embedded derivatives. We include the estimated fair value of these embedded derivatives with the host deposit liability contracts. Changes in the estimated fair value of these embedded derivatives are recorded in other expenses in the consolidated statements of income.
The following table represents activity in the deposit liabilities for the years ended
December 31, 2014
,
2013
and
2012
:
|
December 31,
2014 |
December 31,
2013 |
December 31,
2012 |
|||||||||
|
($ in thousands)
|
|||||||||||
|
Balance, beginning of period
|
$
|
120,946
|
|
$
|
50,446
|
|
$
|
—
|
|
||
|
Consideration received
|
18,398
|
|
66,369
|
|
50,000
|
|
|||||
|
Net investment expense allocation and change in fair value of embedded derivatives
|
6,436
|
|
4,731
|
|
446
|
|
|||||
|
Payments
|
(350
|
)
|
(600
|
)
|
—
|
|
|||||
|
Balance, end of period
|
$
|
145,430
|
|
$
|
120,946
|
|
$
|
50,446
|
|
||
F-29
12. General and administrative expenses
General and administrative expenses for the years ended
December 31, 2014
,
2013
and
2012
are as follows:
|
2014
|
2013
|
2012
|
||||||||||
|
($ in thousands)
|
||||||||||||
|
Payroll and related
|
$
|
16,047
|
|
$
|
13,490
|
|
$
|
13,780
|
|
|||
|
Share compensation expenses
|
9,258
|
|
9,800
|
|
6,408
|
|
||||||
|
Legal and accounting
|
5,251
|
|
3,312
|
|
1,436
|
|
||||||
|
Travel and entertainment
|
3,065
|
|
2,473
|
|
1,887
|
|
||||||
|
IT related
|
1,621
|
|
1,290
|
|
1,417
|
|
||||||
|
Corporate insurance
|
1,123
|
|
744
|
|
365
|
|
||||||
|
Credit facility fees
|
1,023
|
|
605
|
|
677
|
|
||||||
|
Occupancy
|
532
|
|
420
|
|
595
|
|
||||||
|
Director and board costs
|
645
|
|
213
|
|
236
|
|
||||||
|
Other general and administrative expenses
|
1,443
|
|
689
|
|
575
|
|
||||||
|
$
|
40,008
|
|
$
|
33,036
|
|
$
|
27,376
|
|
||||
13. Net investment income
Net investment income for the years ended
December 31, 2014
,
2013
and
2012
consisted of the following:
|
2014
|
2013
|
2012
|
|||||||||
|
Net investment income by type
|
($ in thousands)
|
||||||||||
|
Net realized gains on investments and investment derivatives
|
$
|
193,957
|
|
$
|
236,333
|
|
$
|
55,632
|
|
||
|
Net unrealized gains (losses) on investments and investment derivatives
|
(83,146
|
)
|
78,950
|
|
113,422
|
|
|||||
|
Net gain (loss) on foreign currencies
|
2,581
|
|
21,106
|
|
(219
|
)
|
|||||
|
Dividend and interest income
|
31,750
|
|
14,233
|
|
25,284
|
|
|||||
|
Dividends paid on securities sold, not yet purchased
|
(120
|
)
|
(722
|
)
|
(1,629
|
)
|
|||||
|
Management and performance fees
|
(53,516
|
)
|
(87,333
|
)
|
(50,211
|
)
|
|||||
|
Other expenses
|
(7,151
|
)
|
(8,863
|
)
|
(5,411
|
)
|
|||||
|
Net investment income on investments managed by Third Point LLC
|
84,355
|
|
253,704
|
|
136,868
|
|
|||||
|
Investment income on cash held by the Catastrophe Reinsurer and Catastrophe Fund
|
101
|
|
86
|
|
—
|
|
|||||
|
Net gain on catastrophe bond held by Catastrophe Reinsurer
|
144
|
|
—
|
|
—
|
|
|||||
|
Net gain on reinsurance contract derivatives written by the Catastrophe Reinsurer
|
982
|
|
4,335
|
|
—
|
|
|||||
|
$
|
85,582
|
|
$
|
258,125
|
|
$
|
136,868
|
|
|||
F-30
|
2014
|
2013
|
2012
|
|||||||||
|
Net investment income by asset class
|
($ in thousands)
|
||||||||||
|
Net investment gains on equity securities
|
$
|
82,902
|
|
$
|
243,449
|
|
$
|
96,210
|
|
||
|
Net investment gains on debt securities
|
80,285
|
|
69,194
|
|
65,040
|
|
|||||
|
Net investment gains (losses) on other investments
|
(35,491
|
)
|
(5,045
|
)
|
7,386
|
|
|||||
|
Net investment gains on investment derivatives
|
10,393
|
|
29,257
|
|
5,793
|
|
|||||
|
Net investment gains (losses) on securities sold, not yet purchased
|
4,334
|
|
(5,974
|
)
|
17,076
|
|
|||||
|
Net investment income (loss) on cash, including foreign exchange gains (losses)
|
4,992
|
|
17,961
|
|
(1,230
|
)
|
|||||
|
Net investment gains (losses) on securities purchased under and agreement to resell
|
(4,099
|
)
|
1,863
|
|
562
|
|
|||||
|
Management and performance fees
|
(53,516
|
)
|
(87,333
|
)
|
(50,211
|
)
|
|||||
|
Other investment expenses
|
(4,218
|
)
|
(5,247
|
)
|
(3,758
|
)
|
|||||
|
$
|
85,582
|
|
$
|
258,125
|
|
$
|
136,868
|
|
|||
14. Other expenses
Other expenses for the years ended
December 31, 2014
,
2013
and
2012
consisted of the following:
|
2014
|
2013
|
2012
|
|||||||||
|
($ in thousands)
|
|||||||||||
|
Deposit liabilities investment expense
|
$
|
4,346
|
|
$
|
4,271
|
|
296
|
|
|||
|
Reinsurance contracts investment expense
|
1,061
|
|
191
|
|
—
|
|
|||||
|
Change in fair value of embedded derivatives in deposit and reinsurance contracts (1)
|
1,988
|
|
460
|
|
150
|
|
|||||
|
$
|
7,395
|
|
$
|
4,922
|
|
$
|
446
|
|
|||
(1) See discussion of accounting policy for embedded derivatives in
Note 2
for additional information.
15. Share Capital
Authorized and issued
The Company’s authorized share capital of
$33.0 million
is comprised of
300,000,000
common shares with a par value of
$0.10
each and
30,000,000
preference shares with a par value of
$0.10
each. As of
December 31, 2014
,
104,473,402
common shares were issued and outstanding.
No
preference shares have been issued to date.
On August 20, 2013, the Company completed an IPO of
24,832,484
common shares at a purchase price of
$12.50
per share. The net proceeds of the offering were
$286.0 million
, after deducting offering costs.
Warrants
The Company’s Founders and an advisor provided insurance industry expertise, resources and relationships to ensure that the Company would be fully operational with key management in place in time for the January 2012 underwriting season. In consideration of these commitments, the Company reserved for issuance to the Founders and an advisor warrants to purchase, in the aggregate, up to
4.0%
(Founders
3.5%
and an advisor
0.5%
) of the diluted shares (up to a maximum of
$1 billion
of subscribed shares) provided that the Founders and the advisor will not be issued any warrants for common shares issued in consideration for any capital raised by the Company in excess of
$1 billion
. The following is a summary of warrants as of
December 31, 2014
:
F-31
|
Exercise price
|
Authorized and
issued
|
Aggregated fair
value of
warrants
|
||||||||
|
($ in thousands, except for share and per share amounts)
|
||||||||||
|
Founders
|
$
|
10.00
|
|
4,069,868
|
|
$
|
15,203
|
|
||
|
Advisor
|
$
|
10.00
|
|
581,295
|
|
2,171
|
|
|||
|
4,651,163
|
|
$
|
17,374
|
|
||||||
The warrants were subject to a performance condition that was met as a result of the IPO. Prior to the IPO,
3,648,006
of the warrants were considered exercisable. After the IPO, the remaining
1,003,157
warrants met the performance condition. These amounts have been recorded as a component of capital raise costs in additional paid in capital resulting in no net impact to total shareholders’ equity.
The warrants expire
10 years
from the date of issuance, December 22, 2011, and will be exercisable at a price per share of
$10.00
, which is equal to the price per share paid by investors in the initial private offering.
16. Share-based compensation
On July 15, 2013, the Third Point Reinsurance Ltd. 2103 Omnibus Incentive Plan (“Omnibus Plan”) was approved by the Board of Directors and subsequently on August 2, 2013 by the Shareholders of the Company. An aggregate of
21,627,906
common shares were made available under the Omnibus Plan. This number of shares includes the shares available under the Third Point Reinsurance Limited Share Incentive Plan (“Share Incentive Plan”). Awards under the Omnibus Plan may be made in the form of performance awards, restricted shares, restricted share units, share options, share appreciation rights and other share-based awards.
As of
December 31, 2014
,
10,052,579
(December 31, 2013 -
10,613,975
) of the Company’s common shares were available for future issuance under the equity incentive compensation plans.
Total share based compensation expense of
$9.3 million
for the year ended
December 31, 2014
(
2013
-
$9.8 million
and
2012
-
$6.4 million
) was included in general and administrative expenses.
As of
December 31, 2014
, the Company had
$20.0 million
(December 31, 2013 -
$23.8 million
) of unamortized share compensation expense, which is expected to be amortized over a weighted average period of
1.6 years
(December 31, 2013 -
2.0 years
).
|
(a)
|
Management and director options
|
The management options issued under the Share Incentive Plan were subject to a service and performance condition. The service condition will be met with respect to
20%
of the management options on each of the first
five
anniversary dates following the grant date of the management options. The performance condition with respect to the management options was met as a result of the IPO. Prior to the IPO,
8,572,594
of the management options were considered exercisable subject to the service condition. After the IPO, the remaining
2,357,633
management options had met the performance condition.
The director options contain only a service condition that will be met with respect to
20%
of the director options on each of the
five
anniversary dates following the grant date of the director options. On November 6, 2013, the director options were modified so that a total of
60%
of the outstanding options vested on that date and the remaining
40%
of the director options were forfeited. These forfeited options were replaced with restricted share awards.
F-32
The management and director options activity for the years ended
December 31, 2014
,
2013
and
2012
were as follows:
|
Number of
options
|
Weighted
average exercise
price
|
|||||
|
Balances as of January 1, 2012
|
—
|
|
$
|
—
|
|
|
|
Granted - employees
|
10,872,090
|
|
13.20
|
|
||
|
Granted - directors
|
84,748
|
|
13.20
|
|
||
|
Balances as of December 31, 2012
|
10,956,838
|
|
13.20
|
|
||
|
Granted - employees
|
348,836
|
|
14.09
|
|
||
|
Forfeited
|
(324,599
|
)
|
13.20
|
|
||
|
Balances as of December 31, 2013
|
10,981,075
|
|
13.23
|
|
||
|
Granted - employees
|
348,836
|
|
18.25
|
|
||
|
Forfeited
|
(279,070
|
)
|
13.20
|
|
||
|
Exercised
|
(60,000
|
)
|
10.00
|
|
||
|
Balances as of December 31, 2014
|
10,990,841
|
|
$
|
13.41
|
|
|
The fair value of share options issued were estimated on the grant date using the Black-Scholes option-pricing model. The share price used for purposes of determining the fair value of share options that were granted in the year ended
December 31, 2014
was
$15.05
(
2013
-
$10.89
and
2012
-
$10.00
). The volatility assumption used of
23.1%
(
2013
-
21.95%
and
2012
-
31.25%
) was based on the average estimated volatility of a reinsurance company peer group. The other assumptions used in the option-pricing model were as follows: risk free interest rate of
2.2%
(2013 -
1.23%
and
2012
-
1.9%
), expected life of
6.5 years
(2013 -
6.5 years
and
2012
-
10.0 years
) and a
0.0%
dividend yield (2013 -
0.0%
and
2012
-
0.0%
). As of December 31, 2014, the weighted average remaining contractual term for options outstanding was
7.1 years
(2013 -
8.1 years
).
The following table summarizes information about the Company’s management and director share options outstanding as of
December 31, 2014
:
|
Options outstanding
|
Options exercisable
|
||||||||||
|
Range of exercise prices
|
Number of
options
|
Weighted
average
exercise price
|
Remaining
contractual
life
|
Number of
options
|
Weighted
average
exercise price
|
||||||
|
$10.00 - $10.89
|
6,361,205
|
|
$10.03
|
7.06
|
3,123,997
|
|
$10.01
|
||||
|
$16.00 - $16.89
|
2,349,702
|
|
$15.94
|
7.23
|
1,061,332
|
|
$16.01
|
||||
|
$20.00 - $25.05
|
2,279,934
|
|
$20.21
|
7.18
|
1,061,332
|
|
$20.01
|
||||
|
10,990,841
|
|
$13.41
|
7.12
|
5,246,661
|
|
$13.25
|
|||||
For the year ended
December 31, 2014
, the Company recorded
$6.6 million
(
2013
-
$8.3 million
and
2012
-
$4.8 million
) of share compensation expense related to share options.
The aggregate intrinsic value of options outstanding and options exercisable as of December 31, 2014 was
$28.4 million
and
$14.0 million
, respectively (2013 -
$61.5 million
and
$17.6 million
, respectively).
|
(b)
|
Restricted shares with service condition
|
Restricted shares vest either ratably or at the end of the required service period and contain certain restrictions during the vesting period, relating to, among other things, forfeiture in the event of termination of employment or service and transferability.
F-33
Restricted share award activity for the restricted shares with only a service condition for the years ended
December 31, 2014
,
2013
and
2012
was as follows:
|
Number of non-
vested restricted
shares
|
Weighted
average grant
date fair value
|
|||||
|
Balance as of January 1, 2012
|
—
|
|
$
|
—
|
|
|
|
Granted
|
641,800
|
|
10.00
|
|
||
|
Forfeited
|
(22,500
|
)
|
10.00
|
|
||
|
Balance as of December 31, 2012
|
619,300
|
|
10.00
|
|
||
|
Granted
|
37,856
|
|
15.22
|
|
||
|
Balance as of December 31, 2013
|
657,156
|
|
10.30
|
|
||
|
Granted
|
49,684
|
|
15.39
|
|
||
|
Forfeited
|
(17,800
|
)
|
10.00
|
|
||
|
Vested
|
(72,926
|
)
|
15.56
|
|
||
|
Balance as of December 31, 2014
|
616,114
|
|
$
|
10.10
|
|
|
For the year ended
December 31, 2014
, the Company issued
9,614
(2013 -
5,000
and
2012
-
641,800
) restricted shares to employees and
40,070
(2013 -
32,856
and
2012
-
none
) to directors. The restricted shares issued to employees in 2014 will vest after
three years
from the date of issuance, subject to the grantee’s continued service with the Company. The restricted shares issued in 2013 to employees vest after
two years
from the date of grant. The restricted shares issued in 2012 cliff vest after
three
or
five years
from the date of issuance, subject to the grantee’s continued service with the Company.
The restricted shares issued to directors in 2014 vested on December 31, 2014. The restricted shares issued in 2013 to directors also vested on December 31, 2014.
For the year ended
December 31, 2014
, the Company recorded
$2.6 million
(
2013
-
$1.5 million
and
2012
-
$1.6 million
) compensation expense related to restricted share awards.
(c) Restricted shares with service and performance condition
In December 2014, the Company granted performance-based restricted shares to employees pursuant to the Omnibus Plan where vesting of the awards is subject to both a service and performance condition. The vesting date for these awards is March 1, 2017 and will be based on a formula applied to the cumulative calendar year results for the 2014 to 2016 calendar years. The formula for determining the amount of shares that will vest is based on underwriting performance of the property and casualty reinsurance segment including underwriting income and the amount of float generated, as defined.
For the year ended December 31, 2014,
459,746
performance-based restricted shares had been granted at a grant date fair value of
$14.60
of which
306,496
were considered probable of vesting.
For the year ended December 31, 2014, the Company recorded
$0.1 million
of share compensation expense related to the performance-based restricted shares.
17. Non-controlling interests
Non-controlling interests represent the portion of equity in consolidated subsidiaries not attributable, directly or indirectly, to the Company. The ownership interests in consolidated subsidiaries held by parties other than the Company have been presented in the consolidated balance sheets, as a separate component of shareholders’ equity. Non-controlling interests as of
December 31, 2014
and
2013
are as follows:
F-34
|
December 31, 2014
|
December 31, 2013
|
||||||
|
($ in thousands)
|
|||||||
|
Catastrophe Fund
|
$
|
60,153
|
|
$
|
49,254
|
|
|
|
Catastrophe Fund Manager
|
(259
|
)
|
(236
|
)
|
|||
|
Joint Venture - Third Point Advisors LLC share
|
40,241
|
|
69,717
|
|
|||
|
$
|
100,135
|
|
$
|
118,735
|
|
||
Income (loss) attributable to non-controlling interests for the years ended
December 31, 2014
,
2013
and
2012
was:
|
2014
|
2013
|
2012
|
|||||||||
|
($ in thousands)
|
|||||||||||
|
Catastrophe Fund
|
$
|
4,748
|
|
$
|
4,284
|
|
$
|
—
|
|
||
|
Catastrophe Fund Manager
|
(23
|
)
|
(238
|
)
|
—
|
|
|||||
|
Joint Venture - Third Point Advisors LLC share
|
1,590
|
|
1,721
|
|
1,216
|
|
|||||
|
$
|
6,315
|
|
$
|
5,767
|
|
$
|
1,216
|
|
|||
As of
December 31, 2014
, the following entities were consolidated in accordance with the Financial Accounting Standards Board’s consolidations voting model (ASC 810):
|
a)
|
Third Point Reinsurance Opportunities Fund Ltd. and Third Point Re Cat Ltd.
|
As of
December 31, 2014
, Third Point Re’s investment in the Catastrophe Fund was
$59.5 million
(
December 31, 2013
-
$54.8 million
), representing approximately
49.7%
(December 31, 2013 -
53.0%
) of the Catastrophe Fund’s issued, non-voting, participating share capital. In December 2014, the Company announced that it would no longer accept investments in the Catastrophe Fund and that no new business would be written in the Catastrophe Reinsurer. The Catastrophe Fund Manager will continue to manage the runoff of the remaining exposure in the Catastrophe Fund.
The Catastrophe Fund Manager holds
100%
of the authorized and issued voting, nonparticipating shares of the Catastrophe Fund, while the Catastrophe Fund’s investors, including Third Point Re, hold
100%
of issued non-voting, participating shares. Furthermore,
100%
of the authorized and issued voting, non-participating share capital of the Catastrophe Reinsurer and
100%
of the issued non-voting, participating share capital of the Catastrophe Reinsurer is held by the Catastrophe Fund.
For the year ended
December 31, 2014
, the Catastrophe Fund raised
$6.2 million
(Third Point Re’s share -
nil
) of committed capital resulting in contributions to non-controlling interests for the Catastrophe Fund of
$6.2 million
for the year ended
December 31, 2014
.
For the year ended
December 31, 2013
, the Catastrophe Fund raised
$53.0 million
(Third Point Re’s share -
$28.0 million
) of committed capital resulting in a contribution to non-controlling interests for the Catastrophe Fund of
$25.3 million
for the year ended
December 31, 2013
. The Catastrophe Fund began its operations in 2013, as a result,
no
contributions or calls were made in
2012
.
|
b)
|
Third Point Reinsurance Investment Management Ltd. (the “Catastrophe Fund Manager”)
|
The Catastrophe Fund Manager has been consolidated as part of the Company with Hiscox’s
15%
interest in the Catastrophe Fund Manager recorded as a non-controlling interest. The Catastrophe Fund Manager acts as manager for both the Catastrophe Fund and the Catastrophe Reinsurer and in that capacity is responsible for overseeing:
|
•
|
The investment activities of the Catastrophe Fund, and
|
|
•
|
The underwriting activities of the Catastrophe Reinsurer.
|
F-35
The Catastrophe Fund Manager does not participate in the profits or losses of either the Catastrophe Fund or the Catastrophe Reinsurer; however, the Catastrophe Fund Manager does receive management and performance fees for its advisory services.
On January 5, 2015, the Company and Hiscox agreed to terminate Hiscox’s
15%
ownership in the Catastrophe Fund Manager effective December 31, 2014.
As of
December 31, 2014
, the following entity was consolidated in accordance with the Financial Accounting Standards Board’s consolidations variable interest model (ASC 810):
|
a)
|
Third Point Reinsurance Investment Management Ltd.
|
The joint venture created through the Investment Agreement (
Note 10
) has been considered a variable interest entity in accordance with U.S. GAAP. Since the Company was deemed to be the primary beneficiary, the Company has consolidated the joint venture and has recorded Third Point Advisors LLC’s minority interest as a non-controlling interest in the consolidated statements of shareholders’ equity.
For the year ended
December 31, 2014
,
$51.0
million (2013 -
$35.1
and
2012
- $
nil
) was distributed by Third Point Advisors LLC and reduced the amount of the non-controlling interest.
As of
December 31, 2014
, the following entities were
not
consolidated as per ASC 810:
Consolidation:
|
a)
|
TP Lux Holdco LP
|
Third Point Re is a limited partner in TP Lux Holdco LP (the “Cayman HoldCo”), which is an affiliate of the Investment Manager. The Cayman HoldCo was formed as a limited partnership under the laws of the Cayman Islands and invests and holds debt and equity interests in TP Lux HoldCo S.a.r.l, a Luxembourg private limited liability company (the “LuxCo”) established under the laws of the Grand-Duchy of Luxembourg, which is also an affiliate of the Investment Manager.
LuxCo’s principal objective is to act as a collective investment vehicle to purchase Euro debt and equity investments. Third Point Re invests in the Cayman HoldCo alongside other investment funds managed by the Investment Manager. As of
December 31, 2014
, Third Point Re held a
9.8%
(December 31, 2013 -
10.0%
) interest in the Cayman Holdco. Third Point Re accounts for its investment in the limited partnership under the variable interest model, in which Third Point Re is not the primary beneficiary, at fair value in the consolidated balance sheets and records changes in fair value in the consolidated statements of income.
As of
December 31, 2014
, the estimated fair value of the investment in the limited partnership was
$55.8
million (
December 31, 2013
-
$29.3
million). The valuation policy with respect to this investment in a limited partnership is further described in
Note 5
. Third Point Re’s maximum exposure to loss as a result of its involvement with this investment is limited to the carrying value of the investment.
b) Third Point Hellenic Recovery US Feeder Fund, L.P.
Third Point Re is a limited partner in Third Point Hellenic Recovery US Feeder Fund, L.P. (“Hellenic Fund”), which is an affiliate of the Investment Manager. The Hellenic Fund was formed as a limited partnership under the laws of the Cayman Islands on April 12, 2013 and invests and holds debt and equity interests.
Third Point Re committed
$11.4 million
(
December 31, 2013
-
$11.4 million
) in the Hellenic Fund, of which
$2.9 million
(2013 -
$4.3 million
) was called and
$1.5 million
(2013 - $
nil
) was distributed during the year ended
December 31, 2014
.
As of
December 31, 2014
, Third Point Re held a
3.0%
(December 31, 2013 -
3.1%
) interest in the Hellenic Fund. Third Point Re accounts for its investment in the limited partnership under the variable interest model, in which Third Point Re is not the primary beneficiary, at fair value in the consolidated balance sheets and records the change in the fair value in the consolidated statements of income.
F-36
As of
December 31, 2014
, the estimated fair value of Third Point Re’s investment in the Hellenic Fund was
$6.3
million (December 31, 2013-
$5.3 million
). The valuation policy with respect to this investment in a limited partnership is further described in
Note 5
. Third Point Re’s maximum exposure to loss as a result of its involvement with this investment is limited to the carrying value of the investment.
18. Earnings per share
The following sets forth the computation of basic and diluted earnings per share for the years ended
December 31, 2014
,
2013
and
2012
:
|
2014
|
2013
|
2012
|
|||||||||||
|
Weighted-average number of common shares outstanding:
|
($ in thousands, except share and per share amounts)
|
||||||||||||
|
Basic number of common shares outstanding
|
103,287,693
|
|
87,505,540
|
|
78,432,132
|
|
|||||||
|
Dilutive effect of options
|
1,468,521
|
|
400,149
|
|
—
|
|
|||||||
|
Dilutive effect of warrants
|
1,634,845
|
|
1,064,842
|
|
166,104
|
|
|||||||
|
Diluted number of common shares outstanding
|
106,391,059
|
|
88,970,531
|
|
78,598,236
|
|
|||||||
|
Basic net income per common share:
|
|||||||||||||
|
Net income
|
$
|
50,395
|
|
$
|
227,311
|
|
$
|
99,401
|
|
||||
|
Income allocated to participating shares
|
(328
|
)
|
(1,618
|
)
|
(734
|
)
|
|||||||
|
Net income available to common shareholders
|
$
|
50,067
|
|
$
|
225,693
|
|
$
|
98,667
|
|
||||
|
Basic net income per common share
|
$
|
0.48
|
|
$
|
2.58
|
|
$
|
1.26
|
|
||||
|
Diluted net income per common share
|
|||||||||||||
|
Net income
|
$
|
50,395
|
|
$
|
227,311
|
|
$
|
99,401
|
|
||||
|
Income allocated to participating securities
|
(319
|
)
|
(1,592
|
)
|
(737
|
)
|
|||||||
|
Net income available to common shareholders
|
$
|
50,076
|
|
$
|
225,719
|
|
$
|
98,664
|
|
||||
|
Diluted net income per common share
|
$
|
0.47
|
|
$
|
2.54
|
|
$
|
1.26
|
|
||||
For the years ended
December 31, 2014
,
2013
and
2012
, anti-dilutive options, warrants and restricted shares with service and performance condition of
4,501,991
,
3,786,173
,
3,052,091
, respectively, were excluded from the computation of diluted earnings per share.
19. Related party transactions
In addition to the transactions disclosed in
Note 5
,
10
and
17
to these consolidated financial statements, the following transactions are classified as related party transactions, as each counterparty has either a direct or indirect shareholding in the Company or the Company has an investment in such counterparty.
|
a)
|
Pine Brook Road Partners, LLC and Narragansett Bay Insurance Company
|
Third Point Re entered into a quota share reinsurance agreement with Narragansett Bay Insurance Company (“Narragansett Bay”) effective December 31, 2012, which was renewed on December 31, 2013. This contract was not renewed on December 31, 2014. The Company recorded
$1.0 million
,
$4.7 million
and
$9.0 million
of premiums written related to these contracts for the years ended December 31, 2014,
2013
and
2012
, respectively. Pine Brook Road Partners, LLC (“Pine Brook”) is the manager of an investment funds, one of which owns approximately
12.0%
(December 31, 2013 -
12.0%
) of the Company’s outstanding common shares. Pine Brook is also the manager of an investment fund that owns common shares in Narragansett Bay.
|
b)
|
Third Point Loan L.L.C.
|
Third Point Loan L.L.C. (“Loan LLC”) serves as nominee of Third Point Re and other affiliated investment management clients of the Investment Manager for certain investments. Loan LLC has appointed the Investment
F-37
Manager as its true and lawful agent and attorney. As of
December 31, 2014
, Loan LLC held
$33.4
million (
December 31, 2013
-
$147.2
million) of Third Point Re’s investments, which are included in investments in securities, commodities, and derivative contracts in the consolidated balance sheets. Third Point Re’s pro rata interest in the underlying investments registered in the name of the Loan LLC and the related income and expense are reflected accordingly in the consolidated balance sheets and the consolidated statements of income.
20. Financial instruments with off-balance sheet risk or concentrations of credit risk
Off-balance sheet risk
In the normal course of business, the Company trades various financial instruments and engages in various investment activities with off-balance sheet risk. These financial instruments include securities sold, not yet purchased, forwards, futures, options, swaptions, swaps and contracts for differences. Generally, these financial instruments represent future commitments to purchase or sell other financial instruments at specific terms at specified future dates. Each of these financial instruments contains varying degrees of off-balance sheet risk whereby changes in the fair values of the securities underlying the financial instruments or fluctuations in interest rates and index values may exceed the amounts recognized in the consolidated balance sheets.
Securities sold, not yet purchased are recorded as liabilities in the consolidated balance sheets and have market risk to the extent that the Company, in satisfying its obligations, may be required to purchase securities at a higher value than that recorded in the consolidated balance sheets. The Company’s investments in securities and commodities and amounts due from brokers are partially restricted until the Company satisfies the obligation to deliver securities sold, not yet purchased.
Forward and futures contracts are a commitment to purchase or sell financial instruments, currencies or commodities at a future date at a negotiated rate. Forward and futures contracts expose the Company to market risks to the extent that adverse changes occur to the underlying financial instruments such as currency rates or equity index fluctuations.
Option contracts give the purchaser the right, but not the obligation, to purchase from or sell to the option writer financial instruments, commodities or currencies within a defined time period for a specified price. The premium received by the Company upon writing an option contract is recorded as a liability, marked to market on a daily basis and is included in securities sold, not yet purchased in the consolidated balance sheets. In writing an option, the Company bears the market risk of an unfavorable change in the financial instrument underlying the written option. Exercise of an option written by the Company could result in the Company selling or buying a financial instrument at a price different from the current fair value.
In the normal course of trading activities in its investment portfolio, the Company trades and holds certain derivative contracts, such as written options, which constitute guarantees. The maximum payout for written put options is limited to the number of contracts written and the related strike prices and the maximum payout for written call options is dependent upon the market price of the underlying security at the date of a payout event. As of
December 31, 2014
, the investment portfolio had a maximum payout amount of approximately
$666.9 million
(December 31, 2013 -
$689.5 million
) relating to written put option contracts with expiration ranging from
one
month to
10 months
from the balance sheet date. The maximum payout amount could be offset by the subsequent sale, if any, of assets obtained via the settlement of a payout event. The fair value of these written put options as of
December 31, 2014
is
$4.5 million
(December 31, 2013 -
$2.6 million
) and is included in securities sold, not yet purchased in the consolidated balance sheets.
Swaption contracts give the Company the right, but not the obligation, to enter into a specified interest-rate swap within a specified period of time. The Company’s market and counterparty credit risk is limited to the premium paid to enter into the swaption contract and net unrealized gains.
Total return swaps, contracts for differences, index swaps, and interest rate swaps that involve the exchange of cash flows between the Company and counterparties are based on the change in the fair value of a particular equity, index, or interest rate on a specified notional holding. The use of these contracts exposes the Company to market risks equivalent to actually holding securities of the notional value but typically involve little capital commitment relative to the exposure achieved. The gains or losses of the Company may therefore be magnified on the capital commitment.
F-38
Credit derivatives
Credit default swaps protect the buyer against the loss of principal on one or more underlying bonds, loans, or mortgages in the event the issuer suffers a credit event. Typical credit events include failure to pay or restructuring of obligations, bankruptcy, dissolution or insolvency of the underlying issuer. The buyer of the protection pays an initial and/or a periodic premium to the seller and receives protection for the period of the contract. If there is not a credit event, as defined in the contract, the buyer receives no payments from the seller. If there is a credit event, the buyer receives a payment from the seller of protection as calculated by the contract between the two parties.
The Company may also enter into index and/or basket credit default swaps where the credit derivative may reference a basket of single-name credit default swaps or a broad-based index. Generally, in the event of a default on one of the underlying names, the buyer will receive a pro-rata portion of the total notional amount of the credit default index or basket contract from the seller. When the Company purchases single-name, index and basket credit default swaps, the Company is exposed to counterparty nonperformance.
Upon selling credit default swap protection, the Company may expose itself to the risk of loss from related credit events specified in the contract. Credit spreads of the underlying together with the period of expiration is indicative of the likelihood of a credit event under the credit default swap contract and the Company’s risk of loss. Higher credit spreads and shorter expiration dates are indicative of a higher likelihood of a credit event resulting in the Company’s payment to the buyer of protection. Lower credit spreads and longer expiration dates would indicate the opposite and lowers the likelihood the Company needs to pay the buyer of protection. As of December 31, 2014, there was no cash collateral received specifically related to written credit default swaps as collateral is based on the net exposure associated with all derivative instruments subject to applicable netting agreements with counterparties and may not be specific to any individual derivative contract.
The following table sets forth certain information related to the Company’s written credit derivatives as of
December 31, 2014
and 2013:
|
December 31, 2014
|
Maximum Payout/ Notional Amount (by period of expiration)
|
Fair Value of Written Credit Derivatives (2)
|
||||||||||||||||||||||
|
Credit Spreads on
underlying (basis
points)
|
0-5 years
|
5 years or
Greater Expiring Through 2046
|
Total Written
Credit Default
Swaps (1)
|
Asset
|
Liability
|
Net Asset/(Liability)
|
||||||||||||||||||
|
($ in thousands)
|
||||||||||||||||||||||||
|
Single name (0 - 250)
|
$
|
—
|
|
$
|
5,142
|
|
$
|
5,142
|
|
$
|
—
|
|
$
|
1,319
|
|
$
|
(1,319
|
)
|
||||||
|
Single name (251-500)
|
—
|
|
2,084
|
|
2,084
|
|
205
|
|
—
|
|
205
|
|
||||||||||||
|
$
|
—
|
|
$
|
7,226
|
|
$
|
7,226
|
|
$
|
205
|
|
$
|
1,319
|
|
$
|
(1,114
|
)
|
|||||||
|
December 31, 2013
|
Maximum Payout/ Notional Amount (by period of expiration)
|
Fair Value of Written Credit Derivatives (2)
|
||||||||||||||||||||||
|
Credit Spreads on
underlying (basis
points)
|
0-5 years
|
5 years or
Greater Expiring Through 2046
|
Total Written
Credit Default
Swaps (1)
|
Asset
|
Liability
|
Net Asset/(Liability)
|
||||||||||||||||||
|
($ in thousands)
|
||||||||||||||||||||||||
|
Single name (0 - 250)
|
$
|
368
|
|
$
|
—
|
|
$
|
368
|
|
$
|
—
|
|
$
|
(104
|
)
|
$
|
(104
|
)
|
||||||
|
Single name (251-500)
|
9,514
|
|
—
|
|
9,514
|
|
1,136
|
|
—
|
|
1,136
|
|
||||||||||||
|
Index (0-250)
|
—
|
|
550
|
|
550
|
|
21
|
|
(244
|
)
|
(223
|
)
|
||||||||||||
|
$
|
9,882
|
|
$
|
550
|
|
$
|
10,432
|
|
$
|
1,157
|
|
$
|
(348
|
)
|
$
|
809
|
|
|||||||
|
(1)
|
As of
December 31, 2014
and 2013, the Company did not hold any offsetting buy protection credit derivatives with the same underlying reference obligation.
|
F-39
|
(2)
|
Fair value amounts of derivative contracts are shown on a gross basis prior to cash collateral or counterparty netting.
|
Concentrations of credit risk
In addition to off-balance sheet risks related to specific financial instruments, the Company may be subject to concentration of credit risk with particular counterparties. Substantially all securities transactions of the Company are cleared by several major securities firms. The Company had substantially all such individual counterparty concentration with these brokers or their affiliates as of
December 31, 2014
. However, the Company reduces its credit risk with counterparties by entering into master netting agreements. Therefore, assets represent the Company’s greater unrealized gains less unrealized losses for derivative contracts in which the Company has master netting agreements. Similarly, liabilities represent the Company’s greater unrealized losses less unrealized gains for derivative contracts in which the Joint Venture has master netting agreements. Furthermore, the Company obtains collateral from counterparties to reduce its exposure to counterparty credit risk.
The Company’s maximum exposure to credit risk associated with counterparty nonperformance on derivative contracts is limited to the net unrealized gains by counterparty inherent in such contracts which are recognised in the consolidated balance sheets. As of
December 31, 2014
, the Company’s maximum counterparty credit risk exposure was
$9.7
million (
December 31, 2013
-
$19.0
million).
21. Commitments and Contingencies
Operating lease
The Company leases offices space in Bermuda and in New Jersey, U.S.A. The leases expire on November 30, 2015 and July 31, 2015, respectively. The leases have been accounted for as operating leases. Total rent expense for the year ended
December 31, 2014
was $
0.5 million
(
2013
: $
0.4 million
and 2012:
$0.4 million
).
Future minimum rental commitments as of December 31, 2014 under this lease are expected to be as follows:
|
($ in thousands)
|
|||
|
2015
|
$
|
411
|
|
|
2016
|
—
|
|
|
|
2017
|
—
|
|
|
|
2018
|
—
|
|
|
|
2019
|
—
|
|
|
|
$
|
411
|
|
|
Agreements
Third Point LLC
The Company and Third Point Re (together, the “Companies”) entered into a
5
year investment management agreement with Third Point LLC on December 22, 2011. The Companies are parties to an Investment Agreement with Third Point LLC under which the Companies, Third Point LLC and Third Point Advisors LLC formed a joint venture for the purpose of managing certain jointly held assets. The non-controlling interest in the consolidated balance sheets includes Third Point Advisors LLC’s share of assets in the investment joint venture.
On January 28, 2015, Third Point Re USA entered into a similar investment management agreement with Third Point LLC and Third Point Advisors LLC to form a second joint venture for purposes of managing certain jointly held assets of Third Point Re USA and Third Point Advisors LLC. The term of the new investment management agreement coincides with the expiration of the original investment management agreement.
F-40
Netjets
On December 20, 2011, Third Point Re acquired from Netjets Sales Inc. (“Netjets”) an undivided
12.5%
interest in
two
aircraft for a
five
year period. On September 3, 2014, the Company acquired an undivided
6.25%
interest in
one
additional aircraft for a
five
year period, with a minimum commitment period of 2.5 years. The agreements with NetJets provides for monthly management fees, occupied hourly fees and other fees. Future minimum management fee commitments as of December 31, 2014 under the existing leases are expected to be as follows:
|
($ in thousands)
|
|||
|
2015
|
$
|
660
|
|
|
2016
|
639
|
|
|
|
2017
|
24
|
|
|
|
2018
|
—
|
|
|
|
2019
|
—
|
|
|
|
$
|
1,323
|
|
|
Letters of credit
As of
December 31, 2014
, the Company had entered into the following letter of credit facilities, which automatically renew annually unless terminated by either party in accordance with the required notice period:
|
Facility (3)
|
Renewal date
|
||||
|
($ in thousands)
|
|||||
|
BNP Paribas (1)
|
$
|
100,000
|
|
February 15, 2015
|
|
|
Citibank (2)
|
250,000
|
|
January 23, 2015
|
||
|
J.P. Morgan
|
50,000
|
|
August 22, 2014
|
||
|
$
|
400,000
|
|
|||
|
(1)
|
On February 15, 2015, the BNP Paribas facility was renewed until February 15, 2016.
|
|
(2)
|
On January 23, 2015, the Citibank facility was renewed until January 23, 2016.
|
|
(3)
|
On February 26, 2015, we entered into a letter of credit facility with Lloyds Bank for
$150.0 million
.
|
As of
December 31, 2014
, $
218.5 million
(
December 31, 2013
-
$127.3 million
) of letters of credit, representing
54.6%
of the total available facilities, had been drawn upon (
December 31, 2013
–
42.4%
(based on total available facilities of
$300 million
)).
Under the facilities, the Company provides collateral that may consist of equity securities, repurchase agreements and cash and cash equivalents. As of
December 31, 2014
, cash and cash equivalents with a fair value of $
219.0 million
(
December 31, 2013
- $
100.6 million
) were pledged as security against the letters of credit issued. These amounts are included in restricted cash and cash equivalents in the consolidated balance sheets. Each of the facilities contain customary events of default and restrictive covenants, including but not limited to, limitations on liens on collateral, transactions with affiliates, mergers and sales of assets, as well as solvency and maintenance of certain minimum pledged equity requirements, A.M. Best Company rating of “A-“ or higher, and restricts issuance of any debt without the consent of the letter of credit provider. Additionally, if an event of default exists, as defined in the letter of credit facilities, the Company will be prohibited from paying dividends. The Company was in compliance with all of the covenants as of
December 31, 2014
.
Investments
Loan and other participation interests purchased by the Company, such as bank debt, may include revolving credit arrangements or other financing commitments obligating the Company to advance additional amounts on demand. As of
December 31, 2014
, the Company had one unfunded capital commitment of
$4.2 million
related to its investment in the Hellenic Fund (see
Note 17
for additional information).
F-41
In the normal course of business, the Company, as part of its investment strategy, enters into contracts that contain a variety of indemnifications and warranties. The Company’s maximum exposure under these arrangements is unknown, as this would involve future claims that may be made against the Company that have not yet occurred. However, the Company has not had prior claims or losses pursuant to these contracts and expects the risk of loss to be remote. Thus, no amounts have been accrued related to such indemnifications. The Company also indemnifies Third Point Advisors LLC, Third Point LLC and its employees from and against any loss or expense, including, without limitation any judgment, settlement, legal fees and other costs. Any expenses related to this indemnification are reflected in net investment income in the consolidated statements of income.
See
Note 19
for information regarding investment commitment to Kiskadee Fund.
Litigation
From time to time in the normal course of business, the Company may be involved in formal and informal dispute resolution procedures, which may include arbitration or litigation, the outcomes of which determine the rights and obligations under the Company’s reinsurance contracts and other contractual agreements. In some disputes, the Company may seek to enforce its rights under an agreement or to collect funds owing to it. In other matters, the Company may resist attempts by others to collect funds or enforce alleged rights. While the final outcome of legal disputes that may arise cannot be predicted with certainty, the Company is not currently involved in any formal or informal dispute resolution procedures.
22. Segment reporting
The determination of the Company’s business segments is based on the manner in which management monitors the performance of its operations. The Company reports
two
operating segments – Property and Casualty Reinsurance and Catastrophe Risk Management. The Company has also identified a corporate function that includes the Company’s investment results and certain general and administrative expenses related to corporate activities.
Effective January 1, 2014, the Company modified the presentation of its operating segments to allocate net investment income from float to the property and casualty reinsurance segment. The property and casualty reinsurance operations generate excess cash flows, or float, which the Company tracks in managing the business. The Company considers net investment income on float in evaluating the overall contribution of the property and casualty reinsurance segment. Prior period segment results have been adjusted to conform to this presentation.
The following is a summary of the Company’s operating segments results for the years ended
December 31, 2014
,
2013
and
2012
:
F-42
|
Year Ended December 31, 2014
|
|||||||||||||||
|
Property and Casualty Reinsurance
|
Catastrophe Risk Management
|
Corporate
|
Total
|
||||||||||||
|
Revenues
|
($ in thousands)
|
||||||||||||||
|
Gross premiums written
|
$
|
601,305
|
|
$
|
11,995
|
|
$
|
—
|
|
$
|
613,300
|
|
|||
|
Gross premiums ceded
|
(150
|
)
|
—
|
|
—
|
|
(150
|
)
|
|||||||
|
Net premiums written
|
601,155
|
|
11,995
|
|
—
|
|
613,150
|
|
|||||||
|
Change in net unearned premium reserves
|
(168,858
|
)
|
240
|
|
—
|
|
(168,618
|
)
|
|||||||
|
Net premiums earned
|
432,297
|
|
12,235
|
|
—
|
|
444,532
|
|
|||||||
|
Expenses
|
|||||||||||||||
|
Loss and loss adjustment expenses incurred, net
|
283,180
|
|
(33
|
)
|
—
|
|
283,147
|
|
|||||||
|
Acquisition costs, net
|
136,154
|
|
1,052
|
|
—
|
|
137,206
|
|
|||||||
|
General and administrative expenses
|
22,515
|
|
3,113
|
|
14,380
|
|
40,008
|
|
|||||||
|
Total expenses
|
441,849
|
|
4,132
|
|
14,380
|
|
460,361
|
|
|||||||
|
Net underwriting loss
|
(9,552
|
)
|
n/a
|
|
n/a
|
|
n/a
|
|
|||||||
|
Net investment income
|
11,305
|
|
1,227
|
|
73,050
|
|
85,582
|
|
|||||||
|
Other expenses
|
(7,395
|
)
|
—
|
|
—
|
|
(7,395
|
)
|
|||||||
|
Income tax expense
|
—
|
|
—
|
|
(5,648
|
)
|
(5,648
|
)
|
|||||||
|
Segment income (loss) including non-controlling interests
|
(5,642
|
)
|
9,330
|
|
53,022
|
|
56,710
|
|
|||||||
|
Segment income attributable to non-controlling interests
|
—
|
|
(4,725
|
)
|
(1,590
|
)
|
(6,315
|
)
|
|||||||
|
Segment income (loss)
|
$
|
(5,642
|
)
|
$
|
4,605
|
|
$
|
51,432
|
|
$
|
50,395
|
|
|||
|
Property and Casualty Reinsurance - Underwriting Ratios:
|
|||||||||||||||
|
Loss ratio (1)
|
65.5
|
%
|
|||||||||||||
|
Acquisition cost ratio (2)
|
31.5
|
%
|
|||||||||||||
|
Composite ratio (3)
|
97.0
|
%
|
|||||||||||||
|
General and administrative expense ratio (4)
|
5.2
|
%
|
|||||||||||||
|
Combined ratio (5)
|
102.2
|
%
|
|||||||||||||
|
(1)
|
Loss ratio is calculated by dividing loss and loss adjustment expenses incurred, net by net premiums earned.
|
|
(2)
|
Acquisition cost ratio is calculated by dividing acquisition costs, net by net premiums earned.
|
|
(3)
|
Composite ratio is calculated by dividing the sum of loss and loss adjustment expenses incurred, net and acquisition costs, net by net premiums earned.
|
|
(4)
|
General and administrative expense ratio is calculated by dividing general and administrative expenses related to underwriting activities by net premiums earned.
|
|
(5)
|
Combined ratio is calculated by dividing the sum of loss and loss adjustment expenses incurred, net, acquisition costs, net and general and administrative expenses related to underwriting activities by net premiums earned.
|
F-43
|
Year Ended December 31, 2013
|
|||||||||||||||
|
Property and Casualty Reinsurance (6)
|
Catastrophe Risk Management
|
Corporate
|
Total
|
||||||||||||
|
Revenues
|
($ in thousands)
|
||||||||||||||
|
Gross premiums written
|
$
|
393,588
|
|
$
|
8,349
|
|
$
|
—
|
|
$
|
401,937
|
|
|||
|
Gross premiums ceded
|
(9,975
|
)
|
—
|
|
—
|
|
(9,975
|
)
|
|||||||
|
Net premiums written
|
383,613
|
|
8,349
|
|
—
|
|
391,962
|
|
|||||||
|
Change in net unearned premium reserves
|
(171,006
|
)
|
(289
|
)
|
—
|
|
(171,295
|
)
|
|||||||
|
Net premiums earned
|
212,607
|
|
8,060
|
|
—
|
|
220,667
|
|
|||||||
|
Expenses
|
|||||||||||||||
|
Loss and loss adjustment expenses incurred, net
|
139,616
|
|
196
|
|
—
|
|
139,812
|
|
|||||||
|
Acquisition costs, net
|
66,981
|
|
963
|
|
—
|
|
67,944
|
|
|||||||
|
General and administrative expenses
|
21,838
|
|
3,852
|
|
7,346
|
|
33,036
|
|
|||||||
|
Total expenses
|
228,435
|
|
5,011
|
|
7,346
|
|
240,792
|
|
|||||||
|
Net underwriting loss
|
(15,828
|
)
|
n/a
|
|
n/a
|
|
n/a
|
|
|||||||
|
Net investment income
|
26,953
|
|
4,421
|
|
226,751
|
|
258,125
|
|
|||||||
|
Other expenses
|
(4,922
|
)
|
—
|
|
—
|
|
(4,922
|
)
|
|||||||
|
Segment income including non-controlling interests
|
6,203
|
|
7,470
|
|
219,405
|
|
233,078
|
|
|||||||
|
Segment income attributable to non-controlling interests
|
—
|
|
(4,046
|
)
|
(1,721
|
)
|
(5,767
|
)
|
|||||||
|
Segment income
|
$
|
6,203
|
|
$
|
3,424
|
|
$
|
217,684
|
|
$
|
227,311
|
|
|||
|
Property and Casualty Reinsurance - Underwriting Ratios:
|
|||||||||||||||
|
Loss ratio (1)
|
65.7
|
%
|
|||||||||||||
|
Acquisition cost ratio (2)
|
31.5
|
%
|
|||||||||||||
|
Composite ratio (3)
|
97.2
|
%
|
|||||||||||||
|
General and administrative expense ratio (4)
|
10.3
|
%
|
|||||||||||||
|
Combined ratio (5)
|
107.5
|
%
|
|||||||||||||
|
(1)
|
Loss ratio is calculated by dividing loss and loss adjustment expenses incurred, net by net premiums earned.
|
|
(2)
|
Acquisition cost ratio is calculated by dividing acquisition costs, net by net premiums earned.
|
|
(3)
|
Composite ratio is calculated by dividing the sum of loss and loss adjustment expenses incurred, net and acquisition costs, net by net premiums earned.
|
|
(4)
|
General and administrative expense ratio is calculated by dividing general and administrative expenses related to underwriting activities by net premiums earned.
|
|
(5)
|
Combined ratio is calculated by dividing the sum of loss and loss adjustment expenses incurred, net, acquisition costs, net and general and administrative expenses related to underwriting activities by net premiums earned.
|
|
(6)
|
Effective January 1, 2014, the Company modified the presentation of its operating segments to allocate net investment income from float to the Property and Casualty Reinsurance segment. Prior period segment results have been adjusted to conform to this presentation.
|
F-44
|
Year Ended December 31, 2012
|
|||||||||||||||
|
Property and Casualty Reinsurance (6)
|
Catastrophe Risk Management
|
Corporate
|
Total
|
||||||||||||
|
Revenues
|
($ in thousands)
|
||||||||||||||
|
Gross premiums written
|
$
|
190,374
|
|
$
|
—
|
|
$
|
—
|
|
$
|
190,374
|
|
|||
|
Gross premiums ceded
|
—
|
|
—
|
|
—
|
|
—
|
|
|||||||
|
Net premiums written
|
190,374
|
|
—
|
|
—
|
|
190,374
|
|
|||||||
|
Change in net unearned premium reserves
|
(93,893
|
)
|
—
|
|
—
|
|
(93,893
|
)
|
|||||||
|
Net premiums earned
|
96,481
|
|
—
|
|
—
|
|
96,481
|
|
|||||||
|
Expenses
|
|||||||||||||||
|
Loss and loss adjustment expenses incurred, net
|
80,306
|
|
—
|
|
—
|
|
80,306
|
|
|||||||
|
Acquisition costs, net
|
24,604
|
|
—
|
|
—
|
|
24,604
|
|
|||||||
|
General and administrative expenses
|
20,290
|
|
1,534
|
|
5,552
|
|
27,376
|
|
|||||||
|
Total expenses
|
125,200
|
|
1,534
|
|
5,552
|
|
132,286
|
|
|||||||
|
Net underwriting loss
|
(28,719
|
)
|
n/a
|
|
n/a
|
|
n/a
|
|
|||||||
|
Net investment income
|
4,901
|
|
—
|
|
131,967
|
|
136,868
|
|
|||||||
|
Other expenses
|
(446
|
)
|
—
|
|
—
|
|
(446
|
)
|
|||||||
|
Segment income (loss) including non-controlling interests
|
(24,264
|
)
|
(1,534
|
)
|
126,415
|
|
100,617
|
|
|||||||
|
Segment income attributable to non-controlling interests
|
—
|
|
—
|
|
(1,216
|
)
|
(1,216
|
)
|
|||||||
|
Segment income (loss)
|
$
|
(24,264
|
)
|
$
|
(1,534
|
)
|
$
|
125,199
|
|
$
|
99,401
|
|
|||
|
Property and Casualty Reinsurance - Underwriting Ratios:
|
|||||||||||||||
|
Loss ratio (1)
|
83.2
|
%
|
|||||||||||||
|
Acquisition cost ratio (2)
|
25.5
|
%
|
|||||||||||||
|
Composite ratio (3)
|
108.7
|
%
|
|||||||||||||
|
General and administrative expense ratio (4)
|
21.0
|
%
|
|||||||||||||
|
Combined ratio (5)
|
129.7
|
%
|
|||||||||||||
|
(1)
|
Loss ratio is calculated by dividing loss and loss adjustment expenses incurred, net by net premiums earned.
|
|
(2)
|
Acquisition cost ratio is calculated by dividing acquisition costs, net by net premiums earned.
|
|
(3)
|
Composite ratio is calculated by dividing the sum of loss and loss adjustment expenses incurred, net and acquisition costs, net by net premiums earned.
|
|
(4)
|
General and administrative expense ratio is calculated by dividing general and administrative expenses related to underwriting activities by net premiums earned.
|
|
(5)
|
Combined ratio is calculated by dividing the sum of loss and loss adjustment expenses incurred, net, acquisition costs, net and general and administrative expenses related to underwriting activities by net premiums earned.
|
|
(6)
|
Effective January 1, 2014, the Company modified the presentation of its operating segments to allocate net investment income from float to the Property and Casualty Reinsurance segment. Prior period segment results have been adjusted to conform to this presentation.
|
F-45
The following table lists the number of contracts that individually contributed more than 10% of total gross premiums written for the years ended
December 31, 2014
,
2013
and
2012
as a percentage of total gross premiums written in the relevant period:
|
2014
|
2013
|
2012
|
||||||
|
Contract 1
|
20.4
|
%
|
14.9
|
%
|
22.3
|
%
|
||
|
Contract 2
|
17.1
|
%
|
11.2
|
%
|
22.0
|
%
|
||
|
Contract 3
|
—
|
%
|
10.5
|
%
|
11.8
|
%
|
||
|
Total for contracts contributing greater than 10% each
|
37.5
|
%
|
36.6
|
%
|
56.1
|
%
|
||
|
Total for contracts contributing less than 10% each
|
62.5
|
%
|
63.4
|
%
|
43.9
|
%
|
||
|
100.0
|
%
|
100.0
|
%
|
100.0
|
%
|
|||
The following table provides a breakdown of the Company’s gross premiums written by line of business for the
years ended
December 31, 2014
,
2013
and
2012
:
|
2014
|
2013
|
2012
|
||||||||||||||||||
|
($ in thousands)
|
||||||||||||||||||||
|
Property
|
$
|
106,834
|
|
17.4
|
%
|
$
|
67,612
|
|
16.8
|
%
|
$
|
103,174
|
|
54.2
|
%
|
|||||
|
Casualty
|
266,763
|
|
43.5
|
%
|
210,017
|
|
52.2
|
%
|
44,700
|
|
23.5
|
%
|
||||||||
|
Specialty
|
227,708
|
|
37.1
|
%
|
115,959
|
|
28.9
|
%
|
42,500
|
|
22.3
|
%
|
||||||||
|
Total property and casualty reinsurance
|
601,305
|
|
98.0
|
%
|
393,588
|
|
97.9
|
%
|
190,374
|
|
100.0
|
%
|
||||||||
|
Catastrophe risk management
|
11,995
|
|
2.0
|
%
|
8,349
|
|
2.1
|
%
|
—
|
|
—
|
%
|
||||||||
|
$
|
613,300
|
|
100.0
|
%
|
$
|
401,937
|
|
100.0
|
%
|
$
|
190,374
|
|
100.0
|
%
|
||||||
The following table provides a breakdown of the Company’s gross premiums written by prospective and retroactive reinsurance contracts for the years ended
December 31, 2014
,
2013
and
2012
:
|
2014
|
2013
|
2012
|
||||||||||||||||||
|
($ in thousands)
|
||||||||||||||||||||
|
Prospective
|
$
|
530,169
|
|
86.4
|
%
|
$
|
362,151
|
|
90.1
|
%
|
$
|
190,374
|
|
100.0
|
%
|
|||||
|
Retroactive (1)
|
83,131
|
|
13.6
|
%
|
39,786
|
|
9.9
|
%
|
—
|
|
—
|
%
|
||||||||
|
$
|
613,300
|
|
100.0
|
%
|
$
|
401,937
|
|
100.0
|
%
|
$
|
190,374
|
|
100.0
|
%
|
||||||
|
(1)
|
Includes all retroactive exposure in reinsurance contracts.
|
The Company records the gross premium written and earned at the inception of the contract for retroactive reinsurance contracts.
Substantially all of the Company’s business is sourced through reinsurance brokers. The following table provides a breakdown of the Company’s gross premiums written from brokers for the years ended
December 31, 2014
,
2013
F-46
and
2012
:
|
2014
|
2013
|
2012
|
||||||||||||||||||
|
($ in thousands)
|
||||||||||||||||||||
|
JLT Re
|
$
|
199,563
|
|
32.5
|
%
|
$
|
—
|
|
—
|
%
|
$
|
—
|
|
—
|
%
|
|||||
|
Guy Carpenter & Company, LLC
|
110,063
|
|
17.9
|
%
|
89,125
|
|
22.2
|
%
|
65,073
|
|
34.2
|
%
|
||||||||
|
Aon Benfield - a division of Aon plc
|
80,535
|
|
13.1
|
%
|
111,865
|
|
27.8
|
%
|
22,000
|
|
11.6
|
%
|
||||||||
|
Willis Re
|
61,777
|
|
10.1
|
%
|
22,871
|
|
5.7
|
%
|
—
|
|
—
|
%
|
||||||||
|
Advocate Reinsurance Partners, LLC
|
58,616
|
|
9.6
|
%
|
57,994
|
|
14.4
|
%
|
22,473
|
|
11.8
|
%
|
||||||||
|
Other brokers
|
57,403
|
|
9.4
|
%
|
63,470
|
|
15.8
|
%
|
38,328
|
|
20.2
|
%
|
||||||||
|
Total broker placed
|
567,957
|
|
92.6
|
%
|
345,325
|
|
85.9
|
%
|
147,874
|
|
77.8
|
%
|
||||||||
|
Other
|
45,343
|
|
7.4
|
%
|
56,612
|
|
14.1
|
%
|
42,500
|
|
22.2
|
%
|
||||||||
|
$
|
613,300
|
|
100.0
|
%
|
$
|
401,937
|
|
100.0
|
%
|
$
|
190,374
|
|
100.0
|
%
|
||||||
The following table provides a breakdown of the Company’s gross premiums written by domicile of the ceding companies for the years ended
December 31, 2014
,
2013
and
2012
:
|
2014
|
2013
|
2012
|
||||||||||||||||||
|
($ in thousands)
|
||||||||||||||||||||
|
United States
|
$
|
339,061
|
|
55.3
|
%
|
$
|
304,141
|
|
75.7
|
%
|
$
|
190,374
|
|
100.0
|
%
|
|||||
|
United Kingdom
|
176,522
|
|
28.8
|
%
|
—
|
|
—
|
%
|
—
|
|
—
|
%
|
||||||||
|
Bermuda
|
97,717
|
|
15.9
|
%
|
96,396
|
|
24.0
|
%
|
—
|
|
—
|
%
|
||||||||
|
Other
|
—
|
|
—
|
%
|
1,400
|
|
0.3
|
%
|
—
|
|
—
|
%
|
||||||||
|
$
|
613,300
|
|
100.0
|
%
|
$
|
401,937
|
|
100.0
|
%
|
$
|
190,374
|
|
100.0
|
%
|
||||||
23. Statutory requirements
The following is a summary of actual and required statutory capital and surplus and statutory net income of Third Point Re as of
December 31, 2014
and
2013
:
|
December 31, 2014
|
December 31, 2013
|
|||||||
|
($ in thousands)
|
||||||||
|
Actual statutory capital
|
$
|
1,296,067
|
|
$
|
1,303,487
|
|
||
|
Required statutory capital and surplus
|
622,624
|
|
526,933
|
|
||||
For the years ended
December 31, 2014
,
2013
and
2012
, statutory net income was
$56.7 million
,
$230.0 million
and
$101.3 million
, respectively.
Under the Bermuda Insurance Act, 1978 and related regulations, Third Point Re is subject to capital requirements calculated using the Bermuda Solvency and Capital Requirement, or BSCR model, which is a standardized statutory risk-based capital model used to measure the risk associated with Third Point Re’s assets, liabilities and premiums. Third Point Re’s required statutory capital and surplus under the BSCR model is referred to as the enhanced capital requirement, or ECR. Third Point Re is required to calculate and submit the ECR to the Bermuda Monetary Authority, or the BMA, annually. Following receipt of the submission of Third Point Re’s ECR the BMA has the authority to impose additional capital requirements (capital add-ons) if it deems necessary. If a company fails to maintain or meet its ECR, the BMA may take various degrees of regulatory action. As of December 31, 2014 and 2013, Third Point Re met its ECR.
The principal difference between statutory capital and surplus and shareholder’s equity presented in accordance with GAAP is deferred acquisition costs and prepaid expenses, which are non-admitted assets for statutory purposes.
F-47
Third Point Re is also required under its Class 4 license to maintain a minimum liquidity ratio whereby the value of its relevant assets is not less than
75%
of the amount of its relevant liabilities for general business. As of December 31, 2014 and 2013, Third Point Re met the minimum liquidity ratio requirement.
Third Point Re may declare dividends subject to it continuing to meet its solvency and capital requirements, which includes continuing to hold statutory capital and surplus equal to or exceeding its ECR. Third Point Re is prohibited from declaring or paying in any fiscal year dividends of more than
25%
of its prior year’s statutory capital and surplus unless Third Point Re files with the BMA a signed affidavit by at least
two
members of the Board of Directors attesting that a dividend would not cause the company to fail to meet its relevant margins. As of December 31, 2014, Third Point Re could pay dividends in 2015 of approximately
$324.0
million (2013 -
$325.9 million
) without providing an affidavit to the BMA. On February 26, 2015, Third Point Re declared a dividend of
$158.0 million
to Third Point Reinsurance Ltd.
24. Subsequent events
On January 5, 2015, the shareholders agreement between Third Point Re, Hiscox, and the Catastrophe Fund Manager was terminated by agreement of the parties that the Catastrophe Fund Manager would repurchase for cancellation Hiscox’s common shares, representing
15%
, of the Catastrophe Fund Manager.
On February 13, 2015, TPRUSA issued
$115.0 million
of senior unsecured notes (the “Notes”) due February 13, 2025. The Notes bear interest at
7.00%
and interest is payable semi-annually on February 13 and August 13 of each year, beginning August 13, 2015. The Notes are fully and unconditionally guaranteed by Third Point Reinsurance Ltd., and, in certain circumstances specified in the indenture governing the Notes, certain existing or future subsidiaries of the Company may be required to guarantee the Notes, as described in the indenture governing the Notes.
On February 26, 2015, Third Point Re declared a dividend of
$158.0 million
to Third Point Reinsurance Ltd. This dividend was ultimately used to capitalize Third Point Re USA. In February 2015, the Company completed the capitalization of Third Point Re USA with a total of
$265.0 million
.
On February 26, 2015, we entered into a letter of credit facility with Lloyds Bank for
$150.0 million
.
25. Supplemental Guarantor Information
The following tables present historical, supplemental guarantor financial information as if new debt was issued by a subsidiary of Third Point Reinsurance Ltd. with Third Point Reinsurance Ltd. serving as a parent guarantor. The subsidiary presented as the issuer of debt is TPRUSA, a wholly-owned subsidiary, incorporated on November 21, 2014.
The following information sets forth the Company’s condensed consolidating balance sheets as of December 31, 2014 and 2013 and the condensed consolidating statements of income and cash flows for the years ended December 31, 2014, 2013 and 2012. Investments in subsidiaries are accounted for on the equity method; accordingly, entries necessary to consolidate the parent guarantor, issuer of debt and all other subsidiaries are reflected in the eliminations column.
F-48
|
THIRD POINT REINSURANCE LTD.
|
|||||||||||||||||||
|
CONDENSED CONSOLIDATING BALANCE SHEET
|
|||||||||||||||||||
|
As of December 31, 2014
|
|||||||||||||||||||
|
(expressed in thousands of U.S. dollars)
|
|||||||||||||||||||
|
Parent
Guarantor |
Issuer of Debt
|
Non-Guarantor Subsidiaries
|
Eliminations
|
Consolidated
|
|||||||||||||||
|
Assets
|
|||||||||||||||||||
|
Equity securities
|
$
|
—
|
|
$
|
—
|
|
$
|
1,177,796
|
|
$
|
—
|
|
$
|
1,177,796
|
|
||||
|
Debt securities
|
—
|
|
—
|
|
569,648
|
|
—
|
|
569,648
|
|
|||||||||
|
Other investments
|
—
|
|
—
|
|
83,394
|
|
—
|
|
83,394
|
|
|||||||||
|
Total investments in securities and commodities
|
—
|
|
—
|
|
1,830,838
|
|
—
|
|
1,830,838
|
|
|||||||||
|
Cash and cash equivalents
|
140
|
|
—
|
|
28,594
|
|
—
|
|
28,734
|
|
|||||||||
|
Restricted cash and cash equivalents
|
—
|
|
—
|
|
417,307
|
|
—
|
|
417,307
|
|
|||||||||
|
Investment in subsidiaries
|
1,451,060
|
|
—
|
|
|
(1,451,060
|
)
|
—
|
|
||||||||||
|
Due from brokers
|
—
|
|
—
|
|
58,241
|
|
—
|
|
58,241
|
|
|||||||||
|
Securities purchased under an agreement to sell
|
—
|
|
—
|
|
29,852
|
|
—
|
|
29,852
|
|
|||||||||
|
Derivative assets, at fair value
|
—
|
|
—
|
|
21,130
|
|
—
|
|
21,130
|
|
|||||||||
|
Interest and dividends receivable
|
—
|
|
—
|
|
2,602
|
|
—
|
|
2,602
|
|
|||||||||
|
Reinsurance balances receivable
|
—
|
|
—
|
|
303,649
|
|
—
|
|
303,649
|
|
|||||||||
|
Deferred acquisition costs, net
|
—
|
|
—
|
|
155,901
|
|
—
|
|
155,901
|
|
|||||||||
|
Loss and loss adjustment expenses recoverable
|
—
|
|
—
|
|
814
|
|
—
|
|
814
|
|
|||||||||
|
Other assets
|
600
|
|
666
|
|
2,246
|
|
—
|
|
3,512
|
|
|||||||||
|
Amounts due from affiliates
|
1,339
|
|
(403
|
)
|
(936
|
)
|
—
|
|
—
|
|
|||||||||
|
Total assets
|
$
|
1,453,139
|
|
$
|
263
|
|
$
|
2,850,238
|
|
$
|
(1,451,060
|
)
|
$
|
2,852,580
|
|
||||
|
Liabilities and shareholders’ equity
|
|||||||||||||||||||
|
Liabilities
|
|||||||||||||||||||
|
Accounts payable and accrued expenses
|
$
|
1,226
|
|
$
|
518
|
|
$
|
8,341
|
|
$
|
—
|
|
$
|
10,085
|
|
||||
|
Reinsurance balances payable
|
—
|
|
—
|
|
27,040
|
|
—
|
|
27,040
|
|
|||||||||
|
Deposit liabilities
|
—
|
|
—
|
|
145,430
|
|
—
|
|
145,430
|
|
|||||||||
|
Unearned premium reserves
|
—
|
|
—
|
|
433,809
|
|
—
|
|
433,809
|
|
|||||||||
|
Loss and loss adjustment expense reserves
|
—
|
|
—
|
|
277,362
|
|
—
|
|
277,362
|
|
|||||||||
|
Securities sold, not yet purchased, at fair value
|
—
|
|
—
|
|
82,485
|
|
—
|
|
82,485
|
|
|||||||||
|
Due to brokers
|
—
|
|
—
|
|
312,609
|
|
—
|
|
312,609
|
|
|||||||||
|
Derivative liabilities, at fair value
|
—
|
|
—
|
|
11,015
|
|
—
|
|
11,015
|
|
|||||||||
|
Interest and dividends payable
|
—
|
|
—
|
|
697
|
|
—
|
|
697
|
|
|||||||||
|
Total liabilities
|
1,226
|
|
518
|
|
1,298,788
|
|
—
|
|
1,300,532
|
|
|||||||||
|
Shareholders' equity
|
|||||||||||||||||||
|
Common shares
|
10,447
|
|
—
|
|
1,251
|
|
(1,251
|
)
|
10,447
|
|
|||||||||
|
Additional paid-in capital
|
1,065,489
|
|
—
|
|
1,072,671
|
|
(1,072,671
|
)
|
1,065,489
|
|
|||||||||
|
Retained earnings
|
375,977
|
|
(255
|
)
|
377,393
|
|
(377,138
|
)
|
375,977
|
|
|||||||||
|
Shareholders’ equity attributable to shareholders
|
1,451,913
|
|
(255
|
)
|
1,451,315
|
|
(1,451,060
|
)
|
1,451,913
|
|
|||||||||
|
Non-controlling interests
|
—
|
|
—
|
|
100,135
|
|
—
|
|
100,135
|
|
|||||||||
|
Total shareholders’ equity
|
1,451,913
|
|
(255
|
)
|
1,551,450
|
|
(1,451,060
|
)
|
1,552,048
|
|
|||||||||
|
Total liabilities and shareholders’ equity
|
$
|
1,453,139
|
|
$
|
263
|
|
$
|
2,850,238
|
|
$
|
(1,451,060
|
)
|
$
|
2,852,580
|
|
||||
F-49
|
THIRD POINT REINSURANCE LTD.
|
|||||||||||||||||||
|
CONDENSED CONSOLIDATING BALANCE SHEET
|
|||||||||||||||||||
|
As of December 31, 2013
|
|||||||||||||||||||
|
(expressed in thousands of U.S. dollars)
|
|||||||||||||||||||
|
Parent
Guarantor |
Issuer of Debt
|
Non-Guarantor Subsidiaries
|
Eliminations
|
Consolidated
|
|||||||||||||||
|
Assets
|
|||||||||||||||||||
|
Equity securities
|
$
|
—
|
|
$
|
—
|
|
$
|
954,111
|
|
$
|
—
|
|
$
|
954,111
|
|
||||
|
Debt securities
|
—
|
|
—
|
|
441,424
|
|
—
|
|
441,424
|
|
|||||||||
|
Other investments
|
—
|
|
—
|
|
65,329
|
|
—
|
|
65,329
|
|
|||||||||
|
Total investments in securities and commodities
|
—
|
|
—
|
|
1,460,864
|
|
—
|
|
1,460,864
|
|
|||||||||
|
Cash and cash equivalents
|
294
|
|
—
|
|
31,331
|
|
—
|
|
31,625
|
|
|||||||||
|
Restricted cash and cash equivalents
|
—
|
|
—
|
|
193,577
|
|
—
|
|
193,577
|
|
|||||||||
|
Investment in subsidiaries
|
1,394,644
|
|
—
|
|
—
|
|
(1,394,644
|
)
|
—
|
|
|||||||||
|
Due from brokers
|
—
|
|
—
|
|
98,386
|
|
—
|
|
98,386
|
|
|||||||||
|
Securities purchased under an agreement to sell
|
—
|
|
—
|
|
38,147
|
|
—
|
|
38,147
|
|
|||||||||
|
Derivative assets, at fair value
|
—
|
|
—
|
|
39,045
|
|
—
|
|
39,045
|
|
|||||||||
|
Interest and dividends receivable
|
—
|
|
—
|
|
2,615
|
|
—
|
|
2,615
|
|
|||||||||
|
Reinsurance balances receivable
|
—
|
|
—
|
|
191,763
|
|
—
|
|
191,763
|
|
|||||||||
|
Deferred acquisition costs, net
|
—
|
|
—
|
|
91,193
|
|
—
|
|
91,193
|
|
|||||||||
|
Loss and loss adjustment expenses recoverable
|
—
|
|
—
|
|
9,277
|
|
—
|
|
9,277
|
|
|||||||||
|
Other assets
|
720
|
|
—
|
|
2,678
|
|
—
|
|
3,398
|
|
|||||||||
|
Amounts due from affiliates
|
417
|
|
—
|
|
(417
|
)
|
—
|
|
—
|
|
|||||||||
|
Total assets
|
$
|
1,396,075
|
|
$
|
—
|
|
$
|
2,158,459
|
|
$
|
(1,394,644
|
)
|
$
|
2,159,890
|
|
||||
|
Liabilities and shareholders’ equity
|
|||||||||||||||||||
|
Liabilities
|
|||||||||||||||||||
|
Accounts payable and accrued expenses
|
$
|
242
|
|
$
|
—
|
|
$
|
9,214
|
|
$
|
—
|
|
$
|
9,456
|
|
||||
|
Reinsurance balances payable
|
—
|
|
—
|
|
9,081
|
|
—
|
|
9,081
|
|
|||||||||
|
Deposit liabilities
|
—
|
|
—
|
|
120,946
|
|
—
|
|
120,946
|
|
|||||||||
|
Unearned premium reserves
|
—
|
|
—
|
|
265,187
|
|
—
|
|
265,187
|
|
|||||||||
|
Loss and loss adjustment expense reserves
|
—
|
|
—
|
|
134,331
|
|
—
|
|
134,331
|
|
|||||||||
|
Securities sold, not yet purchased, at fair value
|
—
|
|
—
|
|
56,056
|
|
—
|
|
56,056
|
|
|||||||||
|
Due to brokers
|
—
|
|
—
|
|
44,870
|
|
—
|
|
44,870
|
|
|||||||||
|
Derivative liabilities, at fair value
|
—
|
|
—
|
|
8,819
|
|
—
|
|
8,819
|
|
|||||||||
|
Interest and dividends payable
|
—
|
|
—
|
|
748
|
|
—
|
|
748
|
|
|||||||||
|
Amounts due to affiliates
|
4,172
|
|
—
|
|
(4,172
|
)
|
—
|
|
—
|
|
|||||||||
|
Total liabilities
|
4,414
|
|
—
|
|
645,080
|
|
—
|
|
649,494
|
|
|||||||||
|
Shareholders’ equity
|
|||||||||||||||||||
|
Common shares
|
10,389
|
|
—
|
|
1,251
|
|
(1,251
|
)
|
10,389
|
|
|||||||||
|
Additional paid-in capital
|
1,055,690
|
|
—
|
|
1,064,493
|
|
(1,064,493
|
)
|
1,055,690
|
|
|||||||||
|
Retained earnings
|
325,582
|
|
—
|
|
328,900
|
|
(328,900
|
)
|
325,582
|
|
|||||||||
|
Shareholders’ equity attributable to shareholders
|
1,391,661
|
|
—
|
|
1,394,644
|
|
(1,394,644
|
)
|
1,391,661
|
|
|||||||||
|
Non-controlling interests
|
—
|
|
—
|
|
118,735
|
|
—
|
|
118,735
|
|
|||||||||
|
Total shareholders’ equity
|
1,391,661
|
|
—
|
|
1,513,379
|
|
(1,394,644
|
)
|
1,510,396
|
|
|||||||||
|
Total liabilities and shareholders’ equity
|
$
|
1,396,075
|
|
$
|
—
|
|
$
|
2,158,459
|
|
$
|
(1,394,644
|
)
|
$
|
2,159,890
|
|
||||
F-50
|
THIRD POINT REINSURANCE LTD.
|
|||||||||||||||||||
|
CONDENSED CONSOLIDATING STATEMENT OF INCOME
|
|||||||||||||||||||
|
For the year ended December 31, 2014
|
|||||||||||||||||||
|
(expressed in thousands of U.S. dollars)
|
|||||||||||||||||||
|
Parent
Guarantor |
Issuer of Debt
|
Non-Guarantor Subsidiaries
|
Eliminations
|
Consolidated
|
|||||||||||||||
|
Revenues
|
|||||||||||||||||||
|
Gross premiums written
|
$
|
—
|
|
$
|
—
|
|
$
|
613,300
|
|
$
|
—
|
|
$
|
613,300
|
|
||||
|
Gross premiums ceded
|
—
|
|
—
|
|
(150
|
)
|
—
|
|
(150
|
)
|
|||||||||
|
Net premiums written
|
—
|
|
—
|
|
613,150
|
|
—
|
|
613,150
|
|
|||||||||
|
Change in net unearned premium reserves
|
—
|
|
—
|
|
(168,618
|
)
|
—
|
|
(168,618
|
)
|
|||||||||
|
Net premiums earned
|
—
|
|
—
|
|
444,532
|
|
—
|
|
444,532
|
|
|||||||||
|
Net investment income
|
—
|
|
—
|
|
85,582
|
|
—
|
|
85,582
|
|
|||||||||
|
Equity in earnings of subsidiaries
|
56,238
|
|
—
|
|
—
|
|
(56,238
|
)
|
—
|
|
|||||||||
|
Total revenues
|
56,238
|
|
—
|
|
530,114
|
|
(56,238
|
)
|
530,114
|
|
|||||||||
|
Expenses
|
|||||||||||||||||||
|
Loss and loss adjustment expenses incurred, net
|
—
|
|
—
|
|
283,147
|
|
—
|
|
283,147
|
|
|||||||||
|
Acquisition costs, net
|
—
|
|
—
|
|
137,206
|
|
—
|
|
137,206
|
|
|||||||||
|
General and administrative expenses
|
5,843
|
|
255
|
|
33,910
|
|
—
|
|
40,008
|
|
|||||||||
|
Other expenses
|
—
|
|
—
|
|
7,395
|
|
—
|
|
7,395
|
|
|||||||||
|
Total expenses
|
5,843
|
|
255
|
|
461,658
|
|
—
|
|
467,756
|
|
|||||||||
|
Income before income tax expense
|
50,395
|
|
(255
|
)
|
68,456
|
|
(56,238
|
)
|
62,358
|
|
|||||||||
|
Income tax expense
|
—
|
|
—
|
|
(5,648
|
)
|
—
|
|
(5,648
|
)
|
|||||||||
|
Income including non-controlling interests
|
50,395
|
|
(255
|
)
|
62,808
|
|
(56,238
|
)
|
56,710
|
|
|||||||||
|
Income attributable to non-controlling interests
|
—
|
|
—
|
|
(6,315
|
)
|
—
|
|
(6,315
|
)
|
|||||||||
|
Net income (loss)
|
$
|
50,395
|
|
$
|
(255
|
)
|
$
|
56,493
|
|
$
|
(56,238
|
)
|
$
|
50,395
|
|
||||
|
THIRD POINT REINSURANCE LTD.
|
|||||||||||||||||||
|
CONDENSED CONSOLIDATING STATEMENT OF INCOME
|
|||||||||||||||||||
|
For the year ended December 31, 2013
|
|||||||||||||||||||
|
(expressed in thousands of U.S. dollars)
|
|||||||||||||||||||
|
Parent
Guarantor |
Issuer of Debt
|
Non-Guarantor Subsidiaries
|
Eliminations
|
Consolidated
|
|||||||||||||||
|
Revenues
|
|||||||||||||||||||
|
Gross premiums written
|
$
|
—
|
|
$
|
—
|
|
$
|
401,937
|
|
$
|
—
|
|
$
|
401,937
|
|
||||
|
Gross premiums ceded
|
—
|
|
—
|
|
(9,975
|
)
|
—
|
|
(9,975
|
)
|
|||||||||
|
Net premiums written
|
—
|
|
—
|
|
391,962
|
|
—
|
|
391,962
|
|
|||||||||
|
Change in net unearned premium reserves
|
—
|
|
—
|
|
(171,295
|
)
|
—
|
|
(171,295
|
)
|
|||||||||
|
Net premiums earned
|
—
|
|
—
|
|
220,667
|
|
—
|
|
220,667
|
|
|||||||||
|
Net investment income
|
—
|
|
—
|
|
258,125
|
|
—
|
|
258,125
|
|
|||||||||
|
Equity in earnings of subsidiaries
|
228,646
|
|
—
|
|
—
|
|
(228,646
|
)
|
—
|
|
|||||||||
|
Total revenues
|
228,646
|
|
—
|
|
478,792
|
|
(228,646
|
)
|
478,792
|
|
|||||||||
|
Expenses
|
|||||||||||||||||||
|
Loss and loss adjustment expenses incurred, net
|
—
|
|
—
|
|
139,812
|
|
—
|
|
139,812
|
|
|||||||||
|
Acquisition costs, net
|
—
|
|
—
|
|
67,944
|
|
—
|
|
67,944
|
|
|||||||||
|
General and administrative expenses
|
1,335
|
|
—
|
|
31,701
|
|
—
|
|
33,036
|
|
|||||||||
|
Other expenses
|
—
|
|
—
|
|
4,922
|
|
—
|
|
4,922
|
|
|||||||||
|
Total expenses
|
1,335
|
|
—
|
|
244,379
|
|
—
|
|
245,714
|
|
|||||||||
|
Income including non-controlling interests
|
227,311
|
|
—
|
|
234,413
|
|
(228,646
|
)
|
233,078
|
|
|||||||||
|
Income attributable to non-controlling interests
|
—
|
|
—
|
|
(5,767
|
)
|
—
|
|
(5,767
|
)
|
|||||||||
|
Net income
|
$
|
227,311
|
|
$
|
—
|
|
$
|
228,646
|
|
$
|
(228,646
|
)
|
$
|
227,311
|
|
||||
F-51
|
THIRD POINT REINSURANCE LTD.
|
|||||||||||||||||||
|
CONDENSED CONSOLIDATING STATEMENT OF INCOME
|
|||||||||||||||||||
|
For the year ended December 31, 2012
|
|||||||||||||||||||
|
(expressed in thousands of U.S. dollars)
|
|||||||||||||||||||
|
Parent
Guarantor |
Issuer of Debt
|
Non-Guarantor Subsidiaries
|
Eliminations
|
Consolidated
|
|||||||||||||||
|
Revenues
|
|||||||||||||||||||
|
Gross premiums written
|
$
|
—
|
|
$
|
—
|
|
$
|
190,374
|
|
$
|
—
|
|
$
|
190,374
|
|
||||
|
Gross premiums ceded
|
—
|
|
—
|
|
—
|
|
—
|
|
—
|
|
|||||||||
|
Net premiums written
|
—
|
|
—
|
|
190,374
|
|
—
|
|
190,374
|
|
|||||||||
|
Change in net unearned premium reserves
|
—
|
|
—
|
|
(93,893
|
)
|
—
|
|
(93,893
|
)
|
|||||||||
|
Net premiums earned
|
—
|
|
—
|
|
96,481
|
|
—
|
|
96,481
|
|
|||||||||
|
Net investment income
|
—
|
|
—
|
|
136,868
|
|
—
|
|
136,868
|
|
|||||||||
|
Equity in earnings of subsidiaries
|
101,346
|
|
—
|
|
—
|
|
(101,346
|
)
|
—
|
|
|||||||||
|
Total revenues
|
101,346
|
|
—
|
|
233,349
|
|
(101,346
|
)
|
233,349
|
|
|||||||||
|
Expenses
|
|||||||||||||||||||
|
Loss and loss adjustment expenses incurred, net
|
—
|
|
—
|
|
80,306
|
|
—
|
|
80,306
|
|
|||||||||
|
Acquisition costs, net
|
—
|
|
—
|
|
24,604
|
|
—
|
|
24,604
|
|
|||||||||
|
General and administrative expenses
|
1,945
|
|
—
|
|
25,431
|
|
—
|
|
27,376
|
|
|||||||||
|
Other expenses
|
—
|
|
—
|
|
446
|
|
—
|
|
446
|
|
|||||||||
|
Total expenses
|
1,945
|
|
—
|
|
130,787
|
|
—
|
|
132,732
|
|
|||||||||
|
Income including non-controlling interests
|
99,401
|
|
—
|
|
102,562
|
|
(101,346
|
)
|
100,617
|
|
|||||||||
|
Income attributable to non-controlling interests
|
—
|
|
—
|
|
(1,216
|
)
|
—
|
|
(1,216
|
)
|
|||||||||
|
Net income
|
$
|
99,401
|
|
$
|
—
|
|
$
|
101,346
|
|
$
|
(101,346
|
)
|
$
|
99,401
|
|
||||
F-52
|
THIRD POINT REINSURANCE LTD.
|
|||||||||||||||||||
|
CONDENSED CONSOLIDATING STATEMENT OF CASH FLOWS
|
|||||||||||||||||||
|
For the year ended December 31, 2014
|
|||||||||||||||||||
|
(expressed in thousands of U.S. dollars)
|
|||||||||||||||||||
|
Parent
Guarantor |
Issuer of Debt
|
Non-Guarantor Subsidiaries
|
Eliminations
|
Consolidated
|
|||||||||||||||
|
Operating activities
|
|||||||||||||||||||
|
Income including non-controlling interests
|
$
|
50,395
|
|
$
|
(255
|
)
|
$
|
62,808
|
|
$
|
(56,238
|
)
|
$
|
56,710
|
|
||||
|
Adjustments to reconcile income including non-controlling interests to net cash provided by operating activities
|
|||||||||||||||||||
|
Equity in earnings of subsidiaries
|
(56,238
|
)
|
—
|
|
—
|
|
56,238
|
|
—
|
|
|||||||||
|
Share compensation expense
|
1,080
|
|
—
|
|
8,178
|
|
—
|
|
9,258
|
|
|||||||||
|
Interest expense on deposit liabilities
|
—
|
|
—
|
|
4,346
|
|
—
|
|
4,346
|
|
|||||||||
|
Net unrealized gain on investments and derivatives
|
—
|
|
—
|
|
85,057
|
|
—
|
|
85,057
|
|
|||||||||
|
Net realized gain on investments and derivatives
|
—
|
|
—
|
|
(193,957
|
)
|
—
|
|
(193,957
|
)
|
|||||||||
|
Amortization of premium and accretion of discount, net
|
—
|
|
—
|
|
(1,044
|
)
|
—
|
|
(1,044
|
)
|
|||||||||
|
Changes in assets and liabilities:
|
|||||||||||||||||||
|
Reinsurance balances receivable
|
—
|
|
—
|
|
(111,886
|
)
|
—
|
|
(111,886
|
)
|
|||||||||
|
Deferred acquisition costs, net
|
—
|
|
—
|
|
(64,708
|
)
|
—
|
|
(64,708
|
)
|
|||||||||
|
Loss and loss adjustment expenses recoverable
|
—
|
|
—
|
|
8,463
|
|
—
|
|
8,463
|
|
|||||||||
|
Other assets
|
120
|
|
(666
|
)
|
432
|
|
—
|
|
(114
|
)
|
|||||||||
|
Interest and dividends receivable, net
|
—
|
|
—
|
|
(38
|
)
|
—
|
|
(38
|
)
|
|||||||||
|
Unearned premium reserves
|
—
|
|
—
|
|
168,622
|
|
—
|
|
168,622
|
|
|||||||||
|
Loss and loss adjustment expense reserves
|
—
|
|
—
|
|
143,031
|
|
—
|
|
143,031
|
|
|||||||||
|
Accounts payable and accrued expenses
|
984
|
|
518
|
|
(873
|
)
|
—
|
|
629
|
|
|||||||||
|
Reinsurance balances payable
|
—
|
|
—
|
|
18,061
|
|
—
|
|
18,061
|
|
|||||||||
|
Amounts due from affiliates
|
(922
|
)
|
403
|
|
519
|
|
—
|
|
—
|
|
|||||||||
|
Amounts due to affiliates
|
(4,172
|
)
|
—
|
|
4,172
|
|
—
|
|
—
|
|
|||||||||
|
Net cash provided by operating activities
|
(8,753
|
)
|
—
|
|
131,183
|
|
—
|
|
122,430
|
|
|||||||||
|
Investing activities
|
|||||||||||||||||||
|
Purchases of investments
|
—
|
|
—
|
|
(3,114,906
|
)
|
—
|
|
(3,114,906
|
)
|
|||||||||
|
Proceeds from sales of investments
|
—
|
|
—
|
|
2,857,404
|
|
—
|
|
2,857,404
|
|
|||||||||
|
Purchases of investments to cover short sales
|
—
|
|
—
|
|
(232,568
|
)
|
—
|
|
(232,568
|
)
|
|||||||||
|
Proceeds from short sales of investments
|
—
|
|
—
|
|
278,569
|
|
—
|
|
278,569
|
|
|||||||||
|
Change in due to/from brokers, net
|
—
|
|
—
|
|
307,884
|
|
—
|
|
307,884
|
|
|||||||||
|
Increase in securities purchased under agreement to sell
|
—
|
|
—
|
|
8,294
|
|
—
|
|
8,294
|
|
|||||||||
|
Change in restricted cash and cash equivalents
|
—
|
|
—
|
|
(223,730
|
)
|
—
|
|
(223,730
|
)
|
|||||||||
|
Net cash used in investing activities
|
—
|
|
—
|
|
(119,053
|
)
|
—
|
|
(119,053
|
)
|
|||||||||
|
Financing activities
|
|||||||||||||||||||
|
Proceeds from issuance of common shares, net of costs
|
599
|
|
—
|
|
—
|
|
—
|
|
599
|
|
|||||||||
|
Increase in deposit liabilities
|
—
|
|
—
|
|
18,048
|
|
—
|
|
18,048
|
|
|||||||||
|
Non-controlling interest in investment affiliate, net
|
—
|
|
—
|
|
(31,066
|
)
|
—
|
|
(31,066
|
)
|
|||||||||
|
Non-controlling interest in Catastrophe Fund
|
—
|
|
—
|
|
6,151
|
|
—
|
|
6,151
|
|
|||||||||
|
Dividend received by (paid to) parent
|
8,000
|
|
—
|
|
(8,000
|
)
|
—
|
|
—
|
|
|||||||||
|
Net cash provided by financing activities
|
8,599
|
|
—
|
|
(14,867
|
)
|
—
|
|
(6,268
|
)
|
|||||||||
|
Net (decrease) increase in cash and cash equivalents
|
(154
|
)
|
—
|
|
(2,737
|
)
|
—
|
|
(2,891
|
)
|
|||||||||
|
Cash and cash equivalents at beginning of period
|
294
|
|
—
|
|
31,331
|
|
—
|
|
31,625
|
|
|||||||||
|
Cash and cash equivalents at end of period
|
$
|
140
|
|
$
|
—
|
|
$
|
28,594
|
|
$
|
—
|
|
$
|
28,734
|
|
||||
F-53
|
THIRD POINT REINSURANCE LTD.
|
|||||||||||||||||||
|
CONDENSED CONSOLIDATING STATEMENT OF CASH FLOWS
|
|||||||||||||||||||
|
For the year ended December 31, 2013
|
|||||||||||||||||||
|
(expressed in thousands of U.S. dollars)
|
|||||||||||||||||||
|
Parent
Guarantor |
Issuer of Debt
|
Non-Guarantor Subsidiaries
|
Eliminations
|
Consolidated
|
|||||||||||||||
|
Operating activities
|
|||||||||||||||||||
|
Income including non-controlling interests
|
$
|
227,311
|
|
$
|
—
|
|
$
|
234,413
|
|
$
|
(228,646
|
)
|
$
|
233,078
|
|
||||
|
Adjustments to reconcile income including non-controlling interests to net cash provided by operating activities
|
|||||||||||||||||||
|
Equity in earnings of subsidiaries
|
(228,646
|
)
|
—
|
|
—
|
|
228,646
|
|
—
|
|
|||||||||
|
Share compensation expense
|
—
|
|
—
|
|
9,800
|
|
—
|
|
9,800
|
|
|||||||||
|
Interest expense on deposit liabilities
|
—
|
|
—
|
|
4,271
|
|
—
|
|
4,271
|
|
|||||||||
|
Net unrealized gain on investments and derivatives
|
—
|
|
—
|
|
(78,490
|
)
|
—
|
|
(78,490
|
)
|
|||||||||
|
Net realized gain on investments and derivatives
|
—
|
|
—
|
|
(236,333
|
)
|
—
|
|
(236,333
|
)
|
|||||||||
|
Amortization of premium and accretion of discount, net
|
—
|
|
—
|
|
(262
|
)
|
—
|
|
(262
|
)
|
|||||||||
|
Changes in assets and liabilities:
|
|||||||||||||||||||
|
Reinsurance balances receivable
|
—
|
|
—
|
|
(107,483
|
)
|
—
|
|
(107,483
|
)
|
|||||||||
|
Deferred acquisition costs, net
|
—
|
|
—
|
|
(45,810
|
)
|
—
|
|
(45,810
|
)
|
|||||||||
|
Loss and loss adjustment expenses recoverable
|
—
|
|
—
|
|
(9,277
|
)
|
—
|
|
(9,277
|
)
|
|||||||||
|
Other assets
|
(686
|
)
|
—
|
|
411
|
|
—
|
|
(275
|
)
|
|||||||||
|
Interest and dividends receivable, net
|
—
|
|
—
|
|
(1,034
|
)
|
—
|
|
(1,034
|
)
|
|||||||||
|
Unearned premium reserves
|
—
|
|
—
|
|
171,294
|
|
—
|
|
171,294
|
|
|||||||||
|
Loss and loss adjustment expense reserves
|
—
|
|
—
|
|
67,060
|
|
—
|
|
67,060
|
|
|||||||||
|
Accounts payable and accrued expenses
|
(65
|
)
|
—
|
|
4,154
|
|
—
|
|
4,089
|
|
|||||||||
|
Reinsurance balances payable
|
—
|
|
—
|
|
9,081
|
|
—
|
|
9,081
|
|
|||||||||
|
Amounts due from affiliates
|
353
|
|
—
|
|
(353
|
)
|
—
|
|
—
|
|
|||||||||
|
Amounts due to affiliates
|
2,020
|
|
—
|
|
(2,020
|
)
|
—
|
|
—
|
|
|||||||||
|
Net cash provided by operating activities
|
287
|
|
—
|
|
19,422
|
|
—
|
|
19,709
|
|
|||||||||
|
Investing activities
|
|||||||||||||||||||
|
Purchases of investments
|
—
|
|
—
|
|
(2,172,077
|
)
|
—
|
|
(2,172,077
|
)
|
|||||||||
|
Proceeds from sales of investments
|
—
|
|
—
|
|
1,943,655
|
|
—
|
|
1,943,655
|
|
|||||||||
|
Purchases of investments to cover short sales
|
—
|
|
—
|
|
(407,965
|
)
|
—
|
|
(407,965
|
)
|
|||||||||
|
Proceeds from short sales of investments
|
—
|
|
—
|
|
290,770
|
|
—
|
|
290,770
|
|
|||||||||
|
Change in due to/from brokers, net
|
—
|
|
—
|
|
12,162
|
|
—
|
|
12,162
|
|
|||||||||
|
Increase in securities purchased under agreement to sell
|
—
|
|
—
|
|
22,261
|
|
—
|
|
22,261
|
|
|||||||||
|
Change in restricted cash and cash equivalents
|
—
|
|
—
|
|
(115,950
|
)
|
—
|
|
(115,950
|
)
|
|||||||||
|
Contributed capital (to) from subsidiaries
|
(286,257
|
)
|
—
|
|
286,257
|
|
—
|
|
—
|
|
|||||||||
|
Net cash used in investing activities
|
(286,257
|
)
|
—
|
|
(140,887
|
)
|
—
|
|
(427,144
|
)
|
|||||||||
|
Financing activities
|
|||||||||||||||||||
|
Proceeds from issuance of common shares, net of costs
|
286,095
|
|
—
|
|
—
|
|
—
|
|
286,095
|
|
|||||||||
|
Increase in deposit liabilities
|
—
|
|
—
|
|
65,769
|
|
—
|
|
65,769
|
|
|||||||||
|
Non-controlling interest in investment affiliate, net
|
—
|
|
—
|
|
27,867
|
|
—
|
|
27,867
|
|
|||||||||
|
Non-controlling interest in Catastrophe Fund
|
—
|
|
—
|
|
25,324
|
|
—
|
|
25,324
|
|
|||||||||
|
Net cash provided by financing activities
|
286,095
|
|
—
|
|
118,960
|
|
—
|
|
405,055
|
|
|||||||||
|
Net (decrease) increase in cash and cash equivalents
|
125
|
|
—
|
|
(2,505
|
)
|
—
|
|
(2,380
|
)
|
|||||||||
|
Cash and cash equivalents at beginning of period
|
169
|
|
—
|
|
33,836
|
|
—
|
|
34,005
|
|
|||||||||
|
Cash and cash equivalents at end of period
|
$
|
294
|
|
$
|
—
|
|
$
|
31,331
|
|
$
|
—
|
|
$
|
31,625
|
|
||||
See note 2 for explanation of certain changes made in the presentation of the Company’s consolidated statements of cash flows for the years ended December 31, 2013 and 2012 to conform to the 2014 presentation.
F-54
|
THIRD POINT REINSURANCE LTD.
|
|||||||||||||||||||
|
CONDENSED CONSOLIDATING STATEMENT OF CASH FLOWS
|
|||||||||||||||||||
|
For the year ended December 31, 2012
|
|||||||||||||||||||
|
(expressed in thousands of U.S. dollars)
|
|||||||||||||||||||
|
|
Parent
Guarantor |
Issuer of Debt
|
Non-Guarantor Subsidiaries
|
Eliminations
|
Consolidated
|
||||||||||||||
|
Operating activities
|
|||||||||||||||||||
|
Income including non-controlling interests
|
$
|
99,401
|
|
$
|
—
|
|
$
|
102,562
|
|
$
|
(101,346
|
)
|
$
|
100,617
|
|
||||
|
Adjustments to reconcile income including non-controlling interests to net cash provided by operating activities
|
—
|
|
|||||||||||||||||
|
Equity in earnings of subsidiaries
|
(101,346
|
)
|
—
|
|
—
|
|
101,346
|
|
—
|
|
|||||||||
|
Share compensation expense
|
—
|
|
—
|
|
6,408
|
|
—
|
|
6,408
|
|
|||||||||
|
Interest expense on deposit liabilities
|
—
|
|
—
|
|
296
|
|
—
|
|
296
|
|
|||||||||
|
Net unrealized gain on investments and derivatives
|
—
|
|
—
|
|
(113,271
|
)
|
—
|
|
(113,271
|
)
|
|||||||||
|
Net realized gain on investments and derivatives
|
—
|
|
—
|
|
(55,632
|
)
|
—
|
|
(55,632
|
)
|
|||||||||
|
Amortization of premium and accretion of discount, net
|
—
|
|
—
|
|
(2,434
|
)
|
—
|
|
(2,434
|
)
|
|||||||||
|
Changes in assets and liabilities:
|
|
|
|
|
|
|
—
|
|
|||||||||||
|
Reinsurance balances receivable
|
—
|
|
—
|
|
(84,280
|
)
|
—
|
|
(84,280
|
)
|
|||||||||
|
Deferred acquisition costs, net
|
—
|
|
—
|
|
(45,383
|
)
|
—
|
|
(45,383
|
)
|
|||||||||
|
Other assets
|
(33
|
)
|
—
|
|
(1,668
|
)
|
—
|
|
(1,701
|
)
|
|||||||||
|
Interest and dividends receivable, net
|
—
|
|
—
|
|
(833
|
)
|
—
|
|
(833
|
)
|
|||||||||
|
Unearned premium reserves
|
—
|
|
—
|
|
93,893
|
|
—
|
|
93,893
|
|
|||||||||
|
Loss and loss adjustment expense reserves
|
—
|
|
—
|
|
67,271
|
|
—
|
|
67,271
|
|
|||||||||
|
Accounts payable and accrued expenses
|
682
|
|
—
|
|
3,475
|
|
—
|
|
4,157
|
|
|||||||||
|
Amounts due from affiliates
|
(770
|
)
|
—
|
|
770
|
|
—
|
|
—
|
|
|||||||||
|
Amounts due to affiliates
|
2,152
|
|
—
|
|
(2,152
|
)
|
—
|
|
—
|
|
|||||||||
|
Net cash provided by (used in) operating activities
|
86
|
|
—
|
|
(30,978
|
)
|
—
|
|
(30,892
|
)
|
|||||||||
|
Investing activities
|
|||||||||||||||||||
|
Purchases of investments
|
—
|
|
—
|
|
(2,317,234
|
)
|
—
|
|
(2,317,234
|
)
|
|||||||||
|
Proceeds from sales of investments
|
—
|
|
—
|
|
1,521,110
|
|
—
|
|
1,521,110
|
|
|||||||||
|
Purchases of investments to cover short sales
|
—
|
|
—
|
|
(535,443
|
)
|
—
|
|
(535,443
|
)
|
|||||||||
|
Proceeds from short sales of investments
|
—
|
|
—
|
|
729,182
|
|
—
|
|
729,182
|
|
|||||||||
|
Change in due to/from brokers, net
|
—
|
|
—
|
|
(65,678
|
)
|
—
|
|
(65,678
|
)
|
|||||||||
|
Increase in securities purchased under agreement to sell
|
—
|
|
—
|
|
(60,408
|
)
|
—
|
|
(60,408
|
)
|
|||||||||
|
Change in restricted cash and cash equivalents
|
—
|
|
—
|
|
(77,627
|
)
|
—
|
|
(77,627
|
)
|
|||||||||
|
Contributed capital (to) from subsidiaries
|
(170,110
|
)
|
—
|
|
170,110
|
|
—
|
|
—
|
|
|||||||||
|
Net cash used in investing activities
|
(170,110
|
)
|
—
|
|
(635,988
|
)
|
—
|
|
(806,098
|
)
|
|||||||||
|
Financing activities
|
|||||||||||||||||||
|
Proceeds from issuance of common shares, net of costs
|
158,593
|
|
—
|
|
—
|
|
—
|
|
158,593
|
|
|||||||||
|
Increase in deposit liabilities
|
—
|
|
—
|
|
50,000
|
|
|
50,000
|
|
||||||||||
|
Non-controlling interest in investment affiliate, net
|
—
|
|
—
|
|
38,913
|
|
—
|
|
38,913
|
|
|||||||||
|
Non-controlling interest in Catastrophe Fund
|
—
|
|
—
|
|
19,646
|
|
—
|
|
19,646
|
|
|||||||||
|
Non-controlling interest in Catastrophe Manager
|
—
|
|
—
|
|
2
|
|
—
|
|
2
|
|
|||||||||
|
Net cash provided by financing activities
|
158,593
|
|
—
|
|
108,561
|
|
—
|
|
267,154
|
|
|||||||||
|
Net (decrease) increase in cash and cash equivalents
|
(11,431
|
)
|
—
|
|
(558,405
|
)
|
—
|
|
(569,836
|
)
|
|||||||||
|
Cash and cash equivalents at beginning of period
|
11,600
|
|
—
|
|
592,241
|
|
—
|
|
603,841
|
|
|||||||||
|
Cash and cash equivalents at end of period
|
$
|
169
|
|
$
|
—
|
|
$
|
33,836
|
|
$
|
—
|
|
$
|
34,005
|
|
||||
See note 2 for explanation of certain changes made in the presentation of the Company’s consolidated statements of cash flows for the years ended December 31, 2013 and 2012 to conform to the 2014 presentation.
F-55
26. Quarterly financial results (UNAUDITED)
|
Quarters ended
|
||||||||||||||||
|
December 31, 2014
|
September 30, 2014
|
June 30, 2014
|
March 31, 2014
|
|||||||||||||
|
($ in thousands)
|
||||||||||||||||
|
Revenues
|
||||||||||||||||
|
Gross premiums written
|
$
|
253,802
|
|
$
|
126,403
|
|
$
|
145,508
|
|
$
|
87,587
|
|
||||
|
Gross premiums ceded
|
—
|
|
(150
|
)
|
—
|
|
—
|
|
||||||||
|
Net premiums written
|
253,802
|
|
126,253
|
|
145,508
|
|
87,587
|
|
||||||||
|
Change in net unearned premium reserves
|
(70,230
|
)
|
(17,305
|
)
|
(66,758
|
)
|
(14,325
|
)
|
||||||||
|
Net premiums earned
|
183,572
|
|
108,948
|
|
78,750
|
|
73,262
|
|
||||||||
|
Net investment income (loss)
|
(6,490
|
)
|
1,552
|
|
40,485
|
|
50,035
|
|
||||||||
|
Total revenues
|
177,082
|
|
110,500
|
|
119,235
|
|
123,297
|
|
||||||||
|
Expenses
|
||||||||||||||||
|
Loss and loss adjustment expenses incurred, net
|
132,364
|
|
60,115
|
|
44,409
|
|
46,259
|
|
||||||||
|
Acquisition costs, net
|
43,875
|
|
38,317
|
|
29,583
|
|
25,431
|
|
||||||||
|
General and administrative expenses
|
10,310
|
|
10,124
|
|
9,549
|
|
10,025
|
|
||||||||
|
Other expenses
|
2,606
|
|
2,982
|
|
1,020
|
|
787
|
|
||||||||
|
Total expenses
|
189,155
|
|
111,538
|
|
84,561
|
|
82,502
|
|
||||||||
|
Income (loss) before income tax expense
|
(12,073
|
)
|
(1,038
|
)
|
34,674
|
|
40,795
|
|
||||||||
|
Income tax expense
|
(1,731
|
)
|
(1,542
|
)
|
(2,375
|
)
|
—
|
|
||||||||
|
Net income (loss) including non-controlling interests
|
(13,804
|
)
|
(2,580
|
)
|
32,299
|
|
40,795
|
|
||||||||
|
Income (loss) attributable to non-controlling interests
|
(875
|
)
|
(3,417
|
)
|
(1,007
|
)
|
(1,016
|
)
|
||||||||
|
Net income (loss)
|
$
|
(14,679
|
)
|
$
|
(5,997
|
)
|
$
|
31,292
|
|
$
|
39,779
|
|
||||
|
Earnings (loss) per share
|
||||||||||||||||
|
Basic
|
$
|
(0.14
|
)
|
$
|
(0.06
|
)
|
$
|
0.30
|
|
$
|
0.38
|
|
||||
|
Diluted
|
$
|
(0.14
|
)
|
$
|
(0.06
|
)
|
$
|
0.29
|
|
$
|
0.37
|
|
||||
|
Weighted average number of common shares used in the determination of earnings per share
|
||||||||||||||||
|
Basic
|
103,324,616
|
|
103,295,920
|
|
103,264,616
|
|
103,264,616
|
|
||||||||
|
Diluted
|
103,324,616
|
|
103,295,920
|
|
106,433,881
|
|
103,413,580
|
|
||||||||
F-56
|
Quarters ended
|
||||||||||||||||
|
December 31, 2013
|
September 30, 2013
|
June 30, 2013
|
March 31, 2013
|
|||||||||||||
|
($ in thousands)
|
||||||||||||||||
|
Revenues
|
||||||||||||||||
|
Gross premiums written
|
$
|
162,277
|
|
$
|
45,425
|
|
$
|
98,215
|
|
$
|
96,020
|
|
||||
|
Gross premiums ceded
|
—
|
|
—
|
|
—
|
|
(9,975
|
)
|
||||||||
|
Net premiums written
|
162,277
|
|
45,425
|
|
98,215
|
|
86,045
|
|
||||||||
|
Change in net unearned premium reserves
|
(103,767
|
)
|
20,904
|
|
(35,928
|
)
|
(52,504
|
)
|
||||||||
|
Net premiums earned
|
58,510
|
|
66,329
|
|
62,287
|
|
33,541
|
|
||||||||
|
Net investment income
|
89,321
|
|
54,617
|
|
32,826
|
|
81,361
|
|
||||||||
|
Total revenues
|
147,831
|
|
120,946
|
|
95,113
|
|
114,902
|
|
||||||||
|
Expenses
|
||||||||||||||||
|
Loss and loss adjustment expenses incurred, net
|
36,133
|
|
39,349
|
|
45,692
|
|
18,638
|
|
||||||||
|
Acquisition costs, net
|
18,833
|
|
21,117
|
|
14,921
|
|
13,073
|
|
||||||||
|
General and administrative expenses
|
8,965
|
|
9,846
|
|
7,217
|
|
7,008
|
|
||||||||
|
Other expenses
|
2,247
|
|
1,246
|
|
759
|
|
670
|
|
||||||||
|
Total expenses
|
66,178
|
|
71,558
|
|
68,589
|
|
39,389
|
|
||||||||
|
Net income including non-controlling interests
|
81,653
|
|
49,388
|
|
26,524
|
|
75,513
|
|
||||||||
|
Income attributable to non-controlling interests
|
(1,565
|
)
|
(2,818
|
)
|
(301
|
)
|
(1,083
|
)
|
||||||||
|
Net income
|
$
|
80,088
|
|
$
|
46,570
|
|
$
|
26,223
|
|
$
|
74,430
|
|
||||
|
Earnings per share
|
||||||||||||||||
|
Basic
|
$
|
0.77
|
|
$
|
0.52
|
|
$
|
0.33
|
|
$
|
0.94
|
|
||||
|
Diluted
|
$
|
0.75
|
|
$
|
0.51
|
|
$
|
0.33
|
|
$
|
0.93
|
|
||||
|
Weighted average number of common shares used in the determination of earnings per share
|
||||||||||||||||
|
Basic
|
103,264,616
|
|
89,620,394
|
|
78,432,132
|
|
78,432,132
|
|
||||||||
|
Diluted
|
106,390,339
|
|
90,915,805
|
|
79,254,268
|
|
79,083,675
|
|
||||||||
F-57
THIRD POINT REINSURANCE LTD.
Schedule I - Summary of Investments - Other than Investments in Related Parties
(expressed in thousands of U.S. dollars)
|
Cost
|
Fair value
|
Balance sheet value
|
||||||||||
|
Assets
|
||||||||||||
|
Equity securities
|
$
|
1,073,428
|
|
$
|
1,173,635
|
|
$
|
1,173,635
|
|
|||
|
Private common equity securities
|
5,431
|
|
4,161
|
|
4,161
|
|
||||||
|
Total equities
|
1,078,859
|
|
1,177,796
|
|
1,177,796
|
|
||||||
|
Asset-backed securities
|
391,179
|
|
400,234
|
|
400,234
|
|
||||||
|
Bank debts
|
2,438
|
|
2,395
|
|
2,395
|
|
||||||
|
Corporate bonds
|
47,525
|
|
60,594
|
|
60,594
|
|
||||||
|
Municipal bonds
|
3,291
|
|
3,094
|
|
3,094
|
|
||||||
|
Sovereign debt
|
102,500
|
|
103,331
|
|
103,331
|
|
||||||
|
Total debt securities
|
546,933
|
|
569,648
|
|
569,648
|
|
||||||
|
Investments in limited partnerships
|
85,865
|
|
62,110
|
|
62,110
|
|
||||||
|
Rights and warrants
|
1,752
|
|
1,843
|
|
1,843
|
|
||||||
|
Options
|
9,093
|
|
6,996
|
|
6,996
|
|
||||||
|
Trade claims
|
4,663
|
|
10,368
|
|
10,368
|
|
||||||
|
Catastrophe bond
|
2,000
|
|
2,077
|
|
2,077
|
|
||||||
|
Total other investments
|
103,373
|
|
83,394
|
|
83,394
|
|
||||||
|
Total investments
|
$
|
1,729,165
|
|
$
|
1,830,838
|
|
$
|
1,830,838
|
|
|||
F-58
THIRD POINT REINSURANCE LTD.
Schedule III - Supplementary Insurance Information
For the years ended
December 31, 2014
,
2013
and 2012
(expressed in thousands of U.S. dollars)
|
As of and for the year ended December 31, 2014
|
||||||||||||||||||||||||||||||
|
Deferred acquisition costs, net
|
Loss and loss adjustment expense reserves
|
Unearned premium
|
Net premiums earned
|
Net investment income
|
Other Expenses
|
Loss and loss adjustment expenses incurred, net
|
Amortization of deferred acquisition costs, net
|
Other operating expenses
|
Net premiums written
|
|||||||||||||||||||||
|
Property and Casualty Reinsurance
|
$
|
155,891
|
|
$
|
277,285
|
|
$
|
433,757
|
|
$
|
432,297
|
|
$
|
11,305
|
|
$
|
7,395
|
|
$
|
283,180
|
|
$
|
136,154
|
|
$
|
22,515
|
|
$
|
601,155
|
|
|
Catastrophe Risk Management
|
10
|
|
77
|
|
52
|
|
12,235
|
|
1,227
|
|
—
|
|
(33
|
)
|
1,052
|
|
3,113
|
|
11,995
|
|
||||||||||
|
Corporate
|
—
|
|
—
|
|
—
|
|
—
|
|
73,050
|
|
—
|
|
—
|
|
—
|
|
14,380
|
|
—
|
|
||||||||||
|
$
|
155,901
|
|
$
|
277,362
|
|
$
|
433,809
|
|
$
|
444,532
|
|
$
|
85,582
|
|
$
|
7,395
|
|
$
|
283,147
|
|
$
|
137,206
|
|
$
|
40,008
|
|
$
|
613,150
|
|
|
|
As of and for the year ended December 31, 2013
|
||||||||||||||||||||||||||||||
|
Deferred acquisition costs, net
|
Loss and loss adjustment expense reserves
|
Unearned premium
|
Net premiums earned
|
Net investment income
|
Other Expenses
|
Loss and loss adjustment expenses incurred, net
|
Amortization of deferred acquisition costs, net
|
Other operating expenses
|
Net premiums written
|
|||||||||||||||||||||
|
Property and Casualty Reinsurance
|
$
|
91,141
|
|
$
|
134,221
|
|
$
|
264,898
|
|
$
|
212,607
|
|
$
|
26,953
|
|
$
|
4,922
|
|
$
|
139,616
|
|
$
|
66,981
|
|
$
|
21,838
|
|
$
|
383,613
|
|
|
Catastrophe Risk Management
|
52
|
|
110
|
|
289
|
|
8,060
|
|
4,421
|
|
—
|
|
196
|
|
963
|
|
3,852
|
|
8,349
|
|
||||||||||
|
Corporate
|
—
|
|
—
|
|
—
|
|
—
|
|
226,751
|
|
—
|
|
—
|
|
—
|
|
7,346
|
|
—
|
|
||||||||||
|
$
|
91,193
|
|
$
|
134,331
|
|
$
|
265,187
|
|
$
|
220,667
|
|
$
|
258,125
|
|
$
|
4,922
|
|
$
|
139,812
|
|
$
|
67,944
|
|
$
|
33,036
|
|
$
|
391,962
|
|
|
|
As of and for the year ended December 31, 2012
|
||||||||||||||||||||||||||||||
|
Deferred acquisition costs, net
|
Loss and loss adjustment expense reserves
|
Unearned premium
|
Net premiums earned
|
Net investment income
|
Other Expenses
|
Loss and loss adjustment expenses incurred, net
|
Amortization of deferred acquisition costs, net
|
Other operating expenses
|
Net premiums written
|
|||||||||||||||||||||
|
Property and Casualty Reinsurance
|
$
|
45,383
|
|
$
|
67,271
|
|
$
|
93,893
|
|
$
|
96,481
|
|
$
|
4,901
|
|
$
|
446
|
|
$
|
80,306
|
|
$
|
24,604
|
|
$
|
20,290
|
|
$
|
190,374
|
|
|
Catastrophe Risk Management
|
—
|
|
—
|
|
—
|
|
—
|
|
—
|
|
—
|
|
—
|
|
—
|
|
1,534
|
|
—
|
|
||||||||||
|
Corporate
|
—
|
|
—
|
|
—
|
|
—
|
|
131,521
|
|
—
|
|
—
|
|
—
|
|
5,552
|
|
—
|
|
||||||||||
|
$
|
45,383
|
|
$
|
67,271
|
|
$
|
93,893
|
|
$
|
96,481
|
|
$
|
136,422
|
|
$
|
446
|
|
$
|
80,306
|
|
$
|
24,604
|
|
$
|
27,376
|
|
$
|
190,374
|
|
|
F-59
THIRD POINT REINSURANCE LTD.
Schedule IV - Reinsurance
For the years ended
December 31, 2014
,
2013
and 2012
(expressed in thousands of U.S. dollars)
|
Direct gross premiums written
|
Ceded to other companies
|
Assumed from other companies
|
Net amount
|
Percentage of amount assumed to net
|
||||||||||||||
|
Year ended December 31, 2014
|
$
|
—
|
|
$
|
150
|
|
$
|
613,300
|
|
$
|
613,150
|
|
100
|
%
|
||||
|
Year ended December 31, 2013
|
$
|
—
|
|
$
|
9,975
|
|
$
|
401,937
|
|
$
|
391,962
|
|
98
|
%
|
||||
|
Year ended December 31, 2012
|
$
|
—
|
|
$
|
—
|
|
$
|
190,374
|
|
$
|
190,374
|
|
100
|
%
|
||||
F-60
TABLE OF CONTENTS
Part IItem 1. BusinessItem 1A. Risk FactorsItem 1B. Unresolved Staff CommentsItem 2. PropertiesItem 3. Legal ProceedingsItem 4. Mine Safety DisclosuresPart IIItem 5. Market For Registrant S Common Equity, Related Shareholder Matters and Issuer Purchases Of Equity SecuritiesItem 6 Selected Financial DataItem 7. Management S Discussion and Analysis Of Financial Condition and Results Of OperationsItem 7A. Quantitative and Qualitative Disclosures About Market RiskItem 8. Financial Statements and Supplementary DataItem 9. Changes in and Disagreements with Accountants on Accounting and Financial DisclosureItem 9A. Controls and ProceduresItem 9B. Other InformationPart IIIItem 10. Directors, Executive Officers and Corporate GovernanceItem 11. Executive CompensationItem 12. Security Ownership Of Certain Beneficial Owners and Management and Related Shareholder MattersItem 13. Certain Relationships and Related Transactions, and Director IndependenceItem 14. Principal Accounting Fees and ServicesPart IVItem 15. Exhibits and Financial Statement Schedules