SIRIUSPOINT LTD
10-Ks and 10-Qs
|
|
|
|
|
|
|
|
|
|
|
|
|
|
|
|
|
|
|
|
|
|
|
|
|
|
|
|
|
|
|
|
|
|
|
|
|
|
|
|
|
UNITED STATES SECURITIES AND EXCHANGE COMMISSION
WASHINGTON, D.C. 20549
FORM 10-K
|
x
|
Annual report pursuant to Section 13 or 15(d) of the Securities Exchange Act of 1934
For the fiscal year ended December 31, 2018
|
|
or
|
|
|
¨
|
Transition report pursuant to Section 13 or 15(d) of the Securities Exchange Act of 1934
For the transition period from to
|
Commission File Number 001-35039
THIRD POINT REINSURANCE LTD.
(Exact name of registrant as specified in its charter)
|
Bermuda
|
98-1039994
|
|
|
(State or other jurisdiction of incorporation or organization)
|
(I.R.S. Employer Identification No.)
|
|
|
3 Waterloo Lane
Pembroke, Bermuda, HM 08
|
(441) 542 3300
|
|
|
(Address of principal executive offices and zip code)
|
(Registrant’s telephone number)
|
|
(Former name, former address and former fiscal year, if changed since last report)
Securities registered pursuant to Section 12(b) of the Act:
|
Title of each class
|
Name of each exchange on which registered
|
|
|
Common Shares, $0.10 par value
|
New York Stock Exchange
|
|
Securities registered pursuant to Section 12(g) of the Act: None
Indicate by check mark if the registrant is a well-known seasoned issuer, as defined in Rule 405 of the Securities Act. Yes
x
No
¨
Indicate by check mark if the registrant is not required to file reports pursuant to Section 13 or Section 15(d) of the Act. Yes
¨
No
x
Indicate by check mark whether the registrant (1) has filed all reports required to be filed by Section 13 or 15(d) of the Securities Exchange Act of 1934 during the preceding 12 months (or for such shorter period that the registrant was required to file such reports), and (2) has been subject to such filing requirements for the past 90 days. Yes
x
No
¨
Indicate by check mark whether the registrant has submitted electronically every Interactive Data File required to be submitted pursuant to Rule 405 of Regulation S-T (§232.405 of this chapter) during the preceding 12 months (or for such shorter period that the registrant was required to submit such files). Yes
x
No
¨
Indicate by check mark if disclosure of delinquent filers pursuant to Item 405 of Regulation S-K (§229.405 of this chapter) is not contained herein, and will not be contained, to the best of registrant’s knowledge, in definitive proxy or information statements incorporated by reference in Part III of this Form 10-K or any amendment to this Form 10-K.
¨
Indicate by check mark whether the registrant is a large accelerated filer, an accelerated filer, a non-accelerated filer, smaller reporting company or an emerging growth company. See definitions of “large accelerated filer,” “accelerated filer”, “smaller reporting company,” and “emerging growth company” in Rule 12b-2 of the Exchange Act.
|
Large accelerated filer
|
x
|
Accelerated filer
|
¨
|
Non-accelerated filer
|
¨
|
Smaller reporting company
|
¨
|
Emerging growth company
|
¨
|
If an emerging growth company, indicate by check mark if the registrant has elected not to use the extended transition period for complying with any new or revised financial accounting standards provided pursuant to Section 13(a) of the Exchange Act.
¨
Indicate by check mark whether the registrant is a shell company (as defined in Rule 12b-2 of the Exchange Act). Yes
¨
No
x
The aggregate market value of the shares of the voting and non-voting common equity held by non-affiliates of the registrant as of June 30, 2018 was
$963.2 million
.
As of February 25, 2019, there were
93,639,610
common shares of the registrant’s common shares outstanding, including
2,013,080
restricted shares.
DOCUMENTS INCORPORATED BY REFERENCE
Part III incorporates information from certain portions of the registrant’s definitive proxy statement to be filed with the Securities and Exchange Commission within 120 days after the fiscal year ended
December 31, 2018
.
____________________________________________________________________________________________________________________________________________________________
Third Point Reinsurance Ltd.
INDEX
|
Page
|
|
INTRODUCTORY NOTE
Unless the context otherwise indicates or requires, as used in this Annual Report on Form 10-K references to “we,” “our,” “us,” and the “Company,” refer to Third Point Reinsurance Ltd. (“Third Point Re” or “TPRE”) and its directly and indirectly owned subsidiaries, including Third Point Reinsurance Company Ltd. (“Third Point Re BDA”) and Third Point Reinsurance (USA) Ltd. (“Third Point Re USA”), as a combined entity, except where otherwise stated or where it is clear that the terms mean only Third Point Re exclusive of its subsidiaries. We refer to Third Point Re (USA) Holdings, Inc. as “TPRUSA”, “Fiscal,” when used in reference to any twelve-month period ended December 31, refers to our fiscal years ended December 31. We also refer to Third Point Enhanced LP as “TP Fund”. Unless otherwise indicated, information contained in this Annual Report is as of December 31,
2018
.
Cautionary Note Regarding Forward-Looking Statements
Certain statements contained or incorporated in this Annual Report include forward-looking statements. These forward-looking statements include, without limitation, statements regarding our industry, business strategy, plans, goals and expectations concerning our market position, international expansion, future operations, margins, profitability, future efficiencies, capital expenditures, liquidity and capital resources and other financial and operating information. When used in this discussion, the words “may,” “believes,” “intends,” “seeks,” “anticipates,” “plans,” “estimates,” “expects,” “should,” “assumes,” “continues,” “could,” “will,” “future” and the negative of these or similar terms and phrases are intended to identify forward-looking statements in this Annual Report on Form 10-K.
Forward-looking statements reflect our current expectations regarding future events, results or outcomes. These expectations may or may not be realized. Although we believe the expectations reflected in the forward-looking statements are reasonable, we can give you no assurance these expectations will prove to have been correct. Some of these expectations may be based upon assumptions, data or judgments that prove to be incorrect. Actual events, results and outcomes may differ materially from our expectations due to a variety of known and unknown risks, uncertainties and other factors. Although it is not possible to identify all of these risks and factors, they include, among others, the following:
|
•
|
results of operations fluctuate and may not be indicative of our prospects;
|
|
•
|
more established competitors;
|
|
•
|
losses exceeding reserves;
|
|
•
|
highly cyclical property and casualty reinsurance industry;
|
|
•
|
downgrade or withdrawal of ratings by rating agencies;
|
|
•
|
significant decrease in our capital or surplus;
|
|
•
|
dependence on key executives;
|
|
•
|
dependence on letter of credit facilities that may not be available on commercially acceptable terms;
|
|
•
|
inability to service our indebtedness;
|
|
•
|
limited cash flow and liquidity due to our indebtedness;
|
|
•
|
inability to raise necessary funds to pay principal or interest on debt;
|
|
•
|
potential lack of availability of capital in the future;
|
|
•
|
credit risk associated with the use of reinsurance brokers;
|
|
•
|
future strategic transactions such as acquisitions, dispositions, mergers or joint ventures;
|
|
•
|
technology breaches or failures, including cyber-attacks;
|
|
•
|
lack of control over TP Fund;
|
|
•
|
lack of control over the allocation and performance of TP Fund’s investment portfolio;
|
|
•
|
dependence on Third Point LLC to implement TP Fund’s investment strategy;
|
|
•
|
limited ability to withdraw our capital accounts from TP Fund;
|
|
•
|
decline in revenue due to poor performance of TP Fund’s investment portfolio;
|
|
•
|
TP Fund’s investment strategy involves risks that are greater than those faced by competitors;
|
1
|
•
|
termination by Third Point LLC of our or TP Fund’s investment management agreements;
|
|
•
|
potential conflicts of interest with Third Point LLC;
|
|
•
|
losses resulting from significant investment positions;
|
|
•
|
credit risk associated with the default on obligations of counterparties;
|
|
•
|
ineffective investment risk management systems;
|
|
•
|
fluctuations in the market value of TP Fund’s investment portfolio;
|
|
•
|
trading restrictions being placed on TP Fund’s investments;
|
|
•
|
limited termination provisions in our investment management agreements;
|
|
•
|
limited liquidity and lack of valuation data on certain TP Fund’s investments;
|
|
•
|
U.S. and global economic downturns;
|
|
•
|
specific characteristics of investments in mortgage-backed securities and other asset-backed securities, in securities of issues based outside the U.S., and in special situation or distressed companies;
|
|
•
|
loss of key employees at Third Point LLC;
|
|
•
|
Third Point LLC’s compensation arrangements may incentivize investments that are risky or speculative;
|
|
•
|
increased regulation or scrutiny of alternative investment advisers affecting our reputation;
|
|
•
|
suspension or revocation of our reinsurance licenses;
|
|
•
|
potentially being deemed an investment company under U.S. federal securities law;
|
|
•
|
failure of reinsurance subsidiaries to meet minimum capital and surplus requirements;
|
|
•
|
changes in Bermuda or other law and regulation that may have an adverse impact on our operations;
|
|
•
|
Third Point Re and/or Third Point Re BDA potentially becoming subject to U.S. federal income taxation;
|
|
•
|
potential characterization of Third Point Re and/or Third Point Re BDA as a passive foreign investment company;
|
|
•
|
subjection of our affiliates to the base erosion and anti-abuse tax;
|
|
•
|
potentially becoming subject to U.S. withholding and information reporting requirements under the Foreign Account Tax Compliance Act; and
|
|
•
|
other risks and factors listed under “Item 1A. Risk Factors” and elsewhere in this Annual Report.
|
Any one of these factors or a combination of these factors could materially affect our financial condition or future results of operations and could influence whether any forward-looking statements contained in this report ultimately prove to be accurate. Our forward-looking statements are not guarantees of future performance, and you should not place undue reliance on them. All forward-looking statements speak only as of the date made and we undertake no obligation to update or revise publicly any forward-looking statements, whether as a result of new information, future events or otherwise.
In addition, while we do, from time to time, communicate with security analysts, it is against our policy to disclose to them any material non-public information or other confidential information. Accordingly, shareholders should not assume that we agree with any statement or report issued by any analyst irrespective of the content of the statement or report. Thus, to the extent that reports issued by securities analysts contain any projections, forecasts, or opinions, such reports are not our responsibility.
PART I.
Item 1. Business
Overview
We are a holding company domiciled in Bermuda. Through our reinsurance subsidiaries, we provide specialty property and casualty reinsurance products to insurance and reinsurance companies on a worldwide basis. Our goal is to deliver attractive equity returns to our shareholders by combining profitable reinsurance underwriting with superior investment
2
management provided by Third Point LLC, our investment manager and the investment manager of TP Fund. We believe that our reinsurance and investment strategy differentiates us from our competitors.
Our reinsurance strategy is to be highly opportunistic and disciplined. During periods of extremely competitive or soft reinsurance market conditions, we intend to be selective with regard to the amount and type of reinsurance we write and conserve our risk-taking capital for periods when market conditions are more favorable to us from a pricing and terms and conditions perspective.
Our senior management team has significant senior leadership and underwriting experience in the reinsurance industry. We believe that our experience and longstanding relationships with our insurance and reinsurance company clients, senior reinsurance brokers, insurance regulators and rating agencies are an important competitive advantage.
Substantially all of our investable assets are managed by Third Point LLC, which is wholly owned by Daniel S. Loeb, one of our founding shareholders. Third Point LLC is an SEC-registered investment adviser headquartered in New York, managing
$14.0 billion
in assets as of
December 31, 2018
. Refer to Note 4 to the consolidated financial statements included in this Form 10-K for details on the investment account structure change that occurred in 2018.
We were incorporated on October 6, 2011 and completed our initial capitalization transaction in December 2011 with $784.3 million of equity capital, and commenced underwriting business on January 1, 2012. Both of our operating subsidiaries have an A- (Excellent) financial strength rating from A.M. Best Company, Inc., or A.M. Best.
In August 2012, we established a wholly-owned subsidiary in the United Kingdom, Third Point Re Marketing (UK) Limited (“TPRUK”). In May 2013, TPRUK was licensed as an insurance intermediary by the UK Financial Conduct Authority.
In August 2013, we completed an initial public offering (“IPO”) of 24,832,484 common shares. Our common shares are listed on the New York Stock Exchange (“NYSE”) under the symbol “TPRE”.
In February 2015, we began reinsurance operations in the United States through Third Point Re USA, a Bermuda company licensed as a Class 4 insurer and a wholly owned operating subsidiary of Third Point Re (USA) Holdings Inc. (“TPRUSA”). TPRUSA is a wholly owned subsidiary of Third Point Re (UK) Holdings Ltd., a private company limited by shares organized under the laws of England and Wales and our direct wholly owned subsidiary. Third Point Re USA provides reinsurance products that are substantially similar to the reinsurance products provided by Third Point Re. Third Point Re USA’s U.S. presence is a strategic component of our overall growth strategy.
Segment Information
We manage our business on the basis of one operating segment: Property and Casualty Reinsurance. Non-underwriting income and expenses, presented as a reconciliation to our consolidated results, include: net investment income (loss), certain general and administrative expenses related to corporate activities, interest expense,
foreign exchange (gains) losses
and
income tax (expense) benefit
.
Reinsurance Strategy
Our current reinsurance strategy is to build a portfolio that generates margins commensurate with the amount of risk assumed, by targeting sub-sectors of the market and specific situations where reinsurance capacity and alternatives may be constrained and/or we can leverage our underwriting and structuring expertise. To help lower our expected combined ratio, we have recently expanded into property catastrophe reinsurance and other higher margin event risk type covers. The level of volatility in our reinsurance portfolio will be determined by market conditions, but will typically be lower than that of most other reinsurance companies.
Most of our gross written premium has historically been generated from larger customized reinsurance contracts that require significant interaction during the course of negotiations between the client, intermediaries and us. In these situations, we take a lead underwriting position, meaning that we establish the pricing and terms and conditions of the reinsurance contract. In certain instances, we will follow terms and conditions established by our competitors if we believe the opportunity meets our return threshold and helps us balance our reinsurance portfolio. In addition, with the
3
recent expansion into property catastrophe and other event risk reinsurance covers, the number of less customized, syndicated transactions will significantly increase.
We also write reinsurance contracts that provide protection against adverse development on loss reserves where we provide an incremental amount of additional coverage limit. We typically provide coverage where we agree with the client’s reserving practices and reserve levels or where we believe there are structural or contractual safeguards against reserve deterioration in place. While these transactions may be booked at, or slightly above, a 100% composite ratio (combined ratio before general and administrative expenses) and therefore do not initially generate underwriting income, they typically produce premiums and/or float equal to the reserves ceded at the inception of the contract. In some instances, the level of risk in the reserve cover contract or the risk mitigating features within the contract including limitations on the amount and timing of loss payments require us to account for the contract as a deposit liability contract. Using the deposit method of accounting, a deposit liability, rather than written premium, is initially recorded based upon the consideration received less any explicitly identified premiums or fees. In subsequent periods, the deposit liability is adjusted by calculating the effective yield on the deposit to reflect actual payments to date and future expected payments.
The majority of our gross written premium is derived from a small number of large contracts
and, as a result, individual renewals, non-renewals, cancellations or new business can have a significant impact on premiums recognized in a period. In addition, many of our quota share contracts are subject to significant judgment in the amount of premiums that we expect to recognize. Changes in premium estimates are recorded in the period they are determined and can significantly alter the expected value of a particular reinsurance contract. We also offer customized solutions to our clients, including some of the reserve covers, which are considered retroactive reinsurance contracts, on which we will not have a regular renewal opportunity. Furthermore, we record gross premiums written and earned for reserve covers at the inception of the contract. Together, these factors can impact the comparability of premiums written and earned from period to period and year over year. See
Note 24
to our consolidated financial statements included elsewhere in this Annual Report for a breakdown of contracts that individually contributed more than 10% of total gross premiums written.
We intend to manage our book of business by underwriting predominantly a mix of personal and commercial lines. We intend to increase our geographic spread over time; however, we expect that a majority of our reinsurance business will continue to be comprised of U.S. exposure. See
Note 24
to our consolidated financial statements included elsewhere in this Annual Report for a breakdown of gross premiums written by domicile of ceding companies.
Many of our clients buy reinsurance from us for capital management purposes, primarily to increase their capacity to write insurance premium, maintain or improve their credit ratings from rating agencies, or to meet regulatory capital requirements. Many of our reinsurance contracts include structural and contractual features that limit the amount of risk assumed by the reinsurer, and therefore carry relatively lower expected margins compared to the excess of loss reinsurance and other more volatile forms of reinsurance in our portfolio.
We have historically focused on lines of business and forms of reinsurance that have demonstrated more stable return characteristics and have limited our underwriting of property catastrophe risk. However, we have incrementally expanded the lines of business and forms of reinsurance on which we focus that have increased risk profiles where we believe the higher expected margins adequately compensate us for the increased risk. We have begun writing some excess of loss casualty covers in lines of business where we have historically assumed only quota share exposure. We also began expanding into new specialty lines of business in 2018 and started writing a modest amount of property catastrophe business in 2019.
We plan to continue to expand into these lines of business and to evaluate and consider pursuing opportunities in other new lines of reinsurance business in 2019.
During 2018, we added experienced senior underwriters with strong market relationships to our team and we will continue to expand our underwriting team in 2019. In addition, we may, from time to time, invest in managing general agents or other insurance vehicles as part of our ongoing strategy to leverage our underwriting and capital markets expertise to structure and offer capital alternatives in numerous forms and combinations, including equity, debt and reinsurance offerings.
4
The following table provides a breakdown by line and type of business of gross premiums written for the years ended
December 31, 2018
,
2017
and
2016
:
|
2018
|
2017
|
2016
|
||||||||||||||||||
|
Amount
|
Percentage of Total
|
Amount
|
Percentage of Total
|
Amount
|
Percentage of Total
|
|||||||||||||||
|
($ in thousands)
|
||||||||||||||||||||
|
Property
|
$
|
9,070
|
|
1.6
|
%
|
$
|
136,999
|
|
21.4
|
%
|
$
|
98,334
|
|
15.9
|
%
|
|||||
|
Workers’ Compensation
|
36,824
|
|
6.4
|
%
|
33,194
|
|
5.2
|
%
|
56,069
|
|
9.1
|
%
|
||||||||
|
Auto
|
66,492
|
|
11.5
|
%
|
43,424
|
|
6.7
|
%
|
91,626
|
|
14.8
|
%
|
||||||||
|
Other Casualty
|
132,473
|
|
22.9
|
%
|
193,141
|
|
30.1
|
%
|
65,355
|
|
10.6
|
%
|
||||||||
|
Casualty
|
235,789
|
|
40.8
|
%
|
269,759
|
|
42.0
|
%
|
213,050
|
|
34.5
|
%
|
||||||||
|
Credit & Financial Lines
|
100,576
|
|
17.4
|
%
|
34,324
|
|
5.4
|
%
|
118,707
|
|
19.2
|
%
|
||||||||
|
Multi-line
|
162,248
|
|
28.1
|
%
|
63,665
|
|
9.9
|
%
|
187,283
|
|
30.4
|
%
|
||||||||
|
Other Specialty
|
(3,651
|
)
|
(0.7
|
)%
|
27,522
|
|
4.3
|
%
|
—
|
|
—
|
%
|
||||||||
|
Specialty
|
259,173
|
|
44.8
|
%
|
125,511
|
|
19.6
|
%
|
305,990
|
|
49.6
|
%
|
||||||||
|
Total prospective reinsurance contracts
|
504,032
|
|
87.2
|
%
|
532,269
|
|
83.0
|
%
|
617,374
|
|
100.0
|
%
|
||||||||
|
Retroactive reinsurance contracts
|
74,220
|
|
12.8
|
%
|
109,351
|
|
17.0
|
%
|
—
|
|
—
|
%
|
||||||||
|
Total property and casualty reinsurance
|
$
|
578,252
|
|
100.0
|
%
|
$
|
641,620
|
|
100.0
|
%
|
$
|
617,374
|
|
100.0
|
%
|
|||||
Investment Strategy
During the period covered by this report, we transitioned to a new investment account structure, as previously disclosed in our quarterly reports on Form 10-Q for the fiscal quarters ended June 30, 2018 and September 30, 2018. For additional information, see “Change in Investment Account Structure” below, Item 9B. “Other Information” and Note 4 to the consolidated financial statements included in this Form 10-K.
We expect our overall investment exposures, returns, fees paid to Third Point LLC and Third Point Advisors LLC (“TP GP”) to be generally similar under the LPA and TP Fund IMA, each as defined below, compared to what would have been expected under the separate accounts managed under the JV Agreements, as defined below, assuming similar underlying investment portfolio returns and exposure levels. However, there can be no assurance of such results.
Our investment strategy, through our investments in TP Fund, distinguishes us from most other reinsurers, who typically concentrate their investment portfolios on long-only, investment grade, shorter-term, fixed income securities. As implemented by the investment manager of TP Fund, Third Point LLC, TP Fund’s investment strategy is intended to achieve superior risk-adjusted returns by deploying capital in both long and short investments with favorable risk/reward characteristics across select asset classes, sectors and geographies. Third Point LLC identifies investment opportunities via a bottom-up, value-oriented approach to single security analysis supplemented by a top-down view of portfolio and risk management. Third Point LLC seeks dislocations in certain areas of the capital markets or in the pricing of particular securities and supplements single security analysis with an approach to portfolio construction that includes sizing each investment based on upside/downside calculations, all with a view towards appropriately positioning and managing overall exposures. Dislocations in capital markets refer to any major movements in prices of the capital markets as a whole, certain segments of the market, or a specific security. If Third Point LLC has what it considers to be a differentiated view from the perceived market sentiment with respect to such movement, Third Point LLC may trade securities in our investment accounts based on that differentiated view. If the ultimate market reaction with respect to the event or movement ultimately proves to be closer to Third Point LLC’s original viewpoint, TP Fund may have investment gains as a result of the shift in market sentiment. Through its investment manager, Third Point LLC, TP Fund makes investments globally, in both developed and emerging markets, in all sectors, and in equity, credit, commodity, currency, options and other instruments.
Third Point LLC has historically favored event-driven situations, in which it believes that a catalyst, either intrinsic or extrinsic, will unlock value or alter the lens through which the greater market values a particular investment. Third
5
Point LLC attempts to apply this event framework to each of its single security investments and this approach informs the timing and risk of each investment.
Our cash and investment accounts include the collateral assets pertaining to letters of credit and trust accounts securing our obligations under certain reinsurance contracts. Collateral assets are managed by Third Point LLC under the investment management agreement (the “Collateral Assets IMA”), as discussed below under “Collateral Assets IMA”. The collateral assets pertaining to the trusts are invested pursuant to the eligible securities definition of each trust agreement, but typically limit the type of securities that can be invested to U.S. Treasury securities and highly rated sovereign debt. The collateral assets pertaining to collateral accounts securing letters of credit issued under secured letter of credit facilities are required to be held in cash. Refer to
Note 13
to our consolidated financial statements included elsewhere in this Annual Report for further details.
Property and Casualty Reinsurance Segment Products
Our underwriting team has extensive experience in underwriting many forms of property, casualty and specialty reinsurance products. We offer reinsurance on a proportional basis where the reinsurer shares liabilities and premiums in a clearly defined proportion with the insurer and pays commissions to cover expenses and share in profitability. We also offer reinsurance on an excess of loss basis, where the reinsurer is paid a premium to cover losses after the insurer has retained a specified deductible.
In the current market for property and casualty reinsurance, which remains highly competitive despite the aggregate catastrophe losses in recent years, we expect that we will continue to write prospective property, casualty and specialty reinsurance structured for surplus relief on a proportional basis, as well as opportunistic or higher margin business written on both a proportional and excess of loss basis.
We also write loss portfolio transfers, reserve covers and other forms of retrospective reserve covers, where we are able to leverage both our investment and underwriting capabilities. We believe there is less competition for the type of reserve covers on which we focus. This is a result of the limited willingness of traditional reinsurers, who have historically experienced lower investment returns on investable assets backing reserves, to pursue these products which rely heavily on investment return to produce compelling economics. Margins on this business are determined through bilateral negotiations and comparing the cost of the reserve covers to non-reinsurance solutions such as raising additional equity or debt capital
We began expanding into new specialty lines of business in 2018 and started writing a portfolio of property catastrophe reinsurance incepting in 2019. We have expanded the lines of business and forms of reinsurance that we write to increase our risk-adjusted returns. We will continue to pursue business opportunities that are syndicated as well as those where we are the sole or primary reinsurer.
While we expect to establish a diversified portfolio, our allocation of risk will vary based on our perception of the opportunities available in each line of business. Geographically, we do most of our business with insurer and reinsurer clients located in the United States of America, Bermuda, United Kingdom and Europe. The majority of our exposure emanates from the United States of America, United Kingdom and Europe. Moreover, our appetite for certain lines will fluctuate based upon market conditions and we may only offer or underwrite a limited range of lines in any given period. We intend to:
|
•
|
target markets where capacity and alternatives are underserved or capacity constrained;
|
|
•
|
employ strict underwriting discipline, while assembling a portfolio of diversified risks;
|
|
•
|
select reinsurance opportunities with expected favorable economics over the life of the contract; and
|
|
•
|
potentially offer lines and geographies that are not identified in this Form 10-K.
|
6
Through
December 31, 2018
, we wrote reinsurance contracts covering the following product lines:
Property
This line of business primarily consists of homeowners’ and commercial reinsurance coverage. We also provide proportional and excess of loss reinsurance that has greater potential volatility, but with commensurately larger expected margins. With respect to risk aggregations, we seek to manage volatility via portfolio construction and client selection.
Homeowners’
Homeowners’ reinsurance coverage combines various personal insurance protections, which can include losses occurring to one’s home, their contents, loss of use (including additional living expenses), or loss of other personal possessions of the homeowner, as well as liability insurance for accidents that may happen at covered homes or at the hands of the homeowners.
Commercial
Commercial property coverage protects physical assets, including building structure and contents, from perils including fire, explosion, theft and catastrophic risks, such as hurricane, earthquake and flood. Commercial property reinsurance can include large commercial risks, such as office buildings, small commercial risks such as garden apartments, and highly technical or engineered risks, such as oil refineries.
We provide property reinsurance in numerous forms covering both homeowners and commercial risks. Our proportional reinsurance that is structured to provide surplus relief generally covers homeowners and small commercial risks and are structured on a basis that limits the amount of catastrophic losses that can be recovered.
Workers’ Compensation
Workers’ compensation reinsurance provides wage replacement and medical benefits to employees injured in the course of employment in exchange for the mandatory relinquishment of the employee’s right to sue the employer for negligence. While plans differ among jurisdictions, provisions can be made for payments in place of wages (functioning as a form of disability insurance), compensation for economic loss (past and future), reimbursement or payment of medical and like expenses (functioning as a form of health insurance), and benefits payable to dependents of workers killed during employment (functioning as a form of life insurance). General damages for pain and suffering and punitive damages for employer negligence are not generally available in workers’ compensation plans. Our approach to workers’ compensation is very selective and targets insurance companies that are very specialized within the workers’ compensation line and geographically focused. We offer both proportional and excess of loss reinsurance covering workers’ compensation risks and manage the volatility of this line of business by capping our per occurrence exposures.
Auto
Personal automobile insurance is purchased for individually owned or leased cars designed to provide the insured with financial protection against bodily injury or physical damage resulting from traffic accidents and against liability that could arise from such occurrences. In addition, automobile insurance may offer financial protection against theft or damage of the vehicle from incidents other than collisions. In the United States, each state has different rules and regulations in place for compulsory coverage and the specific terms of automobile insurance policies will vary from company to company. In the United States, we generally focus on providing proportional reinsurance to small, single state and regional carriers that specialize in minimum financial responsibility limits required by their respective states. This business is often referred to as “non-standard” automobile business and was historically underserved by standard markets. More recently, however, standard companies have expanded their appetite for such business and it is written by a broad range of carriers. Outside of the United States, we also focus on the “non-standard” personal automobile segment in the United Kingdom. We have also seen an increase in opportunities that use technology platforms to gain market share in the standard automobile insurance market in the United States. We believe this sector will continue to grow, but we approach these opportunities with caution as there are often significant start-up operational risks that can manifest in poor early underwriting results. When we elect to pursue these opportunities, we try to take a leading role in structuring and incorporate features that attempt to limit losses resulting from start-up risk while building optionality for future reinsurance if, and when, these businesses become successful.
7
Like personal automobile insurance, commercial automobile insurance provides the insured with financial protection against bodily injury or physical damage to the automobile resulting from traffic accidents and against liability that could arise from such occurrences. It is purchased by businesses and provides financial protection for the insured business’ vehicles and drivers. While we have written minimal amounts of commercial automobile liability reinsurance to date, we have seen an increase in potential opportunities in the United States due to market dislocation.
Other Casualty
Our Other Casualty line of business is comprised of casualty contracts exposed to more than one type of casualty risk. We write primarily proportional reinsurance in this sector, though we also provide excess of loss coverage. Typically, Other Casualty includes the following lines of business:
Professional Liability
Professional liability is a form of liability reinsurance that helps protect professional advisors and service-providing individuals and companies from bearing the full cost of defending against a negligence claim made by a client and damages awarded in a civil lawsuit. The coverage primarily addresses alleged failure to perform on the part of, financial loss caused by, and error or omission in the service provided by the policyholder. These are potential causes for legal action that would not be covered by a basic general liability reinsurance policy, which addresses more direct forms of harm. The broad category of professional liability reinsurance includes the specific products of errors and omissions (“E&O”), directors and officers coverage (“D&O”), as well as several other products such as transactional liability insurance.
E&O coverage protects the insured against liability for committing inadequate work or negligent actions in performance of their professional duties. Generally, such policies are designed to cover financial losses rather than liability for bodily injury and property damage. E&O coverage was historically purchased by individuals with professional designations such as doctors, lawyers, architects, and engineers, but more recently other professions also purchase E&O coverage.
D&O coverage insures the legal liability of the individual directors and officers of the insured company for certain errors and omissions committed by them. In certain circumstances in which the insured company is not legally permitted to indemnify its directors or officers for a covered loss, the policy’s D&O coverage provides for insurance payments to be made directly to the directors or officers. Conversely, if the insured company indemnifies its directors or officers for their loss, the policy’s D&O coverage reimburses the insured company for those indemnification payments. In this way, the coverage insures against the insured company’s own “indemnification risk.”
There are two types of coverages available in professional liability insurance: occurrence and claims-made. An occurrence policy protects the insured from any covered incident that “occurs” during the policy period, regardless of when a claim is filed. An occurrence policy protects the insured from claims that are made even after the policy has been canceled, so long as the incident occurred during the period in which coverage was in effect. Claims-made policies provide coverage for claims only when a claim is reported during the period the policy is actually in force. Claims-made policies provide coverage so long as the insured continues to pay premiums for the initial policy and any subsequent renewals. A claims-made policy will cover claims after the coverage period only if the insured purchases extended reporting period or “tail” coverage.
Professional liability coverage is usually (but not always) written under a claims-made coverage form, and includes a duty to defend a lawsuit seeking damages covered by the policy.
Transactional Liability
Transactional liability coverage provides a solution for lowering risk for specific merger and acquisition transactions. The most common type of transactional liability insurance is representations and warranties liability insurance. Our exposure to this line is primarily from proportional reinsurance contracts with market professionals in this segment.
General Liability
General liability insurance policies are issued to business organizations to protect them against liability claims for bodily injury and property damage arising out of premises, operations, products, and completed operations. The premises
8
and operations portion of the coverage includes liability for injury or damage arising out of the insured's premises or out of the insured's business operations while such operations are in progress. The products and completed operations portion of the coverage includes liability arising out of the insured's products or business operations conducted away from the insured's premises once those operations have been completed or abandoned. The standard general liability policy also covers advertising and personal injury liability. These coverages include a duty to defend a lawsuit seeking damages covered by the policy.
Credit & Financial Lines
Credit & Financial Lines predominantly comprises reinsurance of mortgage insurance. Mortgage insurance is an insurance policy that compensates lenders or investors for losses arising from the default of a mortgage loan. Mortgage insurance can refer to private mortgage insurance (“PMI”), mortgage life insurance or mortgage title insurance. We focus on PMI, which is normally required by lenders when a borrower’s down payment or equity is less than 20% of the loan value. Not all lenders will require PMI but those that follow the Fannie Mae and Freddie Mac guidelines for home loan approval require PMI. As well as reinsuring private mortgage insurers in the United States, we assume exposure to the credit risk sharing transactions from Fannie Mae and Freddie Mac both directly and by retrocession. We also write international mortgage reinsurance. In addition to mortgage reinsurance, policies classified as Credit & Financial Lines may include political risk, trade credit, surety, financial guarantee, residual value insurance and title insurance.
Other Specialty
The principal lines of business included in our other specialty line is comprised of:
Marine
- covers damage to or losses of marine vessels and cargo, third-party liability for marine accidents and physical loss and liability from principally offshore energy properties. Coverage includes marine liability cover mainly related to the liabilities of ship-owners and port operators, including reinsurance of Protection and Indemnity Clubs (“P&I Clubs”).
Travel insurance
- covers medical expenses, trip cancellation costs, lost luggage, flight accident and other losses incurred while traveling, either internationally or domestically.
Extended warranty insurance -
compensates individuals or businesses for correction or repair necessary as a result of mechanical or electrical breakdown. Our reinsurance contracts cover motor vehicles, vans, trucks, construction equipment, consumer electronics, and agricultural equipment, and the coverage varies according to the product, the age and the usage. We currently write a limited amount of this coverage on a stand-alone basis and most of our exposure to this line of business emanates from multi-line contracts. The insurance is offered on a multi-year basis, generally with a maximum period of three years on risk, and can cover either new units after a period of warranty offered by the manufacturer or used units once the manufacturer’s warranty has expired. To date, all of the extended warranty insurance business we have written excludes manufacturer defect and product recall.
Multi-line
Multi-line reinsurance is reinsurance of an underlying portfolio of several different types of insurance risks. We focus on multi-line reinsurance opportunities where we have expertise in the underlying lines of business or where the terms and conditions of the reinsurance contract minimize the volatility of the more difficult to analyze classes of business in the portfolio. Contracts that cover more than one line of business will be designated as multi-line even if a portion of the underlying business is covered by one of the lines of business listed above. These opportunities can be structured on both a proportional and excess of loss basis.
9
Retroactive Reinsurance Contracts
Retroactive reinsurance contracts consist of loss portfolio transfers, adverse development covers and other forms of reserve reinsurance providing indemnification of loss and loss adjustment expense reserves with respect to past loss events. These contracts can include one or multiple lines of business and cover the potential for changes in estimates of loss and loss adjustment expense reserves related to loss events that have occurred in the past.
Marketing
The majority of our business is sourced through reinsurance brokers. Broker distribution channels provide us with access to an efficient, variable cost, global distribution system without the significant time and expense that would be incurred in creating a wholly-owned distribution network. We believe that our financial strength rating, well known and respected management team, and responsive client service enhance our working relationships with clients and brokers.
Our objective is to build long-term relationships with senior individuals at reinsurance brokers and with our clients. We meet frequently with brokers, senior representatives of existing clients and prospective clients, and encourage clients to visit our executive offices in order to help distinguish us and to develop mutually beneficial understandings of our respective businesses. As evidenced by rates of submission flow, open dialogue, and successful closing of targeted accounts, we believe we have successfully leveraged the underwriting experience and relationships of our management team. Reinsurance brokers receive a brokerage commission that is usually a percentage of gross premiums written. We seek to become the first choice of brokers and clients by providing:
|
•
|
creative solutions that address the specific business needs of our clients;
|
|
•
|
rapid and substantive responses to structuring and pricing quote requests;
|
|
•
|
financial security; and
|
|
•
|
clear indication of risks we will and will not underwrite.
|
See
Note 24
to our consolidated financial statements included elsewhere in this Annual Report for a breakdown of our premiums written by source that individually contributed more than 10% of total gross premiums written.
We believe that the number of brokers with whom we do business will continue to expand over time, and by maintaining close working relationships with brokers, we are able to increase our chances of successfully growing and accessing a broader range of potential clients.
Underwriting
We have established a team of senior underwriters and actuaries to develop and manage our reinsurance business. We believe that their experience, industry presence and long-standing relationships will allow us to tailor our portfolio to specific market segments. Our approach to underwriting will allow us to deploy our capital in a variety of lines of business and to capitalize on opportunities that we believe offer favorable returns on equity over the long term. Our underwriters and actuaries have expertise in a number of lines of business and we will also look to outside consultants to help us with niche areas of expertise when we deem it appropriate. While our pricing and risk selection decisions are based primarily on our view of underwriting profit, we also consider investment income, where applicable and appropriate, in our underwriting and pricing of business.
We generally apply the following underwriting management principles:
Team Approach
Each submission is assigned to an underwriter. If the program meets our underwriting criteria, the underwriter and pricing actuary evaluate the opportunity, determine the optimal structure where applicable, and price the deal. When capital is committed to any transaction, the underwriting team creates a deal analysis memorandum that highlights the key components of the proposed transaction and presents the proposed transaction to a senior group of staff including our senior executives and representatives of the underwriting, actuarial and finance teams. This group must agree that the transaction meets or exceeds our profitability expectations and requirements before we submit a binding proposal.
10
Actuarial Pricing
We have developed proprietary actuarial models and also use several commercially available tools to assist in pricing our business. Our analysis considers the data and information provided by the potential cedent as well as relevant industry data, where appropriate. We use this cedent specific and industry data to develop our own point estimate of the expected losses under each potential contract. We also use a stochastic model to simulate a distribution of potential loss outcomes and the impact of any contractual features that may exist such as sliding scale ceding commissions or profit commissions.
One key metric that we consider as a result of this process is the expected combined ratio on a particular transaction. We also consider the projected underwriting and economic results, inclusive of the opportunity cost of posting collateral, at various confidence levels with a specific focus on the likelihood and magnitude of adverse outcomes. As part of this process, we also specifically review each transaction to determine if there is sufficient risk transfer to qualify for reinsurance accounting. The results of this pricing process are shared with the underwriter on a contract, and if a deal is bound, summary exhibits are attached to a memo summarizing the actuarial pricing analysis that was performed.
Act as Lead Underwriter
Typically, one or two reinsurers will act as the lead or co-lead parties in developing and negotiating treaty pricing, terms and conditions of reinsurance contracts. We act as the lead underwriter for a significant portion of the premium that we underwrite. We believe that lead underwriting is a critically important factor in achieving long-term success, as lead underwriters have greater control of overall economics of their programs. In addition, we believe that reinsurers that lead contracts are generally solicited for a broader range of business and have greater access to attractive risks. However, for most of our excess of loss business, including our property catastrophe portfolio, which is relatively small by market premium standards, we generally act as a following reinsurer on syndicated terms and conditions.
Alignment of Interests
We seek to ensure that the contracts we underwrite align our interests with our clients’ interest. Specifically, we may seek to:
|
•
|
require our clients to maintain a meaningful risk position in their business;
|
|
•
|
pay our clients a commission based upon their actual expenses and offer an additional commission as an incentive based upon profitability;
|
|
•
|
include deficit carry-forward provisions in our multi-year contracts that allows us to potentially offset underwriting losses from one year to the next;
|
|
•
|
seek rights of first refusal on future business where we are providing solutions that help to build or grow a business;
|
|
•
|
charge the client a premium for reinstatement of the amount of reinsurance coverage to the full amount reduced as a result of a reinsurance loss payment, which we refer to as a reinstatement premium;
|
|
•
|
require specific levels of rate increases on the underlying insurance policies; and
|
|
•
|
for the limited number of contracts on which we offer an interest credit on funds we hold, we credit interest income on actual cash received into a notional experience account whereby the experience account is credited to the ceding company at the maturity of the contract if underwriting results are realized as initially expected.
|
We believe these tools help us align our risk with the risk of the client and provide incentive to clients to manage our mutual interests. We also believe that aligning our interests with our client’s interests promotes profitability, accurate reporting of information, timely settling and management of claims, and limits the potential for disputes. Adjustments to profit commissions and other participating features are recorded in our financial statements based on our estimate of losses and the contractual provisions of the reinsurance contract.
Detailed Underwriting Diligence
We employ selective underwriting criteria in the contracts we choose to underwrite and for the contracts we lead or on which we have a material share, we spend a significant amount of time with our clients and brokers to evaluate the
11
risks and appropriately structure the contracts. In the majority of our transactions, as a leading or following reinsurer, we obtain significant amounts of information from our clients to conduct a thorough analysis. As part of our pricing and underwriting process, we assess among other factors:
|
•
|
the client’s and industry historical loss data and current market conditions;
|
|
•
|
the business purpose served by a proposed contract;
|
|
•
|
the client’s pricing and underwriting strategies;
|
|
•
|
the expected duration for claims to fully develop;
|
|
•
|
the geographic areas in which the client is doing business and its market share;
|
|
•
|
the reputation and financial strength of the client;
|
|
•
|
the reputation and expertise of the broker;
|
|
•
|
proposed contract terms and conditions; and
|
|
•
|
reports provided by independent industry specialists.
|
Retrocessional Coverage
Retrocessional coverage consists of reinsurance purchased by a reinsurer from another reinsurer. While our reinsurance portfolio is focused on reinsurance of insurance companies, we also selectively write retrocessional coverage, the majority of which is in our property catastrophe portfolio. We have also historically purchased limited amounts of retrocessional protection to cover a portion of the risks that we reinsure on behalf of our clients. We purchased a small amount of retrocessional coverage in
2018
on specific accounts, and we may continue to do so in the future. From time to time, we consider purchases of retrocessional coverage for one or more of the following reasons: to specifically reduce our property catastrophe exposure in certain reinsurance contracts that we write, to reduce our net liability on individual risks, to obtain additional underwriting capacity and to balance our underwriting portfolio. Additionally, retrocession can be used as a mechanism to share the risks and rewards of business written and therefore can be used as a tool to align our interests with those of our counterparties.
Claims Management
Our claims management process begins upon receipt of periodic contract reports from brokers or clients. These statements are reviewed on an individual basis, evaluated against our expectations and entered in our management system for portfolio analysis and reporting purposes. In addition to analyzing report statements and results, claims audits are performed on specific contracts based on results and management direction to ensure the clients are reporting and reserving their claims accurately and appropriately.
Reserves
On a quarterly basis, our actuaries produce an actuarial central estimate of the gross and net loss reserves for all contracts bound as of the evaluation date. The reserves are calculated on an undiscounted basis with regards to future investment income. The projections also include estimates of loss-sensitive contingent terms such as additional premium features, profit commissions and sliding scale ceding commissions. All calculations are done on a contract-by-contract basis and reflect the most recent premium and loss information provided by our cedents.
In estimating our loss and loss adjustment reserves, it is necessary to project future loss and loss adjustment expense payments. Actual future loss and loss adjustment expenses will not develop exactly as projected and may, in fact, significantly vary from the projections. Further, the projections make no provision for extraordinary future emergence of new classes of losses or types of losses not sufficiently represented in our or the cedent’s historical database or which are not yet quantifiable.
See
Note 9
to our consolidated financial statements included elsewhere in this Annual Report for additional information and details on our loss reserve development.
12
Collateral Arrangements and Letter of Credit Facilities
Neither Third Point Re BDA nor Third Point Re USA is licensed or admitted as an insurer in any jurisdiction other than Bermuda. Many jurisdictions, such as the United States, do not permit clients to take credit for reinsurance on their statutory financial statements if such reinsurance is obtained from unlicensed or non-admitted insurers without appropriate collateral or, in some states, unless they have investment grade financial strength ratings from two recognized rating agencies. Furthermore, certain clients may require that we post collateral in order to meet their counterparty security requirements. As a result, we anticipate that all of our U.S. clients and a portion of our non-U.S. clients will require us to provide collateral for the contracts we bind with them. We expect this collateral to take the form of funds withheld, trust arrangements or letters of credit. As of
December 31, 2018
, we have issued letters of credit totaling
$349.2 million
in favor of clients. The failure to maintain, replace or increase our letter of credit facilities on commercially acceptable terms may significantly and negatively affect our ability to implement our business strategy. See “Risk Factors - Risks Relating to Our Business - Our failure to obtain sufficient letter of credit facilities or to increase our letter of credit capacity on commercially acceptable terms as we grow could significantly and negatively affect our ability to implement our business strategy.”
In addition, we have
$644.8 million
of restricted cash and investments held in trust accounts to secure obligations under certain reinsurance contracts.
See
Note 13
to our consolidated financial statements included elsewhere in this Annual Report for additional information and details on our collateral arrangements and letter of credit facilities.
Competition
The reinsurance industry is highly competitive. We compete with major reinsurers, most of which are well established, have a significant operating history, stronger financial strength ratings, and have developed long-standing client relationships often with a larger breadth of coverage across the property and casualty market in substantially all lines of business. We also compete with smaller companies and other niche reinsurers and a growing number of insurance linked security fund managers. However, we believe that our unique approach to underwriting and extensive relationships allow us to be successful in underwriting transactions against our competitors.
Risk Management
We have developed a comprehensive risk management strategy that is governed by an articulated vision of risk appetite and control that is conveyed throughout the organization and measured in a transparent and consistent manner. Our risk management strategy, metrics and progress are summarized in a report that is presented to the Board of Directors on a quarterly basis. Our internal capital model incorporates statistics from the pricing, reserving and investment processes to produce an estimate of the amount of capital used at set points in time (e.g., each quarter-end) as well as the overall variability in the prospective financial results. We work closely with the risk management personnel of Third Point LLC, our investment manager, to measure and report the variability of results from our investment portfolio. We also monitor the contractual exposure to catastrophic losses as aggregated across all bound reinsurance contracts.
Ratings
Each of our reinsurance subsidiaries has an A- (Excellent) financial strength rating with a stable outlook from A.M. Best, which is the fourth highest of 15 ratings. We believe that a strong rating is a critical factor in the marketing of reinsurance products to clients and brokers. This rating reflects the rating agency’s opinion of our financial strength, operating performance and ability to meet obligations. It is not an evaluation directed toward the protection of investors or a recommendation to buy, sell or hold our common shares.
Change in Investment Account Structure
On July 31, 2018, Third Point Re, Third Point Re BDA and Third Point Re USA entered into the Amended and Restated Exempted Limited Partnership Agreement (the “2018 LPA”) of TP Fund with TP GP and others, effective August 31, 2018. Pursuant to the investment management agreement between Third Point LLC and TP Fund, dated July 31, 2018 as amended and restated on February 28, 2019 (the “TP Fund IMA”), Third Point LLC is the investment manager for TP Fund. In addition, on July 31, 2018, Third Point Re BDA and Third Point Re USA, together the “TPRE Limited
13
Partners” and TP Fund executed a Subscription Agreement pursuant to which the TPRE Limited Partners transferred certain net investment assets and related liabilities (collectively referred to as the “LP Transaction”) from their separate accounts to TP Fund, and TP Fund issued limited partner interests to the TPRE Limited Partners proportionate to and based on the net asset value transferred by each such entity on the applicable transfer date. Certain collateral assets consisting of debt securities and restricted cash were not transferred to TP Fund but are also managed by Third Point LLC under a separate investment management agreement, as discussed below under “Collateral Assets IMA”. Substantially all of the net investment assets were transferred as of September 4, 2018. The Amended and Restated Joint Venture and Investment Management Agreement dated June 22, 2016 between Third Point Re, Third Point Re BDA, Third Point LLC and TP GP and the Amended and Restated Joint Venture and Investment Management Agreement dated June 22, 2016 between Third Point Re USA, Third Point Re (USA) Holdings Inc., Third Point LLC and TP GP (the “
JV Agreements
”) will be terminated on the date that all net investment assets have been transferred to TP Fund under the Subscription Agreement.
The TP Fund investment strategy, as implemented by Third Point LLC, is intended to achieve superior risk-adjusted returns by deploying capital in both long and short investments with favorable risk/reward characteristics across select asset classes, sectors and geographies. Third Point LLC identifies investment opportunities via a bottom-up, value-oriented approach to single security analysis supplemented by a top-down view of portfolio and risk management. Third Point LLC seeks dislocations in certain areas of the capital markets or in the pricing of particular securities and supplements single security analysis with an approach to portfolio construction that includes sizing each investment based on upside/downside calculations, all with a view towards appropriately positioning and managing overall exposures.
On August 30, 2018, Third Point Re BDA and Third Point Re USA entered into a Participation Agreement (“Participation Agreement”) with TP Fund pursuant to which Third Point Re BDA and Third Point Re USA granted to TP Fund all of the rights, benefits, liabilities, duties and obligations of all net investment assets that had not yet been transferred to TP Fund pursuant to the Subscription Agreement as of the effective date. For the net investment assets that were not transferred on September 4, 2018, the TPRE Limited Partners received limited partnership interests in TP Fund in exchange for transferring the rights, benefits, liabilities, duties and obligations for those net investment assets to TP Fund under the Participation Agreement.
As discussed below, on February 28, 2019, we entered into the Second Amended and Restated Exempted Limited Partnership Agreement of TP Fund (the “Amended LPA”), which amended and restated the 2018 LPA (as amended and restated by the Amended LPA, the “LPA”), with effect from January 1, 2019. The Amended LPA updated the terms of the 2018 LPA to reflect (i) a lower management fee, (ii) the right to withdraw specified amounts from TP Fund and immediately invest such amounts in certain other investment vehicles formed by Third Point LLC and (iii) adjustments to the loss carryforward terms. All other material terms of the Amended LPA remain consistent with the 2018 LPA.
JV Agreements
As discussed above, the JV Agreements will be terminated on the date that all net investment assets have been transferred to TP Fund under the Subscription Agreement. Substantially all of the net investment assets have been transferred. For information regarding our previous investment guidelines related to the JV agreements, see the summary provided under “Joint Ventures and Investment Management Agreements” in the Company’s Annual Report on Form 10-K for the year ended December 31, 2017 filed with the SEC on March 1, 2018.
Limited Partnership Agreement
Term
The LPA has a term ending on December 31, 2021, subject to automatic renewal for additional successive three-year terms unless a party notifies the other parties in writing on or before the June 22nd prior to the end of a term that it wishes to terminate such LPA at the end of such term.
Term and Termination Rights
The LPA shall continue until the first of the following events to occur: (1) at any time, upon the written consent of the TPRE Limited Partners and TP GP, (2) within sixty days of the dissolution, entry of an order for relief or filing of a bankruptcy petition withdrawal of TP GP, unless within such days a successor general parent is elected by a majority
14
interest of the limited partners, or (3) subject to the foregoing, any other event causing the mandatory winding up and dissolution of the partnership under the laws of the Cayman Islands.
We may terminate the LPA upon the death, long-term disability or retirement of Daniel S. Loeb, or the occurrence of other circumstances in which Mr. Loeb is no longer directing the investment program of Third Point LLC or actively involved in the day-to-day management of Third Point LLC.
Withdrawal Rights
Under the LPA, we may withdraw our capital accounts in TP Fund in full on December 31, 2021 (the “Withdrawal Date”), and each successive three-year anniversary of such date.
We may withdraw our capital accounts in TP Fund under the LPA prior to the Withdrawal Date at any time following the occurrence of a “Cause Event”, which is defined as:
|
•
|
a violation of applicable law relating to Third Point LLC’s investment related business;
|
|
•
|
Third Point LLC’s fraud, gross negligence, willful misconduct or reckless disregard of its obligations under the LPA;
|
|
•
|
a material breach by the TP Fund GP of the LPA or Third Point LLC of any material breach of the TP Fund IMA, which, in either case, if such breach is reasonably capable of being cured, is not cured within a 15-day period; a conviction or, a plea of guilty or nolo contendere to in the case of Daniel S. Loeb, a felony or a crime involving moral turpitude and, in the case of certain senior officers of Third Point LLC or the TP Fund GP, a felony or crime relating to or adversely affecting the investment-related business of the TP Fund GP or Third Point LLC;
|
|
•
|
a conviction or, a plea of guilty or nolo contendere to a felony or a crime affecting the investment related business of Third Point LLC by certain senior officers of Third Point LLC or the TP Fund GP;
|
|
•
|
any act of fraud, material misappropriation, material dishonesty, embezzlement, or similar conduct by or the TP Fund GP or Third Point LLC relating to the TP Fund GP or Third Point LLC’s investment related business; or
|
|
•
|
a formal administrative or other legal proceeding before the SEC, the U.S. Commodity Futures Trading Commission, the FINRA, or any other U.S. or non-U.S. regulatory or self-regulatory organization against Third Point LLC; or certain key personnel which would likely have a material adverse effect on us.
|
Under the LPA, the TPRE Limited Partners will have the right to withdraw funds weekly from TP Fund to pay claims and expenses as needed, to meet capital adequacy requirements and to satisfy financing obligations.
In addition, we may withdraw as a participant under the LPA prior to the Withdrawal Date if the net investment performance of Third Point LLC has (a) (i) incurred a loss in two successive calendar years and (ii) underperformed the S&P 500 Index by at least 14 percentage points for such two successive calendar years, taken as a whole, or (b) (i) incurred a cumulative loss of 14% or more during any 24-month period and (ii) underperformed the S&P 500 Index by at least 21 percentage points for such 24-month period. We may not withdraw or terminate the LPA on the basis of performance other than as provided above.
In addition, pursuant to the Amended LPA, TP GP shall notify us if Third Point LLC or its affiliates (either alone or together with a third party) form certain investment vehicles that pursue an investment strategy primarily comprised of debt or other credit-related investments (the “Permitted Funds”). The Amended LPA permits us to withdraw up to $250.0 million in 2019 and a separate $250.0 million during the period from January 1, 2020 through December 31, 2021 for the purpose of immediately investing such amounts in Permitted Funds.
Performance Allocation
Pursuant to both the
JV Agreements
and the LPA, TP GP receives a performance fee allocation. Prior to the change in the Company’s investment account structure, the performance fee allocation was equal to
20%
of the net investment income of the applicable company’s share of the net investment assets managed by Third Point LLC. As a result of the LPA effective August 31, 2018, the performance fee allocation is equal to
20%
of the net investment income allocated to each limited partner’s capital account in TP Fund.
15
At the end of each fiscal year, the performance allocation will be reallocated to the capital account of TP GP from the capital account of each limited partner, provided that a performance allocation will not be made with respect to such capital account until such capital account has recouped the amount of any unrecouped net capital loss in its loss recovery account (as described below). If a limited partner withdraws all or a portion of its capital other than at the end of a fiscal year, the performance allocation accrued and attributable to the portion withdrawn will be debited against such limited partner’s account and credited to TP GP’s capital account at the time of withdrawal.
Pursuant to both the
JV Agreements
and the 2018 LPA, Third Point LLC is required to maintain a loss recovery account in respect of each Limited Partner. Thereafter, for any fiscal year, the loss recovery account balance shall be the sum of all prior year net loss amounts allocated to the limited partner and not subsequently offset by prior year net profit amounts allocated to such limited partner, provided that the loss recovery account balance shall be reduced proportionately to reflect any withdrawals made by such Limited Partner. TP GP may waive or reduce the performance allocation, in its sole discretion. Third Point LLC and TP GP may elect, at the beginning of each fiscal year, to restructure the performance allocation as a performance fee to Third Point LLC with the same terms as the performance allocation.
The Amended LPA preserves the loss carryforward attributable to our investment in TP Fund when contributions to TP Fund are made within nine months of certain types of withdrawals from TP Fund.
Management Fee
Pursuant to both the
JV Agreements
and the LPA, Third Point LLC is entitled to receive monthly management fees. Prior to the change in the Company’s investment account structure, management fees were calculated based on
1.5%
, (
2.0%
up to December 22, 2016), of net investments managed by Third Point LLC. As a result of the 2018 LPA effective August 31, 2018, management fees were charged at the TP Fund level and were calculated based on
1.5%
of the investment in TP Fund and multiplied by an exposure multiplier computed by dividing the average daily investment exposure leverage of the TP Fund by the average daily investment exposure leverage of the Third Point Offshore Master Fund L.P. (“Offshore Master Fund”). The Amended LPA revised the management fee from
1.5%
per annum to 1.25% per annum effective from January 1, 2019. Third Point LLC also serves as the investment manager for the Offshore Master Fund.
Most Favored Nation
In the event that Third Point LLC agrees terms with any existing or future investor wherein the asset-based fees or performance-based compensation that are equal to or more favorable to such investor, Third Point Re BDA and Third Point Re USA, will have the right to receive the benefit of such terms (provided it agrees to be bound by all the terms and conditions associated with such equal or more favorable terms).
Investment Guidelines
In accordance with the investment guidelines under the LPA, the underlying investment portfolio of TP Fund is managed on a basis that is substantially equivalent to Third Point Offshore Master Fund L.P., which is managed by Third Point LLC, but with increased exposures through the use of additional financial leverage. The leverage of TP Fund will be managed based on the terms of the LPA to generally target a “leverage factor” of (a) one and one half times (1.5x) for investments in liquid securities and (b) one time (1x) for investments in illiquid securities and ABS securities, in each case, as determined by TP GP in its sole discretion.
Under the LPA, TP GP is required to cause Third Point LLC to adhere to the following investment guidelines:
|
•
|
Composition of Investments
: at least 60% of the investment portfolio will be held in debt or equity securities (including swaps) of publicly traded companies (or their subsidiaries) and governments of the Organization of Economic Co-operation and Development (“OECD”) high income countries, asset-backed securities, cash, cash equivalents and gold and other precious metals.
|
|
•
|
Concentration of Investments
: other than cash, cash equivalents and U.S. government obligations, TP Fund’s total exposure to any one issuer or entity will constitute no more than 15% (multiplied by the exposure multiplier, the exposure multiplier will be computed by dividing the average of the daily investment exposure
|
16
leverage of TP Fund by the average of the daily investment exposure leverage of Third Point Offshore Master Fund L.P.) of the investment portfolio’s total long exposure.
|
•
|
Liquidity
: the portfolio of TP Fund will be invested in such fashion that the Company have a reasonable expectation that they can meet any of its liabilities as they become due. We review the liquidity of the portfolio on a periodic basis.
|
|
•
|
Net Exposure Limits
: the net position (long positions less short positions) may not exceed 2 times net asset value for more than 10 trading days in any 30-trading day period.
|
Upon written request of Third Point LLC, our senior management may, in exigent circumstances, permit a variation from these guidelines.
See
Note 11
to our consolidated financial statements included elsewhere in this Annual Report for detailed information on management and performance fees.
Collateral Assets IMA
On July 31, 2018, Third Point Re BDA and Third Point Re USA entered into the Collateral Assets IMA, effective August 31, 2018, pursuant to which Third Point LLC serves as investment manager of certain collateral assets that will not be transferred to TP Fund. The Collateral Assets IMA will continue in effect for so long as either Third Point Re BDA or Third Point Re USA remains a limited partner of TP Fund. The collateral assets are presented in the consolidated balance sheets within debt securities and restricted cash and are considered as part of total net investments managed by Third Point LLC.
The Collateral Assets IMA includes provisions limiting liability of Third Point LLC and its affiliates to specified circumstances and providing for indemnification by Third Point Re BDA and Third Point Re USA for certain losses incurred by Third Point LLC and its affiliates. Third Point Re BDA and Third Point Re USA will be responsible for any and all third party expenses incurred by them or on their behalf that are directly attributable to the management of the collateral assets, other than those borne by Third Point LLC. No asset based or performance-based compensation will be paid to Third Point LLC by Third Point Re BDA or Third Point Re USA under the Collateral Assets IMA.
Upon three business days’ prior written notice, Third Point Re BDA and Third Point Re USA may withdraw all or a portion of the collateral assets effective as of any calendar month end or on the close of business on each Wednesday during a month.
Investments
Investment Strategy
Third Point LLC has the contractual right to manage substantially all of our investable assets until December 31, 2021, subject to certain extension and termination rights described above, and is required to follow our investment guidelines described above and to act in a manner that is fair and equitable in allocating investment opportunities to us. However, it is not otherwise restricted with respect to the nature or timing of making investments for our accounts. We have the contractual right to withdraw funds from our managed accounts to pay claims and expenses as needed.
17
Investment Portfolio
The following tables present the total long, short and net exposure of our net investments managed by Third Point LLC as of December 31, 2018 and 2017 by strategy and geography. The tables as of December 31, 2018 include our investments in TP Fund and collateral assets managed by Third Point LLC. The tables as of December 31, 2017 include collateral assets managed by Third Point LLC and our investments in the separate accounts in place prior to the change in the investment account structure described in Note 4 to the consolidated financial statements included in this Form 10-K.
|
|
2018
|
2017
|
|||||||||||||||
|
|
Long
|
Short
|
Net
|
Long
|
Short
|
Net
|
|||||||||||
|
Long/Short Equity
|
|
|
|
|
|
|
|||||||||||
|
Consumer
|
13
|
%
|
(3
|
)%
|
10
|
%
|
18
|
%
|
(5
|
)%
|
13
|
%
|
|||||
|
Energy & Utility
|
2
|
%
|
—
|
%
|
2
|
%
|
6
|
%
|
(2
|
)%
|
4
|
%
|
|||||
|
Financial
|
7
|
%
|
(2
|
)%
|
5
|
%
|
15
|
%
|
(3
|
)%
|
12
|
%
|
|||||
|
Healthcare
|
15
|
%
|
(1
|
)%
|
14
|
%
|
14
|
%
|
(2
|
)%
|
12
|
%
|
|||||
|
Industries & Commodities
|
12
|
%
|
(6
|
)%
|
6
|
%
|
28
|
%
|
(4
|
)%
|
24
|
%
|
|||||
|
Technology, Media and Telecommunications
|
2
|
%
|
(4
|
)%
|
(2
|
)%
|
14
|
%
|
—
|
%
|
14
|
%
|
|||||
|
Market Hedges
|
3
|
%
|
(6
|
)%
|
(3
|
)%
|
3
|
%
|
(9
|
)%
|
(6
|
)%
|
|||||
|
Total Long/Short Equity
|
54
|
%
|
(22
|
)%
|
32
|
%
|
98
|
%
|
(25
|
)%
|
73
|
%
|
|||||
|
Credit
|
|||||||||||||||||
|
Distressed
|
2
|
%
|
—
|
%
|
2
|
%
|
2
|
%
|
—
|
%
|
2
|
%
|
|||||
|
Performing
|
2
|
%
|
—
|
%
|
2
|
%
|
2
|
%
|
(1
|
)%
|
1
|
%
|
|||||
|
Government
|
5
|
%
|
(2
|
)%
|
3
|
%
|
2
|
%
|
—
|
%
|
2
|
%
|
|||||
|
Asset Backed Securities (1)
|
9
|
%
|
(2
|
)%
|
7
|
%
|
10
|
%
|
(3
|
)%
|
7
|
%
|
|||||
|
Total Credit
|
18
|
%
|
(4
|
)%
|
14
|
%
|
16
|
%
|
(4
|
)%
|
12
|
%
|
|||||
|
Other
|
|||||||||||||||||
|
Risk Arbitrage
|
2
|
%
|
(1
|
)%
|
1
|
%
|
7
|
%
|
(2
|
)%
|
5
|
%
|
|||||
|
Private (2)
|
7
|
%
|
—
|
%
|
7
|
%
|
3
|
%
|
—
|
%
|
3
|
%
|
|||||
|
Total Other
|
9
|
%
|
(1
|
)%
|
8
|
%
|
10
|
%
|
|
(2
|
)%
|
|
8
|
%
|
|||
|
81
|
%
|
(27
|
)%
|
54
|
%
|
124
|
%
|
(31
|
)%
|
93
|
%
|
||||||
(1) Includes residential mortgage-backed securities, commercial mortgage-backed securities and related indices.
(2) Prior to the change in investment account structure, private included securities approved for purchase by the Investment and Finance Committee in accordance with the investment guidelines.
|
2018
|
2017
|
||||||||||||||||
|
Long
|
Short
|
Net
|
Long
|
Short
|
Net
|
||||||||||||
|
Americas
|
70
|
%
|
(21
|
)%
|
49
|
%
|
93
|
%
|
(29
|
)%
|
64
|
%
|
|||||
|
Europe, Middle East and Africa
|
11
|
%
|
(3
|
)%
|
8
|
%
|
7
|
%
|
—
|
%
|
7
|
%
|
|||||
|
Asia
|
—
|
%
|
(3
|
)%
|
(3
|
)%
|
24
|
%
|
(2
|
)%
|
22
|
%
|
|||||
|
81
|
%
|
(27
|
)%
|
54
|
%
|
124
|
%
|
(31
|
)%
|
93
|
%
|
||||||
In managing TP Fund’s investment portfolio, Third Point LLC assigns every investment position a sector, strategy and geographic category. The dollar exposure of each position under each category is aggregated and the exposure percentages listed in the exposure table represent the aggregate market exposure of a given category against the total net asset value of the consolidated account. Long and short exposure percentages represent the aggregate relative value of all long and short positions in a given category, respectively. Net exposure represents the short exposure subtracted from the long exposure in a given category. Third Point LLC reports the composition of TP Fund’s total managed portfolio on a market exposure basis, which it believes is the appropriate manner in which to assess the exposure and profile of investments and is the way in which it manages the portfolio. Under this methodology, the exposure for equity swaps and futures contracts are reported at their full notional amount. The notional amount of any derivative contract
18
is the underlying value upon which payment obligations are computed. For an equity total return swap, for example, the notional amount is the number of shares underlying the swap multiplied by the market price of those shares. Options are reported at their delta adjusted basis. The delta of an option is the sensitivity of the option price to the underlying stock price. The delta adjusted basis is the number of shares underlying the option multiplied by the delta and the underlying stock price. Credit derivatives are reported in accordance with their equivalent underlying security exposure. Cash and cash equivalents are excluded from exposure calculations.
Investment Returns
The following is a summary of the net investment return by investment strategy on investments managed by Third Point LLC for the years ended
December 31, 2018
,
2017
and
2016
(1)
. The net investment return includes our investment accounts, inclusive of collateral assets managed by Third Point LLC, prior to August 31, 2018, the date of the change in the investment account structure described in Note 4 to our consolidated financial statements included elsewhere in this Annual Report, and our investment in TP Fund and collateral assets managed by Third Point LLC from the date of the transition.
|
2018
|
2017
|
2016
|
||||||||||||||||||||||||
|
Long
|
Short
|
Net
|
Long
|
Short
|
Net
|
Long
|
Short
|
Net
|
||||||||||||||||||
|
Equity
|
(8.7
|
)%
|
0.1
|
%
|
(8.6
|
)%
|
21.5
|
%
|
(4.6
|
)%
|
16.9
|
%
|
1.5
|
%
|
(2.9
|
)%
|
(1.4
|
)%
|
||||||||
|
Credit
|
—
|
%
|
(0.2
|
)%
|
(0.2
|
)%
|
0.7
|
%
|
(0.6
|
)%
|
0.1
|
%
|
6.4
|
%
|
(0.4
|
)%
|
6.0
|
%
|
||||||||
|
Other
|
(2.8
|
)%
|
0.8
|
%
|
(2.0
|
)%
|
1.8
|
%
|
(1.1
|
)%
|
0.7
|
%
|
0.5
|
%
|
(0.9
|
)%
|
(0.4
|
)%
|
||||||||
|
Net investment return on investments managed by Third Point LLC
|
(11.5
|
)%
|
0.7
|
%
|
(10.8
|
)%
|
24.0
|
%
|
(6.3
|
)%
|
17.7
|
%
|
8.4
|
%
|
(4.2
|
)%
|
4.2
|
%
|
||||||||
|
S&P 500 Total Return Index
|
(4.4
|
)%
|
21.8
|
%
|
12.0
|
%
|
||||||||||||||||||||
|
(1)
|
Past performance is not necessarily indicative of future results.
|
See
Note 14
to our consolidated financial statements included elsewhere in this Annual Report for detailed information on net investment income (loss). TP Fund’s investment manager, Third Point LLC, manages several funds and may manage other client accounts besides our and TP Fund’s accounts, some of which have, or may have, objectives and investment portfolio compositions similar to our and TP Fund’s accounts. Because of the similarity or potential similarity of the investment portfolio of TP Fund to other clients of Third Point LLC, and because, as a matter of ordinary course, Third Point LLC provides its clients, including us and TP Fund, and investors in its main hedge funds with results of their respective investment portfolios following the last day of each month, those other clients or investors indirectly may have material nonpublic information regarding the investment portfolio of TP Fund. To address this, and to comply with Regulation FD, we will continue to post on our website under the heading Investment Portfolio Returns located in the Investors section of the website, following the close of trading on the New York Stock Exchange on the last business day of each month, the preliminary monthly investment results of TP Fund for that month, with additional information regarding the monthly investment results of TP Fund to be posted following the close of trading on the New York Stock Exchange on the first business day of the following month.
Investment Regulatory Concerns and Restrictions
Third Point LLC is involved regularly in trading activities that involve a broad number of U.S. and foreign securities law regimes, including laws governing trading on inside information, market manipulation and a broad number of technical trading requirements that involve fundamental market regulation policies. Violation of such laws could result in severe restrictions on Third Point LLC’s activities and, indirectly, damage to TP Fund’s investment portfolio and our and TP Fund’s reputation as the LPA has limited termination provisions.
Third Point LLC’s failure to comply with applicable laws or regulations could result in fines, censure, suspensions of personnel or other sanctions. The regulations that Third Point LLC is subject to are designed primarily to ensure the integrity of the financial markets. They are not designed to protect us or, indirectly, you. Even if a sanction imposed against Third Point LLC or one of its personnel by a regulator was for a small monetary amount, the adverse publicity related to such sanction against Third Point LLC by regulators could harm its reputation and, possibly, ours.
19
In recent years, there has been debate in both the U.S. and foreign governments about new rules or regulations to be applicable to alternative investment advisers, like Third Point LLC.
In August 2007, the SEC adopted a new rule intended to clarify the SEC’s authority to bring enforcement actions against investment advisers for fraud against investors and prospective investors in their funds (as opposed to fraud against the funds themselves). Although we do not believe the SEC’s rule has directly affected us, Third Point LLC and, accordingly, TP Fund’s investment strategy, may be adversely affected if new or revised legislation or regulations are enacted or by changes to existing rules and regulations of U.S. or foreign governmental regulatory authorities or self-regulatory organizations that supervise the financial markets.
It is possible that increased regulation of alternative investment advisers could adversely affect Third Point LLC’s ability to manage TP Fund’s investment portfolio or its ability to manage TP Fund’s portfolio pursuant to our existing investment strategy, which could cause us to alter our existing investment strategy and could significantly and negatively affect our business and results of operations. In addition, adverse publicity regarding alternative investment strategies generally, or Third Point LLC or its affiliates specifically, could negatively affect our business reputation and attractiveness as a counterparty to brokers and clients.
Other Trading Restrictions
Third Point LLC may from time to time place it or its affiliates’ representatives on creditors committees or boards of certain companies in which our portfolio is invested. While such representation may enable Third Point LLC to enhance the value of our and TP Fund’s investments, it may place trading restrictions on certain securities included in TP Fund’s investment portfolio.
Regulation
Third Point Re BDA and Third Point Re USA are licensed in Bermuda to write reinsurance and are not admitted to do business in any jurisdiction in the United States or in any country other than Bermuda. The insurance laws of each state of the United States and of many foreign countries regulate the sale of insurance and reinsurance within their jurisdictions by alien insurers and reinsurers, such as Third Point Re BDA and Third Point Re USA.
Third Point Re BDA and Third Point Re USA currently intend to conduct their business so as not to be subject to the licensing requirements of insurance regulators in the United States or elsewhere (other than Bermuda). Many aspects of the activities of Third Point Re BDA and Third Point Re USA are similar to those employed by other non-admitted reinsurers that provide reinsurance to U.S. and other ceding companies. There can be no assurance, however, that insurance regulators in the United States or elsewhere will not review the activities of Third Point Re BDA or Third Point Re USA and claim that Third Point Re BDA or Third Point Re USA is subject to such jurisdiction’s licensing requirements.
The Insurance Act of 1978
The Insurance Act of 1978, as amended, and related regulations of Bermuda (the “Insurance Act”), which regulates the insurance business of Third Point Re BDA and Third Point Re USA, provides that no person shall carry on any insurance business in or from within Bermuda unless registered as an insurer under the Insurance Act by the Bermuda Monetary Authority (“BMA”). Third Point Re BDA and Third Point Re USA are each registered as Class 4 insurers under the Insurance Act. Class 4 insurers are required to maintain fully paid-up share capital of $1,000,000. Certain significant aspects of the Bermuda insurance regulatory framework are set forth below.
Annual Financial Statements
As Class 4 insurers, Third Point Re BDA and Third Point Re USA must prepare and submit, on an annual basis, both audited U.S. GAAP and statutory financial statements as prescribed by the Insurance Act.
20
Declaration of Compliance
Third Point Re BDA and Third Point Re USA, at the time of filing their statutory financial statements, will also be required to deliver to the BMA a declaration of compliance, in such form and with such content as may be prescribed by the BMA.
Annual Statutory Financial Return and Annual Capital and Solvency Return
Third Point Re BDA and Third Point Re USA, as Class 4 insurers, are required to file with the BMA a statutory financial return. The statutory financial return includes, among other matters, the statutory financial statements and the calculations for the Class 4 insurer’s minimum solvency margin and liquidity ratio.
In addition, each year Third Point Re BDA and Third Point Re USA, as Class 4 insurers, are also required to file with the BMA a capital and solvency return along with their annual financial statutory returns. The prescribed form of capital and solvency return comprises the insurer’s Bermuda Solvency Capital Requirement (“BSCR”) model or an approved internal capital model in lieu thereof (more fully described below), various schedules, a statutory economic balance sheet and the opinion of the loss reserve specialist.
Quarterly Financial Statements
Third Point Re BDA and Third Point Re USA, as Class 4 insurers are each required to prepare and file quarterly financial returns with the BMA on or before the last day of the months of May, August and November of each year.
Public Disclosures
Third Point Re BDA and Third Point Re USA, as Class 4, insurers are each required to prepare and file with the BMA, and also publish on their website, a financial condition report. The BMA has discretion to approve modifications and exemptions to the public disclosure rules, on application by the insurer if, among other things, the BMA is satisfied that the disclosure of certain information will result in a competitive disadvantage or compromise confidentiality obligations of the insurer.
Non-insurance Business
Third Point Re BDA and Third Point Re USA, as Class 4 insurers may not engage in non-insurance business unless that non-insurance business is ancillary to their core insurance business.
Minimum Liquidity Ratio
The Insurance Act provides a minimum liquidity ratio for general business. As an insurer engaged in general business, Third Point Re BDA and Third Point Re USA are each required to maintain the value of their relevant assets at not less than 75% of the amount of their relevant liabilities. Relevant assets include cash and time deposits, quoted investments, unquoted bonds and debentures, first liens on real estate, investment income due and accrued, accounts and premiums receivable, reinsurance balances receivable, funds held by ceding reinsurers and any other assets which the BMA, on application in any particular case made to it with reasons, accepts in that case.There are certain categories of assets that, unless specifically permitted by the BMA, do not automatically qualify as relevant assets, such as unquoted equity securities, investments in and advances to affiliates and real estate and collateral loans.The relevant liabilities are total general business insurance reserves and total other liabilities less deferred income taxes and letters of credit, guarantees and other instruments.
Minimum Solvency Margin and Enhanced Capital Requirements
The Insurance Act provides that the value of the statutory assets of an insurer must exceed the value of its statutory liabilities by an amount greater than its prescribed minimum solvency margin (the “MSM”).The MSM that must be maintained by a Class 4 insurer with respect to its general business is the greater of (i) $100 million, or (ii) 50% of net premium written (with a credit for reinsurance ceded not exceeding 25% of gross premiums) or (iii) 15% of net loss and loss expense provisions and other insurance reserves; or (iv) 25% of the ECR (as defined below) as reported at the end of the relevant year.
21
Class 4 insurers are also required to maintain available statutory economic capital and surplus at a level equal to or in excess of its enhanced capital requirement (“ECR”), which is established by reference to either the BSCR model or an approved internal capital model. The BMA has also implemented the economic balance sheet (“EBS”) framework, which is used as the basis to determine an insurer’s ECR. Under the new framework, assets and liabilities are mainly assessed and included on the EBS at fair value, with the insurer’s U.S. GAAP balance sheet serving as a starting point. The model also requires insurers to estimate insurance technical provisions, which consist of the insurer’s insurance related balances valued based on best-estimate cash flows, adjusted to reflect the time value of money using a risk-free discount rate, with the addition of a risk margin to reflect the uncertainty in the underlying cash flows.
The BSCR model is a risk-based capital model which provides a method for determining a Class 4 insurer’s capital requirements (statutory economic capital and surplus) by taking into account the risk characteristics of different aspects of the Class 4 insurer’s business.
While not specifically referred to in the Insurance Act, the BMA has also established a target capital level (“TCL”) for each Class 4 insurer equal to 120% of its ECR. While a Class 4 insurer is not currently required to maintain its statutory capital and surplus at this level, the TCL serves as an early warning tool for the BMA and failure to maintain statutory capital at least equal to the TCL will likely result in increased regulatory oversight.
Eligible Capital
To enable the BMA to better assess the quality of the insurer’s capital resources, a Class 4 insurer is required to disclose the makeup of its capital in accordance with the recently introduced ‘3-tiered capital system’. Under this system, all of the insurer’s capital instruments will be classified as either basic or ancillary capital, which in turn will be classified into one of 3 tiers based on their “loss absorbency” characteristics. Under this regime, up to certain specified percentages of Tier 1, Tier 2 and Tier 3 Capital may be used to support the insurer’s MSM, ECR and TCL.
Insurance Code of Conduct
Every Bermuda registered insurer must comply with the Insurance Code of Conduct, which prescribes duties, standards, procedures and sound business principles to ensure sound corporate governance, risk management and internal controls are implemented by the relevant insurer. The BMA will assess an insurer's compliance with the Insurance Code of Conduct in a proportionate manner relative to the nature, scale and complexity of its business. Failure to comply with the requirements under the Insurance Code of Conduct will be a factor taken into account by the BMA in determining whether an insurer is conducting its business in a sound and prudent manner as prescribed by the Insurance Act. Such failure to comply with the requirements of the Insurance Code of Conduct could result in the BMA exercising its powers of intervention and investigation and will be a factor in calculating the operational risk charge applicable in accordance with the insurer's BSCR model or approved internal model.
Restrictions on Dividends and Distributions
A Class 4 insurer is prohibited from declaring or paying a dividend if it is in breach of its MSM, ECR or minimum liquidity ratio or if the declaration or payment of such dividend would cause such a breach. Where an insurer fails to meet its MSM or minimum liquidity ratio on the last day of any financial year, it is prohibited from declaring or paying any dividends during the next financial year without the approval of the BMA.
In addition, a Class 4 insurer is prohibited from declaring or paying in any financial year dividends of more than 25% of its total statutory capital and surplus (as shown on its previous financial year’s statutory balance sheet) unless it files (at least seven days before payment of such dividends) with the BMA an affidavit signed by at least two directors (one of whom must be a Bermuda resident director if any of the insurer’s directors are resident in Bermuda) and the principal representative stating that it will continue to meet its solvency margin and minimum liquidity ratio. Where such an affidavit is filed, it shall be available for public inspection at the offices of the BMA.
Reduction of Capital
Neither Third Point Re BDA nor Third Point Re USA, as general business insurers, may reduce its total statutory capital by 15% or more, as set out in their respective previous year’s financial statements, unless it has received the prior approval of the BMA. Total statutory capital consists of the insurer’s paid in share capital, its contributed surplus
22
(sometimes called additional paid in capital) and any other fixed capital designated by the BMA as statutory capital (such as letters of credit).
Fit and Proper Controllers
The BMA maintains supervision over the controllers of all registered insurers in Bermuda. A controller includes (i) the managing director of the registered insurer or its parent company; (ii) the chief executive of the registered insurer or of its parent company; (iii) a shareholder controller; and, (iv) any person in accordance with whose directions or instructions the directors of the registered insurer or of its parent company are accustomed to act.
The definition of shareholder controller is set out in the Insurance Act but generally refers to (i) a person who holds 10% or more of the shares carrying rights to vote at a shareholders’ meeting of the registered insurer or its parent company, or (ii) a person who is entitled to exercise 10% or more of the voting power at any shareholders’ meeting of such registered insurer or its parent company, or (iii) a person who is able to exercise significant influence over the management of the registered insurer or its parent company by virtue of its shareholding or its entitlement to exercise, or control the exercise of, the voting power at any shareholders’ meeting.
A shareholder controller that owns 10% or more but less than 20% of the shares as described above is defined as a 10% shareholder controller; a shareholder controller that owns 20% or more but less than 33% of the shares as described above is defined as a 20% shareholder controller; a shareholder controller that owns 33% or more but less than 50% of the shares as described above is defined as a 33% shareholder controller; and a shareholder controller that owns 50% or more of the shares as described above is defined as a 50% shareholder controller.
Where the shares of the registered insurer, or the shares of its parent company, are traded on a recognised stock exchange, and such person becomes a 10%, 20%, 33% or 50% shareholder controller of the insurer, that person shall, within 45 days, notify the BMA in writing that he has become such a controller. In addition, a person who is a shareholder controller of a Class 4 insurer whose shares or the shares of its parent company (if any) are traded on a recognised stock exchange must serve on the BMA a notice in writing that he has reduced or disposed of his holding in the insurer where the proportion of voting rights in the insurer held by him will have reached or has fallen below 10%, 20%, 33% or 50% as the case may be, not later than 45 days after such disposal.
Where the shares of an insurer, or the shares of its parent company, are not traded on a recognised stock exchange (i.e., private companies), the Insurance Act prohibits such person from becoming a shareholder controller unless he has first served on the BMA notice in writing stating that he intends to become such a controller and the BMA has either, before the end of 45 days following the date of notification, provided notice to the proposed controller that it does not object to his becoming such a controller or the full 45 days has elapsed without the BMA filing an objection. In addition, a shareholder controller of Third Point Re BDA or Third Point Re USA is not permitted to reduce or dispose of its holdings such that it will cease to be a 50%, 33%, 20% or 10% shareholder unless that shareholder controller notifies the BMA in writing that it intends to do so.
Notification by Registered Person of Change of Controllers and Officers
All registered insurers are required to give written notice to the BMA of the fact that a person has become, or ceased to be, a controller or officer of the registered insurer within 45 days of becoming aware of such fact.
Notification of Material Changes
All registered insurers are required to give notice to the BMA of their intention to effect a material change within the meaning of the Insurance Act. No registered insurer shall take any steps to give effect to a material change unless it has first served notice on the BMA that it intends to effect such material change and before the end of 30 days, either the BMA has notified such company in writing that it has no objection to such change or that period has lapsed without the BMA having issued a notice of objection.
Supervision, Investigation, Intervention and Disclosure
The BMA may, by notice in writing served on an insurer, require the insurer to provide such information and/or documentation as the BMA may reasonably require with respect to matters that are likely to be material to the
23
performance of its supervisory functions under the Insurance Act. In addition, it may require such person’s auditor, underwriter, accountant or any other person with relevant professional skill of such insurer to prepare a report on any aspect pertaining thereto. If it appears to the BMA to be desirable in the interests of the clients of an insurer, the BMA may also exercise these powers in relation to subsidiaries, parent companies and other affiliates of the insurer or designated insurer.
Disclosure of Information
In addition to powers under the Insurance Act to investigate the affairs of an insurer, the BMA may require certain information from an insurer (or certain other persons) to be produced to the BMA. Further, the BMA has been given powers to assist other regulatory authorities, including foreign insurance regulatory authorities, with their investigations involving insurance and reinsurance companies in Bermuda if it is satisfied that the assistance being requested is in connection with the discharge of regulatory responsibilities and that such cooperation is in the public interest.
Certain Other Bermuda Law Considerations
All Bermuda companies must comply with the provisions of the Companies Act regulating the payment of dividends and making distributions from contributed surplus. A company may not declare or pay a dividend, or make a distribution out of contributed surplus, if there are reasonable grounds for believing that: (i) the company is, or would after the payment be, unable to pay its liabilities as they become due; or (ii) the realizable value of the company’s assets would thereby be less than its liabilities.
United States Insurance Regulation
In addition to the regulatory requirements imposed by the jurisdictions in which they are licensed, reinsurers are subject to indirect regulatory requirements imposed by jurisdictions in which their ceding companies are licensed through the “credit for reinsurance” mechanism. In general, a ceding company that obtains reinsurance from a reinsurer that is licensed, accredited or approved by the jurisdiction or state in which the insurer files statutory financial statements is permitted to reflect in its statutory financial statements a credit in an aggregate amount equal to the liability for unearned premiums and loss reserves and loss adjustment expense reserves ceded to the reinsurer.
In the United States, many states allow credit for reinsurance ceded to a reinsurer that is domiciled and licensed in another state of the United States and meets certain financial requirements. A few states do not allow credit for reinsurance ceded to non-licensed reinsurers except in certain limited circumstances and others impose additional requirements that make it difficult to become accredited. The great majority of states, however, permit the reduction in statutory surplus resulting from reinsurance obtained from a non-licensed or non-accredited reinsurer to be offset to the extent that the reinsurer provides a letter of credit or other acceptable security arrangement, and a few states reduce the amount of security to be posted based on a number of factors, including the credit rating given to a reinsurer from a U.S. nationally recognized statistical rating organization.
Information Technology
We have a disaster recovery plan with respect to our information technology infrastructure that includes arrangements with an offshore data center. Our off-island location for data systems back-up and recovery is located in Halifax, Canada, providing a remote site that we believe is unlikely to be subject to the same disaster events that might impair our operations in Bermuda. The disaster recovery environment is configured to provide near real-time backup for key systems to minimize the amount of time needed to restore data following a disaster scenario and support the necessary business capabilities of our Bermuda and U.S. operations.
Employees
As of
December 31, 2018
, we had 31 employees, 20 of whom were based in Bermuda, 10 of whom were based in the United States and 1 of whom was based in the United Kingdom. We believe that our employee relations are good. None of our employees are subject to collective bargaining agreements, and we are not aware of any current efforts to implement such agreements.
24
Available Information
Third Point Re files annual, quarterly and current reports and other information with the SEC. The SEC maintains an Internet website (
www.sec.gov
) that contains reports, proxy and information statements and other information regarding registrants that file electronically with the SEC, including us. You may also access, free of charge, our reports filed with the SEC (for example, our Annual Report on Form 10-K, our Quarterly Reports on Form 10-Q and our Current Reports on Form 8-K and any amendments to those forms) through the “Investors” portion of our Internet website (
www.thirdpointre.bm
). Reports filed with or furnished to the SEC will be available as soon as reasonably practicable after they are filed with or furnished to the SEC. We also make available, free of charge from our website, our Code of Business Conduct and Ethics, Corporate Governance Guidelines, Audit Committee Charter, Compensation Committee Charter, Governance and Nominating Committee Charter, and Board of Directors Communications Policy. Such information is available to print for any shareholder who sends a request to Third Point Reinsurance Ltd., Attn: Office of the Corporate Secretary, 3 Waterloo Lane, Pembroke, Bermuda, HM08.
Our website is included in this Annual Report as an inactive textual reference only. The information found on our website is not part of this or any other report filed with or furnished to the SEC.
Third Point Re has fully and unconditionally guaranteed the debt securities issued by TPRUSA in February 2015; as a result no separate filings are made by TPRUSA with the SEC. See
Note 27
to our consolidated financial statements included elsewhere in this Annual Report for additional information regarding TPRUSA.
Item 1A. Risk Factors
You should consider and read carefully all of the risks and uncertainties described below, as well as other information included in this Annual Report, including our consolidated financial statements and related notes. The risks described below are not the only ones facing us. The occurrence of any of the following risks or additional risks and uncertainties not presently known to us or that we currently believe to be immaterial could materially and adversely affect our business, financial condition or results of operations. This Annual Report also contains forward-looking statements and estimates that involve risks and uncertainties. Our actual results could differ materially from those anticipated in the forward-looking statements as a result of specific factors, including the risks and uncertainties described below.
Risks Related to Our Business
Our results of operations fluctuate from period to period and may not be indicative of our long-term prospects.
The performance of our reinsurance operations and our investment income fluctuate from period to period. Fluctuations result from a variety of factors, including:
|
•
|
the performance of TP Fund’s investment portfolio;
|
|
•
|
reinsurance contract pricing;
|
|
•
|
our assessment of the quality of available reinsurance opportunities;
|
|
•
|
the volume and mix of reinsurance products we underwrite;
|
|
•
|
loss experience on our reinsurance liabilities;
|
|
•
|
low frequency and high severity loss events; and
|
|
•
|
our ability to assess and integrate our risk management strategy properly.
|
In particular, we seek to underwrite products and make investments to achieve a favorable return on equity over the long term. In addition, our opportunistic nature and focus on long-term growth in book value will result in fluctuations in total premiums written from period to period as we concentrate on underwriting contracts that we believe will generate better long-term, rather than short-term, results. Accordingly, our short-term results of operations may not be indicative of our long-term prospects.
25
Established competitors with greater resources may make it difficult for us to effectively market our products or offer our products at a profit.
The reinsurance industry is highly competitive. We compete with major reinsurers, many of which have substantially greater financial, marketing and management resources than we do, as well as other potential providers of capital willing to assume insurance or reinsurance risk. Competition in the types of business that we underwrite is based on many factors, including:
|
•
|
price of reinsurance coverage;
|
|
•
|
the general reputation and perceived financial strength of the reinsurer;
|
|
•
|
relationships with reinsurance brokers;
|
|
•
|
terms and conditions of products offered;
|
|
•
|
ratings assigned by independent rating agencies;
|
|
•
|
speed of claims payment and reputation; and
|
|
•
|
the experience and reputation of the members of our underwriting team in the particular lines of reinsurance we seek to underwrite.
|
Our competitors include, among others, Alleghany Corporation, Allianz SE, American International Group, AmTrust Financial Services, Inc., Arch Capital Group Ltd.,Aspen Insurance Holdings Limited, AXIS Capital Holdings Ltd., Berkshire Hathaway Inc., Chubb Limited, Enstar Group Limited, Everest Re Group, Ltd., Greenlight Reinsurance Ltd., Hamilton Insurance Group Ltd., Hannover Rückversicherung AG, IAT Reinsurance Co Ltd., Markel Bermuda Limited, Münchener Rückversicherungs-Gesellschaft AG., PartnerRe Ltd., RenaissanceRe Holdings Ltd., SCOR SE, Sirius International Insurance Group, Ltd., Swiss Re Limited, Tokio Marine Holdings, Inc. and Watford Re Ltd.
We cannot assure you that we will be able to compete successfully in the reinsurance market. Our failure to compete effectively would significantly and negatively affect our financial condition and results of operations and may increase the likelihood that we are deemed to be a passive foreign investment company or an investment company. See “Risks Relating to Insurance and Other Regulation-We are subject to the risk of becoming an investment company under U.S. federal securities law” and “Risks Relating to Taxation-United States persons who own our shares may be subject to United States federal income taxation on our undistributed earnings and may recognize ordinary income upon disposition of shares.”
If actual renewals of our existing contracts do not meet expectations, our premiums written in future years and our future results of operations could be materially adversely affected.
Many of our contracts are written for a one-year term. In our financial forecasting process, we make assumptions about the renewal of certain prior year’s contracts. The insurance and reinsurance industries have historically been cyclical businesses with periods of intense competition, often based on price. If actual renewals do not meet expectations or if we choose not to write on a renewal basis because of pricing conditions, our premiums written in future years and our future operations would be materially adversely affected.
The inherent uncertainty of models and the use of such models as a tool to evaluate risk may have an adverse effect on our financial results.
We make use of quantitative models to evaluate potential reinsurance transactions, to reserve for transactions once they are bound and to assess our risk related to our reinsurance and investment portfolios. These models have been developed internally and in some cases they make use of third party software. For example, we license catastrophe modeling and aggregation software to both assist with monitoring and managing catastrophe aggregations at pricing selection. The construction of these models and the selection of assumptions requires significant actuarial judgment. Furthermore, these models typically rely on either cedent or industry data, both of which may be incomplete or may be subject to errors by employees, failure to document transactions properly, failure to comply with regulatory requirements or information technology failures. Given the inherent uncertainty in these models as well as the underlying assumptions and data, the results of our models may not accurately address the emergence of a variety of matters which might impact certain of our coverages. Accordingly, these models may understate the exposures we are assuming and our financial
26
results may be adversely affected, perhaps significantly. Any such impact could also be felt across our reinsurance contract portfolio, since similar models and judgment are used in analyzing the majority of our transactions.
Our losses may exceed our loss reserves, which could significantly and negatively affect our business.
Our results of operations and financial condition depends upon our ability to assess accurately the potential losses associated with the risks we reinsure. Reserves are estimates of claims an insurer ultimately expects to pay, based upon facts and circumstances known at the time, predictions of future events, estimates of future trends in claim severity and other variable factors. The inherent uncertainties of estimating loss reserves generally are greater for reinsurance companies as compared to primary insurers, primarily due to:
|
•
|
the lapse of time from the occurrence of an event to the reporting of the claim and the ultimate resolution or settlement of the claim;
|
|
•
|
the diversity of development patterns among different types of reinsurance treaties; and
|
|
•
|
heavier reliance on the client for information regarding claims.
|
Actual losses and loss adjustment expenses paid may deviate substantially from the estimates of our loss reserves, to our detriment. If we determine our loss reserves to be inadequate, we will increase our loss reserves with a corresponding reduction in our net income in the period in which we identify the deficiency. Such a reduction would negatively affect our results of operations. If our losses exceed our loss reserves, our financial condition may be significantly and negatively affected.
As a recently formed reinsurance company, we do not have the benefit of extended loss experience with our cedents. With additional time, we may determine that our cedents’ loss emergence, incurred and payment patterns are different from those implied in the original submission data. Consequently, we may experience greater than average deviation in our loss reserve estimates when compared to our more established competitors.
Our property catastrophe reinsurance operations will make us vulnerable to losses from catastrophes and may cause our results of operations to vary significantly from period to period.
Our property and catastrophe reinsurance operations expose us to claims arising out of unpredictable catastrophic events, such as hurricanes, hailstorms, tornados, windstorms, earthquakes, floods, fires, explosions, and other natural or man-made disasters. The incidence and severity of catastrophes are inherently unpredictable but the loss experience of property catastrophe reinsurers has been generally characterized as low frequency and high severity. Claims from catastrophic events could reduce our earnings and cause substantial volatility in our results of operations for any fiscal quarter or year and adversely affect our financial condition. Corresponding reductions in our surplus levels could impact our ability to write new reinsurance policies.
Catastrophic losses are a function of the insured exposure in the affected area and the severity of the event. Because accounting standards do not permit reinsurers to reserve for catastrophic events until they occur, claims from catastrophic events could cause substantial volatility in our financial results for any fiscal quarter or year and could significantly and negatively affect our financial condition and results of operations.
The failure of any of the loss limitation methods we employ could have a material adverse effect on our financial condition and results of operations.
Although we seek to mitigate our loss exposure through a variety of methods, property and casualty reinsurance risk is inherently unpredictable. It is difficult to predict the timing, frequency and severity of loss events with statistical certainty or estimate the amount of loss any given occurrence will generate. It is not possible to completely eliminate our exposure to unforecasted or unpredictable events and, to the extent that losses from such risks occur, our financial condition and results of operations could be materially adversely affected.
We seek to manage reinsurance volatility by focusing on lines of business that have historically demonstrated more stable return characteristics, such as property quota share, auto, and workers’ compensation. These lines of business are often characterized as having exposure to higher frequency and lower severity claims activity, although this has not always been the case. We seek to further manage the volatility of our reinsurance results by writing contracts on a quota share basis and through the use of contractual terms and conditions, such as loss ratio caps, within our reinsurance
27
contracts. However, there can be no assurance that these terms and conditions will be effective in mitigating our exposure. The failure or ineffectiveness of any of our terms and conditions could have a material adverse effect on our financial condition and results of operations.
We also write reinsurance contracts that seek to provide protection against adverse development on loss reserves. We seek to provide this type of coverage only on relatively stable reserves where we agree with the client’s reserving practices and actuarially determined reserve levels.
The property and casualty reinsurance industry is highly cyclical, and we expect to continue to experience periods characterized by excess underwriting capacity and unfavorable premium rates.
Historically, reinsurers have experienced significant fluctuations in operating results due to competition, frequency of occurrence or severity of catastrophic events, levels of capacity, general economic conditions, including inflation, changes in equity, debt and other investment markets, changes in legislation, case law and prevailing concepts of liability and other factors. In particular, demand for reinsurance is influenced significantly by the underwriting results of primary insurers and prevailing general economic conditions. The supply of reinsurance is related to prevailing prices and levels of surplus capacity that, in turn, may fluctuate in response to changes in rates of return being realized in the reinsurance industry on both underwriting and investment sides.
As a result, the reinsurance business historically has been a cyclical industry characterized by periods of intense price competition due to high levels of available underwriting capacity as well as periods when shortages of capacity have permitted favorable premium levels and changes in terms and conditions. The supply of available reinsurance capital has increased over the past several years and may increase further, either as a result of capital provided by new entrants or by the commitment of additional capital by existing insurers or reinsurers.
Continued increases in the supply of reinsurance may have consequences for us and for the reinsurance industry generally, including fewer contracts written, lower premium rates, increased expenses for customer acquisition and retention, and less favorable policy terms and conditions. As a result, we may be unable to fully execute our reinsurance strategy of selling lower-volatility business. The effects of cyclicality could significantly and negatively affect our financial condition and results of operations and could limit their comparability from period to period and year over year.
The effect of emerging claim and coverage issues on our business is uncertain.
As industry practices and legal, judicial and regulatory conditions change, unexpected issues related to claims and coverage may emerge. Various provisions of our contracts, such as limitations or exclusions from coverage or choice of forum, may be difficult to enforce in the manner we intend, due to, among other things, disputes relating to coverage and choice of legal forum. These issues may adversely affect our business by either extending coverage beyond the period that we intended or by increasing the number or size of claims. In some instances, these changes may not manifest themselves until many years after we have issued insurance or reinsurance contracts that are affected by these changes. As a result, we may not be able to ascertain the full extent of our liabilities under our insurance or reinsurance contracts for many years following the issuance of our contracts. The effects of unforeseen development or substantial government intervention could adversely impact our ability to adhere to our goals.
A downgrade or withdrawal of our A.M. Best rating would significantly and negatively affect our ability to implement our business strategy successfully.
Companies, insurers and reinsurance brokers use ratings from independent ratings agencies as an important means of assessing the financial strength and quality of reinsurers. A.M. Best has assigned each of our reinsurance company subsidiaries a financial strength rating of A- (Excellent), which is the fourth highest of 15 ratings that A.M. Best issues. This rating reflects the rating agency’s opinion of the applicable insurer’s financial strength, operating performance and ability to meet obligations. It is not an evaluation directed toward the protection of investors or a recommendation to buy, sell or hold our shares. A.M. Best periodically reviews our rating, and may revise it downward or revoke it at its sole discretion based primarily on its analysis of our balance sheet strength, operating performance and business profile. Factors which may affect such an analysis include:
28
|
•
|
if we change our business practices from our organizational business plan in a manner that no longer supports A.M. Best’s initial rating;
|
|
•
|
if unfavorable financial or market trends impact us;
|
|
•
|
if losses exceed loss reserves;
|
|
•
|
if we are unable to retain our senior management and other key personnel;
|
|
•
|
if TP Fund’s investment portfolio incurs significant losses; or
|
|
•
|
if A.M. Best alters its capital adequacy assessment methodology in a manner that would adversely affect the rating of Third Point Re BDA or Third Point Re USA.
|
If A.M. Best downgrades the rating of either Third Point Re BDA or Third Point Re USA below A- (Excellent), places either reinsurer on credit watch or withdraws its rating, we could be severely limited or prevented from writing any new reinsurance contracts from the affected reinsurer which would significantly and negatively affect our ability to implement our business strategy. A downgrade may also require us to establish trusts or post letters of credit for ceding company clients. In addition, almost all of our reinsurance contracts provide the client with the right to terminate the agreement or require us to transfer premiums on a funds withheld basis if our A- (Excellent) A.M. Best rating is downgraded.
In February 2015, Third Point Re (USA) Holdings Inc., our wholly owned subsidiary, completed a public offering of $115.0 million in aggregate principal amount of 7.0% senior notes due 2025 (the “Senior Notes”). The Senior Notes are fully and unconditionally guaranteed (the “Guarantee”) by Third Point Re. In certain circumstances, a downgrade of the rating assigned to the Senior Notes would result in an increase in the annual interest rate payable on the Senior Notes or, if a change of control of TPRE has also occurred, an obligation for us to make an offer to repurchase the Senior Notes at a premium. Either of these outcomes could require use of cash that we might otherwise use in operating our business. In addition, we may not have sufficient funds to satisfy these obligations, which could result in an event of default under the indenture governing the Senior Notes. See “Inability to service our indebtedness could adversely affect our liquidity and financial condition and could potentially result in a downgrade or withdrawal of our credit ratings, any of which would adversely affect our ability to implement our business strategy.”
A significant decrease in our capital or surplus could enable certain clients to terminate reinsurance agreements or to require additional collateral.
Certain of our reinsurance contracts contain provisions that permit our clients to cancel the contract or require additional collateral in the event of a downgrade in our ratings below specified levels or a reduction of our capital or surplus below specified levels over the course of the agreement. Whether a client would exercise such cancellation rights would likely depend, among other things, on the reason the provision is triggered, the prevailing market conditions, the degree of unexpired coverage and the pricing and availability of replacement reinsurance coverage.
For the year ended December 31, 2018, the decrease in shareholders’ equity attributable to common shareholder’s of Third Point Re and Third Point Re BDA both exceeded 20%. As a result, termination or collateral rights for some of Third Point Re BDA’s and Third Point Re USA’s reinsurance contracts can be exercised. To date, we have not been advised by any client of their intention to exercise these rights; however, they may do so in the future. We cannot predict whether or how many, if any, of our clients will actually exercise such rights or the extent to which such rights would have a significant and negative effect on our financial condition, results of operations or future prospects but they could have a significant adverse effect on our operations and our ability to post sufficient collateral for reinsurance obligations.
We are dependent on key executives, the loss of whom could adversely affect our business.
Our future success depends to a significant extent on the efforts of our senior management and our senior underwriting executives to implement our business strategy. We believe there are only a limited number of available and qualified executives with substantial experience in our industry. Accordingly, the loss of the services of one or more of the members of our senior management or other key personnel could delay or prevent us from fully implementing our business strategy and, consequently, significantly and negatively affect our business.
We do not currently maintain key man life insurance with respect to any of our senior management. If any member of senior management dies or becomes incapacitated, or leaves the company to pursue employment opportunities
29
elsewhere, we would be solely responsible for locating an adequate replacement for such senior management and for bearing any related cost. To the extent that we are unable to locate an adequate replacement or are unable to do so within a reasonable period of time, our business may be significantly and negatively affected.
In addition, our business operations require the services of a number of specialized employees to carry out day-to-day business operations. There can be no assurance that we can attract and retain the necessary employees to conduct our business activities on a timely basis or at all.
Our inability to provide collateral to certain counterparties on commercially acceptable terms as we grow could significantly and negatively affect our ability to implement our business strategy.
Neither Third Point Re BDA nor Third Point Re USA is licensed or admitted as a reinsurer in any jurisdiction other than Bermuda. Certain jurisdictions, including in the United States, do not permit insurance companies to take statutory credit for reinsurance obtained from unlicensed or non-admitted insurers unless appropriate security measures are implemented. Consequently, certain clients require us to obtain a letter of credit or provide other collateral through funds withheld or trust arrangements. In connection with obtaining letter of credit facilities, we are typically required to provide customary collateral to the letter of credit provider in order to secure our obligations under the facility. Our ability to provide collateral, and the costs at which we provide collateral, is primarily dependent on the composition of our Collateral Assets.
Typically, both letters of credit and collateral trust agreements are collateralized with cash or fixed-income securities. Banks may be willing to accept our assets as collateral, but on terms that may be less favorable to us than reinsurance companies that invest solely or predominantly in fixed-income securities. The inability to renew, maintain or obtain letters of credit or to source acceptable collateral for letters of credit or collateral trust agreements may significantly limit the amount of reinsurance we can write or require us to modify our investment strategy.
We expect to need additional collateral capacity as we grow, and if we are unable to renew, maintain or increase our collateral capacity or are unable to do so on commercially acceptable terms, such a development could significantly and negatively affect our ability to implement our business strategy.
Our ability to pay dividends may be constrained by our holding company structure and certain regulatory and other factors.
Third Point Re is a holding company that conducts no reinsurance operations of its own. The majority of our reinsurance operations are conducted through our wholly-owned operating subsidiaries, Third Point Re BDA and Third Point Re USA. Historically, our cash flows have typically consisted primarily of dividends and other permissible payments from Third Point Re BDA and Third Point Re USA. Third Point Re depends on such payments to receive funds to meet its obligations, including the payment of any dividends and other distributions to our shareholders and any payment obligations in respect of its guarantee of the Senior Notes issued by TPRUSA in February 2015. See “Inability to service our indebtedness could adversely affect our liquidity and financial condition and could potentially result in a downgrade or withdrawal of our credit ratings, any of which would adversely affect our ability to implement our business strategy.”
In March 2015, Third Point Re and Third Point Re USA entered into a Net Worth Maintenance Agreement, pursuant to which Third Point Re must have committed funds sufficient to, and must continue to, maintain a minimum level of capital at Third Point Re USA of $250.0 million (the “Net Worth Maintenance Agreement”). Failure to maintain the minimum level of capital required by the Net Worth Maintenance Agreement could limit or prevent Third Point Re USA from paying dividends to us.
Third Point Re is indirectly subject to Bermuda regulatory constraints placed on Third Point Re BDA and Third Point Re USA. This affects our ability to pay dividends on the shares and make other payments. Under the Insurance Act, Third Point Re BDA and Third Point Re USA, as Class 4 insurers, are prohibited from declaring or paying a dividend if the relevant insurer is in breach of its minimum solvency margin (“MSM”), enhanced capital ratio (“ECR”) or minimum liquidity ratio or if the declaration or payment of such dividend would cause such a breach. Where either Third Point Re BDA or Third Point USA, as Class 4 insurers, fails to meet its MSM or minimum liquidity ratio on the last day of any financial year, they are prohibited from declaring or paying any dividends during the next financial year without the approval of the BMA.
30
In addition, Third Point Re BDA and Third Point Re USA, as Class 4 insurers, are prohibited from declaring or paying in any financial year dividends of more than 25% of their respective total statutory capital and surplus (as shown on its previous financial year’s statutory balance sheet) unless they file (at least seven days before payment of such dividends) with the BMA an affidavit signed by at least two directors (one of whom must be a Bermuda resident director if any of the insurer’s directors are resident in Bermuda) and the relevant insurer’s principal representative stating that the relevant insurer will continue to meet its solvency margin and minimum liquidity ratios. Where such an affidavit is filed, it shall be available for public inspection at the offices of the BMA.
In addition, under the Bermuda Companies Act 1981, as amended (the “Companies Act”), Bermuda companies such as Third Point Re, Third Point Re BDA and Third Point Re USA may not declare or pay a dividend if there are reasonable grounds for believing that the relevant Bermuda company is, or would after the payment be, unable to pay its liabilities as they become due or that the realizable value of its assets would thereby be less than its liabilities.
Inability to service our indebtedness could adversely affect our liquidity and financial condition and could potentially result in a downgrade or withdrawal of our credit ratings, any of which would adversely affect our ability to implement our business strategy.
In February 2015, Third Point Re (USA) Holdings Inc., our wholly owned subsidiary, completed a public offering of $115.0 million in aggregate principal amount of Senior Notes. The Senior Notes are fully and unconditionally guaranteed by Third Point Re.
The Senior Notes are an obligation of TPRUSA, and the Guarantee is an obligation of TPRE. Each of TPRUSA and TPRE is a holding company and, accordingly, conduct substantially all operations through their respective operating subsidiaries. As a result, TPRUSA’s cash flow and its ability to service its debt, as well as TPRE’s ability to satisfy its obligations pursuant to the Guarantee, depend in part upon the earnings of their respective operating subsidiaries and on the distribution of earnings, loans or other payments from such subsidiaries to TPRUSA or TPRE, as applicable. See “Risk Factors-Our ability to pay dividends may be constrained by our holding company structure and certain regulatory and other factors.”
The operating subsidiaries of TPRUSA and TPRE are separate and distinct legal entities and have no obligation to pay any amounts due on the Senior Notes or the Guarantee or to provide TPRUSA or TPRE with funds for their respective payment obligations, whether by dividends, distributions, loans or other payments. There can be no assurance that our operating subsidiaries will generate sufficient cash flow from operations, or that future financing sources will be available to us in amounts sufficient to satisfy our obligations under our indebtedness, to refinance our indebtedness on acceptable terms or at all, or to fund our other business needs. In addition to being limited by the financial condition and operating requirements of such subsidiaries, any payment of dividends, distributions, loans or advances by TPRUSA’s or TPRE’s subsidiaries to TPRUSA or TPRE could be subject to statutory or contractual restrictions. Moreover, since certain of TPRUSA’s and TPRE’s respective subsidiaries are insurance companies, their ability to pay dividends to TPRUSA or TPRE, as applicable, is subject to regulatory limitations. See “Business - Regulation.”
To the extent that either TPRUSA or TPRE needs funds but its subsidiaries are restricted from making such distributions under applicable law or regulation, or are otherwise unable to distribute funds, the liquidity and financial condition of TPRUSA or TPRE, as applicable, would be adversely affected and we would potentially be unable to satisfy our obligations under the Senior Notes, the Guarantee or any other indebtedness. If we cannot service our indebtedness, the implementation of our business strategy would be impeded, and we could be prevented from entering into transactions that would otherwise benefit our business.
The rights of TPRUSA and TPRE to receive any assets of any of their respective subsidiaries upon liquidation or reorganization of such subsidiaries, and therefore the rights of the holders of the Senior Notes, to participate in those assets, will be structurally subordinated to the claims of such subsidiary’s creditors. In addition, even if TPRUSA or TPRE were a creditor of any of their respective subsidiaries, the rights of TPRUSA or TPRE, as applicable, as a creditor would be subordinate to any security interest in the assets of such subsidiaries and any indebtedness of such subsidiaries senior to that held by it. The Senior Notes and the Guarantee would also be structurally subordinated to the rights of the holders of any preferred stock or shares issued by the subsidiaries of either TPRUSA or TPRE, as applicable, whether currently outstanding or issued hereafter. Moreover, the rights of shareholders of TPRE to receive any assets of TPRE upon liquidation or reorganization of TPRE would be subordinate to all of the foregoing claims.
31
Our indebtedness may limit cash flow available to invest in the ongoing needs of our business, and may otherwise place us at a competitive disadvantage compared to our competitors.
We could in the future incur additional indebtedness in addition to the Senior Notes. The indenture governing the Senior Notes does not limit the amount of additional indebtedness we may incur. Our debt combined with our other financial obligations and contractual commitments could have significant adverse consequences, including:
|
•
|
requiring us to dedicate a substantial portion of cash flow from operations to the payment of interest on, and principal of, our debt, which will reduce the amounts available to fund working capital, the expansion of our business and other general corporate purposes;
|
|
•
|
increasing our vulnerability to adverse changes in general economic, industry and market conditions, and exposing us to the risk of increased interest rates;
|
|
•
|
obligating us to additional restrictive covenants that may reduce our ability to take certain corporate actions or obtain further debt or equity financing;
|
|
•
|
making it more difficult for us to make payments on our existing or future obligations;
|
|
•
|
limiting our flexibility in planning for, or reacting to, changes in our business and the industry in which we compete; and
|
|
•
|
placing us at a competitive disadvantage compared to our competitors that have less debt or better debt servicing options.
|
In addition, a failure to comply with the covenants under our debt instruments could result in an event of default under those instruments. In the event of an acceleration of amounts due under our debt instruments as a result of an event of default, we may not have sufficient funds and may be unable to arrange for additional financing to repay our indebtedness, and the lenders could seek to enforce security interests in the collateral securing such indebtedness.
We may not have the ability to raise the funds necessary to pay the principal of or interest on the Senior Notes.
At maturity, the entire principal amount of the Senior Notes then outstanding, plus any accrued and unpaid interest, will become due and payable. TPRUSA must pay interest in cash on the Senior Notes semi-annually on February 13 and August 13 of each year. The amount of interest payable on the Senior Notes is subject to increase from time to time in the event of a downgrade of the rating assigned to the Senior Notes or in connection with certain other events. In addition, upon the occurrence of a change of control triggering event described in the indenture governing the Senior Notes, unless we have exercised our right to redeem the Senior Notes in accordance with their terms, each holder of Senior Notes will have the right to require us to repurchase all or any part of such holder’s Senior Notes for a payment in cash described in the indenture governing the Senior Notes.
We may not have enough available cash or be able to obtain sufficient financing at the time we are required to make these payments. Furthermore, our ability to make these payments may be limited by law, by regulatory authority or by agreements governing future indebtedness. Our failure to pay interest when due, if uncured for 30 days, or our failure to pay the principal amount when due, will constitute an event of default under the indenture governing the Senior Notes. A default under the indenture could also lead to a default under agreements governing future indebtedness. If the repayment of that indebtedness is accelerated as a result, then we may not have sufficient funds to repay that indebtedness or to pay the principal of or interest on the Senior Notes.
We may need additional capital in the future in order to operate our business, and such capital may not be available to us or may not be available to us on acceptable terms. Furthermore, additional capital raising could dilute your ownership interest in our company and may cause the value of the shares to decline.
We may need to raise additional capital in the future through offerings of debt or equity securities or otherwise to:
|
•
|
fund liquidity needs caused by underwriting or investment losses;
|
|
•
|
replace capital lost in the event of significant reinsurance losses or adverse reserve developments;
|
|
•
|
satisfy letters of credit, guarantee bond requirements or other capital requirements that may be imposed by our clients or by regulators;
|
|
•
|
meet rating agency or regulatory capital requirements; or
|
32
|
•
|
respond to competitive pressures.
|
In February 2015, we completed a public offering of $115.0 million in aggregate principal amount of Senior Notes issued by TPRUSA and guaranteed by Third Point Re. These Senior Notes are structurally senior to claims that any holders of our common shares may have on the assets of Third Point Re.
Additional capital may not be available on terms favorable to us, or at all. Further, any additional capital raised through the sale of equity could dilute your ownership interest in our company and may cause the value of our shares to decline. Additional capital raised through the issuance of debt may result in creditors having rights, preferences and privileges senior or otherwise superior to those of the holders of our shares.
We depend on our clients’ evaluations of the risks associated with their insurance underwriting, which may subject us to reinsurance losses.
In most of our quota share reinsurance business we do not separately evaluate each of the original individual risks assumed under these reinsurance contracts. We instead evaluate the underwriting processes and environment at the ceding companies we work with to assess the risks associated with their portfolios.Therefore, we are dependent on the original underwriting decisions made by ceding companies. We are subject to the risk that the clients may not have adequately evaluated the insured risks and that the premiums ceded may not adequately compensate us for the risks we assume. We also do not separately evaluate each of the individual claims made on the underlying insurance contracts. Therefore, we are dependent on the original claims decisions made by our clients. We are subject to the risk that the client may pay invalid claims, which could result in reinsurance losses for us.
The involvement of reinsurance brokers subjects us to their credit risk.
In accordance with industry practice, we frequently pay amounts owed on claims under our policies to reinsurance brokers, and these brokers, in turn, remit these amounts to the ceding companies that have reinsured a portion of their liabilities with us. In some jurisdictions, if a broker fails to make such a payment, we might remain liable to the client for the deficiency notwithstanding the broker’s obligation to make such payment. Conversely, in certain jurisdictions, when the client pays premiums for policies to reinsurance brokers for payment to us, these premiums are considered to have been paid and the client will no longer be liable to us for these premiums, whether or not we have actually received them. Consequently, we assume a degree of credit risk associated with reinsurance brokers around the world.
The inability to obtain business provided from brokers could adversely affect our business strategy and results of operations.
We market our reinsurance worldwide primarily through reinsurance brokers. Business placed by our reinsurance brokers that each individually contributed more than 10% of total gross premiums written from inception to
December 31, 2018
were: Aon Benfield, JLT Re, Willis Re and Guy Carpenter & Company, LLC, which accounted for
29.4%
,
19.0%
,
12.6%
and
11.8%
, respectively. Affiliates of several brokers have also co-sponsored the formation of Bermuda reinsurance companies that may compete with us, and these brokers may favor their own reinsurers over other companies. Loss of all or a substantial portion of the business provided by one or more of these brokers could have a material adverse effect on our business.
We may be unable to purchase reinsurance for the liabilities we reinsure, and if we successfully purchase such reinsurance, we may be unable to collect, which could adversely affect our business, financial condition and results of operations.
We have purchased, and may continue to purchase, retrocessional coverage in order to mitigate the effect of a potential concentration of losses upon our financial condition. The insolvency or inability or refusal of a reinsurer to make payments under the terms of its agreement with us could have an adverse effect on us because we remain liable to our client. From time to time, market conditions have limited, and in some cases have prevented, reinsurers from obtaining the types and amounts of retrocession that they consider adequate for their business needs. Accordingly, we may not be able to obtain our desired amounts of retrocessional coverage or negotiate terms that we deem appropriate or acceptable or obtain retrocession from entities with satisfactory creditworthiness. Our failure to establish adequate
33
retrocessional arrangements or the failure of our retrocessional arrangements to protect us from overly concentrated risk exposure could significantly and negatively affect our business, financial condition and results of operations.
We face risks arising from future strategic transactions such as acquisitions, dispositions, mergers or joint ventures.
We may pursue strategic transactions in the future, which could involve acquisitions or dispositions of businesses or assets. Any future strategic transactions could be significant and could have a material adverse impact on our reputation, business, results of operation or financial condition. We face a number of risks arising from these types of transaction, including financial, accounting, tax and regulatory challenges; difficulties with integration, business retention, execution of strategy, unforeseen liabilities or market conditions; and other managerial or operating risks and challenges. Any future transactions could also subject us to risks such as failure to obtain appropriate value, post-closing claims being levied against us and disruption to our other businesses during the negotiation or execution process or thereafter. Accordingly, these risks and difficulties may prevent us from realizing the expected benefits from the strategic transactions we enter into. For example, the businesses that we acquire or our strategic alliances or joint ventures may underperform relative to the price paid or resources committed by us; we may not achieve anticipated cost savings; or we may otherwise be adversely affected by transaction-related charges.
Through our strategic transactions, we may also assume unknown or undisclosed business, operational, tax, regulatory and other liabilities, fail to properly assess known contingent liabilities, or assume businesses with internal control deficiencies. Risk-mitigating provisions that we put in place in the course of negotiating and executing these transactions, such as due diligence efforts and indemnification provisions, may not be sufficient to fully address these liabilities and contingencies.
In addition, as the pace of change in our industry continues to increase, we regularly evaluate our business plans and strategies and may from time to time modify our business and strategic plan,including through strategic transactions or expansion into new lines of reinsurance business. Any such transaction or expansion could be significant and could materially and adversely affect us and our financial condition. Changing plans and strategies requires significant management time and effort, and may divert management’s attention from our core existing operations and competencies. Moreover, modifications we undertake to our operations may not be immediately reflected in our financial statements and, when reflected, may not reflect the achievement of our targeted long-term results and goals. Our failure to carry out our business plans may have an adverse effect on our long-term results of operations and financial condition.
Technology breaches or failures, including those resulting from a malicious cyber-attack on us or our business partners and service providers, could disrupt or otherwise negatively impact our business.
We rely on information technology systems to process, transmit, store and protect the electronic information, financial data and proprietary models that are critical to our business. Furthermore, a significant portion of the communications between our employees and our business, banking and investment partners depends on information technology and electronic information exchange. We have licensed certain systems and data from third parties. We cannot be certain that we will have access to these, or comparable systems, or that our technology or applications will continue to operate as intended. In addition, we cannot be certain that we would be able to replace these systems without slowing our underwriting response time. Like all companies, our information technology systems are vulnerable to data breaches, interruptions or failures due to events that may be beyond our control, including, but not limited to, natural disasters, theft, terrorist attacks, computer viruses, hackers and general technology failures.
We believe that we have established and implemented appropriate security measures, controls and procedures to safeguard our information technology systems and to prevent unauthorized access to such systems and any data processed or stored in such systems, and we periodically evaluate and test the adequacy of such systems, controls and procedures. In addition, we have established a business continuity plan which is designed to ensure that we are able to maintain all aspects of our key business processes functioning in the midst of certain disruptive events, including any disruptions to or breaches of our information technology systems. Our business continuity plan is routinely tested and evaluated for adequacy. Despite these safeguards, disruptions to and breaches of our information technology systems are possible and may negatively impact our business.
It is possible that insurance policies we have in place with third parties would not entirely protect us in the event that we experienced a breach, interruption or widespread failure of our information technology systems. Furthermore, we
34
have not secured insurance coverage designed to specifically protect us from an economic loss resulting from such events.
Although we have never experienced any known or threatened cases involving unauthorized access to our information technology systems or unauthorized appropriation of the data contained within such systems, we have no assurance that such technology breaches will not occur in the future.
Risks Relating to Our Investment Strategy
Under our new investment account structure, we do not have control over TP Fund.
Under the LPA, TP GP has exclusive management and control of the business of TP Fund, including the authority to undertake on behalf of TP Fund all actions that, in its sole judgment, are necessary or desirable to carry out its duties and responsibilities. These broad rights of TP GP include the power to delegate its authorities under the LPA. Pursuant to the TP Fund IMA, TP GP delegates to Third Point LLC the authority to direct the investments of TP Fund and other day-to-day business of TP Fund. In addition, TP GP may resign or, subject to its minimum investment requirement, withdraw from TP Fund and may admit new limited partners without our consent, which may cause TP Fund to be deemed an “investment company” under the Investment Company Act of 1940. The TPRE Limited Partners have no right to remove TP GP as general partner of TP Fund and do not have any right to participate in the management and conduct of TP Fund.
TP Fund is not, and is not expected to be, registered as an “investment company” under the Investment Company Act of 1940 or any comparable regulatory requirements. Therefore, investors in TP Fund, including the TPRE Limited Partners, do not and will not have the benefit of the protections afforded by such registration and regulation.
We do not control the allocation and performance of TP Fund’s investment portfolio and its performance depends on the ability of its investment manager, Third Point LLC, to select and manage appropriate investments.
Pursuant to the LPA, TP GP is required to apply certain investment guidelines to TP Fund’s investment portfolio. In addition, the TP Fund IMA contractually obligates Third Point LLC, as TP Fund’s investment manager, to comply with the investment guidelines. However, we cannot assure shareholders as to exactly how assets will be allocated to different investment opportunities, including long and short positions and derivatives trading, which could increase the level of risk in our investment in TP Fund. The performance of our investment in TP Fund depends to a great extent on the ability of Third Point LLC, as TP Fund’s investment manager, to select and manage appropriate investments for TP Fund’s investment portfolio. We cannot assure you that Third Point LLC will be successful in meeting TP Fund’s investment objectives.
The failure of Third Point LLC to perform adequately could significantly and negatively affect the results of our investment in TP Fund and consequently could significantly and negatively affect our business, results of operations and financial condition.
In addition, under the LPA, TP GP has the authority to dismiss from employment any and all agents, managers, consultants, advisors and other persons, including Third Point LLC. If TP GP chooses to dismiss Third Point LLC from employment as TP Fund’s investment manager, there is no assurance that TP GP will find or hire a suitable replacement. If TP GP were to hire a suitable replacement, there is no guarantee that any such replacement would provide TP Fund with comparable or better investment results than those that Third Point LLC may provide to TP Fund or than those that Third Point LLC has provided in the past to us.
TP Fund may be expected to indemnify Third Point LLC under certain circumstances in accordance with the TP Fund IMA. As a result, the capital accounts of TPRE Limited Partners in TP Fund could be reduced, which could have a material and adverse impact on our financial conditions and results of operations.
We have a limited ability to withdraw our capital accounts from TP Fund
The LPA limits our ability to withdraw our capital accounts from TP Fund. The LPA provides that we may withdraw our capital accounts in TP Fund in full on the Withdrawal Date or any successive three-year anniversary of such date.
35
It also allows us to withdraw upon the occurrence of certain specified events as described in “Item 1. Withdrawal Rights”.
Additionally, the LPA prohibits us from engaging an investment manager other than Third Point LLC without the written consent of Third Point LLC. As a result, we have limited flexibility to change our investment strategy or manage our investments outside of TP Fund or with a different investment manger, which could have a negative impact on our returns.
TP GP, Third Point LLC and their respective affiliates may have potential conflicts of interest that could adversely affect us
Neither Third Point LLC nor its principals, including Daniel S. Loeb, who is one of our shareholders, are obligated to devote any specific amount of time, effort or investment opportunities to our or TP Fund’s affairs. Affiliates of Third Point LLC manage, and expect to continue to manage, other client accounts, some of which have objectives similar to ours and TP Fund’s, including collective investment vehicles managed by Third Point LLC’s affiliates and in which Third Point LLC or its affiliates may have an equity interest. Third Point LLC’s interest and the interests of its affiliates, may at times conflict, possibly to Third Point LLC’s detriment, which may potentially adversely affect our and TP Fund’s investment opportunities and returns.
Josh Targoff, who serves as Chairman of our Board, also serves as a partner, Chief Operating Officer and General Counsel to Third Point LLC. This service to both companies may create, or may create the appearance of, conflicts of interest.
TP GP, Third Point LLC and their respective affiliates may engage in other business ventures and investment opportunities that may not be allocated equitably among us and such other business ventures.
Under the LPA, TP GP and its affiliates have the ability to engage in or possess interests in other business activities, including investing or disposing of securities in which TP Fund may from time to time invest. TP GP or Third Point LLC may organize and manage one or more entities or accounts that may parallel the investment activities of TP Fund. TP GP or Third Point LLC, as the case may be, may allocate investment opportunities among such entities or accounts, other affiliated funds and TP Fund as it deems to be fair and equitable in its sole discretion. However, we cannot be assured that the allocation of investment opportunities between TP Fund and such other entities, accounts or funds will be equitable.
The historical performance of Third Point LLC should not be considered as indicative of the future results of TP Fund’s investment portfolio or of our future results or any returns expected on our common shares.
The historical returns of the funds managed by Third Point LLC are not directly linked to returns on our common shares. As TP Fund’s investment manager, Third Point LLC has agreed to manage TP Fund’s investment portfolio on a basis that is substantially equivalent to Third Point Offshore Master Fund L.P., which is managed by Third Point LLC, but with increased exposures through the use of additional financial leverage. However, results for TP Fund’s investment portfolio could differ from results of the funds managed by Third Point LLC as a result of restrictions imposed by TP Fund’s investment guidelines, and other factors. In addition, even if TP Fund’s investment portfolio generates investment income in a given period, our overall performance could be adversely affected by losses generated by our reinsurance operations or public market dynamics. Poor performance of TP Fund’s investment portfolio would cause a decline in our revenue and would therefore have a negative effect on our financial performance.
Moreover, with respect to the historical performance of funds or accounts managed by Third Point LLC, including our investment portfolio, prior to the recent change in investment account structure:
|
•
|
the historical performance of funds managed by Third Point LLC should not be considered indicative of the future results that should be expected from TP Fund’s investment portfolio or the Collateral Asset Account; and
|
|
•
|
the returns of funds managed by Third Point LLC have benefited historically from investment opportunities and general market conditions that currently may not exist and may not repeat themselves, and there can be no assurance that Third Point LLC will be able to avail itself of profitable investment opportunities in the future.
|
36
The risks associated with Third Point LLC’s strategy in managing TP Fund’s investment portfolio may be substantially greater than the investment risks faced by other reinsurers with whom we compete.
We derive a significant portion of our income from our investment in TP Fund. As a result, our operating results depend in part on the performance of TP Fund’s investment portfolio. TP Fund’s investments are not structured in relation to our anticipated reinsurance liabilities, which could force us to liquidate investments at a significant loss or at prices that are not optimal, which could significantly and adversely affect our financial results.
The risks associated with Third Point LLC’s investment strategy may be substantially greater than the risks associated with traditional fixed-income investment strategies employed by many reinsurers with whom we compete. Third Point LLC makes investments globally, in both developed and emerging markets, in all sectors, and in equity, credit, commodity, currency, option and other instruments. Third Point LLC is opportunistic and often seeks a catalyst, either intrinsic or extrinsic, that will unlock value or alter the lens through which the greater market values a particular investment. Making long equity investments in an up or rising market may increase the risk of not generating profits on these investments and we may incur losses if the market declines. Similarly, making short equity investments in a down or falling market may increase the risk of not generating profits on these investments and we may incur losses if the market rises. Short sales involve unlimited loss potential since the market price of securities sold short may continuously increase. If the market price of the subject security increases considerably, Third Point LLC might have to cover short sales at suboptimal prices. As of
December 31, 2018
, short exposure in our consolidated investment portfolio was
$921.8 million
consisting of
175
debt, equity and index positions, including
$436.7 million
over
82
positions in the equity portfolio.
The termination by Third Point LLC of the TP Fund IMA or the Collateral Asset IMA could materially adversely affect our investment results.
TP Fund depends upon Third Point LLC, its investment manager, to implement its investment strategy. The TP Fund IMA may be terminated by Third Point LLC or TP GP party at any time upon 90 days’ notice. Further, we also depend on Third Point LLC as the investment manager of the Collateral Assets to implement our investment strategy. The Collateral Asset IMA shall continue in effect as long as either of the TPRE Limited Partners remains a limited partner of TP Fund. If either the TP Fund IMA or the Collateral Asset IMA is terminated, there is no assurance that TP Fund or we could find a suitable replacement. If TP Fund or we were to find a replacement, there is no guarantee that any such replacement would provide comparable or better investment results.
TP Fund’s investment portfolio may contain significant positions, which could result in large losses.
TP Fund’s investment portfolio could be subject to significant losses if it holds a relatively large position in a single issuer, industry, market or a particular type of investment that declines in value, and the losses could increase even further if the investments cannot be liquidated without adverse market reaction or are otherwise adversely affected by changes in market conditions or circumstances. As of
December 31, 2018
, the net exposure of our net investments managed by Third Point LLC, which includes TP Fund and the Collateral Assets Account, was
54%
and the largest ten long and short positions comprised an aggregate of
38%
and
10%
, respectively, of our consolidated investment portfolio. As of December 31,
2017
, prior to the change in the Company’s investment account structure, the net exposure of our consolidated portfolio was
93%
and the largest ten long and short positions comprised an aggregate of 54% and 15%, respectively, of our consolidated investment portfolio. Since our investment portfolio may not be widely diversified at times, it may be subject to more rapid changes in value than would be the case if its investment portfolio were required to maintain a wide diversification among companies, securities and types of securities.
If Third Point LLC’s risk management systems are ineffective, TP Fund may be exposed to material unanticipated losses.
Third Point LLC continually refines its risk management techniques, strategies and assessment methods. However, its risk management techniques and strategies do not fully mitigate the risk exposure of its funds and managed accounts, including TP Fund’s investment portfolio, in all economic or market environments, or against all types of risk, including risks that they might fail to identify or anticipate. Some of Third Point LLC’s strategies for managing risk are based upon its use of historical market behavior statistics. Any failures in Third Point LLC’s risk management techniques and strategies to accurately quantify such risk exposure could limit the risk-adjusted returns of TP Fund’s investment
37
portfolio. In addition, any risk management failures could cause losses in the portfolios and accounts managed by Third Point LLC, including TP Fund, to be significantly greater than the historical measures predict. Third Point LLC’s approach to managing those risks could prove insufficient, exposing TP Fund to material unanticipated losses.
In managing TP Fund’s investment portfolio, Third Point LLC may trade on margin and use other forms of financial leverage, which could potentially adversely affect our revenues.
TP Fund’s investment guidelines provide Third Point LLC with the ability to trade on margin and use other forms of financial leverage. Fluctuations in the market value of TP Fund’s investment portfolio could have a disproportionately large effect in relation to our capital. A common metric used to determine financial leverage for accounts such as TP Fund’s investment portfolio is the “gross exposure” of its managed accounts. The “gross exposure” is shown as a percentage of the Net Asset Value (“NAV”) of the account, and represents the market exposure in the account (long and short) versus the NAV. In other words, if the NAV of an account is $100, and the account holds securities “long” with an aggregate market exposure of $100 (100% long), and has sold short securities with an aggregate market exposure of $25 (25% short), then the gross exposure would be 125% (i.e., $125 of investments against $100 of NAV). As of
December 31, 2018
, the gross exposure of TP Fund’s consolidated investment portfolio was
108%
. Any event that may adversely affect the value of positions TP Fund holds could significantly and negatively affect the net asset value of TP Fund’s investment portfolio and thus our results of operations.
Third Point LLC’s representatives’ service on boards and committees may place trading restrictions on TP Fund’s investments.
Third Point LLC may from time to time place its or its affiliates’ representatives on creditors’ committees or boards of certain companies in which TP Fund’s portfolio is invested. While such representation may enable Third Point LLC to enhance the sale value of our and TP Fund’s investments, it may also place trading restrictions on such investments.
As of the date hereof, representatives of Third Point LLC sat on the board of directors of Baxter International Inc., Hellenic Bank PLC and Sotheby’s, whose securities are publicly traded and included in TP Fund’s investment portfolio.
Certain of TP Fund’s investments may have limited liquidity and lack valuation data, which could create a conflict of interest.
TP Fund’s investment guidelines provide Third Point LLC, as TP Fund’s investment manager, with the flexibility to invest in certain securities with limited liquidity or no public market. This lack of liquidity may adversely affect the ability of Third Point LLC to execute trade orders at desired prices. To the extent that Third Point LLC invests TP Fund’s investable assets in securities or instruments for which market quotations or other independent pricing sources are not readily available, under the terms of the investment management agreements the valuation of such securities and instruments for purposes of compensation to Third Point LLC will be determined by Third Point LLC, whose determination, subject to audit verification, will be conclusive and binding in the absence of bad faith or manifest error. Because the investment guidelines give Third Point LLC the power to determine the value of securities with no readily discernible market value, and because the calculation of Third Point LLC’s fee is based on the value of the investment account, a conflict of interest may exist or arise.
U.S. and global economic downturns could harm the performance of TP Fund’s investment portfolio, and as a result our liquidity and financial condition and our share price.
Volatility in the United States and other securities markets may adversely affect TP Fund’s investment portfolio. The ability of Third Point LLC to manage TP Fund’s investment portfolio profitably is dependent upon conditions in the global financial markets and economic and geopolitical conditions throughout the world that are outside of TP Fund’s control and difficult to predict. Factors such as equity prices, equity market volatility, asset or market correlations, interest rates, counterparty risks, availability of credit, inflation rates, economic uncertainty, changes in laws or regulation (including laws relating to the financial markets generally or the taxation or regulation of the hedge fund industry), trade barriers, commodity prices, interest rates, currency exchange rates and controls, and national and international political circumstances (including governmental instability, wars, terrorist acts or security operations) can have a material impact on the value of TP Fund’s investment portfolio.
38
If Third Point LLC, as TP Fund’s investment manager, fails to react appropriately to difficult market, economic and geopolitical conditions, TP Fund and we, as result of our investment in TP Fund, could incur material losses.
The market price of our common shares may be volatile and the risk of loss may be greater when compared with other reinsurance companies.
Third Point LLC’s use of hedging and derivative transactions in executing trades for TP Fund’s account may not be successful, which could materially adversely affect TP Fund’s and our investment results.
In managing TP Fund’s investment portfolio, Third Point LLC may use various financial instruments both for investment purposes and for risk management purposes in order to protect against possible changes in the market value of TP Fund’s investment portfolio resulting from fluctuations in the securities markets and changes in interest rates, protect unrealized gains in the value of its investment portfolio, facilitate the sale of any such investments, enhance or preserve returns, spreads or gains on any investment in TP Fund’s investment portfolio, hedge the interest rate or currency exchange rate on certain liabilities or assets, protect against any increase in the price of any securities Third Point LLC anticipates purchasing for TP Fund’s account at a later date or for any other reason that Third Point LLC, as TP Fund’s investment manager, deems appropriate. The success of such hedging strategy will be subject to Third Point LLC’s ability to correctly assess the degree of correlation between the performance of the instruments used in the hedging strategy and the performance of the investments in the portfolio being hedged. Since the characteristics of many securities change as markets change or time passes, the success of such hedging strategy will also be subject to Third Point LLC’s ability to continually recalculate, readjust and execute hedges in an efficient and timely manner. While Third Point LLC may enter into hedging transactions for TP Fund’s account to seek to reduce risk, such transactions may result in a poorer overall performance for TP Fund’s investment portfolio than if it had not engaged in any such hedging transactions. For a variety of reasons, Third Point LLC may not seek to establish a perfect correlation between such hedging instruments and the portfolio holdings being hedged. Any such imperfect correlation may prevent Third Point LLC from achieving the intended hedge or expose TP Fund’s investment portfolio to risk of loss.
TP Fund’s investment portfolio may from time to time include investments in mortgage-backed securities and other asset-backed securities, whose investment characteristics differ from corporate debt securities.
TP Fund’s investment portfolio may from time to time be invested in mortgage-backed securities and other asset-backed securities, including securitization of marketplace loans, whose investment characteristics differ from corporate debt securities. As of
December 31, 2018
, the fair value of asset-backed securities in TP Fund’s investment portfolio was
$206.7 million
. Among the major differences are that interest and principal payments are made more frequently, usually monthly, and that principal may be prepaid at any time because the underlying mortgage loans or other assets generally may be prepaid at any time. Mortgage-backed securities and asset-backed securities may also be subject to call risk and extension risk. For example, because homeowners have the option to prepay their mortgages, the duration of a security backed by home mortgages can either shorten or lengthen.
In general, if interest rates on new mortgage loans fall sufficiently below the interest rates on existing outstanding mortgage loans, the rate of prepayment would be expected to increase. Conversely, if mortgage loan interest rates rise above the interest rates on existing outstanding mortgage loans, the rate of prepayment would be expected to decrease. In either case, a change in the prepayment rate can result in losses to investors. If TP Fund’s investment portfolio includes securities that are subordinated to other interests in the same mortgage pool, we may only receive payments after the pool’s obligations to other investors have been satisfied. In addition, TP Fund’s investment portfolio may, from time to time, be invested in structures commonly known as “Re-REMICS,” in which case a trust is further split between a senior tranche and a junior tranche. Third Point LLC usually buys the junior tranche for its funds and the accounts it manages in such circumstances. An unexpectedly high rate of default on mortgages held by a mortgage pool may limit substantially the pool’s ability to make payments to holders of such securities, reducing the value of those securities or rendering them worthless. The risk of such defaults is generally higher in the case of mortgage pools that include “sub-prime” mortgages. Changes in laws and other regulatory developments relating to mortgage loans may impact the investments of TP Fund’s portfolio in mortgage-backed securities in the future.
39
TP Fund’s investment portfolio may include investments in securities of issuers based outside the United States, including emerging markets, which may be riskier than securities of U.S. issuers.
Under TP Fund’s investment guidelines, Third Point LLC may invest in securities of issuers organized or based outside the United States that may involve heightened risks in comparison to the risks of investing in domestic securities, including unfavorable changes in currency rates and exchange control regulations, reduced and less reliable information about issuers and markets, less stringent accounting standards, illiquidity of securities and markets, higher brokerage commissions, transfer taxes and custody fees, local economic or political instability and greater market risk in general. In particular, investing in securities of issuers located in emerging market countries involves additional risks, such as exposure to economic structures that are generally less diverse and mature than, and to political systems that can be expected to have less stability than, those of developed countries. Other characteristics of emerging market countries that may affect investment in their markets include certain national policies that may restrict investment by foreigners in issuers or industries deemed sensitive to relevant national interests and the absence of developed legal structures governing private and foreign investments and private property. The typically small size of the markets for securities of issuers located in emerging markets and the possibility of a low or nonexistent volume of trading in those securities may also result in a lack of liquidity and in price volatility of those securities. In addition, dividend and interest payments from and capital gains in respect of certain foreign securities may be subject to foreign taxes that may or may not be reclaimable. Finally, many transactions in these markets are executed as a “total return swap” or other derivative transaction with a financial institution counterparty, and as a result TP Fund’s investment portfolio has counterparty credit risk with respect to such counterparty.
Third Point LLC’s role as an engaged investor in special situation and distressed investments may subject TP Fund to increased risks including the incurrence of additional legal or other expenses.
As TP Fund’s investment manager, Third Point LLC may invest a portion of TP Fund’s investment portfolio in special situation companies. This generally involves investments in securities of companies in event-driven special situations such as acquisitions, tender offers, bankruptcies, recapitalizations, spinoffs, corporate and financial restructurings, litigation or other liability impairments, turnarounds, management changes, consolidating industries and other catalyst-oriented situations. Third Point LLC may also invest TP Fund’s portfolio in securities of issuers in weak financial condition, experiencing poor operating results, having substantial financial needs or negative net worth or facing special competitive or product obsolescence issues or that are involved in bankruptcy reorganization proceedings, liquidation or other corporate restructuring. Investments of this type involve substantial financial business risks that can result in substantial or total losses. Among the problems involved in assessing and making investments in troubled issuers is the fact that it frequently may be difficult to obtain information as to the condition of such issuer. The market prices of the securities of such issuers are also subject to abrupt and erratic market movements and above average price volatility and the spread between the bid and asked prices of such securities may be greater than normally expected. It may take a number of years for the market prices of such securities to reflect their intrinsic values, if at all. It is anticipated that some of such securities may not be widely traded, and that a position in such securities may be substantial in relation to the market for such securities.
As a consequence of Third Point LLC’s role as an engaged investor in special situation and distressed investments, TP Fund’s investment portfolio may be subject to increased risk of incurring additional legal, indemnification or other expenses, even if TP Fund is not named in any action. In distressed or special situations litigation often follows when disgruntled shareholders, creditors, and other parties seek to recover losses from poorly performing investments. The enhanced litigation risk for distressed companies is further elevated by the potential that Third Point LLC may have controlling or influential positions in the companies. Some of the claims that can be asserted against Third Point LLC as a distressed investor include: aiding and abetting breach of fiduciary duty; equitable subordination of the investor’s claims; recharacterization of the investor’s claims; and preference or fraudulent transfer claims. Third Point LLC’s use of short-selling for its funds and the accounts it manages has subjected, and may continue to subject Third Point LLC and the short sellers to increased risk of litigation. Lawsuits can be brought against short sellers of a company’s stock to discourage short selling. Among other claims, these suits may allege libel, conspiracy, and market manipulation.
40
Third Point LLC’s diminution or loss of service or loss of key employees could materially adversely affect TP Fund’s investment results.
TP Fund depends upon Third Point LLC, as its investment manager, to implement its investment strategy. All investment decisions with respect to its investment portfolio are made by Third Point LLC, subject to its investment guidelines, under the general supervision of Daniel S. Loeb. As a result, the success of its investment strategy depends largely upon the abilities of Mr. Loeb. If Mr. Loeb is no longer an employee of Third Point LLC, no assurance can be given that a suitable replacement for Mr. Loeb could be found. As a result, TP Fund’s and our investment results could be materially adversely affected.
The compensation arrangements of Third Point LLC, as TP Fund’s investment manager, may create an incentive to effect transactions that are risky or speculative.
The LPA provides for the following two forms of compensation to be paid to Third Point LLC and TP GP:
|
•
|
Third Point LLC is entitled to a monthly management fee equal to 1.25% per annum of the net asset value of TP Fund (determined as of the beginning of the month before the accrual of the performance allocation) multiplied by an exposure multiplier; and
|
|
•
|
TP GP is entitled to performance compensation equal to 20% of net profits, subject to the management fee and a loss carryforward provision.
|
While the performance compensation arrangement provides that losses will be carried forward as an offset against net profits in subsequent periods, Third Point LLC generally will not otherwise be penalized for realized losses or decreases in the value of TP Fund’s portfolio. These performance compensation arrangements may create an incentive for Third Point LLC as TP Fund’s investment manager to engage in transactions that focus on the potential for short-term gains rather than long-term growth or that are particularly risky or speculative.
Increased regulation or scrutiny of alternative investment advisers and certain trading methods such as short selling may affect Third Point LLC’s ability to manage TP Fund’s investment portfolio or affect our business reputation.
The regulatory environment for investment managers is evolving, and changes in the regulation of managers may adversely affect the ability of Third Point LLC to effect transactions in TP Fund’s investment portfolio that utilize leverage or to pursue its trading strategies in managing such investments. Third Point LLC is regularly involved in trading activities that involve a number of U.S. and foreign securities law regimes. Violations of any such law could result in severe restrictions on Third Point LLC’s activities and, indirectly, do damage to TP Fund’s investment portfolio or reputation. In addition, the securities and futures markets are subject to comprehensive statutes, regulations and margin requirements. The SEC, other regulators and self-regulatory organizations and exchanges are authorized to take extraordinary actions in the event of market emergencies. The regulation of derivatives transactions and funds that engage in such transactions is an evolving area of law and is subject to modification by government and judicial action. Any future regulatory change could have a significant negative impact on our financial condition and results of operations.
In addition, a number of states and municipal pension plans have adopted so-called “pay-to-play” laws, regulations or policies that prohibit, restrict or require disclosure of payments to (and/or certain contacts with) state officials by individuals and entities seeking to do business with state entities, including investments by public retirement funds. The SEC also has adopted rules that, among other things, prohibit an investment adviser from providing advisory services for compensation to a government client for a period of up to two years after the adviser or certain of its executives or employees make a contribution to certain elected officials or candidates. If Third Point LLC, its employees or affiliates or any service providers acting on their behalf, including, without limitation, a placement agent, fail to comply with such pay-to-play laws, regulations or policies, such non-compliance could have an adverse effect on Third Point LLC and TP Fund’s investment portfolio.
Third Point LLC routinely engages in short selling for TP Fund’s account in managing its investments. Short sale transactions have been subject to increased regulatory scrutiny, including the imposition of restrictions on short selling certain securities and reporting requirements. Third Point LLC’s ability to execute a short selling strategy in managing TP Fund’s investment portfolio may be materially and adversely impacted by temporary or new permanent rules,
41
interpretations, prohibitions, and restrictions adopted in response to these adverse market events. Temporary restrictions or prohibitions on short selling activity may be imposed by regulatory authorities with little or no advance notice and may impact prior and future trading activities of TP Fund’s investment portfolio. Additionally, the SEC, its non-U.S. counterparts, other governmental authorities or self-regulatory organizations may at any time promulgate permanent rules or interpretations consistent with such temporary restrictions or that impose additional or different permanent or temporary limitations or prohibitions. The SEC might impose different limitations or prohibitions on short selling from those imposed by various non-U.S. regulatory authorities. These different regulations, rules or interpretations might have different effective periods.
Regulatory authorities may, from time to time, impose restrictions that adversely affect our ability to borrow certain securities in connection with short sale transactions. In addition, traditional lenders of securities may be less likely to lend securities under certain market conditions. As a result, Third Point LLC may not be able to effectively pursue a short selling strategy due to a limited supply of securities available for borrowing. We may also incur additional costs in connection with short sale transactions effected in TP Fund’s investment portfolio, including in the event that Third Point LLC is required to enter into a borrowing arrangement for TP Fund’s account in advance of any short sales. Moreover, the ability to continue to borrow a security is not guaranteed and our account will be subject to strict delivery requirements. The inability to deliver securities within the required time frame may subject us to mandatory close out by the executing broker-dealer. A mandatory close out may subject us to unintended costs and losses. Certain action or inaction by third parties, such as executing broker-dealers or clearing broker-dealers, may materially impact our ability to effect short sale transactions in TP Fund’s investment portfolio.
An increase or decrease in Third Point LLC’s assets under management may adversely affect the returns of TP Fund’s investment portfolio.
It is possible that if the amount of assets Third Point LLC manages for us, TP Fund and for other accounts it manages were to increase materially, it could be more difficult for Third Point LLC to invest profitably for those accounts because of the difficulty of trading larger positions without adversely affecting prices and managing risks associated with larger positions. In addition, there can be no assurance that there will be appropriate investment opportunities to accommodate future increase in assets under management, which may force Third Point LLC to modify its investment decisions for the accounts it manages because it cannot deploy all the assets in a manner it desires. Furthermore, due to the overlap of strategies and investments across many of the portfolios managed by Third Point LLC, including its hedge funds, the accounts may be adversely affected in the event of rapid or large liquidations of investment positions held by the accounts due to a lack of liquidity resulting from large position sizes in the same investments held by the other accounts.
Alternatively, if the amount of assets Third Point LLC manages for us, TP Fund and for other accounts it manages were to decrease materially, it could negatively impact Third Point LLC’s ability to execute its intended investment strategy, including with respect to obtaining certain larger positions. Such changes could force Third Point LLC to modify its investment decisions for the accounts it manages, which could impact the returns of TP Fund’s investment portfolio.
Risks Relating to Insurance and Other Regulations
Any suspension or revocation of our subsidiaries’ reinsurance licenses would materially impact our ability to do business and implement our business strategy.
Our subsidiaries Third Point Re BDA and Third Point Re USA are licensed as reinsurers only in Bermuda and we do not plan to seek licenses in any other jurisdiction. The suspension or revocation of Third Point Re BDA or Third Point Re USA’s license to do business as a reinsurance company in Bermuda for any reason would mean that we would not be able to enter into any new reinsurance contracts until the suspension ended or Third Point Re BDA or Third Point Re USA became licensed in another jurisdiction. Any such suspension or revocation of our license would negatively impact our reputation in the reinsurance marketplace and could have a material adverse effect on our results of operations.
If we become subject to insurance statutes and regulations in jurisdictions other than Bermuda or there is a change to Bermuda law or regulations or application of Bermuda law or regulations, there could be a significant and negative impact on our business.
42
Third Point Re BDA and Third Point Re USA, our wholly owned operating subsidiaries, are registered Bermuda Class 4 insurers. As such, they are subject to regulation and supervision in Bermuda. Bermuda insurance statutes, regulations and policies of the BMA require each of Third Point Re BDA and Third Point Re USA, among other things, to:
|
•
|
maintain a minimum level of capital, surplus and liquidity;
|
|
•
|
satisfy solvency standards;
|
|
•
|
restrict the payment of dividends and distributions;
|
|
•
|
deliver notification to the BMA of changes in ownership of our common shares beyond and between certain thresholds specified in the Insurance Act;
|
|
•
|
maintain a principal office and appoint and maintain a principal representative in Bermuda; and
|
|
•
|
provide for the performance of certain periodic examinations of Third Point Re BDA and Third Point Re USA and their financial condition.
|
These statutes and regulations may, in effect, restrict our ability to write reinsurance policies, to distribute funds and to pursue our investment strategy.
The process of obtaining licenses is very time consuming and costly, and we may not be able to become licensed in a jurisdiction other than Bermuda even in the event we choose to do so. The modification of the conduct of our business resulting from our becoming licensed in certain jurisdictions could significantly and negatively affect our business. In addition, our inability to comply with insurance statutes and regulations of any particular jurisdiction could significantly and adversely affect our business by limiting our ability to conduct business in that jurisdiction and by subjecting us to penalties and fines.
In addition, the BMA could revoke or suspend Third Point Re BDA or Third Point Re USA’s license in certain circumstances, including circumstances in which (i) it is shown that false, misleading or inaccurate information has been supplied to the BMA by Third Point Re BDA or Third Point Re USA or on their behalf for the purposes of any provision of the Insurance Act; (ii) Third Point Re BDA and Third Point Re USA has ceased to carry on business; (iii) Third Point Re BDA or Third Point Re USA has persistently failed to pay fees due under the Insurance Act; (iv) Third Point Re BDA or Third Point Re USA has been shown to have not complied with a condition attached to its registration or with a requirement made of them under the Insurance Act or any related regulations and insurance accounting rules; (v) we are convicted of an offense against a provision of the Insurance Act or related regulations; (vi) Third Point Re BDA or Third Point Re USA is, in the opinion of the BMA, found not to have been carrying on business in accordance with sound insurance principles; or (vii) if any of the minimum criteria for registration under the Insurance Act is not or will not have been fulfilled. If the BMA were to suspend or revoke Third Point Re BDA or Third Point Re USA’s licenses we could lose our exception under the U.S. Investment Company Act of 1940, as amended, or the “Investment Company Act”. See “We are subject to the risk of becoming an investment company under U.S. federal securities law.”
We are subject to the risk of becoming an investment company under U.S. federal securities law.
The Investment Company Act, regulates certain companies that invest in or trade securities. We rely on an exception under the Investment Company Act that is available to a company organized and regulated as a foreign insurance company which is engaged primarily and predominantly in the reinsurance of risks on insurance agreements. The law in this area has not been well developed and there is a lack of guidance as to the meaning of “primarily and predominantly” under the relevant exception under the Investment Company Act. For example, there is no standard for the amount of premiums that need be written relative to the level of a company’s capital in order to qualify for the exception. If this exception were deemed inapplicable to us, we would have to seek to register under the Investment Company Act as an investment company, which, under the Investment Company Act, would require an order from the SEC. Our inability to obtain such an order could have a significant adverse impact on our business.
Assuming that we were permitted to register as an investment company, registered investment companies are subject to extensive, restrictive and potentially adverse regulation relating to, among other things, operating methods, management, capital structure, our ability to raise additional debt and equity securities or issue stock options or warrants (which could impact our ability to compensate key employees), financial leverage, dividends, board of director composition and transactions with affiliates. Accordingly, if we were required to register as an investment company we would not be able to operate our business as it is currently conducted, nor would we be permitted to have many of
43
the relationships that we have with our affiliated companies. Accordingly, we likely would not be permitted to engage Third Point LLC as the investment manager of our Collateral Asset Account or other investment accounts, unless we obtained the board and shareholder approvals required under the Investment Company Act. Our ability to engage in transactions with Third Point LLC or its affiliates would likely also be significantly restricted. If Third Point LLC were not our investment manager, we would potentially be required to liquidate our Collateral Asset Account and we would seek to identify and retain another investment manager with a similar investment philosophy. Pursuant to the LPA, other than in certain specified circumstances, we cannot engage another investment manager without Third Point LLC’s consent. If we could not identify or retain such an advisor, we would be required to make substantial modifications to our investment strategy. Any such changes to our investment strategy could significantly and negatively impact our investment results, financial condition and our ability to implement our business strategy.
If at any time it were established that we had been operating as an investment company in violation of the Investment Company Act, there would be a risk, among other material adverse consequences, that we could become subject to monetary penalties or injunctive relief, or both, that we could be unable to enforce contracts with third parties or that third parties could seek to obtain rescission of transactions undertaken during the period in which it was established that we were an unregistered investment company. If, subsequently, we were not permitted or were unable to register as an investment company, it is likely that we would be forced to cease operations.
To the extent that the laws and regulations change in the future so that contracts we write are deemed not to be reinsurance contracts, we will be at greater risk of not qualifying for the Investment Company Act exception. Additionally, it is possible that our classification as an investment company would result in the suspension or revocation of our reinsurance license.
Insurance regulators in the United States or elsewhere may review our activities and claim that we are subject to additional licensing requirements.
We do not presently expect that we will be admitted to do business in any jurisdiction other than Bermuda. In general, Bermuda insurance statutes, regulations and the policies of the BMA are less restrictive than United States state insurance statutes and regulations. We conduct business in the United States through our indirect subsidiary, Third Point Re USA. We do not believe that our U.S.-based operations subject us to licensing requirements in any state in which we operate. However, we cannot assure you that insurance regulators in the United States or elsewhere will not review our activities and claim that we are subject to such jurisdiction’s licensing requirements. In addition, we will be subject to indirect regulatory requirements imposed by jurisdictions that may limit our ability to provide reinsurance. For example, our ability to write reinsurance may be subject, in certain cases, to arrangements satisfactory to applicable regulatory bodies and proposed legislation and regulations may have the effect of imposing additional requirements upon, or restricting the market for, non-U.S. reinsurers such as us.
If in the future we were to become subject to regulation under the laws of any state in the United States or the laws of the United States or of any other country, we may consider various alternatives to our operations. If we attempt to become licensed in another jurisdiction, for instance, we may not be able to do so and the modification of the conduct of our business or the non-compliance with insurance statutes and regulations could significantly and negatively affect our business.
Our reinsurance subsidiaries are subject to minimum capital and surplus requirements, and our failure to meet these requirements could subject us to regulatory action.
In 2008, the BMA introduced risk-based capital standards for insurance companies as a tool to assist the BMA both in measuring risk and in determining appropriate levels of capitalization. The amended Bermuda insurance statutes and regulations pursuant to the risk-based supervisory approach required additional filings by insurers to be made to the BMA. The required statutory capital and surplus of our Bermuda-based operating subsidiaries increased under the Bermuda Solvency Capital Requirement model. While Third Point Re BDA and Third Point Re USA, as they currently operate, currently have excess capital and surplus under these new requirements, there can be no assurance that such requirement or similar regulations, in their current form or as may be amended in the future, will not have a material adverse effect on our business, financial condition or results of operations. Any failure to meet applicable requirements or minimum statutory capital requirements could subject us to further examination or corrective action by regulators, including restrictions on dividend payments, limitations on our writing of additional business or engaging in finance
44
activities, supervision or liquidation. Further, any changes in existing risk based capital requirements or minimum statutory capital requirements may require us to increase our statutory capital levels, which we might be unable to do.
Because we are a Bermuda company, we are subject to changes in Bermuda law and regulation that may have an adverse impact on our operations, including through the imposition of increased regulatory supervision.
The Bermuda insurance and reinsurance regulatory framework recently has become subject to substantial change, in part in order to achieve equivalence under Solvency II, the EU regulatory regime enacted in November 2009 and that imposes new solvency and governance requirements across all EU Member States.
On November 26, 2015, the European Commission (the “EC”) adopted a Delegated Act that recognizes Bermuda’s regulatory framework for insurance and reinsurance activities of companies with their head offices in Bermuda, as well as for supervision of insurance and reinsurance groups, with the exception of captives and special purpose insurers, as being fully equivalent to regulatory standards applied to European insurance and reinsurance companies and groups in accordance with the requirements of Solvency II. The Delegated Act was confirmed on March 24, 2016 and was applied retroactively to January 1, 2016, the date Solvency II came into effect. The EC’s decision followed substantial changes to Bermuda’s regulatory framework, including the adoption of the Insurance Amendment (No 2) Act 2015 in July 2015 that entered into force on January 1, 2016, the amendment to the Insurance Code of Conduct with effect from July 2015 and the adoption of revised insurance prudential rules by the BMA that entered into force on January 1, 2016. As many of these changes only came into effect on January 1, 2016, their impact on insurers and reinsurers on companies subject to Bermudian regulation, such as Third Point Re BDA and Third Point Re USA, is unclear.
While we cannot predict the future impact on our operations of changes in the laws and regulation to which we are or may become subject, any such changes could have a material adverse effect on our business, financial condition and results of operations.
Bermuda insurance laws regarding the change of control of insurance companies may limit the acquisition of our shares.
Under Bermuda law, for so long as we have an insurance subsidiary registered under the Insurance Act, the BMA may at any time, by written notice, object to a person holding 10% or more of our common shares if it appears to the BMA that the person is not or is no longer fit and proper to be such a holder. In such a case, the BMA may require the shareholder to reduce its holding of our common shares and direct, among other things, that such shareholder’s voting rights attaching to the common shares shall not be exercisable. A person who does not comply with such a notice or direction from the BMA will be guilty of an offense. This may discourage potential acquisition proposals and may delay, deter or prevent a change of control of our company, including through transactions, and in particular unsolicited transactions, that some or all of our shareholders might consider to be desirable.
Risks Relating to Taxation
In addition to the risk factors discussed below, we advise you to read “Certain Tax Considerations” and to consult your own tax advisor regarding the tax consequences to you of your investment in our shares.
We may be subject to United States federal income taxation.
We are incorporated under the laws of Bermuda and we believe that our activities, as currently conducted (including through our U.S.-based subsidiary, Third Point Re USA) and as contemplated, will not cause us to be treated as engaging in a United States trade or business and will not cause us to be subject to current United States federal income taxation on our net income, except with respect to Third Point Re USA, which is treated as a domestic corporation for U.S. federal income tax purposes. However, because there are no definitive standards provided by the Internal Revenue Code of 1986 as amended or the Code, regulations or court decisions as to the specific activities that constitute being engaged in the conduct of a trade or business within the United States, and as any such determination is essentially factual in nature and must be made annually, we cannot assure you that the United States Internal Revenue Service, or the IRS, will not successfully assert that we are engaged in a trade or business in the United States or, if applicable under the income tax treaty between the U.S. and Bermuda (the “Bermuda Treaty”), engaged in a trade or business in the United States through a permanent establishment, and thus are subject to current United States federal income
45
taxation. If we were deemed to be engaged in a trade or business in the United States (and, if applicable under the Bermuda Treaty, were deemed to be so engaged through a permanent establishment), Third Point Re BDA generally would become subject to United States federal income tax on its income “effectively connected” (or treated as effectively connected) with the U.S. trade or business, and would become subject to the “branch profits” tax on its earnings and profits that are both effectively connected with the U.S. trade or business and deemed repatriated out of the United States. Any such federal tax liability could materially and adversely affect our operations and financial condition.
United States persons who own our shares may be subject to United States federal income taxation on our undistributed earnings and may recognize ordinary income upon disposition of shares.
Passive Foreign Investment Company (“PFIC”).
Significant potential adverse U.S. federal income tax consequences generally apply to any United States person who owns shares in a PFIC. In general, either we and/or Third Point Re BDA would be a PFIC for a taxable year if 75% or more of its income constitutes “passive income” or 50% or more of its assets were held to produce “passive income.” Passive income generally includes interest, dividends and other investment income, but does not include income derived in the active conduct of an insurance business by a corporation predominantly engaged in an insurance business. This exception for insurance companies is intended to ensure that a bona fide insurance company’s income is not treated as passive income, except to the extent such income is attributable to financial reserves in excess of the reasonable needs of the insurance business. However, there is very little authority as to what constitutes the active conduct of an insurance business for purposes of the PFIC rules. The “Tax Cuts and Jobs Act,” P.L. 115-97 (the “TCJA”), modified the insurance exception to apply to a company only if (i) the company would be taxed as an insurance company were it a U.S. corporation and (ii) either (A) loss and loss adjustment expenses and certain reserves constitute more than 25% of the company’s gross assets for the relevant year or (B) a specified exception applies. By adding an additional “bright line” test to the existing PFIC requirements, the TCJA significantly increases the risk that a non-US insurer will be treated as a PFIC, even if it actively conducts insurance operations. There remain significant uncertainties as to the interpretation of the PFIC active insurance exception given the lack of final IRS regulations. Consequently, although we intend to operate, as practicable, in a manner to avoid being classified as a PFIC, there can be no assurance that we will be able to satisfy the requirements of the TCJA.
The IRS has notified taxpayers in IRS Notice 2003-34 that it intends to scrutinize the activities of certain insurance companies located outside of the United States, including reinsurance companies that invest a significant portion of their assets in alternative investment strategies, to determine whether such companies qualify for the active insurance company exception in the PFIC rules. Prior to the TCJA, the IRS proposed regulations did not provide a significant amount of clarity on the requirements for the exception. At this time it is unclear whether final regulations will include a specific methodology for satisfying the exception and how any such methodology would apply to us. The proposed regulations will be effective if issued in final form.
We believe that our financial reserves are consistent with industry standards and are not in excess of the reasonable needs of our insurance business, that we are actively engaged in insurance activities that involve sufficient transfer of risk, that our employees and officers provide substantial managerial and operational services and that we will have a sufficient proportion of qualifying insurance liabilities. However, we cannot assure you the IRS will agree with our position and will not successfully assert that we do not qualify for the insurance exception, and, as discussed above, no assurance can be given that we will be able to operate in a manner to satisfy the additional requirements imposed by the TCJA in any given year. Moreover, our expectation with respect to any taxable year is based on the amount of risk that we expect to underwrite and the amount of insurance-related liabilities we expect to incur during that year. If we are unable to underwrite a sufficient amount of risk or have sufficient insurance-related liabilities for any taxable year, we and/or Third Point Re BDA might be treated as a PFIC. Furthermore, in certain circumstances, we may seek to manage the volatility of our reinsurance results by writing policies that contain certain contractual terms and conditions (such as loss ratio caps), which may cause the IRS to assert that such policies lack sufficient risk transfer to constitute insurance for United States federal income tax purposes, increasing the risk that we and/or Third Point Re BDA may be treated as a PFIC. Counsel to the Company and its subsidiaries (the “Group”) have never provided an opinion regarding the Group’s PFIC status due to the absence of applicable authority regarding the active insurance company exception and the dependence of the Group’s PFIC status on the actual operational results and other relevant facts for each taxable year. Readers are urged to consult their own tax advisors to assess their tolerance of this risk.
46
If a “United States person” holds our shares as “capital assets” within the meaning of section 1221 of the Code during any taxable year in which we and/or Third Point Re BDA are treated as PFICs, such shares will generally be treated as stock in a PFIC for all subsequent years. Certain elections designed to mitigate the adverse consequences of owning shares in a PFIC, including a “Protective QEF Election,” may be available. If you are a United States person, we advise you to consult your own tax advisor concerning the potential tax consequences to you under the PFIC rules, the advisability of making one of these elections and to assess your tolerance of this risk.
Controlled Foreign Corporations (“CFC”)
. United States persons who, directly or indirectly or through attribution rules, own 10% or more of the voting power or, under the TCJA, the value, of our shares, which we refer to as United States 10% shareholders, may be subject to the CFC rules. Under the CFC rules, each United States 10% shareholder must annually include its pro rata share of the CFC’s “subpart F income,” even if no distributions are made. In general (subject to the special rules applicable to “related person insurance income” described below), a foreign insurance company will be treated as a CFC only if United States 10% shareholders collectively own more than 25% of the total combined voting power or total value of the company’s shares at any time during any year. If you are a United States. person we strongly urge you to consult your own tax advisor concerning the controlled foreign corporation rules.
Related Person Insurance Income
. If (a) our gross income attributable to insurance or reinsurance policies pursuant to which the direct or indirect insureds or our direct or indirect United States shareholders or persons related to such United States shareholders equals or exceeds 20% of our gross insurance income in any taxable year; and (b) direct or indirect insureds and persons related to such insureds own directly or indirectly 20% or more of the voting power or value of our shares, a United States. person who owns any shares directly or indirectly on the last day of the taxable year would most likely be required to include its allocable share of our related person insurance income for the taxable year in its income, even if no distributions are made. We do not expect that it is likely that either or both of the 20% gross insurance income threshold or the 20% direct or indirect ownership threshold will be met. However, we cannot assure you that this will be the case. Consequently, we cannot assure you that a person who is a direct or indirect United States shareholder will not be required to include amounts in its income in respect of related person insurance income in any taxable year.
Dispositions of Our Shares.
If a United States shareholder is treated as disposing of shares in a CFC of which it is a United States 10% shareholder, or of shares in a foreign insurance corporation that has related person insurance income and in which United States persons collectively own 25% or more of the voting power or value of the company’s share capital, any gain from the disposition will generally be treated as a dividend to the extent of the United States shareholder’s portion of the corporation’s undistributed earnings and profits, as the case may be, that were accumulated during the period that the U.S. shareholder owned the shares. In addition, the shareholder will be required to comply with certain reporting requirements, regardless of the amount of shares owned by the direct or indirect United States shareholder. Although not free from doubt, we believe it would be reasonable for a United States person to take the position that these rules should not apply to dispositions of our shares because we should not have any United States 10% shareholders and will not be directly engaged in the insurance business. We cannot assure you, however, that the IRS will interpret the proposed regulations potentially applicable to such dispositions in this manner or that the proposed regulations will not be promulgated in final form in a manner that would cause these rules to apply to dispositions of our shares.
United States tax-exempt organizations who own our shares may recognize unrelated business taxable income.
A United States tax-exempt organization may recognize unrelated business taxable income if a portion of our subpart F insurance income is allocated to it. In general, subpart F insurance income will be allocated to a tax-exempt organization owning (or treated as owning) our shares if we are a CFC as discussed above and it is a United States 10% shareholder or we earn related person insurance income and the exceptions described above do not apply. We cannot assure you that United States persons holding our shares (directly or indirectly) will not be allocated subpart F insurance income. United States tax-exempt organizations should consult their own tax advisors regarding the risk of recognizing unrelated business taxable income as a result of the ownership of our shares.
Change in United States tax laws may be retroactive and could subject us to increased taxes and/or United States persons who own our shares to United States income taxation on our undistributed earnings and could adversely affect our operations and financial condition.
47
New tax laws and regulations and changes in existing tax laws and regulations are continuously being enacted that could result in increased tax expenditures in the future.
The tax laws and interpretations thereof regarding whether a company is engaged in a United States trade or business, is a CFC, has related party insurance income or is a PFIC are subject to change, possibly on a retroactive basis. The regulations regarding the application of the passive foreign investment company rules to an insurance company and regarding related party insurance income are in proposed form. New regulations or pronouncements interpreting or clarifying such rules may be forthcoming from the IRS. We are not able to predict if, when or in what form such guidance will be provided and whether such guidance will have a retroactive effect.
Our affiliate transactions may be subject to the base erosion and anti-abuse tax (“BEAT”).
The TCJA imposes a minimum tax (the “BEAT”) on certain payments by United States corporations to a related foreign corporation, which could impose material incremental taxes on reinsurance transactions between Third Point Re USA and Third Point Re BDA, unless Third Point Re USA qualifies for exceptions for taxpayers whose gross receipts or affiliate payments fall under specified thresholds. Although we presently expect that Third Point Re USA would qualify for one of the exceptions, there can be no assurance that the BEAT will not apply to Third Point Re USA.
We may become subject to U.S. withholding and information reporting requirements under the Foreign Account Tax Compliance Act (“FATCA”) provisions.
Under the Foreign Account Tax Compliance Act provisions of the Code and related U.S. Treasury guidance (“FATCA”), a withholding tax of 30% will be imposed in certain circumstances on (i) payments of certain U.S. source income (including interest and dividends) (“withholdable payments”) and (ii) payments made two or more years after the date on which the final U.S. Treasury regulations that define “foreign passthru payments” are published by certain foreign financial institutions (such as banks, brokers, investment funds or certain holding companies) (“FFIs”) that are “attributable” to withholdable payments (“foreign passthru payments”). It is uncertain at present when payments will be treated as “attributable” to withholdable payments.
On December 19, 2013, the Bermuda Government entered into a “Model 2” intergovernmental agreement (“IGA”) with the United States to implement FATCA. If we and/or Third Point Re BDA are treated as FFIs for the purposes of FATCA, under the Model 2 IGA, we and/or Third Point Re BDA will be directed to register with the IRS and required to comply with the requirements of FATCA, including due diligence, reporting and withholding. Assuming registration and compliance with the terms of an agreement with the IRS (an “FFI Agreement”) pursuant to a Model 2 IGA, an FFI would be treated as FATCA compliant and not subject to withholding. An FFI that satisfies the eligibility, information reporting and other requirements of the IGA will not be subject to the regular FATCA reporting and withholding obligations discussed below.
If the Company and/or Third Point Re BDA are treated as FFIs for purposes of FATCA, withholdable payments and foreign passthru payments made to the Company and/or Third Point Re BDA will be subject to a 30% withholding tax unless an FFI Agreement is in effect, pursuant to which the Company and/or Third Point Re BDA would be required to provide information regarding its U.S. direct or indirect owners and to comply with other reporting, verification, due diligence and other procedures established by the IRS, including a requirement to seek waivers of non-U.S. laws that would prevent the reporting of such information. The IRS may terminate the FFI Agreement if the IRS notifies the Company and/or Third Point Re BDA that it is out of compliance with the FFI Agreement and the Company and/or Third Point Re BDA does not remediate the compliance failure. Even if the Company and/or Third Point Re BDA are subject to an FFI Agreement, distributions to an investor that are treated as foreign passthru payments generally will be subject to a 30% withholding tax (a) if the investor fails to provide information or take other actions required for the the Company and/or Third Point Re BDA to comply with the FFI Agreement including, in the case of a non-U.S. investor, providing information regarding certain U.S. direct and indirect owners of the investor (and, in certain circumstances, obtaining waivers of non-U.S. law to permit such reporting), or (b) if the investor is an FFI, unless the investor (i) is subject to an FFI Agreement, (ii) establishes that an exemption applies or (iii) is required to comply with FATCA under an applicable IGA.
Under the regulations implementing FATCA, a foreign insurance company (or foreign holding company of an insurance company) that issues or is obligated to make payments with respect to an account is a foreign financial institution. For
48
this purpose, insurance contracts treated as having “cash value” and annuity contracts issued or maintained by a financial institution are considered accounts, and certain term life insurance contracts are not considered accounts. Insurance companies that issue only property and casualty insurance contracts, or that only issue life insurance contracts lacking cash value (or that provide for limited cash value) generally would not be considered FFIs under the final regulations. However, a holding company may be treated as an FFI if it is formed in connection with or availed of by a collective investment vehicle, mutual fund, exchange traded fund, hedge fund, venture capital fund, leveraged buyout fund, or any similar investment vehicle established with an investment strategy of investing, reinvesting, or trading in financial assets. Moreover, a company may be treated as an FFI if its gross income is primarily attributable to investing, reinvesting, or trading in financial assets and the entity is managed by an FFI, or the entity functions or holds itself out as an investment vehicle established with an investment strategy of investing, reinvesting, or trading in financial assets. Even if the Company and/or Third Point Re BDA are not treated as FFIs, then depending on whether the shares of the Company are treated as “regularly traded on one or more more established securities markets” under the FATCA rules and whether the income and assets of Third Point Re BDA meet the requirements for the treatment of Third Point Re BDA as an “active NFFE,” withholdable payments to the Company and/or Third Point Re BDA may be subject to a 30% withholding tax unless the Company and/or Third Point Re BDA provide information regarding its U.S. direct or indirect owners.
There can be no certainty as to whether the Company and/or Third Point Re BDA will be subject to the requirements imposed on FFIs under FACTA. We will use reasonable efforts to avoid the imposition of a withholding tax under FACTA, which may include the entering into of an FFI Agreement.
Risks Relating to Our Common Shares
Future sales of shares by existing shareholders could cause our share price to decline, even if our business is performing well.
Sales of substantial amounts of our common shares in the public market could occur at any time. These sales, or the perception that these sales could occur, could cause the market price of our common shares to decline.
A significant number of our common shares are currently restricted as a result of applicable securities laws, but are eligible for sale subject to the applicable volume, manner of sale, holding period and other limitations of Rule 144. As of
December 31, 2018
, we also had reserved for issuance common shares underlying certain warrants to purchase, in the aggregate, up to
3,494,979
common shares. In addition, certain of our significant shareholders may distribute shares that they hold to their investors who themselves may then sell into the public market. Such sales may not be subject to the volume, manner of sale, holding period and other limitations of Rule 144. As resale restrictions end, the market price of our common shares could decline if the holders of those shares sell them or are perceived by the market as intending to sell them.
Certain existing holders of our common shares also have registration rights, subject to some conditions, to require us to file registration statements covering the sale of their shares or to include their shares in registration statements that we may file for ourselves or other shareholders in the future. In the event that we register the common shares for the holders of registration rights, they can be freely sold in the public market upon issuance, subject to certain limitations applicable to affiliates.
As of
December 31, 2018
, a total of 22,252,206 common shares were reserved for issuance under our current share incentive plans and in connection with restricted share award agreements entered into between us and certain of our employees and directors. As of
December 31, 2018
, there were share options outstanding (subject to vesting) for
8,888,053
common shares. We have registered on a Form S-8 registration statement these shares and all common shares that we may in future issue under our equity compensation plans. As a result, these shares can be freely sold in the public market upon issuance, subject to certain limitations applicable to affiliates.
In the future, we may issue additional common shares or other equity or debt securities convertible into common shares in connection with a financing, acquisition, litigation settlement or employee arrangement or otherwise. Any of these issuances could result in substantial dilution to our existing shareholders and could cause the trading price of our common shares to decline.
49
If securities analysts or industry analysts downgrade our common shares, publish negative research or reports or fail to publish reports about our business, our share price and trading volume could decline.
The trading market for our common shares is influenced by the research and reports that industry or securities analysts publish about us, our business and our market. If one or more analysts adversely changes their recommendation regarding our stock or our competitors’ stock, our share price would likely decline. If one or more analysts cease coverage of us or fail to regularly publish reports on us, we could lose visibility in the financial markets which in turn could cause our share price or trading volume to decline.
If the ownership of our common shares continues to be concentrated, it could prevent you and other shareholders from influencing significant corporate decisions.
Third Point Re was incorporated on October 6, 2011. On December 22, 2011, KIA TP Holdings, L.P. and KEP TP Holdings, L.P., which are affiliates of Kelso & Company (collectively, “Kelso”) and Pine Brook LVR, L.P., an affiliate of Pine Brook Road Partners, LLC (collectively, “Pine Brook”, and Pine Brook and together with Kelso, the “Lead Investors” and each individually, a “Lead Investor”), Dowling Capital Partners I, L.P., an affiliate of Dowling Capital Management, LLC (collectively, “Dowling”), P RE Opportunities Ltd. (“PROL”), Third Point LLC, Daniel S. Loeb and affiliates associated with Mr. Loeb (collectively, the “Loeb Entities”) and John R. Berger (collectively, the “Founders”), together with certain members of management, committed $533.0 million to capitalize Third Point Re. As of
December 31, 2018
, Kelso, BlackRock, Inc., the Loeb Entities and the Company’s directors and named executive officers, as defined in the proxy statement, beneficially own approximately
11.5%
,
12.0%
, 9.5% and
8.2%
of our issued and outstanding common shares, respectively, on an as converted basis after giving effect to the issuance of vested warrants and options representing the right to purchase
10,834,938
common shares. As a result, Kelso, BlackRock, Inc., the Loeb Entities, our directors and named executive officers could exercise influence over matters requiring shareholder approval, including approval of significant corporate transactions, which may reduce the market price of our common shares.
The interests of the shareholders specified above may conflict with the interests of our other shareholders. Our Board of Directors has adopted corporate governance guidelines that, among other things, address potential conflicts between a director’s interests and our interests. In addition, we have adopted a Code of Business Conduct and Ethics that, among other things, require our employees to avoid actions or relationships that might conflict or appear to conflict with their job responsibilities or our interests and to disclose their outside activities, financial interests or relationships that may present a possible conflict of interest or the appearance of a conflict to our General Counsel. These corporate governance guidelines and Code of Business Conduct and Ethics do not, by themselves, prohibit transactions with our Founders.
The market price of our common shares may fluctuate significantly.
The market price of our common shares may fluctuate significantly. Among the factors that could affect our share price are:
|
•
|
industry or general market conditions;
|
|
•
|
domestic and international economic factors unrelated to our performance;
|
|
•
|
changes in our clients’ needs;
|
|
•
|
new regulatory pronouncements and changes in regulatory guidelines;
|
|
•
|
lawsuits, enforcement actions and other claims by third parties or governmental authorities;
|
|
•
|
actual or anticipated fluctuations in our quarterly operating results;
|
|
•
|
changes in securities analysts' estimates of our financial performance or lack of research and reports by industry analysts;
|
|
•
|
action by institutional shareholders or other large shareholders (including the Founders), including future sales;
|
|
•
|
speculation in the press or investment community;
|
|
•
|
investor perception of us and our industry;
|
|
•
|
changes in market valuations or earnings of similar companies;
|
50
|
•
|
any announcement by us or our competitors of a significant contract, acquisition, strategic transaction or expansion into a new line of business;
|
|
•
|
any future sales of our common shares or other securities; and
|
|
•
|
additions or departures of key personnel.
|
The stock markets have experienced volatility in recent years that has been unrelated to the operating performance of particular companies. These broad market fluctuations may adversely affect the market price of our common shares. In the past, following periods of volatility in the market price of a company's securities, class action litigation has often been instituted against such company. Any litigation of this type brought against us could result in substantial costs and a diversion of management's attention and resources, which would harm our business, operating results and financial condition.
We do not intend to pay dividends on our common shares and, consequently, your ability to achieve a return on your investment will depend on appreciation in the price of our common shares.
We do not intend to declare and pay dividends on our share capital for the foreseeable future. We currently intend to invest our future earnings, if any, to fund our growth. Therefore, you are not likely to receive any dividends on your common shares for the foreseeable future and the success of an investment in our common shares will depend upon any future appreciation in their value. There is no guarantee that our common shares will appreciate in value or even maintain the price at which our shareholders have purchased their shares.
We may repurchase our common shares without our shareholders’ consent.
Under our bye-laws and subject to Bermuda law, we have the option, but not the obligation, to require a shareholder to sell to us at fair market value the minimum number of common shares that is necessary to avoid or cure any adverse tax consequences or materially adverse legal or regulatory treatment to us, our subsidiaries or our shareholders if our Board of Directors reasonably determines, in good faith, that failure to exercise our option would result in such adverse consequences or treatment.
Holders of our shares may have difficulty effecting service of process on us or enforcing judgments against us in the United States.
We are incorporated pursuant to the laws of Bermuda and our business is based in Bermuda. In addition, certain of our directors and officers reside outside the United States, and all or a substantial portion of our assets are located in jurisdictions outside the United States. As such, we have been advised that there is doubt as to whether:
|
•
|
a holder of our shares would be able to enforce, in the courts of Bermuda, judgments of United States courts against persons who reside in Bermuda based upon the civil liability provisions of the United States federal securities laws;
|
|
•
|
a holder of our shares would be able to enforce, in the courts of Bermuda, judgments of United States courts based upon the civil liability provisions of the United States federal securities laws;
|
|
•
|
a holder of our shares would be able to bring an original action in the Bermuda courts to enforce liabilities against us or our directors and officers who reside outside the United States based solely upon United States federal securities laws.
|
Further, we have been advised that there is no treaty in effect between the United States and Bermuda providing for the enforcement of judgments of United States courts, and there are grounds upon which Bermuda courts may not enforce judgments of United States courts. Because judgments of United States courts are not automatically enforceable in Bermuda, it may be difficult for you to recover against us based upon such judgments.
U.S. persons who own our shares may have more difficulty in protecting their interests than U.S. persons who are shareholders of a U.S. corporation.
The Companies Act, which applies to us, differs in certain material respects from laws generally applicable to U.S. corporations and their shareholders. Set forth below is a summary of certain significant provisions of the Companies
51
Act and our bye-laws which differ in certain respects from provisions of Delaware corporate law. Because the following statements are summaries, they do not discuss all aspects of Bermuda law that may be relevant to us and our shareholders.
Interested Directors
: Bermuda law provides that we cannot void any transaction we enter into in which a director has an interest, nor can such director be liable to us for any profit realized pursuant to such transaction, provided the nature of the interest is disclosed at the first opportunity at a meeting of directors, or in writing, to the directors. Under Delaware law such transaction would not be voidable if:
|
•
|
the material facts as to such interested director’s relationship or interests were disclosed or were known to the Board of Directors and the Board of Directors had in good faith authorized the transaction by the affirmative vote of a majority of the disinterested directors;
|
|
•
|
such material facts were disclosed or were known to the shareholders entitled to vote on such transaction and the transaction were specifically approved in good faith by vote of the majority of shares entitled to vote thereon; or
|
|
•
|
the transaction were fair as to the corporation as of the time it was authorized, approved or ratified. Under Delaware law, the interested director could be held liable for a transaction in which the director derived an improper personal benefit.
|
Business Combinations with Large Shareholders or Affiliates
: As a Bermuda company, we may enter into business combinations with our large shareholders or affiliates, including mergers, asset sales and other transactions in which a large shareholder or affiliate receives, or could receive, a financial benefit that is greater than that received, or to be received, by other shareholders, without obtaining prior approval from our Board of Directors or from our shareholders. If we were a Delaware corporation, we would need prior approval from our Board of Directors or a super-majority of our shareholders to enter into a business combination with an interested shareholder for a period of three years from the time the person became an interested shareholder, unless we opted out of the relevant Delaware statute. Our bye-laws include a provision restricting business combinations with interested shareholders consistent with the corresponding Delaware statute.
Shareholders’ Suits
: The rights of shareholders under Bermuda law are not as extensive as the rights of shareholders in many United States jurisdictions. Class actions and derivative actions are generally not available to shareholders under the laws of Bermuda. However, the Bermuda courts ordinarily would be expected to follow English case law precedent, which would permit a shareholder to commence an action in the name of the company to remedy a wrong done to the company where an act is alleged to be beyond the corporate power of the company, is illegal or would result in the violation of our memorandum of association or bye-laws. Furthermore, a court would consider acts that are alleged to constitute a fraud against the minority shareholders or where an act requires the approval of a greater percentage of our shareholders than actually approved it. The winning party in such an action generally would be able to recover a portion of attorneys’ fees incurred in connection with such action. Our bye-laws provide that shareholders waive all claims or rights of action that they might have, individually or in the right of the company, against any director or officer for any act or failure to act in the performance of such director’s or officer’s duties, except with respect to any fraud or dishonesty of such director or officer. Class actions and derivative actions generally are available to shareholders under Delaware law for, among other things, breach of fiduciary duty, corporate waste and actions not taken in accordance with applicable law. In such actions, the court has discretion to permit the winning party to recover attorneys’ fees incurred in connection with such action.
Indemnification of Directors
: We have entered into indemnification agreements with our directors. The indemnification agreements provide that we will indemnify our directors or officers or any person appointed to any committee by the Board of Directors acting in their capacity as such in relation to any of our affairs for any loss arising or liability attaching to them by virtue of any rule of law in respect of any negligence, default, breach of duty or breach of trust of which such person may be guilty in relation to the company other than in respect of his own fraud or dishonesty. Under Delaware law, a corporation may indemnify a director or officer of the corporation against expenses (including attorneys’ fees), judgments, fines and amounts paid in settlement actually and reasonably incurred in defense of an action, suit or proceeding by reason of such position if such director or officer acted in good faith and in a manner he or she reasonably believed to be in or not be opposed to the best interests of the corporation and, with respect to any criminal action or proceeding, such director or officer had no reasonable cause to believe his or her conduct was unlawful.
52
Provisions in our bye-laws may reduce or increase the voting rights of our shares.
In general, and except as provided under our bye-laws and as described below, the common shareholders have one vote for each common share held by them and are entitled to vote, on a non-cumulative basis, at all meetings of shareholders. However, if, and so long as, the shares of a shareholder are treated as “controlled shares” (as determined pursuant to sections 957 and 958 of the Code of any United States person (that owns shares directly or indirectly through non-U.S. entities) and such controlled shares constitute 9.5% or more of the votes conferred by our issued shares, the voting rights with respect to the controlled shares owned by such United States person will be limited, in the aggregate, to a voting power of less than 9.5%, under a formula specified in our bye-laws. The formula is applied repeatedly until the voting power of all 9.5% U.S. shareholders has been reduced to less than 9.5%. In addition, our Board of Directors may limit a shareholder’s voting rights when it deems it appropriate to do so to (i) avoid the existence of any 9.5% U.S. shareholder; and (ii) avoid certain material adverse tax, legal or regulatory consequences to us, any of our subsidiaries or any direct or indirect shareholder or its affiliates. “Controlled shares” include, among other things, all shares that a United States person is deemed to own directly, indirectly or constructively (within the meaning of section 958 of the Code). The amount of any reduction of votes that occurs by operation of the above limitations will generally be reallocated proportionately among our other shareholders whose shares were not “controlled shares” of the 9.5% U.S. shareholder so long as such reallocation does not cause any person to become a 9.5% U.S. Shareholder.
Under these provisions, certain shareholders may have their voting rights limited, while other shareholders may have voting rights in excess of one vote per share. Moreover, these provisions could have the effect of reducing the votes of certain shareholders who would not otherwise be subject to the 9.5% limitation by virtue of their direct share ownership.
We are authorized under our bye-laws to request information from any shareholder for the purpose of determining whether a shareholder’s voting rights are to be reallocated under the bye-laws. If any holder fails to respond to this request or submits incomplete or inaccurate information, we may, in our sole discretion, eliminate the shareholder’s voting rights. Any shareholder must give notice to us within ten days following the date it owns 9.5% of our common shares.
Our bye-laws contain provisions that could discourage takeovers and business combinations that our shareholders might consider in their best interests.
Our bye-laws include certain provisions that could have the effect of delaying, deterring, preventing or rendering more difficult a change in control of us that our shareholders might consider in their best interests.
For example, our bye-laws:
|
•
|
provide the right of shareholders to act by majority written consent for so long as the Lead Investors and the Loeb Entities collectively hold at least 35% of our issued and outstanding common shares;
|
|
•
|
establish a classified Board of Directors;
|
|
•
|
require advance notice of shareholders’ proposals in connection with annual general meetings;
|
|
•
|
authorize our board to issue “blank cheque” preferred shares;
|
|
•
|
prohibit us from engaging in a business combination with a person who acquires at least 15% of our common shares for a period of three years from the date such person acquired such common shares unless board and shareholder approval is obtained prior to the acquisition;
|
|
•
|
require that directors only be removed from office for cause by majority shareholder vote once the Lead Investors and the Loeb Entities cease to collectively hold at least 35% of our issued and outstanding shares;
|
|
•
|
allow each of Kelso and Pine Brook to appoint one director for so long as they hold not less than 25% of the number of shares respectively held as of December 22, 2011;
|
|
•
|
require a supermajority vote of shareholders to effect certain amendments to our memorandum of association and bye-laws; and
|
|
•
|
provide a consent right on the part of Kelso, Pine Brook and Daniel S. Loeb to any amendments to our bye-laws or memorandum of association which would have a material adverse effect on their rights for so long as they hold not less than 25% of the number of shares respectively held as of December 22, 2011.
|
53
Any such provision could prevent our shareholders from receiving the benefit from any premium to the market price of our common shares offered by a bidder in a takeover context. Even in the absence of a takeover attempt, the existence of any of these provisions could adversely affect the prevailing market price of our common shares if they were viewed as discouraging takeover attempts in the future.
Item 1B. Unresolved Staff Comments
None.
Item 2. Properties
The Company leases office space in Pembroke, Bermuda where the Company’s principal executive office is located. Additionally, the Company leases office space in Jersey City, New Jersey for Third Point Re USA’s operations. We renew and enter into new leases in the ordinary course of business. For further discussion of our leasing commitments at
December 31, 2018
, refer to Note
23
to the accompanying consolidated financial statements.
Item 3. Legal Proceedings
We are not currently involved in any litigation or arbitration. We anticipate that, similar to the rest of the reinsurance industry, we will be subject to litigation and arbitration from time to time in the ordinary course of business.
If we are subject to disputes in the ordinary course of our business we anticipate engaging in discussions with the parties to the applicable contract to seek to resolve the matter. If such discussions are unsuccessful, we anticipate invoking the dispute resolution provisions of the relevant contract, which typically provide for the parties to submit to arbitration or litigation, as applicable, to resolve the dispute.
Item 4. Mine Safety Disclosures
Not applicable.
PART II
Item 5. Market for Registrant’s Common Equity, Related Shareholder Matters and Issuer Purchases of Equity Securities
Market Information
Our common shares are listed on the NYSE under the symbol “TPRE”. On February 25,
2019
, the latest practicable date, the last reported sale price of our common shares was $11.23 per share and there were 53 holders of record of our common shares. This number does not include shareholders for whom our shares were held in “street” name.
Dividends
We do not currently expect to declare or pay dividends on our common shares for the foreseeable future. Instead, we intend to retain earnings to finance the growth and development of our business and for working capital and general corporate purposes. Any payment of dividends will be at the discretion of our Board of Directors and will depend upon various factors then existing, including earnings, financial condition, results of operations, capital requirements, level of indebtedness, contractual restrictions with respect to payment of dividends, restrictions imposed by applicable law, general business conditions and other factors that our Board of Directors may deem relevant. In addition, under the Companies Act, we may not declare or pay a dividend if there are reasonable grounds for believing that we are, or would after the payment be, unable to pay our liabilities as they become due or that the realized value of our assets would thereafter be less than our liabilities.
Equity Compensation Plans
The following table presents information concerning the securities authorized for issuance pursuant to our equity compensation plans as of
December 31, 2018
:
|
Number of securities to be issued upon exercise of outstanding options, warrants and rights
(1)
|
Weighted-average exercise price of outstanding options, warrants and rights
(2)
|
Number of securities available for future issuance under equity compensation plans (excluding securities reflected in Column 1)
(3)
|
|||||||
|
Equity compensation plans approved by shareholders
|
8,888,053
|
|
$
|
13.43
|
|
9,017,930
|
|
||
|
Equity compensation plans not approved by shareholders
|
—
|
|
n/a
|
|
—
|
|
|||
|
Total
|
8,888,053
|
|
$
|
13.43
|
|
9,017,930
|
|
||
(1) Represents the number of shares associated with options outstanding as of
December 31, 2018
.
(2) Represents the weighted average exercise price of options disclosed.
(3) Represents the number of shares remaining available for issuance with respect to future awards under our Omnibus Equity Incentive Plan.
54
Performance
The following graph compares the cumulative total shareholder return on our common shares as compared to the cumulative total return of (1) S&P 500 Composite Stock Index (“S&P 500”) and (2) the Dow Jones Property & Casualty Insurance Index (“Dow Jones P&C”) for the five year period commencing December 31, 2013 through to
December 31, 2018
. The share price performance presented below is not necessarily indicative of future results.
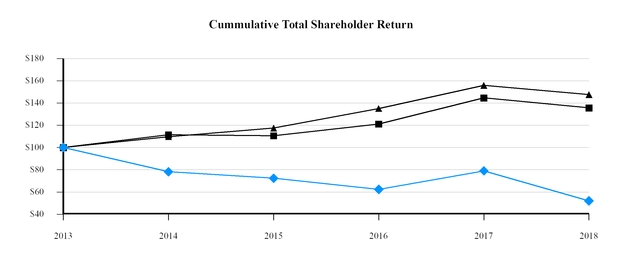
|
December 31, 2013
|
|
December 31, 2014
|
|
December 31, 2015
|
|
December 31, 2016
|
|
December 31, 2017
|
|
December 31, 2018
|
|
|||||||||||||
|
t
TPRE
|
$
|
100.00
|
|
$
|
78.20
|
|
$
|
72.37
|
|
$
|
62.33
|
|
$
|
79.06
|
|
$
|
52.02
|
|
||||||
|
■S&P 500
|
$
|
100.00
|
|
$
|
111.39
|
|
$
|
110.58
|
|
$
|
121.13
|
|
$
|
144.65
|
|
$
|
135.63
|
|
||||||
|
p
Dow Jones P&C
|
$
|
100.00
|
|
$
|
109.80
|
|
$
|
117.51
|
|
$
|
135.09
|
|
$
|
155.86
|
|
$
|
147.58
|
|
||||||
|
1.
|
The above graph assumes that the value of the investment was $100 on December 31, 2013.
|
|
2.
|
This graph is not “soliciting material,” is not deemed filed with the SEC and is not to be incorporated by reference in any filing by us under the Securities Act of 1933 or the Securities and Exchange Act of 1934, whether made before or after the date hereof and irrespective of any general incorporation language in any such filing.
|
Issuer Purchases of Equity Securities
The following table summarizes our repurchase of common shares during the three months ended
December 31, 2018
:
|
(a) Total number of shares purchased
|
(b) Average price paid per share (1)
|
(c) Total number of shares purchased as part of publicly announced plans or programs
|
(d) Maximum number of shares that may yet be purchased under the plans or programs (2)
|
||||||||||
|
October 1, 2018 - October 31, 2018
|
—
|
|
$
|
—
|
|
—
|
|
$
|
66,620,294
|
|
|||
|
November 1, 2018 - November 30, 2018
|
268,228
|
|
10.54
|
|
268,228
|
|
63,792,097
|
|
|||||
|
December 1, 2018 - December 31, 2018
|
257,557
|
|
9.69
|
|
257,557
|
|
61,295,462
|
|
|||||
|
Total
|
525,785
|
|
$
|
10.13
|
|
525,785
|
|
$
|
61,295,462
|
|
|||
(1) Including commissions.
(2) On February 28, 2018, the Company’s Board of Directors authorized the repurchase of an additional $148.3 million common shares, which, together with the shares remaining under the share repurchase program previously authorized on May 4, 2016, will allow the Company to repurchase up to $200.0 million more of the Company’s outstanding common shares in the aggregate.
During the year ended
December 31, 2018
, the Company repurchased
10,311,123
(December 31,
2017
-
3,300,152
) of its common shares in the open market for an aggregate cost of $
138.7 million
(December 31,
2017
-
$40.9 million
) at a weighted average cost, including commissions, of $
13.45
(December 31,
2017
-
$12.38
) per share. Common shares repurchased by the Company were not canceled and are classified as treasury shares.
As of
December 31, 2018
, the Company was authorized to repurchase up to an aggregate of
$61.3 million
of additional common shares under its share repurchase program.
55
Item 6. Selected Financial Data.
The following tables set forth certain of our selected financial data as of and for the years ended December 31,
2018
,
2017
,
2016
,
2015
and
2014
and has been derived from our consolidated financial statements. Our historical results are not necessarily indicative of the results that may be expected for any future period. The selected financial data should be read in conjunction with Part II, Item 7. “Management’s Discussion and Analysis of Financial Condition and Results of Operations” and our consolidated financial statements and related notes included elsewhere in this Annual Report.
|
2018
|
2017
|
2016
|
2015
|
2014
|
|||||||||||||||
|
($ in thousands, except share and per share data)
|
|||||||||||||||||||
|
Selected Statement of Income (Loss) Data:
|
|||||||||||||||||||
|
Net premiums written
|
$
|
558,357
|
|
$
|
639,145
|
|
$
|
615,049
|
|
$
|
700,538
|
|
$
|
613,150
|
|
||||
|
Net premiums earned
|
621,442
|
|
547,058
|
|
590,190
|
|
602,824
|
|
444,532
|
|
|||||||||
|
Net investment income (loss)
|
(251,433
|
)
|
391,953
|
|
98,825
|
|
(28,074
|
)
|
85,582
|
|
|||||||||
|
Loss and loss adjustment expenses incurred, net
|
438,414
|
|
370,058
|
|
395,932
|
|
415,191
|
|
283,147
|
|
|||||||||
|
Acquisition costs, net
|
206,498
|
|
188,904
|
|
222,150
|
|
191,216
|
|
137,206
|
|
|||||||||
|
General and administrative expenses
|
36,241
|
|
53,103
|
|
39,367
|
|
46,033
|
|
40,008
|
|
|||||||||
|
Other expenses
|
9,610
|
|
12,674
|
|
8,387
|
|
8,614
|
|
7,395
|
|
|||||||||
|
Interest expense
|
8,228
|
|
8,225
|
|
8,231
|
|
7,236
|
|
—
|
|
|||||||||
|
Foreign exchange gains (losses)
|
7,503
|
|
(12,300
|
)
|
19,521
|
|
3,196
|
|
—
|
|
|||||||||
|
Income tax (expense) benefit
|
4,010
|
|
(11,976
|
)
|
(5,593
|
)
|
2,905
|
|
(5,648
|
)
|
|||||||||
|
Net income (loss)
|
(317,469
|
)
|
281,771
|
|
28,876
|
|
(87,439
|
)
|
56,710
|
|
|||||||||
|
Net income (loss) available to Third Point Re common shareholders
|
$
|
(317,692
|
)
|
$
|
277,798
|
|
$
|
27,635
|
|
$
|
(87,390
|
)
|
$
|
50,395
|
|
||||
|
Basic earnings (loss) per share available to Third Point Re common shareholders
|
$
|
(3.27
|
)
|
$
|
2.71
|
|
$
|
0.26
|
|
$
|
(0.84
|
)
|
$
|
0.48
|
|
||||
|
Diluted earnings (loss) per share available to Third Point Re common shareholders
|
$
|
(3.27
|
)
|
$
|
2.64
|
|
$
|
0.26
|
|
$
|
(0.84
|
)
|
$
|
0.47
|
|
||||
|
Property and Casualty Reinsurance Segment - Selected Ratios
(1)
:
|
|||||||||||||||||||
|
Loss ratio
|
70.6
|
%
|
67.6
|
%
|
67.1
|
%
|
68.9
|
%
|
65.5
|
%
|
|||||||||
|
Acquisition cost ratio
|
33.2
|
%
|
34.5
|
%
|
37.6
|
%
|
31.7
|
%
|
31.5
|
%
|
|||||||||
|
Composite ratio
|
103.8
|
%
|
102.1
|
%
|
104.7
|
%
|
100.6
|
%
|
97.0
|
%
|
|||||||||
|
General and administrative expense ratio
|
3.0
|
%
|
5.6
|
%
|
3.8
|
%
|
4.1
|
%
|
5.2
|
%
|
|||||||||
|
Combined ratio
|
106.8
|
%
|
107.7
|
%
|
108.5
|
%
|
104.7
|
%
|
102.2
|
%
|
|||||||||
|
Net investment return on investments managed by TP LLC
(2)
|
(10.8
|
)%
|
17.7
|
%
|
4.2
|
%
|
(1.6
|
)%
|
5.1
|
%
|
|||||||||
|
(1)
|
Underwriting ratios are for the property and casualty reinsurance segment only. See additional information in
Note 24
to our consolidated financial statements included elsewhere in this Annual Report. Underwriting ratios are calculated by dividing the related expense by net premiums earned.
|
|
(2)
|
The net investment return on investments managed by Third Point LLC is the percentage change in value of a dollar invested over the reporting period on our net investment assets managed by Third Point LLC, net of noncontrolling interests. The stated return is net of withholding taxes, which were presented as a component of income tax expense (benefit) in our
consolidated statements of income (loss)
prior to the change in the investment account structure described in Note 4 to our audited financial statements. In addition, for the year ended December 31, 2018, the stated return reflect the combined results of net investments managed by Third Point LLC prior to the transition date of August 31, 2018 and the investment in the Third Point Enhanced LP and collateral assets from the date of transition. Net investment return is the key indicator by which we measure the performance of Third Point LLC, our investment manager.
|
56
|
2018
|
2017
|
2016
|
2015
|
2014
|
|||||||||||||||
|
($ in thousands, except per share data)
|
|||||||||||||||||||
|
Selected Balance Sheet Data:
|
|||||||||||||||||||
|
Total investments in securities
(1)
|
$
|
1,523,728
|
|
$
|
2,995,939
|
|
$
|
2,647,512
|
|
$
|
2,317,244
|
|
$
|
1,830,838
|
|
||||
|
Cash and cash equivalents
(2)
|
104,183
|
|
8,197
|
|
9,951
|
|
20,407
|
|
28,734
|
|
|||||||||
|
Restricted cash and cash equivalents
|
609,154
|
|
541,136
|
|
298,940
|
|
330,915
|
|
417,307
|
|
|||||||||
|
Reinsurance balances receivable, net
|
602,448
|
|
476,008
|
|
381,951
|
|
294,313
|
|
303,649
|
|
|||||||||
|
Deferred acquisition costs, net
|
203,842
|
|
258,793
|
|
221,618
|
|
197,093
|
|
155,901
|
|
|||||||||
|
Total assets
|
3,086,234
|
|
4,671,794
|
|
3,895,644
|
|
3,545,108
|
|
2,852,580
|
|
|||||||||
|
Reinsurance balances payable
|
69,701
|
|
41,614
|
|
43,171
|
|
24,119
|
|
27,040
|
|
|||||||||
|
Deposit liabilities
(3)
|
145,342
|
|
129,133
|
|
104,905
|
|
83,955
|
|
145,430
|
|
|||||||||
|
Unearned premium reserves
|
602,936
|
|
649,518
|
|
557,076
|
|
531,710
|
|
433,809
|
|
|||||||||
|
Loss and loss adjustment expense reserves
|
937,157
|
|
720,570
|
|
605,129
|
|
466,047
|
|
277,362
|
|
|||||||||
|
Total liabilities
(1)
|
1,881,660
|
|
2,902,079
|
|
2,445,919
|
|
2,149,225
|
|
1,300,532
|
|
|||||||||
|
Shareholders’ equity attributable to Third Point Re common shareholders
|
1,204,574
|
|
1,656,089
|
|
1,414,051
|
|
1,379,726
|
|
1,451,913
|
|
|||||||||
|
Total shareholders’ equity
|
$
|
1,204,574
|
|
$
|
1,661,496
|
|
$
|
1,449,725
|
|
$
|
1,395,883
|
|
$
|
1,552,048
|
|
||||
|
Book value per share data:
|
|||||||||||||||||||
|
Basic book value per share
(4)
|
$
|
13.15
|
|
$
|
16.33
|
|
$
|
13.57
|
|
$
|
13.23
|
|
$
|
14.04
|
|
||||
|
Diluted book value per share
(4)
|
$
|
12.98
|
|
$
|
15.65
|
|
$
|
13.16
|
|
$
|
12.85
|
|
$
|
13.55
|
|
||||
|
Selected ratios:
|
|||||||||||||||||||
|
Change in diluted book value per share
(4)
|
(17.1
|
)%
|
18.9
|
%
|
2.4
|
%
|
(5.2
|
)%
|
3.3
|
%
|
|||||||||
|
Return on beginning shareholders’ equity attributable to Third Point Re common shareholders
(4)
|
(20.0
|
)%
|
20.1
|
%
|
2.0
|
%
|
(6.0
|
)%
|
3.6
|
%
|
|||||||||
|
(1)
|
Effective August 31, 2018, Third Point Re and the TPRE Limited Partners entered into the 2018 LPA to invest in TP Fund, a related party investment fund. As a result, substantially all assets and related liabilities were transferred from the Company’s separate accounts to TP Fund and the TPRE Limited Partners received limited partnership interests in TP Fund in exchange. The TPRE Limited Partners no longer directly hold their invested assets and liabilities but instead, hold an investment in TP Fund. See Notes
4
and
11
to our consolidated financial statements included elsewhere in this Annual Report for additional information regarding the LPA and TP Fund.
|
|
(2)
|
Cash and cash equivalents consists of cash held in banks and other short-term, highly liquid investments with original maturity dates of ninety days or less.
|
|
(3)
|
Using the deposit method of accounting, a deposit liability, rather than written premium, is initially recorded based upon the consideration received less any explicitly identified premiums or fees. In subsequent periods, the deposit liability is adjusted by calculating the effective yield on the deposit to reflect actual payments to date and future expected payments.
|
|
(4)
|
Basic book value per share, diluted book value per share, change in diluted book value per share and return on beginning shareholders’ equity attributable to Third Point Re common shareholders are non-GAAP financial measures. There are no comparable GAAP measures. See the reconciliations under “Management’s Discussion and Analysis of Financial Condition and Results of Operations - Non-GAAP Financial Measures.”
|
Item 7. Management’s Discussion and Analysis of Financial Condition and Results of Operations
The following discussion and analysis is intended to help the reader understand our business, financial condition, results of operations, liquidity and capital resources. You should read this discussion in conjunction with Part II, Item 6. “Selected Financial Data”, and our consolidated financial statements and the related notes contained elsewhere in this Annual Report on Form 10-K for the fiscal year ended December 31,
2018
(“Annual Report”).
The statements in this discussion regarding business outlook, our expectations regarding our future performance, liquidity and capital resources and other non-historical statements in this discussion are forward-looking statements. These forward-looking statements are subject to numerous risks and uncertainties, including, but not limited to our Introductory Note to this Annual Report and the risks and uncertainties described in Part I, Item 1A “Risk Factors.” Our actual results may differ materially from those contained in or implied by any forward-looking statements.
57
Our fiscal year ends December 31 and, unless otherwise noted, references to years or fiscal are for fiscal years ended December 31.
Overview
We are a holding company domiciled in Bermuda. Through our reinsurance subsidiaries, we provide specialty property and casualty reinsurance products to insurance and reinsurance companies on a worldwide basis. Our goal is to deliver attractive equity returns to our shareholders by combining profitable reinsurance underwriting with superior investment management provided by Third Point LLC, our investment manager and the investment manager of TP Fund. We believe that our reinsurance and investment strategy differentiates us from our competitors.
We manage our business on the basis of one operating segment, Property and Casualty Reinsurance. Non-underwriting income and expenses, presented as a reconciliation to our consolidated results, include: net investment income, certain general and administrative expenses related to corporate activities, interest expense,
foreign exchange (gains) losses
and
income tax (expense) benefit
.
Property and Casualty Reinsurance
We provide reinsurance products to insurance and reinsurance companies, government entities, and other risk bearing vehicles. Contracts can be written on an excess of loss basis or quota share basis, although the majority of contracts written to date have been on a quota share basis. In addition, we write contracts on both a prospective basis and a retroactive basis. Prospective reinsurance contracts cover losses incurred as a result of future insurable events. Retroactive reinsurance contracts cover the potential for changes in estimates of loss and loss adjustment expense reserves related to loss events that have occurred in the past. Retroactive reinsurance contracts can be an attractive type of contract for us as they can generate an underwriting profit should the ultimate loss and loss adjustment expenses settle for less than the initial estimate of reserves and the premiums received at the inception of the contract generate insurance float.
The product lines that we currently underwrite for this operating segment are: property, casualty and specialty. We have historically focused on lines of business and forms of reinsurance that have demonstrated more stable return characteristics and have limited our underwriting of property catastrophe risk. However, we have incrementally expanded the lines of business and forms of reinsurance on which we focus that have increased risk profiles where we believe the higher expected margins adequately compensate us for the increased risk. We have begun writing some excess of loss casualty covers in lines of business where we have historically assumed only quota share exposure. We began expanding into new specialty lines of business in 2018 and started writing a modest amount of property catastrophe business in 2019.
Insurance float is an important aspect of our property and casualty reinsurance operation. In an insurance or reinsurance operation, float arises because premiums from reinsurance contracts and consideration received for deposit accounted contracts are collected before losses are paid on reinsurance contracts and payments are made on deposit accounted contracts. In some instances, the interval between cash receipts and payments can extend over many years. During this time interval, we invest the cash received and seek to generate investment returns.
We believe that over time, our property and casualty reinsurance segment will contribute to our results by both generating underwriting income as well as generating float. In addition, we hope to grow float over time as our reinsurance operations expand.
Investment Management
During the period covered by this report, we transitioned to a new investment account structure. Under the new investment account structure, Third Point LLC serves as investment manager for TP Fund as well as for our collateral assets. See Item 1. “Business” and Note 4 to the consolidated financial statements included in this Form 10-K for further information regarding the current investment account structure.
We expect our overall investment exposures, returns, fees paid to Third Point LLC and TP GP as well as the investment guidelines, liquidity and redemption rights to be generally similar under the new LPA and TP Fund IMA compared to
58
what would have been expected under the separate accounts managed under the JV Agreements, assuming similar underlying investment portfolio returns and exposure levels. However, there can be no assurance of such results.
The TP Fund investment strategy, as implemented by Third Point LLC, is intended to achieve superior risk-adjusted returns by deploying capital in both long and short investments with favorable risk/reward characteristics across select asset classes, sectors and geographies. Third Point LLC identifies investment opportunities via a bottom-up, value-oriented approach to single security analysis supplemented by a top-down view of portfolio and risk management. Third Point LLC seeks dislocations in certain areas of the capital markets or in the pricing of particular securities and supplements single security analysis with an approach to portfolio construction that includes sizing each investment based on upside/downside calculations, all with a view towards appropriately positioning and managing overall exposures.
Business Outlook
The reinsurance markets in which we operate have historically been cyclical. During periods of excess underwriting capacity, as defined by the availability of capital, competition can result in lower pricing and less favorable policy terms and conditions for insurers and reinsurers. During periods of reduced underwriting capacity, pricing and policy terms and conditions are generally more favorable for insurers and reinsurers. Historically, underwriting capacity has been affected by several factors, including industry losses, the impact of catastrophes, changes in legal and regulatory guidelines, new entrants and investment results including interest rate levels and the credit ratings and financial strength of competitors.
Although the industry experienced significant losses in 2017 and 2018, there continues to be significant underwriting capacity available and market conditions remain challenging. While many market participants were hopeful that the significant catastrophe losses in recent years would lead to improvements in pricing, terms and conditions within the property catastrophe line of business with the possibility of improvements in other reinsurance lines, improvements have been modest. Catastrophe pricing on loss impacted programs has improved but pricing on other, non-loss impacted contracts has remained broadly flat. Outside of property catastrophe reinsurance we are seeing some signs of improvement in reinsurance terms and conditions and underlying pricing in the capital relief structures on which we have historically focused. We are cautiously optimistic that we will continue to see similar improvements across our in force portfolio as well as new business opportunities.
We focus on segments and clients where we believe we benefit from relatively more attractive pricing opportunities due to the strength of our relationships, the tailored nature of our reinsurance solutions, an acute need for reinsurance capital as a result of market dislocation, a client’s growth or historically poor performance. However, we have incrementally expanded the lines of business and forms of reinsurance on which we focus to help drive our combined ratio below 100%. This may include lines of business and forms of reinsurance with increased risk profiles where we believe the higher expected margins adequately compensate us for the increased risk. We have begun writing some excess of loss casualty covers in lines of business where we have historically assumed only quota share exposure. We also began expanding into new specialty lines of business in 2018 and started writing a modest amount of property catastrophe business in 2019.
We plan to continue to expand into these lines of business and to evaluate and consider pursuing opportunities in other new lines of reinsurance business in 2019.
During 2018, we added experienced senior underwriters with strong market relationships to our team and we will continue to expand our underwriting team in 2019.
In addition, we may, from time to time, invest in managing general agents or other insurance vehicles as part of our ongoing strategy to leverage our underwriting and capital markets expertise to structure and offer capital alternatives in numerous forms and combinations, including equity, debt and reinsurance offerings.
Key Performance Indicators
We believe that by combining a disciplined and opportunistic approach to reinsurance underwriting with investment results from the active management of TP Fund’s investment portfolio, in which we invest, we will be able to generate attractive returns for our shareholders. The key financial measures that we believe are most meaningful in analyzing our performance are: net underwriting income (loss) for our property and casualty reinsurance segment, combined ratio for our property and casualty reinsurance segment,
net investment income (loss)
, net investment return on investments
59
managed by Third Point LLC, basic book value per share, diluted book value per share, growth in diluted book value per share and return on beginning shareholders’ equity attributable to Third Point Re common shareholders.
The table below shows the key performance indicators for our consolidated business for the years ended
December 31, 2018
,
2017
and
2016
:
|
2018
|
2017
|
2016
|
|||||||||
|
($ in thousands, except for per share data and ratios)
|
|||||||||||
|
Key underwriting metrics for Property and Casualty Reinsurance segment:
|
|||||||||||
|
Net underwriting loss
(1)
|
$
|
(42,105
|
)
|
$
|
(42,560
|
)
|
$
|
(50,052
|
)
|
||
|
Combined ratio
(1)
|
106.8
|
%
|
107.7
|
%
|
108.5
|
%
|
|||||
|
Key investment return metrics:
|
|||||||||||
|
Net investment income (loss)
|
$
|
(251,433
|
)
|
$
|
391,953
|
|
$
|
98,825
|
|
||
|
Net investment return on investments managed by Third Point LLC
|
(10.8
|
)%
|
17.7
|
%
|
4.2
|
%
|
|||||
|
Key shareholders’ value creation metrics:
|
|||||||||||
|
Basic book value per share
(2)
|
$
|
13.15
|
|
$
|
16.33
|
|
$
|
13.57
|
|
||
|
Diluted book value per share
(2)
|
$
|
12.98
|
|
$
|
15.65
|
|
$
|
13.16
|
|
||
|
Change in diluted book value per share
(2)
|
(17.1
|
)%
|
18.9
|
%
|
2.4
|
%
|
|||||
|
Return on beginning shareholders’ equity attributable to Third Point Re common shareholders
(2)
|
(20.0
|
)%
|
20.1
|
%
|
2.0
|
%
|
|||||
|
(1)
|
See
Note 24
to the accompanying consolidated financial statements for a calculation of net underwriting loss and combined ratio.
|
|
(2)
|
Basic book value per share, diluted book value per share, change in diluted book value per share and return on beginning shareholders’ equity attributable to Third Point Re common shareholders are non-GAAP financial measures. There are no comparable GAAP measures. See reconciliations in “Non-GAAP Financial Measures and Other Financial Metrics”.
|
Key Underwriting Metrics for Property and Casualty Reinsurance segment
See “Segment Results -
Property and Casualty Reinsurance
” below for additional details.
Key Investment Return Metrics
Net Investment Income (Loss)
Net investment income (loss)
is an important measure that affects overall profitability.
Net investment income (loss)
is primarily affected by the performance of Third Point LLC as TP Fund’s investment manager and the amount of investable cash generated by our reinsurance operations. Net investment income (loss) also includes the investment income (loss) on collateral assets managed by Third Point LLC. Pursuant to the investment management agreement between TP Fund and Third Point LLC, Third Point LLC is required to manage TP Fund’s investment portfolio on a basis that is substantially equivalent to Third Point Offshore Master Fund L.P., subject to certain conditions set forth in TP Fund’s investment guidelines. These conditions include limitations on investing in private securities, a limitation on portfolio leverage, and a limitation on portfolio concentration in individual securities. The LPA allows us to withdraw cash from the TP Fund at any calendar month end or at the close of business each Wednesday during a month with not less than three days’ notice to pay claims, not less than five days’ notice to pay expenses and with not less than three days’ notice in order to satisfy the requirements of A.M. Best.
Net investment income (loss)
is net of investment fee expenses, which include performance and management fees to related parties.
Net Investment Return on Investments Managed by Third Point LLC
See “Investment Results” below for additional information regarding investment performance and net investment return on investments managed by Third Point LLC.
60
Key Shareholders’ Value Creation Metrics
Basic Book Value Per Share and Diluted Book Value Per Share
Basic book value per share and diluted book value per share are non-GAAP financial measures and there are no comparable GAAP measures. See “Non-GAAP Financial Measures and Other Financial Metrics” for reconciliations.
As of
December 31, 2018
, basic book value per share was
$13.15
, representing
a decrease
of
$3.18
per share, or
19.5%
, from
$16.33
per share as of
December 31, 2017
. As of
December 31, 2017
, basic book value per share was
$16.33
, representing
an increase
of
$2.76
per share, or
20.3%
, from
$13.57
per share as of December 31,
2016
. The changes were primarily due to the impact of share repurchases and the net income (loss) in the year.
As of
December 31, 2018
, diluted book value per share was
$12.98
, representing a
decrease
of
$2.67
per share, or
17.1%
, from
$15.65
per share as of
December 31, 2017
. As of
December 31, 2017
, diluted book value per share was
$15.65
, representing
an increase
of
$2.49
per share, or
18.9%
, from
$13.16
per share as of December 31,
2016
. The changes were primarily due to the impact of share repurchases and the net income (loss) in the year.
The changes in basic book value per share and diluted book value per share were affected by share activity including share repurchases and the issuance of performance restricted shares.
Return on Beginning Shareholders’ Equity Attributable to Third Point Re Common Shareholders
Return on beginning shareholders’ equity attributable to Third Point Re common shareholders as presented is a non-GAAP financial measure. See “Non-GAAP Financial Measures and Other Financial Metrics” for reconciliation.
The changes in return on beginning shareholders’ equity attributable to Third Point Re common shareholders for the years ended
December 31, 2018
and
December 31, 2017
compared to the years ended
December 31, 2017
and December 31,
2016
, respectively, were primarily due to net income (loss) during the year.
Consolidated Results of Operations—Years ended
December 31, 2018
,
2017
and
2016
The following table sets forth the key items discussed in the consolidated results of operations section, and the year over year changes, for the years ended
December 31, 2018
,
2017
and
2016
:
|
2018
|
2017
|
Change
|
2016
|
Change
|
|||||||||||||||
|
($ in thousands)
|
|||||||||||||||||||
|
Net underwriting income (loss)
|
$
|
(42,105
|
)
|
$
|
(42,560
|
)
|
$
|
455
|
|
$
|
(50,052
|
)
|
$
|
7,492
|
|
||||
|
Net investment income (loss)
|
(251,433
|
)
|
391,953
|
|
(643,386
|
)
|
98,825
|
|
293,128
|
|
|||||||||
|
Net investment return on investments managed by Third Point LLC
|
(10.8
|
)%
|
17.7
|
%
|
(28.5
|
)%
|
4.2
|
%
|
13.5
|
%
|
|||||||||
|
Corporate expenses
|
(17,606
|
)
|
(22,447
|
)
|
4,841
|
|
(17,207
|
)
|
(5,240
|
)
|
|||||||||
|
Other expenses
|
(9,610
|
)
|
(12,674
|
)
|
3,064
|
|
(8,387
|
)
|
(4,287
|
)
|
|||||||||
|
Interest expense
|
(8,228
|
)
|
(8,225
|
)
|
(3
|
)
|
(8,231
|
)
|
6
|
|
|||||||||
|
Foreign exchange gains (losses)
|
7,503
|
|
(12,300
|
)
|
19,803
|
|
19,521
|
|
(31,821
|
)
|
|||||||||
|
Income tax (expense) benefit
|
4,010
|
|
(11,976
|
)
|
(15,986
|
)
|
(5,593
|
)
|
6,383
|
|
|||||||||
|
Net income (loss) available to Third Point Re common shareholders
|
$
|
(317,692
|
)
|
$
|
277,798
|
|
$
|
(595,490
|
)
|
$
|
27,635
|
|
$
|
250,163
|
|
||||
A key driver of our consolidated results of operations is the performance of our investments managed by Third Point LLC. Given the nature of the underlying investment strategies, we expect volatility in our investment returns and net investment income and therefore in our consolidated results.
61
Investment Results
Investment Portfolio
The following tables present the total long, short and net exposure of our net investments managed by Third Point LLC as of
December 31, 2018
and 2017 by strategy and geography. The tables as of December 31, 2018 include our investments in TP Fund and collateral assets managed by Third Point LLC. The tables as of December 31, 2017 include collateral assets managed by Third Point LLC and our investments in the separate accounts in place prior to the change in the investment account structure described in Note 4 to the consolidated financial statements included in this Form 10-K.
|
|
December 31, 2018
|
December 31, 2017
|
|||||||||||||||
|
|
Long
|
Short
|
Net
|
Long
|
Short
|
Net
|
|||||||||||
|
Equity
|
54
|
%
|
(22
|
)%
|
32
|
%
|
98
|
%
|
(25
|
)%
|
73
|
%
|
|||||
|
Credit
|
18
|
%
|
(4
|
)%
|
14
|
%
|
16
|
%
|
(4
|
)%
|
12
|
%
|
|||||
|
Other
|
9
|
%
|
(1
|
)%
|
8
|
%
|
10
|
%
|
|
(2
|
)%
|
|
8
|
%
|
|||
|
81
|
%
|
(27
|
)%
|
54
|
%
|
124
|
%
|
(31
|
)%
|
93
|
%
|
||||||
|
December 31, 2018
|
December 31, 2017
|
||||||||||||||||
|
Long
|
Short
|
Net
|
Long
|
Short
|
Net
|
||||||||||||
|
Americas
|
70
|
%
|
(21
|
)%
|
49
|
%
|
93
|
%
|
(29
|
)%
|
64
|
%
|
|||||
|
Europe, Middle East and Africa
|
11
|
%
|
(3
|
)%
|
8
|
%
|
7
|
%
|
—
|
%
|
7
|
%
|
|||||
|
Asia
|
—
|
%
|
(3
|
)%
|
(3
|
)%
|
24
|
%
|
(2
|
)%
|
22
|
%
|
|||||
|
81
|
%
|
(27
|
)%
|
54
|
%
|
124
|
%
|
(31
|
)%
|
93
|
%
|
||||||
In managing TP Fund’s investment portfolio, Third Point LLC assigns every investment position a sector, strategy and geographic category. The dollar exposure of each position under each category is aggregated and the exposure percentages listed in the exposure table represent the aggregate market exposure of a given category against the total net asset value of the consolidated account. Long and short exposure percentages represent the aggregate relative value of all long and short positions in a given category, respectively. Net exposure represents the short exposure subtracted from the long exposure in a given category. Third Point LLC reports the composition of TP Fund’s total managed portfolio on a market exposure basis, which it believes is the appropriate manner in which to assess the exposure and profile of investments and is the way in which it manages the portfolio. Under this methodology, the exposure for equity swaps and futures contracts are reported at their full notional amount. The notional amount of any derivative contract is the underlying value upon which payment obligations are computed. For an equity total return swap, for example, the notional amount is the number of shares underlying the swap multiplied by the market price of those shares. Options are reported at their delta adjusted basis. The delta of an option is the sensitivity of the option price to the underlying stock price. The delta adjusted basis is the number of shares underlying the option multiplied by the delta and the underlying stock price. Credit derivatives are reported in accordance with their equivalent underlying security exposure. Cash and cash equivalents are excluded from exposure calculations.
62
Investment Returns
The following is a summary of the net investment return by investment strategy on investments managed by Third Point LLC for the years ended
December 31, 2018
,
2017
and
2016
. The net investment return includes our investment accounts, inclusive of collateral assets managed by Third Point LLC, prior to August 31, 2018, the date of the change in the investment account structure described in Note 4 to the consolidated financial statements included in this Form 10-K, and our investment in TP Fund and collateral assets managed by Third Point LLC from the date of the transition.
|
2018
|
||||||||
|
Long
|
Short
|
Net
|
||||||
|
Equity
|
(8.7
|
)%
|
0.1
|
%
|
(8.6
|
)%
|
||
|
Credit
|
—
|
%
|
(0.2
|
)%
|
(0.2
|
)%
|
||
|
Other
|
(2.8
|
)%
|
0.8
|
%
|
(2.0
|
)%
|
||
|
Net investment return on investments managed by Third Point LLC
|
(11.5
|
)%
|
0.7
|
%
|
(10.8
|
)%
|
||
|
S&P 500 Total Return Index
|
(4.4
|
)%
|
||||||
|
2017
|
||||||||
|
Long
|
Short
|
Net
|
||||||
|
Equity
|
21.5
|
%
|
(4.6
|
)%
|
16.9
|
%
|
||
|
Credit
|
0.7
|
%
|
(0.6
|
)%
|
0.1
|
%
|
||
|
Other
|
1.8
|
%
|
(1.1
|
)%
|
0.7
|
%
|
||
|
Net investment return on investments managed by Third Point LLC
|
24.0
|
%
|
(6.3
|
)%
|
17.7
|
%
|
||
|
S&P 500 Total Return Index
|
21.8
|
%
|
||||||
|
2016
|
||||||||
|
Long
|
Short
|
Net
|
||||||
|
Equity
|
1.5
|
%
|
(2.9
|
)%
|
(1.4
|
)%
|
||
|
Credit
|
6.4
|
%
|
(0.4
|
)%
|
6.0
|
%
|
||
|
Other
|
0.5
|
%
|
(0.9
|
)%
|
(0.4
|
)%
|
||
|
Net investment return on investments managed by Third Point LLC
|
8.4
|
%
|
(4.2
|
)%
|
4.2
|
%
|
||
|
S&P 500 Total Return Index
|
12.0
|
%
|
||||||
Net investment return represents the return on our net investments managed by Third Point LLC, net of fees. The net investment return on net investments managed by Third Point LLC is the percentage change in value of a dollar invested over the reporting period on our net investment assets managed by Third Point LLC. Effective August 31, 2018, we transitioned from our separately managed account structure to investing in TP Fund. In addition, the Collateral Assets are managed by Third Point LLC from the effective date. See Note 4 to our consolidated financial statements for additional information. The net investment return reflects the combined results of investments managed on behalf of Third Point Re BDA and Third Point Re USA prior to the transition date of August 31, 2018 and the investment in TP Fund and collateral assets from the date of transition. Prior to the transition date of August 31, 2018, the stated return was net of noncontrolling interests and net of withholding taxes, which were presented as a component of income tax expense in our consolidated statements of income. Net investment return is the key indicator by which we measure the performance of Third Point LLC, TP Fund's investment manager.
For the year ended December 31, 2018, the net investment results were primarily attributable to losses generated by long equity investments, a merger arbitrage position, and exposure to cyclical sectors negatively impacted by slowing global growth. Short selling generated positive returns and mitigated further losses in equities. The credit portfolio produced a modest overall loss. The asset-backed securities portfolio’s gains were reduced by losses in corporate credit.
63
For the year ended December 31, 2017, the net investment results were primarily attributable to the equity portfolio. Within equities, we experienced positive returns across each long equity sector partially offset by losses from short positions, primarily from equity market hedges. One large long equity healthcare position was a notable contributor to the long equity performance for the year. Credit and the macroeconomic and other strategy, including currency and private investments, also contributed to positive performance with gains from the long exposures partially offset by short exposures in each strategy.
For the year ended December 31, 2016, the net investment results were primarily driven by positive returns in our credit strategy. Within credit, profits in corporate and sovereign credit were partially offset by modest losses in structured credit. Corporate credit was the main driver in the credit strategy and resulted from positive returns on investments in the energy sector. Within equities, negative performance from two large healthcare positions were partially offset by positive performance from investments in the financial and industrials sectors. During the year, Third Point LLC increased exposure to risk arbitrage transactions, which generated positive performance from several merger-related investments and partially offset losses in the currency and macroeconomic portions of the other portfolio
.
Refer to “ITEM 3. Quantitative and Qualitative Disclosures about Market Risks” for a list of risks and factors that could adversely impact our investments results.
The other key changes in our consolidated results for the years ended
December 31, 2018
compared to the prior year periods were primarily due to the following:
Corporate Expenses
General and administrative expenses allocated to corporate activities include allocations of payroll and related costs for certain executives and non-underwriting activities. We also allocate a portion of overhead and other related costs based on a headcount analysis. The decrease in general and administrative expenses related to corporate activities for the year ended
December 31, 2018
compared to the year ended
December 31, 2017
was primarily due to a decrease in our annual incentive plan compensation expense, partially offset by higher
stock compensation
expense in the current year. Our annual incentive plan is based on the Company’s return on average equity and the combined ratio.
The increase for the year ended
December 31, 2017
compared to the year ended
December 31, 2016
was primarily due to an increase in our annual incentive plan compensation expense where we did not achieve the threshold performance target in 2016, lower share compensation expense in 2016 due to forfeitures and fewer restricted shares with performance and service conditions considered probable of vesting, partially offset by separation costs in 2016.
Other Expenses
Other expenses are comprised of expenses relating to interest crediting features in certain reinsurance and deposit contracts. The decrease in other expenses for the year ended
December 31, 2018
compared to the year ended
December 31, 2017
was primarily due to two deposit contracts that were commuted in 2018, resulting in gains recognized. We also revised estimates of underlying assumptions in the current year period on certain deposit liability contracts resulting in a decrease in other expenses compared to the prior year period.
The increase in other expenses for the year ended
December 31, 2017
compared to the year ended
December 31, 2016
was primarily due to revised estimates of underlying assumptions on our deposit liability contracts in the year ended
December 31, 2016
that resulted in a decrease in other expenses.
Interest Expense
In February 2015, TPRUSA issued $115.0 million of senior notes bearing 7.0% interest. As a result, our consolidated results of operations include interest expense related to the senior notes.
Foreign Exchange Gains (Losses)
The foreign exchange gains were primarily due to the revaluation of foreign currency loss and loss adjustment expense reserves denominated in British pounds to the United States dollar, which had strengthened during the current year period compared to the prior year period. For these contracts, non-U.S. dollar reinsurance assets, or balances held in
64
trust accounts securing reinsurance liabilities generally offset reinsurance liabilities in the same non-U.S. dollar currencies resulting in minimal net exposure. As a result, the foreign exchange gains (losses) on loss and loss adjustment expense reserves in the current year periods were offset by corresponding foreign exchange gains (losses) included in
net investment income (loss)
resulting from the revaluation of foreign currency reinsurance collateral held in trust accounts. Refer to “
ITEM 7A. Quantitative and Qualitative Disclosures about Market Risks
” for further discussion on foreign currency risk related to our reinsurance contracts.
Income Taxes
See
Note 16
to our consolidated financial statements for additional information regarding income taxes. The decrease in income tax expense for the year ended
December 31, 2018
compared to the year ended
December 31, 2017
was primarily the result of a decrease in taxable income generated by our U.S. subsidiaries.
Segment Results—Years ended
December 31, 2018
,
2017
and
2016
The determination of our reportable segments is based on the manner in which management monitors the performance of our operations. For the periods presented, our business comprises one operating segment, Property and Casualty Reinsurance.
Property and Casualty Reinsurance
The following table sets forth net underwriting results and ratios, and the year over year changes for the Property and Casualty Reinsurance segment for the years ended
December 31, 2018
,
2017
and
2016
:
|
2018
|
2017
|
Change
|
2016
|
Change
|
|||||||||||||||
|
($ in thousands)
|
|||||||||||||||||||
|
Gross premiums written
|
$
|
578,252
|
|
$
|
641,620
|
|
$
|
(63,368
|
)
|
$
|
617,374
|
|
$
|
24,246
|
|
||||
|
Gross premiums ceded
|
(19,895
|
)
|
(2,475
|
)
|
(17,420
|
)
|
(2,325
|
)
|
(150
|
)
|
|||||||||
|
Net premiums earned
|
621,442
|
|
547,058
|
|
74,384
|
|
590,190
|
|
(43,132
|
)
|
|||||||||
|
Loss and loss adjustment expenses incurred, net
|
438,414
|
|
370,058
|
|
68,356
|
|
395,932
|
|
(25,874
|
)
|
|||||||||
|
Acquisition costs, net
|
206,498
|
|
188,904
|
|
17,594
|
|
222,150
|
|
(33,246
|
)
|
|||||||||
|
General and administrative expenses
|
18,635
|
|
30,656
|
|
(12,021
|
)
|
22,160
|
|
8,496
|
|
|||||||||
|
Net underwriting income (loss)
|
$
|
(42,105
|
)
|
$
|
(42,560
|
)
|
$
|
455
|
|
$
|
(50,052
|
)
|
$
|
7,492
|
|
||||
|
Underwriting ratios
(1)
:
|
|||||||||||||||||||
|
Loss ratio
|
70.6
|
%
|
67.6
|
%
|
3.0
|
%
|
67.1
|
%
|
0.5
|
%
|
|||||||||
|
Acquisition cost ratio
|
33.2
|
%
|
34.5
|
%
|
(1.3
|
)%
|
37.6
|
%
|
(3.1
|
)%
|
|||||||||
|
Composite ratio
|
103.8
|
%
|
102.1
|
%
|
1.7
|
%
|
104.7
|
%
|
(2.6
|
)%
|
|||||||||
|
General and administrative expense ratio
|
3.0
|
%
|
5.6
|
%
|
(2.6
|
)%
|
3.8
|
%
|
1.8
|
%
|
|||||||||
|
Combined ratio
|
106.8
|
%
|
107.7
|
%
|
(0.9
|
)%
|
108.5
|
%
|
(0.8
|
)%
|
|||||||||
|
(1)
|
Underwriting ratios are calculated by dividing the related expense by net premiums earned.
|
Gross Premiums Written
The amount of gross premiums written and earned that we recognize can vary significantly from period to period due to several reasons, which include:
|
•
|
The majority of our gross written premium is derived from a small number of large contracts
; therefore individual renewals or new business can have a significant impact on premiums recognized in a period;
|
|
•
|
We offer customized solutions to our clients, including reserve covers, on which we may not have a regular renewal opportunity;
|
65
|
•
|
We record gross premiums written and earned for reserve covers, which are considered retroactive reinsurance contracts, at the inception of the contract;
|
|
•
|
We write multi-year contracts that will not necessarily renew in a comparable period;
|
|
•
|
We may extend and/or amend contracts resulting in premium that will not necessarily renew in a comparable period;
|
|
•
|
Our reinsurance contracts often contain commutation and/or cancellation provisions; and
|
|
•
|
Our quota share reinsurance contracts are subject to significant judgment in the amount of premiums that we expect to recognize and changes in premium estimates are recorded in the period they are determined.
|
As a result of these factors, we may experience volatility in the amount of gross premiums written and net premiums earned and period to period comparisons may not be meaningful.
The following table provides a breakdown of our Property and Casualty Reinsurance segment’s gross premiums written by line of business for the years ended
December 31, 2018
,
2017
and
2016
:
|
2018
|
2017
|
2016
|
||||||||||||||||||
|
($ in thousands)
|
||||||||||||||||||||
|
Property
|
$
|
9,070
|
|
1.6
|
%
|
$
|
136,999
|
|
21.4
|
%
|
$
|
98,334
|
|
15.9
|
%
|
|||||
|
Casualty
|
235,789
|
|
40.8
|
%
|
269,759
|
|
42.0
|
%
|
213,050
|
|
34.5
|
%
|
||||||||
|
Specialty
|
259,173
|
|
44.8
|
%
|
125,511
|
|
19.6
|
%
|
305,990
|
|
49.6
|
%
|
||||||||
|
Total prospective reinsurance contracts
|
504,032
|
|
87.2
|
%
|
532,269
|
|
83.0
|
%
|
617,374
|
|
100.0
|
%
|
||||||||
|
Retroactive reinsurance contracts
|
74,220
|
|
12.8
|
%
|
109,351
|
|
17.0
|
%
|
—
|
|
—
|
%
|
||||||||
|
$
|
578,252
|
|
100.0
|
%
|
$
|
641,620
|
|
100.0
|
%
|
$
|
617,374
|
|
100.0
|
%
|
||||||
The
decrease
in gross premiums written of
$63.3 million
, or
9.9%
, for the year ended
December 31, 2018
compared to the year ended
December 31, 2017
was driven by:
Factors resulting in decreases:
|
•
|
We recognized a net increase in premium of $160.9 million in the year ended
December 31, 2018
compared to a net increase of $301.7 million in the
twelve
months ended
December 31, 2017
related to the net impact of contract extensions, cancellations and contracts renewed with no comparable premium in the comparable period.
|
|
•
|
We recognized $108.5 million of premium in the year ended
December 31, 2017
related to contracts that we did not renew in the year ended
December 31, 2018
as a result of underlying pricing, terms and conditions.
|
|
•
|
Changes in renewal premiums for the year ended
December 31, 2018
resulted in a net decrease in premiums of $21.2 million. Premiums can change on renewals of contracts due to a number of factors, including: changes in our line size or participation, changes in the underlying premium volume and pricing trends of the client’s program as well as other contractual terms and conditions.
|
|
•
|
We recorded net increases in premium estimates relating to prior periods of $12.0 million and $25.6 million the years ended
December 31, 2018
and
2017
, respectively. The increases in premium estimates for the year ended
December 31, 2018
and
2017
were due to several contracts for which clients provided updated projections indicating that they expected to write more business than initially estimated.
|
Factor resulting in an increase:
|
•
|
For the year ended
December 31, 2018
, we wrote $220.8 million of new premium, of which $122.8 million was specialty business, including one multi-line contract covering casualty and specialty risks for $101.1 million, $83.4 million was casualty business and $14.6 million was property business.
|
66
The
increase
in gross premiums written of
$24.2 million
, or
3.9%
, for the year ended
December 31, 2017
compared to the year ended
December 31, 2016
was driven by:
Factors resulting in increases:
|
•
|
We wrote $286.4 million of new business for the year ended December 31, 2017, of which $164.0 million was casualty business, $109.4 million was retroactive reinsurance contracts and $13.0 million was specialty business.
|
|
•
|
Changes in renewal premiums for the year ended December 31, 2017 resulted in a net increase in premiums of $57.8 million primarily due to changes to one contract renewed in the period to increase our line size and to change from a one year contract to a two year contract resulting in additional premium recorded in the 2017 period. Premiums can change on renewals of contracts due to a number of factors, including changes in our line size or participation, changes in the underlying premium volume and pricing trends of the client’s program as well as other contractual terms and conditions.
|
Factors resulting in decreases:
|
•
|
We recognized $161.1 million of premium in the year ended December 31, 2016 related to contracts that we did not renew in the year ended December 31, 2017 due to changes in pricing and/or terms and conditions.
|
|
•
|
We recognized net increases in premium of $148.3 million and $226.2 million in the years ended December 31, 2017 and 2016, respectively, related to the net impact of contract extensions, cancellations and contracts written in the prior year with no comparable premium in the current year period.
|
|
•
|
We recorded increases in premium estimates relating to prior periods of $25.6 million and $106.6 million for the years ended December 31, 2017 and 2016, respectively. The increase in premium estimates for the year ended December 31, 2017 was due to several contracts for which clients provided updated projections indicating that they expected to write more business than initially estimated. The significant increase in premium estimates for the year ended December 31, 2016 was primarily due to the following factors:
|
|
◦
|
We wrote one large credit and financial lines quota share, covering primarily mortgage business, whereby the ceding company significantly increased their writings, which resulted in a $46.9 million premium estimate increase in 2016 on this contract;
|
|
◦
|
We wrote a multi-line contract for several underwriting years covering commercial auto physical damage and auto extended warranty. As this was a new and growing program, we initially recorded the cedent’s estimate of expected written premium at a lower amount than their initial estimate. The ceding company exceeded their premium projections resulting in an increase of $23.6 million related to that contract; and
|
|
◦
|
We wrote a general liability quota share contract in 2015 whereby the ceding company increased their writings, which resulted in a $20.8 million premium estimate increase in 2016 on this contract.
|
Gross Premiums Ceded
The increase in gross premiums ceded for the year ended
December 31, 2018
compared to the year ended
December 31, 2017
was primarily due to a new ceded contract covering certain of our 2018 mortgage contracts.
Gross premiums ceded for the year ended
December 31, 2017
compared to the year ended
December 31, 2016
were consistent.
Net Premiums Earned
The
increase
in net premiums earned for the year ended
December 31, 2018
compared to the year ended
December 31, 2017
was primarily due to a higher in-force underwriting portfolio, partially offset by retroactive exposures in reinsurance contracts that were written and fully earned in the prior year period of
$109.4 million
compared to
$74.2 million
for the year ended December 31, 2018.
67
The
decrease
in net premiums earned for the year ended
December 31, 2017
compared to the year ended
December 31, 2016
was primarily due to a lower in-force underwriting portfolio. The
decrease
was partially offset by
$109.4 million
of new retroactive exposures in reinsurance contracts that were written and fully earned in the year ended
December 31, 2017
compared to no retroactive reinsurance contracts written in the year ended
December 31, 2016
.
Net Loss and Loss Adjustment Expenses
The reinsurance contracts we write have a wide range of initial loss ratio estimates. As a result, our net loss and loss expense ratio can vary significantly from period to period depending on the mix of business. The change in our net loss and loss adjustment expenses and related ratio was primarily affected by changes in mix of business, a higher in-force underwriting portfolio, prior years’ reserve development and catastrophe losses in 2018.
In the year ended
December 31, 2018
, we incurred
$18.5 million
of catastrophe losses, or
3.0
percentage points on the combined ratio, related to the California wildfires and other catastrophe events compared to
$5.3 million
in the year ended December 31, 2017, or
1.0
percentage point, relating to the 2017 catastrophe events. Although we have not specifically written property catastrophe contracts in 2018 or in prior years, we were exposed to California wildfire losses through liability reinsurance of the utilities in California during 2018. As a result, we recorded
$11.3 million
of losses relating to the liability exposure from the California utilities. The remainder of the
$18.5 million
in total catastrophe losses related to incidental exposure that we had to catastrophic events on two Florida homeowners contracts (Hurricane Michael) and on two whole account reinsurance contracts.
The following is a summary of the net impact from loss reserve development for the years ended
December 31, 2018
,
2017
and
2016
:
For the year ended
December 31, 2018
, we recognized
$12.9 million
, or
2.1
percentage points on the combined ratio, of net
favorable
prior years’ reserve development as a result of
decrease
s in loss reserve estimates. The
$12.9 million
of net
favorable
prior years’ reserve development for the year ended
December 31, 2018
was accompanied by net
increase
s of
$7.7 million
, or
1.2
percentage points on the combined ratio, in acquisition costs resulting in a
$5.2 million
, or
0.8
percentage points on the combined ratio, improvement in net underwriting results. The
improvement in the net underwriting results
was primarily due to the following factors:
|
•
|
$15.8 million of net favorable underwriting loss development relating to workers’ compensation, multi-line and credit and financial lines contracts. The favorable development was the result of better than expected loss experience and was partially offset by;
|
|
•
|
$10.5 million of net adverse underwriting loss development primarily relating to our general liability and homeowners’ contracts, as a result of worse than expected loss experience.
|
For the year ended December 31, 2017, we incurred $22.3 million, or 4.1 percentage points on the combined ratio, of net favorable prior years’ reserve development as a result of decreases in loss reserve estimates. The $22.3 million of net favorable prior years’ reserve development for the year ended December 31, 2017 was accompanied by net increases of $19.8 million, or 3.6 percentage points on the combined ratio, in acquisition costs, resulting in a $2.5 million, or 0.5 percentage points on the combined ratio, improvement in net underwriting results. The improvement in the net underwriting results was primarily due to the following factors:
|
•
|
$5.8 million of net favorable underwriting loss development relating to several workers’ compensation contracts written from 2012 to 2014, driven by better than expected loss experience; and
|
|
•
|
$1.3 million of net favorable underwriting loss development from several other contracts as a result of better than expected loss experience; partially offset by
|
|
•
|
$4.6 million of net adverse underwriting loss development relating to non-standard auto contracts, primarily due to the inability of cedents to promptly react to increasing frequency and severity trends, resulting in underpriced business and adverse selection.
|
For the year ended December 31, 2016, we incurred $10.5 million, or 1.8 percentage points on the combined ratio, of net adverse prior years’ reserve development as a result of increases in loss reserve estimates. The $10.5 million of net adverse prior years’ reserve development for the year ended December 31, 2016 was accompanied by net increases of
68
$2.0 million, or 0.3 percentage points on the combined ratio, in acquisition costs, resulting in a net adverse development of $12.5 million in net underwriting results, or 2.1 percentage points on the combined ratio. The net underwriting results impact of the adverse loss development was due to:
|
•
|
$4.8 million of net adverse underwriting loss development relating to one multi-line contract written since 2014. This contract contains underlying commercial auto physical damage and auto extended warranty exposure. The adverse loss experience was a result of an increase in the number of reported claims and inadequate pricing in certain segments of the underlying business;
|
|
•
|
$4.0 million of net adverse underwriting loss development relating to non-standard auto contracts, primarily due to the inability of cedents to promptly react to increasing frequency and severity trends, resulting in underpriced business and adverse selection;
|
|
•
|
$3.7 million of net adverse underwriting loss development relating to our Florida homeowners’ contracts primarily as a result of higher than anticipated water damage claims and an increase in the practice of assignment of benefits whereby homeowners assign their rights for filing and settling claims to attorneys and public adjusters, which we believe has led to an increase in the frequency of claims reported as well as the severity of losses and loss adjustment expenses;
|
|
•
|
$3.3 million of net adverse underwriting loss development relating to a workers’ compensation contract written from 2012 to 2014 under which we have been experiencing higher than expected claims development that led to an increase in our previous loss assumptions on this contract; and
|
|
•
|
$2.1 million of net favorable underwriting loss development from several other contracts.
|
Acquisition Costs
Acquisition costs include commissions, brokerage and excise taxes. Acquisition costs are presented net of commissions on reinsurance ceded. The reinsurance contracts we write have a wide range of acquisition cost ratios. As a result, our acquisition cost ratio can vary significantly from period to period depending on the mix of business. Furthermore, a number of our contracts have a sliding scale commission or profit commission feature that will vary depending on the expected loss expense for the contract. As a result, changes in estimates of loss and loss adjustment expenses on a contract can result in changes in the sliding scale commissions or profit commissions and a contract’s overall acquisition cost ratio.
Many of our contracts have similar expected composite ratios (combined ratio before general and administrative expenses); therefore, contracts with higher initial loss ratio estimates have lower acquisition cost ratios and contracts with lower initial loss ratios have higher acquisition cost ratios.
The
increase
in acquisition costs, net, for the year ended
December 31, 2018
was primarily due to a change in mix of business resulting in a higher acquisition cost expense amount.
The decrease in acquisition costs, net, for the year ended December 31, 2017 was primarily due to a retroactive reinsurance contracts with a low acquisition cost ratio in the year ended December 31, 2017 compared to no retroactive reinsurance contracts in the year ended December 31, 2016. Also impacting the difference is lower earned premiums in the year ended December 31, 2017 resulting in a lower acquisition cost expense amount.
See additional information in Net Loss and Loss Adjustment Expenses section above.
General and Administrative Expenses
The decrease in general and administrative expenses allocated to underwriting activities and the related general and administrative expenses ratio for the year ended
December 31, 2018
comp
ared to the year ended
December 31, 2017
was the result of lower payroll related costs primarily due to lower annual incentive plan compensation expense accruals, partially offset by higher stock compensation expense and professional fees. Our annual incentive plan is based on a formula derived from certain financial performance metrics. Our incentive plan accrual was lower for the year ended
December 31, 2018
comp
ared to the year ended
December 31, 2017
to reflect the lower performance of the Company in the year relative to the incentive plan compensation performance metrics. The higher stock compensation expense
69
is a result of an increase of our accruals for restricted shares with performance conditions reflecting improvement in our projected underwriting results. The increase in professional fees is primarily due to legal, accounting and consulting fees incurred in conjunction with the investment restructuring.
The increase in general and administrative expenses related to corporate activities for the year ended December 31, 2017 compared to the year ended December 31, 2016 was primarily due to an increase in our annual incentive plan compensation expense, partially offset by
lower stock compensation
expense in 2017 and separation costs in 2016.
Non-GAAP Financial Measures and Other Financial Metrics
We have included certain financial measures that are not calculated under standards or rules that comprise GAAP. Such measures, including book value per share, diluted book value per share, change in diluted book value per share and return on beginning shareholders’ equity attributable to Third Point Re common shareholders, are referred to as non-GAAP financial measures. These non-GAAP financial measures may be defined or calculated differently by other companies. We believe these measures allow for a more complete understanding of our underlying business. These measures are used by management to monitor our results and should not be viewed as a substitute for those determined in accordance with GAAP. Reconciliations of non-GAAP measures to the most comparable GAAP figures are included below.
In addition, we refer to certain financial metrics such as net investment return on investments managed by Third Point LLC, which is an important metric to measure the performance of TP Fund’s investment manager, Third Point LLC. A more detailed description of this financial metric is included below. We also refer to other generic performance metrics which are described and explained in this subsection. As a result of the change in the Company’s investment account structure described in
Note 4
to the accompanying consolidated financial statements, we no longer calculate investment income on float.
Non-GAAP Financial Measures
Net Investment Return on Investments Managed by Third Point LLC
Net investment return represents the return on our net investments managed by Third Point LLC, net of fees. The net investment return on net investments managed by Third Point LLC is the percentage change in value of a dollar invested over the reporting period on our net investment assets managed by Third Point LLC. Effective August 31, 2018, we transitioned from our separately managed account structure to investing in TP Fund. In addition, the Collateral Assets are managed by Third Point LLC from the effective date. See Note 4 to our consolidated financial statements for additional information. The net investment return reflects the combined results of investments managed on behalf of Third Point Re BDA and Third Point Re USA prior to the transition date of August 31, 2018 and the investment in TP Fund and collateral assets from the date of transition. Prior to the transition date of August 31, 2018, the stated return was net of noncontrolling interests and net of withholding taxes, which were presented as a component of income tax expense in our consolidated statements of income. Net investment return is the key indicator by which we measure the performance of Third Point LLC, TP Fund's investment manager.
Basic Book Value Per Share and Diluted Book Value Per Share
Basic book value per share and diluted book value per share are non-GAAP financial measures and there are no comparable GAAP measures. Basic book value per share, as presented, is a non-GAAP financial measure and is calculated by dividing shareholders’ equity attributable to Third Point Re common shareholders by the number of common shares outstanding, excluding the total number of unvested restricted shares, at period end. Diluted book value per share, as presented, is a non-GAAP financial measure and represents basic book value per share combined with the impact from dilution of all in-the-money share options issued, warrants and unvested restricted shares outstanding as of any period end. For unvested restricted shares with a performance condition, we include the unvested restricted shares for which we consider vesting to be probable. Change in basic book value per share is calculated by taking the change in basic book value per share divided by the beginning of period book value per share. Change in diluted book value per share is calculated by taking the change in diluted book value per share divided by the beginning of period diluted book value per share. We believe that long-term growth in diluted book value per share is the most important measure of our financial performance because it allows our management and investors to track over time the value
70
created by the retention of earnings. In addition, we believe this metric is used by investors because it provides a basis for comparison with other companies in our industry that also report a similar measure.
The following table sets forth the computation of book value per share, basic book value per share and diluted book value per share as of
December 31, 2018
,
2017
and
2016
:
|
2018
|
2017
|
2016
|
|||||||||
|
Basic and diluted book value per share numerator:
|
($ in thousands, except share and per share amounts)
|
||||||||||
|
Shareholders' equity attributable to Third Point Re common shareholders
|
$
|
1,204,574
|
|
$
|
1,656,089
|
|
$
|
1,414,051
|
|
||
|
Effect of dilutive warrants issued to founders and an advisor (1)
|
—
|
|
46,512
|
|
46,512
|
|
|||||
|
Effect of dilutive stock options issued to directors and employees (1)
|
—
|
|
51,422
|
|
52,930
|
|
|||||
|
Diluted book value per share numerator:
|
$
|
1,204,574
|
|
$
|
1,754,023
|
|
$
|
1,513,493
|
|
||
|
Basic and diluted book value per share denominator:
|
|||||||||||
|
Common shares outstanding
|
93,639,610
|
|
103,282,427
|
|
105,856,531
|
|
|||||
|
Unvested restricted shares
|
(2,025,113
|
)
|
(1,873,588
|
)
|
(1,682,783
|
)
|
|||||
|
Basic book value per share denominator:
|
91,614,497
|
|
101,408,839
|
|
104,173,748
|
|
|||||
|
Effect of dilutive warrants issued to founders and an advisor (1)
|
—
|
|
4,651,163
|
|
4,651,163
|
|
|||||
|
Effect of dilutive stock options issued to directors and employees (1)
|
—
|
|
5,123,531
|
|
5,274,333
|
|
|||||
|
Effect of dilutive restricted shares issued to directors and employees
(2)
|
1,209,285
|
|
905,412
|
|
878,529
|
|
|||||
|
Diluted book value per share denominator:
|
92,823,782
|
|
112,088,945
|
|
114,977,773
|
|
|||||
|
Basic book value per share
|
$
|
13.15
|
|
$
|
16.33
|
|
$
|
13.57
|
|
||
|
Diluted book value per share
|
$
|
12.98
|
|
$
|
15.65
|
|
$
|
13.16
|
|
||
|
(1)
|
As a result of the Company’s share price being under the minimum strike price for warrants and options as of December 31, 2018, there was no dilution from warrants and stock options.
|
|
(2)
|
As of
December 31, 2018
, the effect of dilutive restricted shares issued to directors and employees was comprised of
24,065
restricted shares with a service condition only and
1,185,220
restricted shares with a service and performance condition that were considered probable of vesting.
|
Return on Beginning Shareholders’ Equity Attributable to Third Point Re Common Shareholders
Return on beginning shareholders’ equity attributable to Third Point Re common shareholders, as presented, is a non-GAAP financial measure. Return on beginning shareholders’ equity attributable to Third Point Re common shareholders is calculated by dividing
net income (loss) available
to Third Point Re common shareholders by the beginning shareholders’ equity attributable to Third Point Re common shareholders. We believe that return on beginning shareholders’ equity attributable to Third Point Re common shareholders is an important measure because it assists our management and investors in evaluating the Company’s profitability.
For the years ended
December 31, 2018
and
2017
,
we have also adjusted the beginning shareholders’ equity attributable to Third Point Re common shareholders for the impact of the shares repurchased on a weighted average basis. For a period where there was a loss, this adjustment decreased the stated returns on beginning shareholders’ equity and for a period where there was a gain, this adjustment increased the stated returns on beginning shareholders’ equity.
71
Return on beginning shareholders’ equity attributable to Third Point Re common shareholders for the years ended
December 31, 2018
,
2017
and
2016
was calculated as follows:
|
2018
|
2017
|
2016
|
|||||||||
|
($ in thousands)
|
|||||||||||
|
Net income (loss) available to Third Point Re common shareholders
|
$
|
(317,692
|
)
|
$
|
277,798
|
|
$
|
27,635
|
|
||
|
Shareholders’ equity attributable to Third Point Re common shareholders - beginning of year
|
1,656,089
|
|
1,414,051
|
|
1,379,726
|
|
|||||
|
Impact of weighting related to shareholders’ equity from shares repurchased
|
(65,120
|
)
|
(29,038
|
)
|
(4,363
|
)
|
|||||
|
Adjusted shareholders’ equity attributable to Third Point Re common shareholders - beginning of year
|
$
|
1,590,969
|
|
$
|
1,385,013
|
|
$
|
1,375,363
|
|
||
|
Return on beginning shareholders’ equity attributable to Third Point Re common shareholders
|
(20.0
|
)%
|
20.1
|
%
|
2.0
|
%
|
|||||
Other Financial Metrics
Net Underwriting Income (Loss) for Property and Casualty Reinsurance Segment
One way that we evaluate the performance of our property and casualty reinsurance results is by measuring net underwriting income (loss). We do not measure performance based on the amount of gross premiums written. Net underwriting income or loss is calculated from net premiums earned, less net loss and loss adjustment expenses, acquisition costs and general and administrative expenses related to underwriting activities. See additional information in
Note 24
to our consolidated financial statements.
Combined Ratio for Property and Casualty Reinsurance Segment
Combined ratio is calculated by dividing the sum of loss and loss adjustment expenses incurred, net, acquisition costs, net and general and administrative expenses related to underwriting activities by net premiums earned. This ratio is a key indicator of a reinsurance company’s underwriting profitability. A combined ratio of greater than 100% means that loss and loss adjustment expenses, acquisition costs and general and administrative expenses related to underwriting activities exceeded net premiums earned. See additional information in
Note 24
to our consolidated financial statements.
Liquidity and Capital Resources
Liquidity Requirements
Third Point Re is a holding company and has no substantial operations of its own. Its cash needs primarily consist of the payment of corporate expenses. Its assets consist primarily of its investments in subsidiaries. Third Point Re’s ability to pay expenses or dividends or return capital to shareholders will depend upon the availability of dividends or other statutorily permissible distributions from those subsidiaries. Cash at the subsidiaries is used primarily to pay loss and loss adjustment expenses, reinsurance premiums, acquisition costs, interest expense, taxes, general and administrative expenses and to purchase investments.
We and our Bermuda subsidiaries are subject to Bermuda regulatory constraints that affect our ability to pay dividends. Under the Companies Act, as amended, a Bermuda company may declare or pay a dividend out of distributable reserves only if it has reasonable grounds for believing that it is, or would after the payment, be able to pay its liabilities as they become due and if the realizable value of its assets would thereby not be less than its liabilities. Under the Insurance Act, Third Point Re BDA and Third Point Re USA, as Class 4 insurers, are prohibited from declaring or paying a dividend if they are in breach of their respective minimum solvency margin (“MSM”), enhanced capital requirement (“ECR”) or minimum liquidity ratio or if the declaration or payment of such dividend would cause such a breach. Where either Third Point Re BDA or Third Point Re USA, as Class 4 insurers, fails to meet its MSM or minimum liquidity ratio on the last day of any financial year, it is prohibited from declaring or paying any dividends during the next financial year without the approval of the BMA.
In addition, each of Third Point Re BDA and Third Point Re USA, as Class 4 insurers, is prohibited from declaring or paying in any financial year dividends of more than 25% of its respective total statutory capital and surplus (as shown
72
on its previous financial year’s statutory balance sheet) unless it files (at least seven days before payment of such dividend) with the BMA an affidavit signed by at least two directors (one of whom must be a Bermuda resident director if any of the insurer’s directors are resident in Bermuda) and the principal representative stating that it will continue to meet its solvency margin and minimum liquidity ratio.
As of
December 31, 2018
, Third Point Re BDA could pay dividends to Third Point Re of approximately
$260.8 million
(December 31,
2017
- $357.5 million). Third Point Re USA has also entered into a Net Worth Maintenance Agreement that further restricts the amount of capital and surplus it has available for the payment of dividends. In order to comply with the Net Worth Maintenance Agreement, we have committed to ensuring that Third Point Re USA will maintain a minimum level of capital of $250.0 million. Failure of Third Point Re USA to maintain the minimum level of capital required by the Net Worth Maintenance Agreement could limit or prevent Third Point Re USA from paying dividends to us. As a result, Third Point Re USA could pay dividends ultimately to Third Point Re of approximately
$1.4 million
as of
December 31, 2018
(December 31,
2017
-
$24.3 million
).
In addition to the regulatory and other contractual constraints to paying dividends, we manage the capital of the group and each of our operating subsidiaries to support our current ratings from A.M. Best. This could further reduce the ability and amount of dividends that could be paid from Third Point Re BDA or Third Point Re USA to Third Point Re.
Other Liquidity Requirements
Third Point Re fully and unconditionally guarantees the $115.0 million of debt obligations issued by TPRUSA, a wholly owned subsidiary. See
Note 13
to our consolidated financial statements for detailed information on our Senior Notes.
Third Point Re may also require cash to fund share repurchases. See
Note 17
to our consolidated financial statements for detailed information on our share repurchases.
For additional commitments and contingencies that may affect our liquidity requirements see
Note 23
to our consolidated financial statements.
Sources of Liquidity
Historically, our sources of funds have primarily consisted of premiums written, reinsurance recoveries, investment income and proceeds from sales and redemptions of investments.
See Item 1. “Business” and Note 4 to our consolidated financial statements for information regarding the LPA and transition of our investment structure from a separate account structure to TP Fund. We expect our overall investment exposures, returns, fees paid to Third Point LLC and TP GP as well as the investment guidelines, liquidity and redemption rights to be generally similar under the LPA and TP Fund IMA compared to what would have been expected under the separate accounts managed under the JV Agreements, assuming similar underlying investment portfolio returns and exposure levels. However, there can be no assurance of such results.
TP Fund’s investment portfolio is concentrated in tradeable securities and is marked to market each day. Pursuant to the investment guidelines as specified in the LPA, at least 60% of our portfolio must be invested in securities of publicly traded companies and governments of Organization of Economic Co-operation and Development high income countries, asset-backed securities, cash, cash equivalents and gold and other precious metals. We may withdraw all or a portion of our capital account balance from TP Fund at any calendar month end or at the close of business on each Wednesday during a month, with not less than three days’ notice to pay claims on our reinsurance contracts, and with not less than five days’ notice to pay for expenses, and on not less than three days’ notice in order to satisfy a requirement of A.M. Best. We believe the liquidity profile of the net investments underlying the TP Fund, the Company’s rights under the LPA to withdraw from the TP Fund and the operating cash on hand will provide us with sufficient liquidity to manage our operations.
In addition, we expect that our cash and cash equivalents on the balance sheet and cash flow from operations will provide us with the financial flexibility to execute our strategic objectives. Our ability to generate cash, however, is subject to our performance, general economic conditions, industry trends and other factors. To the extent cash and cash equivalents on the balance sheet, investment returns and cash flow from operations are insufficient to fund our future
73
activities and requirements, we may need to raise additional funds through public or private equity or debt financing. If we issue equity securities in order to raise additional funds, substantial dilution to existing shareholders may occur. If we raise cash through the issuance of additional indebtedness, we may be subject to additional contractual restrictions on our business. There is no assurance that we would be able to raise the additional funds on favorable terms or at all. There are regulatory and contractual restrictions and rating agency considerations that might impact the ability of our reinsurance subsidiaries to pay dividends to their respective parent companies, including for purposes of servicing TPRUSA’s debt obligations.
We do not believe that inflation has had a material effect on our consolidated results of operations to date. The effects of inflation are considered implicitly in pricing our reinsurance contracts. Loss reserves are established to recognize likely loss settlements at the date payment is made. Those reserves inherently recognize the effects of inflation. However, the actual effects of inflation on our results cannot be accurately known until claims are ultimately resolved.
Cash Flows
Our cash flows from operations generally represent the difference between: (l) premiums collected and investment earnings realized and (2) loss and loss expenses paid, reinsurance purchased, underwriting and other expenses paid. Cash flows from operations may differ substantially from
net income (loss)
and may be volatile from period to period depending on the underwriting opportunities available to us and other factors. Due to the nature of our underwriting portfolio, claim payments can be unpredictable and may need to be made within relatively short periods of time. Claim payments can also be required several months or years after premiums are collected.
Operating, investing and financing cash flows for the years ended
December 31, 2018
,
2017
and
2016
were as follows:
|
2018
|
2017
|
2016
|
|||||||||
|
($ in thousands)
|
|||||||||||
|
Net cash provided by (used in) operating activities
|
$
|
13,387
|
|
$
|
(78,536
|
)
|
$
|
4,771
|
|
||
|
Net cash provided by (used in) investing activities
|
377,556
|
|
265,245
|
|
(85,253
|
)
|
|||||
|
Net cash provided by (used in) financing activities
|
(226,939
|
)
|
53,733
|
|
38,051
|
|
|||||
|
Net increase (decrease) in cash, cash equivalents and restricted cash
|
164,004
|
|
240,442
|
|
(42,431
|
)
|
|||||
|
Cash, cash equivalents and restricted cash at beginning of year
|
549,333
|
|
308,891
|
|
351,322
|
|
|||||
|
Cash, cash equivalents and restricted cash at end of year
|
$
|
713,337
|
|
$
|
549,333
|
|
$
|
308,891
|
|
||
Operating Activities
Cash flows from operating activities generally represent net premiums collected less loss and loss adjustment expenses, acquisition costs and general and administrative expenses paid.
The increase in cash flows from operating activities in the year ended
December 31, 2018
compared to the year ended December 31, 2017 was primarily due to higher net reinsurance receipts, corresponding to premium receipts less losses paid and acquisition costs paid partially offset by higher general and administrative expenses paid.
The decrease in cash flows from operating activities in the year ended December 31, 2017 compared to the year ended December 31, 2016 was primarily due to lower net reinsurance receipts from our reinsurance operations.
Excess cash generated from our operating activities is typically then invested by Third Point LLC into either the TP Fund or collateral assets. The amount of net reinsurance receipt can vary significantly from period to period depending on the timing, type and size of reinsurance contracts we bind.
Investing Activities
Cash flows provided by (used in) investing activities primarily reflects investment activities in our separate account investment structure prior to the change in investment account structure and the net cash redemptions from TP Fund
74
after such change. The transfer of the net investment assets and liabilities to TP Fund, as described in Note 4 to our consolidated financial statements, had limited impact on our liquidity. Cash flows provided by investing activities for the years ended
December 31, 2018
and
2017
primarily relates to net redemptions and the proceeds from the sale and maturity of certain investments used to fund cash flows from operations and share repurchases of
$138.7 million
and $40.9 million, respectively. Cash flows used in investing activities for the years ended December 31,
2016
primarily reflects the investment of float generated from our reinsurance operations, including the net proceeds from deposit liability contracts.
Financing Activities
Cash flows used in financing activities for the year ended
December 31, 2018
consisted of
$138.7 million
for shares repurchased and
$98.0 million
of net withdrawals from total noncontrolling interests. Cash flows used in financing activities for the year ended
December 31, 2017
consisted of $74.0 million of net contributions from total noncontrolling interests and contributions received on deposit liability contracts of $19.1 million, partially offset by $40.9 million for shares repurchased. Cash flows provided by financing activities for the year ended December 31,
2016
consisted of contributions received on deposit liability contracts and proceeds from the exercise of stock options, partially offset by $7.4 million of shares repurchased.
For the period from inception until
December 31, 2018
, we have had sufficient cash flow from the proceeds of our initial capitalization and IPO, the issuance of Notes in February 2015, and from our operations to meet our liquidity requirements. We expect that projected operating and capital expenditure requirements and debt service requirements for at least the next twelve months will be met by our balance of cash, cash flows generated from operating activities and investment income. We may incur additional indebtedness in the future if we determine that it would be an efficient part of our capital structure.
Cash, Restricted Cash and Cash Equivalents and Restricted Investments
Cash and cash equivalents consist of cash held in banks and other short-term, highly liquid investments with original maturity dates of ninety days or less.
See
Note 3
to our consolidated financial statements for additional information on restricted cash, cash equivalents and investments.
Restricted cash and cash equivalents and restricted investments
decrease
d by
$18.8 million
, or
2.2%
, to
$848.8 million
as of
December 31, 2018
from
$867.6 million
as of
December 31, 2017
. The
decrease
was primarily due to the issuance of letters of credit through our unsecured facility. In addition, we are now investing a portion of the collateral securing certain reinsurance contracts in U.S. treasury securities and sovereign debt. This portion of the collateral is included in debt securities in the consolidated balance sheets and is disclosed as part of restricted investments.
Letter of Credit Facilities
See
Note 13
to our consolidated financial statements for additional information regarding our letter of credit facilities.
As of
December 31, 2018
,
$349.2 million
(
December 31, 2017
-
$250.5 million
) of letters of credit had been issued. Each of the facilities contain customary events of default and restrictive covenants, including but not limited to, limitations on liens on collateral, transactions with affiliates, mergers and sales of assets, as well as solvency and maintenance of certain minimum pledged equity requirements and a minimum rating from rating agencies. Each restricts issuance of any debt without the consent of the letter of credit provider. Additionally, if an event of default exists, in any of the letter of credit facilities, we could be prohibited from paying dividends. We were in compliance with all of the covenants under the aforementioned facilities as of
December 31, 2018
.
Cash Secured Letter of Credit Agreements
Under the cash secured letter of credit facilities, we provide collateral that consists of cash and cash equivalents. As of
December 31, 2018
, total cash and cash equivalents with a fair value of
$204.0 million
(
December 31, 2017
-
$250.5 million
) was pledged as collateral against the letters of credit issued. Prior to the change in the investment account structure, our ability to post collateral securing letters of credit and certain reinsurance contracts depended in part on our ability to borrow against certain assets in our investment accounts through prime brokerage arrangements. As a result of the change in our investment account structure, we no longer borrow from prime brokers to post cash collateral for cash secured letter of credit agreements but hold sufficient cash to post collateral securing letters of credit and certain reinsurance contracts outside of our investments in TP Fund. See Note 4 for additional information regarding the impact of the investment restructuring including the investment of collateral by Third Point LLC under the Collateral IMA.
Unsecured Revolving Credit and Letter of Credit Facility Agreement
On July 31, 2018, Third Point Re, Third Point Re BDA and Third Point Re USA entered into a one-year, $200.0 million Unsecured Revolving Credit and letter of Credit Facility Agreement with various financial institutions (the “Credit Agreement”) to support obligations in connection with our reinsurance business written by Third Point Re BDA and Third Point Re USA. The Credit Agreement expires on July 30, 2019. The Credit Agreement is fully and unconditionally guaranteed by Third Point Re.
75
Financial Condition
Shareholders’ equity
As of
December 31, 2018
, total shareholders’ equity was
$1,204.6 million
compared to
$1,661.5 million
as of
December 31, 2017
. The
decrease
was primarily due to a net loss available to Third Point Re common shareholders of
$317.7 million
and share repurchases of
$138.7 million
.
Investments
As of
December 31, 2018
, total cash and net investments managed by Third Point LLC was
$2,134.1 million
, compared to
$2,589.9 million
as of
December 31, 2017
. The
decrease
was primarily due to the
net investment loss
on net investments managed by Third Point LLC of
$251.6 million
and net
redemptions
of
$197.6 million
, primarily to fund share repurchases and cash flows from operations.
Contractual Obligations
On February 13, 2015, TPRUSA issued Senior Notes in the aggregate principal amount of $115.0 million. The Senior Notes bear interest at 7.0% and interest is payable semi-annually on February 13 and August 13 of each year. The Senior Notes are fully and unconditionally guaranteed by Third Point Re, and, in certain circumstances specified in the indenture governing the Notes, certain existing or future subsidiaries of the Company may be required to guarantee the Notes, as described in the indenture governing the Notes.
The indenture governing the Senior Notes contains customary events of default, and limits our ability to merge or consolidate or to transfer or sell all or substantially all of our assets and TPRUSA’s ability to create liens on the voting securities or profit participating equity interests of Third Point Re USA, its wholly-owned insurance subsidiary. In certain circumstances specified in the indenture governing the Senior Notes, certain of our existing or future subsidiaries may be required to guarantee the Senior Notes. Interest on the Notes is subject to adjustment from time to time in the event of a downgrade or subsequent upgrade of the rating assigned to the Senior Notes or in connection with certain changes in the ratio of consolidated total long-term indebtedness to capitalization (each as defined in the indenture governing the Senior Notes). As of
December 31, 2018
, we were in compliance with all of the covenants under the indenture governing the Senior Notes, and during the year then ended, no event requiring an increase in the interest rate applicable to the Senior Notes occurred.
Our contractual obligations as of
December 31, 2018
by estimated maturity are presented below:
|
Total
|
Less than 1 year
|
1-3 years
|
3-5 years
|
More than 5 years
|
|||||||||||||||
|
($ in thousands)
|
|||||||||||||||||||
|
Senior Notes due 2025
(1)
|
$
|
115,000
|
|
$
|
—
|
|
$
|
—
|
|
$
|
—
|
|
$
|
115,000
|
|
||||
|
Scheduled interest payments
(1)
|
52,325
|
|
8,050
|
|
16,100
|
|
16,100
|
|
12,075
|
|
|||||||||
|
Subtotal - Debt obligations
|
167,325
|
|
8,050
|
|
16,100
|
|
16,100
|
|
127,075
|
|
|||||||||
|
Loss and loss adjustment expense reserves
(2)
|
937,157
|
|
202,189
|
|
301,310
|
|
224,925
|
|
208,733
|
|
|||||||||
|
Other operating agreements
(3)
|
3,027
|
|
995
|
|
1,815
|
|
217
|
|
—
|
|
|||||||||
|
Rental leases
(4)
|
2,049
|
|
935
|
|
1,075
|
|
39
|
|
—
|
|
|||||||||
|
Deposit liabilities
(5)
|
145,342
|
|
13,198
|
|
30,088
|
|
33,941
|
|
68,115
|
|
|||||||||
|
$
|
1,254,900
|
|
$
|
225,367
|
|
$
|
350,388
|
|
$
|
275,222
|
|
$
|
403,923
|
|
|||||
|
(1)
|
See
Note 13
to our consolidated financial statements for detailed information on our Senior Notes.
|
|
(2)
|
We have estimated the expected payout pattern of the loss and loss adjustment expense reserves by applying estimated payout patterns by contract. The amount and timing of actual loss payments could differ materially from the estimated payouts in the table above. Refer to “Critical Policies and Accounting Estimates - Loss and Loss Adjustment Expense Reserves” for additional information.
|
|
(3)
|
We have an undivided
31.25%
interest in an aircraft with NetJets Sales Inc. (“NetJets”), which expires on August 31, 2021. The agreement with NetJets provides for monthly management fees, occupied hourly fees and other fees. We also have service agreements for information technology support services that expire on December 31, 2021 and December 31, 2023.
|
76
|
(4)
|
We lease office space at Point House in Pembroke, Bermuda. This five year lease expires on November 30, 2020. We also lease office space in Jersey City, New Jersey, U.S.A. This three year lease expires on February 28, 2022.
|
|
(5)
|
See
Note 12
to our consolidated financial statements for detailed information on deposit liability contracts. For purposes of this contractual obligations table, we have included estimates of future interest accruals and the amount we expect the deposit liability contracts would settle for at their probable settlement dates.
|
Off-Balance Sheet Commitments and Arrangements
Prior to the change in our investment account structure, the derivatives in our investment portfolio were considered off-balance sheet arrangements. Refer to Note 4 and Note 8 for additional details. We do not participate in transactions that create relationships with unconsolidated entities or financial partnerships, often referred to as variable interest entities, which would have been established for the purpose of facilitating off-balance sheet arrangements.
Critical Accounting Policies and Estimates
See
Note 2
to our notes to consolidated financial statements included elsewhere in this Annual Report on Form 10-K for a summary of our significant accounting and reporting policies.
Our consolidated financial statements are prepared in accordance with U.S. GAAP, which requires management to make estimates and assumptions. We believe that the accounting policies that require the most significant judgments and estimations by management are: (1) premium revenue recognition including evaluation of risk transfer, (2) loss and loss adjustment expense reserves, (3) fair value measurements related to our investments, and (4) consolidation of variable interest entities. If actual events differ significantly from the underlying judgments or estimates used by management in the application of these accounting policies, there could be a material adverse effect on our results of operations and financial condition.
Premium Revenue Recognition Including Evaluation of Risk Transfer
For each contract that we write, we estimate the ultimate premium for the entire contract period and record this estimate at the inception of the contract, to the extent the amount of written premium is estimable. For contracts where the full written premium is not estimable at inception, we record written premium for the portion of the contract period for which the amount is estimable. These estimates are based primarily on information in the underlying contracts as well as information provided by our clients and/or brokers. See
Note 2
to our consolidated financial statements for additional information on premium revenue recognition.
Changes in premium estimates are expected and may result in adjustments in any reporting period. These estimates change over time as additional information regarding the underlying business volume is obtained. Along with uncertainty regarding the underlying business volume, our contracts also contain a number of contractual features that can significantly impact the amount of premium that we ultimately recognize. These include commutation provisions, multi-year contracts with cancellation provisions and provisions to return premium at the expiration of the contract in certain circumstances. In certain contracts, these provisions can be exercised by the client, in some cases provisions can be exercised by us and in other cases by mutual consent. In addition, we write a small number of large contracts and the majority of our property and casualty reinsurance segment premiums written to date has been quota share business. As a result, we may be subject to greater volatility around our premium estimates compared to other property and casualty companies. We regularly monitor the premium estimates for each of our contracts considering the cash premiums received, reported premiums, discussions with our clients regarding their premium projections as well as evaluating the potential impact of contractual features. Any subsequent adjustments arising on such estimates are recorded in the period in which they are determined.
Changes in premium estimates may not result in a direct impact to net income or shareholders’ equity since changes in premium estimates do not necessarily impact the amount of net premiums earned at the time of the premium estimate change and would generally be offset by proportional changes in acquisition costs and net loss and loss adjustment expenses.
During the year ended
December 31, 2018
, we recorded $12.0 million of changes in premium estimates on prior years’ contracts (
2017
- $25.6 million and
2016
- $106.6 million). There was a $0.7 million impact on net income of these changes in premium estimates for the year ended
December 31, 2018
(
2017
- $(0.8) million and
2016
- $1.0 million).
77
See “Management’s Discussion and Analysis of Financial Condition and Results of Operations - Property and Casualty Reinsurance” for additional information on changes in premium estimates.
Determining whether or not a reinsurance contract meets the condition for risk transfer requires judgment. The determination of risk transfer is critical to recognizing premiums written and is based, in part, on the use of actuarial pricing models and assumptions and evaluating contractual features that could impact the determination of whether a contract meets risk transfer. If we determine that a reinsurance contract does not transfer sufficient risk, we use deposit accounting. See
Note 12
to our consolidated financial statements for additional information on deposit contracts entered into to date.
Loss and Loss Adjustment Expense Reserves
See
Note 9
to our notes to consolidated financial statements included elsewhere in this Annual Report on Form 10-K for additional information regarding loss and loss adjustment expense reserves including reserving methodologies and additional information on loss development.
Sensitivity Analysis
The table below shows the impact of reasonably likely changes to our actuarial estimates of our client’s ceded loss on the following: loss and loss adjustment expense reserves, net; acquisition costs, net; net underwriting loss and shareholders’ equity as of and for the year ended December 31,
2018
. Since many contracts that we write have sliding scale commissions, profit commissions, loss corridors or other loss mitigating features that adjust with or offset the loss and loss adjustment expenses incurred, we consider these contractual features to be important in understanding the sensitivity of our results to changes in loss ratio assumptions.
The following table illustrates the aggregate impact of a ten percent increase and decrease applied to the subject ultimate loss and loss adjustment expenses, net for each in-force contract in the property and casualty reinsurance segment. In cases where a loss corridor applies, a 10% increase (or decrease) in our estimate of the subject ultimate loss and loss adjustment expenses, net, may not translate to an increase (or decrease) in the assumed loss and loss adjustment expenses, net. In cases where a sliding scale ceding commission or profit commission applies, a 10% increase (or decrease) in our estimate of the subject ultimate loss and loss adjustment expenses, net, does translate to an increase (or decrease) in the assumed loss and loss adjustment expenses, but that increase (or decrease) may be offset by a decrease (or increase) in the acquisition costs, net.
As a result of the contractual features mentioned above, many of our reinsurance contracts provide for a maximum margin. Consequently, our upside potential on these contracts is limited. In these cases, the relative impact of the adverse development scenario is greater than the impact of the favorable development scenario.
These increases and decreases are only applied to contracts where there is still material uncertainty of the outcome. In general, we treat contracts for which the assumed reporting pattern is less than 90% reported as having material uncertainty in the outcome. Assumed ultimate losses and loss adjustment expenses incurred, net, represents the sum we would be obligated to pay for fully developed claims (i.e., paid losses plus outstanding reported losses and IBNR losses). The impact to shareholder’s equity does not consider the cash flow, and thus, investment income considerations associated with an increase or decrease in subject ultimate loss and loss adjustment expenses, net.
78
|
10% increase in ultimate loss and loss adjustment expenses, net
|
10% decrease in ultimate loss and loss adjustment expenses, net
|
||||||
|
($ in thousands)
|
|||||||
|
Impact on:
|
|||||||
|
Loss and loss adjustment expense reserves, net
|
$
|
134,538
|
|
$
|
(157,892
|
)
|
|
|
Acquisition costs, net
|
(4,484
|
)
|
49,120
|
|
|||
|
Increase (decrease) in net underwriting loss
|
130,054
|
|
(108,772
|
)
|
|||
|
Total shareholders’ equity
|
$
|
1,204,574
|
|
$
|
1,204,574
|
|
|
|
Increase (decrease) in shareholders’ equity
|
(10.8
|
)%
|
9.0
|
%
|
|||
Fair value measurements
See
Note 5
to our consolidated financial statements for additional information on the framework for measuring fair value established by U.S. GAAP disclosure requirements. In addition to the framework discussed in
Note 5
, we perform several processes to ascertain the reasonableness of the valuation of all of our investments comprising our investment portfolio. These processes include (i) obtaining and reviewing weekly and monthly investment portfolio reports from Third Point LLC, (ii) obtaining and reviewing monthly NAV and investment return reports received directly from the Company’s third-party fund administrator, which are compared to the reports noted in (i), and (iii) monthly update discussions with Third Point LLC regarding the investment portfolio, including, their process for reviewing and validating pricing obtained from third party service providers.
Consolidation of variable interest entities
The consolidated financial statements include the accounts of all subsidiaries in which we have a controlling interest and the accounts of variable interest entities (“VIEs”) in which we are deemed to be the primary beneficiary. A VIE is an entity in which either (i) the equity investors as a group, if any, lack the power through voting or similar rights to direct the activities of such entity that most significantly impact such entity’s economic performance or (ii) the equity investment at risk is insufficient to finance that entity’s activities without additional subordinated financial support. We examine specific criteria and use judgment when determining if we are the primary beneficiary of a VIE. Factors considered in determining whether we are the primary beneficiary may include risk and reward sharing, experience and financial condition of other parties, voting rights, involvement in day-to-day capital and operating decisions, representation on a VIE’s executive committee, existence of unilateral kick-out rights or voting rights, level of economic disproportionality between us and the other parties, and other factors. Our accounting policy relating to VIEs is a critical accounting policy because the determination of whether an entity is a VIE and, if so, whether we are primary beneficiary, may require us to exercise significant judgment.
Recent Accounting Pronouncements
Refer to Note 2 to our consolidated financial statements for the year ended
December 31, 2018
included in Item 8 of this Annual Report on Form 10-K for details of recently issued accounting standards.
Item 7A. Quantitative and Qualitative Disclosures About Market Risk
We believe we are principally exposed to the following types of market risk:
|
•
|
equity price risk;
|
|
•
|
foreign currency risk;
|
|
•
|
interest rate risk;
|
|
•
|
commodity price risk;
|
|
•
|
credit risk;
|
|
•
|
liquidity risk; and
|
|
•
|
political risk.
|
79
Change in Investment Account Structure
As described in Note 4 to our consolidated financial statements, effective August 31, 2018, we transitioned from a separate account investment structure to an investment in the TP Fund, a related party investment fund. In addition, certain collateral assets held by Third Point Re BDA and Third Point Re USA will continue to be invested and managed by Third Point LLC. As a result of this transition, we remain exposed to many of the same market risks; however, these market risks are now risks associated with the investments underlying the TP Fund and no longer related to our direct holdings in the investments and securities.
For the information disclosed in relation to periods subsequent to the August 31, 2018 effective date of the investment structure changes, we have estimated the investment risks related to the investment portfolio within our investment in TP Fund based on information provided by the investment manager of TP Fund, Third Point LLC. For the comparative information disclosed for periods prior to August 31, 2018, the information relates to the investments and securities held in our separate accounts.
Equity Price Risk
The investment manager of TP Fund, Third Point LLC, tracks the performance and exposures of the TP Fund, each strategy and sector, and selective individual securities. A particular focus is placed on “beta” exposure, which is the portion of the portfolio that is directly correlated to risks and movements of the equity market as a whole (usually represented by the S&P 500 index) as opposed to idiosyncratic risks and factors associated with a specific position. Further, the performance of our investment portfolio has historically been compared to several market indices, including the S&P 500, CS/Tremont Event Driven Index, HFRI Event Driven Index, and others.
As of
December 31, 2018
, net investments managed by Third Point LLC, including investments underlying the TP Fund, included long and short equity securities, along with certain equity-based derivative instruments, the carrying values of which are primarily based on quoted market prices. Generally, market prices of common equity securities are subject to fluctuation, which could cause the amount to be realized upon the closing of the position to differ significantly from their current reported value. This risk is partly mitigated by the presence of both long and short equity securities in TP Fund’s investment portfolio. As of
December 31, 2018
, a 10% decline in the value of all equity and equity-linked derivatives would result in a loss to the Company of $70.3 million, or 3.3% of total net investments.
Computations of the prospective effects of hypothetical equity price changes are based on numerous assumptions, including the maintenance of the existing level and composition of investment securities and should not be relied on as indicative of future results.
Foreign Currency Risk
Reinsurance Contracts
We have foreign currency exposure related to non-U.S. dollar denominated reinsurance contracts. Of our gross premiums written from inception, $490.6 million, or 13.2%, were written in currencies other than the U.S. dollar. As of
December 31, 2018
, loss and loss adjustment expense reserves included $223.2 million (
December 31, 2017
- $177.2 million) and net reinsurance balances receivable included $82.4 million (
December 31, 2017
- $27.0 million) in foreign currencies. These foreign currency liability exposures were generally offset by foreign currencies held in trust accounts of $165.7 million as of
December 31, 2018
(
December 31, 2017
- $179.9 million). The foreign currency cash and cash equivalents and investments held in reinsurance trust accounts are included in net investments managed by Third Point LLC. The exposure to foreign currency collateral held in trust accounts is excluded from the foreign currency investment exposure table below.
Investments of TP Fund
Third Point LLC continually measures foreign currency exposures in the TP Fund and compares current exposures to historical movement within the relevant currencies. Within the ordinary course of business, Third Point LLC may decide to hedge foreign currency risk within TP Fund investment portfolio by using short-term forward contracts;
80
however, from time to time Third Point LLC may determine not to hedge based on its views of the likely movements of the underlying currency.
We are exposed within the TP Fund to foreign currency risk through cash, forwards, options and investments in securities denominated in foreign currencies. Foreign currency exchange rate risk is the potential for adverse changes in the U.S. dollar value of investments (long and short) and foreign currency derivative instruments, which we employ from both a speculative and risk management perspective, due to a change in the exchange rate of the foreign currency in which cash and financial instruments are denominated. As of
December 31, 2018
, through our investment in TP Fund, the Company had total net short exposure to foreign denominated securities representing 11.9% of the Company’s investment in the TP Fund, including cash and cash equivalents of $254.0 million. As of December 31, 2017, our total net short exposure to foreign denominated securities represented 26.2% of our investment portfolio including cash and cash equivalents, of $695.0 million.
The following table summarizes the net impact that a 10% increase and decrease in the value of the U.S. dollar against select foreign currencies would have had on the value of the TP Fund as of
December 31, 2018
:
|
10% increase in U.S. dollar
|
10% decrease in U.S. dollar
|
||||||||||||
|
Change in fair value
|
Change in fair value as % of investment portfolio
|
Change in fair value
|
Change in fair value as % of investment portfolio
|
||||||||||
|
($ in thousands)
|
|||||||||||||
|
Hong Kong Dollar
|
$
|
26,751
|
|
1.3
|
%
|
$
|
(26,751
|
)
|
(1.3
|
)%
|
|||
|
Saudi Arabian Riyal
|
11,491
|
|
0.5
|
%
|
(11,491
|
)
|
(0.5
|
)%
|
|||||
|
Swiss Franc
|
(13,529
|
)
|
(0.6
|
)%
|
13,529
|
|
0.6
|
%
|
|||||
|
Other
|
680
|
|
—
|
%
|
(680
|
)
|
—
|
%
|
|||||
|
Total
|
$
|
25,393
|
|
1.2
|
%
|
$
|
(25,393
|
)
|
(1.2
|
)%
|
|||
Interest Rate Risk
Our net investments managed by Third Point LLC, including investments underlying the TP Fund and Collateral Assets, includes interest rate sensitive securities, such as U.S. treasury securities and sovereign debt instruments, asset-backed securities (“ABS”), and interest rate options and derivatives. One key market risk exposure for any debt instrument is interest rate risk. As interest rates rise, the fair value of our long fixed-income portfolio falls, and the opposite is also true as interest rates fall. Additionally, some of our sovereign debt instruments, ABS and derivative investments may also be credit sensitive and their value may indirectly fluctuate with changes in interest rates.
The effect of interest rate movements have historically not had a material impact on the performance of our net investments as managed by Third Point LLC, including investments underlying the TP Fund and Collateral Assets. However, Third Point LLC monitors the potential effects of interest rate shifts by performing stress tests against the portfolio composition using a proprietary in-house risk system.
81
The following table summarizes the impact that a 100 basis point increase or decrease in interest rates would have on the value of our net investments managed by Third Point LLC, including investments underlying the TP Fund and Collateral Assets, as of
December 31, 2018
:
|
100 basis point increase in interest rates
|
100 basis point decrease in interest rates
|
||||||||||||
|
Change in fair value
|
Change in fair value as % of investment portfolio
|
Change in fair value
|
Change in fair value as % of investment portfolio
|
||||||||||
|
($ in thousands)
|
|||||||||||||
|
U.S. treasuries and sovereign debt instruments (1)
|
$
|
(7,804
|
)
|
(0.4
|
)%
|
$
|
9,220
|
|
0.4
|
%
|
|||
|
Asset-backed securities (2)
|
(2,465
|
)
|
(0.1
|
)%
|
2,478
|
|
0.1
|
%
|
|||||
|
Net exposure to interest rate risk
|
$
|
(10,269
|
)
|
(0.5
|
)%
|
$
|
11,698
|
|
0.5
|
%
|
|||
|
(1)
|
Includes interest rate risk associated with investments held as collateral in reinsurance trust accounts.
|
|
(2)
|
Includes instruments for which durations are available on
December 31, 2018
. Includes a convexity adjustment if convexity is available. Not included are mortgage hedges which would reduce the impact of interest rate changes.
|
For the purposes of the above table, the hypothetical impact of changes in interest rates on debt instruments, ABS and interest rate options was determined based on the interest rates and credit spreads applicable to each instrument individually. We and Third Point LLC periodically monitor TP Fund’s and our Collateral Assets’ net exposure to interest rate risk and generally do not expect changes in interest rates to have a materially adverse impact on our operations.
Commodity Price Risk
In managing the TP Fund, Third Point LLC periodically monitors and actively trades to take advantage of, and/or seeks to minimize any losses from, fluctuations in commodity prices. As TP Fund’s investment manager, Third Point LLC may choose to opportunistically make a long or short investment in a commodity or in a security directly affected by the price of a commodity as a response to market developments. From time to time, we expect TP Fund will invest in commodities or commodities exposures in the form of derivative contracts from both a speculative and risk management perspective. Generally, market prices of commodities are subject to fluctuation.
As of
December 31, 2018
, the TP Fund had de minimis commodity exposure. As of
December 31, 2017
, we had a de minimis commodity exposure.
We and Third Point LLC periodically monitor TP Fund’s exposure to commodity price fluctuations and generally do not expect changes in commodity prices to have a material adverse impact on our operations.
Credit Risk
Reinsurance Contracts
We have exposure to credit risk through reinsurance contracts with companies that write credit risk insurance. Our portfolio of risk is predominantly U.S.mortgage insurance and mortgage credit risk transfer. We provide our clients in these lines of business with reinsurance protection against credit deterioration, defaults or other types of financial non-performance. Loss experience in these lines of business has been very good but is cyclical and is affected by the state of the general economic environment. We seek to proactively manage the risks associated with these credit-sensitive lines of business by closely, monitoring its risk aggregation and by diversifying the underlying risks where possible. We have bought some retrocessional coverage against a subset of these risks. We have written $363.3 million, or 9.8%, of credit and financial lines premium since inception, of which
$100.6 million
was written in the year ended
December 31, 2018
. The majority of the mortgage insurance premium has been written as quota shares of private mortgage insurers, primarily in the United States.
We have exposure to credit risk as it relates to its business written through brokers, if any of our brokers are unable to fulfill their contractual obligations with respect to payments to us. In addition, in some jurisdictions, if the broker fails
82
to make payments to the insured under our policy, we may remain liable to the insured for the deficiency. Our exposure to such credit risk is somewhat mitigated in certain jurisdictions by contractual terms.
We are exposed to credit risk relating to balances receivable under our reinsurance contracts, including premiums receivable, and the possibility that counterparties may default on their obligations to us. The risk of counterparty default is partially mitigated by the fact that any amount owed to us from a reinsurance counterparty would be netted against any losses we would pay in the future. We monitor the collectability of these balances on a regular basis.
Investments of TP Fund
We are also exposed to credit risk through our net investments managed by Third Point LLC, including investments underlying the TP Fund. Third Point LLC typically performs intensive fundamental analysis on the broader markets, credit spreads, security-specific information, and the underlying issuers of debt securities that are contained in TP Fund’s investment portfolio.
In addition, the securities and cash in the TP Fund are held with several prime brokers, subjecting us to the related credit risk from the possibility that one or more of them may default on their obligations to us. Third Point LLC closely and regularly monitors the concentration of credit risk with each broker and if necessary, transfers cash or securities among brokers to diversify and mitigate TP Fund’s credit risk.
As of
December 31, 2018
and through our investment in TP Fund, and as of
December 31, 2017
, through our investment portfolio managed by Third Point LLC, the Company’s holdings in non-investment grade securities, those having a rating lower than BBB- as determined by Standard & Poor's or Fitch Ratings, Baa3 by Moody's Investor Services and securities not rated by any rating agency, were as follows:
|
2018
|
2017
|
||||||
|
($ in thousands)
|
|||||||
|
Assets:
|
|||||||
|
Asset-backed securities
|
$
|
180,458
|
|
$
|
225,499
|
|
|
|
Bank debt
|
24,299
|
|
14,550
|
|
|||
|
Corporate bonds
|
75,131
|
|
77,086
|
|
|||
|
Municipal bonds
|
25,505
|
|
—
|
|
|||
|
Sovereign debt
|
3,864
|
|
26,134
|
|
|||
|
Trade claims
|
167
|
|
7,496
|
|
|||
|
Other debt securities
|
—
|
|
5,460
|
|
|||
|
$
|
309,424
|
|
$
|
356,225
|
|
||
|
Liabilities:
|
|||||||
|
Corporate bonds
|
$
|
11,141
|
|
$
|
21,699
|
|
|
|
$
|
11,141
|
|
$
|
21,699
|
|
||
As of
December 31, 2018
through our investment in the TP Fund, and as of December 31, 2017, through our investment portfolio managed by Third Point LLC, ABS holdings were private-label issued, non-investment grade securities, and none of these securities were guaranteed by a government sponsored entity. As of
December 31, 2018
and
2017
, the largest concentration of our ABS holdings were as follows:
|
2018
|
2017
|
||||||||||||
|
($ in thousands)
|
|||||||||||||
|
Reperforming loans
|
$
|
118,595
|
|
65.7
|
%
|
$
|
160,354
|
|
71.1
|
%
|
|||
|
Market place loans
|
51,623
|
|
28.6
|
%
|
52,584
|
|
23.3
|
%
|
|||||
|
Other (1)
|
10,240
|
|
5.7
|
%
|
12,561
|
|
5.6
|
%
|
|||||
|
$
|
180,458
|
|
100.0
|
%
|
$
|
225,499
|
|
100.0
|
%
|
||||
|
(1)
|
Other includes: U.S. Alt-A positions, collateralized debt obligations, commercial mortgage-backed securities, non-U.S. RMBS and aircraft ABS.
|
83
The TP Fund may also be exposed to non-investment grade securities held within certain investments in limited partnerships and derivatives. As a result of its investment in this type of ABS and certain other non-investment grade securities, our investment portfolio is exposed to credit risk of underlying borrowers, which may not be able to make timely payments on loans or which may default on their loans. All of these classes of ABS and certain other non-investment grade securities are sensitive to changes in interest rates and any resulting change in the rate at which borrowers sell their properties (in the case of mortgage backed securities), refinance or otherwise pre-pay loans. As an investor in these classes of ABS and certain other non-investment grade securities, the TP Fund may be exposed to the credit risk of underlying borrowers not being able to make timely payments on loans or the likelihood of borrowers defaulting on their loans. In addition, the TP Fund may be exposed to significant market and liquidity risks.
Liquidity Risk
Certain of the investments underlying the TP Fund may become illiquid. Disruptions in the credit markets may materially affect the liquidity of certain investments, including ABS which represent
14.1%
(
December 31, 2017
- 7.5%) of total net investments managed by Third Point LLC as of
December 31, 2018
. If we require significant amounts of cash on short notice in excess of normal cash requirements, which could include the payment of claims expenses or to satisfy a requirement of A.M. Best, in a period of market illiquidity, certain investments underlying the TP Fund may be difficult to sell in a timely manner and may have to be disposed of for less than what may otherwise have been possible under normal conditions. As of
December 31, 2018
, through our investment in the TP Fund, we had
$877.2 million
(
December 31, 2017
- $2,202.4 million through our separate accounts) of unrestricted, liquid investment assets, defined as unrestricted cash and investments and securities with quoted prices available in active markets/exchanges.
Political Risk
Investments
We are exposed to political risk to the extent TP Fund’s investment manager trades securities that are listed on various U.S. and foreign exchanges and markets. The governments in any of these jurisdictions could impose restrictions, regulations or other measures, which may have a material impact on our investment strategy and underwriting operations.
In managing the TP Fund, Third Point LLC routinely monitors and assesses relative levels of risk associated with local political and market conditions and focuses its investments primarily in countries in which it believes the rule of law is respected and followed, thereby affording more predictable outcomes of investments in that country.
Reinsurance Contracts
We also have limited political risk exposure in several reinsurance contracts with companies that write political risk insurance.
Item 8. Financial Statements and Supplementary Data
See our consolidated financial statements and notes thereto and required financial statement schedules commencing on page F-1.
Item 9. Changes in and Disagreements With Accountants on Accounting and Financial Disclosure
Not applicable.
Item 9A. Controls and Procedures
Evaluation of Disclosure Controls and Procedures
Management, with the participation of our Chief Executive Officer and Chief Financial Officer, evaluated the effectiveness of the design and operation of the Company’s disclosure controls and procedures (as defined in Rules 13a-15(e) and 15d-15(e) of the Securities Exchange Act of 1934, as amended) as of
December 31, 2018
. Based upon this evaluation, our Chief Executive Officer and Chief Financial Officer have concluded that our disclosure controls and procedures were effective as of
December 31, 2018
.
Changes in Internal Control over Financial Reporting
There have been no material changes to our internal control over financial reporting in connection with the evaluation required by Rules 13a-15(d) and 15d-15(d) under the Exchange Act during the most recent fiscal quarter that have materially affected, or are reasonably likely to materially affect, our internal control over financial reporting.
Management’s Annual Report on Internal Control Over Financial Reporting
Our management is responsible for establishing and maintaining adequate internal control over financial reporting for the company. Internal control over financial reporting is defined in Rule 13a-15(f) or 15d-15(f) promulgated under the Securities Exchange Act of 1934 as a process designed by, or under the supervision of, the company’s principal executive and principal financial officers and effected by the company’s Board of Directors, management and other personnel, to provide reasonable assurance regarding the reliability of financial reporting and the preparation of financial statements for external purposes in accordance with generally accepted accounting principles and includes those policies and procedures that:
|
•
|
pertain to the maintenance of records that in reasonable detail accurately and fairly reflect the transactions and dispositions of the assets of the company;
|
|
•
|
provide reasonable assurance that transactions are recorded as necessary to permit preparation of financial statements in accordance with generally accepted accounting principles, and that receipts and expenditures of the company are being made only in accordance with authorizations of management and directors of the company; and
|
|
•
|
provide reasonable assurance regarding prevention or timely detection of unauthorized acquisition, use or disposition of the company’s assets that could have a material effect on the financial statements.
|
Because of its inherent limitations, internal control over financial reporting may not prevent or detect misstatements. Therefore, even those systems determined to be effective can provide only reasonable assurance with respect to financial statement preparation and presentation. Projections of any evaluation of effectiveness to future periods are subject to the risk that controls may become inadequate because of changes in conditions, or that the degree of compliance with the policies or procedures may deteriorate.
Our management assessed the effectiveness of our internal control over financial reporting as of
December 31, 2018
. In making this assessment, management used the criteria set forth by the Internal Control - Integrated Framework issued by the Committee of Sponsoring Organizations of the Treadway Commission (2013 Framework). Based on its assessment, management concluded that, as of
December 31, 2018
, our internal control over financial reporting is effective based on those criteria.
Ernst & Young Ltd., an independent registered public accounting firm, which has audited and reported on the consolidated financial statements contained in this Annual Report on Form 10-K, has issued its written attestation report on its assessment of our internal control over financial reporting, which follows this report.
84
Report of Independent Registered Public Accounting Firm
To the Shareholders and the Board of Directors of Third Point Reinsurance Ltd.
Opinion on Internal Control over Financial Reporting
We have audited Third Point Reinsurance Ltd.’s internal control over financial reporting as of
December 31, 2018
, based on criteria established in Internal Control - Integrated Framework issued by the Committee of Sponsoring Organizations of the Treadway Commission (2013 framework) (the COSO criteria). In our opinion, Third Point Reinsurance Ltd. (the Company) maintained, in all material respects, effective internal control over financial reporting as of
December 31, 2018
, based on the COSO criteria.
We also have audited, in accordance with the standards of the Public Company Accounting Oversight Board (United States) (PCAOB), the consolidated balance sheets of the Company as of
December 31, 2018
and
2017
, the related
consolidated statements of income (loss)
, shareholders’ equity and cash flows for each of the three years in the period ended
December 31, 2018
, and the related notes and financial statement schedules listed in the Index at Item 15 and our report dated
February 28, 2019
expressed an unqualified opinion thereon.
Basis for Opinion
The Company’s management is responsible for maintaining effective internal control over financial reporting and for its assessment of the effectiveness of internal control over financial reporting included in the accompanying Management’s Annual Report on Internal Control over Financial Reporting. Our responsibility is to express an opinion on the Company’s internal control over financial reporting based on our audit. We are a public accounting firm registered with the PCAOB and are required to be independent with respect to the Company in accordance with the U.S. federal securities laws and the applicable rules and regulations of the Securities and Exchange Commission and the PCAOB.
We conducted our audit in accordance with the standards of the PCAOB. Those standards require that we plan and perform the audit to obtain reasonable assurance about whether effective internal control over financial reporting was maintained in all material respects.
Our audit included obtaining an understanding of internal control over financial reporting, assessing the risk that a material weakness exists, testing and evaluating the design and operating effectiveness of internal control based on the assessed risk, and performing such other procedures as we considered necessary in the circumstances. We believe that our audit provides a reasonable basis for our opinion.
Definition and Limitations of Internal Control over Financial Reporting
A company’s internal control over financial reporting is a process designed to provide reasonable assurance regarding the reliability of financial reporting and the preparation of financial statements for external purposes in accordance with generally accepted accounting principles. A company’s internal control over financial reporting includes those policies and procedures that (1) pertain to the maintenance of records that, in reasonable detail, accurately and fairly reflect the transactions and dispositions of the assets of the company; (2) provide reasonable assurance that transactions are recorded as necessary to permit preparation of financial statements in accordance with generally accepted accounting principles, and that receipts and expenditures of the company are being made only in accordance with authorizations of management and directors of the company; and (3) provide reasonable assurance regarding prevention or timely detection of unauthorized acquisition, use, or disposition of the company’s assets that could have a material effect on the financial statements.
85
Because of its inherent limitations, internal control over financial reporting may not prevent or detect misstatements. Also, projections of any evaluation of effectiveness to future periods are subject to the risk that controls may become inadequate because of changes in conditions, or that the degree of compliance with the policies or procedures may deteriorate.
/s/ Ernst & Young Ltd.
Hamilton, Bermuda
February 28, 2019
86
Item 9B. Other Information
On February 28, 2019, Third Point Re, Third Point Re BDA and Third Point Re USA entered into the Amended LPA with TP GP, which amended and restated the 2018 LPA, with effect from January 1, 2019.
The Amended LPA revised the management fee from 1.5% per annum to 1.25% per annum with effect from January 1, 2019. In addition, pursuant to the Amended LPA, TP GP shall notify us if Third Point LLC or its affiliates (either alone or together with a third party) form any Permitted Funds. The Amended LPA permits us to withdraw up to $250.0 million in 2019 and a separate $250.0 million during the period from January 1, 2020 through December 31, 2021 for the purpose of immediately investing such amounts in Permitted Funds.
Furthermore, the Amended LPA adjusted the loss carryforward terms of the LPA, which relate to the calculation of TP GP’s performance compensation under the LPA, to preserve the loss carryforward attributable to our investment in TP Fund when contributions to TP Fund are made within nine months of certain types of withdrawals from TP Fund.
The term of the Amended LPA ends December 31, 2021, which is consistent with the term under the 2018 LPA. All other material terms of the Amended LPA remain consistent with the LPA.
A copy of the Amended LPA is furnished as Exhibit 10.33.1 to this Annual Report on Form 10-K and incorporated by reference herein. The foregoing description of the Amended LPA does not purport to be complete and is qualified in its entirety by reference to the full text of such document.
Part III
Item 10. Directors, Executive Officers and Corporate Governance
The information required by this Item relating to our directors, executive officers and corporate governance is incorporated by reference to the definitive proxy statement that will be filed with the Securities and Exchange Commission not later than 120 days after the close of the fiscal year ended
December 31, 2018
pursuant to Regulation 14A.
Item 11. Executive Compensation
The information required by this Item relating to executive compensation is incorporated by reference to the definitive proxy statement that will be filed with the Securities and Exchange Commission not later than 120 days after the close of the fiscal year ended
December 31, 2018
pursuant to Regulation 14A.
Item 12. Security Ownership of Certain Beneficial Owners and Management and Related Shareholder Matters
Certain information relating to this Item is set forth in this Annual Report under the caption “Item 5. Market for Registrant’s Common Equity, Related Shareholder Matters and Issuer Purchases of Equity Securities - Equity Compensation Plan Information”.
The balance of the information required by this Item relating to security ownership of certain beneficial owners and management is incorporated by reference to the definitive proxy statement that will be filed with the Securities and Exchange Commission not later than 120 days after the close of the fiscal year ended
December 31, 2018
pursuant to Regulation 14A.
Item 13. Certain Relationships and Related Transactions, and Director Independence
The information required by this Item relating to certain relationships and related transactions and director independence is incorporated by reference to the definitive proxy statement that will be filed with the Securities and Exchange Commission not later than 120 days after the close of the fiscal year ended
December 31, 2018
pursuant to Regulation 14A.
Item 14. Principal Accounting Fees and Services
The information required by this Item relating to principal accounting fees and services is incorporated by reference to the definitive proxy statement that will be filed with the Securities and Exchange Commission not later than 120 days after the close of the fiscal year ended
December 31, 2018
pursuant to Regulation 14A.
87
PART IV
Item 15. Exhibits and Financial Statement Schedules
Financial Statements, Financial Statement Schedules and Exhibits
Financial Statements and Financial Statement Schedules
See the Index to Consolidated Financial Statements and Supplemental Data on page F-1.
Exhibits
|
Exhibit Number
|
Description
|
|
3.1*
|
|
|
3.1.1
|
|
|
3.1.2
|
|
|
3.3
|
|
|
3.4
|
|
|
4.1*
|
|
|
4.2*
|
|
|
4.3*
|
|
|
4.4*
|
|
|
4.6*
|
|
|
4.7*
|
|
|
4.8*
|
|
|
4.9
|
|
|
4.10
|
|
|
4.11
|
|
|
4.12
|
|
E-1
|
10.1*
|
|
|
10.1.1
|
|
|
10.3.6
|
|
|
10.4*
&
**
|
|
|
10.4.1**
|
|
|
10.4.2**
|
|
|
10.4.3**
|
|
|
10.4.4**
|
|
|
10.4.5
|
|
|
10.5*
&
**
|
|
|
10.6*
&
**
|
|
|
10.6.1**
|
|
|
10.6.2**
|
|
|
10.6.3**
|
|
|
10.6.4**
|
|
|
10.6.4.1
|
|
|
10.6.5**
|
|
|
10.7*
&
**
|
|
|
10.8**
|
|
|
10.8.1**
|
|
|
10.9**
|
|
|
10.9.1
|
|
E-2
|
10.10**
|
|
|
10.11**
|
|
|
10.22*
|
|
|
10.23*
|
|
|
10.24
|
|
|
10.26*†
|
|
|
10.27*
&
**
|
|
|
10.28*
&
**
|
|
|
10.28.1**
|
|
|
10.29
|
|
|
10.30**
|
|
|
10.32**
|
|
|
10.32.1**
|
|
|
10.32.2**
|
|
|
10.32.3**
|
|
|
10.32.4**
|
|
|
10.33
|
|
|
10.33.1
|
|
|
10.34
|
|
|
10.35
|
|
E-3
|
10.36
|
|
|
10.37
|
|
|
10.38
|
|
|
21.1
|
|
|
23.1
|
|
|
23.2
|
|
|
24.1
|
|
|
31.1
|
|
|
31.2
|
|
|
32.1±
|
|
|
32.2±
|
|
|
99.1
|
|
|
101.INS††
|
XBRL Instance Document
|
|
101.SCH††
|
XBRL Taxonomy Extension Schema Document
|
|
101.CAL††
|
XBRL Taxonomy Extension Calculation Linkbase Document
|
|
101.LAB††
|
XBRL Taxonomy Extension Labels Linkbase Document
|
|
101.PRE††
|
XBRL Taxonomy Extension Presentation Linkbase Document
|
|
101.DEF††
|
XBRL Taxonomy Extension Definition Linkbase Document
|
|
*
|
Incorporated by reference to the exhibit of the same number filed as part of the Company’s registration statement on Form S-1 (File No. 333-189960) which was declared effective by the Securities and Exchange Commission on August 14, 2013.
|
|
**
|
Management contracts or compensatory plans or arrangements
|
|
±
|
This certification accompanies the Form 10-K to which it relates, is not deemed filed with the Securities and Exchange Commission and is not to be incorporated by reference into any filing of the Registrant under the Securities Act of 1933, as amended, or the Securities Exchange Act of 1934, as amended (whether made before or after the date of the Form 10-K), irrespective of any general incorporation language contained in such filing.
|
|
†
|
Registrant has omitted portions of the referenced exhibit pursuant to a request for confidential treatment under Rule 406 promulgated under the Securities Act of 1933, as amended (Securities Act).
|
|
††
|
In accordance with Rule 406T of Regulation S-T, the information in these exhibits is furnished and deemed not filed or part of a registration statement or prospectus for purposes of sections 11 or 12 of the Securities Act of 1933, is deemed not filed for purposes of section 18 of the Exchange Act of 1934, and otherwise is not subject to liability under these sections.
|
E-4
SIGNATURES
Pursuant to the requirements of Section 13 or 15(d) of the Securities Exchange Act of 1934, the registrant has duly caused this report to be signed on its behalf by the undersigned, thereunto duly authorized, in Pembroke, Bermuda, on
February 28, 2019
.
THIRD POINT REINSURANCE LTD.
(Registrant)
|
By:
|
/s/ J. Robert Bredahl
|
Name: J. Robert Bredahl
|
Title:
|
Director, President and Chief Executive Officer
|
Pursuant to the requirements of the Securities Act of 1933, as amended, this report has been signed below by the following persons on behalf of the registrant and in the capacities and on the dates indicated.
|
Signature
|
Title
|
Date
|
||
|
*
|
Chairman of the Board
|
February 28, 2019
|
||
|
Joshua L. Targoff
|
||||
|
/s/ J. Robert Bredahl
|
Director, President and Chief Executive Officer
(Principal Executive Officer)
|
February 28, 2019
|
||
|
J. Robert Bredahl
|
||||
|
/s/ Christopher S. Coleman
|
Chief Financial Officer
(Principal Financial Officer and Principal Accounting Officer)
|
February 28, 2019
|
||
|
Christopher S. Coleman
|
||||
|
*
|
Director
|
February 28, 2019
|
||
|
Steven E. Fass
|
||||
|
*
|
Director
|
February 28, 2019
|
||
|
Rafe de la Gueronniere
|
||||
|
*
|
Director
|
February 28, 2019
|
||
|
Gretchen A. Hayes
|
||||
|
*
|
Director
|
February 28, 2019
|
||
|
Mary R. Hennessy
|
||||
|
*
|
Director
|
February 28, 2019
|
||
|
Neil McConachie
|
||||
|
*
|
Director
|
February 28, 2019
|
||
|
Mark Parkin
|
||||
|
* By:
|
/s/ Janice Weidenborner
|
|||
|
Name:
Title:
|
Janice Weidenborner
Attorney-in-Fact
|
|||
E-5
THIRD POINT REINSURANCE LTD.
INDEX TO CONSOLIDATED FINANCIAL STATEMENTS AND SUPPLEMENTAL DATA
|
|
Page
|
|
Audited Consolidated Financial Statements
|
|
|
Report of Independent Registered Public Accounting Firm
|
|
|
Consolidated Balance Sheets as of December 31, 2018 and 2017
|
|
|
Consolidated Statements of Income (Loss) for the years ended December 31, 2018, 2017 and 2016
|
|
|
Consolidated Statements of Changes in Shareholders’ Equity for the years ended December 31, 2018, 2017 and 2016
|
|
|
Consolidated Statements of Cash Flows for the years ended December 31, 2018, 2017 and 2016
|
|
|
Notes to the Consolidated Financial Statements
|
|
|
Schedule I - Summary of Investments - Other than Investments in Related Parties
|
|
|
Schedule III - Supplementary Insurance Information
|
|
|
Schedule IV - Reinsurance
|
|
All other schedules and notes specified under Regulation S-X are omitted because they are either not applicable, not required or the information called for therein appears in response to the items in the Consolidated Financial Statements and the related Notes to Consolidated Financial Statements of Third Point Reinsurance Ltd. and its subsidiaries listed on the above index.
F-1
Report of Independent Registered Public Accounting Firm
To the Shareholders and the Board of Directors of Third Point Reinsurance Ltd.
Opinion on the Financial Statements
We have audited the accompanying consolidated balance sheets of Third Point Reinsurance Ltd. (the Company) as of December 31, 2018 and 2017, the related consolidated statements of income (loss), shareholders’ equity and cash flows for each of the three years in the period ended December 31, 2018 and the related notes and financial statement schedules listed in the Index at Item 15 (collectively referred to as the “consolidated financial statements”). In our opinion, the consolidated financial statements present fairly, in all material respects, the financial position of the Company at December 31, 2018 and 2017, and the results of its operations and its cash flows for each of the three years in the period ended December 31, 2018, in conformity with U.S. generally accepted accounting principles.
We also have audited, in accordance with the standards of the Public Company Accounting Oversight Board (United States) (PCAOB), the Company’s internal control over financial reporting as of December 31, 2018, based on criteria established in Internal Control-Integrated Framework issued by the Committee of Sponsoring Organizations of the Treadway Commission (2013 framework) and our report dated
February 28, 2019
expressed an unqualified opinion thereon.
Basis for Opinion
These financial statements are the responsibility of the Company’s management. Our responsibility is to express an opinion on the Company’s financial statements based on our audits. We are a public accounting firm registered with the PCAOB and are required to be independent with respect to the Company in accordance with the U.S. federal securities laws and the applicable rules and regulations of the Securities and Exchange Commission and the PCAOB.
We conducted our audits in accordance with the standards of the PCAOB. Those standards require that we plan and perform the audit to obtain reasonable assurance about whether the financial statements are free of material misstatement, whether due to error or fraud. Our audits included performing procedures to assess the risks of material misstatement of the financial statements, whether due to error or fraud, and performing procedures that respond to those risks. Such procedures included examining, on a test basis, evidence regarding the amounts and disclosures in the financial statements. Our audits also included, evaluating the accounting principles used and significant estimates made by management, as well as evaluating the overall presentation of the financial statements. We believe that our audits provide a reasonable basis for our opinion.
/s/ Ernst & Young Ltd.
We have served as the Company’s auditor since 2012.
Hamilton, Bermuda
February 28, 2019
F-2
THIRD POINT REINSURANCE LTD.
CONSOLIDATED BALANCE SHEETS
As of
December 31, 2018
and
2017
(expressed in thousands of U.S. dollars, except per share and share amounts)
|
December 31, 2018
|
December 31, 2017
|
||||||
|
Assets
|
|||||||
|
Investment in related party investment fund, at fair value (cost - $1,564,850; 2017 - N/A) (1)
|
$
|
1,284,004
|
|
$
|
—
|
|
|
|
Equity securities, trading, at fair value (cost - N/A; 2017 - $1,868,735)
|
—
|
|
2,283,050
|
|
|||
|
Debt securities, trading, at fair value (cost - $252,362; 2017 - $711,322)
|
239,640
|
|
675,158
|
|
|||
|
Other investments, at fair value
|
84
|
|
37,731
|
|
|||
|
Total investments in securities
|
1,523,728
|
|
2,995,939
|
|
|||
|
Cash and cash equivalents
|
104,183
|
|
8,197
|
|
|||
|
Restricted cash and cash equivalents
|
609,154
|
|
541,136
|
|
|||
|
Due from brokers
|
1,411
|
|
305,093
|
|
|||
|
Derivative assets, at fair value
|
—
|
|
73,372
|
|
|||
|
Interest and dividends receivable
|
1,316
|
|
3,774
|
|
|||
|
Reinsurance balances receivable
|
602,448
|
|
476,008
|
|
|||
|
Deferred acquisition costs, net
|
203,842
|
|
258,793
|
|
|||
|
Unearned premiums ceded
|
17,552
|
|
1,049
|
|
|||
|
Loss and loss adjustment expenses recoverable
|
2,031
|
|
1,113
|
|
|||
|
Other assets
|
20,569
|
|
7,320
|
|
|||
|
Total assets
|
$
|
3,086,234
|
|
$
|
4,671,794
|
|
|
|
Liabilities
|
|||||||
|
Accounts payable and accrued expenses
|
$
|
7,261
|
|
$
|
34,632
|
|
|
|
Reinsurance balances payable
|
69,701
|
|
41,614
|
|
|||
|
Deposit liabilities
|
145,342
|
|
129,133
|
|
|||
|
Unearned premium reserves
|
602,936
|
|
649,518
|
|
|||
|
Loss and loss adjustment expense reserves
|
937,157
|
|
720,570
|
|
|||
|
Securities sold, not yet purchased, at fair value
|
—
|
|
394,278
|
|
|||
|
Securities sold under an agreement to repurchase
|
—
|
|
29,618
|
|
|||
|
Due to brokers
|
—
|
|
770,205
|
|
|||
|
Derivative liabilities, at fair value
|
—
|
|
14,503
|
|
|||
|
Participation agreement with related party investment fund
|
2,297
|
|
—
|
|
|||
|
Interest and dividends payable
|
3,055
|
|
4,275
|
|
|||
|
Senior notes payable, net of deferred costs
|
113,911
|
|
113,733
|
|
|||
|
Total liabilities
|
1,881,660
|
|
2,902,079
|
|
|||
|
Commitments and contingent liabilities
|
|
|
|||||
|
Redeemable noncontrolling interests in related party
|
—
|
|
108,219
|
|
|||
|
Shareholders’ equity
|
|||||||
|
Preference shares (par value $0.10; authorized, 30,000,000; none issued)
|
—
|
|
—
|
|
|||
|
Common shares (Issued: 2018 - 93,639,610; 2017 - 107,227,347; Outstanding: 2018 - 93,639,610; 2017 - 103,282,427)
|
9,364
|
|
10,723
|
|
|||
|
Treasury shares (2018 - 0; 2017 - 3,944,920)
|
—
|
|
(48,253
|
)
|
|||
|
Additional paid-in capital
|
918,882
|
|
1,099,599
|
|
|||
|
Retained earnings
|
276,328
|
|
594,020
|
|
|||
|
Shareholders’ equity attributable to Third Point Re common shareholders
|
1,204,574
|
|
1,656,089
|
|
|||
|
Noncontrolling interests in related party
|
—
|
|
5,407
|
|
|||
|
Total shareholders' equity
|
1,204,574
|
|
1,661,496
|
|
|||
|
Total liabilities, noncontrolling interests and shareholders’ equity
|
$
|
3,086,234
|
|
$
|
4,671,794
|
|
|
|
The accompanying Notes to the Consolidated Financial Statements are
an integral part of the Consolidated Financial Statements.
|
|||||||
(1) Effective August 31, 2018, Third Point Re and the TPRE Limited Partners entered into the 2018 LPA to invest in TP Fund, a related party investment fund. As a result, substantially all assets and related liabilities were transferred from the Company’s separate accounts to TP Fund and the TPRE Limited Partners received limited partnership interests in TP Fund in exchange. The TPRE Limited Partners no longer directly hold their invested assets and liabilities but instead, hold an investment in TP Fund. See Notes
4
and
11
for additional information regarding the LPA and TP Fund.
F-3
THIRD POINT REINSURANCE LTD.
CONSOLIDATED STATEMENTS OF INCOME (LOSS)
For the years ended
December 31, 2018
,
2017
and
2016
(expressed in thousands of U.S. dollars, except per share and share amounts)
|
2018
|
2017
|
2016
|
|||||||||
|
Revenues
|
|||||||||||
|
Gross premiums written
|
$
|
578,252
|
|
$
|
641,620
|
|
$
|
617,374
|
|
||
|
Gross premiums ceded
|
(19,895
|
)
|
(2,475
|
)
|
(2,325
|
)
|
|||||
|
Net premiums written
|
558,357
|
|
|
639,145
|
|
615,049
|
|
||||
|
Change in net unearned premium reserves
|
63,085
|
|
(92,087
|
)
|
(24,859
|
)
|
|||||
|
Net premiums earned
|
621,442
|
|
|
547,058
|
|
590,190
|
|
||||
|
Net investment loss from investment in related party investment fund (1)
|
(280,847
|
)
|
—
|
|
—
|
|
|||||
|
Net investment income before management and performance fees to related parties
|
59,259
|
|
522,664
|
|
158,532
|
|
|||||
|
Management and performance fees to related parties
|
(29,845
|
)
|
(130,711
|
)
|
(59,707
|
)
|
|||||
|
Net investment income (loss)
|
(251,433
|
)
|
391,953
|
|
98,825
|
|
|||||
|
Total revenues
|
370,009
|
|
|
939,011
|
|
689,015
|
|
||||
|
Expenses
|
|||||||||||
|
Loss and loss adjustment expenses incurred, net
|
438,414
|
|
370,058
|
|
395,932
|
|
|||||
|
Acquisition costs, net
|
206,498
|
|
188,904
|
|
222,150
|
|
|||||
|
General and administrative expenses
|
36,241
|
|
53,103
|
|
39,367
|
|
|||||
|
Other expenses
|
9,610
|
|
12,674
|
|
8,387
|
|
|||||
|
Interest expense
|
8,228
|
|
8,225
|
|
8,231
|
|
|||||
|
Foreign exchange (gains) losses
|
(7,503
|
)
|
12,300
|
|
(19,521
|
)
|
|||||
|
Total expenses
|
691,488
|
|
|
645,264
|
|
654,546
|
|
||||
|
Income (loss) before income tax (expense) benefit
|
(321,479
|
)
|
293,747
|
|
34,469
|
|
|||||
|
Income tax (expense) benefit
|
4,010
|
|
(11,976
|
)
|
(5,593
|
)
|
|||||
|
Net income (loss)
|
(317,469
|
)
|
|
281,771
|
|
28,876
|
|
||||
|
Net income attributable to noncontrolling interests in related party
|
(223
|
)
|
(3,973
|
)
|
(1,241
|
)
|
|||||
|
Net income (loss) available to Third Point Re common shareholders
|
$
|
(317,692
|
)
|
|
$
|
277,798
|
|
$
|
27,635
|
|
|
|
Earnings (loss) per share available to Third Point Re common shareholders
|
|||||||||||
|
Basic earnings (loss) per share available to Third Point Re common shareholders
|
$
|
(3.27
|
)
|
$
|
2.71
|
|
$
|
0.26
|
|
||
|
Diluted earnings (loss) per share available to Third Point Re common shareholders
|
$
|
(3.27
|
)
|
$
|
2.64
|
|
$
|
0.26
|
|
||
|
Weighted average number of common shares used in the determination of earnings (loss) per share
|
|||||||||||
|
Basic
|
97,054,315
|
|
102,264,094
|
|
104,060,052
|
|
|||||
|
Diluted
|
97,054,315
|
|
105,227,038
|
|
105,563,784
|
|
|||||
|
The accompanying Notes to the Consolidated Financial Statements are
an integral part of the Consolidated Financial Statements.
|
|||||||||||
(1) See Notes
4
and
11
for additional information regarding the 2018 LPA and related management and performance fees.
As a result of the 2018 LPA, the management and performance fees are presented within net investment income from investment in related party investment fund from the effective date of the LPA. Management and performance fees incurred prior to the effective date of the LPA are reflected in management and performance fees to related parties.
F-4
THIRD POINT REINSURANCE LTD.
CONSOLIDATED STATEMENTS OF SHAREHOLDERS’ EQUITY
For the years ended
December 31, 2018
,
2017
and
2016
(expressed in thousands of U.S. dollars)
|
2018
|
2017
|
2016
|
|||||||||
|
Common shares
|
|||||||||||
|
Balance, beginning of year
|
$
|
10,723
|
|
$
|
10,650
|
|
$
|
10,548
|
|
||
|
Issuance of common shares, net
|
67
|
|
73
|
|
102
|
|
|||||
|
Common shares repurchased and retired
|
(1,426
|
)
|
—
|
|
—
|
|
|||||
|
Balance, end of year
|
9,364
|
|
10,723
|
|
10,650
|
|
|||||
|
Treasury shares
|
|||||||||||
|
Balance, beginning of year
|
(48,253
|
)
|
(7,389
|
)
|
—
|
|
|||||
|
Repurchase of common shares
|
—
|
|
(40,864
|
)
|
(7,389
|
)
|
|||||
|
Retirement of treasury shares
|
48,253
|
|
—
|
|
—
|
|
|||||
|
Balance, end of year
|
—
|
|
(48,253
|
)
|
(7,389
|
)
|
|||||
|
Additional paid-in capital
|
|||||||||||
|
Balance, beginning of year
|
1,099,599
|
|
1,094,568
|
|
1,080,591
|
|
|||||
|
Issuance of common shares, net
|
(141
|
)
|
1,432
|
|
5,039
|
|
|||||
|
Share compensation expense
|
4,956
|
|
3,599
|
|
8,938
|
|
|||||
|
Common shares repurchased and retired
|
(185,532
|
)
|
—
|
|
—
|
|
|||||
|
Balance, end of year
|
918,882
|
|
1,099,599
|
|
1,094,568
|
|
|||||
|
Retained earnings
|
|||||||||||
|
Balance, beginning of year
|
594,020
|
|
316,222
|
|
288,587
|
|
|||||
|
Net income (loss)
|
(317,469
|
)
|
281,771
|
|
28,876
|
|
|||||
|
Net income attributable to noncontrolling interests in related party
|
(223
|
)
|
(3,973
|
)
|
(1,241
|
)
|
|||||
|
Balance, end of year
|
276,328
|
|
594,020
|
|
316,222
|
|
|||||
|
Shareholders’ equity attributable to Third Point Re common shareholders
|
1,204,574
|
|
1,656,089
|
|
1,414,051
|
|
|||||
|
Noncontrolling interests in related party
|
—
|
|
5,407
|
|
35,674
|
|
|||||
|
Total shareholders’ equity
|
$
|
1,204,574
|
|
$
|
1,661,496
|
|
$
|
1,449,725
|
|
||
|
The accompanying Notes to the Consolidated Financial Statements are
an integral part of the Consolidated Financial Statements.
|
|||||||||||
F-5
THIRD POINT REINSURANCE LTD.
CONSOLIDATED STATEMENTS OF CASH FLOWS
For the years ended
December 31, 2018
,
2017
and
2016
(expressed in thousands of U.S. dollars, except per share and share amounts)
|
2018
|
2017
|
2016
|
|||||||||
|
Operating activities
|
|||||||||||
|
Net income (loss)
|
$
|
(317,469
|
)
|
$
|
281,771
|
|
$
|
28,876
|
|
||
|
Adjustments to reconcile net income (loss) to net cash provided by (used in) operating activities:
|
|||||||||||
|
Share compensation expense
|
4,956
|
|
3,599
|
|
8,938
|
|
|||||
|
Net interest expense (income) on deposit liabilities
|
(1,273
|
)
|
2,800
|
|
(164
|
)
|
|||||
|
Net realized and unrealized gain on investments and derivatives
|
(34,145
|
)
|
(480,045
|
)
|
(105,262
|
)
|
|||||
|
Net realized and unrealized loss on investment in related party investment fund (1)
|
280,847
|
|
—
|
|
—
|
|
|||||
|
Net foreign exchange (gains) losses
|
(7,503
|
)
|
12,300
|
|
(19,521
|
)
|
|||||
|
Amortization of premium and accretion of discount, net
|
4,134
|
|
473
|
|
5,118
|
|
|||||
|
Changes in assets and liabilities:
|
|||||||||||
|
Reinsurance balances receivable
|
(120,620
|
)
|
(86,606
|
)
|
(86,612
|
)
|
|||||
|
Deferred acquisition costs, net
|
54,951
|
|
(37,175
|
)
|
(24,525
|
)
|
|||||
|
Unearned premiums ceded
|
(16,503
|
)
|
(354
|
)
|
(508
|
)
|
|||||
|
Loss and loss adjustment expenses recoverable
|
(918
|
)
|
(1,112
|
)
|
124
|
|
|||||
|
Other assets
|
(13,486
|
)
|
9,137
|
|
(4,619
|
)
|
|||||
|
Interest and dividends receivable, net
|
(2,716
|
)
|
3,563
|
|
3,225
|
|
|||||
|
Unearned premium reserves
|
(46,582
|
)
|
92,442
|
|
25,366
|
|
|||||
|
Loss and loss adjustment expense reserves
|
225,670
|
|
97,922
|
|
156,644
|
|
|||||
|
Accounts payable and accrued expenses
|
(24,684
|
)
|
24,212
|
|
(2,095
|
)
|
|||||
|
Reinsurance balances payable
|
28,728
|
|
(1,463
|
)
|
19,786
|
|
|||||
|
Net cash provided by (used in) operating activities
|
13,387
|
|
(78,536
|
)
|
4,771
|
|
|||||
|
Investing activities
|
|||||||||||
|
Net redemptions from related party investment fund (1)
|
6,342
|
|
—
|
|
—
|
|
|||||
|
Change in participation agreement with related party investment fund (1)
|
(20,852
|
)
|
—
|
|
—
|
|
|||||
|
Purchases of investments
|
(3,483,319
|
)
|
(3,099,525
|
)
|
(3,729,944
|
)
|
|||||
|
Proceeds from sales and maturities of investments
|
3,475,515
|
|
3,228,251
|
|
3,504,598
|
|
|||||
|
Purchases of investments to cover short sales
|
(853,798
|
)
|
(791,753
|
)
|
(1,264,404
|
)
|
|||||
|
Proceeds from short sales of investments
|
800,508
|
|
1,048,552
|
|
1,046,422
|
|
|||||
|
Change in due to/from brokers, net
|
482,778
|
|
(149,898
|
)
|
367,019
|
|
|||||
|
Increase (decrease) in securities sold under an agreement to repurchase
|
(29,618
|
)
|
29,618
|
|
(8,944
|
)
|
|||||
|
Net cash provided by (used in) investing activities
|
377,556
|
|
265,245
|
|
(85,253
|
)
|
|||||
|
Financing activities
|
|||||||||||
|
Proceeds from issuance of Third Point Re common shares, net of costs
|
—
|
|
1,505
|
|
5,141
|
|
|||||
|
Taxes paid on withholding shares
|
(74
|
)
|
—
|
|
—
|
|
|||||
|
Purchases of Third Point Re common shares under share repurchase program
|
(138,705
|
)
|
(40,864
|
)
|
(7,389
|
)
|
|||||
|
Increase in deposit liabilities, net
|
9,790
|
|
19,113
|
|
22,023
|
|
|||||
|
Change in total noncontrolling interests in related party, net
|
(97,950
|
)
|
73,979
|
|
18,276
|
|
|||||
|
Net cash provided by (used in) financing activities
|
(226,939
|
)
|
53,733
|
|
38,051
|
|
|||||
|
Net increase (decrease) in cash, cash equivalents and restricted cash
|
164,004
|
|
240,442
|
|
(42,431
|
)
|
|||||
|
Cash, cash equivalents and restricted cash at beginning of year
|
549,333
|
|
308,891
|
|
351,322
|
|
|||||
|
Cash, cash equivalents and restricted cash at end of year
|
$
|
713,337
|
|
$
|
549,333
|
|
$
|
308,891
|
|
||
|
Supplementary information
|
|||||||||||
|
Interest paid in cash
|
$
|
25,578
|
|
$
|
21,394
|
|
$
|
23,027
|
|
||
|
Income taxes paid in cash
|
$
|
7,274
|
|
$
|
7,810
|
|
$
|
5,950
|
|
||
|
Non-cash transfer of net investment assets to the related party investment fund (1)
|
$
|
1,571,191
|
|
$
|
—
|
|
$
|
—
|
|
||
|
The accompanying Notes to the Consolidated Financial Statements are
an integral part of the Consolidated Financial Statements.
|
|||||||||||
(1) Effective August 31, 2018, Third Point Re entered into the 2018 LPA to invest in TP Fund, a related party investment fund. See
Note 4
for additional information regarding the non-cash transfer of net investment assets.
F-6
Third Point Reinsurance Ltd.
Notes to the Consolidated Financial Statements
(Expressed in United States Dollars)
1. Organization
Third Point Reinsurance Ltd. (together with its consolidated subsidiaries, “Third Point Re” or the “Company”) was incorporated under the laws of Bermuda on October 6, 2011. Through its reinsurance subsidiaries, the Company is a provider of global specialty property and casualty reinsurance products. The Company operates through two licensed reinsurance subsidiaries, Third Point Reinsurance Company Ltd. (“Third Point Re BDA”), a Bermuda reinsurance company that commenced operations in January 2012, and Third Point Reinsurance (USA) Ltd. (“Third Point Re USA”).
Third Point Re USA is a Bermuda reinsurance company that was incorporated on November 21, 2014 and commenced operations in February 2015. Third Point Re USA made an election under Section 953(d) of the U.S. Internal Revenue Code of 1986, as amended, to be taxed as a U.S. entity. Third Point Re USA prices and underwrites U.S. domiciled reinsurance business from an office in the United States. Third Point Re USA is a wholly owned subsidiary of Third Point Re (USA) Holdings, Inc. (“TPRUSA”), an intermediate holding company based in the U.S., which is a wholly owned subsidiary of Third Point Re (UK) Holdings Ltd. (“Third Point Re UK”), an intermediate holding company based in the United Kingdom. Third Point Re UK is a wholly owned subsidiary of Third Point Re.
In August 2012, the Company established a wholly-owned subsidiary in the United Kingdom, Third Point Re Marketing (UK) Limited (“TPRUK”). In May 2013, TPRUK was licensed as an insurance intermediary by the UK Financial Conduct Authority.
These consolidated financial statements include the results of the Company and have been prepared in accordance with accounting principles generally accepted in the United States of America (“U.S. GAAP”). All intercompany accounts and transactions have been eliminated.
Tabular amounts are in U.S. Dollars in thousands, except share amounts, unless otherwise noted.
2. Significant accounting policies
The following is a summary of the significant accounting and reporting policies adopted by the Company:
Use of estimates
The preparation of consolidated financial statements in conformity with U.S. GAAP requires management to make estimates and assumptions that affect the reported and disclosed amounts of assets and liabilities and the disclosure of contingent assets and liabilities at the date of the consolidated financial statements and the reported amounts of revenues and expenses during the reporting period. Actual results could differ from those estimates. The major estimates reflected in the Company’s consolidated financial statements include, but are not limited to, the loss and loss adjustment expense reserves, estimates of written and earned premiums and fair value of financial instruments.
Cash, cash equivalents and restricted cash
Cash and cash equivalents consist of cash held in banks and other short-term, highly liquid investments with original maturity dates of ninety days or less.
Restricted cash and cash equivalents consist of cash held in trust accounts securing obligations under certain reinsurance contracts and cash held with brokers and in trust accounts securing letters of credit issued under credit facilities.
Premium revenue recognition
To the extent that the amount of written premium is estimable, the Company estimates the ultimate premiums for the entire contract period and records this estimate at the inception of the contract. For contracts where the full written premium is not estimable at inception, the Company records written premium for the portion of the contract period for
F-7
which the amount is estimable. These estimates are based primarily on information in the underlying contracts as well as information provided by clients and/or brokers.
Changes in premium estimates are expected and may result in adjustments in any reporting period. These estimates change over time as additional information regarding the underlying business volume is obtained. Any subsequent adjustments arising on such estimates are recorded in the period in which they are determined.
Premiums written are earned over the exposure period in proportion to the period of risk covered. Unearned premiums represent the portion of premiums written that relate to the remaining term of the underlying policies in force.
Premiums for retroactive exposures in reinsurance contracts are earned at the inception of the contract, as all of the underlying loss events covered by these exposures occurred in the past. If the estimated loss and loss adjustment expense reserve differs from the premium received at inception of a retroactive reinsurance contract, the resulting difference is deferred and recognized over the estimated claim payment period of the related contract with the periodic amortization reflected in earnings as a component of loss and loss adjustment expenses incurred.
Reinsurance premiums ceded
From time to time, the Company reduces the risk of losses on business written by reinsuring certain risks and exposures with other reinsurers. The Company remains liable to the extent that any retrocessionaire fails to meet its obligations and to the extent that the Company does not hold sufficient security for their unpaid obligations. Ceded premiums are written during the period in which the risks incept and are earned over the contract period in proportion to the period of risk covered. Unearned premiums ceded consist of the unexpired portion of reinsurance ceded.
Reinsurance
Reinsurance recoverables include claims we paid and estimates of unpaid losses and loss adjustment expenses that are subject to reimbursement under reinsurance and retrocessional contracts. The method for determining reinsurance recoverables for unpaid losses and loss adjustment expenses involves reviewing actuarial estimates of gross unpaid losses and loss adjustment expenses to determine our ability to cede unpaid losses and loss adjustment expenses under our existing reinsurance contracts. This method is continually reviewed and updated and any resulting adjustments are reflected in earnings in the period identified. Reinsurance premiums, commissions and expense reimbursements are accounted for on a basis consistent with those used in accounting for the original policies issued and the term of the reinsurance contracts. Amounts recoverable from reinsurers for losses and loss adjustment expenses for which the Company has not been relieved of its legal obligations to the policyholder are reported as assets.
Deferred acquisition costs
Acquisition costs consist of commissions, brokerage and excise taxes that are related directly to the successful acquisition of new or renewal reinsurance contracts. These costs are deferred and amortized over the period in which the related premiums are earned. The Company evaluates the recoverability of deferred acquisition costs by determining if the sum of future earned premiums and anticipated investment income is greater than expected future loss and loss adjustment expenses and acquisition costs. If a loss is probable on the unexpired portion of contracts in force, a premium deficiency loss is recognized. As of
December 31, 2018
, deferred acquisition costs are considered to be fully recoverable and
no
premium deficiency has been recorded.
Acquisition costs also include profit commissions that are expensed when incurred. Profit commissions are calculated and accrued based on the expected loss experience for contracts and recorded when the current loss estimate indicates that a profit commission is probable under the contract terms.
Loss and loss adjustment expense reserves
The Company’s loss and loss adjustment expense reserves include case reserves, reserves for losses incurred but not yet reported (“IBNR reserves”) and deferred gains on retroactive reinsurance contracts. Case reserves are established for losses that have been reported, but not yet paid. IBNR reserves represent the estimated loss and loss adjustment expenses that have been incurred by insureds and reinsureds but not yet reported to the insurer or reinsurer, including unknown future development on loss and loss adjustment expenses that are known to the insurer or reinsurer. IBNR
F-8
reserves are established by management based on actuarially determined estimates of ultimate loss and loss adjustment expenses. Deferred gains represent the underwriting profit related to retroactive exposures in reinsurance contracts at inception and are deferred and amortized over the estimated future settlement period of the contract. Deferred gains are included in loss and loss adjustment expense reserves. If the premium received is lower than the estimated loss and loss adjustment expense reserves assumed at inception of a retroactive reinsurance contract, the resulting difference is deferred and recorded in other assets. This difference is also amortized over the estimated future settlement period of the contract.
Inherent in the estimate of ultimate loss and loss adjustment expenses are expected trends in claim severity and frequency and other factors that may vary significantly as claims are settled. Accordingly, ultimate loss and loss adjustment expenses may differ materially from the amounts recorded in the consolidated financial statements. These estimates are reviewed regularly and, as experience develops and new information becomes known, the reserves are adjusted as necessary. Such adjustments, if any, are recorded in the
consolidated statements of income (loss)
in the period in which they become known.
Deposit liabilities
Certain contracts do not transfer sufficient insurance risk to be deemed reinsurance contracts and are accounted for using the deposit method of accounting. Management exercises judgment in determining whether contracts transfer sufficient risk to be accounted for as reinsurance contracts. Using the deposit method of accounting, a deposit liability, rather than written premium, is initially recorded based upon the consideration received less any explicitly identified premiums or fees. In subsequent periods, the deposit liability is adjusted by calculating the effective yield on the deposit to reflect actual payments to date and future expected payments. In some cases, the effective yield on the contract may be negative, which will result in the recognition of other income.
Fair value measurement
The Company determines the fair value of financial instruments in accordance with current accounting guidance, which defines fair value and establishes a three level fair value hierarchy based upon the transparency of inputs used in the valuation of an asset or liability. Fair value is defined as the price that the Company would receive to sell an asset or would pay to transfer a liability in an orderly transaction between market participants at the measurement date. The Company determines the estimated fair value of each individual security utilizing the highest level inputs available.
The fair value of the Company’s assets and liabilities, which qualify as financial instruments, approximates the carrying amounts presented in the consolidated balance sheets.
U.S. GAAP disclosure requirements establish a framework for measuring fair value, including a three-level hierarchy for fair value measurements based upon the transparency of inputs to the valuation of an asset or liability. The three-level hierarchy of inputs is summarized below:
|
•
|
Level 1 – Quoted prices available in active markets/exchanges for identical investments as of the reporting date.
|
|
•
|
Level 2 – Observable inputs to the valuation methodology other than unadjusted quoted market prices for identical assets or liabilities in active markets. Level 2 inputs include, but are not limited to, prices quoted for similar assets or liabilities in active markets/exchanges, prices quoted for identical or similar assets or liabilities in markets that are not active and fair values determined through the use of models or other valuation methodologies.
|
|
•
|
Level 3 – Pricing inputs unobservable for the investment and include activities where there is little, if any, market activity for the investment. The inputs applied in the determination of fair value require significant management judgment and estimation.
|
Inputs refer broadly to the assumptions that market participants would use in pricing the asset or liability, including assumptions about risk. For example, the risk inherent in a particular valuation technique used to measure fair value including such a pricing model and/or the risk inherent in the inputs to the valuation technique. Inputs may be observable or unobservable.
F-9
Observable inputs are inputs that reflect the assumptions market participants would use in pricing the asset or liability based on market data obtained from sources other than those of the reporting entity. Unobservable inputs are inputs that reflect the reporting entity’s own assumptions about the assumptions market participants would use in pricing the asset or liability developed based on the best information available in the circumstances.
In certain cases, the inputs used to measure fair value may fall into different levels of the fair value hierarchy. In such cases, an investment’s level within the fair value hierarchy is based on the lowest level of input that is significant to the fair value measurement. The Company’s assessment of the significance of a particular input to the fair value measurement requires judgment, and considers factors specific to the investment.
Investments
Investments - Trading
The Company’s investments are classified as “trading securities” and are carried at fair value with changes in fair value included in earnings in the
consolidated statements of income (loss)
.
The fair value of the Company’s investments are based on quoted market prices, or when such prices are not available, by reference to broker or underwriter bid indications, industry recognized pricing vendors, and/or internal pricing valuation techniques. Investment transactions are recorded on a trade date basis with balances pending settlement included in due to/from brokers in the consolidated balance sheets.
Realized gains and losses are determined using cost calculated on a specific identification basis. Dividends are recorded on the ex-dividend date. Income and expenses are recorded on the accrual basis including interest and premiums amortized and discounts accreted.
Investment in related party investment fund
The Company invests in TP Fund, a related party investment fund. The Company’s investment in TP Fund is stated at its fair value, that generally represents the Company’s proportionate interest in TP Fund as reported by the fund based on the net asset value (“NAV”) provided by the fund administrator. Increases or decreases in such fair value are recorded within net investment income from investment in related party investment fund in the Company’s consolidated statements of income. Realized gains or losses upon any redemptions of investments in TP Fund are calculated using the weighted average method. The Company records contributions and withdrawals related to its investments in TP Fund on the transaction date.
Derivatives
Investments
Derivative instruments within our investment assets managed by our investment manager, Third Point LLC, are recorded in the consolidated balance sheets at fair value, with changes in fair values and realized gains and losses recognized in
net investment income (loss)
in the
consolidated statements of income (loss)
.
Derivatives serve as a key component of the Company’s investment strategy and are utilized primarily to structure the portfolio, or individual investments, and to economically match the investment objectives of the Company.
The Company’s derivatives do not qualify as hedges for financial reporting purposes and are recorded in the consolidated balance sheets on a gross basis and not offset against any collateral pledged or received. Pursuant to the International Swaps and Derivatives Association (“ISDA”) master agreements, securities lending agreements and other derivatives agreements, the Company and its counterparties typically have the ability to net certain payments owed to each other in specified circumstances. In addition, in the event a party to one of the ISDA master agreements, securities lending agreements or other derivatives agreements defaults, or a transaction is otherwise subject to termination, the non-defaulting party generally has the right to set off against payments owed to the defaulting party or collateral held by the non defaulting party.
The Company enters into derivative contracts to manage credit risk, interest rate risk, currency exchange risk and other exposure risks. The Company uses derivatives in connection with its risk-management activities to economically hedge
F-10
certain risks and to gain exposure to certain investments. The utilization of derivative contracts also allows for an efficient means by which to trade certain asset classes.
Fair values of derivatives are determined by using quoted market prices, industry recognized pricing vendors and counterparty quotes when available; otherwise fair values are based on pricing models that consider the time value of money, volatility and the current market and contractual prices of underlying financial instruments.
Embedded derivatives
Certain of the Company’s reinsurance contracts contain interest crediting features that vary based on the net investment return on investments managed by Third Point LLC. These contractual features are considered embedded derivatives in accordance with U.S. GAAP. We include the estimated fair value of these embedded derivatives in the consolidated balance sheets with the host contract in order to reflect the expected settlement of these features with the host contract. The change in estimated fair value of these embedded derivatives are recorded in other expenses in the consolidated statements of income (loss).
Share-based compensation
The Company accounts for its share-based compensation transactions using the fair value of the award at the grant date and accounts for forfeitures when they occur. Determining the fair value of share purchase options at the grant date requires estimation and judgment. The Company uses an option-pricing model (Black-Scholes) to calculate the fair value of share purchase options.
For share purchase options or restricted share awards granted that contain both a service and performance condition, the Company recognizes share compensation expense only for the portion of the options or restricted share awards that are considered probable of vesting. Share compensation for share purchase options or restricted share awards considered probable of vesting are expensed over the service (vesting) period on a graded vesting basis. The probability of share purchase options or restricted share awards vesting is evaluated at each reporting period. When the share purchase options or restricted share awards are considered probable of vesting, the Company records a true up of share compensation expense from the grant date (service inception date) to the current reporting period end based on the fair value of the options or restricted share awards at the grant date.
The Company measures grant date fair value for restricted share awards, with a service condition only, based on the price of its common shares at the grant date and the expense is recognized on a straight-line basis over the vesting period.
Warrants
The Company accounts for warrant contracts issued to certain of its founding investors (“Founders”) in conjunction with the initial capitalization of the Company by using either the physical settlement or net-share settlement methods. The fair value of these warrants was recorded in equity as additional paid-in capital. The fair value of warrants issued are estimated on the grant date using the Black-Scholes option-pricing model.
The Company accounts for certain warrant contracts issued to an advisor, where services have been received by the Company, in part, in exchange for equity instruments, based on the fair value of such services. The associated cost of these warrants has been recorded as capital raise costs and is included in additional paid in capital in the consolidated statements of shareholders’ equity.
Debt offering costs
Costs incurred in issuing debt, which includes underwriters’ fees, legal and accounting fees, printing and other fees are capitalized and presented as a direct deduction from the principal amount of senior notes payable in the consolidated balance sheets. These costs are amortized over the term of the debt and are included in interest expense in the
consolidated statements of income (loss)
.
F-11
Other expenses
Other expenses are comprised of expenses relating to interest crediting features in certain reinsurance and deposit contracts as well as changes in value of embedded derivatives in reinsurance contracts and deposit liability contracts that have variable interest crediting features. Variable and fixed interest crediting features are calculated on funds transferred to the Company where interest is credited based on actual cash received into a notional experience account. The ceding company can typically elect to commute at specific points in time in exchange for the amounts held in the notional experience account. For those contracts that contain variable interest crediting features, actual investment returns realized by the Company are included in the calculation, which can increase the overall effective interest crediting rate on those contracts. Variable interest credit features are accounted for as embedded derivatives. Fixed interest credits on reinsurance contracts and deposit liability contracts and changes in value of embedded derivative are included other expenses in the
consolidated statements of income (loss)
.
Foreign currency transactions
The Company’s functional currency is the U.S. dollar. Transactions involving monetary assets and liabilities denominated in foreign currencies have been converted into U.S. dollars at the exchange rate in effect on the balance sheet date, and the related revenues and expenses are converted using specific rates for the period, as appropriate. Net foreign currency transaction gains and losses arising from these activities are reported in the
consolidated statements of income (loss)
in the period in which they arise.
Prior to the change in the investment account structure, certain of the Company's investments were denominated in foreign currencies and thus, were subject to the risk associated with foreign currency fluctuations. These investments were translated into U.S. dollar amounts at the date of valuation. Purchases and sales of investments and income and expenses denominated in foreign currencies were translated in U.S. dollar amounts on the respective dates of such transactions. The Company did not isolate the portion of the
net investment income (loss)
resulting from changes in foreign exchange rates on investments, dividends and interest from the fluctuations arising from changes in fair values of securities and derivatives held within the total net investments managed by Third Point LLC. Periodic payments received or paid on swap agreements were recorded as realized gain or loss on investment transactions. Such fluctuations are included within
net investment income (loss)
in the
consolidated statements of income (loss)
.
Income taxes, withholding taxes and uncertain tax positions
The Company provides for income taxes for its operations in income tax paying jurisdictions. The Company’s provision relies on estimates and interpretations of currently enacted tax laws. The Company recognizes deferred tax assets and liabilities based on the temporary differences between the financial statement carrying amounts and the tax bases of assets and liabilities. Such temporary differences are primarily due to tax basis discounts on loss and loss adjustment expense reserves and unearned premiums, deferred acquisition costs and unrealized gains (losses) on investments. A valuation allowance against deferred tax assets is recorded if it is more likely than not that all, or some portion, of the benefits related to deferred tax assets will not be realized. Any adjustments to deferred income taxes are accounted for as changes in estimates and are reflected in the
consolidated statements of income (loss)
in the year in which they are made. Adjustments could be material and could significantly impact earnings in the year they are recorded.
The Company is subject to withholding tax obligations related to dividends, capital gains and interest on certain investments. These withholding taxes are recorded when they become payable and are included in income tax expense (benefit) in the Company’s
consolidated statements of income (loss)
.
The Company recognized uncertain tax positions related to certain investment transactions in foreign jurisdictions. The Company records its uncertain tax positions based on an estimate of the potential liability, including potential interests and penalties, arising from its investment transactions conducted in foreign countries. The changes in the Company’s uncertain tax position is included in income tax expense (benefit) in the Company’s
consolidated statements of income (loss)
.
F-12
Variable interest entities
The Company accounts for variable interest entities (“VIEs”) in accordance with FASB ASC Topic 810 Consolidation, which requires the consolidation of all VIEs by the primary beneficiary, that being the investor that has the power to direct the activities of the VIE and that will absorb a portion of the VIE’s expected losses or residual returns that could potentially be significant to the VIE. For VIEs the Company determines it has a variable interest in, it determines whether it is the primary beneficiary of a VIE by performing an analysis that principally considers: (i) the VIE’s purpose and design, including the risks the VIE was designed to create and pass through to its variable interest holders; (ii) the VIE’s capital structure; (iii) the terms between the VIE and its variable interest holders and other parties involved with the VIE; (iv) which variable interest holders have the power to direct the activities of the VIE that most significantly impact the VIE’s economic performance; (v) which variable interest holders have the obligation to absorb losses or the right to receive benefits from the VIE that could potentially be significant to the VIE; and (vi) related party relationships. The Company reassesses its initial determination of whether the Company is the primary beneficiary of a VIE upon changes in facts and circumstances that could potentially alter the Company’s assessment.
Noncontrolling interests in related party
The Company consolidates the results of entities in which it has a controlling financial interest. Redeemable noncontrolling interests with redemption features that are not solely within the Company’s control are presented as a mezzanine item, between liabilities and shareholders’ equity, in the Company’s consolidated balance sheets and non-redeemable noncontrolling interests are presented as a separate line within shareholders’ equity in the consolidated balance sheets. The Company records the portion of net (income) loss attributable to noncontrolling interests in related party as a separate line within the
consolidated statements of income (loss)
.
Earnings (loss) per share
Basic earnings (loss) per share is based on the weighted average number of common shares and participating securities outstanding during the period. The weighted average number of common shares excludes any dilutive effect of outstanding warrants, options and unvested restricted shares. Diluted earnings (loss) per share is based on the weighted average number of common shares and participating securities outstanding and includes any dilutive effects of warrants, options and unvested restricted shares under share plans and are determined using the treasury stock method. U.S. GAAP requires that unvested share awards that contain non-forfeitable rights to dividends or dividend equivalents, whether paid or unpaid (referred to as “participating securities”), be treated in the same manner as outstanding shares for earnings per share calculations. The Company treats certain of its unvested restricted shares as participating securities. In the event of a net loss, all participating securities, outstanding warrants, options and restricted shares are excluded from both basic and diluted loss per share since their inclusion would be anti-dilutive.
Leases
Leases in which substantially all of the risks and rewards of ownership are retained by the lessor are classified as operating leases. Payments made under operating leases (net of any incentives received from the lessor) are recognized in the
consolidated statements of income (loss)
on a straight-line basis over the term of the lease.
Comprehensive income
The Company has no comprehensive income other than net income disclosed in the
consolidated statements of income (loss)
.
Segment information
Under U.S. GAAP, operating segments are based on the internal information that management uses for allocating resources and assessing performance of the Company. The Company manages its business on the basis of
one
operating segment: Property and Casualty Reinsurance. Non-underwriting income and expenses, presented as a reconciliation to our consolidated results, include: net investment income, certain general and administrative expenses related to corporate activities, interest expense,
foreign exchange (gains) losses
and
income tax (expense) benefit
.
F-13
Treasury shares
Common shares repurchased by the Company and not canceled are classified as treasury shares. Treasury shares are recorded at cost, which results in a reduction of shareholders’ equity in the consolidated balance sheets. When shares are reissued from treasury, the Company uses the average cost method to determine the cost of the reissued shares. Gains on sales of treasury shares are credited to additional paid-in capital, while losses are charged to additional paid-in capital to the extent that previous net gains from sales of treasury shares are included therein; otherwise, losses are charged to retained earnings.
Transfer of Financial Assets
The Company accounts for transfers of financial assets as sales when it has surrendered control over the related assets. Whether control has been relinquished requires, among other things, an evaluation of relevant legal considerations and an assessment of the nature and extent of the Company’s continuing involvement with the assets transferred. Gains and losses stemming from transfers reported as sales, if any, would be included as realized gains (losses) within net investment income in the accompanying consolidated statements of income.
In instances where a transfer of financial assets does not qualify for sale accounting, the accounting guidance requires that the transaction be accounted for as a collateralized borrowing. Accordingly, the related assets remain on the Company’s consolidated balance sheets and continue to be reported and accounted for as if the transfer had not occurred. Cash proceeds from these transfers are reported as liabilities, with attributable interest expense recognized over the life of the related transactions.
Prior year changes in the presentation of consolidated financial statements
The Company had previously included unearned premium ceded and loss and loss adjustment expenses recoverable in other assets in the consolidated balance sheets and changes in these balances in the consolidated statements of cash flows. These balances have grown and are now disclosed as separate line items in the consolidated balance sheets and changes in these balances in the consolidated statements of cash flows.
Recent accounting pronouncements
Adoption of New Accounting Standards
In May 2014, the FASB issued Accounting Standards Update 2014-09,
Revenue from Contracts with Customers
(ASU 2014-09). ASU 2014-09 provides a framework, through a five-step process, for recognizing revenue from customers, improves comparability and consistency of recognizing revenue across entities, industries, jurisdictions and capital markets, and requires enhanced disclosures. Certain contracts with customers are specifically excluded from the scope of ASU 2014-09, including amongst others, insurance contracts accounted for under Accounting Standard Codification 944,
Financial Services - Insurance
. ASU 2014-09 is effective for public business entities for fiscal years beginning after December 15, 2017, and interim periods within those fiscal years, with retrospective adoption required for the comparative periods. Insurance contracts are specifically excluded from ASU 2014-09 and we do not currently have any other revenue generating activities for which this standard would be applicable. As a result, this new pronouncement did not have a material impact on the Company’s consolidated financial statements.
In January 2016, the Financial Accounting Standards Board (“FASB”) issued Accounting Standards Update 2016-01,
Financial Instruments – Overall (Subtopic 825-10): Recognition and Measurement of Financial Assets and Financial Liabilities
(ASU 2016-01). ASU 2016-01 is intended to provide users of financial statements with more useful information on the recognition, measurement, presentation and disclosure of financial instruments. The new standard affects all entities that hold financial assets or owe financial liabilities. ASU 2016-01 is effective for public business entities for fiscal years beginning after December 15, 2017, and interim periods within those fiscal years. This new accounting standard did not have a material impact on the Company’s consolidated financial statements since all of the Company’s investments are measured at fair market value as the Company's investments are classified as “trading securities” and therefore the change in unrealized gains (losses) are included in the consolidated statement of income (loss).
F-14
In August 2016, the FASB issued Accounting Standards Update 2016-15,
Statement of Cash Flows (Topic 230): Classification of Certain Cash Receipts and Cash Payments
(ASU 2016-15). ASU 2016-15 is intended to reduce diversity in practice and addresses eight specific issues in how certain cash receipts and cash payments are presented and classified in the statement of cash flows. ASU 2016-15 is effective for fiscal years beginning after December 15, 2017, and interim periods within those fiscal years. To date, the Company has not entered into any of the eight types of transactions addressed in ASU 2016-15. As a result, the adoption of this standard did not have a material impact on the Company’s consolidated financial statements.
In November 2016, the FASB issued Accounting Standards Update 2016-18,
Statement of Cash Flows (Topic 230): Restricted Cash
(ASU 2016-18). ASU 2016-18 clarifies guidance on the classification and presentation of restricted cash in the statement of cash flows. Specifically, the Company should include in its cash and cash-equivalent balances in the statement of cash flows those amounts that are deemed to be restricted cash and cash equivalents. An entity with a material balance of amounts generally described as restricted cash and cash equivalents must disclose information about the nature of the restrictions. ASU 2016-18 is effective for fiscal years beginning after December 15, 2017, and interim periods therein. As a result of the adoption of ASU 2016-18, the Company retrospectively classified its restricted cash and cash equivalents within the consolidated statement of cash flows and has included additional disclosures in accordance with ASU 2016-18 in its consolidated financial statements. Prior to adoption, changes in restricted cash had been presented within cash flow from investing activities. Consequently, the consolidated statement of cash flows for the years ended December 31, 2017 and 2016 include adjustments to increase (decrease) net cash provided by investing activities by
$242.2 million
and
$(32.0) million
, respectively.
In May 2017, the FASB issued Accounting Standards Update 2017-09,
Compensation — Stock Compensation (Topic 718): Scope of Modification Accounting
(ASU 2017-09). ASU 2017-09 is intended to reduce diversity in practice and subsequent to its adoption, an entity will not apply modification accounting as a result of changes to terms and conditions of a share-based payment award if certain conditions are met. The amendments in ASU 2017-09 are effective for all entities for annual periods, and interim periods within those annual periods, beginning after December 15, 2017. This new accounting standard did not have a material impact on the Company’s consolidated financial statements.
Recently Issued Accounting Standards Not Yet Adopted
In February 2016, the FASB issued Accounting Standards Update 2016-02,
Leases (Topic 842): Section A - Leases, Section B - Conforming Amendments Related to Leases and Section C - Background Information and Basis for Conclusions
(ASU 2016-02). ASU 2016-02 intends to improve financial reporting related to leasing transactions. The new standard affects all entities that lease assets such as real estate, airplanes and manufacturing equipment. ASU 2016-02 will require entities that lease assets, referred to as “lessees”, to recognize on the balance sheet the assets and liabilities for the rights and obligations created by those leases. ASU 2016-02 is effective for public business entities for fiscal years beginning after December 15, 2018, and interim periods within those fiscal years. The Company has evaluated the impact of this guidance; it is not expected to have a material impact on the Company’s consolidated financial statements as a result of the limited number of leases the Company currently has in place.
In July 2018, the FASB issued Accounting Standards Update 2018-10,
Codification Improvements to Topic 842, Leases
(ASU 2018-10) and Accounting Standards Update 2018-11,
Leases (Topic 842): Targeted improvements
(ASU 2018-11). These updates make improvements to clarify or to correct unintended application of guidance in ASC 842. Those items generally are not expected to have a significant effect on the Company. ASU 2018-10 and ASU 2018-11 will be effective when the Company adopts ASU 2016-02 in 2019.
In June 2016, the FASB issued Accounting Standards Update 2016-13,
Financial Instruments - Credit Losses (Topic 326): Measurement of Credit Losses on Financial Instruments
(ASU 2016-13). ASU 2016-13 amends the guidance on the impairment of financial instruments. Under the new guidance, an entity recognizes as an allowance its estimate of expected credit losses, which the FASB believes will result in more timely recognition of such losses. ASU 2016-13 is effective for fiscal years beginning after December 15, 2019, and interim periods within those fiscal years. The Company is currently evaluating the impact of this guidance on the Company’s consolidated financial statements.
In August 2018, the FASB issued Accounting Standards Update 2018-13,
Fair Value Measurement (Topic 820): Disclosure Framework - Changes to the Disclosure Requirements for Fair Value Measurement
(ASU 2018-13). ASU 2018-13 is intended to improve the effectiveness of fair value measurement disclosure requirements. The amendments
F-15
are effective for interim and annual periods beginning after December 15, 2019. The Company is currently evaluating the impact of this guidance on the Company’s consolidated financial statements.
In October 2018, the FASB issued Accounting Standards Update 2018-17,
Consolidation (Topic 810): Targeted Improvements to Related Party Guidance for Variable Interest Entities
(ASU 2018-17). The amendments in ASU 2018-17 for determining whether a decision-making fee is a variable interest require reporting entities to consider indirect interests held through related parties under common control on a proportional basis rather than as the equivalent of a direct interest in its entirety. ASU 2018-17 is effective for public business entities for fiscal years beginning after December 15, 2019, and interim periods within those fiscal years. This new pronouncement is not expected to have a material impact on the Company’s consolidated financial statements.
3. Cash, cash equivalents, restricted cash and restricted investments
The following table provides a summary of cash and cash equivalents, restricted cash and restricted investments as of
December 31, 2018
and
2017
:
|
2018
|
2017
|
||||||
|
Cash and cash equivalents
|
$
|
104,183
|
|
$
|
8,197
|
|
|
|
Restricted cash securing letter of credit facilities (1)
|
203,953
|
|
250,487
|
|
|||
|
Restricted cash securing reinsurance contracts (2)
|
405,201
|
|
290,649
|
|
|||
|
Total cash, cash equivalents and restricted cash (3)
|
713,337
|
|
549,333
|
|
|||
|
Restricted investments securing reinsurance contracts (2)
|
239,640
|
|
326,429
|
|
|||
|
Total cash, cash equivalents, restricted cash and restricted investments
|
$
|
952,977
|
|
$
|
875,762
|
|
|
|
(1)
|
Restricted cash securing letter of credit facilities primarily pertains to letters of credit issued to clients and cash securing these obligations that the Company will not be released from until the underlying reserves have been settled. The time period for which the Company expects these letters of credit to be in place varies from contract to contract, but can last several years.
|
|
(2)
|
Restricted cash and restricted investments securing other reinsurance contracts pertain to trust accounts securing the Company’s contractual obligations under certain reinsurance contracts that the Company will not be released from until all underlying risks have expired or have been settled. Restricted investments include certain investments in debt securities including U.S. Treasury securities and sovereign debt. The time period for which the Company expects these trust accounts to be in place varies from contract to contract, but can last several years.
|
|
(3)
|
Cash, cash equivalents and restricted cash as reported in the Company’s consolidated statements of cash flows.
|
4. Investments
On July 31, 2018, Third Point Re, Third Point Re BDA and Third Point Re USA (the “TPRE Limited Partners”) entered into the Amended and Restated Exempted Limited Partnership Agreement (the “2018 LPA”) of TP Fund with Third Point Advisors LLC (“TP GP”) and others, effective August 31, 2018. In accordance with the 2018 LPA, TP GP serves as the general partner of TP Fund. TP GP is beneficially owned by Daniel S. Loeb, a founder of the Company, and certain members of his family. Pursuant to the investment management agreement between Third Point LLC and TP Fund, dated July 31, 2018 (the “TP Fund IMA”), Third Point LLC is the investment manager for TP Fund (the “Investment Manager”). In addition, on July 31, 2018, the TPRE Limited Partners, and TP Fund executed a Subscription Agreement pursuant to which the TPRE Limited Partners transferred certain net investment assets and related liabilities (collectively referred to as the “LP Transaction”) from their separate accounts to TP Fund, and TP Fund issued limited partner interests to the TPRE Limited Partners proportionate to and based on the net asset value transferred by each such entity on the applicable transfer date. Certain collateral assets consisting of debt securities and restricted cash were not transferred to TP Fund but are also managed by Third Point LLC under the Collateral Assets IMA, as defined below. Substantially all of the net investment assets were transferred as of September 4, 2018. The
JV Agreements
will be terminated on the date that all net investment assets have been transferred to TP Fund under the Subscription Agreement. The TP Fund investment strategy, as implemented by Third Point LLC, is intended to achieve superior risk-adjusted returns by deploying capital in both long and short investments with favorable risk/reward characteristics across select asset classes, sectors and geographies. Third Point LLC identifies investment opportunities via a bottom-up, value-oriented approach to single security analysis supplemented by a top-down view of portfolio and risk management. Third Point LLC seeks dislocations in certain areas of the capital markets or in the pricing of particular securities and supplem
F-16
ents single security analysis with an approach to portfolio construction that includes sizing each investment based on upside/downside calculations, all with a view towards appropriately positioning and managing overall exposures.
On July 31, 2018, Third Point Re BDA and Third Point Re USA entered into an investment management agreement with Third Point LLC (the “Collateral Assets IMA”), effective August 31, 2018, pursuant to which Third Point LLC serves as investment manager of certain collateral assets that will not be transferred to TP Fund (the “Collateral Assets”). The Collateral Assets IMA will continue in effect for so long as either Third Point Re BDA or Third Point Re USA remains a limited partner of TP Fund. The Collateral Assets are presented in the consolidated balance sheets within debt securities and restricted cash and are considered as part of total net investments managed by Third Point LLC.
On August 30, 2018, Third Point Re BDA and Third Point Re USA entered into a Participation Agreement with TP Fund (“the Participation Agreement”) pursuant to which Third Point Re BDA and Third Point Re USA granted to TP Fund all of the rights, benefits, liabilities, duties and obligations of all net investment assets that had not yet been transferred to TP Fund pursuant to the Subscription Agreement as of the effective date. For the net investment assets that were not transferred on September 4, 2018, the TPRE Limited Partners received limited partnership interests in TP Fund in exchange for transferring the rights, benefits, liabilities, duties and obligations for those net investment assets to TP Fund under the Participation Agreement. Third Point Re BDA and Third Point Re USA are obligated to transfer any remaining net investment assets to TP Fund and a liability corresponding to the estimated fair value of net investment assets not transferred at September 30, 2018 has been recorded in the Company’s consolidated balance sheet. For the period from September 4, 2018 to December 31, 2018,
$2.8 million
of net investment loss in the Company’s separate accounts was subject to the Participation Agreement and as a result, is included in net investment loss from investment in related party investment fund in the Company’s consolidated statements of income. As of December 31, 2018, the Company had
$2.3 million
of net investment assets that it had agreed to transfer pursuant to the Subscription Agreement but that had not been transferred to TP Fund, primarily consisting of cash and balances due from brokers.
Prior to transferring the financial assets and liabilities from the joint ventures to the TP Fund, the Company directly owned the investments held in its separate accounts that were managed by Third Point LLC. In addition, the joint ventures created through the JV Agreements were consolidated and the Company presented all of the underlying assets and liabilities held in the Company’s name on the Company’s consolidated balance sheets and relevant footnote disclosures.
As a result of the changes described above, the Company’s investment in TP Fund has been presented on the consolidated balance sheets as an investment in a related party investment fund. The transfer of the net investment assets was accounted for as a sale in accordance with the Company’s accounting policy for transfers of financial assets. Third Point Re BDA and Third Point Re USA received limited partnership interests in TP Fund corresponding to the fair value of the net investment assets transferred. The Company does not have continuing involvement with the transferred assets. There were no net gains or losses resulting from the transfer of net investment assets. For the year ended December 31, 2018,
$1.6 billion
of net investment assets was transferred from the Company’s separate investment accounts to TP Fund in exchange for limited partnership interests of the same amount, resulting in no gains or losses.
F-17
The following is a summary of the net investments managed by Third Point LLC as of
December 31, 2018
and
2017
:
|
2018
|
2017
|
||||||
|
Assets
|
|||||||
|
Total investments in securities, including investment in related party investment fund
|
$
|
1,523,644
|
|
$
|
2,995,097
|
|
|
|
Cash and cash equivalents
|
1,017
|
|
8
|
|
|||
|
Restricted cash and cash equivalents
|
609,154
|
|
541,136
|
|
|||
|
Due from brokers
|
1,411
|
|
305,093
|
|
|||
|
Derivative assets, at fair value
|
—
|
|
73,372
|
|
|||
|
Interest and dividends receivable
|
1,316
|
|
3,774
|
|
|||
|
Total assets
|
2,136,542
|
|
3,918,480
|
|
|||
|
Liabilities and noncontrolling interests in related party
|
|||||||
|
Accounts payable and accrued expenses
|
114
|
|
5,137
|
|
|||
|
Securities sold, not yet purchased
|
—
|
|
394,278
|
|
|||
|
Securities sold under an agreement to repurchase
|
—
|
|
29,618
|
|
|||
|
Due to brokers
|
—
|
|
770,205
|
|
|||
|
Derivative liabilities, at fair value
|
—
|
|
14,503
|
|
|||
|
Participation agreement with related party investment fund
|
2,297
|
|
—
|
|
|||
|
Interest and dividends payable
|
—
|
|
1,218
|
|
|||
|
Total noncontrolling interests in related party
(1)
|
—
|
|
113,626
|
|
|||
|
Total liabilities and noncontrolling interests in related party
|
2,411
|
|
1,328,585
|
|
|||
|
Total net investments managed by Third Point LLC
|
$
|
2,134,131
|
|
$
|
2,589,895
|
|
|
(1) See
Note 19
for additional information.
5. Fair value measurements
The following table presents the Company’s investments, categorized by the level of the fair value hierarchy as of
December 31, 2018
:
|
December 31, 2018
|
|||||||||||||||
|
Quoted prices in active markets
|
Significant other observable inputs
|
Significant unobservable inputs
|
Total
|
||||||||||||
|
(Level 1)
|
(Level 2)
|
(Level 3)
|
|||||||||||||
|
Assets
|
|||||||||||||||
|
U.S. Treasury securities
|
$
|
—
|
|
$
|
197,312
|
|
$
|
—
|
|
$
|
197,312
|
|
|||
|
Sovereign debt
|
—
|
|
42,328
|
|
—
|
|
42,328
|
|
|||||||
|
Total debt securities
|
$
|
—
|
|
$
|
239,640
|
|
$
|
—
|
|
239,640
|
|
||||
|
Investments in funds valued at NAV
|
1,284,088
|
|
|||||||||||||
|
Total assets
|
$
|
1,523,728
|
|
||||||||||||
|
Liabilities
|
|||||||||||||||
|
Derivative liabilities (embedded)
|
$
|
—
|
|
$
|
—
|
|
$
|
22
|
|
$
|
22
|
|
|||
|
Total liabilities
|
$
|
—
|
|
$
|
—
|
|
$
|
22
|
|
$
|
22
|
|
|||
Debt securities
U.S. Treasury securities and sovereign debt securities are primarily priced by obtaining broker dealer quotes and other market information including actual trade volumes, when available. When evaluating these securities, the pricing services gather information from market sources and integrate other observations from markets and sector news. The fair value of each security is individually computed using analytical models which incorporate option adjusted spreads
F-18
and other daily interest rate data. As the significant inputs used to price these securities are observable, the fair values of these investments are classified as Level 2.
Investments in funds valued at NAV
The Company values its investments in limited partnerships, including its investment in related party investment fund, at fair value. The Company has elected the practical expedient for fair value for these investments which is estimated based on the Company’s share of the net asset value (“NAV”) of the limited partnerships, as provided by the independent fund administrator, as the Company believes it represents the most meaningful measurement basis for the investment assets and liabilities. The NAV represents the Company’s proportionate interest in the members’ equity of the limited partnerships. The resulting net gains or net losses are reflected in the
consolidated statements of income (loss)
. These investments are included in investment in funds valued at NAV and excluded from the presentation of investments categorized by the level of the fair value hierarchy.
In order to assess the reasonableness of the NAVs, the Company performs a number of monitoring procedures on a monthly, quarterly and annual basis, to assess the quality of the information provided by the Investment Manager and fund administrator underlying the preparation of the NAV. These procedures include, but are not limited to, regular review and discussion of the fund’s performance with the investment manager. However, the Company often does not have access to financial information relating to the underlying securities held within the TP Fund. Therefore, management is often unable to corroborate the fair values placed on the securities underlying the asset valuations provided by the Investment Manager or fund administrator.
In 2015, the Company made a
$25.0 million
investment in the Kiskadee Diversified Fund Ltd. (the “Kiskadee Fund”), a fund vehicle managed by Hiscox Insurance Company (Bermuda) Limited. The Kiskadee Fund invests in property catastrophe exposures through collateralized reinsurance transactions and other insurance-linked investments. During the year ended
December 31, 2018
, the Company redeemed
$0.7 million
(
2017
-
$26.7 million
). The Company has elected the fair value option for this investment. This investment is included in investment in funds valued at NAV and is excluded from the presentation of investments categorized by level in the fair value hierarchy. The fair value is estimated based on the Company’s share of the NAV in the Kiskadee Fund, as provided by the investment manager, and was
$0.1 million
as of
December 31, 2018
(
December 31, 2017
-
$0.8 million
). The resulting net gains or losses are reflected in the
consolidated statements of income (loss)
.
Embedded derivatives
The Company has derivatives embedded in non-derivative host contracts that are required to be separated from the host contracts and accounted for at fair value with changes in fair value of the embedded derivative reported in other expenses. The Company’s embedded derivatives relate to interest crediting features in certain reinsurance and deposit contracts that vary based on the returns on the Company’s investments managed by Third Point LLC. The Company determines the fair value of the embedded derivatives using models developed by the Company. As the significant inputs used to price embedded derivatives are unobservable, these are classified as level 3.
Prior to the change in the investment account structure described above, the Company held other types of asset classes.
F-19
The following table presents the Company’s investments, categorized by the level of the fair value hierarchy as of
December 31, 2017
:
|
December 31, 2017
|
|||||||||||||||
|
Quoted prices in active markets
|
Significant other observable inputs
|
Significant unobservable inputs
|
Total
|
||||||||||||
|
(Level 1)
|
(Level 2)
|
(Level 3)
|
|||||||||||||
|
Assets
|
|||||||||||||||
|
Equity securities
|
$
|
2,200,379
|
|
$
|
20,751
|
|
$
|
—
|
|
$
|
2,221,130
|
|
|||
|
Private common equity securities
|
—
|
|
—
|
|
4,794
|
|
4,794
|
|
|||||||
|
Private preferred equity securities
|
—
|
|
—
|
|
57,126
|
|
57,126
|
|
|||||||
|
Total equities
|
2,200,379
|
|
20,751
|
|
61,920
|
|
2,283,050
|
|
|||||||
|
Asset-backed securities
|
—
|
|
198,191
|
|
27,308
|
|
225,499
|
|
|||||||
|
Bank debt
|
—
|
|
14,550
|
|
—
|
|
14,550
|
|
|||||||
|
Corporate bonds
|
—
|
|
67,218
|
|
9,868
|
|
77,086
|
|
|||||||
|
U.S. Treasury securities
|
—
|
|
249,994
|
|
—
|
|
249,994
|
|
|||||||
|
Sovereign debt
|
—
|
|
102,569
|
|
—
|
|
102,569
|
|
|||||||
|
Other debt securities
|
—
|
|
4,747
|
|
713
|
|
5,460
|
|
|||||||
|
Total debt securities
|
—
|
|
637,269
|
|
37,889
|
|
675,158
|
|
|||||||
|
Options
|
1,973
|
|
2,978
|
|
—
|
|
4,951
|
|
|||||||
|
Rights and warrants
|
—
|
|
168
|
|
435
|
|
603
|
|
|||||||
|
Real estate
|
—
|
|
—
|
|
6,831
|
|
6,831
|
|
|||||||
|
Trade claims
|
—
|
|
7,496
|
|
—
|
|
7,496
|
|
|||||||
|
Total other investments
|
1,973
|
|
10,642
|
|
7,266
|
|
19,881
|
|
|||||||
|
Derivative assets (free standing)
|
—
|
|
73,372
|
|
—
|
|
73,372
|
|
|||||||
|
|
$
|
2,202,352
|
|
$
|
742,034
|
|
$
|
107,075
|
|
3,051,461
|
|
||||
|
Investments in funds valued at NAV
|
17,850
|
|
|||||||||||||
|
Total assets
|
$
|
3,069,311
|
|
||||||||||||
|
Liabilities
|
|||||||||||||||
|
Equity securities
|
$
|
364,215
|
|
$
|
—
|
|
$
|
—
|
|
$
|
364,215
|
|
|||
|
Corporate bonds
|
—
|
|
21,699
|
|
—
|
|
21,699
|
|
|||||||
|
Options
|
2,668
|
|
5,696
|
|
—
|
|
8,364
|
|
|||||||
|
Total securities sold, not yet purchased
|
366,883
|
|
27,395
|
|
—
|
|
394,278
|
|
|||||||
|
Derivative liabilities (free standing)
|
—
|
|
12,418
|
|
2,085
|
|
14,503
|
|
|||||||
|
Derivative liabilities (embedded)
|
—
|
|
—
|
|
171
|
|
171
|
|
|||||||
|
Total liabilities
|
$
|
366,883
|
|
$
|
39,813
|
|
$
|
2,256
|
|
$
|
408,952
|
|
|||
During the years ended
December 31, 2018
and
2017
, the Company made
$nil
reclassifications of assets or liabilities between Levels 1 and 2.
As the Company’s investment manager under the prior investment structure, Third Point LLC had a formal valuation policy that set forth the pricing methodology for investments to be used in determining the fair value of each security in the Company’s portfolio. The valuation policy was updated and approved at least on an annual basis by Third Point LLC’s valuation committee (the “Committee”). The Committee met monthly and was comprised of officers and employees who were senior business management personnel of Third Point LLC. The Committee’s role was to review and verify the propriety and consistency of the valuation methodology to determine the fair value of investments. The Committee also reviewed any due diligence performed and approved any changes to current or potential external pricing vendors.
F-20
Equity securities
Securities listed on a national securities exchange or quoted on NASDAQ were valued at their last sales price as of the last business day of the period. Listed securities with no reported sales on such date and over-the-counter (“OTC”) securities were valued at their last closing bid price if held long by the Company, and last closing ask price if held short by the Company. As of
December 31, 2017
, securities valued at
$234.4 million
, representing
7.6%
of investments in securities and derivative assets, and
$2.1 million
, representing
0.5%
of securities sold, not yet purchased and derivative liabilities, were valued based on broker quotes.
As of
December 31, 2017
, the Company had
$83.4 million
of investments fair valued by Third Point LLC, representing approximately
2.7%
of total investments in securities and derivative assets. As a result of the inherent uncertainty of valuation for private securities, the estimated fair value may differ materially from the value that would have been used had a ready market existed for these investments.The actual value at which these securities could be sold or settled with a willing buyer or seller may differ from the Company’s estimated fair values depending on a number of factors including, but not limited to, current and future economic conditions, the quantity sold or settled, the presence of an active market and the availability of a willing buyer or seller.
Debt securities
The key inputs for corporate, government and sovereign bond valuation were coupon frequency, coupon rate and underlying bond spreads. The key inputs for asset-backed securities (“ABS”) were yield, probability of default, loss severity and prepayment.
Other investments
Private securities, real estate and related debt investments are those not registered for public sale and were carried at an estimated fair value at the end of the period, as determined by Third Point LLC. Valuation techniques used by Third Point LLC included market approach, last transaction analysis, liquidation analysis and/or using discounted cash flow models where the significant inputs could include but were not limited to additional rounds of equity financing, financial metrics such as revenue multiples or price-earnings ratio, discount rates and other factors. In addition, third party valuation firms may be employed to conduct investment valuations of such private securities and would provide written reports documenting their recommended valuation as of the determination date for the specified investments.
Free standing derivatives
The Company’s free standing derivatives were recorded at fair value, and were included in the consolidated balance sheets in derivative assets and derivative liabilities. Third Point LLC valued exchange-traded derivatives at their last sales price on the exchange where they were primarily traded. OTC derivatives, which include swap, option, swaption, forward, future and contract for differences, were valued by an industry recognized third party valuation vendor when available; otherwise, fair values were obtained from broker quotes that were based on pricing models that consider the time value of money, volatility, and the current market and contractual prices of the underlying financial instruments.
Key inputs for OTC valuations varied based on the type of underlying security on which the contract was written:
|
•
|
The key inputs for most OTC option contracts included notional, strike price, maturity, payout structure, current foreign exchange forward and spot rates, current market price of the underlying security and volatility of the underlying security.
|
|
•
|
The key inputs for most forward contracts included notional, maturity, forward rate, spot rate, various interest rate curves and discount factor.
|
|
•
|
The key inputs for swap valuation varied based on the type of underlying security on which the contract was written. Generally, the key inputs for most swap contracts included notional, swap period, fixed rate, credit or interest rate curves, current market or spot price of the underlying security and the volatility of the underlying security.
|
F-21
The total change in unrealized gains (losses) on equity and debt securities held at the year ended
December 31, 2018
were
$nil
and
$(6.7) million
, respectively (
2017
-
$330.4 million
and
$(12.4) million
, and
2016
-
$106.2 million
and
$16.9 million
, respectively).
The following table presents the reconciliation of all investments measured at fair value using Level 3 inputs for the years ended
December 31, 2018
and
2017
:
|
January 1,
2018 |
Transfers in to (out of) Level 3
|
Purchases
|
Sales
(1)
|
Realized and Unrealized Gains(Losses)
(2)
|
December 31,
2018 |
||||||||||||||||||
|
Assets
|
|||||||||||||||||||||||
|
Private common equity securities
|
$
|
4,794
|
|
$
|
—
|
|
$
|
567
|
|
$
|
(4,726
|
)
|
$
|
(635
|
)
|
$
|
—
|
|
|||||
|
Private preferred equity securities
|
57,126
|
|
—
|
|
38,376
|
|
(91,065
|
)
|
(4,437
|
)
|
—
|
|
|||||||||||
|
Asset-backed securities
|
27,308
|
|
—
|
|
35,905
|
|
(60,906
|
)
|
(2,307
|
)
|
—
|
|
|||||||||||
|
Corporate bonds
|
9,868
|
|
—
|
|
1,372
|
|
(11,763
|
)
|
523
|
|
—
|
|
|||||||||||
|
Other debt securities
|
713
|
|
—
|
|
—
|
|
(913
|
)
|
200
|
|
—
|
|
|||||||||||
|
Rights and warrants
|
435
|
|
—
|
|
753
|
|
(1,380
|
)
|
192
|
|
—
|
|
|||||||||||
|
Real estate
|
6,831
|
|
—
|
|
—
|
|
(6,817
|
)
|
(14
|
)
|
—
|
|
|||||||||||
|
Total assets
|
$
|
107,075
|
|
$
|
—
|
|
$
|
76,973
|
|
$
|
(177,570
|
)
|
$
|
(6,478
|
)
|
$
|
—
|
|
|||||
|
Liabilities
|
|||||||||||||||||||||||
|
Derivative liabilities (free standing)
|
$
|
(2,085
|
)
|
$
|
—
|
|
$
|
—
|
|
$
|
1,797
|
|
$
|
288
|
|
$
|
—
|
|
|||||
|
Derivative liabilities (embedded)
|
(171
|
)
|
—
|
|
—
|
|
—
|
|
149
|
|
(22
|
)
|
|||||||||||
|
Total liabilities
|
$
|
(2,256
|
)
|
$
|
—
|
|
$
|
—
|
|
$
|
1,797
|
|
$
|
437
|
|
$
|
(22
|
)
|
|||||
|
January 1,
2017 |
Transfers in to (out of) Level 3
|
Purchases
|
Sales
|
Realized and Unrealized Gains(Losses)
(2)
|
December 31,
2017 |
||||||||||||||||||
|
Assets
|
|||||||||||||||||||||||
|
Private common equity securities
|
$
|
4,799
|
|
$
|
—
|
|
$
|
—
|
|
$
|
—
|
|
$
|
(5
|
)
|
$
|
4,794
|
|
|||||
|
Private preferred equity securities
|
48,834
|
|
—
|
|
4,777
|
|
(2,102
|
)
|
5,617
|
|
57,126
|
|
|||||||||||
|
Asset-backed securities
|
17,628
|
|
25,836
|
|
72,758
|
|
(75,666
|
)
|
(13,248
|
)
|
27,308
|
|
|||||||||||
|
Bank debt
|
8,350
|
|
—
|
|
4
|
|
(12,009
|
)
|
3,655
|
|
—
|
|
|||||||||||
|
Corporate bonds
|
9,255
|
|
—
|
|
1,577
|
|
(1,001
|
)
|
37
|
|
9,868
|
|
|||||||||||
|
Other debt securities
|
—
|
|
—
|
|
637
|
|
—
|
|
76
|
|
713
|
|
|||||||||||
|
Rights and warrants
|
—
|
|
—
|
|
—
|
|
—
|
|
435
|
|
435
|
|
|||||||||||
|
Real estate
|
—
|
|
—
|
|
6,770
|
|
—
|
|
61
|
|
6,831
|
|
|||||||||||
|
Total assets
|
$
|
88,866
|
|
$
|
25,836
|
|
$
|
86,523
|
|
$
|
(90,778
|
)
|
$
|
(3,372
|
)
|
$
|
107,075
|
|
|||||
|
Liabilities
|
|||||||||||||||||||||||
|
Derivative liabilities (free standing)
|
$
|
(1,326
|
)
|
$
|
—
|
|
$
|
—
|
|
$
|
(44
|
)
|
$
|
(715
|
)
|
$
|
(2,085
|
)
|
|||||
|
Derivative liabilities (embedded)
|
(92
|
)
|
—
|
|
—
|
|
—
|
|
(79
|
)
|
(171
|
)
|
|||||||||||
|
Total liabilities
|
$
|
(1,418
|
)
|
$
|
—
|
|
$
|
—
|
|
$
|
(44
|
)
|
$
|
(794
|
)
|
$
|
(2,256
|
)
|
|||||
|
(1)
|
Sales of investments measured at fair value using Level 3 inputs include the impact of the LP Transaction as described in
Note 4
.
|
|
(2)
|
Total change in realized and unrealized gains (losses) recorded on Level 3 financial instruments is included in
net investment income (loss)
in the
consolidated statements of income (loss)
.
|
Total change in unrealized gains (losses) on fair value of assets using significant unobservable inputs (Level 3) held at the year ended
December 31, 2018
was
$nil
(
2017
-
$(9.5) million
and
2016
-
$1.0 million
).
For assets and liabilities that were transferred into Level 3 during the period, gains (losses) are presented as if the assets or liabilities had been transferred into Level 3 at the beginning of the period; similarly, for assets and liabilities that
F-22
were transferred out of Level 3 during the year, gains (losses) are presented as if the assets or liabilities had been transferred out of Level 3 at the beginning of the year.
Prior to the change in the Company’s investment account structure, the Company used the following significant unobservable inputs in determining the fair value of the Level 3 investments held by the Company as of
December 31, 2017
. Level 3 investments not presented in the table below were insignificant or do not have any unobservable inputs to disclose, as they were valued primarily using dealer quotes or at cost.
|
December 31, 2017
|
|||||||||||
|
Assets
|
Fair value
|
Valuation technique
|
Unobservable input
|
Range
|
|||||||
|
Private equity investments
|
$
|
37,507
|
|
Market approach
|
Volatility
|
35.0% - 65.0%
|
|
||||
|
Time to exit
|
0.5 - 1.8 years
|
|
|||||||||
|
Multiple
|
7.8 - 24.4x
|
|
|||||||||
|
Real estate
|
6,831
|
|
Discounted cash flow
|
Discount rate
|
9.5
|
%
|
|||||
|
Capitalization rate
|
6.5% - 10.0%
|
|
|||||||||
|
Other debt securities
|
713
|
|
Discounted cash flow
|
Capitalization rate
|
10.0
|
%
|
|||||
|
Rights and warrants
|
433
|
|
Discounted cash flow
|
Discount rate
|
13.5
|
%
|
|||||
|
Time to exit
|
5.0 years
|
|
|||||||||
|
Market approach
|
Multiple
|
3.8 - 4.6x
|
|
||||||||
For the year ended December 31,
2017
, there were no changes in the valuation techniques as they relate to the above.
6. Securities sold under an agreement to repurchase
Prior to the change in the Company’s investment account structure described in
Note 4
, the Company had entered into repurchase and reverse repurchase agreements with financial institutions in which the financial institution agreed to resell or repurchase securities and the Company agreed to repurchase or resell such securities at a mutually agreed price upon maturity. These agreements were generally collateralized by corporate or government bonds or asset-backed securities. As the Company held only repurchase agreements as of
December 31, 2017
, these positions were not impacted by counterparty netting agreements. Interest payable and receivable related to these transactions were included in interest payable and receivable in the consolidated balance sheets. Generally, repurchase and reverse repurchase agreements matured within
30
to
90 days
. The Company may lend securities for securities lending transactions or pledged securities and/or cash for securities borrowed transactions. The value of any securities loaned was reflected in investments in securities. Any collateral received was reflected in due to brokers in the consolidated balance sheets as of
December 31, 2017
.
As a result of the investment account structure change, there were no repurchase and reverse repurchase agreements directly held by the Company as of
December 31, 2018
. The following table presents the contractual maturity of the repurchase agreements by class of collateral pledged as of
December 31, 2017
:
|
December 31, 2017
|
Overnights and continuous
|
Up to 30 days
|
30 - 90 days
|
Greater than 90 days
|
Total
|
||||||||||||||
|
Repurchase agreements
|
|||||||||||||||||||
|
Asset-backed securities
|
$
|
—
|
|
$
|
10,774
|
|
$
|
18,844
|
|
$
|
—
|
|
$
|
29,618
|
|
||||
F-23
7. Due from/to brokers
Prior to the change in the Company’s investment account structure described in
Note 4
, the Company held substantially all of its investments through prime brokers pursuant to agreements between the Company and each prime broker. As of
December 31, 2018
, a net balance of
$1.4 million
was not transferred to TP Fund and as a result, remains on the Company’s consolidated balance sheet and is subject to the Participation Agreement as described in Note 4.
The brokerage arrangements differed from broker to broker, but generally cash and investments in securities were available as collateral against investments in securities sold, not yet purchased and derivative positions, if required. As of
December 31, 2018
and
2017
, the Company’s due from/to brokers were comprised of the following:
|
2018
|
2017
|
||||||
|
Due from brokers
|
|||||||
|
Cash held at brokers
|
$
|
48
|
|
$
|
295,467
|
|
|
|
Receivable from unsettled trades (1)
|
1,363
|
|
9,626
|
|
|||
|
$
|
1,411
|
|
$
|
305,093
|
|
||
|
Due to brokers
|
|||||||
|
Borrowing from prime brokers
|
$
|
—
|
|
$
|
759,267
|
|
|
|
Payable from unsettled trades
|
—
|
|
10,938
|
|
|||
|
$
|
—
|
|
$
|
770,205
|
|
||
(1) Receivables relating to securities sold by the Company were recorded as receivable from unsettled trades in due from brokers in the Company’s consolidated balance sheets.
Due from/to brokers included cash balances maintained with the Company’s prime brokers, receivables and payables from unsettled trades and proceeds from securities sold, not yet purchased. In addition, due from/to brokers included cash collateral received and posted from OTC and repurchase agreement counterparties. As of
December 31, 2017
, the Company’s borrowing from prime brokers included a total non-U.S. currency balance of
$70.1 million
.
Prior to the investment account structure change, the Company used prime brokerage borrowing arrangements to provide collateral for its letter of credit facilities and to fund trust accounts securing certain reinsurance contracts. As of
December 31, 2017
, the Company had
$867.6 million
of restricted cash and investments securing letter of credit facilities and certain reinsurance contracts. Margin debt balances were collateralized by cash held by the broker and certain of the Company’s securities. Margin interest was paid either at the daily broker call rate or based on London Inter-bank Offered Rate. Amounts were borrowed through committed facilities with terms of up to 90 days, secured by assets of the Company held by the prime broker, and incurred interest based on the Company’s negotiated rates. This interest expense was reflected in
net investment income (loss)
in the
consolidated statements of income (loss)
.
8. Derivatives
As of December 31, 2018, the Company only held embedded derivatives in reinsurance contracts. The following table identifies the currency, fair value and notional amounts of embedded derivative instruments included in the consolidated balance sheets as of December 31, 2018.
|
As of December 31, 2018
|
|||||||||
|
Listing currency
(1)
|
Fair Value
|
Notional Amounts
(2)
|
|||||||
|
Derivative Liabilities by Primary Underlying Risk
|
|||||||||
|
Embedded derivative liabilities in reinsurance contracts (3)
|
USD
|
$
|
22
|
|
$
|
20,000
|
|
||
|
Total Derivative Liabilities (embedded)
|
$
|
22
|
|
$
|
20,000
|
|
|||
F-24
Prior to the change in the Company’s investment account structure described in
Note 4
, the Company entered into derivative contracts. The following tables identify the listing currency, fair value and notional amounts of derivative instruments included in the consolidated balance sheets as of December 31,
2017
, categorized by primary underlying risk. Balances are presented on a gross basis.
|
As of December 31, 2017
|
|||||||||
|
Listing currency
(1)
|
Fair Value
|
Notional Amounts
(2)
|
|||||||
|
Derivative Assets by Primary Underlying Risk
|
|||||||||
|
Credit
|
|||||||||
|
Credit Default Swaps - Protection Purchased
|
USD
|
$
|
8,205
|
|
$
|
50,593
|
|
||
|
Total Return Swaps - Long Contracts
|
EGP
|
25,245
|
|
25,245
|
|
||||
|
Equity Price
|
|||||||||
|
Contracts for Differences - Long Contracts
|
BRL/CHF/EUR/USD
|
17,298
|
|
163,868
|
|
||||
|
Contracts for Differences - Short Contracts
|
DKK/NOK/SEK/USD
|
4,384
|
|
31,992
|
|
||||
|
Total Return Swaps - Long Contracts
|
BRL/USD
|
15,936
|
|
96,388
|
|
||||
|
Total Return Swaps - Short Contracts
|
USD
|
1
|
|
—
|
|
||||
|
Interest Rates
|
|||||||||
|
Interest Rate Swaptions
|
JPY
|
539
|
|
64,950
|
|
||||
|
Foreign Currency Exchange Rates
|
|||||||||
|
Foreign Currency Forward Contracts
|
HKD /JPY
|
1,764
|
|
511,937
|
|
||||
|
Total Derivative Assets
|
$
|
73,372
|
|
$
|
944,973
|
|
|||
|
Listing currency
(1)
|
Fair Value
|
Notional Amounts
(2)
|
|||||||
|
Derivative Liabilities by Primary Underlying Risk
|
|||||||||
|
Credit
|
|||||||||
|
Credit Default Swaps - Protection Purchased
|
USD
|
$
|
1,250
|
|
$
|
19,418
|
|
||
|
Credit Default Swaps - Protection Sold
|
USD
|
2,085
|
|
2,351
|
|
||||
|
Equity Price
|
|||||||||
|
Contracts for Differences - Long Contracts
|
BRL/EUR/USD
|
2,200
|
|
93,200
|
|
||||
|
Contracts for Differences - Short Contracts
|
DKK/EUR/USD
|
776
|
|
8,483
|
|
||||
|
Total Return Swaps - Long Contracts
|
BRL/USD
|
73
|
|
50,858
|
|
||||
|
Total Return Swaps - Short Contracts
|
USD
|
1,885
|
|
52,657
|
|
||||
|
Interest Rates
|
|||||||||
|
Interest Rate Swaptions
|
JPY
|
70
|
|
64,482
|
|
||||
|
Foreign Currency Exchange Rates
|
|||||||||
|
Foreign Currency Forward Contracts
|
BRL/CHF/CNH/EUR/HKD/SAR
|
6,164
|
|
573,498
|
|
||||
|
Total Derivative Liabilities (free standing)
|
$
|
14,503
|
|
$
|
864,947
|
|
|||
|
Embedded derivative liabilities in reinsurance contracts (3)
|
USD
|
$
|
171
|
|
$
|
20,000
|
|
||
|
Total Derivative Liabilities (embedded)
|
$
|
171
|
|
$
|
20,000
|
|
|||
|
(1)
|
BRL = Brazilian Real, CHF = Swiss Franc, CNH = Chinese Yuan, DKK = Danish Krone, EGP = Egyptian Pound, EUR = Euro, HKD = Hong Kong Dollar, JPY = Japanese Yen, NOK = Norwegian Krone, SAR = Saudi Arabian Riyal, SEK = Swedish Krona, USD = US Dollar.
|
|
(2)
|
The absolute notional exposure represents the Company’s derivative activity as of
December 31, 2018
and
2017
, which is representative of the volume of derivatives held during the period.
|
|
(3)
|
The fair value of embedded derivatives in reinsurance contracts is included in reinsurance balances payable in the consolidated balance sheets.
|
F-25
The following table sets forth, by major risk type, the Company’s realized and unrealized gains (losses) relating to derivatives for the years ended
December 31, 2018
,
2017
and
2016
. Realized and unrealized gains (losses) for the year ended
December 31, 2018
includes activity in the separate accounts up to the date of change in the investment account structure described in
Note 4
. Realized and unrealized gains (losses) related to free standing derivatives are included in
net investment income (loss)
in the
consolidated statements of income (loss)
. Realized and unrealized gains (losses) related to embedded derivatives are included in other expenses in the
consolidated statements of income (loss)
.
|
2018
|
2017
|
2016
|
|||||||||||||||||||||
|
Free standing Derivatives - Primary Underlying Risk
|
Realized Gain (Loss)
|
Unrealized Gain (Loss)
|
Realized Gain (Loss)
|
Unrealized Gain (Loss)*
|
Realized Gain (Loss)
|
Unrealized Gain (Loss)*
|
|||||||||||||||||
|
Commodity Price
|
|||||||||||||||||||||||
|
Commodity Future Options - Purchased
|
$
|
—
|
|
$
|
—
|
|
$
|
—
|
|
$
|
—
|
|
$
|
651
|
|
$
|
—
|
|
|||||
|
Credit
|
|||||||||||||||||||||||
|
Credit Default Swaps - Protection Purchased
|
(3,557
|
)
|
921
|
|
(3,462
|
)
|
(978
|
)
|
4,311
|
|
(6,841
|
)
|
|||||||||||
|
Credit Default Swaps - Protection Sold
|
(333
|
)
|
744
|
|
605
|
|
(720
|
)
|
(4,009
|
)
|
4,149
|
|
|||||||||||
|
Total Return Swaps - Long Contracts
|
3,486
|
|
(2,000
|
)
|
72
|
|
2,000
|
|
—
|
|
—
|
|
|||||||||||
|
Equity Price
|
|||||||||||||||||||||||
|
Contracts for Differences - Long Contracts
|
32,460
|
|
(15,098
|
)
|
58,047
|
|
13,334
|
|
(4,123
|
)
|
2,245
|
|
|||||||||||
|
Contracts for Differences - Short Contracts
|
4,568
|
|
(3,608
|
)
|
2,608
|
|
4,715
|
|
(253
|
)
|
(3,579
|
)
|
|||||||||||
|
Total Return Swaps - Long Contracts
|
16,792
|
|
(15,864
|
)
|
16,863
|
|
16,923
|
|
(6,835
|
)
|
1,957
|
|
|||||||||||
|
Total Return Swaps - Short Contracts
|
(17,329
|
)
|
1,883
|
|
(15,892
|
)
|
(765
|
)
|
(4,812
|
)
|
(1,198
|
)
|
|||||||||||
|
Interest Rates
|
|||||||||||||||||||||||
|
Commodities Futures - Short Contracts
|
—
|
|
—
|
|
—
|
|
—
|
|
(281
|
)
|
(52
|
)
|
|||||||||||
|
Fixed Income Swap - Short Contracts
|
—
|
|
—
|
|
—
|
|
—
|
|
(94
|
)
|
—
|
|
|||||||||||
|
Interest Rate Swaps
|
—
|
|
—
|
|
(3,104
|
)
|
(1,740
|
)
|
205
|
|
1,740
|
|
|||||||||||
|
Interest Rate Swaptions
|
(1,819
|
)
|
1,228
|
|
(354
|
)
|
(2,056
|
)
|
(340
|
)
|
869
|
|
|||||||||||
|
Sovereign Future Options - Long Contracts
|
403
|
|
—
|
|
—
|
|
—
|
|
—
|
|
—
|
|
|||||||||||
|
Sovereign Future Options - Short Contracts
|
50
|
|
—
|
|
—
|
|
—
|
|
—
|
|
—
|
|
|||||||||||
|
Sovereign Futures - Long Contracts
|
639
|
|
—
|
|
—
|
|
—
|
|
—
|
|
—
|
|
|||||||||||
|
Sovereign Futures - Short Contracts
|
(1,166
|
)
|
—
|
|
(7,798
|
)
|
647
|
|
10,519
|
|
(647
|
)
|
|||||||||||
|
Total Return Swaps - Long Contracts
|
(7,569
|
)
|
—
|
|
—
|
|
—
|
|
—
|
|
—
|
|
|||||||||||
|
Foreign Currency Exchange Rates
|
|||||||||||||||||||||||
|
Foreign Currency Forward Contracts
|
(2,849
|
)
|
4,403
|
|
(10,470
|
)
|
(3,048
|
)
|
(2,747
|
)
|
(2,261
|
)
|
|||||||||||
|
Foreign Currency Future Options - Purchased
|
(108
|
)
|
—
|
|
—
|
|
—
|
|
—
|
|
—
|
|
|||||||||||
|
Foreign Currency Options - Purchased
|
5,138
|
|
—
|
|
(6,716
|
)
|
1,164
|
|
(2,338
|
)
|
(2,229
|
)
|
|||||||||||
|
Foreign Currency Options - Sold
|
(771
|
)
|
—
|
|
2,183
|
|
(80
|
)
|
617
|
|
(103
|
)
|
|||||||||||
|
$
|
28,035
|
|
$
|
(27,391
|
)
|
$
|
32,582
|
|
$
|
29,396
|
|
$
|
(9,529
|
)
|
$
|
(5,950
|
)
|
||||||
|
Embedded Derivatives
|
|||||||||||||||||||||||
|
Embedded derivatives in reinsurance contracts
|
$
|
—
|
|
$
|
149
|
|
$
|
—
|
|
$
|
(79
|
)
|
$
|
—
|
|
$
|
260
|
|
|||||
|
Total Derivative Liabilities (embedded)
|
$
|
—
|
|
$
|
149
|
|
$
|
—
|
|
$
|
(79
|
)
|
$
|
—
|
|
$
|
260
|
|
|||||
*Unrealized gain (loss) relates to derivatives still held at reporting date.
The Company’s derivative contracts were subject to International Swaps and Derivatives Association (“ISDA”) Master Agreements and other similar agreements that contained provisions setting forth events of default and/or termination events (“credit-risk-related contingent features”), including but not limited to provisions setting forth maximum permissible declines in the Company’s net asset value. Upon the occurrence of a termination event with respect to an ISDA Agreement, the Company’s counterparty could elect to terminate the derivative contracts governed by such agreement, resulting in the realization of any net gains or losses with respect to such derivative contracts and the return of collateral held by such party.
F-26
The Company obtained/provided collateral from/to various counterparties for OTC derivative and futures contracts in accordance with bilateral collateral agreements. During the period ended
December 31, 2017
, no termination events were triggered under the ISDA Master Agreements. As of
December 31, 2017
, the aggregate fair value of all derivative instruments with credit-risk-related contingent features that were in a net liability position was
$3.6 million
for which the Company posted collateral in the form of cash of
$103.0 million
in the normal course of business. Similarly, the Company held collateral in cash from certain counterparties as of
December 31, 2017
. If the credit-risk-related contingent features underlying these instruments had been triggered as of
December 31, 2017
and the Company had to settle these instruments immediately, no additional amounts would be required to be posted that would exceed the settlement amounts of open derivative contracts or in the case of cross margining relationships, the assets in the Company’s prime brokerage accounts were sufficient to offset the derivative liabilities.
The Company’s derivatives did not qualify as hedges for financial reporting purposes and were recorded in the consolidated financial statements on a gross basis and not offset against any collateral pledged or received. Pursuant to ISDA master agreements and other counterparty agreements, the Company and its counterparties typically had the ability to net certain payments owed to each other in specified circumstances. In addition, in the event a party to one of the ISDA master agreements or other derivatives agreements defaults, or a transaction is otherwise subject to termination, the non-defaulting party generally had the right to offset against payments owed to the defaulting party or collateral held by the non-defaulting party.
The Company had pledged cash collateral to counterparties to support the current value of amounts due to the counterparties based on the value of the underlying security. As of
December 31, 2017
, the gross and net amounts of derivative instruments and repurchase agreements that were subject to enforceable master netting arrangements or similar agreements were as follows:
|
Amounts not Offset in the Consolidated Balance Sheet
|
|||||||||||||||
|
December 31, 2017
Derivative Contracts
|
Gross Amount
(1)
|
Financial Instruments
|
Cash Collateral Received
|
Net Amount
|
|||||||||||
|
Financial assets, derivative assets and collateral received
|
|||||||||||||||
|
Counterparty 1
|
$
|
167
|
|
$
|
167
|
|
$
|
—
|
|
$
|
—
|
|
|||
|
Counterparty 2
|
1,343
|
|
706
|
|
—
|
|
637
|
|
|||||||
|
Counterparty 3
|
37,313
|
|
2,705
|
|
—
|
|
34,608
|
|
|||||||
|
Counterparty 4
|
2,683
|
|
2,683
|
|
—
|
|
—
|
|
|||||||
|
Counterparty 5
|
14,798
|
|
6,647
|
|
—
|
|
8,151
|
|
|||||||
|
Counterparty 6
|
5,338
|
|
9
|
|
2,122
|
|
3,207
|
|
|||||||
|
Counterparty 7
|
1,377
|
|
—
|
|
1,100
|
|
277
|
|
|||||||
|
Counterparty 8
|
12,628
|
|
2,963
|
|
—
|
|
9,665
|
|
|||||||
|
Counterparty 9
|
703
|
|
703
|
|
—
|
|
—
|
|
|||||||
|
$
|
76,350
|
|
$
|
16,583
|
|
$
|
3,222
|
|
$
|
56,545
|
|
||||
F-27
|
Amounts not Offset in the Consolidated Balance Sheet
|
|||||||||||||||
|
December 31, 2017
Derivative Contracts
|
Gross Amount
(2)
|
Financial Instruments
|
Cash Collateral Pledged
|
Net Amount
|
|||||||||||
|
Financial liabilities, derivative liabilities and collateral pledged
|
|||||||||||||||
|
Counterparty 1
|
$
|
1,340
|
|
$
|
167
|
|
$
|
1,173
|
|
$
|
—
|
|
|||
|
Counterparty 2
|
706
|
|
706
|
|
—
|
|
—
|
|
|||||||
|
Counterparty 3
|
2,705
|
|
2,705
|
|
—
|
|
—
|
|
|||||||
|
Counterparty 4
|
3,812
|
|
2,683
|
|
1,129
|
|
—
|
|
|||||||
|
Counterparty 5
|
6,647
|
|
6,647
|
|
—
|
|
—
|
|
|||||||
|
Counterparty 6
|
9
|
|
9
|
|
—
|
|
—
|
|
|||||||
|
Counterparty 8
|
2,963
|
|
2,963
|
|
—
|
|
—
|
|
|||||||
|
Counterparty 9
|
1,181
|
|
703
|
|
478
|
|
—
|
|
|||||||
|
Counterparty 15
|
836
|
|
—
|
|
732
|
|
104
|
|
|||||||
|
$
|
20,199
|
|
$
|
16,583
|
|
$
|
3,512
|
|
$
|
104
|
|
||||
|
Securities sold under an agreement to repurchase
|
|||||||||||||||
|
Counterparty 4
|
$
|
29,618
|
|
$
|
29,618
|
|
$
|
—
|
|
$
|
—
|
|
|||
|
$
|
29,618
|
|
$
|
29,618
|
|
$
|
—
|
|
$
|
—
|
|
||||
|
(1)
|
The gross amounts of assets presented in the consolidated balance sheets presented above includes the fair value of derivative contract assets as well as gross OTC option contract assets of
$3.0 million
included in other investments in the consolidated balance sheets.
|
|
(2)
|
The gross amounts of liabilities presented in the consolidated balance sheets presented above includes the fair value of derivative contract liabilities as well as gross OTC option contract liabilities of
$5.7 million
included in securities sold, not yet purchased in the consolidated balance sheets.
|
9. Loss and loss adjustment expense reserves
As of
December 31, 2018
and
2017
, loss and loss adjustment expense reserves in the consolidated balance sheets was comprised of the following:
|
2018
|
2017
|
||||||
|
Case loss and loss adjustment expense reserves
|
$
|
125,456
|
|
$
|
115,622
|
|
|
|
Incurred but not reported loss and loss adjustment expense reserves
|
811,280
|
|
604,260
|
|
|||
|
Deferred gains on retroactive reinsurance contracts
|
421
|
|
688
|
|
|||
|
$
|
937,157
|
|
$
|
720,570
|
|
||
Reserving methodologies
The Company’s methodology for reserving for its reinsurance contracts and determining its loss and loss adjustment expense reserves, including incurred but not reported reserves, is as follows:
The Company’s actuaries perform an actuarial projection of the Company’s reserves quarterly and have a third-party actuarial review performed periodically. All reserves are estimated on an individual contract basis; there is no aggregation of contracts for projection of ultimate loss or reserves. The Company typically initially reserves individual contracts to the expected loss and loss expense ratio in its pricing analysis. As loss information is received from cedents, the Company incorporates other actuarial methods into its projection of ultimate losses and, hence, reserves.
In the Company’s pricing analysis, there is a significant amount of information unique to the individual client and, when necessary, the analysis is supplemented with industry data. Industry data primarily takes the form of paid and incurred development patterns from statutory financial statements and statistical agencies. For the Company’s actuarial reserve projections, the relevant information received from clients includes premium estimates, paid loss and loss
F-28
adjustment expenses and case reserves. The Company’s actuaries review the data for reasonableness and research any noted anomalies. On each contract, the Company’s actuaries compare the expected paid and incurred amounts at each quarter-end with actual amounts reported. The Company’s actuaries also compare premiums received with projected premium receipts at each quarter end.
There is a time lag between when a covered loss event occurs and when it is reported to the Company’s cedents. There is also a time lag between when clients pay claims, establish case reserves and re-estimate their reserves, and when they notify the Company of the payments and/or new or revised case reserves. This reporting lag is typically 60 to 90 days after the end of a reporting period, but can be longer in some cases. The Company’s actuaries use techniques that adjust for this reporting lag. While it would be unusual to have lags that extend beyond 90 days, the Company’s actuarial techniques are designed to adjust for such a circumstance.
The principal actuarial methods (and associated key assumptions) used to perform the Company’s quarterly loss reserve analysis may include one or more of the following methods:
A priori loss ratio method
To estimate ultimate losses using the a priori loss ratio method, the Company multiplies earned premiums by an expected loss ratio. The expected loss ratio is selected as part of the pricing and utilizes individual client data, supplemented by industry data where necessary. This method is often useful when there is limited historical data due to few losses being incurred.
Paid loss development method
This method estimates ultimate losses by calculating past paid loss development factors and applying them to exposure periods with further expected paid loss development. The paid loss development method assumes that losses are paid at a rate consistent with the historical rate of payment. It provides an objective test of reported loss projections because paid losses contain no case reserve estimates. For some lines of business, claim payments are made slowly and it may take many years for claims to be fully reported and settled.
Incurred loss development method
This method estimates ultimate losses by using past incurred loss development factors and applying them to exposure periods with further expected incurred loss development. Since incurred losses include payments and case reserves, changes in both of these amounts are incorporated in this method. This approach provides a larger volume of data to estimate ultimate losses than paid loss methods. Thus, incurred loss patterns may be less varied than paid loss patterns, especially for coverages that have historically been paid out over a long period of time but for which claims are incurred relatively early and case loss reserve estimates are established.
Bornhuetter-Ferguson paid and incurred loss methods
These methods are a weighted average of the a priori loss ratio method and the relevant development method. The weighting between the two methods depends on the maturity of the business. This means that for the more recent years a greater weight is placed on the a priori loss ratio method, while for the more mature years a greater weight is placed on the development methods. These methods avoid some of the distortions that could result from a large development factor being applied to a small base of paid or incurred losses to calculate ultimate losses. This method will react slowly if actual paid or incurred loss experience develops differently than historical paid or incurred loss experience because of major changes in rate levels, retentions or deductibles, the forms and conditions of coverage, the types of risks covered or a variety of other factors.
IBNR to outstanding ratio method
This method is used in selected cases typically for very mature years that still have open claims. This method assumes that the estimated future loss development is indicated by the current level of case reserves.
Key to the projection of ultimate loss is the amount of credibility or weight assigned to each actuarial method. Each method has advantages and disadvantages, and those can change depending on numerous factors including the reliability
F-29
of the underlying data. The selection and weighting of the projection methods is a highly subjective process. In order to achieve a desirable amount of consistency from study to study and between contracts, the Company’s actuaries have implemented a weighting scheme that incorporates numerous “rules” for the weighting of actuarial methods. These rules attempt to effectively standardize the process used for selecting weights for the various methods. There are numerous circumstances where the rules would be modified for specific reinsurance contracts; examples would include a large market event or new information on historical years that may cause us to increase our a priori loss ratio.
As part of the Company’s quarterly reserving process, loss-sensitive contingent expenses (e.g., profit commissions, sliding-scale ceding commissions, etc.) are calculated on an individual contract basis. These expense calculations are based on the updated ultimate loss estimates derived from the Company's quarterly reserving process.
The Company’s reserving methodologies use a loss reserving model that calculates a point estimate for the Company’s ultimate losses. Although the Company believes that its assumptions and methodologies are reasonable, the ultimate payments may vary, potentially materially, from the estimates that the Company has made.
There were no significant changes made to the Company’s methodology for calculating loss and loss adjustment reserves for the year ended
December 31, 2018
.
Roll forward of loss and loss adjustment expense reserves
The following table represents the activity in the loss and loss adjustment expense reserves for the years ended
December 31, 2018
,
2017
and
2016
:
|
2018
|
2017
|
2016
|
|||||||||
|
Gross reserves for loss and loss adjustment expenses, beginning of year
|
$
|
720,570
|
|
$
|
605,129
|
|
$
|
466,047
|
|
||
|
Less: loss and loss adjustment expenses recoverable, beginning of year
|
(1,113
|
)
|
(1
|
)
|
(125
|
)
|
|||||
|
Net reserves for loss and loss adjustment expenses, beginning of year
|
719,457
|
|
605,128
|
|
465,922
|
|
|||||
|
Increase (decrease) in net loss and loss adjustment expenses incurred in respect of losses occurring in:
|
|||||||||||
|
Current year
|
434,276
|
|
422,801
|
|
372,002
|
|
|||||
|
Prior years (1)
|
4,138
|
|
(52,743
|
)
|
23,930
|
|
|||||
|
Total incurred loss and loss adjustment expenses
|
438,414
|
|
370,058
|
|
395,932
|
|
|||||
|
Net loss and loss adjustment expenses paid in respect of losses occurring in:
|
|||||||||||
|
Current year
|
(85,173
|
)
|
(110,799
|
)
|
(105,921
|
)
|
|||||
|
Prior years
|
(132,336
|
)
|
(162,447
|
)
|
(133,241
|
)
|
|||||
|
Total net paid losses
|
(217,509
|
)
|
(273,246
|
)
|
(239,162
|
)
|
|||||
|
Foreign currency translation
|
(9,083
|
)
|
17,517
|
|
(17,564
|
)
|
|||||
|
Net reserves for loss and loss adjustment expenses, end of year
|
931,279
|
|
719,457
|
|
605,128
|
|
|||||
|
Plus: loss and loss adjustment expenses recoverable, end of year
|
2,031
|
|
1,113
|
|
1
|
|
|||||
|
Plus: deferred charges on retroactive reinsurance contracts
|
3,847
|
|
—
|
|
—
|
|
|||||
|
Gross reserves for loss and loss adjustment expenses, end of year
|
$
|
937,157
|
|
$
|
720,570
|
|
$
|
605,129
|
|
||
|
(1)
|
In the year ended December 31, 2018, the Company started including the amortization of deferred gains on retroactive reinsurance contracts in prior year loss development. This line item was previously presented separately in the loss reserves roll forward presented above. The prior year presentation has been adjusted to conform to the current year presentation. For the year ended
December 31, 2018
, net loss and loss adjustment expenses incurred in respect of prior years include a decrease of
$3.4 million
relating to the amortization deferred gains/charges (
2017
-
$1.5 million
and
2016
-
$1.0 million
).
|
Changes in the Company’s loss and loss adjustment expense reserves result from re-estimating loss reserves and from changes in premium earnings estimates. Furthermore, many of the Company’s contracts have sliding scale or profit commissions whereby loss reserve development can be offset by changes in acquisition costs that vary inversely with loss experience. In some instances, the Company can have loss reserve development on contracts where there is no sliding scale or profit commission or where the loss ratio falls outside of the loss ratio range to which the sliding scale or profit commission applies.
F-30
The
$4.1 million
net
increase
in prior years’ reserves for the year ended
December 31, 2018
includes
$12.9 million
of net
favorable
reserve development related to
decrease
s in loss reserve estimates and
$17.0 million
increase
in loss reserves resulting from
increase
s in premium earnings estimates on certain contracts. The net
increase
in loss reserves as well as the impact of any offsetting changes in acquisition costs as a result of sliding scale or profit commissions is explained as follows:
|
•
|
The
$12.9 million
of net
favorable
prior years’ reserve development for the year ended
December 31, 2018
was accompanied by net
increase
s of
$7.7 million
in acquisition costs, resulting in a
$5.2 million
improvement in the net underwriting results
, primarily due to:
|
|
•
|
$15.8 million
of net favorable underwriting loss development relating to workers’ compensation, multi-line and credit and financial lines contracts. The favorable development was the result of better than expected loss experience and was partially offset by;
|
|
•
|
$10.5 million
of net adverse underwriting loss development primarily relating to our general liability and homeowners’ contracts, as a result of worse than expected loss experience.
|
|
•
|
The
$17.0 million
net
increase
in loss and loss adjustment expenses incurred resulting from
increase
s in premium earnings estimates was accompanied by a
$5.4 million
increase
in acquisition costs, for a total of
$22.4 million
increase
in loss and loss adjustment expenses incurred and acquisition costs. The
increase
in loss and loss adjustment expenses incurred and acquisition costs was due to
an increase
in prior period earned premium of
$23.4 million
. The
increase
in prior period earned premium was the result of changes in ultimate premium and earning pattern estimates. The net impact was a
$1.0 million
improvement in the net underwriting results
for the year ended
December 31, 2018
.
|
|
•
|
In total, the change in net underwriting loss for prior periods due to loss reserve development and adjustments to premium earnings estimates resulted in a
$6.2 million
improvement in the net underwriting results
for the year ended
December 31, 2018
.
|
The
$52.7 million
net decrease in prior years’ reserves, which includes amortization of deferred gains, for the year ended
December 31, 2017
includes
$22.3 million
of net favorable reserve development related to decreases in loss reserve estimates and
$30.4 million
decrease in loss reserves resulting from decreases in premium earnings estimates on certain contracts. The net decrease in loss reserves as well as the impact of any offsetting changes in acquisition costs as a result of sliding scale or profit commissions is explained as follows:
|
•
|
The
$22.3 million
of net favorable prior years’ reserve development for the year ended
December 31, 2017
was accompanied by net increases of
$19.8 million
in acquisition costs, resulting in a
$2.5 million
improvement in the net underwriting results, primarily due to:
|
|
•
|
$5.8 million
of net favorable underwriting loss development relating to several workers’ compensation contracts written from 2012 to 2014, driven by better than expected loss experience;
|
|
•
|
$1.3 million
of net favorable underwriting loss development from several other contracts as a result of better than expected loss experience; partially offset by
|
|
•
|
$4.6 million
of net adverse underwriting loss development relating to non-standard auto contracts, primarily due to the inability of cedents to promptly react to increasing frequency and severity trends, resulting in underpriced business and adverse selection.
|
|
•
|
The
$30.4 million
net decrease in loss and loss adjustment expenses incurred resulting from decreases in premium earnings estimates on certain contracts was accompanied by a
$21.7 million
decrease in acquisition costs, for a total of
$52.1 million
decrease in loss and loss adjustment expenses incurred and acquisition costs. The decrease in loss and loss adjustment expenses incurred and acquisition costs was due to a decrease in prior period earned premium of
$50.0 million
. The decrease in prior period earned premium was the result of changes in ultimate premium and earning pattern estimates. The net impact was a
$2.1 million
improvement in the net underwriting results for the year ended
December 31, 2017
.
|
F-31
|
•
|
In total, the change in net underwriting loss for prior periods due to loss reserve development and adjustments to premium earnings estimates resulted in a
$4.6 million
improvement in the net underwriting results for the year ended
December 31, 2017
.
|
The
$23.9 million
net increase in prior years’ reserves, which includes amortization of deferred gains, for the year ended
December 31, 2016
includes
$10.5 million
of net adverse reserve development related to increases in loss reserve estimates and
$13.4 million
of additional loss reserves resulting from increases in premium earnings estimates on certain contracts. The net increase in loss reserves as well as the impact of any offsetting changes in acquisition costs as a result of sliding scale or profit commissions is explained as follows:
|
•
|
The
$10.5 million
of net adverse prior years’ reserve development for the year ended
December 31, 2016
was accompanied by net increases of
$2.0 million
in acquisition costs, resulting in a net increase of
$12.5 million
in net underwriting loss, primarily due to:
|
|
•
|
$4.8 million
of net adverse underwriting loss development relating to one multi-line contract written since 2014. This contract contains underlying commercial auto physical damage and auto extended warranty exposure. The adverse loss experience is a result of an increase in the number of reported claims and inadequate pricing in certain segments of the underlying business;
|
|
•
|
$4.0 million
of net adverse underwriting loss development relating to non-standard auto contracts, primarily due to the inability of cedents to promptly react to increasing frequency and severity trends, resulting in underpriced business and adverse selection;
|
|
•
|
$3.7 million
of net adverse underwriting loss development relating to our Florida homeowners’ reinsurance contracts primarily as a result of higher than anticipated water damage claims and an increase in the practice of assignment of benefits whereby homeowners assign their rights for filing and settling claims to attorneys and public adjusters, which has led to increases in the frequency of claims reported as well as the severity of losses and loss adjustment expenses. Contracts for which we experienced this adverse loss development have not been renewed;
|
|
•
|
$3.3 million
of net adverse underwriting loss development relating to a workers’ compensation contract written from 2012 to 2014 under which we have been experiencing higher than expected reported claims development that led to an increase in our previous loss assumptions on this contract; and
|
|
•
|
$2.1 million
of net favorable underwriting loss development from several other contracts.
|
|
•
|
The
$13.4 million
net increase in loss and loss adjustment expenses incurred resulting from increases in premium earnings estimates on certain contracts was accompanied by a
$6.4 million
increase in acquisition costs, for a total of
$19.8 million
increase in loss and loss adjustment expenses incurred and acquisition costs. The increase in loss and loss adjustment expenses incurred and acquisition costs was due to an increase in prior period earned premium of
$19.5 million
. The increase in prior period earned premium was the result of changes in ultimate premium and earning pattern estimates. The net impact was a
$0.3 million
increase to the net underwriting loss for the year ended
December 31, 2016
.
|
|
•
|
In total, the change in net underwriting loss for prior periods due to loss reserve development and adjustments to premium earnings estimates for prior years was an increase in net underwriting loss of
$12.8 million
for the year ended
December 31, 2016
.
|
F-32
Incurred and paid development tables by accident year
The Company manages its business on the basis of one operating segment, property and casualty reinsurance. The Company has disaggregated its loss information presented in the tables below by prospective and retroactive reinsurance. For its prospective reinsurance business, the Company further disaggregated by the different lines of business included in this segment. The Company’s retroactive reinsurance contracts have been presented by year of inception. The Company’s retroactive reinsurance contracts within each inception year share similar characteristics and as a result, have not been disaggregated further. The Company has presented the below development tables for all accident years shown using exchange rates as at
December 31, 2018
. All accident years prior to the current year have been restated and presented using the current year exchange rate.
The Company’s loss reserve analysis is based primarily on underwriting year data. The preparation of accident year development tables requires an allocation of underwriting year data to the corresponding accident years. For instance, a contract written in one particular underwriting year may have exposure to losses from two or more accident years. These allocations are done using accident year loss payment and reporting patterns, along with premium earnings patterns. These patterns are derived from either company-specific or industry historical loss data, depending on availability and applicability. The Company believes that its allocations are reasonable; however, to the extent that the Company’s allocation procedure for loss and loss adjustment expenses incurred differs from actual historical development, the actual loss development may differ materially from the loss development presented.
As described in the roll forward of loss and loss adjustment expense reserves section above, changes in the Company’s loss and loss adjustment expense reserves result from both re-estimating loss reserves as well as changes in premium estimates. In addition, many of the Company’s contracts have sliding scale or profit commissions whereby loss reserve development can be offset by changes in acquisition costs. See additional disclosure above on the net impact on underwriting income after considering the impact of changes in premium estimates and the impact of acquisition costs for the years ended
December 31, 2018
,
2017
and
2016
.
F-33
Property and Casualty Reinsurance - Prospective Reinsurance Contracts
The following tables provide a breakdown of the Company’s loss and loss adjustment expenses incurred, net and net loss and loss adjustment expenses paid by accident year by line of business for the Company’s prospective reinsurance contracts for the years ended
December 31, 2018
and
2017
. The information related to loss and loss adjustment expenses incurred, net and net loss and loss adjustment expenses paid for the years ended December 31, 2012 through
2017
is presented as supplementary information and is unaudited:
Property
|
Loss and loss adjustment expenses incurred, net
|
||||||||||||||||||||||||||||||||
|
Accident year
|
2012
|
2013
|
2014
|
2015
|
2016
|
2017
|
2018
|
IBNR loss and LAE reserves, net
|
||||||||||||||||||||||||
|
<--------------------------------------------- Unaudited --------------------------------------------->
|
||||||||||||||||||||||||||||||||
|
2012
|
$
|
10,917
|
|
$
|
8,672
|
|
$
|
9,375
|
|
$
|
9,353
|
|
$
|
9,416
|
|
$
|
9,472
|
|
$
|
9,501
|
|
$
|
17
|
|
||||||||
|
2013
|
—
|
|
27,765
|
|
24,980
|
|
25,766
|
|
25,882
|
|
25,785
|
|
26,170
|
|
287
|
|
||||||||||||||||
|
2014
|
—
|
|
—
|
|
40,256
|
|
40,920
|
|
41,336
|
|
44,627
|
|
46,500
|
|
1,434
|
|
||||||||||||||||
|
2015
|
—
|
|
—
|
|
—
|
|
50,330
|
|
52,533
|
|
54,635
|
|
56,313
|
|
3,055
|
|
||||||||||||||||
|
2016
|
—
|
|
—
|
|
—
|
|
—
|
|
45,415
|
|
43,038
|
|
43,799
|
|
4,758
|
|
||||||||||||||||
|
2017
|
—
|
|
—
|
|
—
|
|
—
|
|
—
|
|
41,237
|
|
41,833
|
|
5,560
|
|
||||||||||||||||
|
2018
|
—
|
|
—
|
|
—
|
|
—
|
|
—
|
|
—
|
|
54,084
|
|
23,819
|
|
||||||||||||||||
|
Total
|
|
$
|
278,200
|
|
$
|
38,930
|
|
|||||||||||||||||||||||||
|
Cumulative net losses and loss adjustment expenses paid
|
||||||||||||||||||||||||||||||||
|
Accident year
|
2012
|
2013
|
2014
|
2015
|
2016
|
2017
|
2018
|
|||||||||||||||||||||||||
|
<--------------------------------------------- Unaudited --------------------------------------------->
|
||||||||||||||||||||||||||||||||
|
2012
|
$
|
4,656
|
|
$
|
8,381
|
|
$
|
9,075
|
|
$
|
9,186
|
|
$
|
9,352
|
|
$
|
9,400
|
|
$
|
9,482
|
|
|||||||||||
|
2013
|
—
|
|
14,635
|
|
22,229
|
|
24,023
|
|
25,167
|
|
25,406
|
|
25,815
|
|
||||||||||||||||||
|
2014
|
—
|
|
—
|
|
19,420
|
|
34,381
|
|
38,448
|
|
42,775
|
|
44,533
|
|
||||||||||||||||||
|
2015
|
—
|
|
—
|
|
—
|
|
22,706
|
|
43,382
|
|
48,360
|
|
51,783
|
|
||||||||||||||||||
|
2016
|
—
|
|
—
|
|
—
|
|
—
|
|
21,593
|
|
31,871
|
|
37,044
|
|
||||||||||||||||||
|
2017
|
—
|
|
—
|
|
—
|
|
—
|
|
—
|
|
24,713
|
|
33,436
|
|
||||||||||||||||||
|
2018
|
—
|
|
—
|
|
—
|
|
—
|
|
—
|
|
—
|
|
26,458
|
|
||||||||||||||||||
|
Total
|
$
|
228,551
|
|
|||||||||||||||||||||||||||||
|
Property - net reserves for loss and loss adjustment expenses, end of year
|
$
|
49,649
|
|
|||||||||||||||||||||||||||||
F-34
Workers’ Compensation
|
Loss and loss adjustment expenses incurred, net
|
||||||||||||||||||||||||||||||||
|
Accident year
|
2012
|
2013
|
2014
|
2015
|
2016
|
2017
|
2018
|
IBNR loss and LAE reserves, net
|
||||||||||||||||||||||||
|
<--------------------------------------------- Unaudited --------------------------------------------->
|
||||||||||||||||||||||||||||||||
|
2012
|
$
|
4,037
|
|
$
|
4,534
|
|
$
|
5,066
|
|
$
|
5,596
|
|
$
|
5,715
|
|
$
|
5,720
|
|
$
|
5,874
|
|
$
|
126
|
|
||||||||
|
2013
|
—
|
|
27,449
|
|
28,616
|
|
33,365
|
|
33,449
|
|
33,252
|
|
33,067
|
|
954
|
|
||||||||||||||||
|
2014
|
—
|
|
—
|
|
40,247
|
|
46,568
|
|
47,200
|
|
43,470
|
|
42,037
|
|
3,327
|
|
||||||||||||||||
|
2015
|
—
|
|
—
|
|
—
|
|
35,749
|
|
37,138
|
|
34,800
|
|
32,529
|
|
5,104
|
|
||||||||||||||||
|
2016
|
—
|
|
—
|
|
—
|
|
—
|
|
40,433
|
|
39,205
|
|
36,475
|
|
10,129
|
|
||||||||||||||||
|
2017
|
—
|
|
—
|
|
—
|
|
—
|
|
—
|
|
41,075
|
|
40,459
|
|
18,055
|
|
||||||||||||||||
|
2018
|
—
|
|
—
|
|
—
|
|
—
|
|
—
|
|
—
|
|
27,753
|
|
19,516
|
|
||||||||||||||||
|
Total
|
|
$
|
218,194
|
|
$
|
57,211
|
|
|||||||||||||||||||||||||
|
Cumulative net losses and loss adjustment expenses paid
|
||||||||||||||||||||||||||||||||
|
Accident year
|
2012
|
2013
|
2014
|
2015
|
2016
|
2017
|
2018
|
|||||||||||||||||||||||||
|
<--------------------------------------------- Unaudited --------------------------------------------->
|
||||||||||||||||||||||||||||||||
|
2012
|
$
|
93
|
|
$
|
624
|
|
$
|
3,017
|
|
$
|
4,280
|
|
$
|
4,969
|
|
$
|
4,796
|
|
$
|
5,110
|
|
|||||||||||
|
2013
|
—
|
|
2,587
|
|
9,142
|
|
16,840
|
|
22,826
|
|
26,956
|
|
29,082
|
|
||||||||||||||||||
|
2014
|
—
|
|
—
|
|
4,073
|
|
15,947
|
|
24,280
|
|
29,573
|
|
34,112
|
|
||||||||||||||||||
|
2015
|
—
|
|
—
|
|
—
|
|
2,669
|
|
10,755
|
|
17,001
|
|
22,432
|
|
||||||||||||||||||
|
2016
|
—
|
|
—
|
|
—
|
|
—
|
|
3,985
|
|
13,236
|
|
18,346
|
|
||||||||||||||||||
|
2017
|
—
|
|
—
|
|
—
|
|
—
|
|
—
|
|
4,586
|
|
11,868
|
|
||||||||||||||||||
|
2018
|
—
|
|
—
|
|
—
|
|
—
|
|
—
|
|
—
|
|
2,552
|
|
||||||||||||||||||
|
Total
|
|
$
|
123,502
|
|
||||||||||||||||||||||||||||
|
Workers’ Compensation - net reserves for loss and loss adjustment expenses, end of year
|
$
|
94,692
|
|
|||||||||||||||||||||||||||||
F-35
Auto
|
Loss and loss adjustment expenses incurred, net
|
||||||||||||||||||||||||||||||||
|
Accident year
|
2012
|
2013
|
2014
|
2015
|
2016
|
2017
|
2018
|
IBNR loss and LAE reserves, net
|
||||||||||||||||||||||||
|
<--------------------------------------------- Unaudited --------------------------------------------->
|
||||||||||||||||||||||||||||||||
|
2012
|
$
|
13,247
|
|
$
|
12,264
|
|
$
|
11,777
|
|
$
|
11,534
|
|
$
|
11,433
|
|
$
|
11,333
|
|
$
|
11,356
|
|
$
|
6
|
|
||||||||
|
2013
|
—
|
|
20,830
|
|
19,990
|
|
19,472
|
|
19,338
|
|
19,483
|
|
19,534
|
|
47
|
|
||||||||||||||||
|
2014
|
—
|
|
—
|
|
104,896
|
|
103,473
|
|
103,568
|
|
103,661
|
|
103,822
|
|
239
|
|
||||||||||||||||
|
2015
|
—
|
|
—
|
|
—
|
|
82,677
|
|
88,705
|
|
89,550
|
|
89,459
|
|
326
|
|
||||||||||||||||
|
2016
|
—
|
|
—
|
|
—
|
|
—
|
|
77,785
|
|
85,903
|
|
86,434
|
|
1,542
|
|
||||||||||||||||
|
2017
|
—
|
|
—
|
|
—
|
|
—
|
|
—
|
|
48,569
|
|
50,681
|
|
2,330
|
|
||||||||||||||||
|
2018
|
—
|
|
—
|
|
—
|
|
—
|
|
—
|
|
—
|
|
45,145
|
|
12,797
|
|
||||||||||||||||
|
Total
|
|
$
|
406,431
|
|
$
|
17,287
|
|
|||||||||||||||||||||||||
|
Cumulative net losses and loss adjustment expenses paid
|
||||||||||||||||||||||||||||||||
|
Accident year
|
2012
|
2013
|
2014
|
2015
|
2016
|
2017
|
2018
|
|||||||||||||||||||||||||
|
<--------------------------------------------- Unaudited --------------------------------------------->
|
||||||||||||||||||||||||||||||||
|
2012
|
$
|
5,619
|
|
$
|
9,989
|
|
$
|
11,387
|
|
$
|
11,450
|
|
$
|
11,382
|
|
$
|
11,318
|
|
$
|
11,348
|
|
|||||||||||
|
2013
|
—
|
|
8,673
|
|
17,244
|
|
18,686
|
|
19,066
|
|
19,363
|
|
19,463
|
|
||||||||||||||||||
|
2014
|
—
|
|
—
|
|
45,766
|
|
97,651
|
|
101,626
|
|
102,868
|
|
103,379
|
|
||||||||||||||||||
|
2015
|
—
|
|
—
|
|
—
|
|
42,451
|
|
80,765
|
|
86,100
|
|
88,168
|
|
||||||||||||||||||
|
2016
|
—
|
|
—
|
|
—
|
|
—
|
|
38,059
|
|
77,511
|
|
82,556
|
|
||||||||||||||||||
|
2017
|
—
|
|
—
|
|
—
|
|
—
|
|
—
|
|
23,546
|
|
45,084
|
|
||||||||||||||||||
|
2018
|
—
|
|
—
|
|
—
|
|
—
|
|
—
|
|
—
|
|
21,182
|
|
||||||||||||||||||
|
Total
|
|
$
|
371,180
|
|
||||||||||||||||||||||||||||
|
Auto - net reserves for loss and loss adjustment expenses, end of year
|
$
|
35,251
|
|
|||||||||||||||||||||||||||||
F-36
Other Casualty
|
Loss and loss adjustment expenses incurred, net
|
||||||||||||||||||||||||||||||||
|
Accident year
|
2012
|
2013
|
2014
|
2015
|
2016
|
2017
|
2018
|
IBNR loss and LAE reserves, net
|
||||||||||||||||||||||||
|
<--------------------------------------------- Unaudited --------------------------------------------->
|
||||||||||||||||||||||||||||||||
|
2012
|
$
|
—
|
|
$
|
—
|
|
$
|
—
|
|
$
|
—
|
|
$
|
—
|
|
$
|
—
|
|
$
|
—
|
|
$
|
—
|
|
||||||||
|
2013
|
—
|
|
—
|
|
—
|
|
—
|
|
—
|
|
—
|
|
—
|
|
—
|
|
||||||||||||||||
|
2014
|
—
|
|
—
|
|
5,480
|
|
7,519
|
|
7,316
|
|
4,903
|
|
5,584
|
|
1,502
|
|
||||||||||||||||
|
2015
|
—
|
|
—
|
|
—
|
|
45,558
|
|
48,315
|
|
33,396
|
|
37,113
|
|
12,313
|
|
||||||||||||||||
|
2016
|
—
|
|
—
|
|
—
|
|
—
|
|
63,082
|
|
52,118
|
|
54,990
|
|
27,981
|
|
||||||||||||||||
|
2017
|
—
|
|
—
|
|
—
|
|
—
|
|
—
|
|
70,162
|
|
71,084
|
|
54,957
|
|
||||||||||||||||
|
2018
|
—
|
|
—
|
|
—
|
|
—
|
|
—
|
|
—
|
|
120,503
|
|
114,789
|
|
||||||||||||||||
|
Total
|
|
$
|
289,274
|
|
$
|
211,542
|
|
|||||||||||||||||||||||||
|
Cumulative net losses and loss adjustment expenses paid
|
||||||||||||||||||||||||||||||||
|
Accident year
|
2012
|
2013
|
2014
|
2015
|
2016
|
2017
|
2018
|
|||||||||||||||||||||||||
|
<--------------------------------------------- Unaudited --------------------------------------------->
|
||||||||||||||||||||||||||||||||
|
2012
|
$
|
—
|
|
$
|
—
|
|
$
|
—
|
|
$
|
—
|
|
$
|
—
|
|
$
|
—
|
|
$
|
—
|
|
|||||||||||
|
2013
|
—
|
|
—
|
|
—
|
|
—
|
|
—
|
|
—
|
|
—
|
|
||||||||||||||||||
|
2014
|
—
|
|
—
|
|
16
|
|
340
|
|
1,390
|
|
2,226
|
|
3,104
|
|
||||||||||||||||||
|
2015
|
—
|
|
—
|
|
—
|
|
310
|
|
3,612
|
|
9,053
|
|
15,781
|
|
||||||||||||||||||
|
2016
|
—
|
|
—
|
|
—
|
|
—
|
|
621
|
|
6,165
|
|
13,467
|
|
||||||||||||||||||
|
2017
|
—
|
|
—
|
|
—
|
|
—
|
|
—
|
|
1,418
|
|
6,231
|
|
||||||||||||||||||
|
2018
|
—
|
|
—
|
|
—
|
|
—
|
|
—
|
|
—
|
|
1,673
|
|
||||||||||||||||||
|
Total
|
|
$
|
40,256
|
|
||||||||||||||||||||||||||||
|
Other Casualty - net reserves for loss and loss adjustment expenses, end of year
|
$
|
249,018
|
|
|||||||||||||||||||||||||||||
F-37
Credit & Financial Lines
|
Loss and loss adjustment expenses incurred, net
|
||||||||||||||||||||||||||||||||
|
Accident year
|
2012
|
2013
|
2014
|
2015
|
2016
|
2017
|
2018
|
IBNR loss and LAE reserves, net
|
||||||||||||||||||||||||
|
<--------------------------------------------- Unaudited --------------------------------------------->
|
||||||||||||||||||||||||||||||||
|
2012
|
$
|
—
|
|
$
|
—
|
|
$
|
—
|
|
$
|
—
|
|
$
|
—
|
|
$
|
—
|
|
$
|
—
|
|
$
|
—
|
|
||||||||
|
2013
|
—
|
|
364
|
|
408
|
|
113
|
|
107
|
|
99
|
|
77
|
|
1
|
|
||||||||||||||||
|
2014
|
—
|
|
—
|
|
5,846
|
|
2,646
|
|
2,419
|
|
2,203
|
|
1,384
|
|
54
|
|
||||||||||||||||
|
2015
|
—
|
|
—
|
|
—
|
|
5,237
|
|
5,035
|
|
4,754
|
|
4,009
|
|
1,259
|
|
||||||||||||||||
|
2016
|
—
|
|
—
|
|
—
|
|
—
|
|
10,731
|
|
10,723
|
|
10,819
|
|
6,368
|
|
||||||||||||||||
|
2017
|
—
|
|
—
|
|
—
|
|
—
|
|
—
|
|
13,748
|
|
13,779
|
|
10,139
|
|
||||||||||||||||
|
2018
|
—
|
|
—
|
|
—
|
|
—
|
|
—
|
|
—
|
|
17,725
|
|
16,321
|
|
||||||||||||||||
|
Total
|
|
$
|
47,793
|
|
$
|
34,142
|
|
|||||||||||||||||||||||||
|
Cumulative net losses and loss adjustment expenses paid
|
||||||||||||||||||||||||||||||||
|
Accident year
|
2012
|
2013
|
2014
|
2015
|
2016
|
2017
|
2018
|
|||||||||||||||||||||||||
|
<--------------------------------------------- Unaudited --------------------------------------------->
|
||||||||||||||||||||||||||||||||
|
2012
|
$
|
—
|
|
$
|
—
|
|
$
|
—
|
|
$
|
—
|
|
$
|
—
|
|
$
|
—
|
|
$
|
—
|
|
|||||||||||
|
2013
|
—
|
|
—
|
|
11
|
|
66
|
|
74
|
|
78
|
|
77
|
|
||||||||||||||||||
|
2014
|
—
|
|
—
|
|
42
|
|
784
|
|
1,038
|
|
1,318
|
|
1,322
|
|
||||||||||||||||||
|
2015
|
—
|
|
—
|
|
—
|
|
402
|
|
1,128
|
|
2,045
|
|
2,328
|
|
||||||||||||||||||
|
2016
|
—
|
|
—
|
|
—
|
|
—
|
|
1,013
|
|
2,326
|
|
3,419
|
|
||||||||||||||||||
|
2017
|
—
|
|
—
|
|
—
|
|
—
|
|
—
|
|
1,100
|
|
2,332
|
|
||||||||||||||||||
|
2018
|
—
|
|
—
|
|
—
|
|
—
|
|
—
|
|
—
|
|
897
|
|
||||||||||||||||||
|
Total
|
|
$
|
10,375
|
|
||||||||||||||||||||||||||||
|
Credit & Financial Lines - net reserves for loss and loss adjustment expenses, end of year
|
$
|
37,418
|
|
|||||||||||||||||||||||||||||
F-38
Multi-line
|
Loss and loss adjustment expenses incurred, net
|
||||||||||||||||||||||||||||||||
|
Accident year
|
2012
|
2013
|
2014
|
2015
|
2016
|
2017
|
2018
|
IBNR loss and LAE reserves, net
|
||||||||||||||||||||||||
|
<--------------------------------------------- Unaudited --------------------------------------------->
|
||||||||||||||||||||||||||||||||
|
2012
|
$
|
—
|
|
$
|
—
|
|
$
|
—
|
|
$
|
—
|
|
$
|
—
|
|
$
|
—
|
|
$
|
—
|
|
$
|
—
|
|
||||||||
|
2013
|
—
|
|
23,282
|
|
4,272
|
|
4,564
|
|
4,564
|
|
4,564
|
|
4,564
|
|
—
|
|
||||||||||||||||
|
2014
|
—
|
|
—
|
|
42,787
|
|
28,445
|
|
36,489
|
|
35,570
|
|
37,350
|
|
16,913
|
|
||||||||||||||||
|
2015
|
—
|
|
—
|
|
—
|
|
47,906
|
|
88,105
|
|
106,307
|
|
106,460
|
|
29,597
|
|
||||||||||||||||
|
2016
|
—
|
|
—
|
|
—
|
|
—
|
|
84,312
|
|
120,032
|
|
115,840
|
|
30,246
|
|
||||||||||||||||
|
2017
|
—
|
|
—
|
|
—
|
|
—
|
|
—
|
|
99,702
|
|
106,817
|
|
29,281
|
|
||||||||||||||||
|
2018
|
—
|
|
—
|
|
—
|
|
—
|
|
—
|
|
—
|
|
90,156
|
|
55,443
|
|
||||||||||||||||
|
Total
|
|
$
|
461,187
|
|
$
|
161,480
|
|
|||||||||||||||||||||||||
|
Cumulative net losses and loss adjustment expenses paid
|
||||||||||||||||||||||||||||||||
|
Accident year
|
2012
|
2013
|
2014
|
2015
|
2016
|
2017
|
2018
|
|||||||||||||||||||||||||
|
<--------------------------------------------- Unaudited --------------------------------------------->
|
||||||||||||||||||||||||||||||||
|
2012
|
$
|
—
|
|
$
|
—
|
|
$
|
—
|
|
$
|
—
|
|
$
|
—
|
|
$
|
—
|
|
$
|
—
|
|
|||||||||||
|
2013
|
—
|
|
—
|
|
1,243
|
|
4,563
|
|
4,563
|
|
4,563
|
|
4,563
|
|
||||||||||||||||||
|
2014
|
—
|
|
—
|
|
1,245
|
|
10,409
|
|
20,526
|
|
18,614
|
|
20,338
|
|
||||||||||||||||||
|
2015
|
—
|
|
—
|
|
—
|
|
13,208
|
|
64,581
|
|
73,107
|
|
75,694
|
|
||||||||||||||||||
|
2016
|
—
|
|
—
|
|
—
|
|
—
|
|
30,026
|
|
75,288
|
|
83,088
|
|
||||||||||||||||||
|
2017
|
—
|
|
—
|
|
—
|
|
—
|
|
—
|
|
53,334
|
|
73,449
|
|
||||||||||||||||||
|
2018
|
—
|
|
—
|
|
—
|
|
—
|
|
—
|
|
—
|
|
30,228
|
|
||||||||||||||||||
|
Total
|
|
$
|
287,360
|
|
||||||||||||||||||||||||||||
|
Multi-line - net reserves for loss and loss adjustment expenses, end of year
|
$
|
173,827
|
|
|||||||||||||||||||||||||||||
F-39
Other Specialty
|
Loss and loss adjustment expenses incurred, net
|
||||||||||||||||||||||||||||||||
|
Accident year
|
2012
|
2013
|
2014
|
2015
|
2016
|
2017
|
2018
|
IBNR loss and LAE reserves, net
|
||||||||||||||||||||||||
|
<--------------------------------------------- Unaudited --------------------------------------------->
|
||||||||||||||||||||||||||||||||
|
2012
|
$
|
52,105
|
|
$
|
49,942
|
|
$
|
50,055
|
|
$
|
50,055
|
|
$
|
50,065
|
|
$
|
50,104
|
|
$
|
50,104
|
|
$
|
1
|
|
||||||||
|
2013
|
—
|
|
2,308
|
|
24,274
|
|
23,450
|
|
23,138
|
|
23,135
|
|
23,138
|
|
1
|
|
||||||||||||||||
|
2014
|
—
|
|
—
|
|
—
|
|
—
|
|
—
|
|
—
|
|
—
|
|
—
|
|
||||||||||||||||
|
2015
|
—
|
|
—
|
|
—
|
|
—
|
|
—
|
|
—
|
|
—
|
|
—
|
|
||||||||||||||||
|
2016
|
—
|
|
—
|
|
—
|
|
—
|
|
—
|
|
—
|
|
812
|
|
812
|
|
||||||||||||||||
|
2017
|
—
|
|
—
|
|
—
|
|
—
|
|
—
|
|
4,033
|
|
3,544
|
|
3,283
|
|
||||||||||||||||
|
2018
|
—
|
|
—
|
|
—
|
|
—
|
|
—
|
|
—
|
|
6,213
|
|
5,256
|
|
||||||||||||||||
|
Total
|
|
$
|
83,811
|
|
$
|
9,353
|
|
|||||||||||||||||||||||||
|
Cumulative net losses and loss adjustment expenses paid
|
||||||||||||||||||||||||||||||||
|
Accident year
|
2012
|
2013
|
2014
|
2015
|
2016
|
2017
|
2018
|
|||||||||||||||||||||||||
|
<--------------------------------------------- Unaudited --------------------------------------------->
|
||||||||||||||||||||||||||||||||
|
2012
|
$
|
2,666
|
|
$
|
48,455
|
|
$
|
50,024
|
|
$
|
50,025
|
|
$
|
50,067
|
|
$
|
50,103
|
|
$
|
50,103
|
|
|||||||||||
|
2013
|
—
|
|
—
|
|
22,232
|
|
23,138
|
|
23,134
|
|
23,135
|
|
23,137
|
|
||||||||||||||||||
|
2014
|
—
|
|
—
|
|
—
|
|
—
|
|
—
|
|
—
|
|
—
|
|
||||||||||||||||||
|
2015
|
—
|
|
—
|
|
—
|
|
—
|
|
—
|
|
—
|
|
—
|
|
||||||||||||||||||
|
2016
|
—
|
|
—
|
|
—
|
|
—
|
|
—
|
|
—
|
|
—
|
|
||||||||||||||||||
|
2017
|
—
|
|
—
|
|
—
|
|
—
|
|
—
|
|
4
|
|
261
|
|
||||||||||||||||||
|
2018
|
—
|
|
—
|
|
—
|
|
—
|
|
—
|
|
—
|
|
957
|
|
||||||||||||||||||
|
Total
|
|
$
|
74,458
|
|
||||||||||||||||||||||||||||
|
Other Specialty - net reserves for loss and loss adjustment expenses, end of year
|
$
|
9,353
|
|
|||||||||||||||||||||||||||||
Property and Casualty Reinsurance - Retroactive Reinsurance Contracts
The Company writes reinsurance contracts that provide limited protection against adverse development on loss originating from multiple accident years. The Company has other retroactive exposure within contracts that provide primarily prospective coverage. These contracts are included in the prospective reinsurance tables above. These contracts are typically part of prospective reinsurance contracts with a small portion of retroactive exposure resulting from the delay between the dates when the relevant contract was bound and the dates on which each incepted. The information below includes loss and loss adjustment expenses incurred, net and loss and loss adjustment expenses paid, net, by accident year for the Company's retroactive reinsurance contracts presented by year of inception of the retroactive reinsurance contracts.
The Company's estimate for loss and loss adjustment expenses incurred, net, at inception of all retroactive reinsurance contracts entered into to date was the same when the contract incepted and at the relevant year end position. As a result, there was no development in the year of inception for any of the Company's retroactive reinsurance contracts written to date. In addition, there were no loss and loss adjustment expenses paid, net, at inception of the Company's retroactive reinsurance contracts. The information related to loss and loss adjustment expenses incurred, net and net loss and loss adjustment expenses paid for the years ended December 31, 2012 through
2017
is presented as supplementary information and is unaudited.
Retroactive contracts incepting in the year ended December 31, 2012
The Company did not enter into any retroactive reinsurance contracts during the year ended December 31, 2012.
F-40
Retroactive contracts incepting in the year ended December 31, 2013
|
Loss and loss adjustment expenses incurred, net
|
|||||||||||||||||||||||||||||||
|
Accident year
|
2013
|
2014
|
2015
|
2016
|
2017
|
2018
|
IBNR loss and LAE reserves, net
|
||||||||||||||||||||||||
|
<------------------------------------- Unaudited ------------------------------------->
|
|||||||||||||||||||||||||||||||
|
2009
|
$
|
—
|
|
$
|
—
|
|
$
|
—
|
|
$
|
—
|
|
$
|
—
|
|
$
|
—
|
|
$
|
—
|
|
||||||||||
|
2010
|
914
|
|
704
|
|
704
|
|
704
|
|
704
|
|
704
|
|
—
|
|
|||||||||||||||||
|
2011
|
5,419
|
|
4,173
|
|
4,173
|
|
4,173
|
|
4,173
|
|
4,173
|
|
—
|
|
|||||||||||||||||
|
2012
|
10,197
|
|
7,853
|
|
7,853
|
|
7,853
|
|
7,853
|
|
7,853
|
|
—
|
|
|||||||||||||||||
|
2013
|
4,908
|
|
3,779
|
|
3,779
|
|
3,779
|
|
3,779
|
|
3,779
|
|
—
|
|
|||||||||||||||||
|
2014
|
—
|
|
—
|
|
—
|
|
—
|
|
—
|
|
—
|
|
—
|
|
|||||||||||||||||
|
2015
|
—
|
|
—
|
|
—
|
|
—
|
|
—
|
|
—
|
|
—
|
|
|||||||||||||||||
|
2016
|
—
|
|
—
|
|
—
|
|
—
|
|
—
|
|
—
|
|
—
|
|
|||||||||||||||||
|
2017
|
—
|
|
—
|
|
—
|
|
—
|
|
—
|
|
—
|
|
—
|
|
|||||||||||||||||
|
2018
|
—
|
|
—
|
|
—
|
|
—
|
|
—
|
|
—
|
|
—
|
|
—
|
|
|||||||||||||||
|
Total
|
|
|
$
|
16,509
|
|
$
|
—
|
|
|||||||||||||||||||||||
|
Cumulative net loss and loss adjustment expenses paid
|
|||||||||||||||||||||||||||||||
|
Accident year
|
2013
|
2014
|
2015
|
2016
|
2017
|
2018
|
|||||||||||||||||||||||||
|
<------------------------------------- Unaudited ------------------------------------->
|
|||||||||||||||||||||||||||||||
|
2009
|
$
|
—
|
|
$
|
—
|
|
$
|
—
|
|
$
|
—
|
|
$
|
—
|
|
$
|
—
|
|
|||||||||||||
|
2010
|
—
|
|
279
|
|
704
|
|
704
|
|
704
|
|
704
|
|
|||||||||||||||||||
|
2011
|
—
|
|
1,654
|
|
4,173
|
|
4,173
|
|
4,173
|
|
4,173
|
|
|||||||||||||||||||
|
2012
|
—
|
|
3,113
|
|
7,853
|
|
7,853
|
|
7,853
|
|
7,853
|
|
|||||||||||||||||||
|
2013
|
—
|
|
1,498
|
|
3,779
|
|
3,779
|
|
3,779
|
|
3,779
|
|
|||||||||||||||||||
|
2014
|
—
|
|
—
|
|
—
|
|
—
|
|
—
|
|
—
|
|
|||||||||||||||||||
|
2015
|
—
|
|
—
|
|
—
|
|
—
|
|
—
|
|
—
|
|
|||||||||||||||||||
|
2016
|
—
|
|
—
|
|
—
|
|
—
|
|
—
|
|
—
|
|
|||||||||||||||||||
|
2017
|
—
|
|
—
|
|
—
|
|
—
|
|
—
|
|
—
|
|
|||||||||||||||||||
|
2018
|
—
|
|
—
|
|
—
|
|
—
|
|
—
|
|
—
|
|
—
|
|
—
|
|
|||||||||||||||
|
Total
|
|
$
|
16,509
|
|
|||||||||||||||||||||||||||
|
Net reserves for loss and loss adjustment expenses from 2009 to 2018
|
—
|
|
|||||||||||||||||||||||||||||
|
Net reserves for loss and loss adjustment expenses prior to 2009
|
11,425
|
|
|||||||||||||||||||||||||||||
|
Retroactive contracts incepting in the year ended December 31, 2013 - net reserves for loss and loss adjustment expenses, end of year
|
$
|
11,425
|
|
||||||||||||||||||||||||||||
F-41
Retroactive contracts incepting in the year ended December 31, 2014
|
Loss and loss adjustment expenses incurred, net
|
||||||||||||||||||||||||||
|
Accident year
|
2014
|
2015
|
2016
|
2017
|
2018
|
IBNR loss and LAE reserves, net
|
||||||||||||||||||||
|
<--------------------------- Unaudited --------------------------->
|
||||||||||||||||||||||||||
|
2009
|
$
|
382
|
|
$
|
—
|
|
$
|
—
|
|
$
|
—
|
|
$
|
—
|
|
$
|
—
|
|
||||||||
|
2010
|
444
|
|
—
|
|
—
|
|
—
|
|
—
|
|
—
|
|
||||||||||||||
|
2011
|
4,239
|
|
3,455
|
|
3,057
|
|
3,252
|
|
2,884
|
|
2,884
|
|
||||||||||||||
|
2012
|
12,173
|
|
10,794
|
|
9,553
|
|
10,162
|
|
9,011
|
|
9,011
|
|
||||||||||||||
|
2013
|
18,907
|
|
16,929
|
|
14,982
|
|
15,938
|
|
14,132
|
|
14,132
|
|
||||||||||||||
|
2014
|
10,700
|
|
9,590
|
|
8,487
|
|
9,028
|
|
8,005
|
|
8,005
|
|
||||||||||||||
|
2015
|
—
|
|
—
|
|
—
|
|
—
|
|
—
|
|
—
|
|
||||||||||||||
|
2016
|
—
|
|
—
|
|
—
|
|
—
|
|
—
|
|
—
|
|
||||||||||||||
|
2017
|
—
|
|
—
|
|
—
|
|
—
|
|
—
|
|
—
|
|
||||||||||||||
|
2018
|
—
|
|
—
|
|
—
|
|
—
|
|
—
|
|
—
|
|
—
|
|
||||||||||||
|
Total
|
|
$
|
34,032
|
|
$
|
34,032
|
|
|||||||||||||||||||
|
Cumulative net loss and loss adjustment expenses paid
|
||||||||||||||||||||||||||
|
Accident year
|
2014
|
2015
|
2016
|
2017
|
2018
|
|||||||||||||||||||||
|
<--------------------------- Unaudited --------------------------->
|
||||||||||||||||||||||||||
|
2009
|
$
|
—
|
|
$
|
—
|
|
$
|
—
|
|
$
|
—
|
|
$
|
—
|
|
|||||||||||
|
2010
|
—
|
|
—
|
|
—
|
|
—
|
|
—
|
|
||||||||||||||||
|
2011
|
—
|
|
—
|
|
—
|
|
—
|
|
—
|
|
||||||||||||||||
|
2012
|
—
|
|
—
|
|
—
|
|
—
|
|
—
|
|
||||||||||||||||
|
2013
|
—
|
|
—
|
|
—
|
|
—
|
|
—
|
|
||||||||||||||||
|
2014
|
—
|
|
—
|
|
—
|
|
—
|
|
—
|
|
||||||||||||||||
|
2015
|
—
|
|
—
|
|
—
|
|
—
|
|
—
|
|
||||||||||||||||
|
2016
|
—
|
|
—
|
|
—
|
|
—
|
|
—
|
|
||||||||||||||||
|
2017
|
—
|
|
—
|
|
—
|
|
—
|
|
—
|
|
||||||||||||||||
|
2018
|
—
|
|
—
|
|
—
|
|
—
|
|
—
|
|
—
|
|
||||||||||||||
|
Total
|
$
|
—
|
|
|||||||||||||||||||||||
|
Net reserves for loss and loss adjustment expenses from 2009 to 2018
|
34,032
|
|
||||||||||||||||||||||||
|
Net reserves for loss and loss adjustment expenses prior to 2009
|
—
|
|
||||||||||||||||||||||||
|
Retroactive contracts incepting in the year ended December 31, 2014 - net reserves for loss and loss adjustment expenses, end of year
|
$
|
34,032
|
|
|||||||||||||||||||||||
F-42
Retroactive contracts incepting in the year ended December 31, 2015
|
Loss and loss adjustment expenses incurred, net
|
||||||||||||||||||||||
|
Accident year
|
2015
|
2016
|
2017
|
2018
|
IBNR loss and LAE reserves, net
|
|||||||||||||||||
|
<---------------- Unaudited ---------------->
|
||||||||||||||||||||||
|
2009
|
$
|
2,510
|
|
$
|
2,510
|
|
$
|
1,729
|
|
$
|
1,349
|
|
$
|
1,349
|
|
|||||||
|
2010
|
5,273
|
|
5,263
|
|
3,856
|
|
3,484
|
|
3,484
|
|
||||||||||||
|
2011
|
10,029
|
|
10,003
|
|
7,500
|
|
7,115
|
|
7,115
|
|
||||||||||||
|
2012
|
14,726
|
|
14,682
|
|
11,131
|
|
10,793
|
|
10,793
|
|
||||||||||||
|
2013
|
18,152
|
|
18,097
|
|
13,738
|
|
13,355
|
|
13,355
|
|
||||||||||||
|
2014
|
39,978
|
|
39,847
|
|
30,486
|
|
30,084
|
|
30,084
|
|
||||||||||||
|
2015
|
2,596
|
|
2,596
|
|
1,788
|
|
1,393
|
|
1,393
|
|
||||||||||||
|
2016
|
—
|
|
—
|
|
—
|
|
—
|
|
—
|
|
||||||||||||
|
2017
|
—
|
|
—
|
|
—
|
|
—
|
|
—
|
|
||||||||||||
|
2018
|
—
|
|
—
|
|
—
|
|
—
|
|
—
|
|
—
|
|
||||||||||
|
Total
|
|
$
|
67,573
|
|
$
|
67,573
|
|
|||||||||||||||
|
Cumulative net loss and loss adjustment expenses paid
|
||||||||||||||||||||||
|
Accident year
|
2015
|
2016
|
2017
|
2018
|
||||||||||||||||||
|
<---------------- Unaudited ---------------->
|
||||||||||||||||||||||
|
2009
|
$
|
—
|
|
$
|
—
|
|
$
|
—
|
|
$
|
—
|
|
||||||||||
|
2010
|
—
|
|
—
|
|
—
|
|
—
|
|
||||||||||||||
|
2011
|
—
|
|
—
|
|
—
|
|
—
|
|
||||||||||||||
|
2012
|
—
|
|
—
|
|
—
|
|
—
|
|
||||||||||||||
|
2013
|
—
|
|
—
|
|
—
|
|
—
|
|
||||||||||||||
|
2014
|
—
|
|
—
|
|
—
|
|
—
|
|
||||||||||||||
|
2015
|
—
|
|
—
|
|
—
|
|
—
|
|
||||||||||||||
|
2016
|
—
|
|
—
|
|
—
|
|
—
|
|
||||||||||||||
|
2017
|
—
|
|
—
|
|
—
|
|
—
|
|
||||||||||||||
|
2018
|
—
|
|
—
|
|
—
|
|
—
|
|
||||||||||||||
|
Total
|
$
|
—
|
|
|||||||||||||||||||
|
Net reserves for loss and loss adjustment expenses from 2009 to 2018
|
67,573
|
|
||||||||||||||||||||
|
Net reserves for loss and loss adjustment expenses prior to 2009
|
1,336
|
|
||||||||||||||||||||
|
Retroactive contracts incepting in the year ended December 31, 2015 - net reserves for loss and loss adjustment expenses, end of year
|
$
|
68,909
|
|
|||||||||||||||||||
F-43
Retroactive contracts incepting in the year ended December 31, 2016
The Company did not enter into any retroactive reinsurance contracts during the year ended December 31, 2016.
Retroactive contracts incepting in the year ended December 31, 2017
|
Loss and loss adjustment expenses incurred, net
|
|||||||||||||
|
Accident year
|
2017
|
2018
|
IBNR loss and LAE reserves, net
|
||||||||||
|
Unaudited
|
|||||||||||||
|
2009
|
$
|
317
|
|
$
|
247
|
|
$
|
247
|
|
||||
|
2010
|
438
|
|
365
|
|
365
|
|
|||||||
|
2011
|
1,605
|
|
1,496
|
|
1,496
|
|
|||||||
|
2012
|
2,123
|
|
2,007
|
|
2,007
|
|
|||||||
|
2013
|
3,260
|
|
3,101
|
|
3,101
|
|
|||||||
|
2014
|
9,281
|
|
8,952
|
|
8,952
|
|
|||||||
|
2015
|
12,205
|
|
11,748
|
|
11,748
|
|
|||||||
|
2016
|
23,090
|
|
22,349
|
|
22,349
|
|
|||||||
|
2017
|
47,235
|
|
46,165
|
|
46,165
|
|
|||||||
|
2018
|
—
|
|
—
|
|
—
|
|
|||||||
|
Total
|
|
$
|
96,430
|
|
$
|
96,430
|
|
||||||
|
Cumulative net loss and loss adjustment expenses paid
|
|||||||||||||
|
Accident year
|
2017
|
2018
|
|||||||||||
|
Unaudited
|
|||||||||||||
|
2009
|
$
|
—
|
|
$
|
—
|
|
|||||||
|
2010
|
—
|
|
—
|
|
|||||||||
|
2011
|
—
|
|
—
|
|
|||||||||
|
2012
|
—
|
|
—
|
|
|||||||||
|
2013
|
—
|
|
—
|
|
|||||||||
|
2014
|
—
|
|
—
|
|
|||||||||
|
2015
|
—
|
|
—
|
|
|||||||||
|
2016
|
—
|
|
—
|
|
|||||||||
|
2017
|
—
|
|
—
|
|
|||||||||
|
2018
|
—
|
|
—
|
|
|||||||||
|
Total
|
$
|
—
|
|
||||||||||
|
Net reserves for loss and loss adjustment expenses from 2009 to 2018
|
96,430
|
|
|||||||||||
|
Net reserves for loss and loss adjustment expenses prior to 2009
|
143
|
|
|||||||||||
|
Retroactive contracts incepting in the year ended December 31, 2017 - net reserves for loss and loss adjustment expenses, end of year
|
$
|
96,573
|
|
||||||||||
F-44
Retroactive contracts incepting in the year ended December 31, 2018
|
Loss and loss adjustment expenses incurred, net
|
|||||||||
|
Accident year
|
2018
|
IBNR loss and LAE reserves, net
|
|||||||
|
2009
|
$
|
202
|
|
$
|
202
|
|
|||
|
2010
|
221
|
|
221
|
|
|||||
|
2011
|
199
|
|
199
|
|
|||||
|
2012
|
432
|
|
432
|
|
|||||
|
2013
|
2,161
|
|
2,161
|
|
|||||
|
2014
|
5,623
|
|
5,623
|
|
|||||
|
2015
|
12,334
|
|
12,334
|
|
|||||
|
2016
|
18,783
|
|
18,783
|
|
|||||
|
2017
|
16,679
|
|
16,679
|
|
|||||
|
2018
|
14,375
|
|
14,375
|
|
|||||
|
Total
|
$
|
71,009
|
|
$
|
71,009
|
|
|||
|
Cumulative net loss and loss adjustment expenses paid
|
|||||||||
|
Accident year
|
2018
|
||||||||
|
2009
|
$
|
—
|
|
||||||
|
2010
|
—
|
|
|||||||
|
2011
|
—
|
|
|||||||
|
2012
|
—
|
|
|||||||
|
2013
|
—
|
|
|||||||
|
2014
|
—
|
|
|||||||
|
2015
|
—
|
|
|||||||
|
2016
|
—
|
|
|||||||
|
2017
|
—
|
|
|||||||
|
2018
|
—
|
|
|||||||
|
Total
|
$
|
—
|
|
||||||
|
Net reserves for loss and loss adjustment expenses from 2009 to 2018
|
71,009
|
|
|||||||
|
Net reserves for loss and loss adjustment expenses prior to 2009
|
123
|
|
|||||||
|
Retroactive contracts incepting in the year ended December 31, 2018 - net reserves for loss and loss adjustment expenses, end of year
|
$
|
71,132
|
|
||||||
F-45
Reconciliation of loss development information to loss and loss adjustment expense reserves
The following table provides a reconciliation of the Company's loss and loss expense reserves as of
December 31, 2018
:
|
2018
|
|||
|
Prospective reinsurance contracts
|
|||
|
Property
|
$
|
49,649
|
|
|
Workers’ Compensation
|
94,692
|
|
|
|
Auto
|
35,251
|
|
|
|
Other Casualty
|
249,018
|
|
|
|
Credit & Financial Lines
|
37,418
|
|
|
|
Multi-line
|
173,827
|
|
|
|
Other Specialty
|
9,353
|
|
|
|
Retroactive reinsurance contracts
|
|||
|
Retroactive contracts incepting in the year ended December 31, 2012
|
—
|
|
|
|
Retroactive contracts incepting in the year ended December 31, 2013
|
11,425
|
|
|
|
Retroactive contracts incepting in the year ended December 31, 2014
|
34,032
|
|
|
|
Retroactive contracts incepting in the year ended December 31, 2015
|
68,909
|
|
|
|
Retroactive contracts incepting in the year ended December 31, 2016
|
—
|
|
|
|
Retroactive contracts incepting in the year ended December 31, 2017
|
96,573
|
|
|
|
Retroactive contracts incepting in the year ended December 31, 2018
|
71,132
|
|
|
|
Net reserves for loss and loss adjustment expenses, end of year
|
931,279
|
|
|
|
Loss and loss adjustment expenses recoverable
|
|||
|
Property
|
2,031
|
|
|
|
Deferred charges on retroactive reinsurance contracts
|
3,847
|
|
|
|
Gross reserves for loss and loss adjustment expenses, end of year
|
$
|
937,157
|
|
Cumulative claims frequency
The Company determined that the disclosure of claim frequency analysis was impracticable. As a result, no claims frequency information has been disclosed. The Company’s business is primarily comprised of reinsurance contracts written on a quota share or aggregate loss basis and the underlying claim count information is not provided for most contracts. Furthermore, even if claim counts were made available by the Company’s cedents, the quota share cession percentage varies for each contract, resulting in the cedent claim counts not being a meaningful measure of the Company’s loss exposure.
F-46
Claims duration
The following table is presented as supplementary information and presents the Company’s historical average annual percentage payout of loss and loss adjustment expenses incurred, net by age, as of
December 31, 2018
:
|
Year 1
|
Year 2
|
Year 3
|
Year 4
|
Year 5
|
Year 6
|
Year 7
|
||||||||||||||
|
(Unaudited)
|
||||||||||||||||||||
|
Prospective reinsurance contracts
|
||||||||||||||||||||
|
Property
|
49.2
|
%
|
30.2
|
%
|
8.7
|
%
|
5.2
|
%
|
2.1
|
%
|
1.0
|
%
|
0.9
|
%
|
||||||
|
Workers’ Compensation
|
8.4
|
%
|
20.9
|
%
|
23.4
|
%
|
17.2
|
%
|
11.7
|
%
|
1.7
|
%
|
5.3
|
%
|
||||||
|
Auto
|
46.1
|
%
|
43.9
|
%
|
7.1
|
%
|
1.5
|
%
|
0.5
|
%
|
—
|
%
|
0.3
|
%
|
||||||
|
Other Casualty
|
1.1
|
%
|
7.9
|
%
|
15.6
|
%
|
16.5
|
%
|
15.7
|
%
|
n/a
|
|
n/a
|
|
||||||
|
Credit & Financial Lines
|
5.9
|
%
|
21.4
|
%
|
30.7
|
%
|
12.7
|
%
|
2.7
|
%
|
(1.4
|
)%
|
n/a
|
|
||||||
|
Multi-line
|
20.9
|
%
|
31.6
|
%
|
28.6
|
%
|
(0.9
|
)%
|
2.3
|
%
|
—
|
%
|
n/a
|
|
||||||
|
Other Specialty
|
4.2
|
%
|
48.7
|
%
|
2.3
|
%
|
—
|
%
|
—
|
%
|
—
|
%
|
—
|
%
|
||||||
|
Retroactive reinsurance contracts
|
||||||||||||||||||||
|
Retroactive contracts incepting in the year ended December 31, 2012
|
n/a
|
|
n/a
|
|
n/a
|
|
n/a
|
|
n/a
|
|
n/a
|
|
n/a
|
|
||||||
|
Retroactive contracts incepting in the year ended December 31, 2013
|
4.3
|
%
|
23.5
|
%
|
31.2
|
%
|
4.6
|
%
|
3.4
|
%
|
2.6
|
%
|
n/a
|
|
||||||
|
Retroactive contracts incepting in the year ended December 31, 2014
|
—
|
%
|
—
|
%
|
—
|
%
|
—
|
%
|
—
|
%
|
n/a
|
|
n/a
|
|
||||||
|
Retroactive contracts incepting in the year ended December 31, 2015
|
—
|
%
|
—
|
%
|
—
|
%
|
—
|
%
|
n/a
|
|
n/a
|
|
n/a
|
|
||||||
|
Retroactive contracts incepting in the year ended December 31, 2016
|
n/a
|
|
n/a
|
|
n/a
|
|
n/a
|
|
n/a
|
|
n/a
|
|
n/a
|
|
||||||
|
Retroactive contracts incepting in the year ended December 31, 2017
|
—
|
%
|
—
|
%
|
n/a
|
|
n/a
|
|
n/a
|
|
n/a
|
|
n/a
|
|
||||||
|
Retroactive contracts incepting in the year ended December 31, 2018
|
—
|
%
|
n/a
|
|
n/a
|
|
n/a
|
|
n/a
|
|
n/a
|
|
n/a
|
|
||||||
The Company was incorporated on October 6, 2011, commenced underwriting operations in January 2012 and predominantly writes a mix of personal and commercial lines. As a result, the Company has limited historical data and is unable to present a full cycle of claim payments.
10. Reinsurance premiums ceded
From time to time, the Company purchases retrocessional coverage for one or more of the following reasons: to manage its overall exposure, to reduce its net liability on individual risks, to obtain additional underwriting capacity and to balance its underwriting portfolio. Additionally, retrocession can be used as a mechanism to share the risks and rewards of business written and therefore can be used as a tool to align the Company’s interests with those of its counterparties. In the year ended
December 31, 2018
, the Company entered into a quota share contract that provides coverage for recovery of a portion of its mortgage assumed reinsurance contracts. Premiums ceded for the years ended
December 31, 2018
,
2017
and
2016
were
$19.9 million
,
$2.5 million
and
$2.3 million
, respectively. Loss and loss adjustment expenses recoverable from the retrocessionaire are recorded as assets. Retrocession contracts do not relieve the Company from its obligations to the insureds. Failure of retrocessionaires to honor their obligations could result in losses to the Company. As of
December 31, 2018
, the Company had loss and loss adjustment expenses recoverable of
$2.0 million
(December 31,
2017
-
$1.1 million
). The Company generally obtains retrocessional coverage from companies rated “A-” or better by A.M. Best Company, Inc. unless the retrocessionaire’s obligations are collateralized.
F-47
11. Management and performance fees
Prior to the change in the Company’s investment account structure described in
Note 4
, Third Point Re, Third Point Re BDA, TPRUSA and Third Point Re USA were parties to the
JV Agreements
with Third Point LLC and TP GP under which Third Point LLC managed certain jointly held assets. Effective August 31, 2018, Third Point Re, Third Point Re BDA and Third Point Re USA entered into the 2018 LPA with TP GP, pursuant to which Third Point Re BDA and Third Point Re USA invested in the TP Fund.
Management fees
Pursuant to both the
JV Agreements
and the 2018 LPA, Third Point LLC is entitled to receive monthly management fees. Prior to the change in the Company’s investment account structure, management fees were calculated based on
1.5%
, (
2.0%
up to December 22, 2016), of net investments managed by Third Point LLC. As a result of the 2018 LPA effective August 31, 2018, management fees are charged at the TP Fund level and are calculated based on
1.5%
of the investment in TP Fund and multiplied by an exposure multiplier computed by dividing the average daily investment exposure leverage of the TP Fund by the average daily investment exposure leverage of the Third Point Offshore Master Fund L.P. (“Offshore Master Fund”). Third Point LLC also serves as the investment manager for the Offshore Master Fund.
Performance fees
Pursuant to both the
JV Agreements
and the 2018 LPA, TP GP receives a performance fee allocation. Prior to the change in the Company’s investment account structure, the performance fee allocation was equal to
20%
of the net investment income of the applicable company’s share of the net investment assets managed by Third Point LLC. As a result of the 2018 LPA effective August 31, 2018, the performance fee allocation is equal to
20%
of the Company’s investment income in the related party investment fund.
Prior to the change in the investment account structure, the performance fee accrued on net investment income was included in liabilities as a performance fee payable to related party during the period, unless funds were redeemed from the TPRE Limited Partners’ accounts, in which case, the proportionate share of performance fee associated with the redemption amount was earned and allocated to TP GP’s capital account and recorded as an increase in noncontrolling interests in related party. At the end of each year, the remaining portion of the performance fee payable that had not been included in noncontrolling interests in related party was earned and then allocated to TP GP’s capital account.
As a result of the 2018 LPA effective August 31, 2018, the performance fee is included as part of “Investment in related party investment fund” on the Company’s consolidated balance sheet since the fees are charged at the TP Fund level.
The performance fee is subject to a loss carryforward provision pursuant to which TP GP is required to maintain a loss recovery account, which represents the sum of all prior period net loss amounts, not offset by prior year net profit amounts, and that is allocated to future profit amounts until the loss recovery account has returned to a positive balance. Until such time, no performance fees are payable. As of
December 31, 2018
, the Loss Recovery Account for Third Point Re BDA’s investment in TP Fund was
$46.8 million
and for Third Point Re USA’s investment in TP Fund was
$3.8 million
(December 31,
2017
-
$nil
). These amounts have not been recorded in the Company’s consolidated balance sheets.
For the year ended
December 31, 2018
, management and performance fees to related parties in the
consolidated statements of income (loss)
include activity in the separate accounts up to the date of change in the investment account structure. As a result of the 2018 LPA effective August 31, 2018, management and performance fees for the remainder of the year ended
December 31, 2018
are presented within net investment income from investment in related party investment fund in the
consolidated statements of income (loss)
.
F-48
The total management and performance fees to related parties, including our share of fees paid in connection with our investment in TP Fund, for the years ended
December 31, 2018
,
2017
and
2016
were as follows:
|
2018
|
2017
|
2016
|
|||||||||
|
Management fees - Third Point LLC
|
$
|
25,797
|
|
$
|
36,733
|
|
$
|
7,110
|
|
||
|
Management fees - Founders
(1)
|
—
|
|
—
|
|
35,321
|
|
|||||
|
Performance fees - Third Point Advisors LLC (before loss carryforward)
(2)
|
4,048
|
|
93,978
|
|
23,475
|
|
|||||
|
Performance fees - loss carryforward
|
—
|
|
—
|
|
(6,199
|
)
|
|||||
|
Management and performance fees to related parties as reported in the Company’s consolidated statement of income
|
29,845
|
|
130,711
|
|
59,707
|
|
|||||
|
Management and performance fees included in net investment loss from investment in related party investment fund
(2)
|
7,376
|
|
—
|
|
—
|
|
|||||
|
Total management and performance fees to related parties
|
$
|
37,221
|
|
$
|
130,711
|
|
$
|
59,707
|
|
||
(1) KEP TP Bermuda Ltd., KIA TP Bermuda Ltd., Pine Brook LVR, L.P., P RE Opportunities Ltd. and Dowling Capital Partners I, L.P., collectively the “Founders”, received a share of the management fees in proportion to their initial investments in Third Point Re until December 22, 2016.
(2) On the date when the Company’s investments were transferred to TP Fund,
$3.4 million
of performance fees payable to TP GP were also transferred to TP Fund. As a result of the investment loss in the subsequent period, a reduction of
$3.4 million
in performance fee is included in management and performance fees included in net investment loss from investment in related party investment fund.
As of
December 31, 2017
,
$94.0 million
related to performance fees earned by TP GP were included in noncontrolling interests in related party. See
Note 19
for additional information.
12. Deposit accounted contracts
The following table represents activity in the deposit contacts for the years ended
December 31, 2018
,
2017
and
2016
:
|
2018
|
2017
|
2016
|
|||||||||
|
Balance, beginning of year
|
$
|
129,133
|
|
$
|
104,905
|
|
$
|
83,955
|
|
||
|
Consideration received
|
17,879
|
|
22,658
|
|
22,463
|
|
|||||
|
Consideration receivable
|
7,390
|
|
2,080
|
|
—
|
|
|||||
|
Net investment expense (income) allocation
|
(1,273
|
)
|
2,800
|
|
(164
|
)
|
|||||
|
Payments
|
(8,089
|
)
|
(3,545
|
)
|
(915
|
)
|
|||||
|
Foreign currency translation
|
302
|
|
235
|
|
(434
|
)
|
|||||
|
Balance, end of year
|
$
|
145,342
|
|
$
|
129,133
|
|
$
|
104,905
|
|
||
13. Senior Notes payable and letter of credit facilities
Senior Notes payable
As of
December 31, 2018
, TPRUSA had outstanding debt obligations consisting of an aggregate principal amount of
$115.0 million
of senior unsecured notes (the “Notes”) due February 13, 2025. The Notes bear interest at
7.0%
and interest is payable semi-annually on February 13 and August 13 of each year. The Notes are fully and unconditionally guaranteed by Third Point Re, and, in certain circumstances specified in the indenture governing the Notes, certain existing or future subsidiaries of the Company may be required to guarantee the Notes. As of
December 31, 2018
, the Company had capitalized
$1.1 million
of costs associated with the Notes, which are presented as a direct deduction from the principal amount of the Notes on the consolidated balance sheets. As of
December 31, 2018
, the Notes had an estimated fair value of
$114.7 million
(December 31,
2017
-
$116.7 million
). The fair value measurements were based on observable inputs and therefore were considered to be Level 2. The Company was in compliance with all debt covenants as of
December 31, 2018
and
2017
.
F-49
Letters of credit
As of
December 31, 2018
, the Company had entered into the following letter of credit facilities:
|
Letters of Credit
|
Collateral
|
|||||||||||
|
Committed Capacity
|
Issued
|
Cash and Cash Equivalents
|
||||||||||
|
Unsecured syndicated credit facility (1)
|
$
|
200,000
|
|
—
|
|
$
|
145,249
|
|
n/a
|
|
||
|
Committed - Secured letters of credit facilities
|
125,000
|
|
59,564
|
|
59,564
|
|
||||||
|
Uncommitted - Secured letters of credit facilities (2)
|
n/a
|
|
144,389
|
|
144,389
|
|
||||||
|
|
|
$
|
349,202
|
|
$
|
203,953
|
|
|||||
|
(1)
|
On July 31, 2018, Third Point Re, Third Point Re BDA and Third Point Re USA entered into an Unsecured Revolving Credit and Letter of Credit Facility Agreement (the “Credit Agreement”) with SunTrust Bank, SunTrust Robinson Humphrey, Inc., RBC Capital Markets and ING Capital. The Credit Agreement provides for the issuance of up to
$200.0 million
of letters of credit to support obligations in connection with the reinsurance business of Third Point Re BDA and Third Point Re USA. The Credit Agreement is fully and unconditionally guaranteed by Third Point Reinsurance Ltd.
|
|
(2)
|
On December 28, 2018, Third Point Re BDA and Third Point Re USA amended its facilities with Citibank under which, the previous committed letter of credit facility agreements for
$300.0 million
were amended to uncommitted facilities.
|
The Company’s secured letter of credit facilities are bilateral agreements that generally renew on an annual basis. The letters of credit issued under the secured letter of credit facilities are fully collateralized. The syndicated unsecured letter of credit facility expires on July 30, 2019. See
Note 3
for additional information.
14. Net investment income (loss)
Net investment income (loss)
for the years ended
December 31, 2018
,
2017
and
2016
consisted of the following:
|
2018
|
2017
|
2016
|
|||||||||
|
Net investment income (loss) by type
|
|
||||||||||
|
Net realized gains on investments and investment derivatives
|
$
|
446,646
|
|
$
|
228,628
|
|
$
|
33,624
|
|
||
|
Net change in unrealized gains (losses) on investments and investment derivatives
|
(412,650
|
)
|
251,496
|
|
71,704
|
|
|||||
|
Net gains (losses) on foreign currencies
|
(7,305
|
)
|
6,441
|
|
(2,557
|
)
|
|||||
|
Dividend and interest income
|
53,523
|
|
65,896
|
|
77,160
|
|
|||||
|
Dividends paid on securities sold, not yet purchased
|
(5,259
|
)
|
(5,724
|
)
|
(1,977
|
)
|
|||||
|
Other expenses
|
(15,696
|
)
|
(24,073
|
)
|
(19,422
|
)
|
|||||
|
Management and performance fees to related parties
|
(29,845
|
)
|
(130,711
|
)
|
(59,707
|
)
|
|||||
|
Net investment loss from investment in related party investment fund (1)
|
(280,847
|
)
|
—
|
|
—
|
|
|||||
|
Net investment income (loss)
|
$
|
(251,433
|
)
|
$
|
391,953
|
|
$
|
98,825
|
|
||
|
(1)
|
Effective August 31, 2018, Third Point Re, Third Point Re BDA and Third Point Re USA entered into the 2018 LPA to invest in TP Fund. As a result, the management and performance fees are presented within net investment income from investment in related party investment fund from the effective date of the transition. See Notes
4
and
11
for additional information regarding the 2018 LPA and related management and performance fees.
|
F-50
The following table provides an additional breakdown of our
net investment income
by asset and liability type for the years ended
December 31, 2018
,
2017
and
2016
:
|
2018
|
2017
|
2016
|
|||||||||
|
Net investment income (loss) by asset type
|
|||||||||||
|
Equity securities
|
$
|
70,646
|
|
$
|
467,527
|
|
$
|
78,955
|
|
||
|
Private common equity securities
|
(401
|
)
|
(6
|
)
|
333
|
|
|||||
|
Private preferred equity securities
|
(2,680
|
)
|
5,764
|
|
4,146
|
|
|||||
|
Total equities
|
67,565
|
|
473,285
|
|
83,434
|
|
|||||
|
Asset-backed securities
|
20,714
|
|
12,571
|
|
1,166
|
|
|||||
|
Bank debt
|
5,326
|
|
8,868
|
|
6,887
|
|
|||||
|
Corporate bonds
|
(2,958
|
)
|
6,462
|
|
115,568
|
|
|||||
|
Municipal bonds
|
9,990
|
|
—
|
|
—
|
|
|||||
|
U.S. Treasury securities
|
2,787
|
|
2,366
|
|
2,605
|
|
|||||
|
Sovereign debt
|
(7,380
|
)
|
21,553
|
|
8,267
|
|
|||||
|
Other debt securities
|
406
|
|
2,546
|
|
—
|
|
|||||
|
Total debt securities
|
28,885
|
|
54,366
|
|
134,493
|
|
|||||
|
Options
|
(15,527
|
)
|
(33,510
|
)
|
(28,426
|
)
|
|||||
|
Rights and warrants
|
238
|
|
169
|
|
(370
|
)
|
|||||
|
Real estate
|
(186
|
)
|
502
|
|
—
|
|
|||||
|
Trade claims
|
(580
|
)
|
(89
|
)
|
116
|
|
|||||
|
Total other investments
|
(16,055
|
)
|
(32,928
|
)
|
(28,680
|
)
|
|||||
|
Net investment income (loss) in funds valued at NAV, excluding TP Fund
|
(723
|
)
|
10,309
|
|
1,330
|
|
|||||
|
Total net investment income from invested assets
|
79,672
|
|
505,032
|
|
190,577
|
|
|||||
|
Net investment income (loss) by liability type
|
|||||||||||
|
Equity securities
|
(32,407
|
)
|
(35,643
|
)
|
(11,725
|
)
|
|||||
|
Sovereign debt
|
—
|
|
—
|
|
(382
|
)
|
|||||
|
Corporate bonds
|
(2,452
|
)
|
(1,725
|
)
|
(4,195
|
)
|
|||||
|
Options
|
21,697
|
|
(2,907
|
)
|
11,272
|
|
|||||
|
Total net investment income (loss) from securities sold, not yet purchased
|
(13,162
|
)
|
(40,275
|
)
|
(5,030
|
)
|
|||||
|
Other investment income (losses) and other expenses not presented above
|
|||||||||||
|
Other investment expenses
|
903
|
|
(5,103
|
)
|
(6,068
|
)
|
|||||
|
Net investment income (loss) on derivative contracts
|
644
|
|
61,978
|
|
(15,479
|
)
|
|||||
|
Net investment loss on cash, including foreign exchange loss
|
(14,885
|
)
|
(1,454
|
)
|
(10,173
|
)
|
|||||
|
Net investment losses on securities purchased under an agreement to sell and securities sold under and agreement to repurchase
|
(238
|
)
|
(87
|
)
|
(1,970
|
)
|
|||||
|
Withholding taxes reclassified to income tax expense
|
6,325
|
|
2,573
|
|
6,675
|
|
|||||
|
Total other investment income (losses) and other expenses
|
(7,251
|
)
|
57,907
|
|
(27,015
|
)
|
|||||
|
Management and performance fees to related parties
|
(29,845
|
)
|
(130,711
|
)
|
(59,707
|
)
|
|||||
|
Net investment loss from investment in related party investment fund (1)
|
(280,847
|
)
|
—
|
|
—
|
|
|||||
|
Net investment income (loss)
|
$
|
(251,433
|
)
|
$
|
391,953
|
|
$
|
98,825
|
|
||
|
(1)
|
Effective August 31, 2018, Third Point Re, Third Point Re BDA and Third Point Re USA entered into the 2018 LPA to invest in TP Fund. As a result, the management and performance fees are presented within net investment income from investment in related party investment fund from the effective date of the transition. See Notes
4
and
11
for additional information regarding the 2018 LPA and related management and performance fees.
|
F-51
15. Other expenses
Other expenses for the years ended
December 31, 2018
,
2017
and
2016
consisted of the following:
|
2018
|
2017
|
2016
|
|||||||||
|
Investment expense (income) on deposit liabilities
|
$
|
(1,273
|
)
|
$
|
2,800
|
|
$
|
(164
|
)
|
||
|
Investment expense and change in fair value of embedded derivatives in reinsurance contracts
|
10,883
|
|
9,874
|
|
8,551
|
|
|||||
|
$
|
9,610
|
|
$
|
12,674
|
|
$
|
8,387
|
|
|||
16. Income taxes
The Company provides for income tax expense or benefit based upon pre-tax income or loss reported in the
consolidated statements of income (loss)
and the provisions of currently enacted tax laws. The Company and its Bermuda subsidiaries are incorporated under the laws of Bermuda and are subject to Bermuda law with respect to taxation. Under current Bermuda law, the Company and its Bermuda subsidiaries are not subject to any income or capital gains taxes in Bermuda. In the event that such taxes are imposed, the Company and its Bermuda subsidiaries would be exempted from any such taxes until March 2035 under the Tax Assurance Certificates issued to such entities pursuant to the Bermuda Exempted Undertakings Tax Protection Act of 1966, as amended.
The Company has an operating subsidiary incorporated in Bermuda, Third Point Re USA, which made an election to pay tax in the United States of America under Section 953(d) of the U.S. Internal Revenue Code of 1986, as amended. Our non-U.S. subsidiaries would become subject to U.S. federal income tax only to the extent that they derive income from activity that is deemed to be the conduct of a trade or business within the United States. On December 22, 2017, the U.S. government enacted comprehensive tax legislation commonly referred to as the Tax Cuts and Jobs Act (the “Tax Act”). The Tax Act makes broad and complex changes to the U.S. tax code, including, but not limited to, (1) reducing the U.S. federal corporate tax rate from 35% to 21%; (2) eliminating the corporate alternative minimum tax (AMT) and changing how existing AMT credits can be realized; (3) creating the base erosion anti-abuse tax (BEAT), a new minimum tax; and (4) creating a new limitation on deductible interest expense.
As a result of the change in the U.S. federal corporate tax rate from
35%
to
21%
, effective January 1, 2018, the Company had recorded a decrease related to deferred tax assets and deferred tax liabilities of
$6.0 million
and
$6.8 million
, respectively, with a corresponding net adjustment decreasing deferred income tax expense by
$0.8 million
for the year ended December 31, 2017. Although the Company believes that it has accounted for the most significant tax effects of the Tax Act, there may be further changes that could impact the Company’s calculations of certain deferred tax amounts. For example, the Company has not fully incorporated the revisions to the discounting rules for loss reserves into its calculation of this deferred tax asset. The Company does not anticipate material changes to its effective tax rate as a result of the other changes included in the Tax Act.
The Company also has subsidiaries in the United Kingdom, TPRUK and Third Point Re UK, which are subject to applicable taxes in that jurisdiction.
Prior to the change in the Company’s investment account structure described in
Note 4
, the Company was subject to withholding taxes on income sourced in the United States and in other countries, subject to each countries’ specific tax regulations. Income subject to withholding taxes includes, but is not limited to, dividends, capital gains and interest on certain investments. In addition, the Company had recorded uncertain tax positions related to certain investment transactions in certain foreign jurisdictions. As of
December 31, 2018
, the Company has accrued
$1.5 million
(December 31,
2017
-
$1.9 million
).
F-52
For the years ended
December 31, 2018
,
2017
and
2016
, the Company recorded income tax expense (benefit), as follows:
|
2018
|
2017
|
2016
|
|||||||||
|
Income tax expense (benefit) related to U.S. and U.K. subsidiaries
|
$
|
(10,035
|
)
|
$
|
9,248
|
|
$
|
(1,232
|
)
|
||
|
Change in uncertain tax positions
|
(300
|
)
|
155
|
|
147
|
|
|||||
|
Withholding taxes on certain investment transactions
|
6,325
|
|
2,573
|
|
6,678
|
|
|||||
|
|
$
|
(4,010
|
)
|
$
|
11,976
|
|
$
|
5,593
|
|
||
The following is a summary of the Company’s income (loss) before income tax expense (benefit) by jurisdiction for the years ended
December 31, 2018
,
2017
and
2016
:
|
2018
|
2017
|
2016
|
|||||||||
|
Bermuda
|
$
|
(273,697
|
)
|
$
|
266,497
|
|
$
|
38,243
|
|
||
|
United States
|
(47,771
|
)
|
27,172
|
|
(3,687
|
)
|
|||||
|
United Kingdom
|
(11
|
)
|
78
|
|
(87
|
)
|
|||||
|
|
$
|
(321,479
|
)
|
$
|
293,747
|
|
$
|
34,469
|
|
||
The Company’s expected income tax provision computed on pre-tax income at the weighted average tax rate has been calculated as the sum of the pre-tax income in each jurisdiction multiplied by that jurisdiction’s applicable statutory tax rate. Statutory tax rates of
0.0%
,
21.0%
and
19.0%
have been used for Bermuda, the United States and the United Kingdom, respectively. As of
December 31, 2018
, the Company has income tax returns open for examination in the United States for the tax years 2015, 2016 and 2017.
The following table presents a reconciliation of expected income taxes to income tax expense (benefit) for the years ended
December 31, 2018
,
2017
and
2016
:
|
2018
|
2017
|
2016
|
|||||||||
|
Bermuda (expected tax expense at 0%)
|
$
|
—
|
|
$
|
—
|
|
$
|
—
|
|
||
|
Foreign taxes at local expected rates:
|
|||||||||||
|
United States
|
(10,032
|
)
|
9,510
|
|
(1,290
|
)
|
|||||
|
United Kingdom
|
(2
|
)
|
15
|
|
(17
|
)
|
|||||
|
Withholding taxes related to dividend and interest income
|
6,325
|
|
2,573
|
|
6,678
|
|
|||||
|
Uncertain tax positions
|
(300
|
)
|
155
|
|
147
|
|
|||||
|
Non-deductible expenses and other
|
(1
|
)
|
(277
|
)
|
75
|
|
|||||
|
|
$
|
(4,010
|
)
|
$
|
11,976
|
|
$
|
5,593
|
|
||
The following table presents the Company’s current and deferred incomes taxes for the years ended
December 31, 2018
,
2017
and
2016
:
|
2018
|
2017
|
2016
|
|||||||||
|
Current tax expense
|
$
|
6,025
|
|
$
|
2,824
|
|
$
|
6,825
|
|
||
|
Deferred tax expense (benefit)
|
(10,035
|
)
|
9,152
|
|
(1,232
|
)
|
|||||
|
|
$
|
(4,010
|
)
|
$
|
11,976
|
|
$
|
5,593
|
|
||
F-53
The following table presents the tax effects of temporary differences that give rise to the deferred tax assets and deferred tax liabilities as of
December 31, 2018
,
2017
and
2016
:
|
2018
|
2017
|
2016
|
|||||||||
|
Deferred tax assets:
|
|||||||||||
|
Discounting of loss and loss adjustment expense reserves
|
$
|
534
|
|
$
|
330
|
|
$
|
451
|
|
||
|
Unearned premiums
|
1,567
|
|
1,634
|
|
2,486
|
|
|||||
|
Temporary differences in recognition of expenses
|
1,247
|
|
138
|
|
1,134
|
|
|||||
|
Net operating loss carryforward
|
6,798
|
|
7,048
|
|
13,326
|
|
|||||
|
Total deferred tax assets
|
10,146
|
|
9,150
|
|
17,397
|
|
|||||
|
Deferred tax liabilities:
|
|||||||||||
|
Deferred acquisition costs
|
1,490
|
|
7,798
|
|
4,079
|
|
|||||
|
Unrealized losses (gains) on investments
|
(405
|
)
|
2,435
|
|
5,438
|
|
|||||
|
Total deferred tax liabilities
|
1,085
|
|
10,233
|
|
9,517
|
|
|||||
|
Net deferred tax asset (liability)
|
$
|
9,061
|
|
$
|
(1,083
|
)
|
$
|
7,880
|
|
||
The deferred tax assets and liabilities as of
December 31, 2018
were primarily related to U.S. income tax. To evaluate the recoverability of the deferred tax assets, the Company considers the timing of the reversal of deferred income and expense items as well as the likelihood that the Company will generate sufficient taxable income to realize future tax benefits. The Company believes that it is more likely than not that it will generate sufficient taxable income and realize the future tax benefits in order to recover the deferred assets and, accordingly, no valuation allowance was recorded as of
December 31, 2018
and
2017
. As of
December 31, 2018
, deferred tax assets include
$32.3 million
of net operating losses generated prior to January 1, 2018 that can be carried forward for twenty years and part of which will begin to expire in 2035.
17. Share capital
The following tables present a summary of the common shares issued and outstanding and shares repurchased held as treasury shares as of and for the years ended
December 31, 2018
,
2017
and
2016
:
|
Common shares
|
2018
|
2017
|
2016
|
|||||
|
Common shares issued, beginning of period
|
107,227,347
|
|
106,501,299
|
|
105,479,341
|
|
||
|
Options exercised
|
—
|
|
150,802
|
|
514,059
|
|
||
|
Restricted shares granted, net of forfeitures
|
50,644
|
|
(35,011
|
)
|
47,712
|
|
||
|
Performance restricted shares granted, net of forfeitures and shares withheld
|
256,106
|
|
610,257
|
|
460,187
|
|
||
|
Retirement of treasury shares and shares repurchased (1)
|
(14,256,043
|
)
|
—
|
|
—
|
|
||
|
Warrants exercised, net (2)
|
361,556
|
|
—
|
|
—
|
|
||
|
Common shares issued, end of period
|
93,639,610
|
|
107,227,347
|
|
106,501,299
|
|
||
|
Treasury shares, end of year
|
—
|
|
(3,944,920
|
)
|
(644,768
|
)
|
||
|
Common shares outstanding, end of year
|
93,639,610
|
|
103,282,427
|
|
105,856,531
|
|
||
|
(1)
|
Prior to December 31, 2017, common shares repurchased by the Company were not canceled and were classified as treasury shares. Effective January 1, 2018, all treasury shares were retired and future shares repurchased will be retired.
|
|
(2)
|
During the year ended
December 31, 2018
,
1,156,184
warrants were exercised. As a result of the warrant holder electing net settlement,
794,628
of those common shares were withheld by the Company and were subsequently retired, resulting in a net issuance of
361,556
common shares.
|
F-54
Authorized and issued
The Company’s authorized share capital of
$33.0 million
is comprised of
300,000,000
common shares with a par value of
$0.10
each and
30,000,000
preference shares with a par value of
$0.10
each. No preference shares have been issued to date.
Share repurchases
On May 4, 2016, the Company’s Board of Directors authorized a common share repurchase program for up to an aggregate of
$100.0 million
of the Company’s outstanding common shares.
On February 28, 2018, the Company’s Board of Directors authorized the repurchase of an additional
$148.3 million
of common shares, which together with the shares remaining under the previously announced share repurchase program, would allow the Company to repurchase up to
$200.0 million
more of the Company’s outstanding common shares in the aggregate. Under the common share repurchase program, the Company may repurchase shares from time to time in privately negotiated transactions or in open-market purchases in accordance with all applicable securities laws and regulations, including Rule 10b-18 of the Securities Exchange Act of 1934, as amended.
During the year ended
December 31, 2018
, the Company repurchased
10,311,123
(December 31,
2017
-
3,300,152
) of its common shares in the open market for an aggregate cost of $
138.7 million
(December 31,
2017
-
$40.9 million
) at a weighted average cost, including commissions, of $
13.45
(December 31,
2017
-
$12.38
) per share. Common shares repurchased by the Company during the year were retired. In addition, the Company also retired all shares previously held in treasury.
As of
December 31, 2018
, the Company is authorized to repurchase up to an aggregate of
$61.3 million
of additional common shares under its share repurchase program.
Warrants
The Company’s Founders and an advisor provided insurance industry expertise, resources and relationships to ensure that the Company would be fully operational with key management in place in time for the January 2012 underwriting season. In consideration of these commitments, the Company reserved for issuance to the Founders and an advisor warrants to purchase, in the aggregate, up to
4.0%
(Founders
3.5%
and an advisor
0.5%
) of the diluted shares (up to a maximum of
$1 billion
of subscribed shares) provided that the Founders and the advisor will not be issued any warrants for common shares issued in consideration for any capital raised by the Company in excess of
$1 billion
. The following is a summary of warrants as of
December 31, 2018
:
|
Exercise price
|
Authorized and
issued
|
Aggregated fair
value of
warrants
|
||||||||
|
Founders
|
$
|
10.00
|
|
2,913,684
|
|
$
|
10,884
|
|
||
|
Advisor
|
$
|
10.00
|
|
581,295
|
|
2,171
|
|
|||
|
3,494,979
|
|
$
|
13,055
|
|
||||||
The warrants expire
10 years
from the date of issuance, December 22, 2011, and will be exercisable at a price per share of
$10.00
, which is equal to the price per share paid by investors in the initial private offering.
18. Share-based compensation
On July 15, 2013, the Third Point Re 2013 Omnibus Incentive Plan (“Omnibus Plan”) was approved by the Board of Directors and subsequently on August 2, 2013 by the Shareholders of the Company. An aggregate of
21,627,906
common shares were made available under the Omnibus Plan. This number of shares includes the shares available under the Third Point Re Share Incentive Plan (“Share Incentive Plan”). Awards under the Omnibus Plan may be made in the form of performance awards, restricted shares, restricted share units, share options, share appreciation rights and other share-based awards.
F-55
As of
December 31, 2018
,
9,017,930
(December 31,
2017
-
9,330,000
) of the Company’s common shares were available for future issuance under the equity incentive compensation plans.
The following table provides the total share-based compensation expense included in general and administrative expenses during the years ended
December 31, 2018
,
2017
and
2016
:
|
2018
|
2017
|
2016
|
|||||||||
|
Management and director options
|
$
|
275
|
|
$
|
648
|
|
$
|
6,054
|
|
||
|
Restricted shares with service condition
(1)
|
611
|
|
(331
|
)
|
1,365
|
|
|||||
|
Restricted shares with service and performance condition
|
4,070
|
|
3,282
|
|
1,519
|
|
|||||
|
$
|
4,956
|
|
$
|
3,599
|
|
$
|
8,938
|
|
|||
|
(1)
|
Net of forfeitures of $
nil
in the year ended
December 31, 2018
(December 31,
2017
-
$0.9 million
and December 31,
2016
-
$nil
)
|
As of
December 31, 2018
, the Company had
$7.4 million
(December 31,
2017
-
$5.8 million
) of unamortized share compensation expense, which is expected to be amortized over a weighted average period of
1.4 years
(December 31,
2017
-
1.5 years
).
Management and director options
The management options issued under the Share Incentive Plan were subject to a service and performance condition. The service condition will be met with respect to
20%
of the management options on each of the first
five
anniversary dates following the grant date of the management options. The performance condition with respect to the management options was met as a result of the Company’s IPO.
The management and director options activity for the years ended
December 31, 2018
,
2017
and
2016
were as follows:
|
Number of
options
|
Weighted
average exercise
price
|
|||||
|
Balance as of January 1, 2016
|
10,250,586
|
|
$
|
13.52
|
|
|
|
Forfeited
|
(139,534
|
)
|
18.00
|
|
||
|
Exercised
|
(514,059
|
)
|
10.00
|
|
||
|
Balance as of January 1, 2017
|
9,596,993
|
|
13.64
|
|
||
|
Forfeited
|
(558,138
|
)
|
18.00
|
|
||
|
Exercised
|
(150,802
|
)
|
10.00
|
|
||
|
Balance as of January 1, 2018
|
8,888,053
|
|
13.43
|
|
||
|
Forfeited
|
—
|
|
—
|
|
||
|
Exercised
|
—
|
|
—
|
|
||
|
Balance as of December 31, 2018
|
8,888,053
|
|
$
|
13.43
|
|
|
The fair value of share options issued were estimated on the grant date using the Black-Scholes option-pricing model. There were no share options granted in the years ended
December 31, 2018
and
2017
. As of
December 31, 2018
, the weighted average remaining contractual term for options outstanding and exercisable was
3.2 years
and
3.2 years
, respectively (
2017
-
4.2 years
and
4.1 years
, respectively).
F-56
The following table summarizes information about the Company’s management and director share options outstanding as of
December 31, 2018
:
|
Options outstanding
|
Options exercisable
|
||||||||||||||
|
Range of exercise prices
|
Number of
options
|
Weighted
average
exercise price
|
Remaining
contractual
life
|
Number of
options
|
Weighted
average
exercise price
|
||||||||||
|
$10.00 - $10.89
|
5,123,531
|
|
$
|
10.04
|
|
3.1 years
|
5,123,531
|
|
$
|
10.04
|
|
||||
|
$15.05 - $16.89
|
1,917,145
|
|
$
|
15.93
|
|
3.3 years
|
1,917,145
|
|
$
|
15.93
|
|
||||
|
$20.00 - $25.05
|
1,847,377
|
|
$
|
20.26
|
|
3.2 years
|
1,847,377
|
|
$
|
20.26
|
|
||||
|
8,888,053
|
|
$
|
13.43
|
|
3.2 years
|
8,888,053
|
|
$
|
13.43
|
|
|||||
As the Company’s closing share price on December 31, 2018 was below
$10.00
, there was no aggregate intrinsic value of options outstanding and options exercisable. As of December 31, 2017, the aggregate intrinsic value of options outstanding and options exercisable was
$23.6 million
and
$23.4 million
, respectively. For the year ended
December 31, 2018
, the Company received proceeds of $
nil
(
2017
-
$1.5 million
) from the exercise of options.
Restricted shares with service condition
Restricted shares vest either ratably or at the end of the required service period and contain certain restrictions during the vesting period, relating to, among other things, forfeiture in the event of termination of employment or service and transferability.
Restricted share award activity for the restricted shares with only a service condition for the years ended
December 31, 2018
,
2017
and
2016
was as follows:
|
Number of non-
vested restricted
shares
|
Weighted
average grant
date fair value
|
|||||
|
Balance as of January 1, 2016
|
301,043
|
|
$
|
11.12
|
|
|
|
Granted
|
47,712
|
|
11.37
|
|
||
|
Vested
|
(47,712
|
)
|
11.37
|
|
||
|
Balance as of January 1, 2017
|
301,043
|
|
11.12
|
|
||
|
Granted
|
36,418
|
|
12.15
|
|
||
|
Forfeited
|
(71,429
|
)
|
14.00
|
|
||
|
Vested
|
(247,823
|
)
|
10.36
|
|
||
|
Balance as of January 1, 2018
|
18,209
|
|
12.15
|
|
||
|
Granted
|
50,644
|
|
13.45
|
|
||
|
Vested
|
(44,788
|
)
|
12.97
|
|
||
|
Balance as of December 31, 2018
|
24,065
|
|
$
|
13.35
|
|
|
For the year ended
December 31, 2018
, the Company issued
50,644
(
2017
-
36,418
and
2016
-
47,712
) to directors and
nil
(
2017
-
nil
and
2016
-
nil
) restricted shares to employees. The restricted shares issued to employees in 2015 had an original vesting period of
three years
from the date of issuance, however, as a result of the grantee’s departure from the Company, these shares were forfeited in the year ended December 31, 2017. The restricted shares issued in
2016
to directors vested on December 31, 2016. The restricted shares issued to directors in
2017
and
2018
vest quarterly on July 31, October 31, January 31 and April 30, of each year.
Restricted shares with service and performance condition
Beginning in December 2014, the Company granted on an annual basis performance-based restricted shares to certain employees pursuant to the Omnibus Plan. Performance-based restricted shares vest based on continued service and the achievement of certain financial performance measures over a three-year measurement period. The number of
F-57
performance-based restricted shares that will be retained upon vesting will vary based on the level of achievement of the performance goals. The formula for determining the amount of shares that will vest is based on underwriting performance of the property and casualty reinsurance segment including underwriting income and the amount of float generated, as defined in the relevant award agreements.
Restricted share award activity for the restricted shares with a service and performance condition for the years ended
December 31, 2018
,
2017
and
2016
was as follows:
|
Number of non-
vested restricted
shares
|
Number of non-
vested restricted
shares probable of vesting
|
Weighted average grant date fair value
|
|||||||
|
Balance as of January 1, 2016
|
921,553
|
|
536,234
|
|
$
|
14.24
|
|
||
|
Granted
|
653,958
|
|
435,974
|
|
11.40
|
|
|||
|
Forfeited
|
(193,771
|
)
|
(119,009
|
)
|
13.16
|
|
|||
|
Change in estimated restricted shares considered probable of vesting
|
n/a
|
|
(275,713
|
)
|
13.06
|
|
|||
|
Balance as of January 1, 2017
|
1,381,740
|
|
577,486
|
|
12.91
|
|
|||
|
Granted
|
935,825
|
|
623,882
|
|
12.66
|
|
|||
|
Forfeited
|
(325,568
|
)
|
(45,617
|
)
|
12.57
|
|
|||
|
Vested
|
(136,618
|
)
|
(136,618
|
)
|
14.60
|
|
|||
|
Change in estimated restricted shares considered probable of vesting
|
n/a
|
|
(131,930
|
)
|
12.17
|
|
|||
|
Balance as of January 1, 2018
|
1,855,379
|
|
887,203
|
|
12.60
|
|
|||
|
Granted
|
556,403
|
|
370,931
|
|
14.01
|
|
|||
|
Forfeited
|
(294,977
|
)
|
(4,102
|
)
|
13.98
|
|
|||
|
Vested
|
(115,757
|
)
|
(115,757
|
)
|
14.00
|
|
|||
|
Change in estimated restricted shares considered probable of vesting
|
n/a
|
|
46,945
|
|
13.35
|
|
|||
|
Balance as of December 31, 2018
|
2,001,048
|
|
1,185,220
|
|
$
|
12.80
|
|
||
Defined contribution retirement plans
The Company's employees are eligible for retirement benefits through defined contribution retirement plans. The Company and employees contribute an amount equal to a specified percentage of each employee's salary. Expenses related to the defined contribution plans were
$0.9 million
for the year ended
December 31, 2018
(
2017
-
$0.8 million
and
2016
-
$0.8 million
)
19. Noncontrolling interests in related party
Noncontrolling interests in related party represents the portion of equity in consolidated subsidiaries not attributable, directly or indirectly, to the Company. Prior to the change in the Company’s investment account structure described in
Note 4
, the joint ventures created through the
JV Agreements
(
Note 4
) had been considered variable interest entities and had been consolidated in accordance with ASC 810,
Consolidation
(ASC 810).
Since the Company was deemed to be the primary beneficiary, the Company had consolidated the joint ventures and recorded TP GP’s minority interests as redeemable noncontrolling interests in related party and noncontrolling interests in related party in the consolidated balance sheets.
A portion of the noncontrolling interest in investment affiliates was subject to contractual withdrawal rights of TP GP, whereas TP GP, at its sole discretion, could withdraw the capital over the minimum capital required to be maintained in its capital accounts. This excess capital was therefore recorded on the Company’s consolidated balance sheets as redeemable noncontrolling interest in related party whereas the required minimum capital was recorded as noncontrolling interests in related party within shareholders’ equity on the Company’s consolidated balance sheets since it does not have withdrawal rights.
F-58
The following table is a reconciliation of the beginning and ending carrying amounts of redeemable noncontrolling interests in related party, noncontrolling interests in related party and total noncontrolling interests in related party for the years ended
December 31, 2018
and
2017
:
|
Redeemable noncontrolling interests in related party
|
Noncontrolling interests in related party
|
Total noncontrolling interests in related party
|
|||||||||||||||||||||
|
2018
|
2017
|
2018
|
2017
|
2018
|
2017
|
||||||||||||||||||
|
Balance, beginning of period
|
$
|
108,219
|
|
$
|
—
|
|
$
|
5,407
|
|
$
|
35,674
|
|
$
|
113,626
|
|
$
|
35,674
|
|
|||||
|
Changes in capital account allocation
(1)
|
(108,219
|
)
|
108,219
|
|
(5,407
|
)
|
(30,267
|
)
|
(113,626
|
)
|
77,952
|
|
|||||||||||
|
Balance, end of period
|
$
|
—
|
|
$
|
108,219
|
|
$
|
—
|
|
$
|
5,407
|
|
$
|
—
|
|
$
|
113,626
|
|
|||||
|
(1)
|
Changes in capital account allocation include TP GP's redemption in conjunction with the change in the investment account structure. See
Note 4
for additional information.
|
In addition, the following table is a reconciliation of beginning and ending carrying amount of total noncontrolling interests in related party resulting from the consolidation of the Company’s joint venture in Third Point Re BDA and Third Point Re USA:
|
Third Point Re BDA
|
Third Point Re USA
|
Total
|
|||||||||||||||||||||
|
2018
|
2017
|
2018
|
2017
|
2018
|
2017
|
||||||||||||||||||
|
Balance, beginning of period
|
$
|
97,619
|
|
$
|
30,358
|
|
$
|
16,007
|
|
$
|
5,316
|
|
$
|
113,626
|
|
$
|
35,674
|
|
|||||
|
Net income attributable to total noncontrolling interests in related party
|
141
|
|
3,167
|
|
82
|
|
806
|
|
223
|
|
3,973
|
|
|||||||||||
|
Contributions
(1)
|
564
|
|
82,093
|
|
80
|
|
11,885
|
|
644
|
|
93,978
|
|
|||||||||||
|
Redemptions
(2)
|
(98,324
|
)
|
(17,999
|
)
|
(16,169
|
)
|
(2,000
|
)
|
(114,493
|
)
|
(19,999
|
)
|
|||||||||||
|
Balance, end of period
|
$
|
—
|
|
$
|
97,619
|
|
$
|
—
|
|
$
|
16,007
|
|
$
|
—
|
|
$
|
113,626
|
|
|||||
|
(1)
|
Contributions include performance fees earned during the period. See
Note 11
for additional information.
|
|
(2)
|
Redemptions include TP GP's redemption in conjunction with the change in the investment account structure. See
Note 4
for additional information.
|
Non-consolidated variable interest entities
Third Point Enhanced LP
TP Fund meets the definition of a variable interest entity principally because of the existence of disproportionate rights in the partnership compared to the obligations to absorb the expected losses and right to receive the expected residual returns of TP Fund’s results. As of
December 31, 2018
, the Company and TP GP hold interests of approximately
87.3%
and
12.5%
, respectively, of the net asset value of TP Fund. As a result, both entities hold significant financial interests in TP Fund. However, TP GP controls all of the investment decision making authority and the Company does not have the power to direct the activities which most significantly impact the economic performance of TP Fund. As a result, the Company is not considered the primary beneficiary and does not consolidate TP Fund.
Realized gains or losses upon any redemptions of investments are calculated using the weighted average method and the Company records contributions and withdrawals related to its investment in the TP Fund on the transaction date. As of
December 31, 2018
, the Company had no unfunded commitments related to TP Fund and the Company’s maximum exposure to loss corresponds to the value of its investments in TP Fund.
Under the 2018 LPA, the TPRE Limited Partners have the right to withdraw funds weekly from TP Fund to pay claims and expenses as needed, to meet capital adequacy requirements and to satisfy financing obligations. The TPRE Limited Partners may also withdraw their investment upon the occurrence of certain events specified in the 2018 LPA and may withdraw their investment in full on December 31, 2021 and each successive three-year anniversary of such date.
F-59
Non-consolidated variable interest entities under previous investment account structure
Prior to the change in the Company’s investment account structure, the Company invested directly in several limited partnerships and other investment vehicles. Some of these entities were affiliated with TP Fund’s investment manager, Third Point LLC. The activities of these variable interest entities were generally limited to holding investments and the Company’s involvement in these entities was passive in nature. The Company did not have the power to direct the activities which most significantly impacted the variable interest entities economic performance and therefore, the Company was not the primary beneficiary of these variable interest entities. The Company elected the practical expedient for estimating fair value for these investments and reported the investments based on the reported NAV with changes in fair value recognized within the
consolidated statements of income (loss)
. The following summarizes all of the Company’s investment in variable interest entities that were not consolidated prior to the change in the investment account structure:
TP Lux Holdco LP
Prior to the change in the Company’s investment account structure, the Company was a limited partner in TP Lux Holdco LP (the “Cayman HoldCo”), which was an affiliate of the Investment Manager. The Cayman HoldCo was formed as a limited partnership under the laws of the Cayman Islands and invests and held debt and equity interests in TP Lux HoldCo S.a.r.l, a Luxembourg private limited liability company (the “LuxCo”) established under the laws of the Grand-Duchy of Luxembourg, which was also an affiliate of the Investment Manager. LuxCo’s principal objective was to act as a collective investment vehicle to purchase certain European debt and equity investments. The Company invested in the Cayman HoldCo alongside other investment funds managed by the Investment Manager.
During the period from January 1, 2018 to September 4, 2018, the date when the Company’s investment in TP Lux Holdco was transferred to TP Fund, the Company received net distributions of
$0.6 million
(
2017
-
$39.6 million
) from the Cayman HoldCo.
As a result of the change in the investment account structure, the Company’s investment of
$0.3 million
in the limited partnership was transferred to the TP Fund. The estimated fair value of the investment in the limited partnership as of
December 31, 2017
was
$0.6 million
, representing a
15.6%
interest.
Third Point Hellenic Recovery US Feeder Fund, L.P.
Prior to the change in the Company’s investment account structure, the Company was a limited partner in Third Point Hellenic Recovery US Feeder Fund, L.P. (the “Hellenic Fund”), which was an affiliate of the Investment Manager. The Hellenic Fund was formed as a limited partnership under the laws of the Cayman Islands on April 12, 2013 and invests and holds debt and equity interests in Greek Cypriot companies.
No
capital distributions or calls were made during the period from January 1, 2018 to September 4, 2018, the date when the Company’s investment in the Hellenic Fund was transferred to TP Fund (
2017
-
$1.5 million
net distributions).
As a result of the change in the investment account structure, the Company’s investment of
$4.9 million
in the limited partnership was transferred to the TP Fund. The estimated fair value of the investment in the limited partnership as of December 31,
2017
was
$4.9 million
, representing a
2.9%
interest.
TP DR Holdings LLC
Prior to the change in the Company’s investment account structure, the Company held an equity and debt investment in TP DR Holdings LLC (“TP DR”), which was an affiliate of the Investment Manager. In December 2016, TP DR was formed as a limited liability company under the laws of the Cayman Islands to invest and own
100%
equity interest in DCA Holdings Six Ltd. and its wholly owned subsidiary group. TP DR’s principal objective was to own, develop and manage properties in the Dominican Republic. The Company invested in TP DR alongside other investment funds managed by the Investment Manager and third-party investors.
During the period from January 1, 2018 to September 4, 2018, the date when the Company’s investment in TP DR was transferred to TP Fund, the Company contributed cash of
$3.0 million
(
2017
-
$2.4 million
) to TP DR.
F-60
As a result of the change in the investment account structure, the Company’s investment of
$16.8 million
in TP DR was transferred to the TP Fund. As of
December 31, 2017
, the estimated fair value of the investment was
$12.7 million
, corresponding to
$3.7 million
of equity, representing a
7.0%
interest, and
$9.0 million
of debt, representing a
13.1%
interest.
Cloudbreak II Cayman Ltd and TP Trading II LLC
Prior to the change in the Company’s investment account structure, the Company directly held an equity interest in Cloudbreak II Cayman Ltd, Cloudbreak II US LLC (collectively, the “Cloudbreak entities”) and TP Trading II LLC which are affiliates of the Investment Manager. The Company invested in the Cloudbreak entities and TP Trading II LLC alongside other investment funds managed by the Investment Manager. These entities’ were invested in a structure whose primary purpose was to purchase consumer loans and warrants from a marketplace lending platform.
As a result of the change in the investment account structure,
$3.4 million
of the Company’s asset-backed security investments were transferred to the TP Fund. As of
December 31, 2017
, the Cloudbreak entities held
$4.6 million
of the Company’s asset-backed security investments, which were included in investments in securities in the consolidated balance sheet. The Company’s pro rata interest in the underlying investments was registered in the name of Cloudbreak II US LLC and the related income and expense were reflected in the consolidated balance sheets and the
consolidated statements of income (loss)
.
As a result of the change in the investment account structure, the Company’s equity investment of
$4.4 million
in TP Trading II LLC was transferred to the TP Fund. As of
December 31, 2017
, the estimated fair value of the investment was
$6.0 million
, representing a
9.3%
interest.
Ventures Entities
Prior to the change in the Company’s investment account structure, the Company held equity interests in Venture Three Holdings LLC, Venture Four Holdings LLC, Venture Five Holdings LLC and Venture Six Holdings LLC (collectively, the “Ventures entities”), which were affiliates of the Investment Manager. The Company invested in the Ventures entities alongside other investment funds managed by the Investment Manager. The primary purpose of these entities was to make investments in direct commercial real estate, real estate debt and a publicly traded telecommunications company.
As a result of the change in the investment account structure,
$20.8 million
of the Company’s real estate and other debt investments were transferred to the TP Fund. As of
December 31, 2017
, the Ventures entities held
$7.5 million
of the Company’s investments, which were included in investments in securities in the consolidated balance sheets. The Company recorded changes in the fair value of this investment in the
consolidated statements of income (loss)
.
Cloudbreak Aggregator LP
Prior to the change in the Company’s investment account structure, the Company held equity interests in Cloudbreak Aggregator LP, which was an affiliate of the Investment Manager. The Company invested in the Cloudbreak Aggregator LP alongside other investment funds managed by the Investment Manager. The primary purpose of this entity was to invest in Far Point LLC, the sponsor of Far Point Acquisition Corporation “FPAC”. FPAC is a NYSE listed special acquisition corporation.
As a result of the change in the investment account structure, the Company’s equity investment of
$4.5 million
in the Cloudbreak Aggregator LP was transferred to the TP Fund. As of
December 31, 2017
the Company did not hold an equity interest in the Cloudbreak Aggregator LP.
F-61
20. Earnings (loss) per share available to Third Point Re common shareholders
The following sets forth the computation of basic and diluted earnings (loss) per share available to Third Point Re common shareholders for the years ended
December 31, 2018
,
2017
and
2016
:
|
2018
|
2017
|
2016
|
||||||||||
|
Weighted-average number of common shares outstanding:
|
($ in thousands, except share and per share amounts)
|
|||||||||||
|
Basic number of common shares outstanding
|
97,054,315
|
|
102,264,094
|
|
104,060,052
|
|
||||||
|
Dilutive effect of options
|
—
|
|
1,392,384
|
|
633,955
|
|
||||||
|
Dilutive effect of warrants
|
—
|
|
1,270,957
|
|
709,499
|
|
||||||
|
Dilutive effect of restricted shares with service and performance condition
|
—
|
|
299,603
|
|
160,278
|
|
||||||
|
Diluted number of common shares outstanding
|
97,054,315
|
|
105,227,038
|
|
105,563,784
|
|
||||||
|
Basic earnings (loss) per common share:
|
||||||||||||
|
Net income (loss) available to Third Point Re common shareholders
|
$
|
(317,692
|
)
|
$
|
277,798
|
|
$
|
27,635
|
|
|||
|
Net income allocated to Third Point Re participating common shareholders
|
—
|
|
(263
|
)
|
(88
|
)
|
||||||
|
Net income (loss) allocated to Third Point Re common shareholders
|
$
|
(317,692
|
)
|
$
|
277,535
|
|
$
|
27,547
|
|
|||
|
Basic earnings (loss) per share available to Third Point Re common shareholders
|
$
|
(3.27
|
)
|
$
|
2.71
|
|
$
|
0.26
|
|
|||
|
Diluted earnings (loss) per common share:
|
||||||||||||
|
Net income (loss) available to Third Point Re common shareholders
|
$
|
(317,692
|
)
|
$
|
277,798
|
|
$
|
27,635
|
|
|||
|
Net income allocated to Third Point Re participating common shareholders
|
—
|
|
(256
|
)
|
(87
|
)
|
||||||
|
Net income (loss) allocated to Third Point Re common shareholders
|
$
|
(317,692
|
)
|
$
|
277,542
|
|
$
|
27,548
|
|
|||
|
Diluted earnings (loss) per share available to Third Point Re common shareholders
|
$
|
(3.27
|
)
|
$
|
2.64
|
|
$
|
0.26
|
|
|||
As a result of the net loss for the year ended
December 31, 2018
, dilutive options, warrants and restricted shares with service and performance conditions totaling
9,820,795
were considered anti-dilutive and were excluded from the computation of diluted loss per common share. No allocation of the net loss has been made to participating shares in the calculation of diluted net loss per common share.
For the years ended December 31,
2017
and
2016
, anti-dilutive options of
4,056,588
and
4,369,171
, respectively, were excluded from the computation of diluted earnings per share.
21. Related party transactions
In addition to the transactions disclosed in Notes
4
,
11
and
19
to these consolidated financial statements, the following transactions are classified as related party transactions, as the counterparties have either a direct or indirect shareholding in the Company or the Company has an investment in such counterparty.
Prior to the change in the Company’s investment account structure described in
Note 4
, Third Point Loan L.L.C. (“Loan LLC”) and Third Point Ventures LLC (“Ventures LLC” and, together with Loan LLC, “Nominees”) served as nominees of the Company and other affiliated investment management clients of the Investment Manager for certain investments. The Nominees appointed the Investment Manager as its true and lawful agent and attorney. As of
December 31, 2017
, Loan LLC held
$99.6 million
and Ventures LLC held $
6.3 million
of the Company’s investments, which were included in investments in securities and derivative contracts in the consolidated balance sheets. The Company’s pro rata interest in the underlying investments registered in the name of the Nominees and the related income and expense were reflected in the consolidated balance sheets and the
consolidated statements of income (loss)
. The valuation policy, with respect to investments held by the nominees, is further discussed in
Note 4
.
BlackRock, Inc. (“BlackRock”) reported a beneficial ownership interest of more than 10% of the Company’s common shares as of
December 31, 2017
. As a result, BlackRock is considered a related party as defined by U.S. GAAP. Prior
F-62
to the change in the Company’s investment account structure, the Company sold its equity securities in BlackRock. As of
December 31, 2017
,
$106.5 million
of equity securities in BlackRock were included in the Company’s consolidated balance sheets. Included in the Company’s
net investment income (loss)
in its
consolidated statements of income (loss)
for the year ended
December 31, 2018
was
$(0.2) million
(
2017
-
$23.3 million
) of investment income (loss) associated with the Company’s investment in BlackRock.
22. Financial instruments with off-balance sheet risk or concentrations of credit risk
Off-balance sheet risk
Subsequent to the change in the Company’s investment account structure described in
Note 4
, the Company does not own directly the net investment assets and related liabilities but instead, owns limited partnership interests in TP Fund. There are no off-balance sheet risks associated with the Company’s investment in TP Fund. The Company’s maximum exposure to loss associated with its investment in the TP Fund corresponds to the carrying value of its investments in TP Fund.
Prior to the change in the Company’s investment account structure described in
Note 4
, the Company traded various financial instruments and engaged in various investment activities with off-balance sheet risk. These financial instruments included securities sold, not yet purchased, forwards, futures, options, swaptions, swaps and contracts for differences. These financial instruments are now part of the underlying investment activities of TP Fund. Generally, these financial instruments represent future commitments to purchase or sell other financial instruments at specific terms at specified future dates. Each of these financial instruments contain varying degrees of off-balance sheet risk whereby changes in the fair values of the securities underlying the financial instruments or fluctuations in interest rates and index values could have exceeded the amounts recognized in the consolidated balance sheets.
Prior to the change in the Company’s investment account structure, the Company traded and held certain derivative contracts, such as written options, which constitute guarantees. These type of investments are now part of the underlying investment securities held by TP Fund.
Swaption contracts gave the Company the right, but not the obligation, to enter into a specified interest-rate swap within a specified period of time. The Company’s market and counterparty credit risk was limited to the premium paid to enter into the swaption contract and net unrealized gains.
Total return swaps, contracts for differences, index swaps, and interest rate swaps that involve the exchange of cash flows between the Company and counterparties were based on the change in the fair value of a particular equity, index, or interest rate on a specified notional holding. The use of these contracts exposed the Company to market risks equivalent to actually holding securities of the notional value but typically involved little capital commitment relative to the exposure achieved. The gains or losses of the Company may therefore have been magnified on the capital commitment. These type of investments are now part of the investment strategies of the TP Fund.
Credit derivatives
Credit default swaps protect the buyer against the loss of principal on one or more underlying bonds, loans, or mortgages in the event the issuer suffers a credit event. Prior to the change in the investment account structure described in Note 4, the Company directly held these type of securities. Those securities are no longer held by the Company but instead, are included in the TP Fund’s investment strategies.
Prior to the change in the Company’s investment account structure, the Company entered into index and/or basket credit default swaps where the credit derivative may reference a basket of single-name credit default swaps or a broad-based index. Generally, in the event of a default on one of the underlying names, the buyer would receive a pro-rata portion of the total notional amount of the credit default index or basket contract from the seller. When the Company purchased single-name, index and basket credit default swaps, the Company was exposed to counterparty nonperformance.
F-63
The following table sets forth certain information related to the Company’s written credit derivatives as of
December 31, 2017
:
|
Maximum Payout/ Notional Amount
(by period of expiration) |
Fair Value of Written Credit Derivatives
(2)
|
||||||||||||||||||||||
|
Credit Spreads on underlying (basis points)
|
0-5 years
|
5 years or
Greater Expiring Through 2047 |
Total Written
Credit Default Swaps (1) |
Asset
|
Liability
|
Net Asset/(Liability)
|
|||||||||||||||||
|
Single name (0 - 250)
|
$
|
—
|
|
$
|
2,351
|
|
$
|
2,351
|
|
$
|
—
|
|
$
|
2,085
|
|
$
|
(2,085
|
)
|
|||||
|
(1)
|
As of
December 31, 2017
, the Company did not hold any offsetting buy protection credit derivatives with the same underlying reference obligation.
|
|
(2)
|
Fair value amounts of derivative contracts are shown on a gross basis prior to cash collateral or counterparty netting.
|
Concentrations of credit risk
Investments
Subsequent to the change in the Company’s investment account structure described in
Note 4
, the Company does not own directly the net investment assets but instead, owns limited partnership interests in TP Fund. As a result, the Company is no longer exposed directly to credit risk associated with its net investment assets it used to hold. The Company’s maximum exposure to loss associated its investment in the TP Fund corresponds to the carrying value of its investments in TP Fund. The Company does not have any unfunded capital commitments associated with its investment in TP Fund.
Prior to the change in the Company’s investment account structure, the Company was subject to concentrations of credit risk with certain counterparties. Substantially all securities transactions and individual counterparty concentrations were with major securities firms, such as prime brokers or their affiliates. The Company reduced its credit risk with counterparties by entering into master netting agreements. Furthermore, the Company obtained collateral from counterparties to reduce its exposure to counterparty credit risk.
Underwriting
The Company is exposed to credit risk through reinsurance contracts with companies that write credit risk insurance. The Company’s portfolio of risk is predominantly U.S. mortgage insurance and mortgage credit risk transfer. The Company provides its clients in these lines of business with reinsurance protection against credit deterioration, defaults or other types of financial non-performance. Loss experience in these lines of business has been very good but is cyclical and is affected by the state of the general economic environment. The Company proactively manages the risks associated with these credit-sensitive lines of business by closely monitoring its risk aggregation and by diversifying the underlying risks where possible. The Company has bought some retrocessional coverage against a subset of these risks.
The Company has exposure to credit risk as it relates to its business written through brokers, if any of the Company’s brokers are unable to fulfill their contractual obligations with respect to payments to the Company. In addition, in some jurisdictions, if the broker fails to make payments to the insured under the Company’s policy, the Company may remain liable to the insured for the deficiency. The Company’s exposure to such credit risk is somewhat mitigated in certain jurisdictions by contractual terms.
The Company has exposure to credit risk related to balances receivable under our reinsurance contracts, including funds withheld and premiums receivable, and the possibility that counterparties may default on their obligations to the Company. The risk of counterparty default is partially mitigated by the fact that any amount owed from a reinsurance counterparty would be netted against any losses or acquisition costs the Company would pay in the future. The Company monitors the collectability of these balances on a regular basis.
F-64
23. Commitments and Contingencies
Operating leases
The Company leases offices space in Bermuda and in New Jersey, U.S.A. The leases have been accounted for as operating leases. Total rent expense for each of the years ended
December 31, 2018
,
2017
and
2016
were
$0.8 million
.
Future minimum rental commitments as of
December 31, 2018
under these leases are expected to be as follows:
|
2019
|
$
|
935
|
|
|
2020
|
839
|
|
|
|
2021
|
236
|
|
|
|
2022
|
39
|
|
|
|
2023
|
—
|
|
|
|
Thereafter
|
—
|
|
|
|
$
|
2,049
|
|
|
Agreements
Third Point LLC
In June 2016, Third Point Re, Third Point Re BDA, TPRUSA and Third Point Re USA entered into JV Agreements with Third Point LLC and TP GP for an additional five year term, effective on December 22, 2016. These agreements have similar terms to the expired agreements, however, the management fee was reduced from
2%
to
1.5%
.
As a result of the change in investment structure described in Note 4, pursuant to the 2018 LPA effective August 31, 2018, management fees are charged at the TP Fund level and are calculated based on
1.5%
of the investment in TP Fund and multiplied by an exposure multiplier computed by dividing the average daily investment exposure leverage of the TP Fund by the average daily investment exposure leverage of the Offshore Master Fund. The JV Agreements will be terminated on the date that all net investment assets have been transferred to TP Fund pursuant to the Subscription Agreement.
NetJets
In September 2016, the Company traded in its existing aircraft and acquired from NetJets Sales Inc. (“NetJets”) an undivided
31.25%
interest in a new aircraft for a
five
year period. The agreement with NetJets provides for monthly management fees, occupied hourly fees and other fees.
Future minimum management fee commitments as of
December 31, 2018
under the existing agreement are expected to be as follows:
|
2019
|
$
|
738
|
|
|
2020
|
765
|
|
|
|
2021
|
529
|
|
|
|
2022
|
—
|
|
|
|
2023
|
—
|
|
|
|
$
|
2,032
|
|
|
Employment agreements
As of
December 31, 2018
, the Company has entered into employment agreements with certain of its executive officers. Such employment arrangements provide for compensation in the form of base salary, annual bonus, share-based awards, participation in the Company’s employee benefit programs and the reimbursements of expenses.
F-65
Investments
Under the new investment account structure described in
Note 4
, the Company does not have any unfunded commitments or obligations.
Prior to the change in the Company’s investment account structure, the Company purchased loan and other participation interests, such as bank debt, which may have included revolving credit arrangements or other financing commitments obligating the Company to advance additional amounts on demand.
Financing
In February 2015, TPRUSA issued
$115.0 million
of Notes due February 13, 2025. The Notes bear interest at
7.0%
and interest is payable semi-annually on February 13 and August 13 of each year. The Notes are fully and unconditionally guaranteed by Third Point Re, and, in certain circumstances specified in the indenture governing the Notes, certain existing or future subsidiaries of the Company may be required to guarantee the Notes.
Letters of Credit
See
Note 13
for additional information related to the Company’s letter of credit facilities.
Litigation
From time to time in the normal course of business, the Company may be involved in formal and informal dispute resolution procedures, which may include arbitration or litigation, the outcomes of which determine the rights and obligations under the Company’s reinsurance contracts and other contractual agreements. In some disputes, the Company may seek to enforce its rights under an agreement or to collect funds owed to it. In other matters, the Company may resist attempts by others to collect funds or enforce alleged rights. The Company is not currently involved in any material formal or informal dispute resolution procedures.
Reinsurance contracts
The Company is subject to customary termination and collateral provisions within certain of its reinsurance contracts, based on reductions of capital and surplus. The inclusion and terms of these provisions vary by contract but are typically set at a
20%
or greater reduction of capital and surplus over any 12 month period. For the year ended December 31, 2018, the decrease in shareholders’ equity attributable to common shareholder’s of Third Point Re and Third Point Re BDA both exceeded
20%
. As a result, termination or collateral rights for some of Third Point Re BDA’s and Third Point Re USA’s reinsurance contracts can be exercised. The Company has not been advised by any client of their intention to exercise these rights; however, they may do so in the future. The exercising of such rights could cause Third Point Re BDA to have to return premiums and/or post additional collateral, however the impact cannot be reasonably estimated. In each case, this could cause Third Point Re BDA to liquidate investments in TP Fund to return to clients or to post as additional collateral.
24. Segment reporting
The determination of the Company’s business segments is based on the manner in which management monitors the performance of its operations. The Company reports
one
operating segment, Property and Casualty Reinsurance. Non-underwriting income and expenses including:
net investment income (loss)
, certain general and administrative expenses related to corporate activities, interest expense,
foreign exchange (gains) losses
and
income tax (expense) benefit
are presented as a reconciliation to the Company’s consolidated results. The Company does not manage its assets by segment; accordingly, total assets are not allocated to the segments.
F-66
The following is a summary of the Company’s operating segment results for the years ended
December 31, 2018
,
2017
and
2016
:
|
2018
|
2017
|
2016
|
|||||||||||||||||||||
|
Property and Casualty Reinsurance
|
Total
(1)
|
Property and Casualty Reinsurance
|
Total
(1)
|
Property and Casualty Reinsurance
|
Total
(1)
|
||||||||||||||||||
|
Revenues
|
|||||||||||||||||||||||
|
Gross premiums written
|
$
|
578,252
|
|
$
|
578,252
|
|
$
|
641,620
|
|
$
|
641,620
|
|
$
|
617,374
|
|
$
|
617,374
|
|
|||||
|
Gross premiums ceded
|
(19,895
|
)
|
(19,895
|
)
|
(2,475
|
)
|
(2,475
|
)
|
(2,325
|
)
|
(2,325
|
)
|
|||||||||||
|
Net premiums written
|
558,357
|
|
558,357
|
|
639,145
|
|
639,145
|
|
615,049
|
|
615,049
|
|
|||||||||||
|
Change in net unearned premium reserves
|
63,085
|
|
63,085
|
|
(92,087
|
)
|
(92,087
|
)
|
(24,859
|
)
|
(24,859
|
)
|
|||||||||||
|
Net premiums earned
|
621,442
|
|
621,442
|
|
547,058
|
|
547,058
|
|
590,190
|
|
590,190
|
|
|||||||||||
|
Expenses
|
|||||||||||||||||||||||
|
Loss and loss adjustment expenses incurred, net
|
438,414
|
|
438,414
|
|
370,058
|
|
370,058
|
|
395,932
|
|
395,932
|
|
|||||||||||
|
Acquisition costs, net
|
206,498
|
|
206,498
|
|
188,904
|
|
188,904
|
|
222,150
|
|
222,150
|
|
|||||||||||
|
General and administrative expenses
|
18,635
|
|
18,635
|
|
30,656
|
|
30,656
|
|
22,160
|
|
22,160
|
|
|||||||||||
|
Total expenses
|
663,547
|
|
663,547
|
|
589,618
|
|
589,618
|
|
640,242
|
|
640,242
|
|
|||||||||||
|
Net underwriting loss
|
$
|
(42,105
|
)
|
(42,105
|
)
|
$
|
(42,560
|
)
|
(42,560
|
)
|
$
|
(50,052
|
)
|
(50,052
|
)
|
||||||||
|
Net investment income (loss)
|
(251,433
|
)
|
391,953
|
|
98,825
|
|
|||||||||||||||||
|
Corporate expenses
|
(17,606
|
)
|
(22,447
|
)
|
(17,207
|
)
|
|||||||||||||||||
|
Other expenses
|
(9,610
|
)
|
(12,674
|
)
|
(8,387
|
)
|
|||||||||||||||||
|
Interest expense
|
(8,228
|
)
|
(8,225
|
)
|
(8,231
|
)
|
|||||||||||||||||
|
Foreign exchange gains (losses)
|
7,503
|
|
(12,300
|
)
|
19,521
|
|
|||||||||||||||||
|
Income tax (expense) benefit
|
4,010
|
|
(11,976
|
)
|
(5,593
|
)
|
|||||||||||||||||
|
Net income attributable to noncontrolling interests in related party
|
(223
|
)
|
(3,973
|
)
|
(1,241
|
)
|
|||||||||||||||||
|
Net income (loss) available to Third Point Re common shareholders
|
$
|
(317,692
|
)
|
$
|
277,798
|
|
$
|
27,635
|
|
||||||||||||||
|
Property and Casualty Reinsurance - Underwriting Ratios
(2)
:
|
|||||||||||||||||||||||
|
Loss ratio
|
70.6
|
%
|
67.6
|
%
|
67.1
|
%
|
|||||||||||||||||
|
Acquisition cost ratio
|
33.2
|
%
|
34.5
|
%
|
37.6
|
%
|
|||||||||||||||||
|
Composite ratio
|
103.8
|
%
|
102.1
|
%
|
104.7
|
%
|
|||||||||||||||||
|
General and administrative expense ratio
|
3.0
|
%
|
5.6
|
%
|
3.8
|
%
|
|||||||||||||||||
|
Combined ratio
|
106.8
|
%
|
107.7
|
%
|
108.5
|
%
|
|||||||||||||||||
|
(1)
|
As a result of the change in the Company’s investment account structure, the Company is no longer quantifying the net investment income on float and all non-underwriting income and expenses are presented as a reconciliation to the Company’s consolidated results. Prior year comparatives have been adjusted to conform with the revised presentation.
|
|
(2)
|
Underwriting ratios are calculated by dividing the related expense by net premiums earned.
|
F-67
The following table lists the number of contracts that individually contributed more than 10% of total gross premiums written for the years ended
December 31, 2018
,
2017
and
2016
as a percentage of total gross premiums written in the relevant year:
|
2018
|
2017
|
2016
|
||||||
|
Largest contract
|
17.5
|
%
|
16.1
|
%
|
16.1
|
%
|
||
|
Second largest contract
|
12.1
|
%
|
14.1
|
%
|
n/a
|
|
||
|
Third largest contract
|
n/a
|
|
13.1
|
%
|
n/a
|
|
||
|
Total for contracts contributing greater than 10% each
|
29.6
|
%
|
43.3
|
%
|
16.1
|
%
|
||
|
Total for contracts contributing less than 10% each
|
70.4
|
%
|
56.7
|
%
|
83.9
|
%
|
||
|
100.0
|
%
|
100.0
|
%
|
100.0
|
%
|
|||
The following table lists counterparties with whom the Company has reinsurance balances receivable representing more than 10% of the Company’s total reinsurance balances receivable as of
December 31, 2018
and
2017
:
|
December 31, 2018
|
December 31, 2017
|
||||||||||||
|
Counterparty 1
|
$
|
86,155
|
|
14.3
|
%
|
$
|
80,187
|
|
16.8
|
%
|
|||
|
Counterparty 2
|
83,079
|
|
13.8
|
%
|
58,776
|
|
12.4
|
%
|
|||||
|
Counterparty 3
|
69,641
|
|
11.6
|
%
|
51,613
|
|
10.8
|
%
|
|||||
|
Counterparty 4
|
n/a
|
|
n/a
|
|
47,438
|
|
10.0
|
%
|
|||||
|
238,875
|
|
39.7
|
%
|
238,014
|
|
50.0
|
%
|
||||||
|
Other counterparties representing less than 10% each
|
363,573
|
|
60.3
|
%
|
237,994
|
|
50.0
|
%
|
|||||
|
Reinsurance balances receivable
|
$
|
602,448
|
|
100.0
|
%
|
$
|
476,008
|
|
100.0
|
%
|
|||
The following table provides a breakdown of the Company’s gross premiums written by line of business for the
years ended
December 31, 2018
,
2017
and
2016
:
|
2018
|
2017
|
2016
|
||||||||||||||||||
|
Property
|
$
|
9,070
|
|
1.6
|
%
|
$
|
136,999
|
|
21.4
|
%
|
$
|
98,334
|
|
15.9
|
%
|
|||||
|
Casualty
|
235,789
|
|
40.8
|
%
|
269,759
|
|
42.0
|
%
|
213,050
|
|
34.5
|
%
|
||||||||
|
Specialty
|
259,173
|
|
44.8
|
%
|
125,511
|
|
19.6
|
%
|
305,990
|
|
49.6
|
%
|
||||||||
|
Total prospective reinsurance contracts
|
504,032
|
|
87.2
|
%
|
532,269
|
|
83.0
|
%
|
617,374
|
|
100.0
|
%
|
||||||||
|
Retroactive reinsurance contracts
|
74,220
|
|
12.8
|
%
|
109,351
|
|
17.0
|
%
|
—
|
|
—
|
%
|
||||||||
|
$
|
578,252
|
|
100.0
|
%
|
$
|
641,620
|
|
100.0
|
%
|
$
|
617,374
|
|
100.0
|
%
|
||||||
Substantially all of the Company’s business is sourced through reinsurance brokers. The following table sets forth the Company’s premiums written by source that individually contributed more than 10% of total gross premiums written for the years ended
December 31, 2018
,
2017
and
2016
:
|
2018
|
2017
|
2016
|
||||||||||||||||||
|
Largest broker
|
$
|
198,251
|
|
34.3
|
%
|
$
|
243,581
|
|
38.0
|
%
|
$
|
240,172
|
|
38.9
|
%
|
|||||
|
Second largest broker
|
157,542
|
|
27.2
|
%
|
128,648
|
|
20.1
|
%
|
185,638
|
|
30.1
|
%
|
||||||||
|
Third largest broker
|
70,524
|
|
12.2
|
%
|
107,612
|
|
16.8
|
%
|
97,148
|
|
15.7
|
%
|
||||||||
|
Other
|
151,935
|
|
26.3
|
%
|
161,779
|
|
25.1
|
%
|
94,416
|
|
15.3
|
%
|
||||||||
|
$
|
578,252
|
|
100.0
|
%
|
$
|
641,620
|
|
100.0
|
%
|
$
|
617,374
|
|
100.0
|
%
|
||||||
F-68
The following table provides a breakdown of the Company’s gross premiums written by domicile of the ceding companies for the years ended
December 31, 2018
,
2017
and
2016
:
|
2018
|
2017
|
2016
|
||||||||||||||||||
|
United States
|
$
|
326,261
|
|
56.4
|
%
|
$
|
352,539
|
|
54.9
|
%
|
$
|
332,849
|
|
53.9
|
%
|
|||||
|
United Kingdom
|
63,619
|
|
11.0
|
%
|
203,768
|
|
31.8
|
%
|
187,625
|
|
30.4
|
%
|
||||||||
|
Bermuda
|
93,406
|
|
16.2
|
%
|
62,234
|
|
9.7
|
%
|
96,900
|
|
15.7
|
%
|
||||||||
|
Other
|
94,966
|
|
16.4
|
%
|
23,079
|
|
3.6
|
%
|
—
|
|
—
|
%
|
||||||||
|
$
|
578,252
|
|
100.0
|
%
|
$
|
641,620
|
|
100.0
|
%
|
$
|
617,374
|
|
100.0
|
%
|
||||||
25. Statutory requirements
Under the Bermuda Insurance Act 1978, as amended, and related regulations, Third Point Re BDA and Third Point Re USA are subject to capital requirements calculated using the Bermuda Solvency and Capital Requirement (“BSCR”) model, which is a standardized statutory risk-based capital model used to measure the risk associated with Third Point Re BDA’s and Third Point Re USA’s assets, liabilities and premiums. Third Point Re BDA’s and Third Point Re USA’s required statutory capital and surplus under the BSCR model is referred to as the enhanced capital requirement (“ECR”). Third Point Re BDA and Third Point Re USA are required to calculate and submit the ECR to the Bermuda Monetary Authority (“BMA”), annually. Following receipt of the submission of Third Point Re BDA’s and Third Point Re USA’s ECR, the BMA has the authority to impose additional capital requirements (capital add-ons) if it deems necessary. If a company fails to maintain or meet its ECR, the BMA may take various degrees of regulatory action. In 2016, the BMA implemented the economic balance sheet (“EBS”) framework, which is now used as the basis to determine the Company’s ECR. Under the new framework, assets and liabilities are mainly assessed and included on the EBS at fair value, with the insurer’s U.S. GAAP balance sheet serving as a starting point. The model also requires insurers to estimate insurance technical provisions, which consist of the insurer’s insurance related balances valued based on best-estimate cash flows, adjusted to reflect the time value of money using a risk-free discount rate, with the addition of a risk margin to reflect the uncertainty in the underlying cash flows. As of
December 31, 2018
and
2017
, Third Point Re BDA and Third Point Re USA met their ECR.
As of
December 31, 2018
and
2017
, the principal difference between statutory capital and surplus and shareholders’ equity presented in accordance with GAAP is that prepaid expenses is a non-admitted asset for statutory purposes.
Third Point Re BDA and Third Point Re USA are also required under their Class 4 licenses to maintain minimum liquidity ratios whereby the value of their relevant assets are not less than
75%
of the amount of their relevant liabilities for general business. As of
December 31, 2018
and
2017
, Third Point Re BDA and Third Point Re USA met their minimum liquidity ratio requirements.
The following is a summary of actual and required statutory capital and surplus, based on the EBS framework, of Third Point Re BDA and Third Point Re USA as of
December 31, 2018
and
2017
:
|
December 31, 2018
|
December 31, 2017
|
||||||
|
Actual statutory capital and surplus
|
|||||||
|
Third Point Re BDA
|
$
|
1,043,357
|
|
$
|
1,430,174
|
|
|
|
Third Point Re USA
|
255,872
|
|
265,206
|
|
|||
|
Required statutory capital and surplus
|
|||||||
|
Third Point Re BDA
|
574,405
|
|
759,518
|
|
|||
|
Third Point Re USA
|
$
|
100,000
|
|
$
|
93,261
|
|
|
The following is a summary of the statutory
net income (loss)
for Third Point Re and Third Point Re USA for the years ended
December 31, 2018
,
2017
and
2016
:
|
2018
|
2017
|
2016
|
|||||||||
|
Third Point Re BDA
|
$
|
(272,339
|
)
|
$
|
265,903
|
|
$
|
35,096
|
|
||
|
Third Point Re USA
|
$
|
(29,491
|
)
|
$
|
22,310
|
|
$
|
2,701
|
|
||
F-69
Dividend restrictions
Third Point Re BDA
Third Point Re BDA may declare dividends subject to it continuing to meet its solvency and capital requirements, which includes continuing to hold statutory capital and surplus equal to or exceeding its ECR. In addition, Third Point Re BDA is prohibited from declaring or paying in any fiscal year dividends of more than
25%
of its prior year’s statutory capital and surplus unless Third Point Re BDA files with the BMA a signed affidavit by at least
two
members of the Board of Directors attesting that a dividend would not cause Third Point Re BDA to fail to meet its capital requirements. As of
December 31, 2018
, Third Point Re BDA could pay dividends in
2019
of approximately
$260.8 million
(December 31,
2017
-
$357.5 million
) without providing an affidavit to the BMA.
Third Point Re USA
Third Point Re USA may declare dividends subject to it continuing to meet its solvency and capital requirements, which includes continuing to hold statutory capital and surplus equal to or exceeding its ECR. Third Point Re USA is prohibited from declaring or paying in any fiscal year dividends of more than
25%
of its prior year’s statutory capital and surplus, unless Third Point Re USA files with the BMA a signed affidavit by at least
two
members of the Board of Directors attesting that a dividend would not cause Third Point Re USA to fail to meet its capital requirements. Third Point Re USA is also restricted by the amount of shareholder’s equity that is available for the payment of dividends and must maintain a minimum shareholder’s equity of
$250.0 million
as per the Net Worth Maintenance Agreement. As of
December 31, 2018
, Third Point Re USA could pay dividends of approximately
$1.4 million
(December 31,
2017
-
$24.3 million
).
26. Subsequent event
Second Amended and Restated Limited Partnership Agreement
On February 28, 2019, Third Point Re, Third Point Re BDA and Third Point Re USA entered into the Amended LPA with TP GP, which amended and restated the 2018 LPA. The Amended LPA revised the management fee from
1.5%
per annum to
1.25%
per annum with effect from January 1, 2019. In addition, pursuant to the Amended LPA, TP GP shall notify the Company if Third Point LLC or its affiliates (either alone or together with a third party) form certain investment vehicles that pursue an investment strategy primarily comprised of debt or other credit-related investments (the “Permitted Funds”). The Amended LPA provides the Company with the right to withdraw up to
$250.0 million
in 2019 and a separate
$250.0 million
during the period from January 1, 2020 through December 31, 2021 for the purpose of immediately investing such amounts in Permitted Funds. Furthermore, the Amended LPA adjusted the loss carryforward terms of the LPA, which relate to the calculation of TP GP’s performance compensation under the LPA, to preserve the loss carryforward attributable to the Company’s investment in TP Fund when contributions to TP Fund are made within nine months of certain types of withdrawals from TP Fund. The term of the Amended LPA ends December 31, 2021, which is consistent with the term under the 2018 LPA. All other material terms of the Amended LPA remain consistent with the LPA.
27. Supplemental guarantor information
Third Point Re fully and unconditionally guarantees the
$115.0 million
of Notes issued by TPRUSA, a wholly owned subsidiary.
The following information sets forth the consolidating balance sheets as of
December 31, 2018
and
2017
and the consolidating statements of income (loss) and cash flows for the years ended
December 31, 2018
,
2017
and
2016
for Third Point Re, TPRUSA and the non-guarantor subsidiaries of Third Point Re. Investments in subsidiaries are accounted for on the equity method; accordingly, entries necessary to consolidate the parent guarantor, TPRUSA and all other subsidiaries are reflected in the eliminations column.
F-70
|
CONSOLIDATING BALANCE SHEET
|
|||||||||||||||||||
|
As of December 31, 2018
|
|||||||||||||||||||
|
Third Point Re
|
TPRUSA
|
Non-Guarantor Subsidiaries
|
Eliminations
|
Consolidated
|
|||||||||||||||
|
Assets
|
|||||||||||||||||||
|
Total investments in securities
|
$
|
—
|
|
$
|
—
|
|
$
|
1,523,728
|
|
$
|
—
|
|
$
|
1,523,728
|
|
||||
|
Cash and cash equivalents
|
—
|
|
187
|
|
103,996
|
|
—
|
|
104,183
|
|
|||||||||
|
Restricted cash and cash equivalents
|
—
|
|
—
|
|
609,154
|
|
—
|
|
609,154
|
|
|||||||||
|
Investment in subsidiaries
|
1,207,161
|
|
251,350
|
|
175,758
|
|
(1,634,269
|
)
|
—
|
|
|||||||||
|
Due from brokers
|
—
|
|
—
|
|
1,411
|
|
—
|
|
1,411
|
|
|||||||||
|
Interest and dividends receivable
|
—
|
|
—
|
|
1,316
|
|
—
|
|
1,316
|
|
|||||||||
|
Reinsurance balances receivable
|
—
|
|
—
|
|
602,448
|
|
—
|
|
602,448
|
|
|||||||||
|
Deferred acquisition costs, net
|
—
|
|
—
|
|
203,842
|
|
—
|
|
203,842
|
|
|||||||||
|
Unearned premiums ceded
|
—
|
|
—
|
|
17,552
|
|
—
|
|
17,552
|
|
|||||||||
|
Loss and loss adjustment expenses recoverable
|
—
|
|
—
|
|
2,031
|
|
—
|
|
2,031
|
|
|||||||||
|
Amounts due from (to) affiliates
|
(3,522
|
)
|
52
|
|
3,470
|
|
—
|
|
—
|
|
|||||||||
|
Other assets
|
1,673
|
|
5,069
|
|
13,827
|
|
—
|
|
20,569
|
|
|||||||||
|
Total assets
|
$
|
1,205,312
|
|
$
|
256,658
|
|
$
|
3,258,533
|
|
$
|
(1,634,269
|
)
|
$
|
3,086,234
|
|
||||
|
Liabilities
|
|||||||||||||||||||
|
Accounts payable and accrued expenses
|
$
|
738
|
|
$
|
70
|
|
$
|
6,453
|
|
$
|
—
|
|
$
|
7,261
|
|
||||
|
Reinsurance balances payable
|
—
|
|
—
|
|
69,701
|
|
—
|
|
69,701
|
|
|||||||||
|
Deposit liabilities
|
—
|
|
—
|
|
145,342
|
|
—
|
|
145,342
|
|
|||||||||
|
Unearned premium reserves
|
—
|
|
—
|
|
602,936
|
|
—
|
|
602,936
|
|
|||||||||
|
Loss and loss adjustment expense reserves
|
—
|
|
—
|
|
937,157
|
|
—
|
|
937,157
|
|
|||||||||
|
Participation agreement with related party investment fund
|
—
|
|
—
|
|
2,297
|
|
—
|
|
2,297
|
|
|||||||||
|
Interest and dividends payable
|
—
|
|
3,055
|
|
—
|
|
—
|
|
3,055
|
|
|||||||||
|
Senior notes payable, net of deferred costs
|
—
|
|
113,911
|
|
—
|
|
—
|
|
113,911
|
|
|||||||||
|
Total liabilities
|
738
|
|
117,036
|
|
1,763,886
|
|
—
|
|
1,881,660
|
|
|||||||||
|
Redeemable noncontrolling interests in related party
|
—
|
|
—
|
|
—
|
|
—
|
|
—
|
|
|||||||||
|
Shareholders' equity
|
|||||||||||||||||||
|
Common shares
|
9,364
|
|
—
|
|
1,239
|
|
(1,239
|
)
|
9,364
|
|
|||||||||
|
Additional paid-in capital
|
918,882
|
|
176,005
|
|
1,557,016
|
|
(1,733,021
|
)
|
918,882
|
|
|||||||||
|
Retained earnings (deficit)
|
276,328
|
|
(36,383
|
)
|
(63,608
|
)
|
99,991
|
|
276,328
|
|
|||||||||
|
Shareholders’ equity attributable to Third Point Re common shareholders
|
1,204,574
|
|
139,622
|
|
1,494,647
|
|
(1,634,269
|
)
|
1,204,574
|
|
|||||||||
|
Total shareholders’ equity
|
1,204,574
|
|
139,622
|
|
1,494,647
|
|
(1,634,269
|
)
|
1,204,574
|
|
|||||||||
|
Total liabilities, noncontrolling interests and shareholders’ equity
|
$
|
1,205,312
|
|
$
|
256,658
|
|
$
|
3,258,533
|
|
$
|
(1,634,269
|
)
|
$
|
3,086,234
|
|
||||
F-71
|
CONSOLIDATING BALANCE SHEET
|
|||||||||||||||||||
|
As of December 31, 2017
|
|||||||||||||||||||
|
Third Point Re
|
TPRUSA
|
Non-Guarantor Subsidiaries
|
Eliminations
|
Consolidated
|
|||||||||||||||
|
Assets
|
|||||||||||||||||||
|
Total investments in securities
|
$
|
—
|
|
$
|
—
|
|
$
|
2,995,939
|
|
$
|
—
|
|
$
|
2,995,939
|
|
||||
|
Cash and cash equivalents
|
9
|
|
199
|
|
7,989
|
|
—
|
|
8,197
|
|
|||||||||
|
Restricted cash and cash equivalents
|
—
|
|
—
|
|
541,136
|
|
—
|
|
541,136
|
|
|||||||||
|
Investment in subsidiaries
|
1,657,467
|
|
274,272
|
|
164,909
|
|
(2,096,648
|
)
|
—
|
|
|||||||||
|
Due from brokers
|
—
|
|
—
|
|
305,093
|
|
—
|
|
305,093
|
|
|||||||||
|
Derivative assets, at fair value
|
—
|
|
—
|
|
73,372
|
|
—
|
|
73,372
|
|
|||||||||
|
Interest and dividends receivable
|
—
|
|
—
|
|
3,774
|
|
—
|
|
3,774
|
|
|||||||||
|
Reinsurance balances receivable
|
—
|
|
—
|
|
476,008
|
|
—
|
|
476,008
|
|
|||||||||
|
Deferred acquisition costs, net
|
—
|
|
—
|
|
258,793
|
|
—
|
|
258,793
|
|
|||||||||
|
Unearned premiums ceded
|
—
|
|
—
|
|
1,049
|
|
—
|
|
1,049
|
|
|||||||||
|
Loss and loss adjustment expenses recoverable
|
—
|
|
—
|
|
1,113
|
|
—
|
|
1,113
|
|
|||||||||
|
Amounts due from (to) affiliates
|
(1,288
|
)
|
412
|
|
876
|
|
—
|
|
—
|
|
|||||||||
|
Other assets
|
664
|
|
—
|
|
6,656
|
|
—
|
|
7,320
|
|
|||||||||
|
Total assets
|
$
|
1,656,852
|
|
$
|
274,883
|
|
$
|
4,836,707
|
|
$
|
(2,096,648
|
)
|
$
|
4,671,794
|
|
||||
|
Liabilities
|
|||||||||||||||||||
|
Accounts payable and accrued expenses (1)
|
$
|
763
|
|
$
|
(8,805
|
)
|
$
|
42,674
|
|
$
|
—
|
|
$
|
34,632
|
|
||||
|
Reinsurance balances payable
|
—
|
|
—
|
|
41,614
|
|
—
|
|
41,614
|
|
|||||||||
|
Deposit liabilities
|
—
|
|
—
|
|
129,133
|
|
—
|
|
129,133
|
|
|||||||||
|
Unearned premium reserves
|
—
|
|
—
|
|
649,518
|
|
—
|
|
649,518
|
|
|||||||||
|
Loss and loss adjustment expense reserves
|
—
|
|
—
|
|
720,570
|
|
—
|
|
720,570
|
|
|||||||||
|
Securities sold, not yet purchased, at fair value
|
—
|
|
—
|
|
394,278
|
|
—
|
|
394,278
|
|
|||||||||
|
Securities sold under an agreement to repurchase
|
—
|
|
—
|
|
29,618
|
|
—
|
|
29,618
|
|
|||||||||
|
Due to brokers
|
—
|
|
—
|
|
770,205
|
|
—
|
|
770,205
|
|
|||||||||
|
Derivative liabilities, at fair value
|
—
|
|
—
|
|
14,503
|
|
—
|
|
14,503
|
|
|||||||||
|
Interest and dividends payable
|
—
|
|
3,055
|
|
1,220
|
|
—
|
|
4,275
|
|
|||||||||
|
Senior notes payable, net of deferred costs
|
—
|
|
113,733
|
|
—
|
|
—
|
|
113,733
|
|
|||||||||
|
Total liabilities
|
763
|
|
107,983
|
|
2,793,333
|
|
—
|
|
2,902,079
|
|
|||||||||
|
Redeemable noncontrolling interests in related party
|
—
|
|
—
|
|
108,219
|
|
—
|
|
108,219
|
|
|||||||||
|
Shareholders’ equity
|
|||||||||||||||||||
|
Common shares
|
10,723
|
|
—
|
|
1,250
|
|
(1,250
|
)
|
10,723
|
|
|||||||||
|
Treasury shares
|
(48,253
|
)
|
—
|
|
—
|
|
—
|
|
(48,253
|
)
|
|||||||||
|
Additional paid-in capital
|
1,099,599
|
|
165,097
|
|
1,531,770
|
|
(1,696,867
|
)
|
1,099,599
|
|
|||||||||
|
Retained earnings (deficit)
|
594,020
|
|
1,803
|
|
396,728
|
|
(398,531
|
)
|
594,020
|
|
|||||||||
|
Shareholders’ equity attributable to Third Point Re common shareholders
|
1,656,089
|
|
166,900
|
|
1,929,748
|
|
(2,096,648
|
)
|
1,656,089
|
|
|||||||||
|
Noncontrolling interests in related party
|
—
|
|
—
|
|
5,407
|
|
—
|
|
5,407
|
|
|||||||||
|
Total shareholders’ equity
|
1,656,089
|
|
166,900
|
|
1,935,155
|
|
(2,096,648
|
)
|
1,661,496
|
|
|||||||||
|
Total liabilities, noncontrolling interests and shareholders’ equity
|
$
|
1,656,852
|
|
$
|
274,883
|
|
$
|
4,836,707
|
|
$
|
(2,096,648
|
)
|
$
|
4,671,794
|
|
||||
(1) Negative balance of
$8.8 million
represents net deferred tax assets that are offset by net deferred tax liabilities in Third Point Re USA of
$9.9 million
, resulting in a net liability position as of December 31,
2017
.
F-72
|
CONSOLIDATING STATEMENT OF LOSS
|
|||||||||||||||||||
|
Year Ended December 31, 2018
|
|||||||||||||||||||
|
Third Point Re
|
TPRUSA
|
Non-Guarantor Subsidiaries
|
Eliminations
|
Consolidated
|
|||||||||||||||
|
Revenues
|
|||||||||||||||||||
|
Gross premiums written
|
$
|
—
|
|
$
|
—
|
|
$
|
578,252
|
|
$
|
—
|
|
$
|
578,252
|
|
||||
|
Gross premiums ceded
|
—
|
|
—
|
|
(19,895
|
)
|
—
|
|
(19,895
|
)
|
|||||||||
|
Net premiums written
|
—
|
|
—
|
|
558,357
|
|
—
|
|
558,357
|
|
|||||||||
|
Change in net unearned premium reserves
|
—
|
|
—
|
|
63,085
|
|
—
|
|
63,085
|
|
|||||||||
|
Net premiums earned
|
—
|
|
—
|
|
621,442
|
|
—
|
|
621,442
|
|
|||||||||
|
Net investment loss
|
—
|
|
—
|
|
(251,433
|
)
|
—
|
|
(251,433
|
)
|
|||||||||
|
Equity in losses of subsidiaries
|
(310,552
|
)
|
(29,492
|
)
|
(57
|
)
|
340,101
|
|
—
|
|
|||||||||
|
Total revenues
|
(310,552
|
)
|
(29,492
|
)
|
369,952
|
|
340,101
|
|
370,009
|
|
|||||||||
|
Expenses
|
|||||||||||||||||||
|
Loss and loss adjustment expenses incurred, net
|
—
|
|
—
|
|
438,414
|
|
—
|
|
438,414
|
|
|||||||||
|
Acquisition costs, net
|
—
|
|
—
|
|
206,498
|
|
—
|
|
206,498
|
|
|||||||||
|
General and administrative expenses
|
7,140
|
|
47
|
|
29,054
|
|
—
|
|
36,241
|
|
|||||||||
|
Other expenses
|
—
|
|
—
|
|
9,610
|
|
—
|
|
9,610
|
|
|||||||||
|
Interest expense
|
—
|
|
8,228
|
|
—
|
|
—
|
|
8,228
|
|
|||||||||
|
Foreign exchange gains
|
—
|
|
—
|
|
(7,503
|
)
|
—
|
|
(7,503
|
)
|
|||||||||
|
Total expenses
|
7,140
|
|
8,275
|
|
676,073
|
|
—
|
|
691,488
|
|
|||||||||
|
Loss before income tax benefit
|
(317,692
|
)
|
(37,767
|
)
|
(306,121
|
)
|
340,101
|
|
(321,479
|
)
|
|||||||||
|
Income tax (expense) benefit
|
—
|
|
(419
|
)
|
4,429
|
|
—
|
|
4,010
|
|
|||||||||
|
Net loss
|
(317,692
|
)
|
(38,186
|
)
|
(301,692
|
)
|
340,101
|
|
(317,469
|
)
|
|||||||||
|
Net income attributable to noncontrolling interests in related party
|
—
|
|
—
|
|
(223
|
)
|
—
|
|
(223
|
)
|
|||||||||
|
Net loss attributable to Third Point Re common shareholders
|
$
|
(317,692
|
)
|
$
|
(38,186
|
)
|
$
|
(301,915
|
)
|
$
|
340,101
|
|
$
|
(317,692
|
)
|
||||
F-73
|
CONSOLIDATING STATEMENT OF INCOME
|
|||||||||||||||||||
|
Year Ended December 31, 2017
|
|||||||||||||||||||
|
Third Point Re
|
TPRUSA
|
Non-Guarantor Subsidiaries
|
Eliminations
|
Consolidated
|
|||||||||||||||
|
Revenues
|
|||||||||||||||||||
|
Gross premiums written
|
$
|
—
|
|
$
|
—
|
|
$
|
641,620
|
|
$
|
—
|
|
$
|
641,620
|
|
||||
|
Gross premiums ceded
|
—
|
|
—
|
|
(2,475
|
)
|
—
|
|
(2,475
|
)
|
|||||||||
|
Net premiums written
|
—
|
|
—
|
|
639,145
|
|
—
|
|
639,145
|
|
|||||||||
|
Change in net unearned premium reserves
|
—
|
|
—
|
|
(92,087
|
)
|
—
|
|
(92,087
|
)
|
|||||||||
|
Net premiums earned
|
—
|
|
—
|
|
547,058
|
|
—
|
|
547,058
|
|
|||||||||
|
Net investment income
|
—
|
|
—
|
|
391,953
|
|
—
|
|
391,953
|
|
|||||||||
|
Equity in earnings (losses) of subsidiaries
|
283,088
|
|
22,309
|
|
(57
|
)
|
(305,340
|
)
|
—
|
|
|||||||||
|
Total revenues
|
283,088
|
|
22,309
|
|
938,954
|
|
(305,340
|
)
|
939,011
|
|
|||||||||
|
Expenses
|
|||||||||||||||||||
|
Loss and loss adjustment expenses incurred, net
|
—
|
|
—
|
|
370,058
|
|
—
|
|
370,058
|
|
|||||||||
|
Acquisition costs, net
|
—
|
|
—
|
|
188,904
|
|
—
|
|
188,904
|
|
|||||||||
|
General and administrative expenses
|
5,290
|
|
49
|
|
47,764
|
|
—
|
|
53,103
|
|
|||||||||
|
Other expenses
|
—
|
|
—
|
|
12,674
|
|
—
|
|
12,674
|
|
|||||||||
|
Interest expense
|
—
|
|
8,225
|
|
—
|
|
—
|
|
8,225
|
|
|||||||||
|
Foreign exchange losses
|
—
|
|
—
|
|
12,300
|
|
—
|
|
12,300
|
|
|||||||||
|
Total expenses
|
5,290
|
|
8,274
|
|
631,700
|
|
—
|
|
645,264
|
|
|||||||||
|
Income before income tax (expense) benefit
|
277,798
|
|
14,035
|
|
307,254
|
|
(305,340
|
)
|
293,747
|
|
|||||||||
|
Income tax (expense) benefit
|
—
|
|
3,062
|
|
(15,038
|
)
|
—
|
|
(11,976
|
)
|
|||||||||
|
Net income
|
277,798
|
|
17,097
|
|
292,216
|
|
(305,340
|
)
|
281,771
|
|
|||||||||
|
Net income attributable to noncontrolling interests in related party
|
—
|
|
—
|
|
(3,973
|
)
|
—
|
|
(3,973
|
)
|
|||||||||
|
Net income available to Third Point Re common shareholders
|
$
|
277,798
|
|
$
|
17,097
|
|
$
|
288,243
|
|
$
|
(305,340
|
)
|
$
|
277,798
|
|
||||
F-74
|
CONSOLIDATING STATEMENT OF INCOME (LOSS)
|
|||||||||||||||||||
|
Year Ended December 31, 2016
|
|||||||||||||||||||
|
Third Point Re
|
TPRUSA
|
Non-Guarantor Subsidiaries
|
Eliminations
|
Consolidated
|
|||||||||||||||
|
Revenues
|
|||||||||||||||||||
|
Gross premiums written
|
$
|
—
|
|
$
|
—
|
|
$
|
617,374
|
|
$
|
—
|
|
$
|
617,374
|
|
||||
|
Gross premiums ceded
|
—
|
|
—
|
|
(2,325
|
)
|
—
|
|
(2,325
|
)
|
|||||||||
|
Net premiums written
|
—
|
|
—
|
|
615,049
|
|
—
|
|
615,049
|
|
|||||||||
|
Change in net unearned premium reserves
|
—
|
|
—
|
|
(24,859
|
)
|
—
|
|
(24,859
|
)
|
|||||||||
|
Net premiums earned
|
—
|
|
—
|
|
590,190
|
|
—
|
|
590,190
|
|
|||||||||
|
Net investment income
|
—
|
|
—
|
|
98,825
|
|
—
|
|
98,825
|
|
|||||||||
|
Equity in earnings (losses) of subsidiaries
|
32,347
|
|
2,701
|
|
(107
|
)
|
(34,941
|
)
|
—
|
|
|||||||||
|
Total revenues
|
32,347
|
|
2,701
|
|
688,908
|
|
(34,941
|
)
|
689,015
|
|
|||||||||
|
Expenses
|
|||||||||||||||||||
|
Loss and loss adjustment expenses incurred, net
|
—
|
|
—
|
|
395,932
|
|
—
|
|
395,932
|
|
|||||||||
|
Acquisition costs, net
|
—
|
|
—
|
|
222,150
|
|
—
|
|
222,150
|
|
|||||||||
|
General and administrative expenses
|
4,712
|
|
40
|
|
34,615
|
|
—
|
|
39,367
|
|
|||||||||
|
Other expenses
|
—
|
|
—
|
|
8,387
|
|
—
|
|
8,387
|
|
|||||||||
|
Interest expense
|
—
|
|
8,231
|
|
—
|
|
—
|
|
8,231
|
|
|||||||||
|
Foreign exchange gains
|
—
|
|
—
|
|
(19,521
|
)
|
—
|
|
(19,521
|
)
|
|||||||||
|
Total expenses
|
4,712
|
|
8,271
|
|
641,563
|
|
—
|
|
654,546
|
|
|||||||||
|
Income (loss) before income tax (expense) benefit
|
27,635
|
|
(5,570
|
)
|
47,345
|
|
(34,941
|
)
|
34,469
|
|
|||||||||
|
Income tax (expense) benefit
|
—
|
|
2,895
|
|
(8,488
|
)
|
—
|
|
(5,593
|
)
|
|||||||||
|
Net income (loss)
|
27,635
|
|
(2,675
|
)
|
38,857
|
|
(34,941
|
)
|
28,876
|
|
|||||||||
|
Net income attributable to noncontrolling interests in related party
|
—
|
|
—
|
|
(1,241
|
)
|
—
|
|
(1,241
|
)
|
|||||||||
|
Net income (loss) available to Third Point Re common shareholders
|
$
|
27,635
|
|
$
|
(2,675
|
)
|
$
|
37,616
|
|
$
|
(34,941
|
)
|
$
|
27,635
|
|
||||
F-75
|
CONSOLIDATING STATEMENT OF CASH FLOWS
|
|||||||||||||||||||
|
Year Ended December 31, 2018
|
|||||||||||||||||||
|
Third Point Re
|
TPRUSA
|
Non-Guarantor Subsidiaries
|
Eliminations
|
Consolidated
|
|||||||||||||||
|
Operating activities
|
|||||||||||||||||||
|
Net loss
|
$
|
(317,692
|
)
|
$
|
(38,186
|
)
|
$
|
(301,692
|
)
|
$
|
340,101
|
|
$
|
(317,469
|
)
|
||||
|
Adjustments to reconcile net loss to net cash provided by (used in) operating activities:
|
|||||||||||||||||||
|
Equity in losses of subsidiaries
|
310,552
|
|
29,492
|
|
57
|
|
(340,101
|
)
|
—
|
|
|||||||||
|
Share compensation expense
|
610
|
|
—
|
|
4,346
|
|
—
|
|
4,956
|
|
|||||||||
|
Net interest income on deposit liabilities
|
—
|
|
—
|
|
(1,273
|
)
|
—
|
|
(1,273
|
)
|
|||||||||
|
Net realized and unrealized gain on investments and derivatives
|
—
|
|
—
|
|
(34,145
|
)
|
—
|
|
(34,145
|
)
|
|||||||||
|
Net unrealized loss on investment in related party investment fund
|
—
|
|
—
|
|
280,847
|
|
—
|
|
280,847
|
|
|||||||||
|
Net foreign exchange gains
|
—
|
|
—
|
|
(7,503
|
)
|
—
|
|
(7,503
|
)
|
|||||||||
|
Amortization of premium and accretion of discount, net
|
—
|
|
178
|
|
3,956
|
|
—
|
|
4,134
|
|
|||||||||
|
Changes in assets and liabilities:
|
|||||||||||||||||||
|
Reinsurance balances receivable
|
—
|
|
—
|
|
(120,620
|
)
|
—
|
|
(120,620
|
)
|
|||||||||
|
Deferred acquisition costs, net
|
—
|
|
—
|
|
54,951
|
|
—
|
|
54,951
|
|
|||||||||
|
Unearned premiums ceded
|
—
|
|
—
|
|
(16,503
|
)
|
—
|
|
(16,503
|
)
|
|||||||||
|
Loss and loss adjustment expenses recoverable
|
—
|
|
—
|
|
(918
|
)
|
—
|
|
(918
|
)
|
|||||||||
|
Other assets
|
(1,009
|
)
|
(5,069
|
)
|
(7,408
|
)
|
—
|
|
(13,486
|
)
|
|||||||||
|
Interest and dividends receivable, net
|
—
|
|
—
|
|
(2,716
|
)
|
—
|
|
(2,716
|
)
|
|||||||||
|
Unearned premium reserves
|
—
|
|
—
|
|
(46,582
|
)
|
—
|
|
(46,582
|
)
|
|||||||||
|
Loss and loss adjustment expense reserves
|
—
|
|
—
|
|
225,670
|
|
—
|
|
225,670
|
|
|||||||||
|
Accounts payable and accrued expenses
|
(25
|
)
|
5,513
|
|
(30,172
|
)
|
—
|
|
(24,684
|
)
|
|||||||||
|
Reinsurance balances payable
|
—
|
|
—
|
|
28,728
|
|
—
|
|
28,728
|
|
|||||||||
|
Amounts due from (to) affiliates
|
2,234
|
|
360
|
|
(2,594
|
)
|
—
|
|
—
|
|
|||||||||
|
Net cash provided by (used in) operating activities
|
(5,330
|
)
|
(7,712
|
)
|
26,429
|
|
—
|
|
13,387
|
|
|||||||||
|
Investing activities
|
|||||||||||||||||||
|
Net redemptions from related party investment fund
|
—
|
|
—
|
|
6,342
|
|
—
|
|
6,342
|
|
|||||||||
|
Change in participation agreement with related party investment fund
|
—
|
|
—
|
|
(20,852
|
)
|
—
|
|
(20,852
|
)
|
|||||||||
|
Purchases of investments
|
—
|
|
—
|
|
(3,483,319
|
)
|
—
|
|
(3,483,319
|
)
|
|||||||||
|
Proceeds from sales and maturities of investments
|
—
|
|
—
|
|
3,475,515
|
|
—
|
|
3,475,515
|
|
|||||||||
|
Purchases of investments to cover short sales
|
—
|
|
—
|
|
(853,798
|
)
|
—
|
|
(853,798
|
)
|
|||||||||
|
Proceeds from short sales of investments
|
—
|
|
—
|
|
800,508
|
|
—
|
|
800,508
|
|
|||||||||
|
Change in due to/from brokers, net
|
—
|
|
—
|
|
482,778
|
|
—
|
|
482,778
|
|
|||||||||
|
Decrease in securities sold under an agreement to repurchase
|
—
|
|
—
|
|
(29,618
|
)
|
—
|
|
(29,618
|
)
|
|||||||||
|
Contributed capital to subsidiaries
|
(10,000
|
)
|
10,000
|
|
—
|
|
—
|
|
—
|
|
|||||||||
|
Contributed capital from parent and/or subsidiaries
|
—
|
|
(10,000
|
)
|
10,000
|
|
—
|
|
—
|
|
|||||||||
|
Net cash provided by (used in) investing activities
|
(10,000
|
)
|
—
|
|
387,556
|
|
—
|
|
377,556
|
|
|||||||||
|
Financing activities
|
|||||||||||||||||||
|
Taxes paid on withholding shares
|
(74
|
)
|
—
|
|
—
|
|
—
|
|
(74
|
)
|
|||||||||
|
Purchases of Third Point Re common shares under share repurchase program
|
(138,705
|
)
|
—
|
|
—
|
|
—
|
|
(138,705
|
)
|
|||||||||
|
Increase in deposit liabilities, net
|
—
|
|
—
|
|
9,790
|
|
—
|
|
9,790
|
|
|||||||||
|
Change in total noncontrolling interests in related party, net
|
—
|
|
—
|
|
(97,950
|
)
|
—
|
|
(97,950
|
)
|
|||||||||
|
Dividend received by (paid to) parent
|
154,100
|
|
7,700
|
|
(161,800
|
)
|
—
|
|
—
|
|
|||||||||
|
Net cash provided by (used in) financing activities
|
15,321
|
|
7,700
|
|
(249,960
|
)
|
—
|
|
(226,939
|
)
|
|||||||||
|
Net increase (decrease) in cash, cash equivalents and restricted cash
|
(9
|
)
|
(12
|
)
|
164,025
|
|
—
|
|
164,004
|
|
|||||||||
|
Cash, cash equivalents and restricted cash at beginning of period
|
9
|
|
199
|
|
549,125
|
|
—
|
|
549,333
|
|
|||||||||
|
Cash, cash equivalents and restricted cash at end of period
|
$
|
—
|
|
$
|
187
|
|
$
|
713,150
|
|
$
|
—
|
|
$
|
713,337
|
|
||||
F-76
|
CONSOLIDATING STATEMENT OF CASH FLOWS
|
|||||||||||||||||||
|
Year Ended December 31, 2017
|
|||||||||||||||||||
|
Third Point Re
|
TPRUSA
|
Non-Guarantor Subsidiaries
|
Eliminations
|
Consolidated
|
|||||||||||||||
|
Operating activities
|
|||||||||||||||||||
|
Net income
|
$
|
277,798
|
|
$
|
17,097
|
|
$
|
292,216
|
|
$
|
(305,340
|
)
|
$
|
281,771
|
|
||||
|
Adjustments to reconcile net income to net cash used in operating activities:
|
|
||||||||||||||||||
|
Equity in (earnings) losses of subsidiaries
|
(283,088
|
)
|
(22,309
|
)
|
57
|
|
305,340
|
|
—
|
|
|||||||||
|
Share compensation expense
|
298
|
|
—
|
|
3,301
|
|
—
|
|
3,599
|
|
|||||||||
|
Net interest expense on deposit liabilities
|
—
|
|
—
|
|
2,800
|
|
—
|
|
2,800
|
|
|||||||||
|
Net realized and unrealized gain on investments and derivatives
|
—
|
|
—
|
|
(480,045
|
)
|
—
|
|
(480,045
|
)
|
|||||||||
|
Net foreign exchange losses
|
—
|
|
—
|
|
12,300
|
|
—
|
|
12,300
|
|
|||||||||
|
Amortization of premium and accretion of discount, net
|
—
|
|
178
|
|
295
|
|
—
|
|
473
|
|
|||||||||
|
Changes in assets and liabilities:
|
|
|
|||||||||||||||||
|
Reinsurance balances receivable
|
—
|
|
—
|
|
(86,606
|
)
|
—
|
|
(86,606
|
)
|
|||||||||
|
Deferred acquisition costs, net
|
—
|
|
—
|
|
(37,175
|
)
|
—
|
|
(37,175
|
)
|
|||||||||
|
Unearned premiums ceded
|
—
|
|
—
|
|
(354
|
)
|
—
|
|
(354
|
)
|
|||||||||
|
Loss and loss adjustment expenses recoverable
|
—
|
|
—
|
|
(1,112
|
)
|
—
|
|
(1,112
|
)
|
|||||||||
|
Other assets
|
(27
|
)
|
5,507
|
|
3,657
|
|
—
|
|
9,137
|
|
|||||||||
|
Interest and dividends receivable, net
|
—
|
|
(2
|
)
|
3,565
|
|
—
|
|
3,563
|
|
|||||||||
|
Unearned premium reserves
|
—
|
|
—
|
|
92,442
|
|
—
|
|
92,442
|
|
|||||||||
|
Loss and loss adjustment expense reserves
|
—
|
|
—
|
|
97,922
|
|
—
|
|
97,922
|
|
|||||||||
|
Accounts payable and accrued expenses
|
(388
|
)
|
(8,845
|
)
|
33,445
|
|
—
|
|
24,212
|
|
|||||||||
|
Reinsurance balances payable
|
—
|
|
—
|
|
(1,463
|
)
|
—
|
|
(1,463
|
)
|
|||||||||
|
Amounts due from (to) affiliates
|
1,146
|
|
(8,806
|
)
|
7,660
|
|
—
|
|
—
|
|
|||||||||
|
Net cash used in operating activities
|
(4,261
|
)
|
(17,180
|
)
|
(57,095
|
)
|
—
|
|
(78,536
|
)
|
|||||||||
|
Investing activities
|
|||||||||||||||||||
|
Purchases of investments
|
—
|
|
—
|
|
(3,099,525
|
)
|
—
|
|
(3,099,525
|
)
|
|||||||||
|
Proceeds from sales and maturities of investments
|
—
|
|
—
|
|
3,228,251
|
|
—
|
|
3,228,251
|
|
|||||||||
|
Purchases of investments to cover short sales
|
—
|
|
—
|
|
(791,753
|
)
|
—
|
|
(791,753
|
)
|
|||||||||
|
Proceeds from short sales of investments
|
—
|
|
—
|
|
1,048,552
|
|
—
|
|
1,048,552
|
|
|||||||||
|
Change in due to/from brokers, net
|
—
|
|
—
|
|
(149,898
|
)
|
—
|
|
(149,898
|
)
|
|||||||||
|
Increase in securities sold under an agreement to repurchase
|
—
|
|
—
|
|
29,618
|
|
—
|
|
29,618
|
|
|||||||||
|
Net cash provided by investing activities
|
—
|
|
—
|
|
265,245
|
|
—
|
|
265,245
|
|
|||||||||
|
Financing activities
|
|||||||||||||||||||
|
Proceeds from issuance of common shares, net of costs
|
1,505
|
|
—
|
|
—
|
|
—
|
|
1,505
|
|
|||||||||
|
Purchases of Third Point Re common shares under share repurchase program
|
(40,864
|
)
|
—
|
|
—
|
|
—
|
|
(40,864
|
)
|
|||||||||
|
Increase in deposit liabilities
|
—
|
|
—
|
|
19,113
|
|
—
|
|
19,113
|
|
|||||||||
|
Change in total noncontrolling interests in related party, net
|
—
|
|
—
|
|
73,979
|
|
—
|
|
73,979
|
|
|||||||||
|
Dividend received by (paid to) parent
|
42,000
|
|
17,300
|
|
(59,300
|
)
|
—
|
|
—
|
|
|||||||||
|
Net cash provided by financing activities
|
2,641
|
|
17,300
|
|
33,792
|
|
—
|
|
53,733
|
|
|||||||||
|
Net increase (decrease) in cash, cash equivalents and restricted cash
|
(1,620
|
)
|
120
|
|
241,942
|
|
—
|
|
240,442
|
|
|||||||||
|
Cash, cash equivalents and restricted cash at beginning of period
|
1,629
|
|
79
|
|
307,183
|
|
—
|
|
308,891
|
|
|||||||||
|
Cash, cash equivalents and restricted cash at end of period
|
$
|
9
|
|
$
|
199
|
|
$
|
549,125
|
|
$
|
—
|
|
$
|
549,333
|
|
||||
F-77
|
CONSOLIDATING STATEMENT OF CASH FLOWS
|
|||||||||||||||||||
|
Year Ended December 31, 2016
|
|||||||||||||||||||
|
Third Point Re
|
TPRUSA
|
Non-Guarantor Subsidiaries
|
Eliminations
|
Consolidated
|
|||||||||||||||
|
Operating activities
|
|||||||||||||||||||
|
Net income (loss)
|
$
|
27,635
|
|
$
|
(2,675
|
)
|
$
|
38,857
|
|
$
|
(34,941
|
)
|
$
|
28,876
|
|
||||
|
Adjustments to reconcile net income (loss) to net cash provided by (used in) operating activities:
|
|
||||||||||||||||||
|
Equity in (earnings) losses of subsidiaries
|
(32,347
|
)
|
(2,701
|
)
|
107
|
|
34,941
|
|
—
|
|
|||||||||
|
Share compensation expense
|
543
|
|
—
|
|
8,395
|
|
—
|
|
8,938
|
|
|||||||||
|
Net interest income on deposit liabilities
|
—
|
|
—
|
|
(164
|
)
|
—
|
|
(164
|
)
|
|||||||||
|
Net realized and unrealized gain on investments and derivatives
|
—
|
|
—
|
|
(105,262
|
)
|
—
|
|
(105,262
|
)
|
|||||||||
|
Net foreign exchange gains
|
—
|
|
—
|
|
(19,521
|
)
|
—
|
|
(19,521
|
)
|
|||||||||
|
Amortization of premium and accretion of discount, net
|
—
|
|
178
|
|
4,940
|
|
—
|
|
5,118
|
|
|||||||||
|
Changes in assets and liabilities:
|
|
|
|||||||||||||||||
|
Reinsurance balances receivable
|
—
|
|
—
|
|
(86,612
|
)
|
—
|
|
(86,612
|
)
|
|||||||||
|
Deferred acquisition costs, net
|
—
|
|
—
|
|
(24,525
|
)
|
—
|
|
(24,525
|
)
|
|||||||||
|
Unearned premiums ceded
|
—
|
|
—
|
|
(508
|
)
|
—
|
|
(508
|
)
|
|||||||||
|
Loss and loss adjustment expenses recoverable
|
—
|
|
—
|
|
124
|
|
—
|
|
124
|
|
|||||||||
|
Other assets
|
(73
|
)
|
(2,894
|
)
|
(1,652
|
)
|
—
|
|
(4,619
|
)
|
|||||||||
|
Interest and dividends receivable, net
|
—
|
|
2
|
|
3,223
|
|
—
|
|
3,225
|
|
|||||||||
|
Unearned premium reserves
|
—
|
|
—
|
|
25,366
|
|
—
|
|
25,366
|
|
|||||||||
|
Loss and loss adjustment expense reserves
|
—
|
|
—
|
|
156,644
|
|
—
|
|
156,644
|
|
|||||||||
|
Accounts payable and accrued expenses
|
(1,985
|
)
|
—
|
|
(110
|
)
|
—
|
|
(2,095
|
)
|
|||||||||
|
Reinsurance balances payable
|
—
|
|
—
|
|
19,786
|
|
—
|
|
19,786
|
|
|||||||||
|
Amounts due from (to) affiliates
|
(204
|
)
|
8,164
|
|
(7,960
|
)
|
—
|
|
—
|
|
|||||||||
|
Net cash provided by (used in) operating activities
|
(6,431
|
)
|
74
|
|
11,128
|
|
—
|
|
4,771
|
|
|||||||||
|
Investing activities
|
|||||||||||||||||||
|
Purchases of investments
|
—
|
|
—
|
|
(3,729,944
|
)
|
—
|
|
(3,729,944
|
)
|
|||||||||
|
Proceeds from sales of investments
|
—
|
|
—
|
|
3,504,598
|
|
—
|
|
3,504,598
|
|
|||||||||
|
Purchases of investments to cover short sales
|
—
|
|
—
|
|
(1,264,404
|
)
|
—
|
|
(1,264,404
|
)
|
|||||||||
|
Proceeds from short sales of investments
|
—
|
|
—
|
|
1,046,422
|
|
—
|
|
1,046,422
|
|
|||||||||
|
Change in due to/from brokers, net
|
—
|
|
—
|
|
367,019
|
|
—
|
|
367,019
|
|
|||||||||
|
Increase in securities sold under an agreement to repurchase
|
—
|
|
—
|
|
(8,944
|
)
|
—
|
|
(8,944
|
)
|
|||||||||
|
Contributed capital to subsidiaries
|
(5,000
|
)
|
5,000
|
|
—
|
|
—
|
|
—
|
|
|||||||||
|
Contributed capital from parent and/or subsidiaries
|
—
|
|
(5,000
|
)
|
5,000
|
|
—
|
|
—
|
|
|||||||||
|
Net cash used in investing activities
|
(5,000
|
)
|
—
|
|
(80,253
|
)
|
—
|
|
(85,253
|
)
|
|||||||||
|
Financing activities
|
|||||||||||||||||||
|
Proceeds from issuance of common shares, net of costs
|
5,141
|
|
—
|
|
—
|
|
—
|
|
5,141
|
|
|||||||||
|
Purchases of Third Point Re common shares under share repurchase program
|
(7,389
|
)
|
—
|
|
—
|
|
—
|
|
(7,389
|
)
|
|||||||||
|
Increase in deposit liabilities
|
—
|
|
—
|
|
22,023
|
|
—
|
|
22,023
|
|
|||||||||
|
Change in total noncontrolling interests in related party, net
|
—
|
|
—
|
|
18,276
|
|
—
|
|
18,276
|
|
|||||||||
|
Dividend received by (paid to) parent
|
15,000
|
|
—
|
|
(15,000
|
)
|
—
|
|
—
|
|
|||||||||
|
Net cash provided by financing activities
|
12,752
|
|
—
|
|
25,299
|
|
—
|
|
38,051
|
|
|||||||||
|
Net increase (decrease) in cash, cash equivalents and restricted cash
|
1,321
|
|
74
|
|
(43,826
|
)
|
—
|
|
(42,431
|
)
|
|||||||||
|
Cash, cash equivalents and restricted cash at beginning of period
|
308
|
|
5
|
|
351,009
|
|
—
|
|
351,322
|
|
|||||||||
|
Cash, cash equivalents and restricted cash at end of period
|
$
|
1,629
|
|
$
|
79
|
|
$
|
307,183
|
|
$
|
—
|
|
$
|
308,891
|
|
||||
F-78
28. Quarterly financial results (UNAUDITED)
|
Three months ended
|
|||||||||||||||
|
December 31,
2018 |
September 30,
2018 |
June 30,
2018 |
March 31,
2018 |
||||||||||||
|
Revenues
|
|||||||||||||||
|
Gross premiums written
|
$
|
120,063
|
|
$
|
30,064
|
|
$
|
49,765
|
|
$
|
378,360
|
|
|||
|
Gross premiums ceded
|
(1,770
|
)
|
—
|
|
(3,479
|
)
|
(14,646
|
)
|
|||||||
|
Net premiums written
|
118,293
|
|
30,064
|
|
46,286
|
|
363,714
|
|
|||||||
|
Change in net unearned premium reserves
|
91,177
|
|
97,929
|
|
95,207
|
|
(221,228
|
)
|
|||||||
|
Net premiums earned
|
209,470
|
|
127,993
|
|
141,493
|
|
142,486
|
|
|||||||
|
Net investment income (loss)
|
(276,810
|
)
|
(3,590
|
)
|
31,175
|
|
(2,208
|
)
|
|||||||
|
Total revenues
|
(67,340
|
)
|
124,403
|
|
172,668
|
|
140,278
|
|
|||||||
|
Expenses
|
|||||||||||||||
|
Loss and loss adjustment expenses incurred, net
|
173,088
|
|
88,706
|
|
84,000
|
|
92,620
|
|
|||||||
|
Acquisition costs, net
|
56,668
|
|
40,841
|
|
57,584
|
|
51,405
|
|
|||||||
|
General and administrative expenses
|
7,553
|
|
9,511
|
|
9,696
|
|
9,481
|
|
|||||||
|
Other (income) expenses
|
2,994
|
|
(1,362
|
)
|
3,983
|
|
3,995
|
|
|||||||
|
Interest expense
|
2,074
|
|
2,074
|
|
2,051
|
|
2,029
|
|
|||||||
|
Foreign exchange (gains) losses
|
(3,288
|
)
|
(1,979
|
)
|
(8,847
|
)
|
6,611
|
|
|||||||
|
Total expenses
|
239,089
|
|
137,791
|
|
148,467
|
|
166,141
|
|
|||||||
|
Income (loss) before income tax (expense) benefit
|
(306,429
|
)
|
(13,388
|
)
|
24,201
|
|
(25,863
|
)
|
|||||||
|
Income tax (expense) benefit
|
8,417
|
|
111
|
|
(4,390
|
)
|
(128
|
)
|
|||||||
|
Net income (loss)
|
(298,012
|
)
|
(13,277
|
)
|
19,811
|
|
(25,991
|
)
|
|||||||
|
Net income attributable to noncontrolling interests in related party
|
—
|
|
(4
|
)
|
(209
|
)
|
(10
|
)
|
|||||||
|
Net income (loss) available to Third Point Re common shareholders
|
$
|
(298,012
|
)
|
$
|
(13,281
|
)
|
$
|
19,602
|
|
$
|
(26,001
|
)
|
|||
|
Earnings (loss) per share available to Third Point Re common shareholders
|
|||||||||||||||
|
Basic earnings (loss) per share available to Third Point Re common shareholders
|
$
|
(3.24
|
)
|
$
|
(0.14
|
)
|
$
|
0.20
|
|
$
|
(0.26
|
)
|
|||
|
Diluted earnings (loss) per share available to Third Point Re common shareholders
|
$
|
(3.24
|
)
|
$
|
(0.14
|
)
|
$
|
0.19
|
|
$
|
(0.26
|
)
|
|||
|
Weighted average number of common shares used in the determination of earnings (loss) per share
|
|||||||||||||||
|
Basic
|
91,967,831
|
|
95,671,385
|
|
99,498,901
|
|
101,195,747
|
|
|||||||
|
Diluted
|
91,967,831
|
|
95,671,385
|
|
102,032,485
|
|
101,195,747
|
|
|||||||
F-79
|
Three months ended
|
|||||||||||||||
|
December 31,
2017 |
September 30,
2017 |
June 30,
2017 |
March 31,
2017 |
||||||||||||
|
Revenues
|
|||||||||||||||
|
Gross premiums written
|
$
|
164,163
|
|
$
|
174,539
|
|
$
|
156,564
|
|
$
|
146,354
|
|
|||
|
Gross premiums ceded
|
75
|
|
—
|
|
(1,425
|
)
|
(1,125
|
)
|
|||||||
|
Net premiums written
|
164,238
|
|
174,539
|
|
155,139
|
|
145,229
|
|
|||||||
|
Change in net unearned premium reserves
|
(34,722
|
)
|
(68,564
|
)
|
18,419
|
|
(7,220
|
)
|
|||||||
|
Net premiums earned
|
129,516
|
|
105,975
|
|
173,558
|
|
138,009
|
|
|||||||
|
Net investment income
|
67,150
|
|
88,968
|
|
107,325
|
|
128,510
|
|
|||||||
|
Total revenues
|
196,666
|
|
194,943
|
|
280,883
|
|
266,519
|
|
|||||||
|
Expenses
|
|||||||||||||||
|
Loss and loss adjustment expenses incurred, net
|
99,509
|
|
77,275
|
|
107,379
|
|
85,895
|
|
|||||||
|
Acquisition costs, net
|
31,837
|
|
33,974
|
|
68,641
|
|
54,452
|
|
|||||||
|
General and administrative expenses
|
14,299
|
|
13,218
|
|
15,014
|
|
10,572
|
|
|||||||
|
Other expenses
|
3,822
|
|
3,846
|
|
2,105
|
|
2,901
|
|
|||||||
|
Interest expense
|
2,074
|
|
2,074
|
|
2,051
|
|
2,026
|
|
|||||||
|
Foreign exchange losses
|
2,067
|
|
5,437
|
|
4,781
|
|
15
|
|
|||||||
|
Total expenses
|
153,608
|
|
135,824
|
|
199,971
|
|
155,861
|
|
|||||||
|
Income before income tax (expense) benefit
|
43,058
|
|
59,119
|
|
80,912
|
|
110,658
|
|
|||||||
|
Income tax (expense) benefit
|
2,104
|
|
(3,475
|
)
|
(5,307
|
)
|
(5,298
|
)
|
|||||||
|
Net income
|
45,162
|
|
55,644
|
|
75,605
|
|
105,360
|
|
|||||||
|
Net income attributable to noncontrolling interests in related party
|
(813
|
)
|
(959
|
)
|
(1,027
|
)
|
(1,174
|
)
|
|||||||
|
Net income available to Third Point Re common shareholders
|
$
|
44,349
|
|
$
|
54,685
|
|
$
|
74,578
|
|
$
|
104,186
|
|
|||
|
Earnings per share available to Third Point Re common shareholders
|
|||||||||||||||
|
Basic earnings per share available to Third Point Re common shareholders
|
$
|
0.44
|
|
$
|
0.54
|
|
$
|
0.73
|
|
$
|
1.00
|
|
|||
|
Diluted earnings per share available to Third Point Re common shareholders
|
$
|
0.42
|
|
$
|
0.52
|
|
$
|
0.71
|
|
$
|
0.98
|
|
|||
|
Weighted average number of common shares used in the determination of earnings per share
|
|||||||||||||||
|
Basic
|
101,405,772
|
|
101,391,145
|
|
102,283,844
|
|
104,013,871
|
|
|||||||
|
Diluted
|
105,524,115
|
|
104,679,574
|
|
104,569,226
|
|
105,701,599
|
|
|||||||
F-80
THIRD POINT REINSURANCE LTD.
Schedule I - Summary of Investments - Other than Investments in Related Parties
|
Cost
|
Fair value
|
Balance sheet value
|
||||||||||
|
Assets
|
||||||||||||
|
U.S. Treasury securities
|
$
|
201,212
|
|
$
|
197,312
|
|
$
|
197,312
|
|
|||
|
Sovereign debt
|
51,150
|
|
42,328
|
|
42,328
|
|
||||||
|
Total debt securities
|
252,362
|
|
239,640
|
|
239,640
|
|
||||||
|
Investment in Kiskadee Fund
|
301
|
|
84
|
|
84
|
|
||||||
|
Total investments in securities
|
$
|
252,663
|
|
$
|
239,724
|
|
$
|
239,724
|
|
|||
F-81
THIRD POINT REINSURANCE LTD.
Schedule III - Supplementary Insurance Information
For the years ended
December 31, 2018
,
2017
and
2016
|
As of and for the year ended December 31, 2018
|
||||||||||||||||||||||||||||||
|
Deferred acquisition costs, net
|
Loss and loss adjustment expense reserves
|
Unearned premium
|
Net premiums earned
|
Net investment loss
(1)
|
Other expenses
|
Loss and loss adjustment expenses incurred, net
|
Amortization of deferred acquisition costs, net
|
Other operating expenses
|
Net premiums written
|
|||||||||||||||||||||
|
Property and Casualty Reinsurance
|
$
|
203,842
|
|
$
|
937,157
|
|
$
|
602,936
|
|
$
|
621,442
|
|
$
|
—
|
|
$
|
—
|
|
$
|
438,414
|
|
$
|
206,498
|
|
$
|
18,635
|
|
$
|
558,357
|
|
|
Corporate
(2)
|
—
|
|
—
|
|
—
|
|
—
|
|
(251,433
|
)
|
9,610
|
|
—
|
|
—
|
|
17,606
|
|
—
|
|
||||||||||
|
$
|
203,842
|
|
$
|
937,157
|
|
$
|
602,936
|
|
$
|
621,442
|
|
$
|
(251,433
|
)
|
$
|
9,610
|
|
$
|
438,414
|
|
$
|
206,498
|
|
$
|
36,241
|
|
$
|
558,357
|
|
|
|
As of and for the year ended December 31, 2017
|
||||||||||||||||||||||||||||||
|
Deferred acquisition costs, net
|
Loss and loss adjustment expense reserves
|
Unearned premium
|
Net premiums earned
|
Net investment income
(1)
|
Other expenses
|
Loss and loss adjustment expenses incurred, net
|
Amortization of deferred acquisition costs, net
|
Other operating expenses
|
Net premiums written
|
|||||||||||||||||||||
|
Property and Casualty Reinsurance
|
$
|
258,793
|
|
$
|
720,570
|
|
$
|
649,518
|
|
$
|
547,058
|
|
$
|
—
|
|
$
|
—
|
|
$
|
370,058
|
|
$
|
188,904
|
|
$
|
30,656
|
|
$
|
639,145
|
|
|
Corporate
(2)
|
—
|
|
—
|
|
—
|
|
—
|
|
391,953
|
|
12,674
|
|
—
|
|
—
|
|
22,447
|
|
—
|
|
||||||||||
|
$
|
258,793
|
|
$
|
720,570
|
|
$
|
649,518
|
|
$
|
547,058
|
|
$
|
391,953
|
|
$
|
12,674
|
|
$
|
370,058
|
|
$
|
188,904
|
|
$
|
53,103
|
|
$
|
639,145
|
|
|
|
As of and for the year ended December 31, 2016
|
||||||||||||||||||||||||||||||
|
Deferred acquisition costs, net
|
Loss and loss adjustment expense reserves
|
Unearned premium
|
Net premiums earned
|
Net investment income
(1)
|
Other expenses
|
Loss and loss adjustment expenses incurred, net
|
Amortization of deferred acquisition costs, net
|
Other operating expenses
|
Net premiums written
|
|||||||||||||||||||||
|
Property and Casualty Reinsurance
|
$
|
221,618
|
|
$
|
605,129
|
|
$
|
557,076
|
|
$
|
590,190
|
|
$
|
—
|
|
$
|
—
|
|
$
|
395,932
|
|
$
|
222,150
|
|
$
|
22,160
|
|
$
|
615,049
|
|
|
Corporate
(2)
|
—
|
|
—
|
|
—
|
|
—
|
|
98,825
|
|
8,387
|
|
—
|
|
—
|
|
17,207
|
|
—
|
|
||||||||||
|
$
|
221,618
|
|
$
|
605,129
|
|
$
|
557,076
|
|
$
|
590,190
|
|
$
|
98,825
|
|
$
|
8,387
|
|
$
|
395,932
|
|
$
|
222,150
|
|
$
|
39,367
|
|
$
|
615,049
|
|
|
|
(1)
|
As a result of the change in the Company’s investment account structure, the Company is no longer quantifying the net investment income on float. These amounts had previously been presented as part of the Company’s Property and Casualty Reinsurance segment. Prior year comparatives have been adjusted to conform with the revised presentation. See
Note 24
for additional information.
|
|
(2)
|
Corporate is comprised of non-underwriting income and expenses.
|
F-82
THIRD POINT REINSURANCE LTD.
Schedule IV - Reinsurance
For the years ended
December 31, 2018
,
2017
and
2016
|
Direct gross premiums written
|
Ceded to other companies
|
Assumed from other companies
|
Net amount
|
Percentage of amount assumed to net
|
||||||||||||||
|
Year ended December 31, 2018
|
$
|
—
|
|
$
|
19,895
|
|
$
|
578,252
|
|
$
|
558,357
|
|
97
|
%
|
||||
|
Year ended December 31, 2017
|
$
|
—
|
|
$
|
2,475
|
|
$
|
641,620
|
|
$
|
639,145
|
|
100
|
%
|
||||
|
Year ended December 31, 2016
|
$
|
—
|
|
$
|
2,325
|
|
$
|
617,374
|
|
$
|
615,049
|
|
100
|
%
|
||||
F-83
TABLE OF CONTENTS
Part IItem 1. BusinessItem 1A. Risk FactorsItem 1B. Unresolved Staff CommentsItem 2. PropertiesItem 3. Legal ProceedingsItem 4. Mine Safety DisclosuresPart IIItem 5. Market For Registrant S Common Equity, Related Shareholder Matters and Issuer Purchases Of Equity SecuritiesItem 6. Selected Financial DataItem 7. Management S Discussion and Analysis Of Financial Condition and Results Of OperationsItem 7A. Quantitative and Qualitative Disclosures About Market RisksItem 7A. Quantitative and Qualitative Disclosures About Market RiskItem 8. Financial Statements and Supplementary DataItem 9. Changes in and Disagreements with Accountants on Accounting and Financial DisclosureItem 9A. Controls and ProceduresItem 9B. Other InformationPart IIIItem 10. Directors, Executive Officers and Corporate GovernanceItem 11. Executive CompensationItem 12. Security Ownership Of Certain Beneficial Owners and Management and Related Shareholder MattersItem 13. Certain Relationships and Related Transactions, and Director IndependenceItem 14. Principal Accounting Fees and ServicesPart IVItem 15. Exhibits and Financial Statement Schedules