SPOK HOLDINGS, INC
10-Ks and 10-Qs
|
|
|
|
|
|
|
|
|
|
|
|
|
|
|
|
|
|
|
|
|
|
|
|
|
|
|
|
|
|
|
|
|
|
|
|
|
|
|
|
|
|
|
|
|
|
|
|
|
|
UNITED STATES
SECURITIES AND EXCHANGE COMMISSION
W
ASHINGTON
, D.C. 20549
F
ORM
10-K
(Mark One)
|
x
|
ANNUAL REPORT PURSUANT TO SECTION 13 OR 15(d) OF THE SECURITIES EXCHANGE ACT OF 1934
|
For the Fiscal Year Ended
December 31, 2013
or
|
¨
|
TRANSITION REPORT PURSUANT TO SECTION 13 OR 15(d) OF THE SECURITIES EXCHANGE ACT OF 1934
|
For the transition period from to
Commission file number 001-32358
USA Mobility, Inc.
(Exact name of registrant as specified in its charter)
|
DELAWARE
|
16-1694797
|
|
|
(State or other jurisdiction of
incorporation or organization)
|
(I.R.S. Employer
Identification No.)
|
|
|
6850 Versar Center, Suite 420
Springfield, Virginia
|
22151-4148
|
|
|
(Address of principal executive offices)
|
(Zip Code)
|
|
(800) 611-8488
(Registrant’s telephone number, including area code)
Securities registered pursuant to Section 12(b) of the Act:
|
Title of each class
|
Name of each exchange on which registered
|
|
|
Common Stock, par value $0.0001 per share
|
NASDAQ National Market
®
|
|
Securities registered pursuant to Section 12(g) of the Act:
None
Indicate by check mark if the registrant is a well-known seasoned issuer, as defined in Rule 405 of the Securities Act. YES
¨
NO
x
Indicate by check mark if the registrant is not required to file reports pursuant to Section 13 or Section 15(d) of the Act. YES
¨
NO
x
Indicate by check mark whether the registrant (1) has filed all reports required to be filed by Section 13 or 15(d) of the Securities Exchange Act of 1934 during the preceding 12 months (or for such shorter period that the registrant was required to file such reports), and (2) has been subject to such filing requirements for the past 90 days. YES
x
NO
¨
Indicate by check mark whether the registrant has submitted electronically and posted on its corporate Web site, if any, every Interactive Data File required to be submitted and posted pursuant to Rule 405 of Regulation S-T (§ 232.405 of this chapter) during the preceding 12 months (or for such shorter period that the registrant was required to submit and post such files). YES
x
NO
¨
Indicate by check mark if disclosure of delinquent filers pursuant to Item 405 of Regulation S-K (§ 229.405 of this chapter) is not contained herein, and will not be contained, to the best of registrant’s knowledge, in definitive proxy or information statements incorporated by reference in Part III of this Form 10-K or any amendment to this Form 10-K.
x
Indicate by check mark whether the registrant is a large accelerated filer, an accelerated filer, a non-accelerated filer, or a smaller reporting company. See the definitions of “large accelerated filer,” “accelerated filer” and “smaller reporting company” in Rule 12b-2 of the Exchange Act.
|
Large accelerated filer
|
¨
|
Accelerated filer
|
x
|
||
|
Non-accelerated filer
|
¨
(Do not check if a smaller reporting company)
|
Smaller reporting company
|
¨
|
||
Indicate by check mark whether the registrant is a shell company (as defined in Rule 12b-2 of the Act). YES
¨
NO
x
The aggregate market value of the common stock held by non-affiliates of the registrant was $289,067,041 based on the closing price of $13.57 per share on the NASDAQ National Market
®
on June 28, 2013.
The number of shares of registrant’s common stock outstanding on March 7,
2014 was 21,658,816.
DOCUMENTS INCORPORATED BY REFERENCE
Portions of the registrant’s Definitive Proxy Statement for the 2014 Annual Meeting of Stockholders of the registrant, which will be filed with the Securities and Exchange Commission pursuant to Regulation 14A no later than April 30, 2014, are incorporated by reference into Part III of this Report.
TABLE OF CONTENTS
|
Part I
|
||
|
Item 1.
|
||
|
Item 1A.
|
||
|
Item 1B.
|
||
|
Item 2.
|
||
|
Item 3.
|
||
|
Item 4.
|
||
|
Part II
|
||
|
Item 5.
|
||
|
Item 6.
|
||
|
Item 7.
|
||
|
Item 7A.
|
||
|
Item 8
|
||
|
Item 9.
|
||
|
Item 9A.
|
||
|
Item 9B.
|
||
|
Part III
|
||
|
Item 10.
|
||
|
Item 11.
|
||
|
Item 12.
|
||
|
Item 13.
|
||
|
Item 14.
|
||
|
Part IV
|
||
|
Item 15.
|
||
2
Forward-Looking Statements
This Annual Report on Form 10-K contains forward-looking statements and information relating to USA Mobility, Inc. and its direct and indirect wholly owned subsidiaries (collectively, “USA Mobility” or the “Company”) that set forth anticipated results based on management’s current plans, known trends and assumptions. These statements are made pursuant to the safe harbor provisions of the Private Securities Litigation Reform Act of 1995. Statements that are predictive in nature, that depend upon or refer to future events or conditions, or that include words such as “anticipate,” “believe,” “estimate,” “expect,” “intend,” “will,” “target,” “forecast” and similar expressions, as they relate to USA Mobility are forward-looking statements.
Although these statements are based upon current plans, known trends and assumptions that management considers reasonable, they are subject to certain risks, uncertainties and assumptions, including but not limited to those discussed in this Annual Report under Item 1A “Risk Factors.” Should known or unknown risks or uncertainties materialize, known trends change, or underlying assumptions prove inaccurate, actual results or outcomes may differ materially from past results and those described herein as anticipated, believed, estimated, expected, intended, targeted or forecasted. Investors are cautioned not to place undue reliance on these forward-looking statements.
The Company undertakes no obligation to update forward-looking statements. Investors are advised to consult all further disclosures the Company makes in its subsequent reports on Form 10-Q and Form 8-K that it will file with the Securities and Exchange Commission (“SEC”). Also note that, in the risk factors, the Company provides a cautionary discussion of risks, uncertainties and possibly inaccurate assumptions relevant to its business. These are factors that, individually or in the aggregate, could cause the Company’s actual results to differ materially from past results as well as those results that may be anticipated, believed, estimated, expected, intended, targeted or forecasted. It is not possible to predict or identify all such risk factors. Consequently, investors should not consider the risk factor discussion to be a complete discussion of all of the potential risks or uncertainties that could affect USA Mobility’s business, statement of income or financial condition, subsequent to the filing of this Annual Report.
3
The terms "we", "us", "our", "Company" and "USA Mobility" refer to USA Mobility, Inc. and its direct and indirect wholly owned subsidiaries. "Wireless operations" refers to our indirect wholly owned subsidiary, USA Mobility Wireless, Inc. "Amcom" or "Software operations" refers to our indirect wholly owned subsidiary, Amcom Software, Inc.
ITEM 1.
BUSINESS
General
We are a holding company, which, acting through wireless operations, is a leading provider of wireless messaging, mobile voice and data and unified communications solutions in the United States. In addition, Amcom which we acquired on March 3, 2011, provides mission critical unified communications solutions for contact centers, emergency management, mobile event notification, and Smartphone messaging. Our combined product offerings are capable of addressing a customer’s mission critical communications needs.
Our principal office is located at 6850 Versar Center, Suite 420, Springfield, Virginia 22151, and our telephone number is 800-611-8488. We maintain an Internet website at
http://www.usamobility.com/
.
(This website address is for information only and is not intended to be an active link or to incorporate any website information into this 2013 Annual Report on Form 10-K ("2013 Form 10-K").) We make available on our website, free of charge, our annual reports on Form 10-K, quarterly reports on Form 10-Q, current reports on Form 8-K and all amendments to those reports as soon as reasonably practicable after such reports are electronically filed with, or furnished to, the United States Securities and Exchange Commission (the “SEC”). The public may read and copy any materials we file with the SEC at the SEC’s Public Reference Room at 100 F Street, NE, Washington, DC 20549. The public may obtain information on the operation of the Public Reference Room by calling the SEC at 1-800-SEC-0330. The SEC also maintains an Internet site that contains reports, proxy and information statements, and other information regarding issuers that file electronically with the SEC at
http://www.sec.gov
. We also make available on our website, and in print, if any stockholder or other person so requests, our code of business conduct and ethics entitled “Code of Ethics” which is applicable to all employees and directors, our “Corporate Governance Guidelines,” and the charters for all committees of our Board of Directors, including Audit, Corporate Governance and Nominating. Any changes to our Code of Ethics or waiver, if any, of our Code of Ethics for executive officers or directors will be posted on that website.
We currently have two reportable segments, wireless operations and software operations. The operations of our software segment have been included in the consolidated results of the Company from March 3, 2011, the date of acquisition. (See Note 17 in our Notes to Consolidated Financial Statements.)
Scope
We are a leading provider of paging services and selected software solutions in the United States and abroad, generally in Europe, Canada, Australia, Asia and the Middle East. These foreign sales represent less than 3% of consolidated revenue. We offer our services and products primarily to three major market segments: healthcare, government, and large enterprise. For the year ended December 31, 2013, 70% and 30% of our consolidated revenue was generated by our wireless and software operations, respectively.
Wireless Operations
Industry Overview
Our wireless operations provide one-way and advanced two-way wireless messaging services including information services throughout the United States. These services are offered on a local, regional, and nationwide basis employing digital networks. One-way messaging consists of numeric and alphanumeric messaging services. Numeric messaging services enable subscribers to receive messages that are composed entirely of numbers, such as a phone number, while alphanumeric messages may include numbers and letters, which enable subscribers to receive text messages. Two-way messaging services enable subscribers to send and receive messages to and from other wireless messaging devices, including pagers, personal digital assistants and personal computers. Our wireless operations also offer voice mail, personalized greeting, message storage and retrieval, and equipment loss and/or maintenance protection to both one-way and two-way messaging subscribers. These services are commonly referred to as wireless messaging and information services.
Our customers include businesses with employees who need to be accessible to their offices or customers, first responders who need to be accessible in emergencies, and third parties, such as other telecommunication carriers and resellers that pay our Company to use our networks. Customers include businesses, professionals, management personnel, medical personnel, field sales
4
personnel and service forces, members of the construction industry and construction trades, real estate brokers and developers, sales and service organizations, specialty trade organizations, manufacturing organizations, and government agencies.
Although the traditional paging industry in the United States has several licensed paging companies, the overall number of one-way and two-way messaging subscribers has been declining as the industry faces intense competition from “broadband”/voice wireless services and other forms of wireless message delivery. As a result, demand for our one-way and two-way messaging services has declined over the past several years, and we believe that it will continue to decline for the foreseeable future. The decline in demand for messaging services has largely been attributable to competition from cellular and broadband Personal Communications Service carriers.
Products and Operations
We market and distribute our wireless services through a direct sales force and a small indirect sales channel.
Direct.
The direct sales force rents or sells products and messaging services directly to customers ranging from small and medium-sized businesses to companies in the Fortune 1000, healthcare and related businesses, and Federal, state and local government agencies. We will continue to market to commercial enterprises, especially healthcare organizations, that are interested in low cost, highly reliable critical messaging. We maintain a sales presence in key markets throughout the United States in an effort to gain new customers and to retain and increase sales to existing customers. We also maintain several corporate groups, such as our Key Account Management team, focused on retaining and selling additional services to our key healthcare accounts as well as a team selling to government and national accounts. Our direct sales efforts also include a focus on cross-selling Amcom services to our extensive list of wireless operations' customers.
Indirect.
Within the indirect channel, we contract with and invoice an intermediary for airtime services. The intermediary or “reseller” in turn markets, sells, and provides customer service to the end user. Generally, there is no contractual relationship that exists between us and the end subscriber. Therefore, operating costs per unit to provide these services are lower than those required in the direct distribution channel. Indirect units in service typically have lower average revenue per unit (“ARPU”) than direct units in service. The rate at which subscribers disconnect service in the indirect distribution channel has generally been higher than the rate experienced with direct customers, and we expect this trend to continue in the foreseeable future.
The following table summarizes the breakdown of our direct and indirect units in service at specified dates:
|
|
As of December 31,
|
||||||||||||||||
|
|
2013
|
2012
|
2011
|
||||||||||||||
|
Distribution Channel
|
Units
|
% of Total
|
Units
|
% of Total
|
Units
|
% of Total
|
|||||||||||
|
|
(Units in thousands)
|
||||||||||||||||
|
Direct
|
1,315
|
|
95.6
|
%
|
1,421
|
|
93.8
|
%
|
1,555
|
|
93.2
|
%
|
|||||
|
Indirect
|
61
|
|
4.4
|
%
|
94
|
|
6.2
|
%
|
113
|
|
6.8
|
%
|
|||||
|
Total
|
1,376
|
|
100.0
|
%
|
1,515
|
|
100.0
|
%
|
1,668
|
|
100.0
|
%
|
|||||
Our core offering includes subscriptions to one-way or two-way messaging services for a periodic (monthly, quarterly, semi-annual, or annual) service fee. This is generally based upon the type of service provided, the geographic area covered, the number of devices provided to the customer and the period of commitment. A subscriber to one-way messaging services may select coverage on a local, regional or nationwide basis to best meet their messaging needs. Two-way messaging is generally offered on a nationwide basis. We offer ancillary services, such as voicemail and equipment loss/maintenance protection, which help increase the monthly recurring revenue we receive along with these traditional messaging services.
The following table summarizes the breakdown of our one-way and two-way units in service at specified dates:
|
|
As of December 31,
|
||||||||||||||||
|
|
2013
|
2012
|
2011
|
||||||||||||||
|
Service Type
|
Units
|
% of Total
|
Units
|
% of Total
|
Units
|
% of Total
|
|||||||||||
|
|
(Units in thousands)
|
||||||||||||||||
|
One-way messaging
|
1,280
|
|
93.0
|
%
|
1,394
|
|
92.0
|
%
|
1,528
|
|
91.6
|
%
|
|||||
|
Two-way messaging
|
96
|
|
7.0
|
%
|
121
|
|
8.0
|
%
|
140
|
|
8.4
|
%
|
|||||
|
Total
|
1,376
|
|
100.0
|
%
|
1,515
|
|
100.0
|
%
|
1,668
|
|
100.0
|
%
|
|||||
5
The demand for one-way and two-way messaging services declined at each specified date and we believe demand will continue to decline for the foreseeable future. Demand for our services has also been impacted by the uncertainty in the United States economy and high unemployment rates nationwide.
As demand for one-way and two-way messaging has declined, we have developed or added service offerings in order to increase our revenue potential and mitigate the decline in our wireless operations. We will continue to look for ways to innovate and provide customers the highest value possible.
Software Operations
Industry Overview
Our software operations offer a focused suite of unified communications solutions that include call center operations, clinical alerting and notifications, mobile communications and public safety solutions. Given the focused nature of our software products, our primary market has been the healthcare industry, particularly hospitals. We have identified hospitals with 200 or more beds as the primary targets for our software solutions.
Due to the focused nature of our software solutions there is no single competitor that matches our portfolio of software solutions (see “Competition” below). Within this market we have identified the following dynamics and have focused our software solutions (see “Products and Operations” below) to address these dynamics:
|
•
|
A heightened awareness of the ubiquitous, mission critical role of communications in healthcare;
|
|
•
|
An increased focus within hospitals on quality of care and patient safety initiatives;
|
|
•
|
A continuing focus within hospitals to reduce labor and administrative costs while increasing productivity; and
|
|
•
|
A broader proliferation of information technology in healthcare as hospitals strive to apply technology to solve their business problems.
|
Products and Operations
We develop, sell, and support enterprise-wide systems for hospitals and other organizations needing to automate, centralize, and standardize mission critical communications. These solutions are used for contact centers, clinical alerting and notification, mobile communications and messaging and for public safety notifications. These areas of market focus compliment the market focus of our wireless operations outlined above. We have a sales presence and customer base both domestically, throughout the United States, and internationally, in Europe, Australia, Asia and the Middle East.
Our software operations have established solutions for:
|
•
|
Hospital Call Centers — These solutions encompass operator and answering services along with call recording, scheduling and selective additional support modules.
|
|
•
|
Clinical Workflow Communication — These solutions address hospital code processing as well as physician support tools.
|
|
•
|
Communication Applications — These solutions support hospital notification and appointment support.
|
|
•
|
Communications Infrastructure — These solutions support the wireless messaging infrastructure and offer a software product that can link disparate communications software (“middleware”).
|
|
•
|
Public Safety — These solutions implement and support emergency communication systems.
|
In our software operations we sell software solutions, professional services (installation and training), equipment (to be used in conjunction with the software) and maintenance support (post-contract support). Our software is licensed to end users under an industry standard software license agreement. Our software operations are organized as follows to support this business.
Marketing
. We have a centralized marketing function which is focused on supporting our software products and vertical sales efforts by strengthening our Amcom brand, generating sales leads, and facilitating the sales process. These marketing functions are accomplished through targeted email campaigns, webinars, regional and national user conferences, monthly newsletters, and participation at industry trade shows.
Sales.
We have organized our global sales organization into two theaters: the Americas and International. We sell our software products through a direct and channel sales force. The direct sales effort is geographically focused with the exception of dedicated government specialists. The direct sales force targets unified communication executives such as chief information officers, medical officers, care givers, information technology directors, telecommunications directors and contact center managers. Additionally, we target clinical resources including chief nursing officers and chief medical information officers. The timing for a direct sale from initial contact to final sale ranges from 6 to 18 months depending on the type of software solution.
6
The direct sales force is complemented by a channel sales force consisting of a dedicated team of managers. These managers coordinate relationships with alliance partners who provide sales introductions for our direct sales force.
Professional Services
. We offer implementation services for our software products. These implementation services are provided by a dedicated group of professional service employees. Our professional services staff uses a branded, consistent methodology that provides a comprehensive phased work plan for both new software installations and/or upgrades. In support of our implementation methodology, we manage the various aspects of the process through a professional services automation tool. A typical implementation process ranges from 30 to 180 days depending on the type of implementation. We may also use professional services partners to implement our solutions for customers.
Customer Support.
To support our software products, we have established a dedicated customer support organization. Due to the mission critical nature of our software products, we provide 24 hours a day, 7 days a week, 365 days a year customer support that customers can access via telephone, email or the Internet.
Product Development.
We maintain a product development group focused on developing new software products along with ongoing maintenance and enhancement of existing products. Our product development group uses a methodology that balances enhancement requests from a number of sources including customers, the professional services staff, customer support incidents, known defects, market and technology trends, and competitive requirements. These requests are reviewed and prioritized based on criteria that include the potential for increased revenue, customer/employee satisfaction, possible cost savings and development time and expense.
Licenses and Messaging Networks
Wireless Operations
— We hold licenses to operate on various frequencies in the 150 MHz, 450 MHz and 900 MHz narrowband. We are licensed by the United States Federal Communications Commission (the “FCC”) to operate Commercial Mobile Radio Services (“CMRS”). These licenses are required to provide one-way and two-way messaging services over our networks.
We operate local, regional and nationwide one-way networks, which enable subscribers to receive messages over a desired geographic area. The majority of the messaging traffic that is transmitted on our 150 MHz and 450 MHz frequency bands utilize the Post Office Code Standardization Advisory Group (“POCSAG”) messaging protocol. This technology is an older and less efficient air interface protocol due to slower transmission speeds and minimal error correction. One-way networks operating in 900 MHz frequency bands predominantly utilize the FLEX
™
protocol developed by Motorola Mobility, Inc. (“Motorola”); some legacy POCSAG traffic also is broadcast in the 900 MHz frequency band. The FLEX
™
protocol is a newer technology having the advantages of functioning at higher network speeds (which increases the volume of messages that can be transmitted over the network) and of having more robust error correction (which facilitates message delivery to a device with fewer transmission errors).
Our two-way networks utilize the ReFLEX 25
™
protocol, also developed by Motorola. ReFLEX 25
™
promotes spectrum efficiency and high network capacity by dividing coverage areas into zones and sub-zones. Messages are directed to the zone or sub-zone where the subscriber is located, allowing the same frequency to be reused to carry different traffic in other zones or sub-zones. As a result, the ReFLEX 25
™
protocol allows the two-way network to transmit substantially more messages than a one-way network using either the POCSAG or FLEX
™
protocols. The two-way network also provides for assured message delivery. The network stores messages that could not be delivered to a device that is out of coverage for any reason, and when the unit returns to service, those messages are delivered. The two-way paging network operates under a set of licenses called narrowband Personal Communications Service, which uses 900 MHz frequencies. These licenses require certain minimum five and ten-year build-out commitments established by the FCC, which have been satisfied.
Although the capacities of our networks vary by market, we have a significant amount of excess capacity. We have implemented a plan to manage network capacity and to improve overall network efficiency by consolidating subscribers onto fewer, higher capacity networks with increased transmission speeds. This plan is referred to as network rationalization. Network rationalization will result in fewer networks and therefore fewer transmitter locations, which we believe will result in lower operating expenses due primarily to lower site rent expenses.
Software
Operations
— Generally, our software solutions do not require licenses or permits from Federal, state and/or local government agencies in order to be sold to customers. However, certain of our software products are subject to regulation by the United States Food and Drug Administration (“FDA”). (See “Regulation” below).
7
Sources of Equipment
Wireless
Operations
— We do not manufacture the messaging devices our customers need to take advantage of our services or the network equipment we use to provide messaging services. We have relationships with several vendors to purchase new messaging devices. Used messaging devices are available in the secondary market from various sources. We believe existing inventory, returns of devices from customers that cancelled services, and purchases from other available sources of new and reconditioned devices will be sufficient to meet expected messaging device requirements for the foreseeable future. We negotiate contractual terms with our vendors that do not directly relate to the manufacturing of the network equipment or messaging devices. The network equipment and messaging devices are generic on which we may place our logo or label.
Software
Operations
— Our software products are considered to be “off-the-shelf software” as the software is marketed as a stock item that customers can use with little or no customization. We also sell third party equipment for use with the software. The third party equipment that we sell is generally available and does not require any specialty manufacturing to accommodate our software solutions.
We currently have inventory and network equipment on hand that we believe will be sufficient to meet our wireless and software equipment requirements for the foreseeable future.
Competition
Wireless
Operations
— The wireless messaging industry is highly competitive. Companies compete on the basis of price, coverage area, services offered, transmission quality, network reliability, and customer service.
Our wireless operations compete by maintaining competitive pricing for our products and services, by providing broad coverage options through high-quality, reliable messaging networks and by providing quality customer service. Direct competitors for wireless messaging services include American Messaging Service, LLC and a variety of other regional and local providers. Our products and services also compete with a broad array of wireless messaging services provided by mobile telephone companies, including AT&T Mobility LLC, Sprint Nextel Corporation, T-Mobile USA, Inc., and Verizon Wireless, Inc. This competition has intensified as prices for the services of mobile telephone companies have declined and as those companies have incorporated messaging capabilities into their mobile phone devices. Many of these companies possess greater financial, technical and other resources than we do.
Most Personal Communications Service and other mobile phone devices currently sold in the United States are capable of sending and receiving one-way and two-way messages. Most subscribers that purchase these services no longer need to subscribe to a separate messaging service. As a result, many one-way and two-way messaging subscribers can readily switch to cellular, Personal Communications Service and other mobile telephone services. The decrease in prices and increase in capacity and functionality for cellular, Personal Communications Service and other mobile telephone services have led many subscribers to select combined voice and messaging services from mobile telephone companies as an alternative to stand-alone messaging services.
Software
Operations
— Based on industry research, we do have a number of competitors whose software products compete with one or more modules of our unified communications solutions. These competitors are mostly privately held companies and offer a number of call center and middleware products. Currently, there are no competitors that offer a similar comprehensive set of software modules that match our product offerings. Based on the current competitive environment, we do not foresee in the near term any competitor developing a comprehensive set of modular software products that will completely match our current portfolio of software products.
Regulation
Federal Regulation
Wireless
Operations
— The FCC issues licenses to use radio frequencies necessary to conduct our business and regulate many aspects of our wireless operations. Licenses granted to us by the FCC have varying terms, generally of up to ten years, at which time the FCC must approve renewal applications. In the past, FCC renewal applications generally have been granted upon showing compliance with FCC regulations and adequate service to the public. Other than those still pending, the FCC has thus far granted each license renewal that our wireless operation has requested.
The Communications Act of 1934, as amended (the “Communications Act”), requires radio licensees including our wireless operations to obtain prior approval from the FCC for the assignment or transfer of control of any construction permit or station license or authorization of any rights thereunder. The FCC has thus far granted each assignment or transfer request we have made in connection with a change of control.
8
The Communications Act also places limitations on foreign ownership of CMRS licenses, which constitute the majority of our licenses. These foreign ownership restrictions limit the percentage of stockholders’ equity that may be owned or voted, directly or indirectly, by non-United States citizens or their representatives, foreign governments or their representatives, or foreign corporations. Our Amended and Restated Certificate of Incorporation permits the redemption of our equity from stockholders where necessary to ensure compliance with these requirements.
The FCC’s rules and regulations require us to pay a variety of fees that otherwise increase our costs of doing business. For example, the FCC requires licensees, including our wireless operations, to pay levies and fees, such as universal service fees, to cover the costs of certain regulatory programs and to promote various other societal goals. These requirements increase the cost of the services provided. By law, we are permitted to bill our customers for these regulatory costs and we typically do so.
Additionally, the Communications Assistance to Law Enforcement Act of 1994, (“CALEA”) and certain rules implementing CALEA require some telecommunication companies, including us, to design and/or modify their equipment in order to allow law enforcement personnel to “wiretap” or otherwise intercept messages. Other regulatory requirements restrict how we may use customer information and prohibit certain commercial electronic messages, even to our own customers.
In addition, the FCC’s rules require us to pay other carriers for the transport and termination of some telecommunication traffic. As a result of various FCC decisions over the last few years, we no longer pay fees for the termination of traffic originating on the networks of local exchange carriers providing wireline services interconnected with our services. In some instances, we received refunds for prior payments to certain local exchange carriers. We have entered into a number of interconnection agreements with local exchange carriers in order to resolve various issues regarding charges imposed by local exchange carriers for interconnection.
Failure to follow the FCC’s rules and regulations can result in a variety of penalties, ranging from monetary fines to the loss of licenses. Additionally, the FCC has the authority to modify licenses, or impose additional requirements through changes to its rules.
Software
Operations
— The FDA has determined software systems that connect to medical devices are subject to regulation as medical devices as defined by the Federal Food, Drug and Cosmetic Act (“the FDC Act”). Since our middleware software products connect to medical devices, we are required to comply with the FDC Act’s requirements, including but not limited to: registration and listing, labeling, medical device reporting (reporting of medical device-related adverse events), removal and correction, and good manufacturing practice requirements. We have complied with the regulatory requirements of the FDC Act, and registered and received the necessary clearances for our products. As we modify and/or enhance our software products (including our middleware product), we may be required to request FDA clearance before we are permitted to market these products.
In addition, our software products may handle or have access to personal health information subject in the United States to the Health Insurance Portability and Accountability Act (“HIPAA”), the Health Information Technology for Economic and Clinical Health Act (“HITECH”), and related regulations. These statutes and related regulations impose numerous requirements regarding the use and disclosure of personal health information with which we help our customers comply. Our failure to accurately anticipate or interpret these complex and technical laws could subject us to civil and/or criminal liability. We believe that we are in compliance with these laws and their related regulations.
Although these and other regulatory requirements have not, to date, had a material adverse effect on our operating results, such requirements could have a material impact on our operating results in the future. We monitor discussions at the FCC and FDA on pending changes in regulatory policy or regulations; however, we are unable to predict what changes, if any, may occur in 2014 to regulatory policy or regulations.
State Regulation
Wireless
Operations
— As a result of the enactment by Congress of the Omnibus Budget Reconciliation Act of 1993 (“OBRA”) in August 1993, states are now generally preempted from exercising rate or entry regulation over any of our operations. States are not preempted, however, from regulating “other terms and conditions” of our operations, including consumer protection and similar rules of general applicability. Zoning requirements are also generally permissible, however, provisions of the OBRA prohibit local zoning authorities from unreasonably restricting wireless services. States that regulate our services also may require us to obtain prior approval of (1) the acquisition of controlling interests in other paging companies and (2) a change of control. At this time, we are not aware of any proposed state legislation or regulations that would have a material adverse impact on our existing wireless operations.
Software
Operations
— At this time, we are not aware of any proposed state legislation or regulations that would have a material adverse impact on our existing software operations.
9
Trademarks
Wireless
Operations
— We have owned the service marks “USA Mobility” since November 16, 2004, “Arch” since December 17, 2002 and “Metrocall” since September 4, 1979, and hold Federal registrations for the service marks “Metrocall” and “Arch Wireless” as well as various other trademarks. The trademarks are fully amortized for accounting purposes. We believe our trademarks distinguish our wireless operations from our smaller non-public competitors.
Software
Operations
— We have owned the trademark “Amcom” in the United States since April 9, 2002 and in Australia since August 28, 2009. We have also owned the trademark “Amcom Software, Inc.” in the United States since April 8, 2009 and in Australia since August 28, 2009. We also own various other trademarks such as “911 Solutions” since July 21, 1998, “Intellidesk” in the United States since August 1, 1995 and “Intellispeech” in the United States since July 22, 2003. We believe these trademarks distinguish our software solutions from our smaller and diverse competitors.
Employees
At December 31, 2013 and March 7, 2014 we had 631 and 633 full time equivalent (“FTE”) employees, respectively. Our employees are not represented by labor unions. We believe that our employee relations are good.
2014 Business Strategy
During 2014, we will continue to focus on serving the mission critical needs of our customers with a variety of wireless and software communication solutions and new product offerings while operating an efficient and profitable business strategy. In 2013 we recognized that maintaining two distinct businesses - wireless and software - could distract from our long range goal of creating stockholder value based on the ultimate growth potential of our technology solutions and operations. On January 1, 2014 we consolidated our wireless and software operations into one company to operate as a unified communications business with (1) an integrated sales force selling software and wireless solutions, (2) one set of operating overhead, (3) a single customer message and experience and (4) a consolidated operation for future growth and acquisitions. In furtherance of this consolidation we have established the following operating objectives and priorities for 2014:
|
•
|
Grow our software revenue and bookings;
|
|
•
|
Retain our wireless subscribers and revenue stream;
|
|
•
|
Return capital to our stockholders; and
|
|
•
|
Seek long-term revenue growth through business diversification.
|
Grow our software revenue and bookings
— Throughout 2014 we expect to continue our investments in sales and marketing, product implementation, product development and customer support that drive software, services and maintenance bookings and revenue growth. Healthcare customers represent our most stable and loyal customers and represented 67% of our revenue base in 2013. We will continue to focus our sales and marketing efforts in the healthcare market in order to identify opportunities for sales and close those opportunities in the form of purchase orders or bookings. We also plan to leverage our existing wireless relationships in the healthcare market to support our objectives to grow software revenue and bookings.
We have an ongoing initiative to further penetrate the hospital segment in the United States and believe there is a significant opportunity to sell unified communication solutions to hospitals located outside the United States. We intend to leverage the strength of our market presence and the breadth of our product offerings to further expand our customer base in healthcare, but also in the government and large enterprise segments both in the United States and overseas.
We plan to continue to innovate and invest in product development in order to enhance existing software solutions and bring new offerings to market. In particular we have focused on the increased potential in the mobile communications marketplace and our ability to make sure the right person gets the right message on the right device at the right time.
We must address the challenge of effectively managing our operating expenses to support our revenue and bookings growth without allowing costs to erode our profitability objectives. We have established a free cash flow objective for our consolidated operations that focuses management on achieving operating efficiencies. We define free cash flow as operating income plus depreciation, amortization, accretion and impairment expenses (also known as “EBITDA”) less capital expenditures. We have defined this non-GAAP financial measure as operating cash flow. (See Item 7. Non-GAAP Financial Measures.)
Retain our wireless subscribers and revenue stream
— Wireless subscribers and the resulting revenue represented about 71%, 77% and 85% of our total consolidated revenue for each of the three years ended December 31, 2013. We will continue to focus on reducing the rate of subscriber disconnects and minimize the rate of revenue erosion. We continue to have a valuable
10
wireless presence in the healthcare market, particularly in larger hospitals. We offer a comprehensive suite of wireless messaging products and services focused on healthcare and “campus” type environments and critical mission notification. We will also focus on network reliability and customer service to help minimize the rate of subscriber disconnects.
We recognize that our wireless subscribers and revenue will continue to decline. We will also continue to reduce the underlying cost structure directly supporting this revenue stream. These cost reductions will come from all impacted areas. We will reduce payroll and related expenses as well as network related expenses as necessary in light of the declining revenue. We will integrate and consolidate operations as necessary to ensure the lowest cost operational platform for our consolidated business. We have established a total revenue objective for our operations that will focus management on both our software and wireless revenue targets.
Return capital to our stockholders
— We understand that our primary objective is to create long-term stockholder value. Executing our 2014 objectives is important but we continue to evaluate how best to deploy our capital resources to support sustainable business growth and maximize stockholder value. We expect to continue to pay a quarterly dividend of $0.125 per share of common stock or $0.50 annually. Also, we may repurchase more shares of our common stock from time to time under our existing stock repurchase program that expires on December 31, 2014. (See Item 5. Common Stock Repurchase program)
.
Seek long-term revenue growth through business diversification
— We believe that add-on acquisitions of companies or technologies are an important part of our future growth. We believe add-on acquisitions of complementary companies or technologies in the healthcare market will further enhance our position with current customers and expand our overall addressable markets. Rapidly and successfully integrating strategic acquisitions and improving operational efficiencies is a focus of our management team. Given the nature of our solutions new technologies can be integrated to accelerate cross-selling opportunities. Our goal is to evaluate other businesses that are profitably accretive and can accelerate our revenue goals.
To ensure focus on our 2014 business strategy we have established specific performance objectives in our short-term incentive plan (“STIP”) for our management that include these operating objectives and priorities. In addition, our long-term incentive plan (“LTIP”) includes specific performance objectives for these priorities.
ITEM 1A.
RISK FACTORS
The following important factors, among others, could cause our actual operating results to differ materially from those indicated or suggested by forward-looking statements made in this 2013 Form 10-K or presented elsewhere by management from time to time.
We may not realize the benefits of integrating our software and wireless operations.
In 2013 we recognized that maintaining separate wireless and software operations could impact our operational efficiency and ability to generate long-term stockholder value. While we had previously consolidated certain administrative functions such as information technology, human resources and accounting and finance, our consolidation efforts in 2014 will focus on customer support, logistics and sales and marketing. With respect to customer support and logistics we need to ensure that our integration activities will not impact customer service levels which could exacerbate our wireless subscriber churn and wireless revenue erosion. These integration activities could also impact the implementation of our software solutions and adversely impact our ability to deliver software maintenance support.
In 2014 we will begin to combine our sales and marketing teams from the wireless and software operations. The transition will occur over a multi-year period. Combining the wireless and software resources in Sales and Marketing may distract or dilute employee efforts to focus on executing core sales and marketing strategies in their respective areas of expertise. In addition, we risk losing key talent during this transition that may impede our ability to execute on our sales and marketing plans.
Our inability to successfully integrate our operations could adversely impact our operating cash flow and could have material adverse effects on our business, financial condition and statement of income including our continued ability to remain profitable, produce positive operating cash flow, pay cash dividends to stockholders and repurchase shares of our common stock.
The rate of subscriber and revenue erosion could exceed our ability to reduce operating expenses in order to maintain overall positive operating cash flow.
Our wireless revenue is dependent on the number of subscribers that use our paging devices. There is intense competition for these subscribers from other paging service providers and alternate wireless communications providers such as mobile phone and mobile data service providers. We expect our subscriber numbers and revenue to continue to decline into the foreseeable future. As this revenue erosion continues, maintaining positive cash flow is dependent on substantial and timely reductions in selected operating expenses. Reductions in operating expenses require both the reduction of internal costs and negotiation of lower costs from outside vendors. There can be no assurance that we will be able to reduce our operating expenses commensurate with
11
the level of revenue erosion. The inability to reduce operating expenses would have a material adverse impact on our business, financial condition and statement of income including our continued ability to remain profitable, produce positive operating cash flow, pay cash dividends to stockholders, and repurchase shares of our common stock.
We may experience a long sales cycle in our software operations.
Our software revenue growth results from a long sales cycle that from initial contact to final sales order may take 6 to 18 months depending on the type of software solution. Our software sales and marketing efforts involve educating our customers on the technical capabilities of our software solutions and the potential benefits from the deployment of our software. The inherent unpredictability of decision making resulting from budget constraints, multiple approvals and administrative issues may result in fluctuating bookings and revenue from month to month and quarter to quarter. While we attempt to manage this unpredictability through a robust marketing effort to identify sales opportunities, our bookings and corresponding revenue are dependent on actions that have occurred in the past. In every month we need to spend substantial time, effort, and expense on our marketing and sales efforts that may not result in future revenue.
The impact of this sales cycle could adversely impact our operating cash flow and margins and could have a material adverse effect on our business, financial condition and statement of income, including our continued ability to remain profitable, produce positive operating cash flow, pay cash dividends to stockholders, and repurchase shares of our common stock.
Service to our customers could be adversely impacted by network rationalization.
We have an active program to consolidate our number of networks and related transmitter locations, which is referred to as network rationalization. Network rationalization is necessary to match our technical infrastructure to our smaller subscriber base and to reduce both site rent and telecommunication costs. The implementation of the network rationalization program could adversely impact service to our existing subscribers despite our efforts to minimize the impact on subscribers. This adverse impact could increase the rate of gross subscriber cancellations and/or the level of revenue erosion. Adverse changes in gross subscriber cancellations and/or revenue erosion could have a material adverse effect on our business, financial condition and statement of income, including our continued ability to remain profitable, produce positive operating cash flow, pay cash dividends to stockholders, and repurchase shares of our common stock.
If we are unable to retain key management personnel, we might not be able to find suitable replacements in a timely basis, or at all, and our business could be disrupted.
Our success is largely dependent upon the continued service of a relatively small group of experienced and knowledgeable executive and management personnel. We believe that there is, and will continue to be, intense competition for qualified personnel in the telecommunication and software industry, and there is no assurance that we will be able to attract and retain the personnel necessary for the management and development of our business. Turnover, particularly among senior management, can also create distractions as we search for replacement personnel, which could result in significant recruiting, relocation, training and other costs, and can cause operational inefficiencies as replacement personnel become familiar with our business and operations. In addition, manpower in certain areas may be constrained, which could lead to disruptions over time. The consolidation of our wireless and software operations may mitigate this risk although the elimination or reconfiguration of employee responsibilities could impact retention decisions by key executives and management personnel. The loss or unavailability of one or more of our executive officers or the inability to attract or retain key employees in the future could have a material adverse effect on our business, financial condition and statement of income, including our continued ability to remain profitable, produce positive operating cash flow, pay cash dividends to stockholders, and repurchase shares of our common stock.
In order to grow our software revenue and bookings and maintain our wireless revenue and subscribers we are dependent on our ability to effectively manage our employee base in areas such as sales, marketing, product development and implementation.
Growth in our software revenue and bookings and maintenance of our wireless revenue and subscriber base is dependent on the sales productivity of our sales organization. We anticipate that we will continue to improve our sales productivity. A number of mitigating factors could adversely impact our productivity assumptions. Those factors include competitive forces, employee turnover, product innovation and overall market conditions. Our software revenue and bookings growth is also dependent on our ability to attract, integrate and retain employees in our operations. To protect our employee base from competition for software talent, we initiated a software compensation study and developed a market-competitive compensation and rewards strategy. We believe that we have implemented appropriate compensation and incentive programs for our employees, but future costs of these programs is dependent on market conditions that are subject to change. Adverse changes in our sales productivity or ability to attract, integrate and retain employees could have a material adverse effect on our business, financial condition and statement of income including our continued ability to remain profitable, produce positive operating cash flow, pay dividends to stockholders and repurchase shares of our common stock.
12
We may be unable to find vendors able to supply us with paging equipment based on future demands.
We purchase paging equipment from third party vendors. This equipment is sold or leased to customers in order to provide wireless messaging services. The reduction in industry demand for paging equipment has caused various suppliers to cease manufacturing this equipment. There can be no assurance that we can continue to find vendors to supply paging equipment, or that the vendors will supply equipment at costs that allow us to remain a competitive alternative in the wireless messaging industry. A lack of paging equipment could impact our ability to provide certain wireless messaging services and could have a material adverse effect on our business, financial condition and statement of income, including our continued ability to remain profitable, produce positive operating cash flow, pay cash dividends to stockholders, and repurchase shares of our common stock.
We may be unable to realize the benefits associated with our deferred income tax assets.
We have significant deferred income tax assets that are available to offset future taxable income and increase cash flows from operations. The use of these deferred income tax assets is dependent on the availability of taxable income in future periods. The availability of future taxable income is dependent on our ability to profitably grow our software operations and to continue to reduce operating expenses and to maintain profitability in our wireless operations as both revenue and subscribers are expected to decline in the future. To the extent that anticipated reductions in operating expenses do not occur or sufficient revenue is not generated, we may not achieve sufficient taxable income to allow for use of our deferred income tax assets. The accounting for deferred income tax assets is based upon an estimate of future results, and the valuation allowance may be increased or decreased as conditions change or if we are unable to implement certain tax planning strategies. If we are unable to use these deferred income tax assets, our financial condition and statement of income may be materially affected. In addition, a significant portion of our deferred income tax assets relate to net operating losses. If our ability to utilize these losses is limited, due to Internal Revenue Code (“IRC”) Section 382, our financial condition and statement of income may be materially affected.
Our wireless operations are regulated by the FCC and, to a lesser extent, state and local regulatory authorities. Changes in regulation could result in increased costs to us and our customers.
We are subject to regulation by the FCC and, to a lesser extent, by state and local authorities. Changes in regulatory policy could increase the fees we must pay to the government or to third parties, and could subject us to more stringent requirements that could cause us to incur additional capital and/or operating costs. To the extent additional regulatory costs are passed along to customers, those increased costs could adversely impact subscriber cancellations.
For example, the FCC issued an order in October 2007 that mandated paging carriers (such as us) along with all other CMRS providers serving a defined minimum number of subscribers to maintain an emergency back-up power supply at all cell sites to enable operation for a minimum of eight hours in the event of a loss of commercial power (the “Back-up Power Order”). Ultimately, after a hearing by the DC Circuit Court and disapproval by the Office of Management and Budget (the “OMB”) of the information collection requirements of the Back-Up Power Order, the FCC indicated that it would not seek to override the OMB’s disapproval. Rather the FCC indicated that it would issue a Notice of Proposed Rulemaking with the goal of adopting revised back-up power rules. To date, there has been no Notice of Proposed Rulemaking by the FCC and we are unable to predict what impact, if any, a revised back-up power rule could have on our operations, cash flows, ability to continue payment of cash dividends to stockholders, and ability to repurchase shares of our common stock.
The FCC continues to consider changes to the rules governing the collection of universal service fees. The FCC is evaluating a flat monthly charge per assigned telephone number as opposed to assessing universal service contributions based on telecommunication carriers’ interstate revenue. There is no timetable for any rulemaking to implement this numbers-based methodology. If the FCC adopts a numbers-based methodology, our attempt to recover the increased contribution costs from our customers could significantly diminish demand for our services, and our failure to recover such increased contribution costs could have a material adverse impact on our business, financial condition and statement of income, including our continued ability to remain profitable, produce positive operating cash flow, pay cash dividends to stockholders and repurchase shares of our common stock.
In our software operations certain of our software products are regulated by the FDA. The application of or changes in regulations could impact our ability to market new or revised software products to our customers.
Certain of our software products are regulated by the FDA as medical devices. The classification of our software products as medical devices means that we are required to comply with certain registration and listing, labeling, medical device reporting, removal and correction, and good manufacturing practice requirements. Updates to these products or the development of new products could require us to seek clearance from the FDA before we are permitted to market or sell these software products. In addition, changes to FDA regulations could impact existing software products or updates to existing products. The impact of delays in FDA clearance or changes to FDA regulations could impact our ability to market or sell our software products and could have a material adverse effect on our software operations, financial condition and statement of income, including our continued ability
13
to remain profitable, produce positive operating cash flow, pay cash dividends to stockholders and repurchase shares of our common stock.
We have investigated potential acquisitions and may be unable to successfully integrate such acquisitions into our business and may not achieve all or any of the operating synergies or anticipated benefits of those acquisitions.
We continue to evaluate acquisitions of other businesses where we believe such acquisitions will yield increased cash flows, improved market penetration and/or identified operating efficiencies and synergies. We cannot provide any assurances that we will be successful in finding such acquisitions or consummating future acquisitions on favorable terms. We anticipate that our acquisitions will be financed through a combination of methods, including but not limited to the use of available cash on hand, and borrowings under our revolving credit facility. Disruptions in credit markets may limit our ability to finance acquisitions should financing requirements exceed the availability under our revolving credit facility. In addition, we may face various challenges with our integration efforts, including the combination and simplification of product and service offerings, sales and marketing approaches and establishment of combined operations. Although acquired businesses may have significant operating histories, we may have limited or no history of owning and operating these businesses. If we were to acquire these businesses, there can be no assurance that:
|
•
|
such businesses will perform as expected;
|
|
•
|
such businesses will not incur unforeseen obligations or liabilities;
|
|
•
|
such businesses will generate sufficient cash flow to support the indebtedness, if incurred, to acquire them or the expenditures needed to develop them; and/or
|
|
•
|
the rate of return from such businesses will justify the decision to invest the capital to acquire them.
|
If we do not realize all or any of the anticipated benefits of an acquisition, it could have a material adverse effect on our business, financial condition and statement of income, including our continued ability to remain profitable, produce positive operating cash flow, pay cash dividends to stockholders, and repurchase shares of our common stock.
Technical problems and higher costs may affect our product development initiatives.
Our future software revenue growth depends on our ability to develop, introduce and effectively deploy new solutions and features to our existing software solutions. These new features and functionalities are designed to address both existing and new customer requirements. While we have a disciplined approach to product development, we may experience technical problems and additional costs as these new features are tested and deployed. Failure to effectively develop new or improved software solutions could adversely impact software revenue growth and could have a material adverse effect on our operations, financial condition and statement of income including our continued ability to remain profitable, produce positive operating cash flow, pay cash dividends to stockholders, and repurchase shares of our common stock.
We may experience litigation on intellectual property infringement.
Intellectual property infringement litigation has become commonplace. This litigation can be protracted, expensive, and time consuming. Although we have not experienced any litigation of this type in the past, there is no assurance that we will remain immune to this type of predatory litigation. Any such claims, whether meritorious or not, could be time consuming and costly in terms of both resources and management time.
Third parties may claim we infringe their intellectual property rights. We may receive claims that we have infringed the intellectual property rights of others, including claims regarding patents, copyrights, and trademarks. The number of these claims may grow as a result of constant technological change in the segments in which our software products compete, the extensive patent coverage of existing technologies, and the rapid rate of issuance of new patents.
Our portfolio of issued patents and copyrights may be insufficient to defend ourselves against intellectual property infringement claims. We understand these risks and will take reasonable and appropriate action to protect ourselves as we develop and deploy additional software solutions. Should we experience litigation on intellectual property infringement, such litigation could have a material adverse impact on our ability to sell our software solutions and on our financial condition and statement of income including our continued ability to remain profitable, produce positive operating cash flow, pay cash dividends to stockholders, and repurchase shares of our common stock.
We may encounter issues with privacy and security of personal information.
A substantial portion of our revenue comes from healthcare customers. Our software solutions may handle or have access to personal health information subject in the United States to HIPPA, HITECH and related regulations as well as legislation and regulations in foreign countries. These statutes and related regulations impose numerous requirements regarding the use and
14
disclosure of personal health information with which we must comply. Our failure to accurately anticipate or interpret these complex and technical laws and regulations could subject us to civil and/or criminal liability. We make every effort to comply with these and all relevant statutes and regulations. Such failure could adversely impact our ability to market and sell our software solutions to healthcare customers, and have a material adverse impact on our software operations, financial condition and statement of income including our continued ability to remain profitable, produce positive operating cash flow, pay cash dividends to stockholders and repurchase shares of our common stock.
System disruptions and security threats to our computer networks, satellite control or telecommunications systems could have a material adverse effect on our business.
The performance and reliability of our computer network and telecommunications systems infrastructure is critical to our operations. Any computer system or satellite network error or failure, regardless of cause, could result in a substantial outage that materially disrupts our operations. In addition, we face the threat to our computer systems of unauthorized access, computer hackers, computer viruses, malicious code, organized cyber-attacks and other security problems and system disruptions. We devote significant resources to the security of our computer systems, but our computer systems may still be vulnerable to these threats. A user who circumvents security measures could misappropriate proprietary information or cause interruptions or malfunctions in our operations. As a result, we may be required to expend significant resources to protect against the threat of these system disruptions and security breaches or to alleviate problems caused by these disruptions and breaches. Any of these events could have a material adverse effect on our business, financial condition, statement of income and cash flows.
We may encounter issues with international sales and expansion.
A portion of our revenue comes from international sales. We plan to further expand our international presence. We may not be successful in our efforts to expand into these international markets. Our international sales and operations are subject to a number of risks, including:
|
•
|
compliance with foreign and U.S. laws and regulations including the U.S. Foreign Corrupt Practices Act and the United Kingdom Bribery Act 2010;
|
|
•
|
volatility in international political and economic environments;
|
|
•
|
imposition of taxes, export controls, tariffs, embargoes and other trade barriers;
|
|
•
|
changes in regulatory requirements;
|
|
•
|
lack of strong intellectual property protection;
|
|
•
|
difficulty in staffing, developing and managing foreign operations;
|
|
•
|
limitations on the repatriation and investment of funds;
|
|
•
|
fluctuations in foreign currency exchange rates; and
|
|
•
|
geopolitical developments, including war and terrorism.
|
In addition, the economic uncertainty in Europe and implementation of stringent financial austerity measures by many national governments, and the continuing risk of conflict and political instability in the Middle East may lead to delays or cancellations of our sales orders. The consistent growth in the economy of Australia and increase in compensation costs may make it increasingly difficult to attract and retain quality staff and may increase our cost of doing business.
We are unable to predict the impact of these factors. Any one or more of these factors could adversely affect our business, financial condition and statement of income including our continued ability to remain profitable, produce positive operating cash flow, pay cash dividends to stockholders, and repurchase shares of our common stock.
General economic conditions that are largely out of our control may adversely affect our financial condition and statement of income.
Our business is sensitive to changes in general economic conditions, both nationally and locally. Recessionary economic cycles, higher interest rates, inflation, higher levels of unemployment, higher tax rates and other changes in tax laws, or other economic factors that may affect business spending or buying habits could adversely affect the demand for our services. This adverse impact could increase the rate of gross subscriber cancellations and/or the level of revenue erosion. Adverse changes in gross subscriber cancellations and/or revenue erosion could have a material adverse effect on our business, financial condition and statement of income, including our continued ability to remain profitable, produce positive operating cash flow, pay cash dividends to stockholders, and repurchase shares of our common stock.
A significant portion of our revenue is derived from healthcare customers and we are impacted by changes in the healthcare economic environment. The healthcare industry is highly regulated and is subject to changing political, legislative, regulatory, and
15
other economic developments. These developments can have a dramatic effect on the decision-making and the spending for information technology and software. This economic uncertainty can add to the unpredictability of decision-making and lengthen our sales cycle. We plan to respond to these conditions by maintaining our marketing focus and continuing our diversification into other market segments including government and large enterprise.
Further, the consequences of the healthcare reform legislation continue to impact both the economy in general and the healthcare market in particular. The uncertainty created by the legislation is impacting customer decision making and information technology plans in our key healthcare market. We are unable to predict the full consequences of this uncertainty on our operations. Adverse changes in the economic environment could adversely impact our ability to market and sell our wireless and software solutions to healthcare customers and have a material adverse impact on our software operations, financial condition and statement of income including our continued ability to remain profitable, produce positive operating cash flow, pay cash dividends to stockholders, and repurchase shares of our common stock.
ITEM 1B.
UNRESOLVED STAFF COMMENTS
We had no unresolved SEC staff comments as of March 11, 2014.
ITEM 2.
PROPERTIES
Wireless
Operations
— At December 31, 2013, we owned one office building in the United States. The office building has 4,400 square feet and is located in Rochester, New York. In addition, we leased facility space, including our executive headquarters, sales, technical, and storage facilities in approximately 71 locations in 31 states.
At December 31, 2013, we leased transmitter sites on commercial broadcast towers, buildings and other fixed structures in approximately 3,652 locations throughout the United States. These leases are for our active transmitters and are for various terms and provide for periodic lease payments at various rates.
At December 31, 2013, we had 4,538 active transmitters on leased sites which provide service to our customers (of which 2,302 are customer provided sites with no associated site rent expenses).
Software
Operations
— At December 31, 2013, we leased seven facilities in the United States, one facility in Australia, one facility in the United Kingdom and one facility in the Middle East, which included space in four office buildings, three executive sales offices, two storage facilities and one warehouse location.
ITEM 3.
LEGAL PROCEEDINGS
We are involved, from time to time, in lawsuits arising in the normal course of business. We believe these pending lawsuits will not have a material adverse impact on our financial results or statement of income.
ITEM 4.
MINE SAFETY DISCLOSURES
Not applicable.
ITEM 5.
MARKET FOR REGISTRANT’S COMMON EQUITY, RELATED STOCKHOLDER MATTERS AND ISSUER
PURCHASES OF EQUITY SECURITIES
Our sole class of common equity is our $0.0001 par value common stock, which is listed on the NASDAQ National Market
®
and is traded under the symbol “USMO.”
The following table sets forth the high and low intraday sales prices per share of our common stock for the periods indicated, which correspond to our quarterly fiscal periods for financial reporting purposes. Prices for our common stock are as reported on the NASDAQ National Market
®
from January 1, 2012 through December 31, 2013.
16
|
|
2013
|
2012
|
|||||||||||||
|
For the Three Months Ended
|
High
|
Low
|
High
|
Low
|
|||||||||||
|
March 31,
|
$
|
13.30
|
|
$
|
11.10
|
|
$
|
15.20
|
|
$
|
13.10
|
|
|||
|
June 30,
|
14.19
|
|
12.19
|
|
14.32
|
|
11.51
|
|
|||||||
|
September 30,
|
15.79
|
|
13.30
|
|
14.29
|
|
10.71
|
|
|||||||
|
December 31,
|
15.55
|
|
12.58
|
|
12.49
|
|
10.34
|
|
|||||||
We sold no unregistered securities during the years ended December 31, 2013, 2012 and 2011. As of March 7, 2014, there were 4,579 holders of record of our common stock.
Cash Distributions/Dividends to Stockholders
The following table details information on our cash distributions since the formation of USA Mobility through the year ended December 31, 2013. Cash distributions paid as disclosed in the statements of cash flows for the years ended December 31, 2008 through December 31, 2013, include previously declared cash distributions on restricted stock units (“RSUs”) and shares of vested restricted common stock (“restricted stock”) granted under the USA Mobility, Inc. Equity Incentive Plan (“Equity Plan”) to executives and non-executive members of our Board of Directors. Cash distributions on RSUs and restricted stock have been accrued and are paid when the applicable vesting conditions are met. Accrued cash distributions on forfeited RSUs and restricted stock are also forfeited. So long as no default or event of default exists as defined in our Amended and Restated Credit Agreement with Wells Fargo Capital Finance, LLC we may declare and pay dividends of up to $25.0 million in any fiscal year.
|
Year
|
Per Share
Amount
|
|
Total
Payment
(1)
|
||||
|
|
|
|
(Dollars in
thousands)
|
||||
|
2005
|
$
|
1.50
|
|
$
|
40,691
|
|
|
|
2006
(2)
|
3.65
|
|
98,904
|
|
|||
|
2007
(3)
|
3.60
|
|
98,250
|
|
|||
|
2008
(4)
|
1.40
|
|
39,061
|
|
|||
|
2009
(3)
|
2.00
|
|
45,502
|
|
|||
|
2010
(3)
|
2.00
|
|
44,234
|
|
|||
|
2011
|
1.00
|
|
22,121
|
|
|||
|
2012
(5)
|
0.75
|
|
16,512
|
|
|||
|
2013
|
0.50
|
|
12,312
|
|
|||
|
Total
|
$
|
16.40
|
|
$
|
417,587
|
|
|
|
(1)
|
The total payment reflects the cash distributions paid in relation to common stock, vested RSUs and vested shares of restricted stock.
|
|
(2)
|
On August 8, 2006, we announced the adoption of a regular quarterly cash distribution of $0.65 per share of common stock.
|
|
(3)
|
The cash distribution includes an additional special one-time cash distribution to stockholders of $1.00 per share of common stock.
|
|
(4)
|
On May 2, 2008, our Board of Directors reset the quarterly cash distribution rate to $0.25 per share of common stock from $0.65 per share of common stock.
|
|
(5)
|
On July 30, 2012, our Board of Directors reset the quarterly cash distribution rate to $0.125 per share of common stock from $0.25 per share of common stock.
|
On March 5, 2014, our Board of Directors declared a regular quarterly cash dividend of $0.125 per share of common stock, with a record date of March 18, 2014, and a payment date of March 28, 2014. This cash dividend of approximately $2.7 million is expected to be paid from available cash on hand.
Common Stock Repurchase Program
On July 31, 2008, our Board of Directors approved a program to repurchase up to $50.0 million of our common stock in the open market during the twelve-month period commencing on or about August 5, 2008. This program has been extended at various times, most recently through December 31, 2014.
17
Credit Suisse Securities (USA) LLC administers such purchases. We use available cash on hand and net cash provided by operating activities to fund the common stock repurchase program. This repurchase authority allows us, at management’s discretion, to selectively repurchase shares of our common stock from time to time in the open market depending upon market price and other factors.
For the quarter and year ended December 31, 2013, we made no common stock repurchase. From the inception of the program in August 2008 through December 31, 2013, we have repurchased a total of 6,268,504 shares of our common stock for approximately $59.8 million (excluding commissions). There was approximately $17.0 million of common stock repurchase authority remaining under the program as of December 31, 2013. The repurchase authority was reset to $15.0 million as of January 1, 2014. All repurchased shares of common stock were returned to the status of authorized but unissued shares of the Company. Repurchased shares of our common stock were accounted for as a reduction to common stock and additional paid-in-capital in the period in which the repurchase occurred.
Securities Authorized for Issuance Under Equity Compensation Plan
The following table sets forth, as of December 31, 2013, the number of securities outstanding under our currently authorized Equity Plan, the weighted-average exercise price of such securities and the number of securities available for grant under this plan:
|
Plan Category
|
Number of securities to be issued upon exercise of outstanding options, warrants and rights
[a] |
|
Weighted-average exercise price of outstanding options, warrants and rights
[b] |
|
Number of securities remaining available for future issuance under equity compensation plans (excluding securities
reflected in column[a])[c] |
|||
|
Equity compensation plan approved by security holders:
|
|
|
|
|
|
|||
|
2012 USA Mobility, Inc. Equity Incentive Plan
|
—
|
|
|
—
|
|
|
1,720,752
|
|
|
Equity compensation plan not approved by security holders:
|
||||||||
|
None
|
—
|
|
—
|
|
—
|
|
||
|
Total
|
—
|
|
—
|
|
1,720,752
|
|
||
|
(1)
|
The Equity Plan provides that common stock authorized for issuance under the plan may be granted in the form of common stock, stock options, restricted stock and RSUs. As of December 31, 2013, 109,193 shares of restricted stock were granted to the non-executive members of the Board of Directors and 617,027 RSUs were granted to eligible employees under the Equity Plan.
|
Performance Graph
We began trading on the NASDAQ National Market
®
on November 17, 2004. The chart below compares the relative changes in the cumulative total return of our common stock for the period December 31, 2008 to December 31, 2013, against the cumulative total return of the NASDAQ Composite Index
®
and the NASDAQ Telecommunications Index
®
for the same period.
The chart below assumes that on December 31, 2008, $100 was invested in our common stock and in each of the indices. The comparisons assume that all cash distributions were reinvested. The chart indicates the dollar value of each hypothetical $100 investment based on the closing price as of the last trading day of each fiscal year from December 31, 2008 to December 31, 2013.
18
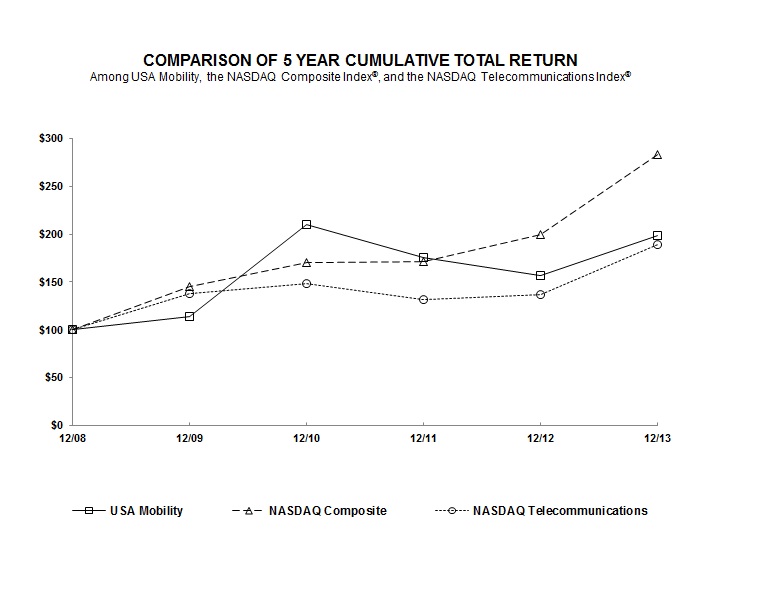
Transfer Restrictions on Common Stock
In order to reduce the possibility that certain changes in ownership could impose limitations on the use of our deferred income tax assets, our Amended and Restated Certificate of Incorporation contains provisions which generally restrict transfers by or to any 5% stockholder of our common stock or any transfer that would cause a person or group of persons to become a 5% stockholder of our common stock. After a cumulative indirect shift in ownership of more than 45% since our emergence from bankruptcy proceedings in May 2002 through a transfer of our common stock, any transfer of our common stock by or to a 5% stockholder of our common stock or any transfer that would cause a person or group of persons to become a 5% stockholder of such common stock, will be prohibited unless the transferee or transferor provides notice of the transfer to us and our Board of Directors determines in good faith that the transfer would not result in a cumulative indirect shift in ownership of more than 47%.
Prior to a cumulative indirect ownership change of more than 45%, transfers of our common stock will not be prohibited, except to the extent that they result in a cumulative indirect shift in ownership of more than 47%, but any transfer by or to a 5% stockholder of our common stock or any transfer that would cause a person or group of persons to become a 5% stockholder of our common stock requires notice to us. Similar restrictions apply to the issuance or transfer of an option to purchase our common stock, if the exercise of the option would result in a transfer that would be prohibited pursuant to the restrictions described above. These restrictions will remain in effect until the earliest of (1) the repeal of IRC Section 382 (or any comparable successor provision) and (2) the date on which the limitation amount imposed by IRC Section 382 in the event of an ownership change would not be less than the tax attributes subject to these limitations. Transfers by or to us and any transfer pursuant to a merger approved by our Board of Directors or any tender offer to acquire all of our outstanding stock where a majority of the shares have been tendered will be exempt from these restrictions.
Based on publicly available information and after considering any direct knowledge we may have, our combined cumulative change in ownership was 3.24% as of December 31, 2013 compared to 6.88% as of December 31, 2012.
19
ITEM 6.
SELECTED FINANCIAL DATA
The following selected consolidated financial data should be read in conjunction with “Item 7. Management’s Discussion and Analysis of Financial Condition and Statement of Income” (“MD&A”), the consolidated financial statements and notes thereto, and other financial information appearing elsewhere in this 2013 Form 10-K. (Software operations have been reflected in the consolidated financial data from March 3, 2011, the acquisition date.)
|
|
For the Year Ended December 31,
|
||||||||||||||||||
|
|
2013
|
2012
|
2011
|
2010
|
2009
|
||||||||||||||
|
|
(Dollars in thousands except per share amounts)
|
||||||||||||||||||
|
Statements of Income Data:
|
|||||||||||||||||||
|
Revenues
|
$
|
209,752
|
|
$
|
219,696
|
|
$
|
233,693
|
|
$
|
233,254
|
|
$
|
289,706
|
|
||||
|
Operating expenses
|
164,258
|
|
173,968
|
|
181,864
|
|
176,075
|
|
232,298
|
|
|||||||||
|
Operating income
|
45,494
|
|
45,728
|
|
51,829
|
|
57,179
|
|
57,408
|
|
|||||||||
|
Net income
|
27,530
|
|
26,984
|
|
83,786
|
|
77,898
|
|
67,558
|
|
|||||||||
|
Basic net income per common share
|
1.27
|
|
1.23
|
|
3.79
|
|
3.50
|
|
2.95
|
|
|||||||||
|
Diluted net income per common share
|
1.25
|
|
1.20
|
|
3.72
|
|
3.45
|
|
2.90
|
|
|||||||||
|
Cash distributions declared per common share
|
0.50
|
|
0.75
|
|
1.00
|
|
2.00
|
|
2.00
|
|
|||||||||
|
|
December 31,
|
||||||||||||||||||
|
|
2013
|
2012
|
2011
|
2010
|
2009
|
||||||||||||||
|
|
(Dollars in thousands)
|
||||||||||||||||||
|
Balance Sheets Data:
|
|||||||||||||||||||
|
Current assets
|
$
|
120,168
|
|
$
|
95,909
|
|
$
|
105,492
|
|
$
|
154,356
|
|
$
|
137,843
|
|
||||
|
Total assets
|
326,898
|
|
322,627
|
|
354,421
|
|
230,658
|
|
213,548
|
|
|||||||||
|
Long-term debt
|
—
|
|
—
|
|
28,250
|
|
—
|
|
—
|
|
|||||||||
|
Long-term liabilities, excluding deferred revenue
|
9,259
|
|
9,789
|
|
12,223
|
|
11,787
|
|
11,228
|
|
|||||||||
|
Stockholders’ equity
|
269,950
|
|
251,419
|
|
247,587
|
|
184,390
|
|
158,796
|
|
|||||||||
ITEM 7.
MANAGEMENT’S DISCUSSION AND ANALYSIS OF FINANCIAL CONDITION AND STATEMENT OF
INCOME
The following discussion and analysis should be read in conjunction with our consolidated financial statements and related notes and the discussions under “Application of Critical Accounting Policies” (also under Item 7.), which describes key estimates and assumptions we make in the preparation of our consolidated financial statements; “Item 1. Business”, which describes our wireless and software operations; and “Item 1A. Risk Factors”, which describes key risks associated with our operations and markets in which we operate. A reference to a “Note” in this section refers to the accompanying Notes to Consolidated Financial Statements.
Overview
We offer our services and products in the United States and abroad primarily to three major market segments: healthcare, government and large enterprise, while our software operations also have a presence in the hospitality market. For the wireless operations, the government business has been trending downward over the last several years as state and local governments have been struggling with budget constraints. At the same time, our wireless services tend to be a reliable and low cost communication alternative when budgets are constrained and therefore paging services can be positioned well against other communication tools. Large enterprise customers have been trending away from paging to cellular/smart phones for a number of years and we expect that trend to continue in future years. Our software operations leverage these trends with more advanced critical messaging offerings such as our Amcom Mobile Connect offering for smart phones, which enables caregivers and physicians to communicate more effectively, and other more advanced unified communication tools. The trend toward more advanced/smart communications devices has been ongoing in large enterprise and is emerging in healthcare and government.
20
The following table indicates revenue by key market segments for the periods stated and illustrates the relative significance of these market segments to our wireless operations.
|
|
For the Year Ended December 31,
|
|||||||||||||||||||
|
Market Segment
|
2013
|
% of Total
|
2012
|
% of Total
|
2011
|
% of Total
|
||||||||||||||
|
|
(Dollars in thousands)
|
|||||||||||||||||||
|
Healthcare
|
$
|
97,458
|
|
65.2
|
%
|
$
|
102,036
|
|
60.6
|
%
|
$
|
111,950
|
|
56.1
|
%
|
|||||
|
Government
|
11,894
|
|
8.0
|
%
|
15,228
|
|
9.0
|
%
|
19,961
|
|
10.0
|
%
|
||||||||
|
Large Enterprise
|
17,056
|
|
11.4
|
%
|
20,846
|
|
12.4
|
%
|
25,721
|
|
12.9
|
%
|
||||||||
|
Other
|
17,559
|
|
11.7
|
%
|
22,717
|
|
13.5
|
%
|
31,139
|
|
15.5
|
%
|
||||||||
|
Total Direct
|
143,967
|
|
96.3
|
%
|
160,827
|
|
95.5
|
%
|
188,771
|
|
94.5
|
%
|
||||||||
|
Total Indirect
|
5,481
|
|
3.7
|
%
|
7,578
|
|
4.5
|
%
|
10,930
|
|
5.5
|
%
|
||||||||
|
Total
|
$
|
149,448
|
|
100.0
|
%
|
$
|
168,405
|
|
100.0
|
%
|
$
|
199,701
|
|
100.0
|
%
|
|||||
Our software operations focus primarily on the healthcare and government market segments, but with a greater emphasis on the healthcare market segment. The following table indicates revenue by key market segments for the periods stated and indicates the relative significance of these market segments to our software operations
.
|
|
For the Year Ended December 31,
|
|||||||||||||||||||
|
Market Segment
|
2013
|
% of Total
|
2012
|
% of Total
|
2011
(1)
|
% of Total
|
||||||||||||||
|
|
(Dollars in thousands)
|
|||||||||||||||||||
|
Healthcare
|
$
|
40,501
|
|
67.2
|
%
|
$
|
32,237
|
|
62.9
|
%
|
$
|
20,327
|
|
59.8
|
%
|
|||||
|
Government
|
6,751
|
|
11.2
|
%
|
5,064
|
|
9.9
|
%
|
2,944
|
|
8.7
|
%
|
||||||||
|
Large Enterprise
|
2,658
|
|
4.4
|
%
|
2,767
|
|
5.4
|
%
|
1,817
|
|
5.3
|
%
|
||||||||
|
Other
(2)
|
3,276
|
|
5.4
|
%
|
2,939
|
|
5.7
|
%
|
1,972
|
|
5.8
|
%
|
||||||||
|
Total Direct
|
53,186
|
|
88.2
|
%
|
43,007
|
|
83.8
|
%
|
27,060
|
|
79.6
|
%
|
||||||||
|
Total Indirect
|
7,118
|
|
11.8
|
%
|
8,284
|
|
16.2
|
%
|
6,932
|
|
20.4
|
%
|
||||||||
|
Total
|
$
|
60,304
|
|
100.0
|
%
|
$
|
51,291
|
|
100.0
|
%
|
$
|
33,992
|
|
100.0
|
%
|
|||||
|
(1)
|
Revenue reflects results from March 3, 2011 (the acquisition date) to December 31, 2011 and is net of maintenance revenue reductions of $6.1 million required by purchase accounting to reflect fair value.
|
(2)
Other includes hospitality, resort and billable travel revenue.
We generate revenue by providing paging services, as well as developing, licensing, and supporting a wide range of software products and services. Our most significant expenses are related to compensating employees, site rents, telecommunications and taxes.
Wireless Operations
Our wireless operations provide one-way and advanced two-way wireless messaging services including information services throughout the United States. We also offer voice mail, personalized greeting, message storage and retrieval, and equipment loss and/or maintenance protection to both one-way and two-way messaging subscribers. We market and distribute these wireless messaging and information services through a direct sales force and a small indirect sales channel. (See Item 1. “Business” for more details.)
The following table summarizes the breakdown of our direct and indirect units in service at specified dates:
|
|
As of December 31,
|
||||||||||||||||
|
|
2013
|
2012
|
2011
|
||||||||||||||
|
Distribution Channel
|
Units
|
% of Total
|
Units
|
% of Total
|
Units
|
% of Total
|
|||||||||||
|
|
(Units in thousands)
|
||||||||||||||||
|
Direct
|
1,315
|
|
95.6
|
%
|
1,421
|
|
93.8
|
%
|
1,555
|
|
93.2
|
%
|
|||||
|
Indirect
|
61
|
|
4.4
|
%
|
94
|
|
6.2
|
%
|
113
|
|
6.8
|
%
|
|||||
|
Total
|
1,376
|
|
100.0
|
%
|
1,515
|
|
100.0
|
%
|
1,668
|
|
100.0
|
%
|
|||||
As noted above in “Overview,” our key market segments are healthcare, government and large enterprise. The following table indicates the percentage of our units in service by key market segments for the periods stated and illustrates the relative significance of these market segments to our operations.
21
|
|
As of December 31,
|
|||||||
|
Market Segment
|
2013
|
2012
|
2011
|
|||||
|
Healthcare
|
71.9
|
%
|
67.1
|
%
|
62.6
|
%
|
||
|
Government
|
8.6
|
%
|
10.3
|
%
|
11.9
|
%
|
||
|
Large Enterprise
|
8.1
|
%
|
8.5
|
%
|
9.5
|
%
|
||
|
Other
|
7.0
|
%
|
7.9
|
%
|
9.2
|
%
|
||
|
Total Direct
|
95.6
|
%
|
93.8
|
%
|
93.2
|
%
|
||
|
Total Indirect
|
4.4
|
%
|
6.2
|
%
|
6.8
|
%
|
||
|
Total
|
100.0
|
%
|
100.0
|
%
|
100.0
|
%
|
||
The following table sets forth information on our direct units in service by account size for the periods stated:
|
|
As of December 31,
|
||||||||||||||||
|
Account Size
|
2013
|
% of Total
|
2012
|
% of Total
|
2011
|
% of Total
|
|||||||||||
|
|
(Units in thousands)
|
||||||||||||||||
|
1 to 3 Units
|
43
|
|
3.2
|
%
|
52
|
|
3.6
|
%
|
65
|
|
4.2
|
%
|
|||||
|
4 to 10 Units
|
25
|
|
1.9
|
%
|
31
|
|
2.2
|
%
|
40
|
|
2.6
|
%
|
|||||
|
11 to 50 Units
|
61
|
|
4.6
|
%
|
75
|
|
5.3
|
%
|
92
|
|
5.9
|
%
|
|||||
|
51 to 100 Units
|
42
|
|
3.2
|
%
|
49
|
|
3.5
|
%
|
56
|
|
3.6
|
%
|
|||||
|
101 to 1000 Units
|
287
|
|
21.9
|
%
|
334
|
|
23.5
|
%
|
380
|
|
24.4
|
%
|
|||||
|
> 1000 Units
|
857
|
|
65.2
|
%
|
880
|
|
61.9
|
%
|
922
|
|
59.3
|
%
|
|||||
|
Total direct units in service
|
1,315
|
|
100.0
|
%
|
1,421
|
|
100.0
|
%
|
1,555
|
|
100.0
|
%
|
|||||
We provide wireless messaging services to subscribers for a periodic fee, as described above. In addition, subscribers either lease a messaging device from us for an additional fixed monthly fee or they own a device, having purchased it either from us or from another vendor. We also sell devices to resellers who lease or resell devices to their subscribers and then sell messaging services utilizing our networks.
We derive the majority of our revenue from fixed monthly or other periodic fees, charged to subscribers for wireless messaging services. Such fees are not generally dependent on usage. As long as a subscriber maintains service, operating results benefit from recurring payment of these fees. Revenue is generally based upon the number of units in service and the monthly charge per unit. The number of units in service changes based on subscribers added, referred to as gross placements, less subscriber cancellations, or disconnects. The net of gross placements and disconnects is commonly referred to as net gains or losses of units in service or net disconnect rate. The absolute number of gross placements as well as the number of gross placements relative to average units in service in a period, referred to as the gross placement rate, is monitored on a monthly basis. Disconnects are also monitored on a monthly basis. The ratio of units disconnected in a period to average units in service for the same period, called the disconnect rate, is an indicator of our success at retaining subscribers, which is important in order to maintain recurring revenue and to control operating expenses.
The following table sets forth our gross placements and disconnects for the periods stated:
|
|
For the Year Ended December 31,
|
||||||||||||||||
|
|
2013
|
2012
|
2011
|
||||||||||||||
|
Distribution Channel
|
Gross
Placements |
Disconnects
|
Gross
Placements |
Disconnects
|
Gross
Placements |
Disconnects
|
|||||||||||
|
|
(Units in thousands)
|
||||||||||||||||
|
Direct
|
174
|
|
280
|
|
193
|
|
327
|
|
209
|
|
405
|
|
|||||
|
Indirect
|
4
|
|
37
|
|
6
|
|
25
|
|
11
|
|
36
|
|
|||||
|
Total
|
178
|
|
317
|
|
199
|
|
352
|
|
220
|
|
441
|
|
|||||
22
The following table sets forth information on the direct net disconnect rate by account size for our direct customers for the periods stated:
|
|
For the Year Ended December 31,
|
|||||||
|
Account Size
|
2013
|
2012
|
2011
|
|||||
|
1 to 3 Units
|
(17.6
|
)%
|
(20.9
|
)%
|
(22.0
|
)%
|
||
|
4 to 10 Units
|
(18.8
|
)%
|
(20.9
|
)%
|
(23.6
|
)%
|
||
|
11 to 50 Units
|
(18.2
|
)%
|
(19.1
|
)%
|
(25.2
|
)%
|
||
|
51 to 100 Units
|
(14.8
|
)%
|
(12.2
|
)%
|
(26.8
|
)%
|
||
|
101 to 1000 Units
|
(13.9
|
)%
|
(12.1
|
)%
|
(12.9
|
)%
|
||
|
> 1000 Units
|
(2.6
|
)%
|
(4.5
|
)%
|
(5.9
|
)%
|
||
|
Total direct net unit loss %
|
(7.4
|
)%
|
(8.6
|
)%
|
(11.2
|
)%
|
||
The other factor that contributes to revenue, in addition to the number of units in service, is the monthly charge per unit. As previously discussed, the monthly charge per unit is dependent on the subscriber’s service, extent of geographic coverage, whether the subscriber leases or owns the messaging device, and the number of units the customer has in the account. The ratio of revenue for a period to the average units in service, for the same period, commonly referred to as average revenue per unit ("ARPU"), is a key revenue measurement as it indicates whether charges for similar services and distribution channels are increasing or decreasing. ARPU by distribution channel and messaging service are monitored regularly.
The following table sets forth ARPU by distribution channel for the periods stated:
|
|
ARPU For the Year Ended December 31,
|
||||||||||
|
Distribution Channel
|
2013
|
2012
|
2011
|
||||||||
|
Direct
|
$
|
8.34
|
|
$
|
8.53
|
|
$
|
8.82
|
|
||
|
Indirect
|
5.87
|
|
6.00
|
|
6.25
|
|
|||||
|
Consolidated
|
8.20
|
|
8.37
|
|
8.64
|
|
|||||
While ARPU for similar services and distribution channels is indicative of changes in monthly charges and the revenue rate applicable to new subscribers, this measurement on a consolidated basis is affected by several factors, including the mix of units in service and the pricing of the various components of our services. We expect future sequential annual revenues to decline in line with recent trends. The change in ARPU in the direct distribution channel is the most significant indicator of rate-related changes in our revenue. The decrease in consolidated ARPU during the years 2011 through 2013 was due to the change in composition of our customer base as the percentage of units in service attributable to larger customers continues to increase. These larger customers benefit from lower pricing associated with their larger number of units-in-service. We believe that without further price adjustments, ARPU would trend lower for both the direct and indirect distribution channels in 2014 and that price increases could mitigate, but not completely offset, the expected declines in both ARPU and revenue.
The following table sets forth information on direct ARPU by account size for the periods stated:
|
|
For the Year Ended December 31,
|
||||||||||
|
Account Size
|
2013
|
2012
|
2011
|
||||||||
|
1 to 3 Units
|
$
|
15.04
|
|
$
|
15.31
|
|
$
|
15.48
|
|
||
|
4 to 10 Units
|
14.15
|
|
14.28
|
|
14.46
|
|
|||||
|
11 to 50 Units
|
11.92
|
|
11.99
|
|
12.14
|
|
|||||
|
51 to 100 Units
|
10.40
|
|
10.41
|
|
10.72
|
|
|||||
|
101 to 1000 Units
|
8.75
|
|
9.00
|
|
9.03
|
|
|||||
|
> 1000 Units
|
7.25
|
|
7.25
|
|
7.43
|
|
|||||
|
Total direct ARPU
|
$
|
8.34
|
|
$
|
8.53
|
|
$
|
8.82
|
|
||
Software Operations
Our primary business in the software operations is the sale of software, professional services (primarily installation and training), equipment (to be used in conjunction with the software), and maintenance support (post-contract support). The software is licensed to end-users under an industry standard software license agreement.
23
Revenue from software operations is included in software revenue and other in the consolidated statements of income. For purposes of MD&A, we break out revenue from software operations into two primary components: operations revenue and maintenance revenue.
Operations revenue in software operations consists of software license revenue, professional services revenue, and equipment sales. In most instances, we recognize equipment revenue when it is delivered to the customer, and software license revenue and professional services revenue when the application is ready for use at the customer location and all service obligations are satisfied under such arrangements.
Maintenance revenue in software operations is for ongoing support of a software application or equipment and is recognized ratably over the period of coverage, typically one year. The maintenance renewal rates for the years ended December 31, 2013, 2012 and 2011 were 99.1%, 99.0% and 99.4%, respectively.
The breakout of revenue by component from software operations was as follows for the periods stated:
|
|
For the Year Ended
December 31, |
||||||||||
|
Revenue
|
2013
|
2012
|
2011
(1)
|
||||||||
|
|
(Dollars in thousands)
|
||||||||||
|
Operations revenue
|
$
|
32,446
|
|
$
|
25,360
|
|
$
|
20,219
|
|
||
|
Maintenance revenue
|
27,858
|
|
25,931
|
|
13,773
|
|
|||||
|
Total revenue
|
$
|
60,304
|
|
$
|
51,291
|
|
$
|
33,992
|
|
||
|
(1)
|
Revenue reflects results from March 3, 2011 (the acquisition date) to December 31, 2011 and is net of maintenance revenue reductions of $6.1 million required by purchase accounting to reflect fair value
.
|
On a regular basis, our software operations engage in contractual arrangements with our customers to provide software licenses, professional services, and equipment sales. In addition, we enter into contractual arrangements for maintenance with our customers on new solutions or renewals on existing solutions. These contractual arrangements are reported as bookings and represent future revenue. Bookings increased by 3.5% for the year ended December 31, 2013 compared to 2012. The increase reflects the continuing success of our expanding software sales force, in both the Americas and International theaters, in closing business and expanding market penetration with new customers, as well as selling additional solutions to our installed customer base.
The following table summarizes total bookings for the periods stated:
|
|
For the Year Ended
December 31, |
||||||||||
|
Bookings
|
2013
|
2012
|
2011
(1)
|
||||||||
|
|
(Dollars in thousands)
|
||||||||||
|
Operations and new maintenance orders
|
$
|
35,130
|
|
$
|
33,191
|
|
$
|
26,213
|
|
||
|
Maintenance and subscription revenue
|
28,322
|
|
28,110
|
|
21,673
|
|
|||||
|
Total bookings
|
$
|
63,452
|
|
$
|
61,301
|
|
$
|
47,886
|
|
||
|
(1)
|
Bookings reflects results from March 3, 2011 (the acquisition date) to December 31, 2011.
|
24
Software operations reported a backlog of $40.2 million for the year ended December 31, 2013, which represented all purchase orders received from customers not yet recognized as revenue. The following table reconciles the Company’s reported backlog at December 31, 2013:
|
Backlog
|
December 31, 2013
|
||
|
|
(Dollars in thousands)
|
||
|
Beginning balance at January 1, 2013
|
$
|
40,626
|
|
|
Operations bookings for the year
|
35,130
|
|
|
|
Maintenance renewals for the year
|
28,322
|
|
|
|
Available backlog
|
$
|
104,078
|
|
|
Operations revenue for the year
|
(32,446
|
)
|
|
|
Maintenance revenue for the year
|
(27,858
|
)
|
|
|
Other
(1)
|
(3,563
|
)
|
|
|
Total backlog at December 31, 2013
|
$
|
40,211
|
|
|
Decrease in backlog from January 1, 2013
|
1.0
|
%
|
|
|
(1)
|
Other reflects cancellations and adjustments to backlog.
|
Operations — Consolidated
Our operating expenses are presented in functional categories. Certain of our functional categories are especially important to overall expense control and management; these operating expenses are categorized as follows:
|
•
|
Cost of revenue
. These are expenses primarily for systems and pagers costs for the wireless operations and hardware, third-party software, payroll and related expenses for our professional services, customer support and maintenance staff, and various other expenses associated with the software operations for professional services and post contract support.
|
|
•
|
Service, rental, and maintenance
. These are expenses associated with the operation of our networks and the provision of messaging services. Expenses consist largely of site rent expenses for transmitter locations, telecommunication expenses to deliver messages over our networks, and payroll and related expenses for our engineering and pager repair functions. Expenses related to the development and maintenance of our software products are included in this category.
|
|
•
|
Selling and marketing
. These are expenses associated with our direct sales force and indirect sales channel and marketing expenses in support of those sales groups. This classification consists primarily of payroll and related expenses and commission expenses.
|
|
•
|
General and administrative
. These are expenses associated with customer service for wireless operations, inventory management, billing, collections, bad debt, and other administrative functions. This classification consists primarily of payroll and related expenses, outside service expenses, taxes, licenses and permit expenses, and facility rent expenses.
|
We review the percentages of these operating expenses to revenue on a regular basis. Even though the operating expenses are classified as described above, expense control and management are also performed by expense category. Approximately 70% of the operating expenses referred to above were incurred in payroll and related expenses, site and facility rent expenses and telecommunication expenses for each of the years ended December 31, 2013, 2012 and 2011. Payroll and related expenses for the year ended December 31, 2012 for software operations included a benefit of $0.3 million for forfeitures under the 2012 STIP associated with the departure of two former executives.
Payroll and related expenses include wages, incentives, employee benefits and related taxes. On a monthly basis, we review the number of employees in major functional categories such as professional services, product development, direct sales, engineering and technical staff, customer service and inventory. We also review the design and physical locations of functional groups to continuously improve efficiency, to simplify organizational structures, and to minimize the number of physical locations for the wireless operations.
We have reduced our wireless employee base by approximately 9.8% to 341 full-time equivalent employees (“FTEs”) at December 31, 2013 from 378 FTEs at December 31, 2012. We anticipate continued staffing reductions in 2014 for wireless operations, consistent with the declining subscriber and revenue trends, and we have accrued post-employment benefits for these anticipated staffing reductions. For our software operations, we expect staffing increases in 2014 to support our revenue growth. The software operations had 290 FTEs at December 31, 2013, an increase of 1.0% from 287 FTEs at December 31, 2012.
25
Site rent expenses for transmitter locations are largely dependent on our paging networks. We operate local, regional, and nationwide one-way and two-way paging networks. These networks each require locations on which to place transmitters, receivers, and antennae. Site rent expenses for transmitter locations are highly dependent on the number of transmitters, which in turn is dependent on the number of networks. In addition, these expenses generally do not vary directly with the number of subscribers or units in service, which is detrimental to our operating margins as revenue declines. In order to reduce these expenses, we have an active program to consolidate the number of networks, and thus transmitter locations, which we refer to as network rationalization. We have reduced the number of active transmitters by 4.4% to 4,538 active transmitters at December 31, 2013 from 4,749 active transmitters at December 31, 2012.
Telecommunication expenses are incurred to interconnect our paging networks and to provide telephone numbers for customer use, points of contact for customer service, and connectivity among our offices. These expenses for wireless operations are dependent on the number of units in service and the number of office and network locations that we maintain. The dependence on units in service is related to the number of telephone numbers provided to customers and the number of telephone calls made to our call centers, though this is not always a direct dependency. For example, the number or duration of telephone calls to call centers may vary from period to period based on factors other than the number of units in service, which could cause telecommunication expenses to vary regardless of the number of units in service. In addition, certain phone numbers we provide to our customers may have a usage component based on the number and duration of calls to the subscriber’s messaging device. Telecommunication expenses do not necessarily vary in direct relationship to units in service. Therefore, based on the factors discussed above, efforts are underway to review and reduce telephone circuit inventories for wireless operations. Telecommunication expenses are also incurred for our offices and call centers for software operations.
Comparison of the Statements of Income for the Years Ended December 31, 2013 and 2012
|
|
For the Year Ended December 31,
|
|
|
|||||||||||||||||||||||||||
|
|
2013
|
2012
|
Change Between
2013 and 2012 |
|||||||||||||||||||||||||||
|
|
Wireless
|
Software
|
Total
|
Wireless
|
Software
|
Total
|
Total
|
%
|
||||||||||||||||||||||
|
|
(Dollars in thousands)
|
|||||||||||||||||||||||||||||
|
Revenues:
|
||||||||||||||||||||||||||||||
|
Service, rental and maintenance, net
|
$
|
143,628
|
|
$
|
—
|
|
$
|
143,628
|
|
$
|
161,890
|
|
$
|
—
|
|
$
|
161,890
|
|
$
|
(18,262
|
)
|
(11.3
|
)%
|
|||||||
|
Software revenue and other, net
|
5,820
|
|
60,304
|
|
66,124
|
|
6,515
|
|
51,291
|
|
57,806
|
|
8,318
|
|
14.4
|
%
|
||||||||||||||
|
Total
|
$
|
149,448
|
|
$
|
60,304
|
|
$
|
209,752
|
|
$
|
168,405
|
|
$
|
51,291
|
|
$
|
219,696
|
|
$
|
(9,944
|
)
|
(4.5
|
)%
|
|||||||
|
Selected operating expenses:
|
||||||||||||||||||||||||||||||
|
Cost of revenue
|
$
|
493
|
|
$
|
21,633
|
|
$
|
22,126
|
|
$
|
693
|
|
$
|
20,153
|
|
$
|
20,846
|
|
$
|
1,280
|
|
6.1
|
%
|
|||||||
|
Service, rental and maintenance
|
41,470
|
|
9,169
|
|
50,639
|
|
45,789
|
|
9,636
|
|
55,425
|
|
(4,786
|
)
|
(8.6
|
)%
|
||||||||||||||
|
Selling and marketing
|
9,572
|
|
16,512
|
|
26,084
|
|
11,521
|
|
12,124
|
|
23,645
|
|
2,439
|
|
10.3
|
%
|
||||||||||||||
|
General and administrative
|
42,281
|
|
6,978
|
|
49,259
|
|
44,689
|
|
5,991
|
|
50,680
|
|
(1,421
|
)
|
(2.8
|
)%
|
||||||||||||||
|
Severance and restructuring
|
969
|
|
14
|
|
983
|
|
1,197
|
|
561
|
|
1,758
|
|
(775
|
)
|
(44.1
|
)%
|
||||||||||||||
|
Total
|
$
|
94,785
|
|
$
|
54,306
|
|
$
|
149,091
|
|
$
|
103,889
|
|
$
|
48,465
|
|
$
|
152,354
|
|
$
|
(3,263
|
)
|
(2.1
|
)%
|
|||||||
|
FTEs
|
341
|
|
290
|
|
631
|
|
378
|
|
287
|
|
665
|
|
(34
|
)
|
(5.1
|
)%
|
||||||||||||||
|
Active transmitters
|
4,538
|
|
—
|
|
4,538
|
|
4,749
|
|
—
|
|
4,749
|
|
(211
|
)
|
(4.4
|
)%
|
||||||||||||||
Revenue — Wireless
Our total revenue was $149.4 million and $168.4 million for the years ended December 31, 2013 and 2012, respectively. The decrease in total revenue reflected the decrease in demand for our wireless services. Service, rental and maintenance revenue, net of $143.6 million and $161.9 million for the years ended December 31, 2013 and 2012, respectively, consist primarily of recurring fees associated with the provision of messaging services and rental of leased units and is net of a provision for service credits. Included in software revenue and other, net was $5.8 million and $6.5 million for the years ended December 31, 2013 and 2012, respectively, of revenue associated with system sales, the sale of devices and charges for leased devices that are not returned and are net of anticipated credits. The table below details total service, rental and maintenance revenue, net for the periods stated:
26
|
|
For the Year Ended
December 31, |
||||||
|
|
2013
|
2012
|
|||||
|
|
(Dollars in thousands)
|
||||||
|
Service, rental and maintenance revenue, net:
|
|||||||
|
Paging:
|
|||||||
|
Direct:
|
|||||||
|
One-way messaging
|
$
|
119,467
|
|
$
|
131,729
|
|
|
|
Two-way messaging
|
17,365
|
|
20,546
|
|
|||
|
$
|
136,832
|
|
$
|
152,275
|
|
||
|
Indirect:
|
|||||||
|
One-way messaging
|
$
|
3,747
|
|
$
|
5,042
|
|
|
|
Two-way messaging
|
1,692
|
|
2,422
|
|
|||
|
$
|
5,439
|
|
$
|
7,464
|
|
||
|
Total paging:
|
|||||||
|
One-way messaging
|
$
|
123,214
|
|
$
|
136,771
|
|
|
|
Two-way messaging
|
19,057
|
|
22,968
|
|
|||
|
Total paging revenue
|
142,271
|
|
159,739
|
|
|||
|
Non-paging revenue
|
1,357
|
|
2,151
|
|
|||
|
Total service, rental and maintenance revenue, net
|
$
|
143,628
|
|
$
|
161,890
|
|
|
The table below sets forth units in service and service revenue, the changes in each between 2013 and 2012 and the changes in revenue associated with differences in ARPU and the number of units in service:
|
|
Units in Service
|
Revenues
|
|
|||||||||||||||||||||||||
|
|
As of December 31,
|
For the Year Ended December 31,
|
Change Due To:
|
|||||||||||||||||||||||||
|
|
2013
|
2012
|
Change
|
2013
(1)
|
2012
(1)
|
Change
|
ARPU
|
Units
|
||||||||||||||||||||
|
|
(Units in thousands)
|
(Dollars in thousands)
|
||||||||||||||||||||||||||
|
One-way messaging
|
1,280
|
|
1,394
|
|
(114
|
)
|
$
|
123,214
|
|
$
|
136,771
|
|
$
|
(13,557
|
)
|
$
|
(1,875
|
)
|
$
|
(11,682
|
)
|
|||||||
|
Two-way messaging
|
96
|
|
121
|
|
(25
|
)
|
19,057
|
|
22,968
|
|
(3,911
|
)
|
(170
|
)
|
(3,741
|
)
|
||||||||||||
|
Total
|
1,376
|
|
1,515
|
|
(139
|
)
|
$
|
142,271
|
|
$
|
159,739
|
|
$
|
(17,468
|
)
|
$
|
(2,045
|
)
|
$
|
(15,423
|
)
|
|||||||
|
(1)
|
Amounts shown exclude non-paging and product and related sales.
|
As previously discussed, demand for messaging services has declined over the past several years and we anticipate that it will continue to decline for the foreseeable future, which would result in reductions in service, rental and maintenance revenue, net due to the lower number of subscribers and related units in service.
Revenue — Software
Revenue for software operations was $60.3 million and $51.3 million for the years ended December 31, 2013 and 2012, respectively, which consisted of operations revenue from licenses revenue, professional services revenue, equipment sales, and maintenance revenue. The table below details total revenue for software operations for the periods stated:
|
|
For the Year Ended
December 31, |
||||||
|
|
2013
|
2012
|
|||||
|
|
(Dollars in thousands)
|
||||||
|
Operations revenue
|
$
|
32,446
|
|
$
|
25,360
|
|
|
|
Maintenance revenue
|
27,858
|
|
25,931
|
|
|||
|
Total revenue
|
$
|
60,304
|
|
$
|
51,291
|
|
|
27
The increase in operations revenue of 27.9% over 2012 is a result of the additional investment in the sales team. We recorded record bookings in 2013 which resulted in higher revenue for the year. Maintenance revenue increased 7.4% over 2012, which reflects the increase in new maintenance orders and price increases to the existing customer base.
Operating Expenses — Consolidated
Cost of revenue.
Cost of revenue consisted primarily of the following items:
|
|
For the Year Ended December 31,
|
|
|
|||||||||||||||||||||||||||
|
|
2013
|
2012
|
Change Between
2013 and 2012 |
|||||||||||||||||||||||||||
|
|
Wireless
|
Software
|
Total
|
Wireless
|
Software
|
Total
|
Total
|
%
|
||||||||||||||||||||||
|
|
(Dollars in thousands)
|
|||||||||||||||||||||||||||||
|
Payroll and related
|
$
|
—
|
|
$
|
11,527
|
|
$
|
11,527
|
|
$
|
—
|
|
$
|
9,753
|
|
$
|
9,753
|
|
$
|
1,774
|
|
18.2
|
%
|
|||||||
|
Cost of sales
|
493
|
|
8,248
|
|
8,741
|
|
693
|
|
8,473
|
|
9,166
|
|
(425
|
)
|
(4.6
|
)%
|
||||||||||||||
|
Other
|
—
|
|
1,858
|
|
1,858
|
|
—
|
|
1,927
|
|
1,927
|
|
(69
|
)
|
(3.6
|
)%
|
||||||||||||||
|
Total cost of revenue
|
$
|
493
|
|
$
|
21,633
|
|
$
|
22,126
|
|
$
|
693
|
|
$
|
20,153
|
|
$
|
20,846
|
|
$
|
1,280
|
|
6.1
|
%
|
|||||||
|
FTEs
|
—
|
|
128
|
|
128
|
|
—
|
|
119
|
|
119
|
|
9
|
|
7.6
|
%
|
||||||||||||||
As illustrated in the table above, cost of revenue for the year ended December 31, 2013 increased $1.3 million or 6.1% from the same period in 2012 due to the following variances:
|
•
|
Payroll and related —
The increase of $1.8 million in payroll and related expenses was due to higher professional services and maintenance support costs associated with the software operations. Total FTEs who provided professional services and post contract support as of December 31, 2013 and 2012 were 128 and 119 FTEs, respectively.
|
|
•
|
Cost of sales —
The decrease of $0.4 million in cost of sales was primarily due to the reduction in wireless operations’ costs of $0.2 million related to a credit issued for a previously reported cost of a systems sale and due to a reduction in software operations’ costs of $0.2 million resulting from the lower cost of third party products.
|
|
•
|
Other —
The decrease of $0.1 million in other expenses was primarily due to lower miscellaneous expenses in the software operations.
|
Service, Rental and Maintenance.
Service, rental and maintenance expenses consisted primarily of the following items:
|
|
For the Year Ended December 31,
|
Change Between
2013 and 2012 |
||||||||||||||||||||||||||||
|
|
2013
|
2012
|
||||||||||||||||||||||||||||
|
|
Wireless
|
Software
|
Total
|
Wireless
|
Software
|
Total
|
Total
|
%
|
||||||||||||||||||||||
|
|
(Dollars in thousands)
|
|||||||||||||||||||||||||||||
|
Site rent
|
$
|
16,586
|
|
$
|
—
|
|
$
|
16,586
|
|
$
|
17,864
|
|
$
|
—
|
|
$
|
17,864
|
|
$
|
(1,278
|
)
|
(7.2
|
)%
|
|||||||
|
Telecommunications
|
7,357
|
|
—
|
|
7,357
|
|
8,968
|
|
—
|
|
8,968
|
|
(1,611
|
)
|
(18.0
|
)%
|
||||||||||||||
|
Payroll and related
|
13,353
|
|
6,720
|
|
20,073
|
|
14,488
|
|
7,142
|
|
21,630
|
|
(1,557
|
)
|
(7.2
|
)%
|
||||||||||||||
|
Stock based compensation
|
54
|
|
—
|
|
54
|
|
25
|
|
—
|
|
25
|
|
29
|
|
116.0
|
%
|
||||||||||||||
|
Other
|
4,120
|
|
2,449
|
|
6,569
|
|
4,444
|
|
2,494
|
|
6,938
|
|
(369
|
)
|
(5.3
|
)%
|
||||||||||||||
|
Total service, rental and maintenance
|
$
|
41,470
|
|
$
|
9,169
|
|
$
|
50,639
|
|
$
|
45,789
|
|
$
|
9,636
|
|
$
|
55,425
|
|
$
|
(4,786
|
)
|
(8.6
|
)%
|
|||||||
|
FTEs
|
134
|
|
57
|
|
191
|
|
150
|
|
65
|
|
215
|
|
(24
|
)
|
(11.2
|
)%
|
||||||||||||||
As illustrated in the table above, service, rental and maintenance expenses for the year ended December 31, 2013 decreased $4.8 million or 8.6% from the same period in 2012 due to the following variances:
|
•
|
Site rent —
The decrease of $1.3 million in site rent expenses was primarily due to the rationalization of our networks, which has decreased the number of transmitters required to provide service to our customers. The reduction in transmitters has, in turn, reduced the number of lease locations required for the wireless operations. Active transmitters declined 4.4% in 2013 from the same period in 2012.
|
|
•
|
Telecommunications —
The decrease of $1.6 million in telecommunication expenses was due to the consolidation of our networks. We believe continued reductions in these expenses will occur as our networks continue to be consolidated as anticipated throughout 2014 for our wireless operations.
|
28
|
•
|
Payroll and related —
Payroll and related expenses for wireless operations were incurred largely for field technicians, their managers, and in-house repair personnel, and payroll and related expenses for software operations were incurred for product development, product strategy and quality assurance personnel. The decrease in payroll and related expenses of $1.6 million was due to reductions of $1.2 million and $0.4 million in payroll and related expenses for wireless and software operations, respectively. Wireless operations FTEs decreased by 16 FTEs to 134 FTEs at December 31, 2013 from 150 FTEs at December 31, 2012. Software operations FTEs decreased by 8 FTEs to 57 FTEs at December 31, 2013 from 65 FTEs at December 31, 2012.
|
|
•
|
Other —
The decrease of $0.4 million in other expenses was due primarily to lower employee and personnel training expenses of $0.1 million for the software operations, and lower outside services expenses of $0.1 million and repairs and maintenance expenses of $0.2 million for the wireless operations.
|
Selling and Marketing
. Selling and marketing expenses consisted of the following items:
|
|
For the Year Ended December 31,
|
Change Between
2013 and 2012 |
|||||||||||||||||||||||||||||
|
|
2013
|
2012
|
|||||||||||||||||||||||||||||
|
|
Wireless
|
Software
|
Total
|
Wireless
|
Software
|
Total
|
Total
|
%
|
|||||||||||||||||||||||
|
|
(Dollars in thousands)
|
||||||||||||||||||||||||||||||
|
Payroll and related
|
$
|
5,965
|
|
$
|
8,501
|
|
$
|
14,466
|
|
$
|
7,422
|
|
$
|
6,704
|
|
$
|
14,126
|
|
$
|
340
|
|
2.4
|
%
|
||||||||
|
Commissions
|
2,514
|
|
3,864
|
|
6,378
|
|
3,037
|
|
2,092
|
|
5,129
|
|
1,249
|
|
24.4
|
%
|
|||||||||||||||
|
Stock based compensation
|
70
|
|
—
|
|
70
|
|
72
|
|
—
|
|
72
|
|
(2
|
)
|
(2.8
|
)%
|
|||||||||||||||
|
Other
|
1,023
|
|
4,147
|
|
5,170
|
|
990
|
|
3,328
|
|
4,318
|
|
852
|
|
19.7
|
%
|
|||||||||||||||
|
Total selling and marketing
|
$
|
9,572
|
|
$
|
16,512
|
|
$
|
26,084
|
|
$
|
11,521
|
|
$
|
12,124
|
|
$
|
23,645
|
|
$
|
2,439
|
|
10.3
|
%
|
||||||||
|
FTEs
|
65
|
|
80
|
|
145
|
|
79
|
|
68
|
|
147
|
|
(2
|
)
|
(1.4
|
)%
|
|||||||||||||||
As indicated in the table above, selling and marketing expenses for the year ended December 31, 2013 increased by $2.4 million, or 10.3%, from the same period in 2012. Selling and marketing expenses consisted primarily of payroll and related expenses, which increased $0.3 million for the year ended December 31, 2013 compared to the same period in 2012 due to the increase of payroll and related expenses of $1.8 million for the software operations, partially offset by a reduction of $1.5 million in payroll and related expenses for the wireless operations due to headcount reductions of 14 FTEs to 65 FTEs at December 31, 2013 from 79 FTEs at December 31, 2012. Software operations FTEs increased by 12 FTEs to 80 FTEs at December 31, 2013 from 68 FTEs at December 31, 2012. The change of 12 FTEs reflects additional sales staff of 14, partially offset by lower marketing staff of 2. The increase in software operations sales staff was focused on increasing software bookings.
The sales and marketing staff are all involved in selling our paging and software products and services domestically and internationally, as well as reselling other wireless products and services such as cellular phones and email devices under authorized agent agreements. These expenses support our efforts to maintain gross placements of units in service, which mitigated the impact of disconnects on our revenue base for wireless operations, and to identify business opportunities for additional or future software sales. We have a centralized marketing function which is focused on supporting our software products and vertical sales efforts by strengthening our brand, generating sales leads and facilitating the sales process. These marketing functions are accomplished through targeted email campaigns, webinars, regional and national user conferences, monthly newsletters and participation at industry trade shows. We sell our software products through a direct and channel sales force that consists of a dedicated team of managers. We have increased the number of software sales and marketing staff with the intention of increasing our potential sales opportunities. We have reduced the overall cost of our selling and marketing activities in the wireless operations by focusing on the most productive sales and marketing employees.
Commission expenses increased by $1.2 million for the year ended December 31, 2013 compared to the same period in 2012 due primarily to an increase in commission expenses for software operations of $1.7 million, partially offset by a reduction of commission expenses for wireless operations of $0.5 million in line with the revenue and subscriber erosion. The increase in software operations commission expense reflects the increase in both operations and maintenance revenue in the software operations.
Other expenses increased by $0.9 million for the year ended December 31, 2013 compared to the same period in 2012 due primarily to increases in travel and entertainment expenses of $0.1 million, advertising expenses of $0.2 million, outside services expenses of $0.2 million, telephone expenses of $0.1 million and other miscellaneous expenses, net of $0.3 million for the software operations.
29
General and Administrative.
General and administrative expenses consisted of the following items:
|
|
For the Year Ended December 31,
|
Change Between
2013 and 2012 |
||||||||||||||||||||||||||||
|
|
2013
|
2012
|
||||||||||||||||||||||||||||
|
|
Wireless
|
Software
|
Total
|
Wireless
|
Software
|
Total
|
Total
|
%
|
||||||||||||||||||||||
|
|
(Dollars in thousands)
|
|||||||||||||||||||||||||||||
|
Payroll and related
|
$
|
18,073
|
|
$
|
4,201
|
|
$
|
22,274
|
|
$
|
20,211
|
|
$
|
4,525
|
|
$
|
24,736
|
|
$
|
(2,462
|
)
|
(10.0
|
)%
|
|||||||
|
Stock based compensation
|
2,144
|
|
777
|
|
2,921
|
|
1,010
|
|
117
|
|
1,127
|
|
1,794
|
|
159.2
|
%
|
||||||||||||||
|
Bad debt
|
749
|
|
327
|
|
1,076
|
|
636
|
|
442
|
|
1,078
|
|
(2
|
)
|
(0.2
|
)%
|
||||||||||||||
|
Facility rent
|
1,821
|
|
1,464
|
|
3,285
|
|
2,062
|
|
1,404
|
|
3,466
|
|
(181
|
)
|
(5.2
|
)%
|
||||||||||||||
|
Telecommunications
|
1,158
|
|
368
|
|
1,526
|
|
1,273
|
|
351
|
|
1,624
|
|
(98
|
)
|
(6.0
|
)%
|
||||||||||||||
|
Outside services
|
8,782
|
|
1,100
|
|
9,882
|
|
9,069
|
|
566
|
|
9,635
|
|
247
|
|
2.6
|
%
|
||||||||||||||
|
Taxes, licenses and permits
|
4,677
|
|
186
|
|
4,863
|
|
5,341
|
|
147
|
|
5,488
|
|
(625
|
)
|
(11.4
|
)%
|
||||||||||||||
|
Other
|
4,877
|
|
(1,445
|
)
|
3,432
|
|
5,087
|
|
(1,561
|
)
|
3,526
|
|
(94
|
)
|
(2.7
|
)%
|
||||||||||||||
|
Total general and administrative
|
$
|
42,281
|
|
$
|
6,978
|
|
$
|
49,259
|
|
$
|
44,689
|
|
$
|
5,991
|
|
$
|
50,680
|
|
$
|
(1,421
|
)
|
(2.8
|
)%
|
|||||||
|
FTEs
|
142
|
|
25
|
|
167
|
|
150
|
|
36
|
|
186
|
|
(19
|
)
|
(10.2
|
)%
|
||||||||||||||
As illustrated in the table above, general and administrative expenses for the year ended December 31, 2013 decreased $1.4 million, or 2.8%, from the same period in 2012 due to the following variances:
|
•
|
Payroll and related —
Payroll and related expenses were incurred mainly for employees in customer service, information technology, inventory, finance and other support functions as well as executive management. Payroll and related expenses decreased by $2.5 million due primarily to lower payroll and related expenses of $2.2 million for the wireless operations reflecting headcount reductions of 8 FTEs to 142 FTEs at December 31, 2013 from 150 FTEs at December 31, 2012, and lower payroll and related expenses of $0.3 million for software operations reflecting headcount reductions of 11 FTEs to 25 FTEs at December 31, 2013 from 36 FTEs at December 31, 2012. The decrease of $2.2 million in payroll and related expenses for the wireless operations was primarily due to less senior level positions in 2013 than 2012 and due to lower payroll and related expense associated with the 2013 Short-Term Incentive Plan (“STIP”) in 2013.
|
|
•
|
Stock based compensation —
Stock based compensation expenses consisted primarily of amortization of compensation expense associated with RSUs awarded to certain eligible employees for both wireless and software operations and amortization of compensation expense for restricted stock awarded to non-executive members of our Board of Directors under the Equity Plans (see Note 6). Stock based compensation expenses increased by $1.8 million due to higher amortization of compensation expense of $1.1 million related to the 2011 LTIP for the wireless operations during the year ended December 31, 2013 compared to the same period in 2012 since the 2011 LTIP award was effective on January 1, 2013 while 2012 included amortization of compensation expense for the 2009 LTIP. Stock based compensation expenses increased by $0.7 million for the software operations for the year ended December 31, 2013 compared to the same period in 2012 primarily due to the benefit of stock based compensation in 2012 related to the forfeitures under the 2011 LTIP associated with the departure of former executives in the software operations and the benefit related to the modification of the 2011 LTIP in 2012.
|
|
•
|
Facility rent —
The decrease of $0.2 million in facility rent expenses was primarily due to lower facility rent expenses for our wireless operations related to the closure of office facilities, as we continue to rationalize our operating requirements to meet lower revenue and customer demand for the wireless operations.
|
|
•
|
Telecommunications —
The decrease of $0.1 million in telecommunication expenses reflected continued office and staffing reductions as we continue to streamline our operations and reduce our telecommunication requirements for the wireless operations.
|
|
•
|
Outside services —
Outside service expenses consisted primarily of costs associated with printing and mailing invoices, outsourced customer service and various professional fees. The increase of $0.2 million in outside services expenses was due primarily to higher professional services fees for external accounting services, partially offset by lower costs for outsourced customer service support.
|
|
•
|
Taxes, licenses and permits —
Taxes, licenses and permit expenses consist of property, franchise, gross receipts and transactional taxes. The decrease in taxes, licenses and permit expenses of $0.6 million was primarily due to lower universal service fund expenses of $0.6 million and lower transactional taxes of $0.2 million due to the resolution of various state and local tax audits at amounts lower than the originally estimated liabilities, partially offset by higher gross receipts taxes.
|
30
|
•
|
Other —
The decrease of $0.1 million in other expenses was due to decreases in office expenses of $0.3 million, recruiting and relocation expenses of $0.3 million, repairs and maintenance expenses of $0.1 million and insurance expenses of $0.1 million; partially offset by higher travel and entertainment expenses of $0.2 million, financial services expenses of $0.2 million, and miscellaneous expenses of $0.3 million.
|
Severance and Restructuring.
Severance and restructuring expenses decreased to $1.0 million for the year ended December 31, 2013 compared to $1.8 million for the same period in 2012 due primarily to lower severance charges recorded during the year ended December 31, 2013 for post-employment benefits resulting from planned staffing reductions for both operations. We accrued post-employment benefits if certain specified criteria are met. Post-employment benefits include salary continuation, severance benefits and continuation of health insurance benefits. (See Note 1 for further discussion on our severance and restructuring policies.)
Depreciation, Amortization and Accretion.
Depreciation, amortization and accretion expenses were $15.2 million for the year ended December 31, 2013 compared to $18.2 million for the same period in 2012. There was $1.0 million less depreciation expense for the period from fully depreciated paging infrastructure and other assets, $0.4 million less depreciation expense on paging devices resulting from fewer purchases of paging devices and from fully depreciated paging devices, $1.4 million less amortization expense and $0.2 million less accretion expense. Depreciation, amortization and accretion expenses for software operations represented $5.6 million of the total $15.2 million in depreciation, amortization and accretion expenses for the year ended December 31, 2013 and $7.1 million of the total $18.2 million in depreciation, amortization and accretion expenses for the year ended December 31, 2012. (See Note 1 for further discussion on our depreciation expense policies.)
Impairments.
We evaluate long-lived assets, amortizable intangible assets and goodwill for impairment at least annually, or when events or circumstances suggest a potential impairment has occurred. We have selected the fourth quarter to perform this annual impairment test. We did not record any impairment of long-lived assets, intangible assets subject to amortization, and goodwill for the year ended December 31, 2013. We recorded an impairment charge of $3.4 million to the contract-based intangible assets for our software operations for the year ended December 31, 2012. We did not record any impairment of long-lived assets, other intangible assets and goodwill in 2012. (See Note 3 for further discussion on the impairment.)
Interest Expense, Net; Other Income, Net and Income Tax Expense
Interest Expense, Net.
Net interest expense decreased to $0.3 million for the year ended December 31, 2013 from $0.4 million for the same period in 2012. This decrease was primarily due to less interest on debt associated with the Amcom acquisition as the debt was completely repaid on April 6, 2012.
Other Income, Net
. Net other income decreased to $0.1 million for the year ended December 31, 2013 from $0.7 million for the same period in 2012. The decrease in net other income in 2013 was primarily due to a net loss of $21,000 on asset disposals compared to a net gain of $0.2 million on asset disposals in 2012 in our wireless operations and a higher consulting expense related to potential mergers and acquisitions of $0.1 million in 2013 and a software support services settlement of $0.3 million in 2013 in our software operations.
Income Tax Expense.
Income tax expense for the year ended December 31, 2013 was $17.8 million, a decrease of $1.3 million from $19.1 million income tax expense for the year ended December 31, 2012. The decrease in income tax expense and the effective tax rate reflects a decrease in income before tax of $0.7 million and a reduction in our effective tax rate of 2.1%. Our annual effective tax rate for the year ended December 31, 2013 decreased by 2.1%, from 41.4% to 39.3% primarily due to a change in the tax rate used to value our deferred tax assets (the deferred income tax rate).
31
The following is the effective tax rate reconciliation for the years ended December 31, 2013 and 2012, respectively. (See Note 7 for further discussion on our income taxes.)
|
|
For the Year Ended December 31,
|
||||||||||||
|
|
2013
|
2012
|
|||||||||||
|
|
(Dollars in thousands)
|
||||||||||||
|
Income before income tax expense
|
$
|
45,339
|
|
$
|
46,063
|
|
|||||||
|
Income tax expense at the Federal statutory rate
|
$
|
15,869
|
|
35.0
|
%
|
$
|
16,122
|
|
35.0
|
%
|
|||
|
State income taxes, net of Federal benefit
|
1,709
|
|
3.8
|
%
|
1,555
|
|
3.4
|
%
|
|||||
|
State law changes
|
—
|
|
—
|
%
|
117
|
|
0.3
|
%
|
|||||
|
Nondeductible compensation expense
|
841
|
|
1.8
|
%
|
—
|
|
—
|
%
|
|||||
|
Change in deferred income tax rates
|
(1,194
|
)
|
(2.6
|
)%
|
—
|
|
—
|
%
|
|||||
|
Change in valuation allowance
|
554
|
|
1.2
|
%
|
658
|
|
1.4
|
%
|
|||||
|
Interest on income tax refunds
|
—
|
|
—
|
%
|
(47
|
)
|
(0.1
|
)%
|
|||||
|
Other
|
30
|
|
0.1
|
%
|
674
|
|
1.4
|
%
|
|||||
|
Income tax expense
|
$
|
17,809
|
|
39.3
|
%
|
$
|
19,079
|
|
41.4
|
%
|
|||
Our annual effective tax rate is comparable to prior periods once the effects of the change in the valuation allowance and the change in the deferred income tax rate are excluded from the computation as indicated in the following table:
|
|
For the Year Ended December 31,
|
||||
|
|
2013
|
2012
|
|||
|
Effective tax rate
|
39.3
|
%
|
41.4
|
%
|
|
|
Change in valuation allowance
|
(1.2
|
%)
|
(1.4
|
%)
|
|
|
Change in deferred income tax rate
|
2.6
|
%
|
—
|
%
|
|
|
Adjusted effective tax rate
|
40.7
|
%
|
40.0
|
%
|
|
Statements of Income
Comparison of the Statements of Income for the Years Ended December 31, 2012 and 2011
|
|
For the Year Ended December 31,
|
|
||||||||||||||||||||||||||||
|
|
2012
|
2011
|
Change Between
2012 and 2011 |
|||||||||||||||||||||||||||
|
|
Wireless
|
Software
|
Total
|
Wireless
|
Software
(1)
|
Total
|
Total
|
%
|
||||||||||||||||||||||
|
|
(Dollars in thousands)
|
|||||||||||||||||||||||||||||
|
Revenues:
|
||||||||||||||||||||||||||||||
|
Service, rental and maintenance, net
|
$
|
161,890
|
|
$
|
—
|
|
$
|
161,890
|
|
$
|
189,568
|
|
$
|
—
|
|
$
|
189,568
|
|
$
|
(27,678
|
)
|
(14.6
|
%)
|
|||||||
|
Software revenue and other, net
|
6,515
|
|
51,291
|
|
57,806
|
|
10,133
|
|
33,992
|
|
44,125
|
|
13,681
|
|
31.0
|
%
|
||||||||||||||
|
Total
|
$
|
168,405
|
|
$
|
51,291
|
|
$
|
219,696
|
|
$
|
199,701
|
|
$
|
33,992
|
|
$
|
233,693
|
|
$
|
(13,997
|
)
|
(6.0
|
%)
|
|||||||
|
Selected operating expenses:
|
||||||||||||||||||||||||||||||
|
Cost of revenue
|
$
|
693
|
|
$
|
20,153
|
|
$
|
20,846
|
|
$
|
2,883
|
|
$
|
17,523
|
|
$
|
20,406
|
|
$
|
440
|
|
2.2
|
%
|
|||||||
|
Service, rental and maintenance
|
45,789
|
|
9,636
|
|
55,425
|
|
55,675
|
|
6,672
|
|
62,347
|
|
(6,922
|
)
|
(11.1
|
%)
|
||||||||||||||
|
Selling and marketing
|
11,521
|
|
12,124
|
|
23,645
|
|
14,466
|
|
7,923
|
|
22,389
|
|
1,256
|
|
5.6
|
%
|
||||||||||||||
|
General and administrative
|
44,689
|
|
5,991
|
|
50,680
|
|
51,029
|
|
5,066
|
|
56,095
|
|
(5,415
|
)
|
(9.7
|
%)
|
||||||||||||||
|
Severance and restructuring
|
1,197
|
|
561
|
|
1,758
|
|
1,293
|
|
—
|
|
1,293
|
|
465
|
|
36.0
|
%
|
||||||||||||||
|
Total
|
$
|
103,889
|
|
$
|
48,465
|
|
$
|
152,354
|
|
$
|
125,346
|
|
$
|
37,184
|
|
$
|
162,530
|
|
$
|
(10,176
|
)
|
(6.3
|
%)
|
|||||||
|
FTEs
|
378
|
|
287
|
|
665
|
|
434
|
|
249
|
|
683
|
|
(18
|
)
|
(2.6
|
%)
|
||||||||||||||
|
Active transmitters
|
4,749
|
|
—
|
|
4,749
|
|
4,991
|
|
—
|
|
4,991
|
|
(242
|
)
|
(4.8
|
%)
|
||||||||||||||
32
|
(1)
|
Software operations reflect financial results from March 3, 2011 to December 31, 2011 and are net of maintenance revenue reductions of $6.1 million required by purchase accounting to reflect fair value.
|
Revenue — Wireless
Our total revenue was $168.4 million and $199.7 million for the years ended December 31, 2012 and 2011, respectively. Service, rental and maintenance revenue, net of $161.9 million and $189.6 million for the years ended December 31, 2012 and 2011, respectively, consist primarily of recurring fees associated with the provision of messaging services and rental of leased units and is net of a provision for service credits. Software revenue and other, net of $6.5 million and $10.1 million for the years ended December 31, 2012 and 2011, respectively, consist primarily of revenue associated with the sale of devices and charges for leased devices that are not returned and are net of anticipated credits. The decrease in revenue reflected the decrease in demand for our wireless services. The table below details total service, rental and maintenance revenue, net for the periods stated:
|
|
For the Year Ended
December 31, |
||||||
|
|
2012
|
2011
|
|||||
|
|
(Dollars in thousands)
|
||||||
|
Service, rental and maintenance revenue, net:
|
|||||||
|
Paging:
|
|||||||
|
Direct:
|
|||||||
|
One-way messaging
|
$
|
131,729
|
|
$
|
149,497
|
|
|
|
Two-way messaging
|
20,546
|
|
25,393
|
|
|||
|
$
|
152,275
|
|
$
|
174,890
|
|
||
|
Indirect:
|
|||||||
|
One-way messaging
|
$
|
5,042
|
|
$
|
6,451
|
|
|
|
Two-way messaging
|
2,422
|
|
2,975
|
|
|||
|
$
|
7,464
|
|
$
|
9,426
|
|
||
|
Total paging:
|
|||||||
|
One-way messaging
|
$
|
136,771
|
|
$
|
155,948
|
|
|
|
Two-way messaging
|
22,968
|
|
28,368
|
|
|||
|
Total paging revenue
|
159,739
|
|
184,316
|
|
|||
|
Non-paging revenue
|
2,151
|
|
5,252
|
|
|||
|
Total service, rental and maintenance revenue, net
|
$
|
161,890
|
|
$
|
189,568
|
|
|
The table below sets forth units in service and service revenue, the changes in each between 2012 and 2011 and the changes in revenue associated with differences in ARPU and the number of units in service.
|
|
Units in Service
|
Revenues
|
|
|
||||||||||||||||||||||||
|
|
As of December 31,
|
For the Year Ended December 31,
|
Change Due To:
|
|||||||||||||||||||||||||
|
|
2012
|
2011
|
Change
|
2012
(1)
|
2011
(1)
|
Change
|
ARPU
|
Units
|
||||||||||||||||||||
|
|
(Units in thousands)
|
(Dollars in thousands)
|
||||||||||||||||||||||||||
|
One-way messaging
|
1,394
|
|
1,528
|
|
(134
|
)
|
$
|
136,771
|
|
$
|
155,948
|
|
$
|
(19,177
|
)
|
$
|
(3,752
|
)
|
$
|
(15,425
|
)
|
|||||||
|
Two-way messaging
|
121
|
|
140
|
|
(19
|
)
|
22,968
|
|
28,368
|
|
(5,400
|
)
|
(580
|
)
|
(4,820
|
)
|
||||||||||||
|
Total
|
1,515
|
|
1,668
|
|
(153
|
)
|
$
|
159,739
|
|
$
|
184,316
|
|
$
|
(24,577
|
)
|
$
|
(4,332
|
)
|
$
|
(20,245
|
)
|
|||||||
|
(1)
|
Amounts shown exclude non-paging and product and related sales.
|
As previously discussed, demand for messaging services has declined over the past several years and we anticipate that it will continue to decline for the foreseeable future, which would result in reductions in service, rental and maintenance revenue, net due to the lower number of subscribers and related units in service.
Revenue — Software
Revenue for software operations was $51.3 million and $34.0 million for the years ended December 31, 2012 and 2011, respectively, which reflect license revenue, professional services revenue, equipment sales, and maintenance revenue. The table below details total revenue for software operations for the periods stated:
33
|
|
For the Year Ended
December 31, |
||||||
|
|
2012
|
2011
(1)
|
|||||
|
|
(Dollars in thousands)
|
||||||
|
Operations revenue
|
$
|
25,360
|
|
$
|
20,219
|
|
|
|
Maintenance revenue
|
25,931
|
|
13,773
|
|
|||
|
Total revenue
|
$
|
51,291
|
|
$
|
33,992
|
|
|
|
(1)
|
Total revenue reflects results from March 3, 2011 to December 31, 2011 and is net of a reduction of $6.1 million to maintenance revenue required by purchase accounting to reflect fair value.
|
Operating Expenses — Consolidated
General. Software operations results for the year ended December 31, 2011 reflect operations from March 3, 2011 to December 31, 2011.
Cost of revenue.
Cost of revenue consisted primarily of the following items:
|
|
For the Year Ended December 31,
|
|
|
|||||||||||||||||||||||||||
|
2012
|
2011
|
Change Between
2012 and 2011 |
||||||||||||||||||||||||||||
|
|
||||||||||||||||||||||||||||||
|
|
Wireless
|
Software
|
Total
|
Wireless
|
Software
|
Total
|
Total
|
%
|
||||||||||||||||||||||
|
|
(Dollars in thousands)
|
|||||||||||||||||||||||||||||
|
Payroll and related
|
$
|
—
|
|
$
|
9,753
|
|
$
|
9,753
|
|
$
|
—
|
|
$
|
7,647
|
|
$
|
7,647
|
|
$
|
2,106
|
|
27.5
|
%
|
|||||||
|
Cost of sales
|
693
|
|
8,473
|
|
9,166
|
|
2,883
|
|
8,289
|
|
11,172
|
|
(2,006
|
)
|
(18.0
|
)%
|
||||||||||||||
|
Other
|
—
|
|
1,927
|
|
1,927
|
|
—
|
|
1,587
|
|
1,587
|
|
340
|
|
21.4
|
%
|
||||||||||||||
|
Total cost of revenue
|
$
|
693
|
|
$
|
20,153
|
|
$
|
20,846
|
|
$
|
2,883
|
|
$
|
17,523
|
|
$
|
20,406
|
|
$
|
440
|
|
2.2
|
%
|
|||||||
|
FTEs
|
—
|
|
119
|
|
119
|
|
—
|
|
113
|
|
113
|
|
6
|
|
5.3
|
%
|
||||||||||||||
As illustrated in the table above, cost of revenue for the year ended December 31, 2012 increased $0.4 million from the same period in 2011 due to the following variances:
|
•
|
Payroll and related —
The increase of $2.1 million in payroll and related expenses was due to professional services and maintenance support costs associated with the software operations. Total FTEs who provided professional services and maintenance support as of December 31, 2012 and 2011 were 119 and 113 FTEs, respectively.
|
|
•
|
Cost of sales —
The decrease of $2.0 million in cost of sales was due to $2.2 million reduction to wireless operations’ costs due to the lower cost basis of devices sold to or lost by wireless operations’ customers and lower cost of sales for systems sales consistent with the lower revenue in 2012, partially offset by $0.2 million increase in cost of sales for third party products.
|
|
•
|
Other —
The increase of $0.3 million in other expenses was primarily due to higher miscellaneous expenses associated with the software operations.
|
Service, Rental and Maintenance.
Service, rental and maintenance expenses consisted primarily of the following items:
|
|
For the Year Ended December 31,
|
|
|
|||||||||||||||||||||||||||
|
|
2012
|
2011
|
Change Between
2012 and 2011 |
|||||||||||||||||||||||||||
|
|
Wireless
|
Software
|
Total
|
Wireless
|
Software
|
Total
|
Total
|
%
|
||||||||||||||||||||||
|
|
(Dollars in thousands)
|
|||||||||||||||||||||||||||||
|
Site rent
|
$
|
17,864
|
|
$
|
—
|
|
$
|
17,864
|
|
$
|
23,283
|
|
$
|
—
|
|
$
|
23,283
|
|
$
|
(5,419
|
)
|
(23.3
|
)%
|
|||||||
|
Telecommunications
|
8,968
|
|
—
|
|
8,968
|
|
11,274
|
|
38
|
|
11,312
|
|
(2,344
|
)
|
(20.7
|
)%
|
||||||||||||||
|
Payroll and related
|
14,488
|
|
7,142
|
|
21,630
|
|
16,073
|
|
5,115
|
|
21,188
|
|
442
|
|
2.1
|
%
|
||||||||||||||
|
Stock based compensation
|
25
|
|
—
|
|
25
|
|
23
|
|
—
|
|
23
|
|
2
|
|
8.7
|
%
|
||||||||||||||
|
Other
|
4,444
|
|
2,494
|
|
6,938
|
|
5,022
|
|
1,519
|
|
6,541
|
|
397
|
|
6.1
|
%
|
||||||||||||||
|
Total service, rental and maintenance
|
$
|
45,789
|
|
$
|
9,636
|
|
$
|
55,425
|
|
$
|
55,675
|
|
$
|
6,672
|
|
$
|
62,347
|
|
$
|
(6,922
|
)
|
(11.1
|
)%
|
|||||||
|
FTEs
|
150
|
|
65
|
|
215
|
|
163
|
|
57
|
|
220
|
|
(5
|
)
|
(2.3
|
)%
|
||||||||||||||
34
As illustrated in the table above, service, rental and maintenance expenses for the year ended December 31, 2012 decreased $6.9 million or 11.1% from the same period in 2011 due to the following variances:
|
•
|
Site rent —
The decrease of $5.4 million in site rent expenses was primarily due to the rationalization of our networks, which has decreased the number of transmitters required to provide service to our customers. The reduction in transmitters has, in turn, reduced the number of lease locations required for the wireless operations. Active transmitters declined 4.8% in 2012 from the same period in 2011.
|
|
•
|
Telecommunications —
The decrease of $2.3 million in telecommunication expenses was primarily due to the consolidation of our networks. We believe continued reductions in these expenses will occur as our networks continue to be consolidated as anticipated throughout 2013 for our wireless operations.
|
|
•
|
Payroll and related —
Payroll and related expenses for wireless operations were incurred largely for field technicians, their managers, and in-house repair personnel, and payroll and related expenses for software operations were incurred for product development, product strategy and quality assurance personnel. The increase in payroll and related expenses of $0.4 million was due primarily to the increase of $2.0 million of payroll and related costs for software operations, partially offset by a reduction of $1.6 million in payroll and related costs for wireless operations due to headcount reductions of 13 FTEs to 150 FTEs at December 31, 2012 from 163 FTEs at December 31, 2011. Software operations FTEs increased by 8 FTEs to 65 FTEs at December 31, 2012 from 57 FTEs at December 31, 2011.
|
|
•
|
Other —
The increase of $0.4 million in other expenses was due to an increase of $1.0 million in other expenses for software operations, partially offset by lower other expenses of $0.6 million for wireless operations. The increase of $1.0 million for software operations consisted of increases in outside service expenses of $0.6 million, training expenses of $0.1 million and various other expenses, net of $0.3 million. The decrease in other expenses of $0.6 million for wireless operations was due primarily to reductions in office expenses of $0.5 million, repairs and maintenance expenses of $0.2 million and various other expenses of $0.1 million offset by higher outside service expenses of $0.2 million for external maintenance support for our networks and transmitters.
|
Selling and Marketing.
Selling and marketing expenses consisted of the following items:
|
|
For the Year Ended December 31,
|
|
|
|||||||||||||||||||||||||||
|
|
2012
|
2011
|
Change Between
2012 and 2011 |
|||||||||||||||||||||||||||
|
|
||||||||||||||||||||||||||||||
|
|
Wireless
|
Software
|
Total
|
Wireless
|
Software
|
Total
|
Total
|
%
|
||||||||||||||||||||||
|
|
(Dollars in thousands)
|
|||||||||||||||||||||||||||||
|
Payroll and related
|
$
|
7,422
|
|
$
|
6,704
|
|
$
|
14,126
|
|
$
|
8,945
|
|
$
|
4,425
|
|
$
|
13,370
|
|
$
|
756
|
|
5.7
|
%
|
|||||||
|
Commissions
|
3,037
|
|
2,092
|
|
5,129
|
|
4,028
|
|
1,415
|
|
5,443
|
|
(314
|
)
|
(5.8
|
)%
|
||||||||||||||
|
Stock based compensation
|
72
|
|
—
|
|
72
|
|
65
|
|
—
|
|
65
|
|
7
|
|
10.8
|
%
|
||||||||||||||
|
Other
|
990
|
|
3,328
|
|
4,318
|
|
1,428
|
|
2,083
|
|
3,511
|
|
807
|
|
23.0
|
%
|
||||||||||||||
|
Total selling and marketing
|
$
|
11,521
|
|
$
|
12,124
|
|
$
|
23,645
|
|
$
|
14,466
|
|
$
|
7,923
|
|
$
|
22,389
|
|
$
|
1,256
|
|
5.6
|
%
|
|||||||
|
FTEs
|
79
|
|
68
|
|
147
|
|
96
|
|
49
|
|
145
|
|
2
|
|
1.4
|
%
|
||||||||||||||
As indicated in the table above, selling and marketing expenses for the year ended December 31, 2012 increased by $1.3 million, or 5.6%, from the same period in 2011. Selling and marketing expenses consisted primarily of payroll and related expenses, which increased $0.8 million or 5.7% for the year ended December 31, 2012 compared to the same period in 2011. The increase was primarily due to an increase in payroll and related expenses of $2.3 million for software operations, partially offset by a reduction of $1.5 million in payroll and related costs for wireless operations reflecting headcount reductions of 17 FTEs to 79 FTEs at December 31, 2012 from 96 FTEs at December 31, 2011. Software operations FTEs increased by 19 FTEs to 68 FTEs at December 31, 2012 from 49 FTEs at December 31, 2011.
Commission expenses decreased by $0.3 million for the year ended December 31, 2012 compared to the same period in 2011 due primarily to a reduction of commission expenses for wireless operations of $1.0 million in line with the revenue and subscriber erosion, offset by an increase in commission expenses for software operations of $0.7 million. Stock based compensation expenses increased slightly due to higher amortization of compensation expense for the RSUs awarded to certain eligible employees under the 2009 LTIP. The increase of $0.8 million in other expenses for the year ended December 31, 2012 compared to the same period in 2011 was primarily due to increases in travel and entertainment expenses of $0.6 million, advertising expenses of $0.3 million, outside service expenses of $0.1 million and miscellaneous expenses of $0.2 million in our software operations, partially offset by reductions in travel and entertainment expenses of $0.1 million, outside service expenses of $0.1 million and miscellaneous expenses of $0.2 million in our wireless operations.
35
General and Administrative.
General and administrative expenses consisted of the following items:
|
|
For the Year Ended December 31,
|
Change Between
2012 and 2011 |
||||||||||||||||||||||||||||
|
|
2012
|
2011
|
||||||||||||||||||||||||||||
|
|
Wireless
|
Software
|
Total
|
Wireless
|
Software
|
Total
|
Total
|
%
|
||||||||||||||||||||||
|
|
(Dollars in thousands)
|
|||||||||||||||||||||||||||||
|
Payroll and related
|
$
|
20,211
|
|
$
|
4,525
|
|
$
|
24,736
|
|
$
|
21,444
|
|
$
|
3,455
|
|
$
|
24,899
|
|
$
|
(163
|
)
|
(0.7
|
)%
|
|||||||
|
Stock based compensation
|
1,010
|
|
117
|
|
1,127
|
|
855
|
|
587
|
|
1,442
|
|
(315
|
)
|
(21.8
|
)%
|
||||||||||||||
|
Bad debt
|
636
|
|
442
|
|
1,078
|
|
705
|
|
340
|
|
1,045
|
|
33
|
|
3.2
|
%
|
||||||||||||||
|
Facility rent
|
2,062
|
|
1,404
|
|
3,466
|
|
2,749
|
|
1,092
|
|
3,841
|
|
(375
|
)
|
(9.8
|
)%
|
||||||||||||||
|
Telecommunications
|
1,273
|
|
351
|
|
1,624
|
|
1,587
|
|
307
|
|
1,894
|
|
(270
|
)
|
(14.3
|
)%
|
||||||||||||||
|
Outside services
|
9,069
|
|
566
|
|
9,635
|
|
12,154
|
|
182
|
|
12,336
|
|
(2,701
|
)
|
(21.9
|
)%
|
||||||||||||||
|
Taxes, licenses and permits
|
5,341
|
|
147
|
|
5,488
|
|
6,182
|
|
112
|
|
6,294
|
|
(806
|
)
|
(12.8
|
)%
|
||||||||||||||
|
Other
|
5,087
|
|
(1,561
|
)
|
3,526
|
|
5,353
|
|
(1,009
|
)
|
4,344
|
|
(818
|
)
|
(18.8
|
)%
|
||||||||||||||
|
Total general and administrative
|
$
|
44,689
|
|
$
|
5,991
|
|
$
|
50,680
|
|
$
|
51,029
|
|
$
|
5,066
|
|
$
|
56,095
|
|
$
|
(5,415
|
)
|
(9.7
|
)%
|
|||||||
|
FTEs
|
150
|
|
36
|
|
186
|
|
175
|
|
30
|
|
205
|
|
(19
|
)
|
(9.3
|
)%
|
||||||||||||||
As illustrated in the table above, general and administrative expenses for the year ended December 31, 2012 decreased $5.4 million, or 9.7%, from the same period in 2011 due primarily to lower outside service expenses and tax, license and permit expenses. The 2011 outside service expenses included acquisition related costs of $2.7 million for wireless operations. Total general and administrative expenses decreased for the year ended December 31, 2012 compared to the same period in 2011 due to the following variances:
|
•
|
Payroll and related —
Payroll and related expenses were incurred mainly for employees in customer service, information technology, inventory, finance and other support functions as well as executive management. Payroll and related expenses decreased by $0.2 million primarily due to lower payroll and related expenses of $1.2 million reflecting headcount reductions of 25 FTEs to 150 FTEs at December 31, 2012 from 175 FTEs at December 31, 2011 for wireless operations, partially offset by higher payroll and related expenses of $1.0 million for software operations. Software operations FTEs increased by 6 FTEs to 36 FTEs at December 31, 2012 from 30 FTEs at December 31, 2011. Payroll and related expenses during the year ended December 31, 2012 for software operations included a benefit of $0.3 million for forfeitures under the 2012 STIP associated with the departure of two former executives.
|
|
•
|
Stock based compensation —
Stock based compensation expenses consisted primarily of amortization of compensation expense associated with RSUs awarded to certain eligible employees for both wireless and software operations and amortization of compensation expense for restricted stock granted to non-executive members of our Board of Directors under the Equity Plans. Stock based compensation expenses decreased by $0.3 million due to lower stock based compensation expenses of $0.5 million during the year ended December 31, 2012 for software operations due to forfeitures under the 2011 LTIP associated with the departure of two former executives and the modification of the performance criteria under the 2011 LTIP, partially offset by higher amortization of compensation expenses of $0.2 million for wireless operations under the 2009 LTIP.
|
|
•
|
Bad debt —
Bad debt expenses increased slightly which reflected the bad debt experience at our respective operations. Bad debt decreased by $0.1 million for wireless operations which was in line with the decline in revenue, offset by an increase in bad debt expense in software operations by $0.1 million.
|
|
•
|
Facility rent —
The decrease of $0.4 million in facility rent expenses was primarily due to lower facility rent expenses of $0.7 million for our wireless operations related to the closure of office facilities, as we continue to rationalize our operating requirements to meet lower revenue and customer demand for the wireless operations, offset by an increase in facility rent expenses for software operations of $0.3 million.
|
|
•
|
Telecommunications —
The decrease of $0.3 million in telecommunication expenses reflected continued office and staffing reductions as we continue to streamline our operations and reduce our telecommunication requirements for the wireless operations.
|
|
•
|
Outside services —
Outside service expenses consisted primarily of costs associated with printing and mailing invoices, outsourced customer service and various professional fees. The decrease of $2.7 million in outside service expenses was due primarily to acquisition and integration related costs of $2.7 million in 2011 and lower outsourced customer service expenses of $0.6 million for wireless operations during the year ended December 31, 2012 compared to the same period in 2011. These decreases were partially offset by increases in external tax support services and other services net of $0.2 million for wireless operations and increases in outside service expenses for software operations of $0.4 million primarily for external accounting service expenses.
|
36
|
•
|
Taxes, licenses and permits —
Taxes, licenses and permit expenses consist of property, franchise, gross receipts and transactional taxes. The decrease in taxes, licenses and permit expenses of $0.8 million was primarily due to resolution of various state and local tax audits for wireless operations for the year ended December 31, 2011 at amounts higher than the originally estimated liabilities.
|
|
•
|
Other —
The decrease of $0.8 million in other expenses was due to decreases of $0.3 million in other expenses for wireless operations and $0.5 million for software operations. The decrease of $0.3 million for wireless operations was primarily due to decreases in repair and maintenance expenses of $0.2 million, insurance expenses of $0.1 million and miscellaneous expenses of $0.4 million, partially offset by increases in recruiting and relocation expenses of $0.4 million. The decrease of $0.5 million for software operations was due to a net increase in credits of $0.7 million for shared costs that have been allocated to cost of products sold, service, rental and maintenance and selling and marketing categories, partially offset by higher office expenses of $0.2 million.
|
Severance and Restructuring
. Severance and restructuring expenses increased to $1.8 million for the year ended December 31, 2012 compared to $1.3 million for the same period in 2011. The $0.5 million increase was primarily due to $1.8 million in severance charges recorded during the year ended December 31, 2012 for post-employment benefits resulting from planned staffing reductions for both operations, as compared to $1.2 million recorded for the same period in 2011 for wireless operations. We accrued post-employment benefits if certain specified criteria are met. Post-employment benefits include salary continuation, severance benefits and continuation of health insurance benefits. In 2012, we incurred $0.1 million of restructuring costs in the wireless operations.
Depreciation, Amortization and Accretion.
Depreciation, amortization and accretion expenses were $18.2 million for the year ended December 31, 2012 compared to $19.3 million for the same period in 2011. There were $1.0 million in lower depreciation expense for the period from fully depreciated paging infrastructure and other assets, $1.2 million in lower depreciation expense on paging devices resulting from fewer purchases of paging devices and from fully depreciated paging devices and $40,000 reduction in accretion expenses, partially offset by an increase of $1.1 million in amortization expense due to the increase in intangible assets associated with our software operations. Depreciation, amortization and accretion expenses for software operations represented $7.1 million of the total $18.2 million in depreciation, amortization and accretion expenses for the year ended December 31, 2012 and $5.4 million of the total $19.3 million in depreciation, amortization and accretion expenses for the year ended December 31, 2011.
Impairments.
We recorded an impairment charge of $3.4 million to the contract-based intangible assets for our software operations for the year ended December 31, 2012; no impairment of amortizable intangible assets was recorded for the same period in 2011. In 2012 and 2011, we did not record any impairment of long-lived assets, other intangible assets and goodwill.
Interest Expense, Net; Other Income, Net and Income Tax Expense (Benefit)
Interest Expense, Net.
Net interest expense decreased to $0.4 million for the year ended December 31, 2012 from $2.3 million for the same period in 2011. This decrease was primarily due to minimal interest on outstanding debt for the year ended December 31, 2012 associated with the Amcom acquisition as the debt was completely repaid on April 6, 2012.
Other Income, Net
. Net other income decreased to $0.7 million for the year ended December 31, 2012 from $8.0 million for the same period in 2011. The other income recorded during the year ended December 30, 2011 primarily related to the gain on the sale of narrowband personal communications service licenses to Sensus USA Inc. in 2011 of $7.5 million.
Income Tax Expense (Benefit).
Income tax expense for the year ended December 31, 2012 was $19.1 million, an increase of $45.4 million from the $26.3 million income tax benefit for the year ended December 31, 2011. The increase in income tax expense and the effective tax rate reflects a net $0.7 million increase to the deferred income tax asset valuation allowance that affected income tax expense during 2012. The 2011 benefit associated with the decrease in the deferred income tax asset valuation account reflected the favorable results in the wireless operations and the projected additional taxable income associated with the acquisition of Amcom. The following is the effective tax rate reconciliation for the years ended December 31, 2012 and 2011, respectively.
37
|
|
For the Year Ended December 31,
|
||||||||||||
|
|
2012
|
2011
|
|||||||||||
|
|
(Dollars in thousands)
|
||||||||||||
|
Income before income tax expense (benefit)
|
$
|
46,063
|
|
$
|
57,525
|
|
|||||||
|
Income tax expense at the Federal statutory rate
|
$
|
16,122
|
|
35.0
|
%
|
$
|
20,134
|
|
35.0
|
%
|
|||
|
State income taxes
|
1,555
|
|
3.4
|
%
|
2,062
|
|
3.6
|
%
|
|||||
|
State law changes
|
117
|
|
0.3
|
%
|
146
|
|
0.3
|
%
|
|||||
|
Increase (Decrease) in valuation allowance
|
658
|
|
1.4
|
%
|
(50,196
|
)
|
(87.3
|
)%
|
|||||
|
Acquisition transaction costs
|
—
|
|
—
|
%
|
947
|
|
1.6
|
%
|
|||||
|
Interest on income tax refunds
|
(47
|
)
|
(0.1
|
)%
|
—
|
|
—
|
%
|
|||||
|
Other
|
674
|
|
1.4
|
%
|
646
|
|
1.1
|
%
|
|||||
|
Income tax expense (benefit)
|
$
|
19,079
|
|
41.4
|
%
|
$
|
(26,261
|
)
|
(45.7
|
)%
|
|||
Our annual effective tax rate is comparable to prior periods once the effects of change in the valuation allowance and the 2011 nondeductible transaction costs related to the Amcom acquisition are excluded from the computation as indicated in the following table:
|
|
For the Year Ended December 31,
|
|||||
|
|
2012
|
2011
|
||||
|
Effective tax rate
|
41.4
|
%
|
(45.7
|
)%
|
||
|
Change in valuation allowance
|
(1.4
|
)%
|
87.3
|
%
|
||
|
Acquisition transaction costs
|
—
|
%
|
(1.6
|
)%
|
||
|
Adjusted effective tax rate
|
40.0
|
%
|
40.0
|
%
|
||
Liquidity and Capital Resources
Cash and Cash Equivalents
At December 31, 2013, we had cash and cash equivalents of $89.1 million. The available cash and cash equivalents are held in accounts managed by third-party financial institutions and consist of invested cash and cash in our operating accounts. The invested cash is invested in interest bearing funds managed by third-party financial institutions. These funds invest in direct obligations of the government of the United States. To date, we have experienced no loss or lack of access to our invested cash or cash equivalents; however, we can provide no assurance that access to our invested cash and cash equivalents will not be impacted by adverse conditions in the financial markets.
At any point in time, we have approximately $3.0 to $5.0 million in our operating accounts that are with third-party financial institutions. While we monitor daily the cash balances in our operating accounts and adjust the cash balances as appropriate, these cash balances could be impacted if the underlying financial institutions fail or are subject to other adverse conditions in the financial markets. To date, we have experienced no loss or lack of access to cash in our operating accounts.
We intend to use our cash on hand to provide working capital, to support operations, and to return value to stockholders through cash dividends and repurchases of our common stock. We may also consider using cash to fund acquisitions of assets of other businesses that we believe will provide a measure of growth or revenue stability while supporting our operating structure.
Overview
In the event that net cash provided by operating activities and cash on hand are not sufficient to meet future cash requirements, we may be required to reduce planned capital expenses, reduce or eliminate our cash dividends to stockholders, reduce or eliminate our common stock repurchase program, and/or sell assets or seek additional financing beyond the availability on our revolving credit facility. We can provide no assurance that reductions in planned capital expenses or proceeds from asset sales would be sufficient to cover shortfalls in available cash or that additional financing would be available on acceptable terms. As of December 31, 2013, our available cash on hand was $89.1 million and our available borrowing capacity under our revolving credit facility was approximately $40.0 million (see “Borrowings” below).
Based on current and anticipated levels of operations, we anticipate net cash provided by operating activities, together with the available cash on hand at December 31, 2013, should be adequate to meet anticipated cash requirements for both our wireless and software operations for the foreseeable future.
38
The following table sets forth information on our net cash flows from operating, investing, and financing activities for the periods stated:
|
|
For the Year Ended December 31,
|
Change
Between 2013 and 2012 |
|||||||||||||
|
|
2013
|
2012
|
2011
|
||||||||||||
|
|
(Dollars in thousands)
|
||||||||||||||
|
Net cash provided by operating activities
|
$
|
50,456
|
|
$
|
72,877
|
|
$
|
82,436
|
|
$
|
(22,421
|
)
|
|||
|
Net cash used in investing activities
|
(10,115
|
)
|
(12,659
|
)
|
(134,647
|
)
|
(2,544
|
)
|
|||||||
|
Net cash used in financing activities
|
(12,312
|
)
|
(52,827
|
)
|
(23,354
|
)
|
(40,515
|
)
|
|||||||
Net Cash Provided by Operating Activities.
As discussed above, we are dependent on cash flows from operating activities to meet our cash requirements. Cash from operations varies depending on changes in various working capital items, including deferred revenues, accounts payable, accounts receivable, prepaid expenses and various accrued expenses. The following table includes the cash receipt and expenditure components of our cash flows from operating activities for the periods indicated, and sets forth the change between the stated periods:
|
|
For the Year Ended December 31,
|
Change
Between 2013 and 2012 |
|||||||||
|
|
2013
|
2012
|
|||||||||
|
|
(Dollars in thousands)
|
||||||||||
|
Cash received from customers
|
$
|
206,514
|
|
$
|
221,961
|
|
$
|
(15,447
|
)
|
||
|
Cash paid for
|
|||||||||||
|
Payroll and related costs
|
79,455
|
|
72,595
|
|
6,860
|
|
|||||
|
Site rent costs
|
16,861
|
|
17,994
|
|
(1,133
|
)
|
|||||
|
Telecommunications costs
|
8,872
|
|
10,276
|
|
(1,404
|
)
|
|||||
|
Interest costs
|
10
|
|
132
|
|
(122
|
)
|
|||||
|
Other operating costs
|
50,860
|
|
48,087
|
|
2,773
|
|
|||||
|
156,058
|
|
149,084
|
|
6,974
|
|
||||||
|
Net cash provided by operating activities
|
$
|
50,456
|
|
$
|
72,877
|
|
$
|
(22,421
|
)
|
||
Net cash provided by operating activities decreased $22.4 million for the year ended December 31, 2013 compared to the same period in 2012 due to a decrease in cash received from customers of $15.4 million and an increase in cash paid for operating activities of $7.0 million. Cash received from customers consisted of revenue and direct taxes billed to customers adjusted for changes in accounts receivable, deferred revenue and tax withholding amounts. The decrease of $15.4 million was due to lower revenue of $9.9 million and lower deferred revenue and customer deposits of $11.2 million, partially offset by lower accounts receivable of $4.9 million and higher accrued sales taxes of $0.8 million.
The increase in cash paid for operating activities of $7.0 million was as follows:
|
•
|
Cash payments for payroll and related costs increased by $6.9 million primarily due to higher costs of $1.3 million in payroll and related costs for wireless operations and higher payroll costs of $5.6 million for software operations. The increase for the wireless operations reflected payment of the cash award under the 2009 LTIP to eligible employees during the second quarter of 2013 that offset lower payroll and related costs due to lower headcount. Increased payments for payroll and related costs in software operations reflected higher commission payments for bookings and higher headcount.
|
|
•
|
Cash payments for site rent costs decreased $1.1 million. This decrease was due primarily to lower site rent expenses for leased locations as we rationalized our network and incurred lower payments in 2013 for wireless operations.
|
|
•
|
Cash payments for telecommunication costs decreased $1.4 million. This decrease was due primarily to the consolidation of our networks and reflects continued office and staffing reductions to support our smaller customer base for wireless operations.
|
|
•
|
Cash payments for interest costs decreased $0.1 million primarily due to less interest on debt associated with the Amcom acquisition as the debt was completely repaid on April 6, 2012.
|
|
•
|
Cash payments for other operating costs increased $2.8 million. The increase was due primarily to higher travel and entertainment costs of $0.3 million, higher outside services costs of $0.4 million, higher financial services costs of $0.2 million, higher operating asset disposals loss of $0.2 million, higher consulting expense related to potential mergers and acquisitions of $0.1 million, a one time software support services settlement of $0.3 millio
|
39
n in 2013, higher advertising costs of $0.2 million, higher current income tax expenses of $0.5 million and higher various other costs, net of $0.6 million.
Net Cash Used In Investing Activities
. Net cash used in investing activities decreased $2.5 million for the year ended December 31, 2013 compared to the same period in 2012 due to lower acquisition costs of $3.0 million for the year ended December 31, 2013 from the same period in 2012, partially offset by higher capital expenses for property and equipment for both operations of $0.5 million.
Net Cash Used In Financing Activities
. Net cash used in financing activities decreased $40.5 million for the year ended December 31, 2013 from the same period in 2012 due to the prepayment of debt of $28.3 million and stock repurchases of $8.0 million for the year ended December 31, 2012. In addition, we paid $4.2 million less in cash dividends to stockholders for the year ended December 31, 2013 compared to the same period in 2012.
Cash Dividends to Stockholders.
For the year ended on December 31, 2013, we paid a total of $10.8 million (or $0.50 per share of common stock) in quarterly cash dividends and accumulated cash dividends of $1.5 million earned on vested RSUs associated with 2009 LTIP compared to $16.5 million (or $0.75 per share of common stock) in quarterly cash dividends for the same period in 2012.
Future Cash Dividends to Stockholders.
On March 5, 2014, our Board of Directors declared a regular quarterly dividend distribution of $0.125 per share of common stock, with a record date of March 18, 2014, and a payment date of March 28, 2014. This cash dividend of approximately $2.7 million will be paid from available cash on hand.
Common Stock Repurchase Program.
On July 31, 2008, our Board of Directors approved a program to repurchase our common stock in the open market. Credit Suisse Securities (USA) LLC administers such purchases. We expect to use available cash on hand and net cash provided by operating activities to fund the common stock repurchase program.
We made no common stock repurchase for the year ended December 31, 2013. The Company’s stock repurchase program has been extended at various dates between 2009 through 2014 by our Board of Directors. The available repurchase authority is $15.0 million as of January 1, 2014. This repurchase authority allows us, at management’s discretion, to selectively repurchase shares of our common stock from time to time in the open market depending upon market price and other factors. (See Note 6 for further discussion on our common stock repurchase program.)
Borrowings.
On November 8, 2011 we executed the First Amendment to our Amended and Restated Credit Agreement (“Amended Credit Agreement”) with Wells Fargo Capital Finance, LLC (“Wells Fargo”). The Amended Credit Agreement increased the amount of the revolving credit facility to $40.0 million. The maturity date for the revolving credit facility is September 3, 2015. The Amended Credit Agreement also revised the London Interbank Offered Rate (“LIBOR”) definition to eliminate the LIBOR floor and reduced the interest rate margin to 3.25%. Borrowings under this facility are secured by a lien on substantially all of the existing assets, interests in assets and proceeds owned or acquired by us.
At December 31, 2013, we had no outstanding debt. (See Note 5 for further discussion on our long-term debt.)
We are subject to certain financial covenants on a quarterly basis under the terms of the Amended Credit Agreement. These financial covenants consist of a leverage ratio and a fixed charge coverage ratio. We are in compliance with all of the required financial covenants as of December 31, 2013.
Commitments and Contingencies
Contractual Obligations.
As of December 31, 2013, our contractual payment obligations under our operating leases for office and transmitter locations are indicated in the table below. For purposes of the table below, purchase obligations are defined as agreements to purchase goods or services that are enforceable and legally binding and that specify all significant terms, including: fixed or minimum quantities to be purchased; fixed, minimum or variable pricing provisions; and the approximate timing of transactions. These purchase obligations primarily related to certain telecommunication and information technology related expenses. The amounts are based on our contractual commitments; however, it is possible that we may be able to negotiate lower payments if we choose to exit these contracts before their expiration date. Other obligations as indicated below consisted primarily of expected future payments for asset retirements and cumulative dividends primarily under the 2011 LTIP to certain eligible employees.
40
We incurred the following significant commitments and contractual obligations as of December 31, 2013.
|
|
Payments Due By Period
|
||||||||||||||||||
|
|
(Dollars in thousands)
|
||||||||||||||||||
|
|
Total
|
Less than 1 Year
|
1 to 3 years
|
3 to 5 years
|
More than 5 years
|
||||||||||||||
|
Operating lease obligations
|
$
|
22,989
|
|
$
|
6,948
|
|
$
|
8,752
|
|
$
|
3,680
|
|
$
|
3,609
|
|
||||
|
Purchase obligations
|
2,339
|
|
1,839
|
|
499
|
|
1
|
|
—
|
|
|||||||||
|
Other obligations
|
10,024
|
|
308
|
|
1,353
|
|
8,363
|
|
—
|
|
|||||||||
|
Total contractual obligations
|
$
|
35,352
|
|
$
|
9,095
|
|
$
|
10,604
|
|
$
|
12,044
|
|
$
|
3,609
|
|
||||
Other Commitments and Contingencies.
See Note 8 for further discussion on other commitments and contingencies.
Off-Balance Sheet Arrangements.
We do not have any relationships with unconsolidated entities or financial partnerships, such as entities often referred to as structured finance or special purpose entities, which would have been established for the purpose of facilitating off-balance sheet arrangements or other contractually narrow or limited purposes. As such, we are not exposed to any financing, liquidity, market or credit risk that could arise if we had engaged in such relationships.
Related Parties
See Note 16 for further discussion on our related party transactions.
Inflation
Inflation has not had a material effect on our operations to date. System equipment and operating costs have not significantly increased in price, and the price of wireless messaging devices has tended to decline in recent years. This reduction in costs has generally been reflected in lower prices charged to subscribers who purchase their wireless messaging devices. Our general operating expenses for both our wireless and software operations, such as salaries, site rent for transmitter locations, employee benefits and occupancy costs, are subject to normal inflationary pressures.
Application of Critical Accounting Policies
The preceding discussion and analysis of financial condition and statement of income are based on our consolidated financial statements, which have been prepared in conformity with United States generally accepted accounting principles (“GAAP”). The preparation of these consolidated financial statements requires management to make estimates, judgments and assumptions that affect the reported amounts of assets, liabilities, revenues, expenses, and related disclosures. On an on-going basis, we evaluate estimates and assumptions, including but not limited to those related to the impairment of long-lived assets and intangible assets subject to amortization and goodwill, revenue recognition, asset retirement obligations, and income taxes - uncertainties and deferred income tax assets. We base our estimates on historical experience and various other assumptions that are believed to be reasonable under the circumstances, the results of which form the basis for making judgments about the carrying values of assets and liabilities that are not readily apparent from other sources. Actual results may differ from these estimates under different assumptions or conditions.
We believe the following critical accounting policies affect our more significant judgments and estimates used in the preparation of our consolidated financial statements.
Impairment of Long-Lived Assets, Intangible Assets Subject to Amortization and Goodwill
We are required to evaluate the carrying value of our long-lived assets, amortizable intangible assets and goodwill. Amortizable intangible assets include customer related intangibles, technology based intangibles, contract based intangibles and marketing intangibles that primarily resulted from our acquisition of Amcom in 2011 and IMCO Technologies Corporation (“IMCO”) in 2012. Such intangibles are being amortized over periods ranging from two to fifteen years. We assess whether circumstances exist which suggest that the carrying value of long-lived assets may not be recoverable. When applicable, we assess the recoverability of the carrying value of our long-lived assets and certain amortizable intangible assets based on estimated undiscounted cash flows to be generated from such assets. In assessing the recoverability of these assets, we forecasted estimated enterprise-level cash flows based on operating assumptions such as revenue forecasted by product line. If the forecast of undiscounted cash flows did not exceed the carrying value of the long-lived assets, we would record an impairment charge to the extent the carrying value exceeded the fair value of such assets.
Goodwill resulting from our acquisitions is not amortized but is evaluated for impairment at least annually, or when events or circumstances suggest a potential impairment has occurred. We have selected the fourth quarter to perform this annual impairment
41
test. We will evaluate goodwill for impairment between annual tests if indicators of impairment exist. GAAP requires the comparison of the fair value of the reporting unit to its carrying amount to determine if there is a potential impairment. For this determination, all of our goodwill has been assigned to our software operations, which is also deemed to be the reporting unit. The first step of the impairment test involves comparing the fair values of the reporting unit with its carrying values. If the reporting unit’s fair value is less than the carrying amount of the reporting unit, we perform the second step of the goodwill impairment test. The second step of the goodwill impairment test involves comparing the implied fair value of the affected reporting unit’s goodwill with the carrying value of that goodwill. The amount, by which the implied fair value is less than the carrying value of the goodwill, if any, is recognized as an impairment loss. The fair value of the reporting unit is estimated using a discounted cash flow methodology. This analysis requires significant judgments, including estimation of future cash flows, which is dependent on internal forecasts, estimation of the long-term rate of growth for our business, estimation of the useful life over which cash flows will occur, and determination of our weighted average cost of capital. We also consider the market value of our invested capital as a confirmatory measurement of fair value.
We did not record any impairment of long-lived assets, amortizable intangible assets and goodwill for the years ended December 31, 2013 and 2011. We recorded an impairment charge of $3.4 million to the contract-based intangible assets for our software operations for the year ended December 31, 2012. All other long-lived assets, amortizable intangible assets and goodwill were not deemed to be impaired for the year ended December 31, 2012.
Revenue Recognition
We recognize revenue when four basic criteria have been met: (1) persuasive evidence of an arrangement exists, (2) delivery has occurred or services rendered, (3) the fee is fixed or determinable and (4) collectability is reasonably assured. Amounts billed to customers but not meeting these revenue recognition criteria are deferred until all four criteria have been met.
Our wireless operations’ revenue consists primarily of service rental and maintenance fees charged to customers on a monthly, quarterly, or annual basis. Revenue also includes the sale of messaging devices directly to customers and other companies that resell our services. With respect to revenue recognition for multiple deliverables, we evaluated these revenue arrangements and determined that two separate units of accounting exist, paging service revenue and product sales. We recognize paging service revenue over the period the service is performed; revenue from product sales is recognized at the time of shipment or installation. We have a variety of billing arrangements with our customers resulting in deferred revenue from advance billings and accounts receivables for billing in-arrears arrangements.
For our software operations, we enter into contractual arrangements that include a fee that is fixed or determinable. This contractual arrangement has been agreed to by the customer and we review customer creditworthiness to assure collectability.
Our software operations’ revenue consists primarily of the sale of software (license fees), professional services (primarily installation and training), equipment (to be used in conjunction with the software) and maintenance support (post-contract support). The software is licensed to end users under an industry standard software license agreement. Our software products are considered to be “off-the-shelf software” as the software is marketed as a stock item that customers can use without customization.
For purposes of disclosure, revenue from the software operations consists of two primary components: (1) operations revenue consisting of software license revenue, professional services revenue and equipment sales, and (2) maintenance revenue.
We generally sell software licenses, professional services, equipment and maintenance in multiple-element arrangements. At inception of the arrangement, we allocate the arrangement consideration to the software deliverables (software licenses, professional services and maintenance) as a group and to the non-software deliverables (equipment and maintenance on equipment, when applicable) using the relative selling price method. When performing this allocation, the estimated selling price for each deliverable is based on vendor specific objective evidence of fair value (“VSOE”), third party evidence of fair value (“TPE”), or if VSOE and TPE are not available, the best estimated selling price (“BESP”) for selling the element on a stand-alone basis. We have determined that TPE is not a practical alternative due to differences in our service offerings compared to other parties and the availability of relevant third-party pricing information. The amount of revenue allocated to delivered items is limited by contingent revenue, if any.
Post contract support is allocated using VSOE as an input in the relative selling price allocation. For software licenses, professional services and equipment we have determined that neither VSOE nor TPE is available and as such, we have used BESP as an input in order to allocate our arrangement fees. We determine BESP by considering our overall pricing objectives and market conditions. Significant pricing practices take into consideration our discounting practices, the size and volume of our transactions, the customer demographic, the geographic area where our services are sold, our price lists, our go-to-market strategy, historical standalone sales and contract prices. The determination of BESP is made through consultation with and approval by management, taking into consideration the go-to-market strategy. As our go-to-market strategies evolve, we may modify our pricing practices in the future, which could result in changes in relative selling prices, including both VSOE and BESP.
42
In multiple-element arrangements, the arrangement consideration allocated to our non-software deliverables (equipment) is generally recognized upon delivery to the customer.
For our software deliverables, which include software licenses, professional services, and post contract support, we further allocate arrangement consideration using the residual method. As noted above, we have not established VSOE for our software licenses and professional services. However, we have established, and continue to maintain, VSOE for post contract support. As such, the residual amount relating to the revenue from software licenses and professional services is recognized as revenue over the period of delivery to the customer, if known, or when fully delivered to the customer. Maintenance revenue is deferred and recognized over the maintenance period, generally one year.
Asset Retirement Obligations
We recognize liabilities and corresponding assets for future obligations associated with the retirement of assets. We have paging equipment assets, principally transmitters, which are located on leased locations. The underlying leases generally require the removal of equipment at the end of the lease term; therefore, a future obligation exists.
Asset retirement costs are reflected in paging equipment assets with depreciation expense recognized over the estimated lives, which range between one and five years. The asset retirement costs were $3.8 million and $1.7 million at December 31, 2013 and 2012, respectively. The net increase in asset retirement costs in 2013 increased paging equipment assets which are being depreciated over the related estimated lives of 12 to 60 months. Depreciation, amortization and accretion for the years ended December 31, 2013 and 2012 included benefits of $1.0 million and $1.1 million, respectively, related to depreciation of these asset retirement costs.The benefits in depreciation expense for these years are due to net reductions to the asset retirement costs as a result of changes in the timing and costs of the transmitter deconstructions. The asset retirement costs and the corresponding liabilities that have been recorded to date generally relate to either current plans to consolidate networks or to the removal of assets at a future terminal date.
At both December 31, 2013 and 2012, accrued other liabilities included $0.4 million of asset retirement liabilities related to our efforts to reduce the number of transmitters in operation; other long-term liabilities included $7.6 million, related primarily to an estimate of the costs of deconstructing assets through the terminal date. The primary variables associated with these estimates are the number of transmitters and related equipment to be removed, the timing of removal, and a fair value estimate of the outside contractor fees to remove each asset. The fair value estimate of contractor fees to remove each asset is assumed to escalate by 4% each year through the terminal date.
The long-term cost associated with the estimated removal costs and timing refinements due to ongoing network rationalization activities will accrete to a total liability of $9.6 million. The accretion was recorded on the interest method utilizing the following discount rates for the specified periods:
|
Period
|
Discount Rate
|
|
|
2013 – December 31 Additions
(1)
and Incremental Estimates
|
10.48
|
%
|
|
2013 – January 1 through September 30 – Additions
(1)
|
10.60
|
%
|
|
2012 – December 31 Additions
(1)
and Incremental Estimates
|
10.60
|
%
|
|
2012 – September 30 – Incremental Estimates
(2)
|
12.14
|
%
|
|
2012 – January 1 through September 30 – Additions
(1)
|
10.77
|
%
|
|
2011 – December 31 Additions
(1)
and Incremental Estimates
|
10.77
|
%
|
|
2011 – September 30 – Incremental Estimates
(2)
|
12.17
|
%
|
|
2011 – April 1 through September 30 – Additions
(1)
|
11.50
|
%
|
|
2011 – January 1 through March 31 – Additions
(1)
|
12.46
|
%
|
|
(1)
|
Transmitters moved to new sites resulting in additional liability.
|
|
(2)
|
Weighted average credit adjusted risk-free rate used to discount downward revision to estimated future cash flows.
|
The total estimated liability is based on transmitter locations remaining after we have consolidated the number of networks we operate and assume the underlying leases continue to be renewed to that future date. Depreciation, amortization and accretion expense for the years ended December 31, 2013, 2012 and 2011 included $0.6 million, $0.7 million and $0.8 million, respectively, for accretion expense on the asset retirement obligation liabilities.
We believe these estimates are reasonable at the present time, but we can give no assurance that changes in technology, our financial condition, the economy or other factors would not result in higher or lower asset retirement obligations. Any variations from our estimates would generally result in a change in the assets and liabilities in equal amounts, and operating results would differ in the future by any difference in depreciation expense and accretion expense.
43
Income Taxes - Uncertainties and Deferred Income Tax Assets ("DTAs")
The preparation of consolidated financial statements in accordance with GAAP requires management to make estimates and assumptions that affect the reported amount of tax-related assets, liabilities and income tax expense. These estimates and assumptions are based on the requirements of the Financial Accounting Standards Board (“FASB”) Accounting Standards Codification (“ASC”). The ASC includes provisions relating to accounting for uncertainty in income taxes.
We file our income tax returns as prescribed by the tax laws of the jurisdictions in which we operate. We are required to evaluate the recoverability of our DTAs. The assessment is to determine whether based on all available evidence, it is more likely than not (i.e., greater than a 50% probability) that all or some portion of the DTAs will be realized in the future.
During 2013, we reflected an increase of approximately $0.6 million in the valuation allowance to offset an AMT tax credit carryforward. The DTA valuation allowance reflects management’s judgment concerning the ultimate recoverability of the DTAs. The wireless operations is projected to continue to decline while the software operations is projected to grow. Given the uncertainties of the economy and business spending on new software solutions, we did not further adjust the valuation allowance and believe it is more likely than not that the net DTAs of $28.9 million will be recoverable. Approximately 88.3% of our net DTAs consist of net operating losses carryforwards. For the three years ended December 31, 2012, the Company has utilized approximately $114.1 million of net operating losses which translates into approximately $45.6 million of DTAs.
During 2012, wireless operations’ results were favorable when compared to our projections and software operations’ were unfavorable. Based upon reforecasting our projections of taxable income in future periods we determined the need for an increase in the valuation allowance which increased income tax expense by $0.7 million. The balance sheet amounts for the DTAs and the valuation account increased by approximately $3.0 million, which reflects an increase in the available Section 382 limited net operating losses.
We consider both positive and negative evidence when evaluating the recoverability of our DTAs. During the fourth quarter of each year, we prepare a multi-year forecast of taxable income for our wireless and software operations. In preparing our analysis of the recoverability of our DTAs, we consider the following possible sources of taxable income:
|
1.
|
Future reversals of existing taxable temporary differences.
|
We consider 100% of our existing taxable temporary differences when estimating the amount of recoverable DTAs. As of December 31, 2013, we had approximately $3.1 million of taxable temporary differences which we believe will be recoverable over the next 20 year carryforward period. Most of these differences relate to software operations intangible assets that have a 15 year recovery period.
|
2.
|
Future taxable income exclusive of reversing temporary differences and carryforwards.
|
As described above, we use a multi-year forecast of taxable income for the wireless and software operations. DTAs are realizable if future deductible amounts would reduce taxes that would be paid on future taxable income excluding the reversal of existing temporary differences. We do not forecast beyond five years due to the increasing levels of uncertainty facing the wireless operations. A similar situation exists regarding the software operations, as future changes in technology may impact present and planned products and services.
|
3.
|
Taxable income in carryback years to the extent permitted by tax law.
|
We have exhausted our carryback potential and now only have carryforwards available.
|
4.
|
Tax planning strategies.
|
During 2012, we elected to capitalize and amortize over 10 years, research and development costs in the software operations. This increases taxable income and the amount of net operating losses utilized.
The wireless operations have experienced a continuing decline in revenue and taxable income as subscribers switch to other communication solutions. The software operations have been impacted by the economic slowdown of the past several years resulting in customers deferring or delaying purchases. The wireless and software operations forecasts of taxable income are not sufficient to result in the full realization of our DTAs.
The balance of the DTA valuation allowance as of December 31, 2013 and 2012 was $119.3 million and $118.7 million, respectively. The estimated recoverable DTAs at December 31, 2013 and 2012 were $28.9 million and $45.2 million, respectively. These estimated recoverable amounts represent approximately 19.5% and 27.6%, respectively, of the gross DTAs at December 31,
44
2013 and 2012. The decrease in the percentage of recoverable DTAs in 2013 reflects the effects of DTA utilization in 2013 and the increase in the DTA valuation allowance to cover the estimated AMT tax credit.
Recent and Pending Accounting Pronouncements
Accounting Standards Updates (“ASU”) issued by the FASB during 2013 were not applicable to us and are not anticipated to have an effect on our financial position or statement of income.
Non-GAAP Financial Measures
We use a non-GAAP financial measure as a key element in determining performance for purposes of incentive compensation under our annual STIP for our wireless and software operations. That non-GAAP financial measure is operating cash flow (“OCF”), defined as EBITDA less purchases of property and equipment. (EBITDA is defined as operating income plus depreciation, amortization, accretion and impairment, each determined in accordance with GAAP). Purchases of property and equipment are also determined in accordance with GAAP. For purposes of STIP performance, OCF was as follows for the periods stated: (See Note 17 for breakdown between our wireless and software operations.)
|
|
For the Year Ended December 31,
|
||||||||||
|
|
2013
|
2012
|
2011
|
||||||||
|
|
(Dollars in thousands)
|
||||||||||
|
Operating income
|
$
|
45,494
|
|
$
|
45,728
|
|
$
|
51,829
|
|
||
|
Plus: Depreciation, amortization, accretion and impairment
|
15,167
|
|
21,614
|
|
19,334
|
|
|||||
|
EBITDA (as defined by the Company)
|
60,661
|
|
67,342
|
|
71,163
|
|
|||||
|
Less: Purchases of property and equipment
|
(10,408
|
)
|
(9,989
|
)
|
(7,952
|
)
|
|||||
|
OCF (as defined by the Company)
|
$
|
50,253
|
|
$
|
57,353
|
|
$
|
63,211
|
|
||
ITEM 7A.
QUANTITATIVE AND QUALITATIVE DISCLOSURES ABOUT MARKET RISK
Interest Rate Risk
On April 6, 2012, we repaid the remaining $3.3 million that was outstanding under the Amended Credit Agreement. As of December 31, 2013, we had no outstanding borrowings and the Amended Credit Agreement remains in effect with approximately $40.0 million of available debt capacity. We will be exposed to changes in interest rates should we undertake new borrowings under the Amended Credit Agreement (see Note 5 for further discussion on our long-term debt). The floating interest rate debt exposes us to interest rate risk, with the primary interest rate exposure resulting from changes in LIBOR.
The definitive extent of the interest rate risk is not quantifiable or predictable because of the variability of future interest rates and business financing requirements. We do not customarily use derivative instruments to manage our interest rate risk profile.
Foreign Currency Exchange Rate Risk
We conduct a limited amount of business outside the United States. Virtually all transactions are currently billed and denominated in United States dollars and, consequently, we do not have any material exposure to the risk of foreign currency exchange rate fluctuations.
ITEM 8.
FINANCIAL STATEMENTS AND SUPPLEMENTARY DATA
The consolidated financial statements and schedules listed in Item 15(1) and (2) are included in this Report beginning on Page F-1.
ITEM 9.
CHANGES IN AND DISAGREEMENTS WITH ACCOUNTANTS ON ACCOUNTING AND FINANCIAL DISCLOSURE
There are no reportable events.
ITEM 9A.
CONTROLS AND PROCEDURES
Evaluation of Disclosure Controls and Procedures
45
Our management carried out an evaluation, as required by Rule 13a-15(b) of the Securities Exchange Act of 1934, as amended (the “Exchange Act”), with the participation of our principal executive officer and our principal financial officer, of the effectiveness of our disclosure controls and procedures, as of the end of our last fiscal year. Disclosure controls and procedures are defined under Rule 13a-15(e) under the Exchange Act as controls and other procedures of an issuer that are designed to ensure that the information required to be disclosed by the issuer in the reports that it files or submits under the Exchange Act (i) is recorded, processed, summarized and reported within the time periods specified in SEC rules and forms, and (ii) is accumulated and communicated to the issuer’s management, including its principal executive officer and principal financial officer, or persons performing similar functions, as appropriate to allow timely decisions regarding required disclosure. Based upon this evaluation, our principal executive officer and our principal financial officer have concluded that our disclosure controls and procedures were effective as of December 31, 2013.
Management’s Report on Internal Control Over Financial Reporting
Our management is responsible for establishing and maintaining adequate internal control over financial reporting, as defined in the Exchange Act Rule 13a-15(f) and 15d-15(f). Management conducted an evaluation of the effectiveness of our internal control over financial reporting based on the 1992
Internal Control — Integrated Framework
issued by the Committee of Sponsoring Organizations of the Treadway Commission (“COSO”).
Such internal controls include those policies and procedures that:
|
•
|
pertain to the maintenance of records that in reasonable detail accurately and fairly reflect the transactions and dispositions of the assets of the Company;
|
|
•
|
provide reasonable assurance that transactions are recorded as necessary to permit preparation of financial statements in accordance with GAAP, and that receipts and expenditures are being made only in accordance with authorizations of management and members of the Board of Directors of the Company; and
|
|
•
|
provide reasonable assurance regarding prevention or timely detection of unauthorized acquisition, use or disposition of our assets that could have a material effect on the financial statements.
|
Because of its inherent limitations, internal control over financial reporting may not prevent or detect misstatements. Projections of any evaluation of effectiveness to future periods are subject to the risk that controls may become inadequate because of changes in conditions, or that the degree of compliance with the policies or procedures may deteriorate.
Based on our evaluation under the 1992
Internal Control — Integrated Framework
, our management concluded that our internal control over financial reporting was effective as of December 31, 2013.
The effectiveness of our internal control over financial reporting as of December 31, 2013 has been audited by Grant Thornton LLP, an independent registered public accounting firm, as stated in their report which appears in this 2013 Annual Report on Form 10-K.
Management’s Remediation Initiatives and Changes in Internal Control Over Financial Reporting
As previously disclosed in our Annual Report on Form 10-K for the fiscal year ended December 31, 2012, which was filed with the SEC on April 15, 2013, we concluded that, as of December 31, 2012, a material weakness in our internal control over financial reporting existed, as we did not adequately design controls over the following revenue recognition processes:
|
•
|
Controls were not adequately designed to provide sufficient evidence to support the conclusion that software was installed and functional at the customer site and all service obligations were satisfied under such arrangements in order to recognize revenue. Sufficient documentation was not available to support the timing for completion of the services element.
|
|
•
|
Controls were not adequately designed to ensure proper review over processing of sales orders to ensure that they were accounted for in accordance with ASC 985-605 "Software Revenue Recognition" and ASC 605-25 "Revenue Recognition - Multiple Element Arrangements" when such transactions also include non-software deliverables. To the extent this review was performed, sufficient documentation was not retained as evidence of review.
|
In the fourth quarter of 2013, we completed our remediation activities, including the testing of the operating effectiveness of our changes to our revenue recognition controls. As a result, as of December 31, 2013, we concluded that we have remediated the previously reported material weaknesses in our internal control over financial reporting.
Our management has discussed the material weakness described above with our Audit Committee and independent registered public accounting firm. During 2013 we implemented the following changes in our internal control over financial reporting to address the previously reported material weakness and to enhance our overall financial control environment:
46
|
•
|
Staffing: We have made several organizational changes to enhance the skills and capabilities of our organization, including a new Senior Director of Revenue and Reporting, Vice President (“VP”) of Services and Senior Director of Sales Operations in our software operations. The Senior Director of Revenue and Reporting has extensive experience in revenue recognition with an emphasis in the software industry and the VP of Services and Senior Director of Sales Operations have significant experience in the software industry to enhance the processes and implement tighter controls over the services and sales organizations. We have hired additional revenue recognition staff with extensive software revenue recognition experience to review contracts and to work with the sales and services organizations.
|
|
•
|
Revenue Recognition Process: We have established processes and controls to review both license and services arrangements in a more comprehensive manner to ensure proper accounting treatment for multiple element software arrangements is in accordance with GAAP. Specifically, one key control implemented during 2013 was the review and approval of completed projects. This control ensures that the VP of Services performs a review of all projects classified as "complete" to ensure the project scope has been fully delivered. This review includes verification that the hours charged and services performed are consistent with the scope of the project. Once approved, the accounting department verifies all other requirements for revenue recognition have been met and are properly evidenced.
|
|
•
|
Training: We have expanded our revenue recognition training program in 2013 with training for both our sales and services organizations. This training includes revenue recognition principles and application of those principles to our software operations. The services organization has been trained to better identify the point at which professional services have been completed. The sales organization has been trained on the implications of contract changes to revenue recognition.
|
In addition to the remediation activities above, we have developed standardized global contracts to streamline the sales and contracting process which will positively impact our revenue recognition review processes.
Changes in Internal Control Over Financial Reporting
Except as noted above, there were no changes made in the Company’s internal control over financial reporting during the three months ended December 31, 2013 that have materially affected, or are reasonably likely to materially affect, the Company’s internal controls over financial reporting
.
ITEM 9B.
OTHER INFORMATION
None.
47
Certain information called for by Items 10 through 14 is incorporated by reference from USA Mobility’s definitive Proxy Statement for our 2014 Annual Meeting of Stockholders, which will be filed with the SEC no later than April 30, 2014.
ITEM 10.
DIRECTORS, EXECUTIVE OFFICERS AND CORPORATE GOVERNANCE
The following information required by this item is incorporated by reference from USA Mobility’s definitive Proxy Statement for our 2014 Annual Meeting of Stockholders:
|
•
|
Information regarding directors is set forth under the caption “Election of Directors”;
|
|
•
|
Information regarding executive officers is set forth under the caption “Executive Officers”;
|
|
•
|
Information regarding our audit committee and designated “audit committee financial expert” is set forth under the caption “The Board of Directors and Committees”; and
|
|
•
|
Information regarding compliance with Section 16(a) of the Exchange Act is set forth under the caption “Section 16(a) Beneficial Ownership Reporting Compliance”.
|
We have adopted a code of ethics that applies to all of our employees including the President and Chief Executive Officer, Chief Financial Officer, and Controller/Chief Accounting Officer. This code of ethics may be accessed at http://www.usamobility.com/. During the period covered by this report we did not request a waiver of our code of ethics and did not grant any such waivers.
ITEM 11.
EXECUTIVE COMPENSATION
The information required by this item is incorporated by reference from the section of USA Mobility’s definitive Proxy Statement for our 2014 Annual Meeting of Stockholders entitled “Compensation Discussion and Analysis”.
ITEM 12.
SECURITY OWNERSHIP OF CERTAIN BENEFICIAL OWNERS AND MANAGEMENT AND RELATED
STOCKHOLDER MATTERS
The information required by this item is incorporated by reference from the section of USA Mobility’s definitive Proxy Statement for our 2014 Annual Meeting of Stockholders entitled “Security Ownership of Certain Beneficial Owners and Management and Related Stockholder Matters”.
ITEM 13.
CERTAIN RELATIONSHIPS AND RELATED TRANSACTIONS, AND DIRECTOR INDEPENDENCE
The information required by this item with respect to certain relationships and related transactions is incorporated by reference from the section of USA Mobility’s definitive Proxy Statement for our 2014 Annual Meeting of Stockholders entitled “Certain Relationships and Related Transactions”. The information required by this item with respect to director independence is incorporated by reference from the section of USA Mobility’s definitive Proxy Statement for our 2014 Annual Meeting of Stockholders entitled “The Board of Directors and Committees”.
ITEM 14
. PRINCIPAL ACCOUNTING FEES AND SERVICES
The information required by this item is incorporated by reference from the section of USA Mobility’s definitive Proxy Statement for our 2014 Annual Meeting of Stockholders entitled “Fees and Services”.
48
|
ITEM 15.
|
EXHIBITS AND FINANCIAL STATEMENT SCHEDULES
|
The following documents are filed as part of this Annual Report on Form 10-K:
|
(1)
|
Consolidated Financial Statements
|
Reports of Independent Registered Public Accounting Firm
Consolidated Balance Sheets as of December 31, 2013 and 2012
Consolidated Statements of Income for the Years Ended December 31, 2013, 2012 and 2011
Consolidated Statements of Stockholders’ Equity for the Years Ended December 31, 2013, 2012 and 2011
Consolidated Statements of Cash Flows for the Years Ended December 31, 2013, 2012 and 2011
Notes to Consolidated Financial Statements
|
(2)
|
Supplemental Schedules
|
Schedule II — Valuation and Qualifying Accounts for the Years Ended December 31, 2013, 2012 and 2011
|
(3)
|
Exhibits
|
The exhibits listed in the accompanying index to exhibits are filed as part of this Annual Report on Form 10-K.
49
SIGNATURES
Pursuant to the requirements of Section 13 or 15(d) of the Securities Exchange Act of 1934, the registrant has duly caused this report to be signed on our behalf by the undersigned, thereunto duly authorized.
|
USA MOBILITY, INC.
|
|
|
By:
|
/s/ Vincent D. Kelly
|
|
Vincent D. Kelly
|
|
|
President and Chief Executive Officer
|
|
|
March 11, 2014
|
|
Pursuant to the requirements of the Securities Exchange Act of 1934, this report has been signed below by the following persons on behalf of the registrant and in the capacities and on the dates indicated.
|
Signature
|
|
Title
|
|
Date
|
|
/s/ Vincent D. Kelly
|
|
Director, President and Chief Executive Officer (principal executive officer)
|
|
March 11, 2014
|
|
Vincent D. Kelly
|
||||
|
/s/ Shawn E. Endsley
|
|
Chief Financial Officer (principal financial officer)
|
|
March 11, 2014
|
|
Shawn E. Endsley
|
||||
|
/s/ MyLe N. Chang
|
|
Chief Accounting Officer and Controller (principal accounting officer)
|
|
March 11, 2014
|
|
MyLe N. Chang
|
||||
|
/s/ Royce Yudkoff
|
|
Chairman of the Board
|
|
March 11, 2014
|
|
Royce Yudkoff
|
||||
|
/s/ N. Blair Butterfield
|
|
Director
|
|
March 11, 2014
|
|
N. Blair Butterfield
|
||||
|
/s/ Nicholas A. Gallopo
|
|
Director
|
|
March 11, 2014
|
|
Nicholas A. Gallopo
|
||||
|
/s/ Brian O’Reilly
|
|
Director
|
|
March 11, 2014
|
|
Brian O’Reilly
|
||||
|
/s/ Matthew Oristano
|
|
Director
|
|
March 11, 2014
|
|
Matthew Oristano
|
||||
|
/s/ Samme L. Thompson
|
|
Director
|
|
March 11, 2014
|
|
Samme L. Thompson
|
||||
50
INDEX TO CONSOLIDATED FINANCIAL STATEMENTS
|
|
Page
|
|
F-2
|
|
|
F-4
|
|
|
F-5
|
|
|
F-6
|
|
|
F-7
|
|
|
F-8
|
|
|
F-33
|
|
F-1
REPORT OF INDEPENDENT REGISTERED PUBLIC ACCOUNTING FIRM
Board of Directors and Stockholders
USA Mobility, Inc.
We have audited the accompanying consolidated balance sheets of USA Mobility, Inc. (a Delaware corporation) and subsidiaries (the "Company") as of December 31, 2013 and 2012, and the related consolidated statements of income, changes in stockholders’ equity, and cash flows for each of the three years in the period ended December 31, 2013. Our audits of the basic consolidated financial statements included the financial statement schedule listed in the index appearing under Item 15(a)(2). These financial statements and financial statement schedule are the responsibility of the Company’s management. Our responsibility is to express an opinion on these financial statements and financial statement schedule based on our audits.
We conducted our audits in accordance with the standards of the Public Company Accounting Oversight Board (United States). Those standards require that we plan and perform the audit to obtain reasonable assurance about whether the financial statements are free of material misstatement. An audit includes examining, on a test basis, evidence supporting the amounts and disclosures in the financial statements. An audit also includes assessing the accounting principles used and significant estimates made by management, as well as evaluating the overall financial statement presentation. We believe that our audits provide a reasonable basis for our opinion.
In our opinion, the consolidated financial statements referred to above present fairly, in all material respects, the financial position of USA Mobility, Inc. and subsidiaries as of December 31, 2013 and 2012, and the results of their operations and their cash flows for each of the three years in the period ended December 31, 2013 in conformity with accounting principles generally accepted in the United States of America. Also in our opinion, the related financial statement schedule, when considered in relation to the basic consolidated financial statements taken as a whole, presents fairly, in all material respects, the information set forth therein.
We also have audited, in accordance with the standards of the Public Company Accounting Oversight Board (United States), USA Mobility, Inc. and subsidiaries’ internal control over financial reporting as of December 31, 2013, based on criteria established in 1992
Internal Control — Integrated Framework
issued by the Committee of Sponsoring Organizations of the Treadway Commission (COSO) and our report dated March 11, 2014 expressed an unqualified opinion.
|
/s/ GRANT THORNTON LLP
|
|
McLean, Virginia
|
|
March 11, 2014
|
F-2
REPORT OF INDEPENDENT REGISTERED PUBLIC ACCOUNTING FIRM
Board of Directors and Stockholders
USA Mobility, Inc.
We have audited the internal control over financial reporting of USA Mobility, Inc. (a Delaware corporation) and subsidiaries (the “Company”) as of December 31, 2013, based on criteria established in 1992
Internal Control—Integrated Framework
issued by the Committee of Sponsoring Organizations of the Treadway Commission (COSO). The Company’s management is responsible for maintaining effective internal control over financial reporting and for its assessment of the effectiveness of internal control over financial reporting, included in the accompanying Management’s Report on Internal Control Over Financial Reporting. Our responsibility is to express an opinion on the Company’s internal control over financial reporting based on our audit.
We conducted our audit in accordance with the standards of the Public Company Accounting Oversight Board (United States). Those standards require that we plan and perform the audit to obtain reasonable assurance about whether effective internal control over financial reporting was maintained in all material respects. Our audit included obtaining an understanding of internal control over financial reporting, assessing the risk that a material weakness exists, testing and evaluating the design and operating effectiveness of internal control based on the assessed risk, and performing such other procedures as we considered necessary in the circumstances. We believe that our audit provides a reasonable basis for our opinion.
A company’s internal control over financial reporting is a process designed to provide reasonable assurance regarding the reliability of financial reporting and the preparation of financial statements for external purposes in accordance with generally accepted accounting principles. A company’s internal control over financial reporting includes those policies and procedures that (1) pertain to the maintenance of records that, in reasonable detail, accurately and fairly reflect the transactions and dispositions of the assets of the company; (2) provide reasonable assurance that transactions are recorded as necessary to permit preparation of financial statements in accordance with generally accepted accounting principles, and that receipts and expenditures of the company are being made only in accordance with authorizations of management and directors of the company; and (3) provide reasonable assurance regarding prevention or timely detection of unauthorized acquisition, use, or disposition of the company’s assets that could have a material effect on the financial statements.
Because of its inherent limitations, internal control over financial reporting may not prevent or detect misstatements. Also, projections of any evaluation of effectiveness to future periods are subject to the risk that controls may become inadequate because of changes in conditions, or that the degree of compliance with the policies or procedures may deteriorate.
In our opinion, the Company has maintained effective internal control over financial reporting as of December 31, 2013, based on criteria established in 1992
Internal Control — Integrated Framework
issued by COSO.
We also have audited, in accordance with the standards of the Public Company Accounting Oversight Board (United States), the consolidated financial statements of the Company as of and for the year ended December 31, 2013, and our report dated March 11, 2014 expressed an unqualified opinion on those consolidated financial statements.
|
/s/ GRANT THORNTON LLP
|
|
McLean, Virginia
|
|
March 11, 2014
|
F-3
USA MOBILITY, INC.
|
|
December 31,
|
||||||
|
|
2013
|
2012
|
|||||
|
|
(Dollars in thousands except
share amounts) |
||||||
|
ASSETS
|
|||||||
|
Current assets:
|
|||||||
|
Cash and cash equivalents
|
$
|
89,075
|
|
$
|
61,046
|
|
|
|
Accounts receivable, less allowances of $2,221 and $2,052, respectively
|
18,084
|
|
21,580
|
|
|||
|
Tax receivables
|
158
|
|
429
|
|
|||
|
Prepaid expenses and other
|
7,241
|
|
5,407
|
|
|||
|
Inventory
|
2,221
|
|
3,257
|
|
|||
|
Escrow receivables
|
—
|
|
275
|
|
|||
|
Deferred income tax assets, less valuation allowance of $15,176 and $9,122, respectively
|
3,389
|
|
3,915
|
|
|||
|
Total current assets
|
120,168
|
|
95,909
|
|
|||
|
Property and equipment, at cost:
|
|||||||
|
Land, buildings and improvements
|
3,226
|
|
3,153
|
|
|||
|
Paging and computer equipment
|
120,850
|
|
121,002
|
|
|||
|
Furniture, fixtures and vehicles
|
4,143
|
|
3,681
|
|
|||
|
|
128,219
|
|
127,836
|
|
|||
|
Less accumulated depreciation and amortization
|
107,097
|
|
107,027
|
|
|||
|
Property and equipment, net
|
21,122
|
|
20,809
|
|
|||
|
Goodwill
|
133,031
|
|
133,031
|
|
|||
|
Other intangibles, net
|
25,368
|
|
30,333
|
|
|||
|
Deferred income tax assets, less valuation allowance of $104,101 and $109,601, respectively
|
25,494
|
|
41,239
|
|
|||
|
Deferred financing costs, net
|
456
|
|
714
|
|
|||
|
Other assets
|
1,259
|
|
592
|
|
|||
|
TOTAL ASSETS
|
$
|
326,898
|
|
$
|
322,627
|
|
|
|
LIABILITIES AND STOCKHOLDERS’ EQUITY
|
|||||||
|
Current liabilities:
|
|||||||
|
Accounts payable
|
$
|
1,726
|
|
$
|
2,205
|
|
|
|
Accrued compensation and benefits
|
12,445
|
|
15,213
|
|
|||
|
Accrued network cost
|
1,169
|
|
1,388
|
|
|||
|
Accrued taxes
|
3,959
|
|
4,171
|
|
|||
|
Accrued severance and restructuring
|
1,474
|
|
2,593
|
|
|||
|
Accrued other
|
3,031
|
|
4,895
|
|
|||
|
Consideration payable
|
—
|
|
275
|
|
|||
|
Customer deposits
|
5,397
|
|
2,090
|
|
|||
|
Deferred revenue
|
17,626
|
|
27,896
|
|
|||
|
Total current liabilities
|
46,827
|
|
60,726
|
|
|||
|
Long-term debt
|
—
|
|
—
|
|
|||
|
Deferred revenue
|
862
|
|
693
|
|
|||
|
Other long-term liabilities
|
9,259
|
|
9,789
|
|
|||
|
TOTAL LIABILITIES
|
56,948
|
|
71,208
|
|
|||
|
COMMITMENTS AND CONTINGENCIES (NOTE 8)
|
|
|
|
|
|||
|
STOCKHOLDERS’ EQUITY:
|
|||||||
|
Preferred stock—$0.0001 par value; 25,000,000 shares authorized; no shares issued or outstanding
|
—
|
|
—
|
|
|||
|
Common stock—$0.0001 par value; 75,000,000 shares authorized; 21,652,341 shares issued and outstanding at December 31, 2013 and 21,442,623 shares issued and 21,701,353 shares outstanding at December 31, 2012
|
2
|
|
2
|
|
|||
|
Additional paid-in capital
|
127,264
|
|
125,212
|
|
|||
|
Retained earnings
|
142,684
|
|
126,205
|
|
|||
|
TOTAL STOCKHOLDERS’ EQUITY
|
269,950
|
|
251,419
|
|
|||
|
TOTAL LIABILITIES AND STOCKHOLDERS’ EQUITY
|
$
|
326,898
|
|
$
|
322,627
|
|
|
The accompanying notes are an integral part of these consolidated financial statements.
F-4
USA MOBILITY, INC.
CONSOLIDATED STATEMENTS OF INCOME
|
|
For the Year Ended December 31,
|
||||||||||
|
|
2013
|
2012
|
2011
|
||||||||
|
|
(Dollars in thousands, except share and per share amounts)
|
||||||||||
|
Revenues:
|
|||||||||||
|
Service, rental and maintenance, net of service credits
|
$
|
143,628
|
|
$
|
161,890
|
|
$
|
189,568
|
|
||
|
Software revenue and other, net of credits
|
66,124
|
|
57,806
|
|
44,125
|
|
|||||
|
Total revenues
|
209,752
|
|
219,696
|
|
233,693
|
|
|||||
|
Operating expenses:
|
|||||||||||
|
Cost of revenue
|
22,126
|
|
20,846
|
|
20,406
|
|
|||||
|
Service, rental and maintenance
|
50,639
|
|
55,425
|
|
62,347
|
|
|||||
|
Selling and marketing
|
26,084
|
|
23,645
|
|
22,389
|
|
|||||
|
General and administrative
|
49,259
|
|
50,680
|
|
56,095
|
|
|||||
|
Severance and restructuring
|
983
|
|
1,758
|
|
1,293
|
|
|||||
|
Depreciation, amortization and accretion
|
15,167
|
|
18,232
|
|
19,334
|
|
|||||
|
Impairment
|
—
|
|
3,382
|
|
—
|
|
|||||
|
Total operating expenses
|
164,258
|
|
173,968
|
|
181,864
|
|
|||||
|
Operating income
|
45,494
|
|
45,728
|
|
51,829
|
|
|||||
|
Interest expense, net
|
(260
|
)
|
(380
|
)
|
(2,254
|
)
|
|||||
|
Gain on disposals of narrowband PCS licenses
|
—
|
|
—
|
|
7,500
|
|
|||||
|
Other income, net
|
105
|
|
715
|
|
450
|
|
|||||
|
Income before income tax (expense) benefit
|
45,339
|
|
46,063
|
|
57,525
|
|
|||||
|
Income tax (expense) benefit
|
(17,809
|
)
|
(19,079
|
)
|
26,261
|
|
|||||
|
Net income
|
$
|
27,530
|
|
$
|
26,984
|
|
$
|
83,786
|
|
||
|
Basic net income per common share
|
$
|
1.27
|
|
$
|
1.23
|
|
$
|
3.79
|
|
||
|
Diluted net income per common share
|
$
|
1.25
|
|
$
|
1.20
|
|
$
|
3.72
|
|
||
|
Basic weighted average common shares outstanding
|
21,648,654
|
|
21,924,748
|
|
22,083,942
|
|
|||||
|
Diluted weighted average common shares outstanding
|
22,010,523
|
|
22,397,587
|
|
22,509,008
|
|
|||||
|
Cash distributions declared per common share
|
$
|
0.50
|
|
$
|
0.75
|
|
$
|
1.00
|
|
||
The accompanying notes are an integral part of these consolidated financial statements.
F-5
USA MOBILITY, INC.
CONSOLIDATED STATEMENTS OF STOCKHOLDERS’ EQUITY
|
Outstanding
Common Shares |
Common
Stock |
Additional
Paid-In Capital |
Retained
Earnings |
Total
Stockholders’ Equity |
||||||||||||||
|
|
(Dollars in thousands except share amounts)
|
|||||||||||||||||
|
Balance, January 1, 2011
|
22,066,805
|
|
$
|
2
|
|
$
|
129,696
|
|
$
|
54,692
|
|
$
|
184,390
|
|
||||
|
Net income
|
—
|
|
—
|
|
—
|
|
83,786
|
|
83,786
|
|
||||||||
|
Issuance of common stock under the Equity Plan
|
47,455
|
|
—
|
|
722
|
|
—
|
|
722
|
|
||||||||
|
Purchased and retired common stock and other
|
(20,027
|
)
|
—
|
|
(336
|
)
|
—
|
|
(336
|
)
|
||||||||
|
Amortization of stock based compensation
|
—
|
|
—
|
|
1,530
|
|
—
|
|
1,530
|
|
||||||||
|
Cash distributions declared
|
—
|
|
—
|
|
—
|
|
(22,505
|
)
|
(22,505
|
)
|
||||||||
|
Issuance of restricted common stock under the Equity Plan
|
14,000
|
|
—
|
|
—
|
|
—
|
|
—
|
|
||||||||
|
Balance, December 31, 2011
|
22,108,233
|
|
$
|
2
|
|
$
|
131,612
|
|
$
|
115,973
|
|
$
|
247,587
|
|
||||
|
Net income
|
—
|
|
—
|
|
—
|
|
26,984
|
|
26,984
|
|
||||||||
|
Issuance of common stock under the Equity Plan
|
51,319
|
|
—
|
|
724
|
|
—
|
|
724
|
|
||||||||
|
Issuance of common stock for vested restricted stock units under the Equity Plan
|
258,730
|
|
—
|
|
—
|
|
—
|
|
—
|
|
||||||||
|
Purchased and retired common stock and other
|
(21,657
|
)
|
—
|
|
(283
|
)
|
—
|
|
(283
|
)
|
||||||||
|
Amortization of stock based compensation
|
—
|
|
—
|
|
1,224
|
|
—
|
|
1,224
|
|
||||||||
|
Cash distributions declared
|
—
|
|
—
|
|
—
|
|
(16,752
|
)
|
(16,752
|
)
|
||||||||
|
Common stock repurchase program
|
(712,173
|
)
|
—
|
|
(8,065
|
)
|
—
|
|
(8,065
|
)
|
||||||||
|
Issuance of restricted common stock under the Equity Plan
|
16,901
|
|
—
|
|
—
|
|
—
|
|
—
|
|
||||||||
|
Balance, December 31, 2012
|
21,701,353
|
|
$
|
2
|
|
$
|
125,212
|
|
$
|
126,205
|
|
$
|
251,419
|
|
||||
|
Net income
|
—
|
|
—
|
|
—
|
|
27,530
|
|
27,530
|
|
||||||||
|
Issuance of common stock under the Equity Plan
|
41,702
|
|
—
|
|
539
|
|
—
|
|
539
|
|
||||||||
|
Purchased and retired common stock and other
|
(108,459
|
)
|
—
|
|
(1,532
|
)
|
—
|
|
(1,532
|
)
|
||||||||
|
Amortization of stock based compensation
|
—
|
|
—
|
|
3,045
|
|
—
|
|
3,045
|
|
||||||||
|
Cash distributions declared
|
—
|
|
—
|
|
—
|
|
(11,051
|
)
|
(11,051
|
)
|
||||||||
|
Issuance of restricted common stock under the Equity Plan
|
17,745
|
|
—
|
|
—
|
|
—
|
|
—
|
|
||||||||
|
Balance, December 31, 2013
|
21,652,341
|
|
$
|
2
|
|
$
|
127,264
|
|
$
|
142,684
|
|
$
|
269,950
|
|
||||
The accompanying notes are an integral part of these consolidated financial statements.
F-6
USA MOBILITY, INC.
|
|
For the Year Ended December 31,
|
||||||||||
|
|
2013
|
2012
|
2011
|
||||||||
|
|
(Dollars in thousands)
|
||||||||||
|
Cash flows from operating activities:
|
|||||||||||
|
Net income
|
$
|
27,530
|
|
$
|
26,984
|
|
$
|
83,786
|
|
||
|
Adjustments to reconcile net income to net cash provided by operating activities:
|
|||||||||||
|
Depreciation, amortization and accretion
|
15,167
|
|
18,232
|
|
19,334
|
|
|||||
|
Impairment
|
—
|
|
3,382
|
|
—
|
|
|||||
|
Amortization of deferred financing costs
|
258
|
|
259
|
|
608
|
|
|||||
|
Deferred income tax expense (benefit)
|
16,276
|
|
18,040
|
|
(28,044
|
)
|
|||||
|
Amortization of stock based compensation
|
3,045
|
|
1,224
|
|
1,530
|
|
|||||
|
Provisions for doubtful accounts, service credits and other
|
1,955
|
|
1,962
|
|
1,679
|
|
|||||
|
(Adjustments)/Settlement of non-cash transaction taxes
|
(474
|
)
|
(480
|
)
|
133
|
|
|||||
|
Loss/(Gain) on disposals of property and equipment
|
21
|
|
(160
|
)
|
109
|
|
|||||
|
Gain on disposals of narrowband PCS licenses
|
—
|
|
—
|
|
(7,500
|
)
|
|||||
|
Changes in assets and liabilities:
|
|||||||||||
|
Accounts receivable
|
1,542
|
|
(3,008
|
)
|
(417
|
)
|
|||||
|
Prepaid expenses, intangible assets and other assets
|
(1,215
|
)
|
(318
|
)
|
6,758
|
|
|||||
|
Accounts payable, accrued liabilities and other
|
(6,855
|
)
|
2,375
|
|
(7,427
|
)
|
|||||
|
Customer deposits and deferred revenue
|
(6,794
|
)
|
4,385
|
|
11,887
|
|
|||||
|
Net cash provided by operating activities
|
50,456
|
|
72,877
|
|
82,436
|
|
|||||
|
Cash flows from investing activities:
|
|||||||||||
|
Purchases of property and equipment
|
(10,408
|
)
|
(9,989
|
)
|
(7,952
|
)
|
|||||
|
Proceeds from disposals of property and equipment
|
293
|
|
330
|
|
55
|
|
|||||
|
Proceeds from disposals of narrowband PCS licenses
|
—
|
|
—
|
|
7,500
|
|
|||||
|
Acquisitions, net of cash acquired
|
—
|
|
(3,000
|
)
|
(134,250
|
)
|
|||||
|
Net cash used in investing activities
|
(10,115
|
)
|
(12,659
|
)
|
(134,647
|
)
|
|||||
|
Cash flows from financing activities:
|
|||||||||||
|
Issuance of debt
|
—
|
|
—
|
|
24,044
|
|
|||||
|
Repayment of debt
|
—
|
|
(28,250
|
)
|
(23,697
|
)
|
|||||
|
Deferred financing costs
|
—
|
|
—
|
|
(1,580
|
)
|
|||||
|
Cash distributions to stockholders
|
(12,312
|
)
|
(16,512
|
)
|
(22,121
|
)
|
|||||
|
Purchase of common stock
|
—
|
|
(8,065
|
)
|
—
|
|
|||||
|
Net cash used in financing activities
|
(12,312
|
)
|
(52,827
|
)
|
(23,354
|
)
|
|||||
|
Net increase (decrease) in cash and cash equivalents
|
28,029
|
|
7,391
|
|
(75,565
|
)
|
|||||
|
Cash and cash equivalents, beginning of period
|
61,046
|
|
53,655
|
|
129,220
|
|
|||||
|
Cash and cash equivalents, end of period
|
$
|
89,075
|
|
$
|
61,046
|
|
$
|
53,655
|
|
||
|
Supplemental disclosure:
|
|||||||||||
|
Interest paid
|
$
|
10
|
|
$
|
288
|
|
$
|
1,504
|
|
||
|
Income taxes paid
|
$
|
1,474
|
|
$
|
1,606
|
|
$
|
1,925
|
|
||
|
Non-cash financing activities
|
$
|
—
|
|
$
|
—
|
|
$
|
27,750
|
|
||
The accompanying notes are an integral part of these consolidated financial statements.
F-7
USA MOBILITY, INC.
NOTES TO CONSOLIDATED FINANCIAL STATEMENTS
1. Organization and Significant Accounting Policies
Business
— USA Mobility, Inc. and its subsidiaries (collectively, “USA Mobility” or the “Company”), through its indirect wholly owned subsidiary, USA Mobility Wireless, Inc. (“wireless operations”) is a leading provider of wireless messaging, mobile voice and data and unified communications solutions in the United States. We provide one-way and two-way messaging services. One-way messaging consists of numeric and alphanumeric messaging services. Numeric messaging services enable subscribers to receive messages that are composed entirely of numbers, such as a phone number, while alphanumeric messages may include numbers and letters which enable subscribers to receive text messages. Two-way messaging services enable subscribers to send and receive messages to and from other wireless messaging devices, including pagers, personal digital assistants and personal computers. We also offer voice mail, personalized greeting, message storage and retrieval and equipment loss and/or maintenance protection to both one-way and two-way messaging subscribers. These services are commonly referred to as wireless messaging and information services.
In addition, the Company, through its indirect wholly owned subsidiary, Amcom Software, Inc. (“Amcom” or “software operations”), provides mission critical unified communications solutions for contact centers, emergency management, mobile event notification and Smartphone messaging. The combined product offering is capable of addressing a customer’s mission critical communication needs. Amcom delivers software solutions, which enable seamless critical communications. Amcom’s unified communications suite (includes solutions for contact centers, emergency management, mobile event notification, and messaging) connects people across a changing complement of communication devices.
Effective January 1, 2014 Amcom Software, Inc. was merged into USA Mobility Wireless, Inc. The Company has and is undertaking the consolidation of wireless and software operation activities and functions.
Organization and Principles of Consolidation
— We are a holding company formed to effect the merger of Arch Wireless, Inc. and subsidiaries (“Arch”) and Metrocall Holdings, Inc. and subsidiaries (“Metrocall”), which occurred on November 16, 2004. Prior to the merger, we had conducted no operations other than those incidental to our formation. On March 3, 2011, we acquired Amcom.
The accompanying consolidated financial statements include our accounts and the accounts of our wholly owned direct and indirect subsidiaries. All significant intercompany accounts and transactions have been eliminated in consolidation. We have an investment in a Canadian company that is
10%
owned and is accounted for under the cost method of accounting.
Preparation of Financial Statements
— Our consolidated financial statements have been prepared in accordance with accounting principles generally accepted in the United States (“GAAP”) and the rules and regulations of the United States Securities and Exchange Commission (the “SEC”). Amounts shown on the consolidated statements of income within the operating expense categories of cost of revenue; service, rental and maintenance; selling and marketing; and general and administrative are recorded exclusive of severance and restructuring, depreciation, amortization and accretion and impairment. These items are shown separately on the consolidated statements of income within operating expenses. Foreign currency translation adjustments were immaterial and were not presented separately in our consolidated statements of stockholders’ equity and balance sheets, and consequently no statements of comprehensive income are presented.
All adjustments are of a normal recurring nature except for adjustments related to the acquisitions. The statements of income and the estimated fair value of the assets acquired and liabilities assumed have been included in our consolidated financial statements from the dates of the acquisitions.
Use of Estimates
— The preparation of these consolidated financial statements requires management to make estimates and judgments that affect the reported amounts of assets, liabilities, revenues, expenses and related disclosures. On an on-going basis, we evaluate estimates and assumptions, including but not limited to those related to the impairment of long-lived assets, intangible assets subject to amortization and goodwill, accounts receivable allowances, revenue recognition, depreciation expense, asset retirement obligations, severance and restructuring and income taxes. We base our estimates on historical experience and various other assumptions that are believed to be reasonable under the circumstances, the results of which form the basis for making judgments about the carrying values of assets and liabilities that are not readily apparent from other sources. Actual results may differ from these estimates under different assumptions or conditions.
Impairment
of Long-Lived Assets, Intangible Assets Subject to Amortization and Goodwill
— We are required to evaluate the carrying value of our long-lived assets, amortizable intangible assets and goodwill. Amortizable intangible assets include customer related intangibles, technology based intangibles, contract based intangibles and marketing intangibles that primarily resulted from our acquisition of Amcom in 2011 and IMCO in 2012. Such intangibles are amortized over periods ranging from
F-8
two
to
fifteen
years. We assess whether circumstances exist which suggest that the carrying value of long-lived assets may not be recoverable. When applicable, we assess the recoverability of the carrying value of our long-lived assets and certain amortizable intangible assets based on estimated undiscounted cash flows to be generated from such assets. In assessing the recoverability of these assets, we forecast estimated enterprise-level cash flows based on various operating assumptions such as revenue forecasted by product line and in-process research and development cost. If the forecast of undiscounted cash flows does not exceed the carrying value of the long-lived assets, we would record an impairment charge to the extent the carrying value exceeded the fair value of such assets.
Goodwill resulting from our acquisitions is not amortized but is evaluated for impairment at least annually, or when events or circumstances suggest a potential impairment has occurred. We have selected the fourth quarter to perform this annual impairment test. We will evaluate goodwill for impairment between annual tests if indicators of impairment exist. GAAP requires the comparison of the fair value of the reporting unit to the carrying amount to determine if there is potential impairment. For this determination, all of our goodwill has been assigned to our software operations, which is also deemed to be the reporting unit. The first step of the impairment test involves comparing the fair values of the reporting unit with its carrying values. If the reporting unit’s fair value is less than the carrying amount of the reporting unit, we perform the second step of the goodwill impairment test. The second step of the goodwill impairment test involves comparing the implied fair value of the affected reporting unit’s goodwill with the carrying value of that goodwill. The amount, by which the implied fair value is less than the carrying value of the goodwill, if any, is recognized as an impairment loss. The fair value of the reporting unit is estimated using a discounted cash flow methodology. This analysis requires significant judgments, including estimation of future cash flows, which is dependent on internal forecasts, estimation of the long-term rate of growth for our business, estimation of the useful life over which cash flows will occur, and determination of our weighted average cost of capital. We also consider the market value of our invested capital as a confirmatory measurement of fair value.
We did not record any impairment of long-lived assets, amortizable intangible assets and goodwill for the years ended December 31, 2013 and 2011. We recorded an impairment charge of
$3.4 million
to the contract-based intangible assets for our software operations for the year ended December 31, 2012. All other long-lived assets, amortizable intangible assets and goodwill were not deemed to be impaired for the year ended December 31, 2012.
Accounts Receivable Allowances
— Our two most significant allowance accounts are: an allowance for doubtful accounts and an allowance for service credits. Provisions for these allowances are recorded on a monthly basis and are included as a component of general and administrative expenses and a reduction of revenue, respectively.
Estimates are used in determining the allowance for doubtful accounts and are based on historical collection experience and current and forecasted trends. In determining these percentages, we review historical write-offs, including comparisons of write-offs to provisions for doubtful accounts and as a percentage of revenues. We compare the ratio of the allowance to gross receivables to historical levels, and monitor amounts collected and related statistics. The allowance for doubtful accounts for both our wireless operations and software operations was
$1.3 million
and
$1.2 million
(of which
$0.7 million
and
$0.6 million
related to software operations) at both December 31, 2013 and 2012, respectively. We write off receivables when they are deem uncollectible. While write-offs of customer accounts have historically been within our expectations and the provisions established, we cannot guarantee that future write-off experience will be consistent with historical experience, which could result in material differences in the allowance for doubtful accounts and related provisions.
The allowance for service credits and related provisions for wireless operations is based on historical credit percentages, current credit and aging trends and actual credit experience. We analyze our past credit experience over several time frames. Using this analysis along with current operational data including existing experience of credits issued and the time frames in which credits are issued, we establish an appropriate allowance for service credits. The allowance for service credits for wireless operations were
$0.3 million
and
$0.4 million
at December 31, 2013 and 2012, respectively. While credits issued have been within our expectations and the provisions established, we cannot guarantee that future credit experience will be consistent with historical experience, which could result in material differences in the allowance for service credits and related provisions.
Other allowance accounts for wireless operations totaled
$0.4 million
at both December 31, 2013 and 2012, respectively. The primary component of these allowance accounts reduces accounts receivable for lost and non-returned pagers to the expected realizable amounts. We base this allowance on historical payment trends. The other allowance for software operations totaled
$0.2 million
and
$0.1 million
at December 31, 2013 and 2012, respectively. This allowance reduces maintenance revenue based on historical actual payment trends and aging trends experience.
Revenue Recognition
— We recognize revenue when four basic criteria have been met: (1) persuasive evidence of an arrangement exists, (2) delivery has occurred or services rendered, (3) the fee is fixed or determinable and (4) collectability is reasonably assured. Amounts billed to customers but not meeting these revenue recognition criteria are deferred until all four criteria have been met.
F-9
Our wireless operations’ revenue consists primarily of service rental and maintenance fees charged to customers on a monthly, quarterly, or annual basis. Revenue also includes the sale of messaging devices directly to customers and other companies that resell our services. With respect to revenue recognition for multiple deliverables, we evaluated these revenue arrangements and determined that two separate units of accounting exist, paging service revenue and product sales. We recognize paging service revenue over the period the service is performed; revenue from product sales is recognized at the time of shipment or installation. We have a variety of billing arrangements with our customers resulting in deferred revenue from advance billings and accounts receivables for billing in-arrears arrangements.
For our software operations, we enter into contractual arrangements that include a fee that is fixed or determinable. This contractual arrangement has been agreed to by the customer and we review customer creditworthiness to assure collectability.
Our software operations’ revenue consists primarily of the sale of software (license fees), professional services (primarily installation and training), equipment (to be used in conjunction with the software) and maintenance support (post-contract support). The software is licensed to end users under an industry standard software license agreement. Our software products are considered to be “off-the-shelf software” as the software is marketed as a stock item that customers can use without customization.
For purposes of disclosure, revenue from the software operations consists of
two
primary components: (1) operations revenue consisting of software license revenue, professional services revenue and equipment sales, and (2) maintenance revenue.
We generally sell software licenses, professional services, equipment and maintenance in multiple-element arrangements. At inception of the arrangement, we allocate the arrangement consideration to the software deliverables (software licenses, professional services and maintenance) as a group and to the non-software deliverables (equipment and maintenance on equipment, when applicable) using the relative selling price method. When performing this allocation, the estimated selling price for each deliverable is based on vendor specific objective evidence of fair value (“VSOE”), third party evidence of fair value (“TPE”), or if VSOE and TPE are not available, the best estimated selling price (“BESP”) for selling the element on a stand-alone basis. We have determined that TPE is not a practical alternative due to differences in our service offerings compared to other parties and the availability of relevant third-party pricing information. The amount of revenue allocated to delivered items is limited by contingent revenue, if any.
Post contract support is allocated using VSOE as an input in the relative selling price allocation. For software licenses, professional services and equipment we have determined that neither VSOE nor TPE is available and as such, we have used BESP as an input in order to allocate our arrangement fees. We determine BESP by considering our overall pricing objectives and market conditions. Significant pricing practices take into consideration our discounting practices, the size and volume of our transactions, the customer demographic, the geographic area where our services are sold, our price lists, our go-to-market strategy, historical standalone sales and contract prices. The determination of BESP is made through consultation with and approval by management, taking into consideration the go-to-market strategy. As our go-to-market strategies evolve, we may modify our pricing practices in the future, which could result in changes in relative selling prices, including both VSOE and BESP.
In multiple-element arrangements, the arrangement consideration allocated to our non-software deliverables (equipment) is generally recognized upon delivery to the customer.
For our software deliverables, which include software licenses, professional services, and post contract support, we further allocate arrangement consideration using the residual method. As noted above, we have not established VSOE for our software licenses and professional services. However, we have established, and continue to maintain, VSOE for post contract support. As such, the residual amount relating to the revenue from software licenses and professional services is recognized as revenue over the period of delivery to the customer, if known, or when fully delivered to the customer. Maintenance revenue is deferred and recognized over the maintenance period, generally
one
year.
Long-Lived Assets
— Leased messaging devices sold or otherwise retired were removed from the accounts at their net book value using the weighted-average method. Property and equipment are reported at cost. Property and equipment is depreciated using the straight-line method over the following estimated useful lives:
F-10
|
|
Estimated Useful
Life
|
|
|
Asset Classification
|
(In Years)
|
|
|
Buildings
|
20
|
|
|
Leasehold improvements
|
3 or lease term
|
|
|
Messaging devices
|
1 - 2
|
|
|
Paging and computer equipment
|
1 - 5
|
|
|
Furniture and fixtures
|
3 - 5
|
|
|
Vehicles
|
3
|
|
We calculate depreciation on certain of our paging equipment assets using the group life method; accordingly, ordinary asset retirements and disposals are charged against accumulated depreciation with no gain or loss recognized.
Asset Retirement Obligations
— We recognized liabilities and corresponding assets for future obligations associated with the retirement of assets. We have paging equipment assets, principally transmitters, which are located on leased locations. The underlying leases generally require the removal of equipment at the end of the lease term; therefore, a future obligation exists (see Note 3).
Severance and Restructuring
— We continually evaluate our staffing levels to meet our business objectives for both the wireless and software operations and our strategy to reduce cost in our wireless operations in line with the declining revenue and subscriber base. Severance costs are reviewed periodically to determine whether a severance charge is required due to employers’ accounting for post-employment benefits. We are required to accrue post-employment benefits if certain specified criteria are met. Post-employment benefits include salary continuation, severance benefits and continuation of health insurance benefits.
From time to time, we will announce reorganization plans that may include eliminating positions. Each plan is reviewed to determine whether a restructuring charge is required to be recorded related to costs associated with exit or disposal activities. We are required to record an estimate of the fair value of any termination costs based on certain facts, circumstances and assumptions, including specific provisions included in the underlying reorganization plan.
Also from time to time, we cease to use certain facilities, such as office buildings and transmitter locations, including available capacity under certain agreements, prior to expiration of the underlying contractual agreements. Exit costs based on certain facts, circumstances and assumptions, including remaining minimum lease payments, potential sublease income and specific provisions included in the underlying contract or lease agreements are reviewed in each of these circumstances on a case-by-case basis to determine whether a restructuring charge is required to be recorded.
Subsequent to recording such accrued severance and restructuring liabilities, changes in market or other conditions may result in changes to assumptions upon which the original liabilities were recorded that could result in an adjustment to the liabilities and, depending on the circumstances, such adjustment could be material (see Note 14).
Income Taxes
— We file a consolidated U.S. Federal income tax return and income tax returns in state, local and foreign jurisdictions (principally Canada and Australia) as required. The provision for current income taxes is calculated and accrued on income and expenses expected to be included in current year U.S. and foreign income tax returns. The provision for current income taxes may also include interest, penalties and an estimated amount reflecting uncertain tax positions.
Deferred income tax assets and liabilities are computed based on temporary differences between the financial statement values and the tax basis of assets and liabilities including net operating loss and tax credit carryforwards at the enacted tax rates expected to apply to taxable income when taxes are actually paid or recovered. Changes in deferred income tax assets and liabilities are included as a component of deferred income tax expense. Deferred income tax assets represent amounts available to reduce future income taxes payable. We provide a valuation allowance when we consider it “more likely than not” (greater than a 50% probability) that a deferred income tax asset will not be fully recovered. Adjustments to the valuation allowance are a component of the deferred income tax expense.
Assets and liabilities are established for uncertain tax positions taken or positions expected to be taken in income tax returns when such positions fail to meet the “more likely than not” threshold based on the technical merits of the positions. Estimated interest and penalties related to uncertain tax positions are included as a component of income tax expense. We assess whether previously unrecognized tax benefits may be recognized when the tax position is (1) more likely than not of being sustained based on its technical merits, (2) effectively settled through examination, negotiation or litigation, or (3) settled through actual expiration of the relevant tax statutes. At December 31, 2013 and 2012, there were no uncertain tax positions.
F-11
Research and Product Development
— Development costs incurred in the research and development of new software products and enhancements to existing software products for external use are expensed as incurred until technological feasibility has been established. Costs incurred after technological feasibility is established and before the product is ready for general release would be capitalized. Costs eligible for capitalization were not material to the consolidated financial statements and were expensed as incurred to service, rental and maintenance expense.
Shipping and Handling Costs
— We incur shipping and handling costs to send and receive messaging devices to/from our wireless operations’ customers and shipping costs related to equipment sales in our software operations. These costs are expensed as incurred and included in general and administrative expenses for wireless operations and costs of revenue for software operations. Total shipping costs were
$0.6 million
,
$0.8 million
and
$1.0 million
for the years ended December 31, 2013, 2012 and 2011, respectively, for wireless operations and
$0.3 million
,
$0.4 million
and
$0.5 million
for the years ended December 31, 2013, 2012 and 2011, respectively, for software operations.
Advertising Expenses
— Advertising costs are charged to operations when incurred because they occur in the same period as the benefit is derived. These costs are included in selling and marketing expenses. We do not incur any direct response advertising costs. Advertising expenses were
$65,000
,
$32,000
and
$26,000
for the years ended December 31, 2013, 2012 and 2011, respectively, for wireless operations and
$1.0 million
,
$0.8 million
and
$0.3 million
for the years ended December 31, 2013, 2012 and 2011, respectively, for software operations.
Stock Based Compensation
— Compensation expense associated with common stock, restricted stock units (“RSUs”) and shares of restricted common stock (“restricted stock”) is recognized over the instruments’ vesting period based on the fair value of the related instruments.
Cash Equivalents
— Cash equivalents include short-term, interest-bearing instruments purchased with initial or remaining maturities of three months or less.
Sales and Use Taxes
— Sales and use taxes imposed on the ultimate consumer are excluded from revenue where we are required by law or regulation to act as collection agent for the taxing jurisdiction.
Fair Value of Financial Instruments
— Our financial instruments include our cash, letters of credit (“LOCs”), accounts receivable and accounts payable. The fair value of cash, accounts receivable and accounts payable are equal to their carrying values at December 31, 2013 and 2012.
Earnings Per Common Share
— The calculation of earnings per common share is based on the weighted-average number of common shares outstanding during the applicable period. The calculation for diluted earnings per common share recognizes the effect of all potential dilutive common shares that were outstanding during the respective periods, unless the impact would be anti-dilutive (see Note 6).
Recent and New Accounting Pronouncements
— Accounting pronouncements issued or effective during the year ended December 31, 2013 are not applicable to us or are not anticipated to have a material effect on our financial position or statement of income.
2. Acquisition
On May 2, 2012, we acquired certain assets and technology from IMCO for a total estimated consideration of
$3.7 million
. During 2012, we increased goodwill by
$2.1 million
and intangible assets by
$1.4 million
for this acquisition. The intangible assets are being amortized over a
four
year period. During the fourth quarter of 2012, we reassessed the projected royalty payments to IMCO and reduced the expected future liabilities by
$0.2 million
based on recent data. During the fourth quarter of 2013, we reassessed the projected royalty payments to IMCO and further reduced the expected future liabilities by
$0.2 million
. During the year ended December 31, 2013, we paid
$18,000
in royalties to IMCO.
3. Long-Lived Assets
The total depreciation, amortization and accretion expenses related to property and equipment, amortizable intangible assets, and asset retirement obligations for the years ended December 31, 2013, 2012, and 2011 were
$9.6 million
,
$11.2 million
and
$14.0 million
, respectively, for wireless operations; and
$5.6 million
,
$7.0 million
and
$5.3 million
for software operations for the years ended December 31, 2013, 2012 and 2011, respectively. The consolidated balances consisted of the following for the periods stated:
F-12
|
|
For the Year Ended December 31,
|
||||||||||
|
|
2013
|
2012
|
2011
|
||||||||
|
|
(Dollars in thousands)
|
||||||||||
|
Depreciation
|
$
|
9,664
|
|
$
|
11,054
|
|
$
|
13,253
|
|
||
|
Amortization
|
4,965
|
|
6,411
|
|
5,274
|
|
|||||
|
Accretion
(1)
|
538
|
|
767
|
|
807
|
|
|||||
|
Total depreciation, amortization and accretion
|
$
|
15,167
|
|
$
|
18,232
|
|
$
|
19,334
|
|
||
|
(1)
|
Accretion expense included
$(29,000)
in 2013 and
$29,000
in 2012 in software operations related to the IMCO acquisition.
|
Property and Equipment
— A component of depreciation expense for wireless operations relates to the depreciation of certain of our paging equipment assets. The primary component of these assets are transmitters. For the years ended December 31, 2013, 2012 and 2011,
$1.1 million
,
$1.9 million
, and
$3.3 million
, respectively, of total wireless operations’ depreciation expense related to these assets. The components of depreciation expense for software operations relate primarily to computer equipment and leasehold improvements which were
$0.8 million
,
$0.8 million
and
$0.3 million
, respectively, for the years ended December 31, 2013, 2012 and 2011.
Transmitter assets are grouped into tranches based on our transmitter decommissioning forecast and are depreciated using the group life method on a straight-line basis. Depreciation expense is determined by the expected useful life of each tranche of the underlying transmitter assets. The expected useful life is based on our forecasted usage of those assets and their retirement over time and aligns the useful lives of these transmitter assets with their planned removal from service. This rational and systematic method matches the underlying usage of these assets to the underlying revenue that is generated from these assets.
Depreciation expense for these assets is subject to change based upon revisions in the timing of transmitter deconstruction resulting from our long-range planning and network rationalization process. During the fourth quarter of 2013, we completed a review of the estimated useful life of our transmitter assets (that are part of paging and computer equipment.) This review was based on the results of our long-range planning and network rationalization process and indicated that the expected useful life of the last tranche of the transmitter assets was no longer appropriate. As a result of that review, the expected useful life of the final tranche of transmitter assets was extended from 2017 to 2018. This change has resulted in a revision of the expected future depreciation expense for the transmitter assets beginning in the fourth quarter of 2013. We believe these estimates are reasonable at the present time, but we can give no assurance that changes in technology, customer usage patterns, our financial condition, the economy or other factors would not result in changes to our transmitter decommissioning plans. Any further variations from our estimates could result in a change in the expected useful lives of the underlying transmitter assets and operating results could differ in the future by any difference in depreciation expense.
The extension of the depreciable life qualifies as a change in accounting estimate. In the fourth quarter of 2013, depreciation expense was approximately
$0.1 million
less than it would have been had the depreciable lives not been extended.
Asset Retirement Obligations
— Asset retirement costs are reflected in paging equipment assets with depreciation expense recognized over the estimated lives, which range between
one and five years
. The asset retirement costs were
$3.8 million
and
$1.7 million
at December 31, 2013 and 2012, respectively. The net increase in asset retirement cost in 2013 increased paging equipment assets which are being depreciated over the related estimated lives of
12 to 60 months
.
Depreciation, amortization and accretion for the years ended December 31, 2013 and 2012 included benefits of
$1.0 million
and
$1.1 million
, respectively, related to depreciation of these asset retirement costs. The benefits in depreciation expense for these years are due to net reductions to the asset retirement costs as a result of changes in the timing and costs of the transmitter deconstructions.
The asset retirement costs and the corresponding liabilities that have been recorded to date generally relate to either current plans to consolidate networks or to the removal of assets at a future terminal date.
The components of the changes in the asset retirement obligation liabilities for the periods stated were as follows:
F-13
|
Short-Term
Portion
|
Long-Term
Portion
|
Total
|
|||||||||
|
|
(Dollars in thousands)
|
||||||||||
|
Balance at January 1, 2012
|
$
|
794
|
|
$
|
7,557
|
|
$
|
8,351
|
|
||
|
Accretion
|
62
|
|
676
|
|
738
|
|
|||||
|
Amounts paid
|
(767
|
)
|
—
|
|
(767
|
)
|
|||||
|
Reductions recorded
|
(35
|
)
|
(351
|
)
|
(386
|
)
|
|||||
|
Reclassifications
|
325
|
|
(325
|
)
|
—
|
|
|||||
|
Balance at December 31, 2012
|
$
|
379
|
|
$
|
7,557
|
|
$
|
7,936
|
|
||
|
Accretion
|
(112
|
)
|
679
|
|
567
|
|
|||||
|
Amounts paid
|
(415
|
)
|
—
|
|
(415
|
)
|
|||||
|
Reductions recorded
|
(445
|
)
|
314
|
|
(131
|
)
|
|||||
|
Reclassifications
|
951
|
|
(951
|
)
|
—
|
|
|||||
|
Balance at December 31, 2013
|
$
|
358
|
|
$
|
7,599
|
|
$
|
7,957
|
|
||
At both December 31, 2013 and 2012, accrued other liabilities included
$0.4 million
of asset retirement liabilities related to our efforts to reduce the number of transmitters in operation; other long-term liabilities included
$7.6 million
, related primarily to an estimate of the costs of deconstructing assets through the terminal date. The primary variables associated with these estimates are the number of transmitters and related equipment to be removed, the timing of removal, and a fair value estimate of the outside contractor fees to remove each asset. The fair value estimate of contractor fees to remove each asset is assumed to escalate by
4%
each year through the terminal date.
The long-term cost associated with the estimated removal costs and timing refinements due to ongoing network rationalization activities will accrete to a total liability of
$9.6 million
. The accretion was recorded on the interest method utilizing the following discount rates for the specified periods:
|
Period
|
Discount Rate
|
|
|
2013 – December 31 Additions
(1)
and Incremental Estimates
|
10.48
|
%
|
|
2013 – January 1 through September 30 – Additions
(1)
|
10.60
|
%
|
|
2012 – December 31 Additions
(1)
and Incremental Estimates
|
10.60
|
%
|
|
2012 – September 30 – Incremental Estimates
(2)
|
12.14
|
%
|
|
2012 – January 1 through September 30 – Additions
(1)
|
10.77
|
%
|
|
2011 – December 31 Additions
(1)
and Incremental Estimates
|
10.77
|
%
|
|
2011 – September 30 – Incremental Estimates
(2)
|
12.17
|
%
|
|
2011 – April 1 through September 30 – Additions
(1)
|
11.50
|
%
|
|
2011 – January 1 through March 31 – Additions
(1)
|
12.46
|
%
|
|
(1)
|
Transmitters moved to new sites resulting in additional liability.
|
|
(2)
|
Weighted average credit adjusted risk-free rate used to discount downward revision to estimated future cash flows.
|
The total estimated liability is based on the transmitter locations remaining after we have consolidated the number of networks we operate and assume the underlying leases continue to be renewed to that future date. Depreciation, amortization and accretion expense for the years ended December 31, 2013, 2012 and 2011 included
$0.6 million
,
$0.7 million
and
$0.8 million
, respectively, for accretion expense on the asset retirement obligation liabilities.
We believe these estimates are reasonable at the present time, but we can give no assurance that changes in technology, our financial condition, the economy or other factors would not result in higher or lower asset retirement obligations. Any variations from our estimates would generally result in a change in the assets and liabilities in equal amounts, and operating results would differ in the future by any difference in depreciation expense and accretion expense.
Amortizable Intangible Assets and Goodwill
— Other intangible assets for wireless operations consisted of a covenant to non-compete with a former executive which was amortized over a three year period. Other intangible assets for software operations were recorded at fair value on the date of acquisition and are being amortized over two to fifteen years. We recorded an impairment charge of
$3.4 million
to the contract-based intangible assets (non compete agreements) for our software operations for the year ended December 31, 2012 and
no
impairment of amortizable intangible assets was recorded for the same period in 2013 and 2011.
F-14
The gross carrying amount of other intangible assets for the wireless operations was
zero
and
$0.4 million
, respectively, and
$41.5 million
for software operations at both December 31, 2013 and 2012. The gross carrying amount of the intangible assets for the wireless operations (covenant to non-compete) was fully amortized and written off in 2013. The accumulated amortization for wireless operations was
$0.3 million
at December 31, 2012 and
$16.2 million
and
$11.3 million
, respectively, for software operations at December 31, 2013 and 2012.
The net consolidated balance of amortizable intangible assets consisted of the following at December 31, 2013 and 2012:
|
|
|
As of December 31,
|
|||||||||||||||||||||||
|
|
|
2013
|
2012
|
||||||||||||||||||||||
|
|
Useful Life
(In Years)
|
Gross Carrying
Amount
|
Accumulated
Amortization
|
Net Balance
|
Gross Carrying
Amount
|
Accumulated
Amortization
|
Net Balance
|
||||||||||||||||||
|
|
|
(Dollars in thousands)
|
|||||||||||||||||||||||
|
Customer relationships
|
10
|
$
|
25,002
|
|
$
|
(7,084
|
)
|
$
|
17,918
|
|
$
|
25,002
|
|
$
|
(4,584
|
)
|
$
|
20,418
|
|
||||||
|
Acquired technology
|
2 - 4
|
8,452
|
|
(5,865
|
)
|
2,587
|
|
8,452
|
|
(3,911
|
)
|
4,541
|
|
||||||||||||
|
Non-compete agreements
|
3 - 5
|
2,370
|
|
(2,132
|
)
|
238
|
|
2,800
|
|
(2,431
|
)
|
369
|
|
||||||||||||
|
Trademarks
|
15
|
5,702
|
|
(1,077
|
)
|
4,625
|
|
5,702
|
|
(697
|
)
|
5,005
|
|
||||||||||||
|
Total amortizable intangible assets
|
$
|
41,526
|
|
$
|
(16,158
|
)
|
$
|
25,368
|
|
$
|
41,956
|
|
$
|
(11,623
|
)
|
$
|
30,333
|
|
|||||||
Aggregate amortization expense for other intangible assets for the years ended December 31, 2013, 2012 and 2011 was
$5.0 million
,
$6.4 million
and
$5.3 million
, respectively.
Estimated amortization of intangible assets for future periods was as follows:
|
|
(Dollars in
thousands)
|
||
|
For the year ending December 31,
|
|||
|
2014
|
$
|
4,866
|
|
|
2015
|
3,588
|
|
|
|
2016
|
3,013
|
|
|
|
2017
|
2,880
|
|
|
|
2018
|
2,880
|
|
|
|
Thereafter
|
8,141
|
|
|
|
Total
|
$
|
25,368
|
|
Goodwill at both December 31, 2013 and 2012 was
$133.0 million
, which is all attributed to our software operations. Goodwill is not amortized but is evaluated for impairment at least annually, or when events or circumstances suggested a potential impairment had occurred. (See Note 1.)
We did not record any impairment of goodwill for the years ended December 31, 2013, 2012 or 2011.
4. Deferred Revenue
Deferred revenue at December 31, 2013 was
$17.6 million
for the current portion and
$0.9 million
for the non-current portion. The deferred revenue at December 31, 2012 was
$27.9 million
for the current portion and
$0.7 million
for the non-current portion. Deferred revenue primarily consisted of unearned maintenance, software license and professional services revenue. Unearned maintenance revenue represented a contractual liability to provide maintenance support over a defined period of time for which payment has generally been received. Unearned software license and professional services revenue represented a contractual liability to provide professional services more substantive than post contract support for which not all payments have been received. Customer deposits for installation represented a contractual liability to provide installation and training services for which payments have been received. At December 31, 2013 and 2012, we had received
$5.4 million
and
$2.1 million
, respectively, in customer deposits for future installation services. We will recognize revenue when the service or software is provided or otherwise meets our revenue recognition criteria.
F-15
On November 8, 2011, we executed the First Amendment to our Amended and Restated Credit Agreement (“Amended Credit Agreement”) with Wells Fargo Capital Finance, LLC (“Wells Fargo”). The Amended Credit Agreement increased the amount of the revolving credit facility to
$40.0 million
. The maturity date for the revolving credit facility is
September 3, 2015
. We may make a London Interbank Offered Rate (“LIBOR”) rate election for any amount of our debt for a period of
1, 2 or 3 months at a time
; however, we may not have more than
5
individual LIBOR rate loans in effect at any given time. We may only exercise the LIBOR rate election for an amount of at least
$1.0 million
.
Borrowings under this facility are secured by a lien on substantially all of our existing assets, interests in assets and proceeds owned or acquired by us.
As of December 31, 2013, we had
no
outstanding debt and the Amended Credit Agreement remains in effect with approximately
$40.0 million
of available borrowing capacity subject to maintaining a minimum liquidity threshold of
$25.0 million
and to reductions for an outstanding LOC (see Note 8). The
$25.0 million
liquidity threshold can be satisfied by maintaining cash on hand or borrowing capacity under the Amended Credit Agreement.
We are exposed to changes in interest rates should we have borrowings under the Amended Credit Agreement. The floating interest rate debt exposes us to interest rate risk, with the primary interest rate exposure resulting from changes in LIBOR. The definitive extent of the interest rate risk is not quantifiable or predictable because of the variability of future interest rates and business financing requirements. We do not customarily use derivative instruments to manage our interest rate risk profile.
We are subject to certain financial covenants on a quarterly basis under the terms of the Amended Credit Agreement. These financial covenants consist of a leverage ratio and a fixed charge coverage ratio. We are in compliance with all of the required financial covenants as of December 31, 2013.
We have also established control agreements with the financial institutions that maintain our cash and investment accounts. These agreements permit Wells Fargo to exercise control over our cash and investment accounts should we default under provisions of the Amended Credit Agreement. We are not in default under the Amended Credit Agreement and do not anticipate that Wells Fargo would need to exercise its rights under these control agreements during the term of the Amended Credit Agreement.
6. Stockholders’ Equity
General
Our authorized capital stock consists of
75 million
shares of common stock, par value
$0.0001
per share, and
25 million
shares of preferred stock, par value
$0.0001
per share.
At December 31, 2013 and 2012, we had
no
stock options outstanding.
At December 31, 2013 and 2012, there were
21,652,341
and
21,701,353
shares of common stock outstanding, respectively, and
no
shares of preferred stock outstanding.
Cash Dividends to Stockholders —
The following table details information on our cash dividends for each of the three years ended December 31, 2013. Cash dividends paid as disclosed in the statements of cash flows for the years ended December 31, 2013, 2012 and 2011 included previously declared cash dividends on vested RSUs issued to eligible employees under the 2009 Long-Term Incentive Plan ("LTIP") and on shares of vested restricted stock issued to non-executive members of our Board of Directors. Cash dividends on the RSUs and restricted stock have been accrued and are paid when the applicable vesting conditions are met. Accrued cash dividends on forfeited RSUs and restricted stock are also forfeited.
F-16
|
Year
|
Declaration Date
|
Record Date
|
Payment Date
|
Per Share
Amount
|
Total
Payment
(1)
|
|||||||||
|
|
|
|
|
|
(Dollars in
thousands)
|
|||||||||
|
2011
|
February 23
|
March 17
|
March 31
|
$
|
0.250
|
|
||||||||
|
May 4
|
May 20
|
June 24
|
0.250
|
|
||||||||||
|
July 27
|
August 19
|
September 9
|
0.250
|
|
||||||||||
|
October 26
|
November 18
|
December 9
|
0.250
|
|
||||||||||
|
Total
|
1.000
|
|
$
|
22,121
|
|
|||||||||
|
2012
|
February 22
|
March 16
|
March 30
|
0.250
|
|
|||||||||
|
May 3
|
May 18
|
June 24
|
0.250
|
|
||||||||||
|
July 30
|
August 17
|
September 9
|
0.125
|
|
(2)
|
|||||||||
|
November 1
|
November 16
|
December 7
|
0.125
|
|
||||||||||
|
Total
|
0.750
|
|
16,512
|
|
||||||||||
|
2013
|
March 4
|
March 15
|
March 29
|
0.125
|
|
|||||||||
|
April 26
|
1,513
|
|
(3)
|
|||||||||||
|
May 9
|
May 20
|
June 25
|
0.125
|
|
||||||||||
|
August 1
|
August 19
|
September 10
|
0.125
|
|
||||||||||
|
November 5
|
November 20
|
December 10
|
0.125
|
|
||||||||||
|
0.500
|
|
12,312
|
|
|||||||||||
|
Total
|
$
|
2.250
|
|
$
|
50,945
|
|
||||||||
|
(1)
|
The total payment reflects the cash dividends paid in relation to common stock, vested RSUs and vested restricted stock.
|
|
(2)
|
On July 30, 2012, our Board of Directors reset the quarterly cash dividends rate to
$0.125
per share of common stock from
$0.25
per share of common stock.
|
|
(3)
|
The payment reflects the accumulated cash dividends earned on vested RSUs associated with the 2009 LTIP.
|
On
March 5, 2014
, our Board of Directors declared a regular quarterly cash dividend of
$0.125
per share of common stock, with a record date of March 18, 2014, and a payment date of March 28, 2014. This cash dividend of approximately
$2.7 million
will be paid from available cash on hand.
Common Stock Repurchase Program
— On July 31, 2008, our Board of Directors approved a program to repurchase up to
$50.0 million
of our common stock in the open market during the twelve-month period commencing on or about August 5, 2008. As discussed below, this program has been extended at various times, most recently through December 31, 2014 with a repurchase authority of
$15.0 million
as of January 1, 2014.
Credit Suisse Securities (USA) LLC administers such purchases. We used available cash on hand and net cash provided by operating activities to fund the common stock repurchase program. This repurchase authority allows us, at management’s discretion, to selectively repurchase shares of our common stock from time to time in the open market depending upon market price and other factors.
For the year ended December 31, 2013, we did not purchase any shares of our common stock under the repurchase program. From the inception of the program in August 2008 through December 31, 2013, we have repurchased a total of
6,268,504
shares of our common stock for approximately
$59.8 million
(excluding commissions).
Repurchased shares of our common stock were accounted for as a reduction to common stock and additional paid-in-capital in the period in which the repurchase occurred. All repurchased shares of common stock are returned to the status of authorized, but unissued, shares of the Company.
Common stock purchased in 2013, 2012 and 2011 (including the purchase of common stock for tax withholdings) was as follows:
F-17
|
For the Three Months Ended
|
Total Number
of Shares
Purchased
|
Average Price
Paid Per
Share
(1)
|
Total Number of
Shares Purchased
as Part of
Publicly
Announced Plans
or Programs
|
Approximate
Dollar Value of
Shares That May
Yet Be Purchased
Under the Publicly
Announced Plans
or Programs
(2)
(Dollars in thousands)
|
|||||||||
|
2011
|
|||||||||||||
|
March 31,
|
20,027
|
|
(3)
|
$
|
15.21
|
|
—
|
|
$
|
16,135
|
|
||
|
June 30,
|
—
|
|
—
|
|
—
|
|
16,135
|
|
|||||
|
September 30,
|
—
|
|
—
|
|
—
|
|
16,135
|
|
|||||
|
December 31,
|
—
|
|
—
|
|
—
|
|
16,135
|
|
|||||
|
Total for 2011
|
20,027
|
|
$
|
15.21
|
|
—
|
|
||||||
|
2012
|
|||||||||||||
|
March 31,
|
21,657
|
|
(4)
|
$
|
14.10
|
|
—
|
|
16,135
|
|
|||
|
June 30,
|
—
|
|
—
|
|
—
|
|
16,135
|
|
|||||
|
September 30,
|
434,982
|
|
11.30
|
|
434,982
|
|
20,085
|
|
|||||
|
December 31,
|
277,191
|
|
11.26
|
|
277,191
|
|
16,964
|
|
|||||
|
Total for 2012
|
733,830
|
|
$
|
11.37
|
|
712,173
|
|
||||||
|
2013
|
|||||||||||||
|
March 31,
|
—
|
|
$
|
—
|
|
—
|
|
16,964
|
|
||||
|
June 30,
|
108,459
|
|
(5)
|
12.92
|
|
—
|
|
16,964
|
|
||||
|
September 30,
|
—
|
|
—
|
|
—
|
|
16,964
|
|
|||||
|
December 31,
|
—
|
|
—
|
|
—
|
|
16,964
|
|
|||||
|
Total for 2013
|
108,459
|
|
$
|
12.92
|
|
—
|
|
||||||
|
Total
|
862,316
|
|
$
|
11.65
|
|
712,173
|
|
||||||
|
(1)
|
Average price paid per share excludes commissions.
|
|
(2)
|
On July 31, 2008, our Board of Directors approved a program to repurchase up to
$50.0 million
of our common stock in the open market during the twelve month period commencing on or about August 5, 2008. Our Board of Directors approved a supplement effective March 3, 2009 which reset the repurchase authority to
$25.0 million
as of January 1, 2009 and extended the purchase period through December 31, 2009. On November 30, 2009, our Board of Directors approved a further extension of the purchase period from December 31, 2009 to March 31, 2010. On March 3, 2010, our Board of Directors approved a supplement to the program to repurchase our common stock in the open market effective March 3, 2010 which reset the repurchase authority to
$25.0 million
as of January 1, 2010 and extended the purchase period through December 31, 2010. On December 6, 2010, our Board of Directors approved another supplement effective January 3, 2011 which reset the repurchase authority to
$25.0 million
as of January 3, 2011 and extended the purchase period through December 31, 2011. During the first quarter of 2011, our Board of Directors temporarily suspended the program. On July 24, 2012, our Board of Directors approved an additional supplement to the common stock repurchase program effective August 1, 2012 which reset the repurchase authority to
$25.0 million
as of August 1, 2012 and extended the purchase period through December 31, 2013. On December 19, 2013, our Board of Directors approved a further extension of the purchase period from December 31, 2013 to December 31, 2014 and reset the repurchase authority to
$15.0 million
as of January 1, 2014.
|
|
(3)
|
The total number of shares purchased were from our President and Chief Executive Officer ("CEO") at a price of
$15.21
per share in payment of required tax withholdings for common stock issued in March 2011 under the 2010 Short-Term Incentive Plan ("STIP").
|
|
(4)
|
The total number of shares purchased were from our CEO at a price of
$14.10
per share in payment of required tax withholdings for common stock issued in March 2012 under the 2011 STIP.
|
|
(5)
|
On April 23, 2013, we purchased a total of
108,459
shares of common stock from our CEO and other eligible employees at a price of
$12.92
per share in payment of required tax withholdings for the common stock awarded under the 2012 STIP and the 2009 LTIP.
|
Additional Paid-in Capital
— Additional paid-in capital was
$127.3 million
and
$125.2 million
at December 31, 2013 and 2012, respectively. The increase in 2013 of
$2.1 million
was due primarily to the amortization of stock based compensation and a net settlement of common stock awards under the 2012 STIP and the 2009 LTIP.
F-18
Net Income per Common Share —
Basic net income per common share is computed on the basis of the weighted average common shares outstanding. Diluted net income per common share is computed on the basis of the weighted average common shares outstanding plus the effect of all potentially dilutive common shares including outstanding restricted stock and RSUs, which are treated as contingently issuable shares, using the "treasury stock" method. During the second quarter of 2013, we acquired a net total of
108,459
shares of common stock after settling vested awards under the 2012 STIP and the 2009 LTIP. These shares of common stock acquired were retired and excluded from our reported outstanding share balance as of December 31, 2013. The components of basic and diluted net income per common share were as follows for the periods stated:
|
|
For the Year Ended December 31,
|
||||||||||
|
|
2013
|
2012
|
2011
|
||||||||
|
|
(Dollars in thousands, except share
and per share amounts)
|
||||||||||
|
Net income
|
$
|
27,530
|
|
$
|
26,984
|
|
$
|
83,786
|
|
||
|
Weighted average shares of common stock outstanding
|
21,648,654
|
|
21,924,748
|
|
22,083,942
|
|
|||||
|
Dilutive effect of restricted stock and RSUs
|
361,869
|
|
472,839
|
|
425,066
|
|
|||||
|
Weighted average shares of common stock and common stock equivalents
|
22,010,523
|
|
22,397,587
|
|
22,509,008
|
|
|||||
|
Net income per common share
|
|||||||||||
|
Basic
|
$
|
1.27
|
|
$
|
1.23
|
|
$
|
3.79
|
|
||
|
Diluted
|
$
|
1.25
|
|
$
|
1.20
|
|
$
|
3.72
|
|
||
USA Mobility, Inc. Equity Incentive Plan
We established the USA Mobility, Inc. Equity Incentive Award Plan (the “2004 Equity Plan”) in connection with and prior to the November 2004 merger of Arch and Metrocall. Under the 2004 Equity Plan, we had the ability to issue up to
1,878,976
shares of our common stock to eligible employees and non-executive members of the Board of Directors in the form of shares of common stock, stock options, restricted stock, RSUs or stock grants. Restricted stock granted under the 2004 Equity Plan entitled the stockholder to all rights of common stock ownership except that the restricted stock may not be sold, transferred, exchanged, or otherwise disposed of during the restriction period, which will be determined by the Compensation Committee of the Board of Directors. RSUs are generally convertible into shares of common stock pursuant to a Restricted Stock Unit Agreement when the appropriate vesting conditions have been satisfied. The fair value of each RSU is the market price of our common stock on the date of grant.
On March 23, 2012, our Board of Directors adopted the USA Mobility, Inc. 2012 Equity Incentive Award Plan (the “2012 Equity Plan”) that was subsequently approved by our stockholders on May 16, 2012. A total of
1,300,000
shares of common stock have been reserved for issuance under this plan. The 2012 Equity Plan is intended to replace the 2004 Equity Plan. As of May 16, 2012,
894,986
shares available under the 2004 Equity Plan will be available for grant under the 2012 Equity Plan. No further grants will be made under the 2004 Equity Plan. However, the 2004 Equity Plan will continue to govern all outstanding awards thereunder. As of December 31, 2013
81,957
RSUs were outstanding and subject to the provisions of the 2004 Equity Plan. Any shares which were available for grant under the 2004 Equity Plan including awards that were forfeited or lapsed unexercised as of the date of stockholders’ approval will be available for grant under the 2012 Equity Plan.
Awards under the 2012 Equity Plan may be in the form of stock options, restricted stock, RSUs, performance awards (a cash bonus award, a stock bonus award, a performance award or an incentive award that is paid in cash), dividend equivalents, stock payment awards, deferred stock, deferred stock units, or stock appreciation rights.
F-19
The following table summarizes the activities under the 2012 Equity Plan as of December 31, 2013:
|
|
Activity
|
|
|
Total equity securities available at May 16, 2012
|
2,194,986
|
|
|
Add: 2011 LTIP RSUs forfeited by eligible employees
|
152,044
|
|
|
Add: Restricted Stock forfeited by non-executive members of the Board of Directors
|
3,189
|
|
|
Less: 2011 LTIP RSUs awarded to eligible employees
|
|
|
|
Wireless operations
|
(392,719
|
)
|
|
Software operations
|
(164,765
|
)
|
|
Less: Restricted Stock awarded to non-executive members of the Board of Directors
|
(30,281
|
)
|
|
Less: Short-Term Incentive Plan (“STIP”) common stock awarded to an eligible employee
|
(41,702
|
)
|
|
Total equity securities available at December 31, 2013
|
1,720,752
|
|
2009 LTIP.
On January 6, 2009, our Board of Directors approved a long-term incentive program (over a
48
month vesting period) that included a cash component and a stock component in the form of RSUs based upon achievement of expense reduction and earnings before interest, taxes, depreciation, amortization and accretion goals during our 2012 calendar year and continued employment with the Company. RSUs were granted under the 2004 Equity Plan pursuant to a Restricted Stock Unit Agreement. Our Board of Directors awarded a total of
338,834
RSUs to certain eligible employees and also approved that future cash dividends related to the existing RSUs would be set aside and paid in cash to each eligible employee when the RSUs are converted into shares of common stock. Any unvested RSUs granted under the Equity Plan and the related cash dividends were forfeited when the participant terminated employment with USA Mobility. As of December 31, 2012 a total of
80,104
RSUs had been forfeited resulting in an outstanding balance of
258,730
RSUs.
We used the fair-value based method of accounting for the 2009 LTIP and amortized
$3.1 million
to expense over the
48
-month vesting period. A total of
$0.9 million
and
$0.7 million
was included in stock based compensation expense for the years ended December 31, 2012 and 2011, respectively, in relation to the 2009 LTIP.
Also on January 6, 2009, we provided for long-term cash performance awards to the same eligible employees under the 2009 LTIP. Similar to the RSUs, the vesting period for these long-term cash performance awards was
48
months upon attainment of the established performance goal.
We recognized
$3.0 million
to expense over the 48-month vesting period. A total of
$0.9 million
and
$0.7 million
was included in payroll and related expense for the years ended December 31, 2012 and 2011, respectively, for these long-term cash performance awards. Any unvested long-term cash performance awards were forfeited when the participant terminated employment with USA Mobility.
On December 31, 2012, the cash and equity awards under the 2009 LTIP vested when the pre-established performance goals were achieved. After the filing of the 2012 Annual Report on Form 10-K with the SEC, the Company converted
258,730
RSUs into shares of common stock under the 2004 Equity Plan on April 19, 2013 and paid
$1.5 million
in accumulated cash dividends earned on the RSUs to the eligible employees on April 26, 2013. The cash awards totaling
$3.0
million under the 2009 LTIP were also paid to the eligible employees on April 26, 2013. These amounts were reflected in accounts payable and accrued liabilities and accrued compensation and benefits, respectively, as of December 31, 2012.
2011 LTIP.
On March 15, 2011, our Board of Directors adopted a long-term incentive program (over a
45
month vesting period) that included a stock component in the form of RSUs. The 2011 LTIP provides eligible employees the opportunity to earn RSUs based upon achievement of performance goals established by our Board of Directors for our revenue and operating cash flows (including software operations) during the period from January 1, 2011 through December 31, 2014 (the “performance period”), and continued employment with the Company. As it relates to software operations, the performance period is considered as April 1, 2011 through December 31, 2014. Our Board of Directors approved that future cash dividends related to the existing RSUs will be set aside and paid in cash to each eligible employee when the RSUs are converted into shares of common stock. Existing RSUs would be converted into shares of common stock on the earlier of a change in control of the Company (as defined in the 2004 Equity Plan for RSUs granted before May 16, 2012 or the 2012 Equity Plan for grants on or after May 16, 2012) or on or after the third business day following the day that we file our 2014 Annual Report on Form 10-K (“2014 Annual Report”) with the SEC but in no event later than December 31, 2015. Any unvested RSUs awarded under the 2011 LTIP and the related cash dividends are forfeited if the participant terminates employment with USA Mobility.
F-20
On April 7, 2011, our Board of Directors granted
211,587
RSUs to eligible employees in our software operations under the 2004 Equity Plan pursuant to a Restricted Stock Agreement. The grant date fair value was
$3.0 million
(net of estimated forfeitures) based upon the closing price per share of our common stock of
$15.68
. In 2012, our Board of Directors awarded
122,673
RSUs to eligible employees with a grant date fair value of
$1.3 million
(net of estimated forfeitures). During 2012,
101,294
RSUs and the related cash dividends were forfeited with a related fair value of
$1.4 million
. The outstanding RSUs under the 2011 LTIP as of December 31, 2012 were
232,966
RSUs.
On December 27, 2012, our Board of Directors approved a modification to the 2011 LTIP performance goals for revenue and operating cash flows during the performance period as the original award was not expected to vest. This modification affected
18
eligible employees in the software operations. As a result of reversing previously recognized compensation expense and recording compensation for the modified award, the Company recognized a benefit to stock based compensation expense of
$0.2 million
. We used the fair-value based method of accounting for the 2011 LTIP and are amortizing the remaining
$1.6 million
of the grant date fair value (net of estimated forfeitures) over the remaining vesting period.
In 2013, our Board of Directors awarded
42,092
RSUs to eligible employees in the software operations under the 2011 LTIP with a grant date fair value of
$0.5 million
(net of estimated forfeitures). During 2013,
48,061
RSUs and the related cash dividends were forfeited with a related fair value of $
0.5 million
. As of December 31, 2013 there were
226,997
RSUs outstanding for the software operations.
A total of $
0.8 million
,
$0.1 million
and
$0.6 million
was included in stock based compensation expense for the years ended December 31, 2013, 2012 and 2011, respectively, in relation to the 2011 LTIP for our software operations. In addition to the benefit for the modification of
$0.2 million
, stock based compensation expense for the year ended December 31, 2012 included a net benefit of
$0.4 million
for forfeitures under the 2011 LTIP associated with the departure of
two
former executives in our software operations.
On January 22, 2013 (the grant date), our Board of Directors awarded
253,739
RSUs to eligible employees in the wireless operations under the 2011 LTIP. The Board of Directors granted these RSUs under the 2012 Equity Plan pursuant to a Restricted Stock Unit Agreement. The grant date fair value of the RSUs was
$2.7 million
(net of estimated forfeitures). During 2013, an additional
138,980
RSUs were awarded by our Board of Directors to an eligible employee with a grant date fair value of $
2.0 million
(net of estimated forfeitures). During 2013,
2,689
RSUs and the related cash dividends were forfeited with a related fair value of $
26,000
. As of December 31, 2013 there were
390,030
RSUs outstanding for the wireless operations. A total of
$2.0 million
was included in stock based compensation expense for the year ended December 31, 2013 in relation to the 2011 LTIP for our wireless operations.
On December 13, 2013, our Board of Directors approved a modification to the 2011 LTIP performance goals for operating cash flows during the performance period. The original award was expected to vest, therefore, the modification had no impact on the grant date fair value. This modification affected
37
and
14
eligible employees in the software operations and wireless operations, respectively.
The following table details activities with respect to outstanding RSUs under the 2011 LTIP for the year ended December 31, 2013:
|
Shares
|
Weighted-
Average Grant Date Fair Value |
Total Unrecognized Compensation Cost (net of estimated forfeitures)
(In thousands) |
Weighted-Average
Period Over Which Cost is Expected to be Recognized (In months) |
||||||||||
|
Non-vested RSUs at January 1, 2013
|
232,966
|
|
$
|
11.20
|
|
||||||||
|
Granted
|
434,811
|
|
12.76
|
|
|||||||||
|
Vested
|
—
|
|
—
|
|
|||||||||
|
Forfeited
|
(50,750
|
)
|
11.20
|
|
|||||||||
|
Non-vested RSUs at December 31, 2013
|
617,027
|
|
$
|
12.30
|
|
$
|
3,573
|
|
12
|
||||
Board of Directors Compensation
. On August 1, 2007, for periods of service beginning on July 1, 2007, our Board of Directors approved that, in lieu of RSUs, each non-executive director will be granted in arrears on the first business day following the quarter of service, restricted stock under the 2004 Equity Plan or the 2012 Equity Plan for their service on the Board of Directors and committees thereof. The restricted stock will be granted quarterly based upon the closing price per share of our common stock at the end of each quarter, such that each non-executive director will receive $
40,000
per year of restricted stock ($
50,000
for the
F-21
Chair of the Audit Committee). The restricted stock will vest on the earlier of a change in control of the Company (as defined in the 2004 Equity Plan for restricted stock granted before May 16, 2012 or the 2012 Equity Plan for grants on or after May 16, 2012) or one year from the date of grant, provided, in each case, that the non-executive director maintains continuous service on the Board of Directors. Future cash dividends related to the restricted stock will be set aside and paid in cash to each non-executive director on the date the restricted stock vests. In addition to the quarterly restricted stock grants, the non-executive directors will be entitled to cash compensation of
$40,000
per year (
$50,000
for the Chair of the Audit Committee), also payable quarterly. These sums are payable, at the election of the non-executive director, in the form of cash, shares of common stock, or any combination thereof.
On July 23, 2013, for the period of service beginning on July 1, 2013, our Board of Directors approved a change in the non-executive directors’ compensation plan. The non-executive directors will receive restricted stock quarterly based upon the closing price per share of our common stock at the end of each quarter, such that each non-executive director will receive
$60,000
per year of restricted stock (
$70,000
for the Chair of the Audit Committee). The restricted stock will vest on the earlier of a change in control of the Company (as defined in the 2012 Equity Plan) or
one year
from the date of grant, provided, in each case, that the non-executive director maintains continuous service on the Board of Directors. Future cash dividends related to the restricted stock will be set aside and paid in cash to each non-executive director on the date the restricted stock vests. The non-executive directors are required to hold shares of common stock and/or restricted stock equal to three times their annual cash compensation (
$135,000
for each non-executive director and
$165,000
for the Chair of the Audit Committee) as measured on June 30
th
of each year. Should the value of the non-executive director’s holdings fall below the established minimum, the non-executive director will be deemed in compliance with the requirement provided that the non-executive director retained shares equal to the total number of restricted stock granted during the preceding
three years
. All non-executive directors will have a
three
year grace period to reach this ownership threshold. In addition to the quarterly restricted stock grants, the non-executive directors will be entitled to cash compensation of
$45,000
per year (
$55,000
for the Chair of the Audit Committee), also payable quarterly. These sums are payable, at the election of the non-executive director, in the form of cash, shares of common stock, or any combination thereof.
The following table details information on the restricted stock awarded to our non-executive directors during the three years ended December 31, 2013:
|
Service for the three months ended
|
Grant Date
|
Price
Per
Share
(1)
|
Restricted Stock Awarded
|
Restricted Stock Vested or Forfeited
(2)
|
Vesting Date
|
Restricted Stock Awarded and Outstanding
(2)
|
Cash Dividends Paid
(3)
|
|||||||||||||
|
December 31, 2010
|
January 3, 2011
|
$
|
17.77
|
|
2,955
|
|
(2,955
|
)
|
January 2, 2012
|
—
|
|
$
|
2,955
|
|
||||||
|
March 31, 2011
|
April 1, 2011
|
14.48
|
|
3,627
|
|
(3,627
|
)
|
April 2, 2012
|
—
|
|
3,627
|
|
||||||||
|
June 30, 2011
|
July 1, 2011
|
15.26
|
|
3,439
|
|
(3,439
|
)
|
July 2, 2012
|
—
|
|
3,439
|
|
||||||||
|
September 30, 2011
|
October 3, 2011
|
13.20
|
|
3,979
|
|
(3,979
|
)
|
October 1, 2012
|
—
|
|
3,482
|
|
||||||||
|
December 31, 2011
|
January 3, 2012
|
13.87
|
|
3,785
|
|
(3,785
|
)
|
January 2, 2013
|
—
|
|
2,839
|
|
||||||||
|
March 31, 2012
|
April 2, 2012
|
13.93
|
|
3,769
|
|
(3,769
|
)
|
April 1, 2013
|
—
|
|
2,356
|
|
||||||||
|
June 30, 2012
|
July 2, 2012
|
12.86
|
|
4,084
|
|
(4,084
|
)
|
July 1, 2013
|
—
|
|
2,042
|
|
||||||||
|
September 30, 2012
|
October 1, 2012
|
11.87
|
|
5,263
|
|
(5,263
|
)
|
October 1, 2013
|
—
|
|
2,211
|
|
||||||||
|
December 31, 2012
|
January 2, 2013
|
11.68
|
|
5,350
|
|
(856
|
)
|
4,494
|
|
—
|
|
|||||||||
|
March 31, 2013
|
April 1, 2013
|
13.27
|
|
4,712
|
|
(754
|
)
|
3,958
|
|
—
|
|
|||||||||
|
June 30, 2013
|
July 1, 2013
|
13.57
|
|
4,606
|
|
(737
|
)
|
3,869
|
|
—
|
|
|||||||||
|
September 30, 2013
|
October 1, 2013
|
14.16
|
|
6,266
|
|
—
|
|
6,266
|
|
—
|
|
|||||||||
|
Total
|
51,835
|
|
(33,248
|
)
|
18,587
|
|
$
|
22,951
|
|
|||||||||||
|
(1)
|
The quarterly restricted stock awarded is based on the price per share of our common stock on the last trading day prior to the quarterly award date.
|
|
(2)
|
Amount includes forfeitures of
3,189
restricted stock resulting from a director's voluntary resignation from the Board.
|
|
(3)
|
Amount excludes interest earned and paid upon vesting of shares of restricted stock.
|
The shares of restricted stock will vest one year from the date of grant and the related cash dividends on the vested restricted stock will be paid to our non-executive directors at vesting. Grants of shares of restricted stock made after May 16, 2012 will reduce the number of shares eligible for future issuance under the 2012 Equity Plan.
We use the fair-value based method of accounting for the equity awards. A total of $
0.2 million
was included in stock based compensation expense for each of the years ended December 31, 2013, 2012 and 2011 in relation to the restricted stock granted to our non-executive directors.
F-22
Board of Directors Common Stock.
No
directors have elected common stock in lieu of cash payments for their services during the years ended December 31, 2013, 2012 and 2011.
The following table reflects the stock based compensation expense for the awards under the Equity Plans:
|
|
For the Year Ended December 31,
|
||||||||||
|
Equity Awards
|
2013
|
2012
|
2011
|
||||||||
|
|
(Dollars in thousands)
|
||||||||||
|
2009 LTIP
|
$
|
—
|
|
$
|
897
|
|
$
|
733
|
|
||
|
2011 LTIP - Wireless Operations
|
2,046
|
|
—
|
|
—
|
|
|||||
|
2011 LTIP - Software Operations
|
777
|
|
117
|
|
587
|
|
|||||
|
Board of Directors Compensation
|
222
|
|
210
|
|
210
|
|
|||||
|
Total stock based compensation
|
$
|
3,045
|
|
$
|
1,224
|
|
$
|
1,530
|
|
||
The 2009 LTIP vested on December 31, 2012, as such,
no
stock based compensation expense was incurred in 2013. The 2011 LTIP was awarded to the eligible employees in the wireless operations effective for January 1, 2013, which resulted in an increase in stock based compensation expense in 2013. Stock based compensation expense for the year ended December 31, 2012 in software operations reflects the net benefit of
$0.6 million
due to forfeitures under the 2011 LTIP and the modification to the performance goals under the 2011 LTIP.
7. Income Taxes
The significant components of our income tax expense (benefit) attributable to current operations for the periods stated were as follows:
|
|
For the Year Ended December 31,
|
||||||||||
|
|
2013
|
2012
|
2011
|
||||||||
|
|
(Dollars in thousands)
|
||||||||||
|
Income before income tax expense (benefit)
|
$
|
45,339
|
|
$
|
46,063
|
|
$
|
57,525
|
|
||
|
Current:
|
|||||||||||
|
Federal tax
|
$
|
575
|
|
$
|
(144
|
)
|
$
|
(39
|
)
|
||
|
State tax
|
958
|
|
1,179
|
|
1,798
|
|
|||||
|
Foreign tax
|
—
|
|
4
|
|
24
|
|
|||||
|
$
|
1,533
|
|
$
|
1,039
|
|
$
|
1,783
|
|
|||
|
Deferred:
|
|||||||||||
|
Federal tax
|
$
|
16,790
|
|
$
|
18,378
|
|
$
|
(28,252
|
)
|
||
|
State tax
|
(355
|
)
|
296
|
|
45
|
|
|||||
|
Foreign tax
|
(159
|
)
|
(634
|
)
|
163
|
|
|||||
|
$
|
16,276
|
|
$
|
18,040
|
|
$
|
(28,044
|
)
|
|||
|
Total income tax expense (benefit)
|
$
|
17,809
|
|
$
|
19,079
|
|
$
|
(26,261
|
)
|
||
The following table summarizes the principal elements of the difference between the United States Federal statutory rate of
35%
and our effective tax rate:
F-23
|
|
For the Year Ended December 31,
|
|||||||
|
|
2013
|
2012
|
2011
|
|||||
|
Federal income tax at statutory rate
|
35.0
|
%
|
35.0
|
%
|
35.0
|
%
|
||
|
Increase (decrease) in taxes resulting from:
|
||||||||
|
State income taxes, net of Federal tax benefit
|
3.8
|
%
|
3.4
|
%
|
3.6
|
%
|
||
|
State law changes
|
—
|
%
|
0.3
|
%
|
0.3
|
%
|
||
|
Acquisition transaction costs
|
—
|
%
|
—
|
%
|
1.6
|
%
|
||
|
Nondeductible compensation expense
|
1.8
|
%
|
—
|
%
|
—
|
%
|
||
|
Change in deferred income tax rates
|
(2.6
|
)%
|
—
|
%
|
—
|
%
|
||
|
Interest on income tax refunds
|
—
|
%
|
(0.1
|
)%
|
—
|
%
|
||
|
Change in valuation allowance
|
1.2
|
%
|
1.4
|
%
|
(87.3
|
)%
|
||
|
Other
|
0.1
|
%
|
1.4
|
%
|
1.1
|
%
|
||
|
Effective tax rate
|
39.3
|
%
|
41.4
|
%
|
(45.7
|
)%
|
||
The net deferred income tax assets at December 31, 2013 and 2012 were as follows:
|
|
December 31,
|
||||||
|
|
2013
|
2012
|
|||||
|
|
(Dollars in thousands)
|
||||||
|
Current:
|
|||||||
|
Net deferred income tax asset
|
$
|
18,565
|
|
$
|
13,037
|
|
|
|
Valuation allowance
|
(15,176
|
)
|
(9,122
|
)
|
|||
|
3,389
|
|
3,915
|
|
||||
|
Long-term:
|
|||||||
|
Net deferred income tax asset
|
129,595
|
|
150,840
|
|
|||
|
Valuation allowance
|
(104,101
|
)
|
(109,601
|
)
|
|||
|
25,494
|
|
41,239
|
|
||||
|
Total deferred income tax assets
|
$
|
28,883
|
|
$
|
45,154
|
|
|
The deferred income tax assets at December 31, 2013 and 2012 were as follows:
|
|
December 31,
|
||||||
|
|
2013
|
2012
|
|||||
|
|
(Dollars in thousands)
|
||||||
|
Net operating losses and tax credits
|
$
|
130,880
|
|
$
|
147,710
|
|
|
|
Property and equipment
|
12,380
|
|
12,988
|
|
|||
|
Accruals and accrued loss contingencies
|
8,043
|
|
9,602
|
|
|||
|
Gross deferred income tax assets
|
151,303
|
|
170,300
|
|
|||
|
Deferred income tax liabilities:
|
|||||||
|
Prepaid expenses
|
(398
|
)
|
(497
|
)
|
|||
|
Other
|
(3
|
)
|
(2
|
)
|
|||
|
Intangible assets
|
(2,742
|
)
|
(5,924
|
)
|
|||
|
Gross deferred income tax liabilities
|
(3,143
|
)
|
(6,423
|
)
|
|||
|
Net deferred income tax assets
|
$
|
148,160
|
|
$
|
163,877
|
|
|
|
Valuation allowance
|
(119,277
|
)
|
(118,723
|
)
|
|||
|
Total deferred income tax assets
|
$
|
28,883
|
|
$
|
45,154
|
|
|
Current State Income Tax Provision —
The current state income tax expense for 2013 decreased from the 2012 state income tax expense by
$0.2 million
. This is due primarily to the decline in taxable income.
F-24
Net Operating Losses —
As of December 31, 2013, we had approximately
$343.8 million
of Federal net operating losses (“NOLs”) available to offset future taxable income. The Internal Revenue Code (“IRC”) Section 382 (“IRC Section 382”) limited NOLs as of December 31, 2013 totaled
$50.4 million
which may be used at a rate of
$6.1 million
per year. The remainder of our Federal NOLs carryforwards of
$293.4 million
is not subject to a limitation. The IRC Section 382 limited NOLs will fully expire on December 31, 2021, and the unlimited NOLs begin expiring in 2023 and will fully expire in 2029. We have foreign NOLs available for future years of approximately
$0.7 million
which do not expire and foreign tax credits of
$0.5 million
.
Valuation Allowance —
We assess the recoverability of our deferred income tax assets, which represent the tax benefits of future tax deductions, by considering the adequacy of future taxable income from all sources. This assessment is required to determine whether based on all available evidence, it is
“more likely than not” (which means a probability of greater than 50%)
that all or some portion of the deferred income tax assets will be realized in future periods. The deferred income tax asset valuation allowance balances at December 31, 2013 and 2012 were
$119.3 million
and
$118.7 million
, respectively. (Included in this amount were approximately
$0.9 million
and
$0.7 million
for foreign operations at December 31, 2013 and 2012, respectively.) The valuation allowance reduces the deferred income tax assets to their estimated recoverable amounts which at December 31, 2013 and 2012 represented
19.5%
and
27.6%
, respectively, of the available deferred income tax assets. The decrease in the percentage of recoverable deferred income tax assets in 2013 reflects the increase in the valuation allowance relating to deferred income tax assets from Alternative Minimum Tax ("AMT") credit carryforwards and updated estimates of our expected benefits from such assets based on the forecasted results for the wireless and software operations. During 2013 we did not make any adjustment to our valuation allowance account except for the increase of $
0.6 million
due to the AMT tax credit carryforward.
We consider both positive and negative evidence when evaluating the recoverability of our deferred income tax assets. During the fourth quarter of each year, we prepare a multi-year forecast of taxable income for our wireless and software operations. The wireless operations have experienced a continuing decline in revenue and taxable income as subscribers switch to other communication solutions. The software operations have been impacted by the economic slowdown of the past several years resulting in customers deferring or delaying purchases. The wireless and software operations forecast of taxable income are not sufficient to result in the full realization of our deferred income tax assets.
The anticipated effective income tax rate is expected to continue to differ from the Federal statutory rate of
35%
primarily due to the effect of state income taxes, the effect of changes to the deferred income tax asset valuation allowance, permanent differences between book and taxable income and certain discrete items. The earnings of non-US subsidiaries are deemed to be indefinitely reinvested in non-US operations.
As of December 31, 2013 and 2012, there were
no
uncertain income tax positions and as such,
no
liability for unrecognized tax benefits.
Income Tax Audits —
Our Federal income tax returns have been examined by the IRS through December 31, 2008. The audits of the Federal returns for the years ended 2005 through 2008 resulted in no changes. The IRS also audited Amcom’s 2009 Federal tax return (pre-acquisition) with no changes. The 2010, 2011 and 2012 income tax returns of the Company have not been audited by the IRS and are within the statute of limitations (“SOL”).
We operate in all states and the District of Columbia and are subject to various state income and franchise tax audits. The states’ SOL varies from
three
to
four
years from the later of the due date of the return or the date filed. We usually file our Federal and all state and local income tax returns on or before September 15 of the following year; therefore, the SOLs for those states with a three year SOL is open for calendar years ending 2010 through 2013, and for the four year SOL states, the SOL is open for years ending from 2009 through 2013.
8. Commitments and Contingencies
Contractual Obligations —
We incurred significant commitments and contractual obligations as of December 31, 2013 as outlined below.
In April 2008, we amended an existing contract with a vendor for invoice processing services over a
three-year
contract term. This contract automatically renewed annually, thereafter. We have a remaining contractual obligation of
$0.1 million
, including both fixed and variable components based on units in service.
In November 2009, we entered into an agreement with a vendor for our headquarters office space in Springfield, Virginia. The office lease commenced in
April 2010
. The total rent expense is estimated to be approximately
$1.4 million
, which includes
$0.4 million
for lease incentives for a
five
-year lease term. We have a remaining commitment of
$0.4 million
as of December 31, 2013.
F-25
In October 2010, we entered into an agreement with a vendor for certain satellite services over a
three-year
contract term. In March 2012, we signed an amendment to cover additional satellite services. In December 2012, we further amended the agreement with additional services, term and conditions. We have a remaining commitment of
$0.9 million
, as of December 31, 2013.
In October 2010, we amended an existing contract with another vendor for satellite service with an annual renewal. The annual cost is
$0.5 million
.
In June 2011, we amended an existing contract with a vendor for office space in Plano, Texas. The amendment commenced in
October 2011
. The total rent expense is estimated to be approximately
$2.5 million
, which includes
$0.2 million
for rent abatements for a
five-year
lease term. We have a remaining commitment of
$1.6 million
as of December 31, 2013.
In December 2011 and effective for February 2012, we contracted with a provider for network maintenance services over a
three-year
contract term. The contract includes a fixed per site cost based on the number of transmitters, which can be adjusted with a 90 day notice. We have a minimum commitment with this vendor of
$0.1 million
.
In May 2012, we contracted with a managed service-hosting provider for certain computer support services over a
three-year
contract term. We have a remaining contractually obligation of
$0.2 million
.
In September 2012, we signed a contract with a vendor for telecommunication services with a
two-year
term. We have a remaining contractual obligation of
$0.1 million
.
Our software operations have agreements and commitments with vendors for office space in Minnesota, New York, New Hampshire, Florida and Australia. The remaining commitments for the office leases are as follows: Minnesota of
$1.5 million
through February 2019; New Hampshire of
$0.8 million
through June 2017; Florida of
$0.1 million
through June 2016; and Australia of
$0.4 million
through July 2016.
As of December 31, 2013, our commitment for the office space in New York is
$0.1 million
through April 2014. On August 27, 2013, we entered into an agreement with a vendor for new office space in New York, New York for a
ten-year
lease term. The office rent started in the first quarter of 2014 upon commencement of the tenant's build out. The total rent expense is estimated to be approximately
$3.6 million
, which includes
$0.4 million
for lease incentives.
Other Commitments —
We also have various LOCs outstanding with multiple state agencies. The LOCs typically have
one to three-year
contract requirements and contain automatic renewal terms. The deposits of
$0.1 million
related to the LOCs are included within other assets on the consolidated balance sheets.
During the third quarter of 2012, we established a
$0.2 million
LOC for an international sale. During the third quarter of 2013, we established a
$0.1
million LOC associated with a new facility lease for software operations. These LOCs have reduced our available borrowing capacity under our Amended Credit Agreement.
Legal Contingencies —
We are involved, from time to time, in lawsuits arising in the normal course of business. We believe these pending lawsuits will not have a material adverse impact on our financial results or statement of income.
Operating Leases —
We have operating leases for office and transmitter locations. Substantially all of these leases have lease terms ranging from
one month
to
five years
. We continue to review our office and transmitter locations, and intend to replace, reduce or consolidate leases, where possible.
Future minimum lease payments under non-cancelable operating leases at December 31, 2013 were as follows:
|
For the Year Ended December 31,
|
(Dollars in
thousands)
|
||
|
2014
|
$
|
6,948
|
|
|
2015
|
4,957
|
|
|
|
2016
|
3,795
|
|
|
|
2017
|
2,160
|
|
|
|
2018
|
1,520
|
|
|
|
Thereafter
|
3,609
|
|
|
|
Total
|
$
|
22,989
|
|
F-26
These leases typically include renewal options and escalation clauses. Where material, we recognize rent expense on a straight-line basis over the lease period. The difference between rent paid and rent expense is recorded as accrued other and other long-term liabilities on the consolidated balance sheets.
Total rent expense under operating leases for the years ended December 31, 2013, 2012 and 2011, was approximately
$19.1 million
,
$20.4 million
and
$26.1 million
, respectively.
Indemnification —
We and certain of our subsidiaries, as permitted under Delaware law, have entered into indemnification agreements with several persons, including each of our present directors and certain members of management, for defined events or occurrences while the director or member of management is, or was serving, at our request in such capacity. The maximum potential amount of future payments we could be required to make under these indemnification agreements is unlimited; however, we have a director and officer insurance policy that limits our exposure and enables us to recover a portion of any future amounts paid under the terms of the policy. As a result of our insurance policy coverage, we believe the estimated fair value of these indemnification agreements is immaterial. Therefore, we have not recorded a liability for these agreements as of December 31, 2013 and 2012, respectively.
Our services and product sales agreements typically include certain provisions that indemnify customers from claims of intellectual property infringement made by third parties arising from the use of our products. To date, we have not incurred and have not accrued for any costs related to such indemnification provisions.
9. Employee Benefit Plans
USA Mobility, Inc. Savings and Retirement Plan —
The USA Mobility, Inc. Savings and Retirement Plan (the “Plan”), is open to all USA Mobility employees working a minimum of twenty hours per week with at least 30 days of service. The Plan qualifies under Section 401(k) of the IRC. Under the Plan, participating employees may elect to voluntarily contribute a percentage of their qualifying compensation on a pretax or after-tax basis up to the annual maximum amounts established by the IRC. The Company matches
50%
of the employee’s contribution, up to
5%
of each participant’s gross salary per pay period, or 50% of the employee’s annualized contribution up to
$2,500
, whichever is greater. There is a per-pay-period match on the
5%
component and an end-of-year true up on the
$2,500
component. Contributions made by the Company become fully vested three years from the date of the participant’s employment (
33%
in year one,
66%
in year two and
100%
in year three). For purposes of vesting, a year consists of
1,000
hours or more. Other than the Company match as discussed above, profit sharing contributions are discretionary. Effective January 1, 2012, the Amcom Software, Inc. 401(k) Plan was merged into the Plan, and all qualified Amcom employees are eligible to participate in the Plan as noted above. Matching contributions under the Plan were approximately
$1.1 million
for both wireless and software operations for the years ended December 31, 2013 and 2012 and
$0.6 million
for the year ended December 31, 2011 for wireless operations. From March 3, 2011 through December 31, 2011, software operations’ employees were covered under the Amcom Software, Inc. 401(k) Plan and the matching contribution during this period was
$0.3 million
.
USA Mobility, Inc. Severance Pay Plan
— The USA Mobility, Inc. Severance Pay Plan for salaried employees, hourly employees and commissioned direct-sales employees (the “Severance Plan”) provides severance payments on a discretionary basis to certain employees who are terminated involuntarily under certain specified circumstances as defined in the Severance Plan. The amount of the benefit to be provided is based on the employee’s compensation and years of service with USA Mobility as defined. Eligible terminated employees will receive two weeks of compensation for each completed year of service, up to a maximum of twenty-six weeks of compensation with a minimum compensation of two weeks. We maintain a substantially similar type of severance pay plan for executive employees at and above the level of vice-president. At December 31, 2013 and 2012, the accrued severance and restructuring liability included
$1.5 million
and
$2.6 million
, respectively, associated with these plans, reflecting our expected headcount reductions (see Note 14).
10. Stock Based Compensation
Compensation expense associated with common stock, RSUs and restricted stock was recognized based on the fair value of the instruments, over the instruments’ vesting period. Stock based compensation expense increased by
$1.8 million
for the year ended December 31, 2013 from the same period in 2012 primarily due to amortization for wireless operations reflecting new grants with a total fair value (net of estimated forfeitures) of
$4.7 million
under the 2011 LTIP in 2013. Stock based compensation expense for software operations for the year ended December 31, 2012 included a benefit of
$0.4 million
for forfeitures under the 2011 LTIP associated with the departure of
two
former executives and
$0.2 million
for the modification of the 2011 LTIP. The following table reflects the statement of income line items for stock based compensation expense for the periods stated:
F-27
|
|
For the Year Ended
December 31,
|
||||||||||
|
Operating Expense Category
|
2013
|
2012
|
2011
|
||||||||
|
|
(Dollars in thousands)
|
||||||||||
|
Service, rental and maintenance
|
$
|
54
|
|
$
|
25
|
|
$
|
23
|
|
||
|
Selling and marketing
|
70
|
|
72
|
|
65
|
|
|||||
|
General and administrative
(1)
|
2,921
|
|
1,127
|
|
1,442
|
|
|||||
|
Total stock based compensation
|
$
|
3,045
|
|
$
|
1,224
|
|
$
|
1,530
|
|
||
|
(1)
|
Software operations stock based compensation represented
$0.8 million
,
$0.1 million
and $
0.6 million
for the years ended December 31, 2013, 2012 and 2011, respectively.
|
11. Prepaid Expenses and Other
Prepaid expenses and other consisted of the following for the periods stated:
|
|
December 31,
|
||||||
|
2013
|
2012
|
||||||
|
|
(Dollars in thousands)
|
||||||
|
Other receivables
|
$
|
748
|
|
$
|
864
|
|
|
|
Deposits
|
172
|
|
64
|
|
|||
|
Prepaid insurance
|
524
|
|
551
|
|
|||
|
Prepaid rent
|
259
|
|
297
|
|
|||
|
Prepaid repairs and maintenance
|
687
|
|
698
|
|
|||
|
Prepaid taxes
|
641
|
|
508
|
|
|||
|
Prepaid commissions
|
2,696
|
|
1,510
|
|
|||
|
Prepaid inventory
|
425
|
|
278
|
|
|||
|
Prepaid expenses
|
1,089
|
|
605
|
|
|||
|
Prepaid royalty
|
—
|
|
32
|
|
|||
|
Total prepaid expenses and other
|
$
|
7,241
|
|
$
|
5,407
|
|
|
Prepaid commissions increased by
$1.2 million
during the year ended December 31, 2013 due to a change in our commissions plan for the software operations which allows for advanced commission payments based on purchase orders received.
12. Inventory
Inventory of
$2.2 million
and
$3.3 million
at December 31, 2013 and 2012, respectively, consisted of third party hardware and software held for resale. We use the first in, first out cost method.
13. Other Assets
Other assets consisted of the following for the periods stated:
|
|
December 31,
|
||||||
|
|
2013
|
2012
|
|||||
|
|
(Dollars in thousands)
|
||||||
|
Deposits
|
$
|
195
|
|
$
|
318
|
|
|
|
Prepaid royalty
|
245
|
|
140
|
|
|||
|
Other assets
|
819
|
|
134
|
|
|||
|
Total other assets
|
$
|
1,259
|
|
$
|
592
|
|
|
Other assets i
ncreased by
$0.7 million
during the year ended December 31, 2013 primarily due to higher long term prepayment for an information technology security related contract in 2013.
F-28
14. Accrued Liabilities
Accrued Severance and Restructuring
— Accrued severance and restructuring charges incurred in 2013 related to staff reductions in the wireless operations as we continue to match our employee levels with operational requirements and to staff reductions in the software operations as part of a management realignment. At December 31, 2013, the balance for accrued severance and restructuring was as follows:
|
January 1,
2013
|
Charges
|
Cash Paid
|
December 31,
2013
|
||||||||||||
|
|
(Dollars in thousands)
|
||||||||||||||
|
Severance costs
|
$
|
2,593
|
|
$
|
965
|
|
$
|
(2,084
|
)
|
$
|
1,474
|
|
|||
|
Restructuring costs
|
—
|
|
18
|
|
(18
|
)
|
—
|
|
|||||||
|
Total accrued severance and restructuring
|
$
|
2,593
|
|
$
|
983
|
|
$
|
(2,102
|
)
|
$
|
1,474
|
|
|||
The balance of accrued severance and restructuring will be paid during 2014.
At December 31, 2012, the balance for accrued severance and restructuring was as follows:
|
January 1,
2012
|
Charges
|
Cash Paid
|
December 31,
2012
|
||||||||||||
|
|
(Dollars in thousands)
|
||||||||||||||
|
Severance costs
|
$
|
1,953
|
|
$
|
1,751
|
|
$
|
(1,111
|
)
|
$
|
2,593
|
|
|||
|
Restructuring costs
|
—
|
|
7
|
|
(7
|
)
|
—
|
|
|||||||
|
Total accrued severance and restructuring
|
$
|
1,953
|
|
$
|
1,758
|
|
$
|
(1,118
|
)
|
$
|
2,593
|
|
|||
Accrued Other
— Accrued other consisted of the following for the periods stated:
|
|
December 31,
|
||||||
|
|
2013
|
2012
|
|||||
|
|
(Dollars in thousands)
|
||||||
|
Asset retirement obligations
|
$
|
358
|
|
$
|
379
|
|
|
|
Accrued outside services
|
1,049
|
|
869
|
|
|||
|
Accrued accounting and legal
|
212
|
|
653
|
|
|||
|
Accrued recognition awards
|
327
|
|
294
|
|
|||
|
Accrued other
|
851
|
|
855
|
|
|||
|
Deferred rent
|
77
|
|
88
|
|
|||
|
Escheat liability
|
5
|
|
78
|
|
|||
|
Lease incentive
|
152
|
|
87
|
|
|||
|
Dividends payable for 2009 LTIP
|
—
|
|
1,481
|
|
|||
|
Royalty payable
|
—
|
|
111
|
|
|||
|
Total accrued other
|
$
|
3,031
|
|
$
|
4,895
|
|
|
The issuance of common stock for vested RSUs awarded under the 2009 LTIP was made on April 19, 2013 and the accumulated dividends earned on the RSUs of
$1.5 million
as of December 31, 2012 included above in “Dividends payable for LTIP” were paid on April 26, 2013. The royalty payable is for the estimated projected future earnout related to the IMCO acquisition.
F-29
15. Other Long-Term Liabilities
Other long-term liabilities consisted of the following for the periods stated:
|
|
December 31,
|
||||||
|
|
2013
|
2012
|
|||||
|
|
(Dollars in thousands)
|
||||||
|
Asset retirement obligations
|
$
|
7,599
|
|
$
|
7,557
|
|
|
|
Dividends payable—2011 LTIP
|
409
|
|
186
|
|
|||
|
Escheat liability
|
509
|
|
926
|
|
|||
|
Capital lease payable
|
23
|
|
53
|
|
|||
|
Lease incentive
|
180
|
|
332
|
|
|||
|
Deferred rent
|
259
|
|
341
|
|
|||
|
Royalty payable
|
280
|
|
394
|
|
|||
|
Total other long-term liabilities
|
$
|
9,259
|
|
$
|
9,789
|
|
|
The royalty payable is for the estimated projected future earnout related to the IMCO acquisition.
16. Related Parties
A member of our Board of Directors also served as a director for an entity that leases transmission tower sites to the Company. For the years ended December 31, 2013, 2012 and 2011, we paid
$3.9 million
,
$4.3 million
and
$7.8 million
, respectively, to that entity in site rent expenses for wireless operations that were included in service, rental and maintenance expenses.
17. Segment Reporting
With the acquisition of Amcom on
March 3, 2011
, we currently have
two
reportable operating segments: a Wireless segment and a Software segment. These segments are operated and managed as strategic business units and are organized by products and services. We measure and evaluate our segments based on segment operating income, consistent with the chief operating decision maker's assessment of segment performance.
Our segments and their principal activities consist of the following:
|
Wireless
|
|
Provides local, regional and nationwide one-way paging and advanced two-way messaging services
and mobile voice and data services through third party providers.
|
|
Software
|
|
Provides mission critical unified communications solutions for contact centers, emergency management, mobile event notification and messaging.
|
Effective January 1, 2014 Amcom Software, Inc was merged into USA Mobility Wireless, Inc. The Company has and is undertaking the consolidation of wireless and software operation activities and functions.
We use a non-GAAP financial measure as a key element in determining performance for purposes of incentive compensation under our annual STIP. That non-GAAP financial measure is operating cash flow (“OCF”) defined as earnings before interest, taxes, depreciation, amortization, accretion and impairment (“EBITDA”) less purchases of property and equipment (EBITDA is defined as operating income plus depreciation, amortization, accretion and impairment, each determined in accordance with GAAP). Purchases of property and equipment are also determined in accordance with GAAP.
F-30
The following table presents the key financial metrics of our segments for the periods stated:
|
|
For the Year Ended December 31,
|
||||||||||
|
|
2013
|
2012
|
2011
|
||||||||
|
|
(Dollars in thousands)
|
||||||||||
|
Revenues:
|
|||||||||||
|
Wireless
|
$
|
149,448
|
|
$
|
168,405
|
|
$
|
199,701
|
|
||
|
Software
|
60,304
|
|
51,291
|
|
33,992
|
|
|||||
|
Total revenues
|
209,752
|
|
219,696
|
|
233,693
|
|
|||||
|
Operating expenses:
|
|||||||||||
|
Wireless
|
104,319
|
|
115,056
|
|
139,319
|
|
|||||
|
Software
|
59,939
|
|
58,912
|
|
42,545
|
|
|||||
|
Total operating expenses
|
164,258
|
|
173,968
|
|
181,864
|
|
|||||
|
Operating income (loss):
|
|||||||||||
|
Wireless
|
45,129
|
|
53,349
|
|
60,382
|
|
|||||
|
Software
|
365
|
|
(7,621
|
)
|
(8,553
|
)
|
|||||
|
Total operating income
|
$
|
45,494
|
|
$
|
45,728
|
|
$
|
51,829
|
|
||
|
For the Year Ended December 31,
|
|||||||||||
|
2013
|
2012
|
2011
|
|||||||||
|
(Dollars in thousands)
|
|||||||||||
|
EBITDA (as defined by the Company):
|
|||||||||||
|
Wireless
|
$
|
54,663
|
|
$
|
64,516
|
|
$
|
74,355
|
|
||
|
Software
|
5,998
|
|
2,826
|
|
(3,192
|
)
|
|||||
|
Total EBITDA
|
60,661
|
|
67,342
|
|
71,163
|
|
|||||
|
% of revenue
|
28.9
|
%
|
30.7
|
%
|
30.5
|
%
|
|||||
|
Capital expenditures:
|
|||||||||||
|
Wireless
|
10,073
|
|
9,746
|
|
7,788
|
|
|||||
|
Software
|
335
|
|
243
|
|
164
|
|
|||||
|
Total capital expenditures
|
10,408
|
|
9,989
|
|
7,952
|
|
|||||
|
% of revenue
|
5.0
|
%
|
4.5
|
%
|
3.4
|
%
|
|||||
|
OCF (as defined by the Company):
|
|||||||||||
|
Wireless
|
44,590
|
|
54,770
|
|
66,567
|
|
|||||
|
Software
|
5,663
|
|
2,583
|
|
(3,356
|
)
|
|||||
|
Total OCF
|
$
|
50,253
|
|
$
|
57,353
|
|
$
|
63,211
|
|
||
|
% of revenue
|
24.0
|
%
|
26.1
|
%
|
27.0
|
%
|
|||||
Segment information for total assets is as follows for the periods stated:
|
December 31,
|
||||||||||||
|
|
2013
|
2012
|
2011
|
|||||||||
|
|
(Dollars in thousands)
|
|||||||||||
|
Wireless
(1)
|
$
|
166,553
|
|
$
|
158,261
|
|
$
|
193,658
|
|
|||
|
Software
|
160,345
|
|
164,366
|
|
160,763
|
|
||||||
|
Total assets
|
$
|
326,898
|
|
$
|
322,627
|
|
$
|
354,421
|
|
|||
|
(1)
|
Includes elimination of
$141.6 million
in investment in software operations recorded upon the acquisition of Amcom.
|
F-31
Below is a reconciliation of our non-GAAP measure for the periods stated:
|
|
For the Year Ended December 31,
|
||||||||||
|
2013
|
2012
|
2011
|
|||||||||
|
|
(Dollars in thousands)
|
||||||||||
|
Operating income
|
$
|
45,494
|
|
$
|
45,728
|
|
$
|
51,829
|
|
||
|
Plus: Depreciation, amortization, accretion and impairment
|
15,167
|
|
21,614
|
|
19,334
|
|
|||||
|
EBITDA (as defined by the Company)
|
60,661
|
|
67,342
|
|
71,163
|
|
|||||
|
Less: Purchases of property and equipment
|
(10,408
|
)
|
(9,989
|
)
|
(7,952
|
)
|
|||||
|
OCF (as defined by the Company)
|
$
|
50,253
|
|
$
|
57,353
|
|
$
|
63,211
|
|
||
18. Quarterly Financial Results (Unaudited)
Quarterly financial information for the years ended December 31, 2013 and 2012 is summarized below:
|
For the Year Ended December 31, 2013:
|
First
Quarter
|
Second
Quarter
|
Third
Quarter
|
Fourth
Quarter
|
||||||||||||
|
|
(Dollars in thousands except per share amounts)
|
|||||||||||||||
|
Revenues
|
$
|
53,130
|
|
$
|
52,268
|
|
$
|
49,669
|
|
$
|
54,685
|
|
||||
|
Operating income
|
11,740
|
|
11,905
|
|
9,534
|
|
12,315
|
|
||||||||
|
Net income
|
6,925
|
|
6,828
|
|
5,762
|
|
8,015
|
|
||||||||
|
Basic net income per common share
(1)
|
0.32
|
|
0.32
|
|
0.27
|
|
0.37
|
|
||||||||
|
Diluted net income per common share
(1)
|
0.32
|
|
0.31
|
|
0.26
|
|
0.36
|
|
||||||||
|
For the Year Ended December 31, 2012:
|
First
Quarter
|
Second
Quarter
|
Third
Quarter
|
Fourth
Quarter
|
||||||||||||
|
|
(Dollars in thousands except per share amounts)
|
|||||||||||||||
|
Revenues
|
$
|
56,735
|
|
$
|
55,961
|
|
$
|
55,116
|
|
$
|
51,884
|
|
||||
|
Operating income
|
14,257
|
|
13,810
|
|
13,047
|
|
4,614
|
|
(2)
|
|||||||
|
Net income
|
8,462
|
|
8,447
|
|
8,048
|
|
2,027
|
|
(2)
|
|||||||
|
Basic net income per common share
(1)
|
0.38
|
|
0.38
|
|
0.37
|
|
0.09
|
|
||||||||
|
Diluted net income per common share
(1)
|
0.37
|
|
0.37
|
|
0.36
|
|
0.09
|
|
||||||||
|
(1)
|
Basic and diluted net income per common share is computed independently for each period presented. As a result, the sum of the quarterly basic and diluted net income per common share for the years ended December 31, 2013 and 2012 may not equal the total computed for the year.
|
|
(2)
|
Includes an impairment charge of
$3.4 million
of the intangible assets in our software operations which decreased operating income and net income and basic and diluted net income per share by
$0.09
.
|
F-32
SCHEDULE (a)(2)
USA MOBILITY, INC.
VALUATION AND QUALIFYING ACCOUNTS
|
Allowance for Doubtful Accounts,
Service Credits and Other
|
Balance at the
Beginning of
the Period
|
Charged to
Operations
|
Write-offs
|
Balance at the
End of the
Period
|
||||||||||||
|
|
(Dollars in thousands)
|
|||||||||||||||
|
Year ended December 31, 2013
|
$
|
2,052
|
|
$
|
1,955
|
|
$
|
(1,786
|
)
|
$
|
2,221
|
|
||||
|
Year ended December 31, 2012
|
$
|
2,270
|
|
$
|
1,962
|
|
$
|
(2,180
|
)
|
$
|
2,052
|
|
||||
|
Year ended December 31, 2011
|
$
|
2,956
|
|
$
|
1,679
|
|
$
|
(2,365
|
)
|
$
|
2,270
|
|
||||
|
Deferred Income Tax Asset Valuation
Allowance
|
Balance at the
Beginning of
the Period
|
Additions
|
Deductions
|
Balance at the
End of the
Period
|
||||||||||||
|
|
(Dollars in thousands)
|
|||||||||||||||
|
Year ended December 31, 2013
|
$
|
118,723
|
|
$
|
554
|
|
$
|
—
|
|
$
|
119,277
|
|
||||
|
Year ended December 31, 2012
|
$
|
115,746
|
|
$
|
2,977
|
|
$
|
—
|
|
$
|
118,723
|
|
||||
|
Year ended December 31, 2011
|
$
|
170,939
|
|
$
|
—
|
|
$
|
(55,193
|
)
|
$
|
115,746
|
|
||||
F-33
EXHIBIT INDEX
|
2.1
|
Amcom Acquisition dated as of March 3, 2011 (10)
|
|
|
2.2
|
Amended Amcom Acquisition dated as of May 5, 2011 (12)
|
|
|
3.1
|
Amended and Restated Certificate of Incorporation (2)
|
|
|
3.2
|
Amended and Restated By-Laws (2)
|
|
|
4.1
|
Specimen of common stock certificate, par value $0.0001 per share (1)
|
|
|
10.1
|
Form of Indemnification Agreement for directors and executive officers of USA Mobility, Inc. (2)
|
|
|
10.2
|
Offer Letter, dated as of November 30, 2004, between USA Mobility, Inc. and Thomas L. Schilling (4)
|
|
|
10.3
|
Metrocall Holdings, Inc. 2003 Stock Option Plan (3)
|
|
|
10.4
|
Arch Wireless, Inc. 2002 Stock Incentive Plan (3)
|
|
|
10.5
|
|
USA Mobility, Inc. Equity Incentive Plan (4)
|
|
10.6
|
USA Mobility, Inc. Long-Term Incentive Plan (5)
|
|
|
10.7
|
Form of Award Agreement for the Long-Term Cash Incentive Plan (5)
|
|
|
10.8
|
Form of Restricted Stock Agreement for the Equity Incentive Plan (5)
|
|
|
10.9
|
Form of Restricted Stock Unit Agreement for the Equity Incentive Plan (5)
|
|
|
10.10
|
USA Mobility, Inc. Equity Incentive Plan Restricted Stock Agreement (For Board of Directors) (amended) (6)
|
|
|
10.11
|
USA Mobility, Inc. Long-Term Incentive Plan (amended) (7)
|
|
|
10.12
|
USA Mobility, Inc. Severance Pay Plan and Summary Plan Description (For certain C-Level, not including CEO) (amended) (7)
|
|
|
10.13
|
Employment Agreement, dated as of October 30, 2008, between USA Mobility, Inc. and Vincent D. Kelly (amended and restated) (8)
|
|
|
10.14
|
Executive Severance and Change of Control Agreement dated as of October 30, 2008 (8)
|
|
|
10.15
|
Director’s Indemnification Agreement dated as of October 30, 2008 (8)
|
|
|
10.16
|
USA Mobility, Inc. Amended and Restated 2009 Long-Term Incentive Plan (18)
|
|
|
10.17
|
Form of Restricted Stock Unit Agreement for the Equity Incentive Plan (9)
|
|
|
10.18
|
Form of Award Agreement for the Long-Term Cash Incentive Plan (9)
|
|
|
10.19
|
USA Mobility, Inc. 2009 Short-Term Incentive Plan (9)
|
|
|
10.20
|
USA Mobility, Inc. 2010 Short-Term Incentive Plan (18)
|
|
|
10.21
|
USA Mobility, Inc. 2011 Short-Term Incentive Plan (18)
|
|
|
10.22
|
Amended and Restated Credit Agreement dated as of March 3, 2011 (10)
|
|
|
10.23
|
Amended and Restated Executive Severance and Change in Control Agreement dated as of March 14, 2011 (11)
|
|
|
10.24
|
USA Mobility, Inc. 2011 Long-Term Incentive Plan (11)(20)
|
|
|
10.25
|
Second Amended and Restated Employee Agreement dated as of March 16, 2011 (11)
|
|
|
10.26
|
Amended Executive Severance and Change In Control Agreement for ‘named executive officers’ or NEOs dated as of May 5, 2011 (12)
|
|
|
10.27
|
Board of Directors Appointment dated as of July 27, 2011 (13)
|
|
|
10.28
|
First Amendment to Amended and Restated Credit Agreement dated as of November 8, 2011 (14)
|
|
|
10.29
|
USA Mobility, Inc. 2012 Short-Term Incentive Plan (19)
|
|
|
10.30
|
USA Mobility, Inc. Executive Realignment dated as of June 20, 2012 (15)
|
|
|
10.31
|
Offer Letter, dated as of July 31, 2012, between USA Mobility, Inc. and Colin Balmforth (16)
|
|
|
10.32
|
USA Mobility, Inc. 2013 Short-Term Incentive Plan (21)
|
|
|
10.33
|
USA Mobility, Inc. Severance Pay Plan and Summary Plan Description (For certain C-Level, not including CEO) (amended and restated) dated as of December 31, 2012 (17)
|
|
|
10.34
|
First Amendment to the Second Amended and Restated Employment Agreement dated as of July 29, 2013 (18)
|
|
|
10.35
|
Adopted Pre-Arranged Stock Trading Plan (19)
|
|
|
10.36
|
USA Mobility, Inc. 2014 Short-Term Incentive Plan (20)(21)
|
|
|
14
|
Code of Business Conduct and Ethics of USA Mobility, Inc. Restated October 19, 2012 (16)
|
|
|
21.1
|
Amended Subsidiaries of USA Mobility, Inc. (21)
|
|
|
23
|
Consent of Grant Thornton LLP (21)
|
|
|
31.1
|
Certification of President and Chief Executive Officer pursuant to Rule 13a-14(a)/Rule 15d-14(a) of the Securities Exchange Act of 1934, as amended, dated March 11, 2014 (21)
|
|
|
31.2
|
Certification of Chief Financial Officer pursuant to Rule 13a-14(a)/Rule 15d-14(a) of the Securities Exchange Act of 1934, as amended, dated March 11, 2014 (21)
|
|
|
32.1
|
Certification of President and Chief Executive Officer pursuant to 18 U.S.C. Section 1350 dated March 11, 2014 (21)
|
|
|
32.2
|
Certification of Chief Financial Officer pursuant to 18 U.S.C. Section 1350 dated March 11, 2014 (21)
|
|
|
101.INS
|
XBRL Instance Document *
|
|
|
101.SCH
|
XBRL Taxonomy Extension Schema*
|
|
|
101.CAL
|
XBRL Taxonomy Extension Calculation*
|
|
|
101.DEF
|
XBRL Taxonomy Extension Definition*
|
|
|
101.LAB
|
XBRL Taxonomy Extension Labels*
|
|
|
101.PRE
|
XBRL Taxonomy Extension Presentation*
|
|
|
*
|
The financial information contained in these XBRL documents is unaudited. The information in these exhibits shall not be deemed “filed” for purposes of Section 18 of the Securities Exchange Act of 1934, or otherwise subject to the liabilities of Section 18, nor shall they be deemed incorporated by reference into any disclosure document relating to USA Mobility, Inc., except to the extent, if any, expressly set forth by specific reference in such filing.
|
|
(1)
|
Incorporated by reference to USA Mobility’s Registration Statement on Form S-4/A filed on October 6, 2004.
|
|
(2)
|
Incorporated by reference to USA Mobility’s Current Report on Form 8-K filed on November 17, 2004.
|
|
(3)
|
Incorporated by reference to USA Mobility’s Registration Statement on Form S-8 filed on November 23, 2004.
|
|
(4)
|
Incorporated by reference to USA Mobility’s Annual Report on Form 10-K for the year ended December 31, 2004.
|
|
(5)
|
Incorporated by reference to USA Mobility’s Current Report on Form 8-K filed on August 2, 2006.
|
|
(6)
|
Incorporated by reference to USA Mobility’s Quarterly Report on Form 10-Q for the quarter ended September 30, 2007.
|
|
(7)
|
Incorporated by reference to USA Mobility’s Annual Report on Form 10-K for the year ended December 31, 2007.
|
|
(8)
|
Incorporated by reference to USA Mobility’s Quarterly Report on Form 10-Q for the quarter ended September 30, 2008.
|
|
(9)
|
Incorporated by reference to USA Mobility’s Annual Report on Form 10-K for the year ended December 31, 2008.
|
|
(10)
|
Incorporated by reference to USA Mobility’s Current Report on Form 8-K filed on March 4, 2011.
|
|
(11)
|
Incorporated by reference to USA Mobility’s Current Report on Form 8-K filed on March 17, 2011.
|
|
(12)
|
Incorporated by reference to USA Mobility’s Current Report on Form 8-K filed on May 5, 2011.
|
|
(13)
|
Incorporated by reference to USA Mobility’s Current Report on Form 8-K filed on July 27, 2011.
|
|
(14)
|
Incorporated by reference to USA Mobility’s Current Report on Form 8-K filed on November 8, 2011.
|
|
(15)
|
Incorporated by reference to USA Mobility’s Current Report on Form 8-K filed on June 20, 2012.
|
|
(16)
|
Incorporated by reference to USA Mobility’s Quarterly Report on Form 10-Q for the quarter ended September 30, 2012.
|
|
(17)
|
Incorporated by reference to USA Mobility’s Annual Report on Form 10-K for the year ended December 31, 2012.
|
|
(18)
|
Incorporated by reference to USA Mobility’s Quarterly Report on Form 10-Q for the quarter ended June 30, 2013.
|
|
(19)
|
Incorporated by reference to USA Mobility’s Current Report on Form 8-K filed on August 23, 2013.
|
|
(20)
|
Portions of this document have been omitted and filed separately with the Securities and Exchange Commission
|
pursuant to requests for confidential treatment pursuant to Rule 24b-2.
|
(21)
|
Filed herewith.
|
TABLE OF CONTENTS
Part IItem 1. BusinessItem 1A. Risk FactorsItem 1B. Unresolved Staff CommentsItem 2. PropertiesItem 3. Legal ProceedingsItem 4. Mine Safety DisclosuresPart IIItem 5. Market For Registrant S Common Equity, Related Stockholder Matters and IssuerItem 6. Selected Financial DataItem 7. Management S Discussion and Analysis Of Financial Condition and Statement OfItem 7A. Quantitative and Qualitative Disclosures About Market RiskItem 8. Financial Statements and Supplementary DataItem 9. Changes in and Disagreements with Accountants on Accounting and Financial DisclosureItem 9A. Controls and ProceduresItem 9B. Other InformationPart IIIItem 10. Directors, Executive Officers and Corporate GovernanceItem 11. Executive CompensationItem 12. Security Ownership Of Certain Beneficial Owners and Management and RelatedItem 13. Certain Relationships and Related Transactions, and Director IndependenceItem 14 . Principal Accounting Fees and ServicesPart IVItem 15. Exhibits and Financial Statement Schedules