UNITED STATES
SECURITIES AND EXCHANGE COMMISSION
Washington, D.C. 20549
FORM 20-F
¨
REGISTRATION STATEMENT PURSUANT TO SECTION 12(b) OR (g) OF THE SECURITIES EXCHANGE ACT OF 1934
OR
x
ANNUAL REPORT PURSUANT TO SECTION 13 OR 15(d) OF THE SECURITIES EXCHANGE ACT OF 1934
For the fiscal year ended December 31, 2010
OR
¨
TRANSITION REPORT PURSUANT TO SECTION 13 OR 15(d) OF THE SECURITIES EXCHANGE ACT OF 1934
OR
¨
SHELL COMPANY REPORT PURSUANT TO SECTION 23 OR 15(d) OF THE SECURITIES EXCHANGE ACT OF 1934
Date of event requiring this shell company report_______________________________ .
For the transition period from _____________to__________ .
Commission file number
33-65728
SOCIEDAD QUIMICA Y MINERA DE CHILE S.A.
(Exact name of registrant as specified in its charter)
CHEMICAL AND MINING COMPANY OF CHILE INC.
(Translation of registrant's name into English)
CHILE
(Jurisdiction of incorporation or organization)
El Trovador 4285, 6
th
Floor, Santiago, Chile +56 2 425-2000
(Address of principal executive offices)
Securities registered or to be registered pursuant to Section 12(b) of the Act.
|
Title of each class
|
Name of each exchange on which registered
|
|
|
Series B shares, in the form of American Depositary Shares
|
New York Stock Exchange
|
Securities registered or to be registered pursuant to Section 12(g) of the Act.
NONE
Securities for which there is a reporting obligation pursuant to Section 15(d) of the Act.
NONE
Indicate the number of outstanding shares of each of the issuer's classes of capital or common stock as of the close of the period covered by the annual report.
Series A shares 142,819,552
Series B shares 120,376,972
Indicate by check mark if the registrant is a well-known seasoned issuer, as defined in rule 405 of the Securities Act:
x
YES
¨
NO
If this report is an annual or transition report, indicate by check mark if the registrant is not required to file reports pursuant to Section 13 or 15(d) of the Securities Exchange act of 1934:
¨
YES
x
NO
Indicate by check mark whether the registrant (1) has filed all reports required to be filed by Section 13 or 15(d) of the Securities Exchange Act of 1934 during the preceding 12 months (or for such shorter period that the registrant was required to file such reports), and (2) has been subject to such filing requirements for the past 90 days.
x
YES
¨
NO
Indicate by check mark whether the registrant has submitted electronically and posted on its corporate Web site, if any, every Interactive Data File required to be submitted and posted pursuant to Rule 405 of Regulation S-T (
§
232.405 of this chapter) during the preceding 12 months (or for such shorter period that the registrant was required to submit and post such files).
¨
YES
¨
NO
Indicate by check mark whether the registrant is a large accelerated filer, an accelerated filer, or a non accelerated filer. See definition of “accelerated filer and large accelerated filer” in rule 12b-2 of the Exchange Act.
x
Large accelerated filer
¨
Accelerated filer
¨
Non- accelerated filer
Indicate by check mark which basis of accounting the registrant has used to prepare the financial statements included in this filing:
¨
U.S. GAAP
x
International Financial Reporting Standards as issued by the International Accounting Standards Board
¨
Other
If “Other” has been checked in response to the previous question, indicate by check mark which financial statement item the registrant has elected to follow.
Indicate by check mark which financial statement item the registrant has elected to follow.
¨
Item 17
x
Item 18
If this is an annual report, indicate by check mark whether the registrant is a shell company (as defined in Rule 12b-2 of the Exchange Act):
¨
YES
x
NO
TABLE OF CONTENTS
|
Page
|
||||||
|
PRESENTATION OF INFORMATION
|
iii
|
|||||
|
GLOSSARY
|
iii
|
|||||
|
CAUTIONARY STATEMENT REGARDING FORWARD-LOOKING STATEMENTS
|
vi
|
|||||
|
PART I
|
2 | |||||
|
ITEM 1.
|
IDENTITY OF DIRECTORS, SENIOR MANAGEMENT AND ADVISERS
|
2 | ||||
|
ITEM 2.
|
OFFER STATISTICS AND EXPECTED TIMETABLE
|
2 | ||||
|
ITEM 3.
|
KEY INFORMATION
|
2 | ||||
|
ITEM 4.
|
INFORMATION ON THE COMPANY
|
15 | ||||
|
ITEM 5.
|
OPERATING AND FINANCIAL REVIEW AND PROSPECTS
|
54 | ||||
|
ITEM 6.
|
DIRECTORS, SENIOR MANAGEMENT AND EMPLOYEES
|
71 | ||||
|
ITEM 7.
|
MAJOR SHAREHOLDERS AND RELATED PARTY TRANSACTIONS
|
84 | ||||
|
ITEM 8.
|
FINANCIAL INFORMATION
|
87 | ||||
|
ITEM 9.
|
THE OFFER AND LISTING
|
90 | ||||
|
ITEM 10.
|
ADDITIONAL INFORMATION
|
93 | ||||
|
ITEM 11.
|
QUANTITATIVE AND QUALITATIVE DISCLOSURES ABOUT MARKET RISK
|
106 | ||||
|
ITEM 12.
|
DESCRIPTION OF SECURITIES OTHER THAN EQUITY SECURITIES
|
108 | ||||
|
PART II
|
109 | |||||
|
ITEM 13.
|
DEFAULTS, DIVIDEND ARREARAGES AND DELINQUENCIES
|
109 | ||||
|
ITEM 14.
|
MATERIAL MODIFICATIONS TO THE RIGHTS OF SECURITY HOLDERS AND USE OF PROCEEDS
|
109 | ||||
|
ITEM 15.
|
CONTROLS AND PROCEDURES
|
109 | ||||
|
ITEM 16.
|
RESERVED
|
110 | ||||
|
ITEM 16.a.
|
AUDIT COMMITTEE FINANCIAL EXPERT
|
110 | ||||
|
ITEM 16.B.
|
CODE OF ETHICS
|
110 | ||||
|
ITEM 16.C
|
PRINCIPAL ACCOUNTANT FEES AND SERVICES
|
111 | ||||
|
ITEM 16.D
|
EXEMPTIONS FROM THE LISTING STANDARDS FOR AUDIT COMMITTEES
|
111 | ||||
|
ITEM 16.E
|
PURCHASES OF EQUITY SECURITIES BY THE ISSUERS AND AFFILIATED PURCHASERS.
|
111 | ||||
|
ITEM 16.F
|
CHANGE IN REGISTRANT'S CERTIFYING ACCOUNTANT.
|
112 | ||||
|
ITEM 16.G
|
CORPORATE GOVERNANCE.
|
112 | ||||
|
PART III
|
113 | |||||
|
ITEM 17.
|
FINANCIAL STATEMENTS
|
113 | ||||
|
ITEM 18.
|
FINANCIAL STATEMENTS
|
113 | ||||
|
ITEM 19.
|
EXHIBITS
|
113 | ||||
|
SIGNATURES
|
114 | |||||
|
CONSOLIDATED FINANCIAL STATEMENTS
|
115 | |||||
|
EXHIBIT 1.1
|
||||||
|
EXHIBIT 8.1
|
||||||
|
EXHIBIT 12.1
|
||||||
|
EXHIBIT 12.2
|
||||||
|
EXHIBIT 13.1
|
||||||
|
EXHIBIT 13.2
|
||||||
|
EXHIBIT 15.1
|
||||||
ii
PRESENTATION OF INFORMATION
In this Annual Report on Form 20-F, unless the context requires otherwise, all references to "
we
", "
us
", "
Company
" or "
SQM
" are to Sociedad Química y Minera de Chile S.A., an open stock corporation (
sociedad anónima abierta
) organized under the laws of the Republic of Chile, and its consolidated subsidiaries.
All references to "
$
," "
US$
," "
U.S. dollars,
" “USD” and "
dollars
" are to United States dollars, references to "
pesos,
" “CLP” and "
Ch$
" are to Chilean pesos, references to ThUS$ are to thousands of United States dollars, references to ThCh$ are to thousands of Chilean pesos and references to "
UF
" are to
Unidades de Fomento
. The UF is an inflation-indexed, peso-denominated unit that is linked to, and adjusted daily to reflect changes in, the previous month's Chilean consumer price index. As of May 31, 2011, UF 1.00 was equivalent to US$46.89 and Ch$21,809.84.
The Republic of Chile is governed by a democratic government, organized in fourteen regions plus the Metropolitan Region (surrounding and including Santiago, the capital of Chile). Our production operations are concentrated in northern Chile, specifically in the Tarapacá Region and in the Antofagasta Region.
Our fiscal year ends on December 31.
We use the metric system of weights and measures in calculating our operating and other data. The United States equivalent units of the most common metric units used by us are as shown below:
1 kilometer equals approximately 0.6214 miles
1 meter equals approximately 3.2808 feet
1 centimeter equals approximately 0.3937 inches
1 hectare equals approximately 2.4710 acres
1 metric ton (“MT”) equals 1,000 kilograms or approximately 2,205 pounds.
We are not aware of any independent, authoritative source of information regarding sizes, growth rates or market shares for most of our markets. Accordingly, the market size, market growth rate and market share estimates contained herein have been developed by us using internal and external sources and reflect our best current estimates. These estimates have not been confirmed by independent sources.
Percentages and certain amounts contained herein have been rounded for ease of presentation. Any discrepancies in any figure between totals and the sums of the amounts presented are due to rounding.
GLOSSARY
"
assay values
" Chemical result or mineral component amount that contains the sample.
"
average global metallurgical recoveries
" Percentage that measures the metallurgical treatment effectiveness based on the quantitative relationship between the initial product contained in the mine-extracted material and the final product produced in the plant.
"
average mining exploitation factor
" Index or ratio that measures the mineral exploitation effectiveness, based on the quantitative relationship between (in-situ mineral minus exploitation losses) / in-situ mineral.
“cash and cash equivalents”
The International Accounting Standards Board (IASB) defines cash and cash equivalents as short-term, highly liquid investments that are readily convertible to known amounts of cash and which are subject to an insignificant risk of changes in value.
“Controller Group
” A person or company or group of persons or companies that have executed a joint performance agreement, that have a direct or indirect share in a company’s ownership and have the power to influence the decisions of the company’s management.
"
Corfo
" Production Development Corporation (
Corporación de Fomento de la Producción
), formed in 1939, a national organization in charge of promoting Chile's manufacturing productivity and commercial development.
"
cut-off grade
" The minimal assay value or chemical amount of some mineral component above which exploitation is economical.
iii
"
dilution
" Loss of mineral grade because of contamination with barren material (or waste) incorporated in some exploited ore mineral.
"
exploitation losses
" Amounts of ore mineral that have not been extracted in accordance with exploitation designs.
"
fertigation
" The process by which plant nutrients are applied to the ground using an irrigation system.
"
geostatistical analysis
" Statistical tools applied to mining planning, geology and geochemical data that allow estimation of averages, grades and quantities of mineral resources and reserves.
"
heap leaching
" A process whereby minerals are leached from a heap, or pad, of crushed ore by leaching solutions percolating down through the heap and collected from a sloping, impermeable liner below the pad.
"
horizontal layering
" Rock mass (stratiform seam) with generally uniform thickness that conform to the sedimentary fields (mineralized and horizontal rock in these cases).
"
hypothetical resources
" Mineral resources that have limited geochemical reconnaissance, based mainly on geological data and samples assay values spaced between 500–1000 meters.
"
Indicated Mineral Resource
" See "Resources—Indicated Mineral Resource."
"
Inferred Mineral Resource
" See "Resources—Inferred Mineral Resource."
"
industrial crops
" Refers to crops that require processing after harvest in order to be ready for consumption or sale. Tobacco, tea and seed crops are examples of industrial crops.
“Kriging Method”
A technique used to estimate ore reserves, in which the spatial distribution of continuous geophysical variables is estimated using control points where values are known.
"LIBOR"
London Inter Bank Offered Rate.
"
limited reconnaissance
" Low or limited level of geological knowledge.
"
Measured Mineral Resource
" See "Resources—Measured Mineral Resource."
"
metallurgical treatment
" A set of chemical and physical processes applied to rocks to extract their useful minerals (or metals).
"
ore depth
" Depth of the mineral that may be economically exploited.
"
ore type
" Main mineral having economic value contained in the caliche ore (sodium nitrate or iodine).
"
ore
" A mineral or rock from which a substance having economic value may be extracted.
"
Probable Mineral Reserve
" See "Reserves—Probable Mineral Reserve."
"
Proved Mineral Reserve
" See "Reserves—Proved Mineral Reserve."
"
Reserves—Probable Mineral Reserve
"* The economically mineable part of an Indicated Mineral Resource and, in some circumstances, Measured Mineral Resource. The calculation of the reserves includes diluting of materials and allowances for losses which may occur when the material is mined. Appropriate assessments, which may include feasibility studies, have been carried out and include consideration of and modification by realistically assumed mining, metallurgical, economic, marketing, legal, environmental, social and governmental factors. These assessments demonstrate at the time of reporting that extraction is reasonably justified. A Probable Mineral Reserve has a lower level of confidence than a Proved Mineral Reserve.
"
Reserves—Proved Mineral Reserve
"* The economically mineable part of a Measured Mineral Resource. The calculation of the reserves includes diluting materials and allowances for losses which may occur when the material is mined. Appropriate assessments, which may include feasibility studies, have been carried out and include consideration of and modification by realistically assumed mining, metallurgical, economic, marketing, legal, environmental, social and governmental factors. These assessments demonstrate at the time of reporting that extraction is reasonably justified.
"
Resources—Indicated Mineral Resource
"* That part of a Mineral Resource for which tonnage, densities, shape, physical characteristics, grade and mineral content can be estimated with a reasonable level of confidence. The calculation is based on exploration, sampling and testing information gathered through appropriate techniques from locations such as outcrops, trenches, pits, workings, and drill holes. The locations are too widely or inappropriately spaced to confirm geological continuity and/or grade continuity but are spaced closely enough for continuity to be assumed. An Indicated Mineral Resource has a lower level of confidence than that applying to a Measured Mineral Resource, but has a higher level of confidence than that applying to an Inferred Mineral Resource.
iv
A deposit may be classified as an Indicated Mineral Resource when the nature, quality, amount and distribution of data are such as to allow the Competent Person determining the Mineral Resource to confidently interpret the geological framework and to assume continuity of mineralization. Confidence in the estimate is sufficient to allow the appropriate application of technical and economic parameters and to enable an evaluation of economic viability.
"
Resources—Inferred Mineral Resource
"* That part of a Mineral Resource for which tonnage, grade and mineral content can be estimated with a low level of confidence, by inferring them on the basis of geological evidence and assumed but not verified geological and/or grade continuity. The estimate is based on information gathered through appropriate techniques from locations such as outcrops, trenches, pits, workings and drill holes, and this information is of limited or uncertain quality and/or reliability. An Inferred Mineral Resource has a lower level of confidence than that applying to an Indicated Mineral Resource.
"
Resources—Measured Mineral Resource
"* The part of a Mineral Resource for which tonnage, densities, shape, physical characteristics, grade and mineral content can be estimated with a high level of confidence. The estimate is based on detailed and reliable exploration, sampling and testing information gathered through appropriate techniques from locations such as outcrops, trenches, pits, workings, and drill holes. The locations are spaced closely enough to confirm geological and/or grade continuity.
A deposit may be classified as a Measured Mineral Resource when the nature, quality, amount and distribution of data are such as to leave no reasonable doubt, in the opinion of the Competent Person determining the Mineral Resource, that the tonnage and grade of the deposit can be estimated within close limits and that any variation from the estimate would not significantly affect potential economic viability. This category requires a high level of confidence in, and understanding of, the geology and controls of the mineral deposit. Confidence in the estimate is sufficient to allow the appropriate application of technical and economic parameters and to enable an evaluation of economic viability.
“vat leaching”
A process whereby minerals are extracted from crushed ore by placing the ore in large vats containing leaching solutions.
"
waste
" Rock or mineral which is not economical for metallurgical treatment.
"
Weighted Average Age
" The sum of the product of the age of each fixed asset at a given facility and its current gross book value as of December 31, 2010 divided by the total gross book value of the Company's fixed assets at such facility as of December 31, 2010.
|
*
|
The definitions we use for resources and reserves are based on those provided by the “
Instituto de Ingenieros de Minas de Chile
” (Chilean Institute of Mining Engineers).
|
|
**
|
The definition of a Controller Group that has been provided is the one that applies to the Company. Chilean law provides for a broader definition of a Controller Group.
|
SQM will provide a copy of any or all of the documents incorporated herein by reference (other than exhibits, unless such exhibits are specifically incorporated by reference in such documents), upon written or oral request. Written requests for such copies should be directed to Sociedad Química y Minera de Chile S.A., El Trovador 4285, 6
th
Floor, Santiago, Chile, Attention: Investor Relations Department. Requests may also be made by telephone (562-425-2000), facsimile (562-425-2493) or e-mail (ir@sqm.com).
v
CAUTIONARY STATEMENT REGARDING FORWARD-LOOKING STATEMENTS
This Form 20-F contains statements that are or may constitute forward-looking statements within the meaning of the Private Securities Litigation Reform Act of 1995. These statements are not based on historical facts and reflect our expectations for future events and results. Words such as "believe," "expect," "predict," "anticipate," "intend," "estimate," "should," "may," "could" or similar expressions may identify forward-looking information. These statements appear throughout this Form 20-F and include statements regarding the intent, belief or current expectations of the Company and its management, including but not limited to any statements concerning:
|
|
·
|
the Company's capital investment program and development of new products;
|
|
|
·
|
trends affecting the Company's financial condition or results of operations;
|
|
|
·
|
level of production, quality of the ore and brines, and production levels and yields;
|
|
|
·
|
the future impact of competition; and
|
|
|
·
|
regulatory changes
|
Such forward-looking statements are not guarantees of future performance and involve risks and uncertainties. Actual results may differ materially from those described in such forward-looking statements included in this Form 20-F, including, without limitation, the information under Item 4. Information on the Company and Item 5. Operating and Financial Review and Prospects. Factors that could cause actual results to differ materially include, but are not limited to:
|
|
·
|
SQM's ability to implement its capital expenditures, including its ability to arrange financing when required;
|
|
|
·
|
the nature and extent of future competition in SQM's principal markets;
|
|
|
·
|
political, economic and demographic developments in the emerging market countries of Latin America and Asia where SQM conducts a large portion of its business;
|
|
|
·
|
volatility of global prices for SQM’s products;
|
|
|
·
|
changes in production capacities;
|
|
|
·
|
changes in raw material and energy prices;
|
|
|
·
|
currency and interest rate fluctuations; and
|
|
|
·
|
additional factors discussed below under Item 3. Key Information—Risk Factors.
|
vi
Not Applicable.
Not Applicable.
3.A.
Selected Financial Data
The following table presents selected financial data as of December 31, 2010 and the previous year. The selected financial data should be read in conjunction with the Audited Consolidated Financial Statements and notes thereto, “Item 5. Operating and Financial Review and Prospects” and other financial information included herein.
Since January 1, 2010, the Company’s consolidated financial statements are and will be prepared in accordance with the International Financial Reporting Standards as published by the International Accounting Standards Board (IASB).
The Company’s consolidated financial information as of and for the year ended December 31, 2009 included in the Company’s annual consolidated financial statements was restated in accordance with IFRS. See Note 2 to the Audited Consolidated Financial Statements of the Company.
|
Year ended December 31,
|
||||||||
|
2010
|
2009
|
|||||||
|
Income Statement Data
|
(in millions of US$)
(1)
|
|||||||
|
I.F.R.S
|
||||||||
|
Sales
|
1,830.4 | 1,438.7 | ||||||
|
Cost of sales
|
(1,204.4 | ) | (908.5 | ) | ||||
|
Gross profit
|
626.0 | 530.2 | ||||||
|
Administrative expenses
|
(78.8 | ) | (75.5 | ) | ||||
|
Operating Income
|
547.2 | 454.7 | ||||||
|
Net finance costs
|
(22.1 | ) | (17.5 | ) | ||||
|
Foreign currency transactions
|
(5.8 | ) | (7,6 | ) | ||||
|
Equity in gains (losses) of associates and joint ventures accounted for using the equity method
|
10.7 | 4.5 | ||||||
|
Other gains(losses), net
|
(36.7 | ) | (18.5 | ) | ||||
|
Profit before income tax expense
|
493.3 | 415.6 | ||||||
|
Income Tax expense
|
(106.0 | ) | (75.8 | ) | ||||
|
Profit (loss)
|
387.3 | 339.8 | ||||||
|
Equity holders of the parent
|
382.1 | 338.3 | ||||||
|
Non-controlling interest
|
5.2 | 1.5 | ||||||
|
Basic earnings per share (2)
|
1.45 | 1.29 | ||||||
|
Basic earnings per ADR (2) (3)
|
1.45 | 1.29 | ||||||
|
Dividend per share (4) (5)
|
0.73 | 0.66 | ||||||
|
Weighted average shares outstanding (000s) (2)
|
263,197 | 263,197 | ||||||
2
|
Year ended December 31,
|
As of
January 1,
|
|||||||||||
|
2010
|
2009
|
2009
|
||||||||||
|
Balance Sheet Data
|
(in millions of US$)
|
|||||||||||
|
I.F.R.S
|
||||||||||||
|
Total assets
|
3,372.8 | 3,141.8 | 2,484.0 | |||||||||
|
Total Liabilities
|
1,702.0 | 1,677.4 | 1,083.8 | |||||||||
|
Total Equity
|
1,670.8 | 1,464.5 | 1,400.2 | |||||||||
|
Equity attributable to the owners of the controlling entity
|
1,622.8 | 1,418.8 | 1,353.7 | |||||||||
|
Equity attributable to non-controlling interest
|
48.0 | 45.7 | 46.5 | |||||||||
|
Capital stock
|
477.4 | 477.4 | 477.4 | |||||||||
(1) Except shares outstanding, dividend and net earnings per share and net earnings per ADR.
(2) There are no authoritative pronouncements related to the calculation of earnings per share in accordance with IFRS.
(3) The Series A ADRs were delisted from the New York Stock Exchange on March 27, 2008. The ratio of ordinary shares to Series B ADRs changed from 10:1 to 1:1 on March 28, 2008. The calculation of earnings per ADR is based on the ratio of 1:1.
(4) Dividends per share are calculated based on 263,196,524 shares for the periods ended December 31, 2009 and 2010.
(5) Dividends may only be paid from net income as determined in accordance with IFRS; see Item 8.A.8. Dividend Policy. For dividends in Ch$ see Item 8.A.8.Dividend Policy — Dividends.
EXCHANGE RATES
Chile has two currency markets, the
Mercado Cambiario Formal
, or the "Formal Exchange Market," and the
Mercado Cambiario Informal
, or the "Informal Exchange Market." The Formal Exchange Market comprises banks and other entities authorized by the Banco Central de Chile (the "Chilean Central Bank"). The Informal Exchange Market comprises entities that are not expressly authorized to operate in the Formal Exchange Market, such as certain foreign exchange houses and travel agencies, among others. The Chilean Central Bank is empowered to determine that certain purchases and sales of foreign currencies be carried out on the Formal Exchange Market.
Both the Formal Exchange Market and the Informal Exchange Market are driven by free market forces. Current regulations require that the Chilean Central Bank be informed of certain transactions and that these transactions be effected through the Formal Exchange Market.
The
dólar observado
, or "Observed Exchange Rate," which is reported by the Chilean Central Bank and published daily in the Chilean newspapers, is computed by taking the weighted average of the previous business day's transactions on the Formal Exchange Market. Nevertheless, the Chilean Central Bank has the power to intervene by buying or selling foreign currency on the Formal Exchange Market to attempt to maintain the Observed Exchange Rate within a desired range.
On January 3, 2011, the Chilean Central Bank decided to intervene in the Formal Exchange Market by increasing the level of international reserves by US$12 billion, the biggest-ever exchange rate intervention aimed at suppressing the rising peso. This plan was implemented in January 2011 and is scheduled to end in December 2011.
3
The Informal Exchange Market reflects transactions carried out at an informal exchange rate, or the "Informal Exchange Rate." There are no limits imposed on the extent to which the rate of exchange in the Informal Exchange Market can fluctuate above or below the Observed Exchange Rate.
The Federal Reserve Bank of New York does not report a noon buying rate for Chilean pesos.
| Ch$ per US$ | ||||||||||||||||
|
Year/Month
|
Low (1)
|
High (1)
|
Average (1)(2)
|
Year/Month
End(3) |
||||||||||||
|
2005
|
509.70 | 592.75 | 559.86 | 512.50 | ||||||||||||
|
2006
|
511.44 | 549.63 | 530.26 | 532.39 | ||||||||||||
|
2007
|
493.14 | 548.67 | 522.69 | 496.89 | ||||||||||||
|
2008
|
431.22 | 676.75 | 521.79 | 636.45 | ||||||||||||
|
2009
|
491.09 | 643.87 | 559.15 | 507.10 | ||||||||||||
|
2010
|
468.01 | 549.17 | 510.22 | 468.01 | ||||||||||||
|
Dec.
|
468.01 | 485.34 | 473.83 | 468.01 | ||||||||||||
|
2011
|
||||||||||||||||
|
Jan.
|
466.05 | 499.03 | 490.21 | 484.14 | ||||||||||||
|
Feb.
|
468.94 | 481.56 | 475.24 | 475.21 | ||||||||||||
|
Mar.
|
472.74 | 485.37 | 479.84 | 479.46 | ||||||||||||
|
Apr.
|
460.04 | 479.90 | 470.35 | 460.09 | ||||||||||||
|
May
|
461.65 | 474.19 | 467.96 | 465.13 | ||||||||||||
Source: Central Bank of Chile
|
|
(1)
|
Observed exchange rates are the actual high and low on a day-to-day basis, for each period.
|
|
|
(2)
|
The monthly average rate is calculated on a day-to-day basis for each month.
|
|
|
(3)
|
The Year/Month End exchange rate is based on transactions observed during the last day of the month/year.
|
Not applicable.
3.C.
Reasons for the Offer and Use of Proceeds
Not applicable.
3.D.
Risk Factors
Our operations are subject to certain risk factors that may affect SQM's financial condition or results of operations. In addition to other information contained in this Annual Report on Form 20-F, you should consider carefully the risks described below. These risks are not the only ones we face. Additional risks not currently known to us or that are known but we currently believe are not significant may also affect our business operations. Our business, financial condition or results of operations could be materially affected by any of these risks.
4
Risks Relating to our Business
Our sales to emerging markets expose us to risks related to economic conditions and trends in those countries
We sell our products in more than 100 countries around the world. In 2010, 48% of our sales were made in emerging market countries: 12% in Central and South America (excluding Chile); 9% to Africa and the Middle East; 13% in Chile; and 13% in Asia (excluding Japan). We expect to expand our sales in these and other emerging markets in the future. The results of and prospects of our operations in these regions and in other countries in which we establish operations will depend, in part, on the general level of political stability and economic activity and policies in those countries. Future developments in the political systems or economies of these countries or the implementation of future governmental policies in those countries, including the imposition of withholding and other taxes, restrictions on the payment of dividends or repatriation of capital, the imposition of import duties or other restrictions, the imposition of new environmental regulations or price controls or changes in relevant laws or regulations could have a material adverse effect on our sales or operations in those countries.
Volatility of world fertilizer and chemical prices and changes in production capacities could affect our business, financial condition and results of operations
The prices of our products are determined principally by world prices, which, in some cases, have been subject to substantial volatility in recent years. World fertilizer and chemical prices vary depending upon the relationship between supply and demand at any given time. Supply and demand dynamics for our products are tied to a certain extent to global economic cycles, and have been impacted by current global economic conditions. Furthermore, the supply of certain fertilizers or chemical products, including certain products that we provide, varies principally depending on the production of the major producers, including SQM, and their respective business strategies.
During 2008, world prices of potassium-based fertilizers (including some of our specialty plant nutrients and potassium chloride) increased significantly during the first nine months of the year. Towards the end of 2008, fertilizer prices generally fell as a result of the global economic and financial slowdown. During 2009, volatility in prices continued to affect commodity markets around the world. During 2010, prices of potassium-based fertilizers stabilized after the conclusion of important contract negotiations between major producers and buyers at the end of 2009. During the first few months of 2011, we have observed consolidation in the industry on the part of producers and the settlement of important supply contracts between China and major potash producers at higher prices, which we expect will support positive price momentum. We have also observed positive price trends in the Brazilian market in the first months of 2011. However, we cannot assure you that prices will not decline in the future.
Iodine prices have followed an upward trend since late 2003, reaching an average price of approximately US$28 per kilogram in 2010. In October 2008, we announced an increase of iodine prices by 25%, and as a result prices increased during 2009. Sales volumes of iodine and its derivatives may be affected by general decreases in the use of applications that are sensitive to economic growth. We cannot assure that prices and sales volumes will not decline in the future.
We started production of lithium carbonate from the brines extracted from Salar de Atacama in October 1996 and started selling lithium carbonate commercially in January 1997. Our entry into the market created an oversupply of lithium carbonate, resulting in a drop in prices from over US$3,000 per ton before our entry to less than US$2,000 per ton. At the end of 2008, prices were approximately US$6,000 per ton and remained at this level until the fourth quarter of 2009 when prices declined to approximately US$5,000 per ton. Before the global economic slowdown, the increase in prices was the result of market dynamics reflecting sustained growth in demand in the past few years and supply that grew only enough to match demand, and we believed this price increase was due mainly to high growth in demand, which had not been fully balanced by the supply of lithium carbonate. As a result of events in global markets during 2009, demand for lithium carbonate declined and, as expected, lithium prices and sales volumes for 2009 were lower compared to the previous year. In September 2009, we announced a 20% price cut for lithium carbonate and lithium hydroxide as a measure to stimulate demand. In 2010, we observed demand recovery in the lithium market. We cannot assure you that this upward trend will continue in the future. Potential decreases in sales volumes of lithium carbonate could have a material adverse effect on our business, financial condition and results of operations.
5
We expect that prices for the products we manufacture will continue to be influenced, among other things, by worldwide supply and demand and the business strategies of major producers. Some of the major producers (including SQM) have increased or have the ability to increase production. As a result, the prices of our products may be subject to substantial volatility. High volatility or a substantial decline in the prices, or in volume demand, of one or more of our products could have a material adverse effect on our business, financial condition and results of operations.
Our inventory levels may increase because of the global economic situation
In general, the global economic slowdown experienced during 2008 and 2009 had an impact on our inventories. Demand decreased during 2009 and, as a result, inventories increased significantly. Higher inventories carry a financial risk due to increased need for cash to fund working capital. Higher inventory levels could also imply increased risk of loss of product. We cannot assure you that these changes in inventory levels will not occur in the future. These factors could have a material adverse effect on our business, financial condition and results of operations.
Our level of and exposure to unrecoverable accounts receivable may significantly increase
The potentially negative effects of the global economic crisis of 2008 and 2009 on the financial condition of our customers may include the extension of the payment terms of our accounts receivable and may increase our exposure to bad debt. While we are taking measures, such as using credit insurance, letters of credits and prepayment for a portion of sales, to minimize this risk, the increase in our accounts receivable coupled with the financial condition of customers may result in losses that could have a material adverse effect on our business, financial condition and results of operations.
New production of lithium carbonate from new competitors
Potential new production of lithium carbonate from new competitors in the markets in which we operate could adversely affect prices. There is limited information on the status of new lithium carbonate production capacity expansion projects being developed by current and potential competitors and, as such, we cannot make accurate projections regarding the capacities of possible new entrants into the market and the dates on which they could become operational. If these potential projects are completed in the short term, they could adversely affect market prices and our market share, which in turn could adversely affect our business, financial position and results of operations.
We have an ambitious capital expenditure program that is subject to significant risks and uncertainties
Our business is capital intensive. Specifically, the exploration and exploitation of reserves, mining and processing costs, the maintenance of machinery and equipment and compliance with applicable laws and regulations require substantial capital expenditures. We must continue to invest capital to maintain or to increase our exploitation levels and the amount of finished products we produce. We require environmental permits for our new projects. Obtaining permits in certain cases may cause significant delays in the execution and implementation of new projects and, consequently, may require us to reassess the related risks and economic incentives. We cannot assure you that we will be able to maintain our production levels or generate sufficient cash flow, or that we will have access to sufficient investments, loans or other financing alternatives, to continue our exploration, exploitation and refining activities at or above present levels, or that we will be able to implement our projects or receive the necessary permits required for them in time. Any or all of these factors may have a material adverse impact on our business, financial condition and results of operations.
6
We transact a significant portion of our business in U.S. dollars, and the U.S. dollar is the currency of the primary economic environment in which we operate. In addition, the U.S. dollar is our functional currency for financial statement reporting purposes. A significant portion of our costs, however, is related to the Chilean peso. Therefore, an increase or decrease in the exchange rate between the Chilean peso and the U.S. dollar would affect our costs of production. The Chilean peso has been subject to large devaluations and revaluations in the past and may be subject to significant fluctuations in the future. As of December 31, 2010, the Chilean peso to U.S. dollar exchange rate was Ch$468.01 per U.S. dollar, while as of December 31, 2009, the Chilean peso to U.S. dollar exchange rate was Ch$507.01 per U.S. dollar. As a result, the U.S. dollar depreciated approximately 8% compared to the peso during 2010.
As an international company operating in several other countries, we also transact business and have assets and liabilities in other non-U.S. dollar currencies, such as, among others, the euro, the South African rand and the Mexican peso. As a result, fluctuations in the exchange rates of such foreign currencies to the U.S. dollar may affect our business, financial condition and results of operations.
Interest rate fluctuations may have a material impact on our financial performance
We have outstanding short- and long-term debt that bears interest based on the London Interbank Offered Rate, or "LIBOR," plus a spread. As we do not have derivative instruments to hedge LIBOR, we are subject to fluctuations in this rate. As of December 31, 2010, approximately 20% of our financial debt had LIBOR-based pricing. Thus, significant increases in the rate could impact our financial condition and results of operations.
High raw materials and energy prices could increase our production costs and cost of goods sold
We rely on certain raw materials and various sources of energy (diesel, electricity, natural gas, fuel oil and others) to manufacture our products. Purchases of raw materials that we do not produce and energy constitute an important part of our cost of sales (17.6% in 2010). To the extent we are unable to pass on increases in raw materials and energy prices to our customers, our business, financial condition and results of operations could be materially adversely affected.
Our reserves estimates could be subject to significant changes
Our mining reserves estimates are prepared by our own geologists. Estimation methods involve numerous uncertainties as to the quantity and quality of the reserves, and reserve estimates could change upwards or downwards. In addition, our reserve estimates are not subject to review by external geologists or an external auditing firm. A downward change in the quantity and/or quality of our reserves could affect future volumes and costs of production and therefore have a material adverse effect on our business, financial condition and results of operations.
Quality standards in markets in which we sell our products could become stricter over time
In the markets in which we do business, customers may impose quality standards on our products and/or governments may enact or are enacting stricter regulations for the distribution and/or use of our products. As a result, we may not be able to sell our products if we cannot meet such new standards. In addition, our cost of production may increase in order to meet any such newly promulgated standards. Failure to sell our products in one or more markets or to important customers could materially adversely affect our business, financial condition and results of operations.
7
Chemical and physical properties of our products could adversely affect its commercialization
Since our products are derived from natural resources, they contain inorganic impurities that may not meet certain client and government standards. As a result, we may not be able to sell our products if we cannot meet such requirements. In addition, our cost of production may increase in order to meet such standards. Failure to meet such standards could materially adversely affect our business, financial condition and results of operations.
Our business is subject to many operating and other risks for which we may not be fully covered under our insurance policies
Our facilities and business operations in Chile and abroad are insured against losses, damages or other risks by insurance policies that are standard for the industry and that would reasonably be expected to be sufficient by prudent and experienced persons engaged in businesses similar to ours.
We may be subject to certain events that may not be covered under our insurance policies, and that could have a material adverse effect on our business, financial condition and results of operations. Additionally, as a result of the major earthquake in Chile in February 2010 and other natural disasters worldwide, conditions in the insurance market may change, and as a result we may face higher premiums and reduced coverage.
We face significantly higher energy costs as a result of a natural gas shortage in Chile
As part of a cost reduction effort, in 2001 we connected our facilities to a natural gas network. This natural gas, which originates in Argentina and is subject to a 10-year agreement terminating in 2011, is used mainly for heat generation at our industrial facilities. Due to energy shortages in Argentina, in 2004 local authorities began to restrict exports of natural gas to Chile in order to increase the supply to their domestic markets. Additionally, even though we have long-term price agreements related to natural gas, the Argentinean government has increased taxes on gas exports, which could lead our suppliers to demand pricing changes, and we cannot assure you that they will not do so again in the future.
We suffered partial shortages of natural gas during 2004, 2005 and 2006, and from 2007 through 2010 we received practically no natural gas. We believe this situation will continue and that during 2011 we will likely receive little to no natural gas from Argentina. Most of our industrial equipment that uses natural gas can also operate on fuel oil, and the remaining equipment can operate on diesel. However, the cost of fuel oil and diesel is significantly higher than the cost of natural gas, and therefore we have recently faced significantly higher energy costs. We expect this situation to continue, and, as such, we expect the reduction in our natural gas supply to continue to have a material adverse effect on our business, financial condition and results of operations.
Decline in the supply of natural gas could negatively affect the supply of electricity and our electricity contracts
The natural gas supply crisis discussed above has placed Chile's northern power grid (Sistema Interconectado del Norte Grande) under significant stress. Continued stress on the northern power grid could lead to a system failure that would then affect the supply of electricity. Restrictions on our electricity consumption could materially adversely affect our operations, potentially decreasing our production volumes and increasing our production costs. During 2010, purchases of electricity represented approximately 4% of our cost of sales.
As the supply of natural gas continues to be uncertain, we are faced with the potential early termination, partial amendment or temporary suspension of our long-term electricity supply contracts. We maintain contracts with two main utilities in Chile, Electroandina S.A. and Norgener S.A., and in the past both have sought relief from the terms of their electricity supply agreements, asserting that unforeseen events have restricted the supply and increased the price of gas from Argentina. As a result of these requests, we entered into negotiations resulting in new tariffs that have had a negative effect on our results of operations. Further increases in the cost of energy could prompt these companies to once again seek to modify, terminate or suspend these contracts. If that were to happen, and these companies were to prevail in any resulting judicial proceedings, our business, financial condition and results of operations could be materially adversely affected.
8
Changes in technology or other developments could result in preferences for substitute products
Our products, particularly iodine, lithium and their derivatives, are preferred raw materials for certain industrial applications, such as rechargeable batteries and LCD screens. Changes in technology, the development of substitute raw materials or other developments could adversely affect demand for these and other products which we produce.
We are exposed to labor strikes and liabilities that could impact our production levels and costs
Approximately 69% of our permanent employees in Chile is represented by 27 labor unions. As a result, we are exposed to labor strikes that could impact our production levels. If a strike occurs and continues for a sustained period of time, we could be faced with increased costs and even disruption in our product flow that could have a material adverse effect on our business, financial condition and results of operations.
Chilean Law No. 20,123, known as the Ley de Subcontratación ("Law on Subcontracting"), provides that when a serious accident in the workplace occurs, a company must halt work at the site where the accident took place until authorities from the National Geology and Mining Service inspect the site and prescribe the measures such company must take to prevent future risks. Work may not be resumed until such company has taken the prescribed measures, and the period of time before work may be resumed may last for a number of hours, days, or longer. The effects of this law could have a material adverse effect on our business, financial condition and results of operations.
Lawsuits and arbitrations could adversely impact us
We are party to a range of lawsuits and arbitrations involving different matters as described in Note 20 to our consolidated financial statements. Although we intend to defend our positions vigorously, our defense of these actions may not be successful. Judgments or settlements in these lawsuits may have a material adverse effect on our business, financial condition and results of operations. In addition, our strategy of being a world leader includes entering into commercial and production alliances, joint ventures and acquisitions to improve our global competitive position. As these operations increase in complexity and are carried out in different jurisdictions, we might be subject to legal proceedings that, if settled against us, could have a material adverse effect on our business, financial condition and results of operations.
The Chilean labor code has recently established new procedures for labor matters which include oral trials conducted by specialized judges. The majority of these oral trials have found in favor of the employee. These new procedures could increase the probability of adverse judgments which could have a material adverse effect on our business, financial condition and results of operations.
We have operations in multiple jurisdictions with differing regulatory, tax and other regimes
We operate in multiple jurisdictions with complex regulatory environments subject to different interpretations by companies and respective governmental authorities. These jurisdictions may each have their own tax codes, environmental regulations, labor codes and legal framework, which could complicate efforts to comply with these regulations which could have a material adverse effect on our business, financial condition and results of operations.
9
Risks Relating to Chile
As we are a company based in Chile, we are exposed to Chilean political risks
Our business, results of operations, financial condition and prospects could be affected by changes in policies of the Chilean government, other political developments in or affecting Chile, and regulatory and legal changes or administrative practices of Chilean authorities, over which we have no control.
Changes in regulations regarding, or any revocation or suspension of, our concessions could negatively affect our business
Any adverse changes to our concession rights, or a revocation or suspension of our concessions, could have a material adverse effect on our business, financial condition and results of operations.
Changes in mining or port concessions could affect our operating costs
We conduct our mining (including brine extraction) operations under exploitation and exploration concessions granted in accordance with provisions of the Chilean constitution and related laws and statutes. Our exploitation concessions essentially grant a perpetual right to conduct mining operations in the areas covered by the concessions, provided that we pay annual concession fees (with the exception of the Salar de Atacama rights, for which we have a lease until 2030). Our exploration concessions permit us to explore for mineral resources on the land covered thereby for a specified period of time and to subsequently request a corresponding exploitation concession.
We also operate port facilities at Tocopilla, Chile for the shipment of our products and the delivery of certain raw materials, pursuant to concessions granted by Chilean regulatory authorities. These concessions are renewable provided that we use such facilities as authorized and pay annual concession fees.
Any significant changes to any of these concessions could have a material adverse effect on our business, financial condition and results of operations.
Changes in water rights laws could affect our operating costs
We hold water rights that are key to our operations. These rights were obtained from the Chilean water authority for supply of water from rivers and wells near our production facilities, which we believe are sufficient to meet current operating requirements. However, the Chilean water rights code (the "Water Code") is subject to changes, which could have a material adverse impact on our business, financial condition and results of operations. For example, an amendment published on June 16, 2005 modified the Water Code, allowing under certain conditions, the granting of permanent water rights of up to two liters per second for each well built prior to June 30, 2004, in the locations where we conduct our mining operations, without considering the availability of water, or how the new rights may affect holders of existing rights. Therefore, the amount of water we can effectively extract based on our existing rights could be reduced if these additional rights are exercised. In addition, we must pay annual concession fees to maintain water rights we are not exercising. These and potential future changes to the Water Code could have a material adverse effect on our business, financial condition and results of operations.
Our water supply could be affected by geological changes
Our access to water may be impacted by changes in geology or other natural factors, such as wells drying up, that we cannot control, and which may have a material adverse effect on our business, financial condition and results of operations.
The Chilean government could levy additional taxes on corporations operating in Chile
In 2005, the Chilean Congress approved Law No. 20,026 (also known as the "Royalty Law"), establishing a royalty tax to be applied to mining activities developed in Chile.
10
After the earthquake in February 2010 in the south of Chile, the government approved changes to both the Royalty Law and the corporate tax rate that raised tax rates in order to partially fund the recovery effort.
We cannot assure you that the manner in which the Royalty Law is interpreted and applied will not change in the future. In addition, the Chilean government may decide to levy additional taxes on mining companies or other corporations in Chile. Such changes could have a material adverse effect on our business, financial condition and results of operations.
Environmental laws and regulations could expose us to higher costs, liabilities, claims and failure to meet current and future production targets
Our operations in Chile are subject to national and local regulations relating to environmental protection. We are required to conduct environmental impact studies of any future projects or activities (or significant modifications thereto) that may affect the environment. The National Environmental Commission (the Comisión Nacional del Medio Ambiente, or "CONAMA") currently evaluates environmental impact studies submitted for its approval and oversees the implementation of projects, and private citizens, public agencies or local authorities may challenge projects that may adversely affect the environment, either before these projects are executed or once they are already operating. Enforcement remedies available include fines and temporary or permanent closure of facilities.
Chilean environmental regulations have become increasingly stringent in recent years, both with respect to the approval of new projects and in connection with the implementation and development of projects already approved. This trend is likely to continue. Furthermore, recently implemented environmental regulations have created uncertainty because rules and enforcement procedures for these regulations have not been fully developed. Given public interest in environmental enforcement matters, these regulations or their application may also be subject to political considerations that are beyond our control.
We continuously monitor the impact of our operations on the environment and have, from time to time, made modifications to our facilities to minimize any adverse impacts. We believe we are currently in compliance in all material respects with applicable environmental regulations in Chile. The only exception is for particulate matter levels that have exceeded permissible levels at the María Elena facilities. We believe that we are complying with current regulations at these facilities; however, we must complete a three-year monitoring period which ends in 2011. Future developments in the creation or implementation of environmental requirements, or in their interpretation, could result in substantially increased capital, operation or compliance costs or otherwise adversely affect our business, financial condition and results of operations.
In connection with our current investments at the Salar de Atacama, we have obtained approval for an environmental impact assessment study that allows us to increase brine and water extraction, subject to a rigorous environmental monitoring system. The success of these investments is dependent on the behavior of the ecosystem variables being monitored over time. If the behavior of these variables in future years does not meet environmental requirements, our operation may be subject to important restrictions by the authorities on the maximum allowable amounts of brine and water extraction.
In connection with our future investments in nitrate and iodine operations, we have submitted and expect to submit several environmental impact assessment studies. The success of these investments is dependent on the approval of such submissions by the pertinent governmental authorities.
Our future development also depends on our ability to sustain future production levels, which requires additional investments and the submission of the corresponding environmental impact assessment studies. If we fail to obtain approval, our ability to maintain production at specified levels will be seriously impaired, thus having a material adverse effect on our business, financial condition and results of operations.
11
In addition, our worldwide operations are subject to international environmental regulations. Since laws and regulations in the different jurisdictions in which we operate may change, we cannot guarantee that future laws, or changes to existing laws, will not materially adversely impact our business, financial condition and results of operations.
Ratification of the International Labor Organization's Convention 169 concerning indigenous and tribal peoples might affect our development plans
In 2008, Chile, a member of the International Labor Organization ("ILO"), ratified the ILO's Convention 169 (the "Indigenous Rights Convention") concerning indigenous and tribal peoples. The Indigenous Rights Convention established several rights for indigenous individuals and communities. Among other rights, the Indigenous Rights Convention outlines that (i) indigenous groups be notified of and consulted prior to the development of any project on land deemed indigenous (right to veto was not included); and (ii) indigenous groups have, to the extent possible, a stake in benefits resulting from the exploitation of natural resources in alleged indigenous land. The extent of these benefits has not been defined by the government. The new rights outlined in the Indigenous Rights Convention could affect the development of our investment projects in alleged indigenous lands which could have a material adverse effect on our business, financial condition and results of operations.
Chile is located in a seismically active region
Although a major earthquake affected parts of southern Chile in February 2010, SQM operations were not impacted. Chile is prone to earthquakes because it is located along major fault lines. A major earthquake could have significant negative consequences for our operations and for the general infrastructure, such as roads, rail, and access to goods, in Chile. Even though we maintain insurance policies standard for this industry with earthquake coverage we cannot assure you that a future seismic event will not have a material adverse effect on our business, financial condition and results of operations.
Risks related to our shares and to our ADRs
The price of our ADRs and the U.S. dollar value of any dividends will be affected by fluctuations in the U.S. dollar/Chilean peso exchange rate
Chilean trading in the shares underlying our ADRs is conducted in Chilean pesos. The depositary will receive cash distributions that we make with respect to the shares in pesos. The depositary will convert such pesos to U.S. dollars at the then prevailing exchange rate to make dividend and other distribution payments in respect of ADRs. If the value of the peso falls relative to the U.S. dollar, the value of the ADRs and any distributions to be received from the depositary will decrease.
Developments in other emerging markets could materially affect the value of our ADRs
The Chilean financial and securities markets are, to varying degrees, influenced by economic and market conditions in other emerging market countries or regions of the world. Although economic conditions are different in each country or region, investor reaction to developments in one country or region can have significant effects on the securities of issuers in other countries and regions, including Chile and Latin America. Events in other parts of the world may have an adverse effect on Chilean financial and securities markets and on the value of our ADRs.
The volatility and low liquidity of the Chilean securities markets could affect the ability of our shareholders to sell our ADRs
The Chilean securities markets are substantially smaller, less liquid and more volatile than the major securities markets in the United States. The volatility and low liquidity of the Chilean markets could increase the price volatility of our ADRs and may impair the ability of a holder to sell our ADRs into the Chilean market in the amount and at the price and time he wishes to do so.
12
Our share price may react negatively to future acquisitions and investments
As world leaders in our core businesses, part of our strategy is to constantly look for opportunities that will allow us to consolidate and strengthen our competitive position. Pursuant to this strategy, we may from time to time, evaluate and eventually carry out acquisitions relating to any of our businesses or to new businesses in which we believe we may have sustainable competitive advantages. Depending on our capital structure at the time of such acquisitions, we may need to raise significant debt and/or equity which will affect our financial condition and future cash flows. Any change in our financial condition could affect our results of operations, negatively impacting our share price.
You may be unable to enforce rights under U.S. Securities Laws
Because we are a Chilean company subject to Chilean law, the rights of our shareholders may differ from the rights of shareholders in companies incorporated in the United States, and you may not be able to enforce or may have difficulty enforcing rights currently in effect under U.S. Federal or State securities laws.
Our Company is a "
sociedad anónima abierta
" (open stock corporation) incorporated under the laws of the Republic of Chile. Most of SQM's directors and officers reside outside the United States, principally in Chile. All or a substantial portion of the assets of these persons are located outside the United States. As a result, if any of our shareholders, including holders of our ADRs, were to bring a lawsuit against our officers or directors in the United States, it may be difficult for them to effect service of legal process within the United States upon these persons. Likewise, it may be difficult for them to enforce judgments obtained in United States courts based upon the civil liability provisions of the federal securities laws of the United States against them in United States courts.
In addition, there is no treaty between the United States and Chile providing for the reciprocal enforcement of foreign judgments. However, Chilean courts have enforced judgments rendered in the United States, provided that the Chilean court finds that the United States court respected basic principles of due process and public policy. Nevertheless, there is doubt as to whether an action could be brought successfully in Chile in the first instance on the basis of liability based solely upon the civil liability provisions of the United States federal securities laws.
As preemptive rights may be unavailable for our ADR holders, they have the risk of their holdings being diluted if we issue new stock
Chilean laws require companies to offer their shareholders preemptive rights whenever selling new shares of capital stock. Preemptive rights permit holders to maintain their existing ownership percentage in a company by subscribing for additional shares. If we increase our capital by issuing new shares, a holder may subscribe for up to the number of shares that would prevent dilution of the holder's ownership interest.
If we issue preemptive rights, United States holders of ADRs would not be able to exercise their rights unless a registration statement under the Securities Act were effective with respect to such rights and the shares issuable upon exercise of such rights or an exemption from registration were available. We cannot assure holders of ADRs that we will file a registration statement or that an exemption from registration will be available. We may, in our absolute discretion, decide not to prepare and file such a registration statement. If our holders were unable to exercise their preemptive rights because SQM did not file a registration statement, the depositary bank would attempt to sell their rights and distribute the net proceeds from the sale to them, after deducting the depositary's fees and expenses. If the depositary could not sell the rights, they would expire and holders of ADRs would not realize any value from them. In either case, ADR holders' equity interest in SQM would be diluted in proportion to the increase in SQM's capital stock.
If the Company were classified as a Passive Foreign Investment Company there could be adverse consequences for U.S. investors
We believe that we were not classified as a passive foreign investment company, or PFIC, for 2010. Characterization as a PFIC could result in adverse U.S. tax consequences to you if you are a U.S. investor in our shares or ADRs. For example, if we (or any of our subsidiaries) are a PFIC, our U.S. investors may become subject to increased tax liabilities under U.S. tax laws and regulations and will become subject to burdensome reporting requirements. The determination of whether or not we (or any of our subsidiaries or portfolio companies) are a PFIC is made on an annual basis and will depend on the composition of our (or their) income and assets from time to time. See Item 10.E Taxation – United States Tax Considerations.
13
Changes in Chilean tax regulations could have adverse consequences for U.S. investors
Currently cash dividends paid by the Company to foreign shareholders are subject to a 35% Chilean withholding tax. If the Company has paid corporate income tax (the "First Category Tax") on the income from which the dividend is paid, a credit for the First Category Tax effectively reduces the rate of Withholding Tax. Changes in current Chilean tax regulations could have adverse consequences for U.S. investors.
14
4.A.
History and Development of the Company
Historical Background
Sociedad Química y Minera de Chile S.A. "SQM" is an open stock corporation (
sociedad anónima abierta
) organized under the laws of the Republic of Chile. The Company was constituted by public deed issued on June 17, 1968 by the Notary Public of Santiago, Mr. Sergio Rodríguez Garcés. Its existence was approved by Decree No. 1.164 of June 22, 1968 of the Ministry of Finance, and it was registered on June 29, 1968 in the Registry of Commerce of Santiago, on page 4.537 No. 1.992. SQM's headquarters are located at El Trovador 4285, Fl. 6, Las Condes, Santiago, Chile. The Company's telephone number is +56 2 425-2000.
Commercial exploitation of the caliche ore deposits in northern Chile began in the 1830s, when sodium nitrate was extracted from the ore for use in the manufacturing of explosives and fertilizers. By the end of the nineteenth century, nitrate production had become the leading industry in Chile and the country was the world's leading supplier of nitrates. The accelerated commercial development of synthetic nitrates in the 1920s and the global economic depression in the 1930s caused a serious contraction of the Chilean nitrate business, which did not recover significantly until shortly before the Second World War. After the war, the widespread commercial production of synthetic nitrates resulted in a further contraction of the natural nitrate industry in Chile, which continued to operate at depressed levels into the 1960s.
SQM was formed in 1968 through a joint venture between Compañía Salitrera Anglo Lautaro S.A. (“Anglo Lautaro”) and
Corporación de Fomento de la Producción
(“Production Development Corporation” or “Corfo”), a Chilean government entity. Three years after our formation, in 1971, Anglo Lautaro sold all of its shares to Corfo, and we were wholly owned by the Chilean Government until 1983. In 1983, Corfo began a process of privatization by selling our shares to the public and subsequently listing such shares on the Santiago Stock Exchange. By 1988, all of our shares were publicly owned. Our Series B ADRs have traded on the NYSE under the ticker symbol “SQM” since 1993.
Since its inception, in addition to producing nitrates, the Company has produced iodine, which is also found in the caliche ore deposits in northern Chile.
Between the years 1994 and 1999, we invested approximately US$300 million in the development of the Salar de Atacama project in northern Chile. The project involved the construction of a potassium chloride plant, a lithium carbonate plant, a potassium sulfate plant, and a boric acid plant.
To help finance the above projects, we accessed the international capital markets by issuing additional Series B ADRs on the New York Stock Exchange in 1995. In 1999 we issued additional Series A shares, which were also listed on the New York Stock Exchange as ADRs. Effective March 27, 2008, the Company voluntarily delisted its Series A ADR (“SQM-A”) from the New York Stock Exchange.
During the period from 2000 through 2004 we principally consolidated the investments carried out in the preceding five years. We focused on reducing costs and improving efficiencies throughout the organization.
Since 2005, we have strengthened our leadership in our main businesses by increasing our capital expenditure program and making appropriate acquisitions and divestitures. During this period we acquired Kefco in Dubai and the iodine business of DSM. We also sold (i) Fertilizantes Olmeca, our Mexican subsidiary, (ii) our butyllithium plant located in Houston, Texas and (iii) our stake in Impronta S.R.L., our Italian subsidiary. These sales allowed SQM to concentrate its efforts on its core products. In 2007, we completed the construction of a new prilling and granulating plant. In 2008, we completed our lithium carbonate capacity expansion and began work on the engineering stage of a new potassium nitrate plant. During 2009 and 2010, we continued expansion of potassium-based products in the Salar de Atacama. During the first quarter of 2011, we completed the construction of a new potassium nitrate facitly in Coya Sur.
15
Capital Expenditure Program
We are constantly reviewing different opportunities to improve our production methods, reduce costs, increase production capacity of existing products and develop new products and markets. Additionally, significant capital expenditures are required every year in order to sustain our production capacity. We are focused on developing new products in response to identified customer demand, as well as new products that can be derived as part of our existing production or other products that could fit our long-term development strategy. Our capital expenditures during the past five years were mainly related to the acquisition of new assets, construction of new facilities and renewal of plant and equipment.
SQM’s capital expenditures in the 2008-2010 period were the following:
|
(in millions of US$)
|
2010
|
2009
|
2008
|
|||||||||
|
Capital Expenditures (1)
|
336.0 | 376.2 | 286.6 | |||||||||
|
|
(1)
|
For purposes of this item, capital expenditures include investments aimed at sustaining, improving or increasing production levels, including acquisitions and investments in related companies.
|
We have developed a capital expenditure program calling for investments totalling approximately US$540 million for 2011. This amount may increase or decrease depending on market conditions. The main purpose of our capital expenditure program is to increase the production capacities of several of our products, including expansions in potassium-based products from the Salar de Atacama, iodine and natural nitrates. In addition, part of this investment plan is intended to modernize production processes in order to improve our operating efficiency.
During 2010, we had total capital expenditures of US$336.0 million, primarily due to:
|
|
·
|
continued construction of a new potassium nitrate production facility at Coya Sur;
|
|
|
·
|
investments related to increase production capacity of potassium-based products at the Salar de Atacama;
|
|
|
·
|
upgrade of our railroad system to handle expanded production capacity; and
|
|
|
·
|
various projects designed to maintain production capacity, increase yields and reduce costs.
|
We have budgeted for 2011 total capital expenditures of approximately US$540 million, primarily relating to:
|
|
·
|
investments related to increase production capacity of potassium-based products at the Salar de Atacama;
|
|
|
·
|
increase capacity and efficiencies at nitrate and iodine facilities;
|
|
|
·
|
optimization railroad system;
|
|
|
·
|
various projects designed to maintain production capacity, increase yields and reduce costs.
|
No external financing is needed to finance the capital expenditure program for the 2011 period. Investments made during this period will be concentrated in the Tarapacá and Antofagasta Regions of Chile.
16
4.B.
Business Overview
The Company
We believe that we are the world’s largest integrated producer of potassium nitrate, iodine and lithium carbonate. We also produce other specialty plant nutrients, iodine and lithium derivatives, potassium chloride and certain industrial chemicals (including industrial nitrates). Our products are sold in over 100 countries through our worldwide distribution network, with more than 85% of our sales derived from countries outside Chile in 2010.
Our products are mainly derived from mineral deposits found in northern Chile. We mine and process caliche ore and brine deposits. The caliche ore in northern Chile contains the only known nitrate and iodine deposits in the world and is the world’s largest commercially exploited source of natural nitrates. The brine deposits of the Salar de Atacama, a salt-encrusted depression within the Atacama desert in northern Chile, contain high concentrations of lithium and potassium as well as significant concentrations of sulfate and boron.
From our caliche ore deposits, we produce a wide range of nitrate-based products used for specialty plant nutrients and industrial applications, as well as iodine and iodine derivatives. At the Salar de Atacama, we extract brines rich in potassium, lithium, sulfate and boron in order to produce potassium chloride, potassium sulfate, lithium solutions, boric acid and bischofite (magnesium chloride). We produce lithium carbonate and lithium hydroxide at a plant near the city of Antofagasta, Chile, from the solutions brought from the Salar de Atacama. We market all of these products through an established worldwide distribution network.
Our products are divided into six categories: specialty plant nutrients; iodine and its derivatives; lithium and its derivatives; industrial chemicals; potassium; and other commodity fertilizers. Specialty plant nutrients premium are fertilizers that enable farmers to improve yields and quality of certain crops. Iodine, lithium and their derivatives are used in human nutrition, pharmaceuticals and other industrial applications. Specifically, iodine and its derivatives are mainly used in the x-ray contrast media and biocides industries and in the production of polarizing film, which is an important component in liquid crystal display (“LCD”) screens. Lithium and its derivatives are mainly used in batteries, greases and frits for production of ceramics. Industrial chemicals have a wide range of applications in certain chemical processes such as the manufacturing of glass, explosives and ceramics, and, more recently, industrial nitrates are being used in solar energy plants as a means for energy storage. Potassium chloride is a commodity fertilizer that is produced and sold by the Company worldwide. During 2009, potassium chloride has begun to contribute significantly to our operations, and we expect this trend to continue in the near future. In addition, we complement our portfolio of plant nutrients through the buying and selling of other fertilizers mainly for use in Chile.
For the year ended December 31, 2010, we had revenues of US$1,830.4 million, gross margin of US$626.0 million and net income of US$382.1 million. Our market capitalization as of December 31, 2010 was approximately US$15.4 billion.
Our Series A and Series B common shares are listed on the Santiago Stock Exchange. Our Series B ADRs have been listed on the NYSE since 1993. Our ticker symbols on the Santiago Stock Exchange for our Series A and Series B shares are “SQM-A” and “SQM-B,” respectively, and our ticker symbol on the NYSE for the Series B ADRs is “SQM.”
17
Specialty Plant Nutrition
: We produce four principal types of specialty plant nutrients: potassium nitrate, sodium nitrate, sodium potassium nitrate, and specialty blends. Furthermore, SQM sells other specialty fertilizers including trading of third party products. All of these specialty plant nutrients are used in either solid or liquid form mainly on high value crops such as vegetables, fruits, flowers, potatoes and cotton, and they are widely used in crops that employ modern agricultural techniques such as hydroponics, greenhousing, fertigation (where fertilizer is dissolved in water prior to irrigation) and foliar application. According to the type of use or application the products are marketed under the brands: Ultrasol™ (fertigation), Qrop™ (field application), Speedfol™ (foliar application), Allganic™ (organic farming) and Nutrilake™ (aquaculture). Specialty plant nutrition has certain advantages over commodity fertilizers, such as rapid and effective absorption (without requiring nitrification), superior water solubility, alkaline pH (which reduces soil acidity) and low chlorine content. These advantages, plus customized specialty blends that meet specific needs along with technical service provided by us, allow us to create plant nutrition solutions that add value to crops through higher yields and better quality production. Because our products are natural or derived from natural nitrate compounds or natural potassium brines, they have certain advantages over synthetically produced fertilizers, including the presence of certain beneficial trace elements, which makes them more attractive to customers who prefer products of natural origin. As a result, our specialty plant nutrients enable our customers to achieve higher yields and better quality crops. Consequently, specialty plant nutrients are sold at a premium price.
Iodine and its derivatives
: We are the world's leading producer of iodine and iodine derivatives, which are used in a wide range of medical, pharmaceutical, agricultural and industrial applications, including x-ray contrast media, polarizing films for liquid crystal displays (LCDs), antiseptics, biocides and disinfectants; in the synthesis of pharmaceuticals, herbicides, electronics, pigments, dye components and heat stabilizers.
Lithium and its derivatives
: We are the world's leading producer of lithium carbonate, which is used in a variety of applications, including batteries, frits for the ceramic and enamel industries, heat-resistant glass (ceramic glass), primary aluminum, lithium bromine for air conditioner equipment, continuous casting powder for steel extrusion, pharmaceuticals, and lithium derivatives. We are also a leading supplier of lithium hydroxide, which is used primarily as a raw material in the lubricating grease industry.
Industrial Chemicals
: We produce four industrial chemicals: sodium nitrate, potassium nitrate, boric acid and potassium chloride. Sodium nitrate is used primarily in the production of glass, explosives, charcoal briquettes and metal treatment. Potassium nitrate is used in the manufacture of specialty glass, and it is also an important raw material for the production of frits for the ceramics and enamel industries. Also, a combination of potassium nitrate and sodium nitrate is used as a thermal storage medium in solar-based electricity generating plants. Boric acid is used in the manufacture of frits for the ceramics and enamel industries, liquid crystal displays (LCD), glass and fiberglass. Potassium chloride is used as an additive in oil drilling as well as in the production of carragenine.
Potassium:
We produce potassium chloride and potassium sulfate from brines extracted from the Salar de Atacama. Potassium chloride is a commodity fertilizer used to fertilize a variety of crops including corn, rice, sugar, soybean, and wheat. Potassium sulfate is a specialty fertilizer used mainly in crops such as vegetables, fruits and industrial crops.
Other Products and Services
: We also sell other fertilizers and blends, some of which we do not produce.
The following table sets forth the percentage breakdown of our revenues for 2010 and 2009 according to our product lines:
|
2010
|
2009
|
|||||||
|
Specialty Plant Nutrition
|
33 | % | 37 | % | ||||
|
Iodine and Derivatives
|
17 | % | 13 | % | ||||
|
Lithium and Derivatives
|
8 | % | 8 | % | ||||
|
Industrial Chemicals
|
8 | % | 8 | % | ||||
|
Potassium
|
29 | % | 28 | % | ||||
|
Other
|
4 | % | 6 | % | ||||
|
Total
|
100 | % | 100 | % | ||||
18
Business Strategy
Our general business strategy is to:
|
(1)
|
maintain leadership in specialty plant nutrients, iodine, lithium and industrial nitrates, in terms of production capacity, costs, production, pricing and development of new products;
|
|
(2)
|
increase our production capacity of potassium-related fertilizers from the Salar de Atacama;
|
|
(3)
|
continually increase the efficiency of our production processes and reduce costs;
|
|
(4)
|
evaluate acquisitions, joint ventures and commercial alliances in each of our core businesses; and
|
|
(5)
|
maintain a solid, conservative financial position and investment grade ratings for our debt securities.
|
We have identified market demand in each of our major product lines, both within our existing customer base and in new markets, for existing products and for additional products that can be produced from our natural resources. In order to take advantage of these opportunities, we have developed specific strategies for each of our product lines.
Specialty Plant Nutrition
Our strategy in our specialty plant nutrients business is to: (i) continue expanding our sales of natural nitrates by continuing to leverage the advantages of our specialty products over commodity-type fertilizers; (ii) increase our sales of higher margin specialty plant nutrients based on potassium and natural nitrates, particularly soluble potassium nitrate and NPK blends; (iii) pursue investment opportunities in complementary businesses to increase production, reduce costs, and add value to and improve the marketing of our products; (iv) develop new specialty nutrient blends produced in our mixing plants that are strategically located in or near our principal markets, in order to meet specific customer needs; (v) focus primarily on the markets for plant nutrients in soluble and foliar applications in order to establish a leadership position; (vi) further develop our global distribution and marketing system directly and through strategic alliances with other producers and global or local distributors; and (vii) reduce our production costs through improved processes and higher labor productivity so as to compete more effectively.
Iodine and its derivatives
Our strategy in our iodine business is to (i) maintain our leadership in the iodine market by encouraging demand growth and expanding our production capacity in line with such demand growth; (ii) develop new iodine derivatives and participate in iodine recycling projects; and (iii) pursue to reduce our production costs through improved processes and higher labor productivity in order to compete more effectively.
Lithium and its derivatives
Our strategy in our lithium business is to (i) maintain our leadership in the lithium industry as the largest producer and distributor of lithium carbonate and lithium hydroxide; (ii) selectively pursue opportunities in the lithium derivatives business by creating new lithium compounds; and (iii) pursue to reduce our production costs through improved processes and higher labor productivity in order to compete more effectively.
Industrial Chemicals
Our strategy in our industrial chemical business is to (i) maintain our leadership position in sodium nitrate and potassium nitrate; (ii) maintain our leadership position in the industrial nitrates for thermal storage market and become a long-term, reliable source for the industry; and (iii) pursue to reduce our production costs through improved processes and higher labor productivity in order to compete more effectively.
19
Potassium
Our strategy is to increase significantly our production capacity of potassium chloride and potassium sulfate. Our distribution strategy is (i) to offer a portfolio of potassium products including potassium sulfate, potassium chloride and other fertilizers to our traditional markets; (ii) to offer standard or compacted product according to market requirements and (iii) to focus in markets where we have logistical advantages.
20
New Business Ventures
From time to time we evaluate opportunities to expand our business in our current core businesses or within new businesses in which we believe we may have sustainable competitive advantages, both within and outside Chile, and we expect to continue to do so in the future. We are currently exploring concessions for certain metallic minerals. If found, we may decide to exploit, sell or enter into a joint venture to extract these resources. We may decide to acquire part or all of the equity of, or undertake joint ventures or other transactions with, other companies involved in our businesses or in other businesses.
Main Business Lines
Specialty Plant Nutrition
We believe we are the world's largest producer of potassium nitrate. We estimate that our sales accounted for approximately 50% of world potassium nitrate sales by volume in 2010, considering net imports to the Chinese market. Worldwide demand increased by approximately 49% over 2009, surpassing our initial expectations about demand recovery. We also produce the following specialty plant nutrients: sodium nitrate, sodium potassium nitrate, and specialty blends (containing various combinations of nitrogen, phosphate and potassium and generally known as "NPK blends").
These specialty plant nutrients have specific characteristics that increase productivity and enhance quality when used on certain crops and soils. Additionally, these plant nutrients are well suited for high-yield agricultural techniques such as hydroponics, fertigation, greenhouses and foliar applications. High-value crop farmers are prompted to invest in specialty plant nutrients due to their technical advantages over commodity fertilizers (such as urea and potassium chloride). These advantages translate into products and crops with higher yields and added quality. Our specialty plant nutrients have significant advantages for certain applications over commodity fertilizers based on nitrogen and potassium, such as the aforementioned urea and potassium chloride.
In particular, our specialty plant nutrients:
|
|
·
|
are fully water soluble, allowing their use in hydroponics, fertigation, foliar applications and other advanced agricultural techniques;
|
|
|
·
|
are absorbed more rapidly by plants because they do not require nitrification, unlike ammonia-based fertilizers;
|
|
|
·
|
are free of chlorine content, reducing the risk of scorching roots and other problems caused by chlorine;
|
|
|
·
|
do not release hydrogen after application, thereby avoiding increased soil acidity;
|
|
|
·
|
possess trace elements, which promote disease resistance in plants and have other beneficial effects;
|
|
|
·
|
are more attractive to customers who prefer products of natural origin; and
|
|
|
·
|
are more efficient than commodity fertilizers because they deliver more nutrients per unit of product applied.
|
In 2010, our sales from specialty plant nutrients were US$603.7 million, representing 33% of our total sales for that year and 15% higher than the US$527.0 million recorded in 2009. Improved economic conditions supported higher demand for premium vegetables and fruits, which has reinforced the consumption of specialty fertilizers.
21
Specialty Plant Nutrition: Market
The target market for our specialty plant nutrients is high-value crops such as fruits, vegetables, and crops grown using modern agricultural techniques. Since 1990, the international market for specialty plant nutrients has grown at a faster rate than the international market for commodity-type fertilizers. This is mostly due to: (i) the application of new agricultural technologies such as fertigation and hydroponics and increasing use of green houses; (ii) the increase in the cost of land, which has forced farmers to improve their yields; (iii) the scarcity of water; (iv) the increase of consumption of fresh fruits and vegetables per capita; and (v) the increasing demand for higher quality crops.
Worldwide scarcity of water and arable land drive the development of new agricultural techniques to maximize the use of these resources, such as fertigation, foliar application and irrigation systems. It is important to remark that irrigation has been growing at an average annual rate of 1.5% during last 20 years. However, micro-irrigation has been growing at 10% per year in the same period. Micro-irrigation systems, which include drip-irrigation and micro-sprinkler, are the most efficient technical irrigation. These applications require fully water-soluble plant nutrients.
Increasing land costs near urban centers also force farmers to maximize their yield per surface area. Specialty plant nutrients, when applied to certain crops, help to increase productivity for various reasons. In particular, since our nitrate-based specialty plant nutrients provide nitrogen in nitric form, crops absorb them faster than they absorb urea- or ammonium-based fertilizers, which provide nitrogen in ammonium form. This is because crops absorb nitrogen in nitric form; thus nitrogen in ammonium form has to be converted into nitric form in the soil first. This process does not occur immediately as it takes time and requires special soil conditions, and it releases hydrogen into the soil, increasing soil acidity, which in most cases is harmful to the soil and the crop. Nitric nitrogen application facilitates a more efficient application of nutrients to the plant, thereby increasing the crop's yield and improving its quality.
Our potassium-based specialty plant nutrients are chlorine free, unlike potassium chloride, which is the most commonly used potassium-based commodity fertilizer. In certain crops, chlorine has negative effects that translate into lower yield and quality.
The most important agricultural applications of sodium nitrate, potassium nitrate, and sodium potassium nitrate plant nutrients are: vegetables, fruits, industrial crops, flowers, cotton and other high-value crops.
Specialty Plant Nutrition: Our Products
Potassium nitrate, sodium potassium nitrate and specialty blends are higher margin products derived from, or consisting of, sodium nitrate, and they are all produced in crystallized or prilled form. Specialty blends are produced using our own specialty plant nutrients and other components at blending plants operated by the Company or its affiliates and related companies in Chile, the United States, Mexico, United Arab Emirates, Belgium, The Netherlands, South Africa, Turkey, Egypt, China and Thailand.
The following table shows our sales volumes of and revenues from specialty plant nutrients for 2010 and 2009.
|
2010
|
2009
|
|||||||
|
Sales Volume
(Th. MT)
|
||||||||
|
Sodium nitrate
|
16.8 | 16.5 | ||||||
|
Potassium nitrate and sodium potassium nitrate
|
546.2 | 392.1 | ||||||
|
Blended and other specialty plant nutrients(1)
|
252.4 | 256.9 | ||||||
|
Total Revenues (in US$ millions)
|
603.7 | 527.0 | ||||||
|
|
(1)
|
Includes blended and other specialty plant nutrients.
|
22
Specialty Plant Nutrition: Marketing and Customers
In 2010, we sold our specialty plant nutrients in close to 92 countries. During the same year, sales of the Company's specialty plant nutrients were exported to the following regions: 14% were sold to customers in Central and South America (not including Chile), 16% to customers in Chile, 25% to customers in North America, 22% to customers in Europe and 23% to customers in other regions. No single customer represented more than 11% of SQM's specialty plant nutrient sales during 2010, and our 10 largest customers accounted in the aggregate for no more than 32% of sales during that period.
|
Sales Breakdown
|
2010
|
2009
|
||||||
|
Central & South America
|
14 | % | 22 | % | ||||
|
North America
|
25 | % | 26 | % | ||||
|
Europe
|
22 | % | 22 | % | ||||
|
Chile
|
16 | % | 10 | % | ||||
|
Others
|
23 | % | 20 | % | ||||
The amounts set forth in the table above reflect sales of SQM's specialty plant nutrients products and do not include sales by SQM of third-party specialty plant nutrients products. We sell our specialty plant nutrients products outside Chile mainly through our own worldwide network of representative offices and through our distribution affiliates.
In November 2001, we signed an agreement with Yara. This agreement allows us to make use of Yara's distribution network in countries where its presence and commercial infrastructure are larger than ours. Similarly, in those markets where our presence is larger, both our specialty plant nutrients and Yara's are marketed through our offices. Both parties, however, maintain an active control over the marketing of their own products.
We also signed a joint venture agreement with Yara and Israel Chemicals Limited at the end of 2001. Under this joint venture agreement, SQM, Yara, and Israel Chemicals Limited are developing the liquid and soluble plant nutrient blends business through their participation in a Belgian company called NU3 N.V. ("NU3"), to which SQM and Israel Chemicals Limited contributed their blending facility in Belgium, and Yara contributed its blending facility in the Netherlands. With this joint venture agreement, important synergies have been achieved, particularly in production costs, administration and the marketing of soluble blends, strengthening the development of new products and improving customer service.
In 2005, SQM and Yara formed a joint venture called MISR Specialty Fertilizers ("MSF"), for the production of tailor-made liquid NPK (nitrogen-phosphate-potassium) fertilizers. The plant is located in Egypt and has a production capacity of 80,000 metric tons per year.
In 2005, SQM also acquired 100% of the shares of Kefco, which has a urea phosphate plant located in Dubai. Urea phosphate is a specialty plant nutrient that is used primarily in drip irrigation systems. The plant has an annual production capacity of 30,000 metric tons.
In May 2008, we signed a commitment letter for a joint venture with Migao Corporation ("Migao") for the production and distribution of specialty plant nutrients in China. In 2009, we signed a shareholders agreement in connection with this joint venture. Through the joint venture, we constructed a potassium nitrate plant with a production capacity of 40,000 metric tons per year. The plant was opened in January 2011. In addition, the joint venture will distribute the potassium nitrate produced by Migao in China and imports of SQM's specialty plant nutrients to China, and it will also handle any exports of potassium nitrate produced by the joint venture or by Migao. This joint venture will enable us to increase our presence in China, which represents one of the most important and fastest-growing markets for the fertilizer industry.
In May 2009, SQM's subsidiary Soquimich European Holdings, entered into an agreement with Coromandel Fertilizers Ltd. to create a joint venture for the production and distribution of water soluble fertilizers in India. The agreement established a 50⁄50 contribution to the joint venture. As part of the agreement, a new 15,000 metric ton facility will be constructed in the city of Kakinada to produce water soluble fertilizers (NPK grades). This new facility will require a total investment of approximately US$ 2.6 million and should be operational during 2011.
23
In October 2009, SQM S.A. signed an agreement with Qingdao Star Plant Protection Technology Co., Ltd., resulting in the creation of the joint venture SQM Qingdao, for the production, distribution and sale of soluble NPK specialty plant nutrients in China. The agreement, a 50⁄50 joint venture, entails a total investment of US$2 million. The plant, located in the city of Jimo, province of Shangdong, is currently operational and will have an annual production capacity of 15,000 metric tons.
In December 2009, SQM signed an agreement with the French Roullier Group to form the joint venture "SQM VITAS." This agreement joins two of the largest companies in the businesses of specialty plant nutrients, specialty animal nutrition and professional hygiene. Peru, Brazil and Dubai will be the main focus of this joint venture. As part of the agreement, the SQM phosphate plant located in Dubai becomes part of this joint venture. In September 2010 SQM VITAS implemented a new phosphate line that will allow the production of two of the main water soluble phosphorus products in the world: Mono Ammonium Phosphate and Urea Phosphate.
We maintain stocks of our specialty plant nutrients in the main markets of the Americas, Asia, Europe, the Middle East and Africa in order to facilitate prompt deliveries to customers. In addition, we sell specialty plant nutrients directly to some of our large customers. Sales are made pursuant to spot purchase orders and short-term contracts.
In connection with our marketing efforts, we provide technical and agronomical assistance and support to our customers. By working closely with our customers, we are able to identify new, higher-value-added products and markets. Our specialty plant nutrients products are used on a wide variety of crops, particularly value-added crops, where the use of our products enables our customers to increase yield and command a premium price.
Our customers are located in both the northern and southern hemispheres. Consequently, there are no material seasonal or cyclical factors that can materially affect the sales of our specialty plant nutrient products.
Specialty Plant Nutrition: Fertilizer Sales in Chile
We market specialty plants nutrients in Chile through Soquimich Comercial S.A. which sells these products either alone or in blends with other imported products, mainly triple super phosphate (TSP) and diammonium phosphate (DAP), among others.
Soquimich Comercial sells imported fertilizers to farmers in Chile mainly for application in the production of sugar beets, cereals, industrial crops, potatoes, grapes and other fruits. Most of the fertilizers that Soquimich Comercial S.A. imports are purchased on a spot basis from different countries in the world.
We believe that all contracts and agreements between Soquimich Comercial S.A. and third party suppliers, with respect to imported fertilizers, contain standard and customary commercial terms and conditions. During the preceding ten years, Soquimich Comercial S.A. has experienced no material difficulties in obtaining adequate supplies of such fertilizers at satisfactory prices, and we expect continuing to do so in the future.
We estimate that Soquimich Comercial S.A.'s sales of fertilizers represented approximately 31% of total fertilizer sales in Chile during 2010. No single customer represented more than 2% of Soquimich Comercial S.A.’s total fertilizer sales revenues, and its 10 largest customers in total represented less than 10% of revenues.
Revenues generated by Soquimich Comercial S.A. represented 9.7% of the Company's 2010 consolidated revenues. Soquimich Comercial S.A.'s consolidated revenues were approximately US$178 million and US$189 million in 2010 and 2009 respectively.
24
Specialty Plant Nutrition: Competition
We believe we are the world's largest producer of sodium and potassium nitrate for agricultural use. Our sodium nitrate products compete indirectly with specialty and commodity-type substitutes, which may be used by some customers instead of sodium nitrate depending on the type of soil and crop to which the product will be applied. Such substitute products include calcium nitrate, ammonium nitrate and calcium ammonium nitrate.
In the potassium nitrate market our largest competitor is Haifa Chemicals Ltd. ("Haifa"), in Israel, which is a subsidiary of Trans Resources International Inc. We estimate that sales of potassium nitrate by Haifa accounted for approximately 34% of total world sales during 2010 (excluding sales by Chinese producers who generally sell to the domestic Chinese market).
S.C.M. Virginia, a Chilean iodine producer, ultimately controlled by Inverraz S.A., also produces potassium nitrate from caliche ore. However, they have been focused on the production of sodium potassium nitrate during the last few years. ACF, another Chilean producer, mainly oriented to iodine production, began production of potassium nitrate from caliche ore and potassium chloride during 2005. Kemapco, a Jordanian producer owned by Arab Potash, produces potassium nitrate in a plant located close to the Port of Aqaba, Jordan. In addition, there are several potassium nitrate producers in China, the largest of which are Wentong and Migao. Most of the Chinese production is consumed by the Chinese domestic market.
The principal means of competition in the sale of potassium nitrate are product quality, customer service, location, logistics, agronomic expertise and price.
Through a partially owned facility, NU3, we also produce soluble and liquid fertilizers using our potassium nitrate as a raw material. Through this activity, we have acquired production technology and marketing know-how, which we believe will be useful for selling our products to greenhouse growers and for use in certain high-technology processes such as fertigation and hydroponics.
In Chile, our products mainly compete with imported fertilizer blends that use calcium ammonium nitrate or potassium magnesium sulfate. Our specialty plant nutrients also compete indirectly with lower-priced synthetic commodity-type fertilizers such as ammonia and urea, which are produced by many producers in a highly price-competitive market. Our products compete on the basis of advantages that make them more suitable for certain applications as described above.
Iodine and its derivatives
We are the world's largest producer of iodine. In 2010, our revenues from iodine and iodine derivatives amounted to US$316.3 million, representing 17% of our total revenues in that year. We estimate that our sales accounted for 36% of world iodine sales by volume in 2010.
Iodine: Market
Iodine and iodine derivatives are used in a wide range of medical, agricultural and industrial applications as well as in human and animal nutrition products. Iodine and iodine derivatives are used as raw materials or catalysts in the formulation of products such as x-ray contrast media, biocides, antiseptics and disinfectants, pharmaceutical intermediates, polarizing films for LCDs, chemicals, herbicides, organic compounds and pigments. Iodine is also added in the form of potassium iodate or potassium iodide to edible salt to prevent iodine deficiency disorders.
25
Iodine: Our Products
We produce iodine, and through a joint venture with Ajay North America L.L.C., ("Ajay"), a U.S.-based Company, we produce organic and inorganic iodine derivatives. Ajay-SQM Group ("ASG"), established in the mid 1990s, has production plants in the United States, Chile and France. ASG is the world's leading inorganic and organic iodine derivatives producer.
Consistent with our business strategy, we are constantly working on the development of new applications for our iodine-based products, pursuing a continuing expansion of our businesses and maintaining our market leadership.
We manufacture our iodine and iodine derivatives in accordance with international quality standards and have qualified our iodine facilities and production processes under the ISO-9001:2008 program, providing third party certification of the quality management system and international quality control standards that we have implemented.
The following table sets forth our total sales and revenues from iodine and iodine derivatives for 2010 and 2009:
|
2010
|
2009
|
|||||||
|
Sales Volume (Th. MT)
|
||||||||
|
Iodine and derivatives
|
11.9 | 7.2 | ||||||
|
Revenues (in US$ millions)
|
316.3 | 190.9 | ||||||
Our sales revenues in 2010 increased from US$190.9 million to US$316.3 million, mainly due to increases in sales volume derived from the quick recovery in demand to levels even higher than those seen before the global economic slowdown in 2008. Solid demand in this market was complimented by tightened supply, making SQM uniquely positioned to meet the shortfall.
Iodine: Marketing and Customers
In 2010, we sold our iodine products to over 300 customers in 62 countries. During the same year, most of our sales were exported: 35% was sold to customers in Europe, 33% to customers in North America, 5% to customers in Central and South America and 27% to customers in Asia, Oceania and other regions. No single customer accounted for more than 8% of the Company's iodine sales in 2010, and our ten largest customers accounted in the aggregate for no more than 36% of sales.
|
Sales Breakdown
|
2010
|
2009
|
||||||
|
Europe
|
35 | % | 31 | % | ||||
|
North America
|
33 | % | 36 | % | ||||
|
Central & South America
|
5 | % | 3 | % | ||||
|
Others
|
27 | % | 30 | % | ||||
We sell iodine through our own worldwide network of representative offices and through our sales, support and distribution affiliates. We maintain inventories of iodine at our facilities throughout the world to facilitate prompt delivery to customers. Iodine sales are made pursuant to spot purchase orders and short, medium and long-term contracts. Sales agreements generally specify annual minimum and maximum purchase commitments, and prices are adjusted periodically, according to prevailing market prices.
Iodine: Competition
SQM and several producers in Chile, Japan and the United States are the world's main iodine producers. There is also production of iodine in Russia, Turkmenistan, Indonesia and China.
Iodine production in Chile starts from minerals, whereas in Japan, the United States, Russia, Turkmenistan and Indonesia producers extract iodine from underground brines which are mainly obtained together with the extraction of natural gas and petroleum. In China, iodine is extracted from seaweed.
26
Four Chilean companies, including SQM, accounted for approximately 58% of such sales (36% by SQM and 22% by the other Chilean producers). Other Chilean producers include Atacama Minerals Corp., a Canadian company that has its iodine operations in Chile, Atacama Chemical S.A. (Cosayach), which is controlled by Inverraz S.A. and ACF Minera S.A. Currently, ACF is developing a new mining operation in the Antofagasta Region of Chile. At this time, it is difficult to estimate the production capacity of this operation.
We estimate that eight Japanese iodine producers accounted for approximately 21%, without considering iodine recycling from Japan, of world iodine sales in 2010.
We estimate that iodine producers in the United States (one of which is owned by Ise Chemicals Ltd., a Japanese company) accounted for almost 5% of world iodine sales in 2010. In 2009, a new U.S.-based player, Iofina, entered the iodine market. While Iofina could become a relevant player in coming years, so far they have produced very small quantities.
Iodine recycling is an increasing trend worldwide. Several Japanese producers have recycling facilities where they recover iodine and iodine derivatives from iodine waste streams. Iodine recycling, mainly related to LCD consumption, has increased over the past few years and currently represents approximately 15% of world iodine sales. It is estimated that around 70% to 75% of the world recycling was done by Japanese iodine producers.
SQM, through ASG or alone, is also actively participating in the iodine recycling business using iodinated side-streams from a variety of chemical processes in Europe, the United States and Asia.
We estimate that worldwide sales of iodine amounted to approximately 29,900 metric tons in 2010.
The prices of our iodine and iodine derivative products are determined by world iodine prices, which are subject to market conditions. World iodine prices vary depending upon, among other things, the relationship between supply and demand at any given time. The supply of iodine varies principally depending upon the production of the few major iodine producers (including us) and their respective business strategies. As a result of a steady growing demand, iodine prices have been increasing since the end of 2003. While prices were around US$13 per kilogram in 2003, they reached an average of approximately US$28 per kilogram in 2010.
Demand for iodine varies depending upon overall levels of economic activity and the level of demand in the medical, pharmaceutical, industrial and other sectors that are the main users of iodine and iodine-derivative products.
The main factors of competition in the sale of iodine and iodine derivative products are reliability, price, quality, customer service and the price and availability of substitutes. We believe we have competitive advantages compared to other producers due to the size and quality of our mining reserves and the production capacity. We believe our iodine is competitive with that produced by other manufacturers in certain advanced industrial processes. We also believe we continue to benefit competitively from the long-term relationships we have established with our larger customers. While there are substitutes for iodine available for certain applications, such as antiseptics and disinfectants, there are no cost-effective substitutes currently available for the main nutritional, pharmaceutical, animal feed, and main chemical uses of iodine, which together account for most iodine sales.
Lithium and its derivatives
We believe we are the world's largest producer of lithium carbonate and one of the world's largest producers of lithium hydroxide. In 2010, our revenues from lithium sales amounted to US$150.8 million, representing 8% of our total revenues. We estimate that our sales accounted for approximately 32% of the world's demand of lithium chemicals in volume.
27
Lithium: Market
Lithium carbonate is used in a variety of applications, including batteries, ceramic and enamel frits, heat resistant glass (ceramic glass), primary aluminum, air conditioning chemicals, continuous casting powder for steel extrusion, synthesis of pharmaceuticals and lithium derivatives.
Lithium hydroxide is primarily used as a raw material in the lubricating grease industry, as well as in the dyes and battery industries.
Lithium: Our Products
We produce lithium carbonate at the Salar del Carmen facilities, near Antofagasta, Chile, from solutions with high concentrations of lithium coming from the potassium chloride production at the Salar de Atacama. The annual production capacity of such lithium carbonate plant is 43,500 MT per year. We believe that the technologies we use, together with the high concentrations of lithium and unique characteristics of the Salar de Atacama, such as high evaporation rate and concentration of other minerals, allow us to be one of the lowest cost producers worldwide.
We also produce lithium hydroxide at our facilities at the Salar del Carmen next to the lithium carbonate operation. The lithium hydroxide facility has a production capacity of 6,000 MT per year and is one of the largest plants in the world.
The following table sets forth our total sales and revenues from lithium carbonate and its derivatives for 2010 and 2009:
|
2010
|
2009
|
|||||||
|
Sales Volume (Th. MT)
|
||||||||
|
Lithium and derivatives
|
32.4 | 21.3 | ||||||
|
Revenues (in US$ millions)
|
150.8 | 117.8 | ||||||
Our sales revenues in 2010 reached US$150.8 million, an increase from US$117.8 million in 2009, due to significantly higher sales volumes resulting from a sharp recovery of demand in 2010, driven by rechargeable batteries and also by the return of operational inventories to previous levels throughout the supply chain.
Lithium: Marketing and Customers
In 2010, we sold our lithium products to over 300 customers in approximately 50 countries. Virtually all of our lithium products were sold overseas: 34% to customers in Europe, 12% to customers in North America, 53% to customers in Asia and Oceania and 1% to customers in other regions. No single customer accounted for more than 14% of the Company's lithium sales in 2010, and our ten largest customers accounted in the aggregate for no more than 48% of sales.
|
Sales Breakdown
|
2010
|
2009
|
||||||
|
Europe
|
34 | % | 31 | % | ||||
|
North America
|
12 | % | 14 | % | ||||
|
Asia & Oceania
|
53 | % | 53 | % | ||||
|
Others
|
1 | % | 2 | % | ||||
Lithium: Competition
Our main competitors in the lithium carbonate and lithium hydroxide businesses are Chemetall GmbH ("Chemetall," a subsidiary of Rockwood Specialties Group Inc.) and FMC Corporation ("FMC"). In addition, a number of Chinese producers together accounted for approximately 30% of the world market in 2010 in volume. Chemetall produces lithium carbonate in its operations located in Chile through Sociedad Chilena del Litio Limitada and in Nevada, United States. Its production of downstream lithium products is mostly performed in the United States, Germany and Taiwan. FMC has production facilities in Argentina through Minera del Altiplano S.A., where they produce lithium chloride and lithium carbonate. Production of its downstream lithium products is mostly performed in the United States and the United Kingdom.
28
Lithium carbonate and lithium hydroxide are produced in China and we believe this production will increase in the near future. Other new projects to develop lithium deposits worldwide have been announced recently. We believe that some of these projects could materialize in the short to medium term.
We estimate that worldwide sales of lithium chemicals expressed as lithium carbonate equivalent (excluding direct use for lithium minerals) amounted to approximately 101,500 metric tons in 2010.
Industrial Chemicals
In addition to producing sodium and potassium nitrate for agricultural applications, we produce three grades of sodium and potassium nitrate for industrial applications: industrial, technical and refined grades. The three grades differ mainly in their chemical purity. Our industrial grades of sodium and potassium nitrate also differ from agricultural grade in the degree of purity. We enjoy certain operational flexibility when producing industrial sodium and potassium nitrate because they are produced from the same process as their equivalent agricultural grades, needing only an additional step of purification. We may, with certain constraints, shift production from one grade to the other depending on market conditions. This flexibility allows us to maximize yields as well as to reduce commercial risk. In addition to producing industrial nitrates, we produce and commercialize other industrial chemicals such as boric acid—a by-product of the production of potassium sulfate—and industrial-grade potassium chloride, both sold into industrial markets in crystalline form. In 2010, our revenues from industrial chemicals were US$149.7 million, representing 8% of our total revenues for that year.
Industrial Chemicals: Market
Industrial sodium and potassium nitrates are used in a wide range of industrial applications, including the production of glass, ceramics, explosives, charcoal briquettes and various chemical processes and metal treatments. In addition, the most significant growth potential comes from industrial nitrates for thermal storage in solar energy projects.
Boric acid is mainly used as raw material in the manufacturing of glass, fiberglass, ceramic and enamel frits, and LCD flat panel displays.
Industrial potassium chloride is mainly used as an additive in oil and gas drilling fluids as well as in the production of carragenine.
Industrial Chemicals: Our Products
The following table sets forth our sales volumes of industrial chemicals and total revenues for 2010 and 2009:
|
2010
|
2009
|
|||||||
|
Sales Volume (Th. MT)
|
||||||||
|
Industrial nitrates
|
198.9 | 149.2 | ||||||
|
Boric Acid
|
2.6 | 3.4 | ||||||
|
Revenues (in US$ millions)
|
149.7 | 115.4 | ||||||
Sales of industrial chemicals increased from US$115.4 million in 2009 to US$149.7 million, mainly due to a fast recovery in sales volumes after the global economic slowdown.
29
Industrial Chemicals: Marketing and Customers
We sold our industrial nitrate products in more than 50 countries in 2010. Eighteen percent of our sales of industrial chemicals were made to customers in North America, 55% to customers in Europe, 22% to customers in Central and South America and 5% to customers in Asia, Oceania and other regions. No single customer accounted for more than 16% of the Company's sales of industrial chemicals in 2010, and our ten largest customers accounted in the aggregate for no more than 56% of such sales.
|
Sales Breakdown
|
2010
|
2009
|
||||||
|
North America
|
18 | % | 30 | % | ||||
|
Europe
|
55 | % | 45 | % | ||||
|
Central & South America
|
22 | % | 18 | % | ||||
|
Others
|
5 | % | 7 | % | ||||
We sell our industrial chemical products mainly through our own worldwide network of representative offices and through our sales and distribution affiliates. We maintain inventories of our different grades of sodium nitrate and potassium nitrate products at our facilities in Europe, North America, South Africa and South America to achieve prompt deliveries to customers. Industrial sodium and potassium nitrate sales are made pursuant to spot purchase orders. Our Research and Development department, together with our foreign affiliates, provide technical support to our customers and continuously work with them to develop new products or applications for our products.
Industrial Chemicals: Competition
We believe we are the world's largest producer of industrial sodium and potassium nitrate. In the case of industrial sodium nitrate, we estimate that our sales represented 55% of world demand in 2010 (excluding China and India internal demand, for which reliable estimates are not available). Our competitors are mainly in Europe and Asia, producing sodium nitrate as a by-product of other production processes. In refined grade sodium nitrate, BASF AG, a German corporation and several producers in China and Eastern Europe are highly competitive in the European and Asian markets. Our industrial sodium nitrate products also compete indirectly with substitute chemicals, including sodium carbonate, sodium hydroxide, sodium sulfate, calcium nitrate and ammonium nitrate, which may be used in certain applications instead of sodium nitrate and are available from a large number of producers worldwide.
Our main competitor in the industrial potassium nitrate market is Haifa Chemicals Ltd., which we estimate has a 20% market share in the industrial sector. We estimate our market share at approximately 28% for 2010.
Producers compete in the market for industrial sodium and potassium nitrate based on reliability, product quality, price and customer service. We believe that we are a low cost producer of both products and are able to produce high quality products.
In the boric acid market, we are a relatively small producer mainly supplying regional needs.
In the industrial potassium chloride market, we intend to increase our current minor presence.
Potassium
We produce potassium chloride and potassium sulfate by extracting brines from the Salar de Atacama that are rich in potassium chloride and other salts.
30
In 2010, our potassium chloride and potassium sulfate revenues amounted to US$528.2 million, representing 29% of our total revenues and a 32.3% increase with respect to 2009. We are currently making investments in potassium chloride and potassium sulfate that will enable us to increase our production and sales of this product.
Sales of potassium chloride and potassium sulfate are reported together. This new classification better reflects the fact that both products are derived from the same natural resource, that they share a production process and that potassium is the most relevant driver for costs and pricing. This new classification is also consistent with the market approach to reporting potassium products. Potassium sulfate sales include sales of third party products.
Potassium is one of the three macronutrients that a plant needs to develop. Although potassium does not form part of a plant's structure, it is essential to the development of its basic functions. Potassium chloride is the most common potassium-based fertilizer, and it is used to fertilize crops that can resist high levels of chloride, such as wheat, corn and soybeans, among others.
Potassium chloride is also an important component for our specialty plant nutrients business line. It is used as a raw material to produce potassium nitrate.
Potassium: Market
During the last decade, the potassium chloride market has experienced rapid growth due to several key factors such as a growing world population, higher demand for protein-based diets and less arable land. All of these factors have contributed to growing demand for fertilizers, and in particular potassium chloride, as efforts are being made to maximize crop yields and use resources efficiently. During this same period, major players in this industry on the supply side have produced potassium chloride according to market demand. Historically demand levels have been below market production capacity.
However, market demand and production are being pushed towards existing levels of production capacity. For much of 2008, demand outpaced production, which led to substantial increases in potassium chloride prices. During the latter part of 2008, however, demand for potassium chloride began to fall as a result of the global economic slowdown.
During 2009, demand of potassium chloride was estimated to be approximately 45% lower than in 2008. We estimate that demand reached the level of 52 million metric tons in 2010, representing an increase of around 80% over the previous year.
Potassium: Our Products
Potassium chloride differs from our other specialty plant nutrient products because it is a commodity fertilizer and contains chloride. SQM offers potassium chloride in two grades: standard and compacted. Potassium sulfate is considered a specialty fertilizer and SQM offers three grades: standard, compacted and soluble.
The following table shows our sales volumes of and revenues from potassium chloride and potassium sulfate for 2010 and 2009.
|
2010
|
2009
|
|||||||
|
Sales Volume (Th. MT)
|
||||||||
|
Potassium Chloride & Potassium Sulfate
|
1,273.0 | 690.0 | ||||||
|
Revenues (in US$ millions)
|
528.2 | 399.1 | ||||||
Potassium: Marketing and Customers
In 2010, we sold potassium chloride and potassium sulfate in approximately 93 countries. Six percent of our sales were sold to customers in Chile, 21% to customers in Latin America and 73% to customers in other regions. No single customer accounted for more than 24% of the Company's sales of potassium chloride and potassium sulfate in 2010, and our ten largest customers accounted in the aggregate for no more than 58% of such sales.
31
|
Sales Breakdown
|
2010
|
2009
|
||||||
|
Chile
|
6 | % | 9 | % | ||||
|
Latin America
|
21 | % | 18 | % | ||||
|
Others
|
73 | % | 73 | % | ||||
Potassium: Competition
We estimate that SQM accounted for less than 3% of global sales of potassium chloride and potassium sulfate in 2010. We also believe that the largest producers of potassium chloride are PCS, accounting for approximately 16.5% of the global sales, and the companies of the former Soviet Union (Beraluskali, Urakali and Silvinit) which together account for 33% of global sales. Uralkali and Silvinit started a merger process to form a single company at the beginning of 2011.
In the potassium sulfate market, we have several competitors of which the most important are K+S KALI GmbH (Germany), Tessenderlo Chemie (Belgium) and Great Salt Lake Minerals Corp. (United States). We believe that those three producers account for approximately 50% of the world production of potassium sulfate.
Production Process
Our integrated production process can be classified according to our natural resources:
|
·
|
Caliche ore deposits: contain nitrates and iodine.
|
|
·
|
Salar brines: contain potassium, lithium, sulfate, boron and magnesium.
|
Caliche Ore Deposits
Caliche deposits are located in northern Chile, where during 2010 we operated four mines: Pedro de Valdivia, María Elena (El Toco), Pampa Blanca and Nueva Victoria. In March 2010, operations at the El Toco (mining site of Maria Elena production facilities) and Pampa Blanca mines were temporarily suspended due to decreased global demand for nitrates and iodine during the preceding 15 months. These operations were also suspended in an effort to optimize inventory of these products. Mining activites resumed at María Elena in November 2010.
Caliche ore is found under a layer of barren overburden in seams with variable thickness from twenty centimeters to five meters, and with the overburden varying in thickness from half a meter to one and a half meters.
Before proper mining begins, a full exploration stage is carried out, including full geological reconnaissance, sampling and drilling caliche ore to determine the features of each deposit and its quality. Drill-hole samples properly identified are tested at our chemical laboratories. With the exploration information on a closed grid pattern of drill holes, the ore evaluation stage provides information for mine planning purpose. Mine planning is done on a long-term basis (10 years), medium-term basis (three years) and short-term basis (one year). A mine production plan is a dynamic tool that details daily, weekly and monthly production plans. After drill holes are made, information is updated to offer the most accurate ore supply schedule to the processing plants.
The process generally begins with bulldozers first ripping and removing the overburden in the mining area. This process is followed by production drilling and blasting to break the caliche seams. Front-end loaders load the ore on off-road trucks. In the Pedro de Valdivia mine, trucks deliver the ore to stockpiles next to rail loading stations. The stockpiled ore is later loaded on to railcars that take the mineral to the processing facilities. Until the suspension of the mining operations at El Toco, trucks hauled the ore and dumped it directly at a crushing installation, after which a 14-kilometer-long overland conveyor belt system delivered the ore to the processing facilities.
32
At the Pedro de Valdivia facility, the ore is crushed and leached to produce concentrated solutions carrying the nitrate, iodine and sodium sulfate. The crushing of the ore produces a coarse fraction that is leached in a vat system and a fine fraction that is leached by agitation. These are followed by liquid-solid separation, where solids precipitate as sediment and liquids containing nitrate and iodine are sent to be processed. This same process was followed at the El Toco mining operation until operations were suspended in March 2010. In November 2010, operations resumed at the El Toco mining site of Maria Elena using a heap leaching production process. In Nueva Victoria, the run of mine ore is loaded in heaps and leached to produce concentrated solutions. This process was also used at Pampa Blanca operations until mining operations were suspended during 2010.
Caliche Ore-Derived Products
Caliche ore-derived products are: sodium nitrate, potassium nitrate, sodium potassium nitrate, iodine and iodine derivatives.
Sodium Nitrate
During 2010, sodium nitrate for both agricultural and industrial applications was produced at the María Elena facitly, until production was idled in March 2010, and at the Pedro de Valdivia facility using the Guggenheim method, which was originally patented in 1921 and is based in a closed circuit of leaching vats. This process uses a heated brine to leach the crushed caliche in the vats and selectively dissolve the contents. The concentrated solution is then cooled, producing the growing of sodium nitrate crystals which can then be separated from the brine using basket centrifuges. After the cristalization process, the brine is pumped to the iodine facilities, where the iodide is separated using a solvent extraction plant, and finally the brine is returned to the vat leaching process. The fine fraction of caliche´s crushing process is leached at ambient temperature with water, producing a weak solution that is pumped to iodine facilities. After a solvent extraction process, the brine is pumped to solar evaporation ponds in Coya Sur 15 km south of María Elena.
The remaining material from the sodium nitrate crystallization process is vat leach tailings. These tailings are unloaded from the leaching vats and deposited at sites near the production facilities. Our total current crystallized sodium nitrate production capacity at Pedro de Valdivia facility is approximately 500,000 metric tons per year. Crystallized sodium nitrate is processed further at Coya Sur and María Elena production plants to produce potassium nitrate and/or crystallized or prilled nitrates (potassium or sodium), which is transported to our port facilities in Tocopilla by railway. A significant part of the sodium nitrate produced at María Elena, until its temporary suspension in March 2010, and Pedro de Valdivia was used in the production of potassium nitrate at Coya Sur, sodium potassium nitrate at María Elena and a highly refined industrial grade sodium nitrate at Coya Sur.
Potassium Nitrate
Potassium nitrate is produced at our Coya Sur facility using a production process developed by SQM. The brine leached with the fine fraction process at Pedro de Valdivia and the brines produced by heap leaching process in Maria Elena are pumped to Coya Sur solar evaporation ponds for a nitrate concentration process. After the nitrate concentration process, the brine is pumped to a conversion plant where potassium chloride is added and a chemical reaction begins and produces brine with dissolved potassium nitrate. This brine is pumped to a crystallization plant, which crystallizes the potassium nitrate by cooling and separating it from the mother liquid by centrifuge.
Concentrated nitrate salts were produced at Pampa Blanca up to March 2010, and are currently produced at Nueva Victoria by leaching caliche ore in heaps in order to extract solutions that are rich in iodine and nitrates. These solutions are then sent to plants were iodine is extracted through a solvent-extraction process. The remaining solutions are subsequently sent to solar evaporation ponds where the solutions are evaporated and rich nitrate salts are produced. These concentrated nitrate salts are then sent to Coya Sur where they are used to produce potassium nitrate.
33
Our current potassium nitrate production capacity at Coya Sur is 950,000 metric tons per year, including 260,000 metric tons per year of technical grade potassium nitrate. A new potassium nitrate plant was commissioned during March 2011. The plant is currently running at 90% capacity, but we expect to reach the nominal rate of 300,000 metric tons per year by the end of the third quarter of 2011. This new plant will use as raw materials salts harvested in Nueva Victoria and potassium salts from Salar de Atacama.
The nitrates produced in crystallized or prilled form at Coya Sur have been certified by TÜV-Rheiland under the quality standard ISO 9001:2008. Potassium nitrate produced at Coya Sur and María Elena is transported to Tocopilla for shipping to customers and distributors.
Sodium Potassium Nitrate
Sodium potassium nitrate is a mixture of approximately two parts sodium nitrate per one part potassium nitrate. We produce sodium potassium nitrate at our María Elena priling facility using standard, non-patented production methods we have developed. Crystallized sodium nitrate is mixed with the crystallized potassium nitrate to make sodium potassium nitrate, which is then prilled. The prilled sodium potassium nitrate is transported to Tocopilla for bulk shipment to customers.
The production process for sodium potassium nitrate is basically the same as that for sodium nitrate and potassium nitrate.
With certain production restraints and following market conditions we may supply sodium nitrate, potassium nitrate or sodium potassium nitrate either in prilled or crystallized form.
Iodine and Iodine Derivatives
We produce iodine at our Pedro de Valdivia and Nueva Victoria facilities. During 2010, Iodine was produced by extracting it from the solutions resulting from the leaching of caliche ore at the Pedro de Valdivia, María Elena, Nueva Victoria and Pampa Blanca facilities. As of March 2010, mining operations at Maria Elena and Pampa Blanca were temporarily suspended. In November 2010, operations resumed at the María Elena mining site.
As in the case of nitrates, the process of extracting iodine from the caliche ore is well established, but variations in the iodine and other chemical contents of the treated ore and other operational parameters require a high level of know-how to manage the process effectively and efficiently.
The solutions resulting from the leaching of caliche carry iodine in iodate form. Part of the iodate solution is reduced to iodide using sulfur dioxide, which is produced by burning sulfur. The resulting iodide is combined with the rest of the untreated iodate solution to release elemental iodine in low concentrations. The iodine is then extracted from the aqueous solutions and concentrated as iodide form using a solvent extraction and stripping plant. The concentrated iodide is oxidized to solid iodine, which is then refined through a smelting process and prilled. We have obtained patents in the United States for our iodine prilling process.
Prilled iodine is tested for quality control purposes, using international standard procedures that we have implemented, then packed in 20-50 kilogram drums or 350-700 kilogram maxibags and transported by truck to Antofagasta or Iquique for export. Our iodine and iodine derivatives production facilities have qualified under the new ISO-9001:2008 program, providing third-party certification—by TÜV-Rheiland —of the quality management system. The last recertification process was carried out and approved at the end of 2010.
34
Our total iodine production in 2010 was approximately 8.8 thousand metric tons: approximately 4.8 thousand metric tons from Nueva Victoria, 3.0 thousand metric tons from Pedro de Valdivia, 0.8 thousand metric tons from Pampa Blanca and 0.2 thousand metric tons from María Elena. The Nueva Victoria facility is also used for recycling iodine from the potassium iodide contained in the LCD waste solutions imported mainly from Korea. Nueva Victoria is also equipped to toll iodine from iodide delivered from other SQM facilities. We have the flexibility to adjust our production according to market conditions. Our total current production capacity at our iodine production plants is approximately 12,500 MT per year.
We use a portion of the produced iodine to manufacture inorgani iodine derivatives, which are intermediate products used for manufacturing agricultural and nutritional applications, at facilities located near Santiago, Chile, and also produce inorganic and organic iodine derivative products together with Ajay that purchases iodine from us. We have in the past primarily marketed our iodine derivative products in South America, Africa and Asia, while Ajay and its affiliates have primarily sold their iodine derivative products in North America and Europe.
In September 2010, the National Environmental Commission approved the Environmental Study of our Pampa Hermosa project, in the I Region of Chile.
This approval will allow us to increase the production capacity of our Nueva Victoria operations from 4,500 to 11,000 metric tons of iodine per year. This increase will produce up to 1.2 million metric tons of nitrates, will mine up to 33 million metric tons of caliche per year and will use new water rights of up to 570.8 liters per second.
Since the fourth quarter of 2010, we have made investments in order to increase the plant capacity of iodine in New Victoria, to reach 5,000 metric tons/year. Additionally, between 2011 and 2012, investments will be made to expand the capacity of solar evaporation ponds and to implement new areas of mining and the collection of solutions. Production in the Iris plant is also expected to restart during this period.
Salar de Atacama Brine Deposits
The Salar de Atacama, located approximately 250 kilometers east of Antofagasta, is a salt-encrusted depression in the Atacama desert, within which lies an underground deposit of brines contained in porous sodium chloride rock fed by an underground inflow of water from the Andes mountains. The brines are estimated to cover a surface of approximately 2,800 square kilometers and contain commercially exploitable deposits of potassium, lithium, sulfates and boron. Concentrations vary at different locations throughout the Salar de Atacama. Our production rights to the Salar de Atacama are pursuant to a lease agreement with the Chilean government, expiring in 2030.
Brines are pumped from depths between 1.5 and 60 meters below surface, through a field of wells that are located in areas of the Salar de Atacama that contain relatively high concentrations of potassium, lithium, sulfate, boron and other minerals.
We process these brines to produce potassium chloride, lithium carbonate, lithium hydroxide, lithium chloride, potassium sulfate, boric acid and bischofite (magnesium chloride).
Potassium Chloride
We use potassium chloride in the production of potassium nitrate. Production of our own supplies of potassium chloride provides us with substantial raw material cost savings.
35
In order to produce potassium chloride, brines from the Salar de Atacama are pumped to solar evaporation ponds. Evaporation of the brines results in a complex crystallized mixture of salts of potassium chloride and sodium chloride. One portion of this mixture is harvested and stored, and the other portion is reprocessed and the remaining salts are transferred by truck to a processing facility where the potassium chloride is separated by a grinding, flotation, and filtering process. Potassium chloride is sent approximately 300 kilometers to our Coya Sur facilities via a dedicated truck transport system, where it is used in the production of potassium nitrate. We sell potassium chloride produced at the Salar de Atacama in excess of our needs to third parties. All of our potassium-related production facilities in the Salar de Atacama currently have a production capacity in excess of up to 1.9 million metric tons per year. Actual production capacity will depend on volumes and quality of the mining resources pumped from the Salar de Atacama. During 2010 actual production was higher than in 2009, and we expect that 2011 production will be higher than in 2010.
During 2009, we increased production capacity of our potassium chloride facility to approximately 1,050,000 metric tons per year. In addition, during 2009 we converted our potassium sulfate facility to a dual plant, with the production capacity to produce only potassium chloride or to produce both potassium sulfate and potassium chloride. If the facility produces only potassium chloride, we have an additional 600,000 metric tons per year of production capacity of potassium chloride. During 2011, further expansion of this plant will allow the plant to produce, at the same time, potassium sulfate and potassium chloride with a total capacity of 1,150,000 metric tons per year.
In addition we have other 2 plants to produce potassium chloride with a combined capacity of 265,000 metric tons per year.
The by-products of the potassium chloride production process are (i) brines remaining after removal of the potassium chloride, which are used to produce lithium carbonate as described below, and the amount in excess of our needs is reinjected into the Salar de Atacama; (ii) sodium chloride, which is similar to the surface material of the Salar de Atacama and is deposited at sites near the production facility; and (iii) other salts containing magnesium chloride.
Lithium Carbonate and Lithium Chloride
A portion of the brines remaining after the production of potassium chloride is sent to additional solar concentration ponds adjacent to the potassium chloride production facility. Following additional evaporation, the remaining concentrated solution of lithium chloride is transported by truck to a production facility located near Antofagasta, approximately 230 kilometers from the Salar de Atacama. At the production facility, the solution is purified and treated with sodium carbonate to produce lithium carbonate, which is dried and then, if necessary, compacted and finally packaged for shipment. A portion of this purified lithium chloride solution is packaged and shipped to customers. The production capacity of our lithium carbonate facility is approximately 43,500 metric tons per year. Future production will depend on the actual volumes and quality of the lithium solutions sent by the Salar de Atacama operations, as well as prevailing market conditions.
Lithium carbonate production quality assurance program has been certified by TÜV-Rheiland under ISO 9001:2000 since 2005 and under ISO 9001:2008 since October 2009.
Lithium Hydroxide
Lithium carbonate is sold to customers, and we also use it as a raw material for our lithium hydroxide monohydrate facility, which started operations at the end of 2005. This facility has a production capacity of 6,000 metric tons per year and is located in the Salar del Carmen, adjacent to our lithium carbonate operations. In the production process, lithium carbonate is reacted with a lime solution to produce lithium hydroxide brine and calcium carbonate salt, which is filtered and piled in reservoirs. The brine is evaporated in a multiple effect evaporator and crystallized to produce the lithium hydroxide monohydrate, which is dried and packaged for shipment to customers.
Lithium hydroxide production quality assurance program has been certified by TÜV-Rheiland under ISO 9001:2000 since 2007 and under ISO 9001:2008 since October 2009.
36
Potassium Sulfate and Boric Acid
Approximately 12 kilometers northeast of the potassium chloride facilities at the Salar de Atacama, we use the brines from the Salar de Atacama to produce potassium sulfate, potassium chloride (as a byproduct of potassium sulfate process) and boric acid. The plant is located in an area of the Salar de Atacama where high sulfate and potassium concentrations are found in the brines. Brines are pumped to preconcentration solar evaporation ponds where waste sodium chloride salts are removed by precipitation. After further evaporation, the sulfate and potassium salts are harvested and sent for treatment at the potassium sulfate plant. Potassium sulfate is produced using flotation, concentration and reaction processes, after which it is crystallized, dried and packaged for shipment. Production capacity for potassium sulfate is approximately 300,000 MT per year.
The principal by-products of the production of potassium sulfate are: (i) non-commercial sodium chloride, which is deposited at sites near the production facility, and (ii) remaining solutions, which are reinjected into the Salar de Atacama or returned to the evaporation ponds. The principal by-products of the boric acid production process are remaining solutions that are treated with sodium carbonate to neutralize acidity and then are reinjected into the Salar de Atacama.
Raw Materials
The main raw material that we require in the production of nitrate and iodine is caliche ore, which is obtained from our surface mines. The main raw material in the production of potassium chloride, lithium carbonate and potassium sulfate is the brine extracted from our operations at the Salar de Atacama.
Other important raw materials are sodium carbonate (used for lithium carbonate production and for the neutralization of iodine solutions), sulfur, sulfuric acid, kerosene, anti-caking and anti-dust agents, ammonium nitrate (used for the preparation of explosives in the mining operations), woven bags for packaging our final products, electricity acquired from electric utilities, and diesel and fuel oil in heat generation. We use diesel and fuel oil as the main energy source in heat generation. Our raw material costs (excluding caliche ore, salar brines and including energy) represented 17.6% of our cost of sales in 2010.
In 1998, we entered into a long-term (15-year) electricity supply agreement with Norgener S.A., a major Chilean electricity producer. In 1999, we entered into a long-term electricity supply agreement with Electroandina S.A., also a major Chilean electricity producer. The agreement has a 10-year term, extending to 2009, with two, three-year renewal options exercisable by us. In 2009, we exercised our first extension option. Since April 2000, we have been connected to the northern power grid, which currently supplies electricity to most cities and industrial facilities in northern Chile. During 2006 and 2007, Norgener and Electroandina asked to change their contracts due to the gas restrictions from Argentina that modified their costs. Under both contracts, the price was finally adjusted upwards and the readjustment clauses were modified.
In May 2001, we entered into a 10-year gas supply contract with Distrinor S.A., which would supply a maximum of 3,850,000 million Btu per year. This gas supply was sufficient to satisfy the requirements for the facilities that are connected to a natural gas supply. However, beginning in 2004, the Argentinean government has imposed restrictions on the supply of natural gas and, in 2010, we only received from Argentina, in a non-continuous basis, approximately 7.7% of the gas received in a normal year. On the other hand, in 2010, Chile began to import liquefied natural gas, using the same gas pipeline to inject the re-gasified liquefied natural gas. The main use of this fuel is linked to the generation of electricity, so there is a much smaller surplus for industrial customers such as SQM. In 2010, we only received liquefied natural gas (LNG) from the LNG terminal, on a non-continuous basis, representing approximately 10.7% of the gas received in a normal year. Consequently, we have had to use other higher-cost fuels as substitutes for natural gas.
We obtain ammonium nitrate, sulfur, sulfuric acid, kerosene and soda ash from several large suppliers, mainly in Chile and the United States, under long-term contracts or general agreements, some of which contain provisions for annual revisions of prices, quantities and deliveries. In addition to the potassium chloride produced by us, we acquire potassium chloride from Sociedad Chilena del Litio Limitada, a local Chilean supplier. Diesel fuel is obtained under contracts that provide fuel at international market prices.
37
We believe that all of the contracts and agreements between SQM and third-party suppliers with respect to our main raw materials contain standard and customary commercial terms and conditions.
Water Supply
The main sources of water for our nitrate and iodine facilities at Pedro de Valdivia, María Elena and Coya Sur are the Loa and San Salvador rivers, which run near our production facilities. Water for our Pampa Blanca, Nueva Victoria and Salar de Atacama facilities is obtained from wells near the production facilities. We additionally buy water from third parties for our production processes at Pampa Blanca, until operations were idled, and at the Salar del Carmen. In addition, we purchase potable water from local utility companies. We have not experienced significant difficulties obtaining the necessary water to conduct our operations.
Government Regulations
Regulations in Chile Generally
We are subject to the full range of government regulations and supervision generally applicable to companies engaged in business in Chile, including labor laws, social security laws, public health laws, consumer protection laws, environmental laws, tax laws, securities laws and anti-trust laws. These include regulations to ensure sanitary and safety conditions in manufacturing plants.
We conduct our mining operations pursuant to exploration concessions and exploitation concessions granted pursuant to applicable Chilean law. Exploitation concessions essentially grant a perpetual right to conduct mining operations in the areas covered by the concessions, provided that annual concession fees are paid (with the exception of the Salar de Atacama rights, which have been leased to us until 2030). Exploration concessions permit us to explore for mineral resources on the land covered thereby for a specified period of time, and to subsequently request a corresponding exploitation concession.
Under Law No. 16,319, the Company has an agreement with the Chilean Commission of Nuclear Energy (“CCHEN”) regarding the exploitation and sale of lithium from the Salar de Atacama. The agreement sets quotas for the tonnage of lithium authorized to be sold.
We also hold water rights obtained from the Chilean water regulatory authority for a supply of water from rivers or wells near our production facilities sufficient to meet our current and anticipated operating requirements. See “Item 3 – Key Information – Risk Factors – Risks Relating to Chile.” The Water Code is subject to changes, which could have a material adverse impact on our business, financial condition and results of operations. Law No. 20,017, published on June 16, 2005, modified the Chilean laws relating to water rights. Under certain conditions, these modifications allow the constitution of permanent water rights of up to 2 liters per second for each well built prior to June 30, 2004, in the locations where we conduct our mining operations. Such rights may be constituted in favor of parties that requested water rights prior to January 1, 2000, when such request had not yet been processed as of June 16, 2005. In constituting these new water rights, the law does not consider the availability of water, or how the new rights may affect holders of existing rights. Therefore, the amount of water we can effectively extract based on our existing rights could be reduced if these additional rights are exercised. These and other potential future changes to the Water Code could have a material adverse impact on our business, financial condition and results of operations.
We operate port facilities at Tocopilla for shipment of products and delivery of certain raw materials pursuant to maritime concessions, under applicable Chilean laws, which are normally renewable on application, provided that such facilities are used as authorized and annual concession fees are paid.
38
In 2005, the Chilean Congress approved Law No. 20,026 (also known as the “Royalty Law”) establishing a royalty tax to be applied to mining activities developed in Chile. In 2010, modifications were made to the law. The Chilean Government may again decide to levy additional taxes on mining companies or other corporations in Chile, and such taxes could have a material adverse impact on our business, financial condition and results of operations.
In 2006, the Chilean Congress amended the Labor Code, and effective January 15, 2007, certain changes were made affecting companies that hire subcontractors to provide certain services. This new law, known as the “Law on Subcontracting”, established, among other regulations, a new requirement that applies in the event of accidents in the workplace. The law states that when a serious accident occurs, the company must halt work at the site where the accident took place until authorities from the National Geology and Mining Service inspect the site and prescribe the measures the company must take to prevent future risks. Work may not be resumed until the company has taken the prescribed measures, and the period of time before work may be resumed may last for a number of hours, days, or longer. The effects of this new law could have a material adverse effect on our business, financial condition and results of operations.
On December 2, 2009, Law No. 20.393 went into effect, establishing a system of criminal liability for legal entities. The objective of the new regulation is to allow legal entities to be prosecuted for the crimes of (a) asset laundering (b) financing terrorism and (c) bribery, where such crimes are committed by people who hold relevant positions within a legal entity, in order to benefit that legal entity. The law establishes a prevention model that includes, among others, the designation of a person in charge of prevention and the establishment of special programs and policies. The implementation of this model can exempt the company from liability.
On January 1, 2010, Law No. 20.382 went into effect, introducing modifications to Law No. 18.045 (relating to the Securities Market) and Law No. 18.046 (relating to Corporations). The new law relates to corporate governance and, in general, seeks to improve such matters as the professionalization of senior management at shareholder corporations, the transparency of information, and the detection and resolution of possible conflicts of interest. The law establishes the concept of an independent director for certain corporations, including SQM S.A. Such director has a preferential right to be a member of the Directors’ Committee, which position, in turn, grants the director further powers. The new independent director may be elected by any shareholder with an ownership interest greater than 1% in the company, but he or she must satisfy a series of independence requirements with respect to the company and the company’s competition, providers, customers and majority shareholders. The Law also refines the regulations regarding the information that companies must provide to the general public and to the Superintendency of Securities and Insurance, as well as regulations relating to the use of inside information, the independence of external auditors, and procedures for the analysis of transactions with related parties.
In 2010, the Chilean Congress amended the Environmental Law to create the Ministry of Environment, the Environmental Assessment Service and the Superintendency of the Environment and to introduce important amendments to environmental regulations in terms of setting up new agencies and introducing new provisions and procedures applicable to projects whose operations bear an impact on the environment. The new Ministry shall design and implement environmental policies relating to environmental conservation, sustainable growth and the protection of Chile's renewable energy resources. In addition, the Ministry will be responsible for enacting emission and quality standard regulations as well as recovery and decontamination plans. The Environmental Assessment Service will pursue procedures of the Environmental Impact System, where projects are environmentally approved or rejected. In procedures for obtaining an environmental license, any person, including legal entities and companies, will be allowed to file oppositions and comments. Moreover, summary procedures, such as Environmental Impact Statements, will allow such oppositions and comments under certain circumstances. Technical reports from governmental agencies would be considered bound for final decision. The Superintendency of the Environment will be an independent agency in charge of coordinating other governmental agencies in their environmental obligations. Likewise, it will receive, investigate and decide complaints concerning the infringement of environmental regulations and sanction violators, deliver injunction orders or levy relevant fines.
39
There are currently no material legal or administrative proceedings pending against the Company except as discussed in Item 8.A.7 “Legal Proceedings”, in Note 20 of the Consolidated Financial Statements and under “Safety, Health and Environmental Regulations” below, and we believe that we are in compliance in all material respects with all applicable statutory and administrative regulations with respect to our business.
Safety, Health and Environmental Regulations in Chile
Our operations in Chile are subject to both national and local regulations related to safety, health, and environmental protection. In Chile, the main regulations on these matters that are applicable to SQM are the Code on Safety in Mining Operations, the Health Code, the Law on Subcontracting, and the Environmental Framework Law.
Health and safety at work are fundamental aspects in the management of mining operations, which is why SQM has made constant efforts to maintain good health and safety conditions for the people working at its mining sites. In addition to the role played by the Company in this important matter, the government has a regulatory role, enacting and enforcing regulations in order to protect and ensure the health and safety of workers. The State, acting through the Ministry of Health and the National Service for Geology and Mining (“Sernageomin”), performs health and safety inspections and oversees mining projects, among other tasks, and it has exclusive powers to enforce standards related to environmental conditions and the health and safety of the people performing activities related to mining.
The Mine Health and Safety Act of 1989 (Ministry of Mining, Code on Safety in Mining Operations or “Reglamento de Seguridad Minera,” Supreme Decree DS No. 72, amended by DS No. 132/2002) protects workers and nearby communities against health and safety hazards, and it provides for enforcement of the law where compliance has not been achieved. SQM’s Internal Mining Standards (“Reglamentos Internos Mineros”) establish our obligation to maintain a workplace that is safe and free of health risks, in as much as this is reasonably practicable. We must comply with the general provisions of the Health and Safety Act 1999 (Ministry of Health, Standards on Basic Sanitary and Environmental Conditions in the Workplace, or “Reglamento sobre Condiciones Sanitarias y Ambientales Básicas en los Lugares de Trabajo” DS No. 594, amended by DS No. 57/2003), our own internal standards, and the provisions of the Mine Health and Safety Act of 1989. In the event of non-compliance, the Ministry of Health and particularly the National Service for Geology and Mining are entitled to use their enforcement powers to ensure compliance with the law.
The Environmental Framework Law was subjected to several important modifications that entered into effect in January 2010, including the creation of the Ministry of the Environment, the National Service of Environmental Impact Assessment, and the Environmental Enforcement Superintendence. The Environmental Enforcement Superintendence will begin operations once the complementary legislation and regulation are enacted, which is expected to occur during 2011. The new and modified Environmental Framework Law replaced the National Commission of the Environment (“Comisión Nacional del Medio Ambiente” or “CONAMA”) with the Ministry of the Environment, which now is the governmental agency responsible for coordinating and supervising environmental issues. Under the new Environmental Framework Law, we will continue to be required to conduct environmental impact studies of any future projects or activities (or their significant modifications) that may affect the environment. Now, with the above mentioned modifications to the Environmental Framework Law, the National Service of Environmental Assessment, together with other public institutions with mandates related to the environment, evaluates environmental impact studies submitted for its approval, and also audits environmental performance during the construction and operation of the projects. The Environmental Framework Law also promotes citizen participation in project evaluation and implementation.
40
On August 10, 1993, the Ministry of Health published in the Official Gazette a resolution establishing that atmospheric particulate levels at our production facilities in María Elena and Pedro de Valdivia exceeded air quality standards, affecting the nearby towns. The high particulate matter levels came principally from dust produced during the processing of caliche ore, particularly the crushing of the ore before leaching. Residents of the town of Pedro de Valdivia were relocated to the town of María Elena, practically removing Pedro de Valdivia from the scope of the determination of the Ministry of Health. In 1998, CONAMA approved a plan to reduce the atmospheric particulate levels below permissible levels by July of the same year; and later approved a new plan by Decree No. 37/2004 on March 2004, which called for an 80% reduction of the emissions of atmospheric particulate material in two years. We designed a new project to modify the milling and screening systems used in the processing of the caliche ore at the María Elena facilities, in order to achieve the necessary reduction of particulate material emissions. An environmental impact study for this project was approved by CONAMA through Resolution No. 270 in October 2005. Construction of this project was completed in December of 2008, and due to international market conditions, this project ceased its operation in March 2010. Today, the milling and screening systems used in the processing of the caliche ore at the María Elena facilities remain closed. Air quality in the area has improved significantly and compliance of air quality standards required by law has to be assessed upon gathering air quality monitoring data for 3 consecutive years (2009 through 2011).
On March 16, 2007, the Ministry of Health published in the Official Gazette a resolution establishing that atmospheric particulate levels exceeded air quality standards in the coast-town of Tocopilla, where we have our port operations. The high particulate matter levels are caused mainly by two thermoelectric power plants that use coal and fuel oil and are located next to our port operations. Our participation in particulate matter emissions is very small (less than 0.20% of the total). However, a decontamination plan was developed by CONAMA, and its implementation began in October 2010. During 2008 and 2009, ahead of schedule, SQM implemented control measures for mitigating particulate material emissions in its port operations according to the requirements of this plan. We do not expect any additional measures to be required of SQM due to the implementation of the plan.
We continuously monitor the impact of our operations on the environment and have made, from time to time, modifications to our facilities in an effort to eliminate any adverse impacts. Also, over time, new environmental standards and regulations have been enacted, which have required minor adjustments or modifications of our operations for full compliance. We anticipate that additional laws and regulations will be enacted over time with respect to environmental matters. While we believe that we will continue to be in compliance with all applicable environmental regulations of which we are now aware, there can be no assurance that future legislative or regulatory developments will not impose new restrictions on our operations. We are committed to both complying with all applicable environmental regulations and applying an Environmental Management System (“EMS”) to continuously improve our environmental performance.
We have submitted and will continue to submit several environmental impact assessment studies related to our projects to the governmental authorities. We require the authorization of these submissions in order to maintain and to increase our production capacity.
International Regulations
In 2007, a new European Community Regulation on chemicals and their safe use went into effect. This regulation, called REACH (Regulation, Evaluation, Authorisation and Restriction of Chemical Substances), requires all manufacturers and importers of chemicals – including SQM – to identify and manage risks linked to the substances they manufacture and market. Non-compliance with this regulation would preclude the Company from commercializing its products in the European market. During 2010, SQM completed on schedule the registration of all products exported to the European Community in quantities larger than 1.000 MT/; thus, ensuring the supply to European costumers.
41
4.C.
Organizational Structure
All of our principal operating subsidiaries are essentially wholly-owned, except for Soquimich Comercial S.A., which is approximately 61% owned by SQM and whose shares are listed and traded on the Chilean Stock Exchanges, and Ajay SQM Chile S.A., which is 51% owned by SQM. The following is a summary of our main subsidiaries as of March 31, 2011. For a list of all our consolidated subsidiaries see Note 2.4 to the Consolidated Financial Statements
.
|
Main subsidiaries
|
Activity
|
Country of
Incorporation
|
SQM Beneficial
Ownership
Interest
(Direct/Indirect)
|
|||
|
SQM Nitratos S.A.
|
Extracts and sells caliche ore to subsidiaries and affiliates of SQM
|
Chile
|
100%
|
|||
|
SQM Industrial S.A.
|
Produces and markets the Company’s products directly and through other subsidiaries and affiliates of SQM
|
Chile
|
100%
|
|||
|
SQM Salar S.A.
|
Exploits the Salar de Atacama to produce and market the Company’s products directly and through other subsidiaries and affiliates of SQM
|
Chile
|
100%
|
|||
|
Minera Nueva Victoria S.A.
|
Produces and markets the Company’s products directly and through other subsidiaries and affiliates of SQM
|
Chile
|
100%
|
|||
|
Servicios Integrales de Tránsitos y Transferencias S.A. (SIT)
|
Owns and operates a rail transport system and also owns and operates the Tocopilla port facilities
|
Chile
|
100%
|
|||
|
Soquimich Comercial S.A.
|
Markets the Company’s specialty plant nutrition products domestically and imports fertilizers for resale in Chile
|
Chile
|
61%
|
|||
|
Ajay-SQM Chile S.A.
|
Produces and markets the Company’s iodine and iodine derivatives
|
Chile
|
51%
|
|||
|
Sales and distribution subsidiaries in the United States, Belgium, Brazil, Venezuela, Ecuador, Peru, Argentina, Mexico, South Africa and other locations.
|
|
Market the Company’s products throughout the world
|
|
Various
|
|
42
4.D.
Property, Plant and Equipment
Discussion of our mining rights is organized below according to the geographic location of our mining operations. SQM's mining interests located throughout the valley of the Tarapacá and Antofagasta regions of northern Chile (in a part of the country known as “el Norte Grande”), referred to collectively as the “Caliche Ore Mines”, are discussed first. The Company's mining interests in the Salar de Atacama are discussed second.
Description of the Caliche Ore Mines
As of May 31, 2011, we held exploitation rights to mineral resources representing approximately 569,234 hectares. In addition, as of May 31, 2011, we held exploration rights to mineral resources representing approximately 8,000 hectares, and we have applied for additional exploration rights for approximately 144,100 hectares. As part of these rights, we have four mines covering an area of approximately 546,494 hectares. In addition, we have applied for an additional 30,740 hectares of exploitation and exploration concessions. Currently, Pedro de Valdivia, María Elena and Nueva Victoria are being exploited.
In 2007, we modified the criteria we use to define a mine. These new criteria require that a property have both the reserves and the processing facilities necessary to carry out exploitation. As a result, certain properties we previously defined as mines but that do not have processing facilities are now considered part of other mines, and the number of mines has been reduced from six to four. The Nueva Victoria mine includes the mining properties Soronal, Mapocho and Iris, which were described separately in previous Company filings. The mining properties in terms of surface area and quantity of reserves have not changed as a result of the new criteria.
Pedro de Valdivia
The mine and facilities that we operate in Pedro de Valdivia are located 170 kilometers northeast of Antofagasta and are accessible by highway. These facilities have been in operation for approximately 78 years and were previously owned and operated by Anglo Lautaro. The areas currently being mined are located approximately 17 kilometers southeast and approximately 20 kilometers west of the Pedro de Valdivia production facilities. Our mining facilities at Pedro de Valdivia have a Weighted Average Age of approximately 11.18 years. Electricity, diesel, and fuel oil are the primary sources of power for this operation.
María Elena
We operated mining facilities at Maria Elena until March 2010, and mining activities using heap leaching resumed in November 2010. The Maria Elena mine and facilities are located 220 kilometers northeast of Antofagasta and are accessible by highway. These facilities were operated for approximately 83 years before operations were suspended and were previously owned and operated by Anglo Lautaro. The area mined until operations were suspended is located approximately 14 kilometers north of the María Elena production facilities. The power sources of power utilized are mainly electricity, diesel, and fuel oil. The Weighted Average Age of the Company's mining facilities at María Elena is approximately 8.12 years.
Pampa Blanca
We operated mining facilities in Pampa Blanca, which is located 100 kilometers northeast of Antofagasta, until operations were suspended in March 2010. Ore from the Pampa Blanca mine was transported by truck to nearby heap leaching pads where it is used to produce iodine and nitrate salts. The Weighted Average Age of the ore recovery facilities at Pampa Blanca is approximately 11.72 years. The power source utilized is mostly electricity, produced by mobile diesel generators.
Nueva Victoria
We currently conduct caliche ore operations in Nueva Victoria, which is located 180 kilometers north of María Elena and is accessible by highway. Since 2007, the Nueva Victoria mine includes the mining properties Soronal, Mapocho and Iris. Ore from Nueva Victoria is transported by truck to heap leaching pads where it is then used to produce iodine. Nueva Victoria mine includes former Iris mining property acquired from DSM Minera S.A. in 2006. The Weighted Average Age of the ore recovery facilities at Nueva Victoria is approximately 6.37 years. The power source utilized is mostly electricity, obtained from the Northern Power Grid (SING).
43
Description of the Salar de Atacama Brines
Salar de Atacama Brines
As of May 31, 2011, SQM Salar S.A. holds exclusive rights to exploit the mineral resources in an area covering approximately 147,000 hectares of land in the Salar de Atacama in northern Chile. These rights are owned by Corfo and leased to SQM Salar S.A. pursuant to a lease agreement between Corfo and SQM Salar S.A. (the “Lease Agreement”). Corfo may not unilaterally amend the Lease Agreement, and the rights to exploit the resources cannot be transferred. The Lease Agreement provides that SQM Salar S.A. is responsible for the maintenance of Corfo’s exploitation rights and for annual payments to the Chilean government, and it expires on December 31, 2030. SQM Salar S.A. is required to make lease-royalty payments to Corfo according to specified percentages of the value of production of minerals extracted from the Salar de Atacama brines. In the years 2010, 2009 and 2008, royalty payments amounted to approximately US$18.2 million, US$17.7 million, and US$17.7 million, respectively. SQM Salar S.A. holds an additional 112,723 hectares of explotation rights in Salar de Atacama.
In addition, as of May 31, 2011, we hold exploration rights covering approximately 126,500 hectares, and we have applied for additional exploration rights covering approximately 12,600 hectares. Exploration rights are valid for a period of two years, after which the Company can (i) request an exploitation concession for the land, (ii) request an extension of the exploration rights for an additional two years (the extension only applies to a reduced surface area equal to 50% of the initial area), or (iii) cease exploration of the zone covered by the rights. The Weighted Average Age of our mining facilities at the Salar de Atacama is approximately 7.39 years. The main source of power used by the operation is electricity.
In addition to the mining rights leased to SQM Salar S.A. described above, as of May 31, 2011, Corfo had exclusive mining rights covering a total area of approximately 65,200 additional hectares in the Salar de Atacama. Under the terms of the Salar de Atacama Project Agreement between Corfo and SQM Salar S.A., (the Project Agreement), Corfo has agreed that it will not permit any other person to explore, exploit or mine any mineral resources in those 65,200 hectares of the Salar de Atacama. The Project Agreement expires on December 31, 2030.
Concessions, Extraction Yields and Reserves for the Caliche Ore Mines and Salar Brines
Concessions Generally
Caliche ore.
We hold our mineral rights pursuant to one of two types of exclusive concessions granted pursuant to applicable law in Chile:
(1) “Exploitation Concessions” These are concessions whereby we are legally entitled to use the land in order to exploit the mineral resources contained therein on a perpetual basis subject to annual payments to the Chilean government; or
(2) “Exploration Concessions” These are concessions whereby we are legally entitled to use the land in order to explore for mineral resources for a period of two years, at the expiration of which the concession may be extended one time only for two additional years if the area covered by the concession is reduced by half.
An Exploration Concession is generally obtained for purposes of evaluating the mineral resources in an area. Generally, after the holder of the Exploration Concession has determined that the area contains exploitable mineral resources, such holder will apply for an Exploitation Concession for the area. Such application will give the holder absolute priority with respect to such Exploitation Concession against third parties. If the holder of the Exploration Concession determines that the area does not contain commercially exploitable mineral resources, the concession is usually allowed to lapse. An application also can be made for an Exploitation Concession without first having obtained an Exploration Concession for the area involved.
44
Concessions for the Caliche Ore Mines and Salar Brines
As of May 31, 2011, approximately 91% of our total mining concessions are held pursuant to Exploitation Concessions and 9% pursuant to Exploration Concessions, not including areas within the Salar de Atacama. Of the Exploitation Concessions, approximately 75% have been already granted pursuant to applicable Chilean law, and approximately 25% are in the process of being granted. Of the Exploration Concessions, approximately 90% have been already granted pursuant to applicable Chilean law, and approximately 10% are in the process of being granted.
We made payments to the Chilean government for our Exploration and Exploitation Concessions of approximately US$8.7 million in the year 2010.
The following table sets forth our exploitation and exploration concessions as of May 31, 2011:
|
Exploitation concessions
|
Exploration concessions
|
Total
|
||||||||||||||||||||||
|
Mines
|
Total number
|
Hectares
|
Total number
|
Hectares
|
Total number
|
Hectares
|
||||||||||||||||||
|
Pedro de Valdivia
|
576 | 147,302 | 0 | 0 | 576 | 147,302 | ||||||||||||||||||
|
El Toco(1)
|
607 | 179,878 | 6 | 1,400 | 613 | 181,278 | ||||||||||||||||||
|
Pampa Blanca(1)
|
458 | 135,160 | 0 | 0 | 458 | 135,160 | ||||||||||||||||||
|
Nueva Victoria
|
298 | 78,254 | 13 | 4,500 | 311 | 82,754 | ||||||||||||||||||
|
Salar de Atacama
|
387 | 259,723 | 329 | 126,500 | 716 | 386,223 | ||||||||||||||||||
|
Subtotal mines
|
2,326 | 800,317 | 348 | 132,400 | 2,674 | 932,717 | ||||||||||||||||||
|
Other caliche areas
|
6,544 | 1,472,682 | 358 | 133,500 | 6,902 | 1,606,182 | ||||||||||||||||||
|
Other salars and other areas
|
432 | 81,980 | 52 | 14,000 | 484 | 95,980 | ||||||||||||||||||
|
Subtotal other Areas
|
6,976 | 1,554,662 | 410 | 147,500 | 7,386 | 1,702,162 | ||||||||||||||||||
|
Total
|
9,302 | 2,354,979 | 758 | 279,900 | 10,060 | 2,634,879 | ||||||||||||||||||
(1) Operations at the El Toco and Pampa Blanca mines were temporarily suspended in March 2010. Mining activites resumed at María Elena in November 2010
45
Extraction Yields
The following table sets forth certain operating data relating to each of our mines:
|
(values in thousands, unless otherwise stated)
|
2010
|
2009
|
2008
|
|||||||||
|
Pedro de Valdivia
|
||||||||||||
|
Metric tons of ore mined
|
11,773 | 11,631 | 11,003 | |||||||||
|
Average grade nitrate (% by weight)
|
7.4 | 7.3 | 7.1 | |||||||||
|
Iodine (parts per million (ppm))
|
403 | 363 | 345 | |||||||||
|
Metric tons of crystallized nitrate produced
|
496 | 434 | 407 | |||||||||
|
Metric tons of iodine produced
|
3.0 | 2.6 | 2.2 | |||||||||
|
María Elena(1)
|
||||||||||||
|
Metric tons of ore mined
|
307 | 5,443 | 4,683 | |||||||||
|
Average grade nitrate (% by weight)
|
5.8 | 6.8 | 7.1 | |||||||||
|
Iodine (ppm)
|
443 | 375 | 358 | |||||||||
|
Metric tons of crystallized nitrate produced
|
22 | 155 | 151 | |||||||||
|
Metric tons of iodine produced
|
0.2 | 1.2 | 1.0 | |||||||||
|
Coya Sur(2)
|
||||||||||||
|
Metric tons of crystallized nitrate produced
|
323 | 193 | 302 | |||||||||
|
Pampa Blanca(1)
|
||||||||||||
|
Metric tons of ore mined
|
383 | 3,785 | 3,811 | |||||||||
|
Iodine (ppm)
|
634 | 645 | 533 | |||||||||
|
Metric tons of iodine produced
|
0.8 | 1.2 | 1.1 | |||||||||
|
Nueva Victoria
|
||||||||||||
|
Metric tons of ore mined
|
14,252 | 17,326 | 15,760 | |||||||||
|
Iodine (ppm)
|
456 | 463 | 475 | |||||||||
|
Metric tons of iodine produced
|
4.8 | 5.1 | 4.0 | |||||||||
|
Salar de Atacama
|
||||||||||||
|
Metric tons of lithium carbonate produced(3)
|
26 | 14 | 30 | |||||||||
|
Metric tons of potassium chloride and potassium sulfate produced
|
1,409 | 1,075 | 863 | |||||||||
|
|
(1)
|
Operations at the El Toco and Pampa Blanca mines were temporarily suspended in March 2010. Mining activites resumed at María Elena in November 2010.
|
|
|
(2)
|
Includes production at Coya Sur from treatment of fines from María Elena and Pedro de Valdivia, nitrates from pile treatment at Pampa Blanca and net production from NPT, or "technical (grade) potassium nitrate," plants.
|
|
|
(3)
|
Lithium carbonate is extracted at the Salar de Atacama and processed at our facilities at the Salar del Carmen.
|
46
Reserves
Reserves for the Caliche Ore Deposits
Our in-house staff of geologists and mining engineers prepares our estimates of caliche ore reserves. The proven and probable reserve figures presented below are estimates, and no assurance can be given that the indicated levels of recovery of nitrates and iodine will be realized.
We estimate ore reserves based on engineering evaluations of assay values derived from sampling of drill-holes and other openings. Drill-holes have been made at different space intervals in order to recognize mining resources. Normally, we start with 400x400 meters and then we reduce spacing to 200x200 meters, 100x100 meters and 50x50 meters. The geological occurrence of caliche mineral is unique and different from other metallic and non-metallic minerals. Caliche ore is generally found under a layer of barren overburden in horizontal seams with variable thickness from twenty centimeters to five meters, and with the overburden varying in thickness from half a meter to one and a half meters. This horizontal layering is a natural geological condition and allows the Company to estimate the continuity of the caliche bed based on surface geological reconnaissance and analysis of samples and trenches. Mining resources can be calculated using the information from the drill-hole sampling.
According to our experience in caliche ore, the grid pattern drill-holes with spacing equal to or less than 100 meters produce data on the caliche resources that is sufficiently defined to consider them measured resources and then, adjusting for technical, economic and legal aspects, as proven reserves. These reserves are obtained using the Kriging Method and the application of operating parameters to obtain economically profitable reserves. Similarly, the information obtained from detailed geologic work and samples taken from grid pattern drill-holes with spacing equal to or less than 200 meters can be used to determine indicated resources. By adjusting such indicated resources to account for technical, economic and legal factors, it is possible to calculate probable reserves. Probable reserves are calculated by evaluating polygons and have an uncertainty or error margin greater than that of proven reserves. However, the degree of certainty of probable reserves is high enough to assume continuity between points of observation.
Probable reserves are the economically mineable part of an "indicated mineral resource" and, in some circumstances, a "measured mineral resource." An indicated mineral resource is that part of a mineral resource for which tonnage, densities, shape, physical characteristics, grade and mineral content can be estimated with a reasonable level of confidence. The calculation is based on exploration, sampling and testing information gathered through appropriate techniques from locations such as outcrops, trenches, pits, workings, and drill holes. A measured mineral resource is the part of a mineral resource for which tonnage, densities, shape, physical characteristics, grade and mineral content can be estimated with a high level of confidence. The estimate is based on detailed and reliable exploration, sampling and testing information gathered through appropriate techniques from locations such as outcrops, trenches, pits, workings, and drill holes.
Proven reserves are the economically mineable part of a measured mineral resource. The calculation of the reserves includes diluting materials and allowances for losses which may occur when the material is mined. Appropriate assessments, which may include feasibility studies, have been carried out and include consideration of and modification by realistically assumed mining, metallurgical, economic, marketing, legal, environmental, social and governmental factors. These assessments demonstrate at the time of reporting that extraction is reasonably justified.
The calculation of the reserves includes diluting of materials and allowances for losses which may occur when the material is mined. Appropriate assessments, which may include feasibility studies, have been carried out and include consideration of and modification by realistically assumed mining, metallurgical, economic, marketing, legal, environmental, social and governmental factors.
47
Proven and probable reserves are determined using extensive drilling, sampling and mine modeling, in order to estimate potential restrictions on production yields, including cut-off grades, ore type, dilution, waste-to-ore ratio and ore depth. Economic feasibility is determined on the basis of this information.
Our estimates of our proven reserves of caliche ore at each of our mines as of December 31, 2010 are as follows:
|
Mine
|
Proven Reserves (1)
(millions of metric tons)
|
Nitrate Average Grade
(percentage by weight
)
|
Iodine Average Grade
(parts per million)
|
|||||||||
|
Pedro de Valdivia
|
167.5 | 7.1 | % | 367 | ||||||||
|
María Elena (2)
|
137.6 | 7.3 | % | 412 | ||||||||
|
Pampa Blanca (2)
|
71.4 | 5.6 | % | 544 | ||||||||
|
Nueva Victoria
|
311.5 | 5.9 | % | 458 | ||||||||
In addition, the updated estimates of our probable reserves of caliche ore at each of our principal mines as of December 31, 2010, are as follows:
|
Mine
|
Probable Reserves (1) (3)
(millions of metric tons
)
|
Nitrate Average Grade
(percentage by weight)
|
Iodine Average Grade
(parts per million)
|
|||||||||
|
Pedro de Valdivia
|
85.2 | 6.9 | % | 482 | ||||||||
|
María Elena (2)
|
98.0 | 7.3 | % | 380 | ||||||||
|
Pampa Blanca (2)
|
447.8 | 5.8 | % | 538 | ||||||||
|
Nueva Victoria
|
77.4 | 6.5 | % | 384 | ||||||||
Notes on Reserves:
|
(1)
|
The proven and probable reserves set forth in the tables above are shown before losses related to exploitation and mineral treatment. Proven and probable reserves are affected by mining exploitation methods, which result in differences between the estimated reserves that are available for exploitation in the mining plan and the recoverable material that is finally transferred to the leaching vats or heaps. The average mining exploitation factor for our different mines ranges between 80% and 90%, whereas the average global metallurgical recoveries of processes for nitrate and iodine contained in the recovered material vary between 55% and 65%.
|
|
(2)
|
Operations at El Toco and Pampa Blanca mines were temporarily suspended in March 2010. Mining activites resumed at María Elena in November 2010.
|
|
(3)
|
Probable reserves can be expressed as proven reserves using a conversion factor. On average, this conversion factor is higher than 60%. This factor depends on geological conditions and caliche ore continuity, which vary from mine to mine. The difference between the probable reserve amounts and the converted probable reserve amounts is the result of the lower degree of certainty pertaining to probable reserves compared with proven reserves.
|
The proven and probable reserves shown above are the result of exploration and evaluation of approximately 16.1% of the total caliche-related mining property of our Company. However, we have explored those areas in which we believe there is a higher potential of finding high-grade caliche ore minerals. The remaining 83.9% of this area has not been explored yet or has limited reconnaissance as inferred or hypothetical resources. Reserves shown in these tables are calculated based on mining properties that are not involved in any legal disputes between SQM and other parties.
We maintain an ongoing program of exploration and resource evaluation on the land surrounding the mines at Nueva Victoria, Pedro de Valdivia, María Elena and Pampa Blanca and at other sites for which we have the appropriate concessions. In 2010, we continued a basic reconnaissance program on new mining properties including a geological mapping of the surface and a spaced drill-hole campaign covering approximately 2,961 hectares. Additionally, we conducted general explorations based on a closer grid pattern of drill-holes over a total area of approximately 599 hectares and, in addition, carried out in-depth sampling of approximately 1,630 hectares (685 hectares at Pedro de Valdivia and 945 hectares at Nueva Victoria). The exploration and development program in 2011 calls for a basic reconnaissance program over a total area of 21,587 hectares, general exploration over a total area of about 10,184 hectares and, in addition, in-depth sampling of approximately 3,655 hectares.
48
Reserves for the Salar de Atacama Brines
Our in-house staff of hydro-geologists and mining engineers prepares our estimates of potassium, sulfate, lithium and boron reserves at the Salar de Atacama. We have exploration concessions of approximately 819.2 square kilometers where we have carried out geological exploration, brine sampling and geostastical analysis. We estimate that our proven and probable reserves, based on economic restrictions, geological exploration, brine sampling and geostatistical analysis up to a depth of 100 meters of our total exploration concessions, and additionally, up to a depth of 280 meters over approximately 47% of the same total area, are as follows:
|
Proven Reserves (1)
(millions of metric tons)
|
Probable Reserves (1)
(millions of metric tons)
|
|||||||
|
Potassium (K
+
) (2)
|
50.4 | 17.5 | ||||||
|
Sulfate (SO
4
2-
) (3)
|
37.2 | 2.2 | ||||||
|
Lithium (Li
+
) (4)
|
2.7 | 2.7 | ||||||
|
Boron (B
3+
) (5)
|
1.1 | 0.2 | ||||||
Notes on Reserves:
|
(1)
|
Metric tons of potassium, sulfate, lithium and boron considered in the proven and probable reserves are shown before losses from evaporation processes and metallurgical treatment. The recoveries of each ion depend on both brine composition, which changes over time, and the process applied to produce the desired commercial products.
|
|
(2)
|
Recoveries for potassium vary from 47% to 77%.
|
|
(3)
|
Recoveries for sulfate vary from 27% to 45%.
|
|
(4)
|
Recoveries for lithium vary from 28% to 40%.
|
|
(5)
|
Recoveries for boron vary from 28% to 32%.
|
The proven and probable reserves are based on drilling, brine sampling and geo-statistic reservoir modeling in order to estimate brine volumes and their composition. To evaluate reserves, we conduct a geostatistical study using the Kriging Method in 2D. We calculate the quality of brine effectively drainable or exploitable in each evaluation unit. We consider chemical parameters to determine the process to be applied to the brines. Based on the chemical characteristics, the volume of brine and drainable percentage, we determine the number of metric tons for each of the chemical ions. Proven reserves are defined as those geographical blocks that comply with a Kriging method estimation error of up to 15%. In the case of probable reserves, the selected blocks must comply with an estimation error between 15% and 35%. Blocks with an error greater than 35% are not considered in the evaluation of reserves. This procedure is used to estimate potential restrictions on production yields, and the economic feasibility of producing such commercial products as potassium chloride, potassium sulfate, lithium carbonate and boric acid is determined on the basis of the evaluation.
PORTS AND WATER RIGHTS
We operate port facilities at Tocopilla in the North of Chile for shipment of products and delivery of certain raw materials pursuant to renewable concessions granted by Chilean regulatory authorities, provided that such facilities are used as authorized and annual concession fees are paid by us. We also hold water rights for a supply of water from rivers and wells near our production facilities sufficient to meet our current operational requirements.
49
PRODUCTION FACILITIES
Our principal production facilities are located near our mines and extraction facilities in northern Chile. The following table sets forth the principal production facilities as of December 31, 2010:
|
Location
|
Type of Facility
|
Approximate Size (Hectares)
|
|||
|
Pedro de Valdivia (1)
|
Nitrates and iodine production
|
235
|
|||
|
María Elena (1)
|
Nitrates and iodine production
|
95
|
|||
|
Coya Sur (1)
|
Nitrates and iodine production
|
250
|
|||
|
Pampa Blanca (1)
|
Concentrated nitrate salts and iodide production
|
129
|
|||
|
Nueva Victoria (1)
|
Concentrated nitrate salts and iodine production
|
328
|
|||
|
Salar de Atacama (2)
|
Potassium chloride, lithium chloride, potassium sulfate and boric acid
|
3,574
|
|||
|
Salar del Carmen, Antofagasta (2)
|
Lithium carbonate and lithium hydroxide production
|
63
|
|||
|
Tocopilla
|
|
Port facilities
|
|
22
|
|
(1) Includes production facilities, solar evaporation ponds and leaching heaps.
(2) Includes production facilities and solar evaporation ponds.
We own, directly or indirectly through subsidiaries, all of the facilities free of any material liens, pledges or encumbrances, and believe that they are suitable and adequate for the business we conduct in them. As of December 31, 2010, the approximate gross book value of the property and associated plant and equipment at our locations was as follows: Pedro de Valdivia (US$85.0 million), María Elena (US$144.2 million), Coya Sur (US$256.6 million), Pampa Blanca (US$20.4 million), Nueva Victoria (US$202.1 million), Salar de Atacama (US$442.3 million), Salar del Carmen (US$213.5 million) and Tocopilla (US$63.5 million).
In addition to the above-listed facilities, we operate a computer and information system linking our principal subsidiaries to our operating facilities throughout Chile via a local area network. The computer and information system is used mainly for accounting, monitoring of supplies and inventories, billing, quality control and research activities. The system's mainframe computer equipment is located at our offices in Santiago.
The approximate Weighted Average Age of our production facilities as of December 31, 2010 was as follows: Pedro de Valdivia (11.18 years), María Elena (8.12 years), Coya Sur (8.83 years), Nueva Victoria (6.37 years), Salar de Atacama (7.39 years), and Salar del Carmen (8.24 years). Our railroad line between our production facilities and Tocopilla was originally constructed in 1890, but the rails, locomotives and rolling stock have been replaced and refurbished as needed. The Tocopilla port facilities were originally constructed in 1961 and have been refurbished and expanded since that time. The Weighted Average Age of the Tocopilla port facilities is approximately 10.38 years. We consider the condition of our principal plant and equipment to be good.
50
The map below shows the location of SQM's principal mining operations and land concessions which have been granted and those that are in the process of being granted.
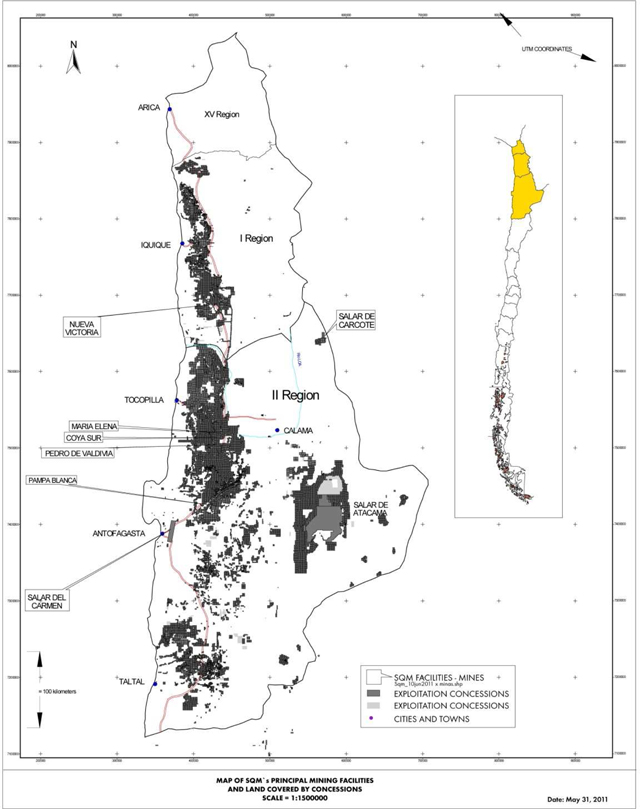
51
We own and operate railway lines and equipment, as well as port and storage facilities, for the transport and handling of finished products and consumable materials.
Our main centers for our production and storage of raw materials is the hub composed of the facilities in Coya Sur - Pedro de Valdivia and Salar de Atacama facilities. Other facilities include Nueva Victoria and the lithium carbonate and lithium hydroxide finishing plants. The Tocopilla port terminal (“Tocopilla Port Terminal”), which we own, is the main facility for storage and shipment of our products.
Nitrate raw materials are produced and first stored at our Pedro de Valdivia mine, and then transported by trucks to the plants described in the next paragraph, for further processing. Nitrate raw material was also produced at our El Toco and Pampa Blanca mining facilities until operations were temporarily suspended in March 2010 at these locations. In November 2010, operations resumed at the María Elena mining site. Nitrate raw material produced at these two facilities were transported by conveyor belt (El Toco) and trucks (Pampa Blanca) to plants for further processing.
Nitrate finished products are produced at our facilities in Coya Sur and then transported by our rail system to Tocopilla Port Terminal, where they are stored and shipped, either bagged or in bulk. Potassium chloride is produced at our facilities in the Salar de Atacama and transported either to Tocopilla Port Terminal or Coya Sur by truck owned by a third-party dedicated contractor. Product transported to Coya Sur is used as a raw material for the production of potassium nitrate or for potassium chloride finished product. Potassium sulfate and boric acid are both produced at our facilities in the Salar de Atacama and are then transported by truck to the Tocopilla Port Terminal.
Lithium solutions, produced at our facilities in the Salar de Atacama, are transported to the lithium carbonate facility in the Salar del Carmen area, where finished lithium carbonate is produced. Part of the lithium carbonate is fed to the adjacent lithium hydroxide plant, where finished lithium hydroxide is produced. These two products are bagged and stored on the premises and are subsequently transported by truck to Tocopilla Port Terminal or to the Antofagasta terminal for shipment on charter vessels or container vessels.
Iodine raw material, obtained in the same mines as the nitrates, is processed, bagged and stored exclusively in the facilities of Pedro de Valdivia and Nueva Victoria, and then shipped by truck to Antofagasta or Iquique for vessel container transport or by truck to Santiago, where iodine derivatives are produced.
The facilities at Tocopilla Port Terminal are located approximately 186 kilometers north of Antofagasta and approximately 124 kilometers west of Pedro de Valdivia, 84 kilometers west of María Elena and Coya Sur and 372 kilometers west of the Salar de Atacama. Our subsidiary, Servicios Integrales de Tránsitos y Transferencias S.A. (SIT) operates the facilities under maritime concessions granted pursuant to applicable Chilean laws. The port also complies with ISPS (International Ship and Port Facility Security Code) regulation. The Tocopilla Port Terminal facilities include a railcar dumper to transfer bulk product into the conveyor belt system used to store and ship bulk product.
Storage facilities consist of a six silo system, with a total production capacity of 55,000 metric tons, and an open storage area for approximately 230,000 metric tons. Additionally, to meet future storage needs, the Company will continue to make investments in accordance with the investment plan outlined by management. Products are also bagged at port facilities in Tocopilla, where the bagging capacity is approximately 300,000 metric tons per year.
For shipping bulk product, the conveyor belt system extends over the coast line to deliver product directly inside bulk carrier hatches. Using this system, the loading capacity is 1,200 tons per hour. Bags are loaded to bulk vessels using barges that are loaded in Tocopilla Port Terminal dock and unloaded by vessel cranes into the hatches. Both bulk and bagged trucks are loaded in Tocopilla Port Terminal for transferring product directly to customers or for container vessels shipping from other ports, mainly Antofagasta, Mejillones and Iquique.
52
Bulk carrier loading in the Tocopilla Port Terminal is mostly contracted to transfer product to our hubs around the world or for shipping to customers, which in limited cases use their own contracted vessels for delivery. Trucking is provided by a mix of spot, contracted and customer- owned equipment.
Tocopilla processes related to the reception, handling, storage, and shipment of bulk/packaged nitrates produced in Coya Sur are certified by third party organization TÜV-Rheiland under the quality standard ISO 9001:2008.
Not applicable
53
|
ITEM 5.
|
OPERATING AND FINANCIAL REVIEW AND PROSPECTS
|
The information in this Item 5 should be read in conjunction with the Company’s Audited Consolidated Financial Statements and the notes thereto included elsewhere in this Annual Report.
Since January 1, 2010, the Company’s consolidated financial statements are and will be prepared in accordance with the International Financial Reporting Standards as published by the International Accounting Standards Board (IASB).
The Company’s consolidated financial information as of and for the year ended December 31, 2009 included in the Company’s annual consolidated financial statements was restated in accordance with IFRS. See Note 2 to the Audited Consolidated Financial Statements of the Company.
IFRS No. 1 provides for certain exemptions from full retrospective application of IFRS in the opening balance sheet. See Note 3 to the Audited Consolidated Financial Statements of the Company for a discussion of the exceptions elected by the Company.
FIRST TIME ADOPTION OF INTERNATIONAL FINANCIAL REPORTING STANDARDS (IFRS)
The accompanying consolidated financial statements as of December 31, 2010 are the first consolidated financial statements prepared according to IFRS. The Company has applied IFRS 1 when preparing these consolidated financial statements.
The transition date is January 1, 2009, and management has prepared its opening balance under IFRS as of that date. The IFRS effective date is January 1, 2010, as indicated by the Chilean Superintendency of Securities and Insurance (SVS).
According to IFRS 1, in order to prepare the accompanying consolidated financial statements, all mandatory exemptions have been applied by the Company, as well as some of the non-mandatory exemptions to the retroactive application of IFRS.
The exceptions established in IFRS 1 that the Company has decided to apply are detailed as follows:
|
|
(i)
|
Business combinations
|
The Company has applied the exemption included in IFRS 1 for business combinations conducted from 2004 and thereafter. For these purposes, the Company reversed the amortization of goodwill recognized in accordance with the previous accounting standards.
|
|
(ii)
|
Fair value or revaluation of property, plant and equipment as deemed cost
|
The Company has chosen to measure certain property, plant and equipment items at their fair value as of the transition date of January 1, 2009. The fair value of property, plant and equipment was measured through a business appraisal conducted by independent external experts, who determined the new values, useful lives and residual values of these assets.
|
(iii)
|
Employee benefits
|
The Company has opted to recognize all the actuarial gains and losses accumulated as of January 1, 2009.
|
(iv)
|
Financial Instruments
|
54
The Company has applied hedge accounting to financial derivative instruments associated with obligations with the public (bonds payable) denominated in UF and Chilean pesos issued by the Company.
See Note 3 to the Audited Consolidated Financial Statements of the Company.
CRITICAL ACCOUNTING POLICIES AND ESTIMATES
Critical accounting policies are defined as those that are reflective of significant judgments and uncertainties, which would potentially result in materially different results under different assumptions and conditions.
We believe that our critical accounting policies applied in the preparation of our IFRS consolidated financial statements are limited to those described below. It should be noted that in many cases, IFRS specifically dictates the accounting treatment of a particular transaction, with limited management’s judgment in their application. There are also areas in which management’s judgment in selecting available alternatives would not produce materially different results.
Trade and other accounts receivable
Trade and other accounts receivable relate to non-derivative financial assets with fixed payments that can be determined and are not quoted in any active market. These arise from sales operations involving the products and/or services that the Company commercializes directly to its customers with no intention of negotiating the account receivable and that are not within the following categories:
|
|
·
|
Those which the Company has the intention of selling immediately in the near future and which are held-for-sale.
|
|
|
·
|
Those designated at their initial recognition as available-for-sale.
|
|
|
·
|
Those through which the holder does not intend to partially recover substantially its entire investment for reasons other than credit impairment and therefore must be classified as available-for-sale.
|
These assets are initially recognized at their fair value (which is equivalent to their face value, discounting implicit interest for installment sales) and subsequently at amortized cost according to the effective interest rate method less a provision for impairment loss. When the face value of the account receivable does not significantly differ from its fair value, it is recognized at face value. An allowance for impairment loss is established for trade accounts receivable when there is objective evidence that the Company will not be able to collect all the amounts owed to it according to the original terms of accounts receivable.
Implicit interest in installment sales is recognized as interest income when interest is accrued over the term of the operation.
Income tax
Corporate income tax for the year is determined as the addition of current tax from the different companies which is the result of the application of the type of tax on taxable income for the year.
Differences between the book value of assets and liabilities and their tax basis generate the balance of deferred tax assets or liabilities, which are calculated using the tax rates expected to be applicable when the assets and liabilities are realized.
In conformity with current Chilean tax regulations, the provision for corporate income tax and taxes on mining activity is recognized on an accrual basis presenting the net balances of accumulated monthly tax provisional payments for the fiscal period and credits associated with it. The balances of these accounts are presented in Current income taxes recoverable or current taxes payable, as applicable.
55
Tax on companies and variations in deferred tax assets or liabilities that are not the result of business combinations are recorded in income statement accounts or net shareholders’ equity accounts in the Consolidated Statement of Financial Position, considering the origin of the gains or losses which have generated them.
At year end, the carrying value of deferred tax assets has been reviewed and reduced for as long as it is possible for there to be no sufficient taxable income to allow the recovery of all or a portion of the deferred tax asset. Likewise, at the date of the statement of financial position, deferred tax assets not recognized are revalued and recognized as long as it has become possible that future taxable income will allow the recovery of the deferred tax asset.
With respect to deductible temporary differences associated with investments in subsidiaries, associated companies and interest in joint ventures, deferred tax assets are recognized solely provided that there is a possibility that the temporary differences will be reversed in the near future and that there will be taxable income with which they may be used.
The deferred income tax related to entries directly recognized in shareholders’ equity is recognized with an effect on shareholders’ equity and not with an effect on profit or loss.
Deferred tax assets and liabilities are offset if there is a legally receivable right of offsetting tax assets against tax liabilities and the deferred tax is related to the same tax entity and authority.
Inventories
The Company states inventory for the lower of cost and net realizable value. The cost price of finished products and products in progress includes direct costs of materials and; as applicable, labor costs, indirect costs incurred to transform raw materials into finished products and general expenses incurred in carrying inventory to their current location and conditions. The method used to determine the cost of inventory is weighted average cost.
The net realizable value represents the estimate of the sales price less all finishing estimated costs and costs that will be incurred in commercialization, sales and distribution processes. Commercial discounts, rebates obtained and other similar entries are deducted in the determination of the acquisition price. The Company conducts an evaluation of the net realizable value of inventory at the end of each year, recording an estimate with a charge to income when these are overstated. When the circumstances that previously gave rise to the rebate cease to exist, or when there is clear evidence of an increase in the net realizable value due to a change in the economic circumstances or prices of main raw materials, the estimate made previously is modified. The valuation of obsolete, impaired or slow-moving products relates to their estimated net realizable value.
Provisions on the Company's inventory have been made based on a technical study which covers the different variables affecting products in stock (density, humidity, among others).
Raw materials, supplies and materials are recorded at the lower of acquisition cost or market value. Acquisition cost is calculated according to the annual average price method.
Obligations related to staff severance indemnities and pension commitments
Obligations with the Company’s employees are in accordance with that established in the collective bargaining agreements in force formalized through collective employment agreements and individual employment contracts. For the case of the United States, this is performed in accordance with the related pension plan.
56
These obligations are valued using the actuarial calculation, which considers such hypotheses as the mortality rate, employee turnover, interest rates, retirement dates, effects related to increases in employees‘ salaries, as well as the effects on variations in services derived from variations in the inflation rate.
Actuarial losses and gains that may be generated by variations in previously defined obligations are directly recorded in profit or loss.
Actuarial losses and gains have their origin in deviations between the estimate and the actual behavior of actuarial hypotheses or in the reformulation of established actuarial hypotheses.
The discount rate used by the Company for calculating the obligation was 6% for the periods ended as of December 31.
Our affiliate SQM North America has established pension plans for its retired employees that are calculated by measuring the projected obligation of IAS using a net salary progressive rate net of adjustments to inflation, mortality and turnover assumptions, deducting the resulting amounts at present value using a 6.5% interest rate for 2010 and 2009. The net balance of this obligation is presented in the category called Non current Employee Benefit Provisions.
Mining development costs
Mine exploration costs and stripping costs to maintain production of mineral resources extracted from operating mines are considered variable production costs and are included in the cost of inventory produced during the period. Mine development costs at new mines, and major development costs at operating mines outside existing areas under extraction that are expected to benefit future production, are capitalized under “other long-term assets” and amortized using a units-of-production method over the associated proven and probable reserves. We determine our proven and probable reserves based on drilling, brine sampling and geostatistical reservoir modeling in order to estimate mineral volume and composition.
All other mine exploration costs, including expenses related to low grade mineral resources rendering reserves that are not economically exploitable, are charged to the results of operations in the period in which they are incurred.
Asset value impairment
The Company assesses on an annual basis any impairment on the amount of Buildings, plant and equipment, intangible assets, goodwill and investments accounted for using the equity method of accounting in accordance with IAS 36. Assets to which this method applies are detailed as follows:
|
|
·
|
Investments recognized using the equity method of accounting
|
|
|
·
|
Property, plant and equipment
|
|
|
·
|
Intangible assets
|
|
|
·
|
Goodwill
|
Assets are reviewed for impairment as to the existence of any indication that the carrying value is lower than the recoverable amount. If such an indication exists, the asset recoverable amount is calculated in order to determine the extent of this impairment, if any exists. In the event that the asset does not generate any cash flows independent from other assets, the Company determines the recoverable amount of the cash generating unit to which this asset belongs according to the corresponding business segment (specialty plant nutrients, iodine and derivatives, lithium and derivatives, industrial chemicals, potassium and other products and services.)
57
The Company conducts impairment tests on intangible assets and goodwill with indefinite useful lives on an annual basis and every time there is indication of impairment.
If the recoverable value of an asset is estimated at an amount lower than its carrying value, the latter decreases to its recoverable amount.
Financial derivatives and hedging transactions
Derivatives are recognized initially at fair value at the date in which the derivatives contract has been signed and subsequently they are valued at fair value at each period end. The method for recognizing the resulting loss or gain depends on whether the derivative has been designated as an accounting hedging instrument and if so, it depends on the type of hedging, which may be as follows:
|
|
(a)
|
Fair value hedge of assets and liabilities recognized (fair value hedges);
|
|
|
(b)
|
Hedging of a single risk associated with an asset or liability recognized or a highly possible foreseen transaction (cash flow hedge);
|
At the beginning of the transaction, the Company documents the relationship between hedging instruments and those entries hedged, as well as their objectives for risk management purposes and the strategy to conduct different hedging operations.
The Company also documents its evaluation both at the beginning and the end of each period of whether derivatives used in hedging transactions are highly effective to offset changes in the fair value or in cash flows of hedged entries.
The fair value of derivative instruments used for hedging purposes is shown in Note 9.3
Non Hedge are classified as a current asset or liability, and the change in their fair value is recognized directly in profit or loss.
|
|
(a)
|
Fair value hedge
|
The change in the fair value of a derivative is recognized with a debit or credit to profit or loss, as applicable. The change in the fair value of the hedged entry attributable to hedged risk is recognized as part of the carrying value of the hedged entry and is also recognized with a debit or credit to profit or loss.
For fair value hedging related to items recorded at amortized cost, the adjustment of the fair value is amortized against income on the remaining year to its expiration. Any adjustment to the carrying value of a hedged financial instrument for which the effective rate is used is amortized with a debit or credit to profit or loss at its fair value attributable to the risk being covered.
If the hedged entry is derecognized, the fair value not amortized is immediately recognized with a debit or credit to profit or loss.
|
|
(b)
|
Cash flow hedge
|
The effective portion of gains or losses from the hedging instrument is initially recognized with a debit or credit to other comprehensive income whereas any ineffective portion is immediately recognized with a debit or credit to income, as applicable.
58
Amounts taken to shareholders’ equity are transferred to profit or loss when the hedged transaction affects income for the period, as when the hedged interest income or expense is recognized when a forecasted sale occurs. When the hedged entry is the cost of a non-financial asset or liability, amounts taken to equity are transferred to the initial carrying value of the non-financial asset or liability.
Should the expected firm transaction or commitment no longer be expected to occur, the amounts previously recognized other comprehensive income are transferred to income. If a hedging instrument expires, is sold, finished, and exercised without any replacement, or if a rollover is performed or if its designation as hedging is revoked, the amounts previously recognized in equity are maintained in shareholders’ equity until the expected firm transaction or commitment occurs.
59
|
5.A.
|
Operating Results
|
Introduction
The following discussion should be read in conjunction with the Company's Consolidated Financial Statements and the Notes thereto included in Item 18. Certain calculations (including percentages) that appear herein have been rounded.
Our Consolidated Financial Statements are prepared in accordance with IFRS standards and prepared in U.S. dollars. The U.S. dollar is the primary currency in which we operate.
We operate as an independent corporation. Nonetheless we are a "controlled corporation", as that term is defined under Chilean law. See Item 6.E. Share Ownership.
Overview of Our Results of Operations
We divide our operations into the production and sale of the following product lines:
|
|
·
|
specialty plant nutrients
|
|
|
·
|
iodine and its derivatives
|
|
|
·
|
lithium and its derivatives
|
|
|
·
|
industrial chemicals
|
|
|
·
|
potassium (potassium chloride and potassium sulfate); and
|
|
|
·
|
the purchase and sale of other commodity fertilizers for use primarily in Chile.
|
In 2009 and 2010, our sale of potassium chloride had an important impact on our results of operations, and we expect this trend to continue in line with our plans to increase our potassium chloride production capacity and sales in the near term.
We sell our products through three primary channels: our own sales offices, a network of distributors and, with respect to our fertilizer products, through Yara International ASA pursuant to a commercial agreement.
FACTORS AFFECTING OUR RESULTS OF OPERATIONS
Our results of operations substantially depend on:
|
|
·
|
trends in demand for and supply of our products, including global economic conditions, which impact prices and volumes;
|
|
|
·
|
efficient operations of our facilities, particularly as some of them run at production capacity;
|
|
|
·
|
our ability to accomplish our capital expenditures program in a timely manner;
|
|
|
·
|
the levels of our inventories;
|
|
|
·
|
trends in the exchange rate between the U.S. dollar and peso, as a significant portion of the cost of sales is in Chilean pesos, and trends in the exchange rate between the U.S. dollar and the Euro, as a significant portion of our sales is denominated in Euros; and
|
|
|
·
|
energy, logistics, raw materials and maintenance costs.
|
The following table sets forth our revenues (in millions of U.S. dollars) and the percentage accounted for by each of our product lines for each of the periods indicated:
60
|
2010
|
2009
|
|||||||||||||||
|
US$
|
%
|
US$
|
%
|
|||||||||||||
|
Specialty plant nutrition
|
603.7 | 33 | 527.0 | 37 | ||||||||||||
|
Iodine and derivatives
|
316.3 | 17 | 190.9 | 13 | ||||||||||||
|
Lithium and derivatives
|
150.8 | 8 | 117.8 | 8 | ||||||||||||
|
Industrial chemicals
|
149.7 | 8 | 115.4 | 8 | ||||||||||||
|
Potassium
|
528.2 | 29 | 399.1 | 28 | ||||||||||||
|
Other income
(1)
|
81.8 | 4 | 88.5 | 6 | ||||||||||||
|
Total
|
1,830.4 | 100 | 1,438.7 | 100 | ||||||||||||
|
(1)
|
Primarily consists of imported fertilizers distributed in Chile.
|
The following table sets forth certain financial information of the Company under IFRS (in millions of U.S. dollars) for each of the periods indicated, as a percentage of revenues:
|
Year ended December 31,
|
||||||||||||||||
|
2010
|
2009
|
|||||||||||||||
|
US$
|
%
|
US$
|
%
|
|||||||||||||
|
Sales
|
1,830.4 | 100.0 | 1,438.7 | 100.0 | ||||||||||||
|
Cost of sales
|
(1,204.4 | ) | (65.8 | ) | (908.5 | ) | (63.1 | ) | ||||||||
|
Gross profit
|
626.0 | 34.2 | 530.2 | 36.9 | ||||||||||||
|
Administrative expenses
|
(78.8 | ) | (4.3 | ) | (75.5 | ) | (5.2 | ) | ||||||||
|
Financial expenses
|
(35.0 | ) | (1.9 | ) | (31.0 | ) | (2.2 | ) | ||||||||
|
Financial income
|
12.9 | 0.7 | 13.5 | 0.9 | ||||||||||||
|
Foreign currency transactions
|
(5.8 | ) | (0.3 | ) | (7.6 | ) | (0.5 | ) | ||||||||
|
Other
|
(26.0 | ) | (1.4 | ) | (14.1 | ) | (0.9 | ) | ||||||||
|
Profit (loss) before income tax
|
493.3 | 27.0 | 415.6 | 28.9 | ||||||||||||
|
Income tax expense
|
(106.0 | ) | (5.8 | ) | (75.8 | ) | (5.3 | ) | ||||||||
|
Profit (loss)
|
387.3 | 21.2 | 339.8 | 23.6 | ||||||||||||
|
Non- controlling interests
|
(5.1 | ) | (0.3 | ) | (1.5 | ) | (0.1 | ) | ||||||||
|
Net income for the year
|
382.1 | 20.9 | 338.3 | 23.5 | ||||||||||||
61
Results of Operations – 2010 compared to 2009
During 2010, we generated total revenues of US$1,830.4 million, which is 27.2% higher than the US$1,438.7 million recorded for 2009.
The main factors causing the increase in revenues and the variation s in the different product lines are described below:
Specialty Plant Nutrition
Specialty Plant Nutrition revenues for 2010 totaled US$603.7 million, 14.6% higher than the US$527.0 million recorded for 2009. Set forth below are sales volume data for the specified years by product category in this product line.
|
(in Th. MT)
|
2010
|
2009
|
% change
|
|||||||||
|
Sodium nitrate
|
16.8 | 16.5 | 1 | % | ||||||||
|
Potassium nitrate and sodium potassium nitrate
|
546.2 | 392.1 | 39 | % | ||||||||
|
Specialty blends and other specialty plant nutrients
|
252.4 | 256.9 | (2 | )% | ||||||||
In general, volumes of fertilizer markets in 2010 showed noticeable improvement over 2009 levels, and our Specialty Plant Nutrition segment was no exception. During 2010, potassium nitrate demand returned to pre-crisis levels, as uncertainty was replaced by consumer confidence during the first months of 2010. Demand was further driven by a return to more normalized consumption rates as growers aimed to meet the fundamental need to improve crop yields.
Improved economic conditions have supported higher demand for premium fruits and vegetables which bolstered demand for specialty fertilizers. Key Specialty Plant Nutrition markets also performed steadily, and sales volumes in 2010 were substantially higher than those recorded in 2009.
As expected, average prices for 2010 were lower than average prices recorded in 2009, but prices in the fourth quarter of 2010, however, were higher than previous quarters of the year.
Iodine and its derivatives
Revenues for iodine and its derivatives during 2010 totaled US$316.3 million, a 65.7% increase compared to the US$190.9 million reported for 2009. Set forth below are sales volume data for the specified years.
|
(in Th. MT)
|
2010
|
2009
|
% change
|
|||||||||
|
Iodine and its derivatives
|
11.9 | 7.2 | 67 | % | ||||||||
Improved economic conditions during 2010 helped support demand recovery in the iodine market, particularly for industrial applications such as LCD screens and biocides. Total market demand for iodine in 2010 improved over 2009 levels and surpassed demand in 2008, the peak year. Solid demand in this market was complimented by tightened supply conditions, and as the world market leader, SQM was uniquely positioned to meet the shortfall in supply. A return to normalized inventory levels throughout the supply chain also positively impacted demand for iodine, and in turn sales volumes were not only significantly higher than those recorded in 2009 but were also the highest recorded in company history. During 2010, iodine prices remained stable.
62
Lithium and its derivatives
Revenues for lithium and its derivatives totaled US$150.8 million during 2010, an increase of 28.0% with respect to the US$117.8 million recorded for 2009. Set forth below are sales volume data for the specified years.
|
(in Th. MT)
|
2010
|
2009
|
% change
|
|||||||||
|
Lithium and its derivatives
|
32.4 | 21.3 | 52 | % | ||||||||
Performance of our lithium business was better than our original expectations for 2010, and this segment posted record sales volumes. The lithium market improved strikingly over 2009 lows, and we estimate that total demand for lithium in 2010 was greater than in 2008, the previous record year for demand. Demand recovery in 2010 was driven by secondary rechargeable batteries for portable devices, the traditional demand driver and was also boosted by a return to operational inventories throughout the lithium supply chain.
Prices in this business line remained relatively stable throughout the year, approximately 20% below 2009 prices.
Potassium
Potassium revenues for 2010 totaled US$528.2 million, an increase of 32.3% compared to 2009, when revenues amounted to US$399.1 million. Set forth below are sales volume data for the specified years.
|
(in Th. MT)
|
2010
|
2009
|
% change
|
|||||||||
|
Potassium chloride & Potassium Sulfate
|
1,273.0 | 690.0 | 84 | % | ||||||||
The potassium chloride market continued to show robust demand recovery in the fourth quarter of 2010, and the strength in demand was prevalent in major markets. In this scenario, SQM achieved higher sales volumes in 2010 compared to the same period of 2009.
Although average prices in 2010 were lower than those recorded in 2009, crop prices in the first months of 2011 have increased to attractive levels creating additional economic motivation for farmers to apply fertilizer at higher rates, resulting in accelerated fertilizer demand and upward pressure on fertilizer prices.
Industrial chemicals
Industrial chemicals revenues for 2010 totaled US$149.7 million, 29.7% higher than the US$115.4 million recorded in 2009. Set forth below are sales volume data for the specified years by product category.
|
(in Th. MT)
|
2010
|
2009
|
% change
|
|||||||||
|
Industrial nitrates
|
198.9 | 149.2 | 33 | % | ||||||||
|
Boric acid
|
2.6 | 3.4 | (22 | )% | ||||||||
Sustained by improved economic conditions, sales volumes for industrial chemicals improved substantially over 2009 levels, while prices remained relatively stable during the year. Greater demand for traditional applications in Asian markets helped to offset slightly slower demand recovery in markets such as the U.S. and Europe.
In general, traditional applications for industrial chemicals, in particular those for civil works, showed notable improvement over 2009 levels. We anticipate that the demand for industrial chemicals will continue to progress favorably in the coming years driven by the development of new applications. Furthermore, new programs for alternative energy projects that utilize industrial-grade sodium and potassium nitrate in solar thermal energy storage continue to develop and present interesting opportunities for SQM.
63
Other products and services
Revenues from sales of other commodity fertilizers and other products totaled US$81.8 during 2010, a 7.6% decline compared to US$88.5 million in 2009.
Costs of sales
During 2010, costs of sales increased 32.6% from US$908.5 million in 2009 (63.1% of revenues) to US$1,204.4 million (65.8% of revenues) in 2010. Costs were impacted by higher energy costs and a less favorable U.S. dollar/ Chilean peso exchange rate in 2010.
Gross profit
Gross profit increased 18.1% from US$530.2 million in 2009 (36.9% of revenues) to US$626.0 million in 2010 (34.2% of revenues). Gross margin was impacted by lower average prices in 2010 compared to 2009 and higher costs.
Administrative expenses
Administrative expenses totaled US$78.8 million (4.3% of revenues) for 2010, compared to the US$75.5 million (5.2% of revenues) recorded for 2009.
Income taxes
In 2010, income taxes were US$106.0 million, resulting in an effective consolidated tax rate of 21.5% compared to income taxes of US$75.8 million in 2009 and an effective consolidated tax rate of 18.2%. The higher effective tax rate was partially a result of changes in the Chilean mining royalty.
Foreign Exchange Rates and Inflation
We transact a significant portion of our business in U.S. dollars, which is the currency of the primary economic environment in which we operate and is our functional currency for financial reporting purposes. A significant portion of our operating costs is related to the Chilean peso, and therefore an increase or decrease in the exchange rate between the Chilean peso and the U.S. dollar affects our costs of production. Additionally, as an international company operating in Chile and several other countries, we transact a portion of our business and have assets and liabilities in Chilean pesos and other non-U.S. dollar currencies, such as the Euro, the South African Rand and the Mexican peso. As a result, fluctuations in the exchange rate of such currencies to the U.S. dollar affect our financial condition and results of operations.
64
The following is a summary of the aggregate net monetary assets and liabilities that are denominated in non-U.S. dollar currencies as of December 31, 2010 and 2009. Figuers do not include our financial hedging positions for year-end:
|
2010
|
2009
|
|||||||
|
Th US$
|
Th US$
|
|||||||
|
Chilean pesos
|
(104,781 | ) | (271,513 | ) | ||||
|
Brazilian real
|
(1,638 | ) | (1,303 | ) | ||||
|
Euro
|
94,900 | 13,821 | ||||||
|
Japanese yen
|
1,642 | 832 | ||||||
|
Mexican pesos
|
(1,465 | ) | 667 | |||||
|
South African rand
|
6,763 | 28,868 | ||||||
|
Dirhams
|
24,168 | 22,575 | ||||||
|
Other currencies
|
16,234 | 16,968 | ||||||
|
Total, net
|
35,823 | (189,085 | ) | |||||
We monitor and attempt to maintain our non-dollar assets and liabilities position in balance and make use of foreign exchange contracts and other hedging instruments to try to minimize our exposure to the risks of changes in foreign exchange rates. As of December 31, 2010, for this purpose we had open options to buy U.S. dollars and sell Euros for approximately US$79.6 million (EUR59.5 million) and sell South African rand for approximately US$14.8 million (ZAR98 million), as well as forward exchange contracts to sell U.S. dollars and buy Chilean pesos for US$53 million (CH$24,804 million). As of this date, all of our UF and Chilean pesos bonds were hedged with cross-currency swaps to the U.S. dollar for approximately US$ 410.62 million.
Also, we had open forward exchange contracts to buy U.S. dollars and sell Chilean pesos to hedge our time deposits in Chilean Pesos for approximately US$386.77 million (CH$181,012 million) and forward contracts to buy U.S. dollars and sell Chilean pesos for approximately US$63million (CH$29,485million) hedging our fertilizer trading business in Chile.
Additionally, we had open forward exchange contracts and options to buy U.S. dollars and sell foreign currency to hedge part of our future Euro cash flows for approximately US$28 million (EUR20.9 million).
5.B.
Liquidity and Capital Resources
As of December 31, 2010, we had US$594.5 million of cash and cash equivalents and time deposits that expires in more than 90 days since the date of the investment (included in other financial assets). In addition, as of December 31, 2010, we had unused uncommitted credit lines amounting to US$657 million and unused committed credit lines amounting to US$40 million.
Shareholders' equity was US$1,670.8 million in 2010 compred to US$1,464.5 million in 2009. Our ratio of total liabilities to equity plus minority interest on a consolidated basis decreased from 1.15 as of December 31, 2009 to 1.02 as of December 31, 2010.
We evaluate from time to time our cash requirements to fund capital expenditures, dividend payouts and increases in working capital. As debt requirements also depend on the level of accounts receivables and inventories, we cannot accurately determine the amount of debt we will require. However, we believe that our cash flow generated by operations, cash balances and available credit lines could enable us to meet our working capital, capital expenditure and debt service requirements for 2011, 2012 and 2013. Nevertheless, the Company may seek to raise funds through new debt issuance at its discretion.
65
The table below sets forth SQM's cash flows for 2010 and 2009:
|
(in millions of U.S. dollars)
|
2010
|
2009
|
||||||
|
Cash generated by (used in):
|
||||||||
|
Operating activities
|
618.5 | 371.4 | ||||||
|
Financing activities
|
(254.2 | ) | 202.5 | |||||
|
Investing activities
|
(236.8 | ) | (507.5 | ) | ||||
|
Increase (decrease) in cash and cash equivalents
|
149.0 | 92.1 | ||||||
We operate a capital-intensive business that requires significant investments in revenue-generating assets. Our growth strategy has included the purchase of production facilities and equipment and has also included the improvement and expansion of existing facilities. Funds for capital expenditures and working capital requirements have been obtained from net cash provided by operating activities, corporate borrowing under credit facilities and issuance of debt securities.
Our capital expenditures, considering capitalized interest, amounted to US$336.0 million in 2010. For 2011 we expect total capital expenditures for approximately US$540 million.
Our other major use of funds is the payment of dividends. We declared US$191.1 million and US$163.4 million in dividends for the business years 2010 and 2009 respectively. Our current dividend policy, as approved by shareholders, is to pay 50% of our net income for each fiscal year in dividends. Under Chilean law, the minimum dividend payout is 30% of net income for each fiscal year.
Financing activities
Our current ratio (current assets divided by current liabilities) increased from 3.04x as of December 31, 2009 to 3.56x as of December 31, 2010. The following table sets forth key information about our outstanding long and short term debt as of December 31, 2010:
|
Financial
instruments
|
Interest rate
|
Issue date
|
Maturity date
|
Amortization
|
|||||
|
Bond—CH$ 21,000 million(1)
|
7.00 | % |
Jan. 13, 2009
|
Jan. 5, 2014
|
Bullet
|
||||
|
Bond—UF 1.50 million(1)
|
3.00 | % |
May 8, 2009
|
Apr. 1, 2014
|
Bullet
|
||||
|
Bond—CH$ 52,000 million(1)
|
5.50 | % |
May 8, 2009
|
Apr. 1, 2014
|
Bullet
|
||||
|
Bond—US$200 million
|
6.13 | % |
Apr. 5, 2006
|
Apr. 15, 2016
|
Bullet
|
||||
|
Bond—US$250 million
|
5.50 | % |
Apr. 14, 2010
|
Apr. 21, 2020
|
Bullet
|
||||
|
Bond—UF 2.40 million(1)
|
4.00 | % |
Jan. 24, 2006
|
Dec. 1, 2026
|
Semiannual, beginning in 2007
|
||||
|
Bond—UF 4.00 million(1)
|
4.90 | % |
Jan. 13, 2009
|
Jan. 5, 2030
|
Semiannual, beginning in 2019
|
||||
|
Bilateral loan—US$20 million
|
6M LIBOR + 3.30%
|
Mar. 20, 2009
|
Mar. 20, 2011
|
Bullet
|
|||||
|
Bilateral loan—US$10 million
|
6M LIBOR + 3.30%
|
Mar. 23, 2009
|
Mar. 23, 2011
|
Bullet
|
|||||
|
Syndicated loan—US$80 million
|
6M LIBOR + 0.30%
|
Nov. 28, 2006
|
Nov. 28, 2011
|
Bullet
|
|||||
|
Bilateral loan—US$140 million
|
6M LIBOR + 2.10%
|
Oct. 29, 2009
|
Oct. 29, 2014
|
Bullet
|
|||||
|
Bilateral loan—US$20 million
|
3M LIBOR + 0.35%
|
Oct. 7, 2010
|
Jan. 5, 2011
|
Bullet
|
|||||
|
Bilateral loan—US$20 million
|
1M LIBOR + 0.00%
|
Dec. 27, 2010
|
Jan. 26, 2011
|
Bullet
|
|||||
|
|
(1)
|
UF- and Ch$- denominated bonds are fully hedged to U.S. dollars with cross-currency swaps.
|
66
As of December 31, 2010, we had total debt of US$1,277.74 million, compared to total debt of US$1,293.2 million as of December 31, 2009. Taking into account the effects of financial derivatives, total debt amounted to US$1,180.2 million as of December 31, 2010 and US$1,241.9 million as of December 31, 2009. Of the total debt as of December 31, 2010, US$187.6 million was short-term debt. All of our long-term debt (including the current portion) as of December 31, 2010 was denominated in U.S. dollars, and all our UF and Ch$ local bonds were hedged with cross-currency swaps to the U.S. dollar.
From December 31, 2010 to the date of this report, we repaid or renewed the following debt:
|
|
·
|
on January 5, 2011, we renewed a short-term bank debt, in an amount of US$20 million with a term of 3 months and an annual interest rate of approximately Libor + 0.36%.
|
|
|
·
|
on January 5, 2011, we renewed a short-term bank debt, in an amount of US$20 million with a term of 3 months and an annual interest rate of approximately Libor + 0.38%.
|
|
|
·
|
on January 5, 2011, we paid short-term bank debt, in an amount of US$20 million with a term of 3 months and an annual interest rate of approximately Libor + 0.35%.
|
|
|
·
|
on January 10, 2011, we renewed a short-term bank debt, in an amount of US$20 million with a term of 4 months and an annual interest rate of approximately Libor + 0.40%.
|
|
|
·
|
on January 10, 2011, we renewed a short-term bank debt, in an amount of US$20 million with a term of 4 months and an annual interest rate of approximately Libor + 0.40%.
|
|
|
·
|
on January 26, 2011, we paid short-term bank debt , in an amount of US$20 million with a term of 1 month and an annual interest rate of approximately Libor + 0%.
|
|
|
·
|
on March 9, 2011, we renewed a short-term bank debt, in an amount of US$20 million with a term of 3 months and an annual interest rate of approximately Libor + 0.29%.
|
|
|
·
|
on March 16, 2011, we paid short-term bank debt, in an amount of US$20 million with a term of 3 months and an annual interest rate of approximately Libor + 0.36%.
|
|
|
·
|
on March 20, 2011, we paid a US$10 million credit agreement, dated as of March 20, 2009, with a term of 3 years and an annual interest rate of Libor + 3.3%.
|
|
|
·
|
on March 23, 2011, we paid a US$20 million credit agreement, dated as of March 23, 2009, with a term of 3 years and an annual interest rate of Libor + 3.3%
|
|
|
·
|
on March 28, 2011, we paid short-term bank debt, in an amount of US$20 million with a term of 3 months and an annual interest rate of approximately Libor + 0.40%.
|
|
|
·
|
on April 25, 2011, we renewed a short-term bank debt, in an amount of US$20 million with a term of 4 months and an annual interest rate of approximately Libor + 0.32%.
|
The financial covenants related to our debt instruments include: (i) limitations on the ratio of total liabilities to equity (including minority interest) on a consolidated basis, (ii) minimum net worth requirements, (iii) limitations on net financial debt to EBITDA, (iv) limitations on interest indebtedness of operating subsidiaries and (v) minimum production assets. We believe that the terms and conditions of our debt agreements are standard and customary and that we are in compliance in all material respects with such terms and conditions.
67
The following table sets forth the maturities of our long-term debt by year as of December 31, 2010:
|
Maturity(1)
(in millions of US$)
|
Amount
|
|||
|
2012
|
5.13 | |||
|
2013
|
5.13 | |||
|
2014
|
327.28 | |||
|
2015
|
5.13 | |||
|
2016
|
205.13 | |||
|
2017 and thereafter
|
447.68 | |||
|
Total
|
995.49 | |||
|
|
(1)
|
Only the principal amount has been included. For the UF and Ch$ local bonds, the amounts presented reflect the real U.S. dollar obligation resulting from the effects of the cross currency swaps that hedge these bonds to the U.S. dollar.
|
Environmental Projects
In 2010 we made disbursements amounting to US$7.8 million related to environmental, safety and health projects. We have budgeted future disbursements for the year 2011 amounting to US$16.5 million related to environmental, safety and health projects. This amount forms part of the capital expenditure program discussed above.
|
5.C.
|
Research and Development, Patents and Licenses, etc.
|
One of the main objectives of our research and development team is to develop new processes and products in order to maximize the returns obtained from the resources that we exploit. The areas of research cover topics such as chemical process design, phase chemistry, chemical analysis methodologies and physical properties of finished products.
There are four units that perform this function each of which reports to one of the Senior VP of Nitrate and Iodine Operations, to the Senior VP of Nueva Victoria Operations, to the Senior VP of Salar Operations, and to the Senior VP of Sustainable Development and Public Affairs.
Our research and development policy emphasizes the following: (i) optimization of current processes in order to decrease costs and improve product quality through the implementation of new technology, and (ii) development of higher-margin products from current products through vertical integration or different product specifications.
Our research and development activities have been instrumental in improving our production processes and developing new value-added products. As a result of research and development activities, new methods of extraction, crystallization and finishing have been developed. Technological advances in recent years have enabled us to improve process efficiency for the nitrate, potassium and lithium operations, to improve the physical quality of our prilled products and to reduce dust emissions and caking by applying specially-designed additives for our products handled in bulk. Our research and development efforts have also resulted in new, value-added markets for our products. One example is the use of sodium nitrate and potassium nitrate as thermal storage in solar power plants.
We have patented several production processes for nitrate, iodine, and lithium products. These patents have been filed mainly in the United States, Chile, and in other countries when necessary.
68
For the years ended December 31, 2010, 2009 and 2008, we invested US$5.8 million, US$4.6 million and US$2.6 million, respectively, on research and development activities.
|
5.D.
|
Trend Information
|
During 2010, we observed significant recovery in demand in all of our business lines, with demand returning to pre-crisis levels. We expect a return to historical market growth for our business in 2011, and we anticipate higher sales volumes in 2011 compared to 2010.
In 2010, the prices of our specialty plant nutrition segment decreased compared to 2009, following the trend of decreasing prices in major fertilizer markets. Prices in 2011 have improved, and although it is difficult to accurately predict prices in this segment for the second half of 2011, we believe prices will continue to increase compared to 2010. Sales volumes of potassium nitrate and sodium potassium nitrate increased during 2010 with respect to 2009. We believe sales volumes could increase in 2011 compared to 2010.
In our lithium segment, prices were cut in late 2009 as a measure to stimulate demand, and prices have remained relatively stable since the price decrease. As a result, average lithium prices fell in 2010 compared to 2009. Sales volumes in 2010 were higher than 2009 as a result of improved economic conditions. We expect that these improved market conditions will continue in 2011, and we expect sales volumes in 2011 to be higher than 2010.
Iodine prices have increased approximately 13% since an announced price increase in late 2008. It is possible that prices could increase in 2011as a result of tightening supply and increased demand, both impacted in part due to the earthquake that hit Japan in March 2011. Sales volumes in 2010 were higher than 2009, as a result of improved economic conditions. These improved conditions should continue in 2011, and we believe that our sales volumes for this business segment in 2011 could be similar to sales recorded in 2010.
Prices for industrial-grade nitrates remained relatively flat in 2010 as compared to 2009. It is difficult to predict at this time what prices for industrial-grade nitrates will be in the near future given that they are to a certain extent linked to the prices of agricultural-grade nitrates. We anticipate that the demand for industrial chemicals will continue to progress favorably in the coming years driven by the development of new applications such as nitrates used in solar thermal energy storage.
Prices of potassium chloride during the first few months of 2011 have followed a positive price trend. We anticipate this trend to continue in the following months of the year. In 2010, we sold significantly higher volumes of potassium chloride as a result of an ongoing expansion project of potassium chloride. We believe that our sales volumes for this segment will increase in 2011.
We expect that 2011 productions costs will be slightly higher than in 2010 due to a less favorable U.S. dollar/Chilean peso exchange rate and higher energy costs. We also expect income taxes to be higher in 2011 compared to 2010 due to changes in corporate tax rate and changes to the mining royalty. These changes were measures taken to raise funds for the reconstruction effort after the February 2010 earthquake in Chile.
|
5.E.
|
Off-Balance Sheet Arrangements
|
We have not entered into any transactions with unconsolidated entities whereby we have financial guarantees, retained or contingent interests in transferred assets, derivative instruments or other contingent arrangements that would expose us to material continuing risks, contingent liabilities, or any other obligation arising out of a variable interest in an unconsolidated entity that provides financing, liquidity, market risk or credit risk support to us or that engages in leasing, hedging or research and development services with us.
69
|
5.F.
|
Tabular Disclosure of Contractual Obligations
|
The following table sets forth our material expected obligations and commitments as of December 31, 2010:
|
|
More
|
|||||||||||||||||||
| Less Than | 1 - 3 | 3 - 5 |
Than
|
|||||||||||||||||
|
Total
|
1 year
|
years
|
Years
|
5 years
|
||||||||||||||||
|
ThUS$
|
ThUS$
|
ThUS$
|
ThUS$
|
ThUS$
|
||||||||||||||||
|
Long- and short-term debt
|
1,277,743 | 187,555 | 13,073 | 375,862 | 701,253 | |||||||||||||||
|
Capital lease obligations
|
207 | 207 | - | - | - | |||||||||||||||
|
Operating leases (*)
|
107,371 | 5,124 | 10,248 | 10,248 | 81,751 | |||||||||||||||
|
Purchase commitments (**)
|
51,347 | 51,347 | - | - | - | |||||||||||||||
|
Staff severance indemnities
|
27,910 | - | - | - | 27,910 | |||||||||||||||
|
Total Contractual Obligations and Commitments
|
1,464,578 | 244,233 | 23,321 | 386,110 | 810,914 | |||||||||||||||
(*) See Note 31 of the Consolidated Financial Statements.
(**) The purchase commitments held by the Company are recognized as a liability when the services and goods are received by the Company.
70
|
ITEM 6.
|
DIRECTORS, SENIOR MANAGEMENT AND EMPLOYEES
|
|
6.A.
|
Directors and Senior Management
|
We are managed by our executive officers under the direction of our Board of Directors, which, in accordance with the Company's By-laws, consists of eight directors, seven of whom are elected by holders of Series A shares and one of whom is elected by holders of Series B shares. The entire Board of Directors is regularly elected every three years at our ordinary shareholders’ meeting. Cumulative voting is allowed for the election of directors. At the annual ordinary shareholders’ meeting that took place on April 28, 2011, a new Board was elected, and their terms will expire in 2014. The Board of Directors may appoint replacements to fill any vacancies that occur during periods between elections. If a vacancy occurs, the entire Board must be elected or re-elected at the next regularly scheduled meeting of shareholders. Our Chief Executive Officer is appointed by the Board of Directors and holds office at the discretion of the Board. The Chief Executive Officer appoints our executive officers. There are regularly scheduled meetings of the Board of Directors once a month. Extraordinary meetings may be called by the Chairman when requested by (i) the director elected by holders of the Series B shares, (ii) any other director with the assent of the Chairman or (iii) an absolute majority of all directors. The Board has a Directors' Committee and its regulations are discussed below.
Our directors as of May 31, 2011 are as follows:
|
Directors
|
||||
|
Name
|
Position
|
Current position held since
|
||
|
Julio Ponce L. (1)
|
Chairman of the Board and Director
|
September 1987
|
||
|
Mr. Ponce is a Forestry Engineer with a degree from the Universidad de Chile. He joined the Company in 1981. He is also Chairman of the board of directors of the following corporations: Sociedad de Inversiones Pampa Calichera S.A., Sociedad de Inversiones Oro Blanco S.A., Norte Grande S.A. and Soquimich Comercial S.A. He is the brother of Eugenio Ponce.
|
||||
|
Wayne R. Brownlee
|
Vice Chairman of the Board and Director
|
December 2001
|
||
|
Mr. Brownlee is Executive Vice-President, Treasurer and Chief Financial Officer of Potash Corporation of Saskatchewan, Inc. Mr. Brownlee earned degrees in Arts and Science and Business Administration from the University of Saskatchewan. He is on the board of directors of Great Western Brewing Company. He became a director of SQM in December 2001
.
|
||||
|
Hernán Büchi B.
|
Director
|
April 1993
|
||
|
Mr. Büchi is a Civil Engineer with a degree from the Universidad de Chile. He served as Vice Chairman of SQM's Board from January 2000 to April 2002. He is currently a member of the board of directors of Quiñenco S.A., S.A.C.I. Falabella and Madeco S.A., among others. He is also Chairman of the board of directors of Universidad del Desarrollo.
|
||||
71
|
José María Eyzaguirre B.
|
Director
|
December 2001
|
||
|
Mr. Eyzaguirre is a lawyer and is a partner of the Chilean law firm Claro y Cia. He obtained his law degree from the Universidad de Chile and was admitted to the Chilean Bar in 1985. In 1987, he obtained a Master's Degree from the New York University School of Law. He was admitted to the New York Bar in 1988. He is also a member of the board of directors of Walmart Chile S.A., Embotelladora Andina S.A., a bottler of The Coca Cola Company, and Chairman of the board of directors of Club de Golf Valle Escondido.
|
||||
|
Daniel Yarur E.
|
Director
|
April 2003
|
||
|
Mr. Yarur is an Information Engineer with a degree from the Universidad de Chile and holds an MSc in Finance from the London School of Economics and an AMP from Harvard Business School. He is President of the Federación Deportiva Nacional Ajedrez Federado de Chile and President Fondo de Inversiones Alekine. Mr. Yarur was Chairman of the Chilean Securities and Exchange Commission from 1994 to 2000 and was also Chairman of the Council Organization of the Securities Regulators of America. He is also a Professor in the Faculty of Economic and Administrative Sciences, Universidad de Chile.
|
||||
|
Wolf von Appen
|
Director
|
May 2005
|
||
|
Mr. Von Appen is an entrepreneur. He is currently a member of the board of directors of Sociedad de Fomento Fabril and Vice President of Centro de Estudios Publicos.
|
||||
|
Eduardo Novoa C.
|
Director
|
April 2008
|
||
|
Mr. Novoa is an economist with a degree from the Universidad de Chile and holds a Master in Business Administration from the University of Chicago. He has held positions in business development, corporate level strategic direction and asset management at a number of Chilean and multinational companies, either as a member of the board of directors, Chief Development Officer, Country Manager or CEO. Currently, Mr. Novoa provides strategic advisory services and is a member of the board of several private companies.
|
72
|
Kendrick T. Wallace
|
Director
|
December 2001
|
||
|
Mr. Wallace is a lawyer who graduated from Harvard Law School. He is currently a consultant to certain fertilizer industry companies. Until July 1, 2008 when he retired, he was Senior Vice President and General Counsel of Yara International ASA in Oslo, Norway. Prior to the spin-off of Yara International ASA from Norsk Hydro ASA, he was the chief legal counsel of Norsk Hydro ASA for North and South America in Tampa, Florida. Before that he was a partner in the law firm of Bryan Cave LLP in Kansas City, Missouri. He is also on the board of directors of Sociedad de Inversiones Pampa Calichera S.A.
|
73
Our executive officers as of May 31, 2011 are as follows:
|
Executive Officers
|
||||
|
Name
|
Position
|
Current position held since
|
||
|
Patricio Contesse G.(2)
|
Chief Executive Officer
|
March 1990
|
||
|
Mr. Contesse is a Forestry Engineer with a degree from the Universidad de Chile. He joined the Company in 1981 as CEO, a position he held until 1982, and again in 1988 for one year. In the past, he was CEO of Celco Limitada, Schwager S.A. and Compañía de Aceros del Pacífico S.A. He has also served as Operations Senior Executive Vice President of Codelco Chile, President of Codelco USA and Executive President of Codelco Chile. Mr. Contesse is also a member of the board of directors of Soquimich Comercial S.A.
|
||||
|
Patricio de Solminihac T.
|
Chief Operating Officer and Executive Vice President
|
January 2000
|
||
|
Mr. de Solminihac is an Industrial Engineer with a degree from the Pontificia Universidad Católica de Chile and holds a Master in Business Administration from the University of Chicago. He joined the Company in 1988 as Business Development Vice President. Currently he is a member of the board of directors of Melon S.A. and CEM S.A. Mr. de Solminihac is also a member of the board of directors of Soquimich Comercial S.A.
|
||||
|
Matías Astaburuaga S.
|
General Counsel and Senior Vice President
|
February 1989
|
||
|
Mr. Astaburuaga is a lawyer with a degree from the Pontificia Universidad Católica de Chile. He joined the Company in 1989. Before that, he was Regional Counsel of The Coca Cola Export Corporation, Andean Region and Regional Counsel of American Life Insurance Company, Latin America Region.
|
||||
|
Ricardo Ramos R.
|
Chief Financial Officer and Business Development Senior Vice President
|
November 1994
|
||
|
Mr. Ramos is an Industrial Engineer with a degree from the Pontificia Universidad Católica de Chile. He joined SQM in 1989. Mr. Ramos is also a member of the board of directors of Soquimich Comercial S.A.
|
74
|
Jaime San Martín L.(2)
|
Nueva Victoria Operations Senior Vice President
|
March 2008
|
||
|
Mr. San Martín is a Transportation Engineer with a degree from the Pontificia Universidad Católica de Chile. He joined the Company in 1995 as Project Manager. He became Metallic Mining Development Manager in 1997, and Development Manager in 1998, Business Development and Mining Property Vice President in 1999, Technical Senior Vice President in 2001, and Senior Vice President of Lithium Operations and Mining Affairs in January 2007. Since 2008, he has been the Senior Vice President of Nueva Victoria Operations (iodine and nitrates in the I Region of Chile).
|
||||
|
Eugenio Ponce L.
|
Senior Commercial Vice President
|
March 1999
|
||
|
Mr. Ponce is a Mechanical Engineer with a degree from the Universidad Católica de Valparaíso. In 1981, he joined the Company as a Sales Manager. He became Commercial Manager in 1982, Commercial and Operations Manager in 1988 and Chief Executive Officer of SQM Nitratos S.A. in 1991. Currently he is a member of the board of Soquimich Comercial S.A. and Vice Chairman of the board of directors of Pampa Calichera. He is Julio Ponce’s brother.
|
||||
|
Mauricio Cabello C.
|
Nitrates-Iodine Operations Senior Vice President
|
June 2005
|
||
|
Mr. Cabello is a Mechanical Engineer with a degree from the Universidad de Santiago de Chile. He joined the Company in 2000 as Maintenance Superintendent of SQM Salar. He became Maintenance Manager of SQM’s nitrates and iodine operations in 2002 and Production Manager of SQM’s nitrates and iodine operations in 2004. He previously worked in various engineering-related positions in Pesquera San José S.A., Pesquera Coloso S.A. and Cintac S.A.
|
||||
|
Pauline De Vidts S.
|
Sustainable Development and Public Affairs Senior Vice President
|
June 2005
|
||
|
|
Mrs. De Vidts is an Industrial Engineer with a degree from the Pontificia Universidad Católica de Chile and holds a Ph.D. in Chemical Engineering from Texas A&M University. She joined the Company in 1996 to work in process development for the Salar de Atacama Operations, becoming Development Manager for these operations in 1998, and later Corporate R&D and Environmental Issues Vice President in 2001. Since 2005 she has overseen safety, health and environmental issues, and in 2011 she also began overseeing public affairs for the Company.
|
|
75
|
Juan Carlos Barrera P. (2)
|
Salar and Lithium Operations Senior Vice President
|
January 2007
|
||
|
Mr. Barrera is an Industrial Engineer with a degree from the Pontificia Universidad Católica de Chile and holds a Master in Business Administration degree from Tulane University and a Master in Business Administration degree from Universidad de Chile. He joined the Company in 1991 as an advisor in the Business Development area and has served in many positions since then. In 1995, he became Business Development Manager of SQM Nitratos S.A. In 1999, he became the Corporate Quality Manager, in 2000 Corporate Supply Chain Vice President and, in 2006, General Manager of Soquimich Comercial S.A. Mr. Barrera is also a member of the board of directors of Soquimich Comercial S.A.
|
||||
|
Daniel Jiménez Sch.
|
Senior Vice President Human Resources, Corporate Services and Exploration
|
May 2007
|
||
|
|
Mr. Jiménez is an Industrial Engineer with a degree from the Pontificia Universidad Católica de Chile and holds a Master in Business Administration degree from Old Dominion University. He joined the Company in 1991, holding several positions in the finance and sales areas at SQM’s headquarters and foreign subsidiaries in USA and Belgium, countries he was based in for eight years. In 2002, he became VP Sales and Marketing Iodine, Lithium and Industrial Chemicals
.
|
|
|
|
(1)
|
Mr. Julio Ponce’s ownership interest in SQM is explained in Item 6.E. Share Ownership.
|
|
|
(2)
|
The individual beneficially owns less than one percent of the Company’s shares.
|
6.B.
Compensation
During 2010, directors were paid a monthly fee (UF 300 to the Chairman and UF 50 to each of the remaining seven directors), which was independent of attendance and the number of Board sessions. In addition, the directors received variable compensation (in Chilean pesos) based on a profit-sharing program approved by the shareholders. In 2010, the Chairman received the equivalent of 0.35% of 2009 net income and each of the remaining seven directors received the equivalent of 0.04% of 2009 net income.
In addition, during the first four months 2010, members of the Directors Committee were paid 50UF regardless of the number of sessions held by the Committee. Since May 2010, each member of the Directors Committee received 17UF each month. Additionally, shareholders approved variable compensation for the 2010 fiscal year of an amount equal to 0.013% of 2010 net income for each Committee member. This remuneration is also independent from what the Committee members obtain as members of the Company’s Board of Directors.
76
During 2010, the compensation paid to each of our directors, who served on the Board during the year, was as follows (amounts in Chilean pesos):
|
SQM S.A.
|
SQMC
|
TOTAL
|
||||||||||||||
|
Meeting(Ch$)*
|
Committee (Ch$)
|
Meeting (Ch$)
|
(Ch$)
|
|||||||||||||
|
Julio Ponce Lerou
|
677,094,645 | 76,290,552 | 753,385,197 | |||||||||||||
|
Wayne R. Brownlee
|
82,425,474 | 82,425,474 | ||||||||||||||
|
Hernán Büchi Buc
|
80,305,549 | 6,724,390 | 87,029,939 | |||||||||||||
|
José María Eyzaguirre Baeza
|
80,305,552 | 80,305,552 | ||||||||||||||
|
Eduardo Novoa Castellón
|
81,378,328 | 7,089,134 | 88,467,462 | |||||||||||||
|
Wolf Von Appen
|
81,378,330 | 81,378,330 | ||||||||||||||
|
Kendrick T. Wallace
|
82,425,474 | 82,425,474 | ||||||||||||||
|
Daniel Yarur Elsaca
|
80,305,552 | 6,724,390 | 87,029,942 | |||||||||||||
|
Total
|
1,245,618,904 | 20,537,914 | 76,290,552 | 1,342,447,370 | ||||||||||||
*Amount includes fixed and variable compensation.
For the year ended December 31, 2010, the aggregate compensation paid to our 108 main executives based in Chile was Ch$10,205.6 million. We do not disclose to our shareholders or otherwise make available to the public information as to the compensation of our individual executive officers.
We maintain incentive programs for our employees, based on individual performance, company performance, and short- medium- and long-term indicators. Additionally, in order to provide incentives to key executives and to retain such executives, we maintain a long-term cash bonus compensation plan for certain senior executives, which consists of a long-term bonus linked to share price and is payable between 2011 and 2016.
As of December 31, 2010, the provision providing a long-term bonus linked to our share price would have increased or decreased by approximately US$1,000,000 per each movement of US$1 in the Series B share price. The amount of actual cash bonuses payable under the long-term incentive program will vary depending on the market share price of the Series B shares on the date as of which the bonuses are paid.
As of December 31, 2010, we had a provision related to all of the incentive programs in an aggregate of US$44.8 million.
We do not maintain any pension or retirement programs for the members of the Board or our executive officers in Chile.
6.C.
Board Practices
Information regarding the period of time each of SQM's current Directors has served in their respective office is provided in the discussion of each member of the board above in Item 6.A Directors and Senior Managers.
The date of expiration of the term of the current Board of Directors is April 2014. The contracts of our executive officers are indefinite.
The members of the Board are remunerated in accordance with the information provided above in Item 6.B. Compensation. There are no contracts between SQM, or any of its subsidiaries, and the members of the Board providing for benefits upon termination of their term.
77
Directors' Committee – Audit Committee
As required by Chilean Law, we have a Comité de Directores ("Directors' Committee") composed of three directors, which performs many of the functions of an audit committee. This Directors' Committee complies with the requirements of the NYSE corporate governance rules applicable to audit committees. Under the NYSE corporate governance rules, the audit committee of a U.S. company must perform the functions detailed in the NYSE Listed Company Manual Rules 303A.06 and 303A.07. Non-U.S. companies are required to comply with Rule 303A.06 beginning July 31, 2005, but are not at any time required to comply with Rule 303A.07.
As of May 31, 2011, the Company's Directors' Committee comprised three Directors: Mr. Hernán Büchi B., Mr. Eduardo Novoa C. and Mr. Wolf Von Appen. Each of the three members meets the NYSE independence requirements for audit committee members. According to Chilean independence requirements, only Mr. Hernán Buchi meets the requirements for independence. This Directors' Committee operates in accordance with article 50 bis of the Chilean Corporations Act, which provides that the Directors' Committee will, among other things:
|
|
(a)
|
examine and issue an opinion regarding the external auditor's report including financial statements prior to its final presentation for approval at the ordinary shareholders meeting;
|
|
|
(b)
|
propose to the Board the external auditors and the rating agencies that will be presented to the ordinary shareholders meeting;
|
|
|
(c)
|
examine and elaborate a report concerning the operations covered by Title XVI of the Chilean Corporations Act, which relates to related party transactions; and
|
|
|
(d)
|
examine the remuneration and compensation plans of the senior management.
|
Accordingly, the following were the main activities of our Directors' Committee during 2010:
|
|
(a)
|
analysis of un-audited financial reports.
|
|
|
(b)
|
analysis of audited financial reports.
|
|
|
(c)
|
analysis of reports and proposals submitted by external auditors, account inspectors and risk rating agencies, and recommendations to the Board of Directors regarding external auditors and risk rating agencies that could be designated by shareholders at the respective Annual General Shareholders Meeting.
|
|
|
(d)
|
analysis of tax and other non-audit services provided by external auditors for the Company and its subsidiaries in Chile and abroad
|
|
|
(e)
|
analysis of functions, objectives and working programs of the Internal Audit Department.
|
|
|
(f)
|
analysis of the Company’s Senior Executives’ remuneration and compensation plans.
|
|
|
(g)
|
analysis of the records relating to the transactions referred to in Title XVI of the Law on Corporations.
|
|
|
(h)
|
analysis of matters related to U.S. law “Sarbanes-Oxley Act”, especially regarding Section 404.
|
|
|
(i)
|
analysis of matters related to “IFRS” and standards issued by U.S. standard-setter, the “PCAOB”.
|
|
|
(j)
|
analysis of Internal Control Report.
|
On April 28, 2011, the Annual General Shareholders Meeting of SQM approved an operational budget for the Directors Committee; the operational budget is equivalent to the annual remuneration of the members of the Directors Committee.
The activities carried out by the Committee, as well as the expenses incurred by it, are to be disclosed at the General Shareholders Meeting. During 2010, the Directors Committee did not incur any consulting expenses.
Article 50 bis of the Chilean Corporations Act states that the Committee should consist of three directors, of which at least one member should preferably be independent from the controller (i.e. any person or entity who “controls” the company for Chilean law purposes), if any, and that their functions be remunerated.
78
Comparative Summary of Differences in Corporate Governance Standards
The following table provides a comparative summary of differences in corporate governance practices followed by us under our home-country rules and those applicable to U.S. domestic issuers pursuant to Section 303A of the New York Stock Exchange (NYSE) Listed Company Manual.
Listed Companies that are foreign private issuers, such as SQM, are permitted to follow home country practices in lieu of the provisions of Section 303A, except such companies are required to comply with the requirements of Section 303A.06, 303A.11 and 303A.12(b) and (c).
|
Section
|
NYSE Standards
|
SQM practices pursuant to Chilean Stock Exchange
regulations
|
||
|
303A.01
|
Listed companies must have a majority of independent directors.
|
There is no legal obligation to have a majority of independent directors on the Board but according to Chilean law, the Company's directors cannot serve as executive officers.
|
||
|
303A.02
|
No director qualifies as "independent" unless the board of directors affirmatively determines that the director has no material relationship with the listed company (either directly or as a partner, shareholder or officer of an organization that has a relationship with the company).
In addition, a director is not independent if:
(i) The director is, or has been within the last three years, an employee of the listed company, or an immediate family member is, or has been within the last three years, an executive officer, of the listed company.
(ii) The director has received, or has an immediate family member who has received, during any twelve-month period within the last three years, more than $120,000 in direct compensation from the listed company, other than director and committee fees and pension or other forms of deferred compensation for prior service (provided such compensation is not contingent in any way on continued service).
(iii) (A) The director is a current partner or employee of a firm that is the listed company's internal or external auditor; (B) the director has an immediate family member who is a current partner of such a firm; (C) the director has an immediate family member who is a current employee of such a firm and personally works on the listed company's audit; or (D) the director or an immediate family member was within the last three years a partner or employee of such a firm and personally worked on the listed company's audit within that time.
(iv) The director or an immediate family member is, or has been with the last three years, employed as an executive officer of another company where any of the listed company's present executive officers at the same time serves or served on that company's compensation committee.
(v) The director is a current employee, or an immediate family member is a current executive officer, of a company that has made payments to, or received payments from, the listed company for property or services in an amount which, in any of the last three fiscal years, exceeds the greater of $1 million, or 2% of such other company's consolidated gross revenues.
|
A director would not be considered independent if, at any time, within the last 18 months he or she:
(i) Maintained any relationship of a relevant nature and amount with the company, with other companies of the same group, with its controlling shareholder or with the principal officers of any of them or has been a director, manager, administrator or officer of any of them.
(ii) Maintained a family relationship with any of the members described in (i) above
(iii) Has been a director, manager, administrator o principal officer of non-profit organizations that have received contributions from (i) above
(iv) Has been a partner or a shareholder that has had or controlled, directly or indirectly, 10% or more of the capital stock or has been a director, manager, administrator or principal officer of an entity that has provided consulting or legal services for a relevant consideration or external audit services to the persons listed in (i) above.
(v) Has been a partner or a shareholder that has had or controlled, directly or indirectly, 10% or more of the capital stock or has been a director, manager, administrator or principal officer of the principal competitor, supplier or clients
|
79
|
Section
|
NYSE Standards
|
SQM practices pursuant to Chilean Stock Exchange
regulations
|
||
|
303A.03
|
The non-management directors must meet at regularly scheduled executive sessions without management.
|
These meetings are not needed given that directors cannot serve as executive officers.
|
||
|
303A.04
|
(a) Listed companies must have a nominating/corporate governance committee composed entirely of independent directors.
(b) The nominating/corporate governance committee must have a written charter that addresses:
(i) the committee's purpose and responsibilities – which, at minimum, must be to: identify individuals qualified to become board members, consistent with criteria approved by the board, and to select, or to recommend that the board select, the director nominees for the next annual meeting of shareholders; develop and recommend to the board a set of corporate governance guidelines applicable to the corporation; and oversee the evaluation of the board and management; and
(ii) an annual performance evaluation of the committee.
|
This committee is not required as such in the Chilean regulations. However, pursuant to Chilean regulations SQM has a Directors' Committee (see Board practices above).
|
||
|
303A.05
|
Listed companies must have a compensation committee composed entirely of independent directors, and must have a written charter
|
This committee is not required as such in the Chilean regulations. Pursuant to Chilean regulations SQM has a Director’s Committee (see Board practices above) that is in charge of reviewing management’s compensation.
|
||
|
303A.06
|
Listed companies must have an audit committee.
|
This committee is not required as such in the Chilean regulations. Pursuant to Chilean regulations, SQM has a Directors’ Committee that performs the functions of an audit committee and that complies with the requirements of the NYSE corporate governance rules.
|
||
|
303A.07
|
The audit committee must have a minimum of three members. All audit committee members must satisfy requirements of independence, and the committee must have a written charter.
The listed companies must have an internal audit function to provide management with ongoing assistance of the Company's risk management process and the system of internal controls
|
Pursuant to Section 303A.00, SQM is not required to comply with requirements in 303A.07. Pursuant to Chilean Regulations SQM has a Director’s Committee (see Board practices above) that also performs the functions of an audit committee with certain requirements of independence.
|
||
|
303A.08
|
Shareholders must have the opportunity to vote on all equity-compensation plans and material revisions thereto.
|
SQM does not have equity compensation plans. However, as mentioned in Item 6.B Compensation, the Company does have a long-term cash bonus compensation plan for certain senior executives, which consists of a long-term bonus linked to the Company's share price. Directors and executives may only acquire SQM shares by individual purchases. The purchaser must give notice of such purchases to the Company and the Superintendence of Securities and Insurance.
|
||
|
303A.09
|
Listed companies must adopt and disclose corporate governance guidelines.
|
Chilean law does not require that corporate governance guidelines be adopted. Directors' responsibilities and access to management and independent advisors are directly provided for by applicable law. Directors' compensation is approved at the annual meeting of shareholders, pursuant to applicable law.
|
||
|
303A.10
|
Listed companies must adopt and disclose a code of business conduct and ethics for directors, officers and employees and promptly disclose any waivers of the code for directors or executive officers.
|
Not required in the Chilean regulations. SQM has adopted and disclosed a Code of Business Conduct and Ethics, available at the Company's website, www.sqm.com.
|
80
|
Section
|
NYSE Standards
|
SQM practices pursuant to Chilean Stock Exchange
regulations
|
||
|
303A.11
|
Listed foreign private issuers must disclose any significant ways in which their corporate governance practices differ from those followed by domestic companies under NYSE listed standards.
|
Pursuant to 303A.11, this table sets forth a comparative summary of differences in corporate governance practices followed by SQM under Chilean regulations and those applicable to U.S. domestic issuers pursuant to Section 303A.
|
||
|
303A.12
|
Each listed company CEO must (a) certify to the NYSE each year that he or she is not aware of any violation by the listed company of NYSE corporate governance listing standards; (b) promptly notify the NYSE in writing after any executive officer becomes aware of any material non-compliance with any applicable provisions of Section 303A; and (c) must submit an executed Written Affirmation annually to the NYSE.
In addition, each listed company must submit an interim Written Affirmation as and when required by the interim Written Affirmation form specified by the NYSE. The annual and interim Written Affirmations must be in the form specified by the NYSE.
|
Not required in the Chilean regulations. The CEO must only comply with Section 303A.12 (b) and (c).
|
||
|
303A.13
|
|
The NYSE may issue a public reprimand letter to any listed company that violates a NYSE listing standard.
|
|
Not specified in the Chilean regulations.
|
6.D.
Employees
As of December 31, 2010, we had 4,327 employees, of whom 254 were employed outside of Chile. The average tenure of our full-time employees is approximately 7.2 years.
|
2010
|
2009
|
2008
|
||||||||||
|
Permanent employees
|
4,327 | 4,387 | 4,561 | |||||||||
|
Employees in Chile
|
4,073 | 4,161 | 4,332 | |||||||||
|
Employees outside of Chile
|
254 | 226 | 229 | |||||||||
Of our permanent employees in Chile, 69% are represented by 27 labor unions, which represent their members in collective negotiations with the Company. Compensation for unionized personnel is established in accordance with the relevant collective bargaining agreements. The terms of most such agreements currently in effect are three years, and expiration dates of such agreements vary from contract to contract. Under these agreements, employees receive a salary according to a scale that depends upon job function, seniority and productivity. Unionized employees also receive certain benefits provided for by law and certain benefits, which vary depending upon the terms of the collective agreement, such as housing allowances and additional death and disability benefits.
In addition, the Company owns all of the equity of Institución de Salud Previsional Norte Grande Limitada ("Isapre Norte Grande"), which is a health care organization that provides medical services primarily to our employees and Sociedad Prestadora de Servicios de Salud Cruz de Norte S.A. ("Prestadora"), which is a hospital in María Elena. We make contributions to Isapre Norte Grande and to Prestadora in accordance with Chilean laws and the provisions of our various collective bargaining agreements, but we are not otherwise responsible for its liabilities.
81
Non-unionized employees receive individually negotiated salaries, benefits provided for by law and certain additional benefits provided by the Company.
We provide housing and other facilities and services for employees and their families at the María Elena site.
We do not maintain any pension or retirement programs for our Chilean employees. Most workers in Chile are subject to a national pension law, adopted in 1980, which establishes a system of independent pension plans that are administered by the corresponding Sociedad Administradora de Fondos de Pensiones ("AFP"). We have no liability for the performance of any of these pension plans or any pension payments to be made to our employees. We, however, sponsor staff severance indemnities plans for employees in SQM and our Chilean subsidiaries whereby we commit to provide a lump sum payment to each employee at the end of his/her employment, whether due to death, termination, resignation or retirement.
We have experienced no strikes or significant work stoppages in the last 15 years and consider the relationship with our employees to be good.
At the end of 2008, we offered the unions the possibility to negotiate in advance their collective labor contracts. In June of 2010, we concluded negotiations with all of the labor unions, representing 100% our total unionized workers, signing new agreements which will last for three years. In the second half of 2011, unions will be invited to again early negotiate their collective labor contracts.
6.E.
Share Ownership
As of May 31, 2011, SQM has been informed that the Canadian company Potash Corporation of Saskatchewan Inc. (“PCS”) indirectly controls 100% of the shares of Inversiones el Boldo Limitada and 100% of the shares of Inversiones RAC Limitada. Through these companies PCS owns 32% of the total shares of SQM.
As of May 31, 2011, SQM has also been informed that Mr. Julio Ponce L. and related persons control 100% of the total shares of Inversiones SQYA S.A., which currently and indirectly controls 31.97% of the total shares of SQM S.A. The above, considering that Inversiones SQYA S.A. controls 67.13% of the total shares of Norte Grande S.A.; that Norte Grande S.A. controls 75.59% of the total shares of Sociedad de Inversiones Oro Blanco S.A.; that Sociedad de Inversiones Oro Blanco S.A and the related companies Norte Grande S.A., Inversiones SQ S.A. and Sociedad de Inversiones Pampa Calichera S.A. control 97.68% of the total shares of Sociedad de Inversiones Pampa Calichera S.A.; and that Sociedad de Inversiones Pampa Calichera S.A. and the related companies Inversiones Global Mining (Chile) Ltda. and Sociedad de Inversiones Oro Blanco S.A. ultimately control 31.97% of the total shares of SQM.
Sociedad de Inversiones Pampa Calichera S.A. and Kowa Company Ltd. –the latter being owner, directly and indirectly, of 2.08% of the total shares of SQM as of May 31, 2011 – subscribed on December 21, 2006 a Joint Performance Agreement that allows them to control 34.04% of the total shares of SQM as of May 31, 2011. As a result of this Agreement, the “Group” lead by Mr. Julio Ponce L. indirectly controls 34.04% of the total shares of SQM S.A. and is, therefore, the Controller of SQM S.A.
The following table shows the combined stakes that the Controller Group held in SQM as of:
|
% Beneficial ownership
|
||||
|
May 31, 2011
|
34.04 | % | ||
|
December 31, 2010
|
33.20 | % | ||
|
December 31, 2009
|
32.22 | % | ||
No other director or executive officer owns more than 1% of each share class of the Company as of May 31, 2011. See Item 6. Directors, Senior Management and Employees—footnote (1). Individual ownership has not been publicly disclosed.
82
We do not grant stock options or other arrangements involving the capital of SQM to directors, managers or employees.
83
7.A.
Major Shareholders
The following table sets forth certain information concerning beneficial ownership of the Series A shares and Series B shares of SQM as of May 31, 2011 with respect to each shareholder known by us to beneficially own more than 5% of the outstanding Series A shares or Series B shares. The following information is derived from our records and reports filed by certain of the persons named below with the Superintendency of Securities and Insurance and the Santiago Stock Exchange.
|
Shareholder
|
Number of
series A
shares
beneficially
owned
|
%
series A
shares
|
Number of
series B
shares
beneficially
owned
|
%
series B
shares
|
%total
shares
|
|||||||||||||||
|
Sociedad de Inversiones Pampa Calichera S.A.(1)(2)
|
57,937,977 | 40.57 | % | 12,398,579 | 10.30 | % | 26.72 | % | ||||||||||||
|
Inversiones El Boldo Ltda.(3)
|
44,751,196 | 31.33 | % | 17,571,676 | 14.60 | % | 23.68 | % | ||||||||||||
|
The Bank of New York
|
— | — | 43,669,229 | 36.28 | % | 16.59 | % | |||||||||||||
|
Inversiones RAC Chile Ltda.(3)
|
19,200,242 | 13.44 | % | 2,699,773 | 2.24 | % | 8.32 | % | ||||||||||||
|
Inversiones Global Mining (Chile) Limitada.(1)
|
8,798,539 | 6.16 | % | — | — | 3.34 | % | |||||||||||||
|
(1)
|
Mr. Julio Ponce L., Chairman of the Board of SQM, and related persons control 100% of Inversiones SQYA S.A. ("SQYA"). SQYA indirectly controls and beneficially owns a majority of the shares of Sociedad de Inversiones Pampa Calichera S.A., ("Pampa Calichera") which, in turn, owns also 100% of Global Mining Investments (Chile) S.A. Therefore, as shown in the table above, as of May 31, 2011, Mr. Ponce and related persons beneficially own through the above entities 79,135,095 shares constituting 30.07% of the total shares of SQM. An additional 5,000,000 shares not shown in the table are held by Sociedad de Inversiones Oro Blanco S.A. (“Oro Blanco”), also beneficially owned by Mr. Ponce and related persons. Therefore, as of May 31, 2011, Mr. Ponce and related persons beneficially own through the above entities 84,153,095 shares constituting 31.97% of the total shares of SQM S.A. The stake held by Mr. Ponce and related parties as of December 31, 2010, 2009 and 2008 was respectively, 31.12%, 30.15% and 32.00% of the total shares of SQM.
|
|
(2)
|
Pampa Calichera is a publicly held corporation whose shares are traded on the Santiago Stock Exchange. Originally, the shareholders of Pampa Calichera were employees of SQM. Pampa Calichera was formed to hold the capital stock of SQM contributed by such employees or later acquired in the open market.
|
|
(3)
|
Potash Corporation of Saskatchewan ("PCS") owns 100% of Inversiones el Boldo Limitada and 100% of Inversiones RAC Ltda., and, accordingly is the beneficial owner of 84,222,887 SQM's shares that represent 32.00% of SQM's total shares. The stake held by PCS as of December 31, 2010, 2009 and 2008 was, respectively, 32.00%, 32.00%, and 32.00% of the total shares of SQM.
|
As of December 31, 2007, Yara owned 49% of the shares of Inversiones SQYA which in turn, indirectly owned 32.00% of the shares of SQM. On April 21, 2008, Yara sold 100% of the shares it held in Inversiones SQYA to Mr. Julio Ponce and related persons. As a result of this sale, as of December 31, 2010, Mr. Julio Ponce and related persons owned 100% of the shares of SQYA.
On December 21, 2006, Pampa Calichera and Kowa Company Ltd. (the latter being owner, directly and indirectly, of 2.08% of the total shares of SQM as of May 31, 2011) executed a joint performance agreement that allows them to control 34.04% of the total shares of SQM as of May 31, 2011. As a result of this agreement, the "group" led by Mr. Julio Ponce L. became the "controller group" of SQM, as that term is defined under Chilean law.
84
Series A and Series B shares have the same economic rights (i.e., both series are entitled to share equally in any dividends declared on the outstanding stock) and voting rights at any shareholders meeting, whether ordinary or extraordinary, with the sole exception of the election of the Board, in which the Series A shareholders elect seven members and the Series B shareholders elect one member. Additionally, Series B shares cannot exceed 50% of our issued and outstanding stock, shareholders of at least 5% of this series may call an ordinary or extraordinary shareholders' meeting and the director elected by this series may request an extraordinary Board meeting without the authorization of the Chairman of the Board. These conditions will remain in effect until 2043. Under our by-laws, the maximum individual voting power personally and/or in representation of other shareholders per series is limited to 37.5% of the subscribed shares of each series with voting rights and 32% of the total subscribed shares with voting rights. To calculate these percentages, shares that belong to the voting shareholder's related persons must be added. In addition, the director elected by the Series B shares cannot vote in the election of the Chairman of the Board if a tie vote has occurred in the prior voting process. As of December 31, 2010, there are 142,819,552 Series A shares and 120,376,972 Series B shares outstanding.
7.B.
Related Party Transactions
Title XVI of Law No. 18,046, or the Chilean Corporations Act (the "Law"), regulates transactions with related parties for publicly held corporations and its related parties.
Articles 146 to 149 of the Law requires that our transactions with related parties (i) have as their purpose to contribute to the Company’s interests (ii) be on price, terms and conditions similar to those customarily prevailing in the market at the time of their approval and (iii) satisfy the requirements and procedures established by the Law. Violation of such Articles may also result in administrative or criminal sanctions and civil liability may be sought by the Company, shareholders or interested third parties that suffer losses as a result of such violations.
In addition, Article 89 of the Law requires that transactions in between affiliates, subsidiaries or related parties of a sociedad anónima cerrada, such as some of the Company’s main affiliates and subsidiaries, shall also be on terms similar to those customarily prevailing in the market. Directors and executive officers of companies that violate Article 89 are liable for losses resulting from such violations.
With respect to SQM S.A., operations with related parties include negotiations, proceedings, contracts or operations involving: (i) SQM and (ii) its controller, directors, managers and officers, and their spouses and relatives, and other companies and persons connected to the abovementioned parties or mentioned in the by-laws or by the Directors’ Committee. Such operations may only be carried out if: (i) their objective is to contribute to the Company’s interests and if their price, terms and conditions conform to prevailing market prices, terms and conditions at the time of their approval and (ii) they satisfy the requirements and procedures established by the Law. Such requirements include, among others: (a) that the operation be informed to the Director’s Committee and to the Board of Directors prior to its execution (b) that the Board of Directors, excluding any Directors involved in the operation, approves the operation with an absolute majority of its members, or, if an absolute majority is not feasible, with a unanimous vote by the Directors not involved in the transaction, or, if neither of these options is available, that an Extraordinary Shareholders’ Meeting be held and that shareholders representing 2/3 of the outstanding shares with voting rights approve the operation. In the latter case, prior to the meeting, the shareholders must be provided with a report by an independent evaluator and with statements by the directors as to whether or not such operation is in the Company’s interest (c) that the grounds for the decision and for the exclusion be recorded in the respective minutes of the Board meeting and (d) that the agreement and the names of the directors who approved the same be reported at the next Shareholders’ Meeting. Infractions will not affect the validity of the operation but they will grant the Company or its shareholders the right to demand that the related party committing such infraction refund the amount equivalent to the benefits received by such party in the operation to the Company, and that such party indemnify the Company for any corresponding damages.
85
However, the Board of Directors may authorize the following operations with related parties to be carried out without following such requirements and procedures, as long as such authorization is obtained in advance: (a) operations wherein the amount of the transaction is not significant or (b) operations that, according to the general policies on customary practices determined by the Board of Directors, are considered normal based on the Company’s business activities or (c) operations carried out between legal entities wherein the Company holds at least a 95% ownership interest in the counterpart.
We believe that we have complied with the applicable requirements of the referred Articles in all transactions with related parties. Accounts receivable from and payable to related companies are stated in U.S. dollars and accrue no interest. Transactions are made under terms and conditions that are similar to those offered to unrelated third parties. We further believe that we could obtain from third parties all raw materials now being provided by related parties. The provision of such raw materials by new suppliers could initially entail additional expenses.
For additional information concerning our transactions with affiliates and other related parties, see Note 8 of the Consolidated Financial Statements.
7.C.
Interests of Experts and Counsel
Not applicable
86
|
8.A.
|
Consolidated Statements and Other Financial Information
|
|
8.A.1
|
See Item 18. Consolidated Financial Statements for our consolidated financial statements.
|
|
8.A.2
|
See Item 18. Consolidated Financial Statements.
|
|
8.A.3
|
See Item 18. Consolidated Financial Statements—Report of Independent Registered Public Accounting Firm.
|
|
8.A.4
|
Not applicable.
|
|
8.A.5
|
Not applicable.
|
|
8.A.6
|
Export Sales
|
We derive most of our revenues from sales outside of Chile. The distribution of sales presented below reflects the regions in which the Company’s subsidiaries are located and does not necessarily reflect the final destination of the products sold. The following is the composition of the consolidated sales for the periods ending on December 31:
|
Th. US$
|
2010
|
2009
|
||||||
|
Foreign sales
|
1,614,385 | 1,243,231 | ||||||
|
Total sales
|
1,830,413 | 1,436,891 | ||||||
|
% of foreign sales
|
88.20 | % | 86.52 | % | ||||
|
8.A.7
|
Legal Proceedings
|
In October 2010, the City of Lindsay, California, named Sociedad Química y Minera de Chile S.A. (SQM) and SQM North America Corporation (SQMNA) as defendants in an action filed in the California Superior Court for Tulare County. That same month, the City of Pomona, California, filed a similar action against SQM and SQMNA in the California Superior Court for Los Angeles County. Both actions allege that fertilizer manufactured or distributed by defendants resulted in perchlorate contamination in municipal water wells. The complaints seek damages and base their causes of action on strict product liability (design defect and failure to warn) and negligence. SQMNA was served in the actions and, in January 2011, removed the City of Lindsay action to the United States District Court for the Eastern District of California and the City of Pomona action to the United States District Court for the Central District of California. SQM has not been served in either action. Discovery is underway in both actions and trial is scheduled for January 2012 in the City of Pomona case, while no trial date has been set in the City of Lindsay case. SQMNA and SQM (if it is legally served) intend to vigorously defend both actions.
The Company is party to various other lawsuits arising in the ordinary course of business. See Note 20 to the Consolidated Financial Statements for more information on these legal proceedings. Also see Item 3.D Risk Factors - Risks Relating to Our Business - Pending lawsuits could adversely impact us.
87
|
8.A.8.
|
Dividend Policy
|
As required by Chilean law and regulations, our dividend policy is decided upon from time to time by our Board of Directors and is announced at the Annual Ordinary Shareholders' Meeting, which is generally held in April of each year. Shareholder approval of the dividend policy is not required. However, each year the Board must submit the declaration of the final dividend or dividends in respect of the preceding year, consistent with the then-established dividend policy to the Annual Ordinary Shareholders' Meeting for approval. As required by the Chilean Companies Act, unless otherwise decided by unanimous vote of the holders of issued shares, we must distribute a cash dividend in an amount equal to at least 30% of our consolidated net income for that year (determined on an IFRS basis), unless and except to the extent it has a deficit in retained earnings.
The Board of Directors has followed a policy of paying a single dividend ranging from 50% to 65% of our consolidated net income for the year (determined on an IFRS basis), and dividends for each year have been paid not later than May of the following year. The dividend policy for 2010 established that SQM must distribute and pay in favor of its shareholders, as a final dividend, the amount in Chilean pesos equivalent to 50% of the distributable income for 2010. At the Annual Shareholders’ Meeting held on April 28, 2011, SQM’s shareholders approved a payment of a definitive dividend in the amount of US$0.72592 per share. From this definitive dividend, the interim dividend amount of US$0.41794 per share was deducted. Payments for this dividend were made on May 11, 2011.
At the Annual Shareholders’ Meeting held on April 28, 2011, shareholders also agreed to pay and distribute a dividend equal to 50% of the distributable income corresponding to 2011. For this purpose, distributable net income includes income for the year included in the income statement item “Profit (Loss) Attributable to Owners of the Parent" less significant changes in the fair value of assets and liabilities that are not realized - and which correspond to earnings net of taxes that have been generated in relation to the acquisition of companies. Also, at the same meeting, shareholders agreed to the payment and distribution of an interim dividend that most likely will be paid during the final quarter of 2011 in an amount not to exceed 50% of the accumulated earnings of the nine months ending September 30, 2011.
We generally declare dividends in U.S. dollars (but may declare dividends in Chilean Pesos) and pay such dividends in Chilean Pesos. When a dividend is declared in U.S. dollars, the exchange rate to be used to convert the dividend into Chilean Pesos is decided by the shareholders at the meeting that approves the dividend, which has usually been the Observed Exchange Rate on the date the dividend is declared. In the case of interim dividends, the exchange rate to be used is the Observed Exchange Rate published five business days before the payment date.
Although the Board of Directors has no current plan to recommend a change in the dividend policy, the amount and timing for payment of dividends is subject to revision from time to time, depending upon our then current level of sales, costs, cash flow and capital requirements, as well as market conditions. Accordingly, there can be no assurance as to the amount or timing of declaration or payment of dividends in the future. Any change in dividend policy would ordinarily be effective for dividends declared in the year following adoption of the change, and a notice as to any such change of policy must be filed with Chilean regulatory authorities and would be publicly available information.
Dividends
Each Series A Share and Series B Share is entitled to share equally in any dividends declared on the outstanding capital stock of SQM.
88
The following table sets forth the U.S. dollar equivalent of dividends per share and per ADR paid in each of the years indicated, based on the Observed Exchange Rate for the date on which the dividend was declared.
|
Dividends
|
Per Share
|
Per ADR
(1)
|
||||||||
|
Declared for the
business year
|
Paid in
|
Ch$
|
US$
|
|||||||
|
2004
|
2005
|
106.56 | 0.182 | |||||||
|
2005
|
2006
|
145.11 | 0.279 | |||||||
|
2006
|
2007
|
183.96 | 0.349 | |||||||
|
2007
|
2008
|
204.14 | 0.445 | |||||||
|
2008 (interim)
|
2008
|
243.34 | 0.380 | |||||||
|
2008
|
2009
|
515.90 | 0.858 | |||||||
|
2009 (interim)
|
2009
|
191.32 | 0.380 | |||||||
|
2009
|
2010
|
126.69 | 0.241 | |||||||
|
2010 (interim)
|
2010
|
198.90 | 0.418 | |||||||
|
2010
|
2011
|
142.40 | 0.308 | |||||||
|
(1)
|
The Series A ADRs were delisted from the New York Stock Exchange on March 27, 2008. The ratio of ordinary shares to Series B ADRs changed from 10:1 to 1:1 on March 28, 2008. The calculation in the table for all periods is based on the ratio of 1:1.
|
Dividends payable to holders of ADRs will be paid net of conversion expenses of the Depositary and will be subject to Chilean withholding tax, currently imposed at the rate of 35% (subject to credits in certain cases).
As a general requirement, a shareholder who is not a resident of Chile must register as a foreign investor under one of the foreign investment regimes contemplated by Chilean law to have dividends, sale proceeds or other amounts with respect to its shares remitted outside Chile through the Formal Exchange Market. Under the Foreign Investment Contract, the Depositary, on behalf of ADR holders, will be granted access to the Formal Exchange Market to convert cash dividends from Chilean Pesos to U.S. dollars and to pay such U.S. dollars to ADR holders outside Chile net of taxes, and no separate registration of ADR holders is required.
8.B.
Significant Changes
No significant change has occurred since the date of the financial statements set forth in Item 18.
89
9.A Offer and Listing Details
Price History
The table below sets forth, for the periods indicated, the reported high and low closing prices for our shares on the Santiago Stock Exchange and the high and low closing prices of the ADRs as reported by the NYSE, as the two main exchanges on which our shares are traded. On March 27, 2008, the Company voluntarily delisted its series A ADRs from the New York Stock Exchange. In addition, on March 28, 2008, a ratio change for the Company’s series B ADRs entered into effect, modifying the ratio of ordinary shares to series B ADRs from the previous ratio of 10:1 to a new ratio of 1:1.
|
(a)
|
Last 5 years
|
|
Santiago Stock Exchange
|
NYSE
|
|||||||||||||||||||||||||||||||
|
Per Share (1)
|
Per ADR
|
|||||||||||||||||||||||||||||||
|
Series A
|
Series B
|
Series A (2)
|
Series B (3)
|
|||||||||||||||||||||||||||||
|
High
|
Low
|
High
|
Low
|
High
|
Low
|
High
|
Low
|
|||||||||||||||||||||||||
|
Ch$
|
Ch$
|
Ch$
|
Ch$
|
US$
|
US$
|
US$
|
US$
|
|||||||||||||||||||||||||
|
2006
|
7,100 | 5,220 | 7,347 | 5,000 | 137.50 | 93.15 | 13.95 | 8.99 | ||||||||||||||||||||||||
|
2007
|
12,100 | 7,100 | 9,985 | 6,800 | 234.80 | 135.00 | 20.04 | 12.50 | ||||||||||||||||||||||||
|
2008
|
29,300 | 12,100 | 27,012 | 6,750 | - | - | 55.74 | 14.77 | ||||||||||||||||||||||||
|
2009
|
22,000 | 16,000 | 21,839 | 14,319 | - | - | 40.18 | 23.84 | ||||||||||||||||||||||||
|
2010
|
27,000 | 21,000 | 26,536 | 22,892 | - | - | 58.42 | 31.91 | ||||||||||||||||||||||||
|
(b)
|
Last 10 quarters
|
|
Santiago Stock Exchange
|
NYSE
|
|||||||||||||||||||||||||||||||
|
Per Share (1)
|
Per ADR
|
|||||||||||||||||||||||||||||||
|
Series A
|
Series B
|
Series A (2)
|
Series B (3)
|
|||||||||||||||||||||||||||||
|
High
|
Low
|
High
|
Low
|
High
|
Low
|
High
|
Low
|
|||||||||||||||||||||||||
|
Ch$
|
Ch$
|
Ch$
|
Ch$
|
US$
|
US$
|
US$
|
US$
|
|||||||||||||||||||||||||
|
2009
|
||||||||||||||||||||||||||||||||
|
First quarter
|
19,000 | 16,000 | 18,997 | 14,319 | - | - | 31.73 | 23.84 | ||||||||||||||||||||||||
|
Second quarter
|
22,000 | 19,000 | 21,839 | 15,969 | - | - | 38.88 | 27.75 | ||||||||||||||||||||||||
|
Third quarter
|
22,000 | 20,900 | 21,397 | 18,695 | - | - | 40.15 | 33.49 | ||||||||||||||||||||||||
|
Fourth quarter
|
21,910 | 20,700 | 21,401 | 18,600 | - | - | 40.18 | 36.36 | ||||||||||||||||||||||||
|
2010
|
||||||||||||||||||||||||||||||||
|
First quarter
|
22,150 | 21,000 | 21,329 | 18,903 | - | - | 43.85 | 34.40 | ||||||||||||||||||||||||
|
Second quarter
|
21,725 | 21,501 | 19,844 | 17,561 | - | - | 36.32 | 31.91 | ||||||||||||||||||||||||
|
Third quarter
|
25,101 | 21,501 | 24,222 | 17,780 | - | - | 49.95 | 33.03 | ||||||||||||||||||||||||
|
Fourth quarter
|
27,000 | 23,850 | 26,536 | 22,892 | 58.42 | 46.89 | ||||||||||||||||||||||||||
|
2011
|
||||||||||||||||||||||||||||||||
|
First quarter
|
28,200 | 26,600 | 28,423 | 24,571 | - | - | 59.15 | 50.49 | ||||||||||||||||||||||||
|
Second quarter (through May 31)
|
29,000 | 27,100 | 29,163 | 25,554 | - | - | 62.57 | 56.26 | ||||||||||||||||||||||||
90
|
(c)
|
Last 6 months
|
|
Santiago Stock Exchange
|
NYSE
|
|||||||||||||||||||||||||||||||
|
Per Share (1)
|
Per ADR
|
|||||||||||||||||||||||||||||||
|
Series A
|
Series B
|
Series A (2)
|
Series B (3)
|
|||||||||||||||||||||||||||||
|
High
|
Low
|
High
|
Low
|
High
|
Low
|
High
|
Low
|
|||||||||||||||||||||||||
|
Ch$
|
Ch$
|
Ch$
|
Ch$
|
US$
|
US$
|
US$
|
US$
|
|||||||||||||||||||||||||
|
December 2010
|
27,000 | 24,000 | 26,536 | 24,827 | - | - | 58.42 | 52.52 | ||||||||||||||||||||||||
|
January 2011
|
28,200 | 26,600 | 28,423 | 25,757 | - | - | 59.15 | 52.72 | ||||||||||||||||||||||||
|
February 2011
|
28,000 | 27,400 | 26,793 | 24,571 | - | - | 56.82 | 51.55 | ||||||||||||||||||||||||
|
March 2011
|
27,450 | 27,100 | 26,502 | 24,681 | - | - | 56.29 | 50.49 | ||||||||||||||||||||||||
|
April 2011
|
29,000 | 27,100 | 27,899 | 26,706 | - | - | 61.03 | 56.26 | ||||||||||||||||||||||||
|
May 2011
|
29,989 | 28,730 | 29,163 | 26,554 | - | - | 62.57 | 56.35 | ||||||||||||||||||||||||
|
(1)
|
Pesos per share of Common Stock reflect nominal price at trade date.
|
|
(2)
|
Series A shares started trading on the New York Stock Exchange on April 9, 1999.
|
|
(3)
|
Series B shares began trading on the New York Stock Exchange on September 20, 1993. Historical prices have been restated to reflect the change in the ratio of local shares to ADRs from 10:1 to 1:1, effective March 28, 2008.
|
As of May 31, 2011, there were 43,669,229 Series B ADRs outstanding held by 69 holders of record for the Series B ADRs. As of May 31, 2011, such ADRs represented approximately 16.6% of the total number of issued and outstanding shares of our Company.
|
9.B
|
Plan Of Distribution
|
Not Applicable
|
9.C
|
Markets
|
The Series A shares and the Series B shares are currently traded on the Santiago Stock Exchange, the Bolsa Electrónica de Chile Bolsa de Valores S.A., (the Electronic Stock Exchange), and the Bolsa de Corredores Bolsa de Valores S.A., (the Valparaíso Stock Exchange). As of December 31, 2007, each series was also traded on the New York Stock Exchange in the form of ADRs, where each ADR represented 10 underlying shares of the corresponding series. On February 26, 2008, the Company’s Board of Directors voted to voluntarily delist the Series A ADRs from the New York Stock Exchange, due to the low trading volume of those shares. On the same date, the Board of Directors also approved a ratio change for the Series B ADRs, modifying the previous ratio of 10 ordinary shares to 1 ADR to a new ratio of 1:1. The Series A ADRs were delisted on March 27, 2008, and the Series B ratio change entered into effect on March 28, 2008. Prior to their delisting, the ADRs representing Series A shares traded on the NYSE beginning on April 9, 1999. The ADRs representing Series B shares have traded on the NYSE since September 20, 1993. The depositary bank for these ADRs is the Bank of New York Mellon.
|
9.D
|
Selling Shareholders
|
Not applicable
91
|
9.E
|
Dilution
|
Not applicable
|
9.F
|
Expenses Of The Issue
|
Not applicable
92
|
ITEM 10.
|
ADDITIONAL INFORMATION
|
|
10.A.
|
Share Capital
|
Not applicable
|
10.B.
|
Memorandum and Articles of Association
|
SQM S.A., headquartered at El Trovador Nº 4285, 6th Floor, Santiago, Chile, is an open stock corporation -sociedad anónima abierta- organized under the laws of the Republic of Chile. The Company was constituted by public deed issued on June 17, 1968 by Mr. Sergio Rodríguez Garcés, Notary Public of Santiago. Its existence was approved by Decree No. 1.164 of June 22, 1968 of the Ministry of Finance, and it was registered on June 29, 1968 in the Business Registry of Santiago, on page 4.537 Nº 1.992.
Corporate purposes
Our main purposes, which appear in article 4 of our By-laws, are to:
(a)
perform all kinds of chemical or mining activities and businesses and, among others, those related to researching, prospecting, extracting, producing, working, processing, purchasing, disposing of, and commercializing properties, as applicable, of all metallic and non-metallic and fossil mining substances and elements of any type or nature, to be obtained from them or from one or more concessions or mining deposits, and in their natural or converted state, or transformed into different raw materials or manufactured or partially manufactured products, and of all rights and properties thereon;
(b)
manufacture, produce, work, purchase, transfer ownership, import, export, distribute, transport, and commercialize in any way, all kinds of fertilizers, components, raw materials, chemical, mining, agricultural, and industrial products, and their by-products;
(c)
generate, produce, distribute, purchase, transfer ownership, and commercialize, in any way, all kinds of electrical, thermal, geothermic or other type of power, and hydric resources or water rights in general;
(d)
request, manifest, claim, constitute, explore, work, lease, transfer ownership, and purchase, in any way, all kinds of mining concessions;
(e)
purchase, transfer ownership, and administer, in any way, any kind of telecommunications, railroads, ships, ports, and any means of transport, and represent and manage shipping companies, common carriers by water, airlines, and carries in general;
(f)
manufacture, produce, commercialize, maintain, repair, assemble, construct, disassemble, purchase and transfer ownership, and in any way, any kind of electromechanical structure, and substructure in general, components, parts, spares, or parts of equipment, and machines, and execute, develop, advice, and commercialize, any kind of electromechanical or smelting activities;
(g)
purchase, transfer ownership, lease, and commercialize any kind of agro industrial and farm forestry activities, in any way
(h)
purchase, transfer ownership, lease, and commercialize, in any way, any kind of urban or rural real estate;
(i)
render any kind of health services and manage hospitals, private clinics, or similar facilities;
(j)
construct, maintain, purchase, transfer ownership, and manage, in any way, any kind of roads, tunnels, bridges, water supply systems, and other required infrastructure works, without any limitation, regardless of whether they may be public or private, among others, to participate in bids and enter into any kind of contracts, and to be the legal owner of the applicable concessions; and
(k)
purchase, transfer ownership, and commercialize, in any way, any kind of intangible properties such as stocks, bonds, debentures, financial assets, commercial papers, shares or rights in corporations, and any kind of bearer securities or instruments, and to administer such investments, acting always within the Investment and Financing Policies approved by the applicable General Shareholders Meeting. We may comply with the foregoing by acting ourselves or through or with other different legal entities or natural persons, within the country or abroad, with properties of our own or owned by third parties, and additionally, in the ways and territories, and with the aforementioned properties and purposes, we may also construct and operate industrial or agricultural facilities or installations; constitute, administer, purchase, transfer ownership, dissolve, liquidate, transform, modify, or form part of partnerships, institutions, foundations, corporations, or associations of any kind or nature; perform all actions, enter into all contracts, and incur in all obligations convenient or necessary for the foregoing; perform any business or activity related to its properties, assets, or patrimony, or with that of its affiliates, associated companies, or related companies; and render financial, commercial, technical, legal, auditing, administrative, advisory, and other pertinent services.
93
Directors
As stated in article 9 of the Company's By-laws, the Company has 8 Directors. One of the Directors must be “independent” as such term is defined in Article 50 bis of Law Nº 18.046. Moreover, the possession of shares is not a condition necessary to become a Director of the Company.
As stated in article 10 of the Company's By-laws, the term of the Directors is of three years and they can be reelected indefinitely; thus, there is no age limit for their retirement.
The Company's By-laws, in articles 16 and 16 bis, essentially establish that the transactions in which a Director has a material interest must comply with the provisions set forth in articles 146 to 149 and 136 of Law Nº 18.046 and the applicable regulations of such Law.
The Board of Directors duties are remunerated, as stated in article 17 of the Company's By-laws, and the amount of that compensation is fixed yearly by the General Ordinary Shareholders’ Meeting. Therefore, Directors can neither determine nor modify their compensation.
Directors cannot authorize Company loans on their behalf.
The Board of Directors must provide shareholders and the public with sufficient, reliable and timely information pertaining to the Company’s legal, economic and financial situation, as required by the Law or the Superintendency of Securities and Insurance. The Board of Directors must adopt the appropriate measures in order to avoid the disclosure of such information to persons other than those persons who should possess such information as a result of their title, position or activity within the Company before such information is disclosed to shareholders and the public. The Board of Directors must treat business dealings and other information about the Company as confidential until such information is officially disclosed. No Director may take advantage of the knowledge about commercial opportunities that he has obtained through his position as Director.
Independent Directors and Directors Committee
According to Chilean Law, SQM S.A. must appoint at least one Independent Director and a Directors’ Committee, due to the fact that (a) the Company has a market capitalization greater than or equal to UF 1,500,000 and (b) at least 12.5% of the Company’s shares with voting rights are held by shareholders who, on an individual basis, control or possess less than 10% of such shares.
Persons who have not been involved in any of the circumstances described in the Law at any time during the preceding 18 months are considered independent. Candidates for the position of Independent Director must be proposed by shareholders representing 1% or more of the Company’s shares, at least 10 days prior to the date of the Shareholders’ Meeting that has been called in order to elect the Directors. No less than two days prior to the respective Shareholders’ Meeting, the candidate must provide the Chief Executive Officer with a sworn statement indicating that he: (a) accepts his candidacy for the position of Independent Director (b) does not meet any of the conditions that would prevent him from being the Independent Director (c) is not related to the Company, the other companies of the group to which the Company belongs, the controller of the Company, or any of the Company’s officers in such a way that would deprive a sensible person of a reasonable degree of autonomy, interfere with his ability to perform his duties objectively and effectively, generate a potential conflict of interest, or interfere with his independent judgment, and (d) assumes the commitment to remain independent as long as he holds the position of Director.
94
The Directors’ Committee shall have the following powers and duties: (a) to examine the reports of the external auditors, the balance sheet and other financial statements presented by the Company’s managers or liquidators to its shareholders and issue an opinion about the same prior to their submission for the approval of the shareholders (b) to propose to the Board of Directors the external auditors and risk rating agencies to be proposed to shareholders at the respective Shareholders’ Meeting. In the event that an agreement cannot be reached, the Board of Directors shall formulate its own suggestion, and both options shall be submitted for shareholder consideration at such Shareholders’ Meeting (c) to examine the information relating to operations referred to in Articles 146 to 149 of Law No. 18,046 and to prepare a report about such operations. A copy of such report shall be sent to the Board of Directors, and such report must be read at the Board Meeting called for the purpose of approving or rejecting the respective operation or operations (d) to examine the remuneration system and compensation plans for the Company’s management, officers and employees (e) to prepare an annual report on its activities, including its main recommendations to the shareholders (f) to inform the Board of Directors about whether or not it is advisable to hire the external audit firm to provide non-audit services where the firm is not prohibited from providing such services because the nature of the same could pose a threat to the firm’s independence, and (g) any other issues indicated in the Company’s by-laws or authorized by a Shareholders’ Meeting or the Board of Directors.
The Directors’ Committee shall be comprised of three members, with at least one independent member. In the event that more than three Directors have the right to form part of the Committee, these same Directors shall unanimously determine who shall make up the Committee. In the event that an agreement cannot be reached, the Directors who were elected with a greater percentage of votes by shareholders controlling or possessing less than 10% of the Company’s shares shall be given priority. If there is only one Independent Director, this Director shall name the other members of the Committee among the other Directors who are not independent. Such other members of the Committee shall have all of the rights associated with such position. The members of the Committee shall be compensated for their role. The amount of their remuneration shall be set annually at the General Shareholders’ Meeting, and it may not be less than the remuneration set for the Main Directors, plus an additional 1/3 of that amount. The General Shareholders’ Meeting shall determine a budget for the expenses of the Committee and its advisors. Such budget may not be less than the sum of the annual remunerations of the Committee members. The Committee may need to hire professional advisory services in order to carry out its duties, in accordance with the abovementioned budget. The proposals made by the Committee to the Board of Directors that are not accepted by the latter must be reported to the Shareholders’ Meeting prior to the vote by shareholders on the corresponding matter or matters. In addition to the responsibilities that are associated with the position of Director, the members of the Committee are jointly and severally liable for any damages they cause, in performing their duties as such, to the shareholders and to the Company.
Shares
Dividends are annually distributed to the Series A and Series B shareholders of record on the fifth business day prior to the date for payment of the dividends. The By-laws do not specify a time limit after which dividend entitlement elapses but Chilean regulations establish that after 5 years, unclaimed dividends are to be donated to the Fire Department.
Article 5 of the Company's By-laws establishes that Series B shares may in no case exceed fifty percent of the issued, outstanding and paid shares of SQM S.A.- Series B shares have a restricted right to vote as they can only elect one Director of the Company, regardless of their capital stock's share. Series B shares have the right to call for an Ordinary or Extraordinary Shareholders’ Meeting when the shareholders of at least 5% of the Series B issued shares request so and for an Extraordinary Board of Directors Meeting without the Chairman's authorization when it is requested by the Director elected by the shareholders of the Series B shares. Series A shares have the option to exclude the Director elected by Series B shareholders from the voting process in which the Chairman of the Board is to be elected, if there is a tie in the first voting process. However, articles 31 and 31 bis establish that in General Shareholders’ Meetings each shareholder will have a right to one vote for each share he owns or represents and (a) that no shareholder will have the right to vote for himself or on behalf of other shareholders of the same Series A or Series B shares representing more than 37.5% of the outstanding shares with right to vote of each Series and (b) that no shareholder will have the right to vote for himself or on behalf of other shareholders representing more than 32% of the outstanding shares with a right to vote. In calculating a single shareholder's ownership of Series A or B shares, the shareholder's stock and those pertaining to third parties related to them are to be added.
95
Article 5 bis of the Company's By-laws establishes that no person may directly or by means of related third persons concentrate more than 32% of the Company’s total shares with right to vote.
Each Series A share and Series B share is entitled to share equally in the Company's profits, i.e., they have the same rights on any dividends declared on the outstanding shares of SQM S.A.-
The Company By-laws do not contain any provision relating to (a) redemption provisions (b) sinking funds or (c) liability to capital calls by the Company.
As established in Article 103 of Law N°18.046, a company subject to the supervision of the Superintendency of Securities and Insurance (SVS) may be liquidated in the following cases:
(a) Expiration of the duration term, if any, as established in its By-laws;
(b) All the shares end up in the possession of one individual for more than ten continuous days;
(c) By agreement of an Extraordinary Shareholders Meeting;
(d) By abolition, pursuant to applicable laws, of the decree that authorized its existence;
(e) Any other reason contemplated in its By-laws.
Article 40 of the Company's By-laws states that in the event of liquidation, the Shareholders’ Meeting will appoint a three-member receiver committee that will have the authority to carry out the liquidation process. Any surplus will be distributed equally among the shareholders.
The only way to change the rights of the holders of the SQM S.A. shares is by modifying its By-laws, which can only be carried out by an Extraordinary Shareholders’ Meeting, as set forth in article 28 of the Company By-laws.
Shareholders’ meetings
Article 29 of the Company's By-laws states that the call to a Shareholders’ Meeting, either Ordinary or Extraordinary, will be by means of a highlighted public notice that will be published at least three times, and on different days, in the newspaper of the legal address determined by the Shareholders’ Meeting, and in the way and under the conditions indicated by the Regulations. Additionally, a notice will be sent by mail to each shareholder at least fifteen days prior to the date of the Meeting, which shall include a reference of the matters to be addressed at the meeting. However, those meetings with the full attendance of the shares with right to vote may be legally held, even if the foregoing formal notice requirements are not met. Notice of any Shareholders’ Meeting shall be delivered to the SVS, at least fifteen days in advance of such meeting.
Any holder of Series A and/or Series B shares registered in the Company's shareholder registry on the fifth business day prior to the date of the meeting will have a right to participate at that meeting
Article 67 of Law No. 18,046 provides that decisions made at Extraordinary Shareholders’ Meeting on the following matters require the approval of 2/3 of the outstanding shares with voting rights: (1) transformation or division of the Company and its merger with another company; (2) modification of the Company’s term of duration, if any; (3) early dissolution of the Company; (4) change of the corporate domicile; (5) capital decrease; (6) approval of contributions and estimation of non-cash assets; (7) modification of powers reserved for Shareholders Meetings or limitations on powers of the Board of Directors; (8) reduction in the number of members of the Board of Directors; (9) disposal of 50% or more of the Company’s assets; formulation or modification of any business plan exceeding the above percentage; disposal of 50% or more of an asset belonging to a subsidiary that represents at least 20% of the Company’s assets; disposal of shares such that the parent company would loose its position as controller; (10) method in which profits are distributed; (11) granting of real or personal guarantees as sureties for third-party obligations that exceed 50% of the Company assets, except for subsidiaries, in which case approval of the Board of Directors shall suffice; (12) acquisition of own shares as set forth in articles 27A and 27B herein; (13) other matters indicated in the By-laws; (14) amendment of the Company By-laws as a result of errors in the constitution process and amendments in the By-laws involving one or more of the matters stated in the preceding numbers; (15) forced sale of shares carried out by the controller who would acquire more than 95% of the Company’s shares in a tender offer, and (16) approval or ratification of proceedings or contracts with related parties in accordance with the provisions of Articles 44 and 147 of Law No. 18,046.
96
Amendments to the By-laws that are intended to create, modify, defer or suspend preferential rights shall be approved by 2/3 of the shares of the affected series.
The transformation of the Company, the merger of the same, the disposal of assets referred to in number (9) above, the constitution of guarantees set forth in number (11) above, the constitution of preferences or the increase, postponement or decrease of the existing preferences, the reparation of formal nullities incurred in the By-laws and the possession of more than 95% of the Company’s shares and other matters contemplated in the Law or in the By-laws, confer “withdrawal rights”.
Foreign shareholders
There exists no restriction on ownership or share concentration, or limiting the exercise of the related right to vote, by local or foreign shareholders other than those discussed under Item 2.B. Memorandum and Articles of Association -Shares above.
Change in control
The Company By-laws provide that no shareholder may hold more than 32% of the Company’s shares, unless the By-laws are modified at an Extraordinary Shareholders’ Meeting. Moreover, on December 12, 2000, the Chilean Government published the Ley de Oferta Pública de Acciones (Public Share Offering law) or (OPA law) that seeks to protect the interests of minority shareholders of open stock corporations in transactions involving a change in control, by requiring that the potential new controller purchase the shares owned by the remaining shareholders either in total or pro rata. The law applies to those transactions in which the controlling party would receive a material premium price compared with the price that would be received by the minority shareholders.
There are three conditions that would make it mandatory to operate under the OPA law:
|
|
1)
|
When an investor wants to take control of a company's stock.
|
|
|
2)
|
When a controlling shareholder holds two-thirds of the company's stock. If such shareholder buys one more share, it will be mandatory to offer to acquire the rest of the outstanding stock within 30 days of surpassing that threshold.
|
|
|
3)
|
When an investor wants to take control of a corporation, which, in turn, controls an open stock corporation that represents 75% or more of the consolidated assets of the former corporation.
|
Parties interested in taking control of a company must (i) notify the company of such intention in writing, and notify its controllers, the companies controlled by it, the SVS and the markets where its stocks are traded and (ii) publish a highlighted public notice in two newspapers of national circulation at least 10 business days prior to the date of materialization of the OPA.
Disclosure of share ownership
The Company's By-laws do not provide for a minimum threshold at which share ownership must be disclosed.
97
|
10.C.
|
Material Contracts
|
The following summarizes the terms and conditions of the main contracts to which SQM or any subsidiary is a party:
|
|
·
|
On February 12, 1999, SQM S.A. entered into an Electrical Energy Supply contract with Electroandina S.A. This contract allowed for two three-year renewal options, at the option of SQM. The first option was exercised. As a result, the contract extends through March 16, 2013 with a three-year renewal option of SQM. Early termination of the contract is subject to payment of non-amortized investments.
|
|
|
·
|
On March 21, 1997, SQM Salar S.A. entered into an Electricity Supply agreement with Norgener S.A. The term of this contract extends through March 20, 2017, and early termination is subject to penalties.
|
|
|
·
|
On January 13, 1998, SQM Nitratos S.A. entered into an Electrical Energy Supply agreement with Norgener S.A. The term of this contract extends through January 31, 2013. Early termination of the contract is subject to payment of non-amortized investments.
|
In addition, the Company, during the normal course of business, has entered into different contracts, some of which have been described herein, related to its production, commercial and legal operations. We believe all of these contracts are standard for this type of industry, and none of them is expected to have a material effect on the Company's results of operations.
|
10.D.
|
Exchange Controls
|
The Central Bank of Chile is responsible for, among other things, monetary policies and exchange controls in Chile. Appropriate registration of a foreign investment in Chile permits the investor access to the Formal Exchange Market. Foreign investments can be registered with the Foreign Investment Committee under Decree Law Nº600 of 1974 or can be registered with the Central Bank of Chile under the Central Bank Act, Law Nº18840 of October 1989. The Central Bank Act is an organic constitutional law requiring a "special majority" vote of the Chilean Congress to be modified.
Our 1993, 1995 and 1998 capital increases were carried out under and subject to the then current legal regulations, whose summary is hereafter included:
A
'Convención Capítulo XXVI del Título I del Compendio de Normas de Cambios Internacionales'
or Compendium of Foreign Exchange Regulations of the Central Bank of Chile, "Foreign Investment Contract" was entered into and among the Central Bank of Chile, our Company and the Depositary, pursuant to Article 47 of the Central Bank Act and to Chapter XXVI of the Compendium of Foreign Exchange Regulations of the Central Bank of Chile, "Chapter XXVI", which addresses the issuance of ADRs by a Chilean company. Absent the Foreign Investment Contract, under applicable Chilean exchange controls, investors would not be granted access to the Formal Exchange Market for the purposes of converting from Chilean Pesos to U.S. dollars and repatriating from Chile amounts received in respect to deposited Series A or B shares or Series A or B shares withdrawn from deposit on surrender of ADRs (including amounts received as cash dividends and proceeds from the sale in Chile of the underlying Series A and Series B shares and any rights arising therefrom). The following is a summary of the material provisions contained in the Foreign Investment Contract. This summary does not purport to be complete and is qualified in its entirety by reference to Chapter XXVI and the Foreign Investment Contract.
98
Under Chapter XXVI and the Foreign Investment Contract, the Central Bank of Chile has agreed to grant to the Depositary, on behalf of ADR holders, and to any investor not residing or not domiciled in Chile who withdraws Series A or Series B shares upon delivery of ADRs (such Series A and Series B shares being referred to herein as "Withdrawn Shares") access to the Formal Exchange Market to convert Chilean Pesos to U.S. dollars (and remit such U.S. dollars outside of Chile) in respect of Series A and Series B shares represented by ADRs or Withdrawn Shares, including amounts received as (a) cash dividends, (b) proceeds from the sale in Chile of Withdrawn Shares, or from shares distributed because of the liquidation, merger or consolidation of the Company, subject to receipt by the Central Bank of Chile of a certificate from the holder of such shares (or from an institution authorized by the Central Bank of Chile) that such holder's residence and domicile are outside Chile and a certificate from a Chilean stock exchange (or from a brokerage or securities firm established in Chile) that such shares were sold on a Chilean Exchange, (c) proceeds from the sale in Chile of preemptive rights to subscribe for additional Series A and Series B shares, (d) proceeds from the liquidation, merger or consolidation of the Company and (e) other distributions, including without limitation those resulting from any recapitalization, as a result of holding Series A and Series B shares represented by ADRs or Withdrawn Shares. Transferees of Withdrawn Shares will not be entitled to any of the foregoing rights under Chapter XXVI unless the Withdrawn Shares are redeposited with the Depositary. Investors receiving Withdrawn Shares in exchange for ADRs will have the right to redeposit such shares in exchange for ADRs, provided that the conditions to redeposit described hereunder are satisfied.
Chapter XXVI provided that access to the Formal Exchange Market in connection with dividend payments will be conditioned upon certification by the Company to the Central Bank of Chile that a dividend payment has been made and any applicable tax has been withheld. Chapter XXVI also provides that access to the Formal Exchange Market in connection with the sale of Withdrawn Shares or distributions thereon will be conditioned upon receipt by the Central Bank of Chile of certification by the Depositary that such shares have been withdrawn in exchange for ADRs and receipt of a waiver of the benefit of the Foreign Investment Contract with respect thereto until such Withdrawn Shares are redeposited.
Chapter XXVI and the Foreign Investment Contract provided that a person who brings certain types of foreign currency into Chile, including U.S. dollars, to purchase Series A shares and/or Series B shares with the benefit of the Foreign Investment Contract must convert it into Chilean Pesos on the same date and has 5 banking business days within which to invest in Series A shares and/or Series B shares in order to receive the benefits of the Foreign Investment Contract. If such person decides within such period not to acquire Series A shares and/or Series B shares, he can access the Formal Exchange Market to reacquire foreign currency, provided that the applicable request is presented to the Central Bank within 7 banking business days of the initial conversion into pesos. Series A shares and/or Series B shares acquired as described above may be deposited for ADRs and receive the benefits of the Foreign Investment Contract, subject to receipt by the Central Bank of Chile of a certificate from the Depositary that such deposit has been effected and that the related ADRs have been issued and receipt by the Custodian of a declaration from the person making such deposit waiving the benefits of the Foreign Investment Contract with respect to the deposited Series A shares and/or Series B shares.
Access to the Formal Exchange Market under any of the circumstances described above is not automatic. Pursuant to Chapter XXVI, such access requires approval of the Central Bank of Chile based on a request presented through a banking institution established in Chile. The Foreign Investment Contract will provide that if the Central Bank of Chile has not acted on such request within seven banking days, the request will be deemed approved.
Under current Chilean law, foreign investments abiding by the Foreign Investment Contract cannot be changed unilaterally by the Central Bank of Chile. No assurance can be given, however, that additional Chilean restrictions applicable to the holders of ADRs, the disposition of underlying Series A shares and/or Series B shares or the repatriation of the proceeds from such disposition could not be imposed in the future, nor can there be any assessment of the duration or impact of such restrictions if imposed.
As of April 19, 2001, Chapter XXVI of Title I of the
Compendio de Normas de Cambios Internacionales
of the Central Bank of Chile was eliminated and new investments in ADR's by non-residents of Chile, are now governed by Chapter XIV of the
Compendio de Normas de Cambios Internacionales
of the Central Bank of Chile. This was made with the purpose of simplifying and facilitating the flow of capital to and from Chile. According to the new regulations, such investments must be carried out through Chile's Formal Exchange Market and only reported to the Central Bank of Chile. Foreign investments may still be registered with the Foreign Investment Committee under Decree Law 600 of 1974, as amended, and obtain the benefits of the contract executed under Decree Law 600.
99
The Central Bank is also responsible for controlling incurrence of loan obligations to be paid from Chile and by a Chilean borrower to banks and certain other financial institutions outside Chile. Chapter XIV establishes what type of loans, investments, capital increases and foreign currency transactions are subject to the current Chapter XIV framework. Foreign currency transactions related to foreign loans must be performed through the Formal Exchange Market, and such transactions and the subsequent modifications of original loans must be properly informed to the Central Bank. Transactions prior to April 19, 2001, will continue to be regulated by the previous legal framework, except in cases where an express request has been presented to the Central Bank resigning previous rights to be regulated by the provisions of Chapter XIV. This summary does not purport to be complete and is qualified in its entirety by reference to the provisions of Chapter XIV.
As of December 31, 2010, we had bonds issued in the international markets under Rule 144A/Regulation S of US$200 million and US$250 million, and we had an outstanding bilateral loan in the amount of US$140.0 million. Additionally, Royal Seed Trading Corporation, a wholly owned subsidiary, has an outstanding syndicated loan in the amount of US$80.0 million, which is fully guaranteed by us.
Any purchases of U.S. dollars in connection with payments on these loans will occur with the Formal Exchange Market. There can be no assurance, however, that restrictions applicable to payments in respect to the loans could not be imposed in the future, nor can there be any assessment of the duration or impact of such restrictions if imposed.
|
10.E.
|
Taxation
|
Chilean Tax Considerations
The following describes the material Chilean income tax consequences of an investment in the ADRs by an individual who is not domiciled or resident in Chile or any legal entity that is not organized under the laws of Chile and does not have a permanent establishment located in Chile, a "foreign holder." This discussion is based upon Chilean income tax laws presently in force, including Ruling No. 324 (1990) of the Chilean Internal Revenue Service and other applicable regulations and rulings. The discussion is not intended as tax advice to any particular investor, which can be rendered only in light of that investor's particular tax situation.
Under Chilean law, provisions contained in statutes such as tax rates applicable to foreign investors, the computation of taxable income for Chilean purposes and the manner in which Chilean taxes are imposed and collected may only be amended by another statute. In addition, the Chilean tax authorities issue rulings and regulations of either general or specific application and interpret the provisions of Chilean tax law. Chilean tax may not be assessed retroactively against taxpayers who act in good faith relying on such rulings, regulations and interpretations, but Chilean tax authorities may change said rulings, regulations and interpretations prospectively.
Cash Dividends and Other Distributions
Cash dividends paid by the Company with respect to the shares, including shares represented by ADRs held by a U.S. holder will be subject to a 35% Chilean withholding tax, which is withheld and paid by the Company, the "Withholding Tax.” If the Company has paid corporate income tax, the "First Category Tax", on the income from which the dividend is paid, a credit for the First Category Tax effectively reduces the rate of Withholding Tax. When a credit is available, the Withholding Tax is computed by applying the 35% rate to the pre-tax amount needed to fund the dividend and then subtracting from the tentative withholding tax so determined the amount of First Category Tax actually paid on the pre-tax income. Under Chilean income tax law, dividends are assumed to have been paid out of our oldest retained tax profits for purposes of determining the rate at which the First Category Tax was paid.
The effective Withholding Tax rate, after giving effect to the credit for First Category Tax, generally is:
(Withholding Tax rate) - (First Category Tax effective rate)
1 - (First Category Tax effective rate)
100
The effective rate of Withholding Tax to be imposed on dividends paid by the Company will vary depending upon the amount of the First Category Tax paid by the Company on the earnings to which the dividends are attributed. The company distributed two dividends corresponding to the business year 2010. The first dividend, paid in December 2010, was considered taxable, and the total tax retention rate was approximately 22%. The second dividend, distributed by the Company in May 2011 corresponding to the business year 2010, was considered taxable, and the total tax retention rate was approximately 28%.
Dividend distributions made in property (such as distribution of cash equivalents) would be subject to the same Chilean tax rules as cash dividends. Stock dividends are not subject to Chilean taxation.
Capital Gains
Gains from the sale or other disposition by a foreign holder of ADR outside Chile will not be subject to Chilean taxation. The deposit and withdrawal of the shares in exchange for ADRs will not be subject to any Chilean taxes.
The tax basis of the shares received in exchange for ADRs (repatriation) will be the acquisition value of the shares. The shares exchanged for ADRs are valued at the highest price at which they trade on the Chilean Stock Exchange on the date of the exchange or on either of the two business days preceding the exchange. Consequently, the conversion of ADRs into the shares and the immediate sale of such shares at a price equal to or less than the highest price for Series B shares on the Chilean Stock Exchange on such dates will not generate a gain subject to Chilean taxation.
Gain recognized on a sale or exchange of shares (as distinguished from sales or exchanges of ADRs representing such shares) will be subject to both the First Category Tax and the Withholding Tax if either (i) the foreign holder has held the shares for less than one year since exchanging the ADRs for the shares, (ii) the foreign holder acquired and disposed of the shares in the ordinary course of its business or as a regular trader of shares, or (iii) the foreign holder and the purchaser of the shares are related parties within the meaning of Chilean tax law. The amount of the First Category Tax may be credited against the amount of the Withholding Tax. In all other cases, gain on the disposition of the shares will be subject only to a capital gains tax, which is assessed at the same rate as the First Category Tax. Gain recognized in the transfer of common shares that have significant trading volumes in the stock exchange, however, is not subject to capital gains tax in Chile, provided that the common shares are transferred in a local stock exchange authorized by the SVS, within the process of a public tender of common shares governed by the Chilean Securities Market Act. Law No. 20.448 states that common shares must also have been acquired after April 19, 2001, either on a local stock exchange authorized by the SVS, within the referred process of public tender of a common shares governed by the Chilean Securities Market Act, in an initial public offer of common shares resulting from the formation of a corporation or a capital increase of the same, in an exchange of convertible securities subject to public offer, or in the redemption of mutual funds shares. According to Ruling No 224 (2008) of the Chilean Internal Revenue Service, common shares received by exchange of ADRs are also considered as “acquired on a stock exchange” if the respective ADRs have been acquired on a foreign stock exchange authorized by the SVS (i.e. London Stock Exchange, New York Stock Exchange and Bolsa de Valores de Madrid). Common shares are considered to have a high presence in the stock exchange when they: a) are registered in the Securities Registry, b) are registered in a Chilean Stock Exchange, c) have an adjusted presence equal to or above 25%.
As of June 19, 2001 capital gains obtained in the sale of common shares that are publicly traded in a stock exchange are also exempt from capital gains tax in Chile when the sale is made by "foreign institutional investors" such as mutual funds and pension funds, provided that the sale is made in a local stock exchange authorized by the SVS, or in accordance with the provisions of the securities market law (law 18.045). To qualify as foreign institutional investors, the referred entities must be formed outside of Chile, not have a domicile in Chile, and they must be an "investment fund" in according with the Chilean tax law.
101
The exercise of preemptive rights relating to shares will not be subject to Chilean taxation. Any gain on the sale or assignment of preemptive rights relating to shares will be subject to both the First Category Tax and the Withholding Tax (the former being creditable against the latter).
Other Chilean Taxes
No Chilean inheritance, gift or succession taxes apply to the transfer or disposition of the ADRs by a foreign holder, but such taxes generally will apply to the transfer at death or by gift of the shares by a foreign holder. No Chilean stamp, issue, registration or similar taxes or duties apply to foreign holders of ADRs or shares.
Withholding Tax Certificates
Upon request, the Company will provide to foreign holders appropriate documentation evidencing the payment of Chilean withholding taxes.
United States Tax Considerations
The following discussion summarizes the principal U.S. federal income tax consequences to beneficial owners arising from ownership and disposition of the Series A shares and the Series B shares, together the "shares" and the ADRs. The discussion which follows is based on the United States Internal Revenue Code of 1986, as amended, the "Code", the Treasury regulations promulgated thereunder, and judicial and administrative interpretations thereof, all as in effect and available on the date hereof, and is subject to any changes in these or other laws occurring after such date. In addition, the summary assumes that the depositary’s activities are clearly and appropriately defined so as to ensure that the tax treatment of ADRs will be identical to the tax treatment of the underlying shares.
For purposes of this summary, the term "U.S. Holder" means a beneficial owner of shares or ADRs that is, for U.S. federal income tax purposes, (a) an individual who is a United States citizen or resident, (b) a corporation or partnership created or organized under the laws of the United States or any political subdivision thereof, (c) an estate, the income of which is subject to U.S. federal income tax regardless of the source, or (d) a trust (i) that validly elects to be treated as a U.S. person for U.S. federal income tax purposes or (ii)(A) if a court within the U.S. is able to exercise primary supervision over the administration of the trust and (B) one or more U.S. persons have the authority to control all substantial decisions of the trust.
The term "Non-U.S. Holder" means, for purposes of this discussion, a beneficial owner of shares or ADRs that is not a U.S. Holder.
If a partnership (or any other entity treated as a partnership for U.S. federal income tax purposes) holds shares or ADRs, the tax treatment of the partnership and a partner in such partnership generally will depend on the status of the partner and the activities of the partnership. Such a partner or partnership should consult its own tax advisor as to its consequences.
The discussion that follows is not intended as tax advice to any particular investor and is limited to investors who will hold the shares or ADRs as "capital assets" within the meaning of Section 1221 of the Code and whose functional currency is the United States dollar. The summary does not address the tax treatment of U.S. Holders and Non-U.S. Holders that may be subject to special U.S. federal income tax rules, such as insurance companies, tax-exempt organizations, financial institutions, persons who are subject to the alternative minimum tax, or persons who are broker-dealers in securities, who hold the shares or ADRs as a hedge against currency risks, as a position in a "straddle" for tax purposes, or as part of a conversion or other integrated transaction, or who own (directly, indirectly or by attribution) 10% or more of the total combined voting power of all classes of the Company's capital stock entitled to vote or 10% or more of the value of the outstanding capital stock of the Company.
As of this date, there is currently no applicable income tax treaty in effect between the United States and Chile. However, in 2010, the United States and Chile signed an income tax treaty that will enter into force once the treaty is ratified by both countries. There can be no assurance that the treaty will be ratified by either country. The following summary assumes that there is no applicable income tax treaty in effect between the United States and Chile.
102
The discussion below does not address the effect of any United States state, local, estate or gift tax law or foreign tax law on a U.S. Holder or Non-U.S. Holder of the shares or ADRs. U.S. HOLDERS AND NON-U.S. HOLDERS OF SHARES OR ADRs SHOULD CONSULT THEIR OWN TAX ADVISORS TO DETERMINE THE PARTICULAR CONSEQUENCES UNDER ANY SUCH LAW OF OWNING OR DISPOSING THE SHARES OR ADRs.
For purposes of applying U.S. federal income tax law, any beneficial owner of an ADR generally will be treated as the owner of the underlying shares represented thereby.
TO ENSURE COMPLIANCE WITH U.S. TREASURY DEPARTMENT CIRCULAR 230, INVESTORS ARE ADVISED THAT: (A) ANY DISCUSSION OF U.S. FEDERAL TAX ISSUES IN THIS FORM 20-F IS NOT INTENDED OR WRITTEN TO BE RELIED UPON, AND CANNOT BE RELIED UPON, BY INVESTORS FOR THE PURPOSE OF AVOIDING PENALTIES THAT MAY BE IMPOSED ON SUCH INVESTORS UNDER THE U.S. INTERNAL REVENUE CODE OF 1986, AS AMENDED; (B) SUCH DISCUSSION IS INCLUDED BY THE COMPANY IN CONNECTION WITH THE PROMOTION OR MARKETING (WITHIN THE MEANING OF CIRCULAR 230) BY THE COMPANY OF THE TRANSACTIONS OR MATTERS ADDRESSED HEREIN; AND (C) INVESTORS SHOULD SEEK ADVICE BASED ON THEIR PARTICULAR CIRCUMSTANCES FROM AN INDEPENDENT TAX ADVISOR.
Cash Dividends and Other Distributions
The U.S. Treasury Department has expressed concern that depositaries for ADRs, or other intermediaries between the holders of shares of an issuer and the issuer, may be taking actions that are inconsistent with the claiming of U.S. foreign tax credits by U.S. holders of such receipts or shares. Accordingly, the analysis regarding the availability of a U.S. foreign tax credit for Chilean taxes and sourcing rules described below could be affected by future actions that may be taken by the U.S. Treasury Department.
The following discussion of cash dividends and other distributions is subject to the discussion below under “Passive Foreign Investment Company Considerations”. The gross amount of a distribution with respect to shares or ADRs generally will be treated as a taxable dividend to the extent of the Company's current and accumulated earnings and profits, computed in accordance with U.S. federal income tax principles. A dividend distribution will be so included in gross income when received by (or otherwise made available to) (i) the U.S. Holder in the case of the shares or (ii) the depositary in the case of the ADRs, and in either case will be characterized as ordinary income for U.S. federal income tax purposes. Distributions in excess of the Company's current and accumulated earnings and profits will be applied against and will reduce the U.S. Holder's tax basis in the shares or ADRs and, to the extent distributions exceed such tax basis, the excess will be treated as gain from a sale or exchange of such shares or ADRs. U.S. Holders that are corporations will not be allowed a deduction for dividends received in respect of distributions on the shares or the ADRs. For example, if the gross amount of a distribution with respect to the shares or ADRs exceeds the Company's current and accumulated earnings and profits by US$10.00, such excess will generally not be subject to a U.S. tax to the extent the U.S. Holder's tax basis in the shares or ADRs equals or exceeds US$10.00. The Company does not maintain calculations of its earnings and profits under U.S. federal income tax principles. Accordingly, U.S. Holders should assume that any cash distribution made by us will be treated as a dividend for U.S. federal income tax purposes.
If a dividend distribution is paid in Chilean pesos, the amount includable in income will generally be the U.S. dollar value, on the date of receipt by the U.S. Holder in the case of the shares or by the depositary in the case of the ADRs, of the peso amount distributed, regardless of whether the payment is actually converted into U.S. dollars. The amount of any distribution of property other than cash will be the fair market value of such property on the date of distribution. Any gain or loss resulting from currency exchange rate fluctuations during the period from the date the dividend is includable in the income of the U.S. Holder to the date the pesos are converted into U.S. dollars will be treated as ordinary income or loss.
103
A dividend distribution will be treated as foreign source income and will generally be classified as "passive category income" or in the case of certain U.S. Holders “general category income" for U.S. foreign tax credit purposes. If Chilean withholding taxes are imposed on a dividend, U.S. Holders will be treated as having actually received the amount of such taxes (net of any credit for the First Category Tax) and as having paid such amount to the Chilean taxing authorities. As a result, the amount of dividend income included in gross income by a U.S. Holder will be greater than the amount of cash actually received by the U.S. Holder with respect to such dividend income. A U.S. Holder may be able, subject to certain generally applicable limitations, to claim a foreign tax credit or a deduction for Chilean withholding taxes (net of any credit for the First Category Tax) imposed on dividend payments. The rules relating to the determination of the U.S. foreign tax credit are complex and the calculation of U.S. foreign tax credits and, in the case of a U.S. Holder that elects to deduct foreign taxes, the availability of deductions, involve the application of rules that depend on a U.S. Holder's particular circumstances. U.S. Holders should, therefore, consult their own tax advisors regarding the application of the U.S. foreign tax credit rules to dividend income on the shares or ADRs.
Subject to the discussion below under “Information Reporting and Backup Withholding”, if you are a
Non-U.S. Holder, you generally will not be subject to U.S. federal income or withholding tax on dividends received by you on your shares or ADRs, unless you conduct a trade or business in the United States and such income is effectively connected with that trade or business.
Capital Gains
A
U.S. Holder will generally recognize gain or loss on the sale, redemption or other disposition of the shares or ADRs in an amount equal to the difference between the amount realized on the sale or exchange and the U.S. Holder's adjusted basis in such shares or ADRs. Thus, if the U.S. Holder sells the shares for US$40.00 and such U.S. Holder's tax basis in such shares is US$30.00, such U.S. Holder will generally recognize a gain of US$10.00 for U.S. federal income tax purposes.
Subject to the discussion below under “Passive Foreign Investment Company Considerations”, gain
or loss upon the sale of the shares or ADRs will be capital gain or loss if the shares or ADRs are capital assets in the hands of the U.S. Holder. Capital gains on the sale of capital assets held for one year or less are subject to U.S. federal income tax at ordinary income tax rates. Net capital gains derived with respect to capital assets held for more than one year are eligible for reduced rates of taxation. Gain or loss realized by a U.S. Holder on the sale or exchange of shares or ADRs will be U.S.-source income. In addition, certain limitations exist on the deductibility of capital losses by both corporate and individual taxpayers. Any tax imposed by Chile directly on the gain from such a sale would generally be eligible for the U.S. foreign tax credit; however, because the gain would generally be U.S.-source, a U.S. Holder might not be able to use the credit otherwise available. U.S. Holders should consult their own tax advisors regarding the foreign tax credit implications of the sale, redemption or other disposition of a share or ADR.
Subject to the discussion below under “Information Reporting and Backup Withholding”, a Non-U.S. Holder of ADRs or shares will not be subject to United States income or withholding tax on gain from the sale or other disposition of ADRs or shares unless, in general (i) such gain is effectively connected with the conduct of a trade or business within the United States or (ii) the Non-U.S. Holder is an individual who is present in the United States for at least 183 days during the taxable year of the disposition
and certain other conditions are met.
Passive Foreign Investment Company Considerations
A Non-U.S. corporation will be classified as a “passive foreign investment company”, or a PFIC, for U.S. federal income tax purposes in any taxable year in which, after applying certain look-through rules, either (i) at least 75% of its gross income is “passive income” or (ii) at least 50% of the average value of its gross assets is attributable to assets that produce “passive income” or are held for the production of passive income. Passive income for this purpose generally includes dividends, interest, royalties, rents and gains from the sale of stock (including gains from the sale of stock of certain subsidiaries), partnership interests, securities or commodities.
Based on certain estimates of our gross income and gross assets and the nature of our business, the Company believes that it was not classified as a PFIC in 2010. The Company’s status in future years will depend on its assets and activities in those years. If the Company were a PFIC for 2010 or for any prior or future taxable year during which a U.S. Holder held shares or ADRs, such U.S. Holder of shares or ADRs generally would be subject to additional filing requirements, imputed interest charges and other disadvantageous tax treatment (including the denial of taxation at the lower rates applicable to long-term capital gains with respect to any gain from the sale or exchange of shares or ADRs).
104
Information Reporting and Backup Withholding
Payments of dividends on the shares or ADRs and the proceeds of sale or other disposition of the shares or ADRs within the United States by holders may be subject to U.S. information reporting and backup withholding. A U.S. Holder generally will be subject to U.S. information reporting and backup withholding (currently at a rate of 28%) unless the recipient of such payment supplies an accurate taxpayer identification number, as well as certain other information, or otherwise establishes an exemption, in the manner prescribed by United States law and applicable regulations. U.S. information reporting and backup withholding of U.S. federal income tax at the same rate may also apply to Non-U.S. Holders that are not "exempt recipients" and that fail to provide certain information as may be required by United States law and applicable regulations. Any amount withheld under U.S. backup withholding is not an additional tax and is generally allowable as a credit against the U.S. Holder's federal income tax liability upon furnishing the required information to the IRS.
Legislation enacted in 2010 requires certain U.S. Holders to report information with respect to their investment in shares or, it is assumed, ADRs not held through a custodial account with a U.S. financial institution to the Internal Revenue Service. Investors who fail to report required information could become subject to substantial penalties and/or an extended statute of limitations.
HOLDERS ARE URGED TO CONSULT THEIR OWN TAX ADVISORS REGARDING THE APPLICATION OF U.S. INFORMATION REPORTING AND BACKUP WITHHOLDING RULES TO THEIR PARTICULAR CIRCUMSTANCES.
|
10.F.
|
Dividends and Paying Agents
|
Not applicable
|
10.G.
|
Statement by Experts
|
Not applicable
|
10.H.
|
Documents on Display
|
Documents referred to in this form 20-F are available to the public at:
http://www.sec.gov/edgar/searchedgar/companysearch.html
, CIK: 909037.
|
10.I.
|
Subsidiary Information
|
See Item 4.C. Organizational Structure.
105
|
ITEM 11.
|
QUANTITATIVE AND QUALITATIVE DISCLOSURES ABOUT MARKET RISK
|
As explained elsewhere in this Annual Report, we transact our businesses in more than 100 countries, thereby rendering our market risk dependent upon the fluctuations of foreign currencies and local and international interest rates. These fluctuations may generate losses in the value of financial instruments taken in the normal course of business.
We, from time to time and depending upon then current market conditions, review and re-establish our financial policies to protect our operations. Management is authorized by our Board of Directors to engage in certain derivative contracts such as forwards and swaps to specifically hedge the fluctuations in interest rates and in currencies other than the U.S. dollar.
Derivative instruments used by us are generally transaction-specific so that a specific debt instrument or contract determines the amount, maturity and other terms of the hedge. We do not use derivative instruments for speculative purposes.
Interest Rate Risk
. As of December 31, 2010, we had approximately 20% of our financial debt priced at Libor, and therefore significant increases in the rate could impact our financial condition. We also maintain the majority of our short-term financial debt priced at Libor plus a spread for which we do not have any kind of derivative contract.
|
Expected Maturity Date
|
||||||||||||||||||||||||||||
|
On Balance Sheet Financial Instruments(3)
|
2015 and
|
|||||||||||||||||||||||||||
|
(in thousands of U.S. dollars)
|
2011
|
2012
|
2013
|
2014
|
thereafter
|
Total
|
Fair Value
|
|||||||||||||||||||||
|
Fixed Rate (US$)
|
53,100 | 52,856 | 52,492 | 229,977 | 860,774 | 1,249,199 | 995,409 | |||||||||||||||||||||
|
Bond — US$250 million - Int.: 5.50%
|
13,750 | 13,750 | 13,750 | 13,750 | 325,625 | 380,625 | 289,406 | |||||||||||||||||||||
|
Bond — US$200 million - Int.: 6.13%
|
12,250 | 12,250 | 12,250 | 12,250 | 218,375 | 267,375 | 238,644 | |||||||||||||||||||||
|
Bond — UF 2.40 million (1) - Int.: 5.84%
|
9,917 | 9,625 | 9,309 | 9,005 | 84,381 | 122,238 | 94,250 | |||||||||||||||||||||
|
Bond — CH$ 21,000 million (1) - Int.: 5.27%
|
1,799 | 1,804 | 1,799 | 34,580 | - | 39,983 | 37,782 | |||||||||||||||||||||
|
Bond — UF 1.50 million (1) - Int.: 4.80%
|
2,727 | 2,735 | 2,727 | 57,400 | - | 65,590 | 61,651 | |||||||||||||||||||||
|
Bond — CH$ 52,000 million (1) - Int.: 4.48%
|
4,199 | 4,210 | 4,199 | 94,533 | - | 107,141 | 100,636 | |||||||||||||||||||||
|
Bond — UF 4.00 million (1) (2) - Int.: 5.70%
|
8,458 | 8,481 | 8,458 | 8,458 | 239,393 | 266,247 | 173,041 | |||||||||||||||||||||
|
Variable Rate (US$)
|
114,162 | 3,709 | 3,699 | 143,699 | - | 265,268 | 253,547 | |||||||||||||||||||||
|
Loan — US$ 140 million - Int.: L + 2.10%
|
3,060 | 3,709 | 3,699 | 143,699 | - | 154,166 | 142,972 | |||||||||||||||||||||
|
Loan — US$ 80 million - Int.: L + 0.30%
|
80,821 | - | - | - | - | 80,821 | 80,339 | |||||||||||||||||||||
|
Loan — US$ 20 million - Int.: L + 3.30%
|
20,187 | - | - | - | - | 20,187 | 20,157 | |||||||||||||||||||||
|
Loan — US$ 10 million - Int.: L + 3.30%
|
10,094 | - | - | - | - | 10,094 | 10,079 | |||||||||||||||||||||
|
Total
|
167,262 | 56,564 | 56,191 | 373,675 | 860,774 | 1,514,467 | 1,248,957 | |||||||||||||||||||||
(1) UF and CH$ bonds are fully hedged, under the Chilean GAAP, to US$ with a Cross Currency Swap (CCS). The cash flows and interest rates presented above are the CCS US$.
(2) The CCS of the UF4 million Bond will cover until 2013. The expected maturity for the following years were projected in U.S. dollars using the same rates that we have today in this CCS.
(3) Includes interest and principal payments.
106
Exchange Rate Risk.
Although the U.S. dollar is the primary currency in which we transact our businesses, our operations throughout the world expose us to exchange rate variations for non-U.S. dollar currencies. Therefore, fluctuations in the exchange rate of such local currencies may affect our financial condition and results of operations. To lessen these effects, we maintain derivative contracts to protect the net difference between our principal assets and liabilities for currencies other than the U.S. dollar. These contracts are renewed periodically depending on the amount covered in each currency. Aside from this, we do not hedge potential future income and expenses in currencies other than the U.S. dollar with the exception of the euro and Chilean peso. We estimate annual sales in Euros and expenses in Chilean pesos, and depending on the circumstances we secure the exchange difference with derivative contracts.
The following is a summary of the aggregate net monetary assets and liabilities that are denominated in non-U.S. dollar currencies as of December 31, 2010 and 2009. Figuers do not include our financial hedging positions for year-end:
|
2010
|
2009
|
|||||||
|
Th US$
|
Th US$
|
|||||||
|
Chilean pesos
|
(104,781 | ) | (271,513 | ) | ||||
|
Brazilian real
|
(1,638 | ) | (1,303 | ) | ||||
|
Euro
|
94,900 | 13,821 | ||||||
|
Japanese yen
|
1,642 | 832 | ||||||
|
Mexican pesos
|
(1,465 | ) | 667 | |||||
|
South African rand
|
6,763 | 28,868 | ||||||
|
Dirhams
|
24,168 | 22,575 | ||||||
|
Other currencies
|
16,234 | 16,968 | ||||||
|
Total, net
|
35,823 | (189,085 | ) | |||||
We monitor and attempt to maintain our non-dollar assets and liabilities position in balance and make use of foreign exchange contracts and other hedging instruments to try to minimize our exposure to the risks of changes in foreign exchange rates. As of December 31, 2010, for this purpose we had open options to buy U.S. dollars and sell Euros for approximately US$79.6 million (EUR59.5 million) and sell South African rand for approximately US$14.8 million (ZAR98 million), as well as forward exchange contracts to sell U.S. dollars and buy Chilean pesos for US$53 million (CH$24,804 million). As of this date, all of our UF and Chilean pesos bonds were hedged with cross-currency swaps to the U.S. dollar for approximately US$ 410.62 million.
Also, we had open forward exchange contracts to buy U.S. dollars and sell Chilean pesos to hedge our time deposits in Chilean Pesos for approximately US$386.77 million (CH$181,012 million) and forward contracts to buy U.S. dollars and sell Chilean pesos for approximately US$63million (CH$29,485million) hedging our fertilizer trading business in Chile.
Additionally, we had open forward exchange contracts and options to buy U.S. dollars and sell foreign currency to hedge part of our future Euro cash flows for approximately US$28 million (EUR20.9 million).
107
|
ITEM 12.
|
DESCRIPTION OF SECURITIES OTHER THAN EQUITY SECURITIES
|
Not applicable.
Not applicable.
Not applicable.
Depositary Fees and Charges
The Company’s American Depositary Receipts (“ADR”) program is administered by The Bank of New York Mellon (101 Barclay St., 22 Fl.W.; New York, NY 10286), as Depositary. Under the terms of the Deposit Agreement, an ADR holder may have to pay the following service fees to the Depositary:
|
Service Fees
|
Fees
|
|
|
Execution and delivery of Receipts and the surrender of Receipts
|
$0.05 per share
|
Depositary Payments Fiscal Year 2010
The Depositary has agreed to reimburse certain expenses related to the Company’s ADR program and incurred by the Company in connection with the program. In 2010, the Depositary reimbursed expenses related to investor relations for a total amount of US$190,574.73.
108
|
ITEM 13.
|
DEFAULTS, DIVIDEND ARREARAGES AND DELINQUENCIES
|
Not applicable
ITEM 14.
MATERIAL MODIFICATIONS TO THE RIGHTS OF SECURITY HOLDERS AND USE OF PROCEEDS
Not applicable.
|
ITEM 15.
|
CONTROLS AND PROCEDURES
|
|
(a)
|
Disclosure Control and Procedures
|
Under the supervision and with the participation of the Company's management, including the Company's Chief Executive Officer and Chief Financial Officer, we evaluated the effectiveness of the design and operation of our disclosure controls and procedures, pursuant to Exchange Act Rules 13(a)-15(b), as of the end of the period covered by this Annual Report. Based upon that evaluation, the Chief Executive Officer and Chief Financial Officer have concluded that the Company's disclosure controls and procedures are effective in providing reasonable assurance that material information is made known to management and that financial and non-financial information is properly recorded, processed, summarized and reported.
The procedures associated to our internal controls are designed to provide reasonable assurance that our transactions are properly authorized, assets are safeguarded against unauthorized or improper use, and transactions are properly recorded and reported. However, through the same design and evaluation period of the disclosure controls and procedures, the Company's management, including the Company's Chief Executive Officer and Chief Financial Officer, recognized that there are inherent limitations to the effectiveness of any internal control system regardless of how well designed and operated. In such a way they can provide only reasonable assurance of achieving the desired control objectives and no evaluation can provide absolute assurance that all control issues or instances of fraud, if any, within the Company have been detected.
There were no significant changes in our internal controls over financial reporting that occurred during the period covered by this Annual Report that have materially affected, or are likely to materially affect our internal control over financial reporting.
|
(b)
|
Management’s Annual Report on Internal Control Over Financial Reporting
|
SQM Management is responsible for establishing and maintaining adequate internal control over financial reporting. The Company’s internal control over financial reporting is designed to provide reasonable assurance regarding the reliability of financial reporting and the preparation of the financial statements for external purposes in accordance with generally accepted accounting principles.
Because of its inherent limitations, internal control over financial reporting may not necessarily prevent or detect some misstatements. It can only provide reasonable assurance regarding financial statement preparation and presentation. Also, projections of any evaluation of effectiveness for future periods are subject to the risk that controls may become inadequate because of changes in conditions or because the degree of compliance with the polices or procedures may deteriorate over time.
Management assessed the effectiveness of its internal control over financial reporting for the year ended December 31, 2010. The assessment was based on criteria established in the framework “Internal Controls — Integrated Framework” issued by the Committee of Sponsoring Organizations of the Treadway Commission (COSO). Based on the assessment, SQM management has concluded that as of December 31, 2010, the Company’s internal control over financial reporting was effective.
109
|
(c)
|
Attestation Report of the Registered Public Accounting Firm
|
Ernst & Young Ltda., the independent registered public accounting firm that has audited our Consolidated Financial Statements, has also issued an attestation report on the Company’s internal control over financial reporting as of December 31, 2010. This attestation report appears on pages F-2 and F-3 under Item 18 Financial Statements.
|
(d)
|
Changes in internal control
|
There were no changes in the Company’s internal control over financial reporting that occurred during 2010 that have materially affected, or are reasonably likely to materially affect, the Company’s internal control over financial reporting.
|
ITEM 16.
|
[Reserved]
|
|
ITEM 16A.
|
AUDIT COMMITTEE FINANCIAL EXPERT
|
On June 17, 2008, the Board of Directors determined that the Company does not have an audit committee financial expert within the meaning of the regulations adopted under Sarbanes-Oxley Act of 2002.
Pursuant to Chilean regulations, the Company has a Directors' Committee whose main duties are similar to those of an audit committee. Each of the members of the Directors' Committee is a member of the audit committee. See 6.C. Board Practices.
Our Board believes that the members of the Directors' Committee have the necessary expertise and experience to perform the functions of the Directors' Committee pursuant to Chilean regulations.
|
ITEM 16B.
|
CODE OF ETHICS
|
We have adopted a Code of Business Conduct that applies to the Chief Executive Officer, the Chief Financial Officer and the Internal Auditor, as well as, to all our officers and employees. Our Code adheres to the definition set forth in Item 16B of Form 20-F under the Exchange Act.
No waivers have been granted therefrom to the officers mentioned above.
The full text of the code is available on our website at
http://www.sqm.com
in the Investor Relations section under “Corporate Governance Framework”.
Amendments to, or waivers from one or more provisions of the code will be disclosed on our website.
110
|
ITEM 16C.
|
PRINCIPAL ACCOUNTANT FEES AND SERVICES
|
The table sets forth the amount of fees billed for each of the last two fiscal years by our independent auditors, Ernst & Young, in relation to audit services, audit-related services, tax and other services provided to us (in thousands of U.S. dollars).
|
Year ended December 31,
|
||||||||
|
2010
|
2009
|
|||||||
|
Audit fees
|
1,007.8 | 954.9 | ||||||
|
Audit-related fees
|
- | - | ||||||
|
Tax fees
|
66.3 | 94.8 | ||||||
|
Other fees
|
28.7 | 34.8 | ||||||
|
Total fees
|
1,102.8 | 1,084.5 | ||||||
Audit fees in the above table are the aggregate fees billed by Ernst & Young in connection with the audit of our annual Consolidated Financial Statements, as well as the review of other statutory filings.
Audit-related fees in the above table are fees billed by Ernst & Young for assurance and related services that are reasonably related to the performance of the audit or review of our financial statements and are not reported under "Audit Fees."
Tax fees in the above table are fees billed by Ernst & Young for tax advice and tax planning services.
Directors' Committee Pre-Approval Policies and Procedures
Chilean law states that public companies are subject to "pre-approval" requirements under which all audit and non-audit services provided by the independent auditor must be pre-approved by the Directors’ Committee. Our Directors’ Committee approves all audits, audit-related, tax and other services provided by Ernst & Young.
Any services provided by Ernst & Young that are not specifically included within the scope of the audit must be pre-approved by the Directors’ Committee prior to any engagement.
|
ITEM 16D.
|
EXEMPTIONS FROM THE LISTING STANDARDS FOR AUDIT COMMITTEE
|
Not applicable
|
ITEM 16E.
|
PURCHASES OF EQUITY SECURITIES BY THE ISSUER AND AFFILIATED PURCHASERS
|
Not applicable
111
|
ITEM 16F.
|
CHANGE IN REGISTRANT’S CERTIFYING ACCOUNTANT
|
On April 18, 2011, our Director’s Committee recommended to the Board of Directors that the Board propose to shareholders a change in the our independent registered public accounting firm at the General Shareholders’ Meeting to be held on April 28, 2011. On such date, our shareholders approved the Board of Directors’ proposal to nominate PricewaterhouseCoopers Consultores, Auditores y Compañía Limitada (“PwC”) as our new independent registered public accounting firm.. Ernst & Young Servicios Profesionales de Auditoría y Asesorías Limitada (“E&Y”) served as our independent registered public accounting firm for the 2009 and 2010 fiscal years, in each case pursuant to the terms of an annual engagement letter. E&Y’s engagement as our independent registered public accounting firm ended upon the filing of this Form 20-F which includes their audit reports.
The audit reports of E&Y on our consolidated financial statements as of and for the years ended December 31, 2009 and 2010 did not contain any adverse opinion or disclaimer of opinion, nor were they qualified or modified as to uncertainty, audit scope or accounting principles.
The audit reports of E&Y on the effectiveness of our internal control over financial reporting as of December 31, 2009 and 2010 did not contain any adverse opinion or disclaimer of opinion and were not qualified or modified as to uncertainty, audit scope or otherwise.
During our two most recent fiscal years ended December 31, 2009 and 2010, and the subsequent interim periods to the date of this report, there were no disagreements with E&Y on any matter of accounting principles or practices, financial statement disclosure, or auditing scope or procedure, which disagreements, if not resolved to E&Y’s satisfaction, would have caused E&Y to make reference to the subject matter of such disagreements in connection with its reports on our consolidated financial statements for such periods.
During our two most recent fiscal years ended December 31, 2009 and 2010 and the subsequent periods to the date of this report, there were no reportable events (as defined in Item 16F(a)(1)(v) of Form 20-F).
We have provided E&Y with a copy of this Form 20-F prior to its filing with the Securities and Exchange Commission (“SEC”). We have requested E&Y to furnish us with a letter addressed to the SEC stating whether or not it agrees with the above statements, as required by Item 16F(a)(3) of Form 20-F. This letter is filed as Exhibit 15.1.
Our Board of Directors, no later than June 30, will engage PwC as the Company’s new independent registered public accounting firm to audit our consolidated financial statements and internal control over financial reporting for the fiscal year ending December 31, 2011.
During our two most recent fiscal years and any subsequent interim periods prior to the our engagement of PwC, neither the Company nor anyone acting on its behalf has consulted PwC on any of the matters or events set forth in Item 16F(a)(2)(i) and Item 16F(a)(2)(ii) of Form 20-F.
|
ITEM 16G.
|
CORPORATE GOVERNANCE
|
For a summary of the significant differences between our corporate governance practices and the NYSE corporate governance standards, please see "Item 6. Directors, Senior Management and Employees-C. Board Practices".
112
|
ITEM 17.
|
FINANCIAL STATEMENTS
|
Not applicable
|
ITEM 18.
|
FINANCIAL STATEMENTS
|
See Item 19(a) for a list of all financial statements filed as part of this Form 20-F annual report.
|
ITEM 19.
|
EXHIBITS
|
(a) Index to Financial Statements
|
Report of Independent Registered Public Accounting Firm
|
F-1
|
|
Report of Independent Registered Public Accounting Firm on the internal control over financial reporting as of December 31, 2010
|
F-2
|
|
Consolidated Financial Statements:
|
|
|
Audited Consolidated Balance Sheets as of December 31, 2010 and 2009
|
F-4
|
|
Audited Consolidated Statements of Income for each of the years in the period ended December 31, 2010 and 2009
|
F-6
|
|
Audited Consolidated Statements of Cash Flows for each of the years in the period ended December 31, 2010 and 2009
|
F-8
|
|
Notes to the Audited Consolidated Financial Statements
|
F-12
|
Supplementary Schedules*
*All other schedules have been omitted because they are not applicable or the required information is shown in the consolidated financial statements or notes thereto.
(b) Exhibits
|
Exhibit
No.
|
Exhibit
|
|
|
1.1
|
By-laws (Estatutos) of the Company**
|
|
|
8.1
|
Significant subsidiaries of the Company
|
|
|
12.1
|
Section 302 Chief Executive Officer Certification
|
|
|
12.2
|
Section 302 Chief Financial Officer Certification
|
|
|
13.1
|
Section 906 Chief Executive Officer Certification
|
|
|
13.2
|
Section 906 Chief Financial Officer Certification
|
|
|
15.1
|
Change in Certifying Accountant
|
**Incorporated by reference to the Company’s Annual Report on Form 20-F for the year ended December 31, 2009 filed with the Securities and Exchange Commission on June 30, 2010.
113
The registrant hereby certifies that it meets all of the requirements for filing on Form 20-F and that it has duly
caused and authorized the undersigned to sign this annual report on its behalf.
SOCIEDAD QUIMICA Y MINERA DE CHILE S.A.
(CHEMICAL AND MINING COMPANY OF CHILE INC.)
/s/ Ricardo Ramos
Ricardo Ramos R.
Chief Financial Officer and
Business Development Senior Vice President
Date: June 30, 2011
114
Consolidated Financial Statements
SOCIEDAD QUIMICA Y MINERA DE CHILE S.A. AND SUBSIDIARIES
As of December 31, 2010 and 2009
and for each of the two years in the period ended December 31, 2010
Contents
|
Report of Independent Registered Public Accounting Firm
|
F-1
|
|
Report of Independent Registered Public Accounting Firm on the internal control over financial reporting as of December 31, 2010
|
F-2
|
|
Consolidated Financial Statements
|
|
|
Audited Consolidated Balance Sheets as of December 31, 20010 and 2009
|
F-4
|
|
Audited Consolidated Statements of Income for each of the two years in the period ended December 31, 2010
|
F-6
|
|
Audited Consolidated Statements of Cash Flows for each of the two years in the period ended December 31, 2010
|
F-8
|
|
Notes to the Audited Consolidated Financial Statements
|
F-12
|
|
Ch$
|
-
|
Chilean pesos
|
|
ThCh$
|
-
|
Thousands of Chilean pesos
|
|
US$
|
-
|
United States dollars
|
|
ThUS$
|
-
|
Thousands of United States dollars
|
|
ThEuro
|
-
|
Thousands of Euros
|
|
UF
|
-
|
The UF is an inflation-indexed, Chilean peso-denominated monetary unit. The UF rate is set daily in advance, based on the change in the Consumer Price Index of the previous month.
|
115
Report of Independent Registered Public Accounting Firm
To the Shareholders and the Board of Directors of
Sociedad Química y Minera de Chile S.A.:
We have audited the accompanying consolidated financial statements of Sociedad Química y Minera de Chile S.A. and subsidiaries (“the Company”) which comprise the consolidated statements of financial position as of December 31, 2010 and 2009, the opening consolidated statement of financial position as of January 1, 2009, and the related consolidated statements of comprehensive income, changes in equity and cash flows for the years ended December 31, 2010 and 2009. The preparation of these consolidated financial statements (which include their related notes) are the responsibility of the Company’s management. Our responsibility is to express an opinion on these consolidated financial statements based on our audits.
We conducted our audits in accordance with the standards of the Public Company Accounting Oversight Board (United States of America). Those standards require that we plan and perform the audit to obtain reasonable assurance about whether the financial statements are free of material misstatement. An audit includes examining, on a test basis, evidence supporting the amounts and disclosures in the financial statements. An audit also includes assessing the accounting principles used and significant estimates made by management, as well as evaluating the overall financial statement presentation. We believe that our audits provide a reasonable basis for our opinion.
In our opinion, the consolidated financial statements referred to above present fairly, in all material respects, the consolidated financial position of Sociedad Química y Minera de Chile S.A. and subsidiaries as of December 31, 2010 and 2009 and as of January 1, 2009, and the consolidated results of their operations and their cash flows for the years ended December 31, 2010 and 2009, in conformity with International Financial Reporting Standards (IFRS), as issued by the International Accounting Standards Board (“IASB”)
We have also audited, in accordance with the standards of the Public Company Accounting Oversight Board (United States of America), the Company’s internal control over financial reporting as of December 31, 2010, based on the criteria established in Internal Control-Integrated Framework issued by the Committee of Sponsoring Organizations of the Treadway Commission (“the COSO criteria”) and our report dated March 01, 2011, except for internal control over financial reporting related to Note 32 of the consolidated financial statements as to which the date is June 28, 2011, expressed an unqualified opinion thereon.
|
ERNST & YOUNG LIMITADA
|
|
|
|
|
|
Santiago, Chile, March 01, 2011
|
|
|
(Except for Note 32 which date is June 28, 2011)
|
F-1
Report of Independent Registered Public Accounting Firm
To the Shareholders and the Board of Directors of
Sociedad Química y Minera de Chile S.A.:
We have audited the internal control over financial reporting of Sociedad Química y Minera de Chile S.A. and subsidiaries (“the Company”) as of December 31, 2010, based on criteria established in Internal Control—Integrated Framework issued by the Committee of Sponsoring Organizations of the Treadway Commission (“the COSO criteria”). The Company’s management is responsible for maintaining effective internal control over financial reporting, and for its assessment of the effectiveness of internal control over financial reporting included in the accompanying Management Annual Report on Internal Control over Financial Reporting. Our responsability is to express an opinion on the company’s internal control over financial reporting based on our audit.
We conducted our audit in accordance with the standards of the Public Company Accounting Oversight Board (United States of America). Those standards require that we plan and perform the audit to obtain reasonable assurance about whether effective internal control over financial reporting was maintained in all material respects. Our audit included obtaining an understanding of internal control over financial reporting, assessing the risk that a material weakness exists, testing and evaluating the design and operating effectiveness of internal control based on the assessed risk, and performing such other procedures as we considered necessary in the circumstances. We believe that our audit provides a reasonable basis for our opinion.
A company’s internal control over financial reporting is a process designed to provide reasonable assurance regarding the reliability of financial reporting and the preparation of financial statements for external purposes in accordance with generally accepted accounting principles. A company’s internal control over financial reporting includes those policies and procedures that (1) pertain to the maintenance of records that, in reasonable detail, accurately and fairly reflect the transactions and dispositions of the assets of the company; (2) provide reasonable assurance that transactions are recorded as necessary to permit preparation of financial statements in accordance with generally accepted accounting principles, and that receipts and expenditures of the company are being made only in accordance with authorizations of management and directors of the company; and (3) provide reasonable assurance regarding prevention or timely detection of unauthorized acquisition, use or disposition of the company’s assets that could have a material effect on the financial statements.
Because of its inherent limitations, internal control over financial reporting may not prevent or detect misstatements. Also, projections of any evaluation of effectiveness to future periods are subject to the risk that controls may become inadequate because of changes in conditions, or that the degree of compliance with the policies or procedures may deteriorate.
F-2
In our opinion, Sociedad Química y Minera de Chile S.A. maintained, in all material respects, effective internal control over financial reporting as of December 31,2010, based on the COSO criteria.
We have also audited, in accordance with the standards of the Public Company Accounting Oversight Board (United States of America), the consolidated financial statements of Sociedad Química y Minera de Chile S.A. and subsidiaries as of December 31, 2010 and 2009 and as of January 1, 2009, and the consolidated results of their operations and their cash flows for the years ended December 31, 2010 and 2009, and our report dated March 01, 2011, except as to Note 32 to which the date is June 28, 2011, expressed an unqualified opinion thereon.
|
ERNST & YOUNG LIMITADA
|
|
|
|
|
|
Santiago, Chile, March 01, 2011
|
(Except for internal control over financial reporting related to Note 32 of the consolidated financial statement as to which the date is June 28, 2011.)
F-3
Sociedad Química y Minera de Chile S.A. and Subsidiaries
(Translation of consolidated financial statements originally issued in Spanish – see Note 2.2)
|
|
|
ASSETS
|
Note
N°
|
12.31.2010
ThUS$
|
12.31.2009
ThUS$
|
01.01.2009
ThUS$
|
||||||||||||
|
Current assets
|
||||||||||||||||
|
Cash and cash equivalents
|
6.1 | 524,652 | 375,639 | 283,576 | ||||||||||||
|
Other current financial assets
|
9.1 | 76,178 | 180,569 | 41,943 | ||||||||||||
|
Other non-financial current assets
|
26 | 44,442 | 34,375 | 41,971 | ||||||||||||
|
Trade and other accounts receivable, current
|
9.2 | 375,945 | 325,823 | 334,791 | ||||||||||||
|
Trade and other accounts receivable due from related parties, current
|
8.6 | 36,172 | 68,656 | 51,027 | ||||||||||||
|
Inventory
|
7.0 | 605,101 | 630,763 | 540,877 | ||||||||||||
|
Current tax assets
|
29.1 | 32,773 | 41,825 | 1,695 | ||||||||||||
|
Total current assets
|
1,695,263 | 1,657,650 | 1,295,880 | |||||||||||||
|
Non-current assets
|
||||||||||||||||
|
Other non-current financial assets
|
9.1 | 92,674 | 49,836 | 101 | ||||||||||||
|
Other non-financial assets, non-current
|
26 | 24,157 | 30,880 | 26,444 | ||||||||||||
|
Non-current rights receivable
|
9.2 | 1,102 | 4,208 | 766 | ||||||||||||
|
Trade and other accounts receivable due from related parties, non-current
|
8.7 | - | - | 2,000 | ||||||||||||
|
Investments accounted for using the equity method
|
11.1 | 62,271 | 55,185 | 36,934 | ||||||||||||
|
Intangible assets other than goodwill
|
13.1 | 3,270 | 2,836 | 3,525 | ||||||||||||
|
Goodwill
|
13.1 | 38,388 | 38,388 | 38,388 | ||||||||||||
|
Property, plant and equipment
|
14.1 | 1,453,973 | 1,300,546 | 1,076,531 | ||||||||||||
|
Investment property
|
14.4 | 1,373 | 1,405 | 1,436 | ||||||||||||
|
Deferred tax assets
|
29.4 | 365 | 870 | 1,969 | ||||||||||||
|
Total non-current assets
|
1,677,573 | 1,484,154 | 1,188,094 | |||||||||||||
|
Total assets
|
3,372,836 | 3,141,804 | 2,483,974 | |||||||||||||
The accompanying notes form an integral part of these consolidated financial statements.
F-4
Sociedad Química y Minera de Chile S.A. and Subsidiaries
(Translation of consolidated financial statements originally issued in Spanish – see Note 2.2)
|
CONSOLIDATED CLASSIFIED STATEMENTS OF FINANCIAL POSITION
(
continued)
|
|
LIABILITIES AND EQUITY
|
Note
N°
|
12.31.2010
ThUS$
|
12.31.2009
ThUS$
|
01.01.2009
ThUS$
|
||||||||||||
|
Liabilities
|
||||||||||||||||
|
Current Liabilities
|
||||||||||||||||
|
Other current financial liabilities
|
9.4 | 187,555 | 268,855 | 150,322 | ||||||||||||
|
Trade and other accounts payable
|
9.5 | 152,147 | 185,975 | 110,802 | ||||||||||||
|
Trade accounts payable due to related parties. Current
|
8.8 | 3,538 | 3,892 | 178 | ||||||||||||
|
Other current provisions
|
19.1 | 15,014 | 16,442 | 9,551 | ||||||||||||
|
Current tax liabilities
|
29.2 | 7,113 | 1,298 | 89,142 | ||||||||||||
|
Current accrual for employee benefits
|
16.1 | 44,011 | 16,375 | 22,112 | ||||||||||||
|
Other non-financial liabilities. Current
|
19.3 | 67,459 | 52,205 | 115,682 | ||||||||||||
|
Total current liabilities
|
476,837 | 545,042 | 497,789 | |||||||||||||
|
Non-current liabilities
|
||||||||||||||||
|
Other non-current financial liabilities
|
9.4 | 1,090,188 | 1,024,350 | 520,140 | ||||||||||||
|
Other non-current accounts payable
|
9.5 | - | 187 | 398 | ||||||||||||
|
Other long-term accrued expenses
|
19.1 | 5,500 | 3,500 | 3,181 | ||||||||||||
|
Deferred tax liabilities
|
29.4 | 100,781 | 53,802 | 27,188 | ||||||||||||
|
Non-current accruals for employee benefits
|
16.1 | 28,710 | 50,473 | 35,059 | ||||||||||||
|
Total non-current liabilities
|
1,225,179 | 1,132,312 | 585,966 | |||||||||||||
|
Total liabilities
|
1,702,016 | 1,677,354 | 1,083,755 | |||||||||||||
|
Equity
|
18 | |||||||||||||||
|
Issued capital
|
477,386 | 477,386 | 477,386 | |||||||||||||
|
Retained earnings
|
1,155,131 | 951,173 | 888,369 | |||||||||||||
|
Other reserves
|
(9,713 | ) | (9,806 | ) | (12,077 | ) | ||||||||||
|
Equity attributable to owners of the parent
|
1,622,804 | 1,418,753 | 1,353,678 | |||||||||||||
|
Non-controlling interest
|
48,016 | 45,697 | 46,541 | |||||||||||||
|
Total equity
|
1,670,820 | 1,464,450 | 1,400,219 | |||||||||||||
|
Total liabilities and equity
|
3,372,836 | 3,141,804 | 2,483,974 | |||||||||||||
The accompanying notes form an integral part of these consolidated financial statements.
F-5
Sociedad Química y Minera de Chile S.A. and Subsidiaries
(Translation of consolidated financial statements originally issued in Spanish – see Note 2.2)
|
|
|
Note
N°
|
12.31.2010
ThUS$
|
12.31.2009
ThUS$
|
||||||||||
|
Sales
|
21 | 1,830,413 | 1,438,659 | |||||||||
|
Cost of sales
|
(1,204,410 | ) | (908,474 | ) | ||||||||
|
Gross profit
|
626,003 | 530,185 | ||||||||||
|
Other income by function
|
28 | 6,545 | 17,009 | |||||||||
|
Administrative expenses
|
(78,819 | ) | (75,470 | ) | ||||||||
|
Other expenses by function
|
28 | (36,212 | ) | (21,847 | ) | |||||||
|
Other gains (losses)
|
28 | (6,979 | ) | (13,705 | ) | |||||||
|
Interest income
|
12,930 | 13,525 | ||||||||||
|
Finance expenses
|
23 | (35,042 | ) | (30,979 | ) | |||||||
|
Equity in income of associates and joint ventures accounted
for using the equity method
|
10,681 | 4,462 | ||||||||||
|
Foreign currency transactions
|
24 | (5,807 | ) | (7,577 | ) | |||||||
|
Income before income tax
|
493,300 | 415,603 | ||||||||||
| Income tax expense | 29.4 | (106,029 | ) | (75,840 | ) | |||||||
|
Net income
|
387,271 | 339,763 | ||||||||||
|
Net income (loss) attributable to:
|
||||||||||||
|
Equity holders of the parent
|
382,122 | 338,297 | ||||||||||
|
Non-controlling interests
|
5,149 | 1,466 | ||||||||||
|
Net income for the year
|
387,271 | 339,763 | ||||||||||
|
Earnings per share
|
||||||||||||
| Common shares | ||||||||||||
|
Basic earnings per share (US$ per share)
|
22 | 1.4519 | 1.2853 | |||||||||
The accompanying notes form an integral part of these consolidated financial statements.
F-6
Sociedad Química y Minera de Chile S.A. and Subsidiaries
(Translation of consolidated financial statements originally issued in Spanish – see Note 2.2)
|
CONSOLIDATED STATEMENTS OF COMPREHENSIVE INCOME
|
| 12.31.2010 | 12.31.2009 | |||||||
|
Statement of comprehensive income
|
ThUS$
|
ThUS$
|
||||||
|
Net income for the year
|
387,271 | 339,763 | ||||||
|
Other comprehensive income components before foreign currency translation difference
|
||||||||
|
Gains (losses) from foreign currency translation differences, before tax
|
663 | 1,735 | ||||||
|
Other comprehensive income before tax and foreign currency translation differences
|
663 | 1,735 | ||||||
|
Cash flow hedges
|
||||||||
|
Gains (losses) from cash flow hedges, before tax
|
(1,474 | ) | (112 | ) | ||||
|
Other comprehensive income before tax and cash flow hedges
|
(1,474 | ) | (112 | ) | ||||
|
Defined benefit plan reserves SQM North America, before tax
|
1,020 | 1,130 | ||||||
|
Other comprehensive income components. net of tax
|
209 | 2,753 | ||||||
|
Income tax related to components of other comprehensive income
|
||||||||
|
Income tax related to other comprehensive income cash flow hedges
|
251 | 19 | ||||||
|
Addition of income tax related to other comprehensive income components
|
251 | 19 | ||||||
|
Other comprehensive income
|
460 | 2,772 | ||||||
|
Total comprehensive income
|
387,731 | 342,535 | ||||||
|
Comprehensive income attributable to
|
||||||||
|
Comprehensive income attributable to owners of the parent
|
382,215 | 340,568 | ||||||
|
Comprehensive income attributable to non-controlling interests
|
5,516 | 1,967 | ||||||
|
Total comprehensive income
|
387,731 | 342,535 | ||||||
The accompanying notes form an integral part of these consolidated financial statements.
F-7
Sociedad Química y Minera de Chile S.A. and Subsidiaries
(Translation of consolidated financial statements originally issued in Spanish – see Note 2.2)
|
|
|
Statement of cash flows
|
Note
N°
|
12.31.2010
ThUS$
|
12.31.2009
ThUS$
|
||||||
|
Cash flows provided by operating activities
|
|||||||||
|
Net income for the year
|
387,271 | 339,763 | |||||||
|
Adjustment due to reconciliation of profit to cash flows
|
|||||||||
|
Depreciation and amortization
|
143,940 | 137,062 | |||||||
|
Amortization of mining rights
|
6,022 | 4,334 | |||||||
|
Increase in Royalty Corfo accrual
|
5,182 | 3,752 | |||||||
|
Increase in marketing expense accrual
|
4,007 | 5,554 | |||||||
|
Increase in legal accrual
|
4,023 | 5,458 | |||||||
|
Increase in bonus accrual
|
41,153 | 23,057 | |||||||
|
Increase in vacation liabilities
|
9,034 | 8,389 | |||||||
|
Increase in accrued expenses
|
9,927 | 42,036 | |||||||
|
Unrealized effects of foreign currency transactions
|
(11,183 | ) | 12,500 | ||||||
|
Unrealized Derivative Instruments, net
|
16,990 | (4,923 | ) | ||||||
|
Non-distributed gains from associates
|
(10,681 | ) | (4,462 | ) | |||||
|
Income tax expense
|
106,396 | 75,840 | |||||||
|
Adjustments for entries other than cash
|
21,919 | (42,941 | ) | ||||||
|
Adjustments for which the effects on cash are cash flows from Investing or financing activities
|
(448 | ) | (229 | ) | |||||
|
Decrease (increase) in trade accounts receivable
|
(18,266 | ) | 9,586 | ||||||
|
Increases in other accounts receivable
|
(21,614 | ) | (33,947 | ) | |||||
|
Decrease (increase) in inventory
|
26,545 | (119,865 | ) | ||||||
|
Increase in trade accounts payable
|
(84,731 | ) | (16,786 | ) | |||||
|
Increases in other accounts payable
|
56,836 | 112,222 | |||||||
|
Reconciling adjustments
|
305,051 | 216,637 | |||||||
|
Interest received
|
1,774 | 838 | |||||||
|
Interest paid
|
(6,655 | ) | (11,434 | ) | |||||
|
Income tax paid
|
(68,919 | ) | (174,451 | ) | |||||
|
Net cash flows provided by operating activities
|
618,522 | 371,353 | |||||||
|
Cash flows used in investing activities
|
|||||||||
|
Payments to acquire interest in joint ventures
|
(3,500 | ) | (3,580 | ) | |||||
|
Proceeds from the disposal of property, plant and equipment
|
1,433 | 26,373 | |||||||
|
Acquisition of property, plant and equipment
|
(335,997 | ) | (376,238 | ) | |||||
|
Loans granted to third parties
|
- | (4,472 | ) | ||||||
|
Third parties payment of loans
|
1,275 | - | |||||||
|
Receipts from time deposits with maturities greater than 90 days
|
169,797 | 40,344 | |||||||
|
Disbursements from time deposits with maturities greater than 90 days
|
(69,817 | ) | (189,918 | ) | |||||
|
Net cash flows used in investing activities
|
(236,809 | ) | (507,491 | ) | |||||
The accompanying notes form an integral part of these consolidated financial statements.
F-8
Sociedad Química y Minera de Chile S.A. and Subsidiaries
(Translation of consolidated financial statements originally issued in Spanish – see Note 2.2)
|
CONSOLIDATED STATEMENTS OF CASH FLOWS, continued
|
|
Cash flows provided by (used in) financing activities
|
Note
N°
|
12.31.2010
ThUS$
|
12.31.2009
ThUS$
|
||||||
|
Amounts received from long-term loans
|
564,000 | 783,874 | |||||||
|
Payments of loans
|
(632,540 | ) | (225,735 | ) | |||||
|
Dividends paid
|
(175,539 | ) | (345,646 | ) | |||||
|
Other cash outflows
|
(10,156 | ) | (10,001 | ) | |||||
|
Net cash flows provided by (used in) financing activities
|
(254,235 | ) | 202,492 | ||||||
|
Net increase in cash and cash equivalents before the effect of changes in foreign exchange rates
|
127,478 | 66,354 | |||||||
|
Effects of variation in foreign exchange rate on cash and cash equivalents
|
21,535 | 25,709 | |||||||
|
Net increase in cash and cash equivalents
|
149,013 | 92,063 | |||||||
|
Cash and cash equivalents at beginning of year
|
375,639 | 283,576 | |||||||
|
Cash and cash equivalents at end of year
|
6
|
524,652 | 375,639 | ||||||
The accompanying notes form an integral part of these consolidated financial statements.
F-9
Sociedad Química y Minera de Chile S.A. and Subsidiaries
(Translation of consolidated financial statements originally issued in Spanish – see Note 2.2)
STATEMENTS OF CHANGES IN EQUITY
For the years ended at December 31, 2010 and 2009:
|
Issued
capital
ThUS$
|
Foreign
currency
translation
reserve
ThUS$
|
Cash flow
hedge
reserve
ThUS$
|
Defined
benefit
plan
reserves
ThUS$
|
Subtotal
Other
reserves
ThUS$
|
Retained
earnings
ThUS$
|
Equity attributable
to
owners of the
parent
ThUS$
|
Non-controlling
interests
ThUS$
|
Total equity
ThUS$
|
||||||||||||||||||||||||||||
|
Beginning balance, current period: January 1, 2010
|
477,386 | 1,234 | (7,984 | ) | (3,056 | ) | (9,806 | ) | 951,173 | 1,418,753 | 45,697 | 1,464,450 | ||||||||||||||||||||||||
|
Net income for the year
|
- | - | - | - | - | 382,122 | 382,122 | 5,149 | 387,271 | |||||||||||||||||||||||||||
|
Other comprehensive income (expenses)
|
- | 296 | (1,223 | ) | 1,020 | 93 | - | 93 | 367 | 460 | ||||||||||||||||||||||||||
|
Comprehensive income
|
- | 296 | (1,223 | ) | 1,020 | 93 | 382,122 | 382,215 | 5,516 | 387,731 | ||||||||||||||||||||||||||
|
Dividends declared
|
- | - | - | - | - | (178,164 | ) | (178,164 | ) | - | (178,164 | ) | ||||||||||||||||||||||||
|
Increase (decrease) from transfers and other changes
|
- | - | - | - | - | - | - | (3,197 | ) | (3,197 | ) | |||||||||||||||||||||||||
|
Changes in equity
|
- | 296 | (1,223 | ) | 1,020 | 93 | 203,958 | 204,051 | 2,319 | 206,370 | ||||||||||||||||||||||||||
|
Ending balance, current year: December 31, 2010
|
477,386 | 1,530 | (9,207 | ) | (2,036 | ) | (9,713 | ) | 1,155,131 | 1,622,804 | 48,016 | 1,670,820 | ||||||||||||||||||||||||
The accompanying notes form an integral part of these consolidated financial statements.
F-10
Sociedad Química y Minera de Chile S.A. and Subsidiaries
(Translation of consolidated financial statements originally issued in Spanish – see Note 2.2)
STATEMENTS OF CHANGES IN EQUITY, continued
|
Issued
capital
ThUS$
|
Foreign
currency
translation
reserve
ThUS$
|
Cash flow
hedge
reserve
ThUS$
|
Defined
benefit
plan
reserves
ThUS$
|
Subtotal
Other
reserves
ThUS$
|
Retained
earnings
ThUS$
|
Equity attributable
to
owners of the
parent
ThUS$
|
Non-controlling
interests
ThUS$
|
Total equity
ThUS$
|
||||||||||||||||||||||||||||
|
Beginning balance, current period: January 1, 2009
|
477,386 | - | (7,891 | ) | (4,186 | ) | (12,077 | ) | 888,369 | 1,353,678 | 46,541 | 1,400,219 | ||||||||||||||||||||||||
|
Net income for the year
|
- | - | - | - | - | 338,297 | 338,297 | 1,466 | 339,763 | |||||||||||||||||||||||||||
|
Other comprehensive income
|
- | 1,234 | (93 | ) | 1,130 | 2,271 | - | 2,271 | 501 | 2,772 | ||||||||||||||||||||||||||
|
Comprehensive income
|
- | 1,234 | (93 | ) | 1,130 | 2,271 | 338,297 | 340,568 | 1,967 | 342,535 | ||||||||||||||||||||||||||
|
Dividends
|
- | - | - | - | - | (275,493 | ) | (275,493 | ) | - | (275,493 | ) | ||||||||||||||||||||||||
|
Increase (decrease) from transfers and other changes
|
- | - | - | - | - | - | - | (2,811 | ) | (2,811 | ) | |||||||||||||||||||||||||
|
Changes in equity
|
- | 1,234 | (93 | ) | 1,130 | 2,271 | 62,804 | 65,075 | (844 | ) | 64,231 | |||||||||||||||||||||||||
|
Ending balance, prior year: December 31, 2009
|
477,386 | 1,234 | (7,984 | ) | (3,056 | ) | (9,806 | ) | 951,173 | 1,418,753 | 45,697 | 1,464,450 | ||||||||||||||||||||||||
The accompanying notes form an integral part of these consolidated financial statements.
F-11
Notes to the consolidated Financial Statements as of December 31, 2010
(Translation of consolidated financial statements originally issued in Spanish – see Note 2.2)
Historical Background
Sociedad Química y Minera de Chile S.A. and subsidiaries (collectively the “Company”) is a public corporation organized in accordance with the laws of the Republic of Chile, ID N° 93.007.000-9. The Company was constituted by public deed issued on June 17, 1968 by the Notary Public of Santiago Mr. Sergio Rodríguez Garcés. Its existence was approved by Decree No. 1,164 of the Ministry of Finance on June 22, 1968, and it was registered on June 29, 1968 in the Business Registry of Santiago, on page 4,537 Nº 1,992. The parent company is located at El Trovador 4285, 6
th
Floor, Las Condes, Santiago, Chile. Its phone No. is (56-2) 425-2000.
The Company is registered with the Securities Registry of the Chilean Superintendence of Securities and Insurance (SVS) under No. 0184 dated March 18. 1983 and is subject to inspection by the SVS.
The Company’s operating segments are divided into five main categories, as follows:
Specialty plant nutrients
: In this business line, the Company provides advice in practices for fertilization according to each type of crop, soil and climate. In this business category, potassium derivative products and especially potassium nitrate have played a leading role, given the contribution they make to developing crops, ensuring an improvement in post-crop life in addition to improving quality, flavor and fruit color. Potassium nitrate, which is sold in multiple formats and as a part of other specialty mixtures, is complemented by sodium nitrate, potassium sodium nitrate, and other mixtures.
Iodine
: The Company is an important producer of iodine worldwide. Iodine is a product that is widely used in the pharmaceutical industry, in technology and in nutrition. Additionally, Iodine is also used in x-ray contrast media and polarizing film for LCD displays.
Lithium:
The Company’s Lithium is mainly used in rechargeable batteries for cell phones, cameras and laptops. Through the preparation of lithium-based products, the Company provides significant raw materials to face great challenges such as the efficient use of energy and raw material. Lithium is not only used for rechargeable batteries and in new technologies for electric vehicles, but is also used in industrial applications to lower melting temperatures and to help save costs and energy.
Industrial Chemicals:
Industrial chemicals are products used as supplies for a number of production processes. The Company participates in this line of business, producing sodium nitrate, potassium nitrate, boric acid and potassium chloride. Industrial nitrates are also used as a means for the storage of thermal energy at solar energy plants, which are widely used in countries such as Spain and the United States in their search for decreasing CO2 emissions.
Potassium:
Potassium is a primary essential macro-nutrient, and even though it does not form part of a plant’s structure, it has a significant role in the development of its basic functions, validating the quality of a crop, increasing post-crop life, improving the crop flavor, its vitamin content and its physical appearance. Within this business line, the Company also produces potassium chlorate and potassium sulfate, both extracted from the salt layer located under the Atacama Salar (the Atacama Saltpeter Deposit).
F-12
Notes to the consolidated Financial Statements as of December 31, 2010
(Translation of consolidated financial statements originally issued in Spanish – see Note 2.2)
|
2.1
|
Periods covered
|
These consolidated financial statements cover the following periods:
|
-
|
Consolidated classified statements of financial position as of December 31, 2010 and 2009, and as of January 1, 2009.
|
|
-
|
Consolidated statements of income by function for the years ended December 31, 2010 and 2009.
|
|
-
|
Consolidated statements of comprehensive income for the years ended December 31, 2010 and 2009.
|
|
-
|
Consolidated statements of cash flows for the periods ended December 31, 2010 and 2009.
|
|
-
|
Consolidated statements of changes in equity for the years ended December 31, 2010 and 2009.
|
|
2.2
|
Basis of preparation
|
The Company’s annual consolidated financial statements have been prepared in accordance with International Financial Reporting Standards (hereinafter “IFRS”) and represent the integral adoption, explicit, and without reserves of the IFRS as issued by the International Accounting Standards Board (IASB).
These annual consolidated financial statements reflect fairly the Company’s, financial position, results of its operations, comprehensive income, changes in equity and cash flows for the years ended December 31, 2010 and 2009.
IFRS establish certain alternatives for their application. Those alternative applied by the Company are detailed in this Note.
The accounting policies used in the preparation of these consolidated financial statements comply with each IFRS in force at their presentation date.
For comparative purposes, the Company’s consolidated classified statement of financial position as of December 31, 2009 and the Company’s statement of income by function as of December 31, 2009 have been converted from Chilean Generally Accepted Accounting Principles to IFRS.
For the convenience of the reader, these consolidated financial statements and their accompanying notes have been translated from Spanish to English.
F-13
Notes to the consolidated Financial Statements as of December 31, 2010
(Translation of consolidated financial statements originally issued in Spanish – see Note 2.2)
|
2.2
|
Basis of preparation (continued)
|
|
a)
|
Accounting pronouncements
|
|
|
As of the date of these consolidated financial statements, the following accounting pronouncements had been issued by the IASB, but their application was not mandatory, and they were not applied by the Company.
|
|
New standards
|
Mandatory
application
beginning on
|
||
|
IFRS 9
|
Financial instruments
|
01.01.2013
|
|
|
IFRIC 9
|
Extinguishing of financial liabilities with equity instruments
|
01.01.2011
|
IFRS 9 “Financial instruments”
This Standard introduces new requirements to classify and measure financial assets, allowing for its early adoption. It requires that all financial assets be classified under the business model of the entity to manage financial assets and the characteristics of contractual cash flows of the financial assets. Financial assets under this standard are measured at amortized cost or fair value. Only the financial assets classified as measured at amortized cost should be tested for impairment. It is effective for annual periods beginning on or after January 1, 2013, and early application is permitted.
The Company has evaluated the impact that this standard might have and concluded that it will not significantly affect the Company’s consolidated financial statements.
IFRIC 19 “Extinguishing Financial Liabilities with Equity Instruments”
On November 26, 2009, IFRIC 19 “Extinguishing Financial Liabilities with Equity Instruments” was issued. This interpretation provides guidance to account for the extinguishing of a financial liability by issuing equity instruments. IFRIC concluded that issuing equity instruments to extinguish an obligation is “consideration paid”. This amount should be measured at the fair value of the equity instrument that is issued, unless fair value is not reliably determined, in which case the equity instruments issued are measured at the fair value of the liability extinguished. This IFRIC is effective for annual periods beginning after January 1, 2011, and early application is permitted.
The Company has evaluated the impact that this standard might have and concluded that it will not significantly affect the Company’s consolidated financial statements.
F-14
Notes to the consolidated Financial Statements as of December 31, 2010
(Translation of consolidated financial statements originally issued in Spanish – see Note 2.2)
Note 2 - Basis of presentation for consolidated financial statements and Summary of significant accounting policies (continued)
|
2.2
|
Basis of preparation (continued)
|
|
(a)
|
Accounting pronouncements (continued)
|
IFRIC 19 “Extinguishing Financial Liabilities with Equity Instruments” (continued)
|
Improvements and amendments
|
Mandatory
application
beginning on
|
|||
|
IFRS 1
|
First-time adoption
|
01.01.2011
|
||
|
IFRS 3
|
Business combinations
|
01.01.2011
|
||
|
IFRS 7
|
Financial instruments: Disclosures
|
01.01.2011
|
||
|
IAS 1
|
Presentation of Financial Statements
|
01.01.2011
|
||
|
IAS 12
|
Income taxes
|
01.01.2012
|
||
|
IAS 24
|
Related party Disclosures
|
01.01.2011
|
||
|
IAS 27
|
Consolidated and separate financial statements
|
01.01.2011
|
||
|
IAS 32
|
Financial Instruments Presentation
|
01.01.2011
|
||
|
IAS 34
|
Interim Financial Reporting
|
01.01.2011
|
||
|
IFRIC 14
|
Minimum Funding Requirements
|
01.01.2011
|
IFRS 1 “First-time adoption”
In May 2010, the IASB introduced amendments to IFRS 1. Such amendments address the changes in accounting policy during the adoption year and the use of cost attributed to operations subject to rate regulations. This standard is effective from January 1, 2011.
IFRS 3 “Business Combinations”
The IASB amendments to IFRS 3 issued in May 2010 clarify the non-controlling interest measurement principles and makes certain specifications about share-based payment incentives (now called “Transactions” instead of “Incentives”). It also provides for transition requirements for contingent payments in a business combination occurring before the effective date of the IFRS revision. This standard is effective from January 1, 2011.
IFRS 7 “Financial Instruments: Disclosures”
The amendments to IFRS 7 issued by the IASB in May 2010 include some clarifications to required financial statement disclosures, mostly with regard to the nature and the extent of risks arising from the financial statements as well as the interaction between quantitative and qualitative disclosures. This standard is effective from January 1, 2011.
IAS 1 “Presentation of Financial Statements”
Prior to the issuance of amendments to IAS 1, the standard required the entity to present a reconciliation of the changes in each item of equity. The IASB makes it clear in the amendments issued in May 2010 that entities may present the required reconciliations for each component in other comprehensive income either in the statement of changes in equity or in the notes to the financial statements. This standard is effective from January 1, 2011.
F-15
Notes to the consolidated Financial Statements as of December 31, 2010
(Translation of consolidated financial statements originally issued in Spanish – see Note 2.2)
Note 2 - Basis of presentation for consolidated financial statements and Summary of significant accounting policies (continued)
|
2.2
|
Basis of preparation (continued)
|
|
(a)
|
Accounting pronouncements (continued)
|
IAS 12 - Income Taxes
On December 20, 2010 the IASB issued a document called “Deferred Tax: Recovery of Underlying Assets (amendment to IAS 12)” that prescribes the determination of deferred taxes of entities using fair value as a model to value investment properties under IAS 40 “Investment Property”. In addition, this new standard includes SIC 21 “Income Tax− Recovery of Revalued Non-Depreciable Assets”. These amendments are effective for the years beginning January 1, 2012.
IAS 24 “Related Party Disclosures”
In November 2009, the IASB issued amendments to IAS 24. The revised standard simplifies the disclosure requirements for entities that are controlled, jointly controlled or significantly influenced by agencies of a government (called related - government entities) and provides for a definition of related entities. This standard is effective from January 1, 2011. Retrospective application is required.
IAS 27 “Consolidated and Separate Financial Statements”
The amendments to IAS 27 issued in May 2010 by IASB specify some of the transition requirements for amendments resulting from this standard. These amendments relate to IAS 21 the “Effects of Changes in Foreign Exchange Rates” according to which amendments must be applied retrospectively. This standard is effective from January 1, 2011.
IAS 32 “Financial Instruments Presentation”
In October 2009, the IASB issued a document called “Classification of Rights Issues”. This changed some sections of IAS 32 related to rights issues. According to the amendments the rights, options and warrants that meet the definition in paragraph 11 of IAS 32 issued to acquire a fixed number of the entity’s own non derivative equity instruments for a fixed amount in any currency are classified as equity instruments provided they are offered prorata to the current owners of the same class of the entity’s own non derivative equity instruments. This standard is effective for annual periods beginning on or after February 1, 2010, and early adoption is permitted.
F-16
Notes to the consolidated Financial Statements as of December 31, 2010
(Translation of consolidated financial statements originally issued in Spanish – see Note 2.2)
Note 2 - Basis of presentation for consolidated financial statements and Summary of significant accounting policies (continued)
|
2.2
|
Basis of preparation (continued)
|
|
(a)
|
Accounting pronouncements (continued)
|
IAS 34 “Interim Financial Reporting”
The IASB addressed in the amendments to IFRS issued in May 2010, the requests to clarify disclosures required by IAS 34 when this standard was deemed to be against the changes in the disclosure requirements of other IFRS. IAS 34 prescribes the disclosure principles to determine the kind of information that must be disclosed in interim statements. The IASB concluded that amendments to IAS 34 would improve interim financial reporting, putting an emphasis on the principles and inclusion of additional examples relating to more recent reporting requirements. This standard is effective from January 1, 2011.
IFRIC 14 “Minimum Funding Requirements”
In November 2009 the IASB amended IFRIC 14 to eliminate an unintended consequence that arises from the treatment of pre-payments for future contributions in some cases when there is an obligation to maintain minimum funding. Amendments will apply in limited circumstances: when an entity is subject to minimum funding requirements and makes pre-payments in order to cover these requirements. The amendments allow an entity to treat these pre-payments as assets. This IFRIC is effective from January 1, 2011.
Management is in the process of evaluating the impact of the adoption of the new standards, improvements and amendments on the Company’s consolidated financial statements. .
|
2.3
|
Transactions in foreign currency
|
|
(a)
|
Functional and presentation currency
|
The Company’s consolidated financial statements are presented in United States dollars (“U.S. dollars” or “USD”), which is the Company’s functional and presentation currency and is the currency of the main economic environment in which it operates.
Consequently, the term foreign currency is defined as any currency other than U.S. dollar.
The conversion of the financial statements of foreign companies with functional currency other than U.S. dollars is performed as follows:
|
|
-
|
Assets and liabilities using the exchange rate prevailing on the closing date of the consolidated financial statements.
|
|
|
-
|
Statement of income account items using the average exchange rate for the year.
|
|
|
-
|
Equity accounts are stated at the historical exchange rate prevailing at acquisition date (or at the average exchange rate for the period in which it was generated both for the case of retained earnings and for contributions made), as applicable.
|
F-17
Notes to the consolidated Financial Statements as of December 31, 2010
(Translation of consolidated financial statements originally issued in Spanish – see Note 2.2)
Note 2 - Basis of presentation for consolidated financial statements and Summary of significant accounting policies (continued)
|
2.3
|
Transactions in foreign currency (continued)
|
|
(a)
|
Functional and presentation currency (continued)
|
Foreign currency translation differences which arise from the conversion of financial statements are recorded in the account “Foreign currency translation differences" within other comprehensive income.
|
(b)
|
Basis of conversion
|
Domestic subsidiaries
Assets and liabilities denominated in Chilean pesos and other currencies other than the functional currency (U.S. dollar) as of December 31, 2010, December 31, 2009, and January 1, 2009 have been translated to U.S. dollars at the exchange rates prevailing at those dates. The corresponding Chilean pesos were converted at Ch$468.01 per US$1.00 as of December 31, 2010, Ch$507.10 per US$1.00 as of December 31, 2009, and Ch$636.45 per US$1.00 as of January 1, 2009.)
The values of the UF (a Chilean peso-denominated, inflation-indexed monetary unit) used to convert the UF denominated assets and liabilities as of December 31, 2010 amounted to Ch$21,455.55 (US$45.84), as of December 31, 2009 amounted to Ch$20,942.88 (US$41.30), and as of January 1, 2009 amounted to Ch$21,452.57 (US$33.71.)
Foreign subsidiaries
The exchange rates used to translate the monetary assets and liabilities expressed in foreign currency at the closing date of each period in respect to the U.S. dollar are detailed as follows:
|
12.31.2010
|
12.31.2009
|
01.01.2009
|
||||||||||
|
US$
|
US$
|
US$
|
||||||||||
|
Brazilian Real
|
1.66 | 1.74 | 2.34 | |||||||||
|
New Peruvian Sol
|
2.81 | 2.88 | 3.14 | |||||||||
|
Argentinean Peso
|
3.98 | 3.83 | 3.47 | |||||||||
|
Japanese Yen
|
81.49 | 92.10 | 91.03 | |||||||||
|
Euro
|
0.75 | 0.69 | 0.72 | |||||||||
|
Mexican Peso
|
12.38 | 13.04 | 13.77 | |||||||||
|
Australian Dollar
|
1.01 | 1.12 | 1.45 | |||||||||
|
Pound Sterling
|
0.64 | 0.62 | 0.67 | |||||||||
|
South African Rand
|
6.63 | 7.40 | 9.28 | |||||||||
|
Ecuadorian Dollar
|
1.00 | 1.00 | 1.00 | |||||||||
|
Chilean Peso
|
468.01 | 507.10 | 636.45 | |||||||||
|
UF
|
45.84 | 41.30 | 33.71 | |||||||||
F-18
Notes to the consolidated Financial Statements as of December 31, 2010
(Translation of consolidated financial statements originally issued in Spanish – see Note 2.2)
Note 2 - Basis of presentation for consolidated financial statements and Summary of significant accounting policies (continued)
|
2.3
|
Transactions in foreign currency (continued)
|
|
(c)
|
Transactions and balances
|
Non-monetary transaction balances denominated in a currency other than the functional currency (U.S. dollar) are translated using the exchange rate in force for the functional currency at the transaction date. Monetary assets and liabilities denominated in a foreign currency are translated at the exchange rate of the functional currency prevailing at the closing date of the consolidated classified statement of financial position. All differences are taken to the statement of income with the exception of all monetary items that provide an effective hedge for a net investment in a foreign operation. These items are recognized in other comprehensive income upon the disposal of the investment, at which time they are recognized in the statement of income. Tax charges and credits attributable to exchange differences on those monetary items are also recorded in other comprehensive income.
Non-monetary items that are measured in terms of historical cost in a foreign currency are translated using the exchange rates at the dates of the initial transactions. Non-monetary items measured at fair value in a foreign currency are translated using the exchange rates at the date when the fair value is determined.
|
(d)
|
Group entities
|
The profit or loss, assets and liabilities of all those entities with a functional currency other than the presentation currency are translated to the presentation currency as follows:
|
|
-
|
Assets and liabilities are translated at the closing date exchange rate as of the date of the consolidated statement of financial position.
|
|
|
-
|
Revenue and expenses in each profit or loss account are translated at average exchange rates for the year.
|
|
|
-
|
All resulting foreign currency exchange differences are recognized as a component separate from other comprehensive income (the foreign currency translation difference reserve).
|
|
2.4
|
Basis of consolidation
|
|
(a)
|
Subsidiaries
|
Subsidiaries are all those entities over which the Company has control to lead the financial and operating policies, which, in general, is accompanied by an interest of greater than half the voting rights. Subsidiaries are consolidated from the date on which control is transferred to the Company and are excluded from consolidation on the date that this control ceases to exist.
F-19
Notes to the consolidated Financial Statements as of December 31, 2010
(Translation of consolidated financial statements originally issued in Spanish – see Note 2.2)
Note 2 - Basis of presentation for consolidated financial statements and Summary of significant accounting policies (continued)
|
2.4
|
Basis of consolidation (continued)
|
|
(a)
|
Subsidiaries (continued)
|
In order to recognize the acquisition of an subsidiary, the Company uses the acquisition method. Under this method, the acquisition cost is the fair value of assets delivered, of equity instruments issued and of liabilities incurred or assumed at the exchange date plus costs directly attributable to the acquisition. Identifiable assets acquired and identifiable liabilities and contingencies assumed in a business combination are initially stated at their fair value as of the acquisition date. For each business combination, the acquirer measures the non-controlling interests in the acquiree at fair value.
Companies included in consolidation
:
|
Country of
|
Functional
|
Ownership interest
12.31.2010
|
12.31.2009
(**)
|
|||||||||||||||||||
|
TAX ID No.
|
Foreign subsidiaries
|
origin
|
currency
|
Direct
|
Indirect
|
Total
|
Total
|
|||||||||||||||
|
Foreign
|
Nitratos Naturais Do Chile Ltda.
|
Brazil
|
US$
|
0.0000 | 100.0000 | 100.0000 | 100.0000 | |||||||||||||||
|
Foreign
|
Nitrate Corporation Of Chile Ltd.
|
United Kingdom
|
US$
|
0.0000 | 100.0000 | 100.0000 | 100.0000 | |||||||||||||||
|
Foreign
|
SQM North America Corp.
|
USA
|
US$
|
40.0000 | 60.0000 | 100.0000 | 100.0000 | |||||||||||||||
|
Foreign
|
SQM Europe N.V.
|
Belgium
|
US$
|
0.8600 | 99.1400 | 100.0000 | 100.0000 | |||||||||||||||
|
Foreign
|
Soquimich S.R.L. Argentina
|
Argentina
|
US$
|
0.0000 | 100.0000 | 100.0000 | 100.0000 | |||||||||||||||
|
Foreign
|
Soquimich European Holding B.V.
|
The Netherlands
|
US$
|
0.0000 | 100.0000 | 100.0000 | 100.0000 | |||||||||||||||
|
Foreign
|
SQM Corporation N.V.
|
Dutch Antilles
|
US$
|
0.0002 | 99.9998 | 100.0000 | 100.0000 | |||||||||||||||
|
Foreign
|
SQI Corporation N.V.
|
Dutch Antilles
|
US$
|
0.0159 | 99.9841 | 100.0000 | 100.0000 | |||||||||||||||
|
Foreign
|
SQM Comercial De Mexico S.A. De C.V.
|
Mexico
|
US$
|
1.0000 | 99.0000 | 100.0000 | 100.0000 | |||||||||||||||
|
Foreign
|
North American Trading Company
|
USA
|
US$
|
0.0000 | 100.0000 | 100.0000 | 100.0000 | |||||||||||||||
|
Foreign
|
Administración Y Servicios Santiago S.A. De C.V.
|
Mexico
|
US$
|
0.0200 | 99.9800 | 100.0000 | 100.0000 | |||||||||||||||
|
Foreign
|
SQM Peru S.A.
|
Peru
|
US$
|
0.9800 | 99.0200 | 100.0000 | 100.0000 | |||||||||||||||
|
Foreign
|
SQM Ecuador S.A.
|
Ecuador
|
US$
|
0.0040 | 99.9960 | 100.0000 | 100.0000 | |||||||||||||||
|
Foreign
|
SQM Nitratos Mexico S.A. De C.V.
|
Mexico
|
US$
|
0.0000 | 51.0000 | 51.0000 | 51.0000 | |||||||||||||||
|
Foreign
|
SQMC Holding Corporation L.L.P.
|
USA.
|
US$
|
0.1000 | 99.9000 | 100.0000 | 100.0000 | |||||||||||||||
|
Foreign
|
SQM Investment Corporation N.V.
|
Dutch Antilles
|
US$
|
1.0000 | 99.0000 | 100.0000 | 100.0000 | |||||||||||||||
|
Foreign
|
SQM Brasil Limitada
|
Brazil
|
US$
|
3.0100 | 96.9900 | 100.0000 | 100.0000 | |||||||||||||||
|
Foreign
|
SQM France S.A.
|
France
|
US$
|
0.0000 | 100.0000 | 100.0000 | 100.0000 | |||||||||||||||
|
Foreign
|
SQM Japan Co. Ltd.
|
Japan
|
US$
|
1.0000 | 99.0000 | 100.0000 | 100.0000 | |||||||||||||||
|
Foreign
|
Royal Seed Trading Corporation A.V.V.
|
Aruba
|
US$
|
1.6700 | 98.3300 | 100.0000 | 100.0000 | |||||||||||||||
|
Foreign
|
SQM Oceania Pty Limited
|
Australia
|
US$
|
0.0000 | 100.0000 | 100.0000 | 100.0000 | |||||||||||||||
|
Foreign
|
Rs Agro-Chemical Trading A.V.V.
|
Aruba
|
US$
|
98.3300 | 1.6700 | 100.0000 | 100.0000 | |||||||||||||||
|
Foreign
|
SQM Indonesia
|
Indonesia
|
US$
|
0.0000 | 80.0000 | 80.0000 | 80.0000 | |||||||||||||||
|
Foreign
|
SQM Virginia L.L.C.
|
USA
|
US$
|
0.0000 | 100.0000 | 100.0000 | 100.0000 | |||||||||||||||
|
Foreign
|
SQM Venezuela S.A.
|
Venezuela
|
US$
|
0.0000 | 100.0000 | 100.0000 | 100.0000 | |||||||||||||||
|
Foreign
|
SQM Italia SRL
|
Italy
|
US$
|
0.0000 | 100.0000 | 100.0000 | 100.0000 | |||||||||||||||
|
Foreign
|
Comercial Caiman Internacional S.A.
|
Cayman Islands
|
US$
|
0.0000 | 100.0000 | 100.0000 | 100.0000 | |||||||||||||||
|
Foreign
|
SQM Africa Pty.
|
South Africa
|
US$
|
0.0000 | 100.0000 | 100.0000 | 100.0000 | |||||||||||||||
|
Foreign
|
SQM Lithium Specialties LLC
|
USA
|
US$
|
0.0000 | 100.0000 | 100.0000 | 100.0000 | |||||||||||||||
|
Foreign
|
Fertilizantes Naturales S.A.
|
Spain
|
US$
|
0.0000 | 66.6700 | 66.6700 | 66.6700 | |||||||||||||||
|
Foreign
|
Iodine Minera B.V.
|
The Netherlands
|
US$
|
0.0000 | 100.0000 | 100.0000 | 100.0000 | |||||||||||||||
|
Foreign
|
SQM Agro India Pvt. Ltd.
|
India
|
US$
|
0.0000 | 100.0000 | 100.0000 | 0.00000 | |||||||||||||||
|
Foreign
|
SQM Beijin Comercial Ltd.
|
China
|
US$
|
0.0000 | 100.0000 | 100.0000 | 0.00000 | |||||||||||||||
F-20
Notes to the consolidated Financial Statements as of December 31, 2010
(Translation of consolidated financial statements originally issued in Spanish – see Note 2.2)
Note 2 - Basis of presentation for consolidated financial statements and Summary of significant accounting policies (continued)
|
2.4
|
Basis of consolidation (continued)
|
|
(a)
|
Subsidiaries (continued)
|
Companies included in consolidation
|
Country of
|
Functional
|
Ownership interest
12.31.2010
|
12.31.2009
(**)
|
|||||||||||||||||||
|
TAX ID No.
|
Domestic subsidiaries
|
origin
|
currency
|
Direct
|
Indirect
|
Total
|
Total
|
|||||||||||||||
| 96.801.610-5 |
Comercial Hydro S.A.
|
Chile
|
Chilean peso
|
0.0000 | 60.6382 | 60.6382 | 60.6382 | |||||||||||||||
| 96.651.060-9 |
SQM Potasio S.A.
|
Chile
|
US$
|
99.9974 | 0.0000 | 99.9974 | 99.9974 | |||||||||||||||
| 96.592.190-7 |
SQM Nitratos S.A.
|
Chile
|
US$
|
99.9999 | 0.0001 | 100.0000 | 100.0000 | |||||||||||||||
| 96.592180-K |
Ajay SQM Chile S.A.
|
Chile
|
US$
|
51.0000 | 0.0000 | 51.0000 | 51.0000 | |||||||||||||||
| 86.630.200-6 |
SQMC Internacional Ltda.
|
Chile
|
Chilean peso
|
0.0000 | 60.6382 | 60.6382 | 60.6382 | |||||||||||||||
| 79.947.100-0 |
SQM Industrial S.A.
|
Chile
|
US$
|
99.9954 | 0.0046 | 100.0000 | 100.0000 | |||||||||||||||
| 79.906.120-1 |
Isapre Norte Grande Ltda.
|
Chile
|
Chilean peso
|
1.0000 | 99.0000 | 100.0000 | 100.0000 | |||||||||||||||
| 79.876.080-7 |
Almacenes y Depósitos Ltda.
|
Chile
|
Chilean peso
|
1.0000 | 99.0000 | 100.0000 | 100.0000 | |||||||||||||||
| 79.770.780-5 |
Servicios Integrales de Tránsitos y Transferencias S.A.
|
Chile
|
US$
|
0.0003 | 99.9997 | 100.0000 | 100.0000 | |||||||||||||||
| 79.768.170-9 |
Soquimich Comercial S.A.
|
Chile
|
US$
|
0.0000 | 60.6383 | 60.6383 | 60.6383 | |||||||||||||||
| 79.626.800-K |
SQM Salar S.A.
|
Chile
|
US$
|
18.1800 | 81.8200 | 100.0000 | 100.0000 | |||||||||||||||
| 78.602.530-3 |
Minera Nueva Victoria S.A.
|
Chile
|
US$
|
99.0000 | 1.0000 | 100.0000 | 100.0000 | |||||||||||||||
| 78.053.910-0 |
Proinsa Ltda.
|
Chile
|
Chilean peso
|
0.0000 | 60.5800 | 60.5800 | 60.5800 | |||||||||||||||
| 76.534.490-5 |
Sociedad Prestadora de Servicios de Salud Cruz del Norte S.A.
|
Chile
|
Chilean peso
|
0.0000 | 100.0000 | 100.0000 | 100.0000 | |||||||||||||||
| 76.425.380-9 |
Exploraciones Mineras S.A.
|
Chile
|
US$
|
0.0100 | 99.9900 | 100.0000 | 100.0000 | |||||||||||||||
| 76.064.419-6 |
Agrorama Callegari Ltda. (*)
|
Chile
|
Chilean peso
|
0.0000 | 42.4468 | 42.4468 | 42.4468 | |||||||||||||||
(*) Agrorama Callegari Ltda. was consolidated given that the Company has control through subsidiary Soquimich Comercial S.A.
(**) Percentages of ownership interest as of January 1, 2009 are the same as those shown as of December 31, 2009.
Subsidiaries are consolidated by including in the consolidated financial statements all of their assets, liabilities, revenues, expenses and cash flows upon making the respective adjustments and eliminations of intragroup operations.
The results from subsidiary companies acquired or disposed of during the year are included in consolidated statement of income accounts from the effective date of acquisition or up to the effective date of disposal, as applicable.
F-21
Notes to the consolidated Financial Statements as of December 31, 2010
(Translation of consolidated financial statements originally issued in Spanish – see Note 2.2)
Note 2 - Basis of presentation for consolidated financial statements and Summary of significant accounting policies (continued)
|
2.4
|
Basis of consolidation (continued)
|
|
(a)
|
Subsidiaries (continued)
|
Non-controlling interests represent the portion of subsidiary net assets and operating results not owned by the parent company.
|
2.5
|
Significant accounting judgements, estimates and assumptions
|
The information contained in these consolidated financial statements is the responsibility of the Company’s management, who expressly indicate that they have applied all the principles and criteria included in IFRS, issued by the IASB.
In the accompanying consolidated financial statements, judgments and estimates have been made by management to quantify certain assets, liabilities, revenues, expenses and commitments recorded and or disclosed therein. Basically, these estimates include, but are not limited to, the following:
|
-
|
The useful lives of tangible and intangible assets and their residual values.
|
|
-
|
Impairment evaluations and resulting losses, if any.
|
|
-
|
Assumptions used for the actuarial calculation of employee benefits.
|
|
-
|
Provisions and contingent liabilities.
|
|
-
|
Inventory provisions based on technical studies which cover the different variables affecting products in stock (density. humidity. among others) and allowances on slow-moving spare parts in inventory.
|
|
-
|
Future costs for the closure of mining facilities.
|
|
-
|
The determination of the fair value of certain financial and non-financial assets and derivative instruments.
|
The determination and allocation of fair values in business combinations.
Although these estimates have been made considering information available as of the date of preparation of these consolidated financial statements, it is possible that events that may occur in the future could make their modification necessary in future years. Changes would be recorded prospectively, recognizing the effects of the change in estimates in the respective future consolidated financial statements.
|
2.6
|
Financial information by operating segment
|
IFRS 8 requires that companies adopt a “management approach” to disclose information on the operations generated by its operating segments. In general, this is the information that management uses internally for the evaluation of segment performance and making the decision on how to allocate resources for this purpose.
F-22
Notes to the consolidated Financial Statements as of December 31, 2010
(Translation of consolidated financial statements originally issued in Spanish – see Note 2.2)
|
2.6
|
Financial information by operating segment (continued)
|
An operating segment is a group of assets and operations responsible for providing products or services subject to risks and performance different from those of other business segments. A geographical segment is responsible for providing products or services in a given economic environment subject to risks and performance different from those of other segments that operate in other economic environments.
The following operating segments have been identified by the Company:
|
-
|
Specialty plant nutrients
|
|
-
|
Industrial chemicals
|
|
-
|
Iodine and derivatives
|
|
-
|
Lithium and derivatives
|
|
-
|
Potassium
|
|
-
|
Other products and services
|
The Company has not been able to allocate all assets and liabilities to each operating segment because the same productive plants and process are often related to more than one operating segment. Such assets and liabilities are classified as non-allocated in Note 27.
|
2.7
|
Property, plant and equipment
|
Tangible property, plant and equipment assets are stated at acquisition cost, net of the related accumulated depreciation, amortization and impairment losses that they might have experienced.
In addition to the price paid for the acquisition of tangible property, plant and equipment, the Company has considered the following concepts as part of the acquisition cost, as applicable:
|
1.
|
Accrued interest expenses during the construction period which are directly attributable to the acquisition, construction or production of qualifying assets, which are those that require a substantial period prior to being ready for use. The interest rate used is that related to the project’s specific financing or, should this not exist, the average financing rate of the investor company.
|
F-23
Notes to the consolidated Financial Statements as of December 31, 2010
(Translation of consolidated financial statements originally issued in Spanish – see Note 2.2)
Note 2 - Basis of presentationof consolidated financial statements and Summary of significant accounting principles (continued)
|
2.7
|
Property, plant and equipment (continued)
|
|
2.
|
The present value of future costs that the Company will have to experience related to the closure of its facilities are included in the asset's cost.
|
Construction-in-progress is transferred to property, plant and equipment in operation once the assets are available for use and the related depreciation and amortization begins on that date.
Extension, modernization or improvement costs that represent an increase in productivity, ability or efficiency or an extension of the useful lives of property, plant and equipment are capitalized as a higher cost of the related assets. All the remaining maintenance, preservation and repair expenses are charged to expense as incurred.
Property, plant and equipment, net in the case of their residual value is depreciatedusing the straight-line method over its estimated useful lives. When portions of a property, plant and equipment item have different useful lives, these portions are recorded as separate items. The useful life is reviewed annually, and revised if necessary.
The useful lives used for the depreciation and amortization of assets included in property, plant and equipment are presented below.
|
Types of property. plant and equipment
|
Life
|
Life
|
||||||
|
Buildings
|
3 | 60 | ||||||
|
Plant and equipment
|
3 | 35 | ||||||
|
Information technology equipment
|
3 | 10 | ||||||
|
Fixed installations and accessories
|
3 | 35 | ||||||
|
Motor vehicles
|
5 | 10 | ||||||
|
Other property. plant and equipment
|
2 | 30 | ||||||
F-24
Notes to the consolidated Financial Statements as of December 31, 2010
(Translation of consolidated financial statements originally issued in Spanish – see Note 2.2)
Note 2 - Basis of presentationof consolidated financial statements and Summary of significant accounting principles (continued)
|
2.7
|
Property, plant and equipment (continued)
|
Gains or losses which are generated from the sale or disposal of property, plant and equipment are recognized as income (or loss) in the period and calculated as the difference between the asset’s sales value and its net carrying value.
The Company obtains property rights and mining concessions from the Chilean State Government. Property rights are usually obtained without any initial cost (other than the payment of mining licenses and minor registration expenses) and when rights are obtained on these concessions, the Company retains them while it pays the related annual license fees. Such license fees, which are paid annually, are recorded as prepaid expenses and amortized over the following twelve month period. Amounts attributable to mining concessions acquired from other Governments or third parties, which are not from the Chilean State, are recorded at their acquisition cost in property, plant and equipment, and depreciated over their contractual lives.
|
2.8
|
Investment properties
|
The Company recognizes as investment properties the net values of land, buildings and other properties held which it intends to commercialize under lease agreements, or to obtain proceeds from their sale as a result of those increases generated in the future in the respective market prices. These assets are not used in the activities and are not destined for the Company’s own use.
Investment properties are initially stated at acquisition cost, which includes the acquisition price or production cost plus directly assignable expenses. Subsequently, investment properties are stated at their acquisition cost less accumulated depreciation, and the possible accrued provisions for value impairment.
|
2.9
|
Inventory
|
The Company states inventory at the lower of cost or net realizable value. Cost includes direct costs of materials and; as applicable, labor costs, indirect costs incurred to transform raw materials into finished products, and general expenses incurred in carrying inventory to their current location and conditions. The method used to determine the cost of inventory is weighted average cost method.
The net realizable value of inventory represents the estimate of the sales price less estimated finishing costs and costs that will be incurred in commercialization, sales and distribution processes.
Commercial discounts, rebates obtained and other similar entries are deducted in the determination of the acquisition price.
F-25
Notes to the consolidated Financial Statements as of December 31, 2010
(Translation of consolidated financial statements originally issued in Spanish – see Note 2.2)
Note 2 - Basis of presentationof consolidated financial statements and Summary of significant accounting principles (continued)
|
2.9
|
Inventory (continued)
|
The valuation of obsolete, impaired or slow-moving products relates to their estimated net realizable value. The Company conducts an evaluation of the net realizable value of inventory at the end of each year, recording an estimate with a charge to expense when inventories are overstated. When the circumstances that previously gave rise to the write-down cease to exist, or when there is clear evidence of an increase in the net realizable value due to a change in the economic circumstances (or prices of primary raw materials), the estimate made previously is modified.
Provisions on the Company's inventory have been made based on a technical study which covers the different variables affecting products in stock (density, humidity, among others.)
|
2.10
|
Trade and other accounts receivable
|
Trade and other accounts receivable relate to non-derivative financial assets with fixed payments that can be determined and are not quoted in any active market. These arise from sales operations involving the products and/or services that the Company commercializes directly to its customers.
These assets are initially recognized at their fair value (which is equivalent to their face value, discounting implicit interest for installment sales) and subsequently at amortized cost according to the effective interest rate method less an accrual for impairment loss. When the face value of the account receivable does not significantly differ from its fair value, it is recognized at face value. An allowance for impairment loss is established for trade accounts receivable when there is objective evidence that the Company will not be able to collect all the amounts owed to it according to the original terms of accounts receivable.
Implicit interest in installment sales is recognized as interest income when interest is accrued over the term of the operation.
F-26
Notes to the consolidated Financial Statements as of December 31, 2010
(Translation of consolidated financial statements originally issued in Spanish – see Note 2.2)
Note 2 - Basis of presentationof consolidated financial statements and Summary of significant accounting principles (continued)
|
2.11
|
Revenue recognition
|
Revenue includes the fair value of considerations received or receivable for the sale of goods and services during performance of the Company's activities. Revenue is presented net of value added tax, estimated returns, rebates and discounts and after the elimination of sales among subsidiaries.
Revenue is recognized when its amount can be stated reliably, it is possible that the future economic rewards will flow to the entity and the specific conditions for each type of activity -related revenue are complied with, as follows:
|
(a)
|
Sale of goods
|
Sales of goods are recognized when the Company has delivered products to the customer, the customer has total discretion on the distribution channel and the price at which products are sold and there is no obligation pending compliance that could affect the acceptance of products by the customer. The delivery does not occur until products have been shipped to the customer or confirmed as received by customers when the related risks of obsolescence and loss have been transferred to the customer and the customer has accepted products in accordance with the conditions established in the sale, the acceptance period has ended or there is objective evidence that those criteria required for acceptance have been met.
Sales are recognized in consideration of the price set in the sales agreement, net of volume discounts and estimated returns at the date of the sale. Volume discounts are evaluated in consideration of annual foreseen purchases and in accordance with the criteria defined in agreements.
|
(b)
|
Sales of services
|
Revenue associated with the rendering of services is recognized considering the degree of completion of the service as of the date of presentation of the consolidated classified statement of financial position, provided that the result from the transaction can be estimated reliably.
|
(c)
|
Interest income
|
Interest income is recognized when interest is accrued in consideration of the principal pending payment using the effective interest rate method.
|
(d)
|
Income from royalties
|
Income from royalties is recognized based on the accrual in accordance with the economic substance of the related agreements.
F-27
Notes to the consolidated Financial Statements as of December 31, 2010
(Translation of consolidated financial statements originally issued in Spanish – see Note 2.2)
Note 2 - Basis of presentationof consolidated financial statements and Summary of significant accounting principles (continued)
|
2.11
|
Revenue recognition (continued)
|
|
(e)
|
Income from dividends
|
Income from dividends is recognized when the right to receive the payment is established.
|
2.12
|
Investments recognized using the equity method
|
Interests in companies in which control is exercised together with another company (joint ventures) or in which the Company has significant influence (associated companies) are recorded using the equity method. Significant influence is assumed to exist when the Company has interest exceeding 20% of the investee's equity.
Under this method, the investment is recognized in the consolidated classified statement of financial position at cost plus changes subsequent to the acquisition in an amount proportional to the net associated company’s equity using the ownership interest in the associate. The associated goodwill is included at the carrying value of the investee, and it is not subject to amortization. The debit or credit to profit or loss reflects the proportional amount in the associated companies’s results for the reporting period.
Unrealized profit on transactions with associates and subisidiries are eliminated in consolidation of the ownership percentage that the Company has on these entities.
Unrealized losses are also eliminated unless the transaction provided evidence of loss from impairment of the assets transferred.
Changes in equity of the associates are recognized proportionally with a debit or credit to “Other reserves” and classified according to their origin.
The associated companies and the Company’s reporting dates and policies are similar for equivalent transactions and events under similar circumstances.
In the event that significant influence is lost or the investment is sold or is available-for-sale, the equity value method is discontinued, suspending the recognition of proportional income.
If the resulting amount according to the equity method is negative, the Company’s equity interest is reduced to zero in the consolidated classified statement of financial position unless the Company has a contractual commitment to resolvethe equity position. In this case, the respective provision for risks and expenses is recorded.
Dividends received in these companies are recorded by reducing the equity value and proportional profit or loss recognized in conformity with their interest, and are included in the consolidated statement of income under the caption “Equity in income (losses) of associates and joint ventures accounted for using the equity method”.
F-28
Notes to the consolidated Financial Statements as of December 31, 2010
(Translation of consolidated financial statements originally issued in Spanish – see Note 2.2)
Note 2 - Basis of presentationof consolidated financial statements and Summary of significant accounting principles (continued)
|
2.13
|
Income Tax
|
Corporate income tax for the year is determined as the sum of current taxes from the different consolidated companies. Current taxes are based on the application of the various types of taxes attributable to taxable income for the year.
Differences between the book value of assets and liabilities and their tax basis generate the balance of deferred tax assets or liabilities, which are calculated using the tax rates expected to be applicable when the assets and liabilities are realized.
In conformity with current Chilean tax regulations, the provision for corporate income tax and taxes on mining activity is recognized on an accrual basis, presenting the net balances of accumulated monthly tax provisional payments for the fiscal period and associated credits.. The balances of these accounts are presented in current income taxes recoverable or current taxes payable, as applicable.
Tax on companies and variations in deferred tax assets or liabilities that are not the result of business combinations are recorded in statement of income accounts or equity accounts in the consolidated classified statement of financial position, considering the origin of the gains or losses which have generated them.
As of the date of these consolidated financial statements, the carrying value of deferred tax assets has been reviewed and reduced to the extent their will not be sufficient taxable income to allow the recovery of all or a portion of the deferred tax assets. Likewise, as of the date of the consolidated financial statements, deferred tax assets that are not recognized are were evaluated and not recognized as it was not more likely than not that future taxable income will allow for recovery of the deferred tax asset.
With respect to deductible temporary differences associated with investments in subsidiaries, associated companies and interest in joint ventures, deferred tax assets are recognized solely provided that it is more likely than not that the temporary differences will be reversed in the near future and that there will be taxable income with which they may be used.
The deferred income tax related to entries directly recognized in equity is recognized with an effect on equity and not with an effect on profit or loss.
Deferred tax assets and liabilities are offset if there is a legally receivable right of offsetting tax assets against tax liabilities and the deferred tax is related to the same tax entity and authority.
|
2.14
|
Earnings per share
|
The basic earnings per share amounts are calculated by dividing profit for the year attributable to ordinary owners of the parent by the weighted average number of ordinary shares outstanding during the year.
The Company has not conducted any type of operation of potential dilutive effect that assumes diluted earnings per share other than the basic earnings per share.
F-29
Notes to the consolidated Financial Statements as of December 31, 2010
(Translation of consolidated financial statements originally issued in Spanish – see Note 2.2)
|
2.15
|
Non-financial asset value impairment
|
Assets subject to depreciation and amortization are subject to impairment testing, provided that an event or change in the circumstances indicates that the amounts in the accounting records may not be recoverable. An impairment loss is recognized for the excess of the book value of the asset over its recoverable amount.
The recoverable amount of an asset is the higher between the fair value of an asset or cash generating unit (“CGU”) less costs of sales and its value in use, and is determined for an individual asset unless the asset does not generate any cash inflows that are clearly independent from other assets or groups of assets.
When the carrying value of an asset exceeds its recoverable amount, the asset is considered an impaired asset and is reduced to its net recoverable amount.
In evaluating value in use, estimated future cash flows are discounted using a discount rate before taxes which reflects current market evaluation on the time value of money and specific asset risks.
An appropriate valuation model is used to determine the fair value less selling costs. These calculations are confirmed by valuation multiples, quoted share prices for subsidiaries quoted publicly or other available fair value indicators.
Impairment losses are recognized as expense, except for properties reevaluated previously where the revaluation was taken to equity. In this case impairment is also recognized with a debit to equity up to the amount of any previous revaluation.
For assets other than acquired goodwill, an annual evaluation is conducted of whether there are impairment loss indicators recognized previously that might have already ceased to exist or decreased. The recoverable amount is estimated if such indicators exist. An impairment loss previously recognized is reversed only if there have been changes in estimates used to determine the asset’s recoverable amount from the last time in which an impairment loss was recognized. If this is the case, the carrying value of the asset is increased to its recoverable amount. This increased amount cannot exceed the carrying value that would have been determined net of depreciation if an asset impairment loss would have not been recognized in prior years. This reversal is recognized with a credit to profit or loss unless an asset is recorded at the revalued amount. Should this be the case, the reversal is treated as an increase in revaluation.
As of December 31, 2010, the Company is not aware of any indicators of impairment with respect to its depreciated long-term assets.
F-30
Notes to the consolidated Financial Statements as of December 31, 2010
(Translation of consolidated financial statements originally issued in Spanish – see Note 2.2)
Note 2 - Basis of presentationof consolidated financial statements and Summary of significant accounting principles (continued)
|
2.16
|
Financial assets
|
The Company classifies its financial assets under the following categories: at fair value through profit or loss, loans and accounts receivable, financial assets held-to-maturity and financial assets available-for-sale. The classification depends on the purpose for which financial assets were acquired. Management determines the classification of its financial assets at the time of initial recognition.
The Company assesses at each reporting date whether there is any objective evidence that a financial asset or a group of financial assets is impaired. A financial asset or a group of assets is deemed to be impaired if and only if there is objective evidence of impairment as a result of one or more events that has occurred after the initial recognition of the asset (an incurred “loss event”) and that loss event has an impact on the estimated future cash flow of the financial asset or the group of financial assets that can be reliably estimated.
|
(a)
|
Financial assets at fair value through profit or loss
|
Financial assets at fair value through profit or loss are financial assets held for trading. A financial asset is classified in this category if it is acquired mainly for the purpose of being sold in the short-term. Derivatives are also classified as acquired for trading unless they are designated as hedge accounts. Assets under this category are classified as current assets and variations generated in fair value are directly recognized in profit or loss.
|
(b)
|
Loans and accounts receivable
|
Loans and accounts receivable are non-derivative financial assets with fixed payments or payments that can be determined and are not quoted in any active market. These are included in current assets, except for those with expiration dates exceeding 12 months from the closing date, which are classified as non-current assets. Loans and accounts receivable are included under the caption “Trade and other accounts receivable” in the consolidated classified statement of financial position and are stated at amortized cost. The subsequent measurement at amortized cost is calculated using the effective interest rate method less impairment.
|
(c)
|
Financial assets held-to-maturity
|
Financial assets held-to-maturity are non-derivative financial assets with fixed payments or payments that can be determined and fixed expiration dates which management has the positive intention and ability of holding to maturity. If a significant amount of financial assets held to maturity were to be sold, the full category would be reclassified as available for sale. Assets in this category are stated at amortized cost.
|
(d)
|
Financial assets available for sale
|
Financial assets available for sale are non-derivative instruments that have been designated in this category or are not classified in any of the other categories. They are included in non-current assets unless the Company intends to dispose of the investment in the 12 months following the closing date. These assets are stated at fair value, recognizing in other comprehensive income those variations in fair value.
F-31
Notes to the consolidated Financial Statements as of December 31, 2010
(Translation of consolidated financial statements originally issued in Spanish – see Note 2.2)
Note 2 - Basis of presentationof consolidated financial statements and Summary of significant accounting principles (continued)
|
2.17
|
Financial liabilities
|
The Company classifies its financial liabilities under the following categories: at fair value through profit or loss, trade accounts payable, interest-bearing loans or derivatives designated as hedging instruments.
The Company’s management determines the classification of its financial liabilities at the time of initial recognition.
Financial debt obligations are recorded at nominal value and as non-current when maturity is over twelve months and as current when maturity is less than twelve months. Interest expenses are recorded the year in which they are accrued under a financial approach.
In accordance with IAS 32 and 39, debt-related expenses are accounted for in the accompanying consolidated classified statements of financial position, deducting the associated debt and are imputed to the results of the year within the life of the debt using the effective interest rate method.
Financial liabilities are derecognized when the obligation is repaid, settled or it expires.
|
(a)
|
Financial liabilities at fair value through profit or loss
|
Financial liabilities are classified at fair value when these are held for trading or designated in their initial recognition at fair value through profit or loss. This category includes derivative instruments not designated for hedge accounting.
|
(b)
|
Trade accounts payable
|
Trade accounts payable to suppliers are subsequently stated at their amortized cost using the effective interest rate method.
|
(c)
|
Interest-bearing loans
|
Loans are subsequently stated at amortized cost using the effective interest rate method. Amortized cost is calculated considering any premium or discount from the acquisition and includes costs of transactions which are an integral part of the effective interest rate.
|
2.18
|
The environment
|
In general, the Company follows the criteria of considering amounts used in environmental protection and improvement as environmental expenses. However, the cost of facilities, machinery and equipment used for the same purpose are considered property, plant and equipment.
F-32
Notes to the consolidated Financial Statements as of December 31, 2010
(Translation of consolidated financial statements originally issued in Spanish – see Note 2.2)
Note 2 - Basis of presentationof consolidated financial statements and Summary of significant accounting principles (continued)
|
2.19
|
Minimum dividend
|
As required by the Public Corporations Act, unless otherwise decided by the shareholders through unanimous vote of the holders of those shares issued and subscribed, a public corporation must distribute a minimum dividend of 30% of its profit for the year, except in the event that the Company has losses not absorbed in prior years.
|
2.20
|
Consolidated statement of cash flows
|
Cash equivalents relate to short-term, highly liquid investments that are readily convertible into known amounts of cash and are subject to low risk of change in value, and that expire in less than three months. This classification also applies to mutual funds classified as cash equivalents.
The statement of cash flows includes cash movements performed during the year, determined using the indirect method.
|
2.21
|
Obligations related to employee termination benefits and pension commitments
|
Obligations with the Company’s employees are in accordance with that established in the collective bargaining agreements in force formalized through collective employment agreements and individual employment contracts. In the case of the United States employees, certain obligations are in accordance with the related pension plan.
These obligations are valued using actuarial calculations, which consider such hypotheses as the mortality rate, employee turnover, interest rates, retirement dates, effects related to increases in employees‘salaries, as well as the effects on variations in services derived from variations in the inflation rate.
F-33
Notes to the consolidated Financial Statements as of December 31, 2010
(Translation of consolidated financial statements originally issued in Spanish – see Note 2.2)
Note 2 - Basis of presentationof consolidated financial statements and Summary of significant accounting principles (continued)
|
2.21
|
Obligations related to employee termination benefits and pension commitments (continued)
|
Actuarial losses and gains that may be generated by variations in previously defined obligations are directly recorded in consolidated statement of income.
Actuarial losses and gains have their origin in deviations between the estimate and the actual behavior of actuarial hypotheses or in the reformulation of established actuarial hypotheses.
The discount rate used by the Company for calculating the obligation was 6% for the years ended December 31, 2010, December 31, 2009 and January 1, 2009.
The Company’s affiliate SQM North America has established pension plans for its retired employees that are calculated by measuring the projected obligation using a net salary progressive rate net of adjustments for inflation, mortality and turnover assumptions, deducting the resulting amounts at present value using a 6.5% interest rate. The net balance of this obligation is presented in the category called non-current accruals for employee benefits.
|
2.22
|
Financial derivatives and hedge transactions
|
Derivatives are recognized initially at fair value as of the date in which the derivatives contract is signed and subsequently they are valued at fair value at each period end. The method for recognizing the resulting loss or gain depends on whether the derivative has been designated as an accounting hedge instrument and if so, it depends on the type of hedging, which may be as follows:
|
(a)
|
Fair value hedge of assets and liabilities recognized (fair value hedges);
|
|
(b)
|
Hedging of a single risk associated with an asset or liability recognized or a highly possible foreseen transaction (cash flow hedge);
|
At the beginning of the transaction, the Company documents the relationship existing between hedging instruments and those entries hedged, as well as their objectives for risk management purposes and the strategy to conduct different hedging operations.
The Company also documents its evaluation both at the beginning and the end of each period of whether derivatives used in hedging transactions are highly effective to offset changes in the fair value or in cash flows of hedged entries.
The fair value of derivative instruments used for hedging purposes is shown in Note 9.3. Movements in the cash flow hedge reserve (other comprehensive income) are classified as a non-current asset or liability if the remaining expiration period of the hedged item is higher than 12 months and as a current asset or liability if the remaining expiration period of the entry is lower than 12 months.
F-34
Notes to the consolidated Financial Statements as of December 31, 2010
(Translation of consolidated financial statements originally issued in Spanish – see Note 2.2)
Note 2 - Basis of presentationof consolidated financial statements and Summary of significant accounting principles (continued)
|
2.22
|
Financial derivatives and hedge transactions(continued)
|
Financial derivatives are classified as a current asset or liability, and the change in their fair value is recognized directly in profit or loss.
|
(a)
|
Fair value hedge
|
The change in the fair value of a derivative is recognized with a debit or credit to profit or loss, as applicable. The change in the fair value of the hedged entry attributable to hedged risk is recognized as part of the carrying value of the hedged entry and is also recognized with a debit or credit to profit or loss.
For fair value hedging related to items recorded at amortized cost, the adjustment of the fair value is amortized against income during the period through maturity. Any adjustment to the carrying value of a hedged financial instrument for which the effective rate is used is amortized with a debit or credit to profit or loss at its fair value attributable to the risk being covered.
If the hedged entry is derecognized, the fair value not amortized is immediately recognized with a debit or credit to profit or loss.
|
(b)
|
Cash flow hedges
|
The effective portion of gains or losses from the hedge instrument is initially recognized with a debit or credit to other comprehensive income, whereas any ineffective portion is immediately recognized with a debit or credit to income, as applicable.
Amounts taken to equity are transferred to profit or loss when the hedged transaction affects income for the year, as when the hedged interest income or expense is recognized when a forecasted sale occurs. When the hedged entry is the cost of a non-financial asset or liability, amounts taken to equity are transferred to the initial carrying value of the non-financial asset or liability.
Should the expected firm transaction or commitment no longer be expected to occur, the amounts previously recognized in other comprehensive income are transferred to income. If a hedge instrument expires, is sold, finished, and exercised without any replacement, or if a rollover is performed or if its designation as hedging is revoked, the amounts previously recognized in equity are maintained in shareholders’ equity until the expected firm transaction or commitment occurs.
F-35
Notes to the consolidated Financial Statements as of December 31, 2010
(Translation of consolidated financial statements originally issued in Spanish – see Note 2.2)
Note 2 - Basis of presentationof consolidated financial statements and Summary of significant accounting principles (continued)
|
2.23
|
Leases
|
|
(a)
|
Leases - Finance lease
|
Leases are classified as finance leases when the Company holds substantially all the risks and rewards derived from the ownership. Finance leases are capitalized at the beginning of the lease at the lower of the fair value of the leased asset or the present value of minimum lease payments.
Each lease payment is distributed between the liability and the interest expenses to obtain ongoing interest on the pending balance of the debt. The respective lease obligations, net of interest expense, are included in other non-current liabilities. The interest element of finance cost is debited in the consolidated statement of income during the lease period so that a regular ongoing interest rate is obtained on the remaining balance of the liability for each year. The asset acquired through a finance lease is subject to depreciation over the lesser value of its useful life or the life of the agreement.
|
(b)
|
Lease - Operating lease
|
Leases in which the lessor maintains a significant part of the risks and rewards derived from the ownership are classified as operating leases. Operating lease payments (net of any incentive received from the lessor) are debited to the statement of income or capitalized (as applicable) on a straight-line basis over the lease period.
|
2.24
|
Prospecting expenses
|
Those prospecting expenses associated with mineral reserves being exploited are included under Inventory and amortized according to the estimated mineral content reserves. Prospecting expenses associated with future mineral reserves are presented under other non-financial assets as and when minerals included in the future reserve have caliche ore-grade, which makes the mining property economically commercializable.
Those expenses incurred on mining properties in which the product has a low caliche ore-grade that is not economically commercializable, are directly charged to income.
|
2.25
|
Other provisionsaccrued expenses
|
Provisions are recognized when:
|
*
|
The Company has a present obligation as the result of a past event.
|
|
*
|
It is more likely than not that certain resources must be used, including benefits, to settle the obligation.
|
|
*
|
A reliable estimate can be made of the amount of the obligation.
|
F-36
Notes to the consolidated Financial Statements as of December 31, 2010
(Translation of consolidated financial statements originally issued in Spanish – see Note 2.2)
Note 2 - Basis of presentationof consolidated financial statements and Summary of significant accounting principles (continued)
|
2.25
|
Other provisionsaccrued expenses (continued)
|
In the event that the provision or a portion of it is reimbursed, the reimbursement is recognized as a separate asset solely if there is certainty of income.
In the consolidated statement of income, the expense for any provision is presented net of any reimbursement.
Should the effect of the time value of money be significant, provisions are discounted using a discount rate before taxes that reflects the liability’s specific risks. When a discount rate is used, the increase in the provision over time is recognized as a finance cost.
The Company’s policy is maintaining accruals to cover risks and expenses based on a better estimate to deal with possible or certain and quantifiable responsibilities from current litigation, compensations or obligations, pending expenses for which the amount has not yet been determined, collaterals and other similar guarantees for which the Company is responsible. These are recorded at the time the responsibility or the obligation that determines the compensation or payment is generated.
The Company determines and recognizes the cost related to employee vacation on an accrual basis.
|
2.26
|
Compensation plans
|
Compensation plans implemented through benefits in share-based payments settled in cash, which have been provided, are recognized in the financial statements at their fair value, in accordance with International Financial Reporting Standard No. 2 “Share-based payments”. Variations in the fair value of options granted are recognized with a charge to wages on a straight-line basis during the period between the date on which these options are granted and the payment date. (See Note N°17)
F-37
Notes to the consolidated Financial Statements as of December 31, 2010
(Translation of consolidated financial statements originally issued in Spanish – see Note 2.2)
Note 2 - Basis of presentationof consolidated financial statements and Summary of significant accounting principles (continued)
|
2.27
|
Goods and service insurance expenses
|
Payments for the different insurance policies which the Company contracts are recognized in expenses considering the proportional amount related to the time that they cover, regardless of payment terms. Amounts paid and not consumed are recognized as prepaid expenses within current assets.
Costs of claims are recognized in profit or loss immediately after they become known, net of recoverable amounts from insurance companies. Recoverable amounts are recorded as a reimbursable asset from the insurance company under “Trade and other accounts receivable", calculated as established in the respective insurance policies.
|
2.28
|
Intangible assets
|
Intangible assets mainly relate to goodwill acquired, water rights, trademarks, and rights of way related to electric lines and development expenses, and computer software licenses.
|
(a)
|
Goodwill acquired
|
Goodwill acquired represents the excess in acquisition cost on the fair value of the Company's ownership of the net identifiable assets of the subsidiary on the acquisition date. Goodwill acquired related to acquisitions of subsidiaries is included in intangible assets, which is subject to value impairment tests annually and is stated at cost plus accumulated impairment losses. Gains and losses related to the sale of an entity include the carrying value of goodwill related to the entity sold.
This intangible asset is assigned to cash generating units with the purpose of testing impairment losses. It is allocated based on cash generating units expected to obtain benefits from the business combination from which the aforementioned goodwill acquired arose.
|
(b)
|
Water rights
|
Water rights acquired by the Company relate to water from natural sources and are recorded at acquisition cost. Given that these assets represent rights granted on a perpetual basis to the Company, these are not amortized. However, they are subject to an impairment assessment on an annual basis.
|
(c)
|
Right of way for electric lines
|
As required for the operation of industrial plants, the Company has paid rights of way in order to install wires for the different electric lines in third party land. These rights are presented under Intangible assets. Amounts paid are capitalized at the date of the agreement and charged to income according to the life of the right of way.
F-38
Notes to the consolidated Financial Statements as of December 31, 2010
(Translation of consolidated financial statements originally issued in Spanish – see Note 2.2)
|
2.28
|
Intangible assets (continued)
|
|
(d)
|
Computer software
|
Licenses for IT programs acquired are capitalized based on costs that have been incurred to acquire them and prepare them to use the specific program. These costs are amortized over their estimated useful lives.
Expenses related to the development or maintenance of IT programs are recognized as an expense as and when incurred. Costs directly related to the production of unique and identifiable IT programs controlled by the Group and which probably will generate economic benefits that are higher than costs during more than a year, are recognized as intangible assets. Direct costs include expenses incurred for employees who develop IT programs and an adequate percentage of general expenses.
The costs of development for IT programs recognized as assets are amortized over their estimated useful lives.
No impairment of intangible assets exists as of December 31, 2010, 2009 or as of January 1, 2009.
|
2.29
|
Research and development expenses
|
Research and development expenses are expensed in the period in which the disbursement is made, with the exception of property, plant and equipment acquired for use in research and development, which are recognized in the accounting under the respective item within property, plant and equipment.
|
2.30
|
Classification of balances as current and non-current
|
In the attached statement of financial position, balances are classified in consideration of their remaining recovery (maturity) dates; i.e., those maturing on a date equal to or lower than twelve months are classified as current and those with maturity dates exceeding the aforementioned period are classified as non-current.
The exception to the foregoing relates to deferred taxes, which are classified as non-current, regardless of the anticipated recovery date.
F-39
Notes to the consolidated Financial Statements as of December 31, 2010
(Translation of consolidated financial statements originally issued in Spanish – see Note 2.2)
Application IFRS 1
The accompanying consolidated financial statements as of December 31, 2010 are the first consolidated financial statements prepared according to IFRS. The Company has applied IFRS 1 when preparing these consolidated financial statements.
The transition date is January 1, 2009, and management has prepared its opening balance under IFRS as of that date. The IFRS effective date is January 1, 2010, as indicated by the Chilean Superintendency of Securities and Insurance (SVS).
According to IFRS 1, in order to prepare the accompanying consolidated financial statements, all mandatory exemptions have been applied by the Company, as well as some of the non-mandatory exemptions to the retroactive application of IFRS.
The exceptions established in IFRS 1 that the Company has decided to apply are detailed as follows:
|
i)
|
Business combinations
|
The Company has applied the exemption included in IFRS 1 for business combinations conducted from 2004 and thereafter. For these purposes, the Company reversed the amortization of goodwill recognized in accordance with the previous accounting standards.
|
ii)
|
Fair value or revaluation of property, plant and equipment as deemed cost
|
The Company has chosen to measure certain property, plant and equipment items at their fair value as of the transition date of January 1, 2009. The fair value of property, plant and equipment was measured through a business appraisal conducted by independent external experts, who determined the new values, useful lives and residual values of these assets.
|
iii)
|
Employee benefits
|
The Company has opted to recognize all the actuarial gains and losses accumulated as of January 1, 2009.
|
iv)
|
Financial Instruments
|
The Company has applied hedge accounting to financial derivative instruments associated with obligations with the public (bonds payable) denominated in UF and Chilean pesos issued by the Company.
F-40
Notes to the consolidated Financial Statements as of December 31, 2010
(Translation of consolidated financial statements originally issued in Spanish – see Note 2.2)
Note 3 - First-time adoption of International Financial Reporting Standards (IFRS) (continued)
|
v)
|
Cumulative translation differences
|
The Company has opted to transfer cumulative translation differences from other reserves to retained earnings as of the transition date. This exemption has been applied to all dependent companies in accordance with IFRS 1.
IFRS first-time adoption effects are recognized in retained earnings or other reserve accounts in the Company’s equity, depending on whether these adjustments represent realized or unrealized gains or losses as of the transition date.
The following is a detailed description of the main differences between Generally Accepted Accounting Principles in Chile (Chilean GAAP) and International Financial Reporting Standards (IFRS) applied by the Company and the impact on equity as of December 31, 2009, and January 1, 2009 and on results of operations for the year ended December 31, 2009:.
|
|
a)
|
Reconciliation of equity from Generally Accepted Accounting Principles (Chilean GAAP) to International Financial Reporting Standards (IFRS) as of January 1, 2009
|
|
As of January 1, 2009
|
Owners of the
Parent
|
Non-
controlling
Interests
|
Total
Shareholder’s
equity
|
|||||||||
|
RECONCILIATION
|
ThUS$
|
ThUS$
|
ThUS$
|
|||||||||
|
Net equity under Chilean GAAP
|
1,463,108 | - | 1,463,108 | |||||||||
|
Incorporation of non-cotnrolling interests
|
- | 47,069 | 47,069 | |||||||||
|
Reversal of amortization of goodwill
|
6,487 | - | 6,487 | |||||||||
|
Negative goodwill
|
1,279 | - | 1,279 | |||||||||
|
Reversal of deferred tax complementary accounts
|
(13,515 | ) | - | (13,515 | ) | |||||||
|
Recognition of obligation for the minimum compulsory distribution of dividends of 30% of profit for the year
|
(50,422 | ) | - | (50,422 | ) | |||||||
|
Fair value of property, plant and equipment
|
(53,732 | ) | (634 | ) | (54,366 | ) | ||||||
|
Recognition of actuarial calculation of accrual for employee termination benefits
|
(928 | ) | (2 | ) | (930 | ) | ||||||
|
Hedge accounting (derivative instruments designated as cash flowhedge)
|
(9,507 | ) | - | (9,507 | ) | |||||||
|
Deferred taxes on IFRS adjustments
|
10,908 | 108 | 11,016 | |||||||||
|
Effect of transition to IFRS
|
(109,430 | ) | (528 | ) | (109,958 | ) | ||||||
|
Net equity under IFRS
|
1,353,678 | 46,541 | 1,400,219 | |||||||||
F-41
Notes to the consolidated Financial Statements as of December 31, 2010
(Translation of consolidated financial statements originally issued in Spanish – see Note 2.2)
Note 3 - First-time adoption of International Financial Reporting Standards (IFRS) (continued)
|
|
b)
|
Reconciliation of equity from Generally Accepted Accounting Principles (Chilean GAAP) to International Financial Reporting Standards (IFRS) as of December 31, 2009
|
|
As of De cember 31, 2009
|
Owners of the
Parent
|
Non -
controlling
Interests
|
Total
Shareholder’s
Equity
|
|||||||||
|
RECONCILIATION
|
ThUS$
|
ThUS$
|
ThUS$
|
|||||||||
|
Net equity under Chilean GAAP
|
1,466,613 | - | 1,466,613 | |||||||||
|
Incorporation of non-controlling interests
|
- | 46,093 | 46,093 | |||||||||
|
Reversal of amortization of goodwill
|
8,663 | - | 8,663 | |||||||||
|
Negative goodwill
|
1,072 | - | 1,072 | |||||||||
|
Reversal of deferred tax complementary accounts
|
(11,365 | ) | - | (11,365 | ) | |||||||
|
Recognition of obligation for the minimum compulsory distribution of dividends of 30% of profit for the year
|
- | - | ||||||||||
|
Fair value of property, plant and equipment
|
(45,132 | ) | (503 | ) | (45,635 | ) | ||||||
|
Recognition of actuarial calculation of accrual for employee termination benefits
|
(947 | ) | 26 | (921 | ) | |||||||
|
Hedge accounting (derivative instruments designated as cash flowhedge)
|
(9,619 | ) | - | (9,619 | ) | |||||||
|
Deferred taxes on IFRS adjustments
|
9,468 | 81 | 9,549 | |||||||||
|
Effect of transition to IFRS
|
(47,860 | ) | (396 | ) | (48,256 | ) | ||||||
|
Net equity under IFRS
|
1,418,753 | 45,697 | 1,464,450 | |||||||||
F-42
Notes to the consolidated Financial Statements as of December 31, 2010
(Translation of consolidated financial statements originally issued in Spanish – see Note 2.2)
Note 3 - First-time adoption of International Financial Reporting Standards (IFRS) (continued)
|
|
c)
|
Reconciliation of net income for the year from Generally Accepted Accounting Principles (Chilean GAAP ) to International Financial Reporting Standards (IFRS) as of December 31, 2009
|
|
As of December 31, 2009
|
Profit (loss) of
the parent
|
Profit (loss) of
non-controlling
interests
|
Total profit
or loss
|
|||||||||
|
RECONCILIATION
|
ThUS$
|
ThUS$
|
ThUS$
|
|||||||||
|
Income for the year under Chilean GAAP
|
327,056 | 1,334 | 328,390 | |||||||||
|
Amortization of goodwill
|
2,176 | - | 2,176 | |||||||||
|
Amortization of negative goodwill
|
(206 | ) | - | (206 | ) | |||||||
|
Amortization of deferred tax complementary accounts
|
2,151 | - | 2,151 | |||||||||
|
Depreciation
|
8,598 | 131 | 8,729 | |||||||||
|
Recognition of actuarial calculation of accrual for employee termination benefits
|
(19 | ) | 28 | 9 | ||||||||
|
Deferred taxes on IFRS adjustments
|
(1,459 | ) | (27 | ) | (1,486 | ) | ||||||
|
Effect of transition to IFRS at the date of the most recent annual financial statements
|
11,241 | 132 | 11,373 | |||||||||
|
Income for the year under IFRS
|
338,297 | 1,466 | 339,763 | |||||||||
|
Other income and expenses with a debit or credit in net equity:
|
||||||||||||
|
Foreign currency tranalation difference gain (loss), before tax
|
1,234 | 501 | 1,735 | |||||||||
|
Cash flow hedge gain (loss), before tax
|
(112 | ) | - | (112 | ) | |||||||
|
Other comprehensive income before tax, defined plan actuarial gain (loss)
|
- 1,130 | - | 1,130 | |||||||||
|
Tax effect of cash flow hedge of other comprehensive income items
|
19 | - | 19 | |||||||||
|
Other comprehensive income
|
2,271 | 501 | 2,772 | |||||||||
|
Comprehensive income for the period under IFRS
|
340,568 | 1,967 | 342,535 | |||||||||
|
|
d)
|
Reconciliation of Statement of cash flows from Generally Accepted Accounting Principles (Chilean GAAP) to International Financial Reporting Standards (IFRS) as of December 31, 2009:
|
|
As of December 31, 2009
|
Cash and Cash
equivalents
|
|||
|
RECONCILIATION
|
ThUS$
|
|||
|
Cash and cash equivalents under Chilean GAAP
|
530,394 | |||
|
Investments with purchased maturities in excess of ninety days
|
(154,755 | ) | ||
|
Effect of transition to IFRS
|
(154,755 | ) | ||
|
Cash and cash equivalents under IFRS
|
375,639 | |||
F-43
Notes to the consolidated Financial Statements as of December 31, 2010
(Translation of consolidated financial statements originally issued in Spanish – see Note 2.2)
Note 3 - First-time adoption of International Financial Reporting Standards (IFRS) (continued)
Explanation of adjustments for the effects of transition to IFRS
Explanations of the reconciliation adjustments included in the preceding tables are as follows:
|
(a)
|
Deferred income taxes
|
As described in Note 2.13, under IFRS the Company must recognize the effects of deferred income taxes for all temporary differences existing between the tax and book balances based on the liability method.
Although the method established in IAS 12 is similar to Chilean GAAP, the Company made the following adjustments in accordance with IFRS requirements:
|
|
i)
|
The elimination of "deferred tax complementary accounts” in which the Company deferred the effects on shareholders’ equity of the first-time application of Technical Bulletin No. 60 issued by the Chilean Association of Accountants.
|
|
|
ii)
|
The Company determined a complementary deffered taxes for those items which were affected by the reconciliation from Chilean GAAP.
|
|
(b)
|
Revaluation of property, plant and equipment at fair value as deemed cost
|
For the adoption of IFRS, the Company valued certain property, plant and equipment items (mainly machinery and equipment) at their fair value in conformity with the exemption contained in IFRS 1. The revaluation was performed only once in accordance with IFRS 1. The new value determined relates to the initial cost of the asset beginning on the transition date. This fair value of assets amounted to ThUS$60,458 as of January 1, 2009 and represented a decrease in the value of the equipment (and ThUS equity) of ThUS$54,366 as of that date. This decrease is not representative of impairment of the previous Chilean GAAP carrying value as such asset carrying values were supported as of December 31, 2008 by the projected future undiscounted cash flows to be derived from such assets.
F-44
Notes to the consolidated Financial Statements as of December 31, 2010
(Translation of consolidated financial statements originally issued in Spanish – see Note 2.2)
Note 3 - First-time adoption of International Financial Reporting Standards (IFRS) (continued)
|
(c)
|
Minimum dividend
|
In accordance with Chilean GAAP, dividends for distribution are recorded in the Company’s financial statements at the time of the agreement at the Shareholders’ or Board of Directors’ Meeting. Law No. 18,046 on Public Corporations establishes in its article No. 79 that public corporations will have to distribute at least 30% of profit for the year as dividends to its shareholders, unless the shareholders of shares issued with voting rights at the Shareholders' Meeting unanimously agree otherwise. Under IFRS, the Company has recorded the obligation on an accrual basis, net of interim dividends which would have been agreed upon at the closing date for 30% of profit for the year, which is the legal minimum percentage. As of December 31, 2009, the interim dividend distributed during November covers this minimum dividend and therefore, no accrual was required.
|
(d)
|
Non-controlling interest
|
Chilean GAAP, applied for the preparation of the consolidated financial statements, recognized the interest of minority shareholders in the equity of subsidiaries as a separate account between liabilities and net equity in the Company’s consolidated statement of financial position. Likewise, the consolidated financial statements for the year under Chilean GAAP excluded through a specific line non-controlling interests in net profit or loss of subsidiaries. Under IFRS, non-controlling interest are a part of the economic conglomerate or group and; therefore, their interest is considered part of the statement of changes in equity and the statement of income.
|
(e)
|
Derivative hedging
|
The Company maintains as hedging instruments those financial derivatives associated with obligations with the public (bonds payable) issued in UF and in Chilean pesos. Under IFRS, changes generated in the fair value of derivatives which are designated and qualified as hedges, for their effective component, are recognized in other comprehensive income as part of the equity. The gain or loss relative to the non-effective part of the hedging is immediately recognized in the statement of income under "Other gains / losses." This represents a change with respect to Chilean GAAP, where realized gains or losses for this concept were recognized in non-operating income, whereas unrealized gains or losses related to changes in the fair value of derivative instruments in cash flow hedging were deferred in asset and liability accounts without affecting income up to the settlement of hedged and hedging entries.
|
(f)
|
Actuarial employee termination benefits
|
IFRS require that the benefits of defined services defined to employees in the long-term are determined in consideration of the application of an actuarial calculation model. This accounting generates a difference with respect to the methodology applied previously, which primarily considered present values.
F-45
Notes to the consolidated Financial Statements as of December 31, 2010
(Translation of consolidated financial statements originally issued in Spanish – see Note 2.2)
|
(g)
|
Negative goodwill
|
IFRS does not contemplate the recognition in the consolidated statement of financial position of negative goodwill at the date of a business combination, instead recognizing this difference directly in income. Under Chilean GAAP this was presented as a deduction of assets. Accordingly, the existing balance of negative goodwill was transferred to retained earnings..
|
(h)
|
Goodwill
|
Under IFRS, the Company has considered goodwill as an intangible asset of indefinite useful life. At least once a year, the cash generating unit that gave rise to goodwill is assessed for possible impairment. If there is any evidence of impairment, goodwill is initially adjusted with a charge to income. For first-time adoption purposes, the Company reversed the amortization of goodwill subsequent to 2004 which was recorded under Chilean GAAP.
|
(i)
|
Reconciliation of cash flows for the year ended December 31, 2009
|
In accordance with IAS 7, investments with purchased maturities in excess of three months are not considered cash equivalents. Under Chilean GAAP, cash equivalents included short term investments that are regularly made by the company in managing the cash surplus and intended for conversion in a term not exceeding 90 days from the closing date of the financial statements.
|
4.1
|
Risk management policy
|
The Risk Management Policy of the company is oriented towards safeguarding its stability and sustainability in relation to all such relevant financial uncertainty components.
The operations of the Company are subject to certain risk factors that may affect the financial position or results of operations. Among these risks, the most relevant are market risk, liquidity risk, foreign exchange rate risk, doubtful accounts risk, and interest rate risk.
There may be additional risks that might also affect the commercial operations, the business, the financial position or the operations of the Company, but at this time they are not considered significant.
The financial risk management structure includes identifying, determining, analyzing, quantifying, measuring and controlling these events. Management, in particular the Finance Management, is responsible for constantly assessing the financial risk. The Company uses derivatives to cover a significant portion of these risks.
F-46
Notes to the consolidated Financial Statements as of December 31, 2010
(Translation of consolidated financial statements originally issued in Spanish – see Note 2.2)
Note 4 - Financial Risk Management, Objectives and Policies (continued)
4.2 Risk factors
4.2.1 Market risk
Market risks are those uncertainties associated with fluctuations of market variables that affect the assets and liabilities of the Company, such as:
|
a)
|
Country risk
|
The economic position of the countries where the Company has a presence may affect its financial position. For example, the sales carried out in emerging markets expose the Company to risks related to economic conditions and trends in those countries. On the other hand, inventory may also be affected by the economic situation of these countries and/ or the global economy, amongst other probable economic impacts.
|
b)
|
Price volatility risk
|
The prices of the Company’s products are affected by the fluctuations of the international prices of fertilizers and chemical products and changes in productive capacities or market demand, all of which might affect the Company’s business, financial position and operating income.
|
c)
|
Commodities price risk
|
The Company is exposed to changes in the prices of raw materials and energy, which may have an impact on its production costs, ThUS giving rise to instability in the results.
At present, the Company has a direct annual expense close to US$70 million on account of fuel and close to US$50 million on account of electricity. Variations of 10% in the prices of energy the Company requires to operate, may involve in the short term movements in costs amounting to US$12 million.
Doubtful accounts risk
As occurred in the last global financial crisis, the contraction of the global economy and the potentially negative effects on the financial position of the Company’s clients may extend the accounts receivable collection time, increasing the Company’s exposure to doubtful accounts. While measures have been taken in order to minimize risk, the global economy may trigger losses that might have a material adverse effect on the business, financial position or the results of the Company’s operations.
As a way to mitigate these risks, the Company actively controls debt collection and uses measures such as loan insurance, letters of credit, and advance payments with regard to some accounts receivable.
F-47
Notes to the consolidated Financial Statements as of December 31, 2010
(Translation of consolidated financial statements originally issued in Spanish – see Note 2.2)
Note 4 - Financial Risk Management, Objectives and Policies (continued)
4.2 Risk factors (continued)
4.2.2 Foreign exchange risk
As a result of the influence in the price determination, of its relationship with sales costs, and since a significant part of the business of the Company is carried out in that foreign currency, the functional currency of the Company is the U.S. dollar. However, the global business activities of the Company expose it to the foreign exchange fluctuations of several currencies with respect to the US dollar. Therefore, the Company has hedge contracts to insure its main mismatches (assets net of liabilities) in currencies other than the US dollar against the foreign exchange fluctuation. Those contracts are periodically up-dated depending upon the mismatch amount to be covered in these currencies.
A significant portion of the Company’s costs is related to the Chilean peso. Therefore, an increase or decrease in the foreign exchange rate between the Chilean peso and the US dollar would affect its costs. US$300 to US$350 million of the Company’s costs, especially payroll, relate to the Chilean peso, which are hedged by derivative instruments that cover currency fluctuations.
As of December 31, 2009 the Company had derivative instruments classified as foreign exchange risk and interest rate hedged associated with the total bond obligations in both Chilean pesos and UF (units indexed by inflation), for a fair value of US$51.3 million. As of December 31, 2010 this sum amounts to US$ 97.5 million, both in favor of the Company.
|
4.2.3
|
Interest rate risk
|
Interest rate fluctuations, due to the uncertain future behavior of markets, may have a material impact on the financial results of the Company.
The Company has short and long term debts valued at LIBOR plus a spread. As the Company does not have derivative instruments to cover LIBOR fluctuations, the Company is subject to the fluctuations of that rate.
As of December 31, 2010 approximately 20% of the Company’s financial obligations included current portion valued at LIBOR, therefore significant increases in the rate may impact its financial position. A 100 point variation on this rate may trigger variations in the financial expenses close to US$2.5 million per year; however, this effect is significantly counterbalanced by the returns of the Company’s investments that also relate to LIBOR.
In addition, the Company has over the total financial debt as of December 31, 2010 a percentage close to 15% with short term maturity, ThUS reducing the exposure to interest rate fluctuations.
F-48
Notes to the consolidated Financial Statements as of December 31, 2010
(Translation of consolidated financial statements originally issued in Spanish – see Note 2.2)
4.2 Risk factors (continued)
|
4.2.4
|
Liquidity risk
|
Liquidity risk is related to the fund requirements to comply with payment obligations. The object of the Company is to keep financial flexibility by comfortably balancing the fund requirements and the flows from the regular business conduct, bank loans, public bonds, short term investments, and negotiable instruments, amongst others.
The Company has a relevant capital expense program that is subject to risks and uncertainties. Mostly the exploration and exploitation of reserves, mining and processing costs, and compliance with the applicable regulations require important capital expenses, which are subject to variations in time.
On the other hand, world financial markets go through contraction and expansion periods that are not foreseeable in the long term and may affect the Company’s access to financial resources. These factors may have a material adverse impact on the business, financial position, and operational results of the Company.
As a result of the foregoing, the Company constantly monitors that its obligations and investments match, taking care as part of its financial risk management strategy of the obligations and investments maturities from a conservative perspective. As of December 31, 2010 the Company had committed bank lines amounting to US$657 million and not committed bank lines amounting to US$40 million, in the event additional resources were needed.
The position in other cash and cash equivalents so generated by the Company is invested in highly liquid mutual funds which risk classification is AAA.
|
4.3
|
Risk measurement
|
The Company has methods to measure the effectiveness and efficiency of risk strategies, both prospectively and retrospectively. Those methods are consistent with the risk management profile of the Group.
|
5.1
|
Changes in accounting estimates
|
There are no changes in accounting estimates as of the closing date of the consolidated financial statements.
F-49
Notes to the consolidated Financial Statements as of December 31, 2010
(Translation of consolidated financial statements originally issued in Spanish – see Note 2.2)
|
5.2
|
Changes in accounting policies
|
As of December 31, 2010, the Company’s consolidated financial statements present no changes in accounting policies or estimates compared to the prior period or the transaction date, except for the application of IFRSbeginning on January 1, 2010.
Changes in policies and accounting estimates compared to local accounting principles and their effects were described in Note 3: Transition to International Financial Reporting Standards (IFRS).
The consolidated classified statements of financial position as of December 31, 2010 and 2009 and as of January 1, 2009 and the statements of income, comprehensive income, equity and cash flows for the year ended December 31, 2010 have been prepared in accordance with IFRS, and accounting principles and criteria have been applied consistently.
|
6.1
|
Types of cash and cash equivalents
|
As of December 31, 2010 and 2009, and as of January 1, 2009, cash and cash equivalents are detailed as follows:
|
12.31.2010
|
12.31.2009
|
01.01.2009
|
||||||||||
|
Cash and cash equivalents
|
ThUS$
|
ThUS$
|
ThUS$
|
|||||||||
|
Cash on hand
|
83 | 96 | 2,845 | |||||||||
|
Bank balances
|
24,267 | 19,121 | 18,773 | |||||||||
|
Short-term time deposits
|
375,057 | 181,680 | 96,269 | |||||||||
|
Other cash and cash equivalents
|
125,245 | 174,742 | 165,689 | |||||||||
|
Cash and cash equivalents
|
524,652 | 375,639 | 283,576 | |||||||||
|
6.2
|
Other cash and cash equivalents
|
As of December 31, 2010, 2009, and January 1, 2009, other cash and cash equivalents relate to mutual fund units for investments made in:
|
Institution
|
12.31.2010
ThUS$
|
12.31.2009
ThUS$
|
01.01.2009
ThUS$
|
|||||||||
|
Legg Mason Western Asset Management Co.
|
52,576 | 59,224 | 56,384 | |||||||||
|
BlackRock Cash Management Plc
|
36,712 | 59,070 | 55,760 | |||||||||
|
JP Morgan Asset Management
|
35,957 | 56,334 | 53,545 | |||||||||
|
Citibank
|
- | 114 | - | |||||||||
|
Total
|
125,245 | 174,742 | 165,689 | |||||||||
These other cash equivalents are highly liquid fund manager accounts that are basically invested in short-term fixed rate notes in the U.S. market, consistent with money market accounts.
F-50
Notes to the consolidated Financial Statements as of December 31, 2010
(Translation of consolidated financial statements originally issued in Spanish – see Note 2.2)
|
6.3
|
Information on cash and cash equivalents by currency
|
Cash and cash equivalents are classified by currency as follows:
|
31.12.2010
|
31.12.2009
|
01.01.2009
|
||||||||||
|
Original currency
|
ThUS$
|
ThUS$
|
ThUS$
|
|||||||||
|
Chilean Peso
|
331,011 | 104,925 | 99 | |||||||||
|
US Dollar
|
176,703 | 263,207 | 270,954 | |||||||||
|
Euro
|
6,784 | 3,813 | 7,676 | |||||||||
|
Mexican Peso
|
102 | 218 | 809 | |||||||||
|
South African Rand
|
8,776 | 2,586 | 2,574 | |||||||||
|
Japanese Yen
|
1,192 | 823 | 1,096 | |||||||||
|
Dirham
|
- | - | 176 | |||||||||
|
Peruvian Sol
|
13 | 26 | 175 | |||||||||
|
Argentinean Peso
|
- | 1 | 3 | |||||||||
|
Brazilian Real
|
21 | 33 | 4 | |||||||||
|
Chinese Yuan
|
40 | - | - | |||||||||
|
Indonesian rupee
|
5 | 5 | 4 | |||||||||
|
Pound sterling
|
5 | 2 | 6 | |||||||||
|
Totales
|
524,652 | 375,639 | 283,576 | |||||||||
|
6.4
|
Amount of significant restricted (unavailable) cash balances
|
Cash on hand and in current bank accounts are available resources, and their carrying value is equal to their fair value.
As of December 31, 2010, December 31, 2009 and January 1, 2009, the Company has no significant cash balances with any type of restriction.
F-51
Notes to the consolidated Financial Statements as of December 31, 2010
(Translation of consolidated financial statements originally issued in Spanish – see Note 2.2)
Note 6 - Cash and Cash Equivalents (continued)
6.5 Detail of time deposits
Cash and cash equivalents in time deposits at each year-end are detailed as follows:
|
Receiver of the deposit
|
Type of
Deposit
|
Original Currency
|
Interest
rate
|
Placement
date
|
Expiration
date
|
Principal
ThUS$
|
Interest
accrued to-
date ThUS$ |
12.31.2010
ThUS$
|
12.31.2009
ThUS$
|
01.01.2009
ThUS$
|
||||||||||||||||||||||||||
|
Banco Crédito e Inversiones
|
Fixed term
|
Chilean pesos
|
0.35 | 11-03-2010 | 02-01-2011 | 26,224 | 177 | 26,401 | 34,865 | 11,015 | ||||||||||||||||||||||||||
|
Banco Crédito e Inversiones
|
Fixed term
|
Chilean pesos
|
0.34 | 11-04-2010 | 02-02-2011 | 4,142 | 26 | 4,168 | - | - | ||||||||||||||||||||||||||
|
Banco Crédito e Inversiones
|
Fixed term
|
Chilean pesos
|
0.34 | 12-06-2010 | 03-04-2011 | 6,719 | 19 | 6,738 | - | - | ||||||||||||||||||||||||||
|
Banco Crédito e Inversiones
|
Fixed term
|
Chilean pesos
|
0.36 | 12-14-2010 | 03-14-2011 | 10,552 | 22 | 10,574 | - | - | ||||||||||||||||||||||||||
|
Banco Crédito e Inversiones
|
Fixed term
|
Chilean pesos
|
0.35 | 12-16-2010 | 02-17-2011 | 10,132 | 18 | 10,150 | - | - | ||||||||||||||||||||||||||
|
Banco Crédito e Inversiones
|
Fixed term
|
Chilean pesos
|
0.35 | 12-16-2010 | 03-16-2011 | 10,336 | 19 | 10,355 | - | - | ||||||||||||||||||||||||||
|
Banco de Chile
|
Fixed term
|
Chilean pesos
|
0.32 | 10-07-2010 | 01-05-2011 | 20,594 | 187 | 20,781 | 69,201 | 10,022 | ||||||||||||||||||||||||||
|
Banco de Chile
|
Fixed term
|
Chilean pesos
|
0.33 | 10-28-2010 | 01-26-2011 | 15,943 | 113 | 16,056 | - | - | ||||||||||||||||||||||||||
|
Banco de Chile
|
Fixed term
|
Chilean pesos
|
0.33 | 10-29-2010 | 01-27-2011 | 15,723 | 109 | 15,832 | - | - | ||||||||||||||||||||||||||
|
Banco de Chile
|
Fixed term
|
Chilean pesos
|
0.29 | 11-26-2010 | 01-07-2011 | 20,891 | 71 | 20,962 | - | - | ||||||||||||||||||||||||||
|
Banco de Chile
|
Fixed term
|
Chilean pesos
|
0.30 | 12-03-2010 | 01-03-2011 | 7,251 | 20 | 7,271 | - | - | ||||||||||||||||||||||||||
|
Banco de Chile
|
Fixed term
|
Chilean pesos
|
0.33 | 12-27-2010 | 01-26-2011 | 20,297 | 9 | 20,306 | - | - | ||||||||||||||||||||||||||
|
Banco de Chile
|
Fixed term
|
Chilean pesos
|
0.24 | 12-30-2010 | 01-14-2011 | 1,667 | - | 1,667 | - | - | ||||||||||||||||||||||||||
|
Banco Estado
|
Fixed term
|
US Dollar
|
0.70 | 12-29-2010 | 01-13-2011 | 17,000 | 1 | 17,001 | - | - | ||||||||||||||||||||||||||
|
Banco Santander-Santiago
|
Fixed term
|
Chilean pesos
|
0.31 | 10-22-2010 | 01-20-2011 | 10,423 | 76 | 10,499 | 50,006 | 24,229 | ||||||||||||||||||||||||||
|
Banco Santander-Santiago
|
Fixed term
|
Chilean pesos
|
0.31 | 10-25-2010 | 01-19-2011 | 15,421 | 107 | 15,528 | - | - | ||||||||||||||||||||||||||
|
Banco Santander-Santiago
|
Fixed term
|
Chilean pesos
|
0.32 | 10-26-2010 | 01-24-2011 | 20,751 | 146 | 20,897 | - | - | ||||||||||||||||||||||||||
|
Banco Santander-Santiago
|
Fixed term
|
Chilean pesos
|
0.32 | 10-26-2010 | 01-24-2011 | 31,530 | 222 | 31,752 | - | - | ||||||||||||||||||||||||||
|
Banco Santander-Santiago
|
Fixed term
|
Chilean pesos
|
0.33 | 11-04-2010 | 02-02-2011 | 6,212 | 39 | 6,251 | - | - | ||||||||||||||||||||||||||
|
Banco Santander-Santiago
|
Fixed term
|
Chilean pesos
|
0.33 | 12-06-2010 | 03-04-2011 | 3,192 | 8 | 3,200 | - | - | ||||||||||||||||||||||||||
|
Banco Santander-Santiago
|
Fixed term
|
US Dollar
|
0.42 | 11-23-2010 | 01-12-2011 | 20,000 | 9 | 20,009 | - | - | ||||||||||||||||||||||||||
|
Banco Security
|
Fixed term
|
Chilean pesos
|
0.32 | 10-20-2010 | 01-18-2011 | 15,892 | 122 | 16,014 | - | - | ||||||||||||||||||||||||||
|
Banco Security
|
Fixed term
|
US Dollar
|
1.30 | 10-25-2010 | 01-19-2011 | 7,000 | 17 | 7,017 | - | - | ||||||||||||||||||||||||||
|
Citibank New - York Inversiones
|
Overnight
|
US Dollar
|
0.03 | 12-31-2010 | 01-03-2011 | 557 | - | 557 | 2,122 | 824 | ||||||||||||||||||||||||||
F-52
Notes to the consolidated Financial Statements as of December 31, 2010
(Translation of consolidated financial statements originally issued in Spanish – see Note 2.2)
6.5 Detail of time deposits (continued)
Cash and cash equivalents in time deposits at each year-end are detailed as follows:
|
Receiver of the deposit
|
Type of
Deposit
|
Original Currency
|
Interest
rate
|
Placement
date
|
Expiration
date
|
Principal
ThUS$
|
Interest
accrued to-date ThUS$
|
12.31.2010
ThUS$
|
12.31.2009
ThUS$
|
01.01.2009
ThUS$
|
||||||||||||||||||||||||||||||
|
Corpbanca
|
Fixed Term
|
Chilean pesos
|
0.34 | 12-06-2010 | 03-03-2010 | 15,513 | 43 | 15,556 | 10,486 | 20,045 | ||||||||||||||||||||||||||||||
|
Corpbanca
|
Fixed Term
|
Chilean pesos
|
0.34 | 12-06-2010 | 03-04-2011 | 5,770 | 16 | 5,786 | - | - | ||||||||||||||||||||||||||||||
|
Corpbanca
|
Fixed Term
|
Chilean pesos
|
0.36 | 12-16-2010 | 03-16-2011 | 4,053 | 7 | 4,060 | - | - | ||||||||||||||||||||||||||||||
|
Corpbanca
|
Fixed Term
|
Chilean pesos
|
0.36 | 12-17-2010 | 03-17-2011 | 8,772 | 14 | 8,786 | - | - | ||||||||||||||||||||||||||||||
|
IDBI Bank
|
Fixed Term
|
Rupee
|
- | 12-31-2010 | 12-31-2011 | 3 | - | 3 | - | - | ||||||||||||||||||||||||||||||
|
Scotiabank Sud Americano
|
Fixed Term
|
Chilean pesos
|
0.30 | 11-24-2010 | 01-25-2011 | 20,803 | 77 | 20,880 | - | |||||||||||||||||||||||||||||||
|
HSBC Bank Chile
|
5,013 | |||||||||||||||||||||||||||||||||||||||
|
Banco BBVA Chile
|
- | - | - | - | - | - | 16,103 | |||||||||||||||||||||||||||||||||
|
Banco Itau Chile
|
- | - | - | - | 9,018 | |||||||||||||||||||||||||||||||||||
|
Deutsche Bank Chile
|
- | - | - | - | - | - | - | - | 15,000 | - | ||||||||||||||||||||||||||||||
|
Total
|
375,057 | 181,680 | 96,269 | |||||||||||||||||||||||||||||||||||||
F-53
Notes to the consolidated Financial Statements as of December 31, 2010
(Translation of consolidated financial statements originally issued in Spanish – see Note 2.2)
Nota 7 - Inventory
The composition of inventory is detailed as follows:
|
Type of inventory
|
12.31.2010
ThUS$
|
12.31.2009
ThUS$
|
01.01.2009
ThUS$
|
|||||||||
|
Raw materials
|
7,120 | 6,491 | 11,144 | |||||||||
|
Supplies for production
|
21,398 | 15,617 | 19,275 | |||||||||
|
Products-in-progress
|
291,536 | 287,712 | 189,555 | |||||||||
|
Finished products
|
285,047 | 320,943 | 320,903 | |||||||||
|
Total
|
605,101 | 630,763 | 540,877 | |||||||||
Inventory reserves recognized as of December 31, 2010 amount to ThUS$63,597, as of December 31, 2009 amounted to ThUS$65,298, and as of January 1, 2009 amounted to ThUS$43,686. Inventory reserves have been made based on a technical study that covers the different variables affecting products in stock (density, humidity, among others.) Additionally, reserves have been recognized for lower prices on the sale of products and inventory difference.
As of December 31, 2010 the sum registred as cost of sale related to inventory in the statement of income amounts to ThUS$902,961 and as of December 31, 2009 to ThUS$615,755.
The breakdowns of inventory reserves are detailed as follows:
|
Type of Inventory
|
12.31.2010
ThUS$
|
12.31.2009
ThUS$
|
01.01.2009
ThUS$
|
|||||||||
|
Raw materials reserves
|
1,093 | 93 | 93 | |||||||||
|
Supplies for production reserves
|
- | 1,580 | 1,900 | |||||||||
|
Products-in-progress reserves
|
43,115 | 46,228 | 27,599 | |||||||||
|
Finished products reserves
|
19,389 | 18,027 | 14,094 | |||||||||
|
Total
|
63,597 | 65,928 | 43,686 | |||||||||
The Company has not delivered inventory as collateral for the periods indicated above.
|
8.1
|
Related party disclosures
|
Balances pending at each period-end are not guaranteed, accrue no interest and are settled in cash. No guarantees have been delivered or received for trade and other accounts receivable from related parties or trade and other accounts payable to related parties. For the year ended December 31, 2010, the Company has not recorded any impairment in accounts receivable related to amounts owed by related parties. This evaluation is conducted every year through an examination of the financial position of the related party in the market in which it operates.
F-54
Notes to the consolidated Financial Statements as of December 31, 2010
(Translation of consolidated financial statements originally issued in Spanish – see Note 2.2)
Note 8 - Related Party Disclosures (continued)
|
8.2
|
Relationships between the parent company and the entity
|
According to the Company’s by-laws., no shareholder can own more than 32% of the Company’s voting shares.
Sociedad de Inversiones Pampa Calichera S.A. and Global Mining Investments (Chile) S.A., collectively the Pampa Group, are the owners of a number of shares that are equivalent to 29.69% of the current total amount of shares issued, subscribed and paid of the Company. In addition, Kowa Company Ltd., Inversiones La Esperanza (Chile) Limitada, Kochi S.A. and La Esperanza Delaware Corporation, collectively the Kowa Group, are the owners of a number of shares equivalent to 2.08% of the total amount of shares of SQM S.A. issued, subscribed and paid.
The Pampa Group and the Kowa Group have informed the Company, the Chilean SVS and the pertinent stock exchanges in Chile and abroad that they are not and have never been related parties.. In addition, this assertion is regardless of the fact that both Groups on December 21, 2006 subscribed to a joint venture agreement with respect to those shares. Consequently, such parties assert that the Pampa Group, by itself, does not concentrate more than 32% of the voting rights capital of the Company, and the Kowa Group does not concentrate by itself more than 32% of the voting rights capital of SQM S.A.
Detail of effective concentration
|
Taxpayer ID
|
Company name
|
Ownership
percentage %
|
||||
|
96.511.530-7
|
Sociedad de Inversiones Pampa Calichera S.A.
|
24.45 | ||||
|
96.863.960-9
|
Global Mining Investments (Chile) S.A.
|
5.24 | ||||
|
Total Pampa Group
|
29.69 | |||||
|
79.798.650-k
|
Inversiones la Esperanza (Chile) Ltda.
|
1.40 | ||||
|
59.046.730-8
|
Kowa Co Ltd.
|
0.30 | ||||
|
96.518.570-4
|
Kochi S.A.
|
0.29 | ||||
|
59.023.690-k
|
La Esperanza Delaware Corporation
|
0.09 | ||||
|
Total Kowa Group
|
2.08 | |||||
|
8.3
|
Intermediate parent company and companies controlled by SQM S.A. that publicly issue financial statements
|
The following intermediate parent companies prepare public financial statements:
Soquimich Comercial S.A.
F-55
Notes to the consolidated Financial Statements as of December 31, 2010
(Translation of consolidated financial statements originally issued in Spanish – see Note 2.2)
Note 8 - Related Party Disclosures (continued)
|
8.4
|
Detailed identification of the link between the parent company and the subsidiary as of December 31, 2010 and 2009
|
|
Interest percentage in subsidiary
12.31.2010 and 12.31.2009
|
||||||||||||
|
Subsidiary
|
Direct
%
|
Indirect
%
|
Total
%
|
|||||||||
|
Comercial Hydro S.A.
|
0.0000 | 60.3820 | 60.3820 | |||||||||
|
SQM Potasio S.A.
|
99.9974 | 0.0000 | 99.9974 | |||||||||
|
SQM Nitratos S.A.
|
99.9999 | 0.0001 | 100.0000 | |||||||||
|
Ajay SQM Chile S.A.
|
51.0000 | 0.0000 | 51.0000 | |||||||||
|
SQMC Internacional Ltda.
|
0.0000 | 60.6382 | 60.6382 | |||||||||
|
SQM Industrial S.A.
|
99.9954 | 0.0046 | 100 .0000 | |||||||||
|
Isapre Norte Grande Ltda.
|
1.0000 | 99.0000 | 100.0000 | |||||||||
|
Almacenes y Depósitos Ltda.
|
1.0000 | 99.0000 | 100.0000 | |||||||||
|
Serv. Integrales de Tránsitos y Transferencias S.A.
|
0.0003 | 99.9997 | 100.0000 | |||||||||
|
Soquimich Comercial S.A.
|
0.0000 | 60.6383 | 60.6383 | |||||||||
|
SQM Salar S.A.
|
18.1800 | 81.8200 | 100.0000 | |||||||||
|
Minera Nueva Victoria S.A.
|
99.0000 | 1.0000 | 100.0000 | |||||||||
|
Proinsa Ltda.
|
0.0000 | 60.5800 | 60.5800 | |||||||||
|
Sociedad Prestadora de Servicios de Salud Cruz del Norte S.A.
|
0.0000 | 100.0000 | 100.0000 | |||||||||
|
Exploraciones Mineras S.A.
|
0.2691 | 99.7309 | 100.0000 | |||||||||
|
Nitratos Naturais Do Chile Ltda.
|
0.0000 | 100.0000 | 100.0000 | |||||||||
|
Nitrate Corporation of Chile Ltd.
|
0.0000 | 100.0000 | 100.0000 | |||||||||
|
SQM North America Corporation.
|
40.0000 | 60.0000 | 100.0000 | |||||||||
|
SQM Europe N.V.
|
0.8600 | 99.1400 | 100.0000 | |||||||||
|
Soquimich SRL Argentina
|
0.0000 | 100.0000 | 100.0000 | |||||||||
|
Soquimich European Holding B.V.
|
0.0000 | 100.0000 | 100.0000 | |||||||||
|
SQM Corporation N.V.
|
0.0001 | 99.9999 | 100.0000 | |||||||||
F-56
Notes to the consolidated Financial Statements as of December 31, 2010
(Translation of consolidated financial statements originally issued in Spanish – see Note 2.2)
Note 8 - Related Party Disclosures (continued)
|
8.4
|
Detailed identification of the link between the parent company and the subsidiary as of December 31, 2010 and December 31, 2009 (continued)
|
|
Interest percentage in subsidiary
12.31.2010 and 12.31.2009
|
||||||||||||
|
Subsidiary
|
Direct
%
|
Indirect
%
|
Total
%
|
|||||||||
|
SQI Corporation N.V.
|
0.0159 | 99.9841 | 100.0000 | |||||||||
|
SQM Comercial de México S.A. de C.V.
|
1.0000 | 99.0000 | 100.0000 | |||||||||
|
North American Trading Co.
|
0.0000 | 100.0000 | 100.0000 | |||||||||
|
Administración y Servicios Santiago S.A. de C.V.
|
0.0200 | 99.9800 | 100.0000 | |||||||||
|
SQM Perú S.A.
|
0.9800 | 99.0200 | 100.0000 | |||||||||
|
SQM Ecuador S.A.
|
0.0040 | 99.9960 | 100.0000 | |||||||||
|
SQM Nitratos México S.A.
|
0.0000 | 51.0000 | 51.0000 | |||||||||
|
SQMC Holding Corporation L.L.P.
|
0.1000 | 99.9000 | 100.0000 | |||||||||
|
SQM Investment Corporation N.V.
|
1.0000 | 99.0000 | 100.0000 | |||||||||
|
SQM Brasil Limitada.
|
2.7900 | 97.2100 | 100.0000 | |||||||||
|
SQM France S.A.
|
0.0000 | 100.0000 | 100.0000 | |||||||||
|
SQM Japan Co Ltd.
|
1.0000 | 99.0000 | 100.0000 | |||||||||
|
Royal Seed Trading A.V.V.
|
1.6700 | 98.3300 | 100.0000 | |||||||||
|
SQM Oceania Pty Limited.
|
0.0000 | 100.0000 | 100.0000 | |||||||||
|
Rs Agro Chemical Trading A.V.V.
|
98.3300 | 1.6700 | 100.0000 | |||||||||
|
SQM Indonesia S.A.
|
0.0000 | 80.0000 | 80 .0000 | |||||||||
|
SQM Virginia L.L.C.
|
0.0000 | 100.0000 | 100.0000 | |||||||||
|
SQM Venezuela S.A.
|
0.0000 | 100.0000 | 100.0000 | |||||||||
|
SQM Italia SRL
|
0.0000 | 100.0000 | 100.0000 | |||||||||
|
Comercial Caiman Internacional S.A.
|
0.0000 | 100.0000 | 100.0000 | |||||||||
|
SQM Africa Pty.Ltd.
|
0.0000 | 100.0000 | 100.0000 | |||||||||
|
SQM Lithium Specialties LLP.
|
0.0000 | 100.0000 | 100.0000 | |||||||||
|
Fertilizantes Naturales S.A.
|
0.0000 | 66.6700 | 66.6700 | |||||||||
|
Iodine Minera B.V.
|
0.0000 | 100.0000 | 100.0000 | |||||||||
|
SQM Agro India Pvt. Ltd.
|
0.0000 | 100.0000 | 100.0000 | |||||||||
|
SQM Beijin Comercial Co. Ltd.
|
0.0000 | 100.0000 | 100.0000 | |||||||||
|
Agrorama Callegari Ltda.
|
0.0000 | 42.4466 | 42.4466 | |||||||||
|
8.5
|
Detail of related parties and transactions with related parties
|
Transactions between the parent company and its subsidiaries are part of the Company's common transactions. In addition, these have been eliminated in consolidation and are not detailed in this note.
F-57
Notes to the consolidated Financial Statements as of December 31, 2010
(Translation of consolidated financial statements originally issued in Spanish – see Note 2.2)
Note 8 - Related Party Disclosures (continued)
|
8.5
|
Detail of related parties and transactions with related parties (continued)
|
|
Taxpayer ID
|
Company
|
Relationship
|
Original
country
|
Transaction
|
12.31.2010
ThUS$
|
12.31.2009
ThUS$
|
||||||||||
|
Foreign
|
Doktor Tarsa Tarim Sanayi As
|
Associate
|
Turkey
|
Product Sales
|
12,460 | 11,030 | ||||||||||
|
Foreign
|
Ajay Europe S.A.R.L.
|
Associate
|
France
|
Product Sales
|
22,150 | 11,899 | ||||||||||
|
Foreign
|
Ajay Europe S.A.R.L.
|
Associate
|
France
|
Dividends
|
628 | - | ||||||||||
|
Foreign
|
Ajay North America LLC.
|
Associate
|
United States
|
Product Sales
|
35,502 | 13,839 | ||||||||||
|
Foreign
|
Ajay North America LLC.
|
Associate
|
United States
|
Dividends
|
- | 453 | ||||||||||
|
Foreign
|
Abu Dhabi Fertilizer Industries WWL
|
Associate
|
United Arab Emirates
|
Product Sales
|
12,384 | 7,385 | ||||||||||
|
Foreign
|
Abu Dhabi Fertilizer Industries WWL
|
Associate
|
United Arab Emirates
|
Interest Income
|
- | 54 | ||||||||||
|
Foreign
|
Kowa Company Ltd.
|
Other related party
|
Japan
|
Product Sales
|
94,611 | 59,233 | ||||||||||
|
Foreign
|
Kowa Company Ltd.
|
Other related party
|
Japan
|
Services Sales
|
- | 185 | ||||||||||
|
Foreign
|
NU3 B.V.
|
Associate
|
The Netherlands
|
Product Sales
|
12,921 | - | ||||||||||
|
Foreign
|
NU3 B.V.
|
Associate
|
The Netherlands
|
Services Sales
|
102 | - | ||||||||||
|
Foreign
|
NU3 N.V.
|
Associate
|
Belgium
|
Product Sales
|
12,590 | - | ||||||||||
|
Foreign
|
SQM Thailand Co.Ltd.
|
Associate
|
Thailand
|
Product Sales
|
1,613 | 1,716 | ||||||||||
|
Foreign
|
Misr Speciality Fertilizers
|
Associate
|
Egypt
|
Product Sales
|
502 | 170 | ||||||||||
|
Foreign
|
Nutrisi Holding N.V.
|
Associate
|
Belgium
|
Interest Income
|
- | 10,825 | ||||||||||
|
Foreign
|
Nutrisi Holding N.V.
|
Associate
|
Belgium
|
Product Sales
|
- | 10,223 | ||||||||||
|
Foreign
|
Nutrisi Holding N.V.
|
Associate
|
Belgium
|
Services Sales
|
- | 106 | ||||||||||
|
77.557.430-5
|
Sales de Magnesio Ltda
|
Associate
|
Chile
|
Product Sales
|
834 | 908 | ||||||||||
|
77.557.430-5
|
Sales de Magnesio Ltda
|
Associate
|
Chile
|
Dividends
|
- | 385 | ||||||||||
|
77.557.430-5
|
Sales de Magnesio Ltda
|
Associate
|
Chile
|
Services Sales
|
353 | 270 | ||||||||||
|
78.062.420-5
|
Minera Saskatchewan Ltda ( PCS )
|
Other related party
|
Chile
|
Product Sales
|
- | 34,949 | ||||||||||
|
78.062.420-5
|
Minera Saskatchewan Ltda ( PCS )
|
Other related party
|
Chile
|
Services Sales
|
423 | 540 | ||||||||||
F-58
Notes to the consolidated Financial Statements as of December 31, 2010
(Translation of consolidated financial statements originally issued in Spanish – see Note 2.2)
Note 8 - Related Party Disclosures (continued)
|
8.6
|
Trade and other accounts receivable from related parties, current
|
|
12.31.2010
|
12.31.2009
|
01.01.2009
|
||||||||||||||||||
|
Taxpayer ID
|
Company
|
Relationship
|
Country
|
Currency
|
ThUS$
|
ThUS$
|
ThUS$
|
|||||||||||||
|
77.557.430-5
|
Sales de Magnesio Ltda.
|
Associate
|
Chile
|
US Dollar
|
106 | 292 | 143 | |||||||||||||
|
96.511.530-7
|
Soc.de Inversiones Pampa Calichera
|
Other related party
|
Chile
|
US Dollar
|
8 | 8 | 8 | |||||||||||||
|
78.062.420-5
|
Minera Saskatchewan Ltda.
|
Other related party
|
Chile
|
US Dollar
|
- | 32,588 | - | |||||||||||||
|
79.049.778-9
|
Callegari Agrícola S.A.
|
Other related party
|
Chile
|
Chilean peso
|
6 | - | - | |||||||||||||
|
Foreign
|
Doktor Tarsa Tarim Sanayi AS
|
Associate
|
Turkey
|
US Dollar
|
- | 7,304 | 13,641 | |||||||||||||
|
Foreign
|
Nutrisi Holding N.V.
|
Associate
|
Belgium
|
Euro
|
1,618 | 1,741 | 1,702 | |||||||||||||
|
Foreign
|
Ajay Europe S.A.R. L.
|
Associate
|
France
|
US Dollar
|
2,043 | 1,492 | 4,061 | |||||||||||||
|
Foreign
|
Ajay North America LLC.
|
Associate
|
United states
|
US Dollar
|
2,666 | 2,914 | 2,520 | |||||||||||||
|
Foreign
|
Abu Dhabi Fertilizer Industries WWL
|
Associate
|
United Arab Emirates
|
US Dollar
|
4,517 | 3,546 | 6,579 | |||||||||||||
|
Foreign
|
NU3 B.V.
|
Associate
|
The Netherlands
|
Euro
|
1,083 | 1,883 | 772 | |||||||||||||
|
Foreign
|
Misr Speciality Fertilizers
|
Associate
|
Egypt
|
US Dollar
|
335 | 289 | 632 | |||||||||||||
|
Foreign
|
Kowa Company Ltd.
|
Other related party
|
Japan
|
US Dollar
|
23,134 | 15,764 | 18,170 | |||||||||||||
|
Foreign
|
SQM Thailand Co. Ltd.
|
Associate
|
Thailand
|
US Dollar
|
656 | 835 | - | |||||||||||||
|
Foreign
|
SQM Agro India
|
Subsidiary
|
India
|
US Dollar
|
- | - | 595 | |||||||||||||
|
Foreign
|
SQM East Med Turkey
|
Associate
|
Turkey
|
US Dollar
|
- | - | 1,075 | |||||||||||||
|
Foreign
|
NU3 N.V.
|
Associate
|
Belgium
|
Euro
|
- | - | 1,129 | |||||||||||||
|
Total
|
36,172 | 68,656 | 51,027 | |||||||||||||||||
F-59
Notes to the consolidated Financial Statements as of December 31, 2010
(Translation of consolidated financial statements originally issued in Spanish – see Note 2.2)
Note 8 - Related Party Disclosures (continued)
|
8.7
|
Trade and other accounts receivable from related parties, non-current
|
|
12.31.2010
|
12.31.2009
|
01.01.2009
|
||||||||||||||||||
|
Taxpayer ID
|
Company
|
Relationship
|
Country
|
Currency
|
ThUS$
|
ThUS$
|
ThUS$
|
|||||||||||||
|
Foreign
|
Abu Dhabi Fertilizer Industries WWL
|
Associate
|
United Arab Emirates
|
US Dollar
|
- | - | 2,000 | |||||||||||||
|
Total
|
- | - | 2,000 | |||||||||||||||||
|
8.8
|
Trade and other accounts payable to related parties, current
|
|
12.31.2010
|
12.31.2009
|
01.01.2009
|
||||||||||||||||||
|
Taxpayer ID
|
Company
|
Relationship
|
Country
|
Currency
|
ThUS$
|
ThUS$
|
ThUS$
|
|||||||||||||
|
79.049.778-9
|
Callegari Agrícola S.A.
|
Other related party
|
Chile
|
Chilean peso
|
- | 234 | - | |||||||||||||
|
Foreign
|
Doktor Tarsa Tarim Sanayi AS
|
Associate
|
Turkey
|
US Dollar
|
73 | - | - | |||||||||||||
|
Foreign
|
NU3 N.V.
|
Associate
|
Belgium
|
US Dollar
|
270 | 94 | - | |||||||||||||
|
Foreign
|
SQM Vitas
|
Joint venture
|
United Arab Emirates
|
Dirham
|
2,614 | 2,883 | - | |||||||||||||
|
Foreign
|
Coromandel Fertilizers Limited
|
Joint venture
|
India
|
Rupee
|
581 | 681 | - | |||||||||||||
|
Foreign
|
SQM Thailand Co. Ltd.
|
Associate
|
Thailand
|
Euro
|
- | - | 178 | |||||||||||||
|
Total
|
3,538 | 3,892 | 178 | |||||||||||||||||
As of December 31, 2010, December 31, 2009 and January 1, 2009 there are no allowances for doubtful accounts relating to outstanding balances from transactions with related parties.
F-60
Notes to the consolidated Financial Statements as of December 31, 2010
(Translation of consolidated financial statements originally issued in Spanish – see Note 2.2)
Note 8 - Related Party Disclosures (continued)
|
8.9
|
Board of directors and senior management
|
|
1)
|
Board of directors
|
The Company is managed by a Board of Directors which is composed of eight regular directors who are elected for a four-year period. The present Board of Directors was elected by the shareholders at the Ordinary Shareholders' Meeting of April 30, 2008.
As of December 31, 2010, the Company has an Audit Committee made up of three members of the Board of Directors. This Committee performs those duties provided in Article 50 bis of Law No. 18,046.
During the periods covered by these consolidated financial statements, there are no pending balances receivable and payable between the Company, its directors or members of Senior Management other than those related to remuneration, fee allowances and profit participation. In addition, there were no transactions conducted between the Company, its directors or members of Senior Management.
|
2)
|
Directors’ Compensation
|
2.1 Compensation for 2010
2.1.1 Board of Directors
Directors’ compensation is detailed as follows:
|
a)
|
A payment of a monthly fixed gross amount of UF 300 in favor of the the Chairman of the Company’s Board of Directors and UF 50 in favor of the seven remaining board members regardless of their attendance at Board meetings or the number of meetings attended.
|
|
b)
|
A payment in domestic currency in favor of the Chairman of the Company’s Board of Directors consisting of a variable and gross amount equivalent to 0.35% of total net for the period effectively earned by the Company during fiscal year 2010.
|
|
c)
|
A payment in domestic currency in favor of each Company’s directors excluding the Chairman of the Board, consisting of a variable and gross amount equivalent to 0.04% of total net income for for the year effectively earned by the Company during fiscal year 2010.
|
|
d)
|
The fixed and variable amounts indicated above will not be subject to any charge between them, and those expressed as a percentage will be paid immediately after the shareholders at the respective Annual General Shareholders’ Meeting of the Company approve the statement of financial position (balance sheet), the financial statements, the annual report, the report by the account inspectors and the report of external auditors for the fiscal year ending December 31, 2010.
|
|
e)
|
Therefore, the remunerations and profit sharing paid to members of the Board of Directors and Audit Comittee during 2010 amount to ThUS$ 2,869.
|
F-61
Notes to the consolidated Financial Statements as of December 31, 2010
(Translation of consolidated financial statements originally issued in Spanish – see Note 2.2)
Note 8 - Related Party Disclosures (continued)
|
2)
|
Directors’ Compensation
|
2.1.2 Audit Committee
The remuneration of the Audit Committee is detailed as follows:
|
a)
|
A payment of a monthly, fixed and gross amount of UF 17 in favor of each of the three Directors who are a part of the Company’s Audit Committee regardless of the number of meetings conducted during the respective month.
|
|
b)
|
A payment in domestic currency and in favor of each of the three Directors of a variable and gross amount equivalent to 0.0013% of the Company’s total net income for the year effectively earned by the Company during fiscal year 2010.
|
|
2.2
|
Compensation for 2009
|
2.2.1 Directors’ Compensation and Committee
During 2009, the Company has paid its directors an annual amount of UF 300 to the Chairman and UF 50 to each of the seven remaining board members regardless of attendance to Board meetings or the number of meetings attended.
In addition, the directors have received variable remuneration consisting of 0.5% of 2008 net income for the Chairman and 0.5% of 2008 net income divided in equal parts for each of the seven remaining board members.
Therefore, remuneration and profit share paid to the members of the Audit Committee and the Directors during 2009 amounted to ThUS$6,507.
In April 2009, at the General Ordinary Shareholders’ Meeting of the Company, the shareholders agreed to change the percentages of variable benefit for 2009, to 0.35% of net income for 2009 for the Chairman and 0.04% of net income for 2009 to each of the remaining seven directors.
|
3)
|
No guarantees have been constituted in favor of the Directors.
|
|
4)
|
Senior Management remuneration
|
As of December 31, 2010, the overall remuneration paid to the 108 main executives amounts to ThUS$21,809. (ThUS$20,025 as of Decemeber 31, 2009) This includes monthly fixed salary and variable performance bonuses.
The Company has defined annual bonus plans for its executives related to goal achievement and level of individual contribution to the Company’s income. These incentives are structured in a minimum and maximum of gross remunerations, which are paid once a year or every two years.
F-62
Notes to the consolidated Financial Statements as of December 31, 2010
(Translation of consolidated financial statements originally issued in Spanish – see Note 2.2)
|
5)
|
Additionally, the Company has retention bonuses for the Company’s executives. The amount of these bonuses is linked to the price of the Company’s share and is payable in cash between 2011 and 2016 (See Note 17).
|
|
6)
|
No guarantees have been constituted in favor of the Company’s management.
|
|
7)
|
The Company’s Managers and Directors do not receive or have not received any benefit during the period ended as of December 31, 2010 or compensation for the concept of pensions, life insurance, paid time off, profit sharing, incentives, or benefits due to disability other than those mentioned in the preceding points.
|
|
8)
|
One of the Company’s Board of Directors is member of the Ultramar Group. During the year end December 31, 2010, the amount of operations with this Group is approximately ThUS$11,532 (ThUS$ 1,272 as of December 31, 2009).
|
|
9)
|
The Company currently maintains financial operations with BCI Bank (Banco de Crédito e Inversiones). A member of the Company’s Board of Directors also belongs to the Board of Directors of BCI Bank.
|
Financial assets are detailed as follows:
|
9.1
|
Types of other financial assets
|
|
Types of other financial assets
|
12.31.2010
ThUS$
|
12.31.2009
ThUS$
|
01.01.2009
ThUS$
|
|||||||||
|
Other current financial assets (1)
|
69,818 | 169,798 | 40,344 | |||||||||
|
Derivative instruments (2)
|
1,363 | 9,155 | 1,599 | |||||||||
|
Hedging assets, current
|
4,997 | 1,616 | - | |||||||||
|
Total other current financial assets
|
76,178 | 180,569 | 41,943 | |||||||||
|
Other non-current financial assets (3)
|
118 | 113 | 101 | |||||||||
|
Hedging assets, non-current
|
92,556 | 49,723 | - | |||||||||
|
Total other non-current financial assets
|
92,674 | 49,836 | 101 | |||||||||
(1) Relates to time deposits with purchased maturities greater than 90 days.
(2) Relate to forwards and options that were not classified as hedging instruments. (See note 9.3)
(3) Relate to guarantees delivered for the lease of offices and investments in Sociedad Garantizadora de Pensiones (ownership interest of 3 %.)
F-63
Notes to the consolidated Financial Statements as of December 31, 2010
(Translation of consolidated financial statements originally issued in Spanish – see Note 2.2)
Note 9 - Financial Instruments (continued)
|
9.1
|
Types of other financial assets (continued)
|
Other financial assets, current
|
Financial Institution
|
12.31.2010
ThUS$
|
12.31.2009
ThUS$
|
01.01.2009
ThUS$
|
|||||||||
|
Banco Santander Santiago
|
- | 39,131 | 20,223 | |||||||||
|
Banco de Crédito e Inversiones
|
36,251 | 36,980 | 20,121 | |||||||||
|
Banco de Chile
|
10,333 | 53,705 | - | |||||||||
|
Corpbanca
|
18,031 | 39,982 | - | |||||||||
|
Banco Itau Chile
|
5,203 | - | - | |||||||||
|
Total
|
69,818 | 169,798 | 40,344 | |||||||||
|
9.2
|
Trade and other accounts receivable
|
|
a)
|
Trade and other accounts receivable, net:
|
|
Description of the type of trade and other accounts
receivable, net:
|
12.31.2010
ThUS$
|
12.31.2009
ThUS$
|
01.01.2009
ThUS$
|
|||||||||
|
Trade accounts receivable
|
350,720 | 309,765 | 328,044 | |||||||||
|
Other accounts receivable
|
25,225 | 16,058 | 6,747 | |||||||||
|
Trade and other accounts receivable current, net
|
375,945 | 325,823 | 334,791 | |||||||||
|
Trade and other accounts receivable non-current, net
|
1,102 | 4,208 | 766 | |||||||||
|
Other accounts receivable
|
1,102 | 4,208 | 766 | |||||||||
|
Total
|
377,047 | 330,031 | 335,557 | |||||||||
|
b)
|
Trade and other accounts receivable, gross:
|
|
Types of trade and other accounts receivable, gross
|
12.31.2010
ThUS$
|
12.31.2009
ThUS$
|
01.01.2009
ThUS$
|
|||||||||
|
Trade accounts receivable
|
367,545 | 326,192 | 339,932 | |||||||||
|
Other accounts receivable
|
27,282 | 16,714 | 8,134 | |||||||||
|
Trade and other accounts receivable current, gross
|
394,827 | 342,906 | 348,066 | |||||||||
|
Other accounts receivable
|
1,102 | 4,208 | 766 | |||||||||
|
Total
|
395,929 | 347,114 | 348,832 | |||||||||
F-64
Notes to the consolidated Financial Statements as of December 31, 2010
(Translation of consolidated financial statements originally issued in Spanish – see Note 2.2)
Note 9 - Financial Instruments (continued)
|
9.2
|
Trade and other accounts receivable (continued)
|
|
c)
|
Detail of financial assets past due
|
Financial assets past due are composed of the following: Trade and other accounts receivable as of December 31, 2010 and December 31, 2009.
|
Balances as of
12.31.2010
|
||||||||||||||||||||
|
Financial assets
|
Past due for
less than
three
months
ThUS$
|
Past due for
between
three and
six months
ThUS$
|
Past due for
between six
and twelve
months
ThUS$
|
Past due for
more than
twelve
months
ThUS$
|
Total
ThUS$
|
|||||||||||||||
|
Trade and other accounts receivable
|
54,203 | 1,911 | 28,689 | 4,108 | 88,911 | |||||||||||||||
|
Total
|
54,203 | 1,911 | 28,689 | 4,108 | 88,911 | |||||||||||||||
|
Balances as of
12.31.2009
|
||||||||||||||||||||
|
Financial assets
|
Past due for
less than
three months
ThUS$
|
Past due for
between three
and six
months
ThUS$
|
Past due for
between six
and twelve
months
ThUS$
|
Past due for
more than
twelve
months
ThUS$
|
Total
ThUS$
|
|||||||||||||||
|
Trade and other accounts receivable
|
36,956 | 7,107 | 713 | 6,370 | 51,146 | |||||||||||||||
|
Total
|
36,956 | 7,107 | 713 | 6,370 | 51,146 | |||||||||||||||
|
Balances as of
01.01.2009
|
||||||||||||||||||||
|
Financial assets
|
Past due for
less than
three months
ThUS$
|
Past due for
between three
and six
months
ThUS$
|
Past due for
between six
and twelve
months
ThUS$
|
Past due for
more than
twelve
months
ThUS$
|
Total
ThUS$
|
|||||||||||||||
|
Trade and other accounts receivable
|
41,049 | 5,773 | 15,671 | 1,396 | 63,889 | |||||||||||||||
|
Total
|
41,049 | 5,773 | 15,671 | 1,396 | 63,889 | |||||||||||||||
F-65
Notes to the consolidated Financial Statements as of December 31, 2010
(Translation of consolidated financial statements originally issued in Spanish – see Note 2.2)
Note 9 - Financial Instruments (continued)
|
9.2
|
Trade and other accounts receivable (continued)
|
|
d)
|
Allowance for doubtful accounts
|
The Company records an allowance for doubtful accounts when in the Company’s management’s opinion, all collection means have been exhausted or there are certain doubts as to the recovery of trade and other accounts receivable.
|
Financial assets
|
12.31.2010
ThUS$
|
12.31.2009
ThUS$
|
01.01.2009
ThUS$
|
|||||||||
|
Trade and other accounts receivable
|
(18,882 | ) | (17,083 | ) | (13,275 | ) | ||||||
|
Balance
|
(18,882 | ) | (17,083 | ) | (13,275 | ) | ||||||
Reconciliation of variations in the allowance for doubtful accounts of trade and other accounts receivable.
|
12.31.2010
ThUS$
|
12.31.2009
ThUS$
|
01.01.2009
ThUS$
|
||||||||||
|
Opening balance
|
17,083 | 13,275 | 10,649 | |||||||||
|
Bad debt expense
|
2,028 | 3,716 | 4,700 | |||||||||
|
Write-offs
|
(118 | ) | (199 | ) | (1,042 | ) | ||||||
|
Exchange difference
|
(111 | ) | 1,214 | (855 | ) | |||||||
|
Other
|
- | (923 | ) | (177 | ) | |||||||
|
Total
|
18,882 | 17,083 | 13,275 | |||||||||
|
e)
|
Credit risk concentration
|
Credit risk concentrations with respect to trade receivables are reduced due to the great number of entities included in the Company’s client database and their distribution throughout the world.
F-66
Notes to the consolidated Financial Statements as of December 31, 2010
(Translation of consolidated financial statements originally issued in Spanish – see Note 2.2)
Note 9 - Financial Instruments (continued)
|
9.2
|
Trade and other accounts receivable (continued)
|
The policy of the Company is to request a collateral (such as letters of credit and guarantee clauses or other), and/ or to have insurance for certain accounts as the management deems suitable. Renegotiated debts are not significant and are limited to accounts receivable in Chile.
|
Trade receivables
|
12.31.2010
ThUS$
|
12.31.2009
ThUS$
|
01.01.2009
ThUS$
|
|||||||||
|
Gross trade receivable
|
395,929 | 347,114 | 348,832 | |||||||||
|
Overdue which are not considered to be impaired
|
(88,911 | ) | (51,146 | ) | (63,889 | ) | ||||||
|
Allowance for doubtful accounts
|
(18,882 | ) | (17,083 | ) | (13,275 | ) | ||||||
|
Receivables that are neither overdue or considered impaired in value
|
288,136 | 278,885 | 271,668 | |||||||||
|
9.3
|
Current hedge assets
|
The balance represents derivative instruments measured at fair value which have been classified as hedges from exchange and interest rate risks related to the total obligations relating to bonds of the Company in Chilean pesos and UF. As of December 31, 2010 the nominal value of flows in Cross Currency Swap contracts agreed upon in US dollars amounted to ThUS$ 410,618; as of December 31, 2009 such contracts amounted to ThUS$ 415,749; and as of January 1, 2009 to ThUS$ 92,367.
|
Hedging assets
|
Derivative
instruments
(CCS)
|
Effect on profit or
loss for the
period, derivative
Instruments
|
Hedging reserve
in other
comprehensive
income (equity)
|
Deferred income
tax hedging
reserve in equity
|
Hedging reserve
in other
comprehensive
income (equity)
|
|||||||||||||||
|
ThUS$
|
ThUS$
|
ThUS$
|
ThUS$
|
ThUS$
|
||||||||||||||||
|
December 31, 2010
|
97,553 | 46,936 | (11,093 | ) | 1,886 | (9,207 | ) | |||||||||||||
|
December 31, 2009
|
51,339 | 68,533 | (9,619 | ) | 1,635 | (7,984 | ) | |||||||||||||
Balances in the column “Effects on profit or loss”, consider the annual effects of contracts that were in force as of December 31, 2010 and December 31, 2009
.
Derivative contract maturities are detailed as follows:
|
Series
|
Contract
Amount ThUS$
|
Currency
|
Expiration Date
|
||||||
|
C
|
82,104 |
UF
|
12.01.2026 | ||||||
|
G
|
33,673 |
Chilean peso
|
01.05.2014 | ||||||
|
H
|
146,360 |
UF
|
01.05.2013 | ||||||
|
I
|
56,041 |
UF
|
04.01.2014 | ||||||
|
J
|
92,440 |
Chilean peso
|
04.01.2014 | ||||||
F-67
Notes to the consolidated Financial Statements as of December 31, 2010
(Translation of consolidated financial statements originally issued in Spanish – see Note 2.2)
|
9.3
|
Current hedge assets (continued)
|
The Company uses cross currency swap derivative instruments to hedge the possible financial risk associated with the volatility of the exchange rate associated with Chilean pesos and UF. The objective is to hedge the exchange rate financial risks associated with bonds payable. Hedges are documented and tested to measure their effectiveness.
Based on a comparison of critical terms, hedging is highly effective, given that the hedged amount is consistent with obligations maintained for bonds denominated in Chilean pesos and UF. Likewise, hedging contracts are denominated in the same currencies and have the same expiration dates of bond principal payments.
Hedge Accounting
The Company classifies derivative instruments as hedging that may include derivative or implicit derivatives either as fair value hedge derivative instruments, cash flow hedge derivative instruments, or hedge derivative instruments for net investment in a business abroad.
|
(a)
|
Fair value hedges
|
Changes in fair values of derivative instruments classified as fair value hedge derivative instruments are accounted for in gains and losses immediately along with any change in the fair value of the covered item that is attributable to the risk that is covered.
The Company documents the relationship between hedge instruments and the covered entry along with the objectives of its risk management and strategy to carry out different hedge transactions. In addition, upon commencement of the period covered and then on a quarterly basis the Company documents whether hedge instruments have been efficient and met the objective to cover market fluctuations for which purpose we use the effectiveness test. A hedge instrument is deemed effective if the effectiveness test result is between 80 to 120%.
The hedge instruments are classified as effective or not effective on the basis of the effectiveness test results. To date, the effectiveness tests have defined them as effective.
|
(b)
|
Cash flow hedges
|
Cash flow hedges cover exposure to the cash flow variations attributable to a risk associated with a specific transaction that is very likely to be executed, that may have material effects on the results of the Company.
F-68
Notes to the consolidated Financial Statements as of December 31, 2010
(Translation of consolidated financial statements originally issued in Spanish – see Note 2.2)
Note 9 - Financial instruments (continued)
|
9.4
|
Financial liabilities
|
As of December 31, 2010, December 31, 2009 and January 1, 2009, financial liabilities are detailed as follows:
|
Types of interest-bearing loans
|
12.31.2010
ThUS$
|
12.31.2009
ThUS$
|
01.01.2009
ThUS$
|
|||||||||
|
Current interest-bearing loans
|
||||||||||||
|
Bank loans (a)
|
150,958 | 220,756 | 133,587 | |||||||||
|
Derivative instruments (9.6)
|
18,353 | 4,232 | 7,158 | |||||||||
|
Current hedging liabilities
|
- | - | 2,233 | |||||||||
|
Unsecured obligations (b)
|
18,244 | 43,867 | 7,344 | |||||||||
|
Total
|
187,555 | 268,855 | 150,322 | |||||||||
|
Non-current interest-bearing loans
|
||||||||||||
|
Bank loans (c)
|
140,000 | 363,808 | 229,680 | |||||||||
|
Non-current hedging liabilities
|
- | - | 8,798 | |||||||||
|
Unsecured obligations (d)
|
950,188 | 660,542 | 281,662 | |||||||||
|
Total
|
1,090,188 | 1,024,350 | 520,140 | |||||||||
F-69
Notes to the consolidated Financial Statements as of December 31, 2010
(Translation of consolidated financial statements originally issued in Spanish – see Note 2.2)
Note 9 - Financial instruments (continued)
|
9.4
|
Financial liabilities (continued)
|
|
a)
|
Current bank loans:
|
As of December 31, 2010, December 31, 2009 and January 1, 2009, current bank loans are detailed as follows:
|
Debtor
|
Creditor
|
12.31.2010
Current maturities
|
||||||||||||||||||||||||||||||||
|
Taxpayer ID
|
Subsidiary
|
Country
|
Taxpayer ID
|
Financial institution
|
Country
|
Currency
|
Type of
repayment
|
Effective
rate
|
Nominal
rate
|
Up to 90
days
ThUS$
|
More than
90 days
less than 1
year
ThUS$
|
Total
ThUS$
|
||||||||||||||||||||||
|
93.007.000-9
|
SQM S.A.
|
Chile
|
Foreign
|
Banco Estado NY Branch
|
United States
|
USD
|
Maturity date
|
3.93 | % | 3.77 | % | 20,214 | - | 20,214 | ||||||||||||||||||||
|
93.007.000-9
|
SQM S.A.
|
Chile
|
Foreign
|
Banco Estado NY Branch
|
United States
|
USD
|
Maturity date
|
3.93 | % | 3.77 | % | 10,104 | - | 10,104 | ||||||||||||||||||||
|
93.007.000-9
|
SQM S.A.
|
Chile
|
Foreign
|
Banco Estado NY Branch
|
United States
|
USD
|
Maturity date
|
2.55 | % | 2.55 | % | - | 625 | 625 | ||||||||||||||||||||
|
93.007.000-9
|
SQM S.A.
|
Chile
|
Foreign
|
BBVA Banco Bilbao Vizcaya Argentaria
|
Chile
|
USD
|
Maturity date
|
0.64 | % | 0.64 | % | 20,030 | - | 20,030 | ||||||||||||||||||||
|
93.007.000-9
|
SQM S.A.
|
Chile
|
Foreign
|
BBVA Banco Bilbao Vizcaya Argentaria
|
Chile
|
USD
|
Maturity date
|
0.26 | % | 0.26 | % | 20,000 | - | 20,000 | ||||||||||||||||||||
|
Foreign
|
Royal Seed Trading Corporation A.V.V.
|
Aruba
|
Foreign
|
ING Capital LLC
|
United States
|
USD
|
Maturity date
|
1.00 | % | 0.80 | % | - | 80,055 | 80,055 | ||||||||||||||||||||
|
Total
|
70,348 | 80,680 | 151,028 | |||||||||||||||||||||||||||||||
|
Borrowing costs
|
- | (70 | ) | (70 | ) | |||||||||||||||||||||||||||||
|
Total
|
70,348 | 80,610 | 150,958 | |||||||||||||||||||||||||||||||
F-70
Notes to the consolidated Financial Statements as of December 31, 2010
(Translation of consolidated financial statements originally issued in Spanish – see Note 2.2)
Note 9 - Financial instruments (continued)
|
9.4
|
Financial liabilities (continued)
|
|
Debtor
|
Creditor
|
12.31.2009
Current maturities
|
||||||||||||||||||||||||||||||||
|
Taxpayer ID
|
Subsidiary
|
Country
|
Taxpayer ID
|
Financial institution
|
Country
|
Currency
|
Type of
repayment
|
Effective
rate
|
Nominal
rate
|
Up to 90
days
ThUS$
|
More than
90 days
less than 1
year
ThUS$
|
Total
ThUS$
|
||||||||||||||||||||||
|
79.947.100-0
|
SQM Industrial S.A.
|
Chile
|
97.951.000-4 |
HSBC Bank Chile
|
Chile
|
USD
|
Maturity date
|
4.74 | % | 4.74 | % | 15,090 | - | 15,090 | ||||||||||||||||||||
|
93.007.000-9
|
SQM S.A.
|
Chile
|
Foreign
|
Banco Estado NY Branch
|
United States
|
USD
|
Maturity date
|
2.68 | % | 2.68 | % | - | 656 | 656 | ||||||||||||||||||||
|
93.007.000-9
|
SQM S.A.
|
Chile
|
97.030.000-7 |
Banco Estado
|
Chile
|
USD
|
Maturity date
|
4.66 | % | 4.66 | % | 20,813 | - | 20,813 | ||||||||||||||||||||
|
93.007.000-9
|
SQM S.A.
|
Chile
|
Foreign
|
Banco Estado NY Branch
|
United States
|
USD
|
Maturity date
|
3.98 | % | 3.98 | % | 223 | - | 223 | ||||||||||||||||||||
|
93.007.000-9
|
SQM S.A.
|
Chile
|
Foreign
|
Banco Estado NY Branch
|
United States
|
USD
|
Maturity date
|
3.98 | % | 3.98 | % | 109 | - | 109 | ||||||||||||||||||||
|
93.007.000-9
|
SQM S.A.
|
Chile
|
97.032.000-8 |
BBVA Chile
|
Chile
|
USD
|
Maturity date
|
4.51 | % | 4.51 | % | 20,762 | - | 20,762 | ||||||||||||||||||||
|
93.007.000-9
|
SQM S.A.
|
Chile
|
97.032.000-8 |
BBVA Chile
|
Chile
|
USD
|
Maturity date
|
4.46 | % | 4.46 | % | 10,376 | - | 10,376 | ||||||||||||||||||||
|
93.007.000-9
|
SQM S.A.
|
Chile
|
Foreign
|
Caja de Ahorro y Monte de Piedad
|
United States
|
USD
|
Maturity date
|
3.08 | % | 2.56 | % | 43 | - | 43 | ||||||||||||||||||||
|
Foreign
|
Royal Seed Trading Corporation A.V.V..
|
Aruba
|
Foreign
|
BBVA Banco Bilbao Vizcaya Argentaria
|
United States
|
USD
|
Maturity date
|
1.22 | % | 0.69 | % | 100,053 | - | 100,053 | ||||||||||||||||||||
|
Foreign
|
Royal Seed Trading Corporation A.V.V.
|
Aruba
|
Foreign
|
ING Capital LLC
|
United States
|
USD
|
Maturity date
|
0.95 | % | 0.80 | % | - | 55 | 55 | ||||||||||||||||||||
|
Foreign
|
SQM Investment Corporation N.V.
|
Dutch Antilles
|
Foreign
|
Export Development Canada
|
United States
|
USD
|
Maturity date
|
2.47 | % | 1.93 | % | - | 50,019 | 50,019 | ||||||||||||||||||||
|
Foreign
|
Fertilizantes Naturales S.A.
|
Spain
|
Foreign
|
Other Banks
|
Spain
|
Euro
|
Maturity date
|
- | - | - | 3,327 | 3,327 | ||||||||||||||||||||||
|
Total
|
167,469 | 54,057 | 221,526 | |||||||||||||||||||||||||||||||
|
Borrowing costs
|
(653 | ) | (117 | ) | (770 | ) | ||||||||||||||||||||||||||||
|
Total
|
166,816 | 53,940 | 220,756 | |||||||||||||||||||||||||||||||
F-71
Notes to the consolidated Financial Statements as of December 31, 2010
(Translation of consolidated financial statements originally issued in Spanish – see Note 2.2)
Note 9 - Financial instruments (continued)
|
9.4
|
Financial liabilities (continued)
|
|
Debtor
|
Creditor
|
01.01.2009
Current maturities
|
||||||||||||||||||||||||||||||||
|
Taxpayer ID
|
Subsidiary
|
Country
|
Taxpayer ID
|
Financial institution
|
Country
|
Currency
|
Type of
repayment
|
Effective
rate
|
Nominal
rate
|
Up to 90
days
ThUS$
|
More than
90 days less
than 1 year
ThUS$
|
Total ThUS$
|
||||||||||||||||||||||
|
79.947.100-0
|
SQM Industrial S.A.
|
Chile
|
97.006.000-6 |
Banco Crédito e Inversiones
|
Chile
|
USD
|
Maturity date
|
10.12 | % | 10.12 | % | 15,346 | - | 15,346 | ||||||||||||||||||||
|
93.007.000-9
|
SQM S.A.
|
Chile
|
97.006.000-6 |
Banco Crédito e Inversiones
|
Chile
|
USD
|
Maturity date
|
6.00 | % | 6.00 | % | - | 10,085 | 10,085 | ||||||||||||||||||||
|
93.007.000-9
|
SQM S.A.
|
Chile
|
Foreign
|
JP Morgan Chase Bank
|
United States
|
USD
|
Maturity date
|
6.63 | % | 6.63 | % | - | 20,317 | 20,317 | ||||||||||||||||||||
|
93.007.000-9
|
SQM S.A.
|
Chile
|
97.006.000-6 |
Banco Crédito e Inversiones
|
Chile
|
USD
|
Maturity date
|
6.12 | % | 6.12 | % | - | 10,087 | 10,087 | ||||||||||||||||||||
|
93.007.000-9
|
SQM S.A.
|
Chile
|
97.032000-8 |
BBVA Chile
|
Chile
|
USD
|
Maturity date
|
4.62 | % | 4.62 | % | 10,021 | - | 10,021 | ||||||||||||||||||||
|
93.007.000-9
|
SQM S.A.
|
Chile
|
97.032000-8 |
BBVA Chile
|
Chile
|
USD
|
Maturity date
|
7.87 | % | 7.87 | % | 10,166 | - | 10,166 | ||||||||||||||||||||
|
93.007.000-9
|
SQM S.A.
|
Chile
|
97.032000-8 |
BBVA Chile
|
Chile
|
USD
|
Maturity date
|
8.00 | % | 8.00 | % | 20,338 | - | 20,338 | ||||||||||||||||||||
|
79.626.800-K
|
SQM Salar S.A.
|
Chile
|
97.036.000-K |
Banco Santander Santiago
|
Chile
|
USD
|
Maturity date
|
6.25 | % | 6.25 | % | - | 10,038 | 10,038 | ||||||||||||||||||||
|
79.626.800-K
|
SQM Salar S.A.
|
Chile
|
97.036.000-K |
Banco Santander Santiago
|
Chile
|
USD
|
Maturity date
|
6.02 | % | 6.02 | % | 10,037 | - | 10,037 | ||||||||||||||||||||
|
79.626.800-K
|
SQM Salar S.A.
|
Chile
|
97.951.000-4 |
HSBC Bank Chile
|
Chile
|
USD
|
Maturity date
|
7.80 | % | 7.80 | % | - | 15,267 | 15,267 | ||||||||||||||||||||
|
Foreign
|
Royal Seed Trading Corporation A.V.V.
|
Aruba
|
Foreign
|
Banco Bilbao Vizcaya Argentaria
|
United States
|
USD
|
Maturity date
|
3.01 | % | 2.63 | % | 204 | - | 204 | ||||||||||||||||||||
|
Foreign
|
Royal Seed Trading Corporation A.V.V.
|
Aruba
|
Foreign
|
ING Capital LLC
|
United States
|
USD
|
Maturity date
|
3.19 | % | 2.93 | % | - | 215 | 215 | ||||||||||||||||||||
|
Foreign
|
SQM Investment Corporation N.V.
|
Dutch Antilles
|
Foreign
|
Export Development Canada
|
United States
|
USD
|
Maturity date
|
3.73 | % | 3.33 | % | - | 32 | 32 | ||||||||||||||||||||
|
Foreign
|
SQM Dubai - Fzco
|
UAE
|
Foreign
|
HSBC Bank Middle East Ltd.
|
UAE
|
Dirham
|
Maturity date
|
- | - | 21 | - | 21 | ||||||||||||||||||||||
|
Foreign
|
Fertilizantes Naturales S.A.
|
Spain
|
Foreign
|
Other Banks
|
Spain
|
Euro
|
Maturity date
|
- | - | - | 1,632 | 1,632 | ||||||||||||||||||||||
|
Total
|
66,133 | 67,673 | 133,806 | |||||||||||||||||||||||||||||||
|
Borrowing costs
|
(102 | ) | (117 | ) | (219 | ) | ||||||||||||||||||||||||||||
|
Total
|
66,031 | 67,556 | 133,587 | |||||||||||||||||||||||||||||||
F-72
Notes to the consolidated Financial Statements as of December 31, 2010
(Translation of consolidated financial statements originally issued in Spanish – see Note 2.2)
Note 9 - Financial instruments (continued)
|
9.4
|
Financial liabilities (continued)
|
|
b)
|
Unsecured obligations, current:
|
As of December 31, 2010, December 31, 2009 and January 1, 2009, unsecured current interest-bearing obligations are detailed as follows:
Promissory notes
| ID or registration | Expiration date |
Carrying value
ThUS$
|
|||||||||||||||||||||||||||||
|
No. of the
instrument
|
Series
|
Currency
|
Face value
|
of the credit
note
|
Interest
rate
|
12.31.2010 | 12.31.2009 | 01.01.2009 | |||||||||||||||||||||||
| 47 | 1-B |
Ch$
|
15,000,000,000 | 03-17-2010 | 3.6 | % | - | 29,363 | - | ||||||||||||||||||||||
|
Total
|
- | 29,363 | - | ||||||||||||||||||||||||||||
On March 17, 2010, promissory note No. 47 series 1-B Capital was paid amounting to ThUS$29,040.
Bonds
|
Debtor
|
Periodicity
|
12.31.2010
Current due dates
|
||||||||||||||||||||||||||||||||||||||
|
Tax ID
|
Subsidiary
|
Country
|
Placement in
Chile or abroad
|
Number of
registration
or ID of the
instrument
|
Series
|
Placed
nominal
current
value
|
Currency
or indexed
unit
|
Effective
rate
|
Nominal
rate
|
Interest
payment
|
Amortization
payment
|
Up to 90
days
ThUS$
|
More than 90
days less
than 1 year
ThUS$
|
Total
ThUS$
|
||||||||||||||||||||||||||
| 93.007.000-9 |
SQM S.A
|
Chile
|
Foreign
|
Single
|
- |
US$
|
6.79 | % | 6.13 | % |
Bi-annually
|
At maturity
|
- | 2,591 | 2,591 | |||||||||||||||||||||||||
| 93.007.000-9 |
SQM S.A
|
Chile
|
Foreign
|
Single
|
- |
US$
|
5.92 | % | 5.50 | % |
Bi-annually
|
At maturity
|
- | 2,682 | 2,682 | |||||||||||||||||||||||||
| 93.007.000-9 |
SQM S.A
|
Chile
|
Chile
|
446 | C | 150,000 |
UF
|
6.63 | % | 4.00 | % |
Bi-annually
|
Bi-annually
|
- | 7,237 | 7,237 | ||||||||||||||||||||||||
| 93.007.000-9 |
SQM S.A
|
Chile
|
Chile
|
564 | H | - |
UF
|
6.43 | % | 4.90 | % |
Bi-annually
|
Bi-annually
|
4,319 | - | 4,319 | ||||||||||||||||||||||||
| 93.007.000-9 |
SQM S.A
|
Chile
|
Chile
|
563 | G | - |
Ch$
|
6.19 | % | 7.00 | % |
Bi-annually
|
At maturity
|
1,502 | - | 1,502 | ||||||||||||||||||||||||
| 93.007.000-9 |
SQM S.A
|
Chile
|
Chile
|
563 | I | - |
UF
|
5.88 | % | 3.00 | % |
Bi-annually
|
At maturity
|
- | 512 | 512 | ||||||||||||||||||||||||
| 93.007.000-9 |
SQM S.A
|
Chile
|
Chile
|
563 | J | - |
Ch$
|
5.37 | % | 5.50 | % |
Bi-annually
|
At maturity
|
- | 1,508 | 1,508 | ||||||||||||||||||||||||
|
Total
|
5,821 | 14,530 | 20,351 | |||||||||||||||||||||||||||||||||||||
|
Bond issue cost
|
(270 | ) | (1,837 | ) | (2,107 | ) | ||||||||||||||||||||||||||||||||||
|
Total
|
5,551 | 12,693 | 18,244 | |||||||||||||||||||||||||||||||||||||
Effective rates of bonds in Chilean pesos and UF are expressed and calculated in U.S. dollars based on the flows expected in Cross Currency Swap Agreements.
F-73
Notes to the consolidated Financial Statements as of December 31, 2010
(Translation of consolidated financial statements originally issued in Spanish – see Note 2.2)
Note 9 - Financial instruments (continued)
|
9.4
|
Financial liabilities (continued)
|
|
Debtor
|
Periodicity
|
12.31.2009
Current maturities
|
||||||||||||||||||||||||||||||||||||||
|
Taxpayer ID
|
Subsidiary
|
Country
|
Placement
in Chile or
abroad
|
Registration
No. or ID of
the
instrument
|
Series
|
Placed face
outstanding
value
|
Currency
or indexed
unit
|
Effective
rate
|
Nominal
rate
|
Interest
payment
|
Amortization
payment
|
Up to 90
days
ThUS$
|
More than 90
days less
than 1 year
ThUS$
|
Total
ThUS$
|
||||||||||||||||||||||||||
| 93.007.000-9 |
SQM S.A
|
Chile
|
Foreign
|
Single
|
- |
US$
|
6.79 | % | 6.13 | % |
Bi-annually
|
At maturity
|
- | 2,577 | 2,577 | |||||||||||||||||||||||||
| 93.007.000-9 |
SQM S.A
|
Chile
|
Chile
|
446 | C | 150,000 |
UF
|
6.63 | % | 4.00 | % |
Bi-annually
|
Bi-annually
|
- | 6,537 | 6,537 | ||||||||||||||||||||||||
| 93.007.000-9 |
SQM S.A
|
Chile
|
Chile
|
564 | H | - |
UF
|
6.43 | % | 4.90 | % |
Bi-annually
|
Bi-annually
|
3,891 | - | 3,891 | ||||||||||||||||||||||||
| 93.007.000-9 |
SQM S.A
|
Chile
|
Chile
|
563 | G | - |
Ch$
|
6.19 | % | 7.00 | % |
Bi-annually
|
At maturity
|
1,386 | - | 1,386 | ||||||||||||||||||||||||
| 93.007.000-9 |
SQM S.A
|
Chile
|
Chile
|
563 | I | - |
UF
|
5.88 | % | 3.00 | % |
Bi-annually
|
At maturity
|
- | 461 | 461 | ||||||||||||||||||||||||
| 93.007.000-9 |
SQM S.A
|
Chile
|
Chile
|
563 | J | - |
Ch$
|
5.37 | % | 5.50 | % |
Bi-annually
|
At maturity
|
- | 1,391 | 1,391 | ||||||||||||||||||||||||
|
Total
|
5,277 | 10,966 | 16,243 | |||||||||||||||||||||||||||||||||||||
|
Bond issue cost
|
(269 | ) | (1,470 | ) | (1,739 | ) | ||||||||||||||||||||||||||||||||||
|
Total
|
5,008 | 9,496 | 14,504 | |||||||||||||||||||||||||||||||||||||
|
Debtor
|
Periodicity
|
01.01.2009
Current maturities
|
||||||||||||||||||||||||||||||||||||||
|
Taxpayer ID
|
Subsidiary
|
Country
|
Placement
in Chile or
abroad
|
Registration
No. or ID of
the
instrument
|
Series
|
Placed face
outstanding
value
|
Currency
or indexed
|
Effective
rate
|
Nominal
rate
|
Interest
payment
|
Amortization
payment
|
Up to 90
days
ThUS$
|
More than 90
days less
than 1 year
ThUS$
|
Total
ThUS$
|
||||||||||||||||||||||||||
| 93.007.000-9 |
SQM S.A
|
Chile
|
Foreign
|
Single
|
- |
US$
|
6.79 | % | 6.13 | % |
Bi-annually
|
At maturity
|
- | 2,577 | 2,577 | |||||||||||||||||||||||||
| 93.007.000-9 |
SQM S.A
|
Chile
|
Chile
|
446 | C | 150,000 |
UF
|
6.63 | % | 4.00 | % |
Bi-annually
|
Bi-annually
|
- | 5,353 | 5,353 | ||||||||||||||||||||||||
|
Total
|
- | 7,930 | 7,930 | |||||||||||||||||||||||||||||||||||||
|
Bond issue cost
|
- | (586 | ) | (586 | ) | |||||||||||||||||||||||||||||||||||
|
Total
|
- | 7,344 | 7,344 | |||||||||||||||||||||||||||||||||||||
F-74
Notes to the consolidated Financial Statements as of December 31, 2010
(Translation of consolidated financial statements originally issued in Spanish – see Note 2.2)
Note 9 - Financial instruments (continued)
|
9.4
|
Financial liabilities (continued)
|
|
c)
|
Types of non-current interest-bearing loans
|
Non-current interest-bearing loans as of December 31, 2010, December 31, 2009 and January 1, 2009 are detailed as follows:
Non-current interest-bearing bank loans
|
Debtor
|
Creditor
|
12.31.2010
Years to maturity
|
||||||||||||||||||||||||||||||
|
Taxpayer ID
|
Subsidiary
|
Country
|
Taxpayer
ID
|
Financial
institution
|
Country
|
Currency
|
Amortization
period
|
Effective
rate
|
Nominal
rate
|
1 to 3
years
ThUS$
|
3 to 5
years
ThUS$
|
More
than 5
years
ThUS$
|
Total
ThUS$
|
|||||||||||||||||||
| 93.007.000-9 |
SQM S.A.
|
Chile
|
Foreign
|
Banco Estado NY Branch
|
United States
|
USD
|
At maturity
|
2.55 | % | 2.55 | % | - | 140,000 | - | 140,000 | |||||||||||||||||
|
Total
|
- | 140,000 | - | 140,000 | ||||||||||||||||||||||||||||
|
Borrowing costs
|
- | - | - | - | ||||||||||||||||||||||||||||
|
Total
|
- | 140,000 | - | 140,000 | ||||||||||||||||||||||||||||
|
Debtor
|
Creditor
|
12.31.2009
Years to maturity
|
||||||||||||||||||||||||||||||
|
Taxpayer ID
|
Subsidiary
|
Country
|
Taxpayer
ID
|
Financial
institution
|
Country
|
Currency
|
Amortization
period
|
Effective
rate
|
Nominal
rate
|
1 to 3
years
ThUS$
|
3 to 5
years
ThUS$
|
More
than 5
years
ThUS$
|
Total
ThUS$
|
|||||||||||||||||||
| 93.007.000-9 |
SQM S.A.
|
Chile
|
Foreign
|
Banco Estado NY Branch
|
United States
|
USD
|
At maturity
|
2.68 | % | 2.68 | % | - | 140,000 | - | 140,000 | |||||||||||||||||
| 93.007.000-9 |
SQM S.A.
|
Chile
|
Foreign
|
Caja de Ahorro y Monte de Piedad
|
United States
|
USD
|
At maturity
|
3.08 | % | 2.56 | % | 40,000 | - | - | 40,000 | |||||||||||||||||
| 93.007.000-9 |
SQM S.A.
|
Chile
|
Foreign
|
Banco Estado NY Branch
|
United States
|
USD
|
At maturity
|
3.98 | % | 3.98 | % | 10,000 | - | - | 10,000 | |||||||||||||||||
| 93.007.000-9 |
SQM S.A.
|
Chile
|
Foreign
|
Banco Estado NY Branch
|
United States
|
USD
|
At maturity
|
3.98 | % | 3.98 | % | 20,000 | - | - | 20,000 | |||||||||||||||||
|
Foreign
|
Royal Seed Trading Corporation A.V.V.
|
Aruba
|
Foreign
|
BBVA Bancomer
|
United States
|
USD
|
At maturity
|
4.07 | % | 3.25 | % | 75,000 | - | - | 75,000 | |||||||||||||||||
|
Foreign
|
Royal Seed Trading Corporation A.V.V.
|
Aruba
|
Foreign
|
ING Capital LLC
|
United States
|
USD
|
At maturity
|
0.95 | % | 0.80 | % | 80,000 | - | - | 80,000 | |||||||||||||||||
|
Total
|
225,000 | 140,000 | - | 365,000 | ||||||||||||||||||||||||||||
|
Borrowing costs
|
(1,192 | ) | - | - | (1,192 | ) | ||||||||||||||||||||||||||
|
Total
|
223,808 | 140,000 | - | 363,808 | ||||||||||||||||||||||||||||
F-75
Notes to the consolidated Financial Statements as of December 31, 2010
(Translation of consolidated financial statements originally issued in Spanish – see Note 2.2)
Note 9 - Financial instruments (continued)
|
9.4
|
Financial liabilities (continued)
|
|
Debtor
|
Creditor
|
01.01.2009
Years to maturity
|
|||||||||||||||||||||||||||||
|
Taxpayer ID
|
Subsidiary
|
Country
|
Taxpayer ID
|
Financial
institution
|
Country
|
Currency
|
Amortization
period
|
Effective
rate
|
Nominal
rate
|
1 to 3
years
ThUS$
|
3 to 5
years
ThUS$
|
More than
5 years
ThUS$
|
Total
ThUS$
Country
|
||||||||||||||||||
|
Foreign
|
Royal Seed Trading Corporation A.V.V.
|
Aruba
|
Foreign
|
BBVA Banco Bilbao Vizcaya Argentaria
|
United States
|
USD
|
At maturity
|
3.01 | % | 2.63 | % | 100,000 | - | - | 100,000 | ||||||||||||||||
|
Foreign
|
Royal Seed Trading Corporation A.V.V.
|
Aruba
|
Foreign
|
ING Capital LLC
|
United States
|
USD
|
At maturity
|
3.19 | % | 2.93 | % | 80,000 | - | - | 80,000 | ||||||||||||||||
|
Foreign
|
SQM Investment Corporation N.V.
|
Dutch Antilles
|
Foreign
|
Export Development Canada
|
United States
|
USD
|
At maturity
|
3.73 | % | 3.33 | % | 50,000 | - | - | 50,000 | ||||||||||||||||
|
Total
|
230,000 | - | - | 230,000 | |||||||||||||||||||||||||||
|
Borrowing costs
|
(320 | ) | (320 | ) | |||||||||||||||||||||||||||
|
Total
|
229,680 | - | - | 229,680 | |||||||||||||||||||||||||||
|
d)
|
Non-current unsecured interest-bearing bonds
|
The breakdown of non-current unsecured interest-bearing bonds as of December 31, 2010, December 31, 2009 and January 1, 2009 is detailed as follows:
|
Debtor
|
Periodicity
|
12.31.2010
Non-current due dates
|
|||||||||||||||||||||||||||||||||||||||
|
Tax ID
|
Subsidiary
|
Country
|
Placement
in Chile or
abroad
|
Number of
registration
or ID of the
instrument
|
Series
|
Placed nominal
current amount
|
Currency or
indexed
unit
|
Effective
rate
|
Nominal
rate
|
Interest
payment
|
Amortization
payment
|
Over 1
to 3
ThUS$
|
Over 3
to 5
ThUS$
|
Over 5
ThUS$
|
Total
ThUS$
|
||||||||||||||||||||||||||
| 93.007.000-9 |
SQM S.A
|
Chile
|
Foreign
|
single
|
200.000.000 |
US$
|
6.79 | % | 6.13 | % |
Bi-annually
|
At maturity
|
- | - | 200,000 | 200,000 | |||||||||||||||||||||||||
| 93.007.000-9 |
SQM S.A.
|
Chile
|
Foreign
|
single
|
250.000.000 |
US$
|
5.92 | % | 5.50 | % |
Bi-annually
|
At maturity
|
- | - | 250,000 | 250,000 | |||||||||||||||||||||||||
| 93.007.000-9 |
SQM S.A
|
Chile
|
Chile
|
446 | C | 2.325.000 |
UF
|
6.63 | % | 4.00 | % |
Bi-annually
|
Bi-annually
|
13,755 | 13,755 | 75,654 | 103,164 | ||||||||||||||||||||||||
| 93.007.000-9 |
SQM S.A
|
Chile
|
Chile
|
564 | H | 4.000.000 |
UF
|
6.43 | % | 4.90 | % |
Bi-annually
|
Bi-annually
|
- | - | 183,402 | 183,402 | ||||||||||||||||||||||||
| 93.007.000-9 |
SQM S.A
|
Chile
|
Chile
|
563 | G | 21.000.000.000 |
Ch$
|
6.19 | % | 7.00 | % |
Bi-annually
|
At maturity
|
- | 44,877 | - | 44,877 | ||||||||||||||||||||||||
| 93.007.000-9 |
SQM S.A
|
Chile
|
Chile
|
563 | I | 1.500.000 |
UF
|
5.88 | % | 3.00 | % |
Bi-annually
|
At maturity
|
- | 68,776 | - | 68,776 | ||||||||||||||||||||||||
| 93.007.000-9 |
SQM S.A
|
Chile
|
Chile
|
563 | J | 52.000.000.000 |
Ch$
|
5.37 | % | 5.50 | % |
Bi-annually
|
At maturity
|
111,124 | - | 111,124 | |||||||||||||||||||||||||
|
Total
|
13,755 | 238,532 | 709,056 | 961,343 | |||||||||||||||||||||||||||||||||||||
|
Bond issue costs
|
(682 | ) | (2,670 | ) | (7,803 | ) | (11,155 | ) | |||||||||||||||||||||||||||||||||
|
Total
|
13,073 | 235,862 | 701,253 | 950,188 | |||||||||||||||||||||||||||||||||||||
F-76
Notes to the consolidated Financial Statements as of December 31, 2010
(Translation of consolidated financial statements originally issued in Spanish – see Note 2.2)
Note 9 - Financial instruments (continued)
|
9.4
|
Financial liabilities (continued)
|
|
Debtor
|
Periodicity
|
12.31.2009
Non-current due dates
|
|||||||||||||||||||||||||||||||||||||||
|
Tax ID
|
Subsidiary
|
Country
|
Placement
in Chile or
abroad
|
Number of
registration
or ID of
the
instrument
|
Series
|
Placed
nominal
current
amount
|
Currency
or indexed
unit
|
Effective
rate
|
Nominal
rate
|
Interest
payment
|
Amortization
payment
|
Over 1
to 3
ThUS$
|
Over 3
to 5
ThUS$
|
Over 5
ThUS$
|
Total
ThUS$
|
||||||||||||||||||||||||||
| 93.007.000-9 |
SQM S.A
|
Chile
|
Foreign
|
single
|
200.000.000 |
US
|
6.79 | % | 6.13 | % |
Bi-annually
|
At maturity
|
- | - | 200,000 | 200,000 | |||||||||||||||||||||||||
| 93.007.000-9 |
SQM S.A
|
Chile
|
Chile
|
446 | C | 2.400.000 |
UF
|
6.63 | % | 4.00 | % |
Bi-annually
|
Bi-annually
|
12,390 | 12,390 | 74,339 | 99,119 | ||||||||||||||||||||||||
| 93.007.000-9 |
SQM S.A
|
Chile
|
Chile
|
564 | H | 4.000.000 |
UF
|
6.43 | % | 4.9 | % |
Bi-annually
|
Bi-annually
|
- | - | 165,197 | 165,197 | ||||||||||||||||||||||||
| 93.007.000-9 |
SQM S.A
|
Chile
|
Chile
|
563 | G | 21.000.000.000 |
Ch$
|
6.19 | % | 7.00 | % |
Bi-annually
|
At maturity
|
- | 41,412 | - | 41,412 | ||||||||||||||||||||||||
| 93.007.000-9 |
SQM S.A
|
Chile
|
Chile
|
563 | I | 1.500.000 |
UF
|
5.88 | % | 3.00 | % |
Bi-annually
|
At maturity
|
- | 61,949 | - | 61,949 | ||||||||||||||||||||||||
| 93.007.000-9 |
SQM S.A
|
Chile
|
Chile
|
563 | J | 52.000.000.000 |
Ch$
|
5.37 | % | 5.50 | % |
Bi-annually
|
At maturity
|
- | 102,544 | - | 102,544 | ||||||||||||||||||||||||
|
Total
|
12,390 | 218,295 | 439,536 | 670,221 | |||||||||||||||||||||||||||||||||||||
|
Bond issue costs
|
(731 | ) | (3,739 | ) | (5,209 | ) | (9,679 | ) | |||||||||||||||||||||||||||||||||
|
Total
|
11,659 | 214,556 | 434,327 | 660,542 | |||||||||||||||||||||||||||||||||||||
|
Debtor
|
Periodicity
|
12.31.2009
Non-current due dates
|
|||||||||||||||||||||||||||||||||||||||
|
Tax ID
|
Subsidiary
|
Country
|
Placement
in Chile or
abroad
|
Number of
registration
or ID of
the
instrument
|
Series
|
Placed
nominal
current
amount
|
Currency
or indexed
unit
|
Effective
rate
|
Nominal
rate
|
Interest
payment
|
Amortization
payment
|
Over 1
to 3
ThUS$
|
Over 3
to 5
ThUS$
|
Over 5
ThUS$
|
Total
ThUS$
|
||||||||||||||||||||||||||
| 93.007.000-9 |
SQM S.A
|
Chile
|
Foreign
|
single
|
200.000.000 |
US$
|
6.79 | % | 6.13 | % |
Bi-annually
|
At maturity
|
- | - | 200,000 | 200,000 | |||||||||||||||||||||||||
| 93.007.000-9 |
SQM S.A
|
Chile
|
Chile
|
446 | C | 2.550.000 |
UF
|
6.63 | % | 4.00 | % |
Bi-annually
|
Bi-annually
|
10,111 | 10,111 | 65,718 | 85,940 | ||||||||||||||||||||||||
|
Total
|
10,111 | 10,111 | 265,718 | 285,940 | |||||||||||||||||||||||||||||||||||||
|
Bond issue costs
|
(781 | ) | (438 | ) | (3,059 | ) | (4,278 | ) | |||||||||||||||||||||||||||||||||
|
Total
|
9,330 | 9,673 | 262,659 | 281,662 | |||||||||||||||||||||||||||||||||||||
F-77
Notes to the consolidated Financial Statements as of December 31, 2010
(Translation of consolidated financial statements originally issued in Spanish – see Note 2.2)
Note 9 - Financial instruments (continued)
|
9.4
|
Financial liabilities (continued)
|
|
e)
|
Additional Information
|
|
-
|
Bonds
|
As of December 31, 2010, December 31, 2009 and January 1, 2009, ThUS$18,244, ThUS$14,504 and ThUS$7,344, respectively are presented at short-term related to principal, current portion plus interest accrued at that date, not including borrowing costs and bonds issuance costs . In the long-term, non-current, the Company presented ThUS$950,288 as of December 31, 2010, ThUS$660,542 as of December 31, 2009 and ThUS$281,662 as of January 1, 2009 related to principal installments of Series C bonds, unique Series bonds, Series G bonds, Series H bonds, Series J bonds, Series I bonds and single series second issuance bonds.
As of December 31, 2010, December 31, 2009 and January 1, 2009 the details of each issuance are as follows:
Series “C” bonds
On January 25, 2006, the Company placed Series C bonds for UF 3,000,000 (ThUS$101,918) at an annual rate of 4.00%
As of December 31, 2010 and 2009, the Company has made the following payments of principal and interest to comply with its obligations in relation to the Series C bonds.
|
Payments made
|
12.31.2010
|
12.31.2009
|
||||||||||||||
|
UF
|
ThUS$
|
UF
|
ThUS$
|
|||||||||||||
|
Principal
|
150,000.00 | 6,298 | 150,000.00 | 5,967 | ||||||||||||
|
Interest
|
99,515.01 | 4,175 | 105,456.30 | 4,191 | ||||||||||||
Single Series bonds
On April 5, 2006, the Company placed Single Series bonds for ThUS$200,000 at an annual rate of 6.125% under "Rule 144 and regulation S of the U.S. Securities Act of 1933."
As of December 31, 2010 and 2009, the Company has made the following payments of principal and interest to comply with its obligations in relation to the Single Series bonds.
|
12.31.2010
|
12.31.02009
|
|||||||
|
ThUS$
|
ThUS$
|
|||||||
|
Interest payments
|
12,250 | 12,250 | ||||||
F-78
Notes to the consolidated Financial Statements as of December 31, 2010
(Translation of consolidated financial statements originally issued in Spanish – see Note 2.2)
Note 9 - Financial instruments (continued)
|
9.4
|
Financial liabilities (continued)
|
Series “G” and “H” bonds
On January 13, 2009, the Company placed two bond series in the domestic market. Series H for UF 4,000,000 (ThUS$139,216) at an annual interest rate of 4.9% at a term of 21 years with payment of principal beginning in 2019 and Series G for ThCh$ 21,000,000 (ThUS$34,146), which was placed at a term of 5 years with a single payment at the maturity of the term and an annual interest rate of 7%.
As of December 31, 2010 and 2009, the Company has made the following payments of principal and interest to comply with its obligations in relation to the the Series G and H bonds line:
|
12.31.2010
ThUS$
|
12.31.2009
ThUS$
|
|||||||
|
Interest G series
|
2,750 | 1,330 | ||||||
|
Interest H series
|
7,763 | 3,727 | ||||||
Series “J” and “I” Bonds
On May 8, 2009, the Company placed two bond series in the domestic market. Series J for ThCh$52,000,000 (ThUS$92,456) which was placed at a term of 5 years with single payment at the expiration date of the term and annual interest rate of 5.5% and Series I for UF 1,500,000 (ThUS$56,051) which was placed at a term of 5 years with single payment at the maturity of the term and annual interest rate of 3.00%.
As of December 31, 2010 and 2009, the Company has made the following payments of principal and interest to comply with its obligations in relation to the Series J and I bonds:
|
12.31.2010
ThUS$
|
12.31.2009
ThUS$
|
|||||||
|
Interest J series
|
5,588 | 2,583 | ||||||
|
Interest I series
|
1,873 | 852 | ||||||
F-79
Notes to the consolidated Financial Statements as of December 31, 2010
(Translation of consolidated financial statements originally issued in Spanish – see Note 2.2)
Note 9 - Financial instruments (continued)
|
9.4
|
Financial liabilities (continued)
|
Single Series bonds (second issuance)
On April 21, 2010, the Company informed the Chilean Superintendence of Securities and Insurance of its placement in international markets of an unsecured bond of ThUS$250,000 maturing in ten years beginning on the aforementioned date with an annual interest rate of 5.5%.
As of December 31, 2010 and 2009, the Company has made the following payments of principal and interest to comply with its obligations in relation to the second-issuance single series bonds.
|
12.31.2010
ThUS$
|
12.31.2009
ThUS$
|
|||||||
|
Interest payments
|
6,875 | - | ||||||
|
-
|
Commercial papers (promissory notes)
|
On March 24, 2009, the Company placed promissory notes totaling ThCh$15,000,000 (ThUS$25,875) in the Chilean market. These notes are denominated series 2-A, line 46 and mature in 10 years. The maximum amount that can be issued is UF 1,500,000.
On December 15, 2009, the Company repaid Series 2-A.
On April 2, 2009, the Company placed promissory notes totaling ThCh$15,000,000 (ThUS$25,770) in the Chilean market. These notes are denominated series 1-B, line 47 and mature in 10 years. The maximum amount that can be issued is UF 1,500,000.
|
Payments made
|
12.31.2010
|
12.31.2009
|
||||||||||||||
|
ThCh$
|
ThUS$
|
ThCh$
|
ThUS$
|
|||||||||||||
|
Principal, Series 2-A
|
- | - | 15,000,000 | 30,270 | ||||||||||||
|
Principal, Series 1-B
|
15,000,000 | 29,040 | - | - | ||||||||||||
|
9.5
|
Trade and other accounts payable
|
|
Type of trade and other accounts payable
|
12.31.2010
ThUS$
|
12.31.2009
ThUS$
|
01.01.2009
ThUS$
|
|||||||||
|
Current trade and other accounts payable
|
||||||||||||
|
Trade accounts payable
|
151,516 | 184,499 | 109,465 | |||||||||
|
Rentals
|
207 | 300 | 226 | |||||||||
|
Other accounts payable
|
424 | 1,176 | 1,111 | |||||||||
|
Total
|
152,147 | 185,975 | 110,802 | |||||||||
The purchase commitments held by the Company are recognized as a liability when the services and goods are received by the Company. The Company has purchase order as of December 31, 2010 which amounts ThUS$ 51,347 (December 31, 2009 ThUS$ 122,651 and January 1, 2009 ThUS$ 215,356)
F-80
Notes to the consolidated Financial Statements as of December 31, 2010
(Translation of consolidated financial statements originally issued in Spanish – see Note 2.2)
Note 9 - Financial instruments (continued)
|
9.5
|
Trade and other accounts payable (continued)
|
|
Types of creditors and other accounts payable, non-current
|
12.31.2010
ThUS$
|
12.31.2009
ThUS$
|
01.01.2009
ThUS$
|
|||||||||
|
Lease liabilities
|
- | 187 | 398 | |||||||||
|
Total
|
- | 187 | 398 | |||||||||
|
9.6
|
Financial liabilities at fair value through profit or loss
|
This balance relates to derivative instruments, measured at fair value, the detail by type of instrument is as follows:
|
Financial liabilities at fair value
through profit or loss
|
12.31.2010
|
Effect on
profit or loss
as of
12.31.2010
|
12.31.2009
|
Effect on
profit or loss
as of
12.31.2009
|
01.01.2009
|
|||||||||||||||
|
ThUS$
|
ThUS$
|
ThUS$
|
ThUS$
|
ThUS$
|
||||||||||||||||
|
Current
|
||||||||||||||||||||
|
Derivative instruments (forwards)
|
15,818 | (15,818 | ) | 3,993 | (3,993 | ) | 5,029 | |||||||||||||
|
Derivative instruments (options)
|
2,535 | (2,535 | ) | 239 | (239 | ) | 2,129 | |||||||||||||
| 18,353 | (18,353 | ) | 4,232 | (4,232 | ) | 7,158 | ||||||||||||||
Balances in the column “effect on profit or loss” consider the annual effects of agreements that were in force as of December 31, 2010.
F-81
Notes to the consolidated Financial Statements as of December 31, 2010
(Translation of consolidated financial statements originally issued in Spanish – see Note 2.2)
Note 9 - Financial instruments (continued)
|
9.7
|
Financial asset and liability categories
|
|
Description of financial assets
|
12.31.2010
ThUS$
|
12.31.2009
ThUS$
|
01.01.2009
ThUS$
|
|||||||||
|
Financial assets at fair value through profit or loss
|
98,916 | 60,494 | 1,599 | |||||||||
|
Financial assets available for sale
|
69,818 | 169,798 | 40,344 | |||||||||
|
Investments held to maturity
|
118 | 113 | 101 | |||||||||
|
Loans and accounts receivable
|
377,047 | 330,031 | 335,557 | |||||||||
|
Financial assets available for sale
|
- | - | - | |||||||||
|
Total financial assets
|
545,899 | 560,436 | 377,601 | |||||||||
|
Description of financial liabilities
|
12.31.2010
ThUS$
|
12.31.2009
ThUS$
|
01.01.2009
ThUS$
|
|||||||||
|
Financial liabilities at fair value through profit or loss
|
18,353 | 4,232 | 7,158 | |||||||||
|
Financial liabilities measured at amortized cost
|
1,411,537 | 1.475,135 | 774,504 | |||||||||
|
Total financial liabilities
|
1,429,890 | 1,479,367 | 781,662 | |||||||||
|
9.8
|
Financial assets pledged as guarantee
|
On November 4, 2004, Isapre Norte Grande maintained a guarantee equivalent to the total amount owed to its members and healthcare providers, which is managed and maintained by Banco de Chile.
On October 15, 2009, SQM Brazil directly provided a guarantee to governmental entities related to legal processes under development, in a note issued by BBVA Bancomer S.A.
As of December 31, 2010 and December 31, 2009, assets pledged as guarantees are detailed as follows:
|
Restricted cash
|
12.31.2010
ThUS$
|
12.31.2009
ThUS$
|
||||||
|
Isapre Norte Grande Ltda.
|
514 | 446 | ||||||
|
SQM Brasil Limitada
|
- | 21 | ||||||
|
Total
|
514 | 467 | ||||||
F-82
Notes to the consolidated Financial Statements as of December 31, 2010
(Translation of consolidated financial statements originally issued in Spanish – see Note 2.2)
Note 9 - Financial instruments (continued)
|
9.9
|
Estimated fair value of financial instruments and derivative financial instruments
|
As required by IFRS 7, the following information is presented for the disclosure of the estimated fair value of financial assets and liabilities.
Although inputs represent Management's best estimate, they are subjective and involve significant estimates related to the current economic and market conditions, as well as risk factors.
Methodologies and assumptions used depend on the risk terms and characteristics of each instrument, and include the following as a summary:
|
-
|
Cash equivalents approximate fair value due to the short-term maturities of these instruments.
|
|
-
|
Other current financial liabilities are considered at fair value equal to their carrying values.
|
|
-
|
For interest-bearing liabilities with an original maturity of more than a year, fair values are calculated by discounting contractual cash flows at their original current market with similar terms.
|
|
-
|
For forward and swap contracts, fair value is determined using quoted market prices of financial instruments with similar characteristics.
|
F-83
Notes to the consolidated Financial Statements as of December 31, 2010
(Translation of consolidated financial statements originally issued in Spanish – see Note 2.2)
|
9.9
|
Estimated fair value of financial instruments and derivative financial instruments (continued)
|
The Company’s instruments, listed at carrying value and estimated fair value, are detailed as follows:
|
12.31.2010
|
12.31.2009
|
01.01.2009
|
||||||||||||||||||||||
|
Carrying
Value
|
Fair Value
|
Carrying
Value
|
Fair Value
|
Carrying
Value
|
Fair Value
|
|||||||||||||||||||
|
ThUS$
|
ThUS$
|
ThUS$
|
ThUS$
|
ThUS$
|
ThUS$
|
|||||||||||||||||||
|
Cash and cash equivalents
|
524,652 | 524,652 | 375,639 | 375,639 | 283,576 | 283,576 | ||||||||||||||||||
|
Current trade and other accounts receivable
|
375,945 | 375,945 | 325,823 | 325,823 | 334,791 | 334,791 | ||||||||||||||||||
|
Other current financial assets:
|
||||||||||||||||||||||||
|
- Time deposits (L2)
|
69,818 | 69,818 | 169,798 | 169,798 | 40,344 | 40,344 | ||||||||||||||||||
|
- Derivative instruments (L2)
|
1,363 | 1,363 | 9,155 | 9,155 | 1,599 | 1,599 | ||||||||||||||||||
|
- Current hedging assets (L2)
|
4,997 | 4,997 | 1,616 | 1,616 | - | - | ||||||||||||||||||
|
Total other current financial assets
|
76,178 | 76,178 | 180,569 | 180,569 | 41,943 | 41,943 | ||||||||||||||||||
|
Other non-current financial assets:
|
118 | 118 | 113 | 113 | 101 | 101 | ||||||||||||||||||
|
Non-current hedging assets (L2)
|
92,556 | 92,556 | 49,723 | 49,723 | - | - | ||||||||||||||||||
|
Total other non-current financial assets
|
92,674 | 92,674 | 49, 836 | 49,836 | 101 | 101 | ||||||||||||||||||
|
Other current financial liabilities
|
||||||||||||||||||||||||
|
- Bank loans
|
150,958 | 150,958 | 220,756 | 220,756 | 133,587 | 133,587 | ||||||||||||||||||
|
- Derivative instruments (L2)
|
18,353 | 18,353 | 4,232 | 4,232 | 7,158 | 7,158 | ||||||||||||||||||
|
- Hedging liabilities (L2)
|
- | - | - | - | 2,233 | 2,233 | ||||||||||||||||||
|
- Unsecured obligations
|
18,244 | 18,244 | 43,867 | 43,867 | 7,344 | 7,344 | ||||||||||||||||||
|
Total other current financial Liabilities
|
187,555 | 187,555 | 268,855 | 268,855 | 150,322 | 150,322 | ||||||||||||||||||
|
Trade accounts payable
|
152,147 | 152,147 | 185,975 | 185,975 | 110,802 | 110,802 | ||||||||||||||||||
|
Other non-current financial liabilities:
|
||||||||||||||||||||||||
|
- Bank loans
|
140,000 | 143,174 | 363,808 | 365,489 | 229,680 | 229,585 | ||||||||||||||||||
|
- Non-current hedging liabilities (L2)
|
- | - | - | - | 8,798 | 8,798 | ||||||||||||||||||
|
- Unsecured obligations
|
950,188 | 1,092,026 | 660,542 | 734,618 | 281,662 | 346,739 | ||||||||||||||||||
|
Total other non-current financial liabilities
|
1,090,188 | 1,235,200 | 1,024,350 | 1,100,107 | 520,140 | 585,122 | ||||||||||||||||||
Fair value hierarchy
Fair value hierarchies correspond to:
Level 1 (L1):
when only quoted (unadjusted) prices have been used in active markets.
Level 2 (L2) :
when in a phase in the valuation process variables other than prices quoted in Level 1 have been used which are directly observable in markets.
Level 3 (L3):
when in a phase in the valuation process, variables not based on observable market data have been used.
F-84
Notes to the consolidated Financial Statements as of December 31, 2010
(Translation of consolidated financial statements originally issued in Spanish – see Note 2.2)
|
10.1
|
Disclosures on investments in subsidiaries
|
|
a)
|
Operations acquired in 2010
|
On February 2, 2010, the subsidiary SQM Beijin Comercial was formed, to which SQM Industrial S.A. contributed capital of ThUS$100, obtaining an equity interest of 100% in that entity.
|
b)
|
Operations acquired in 2009
|
On
July 14, 2009, the subsidiary Comercial Agrorama Callegari Limitada was formed, to which Soquimich Comercial S.A. contributed capital of ThUS$1,021, thereby obtaining an equity interest of 70% in that entity.
On December 17, 2009, Soquimich European Holdings B.V. acquired 51% of SQM Agro India Private Ltda. for ThUS$50. Through this acquisition, it now holds an equity interest of 100% of this entity. The Company conducted the valuation considering the carrying value of the equity of SQM Agro India Private Ltda., which does not significantly differ from its fair value determined at that date.
The Company controls all the subsidiaries in which it has more than 50% direct or indirect voting rights.
F-85
Notes to the consolidated Financial Statements as of December 31, 2010
(Translation of consolidated financial statements originally issued in Spanish – see Note 2.2)
Note 10 - Investments and disclosures on Investments in subsidiaries (continued
)
|
10.1
|
Disclosures on investments in subsidiaries (continued)
|
Financial information as of December 31, 2010 of the companies included in the consolidation process is detailed as follows:
|
12.31.2010
|
||||||||||||||||||||||||||||||||||||||||
|
Assets
|
Liabilities
|
|||||||||||||||||||||||||||||||||||||||
|
Subsidiaries
|
Country
|
Functional
currency
|
Interest %
|
Current
ThUS$
|
Non-
current
ThUS$
|
Total
ThUS$
|
Current
ThUS$
|
Non-
current
ThUS$
|
Total
ThUS$
|
Revenue
ThUS$
|
Net profit
(loss)
ThUS$
|
|||||||||||||||||||||||||||||
|
SQM Nitratos S.A.
|
Chile
|
US dollar
|
100 | 652,776 | 61,542 | 714,318 | 610,283 | 11,599 | 621,882 | 134,842 | 29,622 | |||||||||||||||||||||||||||||
|
Proinsa Ltda.
|
Chile
|
Chilean peso
|
60.58 | 227 | 1 | 228 | - | - | - | - | - | |||||||||||||||||||||||||||||
|
SQMC Internacional Ltda.
|
Chile
|
Chilean peso
|
60.6382 | 302 | - | 302 | - | - | - | - | (2 | ) | ||||||||||||||||||||||||||||
|
SQM Potasio S.A.
|
Chile
|
US dollar
|
99.9974 | 58,331 | 604,872 | 663,203 | 2 | 172,351 | 172,353 | - | 139,838 | |||||||||||||||||||||||||||||
|
Serv. Integrales de Tránsito y Transf. S.A.
|
Chile
|
US dollar
|
100 | 149,255 | 60,290 | 209,545 | 182,671 | 4,437 | 187,108 | 45,446 | 10,113 | |||||||||||||||||||||||||||||
|
Isapre Norte Grande Ltda.
|
Chile
|
Chilean peso
|
100 | 570 | 591 | 1,161 | 581 | 154 | 735 | 4,018 | 20 | |||||||||||||||||||||||||||||
|
Ajay SQM Chile S.A.
|
Chile
|
US dollar
|
51 | 15,299 | 2,378 | 17,677 | 6,833 | 747 | 7,580 | 54,948 | 2,049 | |||||||||||||||||||||||||||||
|
Almacenes y Depósitos Ltda.
|
Chile
|
Chilean peso
|
100 | 413 | 52 | 465 | 1 | - | 1 | - | (13 | ) | ||||||||||||||||||||||||||||
|
SQM Salar S.A.
|
Chile
|
US dollar
|
100 | 365,830 | 658,793 | 1,024,623 | 273,758 | 98,885 | 372,643 | 631,151 | 185,315 | |||||||||||||||||||||||||||||
|
Comercial Hydro S.A.
|
Chile
|
Chilean peso
|
60.6382 | 6,890 | 329 | 7,219 | 40 | 73 | 113 | 185 | 217 | |||||||||||||||||||||||||||||
|
SQM Industrial S.A.
|
Chile
|
US dollar
|
100 | 1,063,080 | 596,723 | 1,659,803 | 854,130 | 51,512 | 905,642 | 690,541 | 130,230 | |||||||||||||||||||||||||||||
|
Minera Nueva Victoria S.A.
|
Chile
|
US dollar
|
100 | 73,217 | 53,754 | 126,971 | 445 | 2,495 | 2,940 | 1,578 | 4,369 | |||||||||||||||||||||||||||||
|
Exploraciones Mineras S.A.
|
Chile
|
US dollar
|
100 | 438 | 31,380 | 31,818 | 3,814 | - | 3,814 | - | (178 | ) | ||||||||||||||||||||||||||||
|
Sociedad Prestadora de Servicios de Salud Cruz del Norte S.A.
|
Chile
|
Chilean peso
|
100 | 645 | 93 | 738 | 224 | 367 | 591 | 1,897 | (3 | ) | ||||||||||||||||||||||||||||
|
Soquimich Comercial S.A.
|
Chile
|
US dollar
|
60.6383 | 140,678 | 15,875 | 156,553 | 48,195 | 1,181 | 49,376 | 171,181 | 10,107 | |||||||||||||||||||||||||||||
|
Agrorama Callegari Ltda.
|
Chile
|
Chilean peso
|
42.4468 | 5,024 | 1,492 | 6,516 | 4,998 | 117 | 5,115 | 6,910 | (293 | ) | ||||||||||||||||||||||||||||
|
SQM North América Corp.
|
United States
|
US dollar
|
100 | 109,944 | 15,448 | 125,392 | 90,533 | 2,644 | 93,177 | 226,249 | 8,143 | |||||||||||||||||||||||||||||
|
RS Agro Chemical.Trading A.V.V.
|
Aruba
|
US dollar
|
100 | 5,227 | - | 5,227 | - | - | - | - | (5 | ) | ||||||||||||||||||||||||||||
|
Nitratos Naturais do Chile Ltda.
|
Brazil
|
US dollar
|
100 | 5 | 290 | 295 | 5,022 | - | 5,022 | - | (124 | ) | ||||||||||||||||||||||||||||
F-86
Notes to the consolidated Financial Statements as of December 31, 2010
(Translation of consolidated financial statements originally issued in Spanish – see Note 2.2)
Note 10 - Investments and disclosures on Investments in subsidiaries (continued
)
|
10.1
|
Disclosures on investments in subsidiaries (continued)
|
|
12.31.2010
|
||||||||||||||||||||||||||||||||||||||
|
Assets
|
Liabilities
|
|||||||||||||||||||||||||||||||||||||
|
Subsidiaries
|
Country
|
Functional
currency
|
Interest %
|
Current
ThUS$
|
Non-
current
ThUS$
|
Total
ThUS$
|
Current
ThUS$
|
Non-
current
ThUS$
|
Total
ThUS$
|
Revenue
ThUS$
|
Net profit
(loss)
ThUS$
|
|||||||||||||||||||||||||||
|
Nitrate Corporation of Chile Ltd.
|
England
|
US dollar
|
100 | 5,076 | - | 5,076 | - | - | - | - | - | |||||||||||||||||||||||||||
|
SQM Corporation N.V.
|
Dutch Antilles
|
US dollar
|
100 | 669 | 52,607 | 53,276 | 3,712 | - | 3,712 | - | 13,472 | |||||||||||||||||||||||||||
|
SQM Perú S.A.
|
Peru
|
US dollar
|
100 | 15,159 | 483 | 15,642 | 15,027 | - | 15,027 | 24,536 | 1,236 | |||||||||||||||||||||||||||
|
SQM Ecuador S.A.
|
Ecuador
|
US dollar
|
100 | 8,716 | 71 | 8,787 | 8,149 | - | 8,149 | 16,808 | 298 | |||||||||||||||||||||||||||
|
SQM Brasil Ltda.
|
Brazil
|
US dollar
|
100 | 295 | 75 | 370 | 1,180 | - | 1,180 | 771 | 17 | |||||||||||||||||||||||||||
|
SQI Corporation NV.
|
Dutch Antilles
|
US dollar
|
100 | - | 10 | 10 | 33 | - | 33 | - | - | |||||||||||||||||||||||||||
|
SQMC Holding Corporation L.L.P.
|
United States
|
US dollar
|
100 | 1,501 | 8,498 | 9,999 | 619 | - | 619 | - | 492 | |||||||||||||||||||||||||||
|
SQM Japan Co. Ltd.
|
Japan
|
US dollar
|
100 | 1,440 | 633 | 2,073 | 263 | 436 | 699 | 1,855 | 218 | |||||||||||||||||||||||||||
|
SQM Europe N.V.
|
Belgium
|
US dollar
|
100 | 358,214 | 454 | 358,668 | 341,425 | - | 341,425 | 861,596 | 7,107 | |||||||||||||||||||||||||||
|
SQM Italia SRL
|
Italy
|
US dollar
|
100 | 1,377 | - | 1,377 | 17 | - | 17 | - | - | |||||||||||||||||||||||||||
|
SQM Indonesia S.A.
|
Indonesia
|
US dollar
|
80 | 5 | - | 5 | 1 | - | 1 | - | - | |||||||||||||||||||||||||||
|
North American Trading Company
|
United States
|
US dollar
|
100 | 161 | 145 | 306 | 39 | - | 39 | - | - | |||||||||||||||||||||||||||
|
SQM Virginia LLC
|
United States
|
US dollar
|
100 | 14,834 | 14,379 | 29,213 | 14,834 | - | 14,834 | - | (1 | ) | ||||||||||||||||||||||||||
|
SQM Comercial de México S.A. de C.V.
|
Mexico
|
US dollar
|
100 | 58,332 | 1,410 | 59,742 | 60,646 | - | 60,646 | 130,861 | (1,523 | ) | ||||||||||||||||||||||||||
F-87
Notes to the consolidated Financial Statements as of December 31, 2010
(Translation of consolidated financial statements originally issued in Spanish – see Note 2.2)
Note 10 - Investments and disclosures on Investments in subsidiaries (continued
)
|
10.1
|
Disclosures on investments in subsidiaries (continued)
|
|
12.31.2010
|
||||||||||||||||||||||||||||||||||||||
|
Assets
|
Liabilities
|
|||||||||||||||||||||||||||||||||||||
|
Subsidiaries
|
Country
|
Functional
currency
|
% Interest
|
Current
ThUS$
|
Non-
current
ThUS$
|
Total
ThUS$
|
Current
ThUS$
|
Non-
current
ThUS$
|
Total
ThUS$
|
Operating
Revenues
ThUS$
|
Net
profit
(loss)
ThUS$
|
|||||||||||||||||||||||||||
|
SQM Investment Corporation N.V.
|
Dutch Antilles
|
US dollar
|
100 | 71,100 | 551 | 71,651 | 49,515 | 742 | 50,257 | 14,255 | 587 | |||||||||||||||||||||||||||
|
Royal Seed Trading Corporation A.V.V.
|
Aruba
|
US dollar
|
100 | 88,567 | - | 88,567 | 96,627 | - | 96,627 | - | (9,058 | ) | ||||||||||||||||||||||||||
|
SQM Lithium Specialties LLP
|
United States
|
US dollar
|
100 | 15,786 | 3 | 15,789 | 1,264 | - | 1,264 | - | (1 | ) | ||||||||||||||||||||||||||
|
Soquimich SRL Argentina
|
Argentina
|
US dollar
|
100 | 472 | - | 472 | 109 | - | 109 | - | (83 | ) | ||||||||||||||||||||||||||
|
Comercial Caimán Internacional S.A.
|
Panama
|
US dollar
|
100 | 339 | - | 339 | 1,080 | - | 1,080 | - | (174 | ) | ||||||||||||||||||||||||||
|
SQM France S.A.
|
France
|
US dollar
|
100 | 345 | 6 | 351 | 114 | - | 114 | - | - | |||||||||||||||||||||||||||
|
Administración y Servicios Santiago S.A. de C.V.
|
Mexico
|
US dollar
|
100 | 47 | - | 47 | 854 | 195 | 1,049 | 2,597 | (173 | ) | ||||||||||||||||||||||||||
|
SQM Nitratos México S.A. de C.V.
|
Mexico
|
US dollar
|
51 | 27 | 1 | 28 | 17 | - | 17 | 128 | 4 | |||||||||||||||||||||||||||
|
Soquimich European Holding B.V.
|
Netherlands
|
US dollar
|
100 | 68,722 | 71,384 | 140,106 | 94,565 | - | 94,565 | - | 12,481 | |||||||||||||||||||||||||||
|
Fertilizantes Naturales S.A.
|
Spain
|
US dollar
|
66.67 | 16,515 | (10 | ) | 16,505 | 15,175 | - | 15,175 | 64,748 | 749 | ||||||||||||||||||||||||||
|
Iodine Minera B.V.
|
Netherlands
|
US dollar
|
100 | 10,122 | - | 10,122 | 1 | - | 1 | 1,467 | 1,175 | |||||||||||||||||||||||||||
|
SQM Africa Pty Ltd.
|
South Africa
|
US dollar
|
100 | 38,463 | 147 | 38,610 | 36,736 | - | 36,736 | 94,111 | 149 | |||||||||||||||||||||||||||
|
SQM Venezuela S.A.
|
Venezuela
|
US dollar
|
100 | 80 | - | 80 | 402 | - | 402 | - | (161 | ) | ||||||||||||||||||||||||||
|
SQM Oceanía Pty Ltd.
|
Australia
|
US dollar
|
100 | 1,466 | - | 1,466 | 533 | - | 533 | 2,207 | 120 | |||||||||||||||||||||||||||
|
SQM Agro India Pvt. Ltd.
|
India
|
US dollar
|
100 | 231 | 4 | 235 | 149 | - | 149 | - | (14 | ) | ||||||||||||||||||||||||||
|
SQM Beijin Commercial Co. Ltd.
|
China
|
US dollar
|
100 | 131 | 42 | 173 | 77 | - | 77 | 1,462 | (4 | ) | ||||||||||||||||||||||||||
|
Total
|
3,426,343 | 2,254,796 | 5,681,139 | 2,824,693 | 347,935 | 3,172,628 | 3,186,348 | 546,318 | ||||||||||||||||||||||||||||||
F-88
Notes to the consolidated Financial Statements as of December 31, 2010
(Translation of consolidated financial statements originally issued in Spanish – see Note 2.2)
Note 10 - Investments and disclosures on Investments in subsidiaries (continued
)
|
10.1
|
Disclosures on investments in subsidiaries (continued)
|
Financial information as of December 31, 2009 of the companies included in the consolidation process is detailed as follows:
|
12.31.2009
|
||||||||||||||||||||||||||||||||||||||
|
Assets
|
Liabilities
|
|||||||||||||||||||||||||||||||||||||
|
Subsidiaries
|
Country
|
Functional
currency
|
Interest %
|
Current
ThUS$
|
Non-
current
ThUS$
|
Total
ThUS$
|
Current
ThUS$
|
Non-
current
ThUS$
|
Total
ThUS$
|
Revenue
ThUS$
|
Net profit
(loss)
ThUS$
|
|||||||||||||||||||||||||||
|
SQM Nitratos S.A.
|
Chile
|
US dollar
|
100.00 | 455,452 | 66,564 | 522,016 | 447,246 | 11,956 | 459,202 | 167,562 | 45,972 | |||||||||||||||||||||||||||
|
Proinsa Ltda.
|
Chile
|
Chilean peso
|
60.58 | 209 | 1 | 210 | - | - | - | - | 4 | |||||||||||||||||||||||||||
|
SQMC Internacional Ltda.
|
Chile
|
Chilean peso
|
60.6382 | 281 | - | 281 | - | - | - | - | 5 | |||||||||||||||||||||||||||
|
SQM Potasio S.A.
|
Chile
|
US dollar
|
99.9974 | 100,257 | 498,631 | 598,888 | 1 | 198,902 | 198,903 | - | 101,711 | |||||||||||||||||||||||||||
|
Serv. Integrales de Tránsito y Transf. S.A.
|
Chile
|
US dollar
|
100.00 | 93,505 | 56,361 | 149,866 | 135,104 | 2,439 | 137,543 | 28,066 | 385 | |||||||||||||||||||||||||||
|
Isapre Norte Grande Ltda.
|
Chile
|
Peso Chileno
|
100.00 | 439 | 521 | 960 | 466 | 119 | 585 | 3,780 | 17 | |||||||||||||||||||||||||||
|
Ajay SQM Chile S.A.
|
Chile
|
US dollar
|
51.00 | 12,816 | 3,829 | 16,645 | 6,221 | 1,662 | 7,883 | 35,752 | 722 | |||||||||||||||||||||||||||
|
Almacenes y Depósitos Ltda.
|
Chile
|
Chilean peso
|
100.00 | 383 | 46 | 429 | 1 | - | 1 | - | 7 | |||||||||||||||||||||||||||
|
SQM Salar S.A.
|
Chile
|
US dollar
|
100.00 | 388,082 | 526,431 | 914,513 | 301,143 | 86,784 | 387,927 | 477,878 | 161,346 | |||||||||||||||||||||||||||
|
Comercial Hydro S.A.
|
Chile
|
Chilean peso
|
60.6382 | 6,105 | 365 | 6,470 | 44 | 66 | 110 | 69 | 256 | |||||||||||||||||||||||||||
|
SQM Industrial S.A.
|
Chile
|
US dollar
|
100.00 | 844,030 | 537,981 | 1,382,011 | 728,276 | 30,582 | 758,858 | 628,703 | 28,891 | |||||||||||||||||||||||||||
|
Minera Nueva Victoria S.A.
|
Chile
|
US dollar
|
100.00 | 68,861 | 55,213 | 124,074 | 1,928 | 2,484 | 4,412 | 1,895 | 3,812 | |||||||||||||||||||||||||||
|
Exploraciones Mineras S.A.
|
Chile
|
US dollar
|
100.00 | 403 | 31,344 | 31,747 | 3,565 | - | 3,565 | - | (183 | ) | ||||||||||||||||||||||||||
|
Sociedad Prestadora de Servicios de Salud Cruz del Norte S.A.
|
Chile
|
Chilean peso
|
100.00 | 549 | 110 | 659 | 216 | 305 | 521 | 1,658 | (33 | ) | ||||||||||||||||||||||||||
|
Soquimich Comercial S.A.
|
Chile
|
US dollar
|
60.6383 | 144,525 | 15,133 | 159,658 | 54,876 | 1,145 | 56,021 | 188,072 | 3,503 | |||||||||||||||||||||||||||
|
Agrorama Callegari Ltda.
|
Chile
|
Chilean peso
|
42.4468 | 2,130 | 173 | 2,303 | 740 | - | 740 | 1,211 | (7 | ) | ||||||||||||||||||||||||||
|
SQM North América Corp.
|
United States
|
US dollar
|
100.00 | 137,329 | 15,540 | 152,869 | 126,097 | 3,644 | 129,741 | 191,520 | (761 | ) | ||||||||||||||||||||||||||
|
RS Agro Chemical.Trading A.V.V.
|
Aruba
|
US dollar
|
100.00 | 5,232 | - | 5,232 | - | - | - | - | (4 | ) | ||||||||||||||||||||||||||
|
Nitratos Naturais do Chile Ltda.
|
Brazil
|
US dollar
|
100.00 | 6 | 287 | 293 | 4,896 | - | 4,896 | - | (572 | ) | ||||||||||||||||||||||||||
F-89
Notes to the consolidated Financial Statements as of December 31, 2010
(Translation of consolidated financial statements originally issued in Spanish – see Note 2.2)
Note 10 - Investments and disclosures on Investments in subsidiaries (continued
)
|
10.1
|
Disclosures on investments in subsidiaries (continued)
|
|
12.31.2009
|
||||||||||||||||||||||||||||||||||||||
|
Assets
|
Liabilities
|
|||||||||||||||||||||||||||||||||||||
|
Subsidiaries
|
Country
|
Functional
currency
|
Interest %
|
Current
ThUS$
|
Non-
current
ThUS$
|
Total
ThUS$
|
Current
ThUS$
|
Non-
current
ThUS$
|
Total
ThUS$
|
Revenue
|
Net profit
(loss)
|
|||||||||||||||||||||||||||
|
Nitrate Corporation of Chile Ltd.
|
England
|
US dollar
|
100.00 | 5,076 | - | 5,076 | - | - | - | - | - | |||||||||||||||||||||||||||
|
SQM Corporation N.V.
|
Dutch Antilles
|
US dollar
|
100.00 | 669 | 39,365 | 40,034 | 3,688 | - | 3,688 | - | 1,523 | |||||||||||||||||||||||||||
|
SQM Perú S.A.
|
Peru
|
US dollar
|
100.00 | 29,200 | 144 | 29,344 | 29,965 | - | 29,965 | 17,791 | (2,583 | ) | ||||||||||||||||||||||||||
|
SQM Ecuador S.A.
|
Ecuador
|
US dollar
|
100.00 | 6,218 | 81 | 6,299 | 5,992 | - | 5,992 | 12,960 | (183 | ) | ||||||||||||||||||||||||||
|
SQM Brasil Ltda.
|
Brazil
|
US dollar
|
100.00 | 245 | 77 | 322 | 1,149 | - | 1,149 | 844 | (131 | ) | ||||||||||||||||||||||||||
|
SQI Corporation NV.
|
Dutch Antilles
|
US dollar
|
100.00 | - | 7 | 7 | 31 | - | 31 | - | (2 | ) | ||||||||||||||||||||||||||
|
SQM Japan Co. Ltd.
|
Japan
|
US dollar
|
100.00 | 1,075 | 509 | 1,584 | 103 | 326 | 429 | 1,395 | 10 | |||||||||||||||||||||||||||
|
SQMC Holding Corporation L.L.P.
|
United States
|
US dollar
|
100.00 | 1,443 | 7,678 | 9,121 | 358 | - | 358 | - | 1,632 | |||||||||||||||||||||||||||
|
SQM Europe N.V.
|
Belgium
|
US dollar
|
100.00 | 274,514 | 502 | 275,016 | 265,171 | - | 265,171 | 510,837 | 6,755 | |||||||||||||||||||||||||||
|
SQM Italia SRL
|
Italy
|
US dollar
|
100.00 | 1,485 | - | 1,485 | 19 | - | 19 | - | - | |||||||||||||||||||||||||||
|
SQM Indonesia S.A.
|
Indonesia
|
US dollar
|
80.00 | 5 | - | 5 | 1 | - | 1 | - | 181 | |||||||||||||||||||||||||||
|
North American Trading Company
|
United States
|
US dollar
|
100.00 | 162 | 145 | 307 | 39 | - | 39 | - | (1 | ) | ||||||||||||||||||||||||||
|
SQM Virginia LLC
|
United States
|
US dollar
|
100.00 | 14,834 | 14,380 | 29,214 | 14,834 | - | 14,834 | - | (99 | ) | ||||||||||||||||||||||||||
|
SQM Comercial de México S.A. de C.V.
|
Mexico
|
US dollar
|
100.00 | 60,370 | 2,128 | 62,498 | 61,880 | - | 61,880 | 129,083 | (10,090 | ) | ||||||||||||||||||||||||||
F-90
Notes to the consolidated Financial Statements as of December 31, 2010
(Translation of consolidated financial statements originally issued in Spanish – see Note 2.2)
|
10.1
|
Disclosures on investments in subsidiaries (continued)
|
|
12.31.2009
|
||||||||||||||||||||||||||||||||||||||
|
Assets
|
Liabilities
|
|||||||||||||||||||||||||||||||||||||
|
Subsidiaries
|
Country
|
Functional
currency
|
Interest %
|
Current
ThUS$
|
Non-
current
ThUS$
|
Total
ThUS$
|
Current
ThUS$
|
Non-
current
ThUS$
|
Total
ThUS$
|
Revenue
|
Net profit
(loss)
|
|||||||||||||||||||||||||||
|
SQM investment Corporation N.V.
|
Dutch Antilles
|
US dollar
|
100.00 | 136,349 | 847 | 137,196 | 115,793 | 572 | 116,365 | 14,746 | (21,843 | ) | ||||||||||||||||||||||||||
|
Royal Seed Trading Corporation A.V.V.
|
Aruba
|
US dollar
|
100.00 | 255,328 | 793 | 256,121 | 100,123 | 155,000 | 255,123 | - | 1,777 | |||||||||||||||||||||||||||
|
SQM Lithium Specialties LLP
|
United States
|
US dollar
|
100.00 | 15,787 | 3 | 15,790 | 1,264 | - | 1,264 | - | (100 | ) | ||||||||||||||||||||||||||
|
Soquimich SRL Argentina
|
Argentina
|
US dollar
|
100.00 | 564 | - | 564 | 118 | - | 118 | - | (14 | ) | ||||||||||||||||||||||||||
|
Comercial Caimán Internacional S.A.
|
Panama
|
US dollar
|
100.00 | 1,345 | - | 1,345 | 1,912 | - | 1,912 | 1,092 | 220 | |||||||||||||||||||||||||||
|
SQM France S.A.
|
France
|
US dollar
|
100.00 | 345 | 6 | 351 | 114 | - | 114 | - | - | |||||||||||||||||||||||||||
|
Administración y Servicios Santiago S.A. de C.V.
|
Mexico
|
US dollar
|
100.00 | 20 | - | 20 | 664 | 185 | 849 | 2,830 | (55 | ) | ||||||||||||||||||||||||||
|
SQM Nitratos México S.A. de C.V.
|
Mexico
|
US dollar
|
51.00 | 19 | 1 | 20 | 13 | - | 13 | 110 | (14 | ) | ||||||||||||||||||||||||||
|
Soquimich European Holding B.V.
|
Dutch Antilles
|
US dollar
|
100.00 | 97,854 | 60,645 | 158,499 | 125,168 | 38 | 125,206 | - | 1,137 | |||||||||||||||||||||||||||
|
Fertilizantes Naturales S.A.
|
Spain
|
US dollar
|
66.67 | 16,872 | 3 | 16,875 | 16,293 | - | 16,293 | 52,872 | (689 | ) | ||||||||||||||||||||||||||
|
Iodine Minera B.V.
|
Dutch Antilles
|
US dollar
|
100.00 | 8,959 | - | 8,959 | 14 | - | 14 | 1,330 | 1,864 | |||||||||||||||||||||||||||
|
SQM Africa Pty Ltd.
|
South Africa
|
US dollar
|
100.00 | 61,289 | 153 | 61,442 | 59,834 | - | 59,834 | 75,438 | (1,181 | ) | ||||||||||||||||||||||||||
|
SQM Venezuela S.A.
|
Venezuela
|
US dollar
|
100.00 | 91 | - | 91 | 399 | - | 399 | - | - | |||||||||||||||||||||||||||
|
SQM Oceanía Pty Ltd.
|
Australia
|
US dollar
|
100.00 | 2,509 | - | 2,509 | 1,934 | - | 1,934 | 1,679 | 429 | |||||||||||||||||||||||||||
|
SQM Agro India Pvt. Ltd.
|
India
|
US dollar
|
100.00 | 242 | 3 | 245 | 284 | - | 284 | - | (213 | ) | ||||||||||||||||||||||||||
|
SQM Dubai Fzco.
|
UAE
|
US dollar
|
- | - | - | - | - | - | - | 5,198 | - | |||||||||||||||||||||||||||
|
Total
|
3,253,463 | 1,936,000 | 5,189,463 | 2,617,977 | 496,209 | 3,114,186 | 2,554,371 | 323,401 | ||||||||||||||||||||||||||||||
F-91
Notes to the consolidated Financial Statements as of December 31, 2010
(Translation of consolidated financial statements originally issued in Spanish – see Note 2.2)
|
11.1
|
Investments in associates accounted for using the equity method
|
As of December 31, 2010, December 31, 2009 and as of January 1, 2009, in accordance with criteria established in Note 2.4 and Note 2.12, investments in associates accounted for using the equity method and investments in joint ventures are detailed as follows:
|
Note
Nº
|
12.31.2010
ThUS$
|
12.31.2009
ThUS$
|
01.01.2009
ThUS$
|
||||||||||
|
Investments in associates
|
11.1 to 11.3
|
38,262 | 35,163 | 36,934 | |||||||||
|
Joint ventures
|
12.0 to 12.4
|
24,009 | 20,022 | - | |||||||||
|
Total
|
62,271 | 55,185 | 36,934 | ||||||||||
F-92
Notes to the consolidated Financial Statements as of December 31, 2010
(Translation of consolidated financial statements originally issued in Spanish – see Note 2.2)
Note 11 - Investments in associates accounted for using the Equity method (continued)
|
11.2
|
Assets, liabilities, revenues and expenses of associates
|
|
12.31.2010
|
|||||||||||||||||||||||||||||||||||
|
Asstes
|
Liabilities
|
||||||||||||||||||||||||||||||||||
|
Tax ID
|
Associate
|
Country of
incorporation
|
Functional currency
|
Current
ThUS$
|
Non-
current
ThUS$
|
Total
ThUS$
|
Current
ThUS$
|
Non-
current
ThUS$
|
Total
ThUS$
|
Revenue
ThUS$
|
Profit (loss)
ThUS$
|
||||||||||||||||||||||||
|
77.557.430-5
|
Sales de Magnesio Ltda.
|
Chile
|
Chilean peso
|
3,844 | 3 | 3,847 | 1,143 | - | 1,143 | 6,494 | 1,408 | ||||||||||||||||||||||||
|
Foreign
|
Abu Dhabi Fertilizer Industries WWL
|
Arabia
|
Dirham of the United Arab Emirates
|
19,909 | 2,092 | 22,001 | 7,869 | - | 7,869 | 35,506 | 1,960 | ||||||||||||||||||||||||
|
Foreign
|
Doktor Tarsa Tarim Sanayi AS
|
Turkey
|
Turkish Lira
|
49,013 | 7,840 | 56,853 | 33,229 | 27 | 33,256 | 64,540 | 8,003 | ||||||||||||||||||||||||
|
Foreign
|
Nutrisi Holding N.V.
|
Belgium
|
Euro
|
449 | 10,768 | 11,217 | 3,228 | - | 3,228 | - | 3,056 | ||||||||||||||||||||||||
|
Foreign
|
Ajay North America
|
United States
|
US dollar
|
15,585 | 6,926 | 22,511 | 5,168 | - | 5,168 | 52,237 | 4,143 | ||||||||||||||||||||||||
|
Foreign
|
Nutrichem Benelux
|
Belgium
|
Euro
|
- | - | - | - | - | - | - | - | ||||||||||||||||||||||||
|
Foreign
|
Ajay Europe SARL
|
France
|
Euro
|
15,428 | 2,223 | 17,651 | 6,519 | - | 6,519 | 41,992 | 2,212 | ||||||||||||||||||||||||
|
Foreign
|
Generale De Nutrition
|
Belgium
|
Euro
|
- | - | - | - | - | - | - | - | ||||||||||||||||||||||||
|
Foreign
|
Mirs Specialty Fertilizers
|
Egypt
|
Egyptian pound
|
3,013 | 3,214 | 6,227 | 2,980 | 226 | 3,206 | 4,231 | (521 | ) | |||||||||||||||||||||||
|
Foreign
|
SQM Eastmed Turkey
|
Turkey
|
Euro
|
34 | 592 | 626 | 247 | - | 247 | 646 | - | ||||||||||||||||||||||||
|
Foreign
|
SQM Thailand Co. Ltd.
|
Thailand
|
Thai Bath
|
5,307 | 587 | 5,894 | 2,035 | - | 2,035 | 11,149 | 594 | ||||||||||||||||||||||||
|
Total
|
112,582 | 34,245 | 146,827 | 62,418 | 253 | 62,671 | 216,795 | 20,855 | |||||||||||||||||||||||||||
|
12.31.2009
|
|||||||||||||||||||||||||||||||||||
|
Assets
|
Liabilities
|
||||||||||||||||||||||||||||||||||
|
Tax ID
|
Associate
|
Country of
incorporation
|
Functional currency
|
Current
ThUS$
|
Non-
current
ThUS$
|
Total
ThUS$
|
Current
ThUS$
|
Non-
current
ThUS$
|
Total
ThUS$
|
Revenue
ThUS$
|
Profit (loss)
ThUS$
|
||||||||||||||||||||||||
|
77.557.430-5
|
Sales de Magnesio Ltda.
|
Chile
|
Chilean peso
|
1,850 | 2 | 1,852 | 1,195 | - | 1,195 | 2,362 | 354 | ||||||||||||||||||||||||
|
Foreign
|
Abu Dhabi Fertilizer Industries WWL
|
Arabia
|
Dirham of the United Arab Emirates
|
14,559 | 2,746 | 17,305 | 5,163 | - | 5,163 | 26,173 | 1,547 | ||||||||||||||||||||||||
|
Foreign
|
Doktor Tarsa Tarim Sanayi AS
|
Turkey
|
Turkish Lira
|
36,022 | 6,032 | 42,054 | 22,545 | 2,525 | 25,070 | 58,850 | 3,678 | ||||||||||||||||||||||||
|
Foreign
|
Nutrisi Holding N.V.
|
Belgium
|
Euro
|
(552 | ) | 14,913 | 14,361 | 1,494 | - | 1,494 | - | (2,120 | ) | ||||||||||||||||||||||
|
Foreign
|
Ajay North America
|
United States
|
US dollar
|
12,471 | 7,046 | 19,517 | 3,848 | - | 3,848 | 28,594 | 4,097 | ||||||||||||||||||||||||
|
Foreign
|
Nutrichem Benelux
|
Belgium
|
Euro
|
- | - | - | - | - | - | - | - | ||||||||||||||||||||||||
|
Foreign
|
Ajay Europe SARL
|
France
|
Euro
|
12,830 | 2,325 | 15,155 | 4,181 | - | 4,181 | 20,788 | 1,449 | ||||||||||||||||||||||||
|
Foreign
|
Generale De Nutrition
|
Belgium
|
Euro
|
- | - | - | - | - | - | - | - | ||||||||||||||||||||||||
|
Foreign
|
Mirs Specialty Fertilizers
|
Egypt
|
Egyptian pound
|
2,708 | 3,858 | 6,566 | 2,542 | 275 | 2,817 | 5,400 | 882 | ||||||||||||||||||||||||
|
Foreign
|
SQM Eastmed Turkey
|
Turkey
|
Euro
|
764 | 636 | 1,400 | 998 | - | 998 | 793 | (11 | ) | |||||||||||||||||||||||
|
Foreign
|
SQM Thailand Co. Ltd.
|
Thailand
|
Thai Bath
|
6,119 | 574 | 6,693 | 2,999 | - | 2,999 | 9,691 | 430 | ||||||||||||||||||||||||
|
Total
|
86,771 | 38,132 | 124,903 | 44,965 | 2,800 | 47,765 | 152,631 | 10,306 | |||||||||||||||||||||||||||
F-93
Notes to the consolidated Financial Statements as of December 31, 2010
(Translation of consolidated financial statements originally issued in Spanish – see Note 2.2)
|
11.3
|
Details of investments in associates
|
The interest of SQM S.A., in its associates is detailed as follows:
|
Associate Name
|
Main Activities of Associate
|
% Interest
|
Investment
12.31.2010
ThUS$
|
Investment
12.31.2009
ThUS$
|
Investment
01.01.2009
ThUS$
|
||||||||||||
|
Sales de Magnesio Ltda.
|
Magnesium salt trader.
|
50 | % | 1,352 | 328 | 473 | |||||||||||
|
Abu Dhabi Fertilizer Industries Co. W.W.L.
|
Distribution and trade of specialty vegetal nutrients in the Middle East.
|
50 | % | 7,066 | 6,072 | 5,278 | |||||||||||
|
Ajay North America L.L.C
|
Production and trade of iodine by-products.
|
49 | % | 7,251 | 6,653 | 4,892 | |||||||||||
|
Doktor Tarsa Tarim Sanayi AS
|
Distribution and trade of specialty vegetal nutrients in Turkey.
|
50 | % | 11,799 | 8,492 | 11,212 | |||||||||||
|
Nutrisi Holding N.V.
|
Holding
|
50 | % | 3,551 | 6,239 | 6,823 | |||||||||||
|
Ajay Europe SARL
|
Production and distribution of iodine and iodine products
|
50 | % | 4,076 | 3,920 | 4,282 | |||||||||||
|
Mirs Specialty Fertilizers S.A.E.
|
Production and trade of liquid fertilizers for Egypt
|
47.4857 | % | 1,435 | 1,780 | 2,247 | |||||||||||
|
SQM Agro India PVT Ltda.
|
Agent and distributor of specialty vegetal nutrients.
|
49 | % | - | - | 94 | |||||||||||
|
SQM Eastmed Turkey
|
Production and trade of specialty products
|
50 | % | 189 | 201 | 219 | |||||||||||
|
SQM Thailand Co. Ltd.
|
Distribution and trade of specialty vegetal nutrients.
|
40 | % | 1,543 | 1,478 | 1,414 | |||||||||||
|
Total
|
38,262 | 35,163 | 36,934 | ||||||||||||||
The Company does not have an interest in unrecognized losses in investments in associates.
The Company does not have any associates not accounted for using the equity method.
|
12.1
|
Policy for accounting for joint ventures in a Parent Company’s separate financial statements
|
The method for the recognition of joint ventures in which equity interest is initially recorded at cost and subsequently adjusted considering changes after the acquisition in the portion of the entity’s net assets which correspond to the investor. Profit for the year of the investor will receive the portion which belongs to it in profit or loss of the entity under joint control.
|
12.2
|
Disclosures on interest in joint ventures
|
|
a)
|
Operations acquired in 2010
|
On March 4, 2010, SQM Industrial entered an agreement with Qingdao Star Plant Protection Technology Co., Ltd., by means of which the companies formed a joint venture, SQM Qingdao-Star Co, Ltd. Each party made a capital contribution of ThUS$2,000 for an interest of 50%.
On June 24, 2010, SQM Industrial S.A. made a contribution of ThUS$2,500 in SQM Migao Sichuan.
F-94
Notes to the consolidated Financial Statements as of December 31, 2010
(Translation of consolidated financial statements originally issued in Spanish – see Note 2.2)
|
12.2
|
Disclosures on interest in joint ventures (continued)
|
|
b)
|
Operations acquired in 2009
|
On October 9, 2009, the subsidiary Soquimich European Holdings formed a joint venture with Coromandel Fertilizers Limited, Coromandel SQM. Each party made capital contributions of ThUS$2,200 for an interest of 50%.
On March 18, 2009, a shareholder agreement was entered to incorporate Sichuan SQM-Migao Chemical Fertilizer Co. Ltda. and the process for the registration and obtaining of licenses ended on September 1, 2009.
SQM Industrial S.A. made its first capital contribution of ThUS$3,000 on November 6, 2009 from a total contribution of ThUS$10,000 by each party. Contributions will be paid in 2010.
On December 29, 2009, a joint venture agreement was entered into with the Roullier Group for the SQM Dubai-FZCO, thereby decreasing the Company’s interest from 100% to 50%. On the same date, the company changed its name to SQM Vitas.
This transaction resulted in an effect on profit of ThUS$3,019, which is presented under other gains (losses).
F-95
Notes to the consolidated Financial Statements as of December 31, 2010
(Translation of consolidated financial statements originally issued in Spanish – see Note 2.2)
Nota 12 - Policy and disclosures on interest in Joint Ventures (continued)
|
12.3
|
Detail of assets, liabilities and results of investments in joint ventures by company as of 12.31.2010 and 12.31.2009, respectively:
|
|
12.31.2010
|
|||||||||||||||||||||||||||||||||||||||
|
Assets
|
Liabilities
|
||||||||||||||||||||||||||||||||||||||
|
Tax ID
|
Associate
|
Country
|
Functional currency
|
Current
ThUS$
|
Non-current
ThUS$
|
Total
ThUS$
|
Current
ThUS$
|
Non-current
ThUS$
|
Total
ThUS$
|
Revenues
ThUS$
|
Expenses
ThUS$
|
Net income
(loss)
ThUS$
|
|||||||||||||||||||||||||||
|
Foreign
|
Sichuan SQM Migao Chemical Fertilizers Co Ltda.
|
China
|
US dollar
|
2,987 | 11,677 | 14,664 | 3,744 | - | 3,744 | - | (46 | ) | (46 | ) | |||||||||||||||||||||||||
|
Foreign
|
Coromandel SQM
|
India
|
Indian Rupee
|
10 | 862 | 872 | 7 | - | 7 | 3 | - | 3 | |||||||||||||||||||||||||||
|
Foreign
|
SQM Vitas
|
United Arab Emirates
|
Dirham of the United Arab Emirates
|
27,534 | 9,499 | 37,033 | 2,828 | - | 2,828 | 19,954 | (18,756 | ) | 1,198 | ||||||||||||||||||||||||||
|
Foreign
|
SQM Qindao-Star Co. Ltda.
|
China
|
US dollar
|
2,448 | 387 | 2,835 | 808 | - | 808 | 2,900 | (2,873 | ) | 27 | ||||||||||||||||||||||||||
|
Total
|
32,979 | 22,425 | 55,404 | 7,387 | - | 7,387 | 22,857 | (21,675 | ) | 1,182 | |||||||||||||||||||||||||||||
|
12.31.2009
|
|||||||||||||||||||||||||||||||||||||||
|
Assets
|
Liabilities
|
||||||||||||||||||||||||||||||||||||||
|
Tax ID
|
Associate
|
Country
|
Functional Currency
|
Current
ThUS$
|
Non-current
ThUS$
|
Total
ThUS$
|
Current
ThUS$
|
Non-current
ThUS$
|
Total
ThUS$
|
Revenues
ThUS$
|
Expenses
ThUS$
|
Net income
(loss)
ThUS$
|
|||||||||||||||||||||||||||
|
Foreign
|
Sichuan SQM Migao Chemical Fertilizers Co Ltda.
|
China
|
US dollar
|
6,414 | 2,146 | 8,560 | 92 | - | 92 | - | (33 | ) | (33 | ) | |||||||||||||||||||||||||
|
Foreign
|
Coromandel SQM
|
India
|
Indian Rupee
|
- | 1,060 | 1,060 | - | - | - | - | - | - | |||||||||||||||||||||||||||
|
Foreign
|
SQM Vitas
|
United Arab Emirates
|
Dirham of the United Arab Emirates
|
25,913 | 5,543 | 31,456 | (1,551 | ) | - | (1,551 | ) | 1,893 | (1,821 | ) | 72 | ||||||||||||||||||||||||
|
Total
|
32,327 | 8,749 | 41,076 | (1,459 | ) | - | (1,459 | ) | 1,893 | (1,854 | ) | 39 | |||||||||||||||||||||||||||
F-96
Notes to the consolidated Financial Statements as of December 31, 2010
(Translation of consolidated financial statements originally issued in Spanish – see Note 2.2)
Nota 12 - Policy and disclosures on interest in Joint Ventures (continued)
|
12.4
|
Amount of net gain (loss) on investments in joint ventures by company is detailed as follows:
|
|
Associate Name
|
Main Activities of Associate
|
% Interest
|
Investment
|
Investment
|
Investment
|
||||||||||||
|
12.31.2010
|
12.31.2009
|
01.01.2009
|
|||||||||||||||
|
ThUS$
|
ThUS$
|
ThUS$
|
|||||||||||||||
|
Coromandel SQM
|
Production and distribution of potassium nitrate
|
50 | % | 432 | 530 | - | |||||||||||
|
Sichuan SQM Migao Chemical Fertilizer Co. Ltda.
|
Production and distribution of soluble fertilizers.
|
50 | % | 5,461 | 2,988 | - | |||||||||||
|
SQM Vitas
|
Production and trade of vegetal and animal specialty and industrial hygiene nutrition goods
|
50 | % | 17,102 | 16,504 | - | |||||||||||
|
SQM Quindao-Star Co. Ltda.
|
Production and distribution of Vegetal Nutrition Solutions NPK solubles
|
50 | % | 1,014 | - | - | |||||||||||
|
Total
|
24,009 | 20,022 | - | ||||||||||||||
F-97
Notes to the consolidated Financial Statements as of December 31, 2010
(Translation of consolidated financial statements originally issued in Spanish – see Note 2.2)
|
13.1
|
Balances
|
|
Balances
|
12.31.2010
|
12.31.2009
|
01.01.2009
|
|||||||||
|
ThUS$
|
ThUS$
|
ThUS$
|
||||||||||
|
Intangible assets other than goodwill
|
3,270 | 2,836 | 3,525 | |||||||||
|
Goodwill
|
38,388 | 38,388 | 38,388 | |||||||||
|
Total
|
41,658 | 41,224 | 41,913 | |||||||||
|
13.2
|
Disclosures on intangible assets and goodwill
|
Intangible assets relating to goodwill, water rights, trademarks, industrial patents, rights of way and IT programs.
Balances and movements in the main types of intangible assets as of December 31, 2010, December 31, 2009 and January 1, 2009 are detailed as follows:
|
Description of types of
intangible assets
|
Useful life
|
12.31.2010
ThUS$
|
|||
|
Goodwill
|
Indefinite
|
38,388 | |||
|
Water rights
|
Indefinite
|
1,547 | |||
|
Rights of way,net
|
Finite
|
395 | |||
|
Industrial patents, net
|
Finite
|
501 | |||
|
Trademarks, net
|
Finite
|
4 | |||
|
IT programs, net
|
Finite
|
823 | |||
|
Total
|
41,658 | ||||
F-98
Notes to the consolidated Financial Statements as of December 31, 2010
(Translation of consolidated financial statements originally issued in Spanish – see Note 2.2)
|
13.2
|
Disclosures on intangible assets and goodwill (continued)
|
|
Description
of types of
intangible assets
|
Useful life
|
12.31.2009
ThUS$
|
|||
|
Goodwill
|
Indefinite
|
38,388 | |||
|
Water rights
|
Indefinite
|
1,549 | |||
|
Rights of way, net
|
Finite
|
395 | |||
|
Industrial patents, net
|
Finite
|
570 | |||
|
Trademarks, net
|
Finite
|
- | |||
|
IT
programs, net
|
Finite
|
322 | |||
|
Total
|
41,224 | ||||
|
Description of types of
intangible assets
|
Useful life
|
01.01.2009
ThUS$
|
|||
|
Goodwill
|
Indefinite
|
38,388 | |||
|
Water rights
|
Indefinite
|
1,897 | |||
|
Rights of way, net
|
Finite
|
409 | |||
|
Industrial patents, net
|
Finite
|
650 | |||
|
Trademarks, net
|
Finite
|
159 | |||
|
IT
programs, net
|
Finite
|
410 | |||
|
Total
|
41,913 | ||||
F-99
Notes to the consolidated Financial Statements as of December 31, 2010
(Translation of consolidated financial statements originally issued in Spanish – see Note 2.2)
Note 13 - Intangible assets and Goodwill (continued)
13.2 Disclosures on intangible assets and goodwill (continued)
|
a)
|
Estimated useful lives or amortization rates used for finite identifiable intangible assets
|
Finite useful life measures the lifetime or the number of productive units or other similar factor that constitute its useful life.
The estimated useful life for software is three years. For other finite useful life assets, the period in which they are amortized relates to periods defined by contracts or the rights that generate them.
Indefinite useful life intangible assets mainly relate to water rights and rights of way, which were obtained as indefinite.
|
b)
|
Method used to express the amortization of identifiable intangible assets (life or rate)
|
The method used to express amortization is useful life.
|
c)
|
Minimum and maximum amortization lives or rates of intangible assets:
|
|
Estimated useful lives or amortization rate
|
Minimum life or
rate
|
Maximum life or rate
|
|
|
Water rights
|
Indefinite
|
Indefinite
|
|
|
Rights of way
|
1 year
|
20 years
|
|
|
Industrial patents
|
1 year
|
16 years
|
|
|
Trademarks
|
1 year
|
5 years
|
|
|
IT programs
|
2 years
|
3 years
|
|
d)
|
Disclosure on internally-generated assets
|
The Company has no internally-generated intangible assets.
F-100
Notes to the consolidated Financial Statements as of December 31, 2010
(Translation of consolidated financial statements originally issued in Spanish – see Note 2.2)
13.2 Disclosures on intangible assets and goodwill (continued)
|
e)
|
Movements in identifiable intangible assets as of December 31, 2010
|
|
Movements in identifiable intangible assets
|
Net
goodwill
ThUS$
|
Water
rights, net
ThUS$
|
Rights of way,
net
ThUS$
|
Industrial
patents, net
ThUS$
|
Trademarks,
net
ThUS$
|
Computer
software, net
ThUS$
|
Identifiable
intangible
assets, net
ThUS$
|
|||||||||||||||||||||
|
Opening balance
|
38,388 | 1,549 | 395 | 570 | - | 322 | 41,224 | |||||||||||||||||||||
|
Additions
|
- | 92 | - | - | - | 839 | 931 | |||||||||||||||||||||
|
Amortization
|
- | - | - | (69 | ) | (368 | ) | (338 | ) | (755 | ) | |||||||||||||||||
|
Other increases (decreases)
|
- | (94 | ) | - | - | 372 | - | 278 | ||||||||||||||||||||
|
Ending balance
|
38,388 | 1,547 | 395 | 501 | 4 | 823 | 41,658 | |||||||||||||||||||||
Movements in identifiable intangible assets as of December 31, 2009
|
Movements in identifiable intangible assets
|
Net
goodwill
ThUS$
|
Water
rights, net
ThUS$
|
Rights of way,
net
ThUS$
|
Industrial
patents, net
ThUS$
|
Trademarks,
net
ThUS$
|
Computer
software, net
ThUS$
|
Identifiable
intangible
assets, net
ThUS$
|
|||||||||||||||||||||
|
Opening balance
|
38,388 | 1,897 | 409 | 650 | 159 | 410 | 41,913 | |||||||||||||||||||||
|
Additions
|
- | 51 | - | - | - | 124 | 175 | |||||||||||||||||||||
|
Amortization
|
- | - | (14 | ) | (80 | ) | (159 | ) | (212 | ) | (465 | ) | ||||||||||||||||
|
Other increases (decreases)
|
- | (399 | ) | - | - | - | - | (399 | ) | |||||||||||||||||||
|
Ending balance
|
38,388 | 1,549 | 395 | 570 | - | 322 | 41,224 | |||||||||||||||||||||
F-101
Notes to the consolidated Financial Statements as of December 31, 2010
(Translation of consolidated financial statements originally issued in Spanish – see Note 2.2)
As of December 31, 2010, December 31, 2009 and January 1, 2009, property, plant and equipment are detailed as follows:
|
14.1
|
Types of property, plant and equipment
|
|
Description of types of property, plant and equipment
|
12.31.2010
ThUS$
|
12.31.2009
ThUS$
|
01.01.2009
ThUS$
|
|||||||||
|
Property, plant and equipment, net
|
||||||||||||
|
Construction-in-progress
|
356,551 | 379,416 | 234,757 | |||||||||
|
Land
|
107,869 | 108,356 | 106,800 | |||||||||
|
Buildings
|
88,320 | 86,252 | 66,813 | |||||||||
|
Plant and equipment
|
492,525 | 453,859 | 461,277 | |||||||||
|
IT equipment
|
3,897 | 3,853 | 3,526 | |||||||||
|
Fixed installations and accessories
|
327,511 | 193,893 | 152,176 | |||||||||
|
Motor vehicles
|
48,936 | 55,341 | 41,309 | |||||||||
|
Other property, plant and equipment
|
28,364 | 19,576 | 9,873 | |||||||||
|
Total
|
1,453,973 | 1,300,546 | 1,076,531 | |||||||||
|
Property, plant and equipment, gross
|
||||||||||||
|
Construction-in-progress
|
356,551 | 379,416 | 234,757 | |||||||||
|
Land
|
107,869 | 108,356 | 106,800 | |||||||||
|
Buildings
|
221,715 | 212,751 | 184,061 | |||||||||
|
Plant and equipment
|
1,184,270 | 1,090,769 | 1,012,711 | |||||||||
|
IT equipment
|
22,759 | 21,573 | 19,540 | |||||||||
|
Fixed installations and accessories
|
531,423 | 368,419 | 304,360 | |||||||||
|
Motor vehicles
|
151,544 | 154,887 | 130,154 | |||||||||
|
Other property, plant and equipment
|
47,910 | 37,962 | 32,410 | |||||||||
|
Total
|
2,624,041 | 2,374,133 | 2,024,793 | |||||||||
|
Accumulated depreciation and value impairment of property, plant and equipment
|
||||||||||||
|
Accumulated depreciation of buildings
|
133,395 | 126,499 | 117,248 | |||||||||
|
Accumulated depreciation plant and equipment
|
691,745 | 636,910 | 551,434 | |||||||||
|
Accumulated depreciation of IT equipment
|
18,862 | 17,720 | 16,014 | |||||||||
|
Accumulated depreciation of fixed installations and accessories
|
203,912 | 174,526 | 152,184 | |||||||||
|
Accumulated depreciation of motor vehicles
|
102,608 | 99,546 | 88,845 | |||||||||
|
Accumulated depreciation of other PP&E
|
19,546 | 18,386 | 22,537 | |||||||||
|
Total
|
1,170,068 | 1,073,587 | 948,262 | |||||||||
F-102
Notes to the consolidated Financial Statements as of December 31, 2010
(Translation of consolidated financial statements originally issued in Spanish – see Note 2.2)
Note 14 - Property, plant and equipment (continued)
|
14.2
|
Reconciliation of changes in property, plant and equipment by type as of December 31, 2010 and December 31, 2009:
|
|
Reconciliation entries of changes in
property, plant and equipment by
class as of December 31, 2010
|
Construction in-
progress
|
Land
|
Buildings,
net
|
Plant and
equipment,
net
|
IT
equipment,
net
|
Fixed
installations
and
accessories,
net
|
Motor
vehicles,
net
|
Improvement of
leased property,
plant and
equipment, net
|
Other property,
plant and
equipment, net
|
Property,
plant
and
equipment,
net
|
||||||||||||||||||||||||||||||
|
ThUS$
|
ThUS$
|
ThUS$
|
ThUS$
|
ThUS$
|
ThUS$
|
ThUS$
|
ThUS$
|
ThUS$
|
ThUS$
|
|||||||||||||||||||||||||||||||
|
Opening balance
|
379,416 | 108,356 | 86,252 | 453,859 | 3,853 | 193,893 | 55,341 | - | 19,576 | 1,300,546 | ||||||||||||||||||||||||||||||
|
Changes
|
||||||||||||||||||||||||||||||||||||||||
|
Additions
|
295,357 | 386 | 1,021 | 512 | 123 | 41 | 450 | - | 126 | 298,016 | ||||||||||||||||||||||||||||||
|
Divestitures
|
- | (26 | ) | (114 | ) | (3,391 | ) | (26 | ) | - | -, | - | (116 | ) | (3,673 | ) | ||||||||||||||||||||||||
|
Depreciation expense
|
- | - | (9,226 | ) | (88,640 | ) | (1,537 | ) | (29,342 | ) | (11,837 | ) | - | (3,326 | ) | (143,908 | ) | |||||||||||||||||||||||
|
Increase(decrease) in foreign currency exchange
|
- | - | 2 | 55 | - | 14 | 13 | - | 2 | 86 | ||||||||||||||||||||||||||||||
|
Reclassifications
|
(315,722 | ) | - | 10,385 | 130,130 | 1,484 | 162,905 | 4,969 | - | 5,849 | - | |||||||||||||||||||||||||||||
|
Others Increases / Decreases
|
(2,500 | ) | (847 | ) | - | - | - | - | - | - | 6,253 | 2,906 | ||||||||||||||||||||||||||||
|
Total changes
|
(22,865 | ) | (487 | ) | 2,068 | 38,666 | 44 | 133,618 | (6,405 | ) | - | 8,788 | 153,427 | |||||||||||||||||||||||||||
|
Ending balance
|
356,551 | 107,869 | 88,320 | 492,525 | 3,897 | 327,511 | 48,936 | - | 28,364 | 1,453,973 | ||||||||||||||||||||||||||||||
F-103
Notes to the consolidated Financial Statements as of December 31, 2010
(Translation of consolidated financial statements originally issued in Spanish – see Note 2.2)
Note 14 - Property, plant and equipment (continued)
|
14.2
|
Reconciliation of changes in property, plant and equipment by class as of December 31, 2010 and December 31, 2009, continued:
|
|
Reconciliation entries of changes
in property, plant and equipment
by class as of December 31, 2009
|
Construction
in-progress
|
Land
|
Buildings,
net
|
Plant and
equipment,
net
|
IT
equipment,
net
|
Fixed
installations
and
accessories,
net
|
Motor
vehicles,
net
|
Improvement of
leased property,
plant and
equipment, net
|
Other
property,
plant and
equipment,
net
|
Property, plant
and equipment,
net
|
||||||||||||||||||||||||||||||
|
ThUS$
|
ThUS$
|
ThUS$
|
ThUS$
|
ThUS$
|
ThUS$
|
ThUS$
|
ThUS$
|
ThUS$
|
ThUS$
|
|||||||||||||||||||||||||||||||
|
Opening balance
|
234,757 | 106,800 | 66,813 | 461,277 | 3,526 | 152,176 | 41,309 | - | 9,873 | 1,076,531 | ||||||||||||||||||||||||||||||
|
Changes
|
||||||||||||||||||||||||||||||||||||||||
|
Additions
|
373,686 | 1,560 | - | 306 | 148 | 9 | 233 | - | 128 | 376,070 | ||||||||||||||||||||||||||||||
|
Divestitures
|
(4,405 | ) | - | (324 | ) | (1,172 | ) | (9 | ) | (108 | ) | (6 | ) | - | (134 | ) | (6,158 | ) | ||||||||||||||||||||||
|
Depreciation expense
|
- | - | (8,459 | ) | (90,446 | ) | (1,585 | ) | (22,426 | ) | (10,480 | ) | - | (3,014 | ) | (136,410 | ) | |||||||||||||||||||||||
|
Increase(decrease) in foreign currency exchange
|
- | - | 3 | 54 | - | - | 1 | - | 3 | 61 | ||||||||||||||||||||||||||||||
|
Reclassifications
|
(221,569 | ) | - | 28,055 | 94,914 | 1,737 | 64,249 | 24,284 | 8,330 | - | ||||||||||||||||||||||||||||||
|
Capitalization of soil
|
(5,446 | ) | - | - | - | - | - | - | - | - | (5,446 | ) | ||||||||||||||||||||||||||||
|
Disposal of Assets
|
- | (4 | ) | - | (5,038 | ) | - | (7 | ) | - | - | - | (5,049 | ) | ||||||||||||||||||||||||||
|
Others Increases / Decreases
|
2,393 | - | 164 | (6,000 | ) | - | - | - | - | 4,390 | 947 | |||||||||||||||||||||||||||||
|
Total changes
|
144,659 | 1,556 | 19,439 | (7,382 | ) | 291 | 41,717 | 14,032 | - | 9,703 | 224,015 | |||||||||||||||||||||||||||||
|
Ending balance
|
379,416 | 108,356 | 86,252 | 453,895 | 3,817 | 193,893 | 55,341 | - | 19,576 | 1,300,546 | ||||||||||||||||||||||||||||||
F-104
Notes to the consolidated Financial Statements as of December 31, 2010
(Translation of consolidated financial statements originally issued in Spanish – see Note 2.2)
|
14.3
|
Detail of property, plant and equipment pledged as guarantee
|
There are no restrictions on titles or guarantees for the compliance with obligations which affect property, plant and equipment.
|
14.4
|
Additional Information
|
|
1)
|
Assets recognized at fair value
|
As part of the process for the first-time adoption of IFRS, the Company opted to measure certain assets at fair value as deemed cost at the transition date of January 1, 2009. These amounts were determined by an external specialist. The revaluation of assets resulted in an adjustment against retained earnings as of January 1, 2009 of ThUS$54,366. The adjusted balance of property, plant and equipment assets which were previously restated to fair value as of January 1, 2009 is as follows:
|
12.31.2010
ThUS$
|
12.31.2009
ThUS$
|
01.01.2009
ThUS$
|
||||||||||
|
Land
|
1,332 | 1,332 | 1,332 | |||||||||
|
Buildings, net
|
2,210 | 2,241 | 2,426 | |||||||||
|
Plant and equipment, net
|
33,069 | 42,335 | 53,576 | |||||||||
|
IT equipment, net
|
1 | 1 | 1 | |||||||||
|
Fixed installations and accessories, net
|
1,799 | 1,840 | 2,031 | |||||||||
|
Other property, plant and equipment, gross
|
882 | 918 | 1,091 | |||||||||
|
Total
|
39,293 | 48,667 | 60,457 | |||||||||
|
2)
|
Leased property, plant and equipment
|
Investment properties include leased assets, detailed as follows:
|
12.31.2010
|
12.31.2009
|
01.01.2009
|
||||||||||
|
Description of assets
|
ThUS$
|
ThUS$
|
ThUS$
|
|||||||||
|
2 floors of the Las Americas Building, net
|
1,373 | 1,405 | 1,436 | |||||||||
|
Total (net)
|
1,373 | 1,405 | 1,436 | |||||||||
|
3)
|
Interest capitalized in construction-in-progress
|
Capitalized interest amounted to ThUS$ 25,947 as of December 31, 2010 and ThUS$ 19,231 as of December 31, 2009.
Financing costs are not capitalized for periods that exceed the normal term of acquisition, construction or installation of the asset, such as in the case of delays, interruptions or temporary suspension of the project due to technical, financial or other issues that inhibit the asset’s maintenance in good conditions for its use.
F-105
Notes to the consolidated Financial Statements as of December 31, 2010
(Translation of consolidated financial statements originally issued in Spanish – see Note 2.2)
|
15.1
|
Disclosures on finance leases, lessee
|
The asset acquired under a finance lease relates to a contract that the Company. has with Inversiones La Esperanza S.A., which began in June 1992 and ends on June 31, 2011. The agreement entered into indicates 230 installments of UF 663.75 each, with an annual interest rate of 8.5%.
The Company maintains finance lease arrangements as lessee for which there are no contingent installments or restrictions to report.
The net carrying amount as of December 31, 2010 amounted to ThUS$1,373 and as of December 31, 2009 and January 1, 2009 amounted to ThUS$ 1,405 and ThUS$ 1,436, respectively.
|
15.2
|
Reconciliation of minimum finance lease payments, lessee
|
The reconciliation between the total gross investment and the present value is detailed as follows:
|
Minimum
|
12.31.2010
ThUS$
|
12.31.2009
ThUS$
|
01.01.2009
ThUS$
|
|||||||||||||||||||||||||||||||||
|
payments to be
made
|
Gross
investment
|
Deferred
interest
|
Present
value
|
Gross
investment
|
Deferred
interest
|
Present
value
|
Gross
investment
|
Deferred
interest
|
Present
value
|
|||||||||||||||||||||||||||
|
Not exceeding oneene year
|
213 | (6 | ) | 207 | 329 | (29 | ) | 300 | 268 | (43 | ) | 225 | ||||||||||||||||||||||||
|
Between 1 and 5 years
|
- | - | - | 192 | (5 | ) | 187 | 425 | (28 | ) | 397 | |||||||||||||||||||||||||
|
Total
|
213 | (6 | ) | 207 | 521 | (34 | ) | 487 | 693 | (71 | ) | 622 | ||||||||||||||||||||||||
F-106
Notes to the consolidated Financial Statements as of December 31, 2010
(Translation of consolidated financial statements originally issued in Spanish – see Note 2.2)
|
16.1
|
Accruals for employee benefits
|
|
12.31.2010
|
12.31.2009
|
01.01.2009
|
||||||||||
|
Types of benefits and expenses by employee
|
ThUS$
|
ThUS$
|
ThUS$
|
|||||||||
|
Current
|
||||||||||||
|
Profit sharing and bonuses
|
44,011 | 16,375 | 22,112 | |||||||||
|
Total
|
44,011 | 16,375 | 22,112 | |||||||||
|
Non- current
|
||||||||||||
|
Profit sharing and bonuses
|
800 | 20,082 | 12,000 | |||||||||
|
Severance indemnities
|
27,208 | 28,682 | 20,186 | |||||||||
|
Pension Plan
|
702 | 1,709 | 2,873 | |||||||||
|
Total
|
28,710 | 50,473 | 35,059 | |||||||||
|
16.2
|
Policies on defined benefit plan
|
This policy is applied to all benefits received for services provided by the Company's employees.
Short-term benefits for active employees are represented by salaries, social welfare benefits, paid time off, sick leaves and other leaves, profit sharing and incentives and non-monetary benefits; e.g., healthcare services, housing, subsidized or free goods or services. These benefits will be paid over a term not exceeding twelve months.
The Company only has employee benefits for active employees, with the exception of SQM North America, as explained in 16.4 below.
For each incentive bonus delivered to the Company’s employees, there will be a disbursement in the first quarter of the following year calculated based on the net income for the period, applying a factor obtained subsequent to the employee evaluation process.
Employee benefits include bonuses for officers of the Company according to the price per share of the Company and are paid in cash. The short-term portion is presented as the current employee benefits accrual while the long-term portion is presented as non-current.
The bonus provided to the Company’s directors is calculated based on net income for the year at each year-end and will consider the application of a percentage factor.
The benefit relates to vacations (short-term benefits to employees) as provided in the Chilean Labor Code, which indicates that employees with more than a year of service will be entitled to annual holidays for a period of not less than fifteen paid business days. The Company provides the benefit of two additional vacation days.
F-107
Notes to the consolidated Financial Statements as of December 31, 2010
(Translation of consolidated financial statements originally issued in Spanish – see Note 2.2)
Note 16 - Employee benefits (continued)
|
16.2
|
Policies on defined benefit plan (continued)
|
Employee termination benefits are agreed upon and payable based on the last salary for each year of service to the Company or with certain maximum limits in respect to the number of years to be considered or with respect to monetary terms. In general, this benefit is payable when the employee or worker ceases to provide his/her services to the Company, and the right to collect can be obtained for different causes, as indicated in the respective agreements; e.g., retirement, dismissal, voluntary retirement, incapacity or disability, death, etc.
Law No. 19,728 published on May 14, 2001 and effective since October 14, 2002 required “Compulsory Unemployment Insurance” in favor of all dependent employees regulated by the Chilean Labor Code. Article 5 of this law provided the financing of this insurance through monthly contribution payments by both the employee and the employer.
|
16.3
|
Other long-term benefits
|
Other long-term benefits relate to employee termination benefits and are recorded at their actuarial value.
|
12.31.2010
|
12.31.2009
|
01.01.2009
|
||||||||||
|
Employee termination benefits at actuarial value
|
ThUS$
|
ThUS$
|
ThUS$
|
|||||||||
|
Employee termination benefits, Chile
|
26,577 | 28,170 | 19,478 | |||||||||
|
Other obligations in foreign companies
|
631 | 512 | 708 | |||||||||
|
Total other non-current liabilities
|
27,208 | 28,682 | 20,186 | |||||||||
|
SQM North America’s pension plan
|
702 | 1,709 | 2,873 | |||||||||
|
Total post-employment obligations
|
702 | 1,709 | 2,873 | |||||||||
Employee termination benefits have been calculated using the actuarial assessment method of the Company’s obligations with respect to employee termination benefits, which relate to defined benefit plans consisting of days of remuneration per year served at the time of retirement, under conditions agreed upon in the respective agreements established between the Company and its employees.
Under the indemnity fund benefit plan, the Company retains the obligation for the payment of employee termination benefits related to retirements without establishing a separate fund with specific assets, which is referred to as not funded. The discount interest rate of flows expected to be used was 6%.
F-108
Notes to the consolidated Financial Statements as of December 31, 2010
(Translation of consolidated financial statements originally issued in Spanish – see Note 2.2)
Note 16 - Employee benefits (continued)
|
16.3
|
Other long-term benefits (continued)
|
Benefit payment conditions
The employee termination benefit relates to remuneration days per year worked for the Company with no limit on salary or years of service to the Company, when employees cease to work for the Company due to turnover or death. In this case, the maximum age for men is 65 years and 60 years old for women, which are the usual ages for retirement due to achieving the senior citizen age according to the Chilean pension system provided in Decree Law 3,500 of 1980.
Methodology
The determination of the obligation for benefits under IAS 19, Projected Benefit Obligation (PBO) is described as follows:
To determine the Company's total liability, the Company used a mathematical simulation model that was programmed using a computer and processed the situation of each employee on an individual basis.
This model considered months as discrete time; i.e., the Company determined the age of each person and his/her salary on a monthly basis according to the growth rate. ThUS, information on each person was simulated from the beginning of the life of his/her employment contract or when he/she started earning benefits up to the month in which the person reaches the normal retirement age, generating in each period the possible retirement according to the Company’s turnover rate and the mortality rate according to the age reached. When he/she reaches retirement age, the employee finishes his/her service for the Company and receives indemnity related to retirement due to old age.
The methodology followed to determine the accrual for all employees covered by the agreements has considered turnover rates and the mortality rate RV-2009 established by the Chilean Superintendence of Securities and Insurance to calculate pension-related life insurance reserves in Chile according to the Accumulated Benefit Valuation or Accrued Cost of Benefit Method. This methodology is established in IAS 19 Retirement Benefit Costs.
|
16.4
|
Employee post-retirement obligations
|
The Company’s subsidiary SQM North America has established with its employees certain pension plans for retired employees, which are calculated by measuring the expected future forecasted staff severance indemnity obligation using a net salary gradual rate of restatements for inflation, mortality and turnover assumptions discounting the resulting amounts at present value using an interest rate of 6.5% for 2010 and 2009. The net balance of this liability is presented under Non-current accruals for employee benefits.
F-109
Notes to the consolidated Financial Statements as of December 31, 2010
(Translation of consolidated financial statements originally issued in Spanish – see Note 2.2)
Note 16 - Employee benefits (continued)
|
16.4
|
Employee post-retirement obligations
(
continued
)
|
The table below establishes the status of the financing plan and the amounts recognized in the consolidated balance sheet:
|
12.31.2010
|
12.31.2009
|
|||||||
|
ThUS$
|
ThUS$
|
|||||||
|
Variation in projected benefit obligation (liability):
|
||||||||
|
Benefit liability at the beginning of year
|
6,792 | 6,631 | ||||||
|
Cost of service
|
1 | 1 | ||||||
|
Interest cost
|
427 | 423 | ||||||
|
Actuarial loss
|
(374 | ) | 33 | |||||
|
Benefits paid
|
(297 | ) | (297 | ) | ||||
|
Benefit obligation (liability) at year-end
|
6,549 | 6,791 | ||||||
|
Change in the plan’s assets:
|
||||||||
|
Fair value of the plan’s assets at beginning of year
|
5,082 | 3,758 | ||||||
|
Contributions by the employer
|
192 | 448 | ||||||
|
Actual return (loss) on plan assets
|
869 | 1,173 | ||||||
|
Benefits paid
|
(296 | ) | (297 | ) | ||||
|
Fair value of the plan’s assets at year-end
|
5,847 | 5,082 | ||||||
|
Accrued liability pension plan
|
(702 | ) | (1,709 | ) | ||||
|
Items not yet recognized as net regular pension-related cost elements:
|
||||||||
|
Net actuarial loss at the beginning of year
|
(3,056 | ) | (4,186 | ) | ||||
|
Amortization during the period
|
155 | 235 | ||||||
|
Net gain or loss during the period
|
865 | 895 | ||||||
|
Adjustment made to recognize the minimum pension-related liability
|
(2,036 | ) | (3,056 | ) | ||||
As of December 31, 2010 and December 31, 2009 the net regular pension-related expense was composed of the following elements:
|
12.31.2010
|
12.31.2009
|
|||||||
|
ThUS$
|
ThUS$
|
|||||||
|
Costs or benefits of services earned during the period
|
1 | 1 | ||||||
|
Cost of interest in benefit liability
|
427 | 423 | ||||||
|
Actual return in plan’s assets
|
(869 | ) | (1,173 | ) | ||||
|
Amortization of loss from prior periods
|
154 | 198 | ||||||
|
Net gain for the period
|
492 | 889 | ||||||
|
Net regular pension-related expense
|
(205 | ) | 338 | |||||
F-110
Notes to the consolidated Financial Statements as of December 31, 2010
(Translation of consolidated financial statements originally issued in Spanish – see Note 2.2)
|
16.4
|
Employee post-retirement obligations
(
continued
)
|
As of December 31, 2010 and December 31, 2009 distributions of the plan assets (SQM North America) by category are detailed as follows:
|
12.31.2010
|
12.31.2009
|
|||||||
|
Growth securities (US instruments)
|
59 | % | 59 | % | ||||
|
International securities (US instruments)
|
25 | % | 25 | % | ||||
|
Taxable bonds (US instruments)
|
14 | % | 14 | % | ||||
|
Money market funds (US instruments)
|
2 | % | 2 | % | ||||
| 100 | % | 100 | % | |||||
|
16.5
|
Employee termination benefits
|
Severance pays calculated at actuarial value present the movements below:
|
12.31.2010
ThUS$
|
12.31.2009
ThUS$
|
|||||||
|
Initial balance
|
(28,682 | ) | (20,186 | ) | ||||
|
Cost of current service
|
(3,583 | ) | (10,072 | ) | ||||
|
Interest cost
|
(1,889 | ) | (1,440 | ) | ||||
|
Actuarial gains/ losses
|
88 | 242 | ||||||
|
Benefits paid
|
6,858 | 2,774 | ||||||
|
Balance as of December 31
|
(27,208 | ) | (28,682 | ) | ||||
The severance pay liability is valued using the actuarial value method, for which purpose the company uses the following actuarial hypotheses:
|
12.31.2010
|
12.31.2009
|
||||||||
|
Mortality table
|
RV - 2009
|
RV - 2004
|
|||||||
|
Real annual interest rate
|
6 | % | 6 | % | |||||
|
Voluntary resignation turnover rate:
|
|||||||||
|
Men
|
0.9 | % | 0.93 | % |
annual
|
||||
|
Women
|
1.53 | % | 1.47 | % |
annual
|
||||
|
Salary increase
|
3.0 | % | 3.0 | % |
annual
|
||||
|
Retirement age:
|
|||||||||
|
Men
|
65 | 65 |
years
|
||||||
|
Women
|
60 | 60 |
years
|
||||||
F-111
Notes to the consolidated Financial Statements as of December 31, 2010
(Translation of consolidated financial statements originally issued in Spanish – see Note 2.2)
The Company counts on a compensation plan for its executives, by means of the granting of payments based on the SQM share price change, paid in cash, and the executives may exercise their rights until the year 2016.
Characteristics of the plan
This compensation plan is related with the company performance through the price of the Series B SQM share (Santiago Stock Exchange).
Participants in this plan
This compensation plan includes 42 executives of the Company, who are entitled to this benefit, provided they stay with the Company during the dates these options are executed. The dates for exercising the options will be the first 7 calendar days of May corresponding to the fiscal year.
Compensation
The compensation for each executive is the differential between the average prices of the share during April of each year compared to the base price established by the Board of Directors of the Company. The base price is fixed by the Company, which for this compensation plan amounts to US$ 50 per share, for those granted in the year 2010, and US$ 9.30 for the shares granted since 2005.
Compensation plan appraisal method and patterns
The Company used the following variables with the purpose of determining the average fair value of these options.
|
Variables and receptiveness to
change of the pattern
|
12.31.2010 | 12.31.2009 | 01.01.2009 | |||||||||
|
Expected volatility (%)
|
||||||||||||
|
SQM Annualized (*)
|
21.51 | % | 31.79 | % | 45.49 | % | ||||||
|
Ch. $/USD Annualized (*)
|
10.00 | % | 11.20 | % | 10.95 | % | ||||||
|
Interest rate free of risk (%)
|
2.40 | % | 2.15 | % | 6.08 | % | ||||||
|
Expected life of the option (years)
|
3.3 years
|
2 years
|
2 years
|
|||||||||
|
Average price of the share (US$)
|
57 | 38 | 24 | |||||||||
|
Dividend yield
|
1.61 | % | 3.66 | % | 2.76 | % | ||||||
|
Period covered
|
60 months
|
24 months
|
36 months
|
|||||||||
|
Pattern used
|
Binomial
|
Binomial
|
Binomial
|
|||||||||
(*) calculated based on 252 trading days
F-112
Notes to the consolidated Financial Statements as of December 31, 2010
(Translation of consolidated financial statements originally issued in Spanish – see Note 2.2)
The movement of the options in effect for the period, the average prices for the fiscal year of the options and the average contractual life of the options in effect as of December 31, 2010 are the following:
|
Movement for the period
|
12.31.2010 | 12.31.2009 | 01.01.2009 | |||||||||
|
In effect as of January 1
|
1,210,000 | 1,455,000 | 1,455,000 | |||||||||
|
Granted during the fiscal year
|
2,370,000 | - | - | |||||||||
|
Exercised during the fiscal year
|
150,000 | 245,000 | - | |||||||||
|
In circulation as of December 31
|
3,430,000 | 1,210,000 | - | |||||||||
|
Average contractual life
|
60 months
|
24 months
|
36 months
|
|||||||||
The amounts accrued by the plan, as of December 31, 2010 and 2009, amount to:
|
Result effect
|
12.31.2010
ThUS$
|
12.31.2009
ThUS$
|
||||||
|
Amount accrued
|
22,782 | 12,663 | ||||||
|
Total accrued compensation
|
22,782 | 12,663 | ||||||
The detail and movements in the funds of equity accounts are shown in the consolidated statement of changes in equity.
|
18.1
|
Capital management
|
The main object of capital management relative to the administration of the Company’s equity is to administer the capital of SQM group as follows:
|
-
|
Ensure the regular conduct of operations and business continuity in the long term.
|
|
-
|
Ensure financing of new investments in order to maintain steady growth.
|
|
-
|
Have an adequate capital structure in accordance with the cycles of the economy that have an impact on the business and the nature of the industry.
|
|
-
|
Maximize the value of SQM group in the mid and long term.
|
According to the foregoing, the capital requirements are included on the basis of the financing requirements of the group, with the constant intention of maintaining an adequate level of liquidity and in compliance with the financial safeguards established in the debt contracts in force. The Company manages its capital structure and makes adjustments on the basis of the predominant economic conditions so as to mitigate the risks associated with adverse market conditions and take advantage of the opportunities there may be to improve the liquidity position.
There have been no changes in the capital management objectives or policy within the years reported in this document.
F-113
Notes to the consolidated Financial Statements as of December 31, 2010
(Translation of consolidated financial statements originally issued in Spanish – see Note 2.2)
Note 18 - Equity Disclosures (continued)
|
18.2
|
Disclosures on preference share capital
|
Issued share capital is divided into 263,196,524 fully paid and subscribed shares with no par value composed of 142,819,552 Series "A" shares and 120,376,972 Series “B” shares, where both series are preferred shares.
The preferential voting rights for each series are detailed as follows:
Series “A”:
If the election of the President of the Company results in a tie vote, the Company's directors may vote once again, without the vote of the director elected by the Series B shareholders.
Series “B”:
|
1)
|
A general or extraordinary shareholders' meeting may be called at the request of shareholders representing 5% of the Company's Series B shares.
|
|
2)
|
An extraordinary meeting of the Board of Directors may be called with or without the agreement of the Company's President, at the request of the director elected by Series B shareholders.
|
As of December 31, 2010, December 31, 2009 and January 1, 2009, the Group does not maintain shares in the parent company either directly or through its companies in which it has investments.
F-114
Notes to the consolidated Financial Statements as of December 31, 2010
(Translation of consolidated financial statements originally issued in Spanish – see Note 2.2)
|
18.2
|
Disclosures on preference share capital (continued)
|
Detail of types of capital in preference shares:
|
Type of capital in preferred shares
|
12.31.2010
|
12.31.2009
|
01.01.2009
|
|||||||||||||||||||||
|
Description of type of capital in preferred shares
|
Serie A
|
Serie B
|
Serie A
|
Serie B
|
Serie A
|
Serie B
|
||||||||||||||||||
|
Number of authorized shares
|
142,819,552 | 120,376,972 | 142,819,552 | 120,376,972 | 142,819,552 | 120,376,972 | ||||||||||||||||||
|
Par value of shares in ThUS$
|
- | - | - | - | - | - | ||||||||||||||||||
|
Capital amount in shares ThUS$
|
134,750 | 342,636 | 134,750 | 342,636 | 134,750 | 342,636 | ||||||||||||||||||
|
Amount of premium issuance ThUS$
|
- | - | - | - | - | - | ||||||||||||||||||
|
Amount of reserves ThUS$
|
- | - | - | - | - | - | ||||||||||||||||||
|
Number of fully subscribed and paid shares
|
142,819,552 | 120,376,972 | 142,819,552 | 120,376,972 | 142,819,552 | 120,376,972 | ||||||||||||||||||
|
Number of subscribed, partially paid shares
|
- | - | - | - | - | - | ||||||||||||||||||
|
Total number of subscribed shares
|
142,819,552 | 120,376,972 | 142,819,552 | 120,376,972 | 142,819,552 | 120,376,972 | ||||||||||||||||||
As of December 31, 2010, December 31, 2009 and January 1, 2009, the Company has not placed any new issuances of shares on the market.
F-115
Notes to the consolidated Financial Statements as of December 31, 2010
(Translation of consolidated financial statements originally issued in Spanish – see Note 2.2)
Note 18 - Shareholders’ Equity Disclosures (continued)
|
18.3
|
Dividend policy
|
As required by Article 79 of the Chilean Shareholders’ Company Act, unless otherwise decided by unanimous vote of the holders of issued and subscribed shares, the Company must distribute a cash dividend in an amount equal to at least 30% of consolidated profit for the year ended December 31, 2009 unless and except to the extent that it has a deficit in retained earnings (losses not absorbed in prior years.)
The Company’s dividend policy for 2010 wasdetailed as follows:
|
-
|
Distribution and payment in favor of each shareholder of a final dividend that will be equivalent to 50% of profit for the year obtained in 2010.
|
|
-
|
Distribution and payment during 2010, of an interim dividend which is recorded against the aforementioned final dividend. This interim dividend was paid (see below) during the last quarter of 2010, and its amount did not exceed 50% of the retained earnings for distribution obtained during 2010, which are reflected in the Company’s financial statements as of September 30, 2010.
|
|
-
|
The distribution and payment by the Company of the remaining balance of the final dividend related to profit for the year for the 2010 fiscal year in up to two installments, which must be effectively paid and distributed prior to June 30, 2011.
|
|
-
|
An amount equivalent to the remaining 50% of the Company’s profit for the year for 2010 will be retained and destined to the financing of operations of one or more of the Company’s investment projects with no prejudice to the possible future capitalization of the entirety or a portion of this.
|
|
-
|
The Board of Directors does not consider the payment of any additional or interim dividends.
|
|
18.4
|
Interim dividends
|
On November 23, 2010 the Board of the Company agreed to pay interim dividends amounting to ThUS$ 110,000, payable from December 15, 2010.
At a Board of Directors meeting held on April 29, 2010, the Directors unanimously agreed to reduce its distribution of dividends. This means that a final dividend of US$ 0.62131 per share will be paid in relation to net profit for the year. Notwithstanding the above, US$ 0.37994 per share was already paid as an interim dividend, and this amount should be subtracted from the final dividend detailed above. In line with this, the balance, amounting to US$ 0.24137 per share, will be paid and distributed among shareholders of the Company who are registered with their respective shareholders ‘registry as of the fifth business day prior to the day in which this dividend will be paid.
F-116
Notes to the consolidated Financial Statements as of December 31, 2010
(Translation of consolidated financial statements originally issued in Spanish – see Note 2.2)
|
18.4
|
Interim dividends (continued)
|
At a Board of Directors meeting held on November 17, 2009, the Directors agreed to pay and distribute an interim dividend of US$0.37994 per share. This dividend totaled approximately ThUS$100,000 and is equivalent to 40% of distributable 2009 profit for the year, accumulated as of December 31, 2009. This dividend is payable in relation to to net income for the period for that commercial year to SQM shareholders registered in the respective shareholders’ registry as of the fifth business day prior to December 16, 2009, in its equivalent in Chilean pesos, based on the observed dollar exchange rate as published in the Official Gazette prevailing on December 10, 2009.
As of December 31, 2010, a provision of ThUS$4.637 was recognized due to minimum dividend. Due to what is expressed above, the dividends deducted from equity are as follows:
|
12.31.2010
ThUS$
|
12.31.2009
ThUS$
|
|||||||
|
Final dividend
|
63,527 | 175,493 | ||||||
|
Interim dividend
|
110,000 | 100,000 | ||||||
|
Minimum dividend accrual
|
4,637 | - | ||||||
|
Total
|
178,164 | 275,493 | ||||||
|
19.1
|
Types of provisions
|
|
12.31.2010
|
12.31.2009
|
01.01.2009
|
||||||||||
|
Description of types of provisions
|
ThUS$
|
ThUS$
|
ThUS$
|
|||||||||
|
Other current provisions
|
||||||||||||
|
Provision for legal complaints (*)
|
2,590 | 590 | 715 | |||||||||
|
Other provisions – see below
|
12,424 | 15,852 | 8,836 | |||||||||
|
Total
|
15,014 | 16,442 | 9,551 | |||||||||
|
Other non-current provisions
|
||||||||||||
|
Other provisions
|
2,000 | - | - | |||||||||
|
Mine closers
|
3,500 | 3,500 | 3,181 | |||||||||
|
Other current provisions
|
5,500 | 3,500 | 3,181 | |||||||||
(*) Provisions for legal complaints relate to legal expenses for lawsuits whose resolution is pending, and correspond to funds estimated necessary to make the disbursement of expenses incurred for this purpose.
This provision relates mainly to the litigation of its subsidiary locaited in Brazil (see note 20.1, number 2) and other minor litigations.
F-117
Notes to the consolidated Financial Statements as of December 31, 2010
(Translation of consolidated financial statements originally issued in Spanish – see Note 2.2)
Note 19 - Provisions and other non-financial liabilities (continued)
|
19.2
|
Description of other provisions
|
|
Description of other provisions
|
12.31.2010
ThUS$
|
12.31.2009
ThUS$
|
01.01.2009
ThUS$
|
|||||||||
|
Current provisions, other provisions
|
||||||||||||
|
Provision for tax loss in fiscal litigation
|
1,634 | 1,564 | 1,284 | |||||||||
|
Royalties, agreement with CORFO (the Chilean Economic Development Agency)
|
5,182 | 3,752 | 5,256 | |||||||||
|
Temporary closer of “El Toco operation”
|
3,264 | 6,500 | - | |||||||||
|
Retirement plan
|
880 | 2,500 | - | |||||||||
|
Miscellaneous provisions
|
1,464 | 1,536 | 2,296 | |||||||||
|
Total
|
12,424 | 15,852 | 8,836 | |||||||||
|
Other long-term provisions
|
||||||||||||
|
Mine closure
|
3,500 | 3,500 | 3,181 | |||||||||
|
Total
|
3,500 | 3,500 | 3,181 | |||||||||
|
19.3
|
Other non-financial liabilities, current
|
|
Description of other liabilities
|
12.31.2010
ThUS$
|
12.31.2009
ThUS$
|
01.01.2009
ThUS$
|
|||||||||
|
Tax withholdings
|
5,529 | 6,043 | 594 | |||||||||
|
VAT payable
|
12,416 | 4,733 | 5,322 | |||||||||
|
Guarantees received
|
1,028 | 1,016 | 2,511 | |||||||||
|
Accrual for minimum dividend
|
4,637 | - | 50,421 | |||||||||
|
Monthly tax provisional payments
|
8,171 | 5,071 | 10,345 | |||||||||
|
Deferred income
|
14,350 | 16,537 | 31,722 | |||||||||
|
Withholdings from employees and salaries payable
|
4,936 | 4,858 | 4,199 | |||||||||
|
Vacation accrual
|
14,854 | 13,897 | 10,518 | |||||||||
|
Other current liabilities
|
1,538 | 50 | 50 | |||||||||
|
Total
|
67,459 | 52,205 | 115,682 | |||||||||
F-118
Notes to the consolidated Financial Statements as of December 31, 2010
(Translation of consolidated financial statements originally issued in Spanish – see Note 2.2)
Note 19 - Provisions and other non-financial liabilities (continued)
|
19.4
|
Movements in provisions as of December 31, 2010
|
|
Description of items that gave rise to
variations
|
Legal complaints
|
Other
provisions
|
Total
|
|||||||||
|
ThUS$
|
ThUS$
|
ThUS$
|
||||||||||
|
Total provisions, initial balance
|
590 | 19,352 | 19,942 | |||||||||
|
Additional provisions
|
4,000 | 14,301 | 18,301 | |||||||||
|
Provision used
|
- | (19,583 | ) | (19,583 | ) | |||||||
|
Increase (decrease) in foreign currency translation
|
- | 74 | 74 | |||||||||
|
Total provisions, final balance
|
4,590 | 15,924 | 20,514 | |||||||||
|
19.4
|
Movements in provisions as of December 31, 2009
|
|
Description of items that gave rise to
variations
|
Legal complaints
|
Other
provisions
|
Total
|
|||||||||
|
ThUS$
|
ThUS$
|
ThUS$
|
||||||||||
|
Total provisions, initial balance
|
715 | 12,017 | 12,732 | |||||||||
|
Changes in provisions:
|
||||||||||||
|
Additional provisions
|
200 | 14,604 | 14,804 | |||||||||
|
Provision used
|
(325 | ) | (6,898 | ) | (7,223 | ) | ||||||
|
Increase (decrease) in foreign currency translation
|
- | (371 | ) | (371 | ) | |||||||
|
Total provisions, final balance
|
590 | 19,352 | 19,942 | |||||||||
F-119
Notes to the consolidated Financial Statements as of December 31, 2010
(Translation of consolidated financial statements originally issued in Spanish – see Note 2.2)
|
19.5
|
Detail of main types of provisions and other non-financial liabilitiess
|
Legal expenses:
this provision depends on the pending resolution of a legal lawsuit. .
Tax accrual in tax litigation:
this accrual relates to lawsuits pending resolution related to taxes in Brazil for two of our subsidiaries, SQM Brazil and NNC.
CORFO (Economic Development Agency) Royalties agreement:
relates to the commercialization of mining properties that SQM Salar S.A. pays the Economic Development Agency for on a quarterly basis. The amount of the lease payable is calculated based on sales of products extracted from the Atacama Saltpeter deposit.
The settlement of the aforementioned amountsare performed on a quarterly basis.
Temporary closure of El Toco operation:
The Company’s Board of Directors unanimously agreed to approve the temporary closure of the Toco and Pampa Blanca mining sectors. The Company accrued a legal severance indemnity for the employees subject to this closure. Additional benefits that will be paid to employees will correspond to 2010 expenses.
Retirement plan:
corresponds to a benefit agreed upon with employees to retire from the Company. Those employees who invoked the agreed-upon plan signed their consent as of December 31, 2009. The effective retirement date was during 2010, but part of this benefit is pending for 2011.
According to note 19.1 the Company has only registered a provision for those lawsuits in which the probability to lose is “more likely than not”. The Company is party to lawsuits and other relevant legal actions that are detailed as follows:
|
20.1
|
Lawsuits and other relevant events
|
|
1.
|
Plaintiff
|
: Compañía de Salitre y Yodo Soledad S.A.
|
|
Defendant
|
: Sociedad Química y Minera de Chile S.A.
|
|
|
Date
|
: December 1994
|
|
|
Court
|
: Civil Court in Pozo Almonte
|
|
|
Reason
|
: Nullity of mining concession Cesard 1 to 29
|
|
|
Status
|
: Evidence provided
|
|
|
Nominal value
|
: ThUS$ 211
|
F-120
Notes to the consolidated Financial Statements as of December 31, 2010
(Translation of consolidated financial statements originally issued in Spanish – see Note 2.2)
Note 20 - Contingencies and restrictions (continued)
|
20.1
|
Lawsuits and other relevant events (continued)
|
|
2.
|
Plaintiffs
|
: JB Comércio de Fertilizantes e Defensivos Agrícolas Ltda. (JB)
|
|
Defendants
|
: Nitratos Naturais do Chile Ltda. (NNC)
|
|
|
Date
|
: December 1995
|
|
|
Court
|
: MM 1ª. Vara Civel de Comarca de Barueri, Brasil.
|
|
|
Reason
|
: Compensation claim filed by JB against NNC for having appointed a distributor in a territory of Brazil for which JB had an exclusive contract.
|
|
|
Status
|
: First instance against NNC.
|
|
|
|
Nominal value
|
: ThUS$1,800
|
|
3.
|
Plaintiff
|
: Compañía Productora de Yodo y Sales S.A.
|
|
Defendant
|
: Sociedad Química y Minera de Chile S.A.
|
|
|
Date
|
: November 1999
|
|
|
Court
|
: Civil Court in Pozo Almonte
|
|
|
Reason
|
: Nullity of mining concession Paz II 1 to 25
|
|
|
Status
|
: Evidence provided
|
|
|
Nominal value
|
: ThUS$ 162
|
|
|
4.
|
Plaintiff
|
: Compañía Productora de Yodo y Sales S.A.
|
|
Defendant
|
: Sociedad Química y Minera de Chile S.A.
|
|
|
Date
|
: November 1999
|
|
|
Court
|
: Civil Court in Pozo Almonte
|
|
|
Reason
|
: Nullity of mining concession Paz III 1 to 25
|
|
|
Status
|
: Evidence provided
|
|
|
Nominal value
|
: ThUS$ 204
|
|
|
5.
|
Plaintiff
|
: Nancy Erika Urra Muñoz
|
|
Defendants
|
: Fresia Flores Zamorano, Duratec-Vinilit S.A. and SQM S.A. and their
|
|
|
insurers
|
||
|
Date
|
: December 2008
|
|
|
Court
|
: 1st Civil Court of Santiago
|
|
|
Reason
|
: Labor Accident
|
|
|
Status
|
: At hearing stage
|
|
|
Nominal value
|
: ThUS$ 550
|
|
|
6.
|
Plaintiff
|
: Agraria Santa Aldina Limitada.
|
|
Defendants
|
: SQM Perú S.A.
|
|
|
Date
|
: June 2009
|
|
|
Court
|
: Civil Court in Pisco - Peru
|
|
|
Reason
|
: Claim for damages for alleged breach of terms of product distribution contracts.
|
|
|
Status
|
: Settlement, at present being implemented
|
|
|
Nominal value
|
: ThUS$ 400
|
F-121
Notes to the consolidated Financial Statements as of December 31, 2010
(Translation of consolidated financial statements originally issued in Spanish – see Note 2.2)
Note 20 - Contingencies and restrictions (continued)
|
20.1
|
Lawsuits and other relevant events (continued)
|
|
7.
|
Plaintiffs
|
: Eduardo Fajardo Nuñez, Ana Maria Canales Poblete, Raquel Beltran Parra,
|
|
E
|
Eduardo Fajardo Beltran and Martina Fajardo Beltran.
|
|
|
Defendants
|
: SQM Salar S.A. and insured parties
|
|
|
Date
|
: November 2009
|
|
|
Court
|
: 20th Civil Court in Santiago
|
|
|
Reason
|
: Labor accident
|
|
|
Status
|
: Evidence
|
|
|
Nominal value
|
: ThUS$ 1,880
|
|
|
8.
|
Plaintiff
|
: Poli Instalaciones Limitada
|
|
Defendant
|
: SQM Industrial S.A.
|
|
|
Date
|
: August 2010
|
|
|
Court
|
: Arbitral Court
|
|
|
Reason
|
: Claim for damages resulting from the exercise of a contractual clause under which the contract may be terminated in advance
|
|
|
Status
|
: Discovery stage
|
|
|
Nominal value
|
: ThUS$ 484
|
|
|
9.
|
Plaintiff
|
: Newland S.A.
|
|
Defendant
|
: SQM Industrial S.A.
|
|
|
Date
|
: August 2010
|
|
|
Court
|
: Arbitral Court
|
|
|
Reason
|
: Claim for damages due to alleged breach of obligations
|
|
|
Status
|
: Discovery stage
|
|
|
Nominal value
|
: ThUS$480
|
|
|
10.
|
Plaintiffs
|
: María Loreto Lorca Morales, Nathan Guerrero Lorca, Maryori Guerrero
|
|
Lorca, Abraham Guerrero Lorca, Esteban Guerrero Lorca and María Sol
|
||
|
Osorio Tapia et all
|
||
|
Defendants
|
: Gonzalo Daved Valenzuela, Julio Zamorano Avendaño, Comercial
|
|
|
Transportes y Servicios Generales Julio Zamorano Avendaño E.I.R.L.,
|
||
|
And in solidum SQM S.A. and insurers
|
||
|
Date
|
: August 2010
|
|
|
Court
|
: 2nd Civil Court of Iquique
|
|
|
Reason
|
: Claim for damages resulting from the crash of two trucks in July 2008 near
|
|
|
Pozo Almonte, causing the death of Mr. Alberto Galleguillos Monardes
|
||
|
And Mr. Fernando Guerrero Tapia
|
||
|
Status
|
: Hearing stage ended.
|
|
|
Nominal value
|
: ThUS$3,500
|
F-122
Notes to the consolidated Financial Statements as of December 31, 2010
(Translation of consolidated financial statements originally issued in Spanish – see Note 2.2)
Note 20 - Contingencies and restrictions (continued)
|
20.1
|
Lawsuits and other relevant events (continued)
|
|
11.
|
Plaintiff
|
: Sociedad Chilena del Litio Ltda.
|
|
Defendant
|
: SQM Salar S.A.
|
|
|
Date
|
: December 2010
|
|
|
Court
|
: Arbitral
|
|
|
Reason
|
: Payment of sales prices
|
|
|
Status
|
: At hearing stage
|
|
|
Nominal value
|
:
ThUS$2,000
|
|
|
12.
|
Plaintiff
|
: City of Pomona, California USA
|
|
Defendant
|
: SQM North America Corp (SQM NA) and the Company
|
|
|
Date
|
: December 2010
|
|
|
Court
|
: United States District Court for the Central District of California
|
|
|
Reason
|
: Claim for damages incurred by the city of Pomona, as a result of the alleged responsibility in the perchlorate contamination of municipal underground water wells that feed the freshwater system in the city
|
|
|
Status
|
: Discovery statge. The Company has been named but has not yet been served.
|
|
|
|
Nominal value
|
: Unspecified
|
|
13.
|
Plaintiff
|
: City of Lindsay, California USA
|
|
Defendant
|
: SQM North America Corp (SQM NA) and the Company
|
|
|
Date
|
: December 2010
|
|
|
Court
|
: United States District Court for the Eastern District of California
|
|
|
Reason
|
: Claim for damages incurred by the city of Lindsay, as a result of the alleged responsibility in perchlorate contamination of municipal underground water wells that feed the freshwater system in the city
|
|
|
Status
|
: Discovery stage. The Company has been named but has not yet been served.
|
|
|
|
Nominal value
|
: Unspecified
|
The Company has been involved and will probably continue being involved either as plaintiffs or defendants in certain judicial proceedings that have been and will be heard by the Arbitral or Ordinary Courts of Justice that will make the final decision. Those proceedings that are regulated by the appropriate legal regulations are intended to exercise or oppose certain actions or exceptions related to certain mining claims either granted or to be granted and that do not or will not affect in an essential manner the development of the Company.
Soquimich Comercial S.A. has been involved and will probably continue being involved either as plaintiff or defendant in certain judicial proceedings through which it intends to collect and receive the amounts owed, the total nominal value of which is approximately ThUS$ 700.
The Company has made efforts and continues making efforts to obtain payment of certain amounts that are still owed it on occasion of their activities. Such amounts will continue to be required using judicial or non-judicial means by the plaintiffs, and the actions and exercise related to theseare currently in full force and effect.
F-123
Notes to the consolidated Financial Statements as of December 31, 2010
(Translation of consolidated financial statements originally issued in Spanish – see Note 2.2)
Note 20 - Contingencies and restrictions (continued)
|
20.1
|
Lawsuits and other relevant events (continued)
|
The Company has not received legal notice of any claims other than those mentioned in paragraph I above. The claims detailed above seek to annul certain mining claims that were purchased by SQM S.A. and Subsidiaries, the proportional purchase value of which, with respect to the portion affected by the superimposition, exceeds the nominal and approximate amount of ThUS$ 150. The claims seek payment of certain amounts allegedly owed by the Company due to its own activities, which exceed the approximate nominal and individual amount of ThUS$ 150.
20.2 Restrictions
Bank loans of the Company have similar restrictions to the loans of a similar nature that have been valid at the appropriate times and that amongst others relate to maximum indebtedness and minimum equity. Save for the foregoing, The Company. is not exposed to other restrictions or limits on financial indicators relating to contracts and agreements with creditors.
20.3 Commitment
The subsidiary SQM Salar S.A. has signed a rental contract with the Economic Development Agency (CORFO), which establishes that this subsidiary will pay rent to CORFO for the concept of commercialization of certain mining properties owned by CORFO and for the products resulting from this commercialization. The annual rent stated in the aforementioned contract is calculated on the basis of sales of each type of product. The contract is in force until 2030, and rent began being paid in 1996 reflecting an expense amount of ThUS$ 18,177 as of December 31, 2010 (ThUS$ 17,747 as of December 31, 2009).
20.4 Restricted or pledged cash
The subsidiary Isapre Norte Grande S.A. in compliance with that established by the Chilean Superintendence of Healthcare, which regulates the running of pension-related health institutions, maintains a guarantee in financial instruments, delivered in deposits, custody and administration to Banco de Chile.
This guarantee, according to the regulations issued by the Chilean Superintendence of Healthcare is equivalent to the total sum owed to its members and medical providers. Banco de Chile reports the present value of the guarantee to the Chilean Superintendence of Healthcare and Isapre Norte Grande Ltda.on a daily basis. As of December 31, 2010, the guarantee amounts to ThUS$ 514.
F-124
Notes to the consolidated Financial Statements as of December 31, 2010
(Translation of consolidated financial statements originally issued in Spanish – see Note 2.2)
Note 20 - Contingencies and restrictions (continued)
20.5 Collateral received from third parties
The main collateral received from third parties (distributors) to guarantee Soquimich Comercial S.A.’s compliance with obligations in contracts of commercial mandates for the distribution and sale of fertilizers amounted to ThUS$6,389 as of December 31, 2010; as of December 31, 2009 these amounted to ThUS$6,523 and as of January 1, 2009 amounted to ThUS$5,302 which are detailed as follows:
|
Entity name
|
12.31.2010
ThUS$
|
12.31.2009
ThUS$
|
01.01.2009
ThUS$
|
|||||||||
|
Llanos y Wammes Soc. Com. Ltda
|
2,037 | 2,037 | 1,727 | |||||||||
|
Fertglobal Chile Ltda.
|
3,352 | 3,352 | 2,671 | |||||||||
|
Tattersall Agroinsumos S.A.
|
1,000 | 1,134 | 904 | |||||||||
F-125
Notes to the consolidated Financial Statements as of December 31, 2010
(Translation of consolidated financial statements originally issued in Spanish – see Note 2.2)
20.6 Indirect guarantees
Guarantees in which there is no pending balance indirectly reflect that the respective guarantees are in force and approved by the Company's Board of Directors and have not been used by the respective subsidiary.
|
Debtor
|
Pending balances as of the closing date
of the financial statements
|
|||||||||||||||||
|
Creditor of the guarantee
|
Name
|
Relationship
|
Type of
guarantee
|
12.31.2010
ThUS$
|
12.31.2009
ThUS$
|
01.01.2009
ThUS$
|
||||||||||||
|
Australian and New Zealand Bank
|
SQM North America Corp
|
Subsidiary
|
Bond
|
- | - | - | ||||||||||||
|
Australian and New Zealand Bank
|
SQM Europe N.V.
|
Subsidiary
|
Bond
|
- | - | - | ||||||||||||
|
Generale Bank
|
SQM North America Corp
|
Subsidiary
|
Bond
|
- | - | - | ||||||||||||
|
Generale Bank
|
SQM Europe N.V.
|
Subsidiary
|
Bond
|
- | - | - | ||||||||||||
|
Kredietbank
|
SQM North America Corp
|
Subsidiary
|
Bond
|
- | - | - | ||||||||||||
|
Kredietbank
|
SQM Europe N.V.
|
Subsidiary
|
Bond
|
- | - | - | ||||||||||||
|
Banks and financial institutions
|
SQM Investment Corp. N.V.
|
Subsidiary
|
Bond
|
- | - | - | ||||||||||||
|
Banks and financial institutions
|
SQM Europe N.V.
|
Subsidiary
|
Bond
|
- | - | - | ||||||||||||
|
Banks and financial institutions
|
SQM North America Corp
|
Subsidiary
|
Bond
|
- | - | - | ||||||||||||
|
Banks and financial institutions
|
Nitratos Naturais do Chile Ltda.
|
Subsidiary
|
Bond
|
- | - | - | ||||||||||||
|
Banks and financial institutions
|
SQM México S.A. de C.V.
|
Subsidiary
|
Bond
|
- | - | - | ||||||||||||
|
Banks and financial institutions
|
SQM Brasil Ltda.
|
Subsidiary
|
Bond
|
- | - | - | ||||||||||||
|
Banque Nationale de Paris
|
SQM Investment Corp. N.V.
|
Subsidiary
|
Bond
|
- | - | - | ||||||||||||
|
San Francisco Branch
|
SQM Investment Corp. N.V.
|
Subsidiary
|
Bond
|
- | - | - | ||||||||||||
|
Sociedad Nacional de Mineria A.G.
|
SQM Potasio S.A.
|
Subsidiary
|
Bond
|
- | - | - | ||||||||||||
|
Royal Bank of Canada
|
SQM Investment Corp. N.V.
|
Subsidiary
|
Bond
|
- | - | - | ||||||||||||
|
Citibank N.Y
|
SQM Investment Corp. N.V.
|
Subsidiary
|
Bond
|
- | - | - | ||||||||||||
|
BBVA Banco Bilbao Vizcaya Argentaria
|
Royal Seed Trading A..V.V.
|
Subsidiary
|
Bond
|
- | 100,053 | 100,204 | ||||||||||||
|
ING Capital LLC
|
Royal Seed Trading A..V.V.
|
Subsidiary
|
Bond
|
80,055 | 80,055 | 80,215 | ||||||||||||
|
JP Morgan Chase Bank
|
SQM Industrial S.A.
|
Subsidiary
|
Bond
|
- | - | - | ||||||||||||
|
Export Development Canada
|
SQM Investment Corp. N.V.
|
Subsidiary
|
Bond
|
- | 50,019 | 50,032 | ||||||||||||
|
BBVA Bancomer S.A.
|
Royal Seef Trading
|
Subsidiary
|
Bond
|
- | 75,000 | - | ||||||||||||
F-126
Notes to the consolidated Financial Statements as of December 31, 2010
(Translation of consolidated financial statements originally issued in Spanish – see Note 2.2)
As of December 31, 2010 and 2009, revenue is detailed as follows:
|
12.31.2010
|
12.31.2009
|
|||||||
|
ThUS$
|
ThUS$
|
|||||||
|
Sales of goods
|
1,823,843 | 1,431,221 | ||||||
|
Provision of services
|
6,570 | 7,438 | ||||||
|
Total
|
1,830,413 | 1,438,659 | ||||||
Basic earnings per share are calculated by dividing net income attributable to the Company’s shareholders by the weighted average of the number of shares in circulation during that period.
As expressed, earnings per share are detailed as follows:
|
Earnings per share
|
12.31.2010
ThUS$
|
12.31.2009
ThUS$
|
||||||
|
Earnings attributable to owners of the parent
|
382,122 | 338,297 | ||||||
|
12.31.2010
Units
|
12.31.2009
Units
|
|||||||
|
Number of common shares in circulation
|
263,196,524 | 263,196,524 | ||||||
|
12.31.2010
|
12.31.2009
|
|||||||
|
Basic and diluted earnings per share
|
1.4519 | 1.2853 | ||||||
The Company has not made any operation with a potential dilutive effect that assumes a diluted earnings per share different from the basic earnings per share.
F-127
Notes to the consolidated Financial Statements as of December 31, 2010
(Translation of consolidated financial statements originally issued in Spanish – see Note 2.2)
The cost of interest is recognized as expenses in the year in which it is incurred, except for interest that is directly related to the acquisition and construction of tangible property, plant and equipment assets and that complies with the requirements of IAS 23. As of December 31, 2010, total interest expenses incurred amount to ThUS$35,042 (ThUS$30,979 as of December 31, 2009.)
The Company capitalizes all interest costs directly related to the construction or to the acquisition of property, plant and equipment, which require a substantial time to be suitable for use.
Costs of capitalized interest, property, plant and equipment
The cost of capitalized interest is determined by applying the average or weighted average of all financing costs incurred by the Company to the monthly end balances of works-in-progress meeting the requirements of IAS 23.
The rates and costs for capitalized interest of property, plant and equipment are detailed as follows:
| 12.31.2010 | 12.31.2009 | |||||||
|
Capitalization rate of costs for capitalized interest, property, plant and equipment
|
7 | % | 7 | % | ||||
|
Amount of costs for interest capitalized in ThUS$
|
25,947 | 19,231 |
|
a)
|
Foreign currency exchange differences recognized in profit or loss except for financial instruments measured at fair value through profit or loss
|
|
12.31.2010
ThUS$
|
12.31.2009
ThUS$
|
|||||||
|
Conversion foreign exchange gains (losses) recognized in the result of the year.
|
(5,807 | ) | (7,577 | ) | ||||
|
Conversion foreign exchange reserves attributable to the owners of the controlling entity.
|
296 | 1,234 | ||||||
|
Conversion foreign exchange reserves attributable to the non-controlling entity.
|
367 | 501 | ||||||
F-128
Notes to the consolidated Financial Statements as of December 31, 2010
(Translation of consolidated financial statements originally issued in Spanish – see Note 2.2)
|
b)
|
Reserves for foreign currency exchange differences
|
As of December 31, 2010 and 2009, foreign currency exchange differences are detailed as follows:
|
Detail
|
12.31.2010
ThUS$
|
12.31.2009
ThUS$
|
||||||
|
Changes in equity generated through the equity method
|
||||||||
|
Comercial Hydro S.A.
|
937 | 946 | ||||||
|
SQMC Internacional Ltda.
|
41 | 43 | ||||||
|
Proinsa Ltda.
|
31 | 32 | ||||||
|
Agrorama Callegari Ltda.
|
161 | 66 | ||||||
|
Isapre Cruz del Norte Ltda.
|
99 | 37 | ||||||
|
Almacenes y Depósitos Ltda.
|
90 | 42 | ||||||
|
Sales de Magnesio Ltda.
|
132 | 53 | ||||||
|
Sociedad de Servicios de Salud S.A.
|
39 | 15 | ||||||
|
Total
|
1,530 | 1,234 | ||||||
|
c)
|
Functional and presentation currency
|
The functional currency of the aforementioned entities is the Chilean peso and the presentation currency is the United States dollar.
|
d)
|
Reasons to use one presentation currency and a different functional currency
|
|
|
-
|
The total revenues of these subsidiaries are associated with the Chilean peso.
|
|
|
-
|
The commercialization cost structure of these companies is affected by the local currency.
|
|
|
-
|
The equities of these companies are expressed in local currency (Chilean peso).
|
|
25.1
|
Disclosures of disbursements related to the environment
|
The Company is continuously concerned with protecting the environment both in its production processes and with respect to products manufactured. This commitment is supported by the principles indicated in the Company’s Sustainable Development Policy. The Company is currently operating under an Environmental Management System (EMS) that has allowed it to strengthen its environmental performance through the effective application of the Company’s Sustainable Development Policy
F-129
Notes to the consolidated Financial Statements as of December 31, 2010
(Translation of consolidated financial statements originally issued in Spanish – see Note 2.2)
Note 25 - The environment (continued)
|
25.1
|
Disclosures of disbursements related to the environment (continued)
|
Operations that use caliche as a raw material are carried out in desert areas with climatic conditions that are favorable for drying solids and evaporating liquids using solar energy. Operations involving the open-pit extraction of minerals, due to their low waste-to-mineral ratio, generate remaining deposits that slightly alter the environment. A portion of the ore extracted is crushed, a process in which particle emissions occur. Currently this operation is conducted only at the Pedro de Valdivia worksite. In the María Elena location, crushing units used to operate that affected the air quality. The Company has implemented a range of mitigating actions that have led to a notable improvement in air quality at Maria Elena, and beginning in March 2010, no ore crushing process is conducted in the Maria Elena sector.
Many of the Company’s products are shipped in bulk at the Port of Tocopilla. In 2007 the city of Tocopilla was declared a zone Saturated with MP 10 Particles mainly due to the emissions from the electric power plants that operate in that city. In October 2010 the Decontamination Plan for Tocopilla was put in place. Accordingly, the Company has committed to taking several measures to mitigate the effects derived from bulk product movements in the port. These measures have been successfully implemented since 2007.
The Company carries out environmental follow-up and monitoring plans based on specialized scientific studies, and it also provides an annual training program in environmental matters to both its direct employees and its contractors’ employees. Within this context, the Company entered into a contract with the National Forestry Corporation (CONAF) aimed at researching the activities of flamingo groups that live in the Salar de Atacama (Atacama Saltpeter Deposit) lagoons. Such research includes a population count of the birds, as well as breeding research. Environmental monitoring activities carried out by the Company at the Salar de Atacama and other systems in which it operates are supported by a number of studies that have integrated diverse scientific efforts from prestigious research centers, including Dictuc from the Pontificia Universidad Católica in Santiago and the School of Agricultural Science of the Universidad de Chile.
Furthermore, within the framework of the environmental studies which the Company is conducting, the Company performs significant activities in relation to the recording of Pre-Columbian and historical cultural heritage, as well as the protection of heritage sites, in accordance with current Chilean laws. These activities have been especially performed in the areas surrounding Maria Elena and the Nueva Victoria plants. This effort is being accompanied by cultural initiatives within the community and the organization of exhibits in local and regional museums.
As emphasized in its Sustainable Development Policy, the Company strives to maintain positive relationships with the communities surrounding the locations in which it carries out its operations, as well as to participate in communities’ development by supporting joint projects and activities which help to improve the quality of life for residents. For this purpose, the Company has focused its efforts on activities involving the rescue of historical heritage, education and culture, as well as development, and in order to do so, it acts both individually and in conjunction with private and public entities.
F-130
Notes to the consolidated Financial Statements as of December 31, 2010
(Translation of consolidated financial statements originally issued in Spanish – see Note 2.2)
Note 25 - The environment (continued)
|
25.2
|
Detail of information on disbursements related to the environment
|
The accumulated disbursements in which the Company incurred as of December 31, 2010 for the concept of investments in production processes, verification and control of compliance with ordinances and laws relative to industrial processes and facilities, including prior year disbursements related to these projects amounted to ThUS$ 11,335 and are detailed as follows:
F-131
Notes to the consolidated Financial Statements as of December 31, 2010
(Translation of consolidated financial statements originally issued in Spanish – see Note 2.2)
Note 25 - The environment (continued)
|
25.3
|
Detail of information on disbursements related to the environment
|
Accumulated expenses as of December 31, 2010
|
Identification of the Parent
Company or subsidiary
|
Name of the project with which the
disbursement is associated
|
Concept for which the disbursement was made
or will be made
|
Asset / Expense
|
Description of
the asset or
expense Item
|
Amount of
disbursement
for the Period
ThUS$
|
Certain or estimated
date on which
disbursements were or
will be made
|
||||||
|
SQM Industrial S.A
|
Environment Management (2010 Expense)
|
Not classified
|
Expense
|
Not classified
|
1,270
|
12.01.2010
|
||||||
|
SQM Industrial S.A
|
MCLX - Cleaning of the saving yards
|
Cost reduction
|
Expense
|
Development
|
604
|
10.01.2010
|
||||||
|
SQM Industrial S.A
|
ANMI - Infrastructure consulting for the storage of dangerous chemical substances
|
Support: Risk prevention and the environment
|
Asset
|
Development
|
46
|
12.01.2010
|
||||||
|
SQM Industrial S.A
|
MNH8 - Lightning upgrades
|
Support
|
Expense
|
Development
|
228
|
12.01.2010
|
||||||
|
SQM Industrial S.A
|
SCCY - Disposal of dangerous residue
|
Support
|
Asset - Expense
|
Development
|
165
|
12.01.2010
|
||||||
|
SQM Industrial S.A
|
JNTU - San Isidro wáter evaluation
|
Support: Risk prevention and the environment
|
Asset
|
Not classified
|
556
|
12.31.2010
|
||||||
|
SQM Industrial S.A
|
JNNX - Nitrate environment various
|
Support: Risk prevention and the environment
|
Asset
|
Not classified
|
51
|
12.01.2010
|
||||||
|
SQM Industrial S.A
|
MNTE - Industrial hygiene equipmentl
|
Support: Risk prevention and the environment
|
Asset
|
Development
|
19
|
12.01.2010
|
||||||
|
SQM Industrial S.A
|
INST - Adquisition of used lubricant rapid disposal bank. NV-ME-PB
|
Support: Risk prevention and the environment
|
Expense
|
Development
|
46
|
01.07.2010
|
||||||
|
SQM Industrial S.A
|
MP17 - Normalization of consumable water ME/CS/PV
|
Support
|
Asset
|
Not classified
|
7
|
12.01.2010
|
||||||
|
SQM Industrial S.A
|
MP5W - Normalization TK´s fuel
|
Support
|
Asset
|
Not classified
|
397
|
12.01.2010
|
||||||
|
SQM Industrial S.A
|
FNWR DIA Discard field Pampa Blanca
|
Support: Risk prevention and the environment
|
Expense
|
Development
|
30
|
12.01.2010
|
||||||
|
SQM Industrial S.A
|
MNYS Actions for the dissemination of cultural heritage, technology change Maria Elena
|
Support: Risk prevention and the environment
|
Asset
|
Not classified
|
21
|
12.31.2010
|
||||||
|
SQM Industrial S.A
|
FP55-FPXA
|
Support
|
Asset
|
Development
|
1,106
|
12.31.2010
|
||||||
|
SQM Industrial S.A
|
MP8Z Automation of water volume inlet pipe ME, CS and Vergara
|
Support
|
Asset
|
Development
|
523
|
12.01.2010
|
||||||
|
SQM Industrial S.A
|
MPL5Repair of sanitary and electric facilities
|
Support
|
Asset
|
Development
|
184
|
10.01.2010
|
||||||
|
SQM Industrial S.A
|
MPIS - Stabilization of streets and suppression of dust at sidewalks
|
Support
|
Asset
|
Development
|
736
|
10.01.2010
|
||||||
|
SQM Industrial S.A
|
PPNK Handling of PV ammonia in Detention of plant
|
Support: Risk prevention and the environment
|
Asset
|
Not classified
|
22
|
12.01.2010
|
||||||
|
SQM Industrial S.A
|
MPGF Improvement of sealing and pressurization room 031
|
Support
|
Asset - Expense
|
Not classified
|
48
|
12.01.2010
|
||||||
|
SQM Industrial S.A
|
TPO4 Indigenous camp
|
Support
|
Asset
|
Not classified
|
88
|
06.11.2010
|
||||||
|
SQM Industrial S.A
|
MPLS Automated alarms and information of monitoring station Hospital
|
Not classified
|
Asset
|
Not classified
|
10
|
12.01.2010
|
||||||
|
Minera Nueva Victoria S.A.
|
IPNW Extension in sanitary capacity for Iris
|
Support
|
Asset
|
Not classified
|
44
|
12.01.2010
|
||||||
|
Minera Nueva Victoria S.A.
|
IPMN Extension in sanitary capacity for Iris
|
Capacity upgrade
|
Asset
|
Development
|
85
|
12.01.2010
|
||||||
|
SQM Nitratos S.A
|
PNH2 Maintenance of Environmental projects ME-PV-NV-PB
|
Support: Risk prevention and the environment
|
Asset - Expense
|
Development
|
48
|
06.29.2010
|
F-132
Notes to the consolidated Financial Statements as of December 31, 2010
(Translation of consolidated financial statements originally issued in Spanish – see Note 2.2)
Note 25 - The environment (continued)
|
25.2
|
Detail of information on disbursements related to the environment (continued)
|
Accumulated expenses as of December 31, 2010 (continued)
|
Identification of the Parent
Company or subsidiary
|
Name of the project with which the
disbursement is associated
|
Concept for which the disbursement was
made or will be made
|
Asset / Expense
|
Description
of the asset
or expense
Item
|
Amount of
disbursement
for the Period
ThUS$
|
Certain or estimated
date on which
disbursements were
or will be made
|
||||||
|
SQM Nitratos S.A
|
PP0V - Maintenance of environmental projects ME-PV-NV-PB
|
Support: Risk prevention and the environment
|
Asset - Expense
|
Development
|
82
|
12.01.2010
|
||||||
|
SQM Nitratos S.A
|
IP6W Tratment plants of “riles”
|
Support: Risk prevention and the environment
|
Asset
|
Not classified
|
95
|
12.01.2010
|
||||||
|
SQM Nitratos S.A
|
PPAT - Risk prevention projects Sem II 2008
|
Support: Risk prevention and the environment
|
Expense
|
Development
|
157
|
12.01.2010
|
||||||
|
SQM Salar S.A
|
LP5K Enviromental evaluation (mop)
|
Support: Risk prevention and the environment
|
Asset
|
Not classified
|
4
|
12.01.2010
|
||||||
|
SQM Salar S.A
|
LP5J - Water study Water Recharge Atacama Saltpeter deposit
|
Support: Risk prevention and the environment
|
Expense
|
Investigation
|
83
|
12.31.2010
|
||||||
|
SQM Salar S.A
|
LNNT Enviromental proyects Salar Chaxa
|
Support: Risk prevention and the environment
|
Expense
|
Not classified
|
98
|
12.01.2010
|
||||||
|
SQM Salar S.A
|
LPIL Upgrade SOP plant
|
Capacity uograde
|
Asset
|
Development
|
17
|
12.01.2010
|
||||||
|
SQM Salar S.A
|
LPIK Potasium Plant
|
Capacity uograde
|
Asset
|
Development
|
19
|
12.01.2010
|
||||||
|
SQM Salar S.A
|
LP82 - Proyecto de Fomento a la Actividad Agricola en Localidades del Salar
|
Support
|
Expense
|
Development
|
331
|
12.31.2012
|
||||||
|
SQM Salar S.A
|
LPGA Improvement in facilitiesToconao
|
Capacity uograde
|
Asset
|
Not classified
|
109
|
09.30.2010
|
||||||
|
SQM Salar S.A
|
LPK2 Cash exchange house
|
Not classified
|
Asset
|
Not classified
|
102
|
12.01.2010
|
||||||
|
SQM Salar S.A
|
LPN3 New plant MOP
|
Support
|
Asset
|
Investigation
|
19
|
12.31.2011
|
||||||
|
SQM Salar S.A
|
CPTP - Installation of drinking water emergency showers
|
Support
|
Asset
|
Not classified
|
14
|
04.01.2011
|
||||||
|
SQM Salar S.A
|
LPTF Environment projects
|
Support
|
Expense
|
Not classified
|
169
|
12.31.2010
|
||||||
|
SQM Salar S.A
|
LPTJ Sanitary uogrades
|
Support
|
Asset
|
Not classified
|
95
|
05.01.2011
|
||||||
|
SQM Salar S.A
|
LPPJ - DIA SOP upgrade
|
Capacity uograde
|
Asset
|
Not classified
|
14
|
12.31.2011
|
||||||
|
SIT S.A.
|
TNLA - Road paving
|
Support: Risk prevention and the environment
|
Asset
|
Development
|
82
|
12.01.2010
|
||||||
|
SIT S.A.
|
PNOT - Lightning uograde (train area)
|
Support
|
Asset -Expense
|
Development
|
369
|
12.01.2010
|
||||||
|
SIT S.A.
|
TPR8 - Elimination of waste water generation through vacuum
|
Support: Risk prevention and the environment
|
Asset - Expense
|
Not classified
|
54
|
12.01.2010
|
||||||
|
SIT S.A.
|
TPLR - Waste dispossal system
|
Support: Risk prevention and the environment
|
Asset
|
Not classified
|
68
|
12.01.2010
|
||||||
|
SIT S.A.
|
TPM7 - Environment projects
|
Not classified
|
Asset - Expense
|
Not classified
|
524
|
06.30.2011
|
||||||
|
SQM
|
SCI6 - Environment studies
|
Not classified
|
Expense
|
Not classified
|
2,376
|
10.01.2010
|
F-133
Notes to the consolidated Financial Statements as of December 31, 2010
(Translation of consolidated financial statements originally issued in Spanish – see Note 2.2)
Note 25 - The environment (continued)
|
25.2
|
Detail of information on disbursements related to the environment (continued)
|
Accumulated expenses as of December 31, 2010 (continued)
|
Identification of the Parent
Company or subsidiary
|
Name of the project with which the
disbursement is associated
|
Concept for which the disbursement was
made or will be made
|
Asset / Expense
|
Description
of the asset
or expense
Item
|
Amount of
disbursement
for the Period
ThUS$
|
Certain or estimated
date on which
disbursements were
or will be made
|
||||||
|
SQM S.A.
|
AQ0A Llamara & Tamarugal Meadows
|
Support Natural resources
|
Asset
|
Development
|
5
|
03.30.2011
|
||||||
|
SQM S.A.
|
IPFT - I Region of Chile
Cultural heritage
|
Support: Risk prevention and the environment
|
Expense
|
Not classified
|
111
|
12.31.2011
|
||||||
|
SQM S.A.
|
IPXE- Environmental follow-up plan at Tamarugal Meadows
|
Support: Risk prevention and the environment
|
Expense
|
Not classified
|
4
|
12.31.2012
|
||||||
|
11,335
|
F-134
Notes to the consolidated Financial Statements as of December 31, 2010
(Translation of consolidated financial statements originally issued in Spanish – see Note 2.2)
Note 25 - The environment (continued)
|
25.2
|
Detail of information on disbursements related to the environment (continued)
|
Future expenses
|
Identification of the Parent
Company or subsidiary
|
Name of the project to which the
disbursement is associated
|
Concept for which the disbursement was
made or will be made
|
Asset / Expense
|
Description of
the asset or
expense Item
|
Amount of
disbursement
for the Period
ThUS$
|
Certain or
estimated date on
which
disbursements
were or will be
made
|
||||||
|
SQM Industrial S.A
|
Environment management (Ppto 2011)
|
Not classified
|
Expense
|
Not classified
|
1,771
|
12.01.2011
|
||||||
|
SQM Industrial S.A
|
ACI9 - DIA Coya Sur prilling upgrade
|
Support: Investigation and Development
|
Expense
|
Investigation
|
23
|
12.31.2011
|
||||||
|
SQM Industrial S.A
|
ANMI Consulting for infrastructure for the storage of hazardous chemicals
|
Support: Risk prevention and the environment
|
Asset
|
Development
|
4
|
06.30.2011
|
||||||
|
SQM Industrial S.A
|
MNH8 Improvement in lighting
|
Support
|
Expense
|
Development
|
2
|
06.30.2011
|
||||||
|
SQM Industrial S.A
|
MP5W Normalization of TK fuels
|
Support
|
Asset
|
Not classified
|
703
|
12.31.2011
|
||||||
|
SQM Industrial S.A
|
MNYS Actions for the dissemination of cultural heritage, technology change Maria Elena
|
Support: Risk prevention and the environment
|
Asset
|
Not classified
|
85
|
12.31.2011
|
||||||
|
SQM Industrial S.A
|
FP55-FPXA Pampa Blanca sea water (DIA Mine Zone PB and DIA extension PB)
|
Support
|
Asset
|
Development
|
204
|
12.31.2011
|
||||||
|
SQM Industrial S.A
|
MP8Z Automation of water volume inlet pipe ME, CS and Vergara
|
Support
|
Asset
|
Development
|
261
|
12.31.2011
|
||||||
|
SQM Industrial S.A
|
PPC1 Replacement of starters and transformers with PCB
|
Support: equipment renewal
|
Asset - Expense
|
Not classified
|
171
|
12.31.2011
|
||||||
|
SQM Industrial S.A
|
MPIS - Stabilization of streets and suppression of dust at sidewalks
|
Support
|
Asset
|
Development
|
1
|
06.30.2011
|
||||||
|
SQM Industrial S.A
|
PPNK Handling of PV ammonia in Detention of plant
|
Support: Risk prevention and the environment
|
Asset
|
Not classified
|
177
|
12.31.2011
|
||||||
|
SQM Industrial S.A
|
PPZU - Normalize and certifícate fuel tanks
|
Support: Risk prevention and the environment
|
Asset - Expense
|
Not classified
|
3,000
|
07.01.2011
|
||||||
|
SQM Industrial S.A
|
IQ5B - transfer pumps upgrade
|
Housing upgrade
|
Asset -Expense
|
Not classified
|
110
|
10.10.2011
|
||||||
|
SQM Industrial S.A
|
MQ51 environmental maintenance projects
|
Support
|
Expense
|
Not classified
|
10
|
06.30.2011
|
||||||
|
SQM Industrial S.A
|
FQ39 - Closing of Pampa Blanca
|
Support: Risk prevention and the environment
|
Asset
|
Development
|
500
|
12.01.2011
|
||||||
|
Minera Nueva Victoria S.A.
|
IQ4C - Camp development
|
Support
|
Asset - Expense
|
Not classified
|
3,000
|
12.31.2012
|
||||||
|
SQM Nitratos S.A
|
PP0V environmental maintenance projects
|
Support: Risk prevention and the environment
|
Asset - Expense
|
Development
|
4
|
06.30.2011
|
||||||
|
SQM Nitratos S.A
|
PPAT Risk prevention projects Sem II 2008
|
Support: Risk prevention and the environment
|
Expense
|
Development
|
1
|
06.30.2011
|
F-135
Notes to the consolidated Financial Statements as of December 31, 2010
(Translation of consolidated financial statements originally issued in Spanish – see Note 2.2)
Note 25 - The environment (continued)
|
25.2
|
Detail of information on disbursements related to the environment (continued)
|
Future expenses (continued)
|
Identification of the Parent
Company or subsidiary
|
Name of the project to which the
disbursement is associated
|
Concept for which the disbursement was
made or will be made
|
Asset / Expense
|
Description of
the asset or
expense Item
|
Amount of
disbursement
for the Period
ThUS$
|
Certain or
estimated date on
which
disbursements
were or will be
made
|
||||||
|
SQM Salar S.A
|
LP5J - Salar de Atacama recharge project
|
Support: Risk prevention and the environment
|
-
|
Investigation
|
29
|
06.30.2011
|
||||||
|
SQM Salar S.A
|
LQ38 - Drying yard
|
Support: Risk prevention and the environment
|
Asset - Expense
|
Not classified
|
154
|
09.30.2011
|
||||||
|
SQM Salar S.A
|
LP82 Project to foster agricultural activity in saltpeter locations
|
Support
|
Expense
|
Development
|
528
|
12.31.2012
|
||||||
|
SQM Salar S.A
|
LPK2 - Money exchange
|
Not classified
|
Asset
|
Not classified
|
102
|
12.31.2011
|
||||||
|
SQM Salar S.A
|
CPTP - Instalation of emergency showers
|
Support
|
Asset
|
Not classified
|
12
|
04.01.2011
|
||||||
|
SQM Salar S.A
|
LPTF - Environment study
|
Support
|
Expense
|
Not classified
|
226
|
12.31.2011
|
||||||
|
SQM Salar S.A
|
LPTJ - Sanitary improvements
|
Support
|
Asset
|
Not classified
|
104
|
05.01.2011
|
||||||
|
SQM Salar S.A
|
LQ33 - Salar regularization
|
Not classified
|
Asset - Expense
|
Not classified
|
300
|
12.31.2011
|
||||||
|
SIT S.A.
|
PNOT - Lightning improvement (train area)
|
Support
|
Asset -Expense
|
Development
|
65
|
06.30.2011
|
||||||
|
SIT S.A.
|
TPR8 - Elimination of waste water generation through vacuum
|
Support: Risk prevention and the environment
|
Asset - Expense
|
Not classified
|
96
|
12.31.2011
|
||||||
|
SIT S.A.
|
TPLR Implementation of a system to pump sewage to dump
|
Support: Risk prevention and the environment
|
Asset
|
Not classified
|
10
|
06.30.2011
|
||||||
|
SIT S.A.
|
TPM7 Environment project
|
Not classified
|
Asset - Expense
|
Not classified
|
15
|
06.30.2011
|
||||||
|
SQM S.A.
|
SCI6 Environment studies, 1 region
|
Not classified
|
Expense
|
Not classified
|
1
|
06.30.2011
|
||||||
|
SQM S.A.
|
AQ0A - Drilling 4 wells
|
Support: Natural Resources
|
Asset
|
Development
|
595
|
03.30.2011
|
||||||
|
SQM S.A.
|
IPFT - Cultural heritage, 1 region
|
Support: Risk prevention and the environment
|
Expense
|
Not classified
|
47
|
12.31.2011
|
||||||
|
SQM S.A.
|
IQ0C - Nueva Victoria Mining zone
|
Support: Risk prevention and the environment
|
Expense
|
Not classified
|
139
|
12.31.2011
|
||||||
|
SQM S.A.
|
IPXF- Environmental follow-up plan at Llamara Salar
|
Support: Risk prevention and the environment
|
Expense
|
Not classified
|
530
|
12.31.2012
|
||||||
|
SQM S.A.
|
IPXF- Environmental follow-up plan at Tamarugal Meadows
|
Support: Risk prevention and the environment
|
Expense
|
Not classified
|
543
|
12.31.2012
|
||||||
|
SQM S.A.
|
IQ08 - PSA Llamara & Pampa del Tamarugal
|
Support: Natural Resources
|
Expense
|
Development
|
424
|
02.28.2011
|
||||||
|
SQM S.A.
|
IQ1M - PSA Water re usal in Puquíos Llamara
|
Not classified
|
Asset
|
Not classified
|
1,649
|
07.31.2011
|
F-136
Notes to the consolidated Financial Statements as of December 31, 2010
(Translation of consolidated financial statements originally issued in Spanish – see Note 2.2)
Note 25 - The environment (continued)
|
25.2
|
Detail of information on disbursements related to the environment (continued)
|
Future expenses (continued)
|
Identification of the Parent
Company or subsidiary
|
Name of the project to which the
disbursement is associated
|
Concept for which the disbursement was
made or will be made
|
Asset / Expense
|
Description of
the asset or
expense Item
|
Amount of
disbursement
for the Period
ThUS$
|
Certain or
estimated date on
which
disbursements
were or will be
made
|
||||||
|
SQM S.A.
|
IQ1K - Constructoin of 3 observation wells
|
Support: Natural Resources
|
Asset
|
Development
|
200
|
03.31.2011
|
||||||
|
SQM S.A.
|
IQ3S - Handling of dangerous materials
|
Support: Risk prevention and the environment
|
Asset
|
Not classified
|
400
|
12.30.2012
|
||||||
|
SQM S.A.
|
IQ52 - Environment office
|
Support: Risk prevention and the environment
|
Asset
|
Not classified
|
30
|
06.31.2011
|
||||||
|
SQM S.A.
|
IQ54 - Pampa Hermosa cultural heritage
|
Support: Risk prevention and the environment
|
Asset
|
Not classified
|
340
|
12.31.2011
|
||||||
|
SQM S.A.
|
IQ53 - Pampa Hermosa cultural heritage
|
Support: Risk prevention and the environment
|
Asset
|
Not classified
|
20
|
12.31.2011
|
||||||
|
16,586
|
F-137
Notes to the consolidated Financial Statements as of December 31, 2010
(Translation of consolidated financial statements originally issued in Spanish – see Note 2.2)
Note 25 - The environment (continued)
|
25.2
|
Detail of information on disbursements related to the environment (continued)
|
Accumulated expenses, as of December 31, 2009
|
Identification of the Parent
Company or subsidiary
|
Name of the project with which the
disbursement is associated
|
Concept for which the disbursement was
made or will be made
|
Asset / Expense
|
Description of
the asset or
expense Item
|
Amount of
disbursement
for the Period
ThUS$
|
Certain or
estimated date on
which
disbursements
were or will be
made
|
||||||
|
SQM Industrial S.A.
|
Yard cleaning
|
Cost reduction
|
Expense
|
Development
|
569
|
12.31.2009
|
||||||
|
SQM Industrial S.A.
|
Construction of sewer water plant
|
Support: Risk prevention and the environment
|
Expense
|
Development
|
32
|
03.31.2009
|
||||||
|
SQM Industrial S.A.
|
Environment studies
|
Support: Risk prevention and the environment
|
Expense
|
Development
|
5
|
04.30.2009
|
||||||
|
SQM Industrial S.A.
|
ANMI - Consulting infrastructure to the storage of Hazardous chemicals products
|
Support: Risk prevention and the environment
|
Expense
|
Development
|
46
|
12.31.2009
|
||||||
|
SQM Industrial S.A.
|
Lightning improvements
|
Support
|
Asset
|
Development
|
221
|
12.31.2009
|
||||||
|
SQM Industrial S.A.
|
Sanitary instalation in Prilling plant
|
Support: Risk prevention and the environment
|
Expense
|
Not classified
|
44
|
09.30.2009
|
||||||
|
SQM Industrial S.A.
|
Dangerous waste dispossal
|
Support
|
Asset
|
Development
|
165
|
12.31.2009
|
||||||
|
SQM Industrial S.A.
|
San Isidro wáter evaluation
|
Support: Risk prevention and the environment
|
Asset-Expense
|
Not classified
|
505
|
12.31.2009
|
||||||
|
SQM Industrial S.A.
|
Improvement in NH3 level measurement
|
Support
|
Expense
|
Not classified
|
64
|
12.30.2009
|
||||||
|
SQM Industrial S.A.
|
Sanitary instalation regulation
|
Support: Risk prevention and the environment
|
Expense
|
Not classified
|
82
|
08.30.2009
|
||||||
|
SQM Industrial S.A.
|
Industrial Hygiene equipment
|
Support: Risk prevention and the environment
|
Asset
|
Development
|
31
|
12.31.2009
|
||||||
|
SQM Industrial S.A.
|
Replacement of starters and transformers with PCB
|
Support: Risk prevention and the environment
|
Expense
|
Not classified
|
4
|
12.31.2009
|
||||||
|
SQM Industrial S.A.
|
Acquisition for quick evacuation for used lubricants. NV-ME-PB
|
Support: Risk prevention and the environment
|
Asset
|
Development
|
45
|
12.31.2009
|
||||||
|
SQM Industrial S.A.
|
Handling of waste at Antofagasta
|
Support: Risk prevention and the environment
|
Asset
|
Not classified
|
17
|
12.31.2009
|
||||||
|
SQM Industrial S.A.
|
Normalization drinking water chloride ME/CS/PV
|
Support
|
Expense
|
Not classified
|
7
|
02.28.2009
|
||||||
|
SQM Industrial S.A.
|
Normalization of TK fuels
|
Support
|
Asset
|
Not classified
|
160
|
12.31.2009
|
||||||
|
SQM Industrial S.A.
|
DIA Discard field Pampa Blanca
|
Support: Risk prevention and the environment
|
Asset
|
Development
|
30
|
12.31.2009
|
||||||
|
SQM Industrial S.A.
|
Actions for the dissemination of cultural heritage, technology change Maria Elena
|
Support: Risk prevention and the environment
|
Expense
|
Not classified
|
20
|
12.31.2009
|
||||||
|
SQM Industrial S.A.
|
Chamber to detect gas leaking
|
Support: Risk prevention and the environment
|
Expense
|
Investigation
|
5
|
01.31.2009
|
||||||
|
SQM Industrial S.A.
|
Automation of water volume inlet pipe ME, CS and Vergara
|
Support
|
Asset
|
Development
|
261
|
12.31.2009
|
||||||
|
SQM Industrial S.A.
|
Repair of sanitary and electric facilities
|
Support
|
Asset-Expense
|
Development
|
165
|
12.31.2009
|
F-138
Notes to the consolidated Financial Statements as of December 31, 2010
(Translation of consolidated financial statements originally issued in Spanish – see Note 2.2)
Note 25 - The environment (continued)
|
25.2
|
Detail of information on disbursements related to the environment (continued)
|
Accumulated expenses, as of December31, 2009 (continued)
|
Identification of the Parent
Company or subsidiary
|
Name of the project with which the
disbursement is associated
|
Concept for which the disbursement was
made or will be made
|
Asset / Expense
|
Description of
the asset or
expense Item
|
Amount of
disbursement
for the Period
ThUS$
|
Certain or
estimated date
on which
disbursements
were or will be
made
|
||||||
|
SQM Industrial S.A.
|
MPIS - Stabilization of streets and suppression of dust at sidewalks
|
Support
|
Asset
|
Development
|
689
|
06.30.2009
|
||||||
|
SQM Industrial S.A.
|
Improvement of sealing and pressurization room 031
|
Support
|
Asset
|
Not classified
|
42
|
11.01.2009
|
||||||
|
SQM Industrial S.A.
|
Nitrate miscellaneous project
|
Support: Risk prevention and the environment
|
Asset
|
Not classified
|
51
|
12.31.2009
|
||||||
|
SQM Industrial S.A.
|
Automated alarms and information of monitoring station Hospital
|
Not classified
|
Asset
|
Not classified
|
8
|
12.30.2009
|
||||||
|
SQM Industrial S.A.
|
Handling of PV ammonia in Detention of plant
|
Support: Risk prevention and the environment
|
Asset
|
Not classified
|
1
|
12.01.2009
|
||||||
|
SQM Industrial S.A.
|
Indigenous camp
|
Support
|
Asset-Expense
|
Not classified
|
83
|
12.31.2009
|
||||||
|
SQM Industrial S.A.
|
Pampa Blanca sea water (DIA Mine Zone PB and DIA extension PB)
|
Support
|
Asset
|
Development
|
461
|
12.30.2009
|
||||||
|
SQM Industrial S.A.
|
Environmental Management
|
Operations
|
Expense
|
Not classified
|
1,235
|
12.31.2009
|
||||||
|
Minera Nueva Victoria
|
Extension in sanitary capacity for Iris
|
Capacity extension
|
Asset
|
Development
|
85
|
12.31.2009
|
||||||
|
SQM Nitratos S.A.
|
Waste water treatment plant washing surfaces PV-NV-PB
|
Support: Risk prevention and the environment
|
Asset-Expense
|
Development
|
42
|
12.31.2009
|
||||||
|
SQM Nitratos S.A.
|
Maintenance of Environmental projects ME-PV-NV-PB
|
Support: Risk prevention and the environment
|
Asset-Expense
|
Development
|
82
|
12.31.2009
|
||||||
|
SQM Nitratos S.A.
|
Waste water treatment plant
|
Support: Risk prevention and the environment
|
Asset-Expense
|
Not classified
|
95
|
12.31.2009
|
||||||
|
SQM Nitratos S.A.
|
Risk prevention projects Sem II 2008
|
Support: Risk prevention and the environment
|
Asset
|
Development
|
117
|
12.31.2009
|
F-139
Notes to the consolidated Financial Statements as of December 31, 2010
(Translation of consolidated financial statements originally issued in Spanish – see Note 2.2)
Note 25 - The environment (continued)
|
25.2
|
Detail of information on disbursements related to the environment (continued)
|
Accumulated expenses, as of December 31, 2009
|
Identification of the Parent
Company or subsidiary
|
Name of the project with which the
disbursement is associated
|
Concept for which the disbursement was
made or will be made
|
Asset / Expense
|
Description of
the asset or
expense Item
|
Amount of
disbursement
for the Period
ThUS$
|
Certain or
estimated date on
which
disbursements
were or will be
made
|
||||||
|
SQM Salar S.A.
|
Environmental evaluation extension of production capacity MOP
|
Support: Risk prevention and the environment
|
Asset-Expense
|
Not classified
|
38
|
12.31.2009
|
||||||
|
SQM Salar S.A.
|
Detailed engineering and implementation of a dust collector
|
Support
|
Expense
|
Not classified
|
81
|
08.30.2009
|
||||||
|
SQM Salar S.A.
|
Renewal of meteorological station Chaxa saltpeter deposit
|
Support: Risk prevention and the environment
|
Asset
|
Not classified
|
98
|
12.31.2009
|
||||||
|
SQM Salar S.A.
|
Study for water recharge at Atacama saltpeter
|
Support: Risk prevention and the environment
|
Expense
|
Investigación
|
42
|
08.31.2009
|
||||||
|
SQM Salar S.A.
|
Construction of pit for used water infiltration, Toconao camp
|
Capacity extension
|
Asset
|
Not classified
|
106
|
12.31.2009
|
||||||
|
SQM Salar S.A.
|
Project to foster agricultural activity in saltpeter locations
|
Support
|
Asset-Expense
|
Development
|
131
|
12.31.2009
|
||||||
|
SQM Salar S.A.
|
Implementation of currency Exchange facility
|
Not classified
|
Asset
|
Not classified
|
105
|
02.28.2010
|
||||||
|
SQM Salar S.A.
|
Dual MOP-SOP (DIA Plant Modification SOP)
|
Capacity extension
|
Asset
|
Development
|
14
|
12.31.2009
|
||||||
|
SQM Salar S.A.
|
Dryer MOP (DIA Potassium chloride dryer plant)
|
Capacity extension
|
Asset
|
Development
|
19
|
12.31.2009
|
||||||
|
SIT S.A.
|
Pavement of Work location- port road
|
Support: Risk prevention and the environment
|
Asset
|
Development
|
82
|
12.31.2009
|
||||||
|
SIT S.A.
|
Risk prevention plan Port
|
Support: Risk prevention and the environment
|
Asset-Expense
|
Development
|
101
|
12.31.2009
|
||||||
|
SIT S.A.
|
Lighting improvement, railroad area
|
Support
|
Asset
|
Development
|
365
|
12.31.2009
|
||||||
|
SIT S.A.
|
Implementation of a system to pump sewage to dump
|
Support: Risk prevention and the environment
|
Asset-Expense
|
Not classified
|
68
|
12.31.2009
|
||||||
|
SIT S.A.
|
Environmental meshes for fields 3 and 4
|
Not classified
|
Asset
|
Not classified
|
164
|
12.30.2009
|
||||||
|
SQM S.A.
|
Environmental study - Region I project
|
Not classified
|
Asset-Expense
|
Not classified
|
2,091
|
06.30.2010
|
||||||
|
SQM S.A.
|
Environmental commitments Nueva Victoria mine Zone
|
Support: Risk prevention and the environment
|
Expense
|
Not classified
|
275
|
03.30.2009
|
||||||
|
SQM S.A.
|
Cultural heritage Region I
|
Support: Risk prevention and the environment
|
Asset-Expense
|
Not classified
|
75
|
12.30.2009
|
||||||
|
Total
|
9,324
|
F-140
Notes to the consolidated Financial Statements as of December 31, 2010
(Translation of consolidated financial statements originally issued in Spanish – see Note 2.2)
Note 25 - The environment (continued)
|
25.2
|
Detail of information on disbursements related to the environment (continued)
|
Future expenses, as of December 31, 2009
|
Identification of the Parent
Company or subsidiary
|
Name of the project with which the
disbursement is associated
|
Concept for which the disbursement was
made or will be made
|
Asset / Expense
|
Description of the
asset or expense
Item
|
Amount of
disbursement
for the Period
ThUS$
|
Certain or estimated
date on which
disbursements were
or will be made
|
||||||
|
SQM Industrial S.A.
|
Consulting in infrastructure to store hazardous chemicals
|
Support: Risk prevention and the environment
|
Expense
|
Development
|
4
|
12.31.2010
|
||||||
|
SQM Industrial S.A.
|
Improvement in lighting
|
Support
|
Asset
|
Development
|
27
|
12.31.2010
|
||||||
|
SQM Industrial S.A.
|
San Isidro water assessment
|
Support: Risk prevention and the environment
|
Asset/Expense
|
Not classified
|
352
|
12.31.2010
|
||||||
|
SQM Industrial S.A.
|
Normalization of drinking water chlorination, ME/CS/PV
|
Support
|
Expense
|
Not classified
|
88
|
12.31.2010
|
||||||
|
SQM Industrial S.A.
|
Normalization of TK´s fuel
|
Support
|
Asset
|
Not classified
|
748
|
12.31.2010
|
||||||
|
SQM Industrial S.A.
|
Cultural heritage dissemination actions, Technological change at Maria Elena
|
Support: Risk prevention and the environment
|
Expense
|
Not classified
|
13
|
12.31.2010
|
||||||
|
SQM Industrial S.A.
|
Elimination of OCB switches at 3 and 1/12 Pedro de Valdivia sub stations
|
Support: Replacement of equipment
|
Asset
|
Not classified
|
171
|
12.31.2010
|
||||||
|
SQM Industrial S.A.
|
Improvement of sealing and pressurization of 031 room
|
Support
|
Asset
|
Not classified
|
28
|
12.31.2010
|
||||||
|
SQM Industrial S.A.
|
Improvement of NV supervisors’ hall
|
Support
|
Asset/Expense
|
Not classified
|
10
|
12.31.2010
|
||||||
|
SQM Industrial S.A.
|
Automation of alarms and information on Hospital Monitoring station
|
Not classified
|
Asset
|
Not classified
|
2
|
12.31.2010
|
||||||
|
SQM Industrial S.A.
|
Handling of PV ammonia at plant stoppage
|
Support: Risk prevention and the environment
|
Asset
|
Not classified
|
134
|
12.31.2010
|
||||||
|
SQM Industrial S.A.
|
Pampa Blanca sea water (DIA PB mine zone and DIA PB extension)
|
Support
|
Asset
|
Development
|
30
|
12.31.2010
|
||||||
|
SQM Industrial S.A.
|
Environmental management
|
Support
|
Expense
|
Not classified
|
1,239
|
12.31.2010
|
||||||
|
Minera Nueva Victoria
|
Improvements in Iris C/D/B halls
|
Support
|
Asset
|
Not classified
|
44
|
12.31.2010
|
||||||
|
SQM Nitratos S.A.
|
ME-PV-NV-PB environmental maintenance projects
|
Support: Risk prevention and the environment
|
Asset-Expense
|
Development
|
4
|
12.31.2010
|
||||||
|
SQM Nitratos S.A.
|
Risk prevention projects Sem II 2008
|
Support: Risk prevention and the environment
|
Asset
|
Development
|
38
|
12.31.2010
|
||||||
|
SQM Nitratos S.A.
|
Construction of sewage system at Lagarto.
|
Capacity extension
|
Asset-Expense
|
Development
|
100
|
12.31.2010
|
||||||
|
SQM Salar S.A.
|
Renewal of Chaxa saltpeter deposit meteorological station
|
Support: Risk prevention and the environment
|
Asset
|
Not classified
|
1
|
12.31.2010
|
||||||
|
SQM Salar S.A
|
Water recharge study, Atacama saltpeter deposit
|
Support: Risk prevention and the environment
|
Expense
|
Investigación
|
70
|
12.31.2010
|
||||||
|
SQM Salar S.A
|
Project to foster agricultural activity in saltpeter deposit locations
|
Support
|
Asset-Expense
|
Development
|
212
|
12.31.2010
|
||||||
|
SQM Salar S.A
|
Fuel facility improvement study
|
Support
|
Asset-Expense
|
Investigación
|
50
|
12.31.2011
|
||||||
|
SIT S.A.
|
Improvement in lighting in the railroad area
|
Support
|
Asset
|
Development
|
64
|
12.31.2010
|
||||||
|
SIT S.A.
|
Environmental meshes for fields 3 and 4
|
Not classified
|
Asset
|
Not classified
|
66
|
12.31.2010
|
F-141
Notes to the consolidated Financial Statements as of December 31, 2010
(Translation of consolidated financial statements originally issued in Spanish – see Note 2.2)
Note 25 - The environment (continued)
|
25.2
|
Detail of information on disbursements related to the environment (continued)
|
Future expenses, as of December 31, 2009
|
Identification of the Parent
Company or subsidiary
|
Name of the project with which the
disbursement is associated
|
Concept for which the disbursement was
made or will be made
|
Asset / Expense
|
Description of
the asset or
expense Item
|
Amount of
disbursement
for the Period
ThUS$
|
Certain or
estimated date on
which
disbursements
were or will be
made
|
||||||
|
SIT
S.A.
|
Elimination of waste water generation through vacuum
|
Support: Risk prevention and the environment
|
Expense
|
Not classified
|
150
|
06.30.2010
|
||||||
|
SQM S.A.
|
Environmental studies - Region I project
|
Not classified
|
Asset-Expense
|
Not classified
|
184
|
06.30.2010
|
||||||
|
SQM S.A.
|
Cultural Heritage Region I
|
Support: Risk prevention and the environment
|
Asset-Expense
|
Not classified
|
440
|
12.31.2010
|
||||||
|
Total
|
4,269
|
F-142
Notes to the consolidated Financial Statements as of December 31, 2010
(Translation of consolidated financial statements originally issued in Spanish – see Note 2.2)
Note 25 - The environment (continued)
|
25.3
|
Description of each project, indicating whether they are being implemented or completed
|
SQM Industrial S.A.
MCLX:
Cleaning of rescue yards in every SQM Plant (25 yards). The project consists of cleaning the rescue yards, selecting and selling all tradable waste situated in the yards. To identify and destine domestic waste to authorized dumps. The project is close to completion.
ANMI:
Compliance with technical and legal aspects and with specific regulations applicable to warehouses, signals, safety and main factors associated with materials, products and supplies at the mine site. In addition, the infrastructure of warehouses for storage of hazardous chemicals will be improved. The project is being implemented.
MNH8:
Improvement of lighting in Maria Elena, as some areas lack any lighting, cables are not channeled, and some have deteriorated. The project is being implemented.
SCCY:
Conceptual Engineering and Environmental Study for the construction of warehousing facilities for hazardous waste resulting from several processes. The project is close to completion.
JNTU:
To make an environmental evaluation of San Isidro waters. The project is being implemented.
JNNX:
Inclusion of UV sensor at Coya Sur Meteorological Station, closing of Nueva Victoria Meteorological Station and Georeference new emission sources in Toco and Coya Sur. The project is close to completion.
MNTE:
Acquisition of equipment for quantitative measure of harmful agents in SQM facilities. The project is being implemented.
INST:
Implement evacuation circuit to transfuse oils directly from the equipment moving dirt to ALU storage tanks. The project is close to completion.
MP17:
A study of the current water chlorination system in María Elena, Coya Sur and Pedro de Valdivia will be made to then implement and start the water chlorination system in accordance with the regulations in force. The project is being implemented.
MP5W:
Standardization of fuel storage and distribution at the facilities of SQM. The project is being implemented.
FNWR:
Preparation of DIA for elimination field project Pampa Blanca. The project is close to completion.
MNYS:
Preparation and implementation of geoglyph conservation project. Editing and publication of book and implementation of information center. Construction of storage for collections. All compensation measures María Elena Technological Change Project. The project is being implemented.
F-143
Notes to the consolidated Financial Statements as of December 31, 2010
(Translation of consolidated financial statements originally issued in Spanish – see Note 2.2)
Note 25 - The environment (continued)
|
25.3
|
Description of each project, indicating whether they are being implemented or completed (continued)
|
FP55 - FPXA:
These two projects have a common final object, that is, the installation of an 87 kilometer sea water adductor system from Mejillones to the facilities of SQM in Pampa Blanca. The expenses relate to EIA Zona Mina PB and EIA Ampliación PB only. The projects are being implemented.
MP8Z:
Implement a control system at the water intake of rivers ME; CS and Vergara that allows forriver control automation. In addition, complement the extraction satellite system recently implemented at water intakes to ensure due compliance with the concessions authorized by DGA and therefore ensure the normal water supply needed by SQM. The project is close to completion.
MPL5:
Partial improvement of the water and sewage systems in María Elena. The project is being implemented.
MPIS:
Improve the urban situation of María Elena, paving roads with dust treatment on sidewalks. The project is being implemented.
PPNK:
Project to ensure control of ammonia gas in crystal plant. The project is being implemented.
MPGF:
Eliminate pollution in sub station 031, resulting from an inefficient sealing system. The project is being implemented.
TPO4:
Project to change fresh water and sewage systems in camp Indígena and improve the rooms. The project is close to completion.
MPLS:
Implement alarms via e-mail for Particle concentration peaks and change the text file information log to a database to implement reports. The project is being implemented.
Minera Nueva Victoria S.A.
IPNW:
Replacement of deteriorated bathroom fixtures in order to improve hygiene conditions. The project is being implemented.
IPMN:
Improve sanitary capacity in camp IRIS by building 3 ditches. The project is being implemented.
SQM Nitratos S.A.
PNH2:
Design and build settling ditches for mud, water, oil and a tank with a pump to reuse settled water, metal tanks to withdraw mud. The project is close to completion.
PP0V:
Installation of a container for hazardous waste in maintenance shops and elimination of liquid and solid industrial waste hydraulic filter at maintenance shops situated at the María Elena, Pedro de Valdivia, Nueva Victoria and Pampa Blanca mines. The project is being implemented.
F-144
Notes to the consolidated Financial Statements as of December 31, 2010
(Translation of consolidated financial statements originally issued in Spanish – see Note 2.2)
Note 25 - The environment (continued)
|
25.3
|
Description of each project, indicating whether they are being implemented or completed (continued)
|
IP6W:
Design and build settling ditches for mud, water, oil and a tank with a pump to reuse settled water, metal tanks to withdraw mud. The project is close to completion.
PPAT:
The Company intends to comply with the sanitary regulations in force with respect to the water treatment systems and infiltration of effluents in some sectors of Pedro de Valdivia and María Elena. The project is being implemented.
SQM Salar S.A.
LP5K
: Environmental evaluation via DIA of Project to enhance the MOP production capacity. The project is close to completion.
LNNT:
This Project intends to have reliable measurements of the climatologic seasonal condition of the salt flat, timely measurements to prepare reports and timetables and provide real information to the environmental authority. The project is close to completion.
LP5J:
Perform the analyses conducive to refining the hydrological units of the basin, quantifying the recharge to the water-bearing place using environmental isotopic techniques. The project is being implemented.
LPIL:
Modify the current SOP plant so that it is possible to work on the MOP or SOP production, at Salar de Atacama, as deemed convenient. Expenses only relate to the DIA for the SOP Plant Modification. The project is being implemented.
LPIK:
The final project considers the construction of a new MOP drier as the Compact Drying plant will be used for other purposes at Salar de Atacama. The expenses only relate to the DIA for the Potassium Chloride Drying Plant. The project is close to completion.
LP82:
Support in the development of demonstration lots, technical assistance for the application of improvements in irrigation and agricultural practices. The project is being implemented.
LPGA:
Improvement in the disposal of treated sewage. The project is being implemented.
LPK2:
Improve sanitary fixtures at the current house located at MOP sector to comply with the requirements of the site users. The project is close to completion.
LPN3:
Conceptual engineering and construction of a new granulate-compact plant located at Salar de Atacama. The expenses only relate to the DIA for the New Drying Compacting Plant. The project is being implemented.
CPTP:
Change of the current industrial water system to fresh water in order to comply with the regulations in force contained in DS 72. The project is being implemented.
F-145
Notes to the consolidated Financial Statements as of December 31, 2010
(Translation of consolidated financial statements originally issued in Spanish – see Note 2.2)
Note 25 - The environment (continued)
|
25.3
|
Description of each project, indicating whether they are being implemented or completed (continued)
|
LPTF:
Prepare biannual reports so as to present improvements of environmental checkpoints; knowledge of geological and hydro-geological variables at Salar de Atacama should be improved. The project is being implemented.
LPTJ
: Acquisition of stand equipment to ensure the operational continuity of plants TAS and OR; change in current control system of level of accumulation in TK`s of fresh water, sewage, and sewage elevation tanks, amongst others. The project is being implemented.
LPPJ:
The goal of this project is to enlarge the dual plant situated at Salar de Atacama so that it may produce MOP and SOP at the same time, increasing its capacity. The expenses only relate to the DIA for the SOP Enlargement. The project is being implemented.
SIT S.A.
TNLA:
Pavement of roads in yard 2 and south access to Tocopilla port, as they have dust emissions and there are accident risks as machines are operating. The project is close to completion.
PNOT:
Improve night lighting in high transit sectors, using more continuous sodium lights with a 45 degree angle. ThUS, the security and lighting pollution regulations will be complied with. The project is close to completion.
TPR8:
The Company intends to reduce the generation of liquid and solid industrial waste using aspiration and not washing technologies by implementing an aspiration system that avoids using water and therefore the generation of liquid and solid industrial waste. The project is being implemented.
TPLR:
The goal of this project is to spill sewage generated in Tocopilla port to the public sewage system. The project is being implemented.
TPM7:
Nets will be purchased and installed in yards 3 and 4 in order to control dust emissions coming from screening operations and protect from emissions from the electric power plant. The project is being implemented.
SQM S.A.
SCI6:
The goal of this project is to obtain the environmental permits for projects in the Development I Region, including all initial environmental requirement projects that allow Operations to implement the project construction and operation. The environmental evaluation will be made via EIA, including the preparation of the document as well as activities relating to specific environmental studies (Studies of “tamarugos” in Llamara and P. Tamarugal, archeological mitigation measures, environmental study of Loa river, hydro-geological studies). The project is being implemented.
F-146
Notes to the consolidated Financial Statements as of December 31, 2010
(Translation of consolidated financial statements originally issued in Spanish – see Note 2.2)
|
25.3
|
Description of each project, indicating whether they are being implemented or completed (continued)
|
AQ0A:
To be able to use water rights that have been granted in relation to several wells situated in the ecological reserve of Conaf called Pampa del Tamarugal and take them outside the “tamarugo” forest and the reserve, ThUS reducing the environmental impact caused by the exploitation thereof. The project is being implemented.
IPFT:
Implementation of patrimonial measures in projects Zona de Mina Nueva Victoria, Operations Up-date Nueva Victoria, Evaporation Duct and Pools Iris. The project is being implemented.
IPXE:
Implement the environmental follow-up plan of project Pampa Hermosa at Salar de Llamara. The project is being implemented.
As of December 31, 2010, December 31, 2009 and January 1, 2009, the composition of other current and non-current assets is detailed as follows:
|
Other non-financial assets, current
|
12.31.2010
|
12.31.2009
|
01.01.2009
|
|||||||||
|
ThUS$
|
ThUS$
|
ThUS$
|
||||||||||
|
Agreement termination bonus
|
2,108 | 2,191 | 990 | |||||||||
|
Domestic Value Added Tax
|
30,795 | 23,246 | 24,650 | |||||||||
|
Foreign Value Added Tax
|
4,167 | 3,080 | 10,666 | |||||||||
|
Prepaid mining licenses
|
1,281 | 1,104 | 1,183 | |||||||||
|
Prepaid insurance
|
4,575 | 4,062 | 4,085 | |||||||||
|
Commercial and industrial patents
|
30 | 42 | 145 | |||||||||
|
Prepaid leases
|
48 | 39 | 30 | |||||||||
|
Marine concessions
|
86 | 27 | 46 | |||||||||
|
Other prepaid expenses
|
1,352 | 584 | 176 | |||||||||
|
Other assets
|
44,442 | 34,375 | 41,971 | |||||||||
|
Other non-financial assets, non-current
|
12.31.2010
|
12.31.2009
|
01.01.2009
|
|||||||||
|
ThUS$
|
ThUS$
|
ThUS$
|
||||||||||
|
End of collective negotiation bonus
|
1,538 | 2,842 | 454 | |||||||||
|
Stain development expenses and prospecting expenses (1)
|
21,350 | 26,832 | 24,892 | |||||||||
|
Income taxes recoverable
|
651 | 567 | 454 | |||||||||
|
Guarantee deposits
|
514 | 467 | 308 | |||||||||
|
Other assets
|
104 | 172 | 336 | |||||||||
|
Total
|
24,157 | 30,880 | 26,444 | |||||||||
|
(1)
|
Assets for the exploration or evaluation of mineral resources are amortized to the extent that the explored or evaluated area has been exploited. For this purpose, a variable rate is applied to extracted tons, which is determined based on the measured initial reserve and evaluation cost. The Company presents expenses associated with Exploration and Evaluation of Mineral Resources. Of these expenses, those that are under exploitation are included under Inventory and are amortized according to the estimated ore reserves contained, and expenses associated with future reserves are presented under Other non-current assets. Those expenses incurred on properties with low ore grade that are not economically exploitable are directly charged to income. As of December 31, 2010 balances associated with the exploration and assessment of mineral resources are presented under Inventory for ThUS$ 1,723 (ThUS$ 2,285 as of December 31 2009, and ThUS$ 1,421 as of January 01 2009).
|
F-147
Notes to the consolidated Financial Statements as of December 31, 2010
(Translation of consolidated financial statements originally issued in Spanish – see Note 2.2)
Reconciliation of changes in assets for exploration and mineral resource evaluation, by type
Movements in assets for the exploration and evaluation of mineral resources as of December 31, 2010 and December 31, 2009:
|
2.31.2010
|
2.31.2009
|
|||||||
|
Reconciliation
|
ThUS$
|
ThUS$
|
||||||
|
|
||||||||
|
Assets for the exploration and evaluation of mineral resources, net, beginning balance
|
26,832 | 24,892 | ||||||
|
Changes in assets for exploration and assessment of mineral resources:
|
||||||||
|
Additions
|
- | 5,446 | ||||||
|
Depreciation and amortization
|
(2,044 | ) | ( 2,641 | ) | ||||
|
Decrease due to transfers and other charges
|
(3,438 | ) | (865 | ) | ||||
|
Assets for exploration and assessment of mineral resources, net, final balance
|
21,350 | 26,832 | ||||||
As of the presentation date, no reevaluations of assets for exploration and assessment of mineral resources have been conducted.
|
27.1
|
Operating segments
|
In accordance with IFRS 8 "Operating segments", the Company provides financial and descriptive information abour the segments it has defined in consideration of available annual separate financial information, which is regularly evaluated by the maximum authority in making operating decisions with the purpose of deciding how to assign resources and assess performance.
Operating segments relate to the following groups of products that generate revenue and for which the Company incurs expenses and the result of which is regularly reviewed by the Company's maximum authority in the decision-making process:
1. Specialty plant nutrients
2. Iodine and its derivatives
3. Lithium and its derivatives
4. Industrial chemicals
5. Potassium
6. Other products and services
Information relative to assets, liabilities and profit and expenses that cannot be assigned to the segments indicated above, due to the nature of production processes, is included under the "Corporate Unit" category of disclosures.
F-148
Notes to the consolidated Financial Statements as of December 31, 2010
(Translation of consolidated financial statements originally issued in Spanish – see Note 2.2)
Note 27 - Operating segments (continued)
|
27.2
|
Statement of income classified by operating segments based on groups of products as of December 31, 2010:
|
|
Items in the statement of income
|
Specialty
plant
nutrients
ThUS$
|
Iodine and
its
derivatives
ThUS$
|
Lithium and
its
derivatives
ThUS$
|
Industrial
chemicals
ThUS$
|
Potassium
ThUS$
|
Other
products
and
services
ThUS$
|
Corporate
unit
ThUS$
|
Total
segments
and
Corporate
unit
ThUS$
|
||||||||||||||||||||||||
|
Sales
|
603,678 | 316,253 | 150,810 | 149,706 | 528,151 | 81,815 | - | 1,830,413 | ||||||||||||||||||||||||
|
Cost of sales
|
(431,735 | ) | (177,425 | ) | (85,596 | ) | (82,489 | ) | (350,092 | ) | (77,073 | ) | - | (1,204,410 | ) | |||||||||||||||||
|
Gross profit
|
171,943 | 138,828 | 65,214 | 67,217 | 178,059 | 4,742 | - | 626,003 | ||||||||||||||||||||||||
|
Other income by function
|
- | - | - | - | - | - | 6,545 | 6,545 | ||||||||||||||||||||||||
|
Administrative expenses
|
- | - | - | - | - | - | (78,819 | ) | (78,819 | ) | ||||||||||||||||||||||
|
Other expenses by function
|
- | - | - | - | - | - | (36,212 | ) | (36,212 | ) | ||||||||||||||||||||||
|
Other gains
|
- | - | - | - | - | - | (6,979 | ) | (6,979 | ) | ||||||||||||||||||||||
|
Interest income
|
- | - | - | - | - | - | 12,930 | 12,930 | ||||||||||||||||||||||||
|
Interest expenses
|
- | - | - | - | - | - | (35,042 | ) | (35,042 | ) | ||||||||||||||||||||||
|
Interest in gains from associates and joint ventures accounted for using the equity method
|
- | - | - | - | - | - | 10,681 | 10,681 | ||||||||||||||||||||||||
|
Foreign currency transactions
|
- | - | - | - | - | - | (5,807 | ) | (5,807 | ) | ||||||||||||||||||||||
|
Profit (loss) before taxes
|
171,943 | 138,828 | 65,214 | 67,217 | 178,059 | 4,742 | (132,703 | ) | 493,300 | |||||||||||||||||||||||
|
Income tax expense
|
- | - | - | - | - | - | (106,029 | ) | (106,029 | ) | ||||||||||||||||||||||
|
Net income (loss) from continuing operations
|
171,943 | 138,828 | 65,214 | 67,217 | 178,059 | 4,742 | (238,732 | ) | 387,271 | |||||||||||||||||||||||
|
Net income (loss) from discontinued operations
|
- | - | - | - | - | - | - | - | ||||||||||||||||||||||||
|
Net income (loss)
|
171,943 | 138,828 | 65,214 | 67,217 | 178,059 | 4,742 | (238,732 | ) | 387,271 | |||||||||||||||||||||||
|
Net income attributable to:
|
||||||||||||||||||||||||||||||||
|
Owners of the parent
|
- | - | - | - | - | - | - | 382,122 | ||||||||||||||||||||||||
|
Non-controlling interests
|
- | - | - | - | - | - | - | 5,149 | ||||||||||||||||||||||||
|
Net income for the year
|
- | - | - | - | - | - | - | 387,271 | ||||||||||||||||||||||||
F-149
Notes to the consolidated Financial Statements as of December 31, 2010
(Translation of consolidated financial statements originally issued in Spanish – see Note 2.2)
Note 27 - Operating segments (continued)
|
27.2
|
Statement of Income classified by operating segments based on groups of products as of December 31, 2009:
|
|
Items in the statement of income
|
Specialty
plant
nutrients
ThUS$
|
Iodine and
its
derivatives
ThUS$
|
Lithium and
its
derivatives
ThUS$
|
Industrial
chemicals
ThUS$
|
Potassium
ThUS$
|
Other
products
and
services
ThUS$
|
Corporate
unit
ThUS$
|
Total
segments
and
Corporate
unit
ThUS$
|
||||||||||||||||||||||||
|
Sales
|
526,953 | 190,915 | 117,844 | 115,385 | 399,109 | 88,453 | - | 1,438,659 | ||||||||||||||||||||||||
|
Cost of sales
|
(382,959 | ) | (73,978 | ) | (60,302 | ) | (57,385 | ) | (249,617 | ) | (84,233 | ) | - | (908,474 | ) | |||||||||||||||||
|
Gross profit
|
143,994 | 116,937 | 57,542 | 58,000 | 149,492 | 4,220 | - | 530,185 | ||||||||||||||||||||||||
|
Other income by function
|
- | - | - | - | - | - | 17,009 | 17,009 | ||||||||||||||||||||||||
|
Administrative expenses
|
- | - | - | - | - | - | (75,470 | ) | (75,470 | ) | ||||||||||||||||||||||
|
Other expenses by function
|
- | - | - | - | - | - | (21,847 | ) | (21,847 | ) | ||||||||||||||||||||||
|
Other gains (losses)
|
- | - | - | - | - | - | (13,705 | ) | (13,705 | ) | ||||||||||||||||||||||
|
Interest income
|
- | - | - | - | - | - | 13,525 | 13,525 | ||||||||||||||||||||||||
|
Interest expenses
|
- | - | - | - | - | - | (30,979 | ) | (30,979 | ) | ||||||||||||||||||||||
|
Interest in gains from associates and joint ventures accounted for using the equity method
|
- | - | - | - | - | - | 4,462 | 4,462 | ||||||||||||||||||||||||
|
Foreign currency transactions
|
- | - | - | - | - | - | (7,577 | ) | (7,577 | ) | ||||||||||||||||||||||
|
Income (loss) before taxes
|
143,994 | 116,937 | 57,542 | 58,000 | 149,492 | 4,220 | (114,582 | ) | 415,603 | |||||||||||||||||||||||
|
Income tax expense
|
- | - | - | - | - | - | (75,840 | ) | (75,840 | ) | ||||||||||||||||||||||
|
Net income (loss) from continuing operations
|
143,994 | 116,937 | 57,542 | 58,000 | 149,492 | 4,220 | (190,422 | ) | 339,763 | |||||||||||||||||||||||
|
Net income (loss) from discontinued operations
|
- | - | - | - | - | - | - | - | ||||||||||||||||||||||||
|
Net income (loss)
|
143,994 | 116,937 | 57,542 | 58,000 | 149,492 | 4,220 | (190,422 | ) | 339,763 | |||||||||||||||||||||||
|
Net income attributable to:
|
||||||||||||||||||||||||||||||||
|
Owners of the parent
|
- | - | - | - | - | - | - | 338,297 | ||||||||||||||||||||||||
|
Non-controlling interests
|
- | - | - | - | - | - | 1,466 | |||||||||||||||||||||||||
|
Profit for the year
|
- | - | - | - | - | - | - | 339,763 | ||||||||||||||||||||||||
F-150
Notes to the consolidated Financial Statements as of December 31, 2010
(Translation of consolidated financial statements originally issued in Spanish – see Note 2.2)
Note 27 - Operating segments (continued)
|
27.3
|
Disbursements of non-monetary assets of the segment as of December 31, 2010:
|
|
Identification of disbursements of non-monetary assets
|
Chile
ThUS$
|
Latin America
and the
Caribbean
ThUS$
|
Europe
ThUS$
|
North America
ThUS$
|
Asia and
others
ThUS$
|
Balances
according to the
Statement of
Financial
Position
ThUS$
|
||||||||||||||||||
|
Investments in joint ventures
|
- | - | - | - | 3,500 | 3,500 | ||||||||||||||||||
|
SQM Quindao - Star
|
- | - | - | - | 1,000 | 1,000 | ||||||||||||||||||
|
SQM Migao Sichuan
|
2,500 | 2,500 | ||||||||||||||||||||||
|
Amounts in addition of non-current assets
|
335,997 | - | - | - | - | 335,997 | ||||||||||||||||||
|
- Property, plant and equipment
|
335,632 | - | - | - | - | 335,632 | ||||||||||||||||||
|
- Intangible assets
|
365 | - | - | - | - | 365 | ||||||||||||||||||
|
Total segments
|
335,997 | - | - | - | 3,500 | 339,497 | ||||||||||||||||||
|
27.3
|
Disbursements of non-monetary assets of the segment as of December 31, 2009:
|
|
Identification of disbursements of non-monetary assets
|
Chile
ThUS$
|
Latin America
and the
Caribbean
ThUS$
|
Europe
ThUS$
|
North America
ThUS$
|
Asia and
others
ThUS$
|
Balances
according to the
Statement of
Financial
Position
ThUS$
|
||||||||||||||||||
|
Investments in joint ventures
|
- | - | - | - | 3,530 | 3,530 | ||||||||||||||||||
|
SQM Migao Sichuan
|
- | - | - | - | 3,000 | 3,000 | ||||||||||||||||||
|
Coromandel SQM India
|
- | - | - | - | 530 | 530 | ||||||||||||||||||
|
Amounts in additions of non-current assets
|
376,515 | - | - | - | - | 376,515 | ||||||||||||||||||
|
- Property, plant and equipment
|
376,186 | - | - | - | - | 376,186 | ||||||||||||||||||
|
- Intangible assets
|
329 | - | - | - | - | 329 | ||||||||||||||||||
|
Total segments
|
376,515 | - | - | - | 3,530 | 380,045 | ||||||||||||||||||
F-151
Notes to the consolidated Financial Statements as of December 31, 2010
(Translation of consolidated financial statements originally issued in Spanish – see Note 2.2)
Note 27 - Operating segments (continued)
|
27.4
|
Information on products and services of external customers
|
Revenues from operating activities withexternal customers by group of product and service as of December 31, 2010 are detailed as follows:
|
Items in the statement of income
|
Specialty plant
nutrients
ThUS$
|
Iodine and
its
derivatives
ThUS$
|
Lithium and
its
derivatives
ThUS$
|
Industrial
chemicals
ThUS$
|
Potassium
ThUS$
|
Other
products
and services
ThUS$
|
Total
segments and
Corporate Unit
ThUS$
|
|||||||||||||||||||||
|
Revenue
|
603,678 | 316,253 | 150,810 | 149,706 | 528,151 | 81,815 | 1,830,413 | |||||||||||||||||||||
Revenues from operating activities from external customers by group of product and service as of December 31, 2009 are detailed as follows:
|
Items in the statement of income
|
Specialty plant
nutrients
ThUS$
|
Iodine and
its
derivatives
ThUS$
|
Lithium and
its
derivatives
ThUS$
|
Industrial
chemicals
ThUS$
|
Potassium
ThUS$
|
Other
products
and services
ThUS$
|
Total
segments and
Corporate Unit
ThUS$
|
|||||||||||||||||||||
|
Revenue
|
526,953 | 190,915 | 117,844 | 115,385 | 399,109 | 88,453 | 1,438,659 | |||||||||||||||||||||
|
27.5
|
Information on geographical areas
|
As indicated in paragraph 33 of IFRS 8, the entity discloses geographical information on its revenue from operating activities with external customers and from non-current assets that are not financial instruments, deferred income tax assets, assets related to post-employment benefits or rights derived from insurance contracts.
F-152
Notes to the consolidated Financial Statements as of December 31, 2010
(Translation of consolidated financial statements originally issued in Spanish – see Note 2.2)
Note 27 - Operating segments (continued)
|
27.6
|
Revenues from operating activities from external customers classified by geographical areas as of December 31, 2010:
|
|
Identification of revenue from external customers
|
Chile
ThUS$
|
Latin America
and the
Caribbean
ThUS$
|
Europe
ThUS$
|
North America
ThUS$
|
Asia and
others
ThUS$
|
Balances
according to the
Statement of
income
ThUS$
|
||||||||||||||||||
|
Revenue
|
216,028 | 162,967 | 799,457 | 363,676 | 288,285 | 1,830,413 | ||||||||||||||||||
|
27.6
|
Revenue from external customers, classified by geographical areas as of December 31, 2009:
|
|
Identification of revenue from external customers
|
Chile
ThUS$
|
Latin America
and the
Caribbean
ThUS$
|
Europe
ThUS$
|
North America
ThUS$
|
Asia and
others
ThUS$
|
Balances
according to
the Statement
of income
ThUS$
|
||||||||||||||||||
|
Revenue
|
250,730 | 169,148 | 408,682 | 299,926 | 310,173 | 1,438,659 | ||||||||||||||||||
F-153
Notes to the consolidated Financial Statements as of December 31, 2010
(Translation of consolidated financial statements originally issued in Spanish – see Note 2.2)
Note 27 - Operating segments (continued)
|
27.7
|
Non-current assets classified by geographical area as of December 31, 2010:
|
|
Non-current asset items
|
Chile
ThUS$
|
Latin
America and
the
Caribbean
ThUS$
|
Europe
ThUS$
|
North America
ThUS$
|
Asia and
others
ThUS$
|
Balances
according to
the Statement
of financial
position
ThUS$
|
||||||||||||||||||
|
Investments in associates accounted forusing the equity method
|
1,352 | - | 19,615 | 7,251 | 34,053 | 62,271 | ||||||||||||||||||
|
Intangible assets other than goodwill
|
2,765 | - | 4 | 501 | - | 3,270 | ||||||||||||||||||
|
Goodwill
|
24,147 | 86 | 11,373 | 724 | 2,058 | 38,388 | ||||||||||||||||||
|
Property, plant and equipment, net
|
1,451,576 | 1,858 | 331 | 40 | 168 | 1,453,973 | ||||||||||||||||||
|
Investment property
|
1,373 | - | - | - | - | 1,373 | ||||||||||||||||||
|
Other non-current assets
|
112,820 | 227 | - | 3,293 | 373 | 116,713 | ||||||||||||||||||
|
Total assets
|
1,594,033 | 2,171 | 31,323 | 11,809 | 36,652 | 1,675,988 | ||||||||||||||||||
|
27.7
|
Non-current assets classified by geographical area as of December 31, 2009:
|
|
Non-current asset items
|
Chile
ThUS$
|
Latin
America and
the
Caribbean
ThUS$
|
Europe
ThUS$
|
North America
ThUS$
|
Asia and
others
ThUS$
|
Balances
according to
the Statement
of Financial
Position
ThUS$
|
||||||||||||||||||
|
Investments in associates accounted forusing the equity method
|
328 | - | 18,853 | 6,653 | 29,351 | 55,185 | ||||||||||||||||||
|
Intangible assets other than goodwill
|
2,267 | - | - | 569 | - | 2,836 | ||||||||||||||||||
|
Goodwill
|
24,248 | 86 | 11,373 | 724 | 1,957 | 38,388 | ||||||||||||||||||
|
Property, plant and equipment, net
|
1,297,830 | 293 | 474 | 1,766 | 183 | 1,300,546 | ||||||||||||||||||
|
Investment property
|
1,405 | - | - | - | - | 1,405 | ||||||||||||||||||
|
Other non-current assets
|
78,252 | 1,017 | - | 1,037 | 297 | 80,603 | ||||||||||||||||||
|
Total assets
|
1,404,330 | 1,396 | 30,700 | 10,749 | 31,788 | 1,478,963 | ||||||||||||||||||
F-154
Notes to the consolidated Financial Statements as of December 31, 2010
(Translation of consolidated financial statements originally issued in Spanish – see Note 2.2)
Note 27 - Operating segments (continued)
|
27.8
|
Information on main customers
|
With respect to the degree of dependency of the Company on its customers, in accordance with, the Company has no external customers who individually represent 10% or more of its income from operating activities. Credit risk concentrations with respect to trade and other accounts receivable are limited due to the significant number of entities in the Company’s portfolio and its worldwide distribution. The Company’s policy is ro require guarantees (such as letters of credit, guarantee clauses and others) and/or to maintain insurance policies for certain accounts as deemed necessary by the Company's Management.
|
27.9
|
Property, plant and equipment classified by geographical area as of December 31, 2010:
|
|
Property, plant and equipment
|
Chile
|
Latin America
and the
Caribbean
|
Europe
|
North America
|
Asia and
others
|
Total
|
||||||||||||||||||
| 12.31.2010 | ||||||||||||||||||||||||
|
ThUS$
|
ThUS$
|
ThUS$
|
ThUS$
|
ThUS$
|
ThUS$
|
|||||||||||||||||||
|
Production facilities:
|
||||||||||||||||||||||||
|
Coya Sur
|
256,570 | - | - | - | - | 256,570 | ||||||||||||||||||
|
María Elena
|
144,233 | - | - | - | - | 144,233 | ||||||||||||||||||
|
Nueva Victoria
|
202,134 | - | - | - | - | 202,134 | ||||||||||||||||||
|
Pampa Blanca
|
20,381 | - | - | - | - | 20,381 | ||||||||||||||||||
|
Pedro de Valdivia
|
84,992 | - | - | - | - | 84,992 | ||||||||||||||||||
|
Salar de Atacama
|
442,281 | - | - | - | - | 442,281 | ||||||||||||||||||
|
Salar del Carmen
|
213,488 | - | - | - | - | 213,488 | ||||||||||||||||||
|
Tocopilla (Instalaciones portuarias)
|
63,521 | - | - | - | - | 63,521 | ||||||||||||||||||
|
Subtotal production facilities
|
1,427,600 | - | - | - | - | 1,427,600 | ||||||||||||||||||
|
Corporate facilities:
|
||||||||||||||||||||||||
|
Santiago
|
14,506 | - | - | - | - | 14,506 | ||||||||||||||||||
|
Antofagasta
|
6,831 | - | - | - | - | 6,831 | ||||||||||||||||||
|
Subtotal corporate facilities
|
21,337 | - | - | - | - | 21,337 | ||||||||||||||||||
|
Subtotal business offices
|
2,639 | 1,858 | 331 | 40 | 168 | 5,036 | ||||||||||||||||||
|
Total segments
|
1,451,576 | 1,858 | 331 | 40 | 168 | 1,453,973 | ||||||||||||||||||
F-155
Notes to the consolidated Financial Statements as of December 31, 2010
(Translation of consolidated financial statements originally issued in Spanish – see Note 2.2)
|
27.9
|
Property, plant and equipment classified by geographical area as of December 31, 2009:
|
|
Property, plant and equipment
|
Chile
|
Latin America
and the
Caribbean
|
Europe
|
North America
|
Asia and
others
|
Total
|
||||||||||||||||||
| 12.31.2009 | ||||||||||||||||||||||||
|
ThUS$
|
ThUS$
|
ThUS$
|
ThUS$
|
ThUS$
|
ThUS$
|
|||||||||||||||||||
|
Production facilities:
|
||||||||||||||||||||||||
|
Coya Sur
|
252,138 | - | - | - | - | 252,138 | ||||||||||||||||||
|
María Elena
|
142,442 | - | - | - | - | 142,442 | ||||||||||||||||||
|
Nueva Victoria
|
202,037 | - | - | - | - | 202,037 | ||||||||||||||||||
|
Pampa Blanca
|
25,271 | - | - | - | - | 25,271 | ||||||||||||||||||
|
Pedro de Valdivia
|
73,203 | - | - | - | - | 73,203 | ||||||||||||||||||
|
Salar de Atacama
|
302,840 | - | - | - | - | 302,840 | ||||||||||||||||||
|
Salar del Carmen
|
222,093 | - | - | - | - | 222,093 | ||||||||||||||||||
|
Tocopilla (Instalaciones portuarias)
|
59,132 | - | - | - | - | 59,132 | ||||||||||||||||||
|
Subtotal production facilities
|
1,279,156 | - | - | - | - | 1,279,156 | ||||||||||||||||||
|
Corporate facilities:
|
||||||||||||||||||||||||
|
Santiago
|
12,233 | - | - | - | - | 12,233 | ||||||||||||||||||
|
Antofagasta
|
5,808 | - | - | - | - | 5,808 | ||||||||||||||||||
|
Subtotal corporate facilities
|
18,041 | - | - | - | - | 18,041 | ||||||||||||||||||
|
Subtotal business offices
|
633 | 293 | 474 | 1,766 | 183 | 3,349 | ||||||||||||||||||
|
Total segments
|
1,297,830 | 293 | 474 | 1,766 | 183 | 1,300,546 | ||||||||||||||||||
F-156
Notes to the consolidated Financial Statements as of December 31, 2010
(Translation of consolidated financial statements originally issued in Spanish – see Note 2.2)
Other income and expenses are detailed as follows:
|
a)
|
Other income by function
|
|
12.31.2010
ThUS$
|
12.31.2009
ThUS$
|
|||||||
|
Discounts obtained from suppliers
|
922 | 921 | ||||||
|
Indemnities received
|
272 | 60 | ||||||
|
Insurance recovery
|
201 | 285 | ||||||
|
Overestimate of accrual for obligation with third parties
|
424 | 670 | ||||||
|
Overestimate of doubtful accounts
|
83 | 41 | ||||||
|
Sale of mine concessions
|
872 | 2,170 | ||||||
|
Sale of materials, spare parts and supplies
|
668 | 400 | ||||||
|
Sale of property, plant and equipment
|
448 | 248 | ||||||
|
Other operating income
|
1,357 | 1,858 | ||||||
|
Miscellaneous services
|
534 | - | ||||||
|
Indemnities at Minera Esperanza
|
764 | 10,356 | ||||||
|
Total
|
6,545 | 17,009 | ||||||
|
b)
|
Other expenses by function
|
|
12.31.2010
ThUS$
|
12.31.2009
ThUS$
|
|||||||
|
Doubtful accounts impairment
|
(1,246 | ) | (3,293 | ) | ||||
|
VAT and other non recoverable taxes
|
(543 | ) | (612 | ) | ||||
|
Fines paid
|
(374 | ) | (262 | ) | ||||
|
Investment plan expenses
|
(13,279 | ) | (5,737 | ) | ||||
|
Gifts not accepted as credit
|
(2,095 | ) | (2,431 | ) | ||||
|
Adjustment to the realizable value of property, plant and equipment items
|
(1,000 | ) | (2,612 | ) | ||||
|
Impairmen of property, plant and equipment
|
- | (1,001 | ) | |||||
|
Losses from auction
|
(500 | ) | (3,000 | ) | ||||
|
Legal expenses
|
(2,087 | ) | (451 | ) | ||||
|
Depreciation of immobilized goods
|
(5,677 | ) | - | |||||
|
Brazil Trial
|
(2,000 | ) | - | |||||
|
Prospecting provision
|
(4,000 | ) | - | |||||
|
Other operating expenses
|
(3,411 | ) | (2,448 | ) | ||||
|
Total
|
(36,212 | ) | (21,847 | ) | ||||
F-157
Notes to the consolidated Financial Statements as of December 31, 2010
(Translation of consolidated financial statements originally issued in Spanish – see Note 2.2)
|
c)
|
Other gains or losses
|
|
12.31.2010
ThUS$
|
12.31.2009
ThUS$
|
|||||||
|
Retirement plan provision
|
(100 | ) | (2,500 | ) | ||||
|
Temporary closing of El Toco operations provision
|
(6,900 | ) | (6,500 | ) | ||||
|
PNW adjustment of previous year
|
23 | - | ||||||
|
Layoff process costs
|
- | (1,696 | ) | |||||
|
El Toco closing provision
|
- | (6,028 | ) | |||||
|
Lack of capital contribution income
|
- | 3,019 | ||||||
|
Other
|
(2 | ) | - | |||||
|
Total
|
(6,979 | ) | (13,705 | ) | ||||
As of December 31, 2010, December 31, 2009 and January 1, 2009, current income taxes recoverable are detailed as follows:
|
29.1
|
Current tax accounts receivable
|
|
2.31.2010
|
2.31.2009
|
1.01.2009
|
||||||||||
|
ThUS$
|
ThUS$
|
ThUS$
|
||||||||||
|
Net monthly tax provisional payments, Chilean companies actual year
|
19,614 | 27,213 | 329 | |||||||||
|
Net monthly tax provisional payments, Chilean companies prior year
|
2,158 | 86 | 34 | |||||||||
|
Monthly tax provisional payments, foreign companies
|
562 | 1,638 | 610 | |||||||||
|
Corporate tax credits (1)
|
1,111 | 1,063 | 645 | |||||||||
|
Corporate tax absorbed by tax losses (2)
|
9,328 | 11,825 | 77 | |||||||||
|
Total
|
32,773 | 41,825 | 1,695 | |||||||||
(1): These credits are available to companies and relate to the corporate tax payment in April of the following year. These credits include, amongst others, training expense credits (SENCE) and property, plant and equipment acquisition credits that are equivalent to 4% of the property, plant and equipment purchases made during the year. In addition, some credits relate to the donations the Group has made during 2010 and 2009.
(2): This concept corresponds to the absorption of non-operating losses (NOL’s) determined by the company at year end, which must be imputed or recorded in the Retained Taxable Profits Registry (FUT).
In accordance with the laws in force and as provided by article 31, No. 3 of the Income Tax Law, when profits recorded in the FUT that have not been withdrawn or distributed are totally or partially absorbed by NOL’s, the corporate tax paid on such profits (17%, 16.5%, 16%, 15%, 10% depending on the year in which profits were generated) will be considered to be a provisional payment with respect to the portion representing the absorbed accumulated tax profits.
F-158
Notes to the consolidated Financial Statements as of December 31, 2010
(Translation of consolidated financial statements originally issued in Spanish – see Note 2.2)
Note 29 - Income and deferred taxes (continued)
|
29.1
|
Current tax accounts receivable (continued)
|
Taxpayers are entitled to apply for a refund of this provisional tax payment on the absorbed profits recorded in the FUT registry via their tax returns (Form 22).
Therefore, the provisional payment for absorbed profits (PPAP) recorded in the FUT is in effect a recoverable tax, and as such the Company records it as an asset.
|
29.2
|
Current tax accounts payable
|
|
Taxes payable
|
12.31.2010
|
12.31.2009
|
01.01.2009
|
|||||||||
|
ThUS$
|
ThUS$
|
ThUS$
|
||||||||||
|
Corporate tax and royalty (1)
|
5,915 | 323 | 88,328 | |||||||||
|
Foreign company income tax
|
1,174 | 592 | 762 | |||||||||
|
Article 21 unique tax
|
24 | 383 | 52 | |||||||||
|
Total
|
7,113 | 1,298 | 89,142 | |||||||||
(1):This concept relates to the tax accrual that is determined by the company and that will be paid the following year when the appropriate tax return is filed.
The income tax is determined on the basis of the tax result determination to which the tax rate currently in force in Chile, i.e. 17%, is applied (the tax rate was transitorily increased for 2011 and 2012 to 20% and 18.5%, respectively).
The royalty provision is determined by applying the tax rate that was determined to the Operational Net Income (ONI).
In conclusion, both concepts represent the estimated amount the company will have to pay on account of income tax and specific tax on mining.
|
29.3
|
Taxable earnings
|
As of December 31, 2010, December 31, 2009 and January 1, 2009, the Company and its subsidiaries have recorded the following consolidated balances for retained taxable earnings registry, income not constituting revenue subject to income tax, accumulated tax losses and credit for shareholders:
|
12.31.2010
ThUS$
|
12.31.2009
ThUS$
|
01.01.2009
ThUS$
|
||||||||||
|
Taxable profits with credit rights (1)
|
602,536 | 668,670 | 813,716 | |||||||||
|
Taxable profits without credit rights (1)
|
86,920 | 107,832 | 132,773 | |||||||||
|
Taxable losses
|
21,630 | 99,333 | 16,949 | |||||||||
|
Credit for shareholders
|
123,322 | 136,874 | 166,554 | |||||||||
F-159
Notes to the consolidated Financial Statements as of December 31, 2010
(Translation of consolidated financial statements originally issued in Spanish – see Note 2.2)
Note 29 - Income and deferred taxes (continued)
|
29.3
|
Taxable earnings (continued)
|
(1): The Retained Taxable Profits Registry (FUT) is a chronological registry where the profits generated and distributed by the company are recorded. The object of the FUT is to control the accumulated taxable profits of the company that may be distributed, withdrawn or remitted to the owners, shareholders or partners, and the final taxes that must be imposed, called in Chile Global Aggregate Tax (that levies persons resident or domiciled in Chile), or Withholding Tax (that levies persons “Not” resident or domiciled in Chile).
The FUT Register contains profits with credit rights and profits without credit rights, which arise out of the inclusion of the net taxable income determined by the company or the profits received by the company that may be dividends received or withdrawals made within the period.
Profits without credit rights represent the tax payable by the company within the year and filed the following year, therefore they will be deducted from the FUT Registry the following year.
Profits with credit rights may be used to reduce the final tax burden of owners, shareholders or partners, which upon withdrawal are entitled to use the credits associated with the relevant profits.
In summary, companies use the FUT Registry to maintain control over the profits they generate that have not been distributed to the owners and the relevant credits associated with such profits.
|
29.4
|
Income and deferred taxes
|
Assets and liabilities recognized in the consolidated classified statement of financial position are offset if and only if:
|
1
|
The Company has legally recognized before the tax authority the right to offset the amounts recognized in these entries; and
|
|
2
|
Deferred income tax assets and liabilities are derived from income tax related to the same tax authority on:
|
|
|
(i)
|
the same entity or tax subject; or
|
|
|
(
ii)
|
different entities or tax subjects who intend either to settle current fiscal assets and liabilities for their net amount, or to realize assets and pay liabilities simultaneously in each of the future periods in which the Company expects to settle or recover significant amounts of deferred tax assets or liabilities.
|
Deferred income tax assets recognized are those income taxes to be recovered in future periods, related to:
|
|
(a)
|
deductible temporary differences;
|
|
|
(b)
|
the offset of losses obtained in prior periods and not yet subject to tax deduction; and
|
|
|
(c)
|
the offset of unused credits from prior periods.
|
F-160
Notes to the consolidated Financial Statements as of December 31, 2010
(Translation of consolidated financial statements originally issued in Spanish – see Note 2.2)
Note 29 - Income and deferred taxes (continued)
|
29.4
|
Income and deferred taxes (continued)
|
The Company recognizes a deferred tax asset when there is certainty that these can be offset with fiscal income from subsequent periods, losses or fiscal credits not yet used, but solely as long as it is more likely than not that there will be tax earnings in the future against which to charge to these losses or unused fiscal credits.
Deferred tax liabilities recognized refer to the amounts of income taxes payable in future periods related to taxable temporary differences.
|
D.1
|
Income tax assets and liabilities as of December 31, 2010 are detailed as follows:
|
|
Net possition, assets
|
Net possition,
liabilities |
|||||||||||||||
|
Description of deferred income tax assets
|
Assets
|
Liabilities
|
Assets
|
Liabilities
|
||||||||||||
|
and liabilities
|
ThUS$
|
ThUS$
|
ThUS$
|
ThUS$
|
||||||||||||
|
Depreciation
|
- | - | - | 88,785 | ||||||||||||
|
Doubtful accounts impairment
|
139 | - | 3,452 | - | ||||||||||||
|
Vacation accrual
|
9 | - | 2,382 | - | ||||||||||||
|
Production expenses
|
- | - | - | 47,442 | ||||||||||||
|
Unrealized gains (losses) from sales of products
|
- | - | 49,181 | - | ||||||||||||
|
Bonds fair value
|
- | - | 1,886 | - | ||||||||||||
|
Employee termination benefits
|
- | - | - | 2,984 | ||||||||||||
|
Hedging
|
- | - | - | 20,739 | ||||||||||||
|
Inventory of products, spare parts and supplies
|
- | 1,050 | 8,950 | - | ||||||||||||
|
Research and development expenses
|
- | - | - | 4,215 | ||||||||||||
|
Tax losses
|
796 | - | 2,748 | - | ||||||||||||
|
Capitalized interest
|
- | - | - | 14,784 | ||||||||||||
|
Expenses in assumption of bank loans
|
- | - | - | 2,278 | ||||||||||||
|
Unaccrued interest
|
- | - | 261 | - | ||||||||||||
|
Fair value of property, plant and equipment
|
- | - | 9,634 | - | ||||||||||||
|
Employee benefits
|
- | - | 6,052 | - | ||||||||||||
|
Royalty deferred income taxes
|
- | - | - | 7,462 | ||||||||||||
|
Other
|
471 | - | 3,362 | - | ||||||||||||
|
Balance at year-end
|
1,415 | 1,050 | 87,908 | 188,689 | ||||||||||||
|
Net balance
|
365 | - | - | 100,781 | ||||||||||||
F-161
Notes to the consolidated Financial Statements as of December 31, 2010
(Translation of consolidated financial statements originally issued in Spanish – see Note 2.2)
Note 29 - Income and deferred taxes (continued)
|
29.4
|
Income and deferred taxes (continued)
|
|
D.2
|
Income tax assets and liabilities as of December 31, 2009 are detailed as follows:
|
| Net possition, assets | Net possition, liabilities | |||||||||||||||
|
Description of deferred income tax
|
Assets
|
Liabilities
|
Assets
|
Liabilities
|
||||||||||||
|
assets and liabilities
|
ThUS$
|
ThUS$
|
ThUS$
|
ThUS$
|
||||||||||||
|
Depreciation
|
- | - | - | 81,055 | ||||||||||||
|
Doubtful accounts impairment
|
- | - | 3,708 | - | ||||||||||||
|
Vacation accrual
|
- | - | 2,309 | - | ||||||||||||
|
Production expenses
|
- | - | - | 39,660 | ||||||||||||
|
Unrealized gains (losses) from sales of products
|
- | - | 48,644 | - | ||||||||||||
|
Bonds fair value
|
- | - | 1,635 | - | ||||||||||||
|
Employee termination benefits
|
- | - | - | 2,593 | ||||||||||||
|
Hedging
|
- | - | - | 10,948 | ||||||||||||
|
Inventory of products, spare parts and supplies
|
- | - | 14,229 | - | ||||||||||||
|
Research and development expenses
|
- | - | - | 5,263 | ||||||||||||
|
Tax losses
|
1,733 | - | 16,473 | - | ||||||||||||
|
Capitalized interest
|
- | - | - | 11,222 | ||||||||||||
|
Expenses in assumption of bank loans
|
- | - | - | 2,015 | ||||||||||||
|
Unaccrued interest
|
- | - | 393 | - | ||||||||||||
|
Fair value of property, plant and equipment
|
- | - | 10,524 | - | ||||||||||||
|
Employee benefits
|
- | - | 6,180 | - | ||||||||||||
|
Royalty deferred income taxes
|
- | - | - | 7,677 | ||||||||||||
|
Other
|
- | 863 | 2,536 | - | ||||||||||||
|
Balance at year-end
|
1,733 | 863 | 106,631 | 160,433 | ||||||||||||
|
Net balance
|
870 | - | - | 53,802 | ||||||||||||
F-162
Notes to the consolidated Financial Statements as of December 31, 2010
(Translation of consolidated financial statements originally issued in Spanish – see Note 2.2)
Note 29 - Income and deferred taxes (continued)
|
29.4
|
Income and deferred taxes (continued)
|
|
D.3
|
Income tax assets and liabilities as of January 1, 2009 are detailed as follows
|
|
Net possition, assets
|
Net possition, liabilities
|
|||||||||||||||
|
Description of deferred income tax assets
|
Assets
|
Liabilities
|
Assets
|
Liabilities
|
||||||||||||
|
and liabilities
|
ThUS$
|
ThUS$
|
ThUS$
|
ThUS$
|
||||||||||||
|
Depreciation
|
- | - | - | 72,192 | ||||||||||||
|
Doubtful accounts impairment
|
- | - | 1,926 | - | ||||||||||||
|
Vacation accrual
|
- | - | 1,734 | - | ||||||||||||
|
Production expenses
|
- | - | - | 29,774 | ||||||||||||
|
Unrealized gains (losses) from sales of products
|
- | - | 55,827 | - | ||||||||||||
|
Bonds fair value
|
- | - | 1,616 | - | ||||||||||||
|
Employee termination benefits
|
- | - | - | 1,777 | ||||||||||||
|
Hedging
|
- | - | 629 | - | ||||||||||||
|
Inventory of products, spare parts and supplies
|
- | - | 13,613 | - | ||||||||||||
|
Research and development expenses
|
- | - | - | 4,702 | ||||||||||||
|
Tax losses
|
2,828 | - | 1,534 | - | ||||||||||||
|
Capitalized interest
|
- | - | - | 9,252 | ||||||||||||
|
Expenses in assumption of bank loans
|
- | - | - | 826 | ||||||||||||
|
Unaccrued interest
|
- | - | 504 | - | ||||||||||||
|
Fair value of property, plant and equipment
|
- | - | 12,287 | - | ||||||||||||
|
Employee benefits
|
- | - | 2,915 | - | ||||||||||||
|
Royalty deferred income taxes
|
- | - | - | 5,544 | ||||||||||||
|
Other
|
- | 859 | 4,294 | - | ||||||||||||
|
Balance at year-end
|
2,828 | 859 | 96,879 | 124,067 | ||||||||||||
|
Net balance
|
1,969 | - | - | 27, 188 | ||||||||||||
F-163
Notes to the consolidated Financial Statements as of December 31, 2010
(Translation of consolidated financial statements originally issued in Spanish – see Note 2.2)
Note 29 - Income and deferred taxes (continued)
|
29.4
|
Income and deferred taxes (continued)
|
|
D.4
|
Deferred income taxes related to benefits for tax losses
|
The Company’s tax loss carryforwards (NOL carryforwards) were mainly generated by losses in Chile, which in accordance with current Chilean tax regulations have no expiration date. During 2009, the Company did not use any significant tax losses.
As of December 31, 2010, December 31, 2009 and January 1, 2009, tax loss carryforwards (NOL carryforwards) are detailed as follows:
|
12.31.2010
|
12.31.2009
|
01.01.2009
|
||||||||||
|
ThUS$
|
ThUS$
|
ThUS$
|
||||||||||
|
Chile
|
2,748 | 16,473 | 1,534 | |||||||||
|
Other countries
|
796 | 1,733 | 2,828 | |||||||||
|
Balance at year-end
|
3,544 | 18,206 | 4,362 | |||||||||
Tax losses (NOL’s) correspond mainly to Mexico. These losses expire on December 31, 2011.
|
D.5
|
Unrecognized deferred income tax assets and liabilities
|
As of December 31, 2010, December 31, 2009 and January 1, 2009, unrecognized assets and liabilities are detailed as follows:
|
12.31.2010
|
12.31.2009
|
01.01.2009
|
||||||||||
|
ThUS$
|
ThUS$
|
ThUS$
|
||||||||||
|
Assets (liabilities)
|
Assets (liabilities)
|
Assets (liabilities)
|
||||||||||
|
Tax losses (NOL’s)
|
251 | 489 | 1,544 | |||||||||
|
Doubtful accounts impairment
|
98 | 98 | 98 | |||||||||
|
Inventory impairment
|
704 | 1,176 | 748 | |||||||||
|
Pensions plan
|
266 | 648 | 1,091 | |||||||||
|
Vacation accrual
|
29 | 29 | 29 | |||||||||
|
Depreciation
|
(67 | ) | (44 | ) | (20 | ) | ||||||
|
Other
|
(17 | ) | (15 | ) | (12 | ) | ||||||
|
Balance at year-end
|
1,264 | 2,381 | 3,478 | |||||||||
Tax losses mainly relate to the United States, which expire in 20 years.
F-164
Notes to the consolidated Financial Statements as of December 31, 2010
(Translation of consolidated financial statements originally issued in Spanish – see Note 2.2)
Note 29 - Income and deferred taxes (continued)
|
29.4
|
Income and deferred taxes (continued)
|
|
D.6
|
Movements in deferred tax liabilities
|
Movements in deferred tax liabilities as of December 31, 2010 and 2009 are detailed as follows:
|
12.31.2010
|
12.31.2009
|
|||||||
|
ThUS$
|
ThUS$
|
|||||||
|
Liabilities
(assets) |
Liabilities
(assets) |
|||||||
|
Beginning balance of deferred income tax liabilities
|
53,802 | 27,188 | ||||||
|
Increase (decrease) in deferred income taxes in statement of income
|
47,230 | 26,633 | ||||||
|
Increase (decrease) in deferred income taxes in equity
|
(251 | ) | (19 | ) | ||||
|
Balance at period and
|
100,781 | 53,802 | ||||||
|
D.7
|
Disclosures on income tax expense (income)
|
The Company recognizes current and deferred income taxes as income or expenses, and they are included in income, unless they arise from:
|
|
(a)
|
a transaction or event recognized in the same period or in a different period, outside profit or loss either in other comprehensive income or directly in equity; or
|
|
|
(b)
|
a business combination
|
F-165
Notes to the consolidated Financial Statements as of December 31, 2010
(Translation of consolidated financial statements originally issued in Spanish – see Note 2.2)
Note 29 - Income and deferred taxes (continued)
|
29.4
|
Income and deferred taxes (continued)
|
|
D.7
|
Disclosures on income tax expense (income) (continued)
|
Current and deferred income tax expenses (income) are detailed as follows
|
12.31.2010
|
12.31.2009
|
|||||||
|
ThUS$
|
ThUS$
|
|||||||
|
Benefit
(expenses)
|
Benefit
(expenses)
|
|||||||
|
Current gains tax expense
|
||||||||
|
Current tax expense
|
(60,863 | ) | (43,613 | ) | ||||
|
Adjustments to current taxes of the previous year
|
2,569 | (4,495 | ) | |||||
|
Current tax expenses, net, total
|
(58,294 | ) | (48,108 | ) | ||||
|
Deferred tax expenses
|
||||||||
|
Deferred tax expense (revenue) relating to the creation and reversal of temporary differences
|
(36,350 | ) | (27,732 | ) | ||||
|
Deferred tax expense (revenue) relating to changes in fiscal rates or the imposition of new taxes
|
(11,385 | ) | - | |||||
|
Deferred tax expenses, net, total
|
(47,735 | ) | (27,732 | ) | ||||
|
Income tax expense
|
(106,029 | ) | (75,840 | ) | ||||
Expenses (income) for income taxes for foreign and domestic parties are detailed as follows:
|
12.31.2010
|
12.31.2009
|
|||||||
|
ThUS$
|
ThUS$
|
|||||||
|
Benefit
(expenses)
|
Benefit
(expenses)
|
|||||||
|
Current income tax expense by domestic and foreign parties, net
|
||||||||
|
Current income tax expense, foreign parties, net
|
(2,208 | ) | (1,499 | ) | ||||
|
Current income tax expense, domestic, net
|
(56,086 | ) | (46,609 | ) | ||||
|
Total current income tax expense, net
|
(58,294 | ) | (48,108 | ) | ||||
|
Deferred income taxes by foreign and domestic parties, net
|
||||||||
|
Deferred income tax expense, foreign parties, net
|
(646 | ) | (1,075 | ) | ||||
|
Deferred income tax expense, domestic, net
|
(47,089 | ) | (26,657 | ) | ||||
|
Deferred income tax expense, net
|
(47,735 | ) | (27,732 | ) | ||||
|
Income tax expense
|
(106,029 | ) | (75,840 | ) | ||||
F-166
Notes to the consolidated Financial Statements as of December 31, 2010
(Translation of consolidated financial statements originally issued in Spanish – see Note 2.2)
Note 29 - Income and deferred taxes (continued)
|
29.4
|
Income and deferred taxes (continued)
|
|
D.8
|
Equity interest in taxation attributable to investments recognized according to the equity method:
|
The Company does not recognize any deferred income tax liability in all cases of taxable temporary differences associated with investments in subsidiaries, branches and associated companies or interest in joint ventures, because as indicated in the standard, the following two conditions are jointly met:
|
(a)
|
the parent company, investor or interest holder is able to control the time for reversal of the temporary difference; and
|
|
(b)
|
It is more likely than not that the temporary difference is not reversed in the foreseeable future.
|
In addition, the Company does not recognize deferred income tax assets for all deductible temporary differences from investments in subsidiaries, branches and associated companies or interests in joint ventures because it is not possible to meet for the following requirements:
|
|
(a)
|
Temporary differences are reversed in a foreseeable future; and
|
|
|
(b)
|
The Company has tax earnings against which temporary differences can be used.
|
|
D.9
|
Information on the tax effects of other comprehensive income components:
|
|
12.31.2010
|
||||||||||||
|
ThUS$
|
||||||||||||
|
Income tax related to components of other
income and expense with a charge or credit to
net equity
|
Amount
before taxes
|
Expense
(income) for
income taxes
|
Amount
after
taxes
|
|||||||||
|
Cash flow hedges
|
(1,474 | ) | 251 | (1,223 | ) | |||||||
|
Total
|
(1,474 | ) | 251 | (1,223 | ) | |||||||
|
12.31.2009
|
||||||||||||
|
ThUS$
|
||||||||||||
|
Income tax related to components of other
income and expense with a charge or credit to
equity
|
Amount
before taxes
|
Expense
(income) for
income taxes
|
Amount
after taxes
|
|||||||||
|
Cash flow hedges
|
(112 | ) | 19 | (93 | ) | |||||||
|
Total
|
(112 | ) | 19 | (93 | ) | |||||||
F-167
Notes to the consolidated Financial Statements as of December 31, 2010
(Translation of consolidated financial statements originally issued in Spanish – see Note 2.2)
Note 29 - Income and deferred taxes (continued)
|
29.4
|
Income and deferred taxes (continued)
|
|
D.10
|
Explanation of the relationship between expense (income) for tax purposes and accounting income
|
In accordance with paragraph No. 81, letter c) of IAS 12, the Company has estimated that the method that discloses more significant information for the users of its financial statements is the reconciliation of tax expense (income) to the result of multiplying income for accounting purposes by the tax rate in force in Chile. This option is based on the fact that the Parent Company and its subsidiaries incorporated in Chile generate almost the total amount of tax expense (income) and the fact that amounts of subsidiaries incorporated in foreign countries have no relevant significance within the context of the total amount of tax expense (income.)
Reconciliation of numbers in income tax expenses (income) and the result of multiplying financial gain by the rate prevailing in Chile.
|
12.31.2010
|
12.31.2009
|
|||||||
|
ThUS$
|
ThUS$
|
|||||||
|
Income
(loss) |
Income
(loss) |
|||||||
|
Consolidated income before taxes
|
493,300 | 415,603 | ||||||
|
Income tax rate in force in Chile
|
17 | % | 17 | % | ||||
|
Tax expense using the legal rate
|
(83,861 | ) | (70,653 | ) | ||||
|
Effect of royalty tax expense
|
(11,115 | ) | (9,364 | ) | ||||
|
Effect of non-taxable income
|
2,783 | 1,305 | ||||||
|
Tax effect of rates in other jurisdictions
|
(3,996 | ) | (141 | ) | ||||
|
Effect of changes in tax rates – see below
|
(11,385 | ) | - | |||||
|
Other effects from the reconciliation between carrying amount and the tax expense (income)
|
1,545 | 3,013 | ||||||
|
Tax expense using the effective rate
|
(106,029 | ) | (75,840 | ) | ||||
F-168
Notes to the consolidated Financial Statements as of December 31, 2010
(Translation of consolidated financial statements originally issued in Spanish – see Note 2.2)
Note 29 - Income and deferred taxes (continued)
|
29.4
|
Income and deferred taxes (continued)
|
|
D.11
|
Tax periods potentially subject to verification:
|
The Company is potentially subject to income tax audits by tax authorities in each country. These audits are limited to a number of annual tax periods, which, in general, when they elapse, give rise to the expiration of these inspections.
Tax audits, due to their nature, are often complex and may require several years. Below, we provide a summary of tax periods that are potentially subject to verification, in accordance with tax regulations in force in the country of origin:
|
|
a)
|
Chile
|
In Chile, the tax authority may review tax returns for up to 3 years from the expiration date of the legal term in which the payment should have been made. In the event that there is an administrative or legal notice, the review can be extended to a period of 6 years.
|
|
b)
|
United States
|
In the United States, the tax authority may review tax returns for up to 3 years from the expiration date of the tax return. In the event that an omission or error is detected in the tax return of sales or cost of sales, the review can be extended for a period of up to 6 years.
|
|
c)
|
Mexico
|
In Mexico, the tax authority can review tax returns up to 5 years from the expiration date of the tax return.
|
|
d)
|
Spain
|
In Spain, the tax authority can review tax returns up to 4 years from the expiration date of the tax return.
|
|
e)
|
Belgium
|
In Belgium, the tax authority may review tax returns for up to 3 years from the expiration date of the tax return if no tax losses exist. In the event of detecting an omission or error in the tax return, the review can be extended for a period of up to 5 years.
|
|
f)
|
South Africa
|
In South Africa, the tax authority may review tax returns for up to 3 years from the expiration date of the tax return. In the event an omission or error in the tax return is detected, the review can be extended for a period of up to 5 years.
F-169
Notes to the consolidated Financial Statements as of December 31, 2010
(Translation of consolidated financial statements originally issued in Spanish – see Note 2.2)
|
29.5
|
Amendments to the income tax law and specific tax on mining in Chile
|
|
a)
|
Amendment to Corporate Tax
|
Law No. 20,455 was published in the Official Gazette of July 31, 2010. Article 1 of this law temporarily increases the Corporate Tax rate set forth in article 20 of the Income Tax Law (ITL), which levies incomes received or accrued within calendar years 2011 and 2012.
In accordance with that temporary increase, the referred-to rate of 17% increases to 20% for income received or accrued within calendar year 2011 (fiscal year 2012); and to 18.5% for income received or accrued within calendar year 2012 (fiscal year 2013).
The temporary differences affected by this rate increase were identified, which triggers a deferred tax charge to income amounting to ThUS$11,385.
|
b)
|
Amendment to the specific tax on mining
|
Law No. 20.469 was published in the Official Gazette of October 21, 2010, dealing with the following matters:
|
|
a.
|
Article 64 bis of the Income Tax Law, which establishes a specific tax on the operating income derived from mining activities earned by a foreign mine operator, was replaced;
|
|
|
b.
|
It included a new article 64 ter, relating to the method to be used to determine the operating taxable income derived from mining activities that, prior to this amendment, were addressed in the replaced article 64 bis;
|
|
c.
|
It amended article 11 ter of Decree Law 600/ 1974; and
|
|
|
d.
|
It established transitory and optional regulations applicable to investments or companies subject to articles 7, 11 bis and 11 ter of DL 600/ 1974; transitory article 5 of Law 20,026, and companies included in the provisions set forth in transitory article 4, even when they are not the recipients of foreign investments.
|
Subsidiaries SQM Salar S.A. and SQM Nitratos S.A. requested approval from the Ministry of Economy to be subject to the provisions set forth in transitory article 4 so they can choose to be subject, from 2013 and for a 5 year period, to the 5% invariability rate as the specific tax on mining.
Consequently, for the years 2010, 2011 and 2012 the mechanism used to determine the tax on mining payable with regard to the mining operating margin obtained by these entities will change. As of December 31, 2010 the company reserved the amount of ThUS$13,565, chargeable to the income account.
F-170
Notes to the consolidated Financial Statements as of December 31, 2010
(Translation of consolidated financial statements originally issued in Spanish – see Note 2.2)
Assets maintained in foreign currency are detailed as follows:
|
Types of Assets
|
Currency
|
12.31.2010
ThUS$
|
12.31.2009
ThUS$
|
01.01.2009
ThUS$
|
|||||||||
|
Current assets:
|
|||||||||||||
|
Cash and cash equivalents
|
CLP
|
332,624 | 61,326 | 99 | |||||||||
|
Cash and cash equivalents
|
CLF
|
- | - | - | |||||||||
|
Cash and cash equivalents
|
EUR
|
6,709 | 3,813 | 7,676 | |||||||||
|
Cash and cash equivalents
|
ZAR
|
1,523 | 2,586 | 2,574 | |||||||||
|
Cash and cash equivalents
|
AED
|
- | - | 176 | |||||||||
|
Cash and cash equivalents
|
BRL
|
22 | 33 | 4 | |||||||||
|
Cash and cash equivalents
|
YEN
|
1,193 | 823 | 1,096 | |||||||||
|
Cash and cash equivalents
|
CNY
|
104 | - | - | |||||||||
|
Cash and cash equivalents
|
PEN
|
13 | 26 | 175 | |||||||||
|
Cash and cash equivalents
|
ARS
|
- | 1 | 3 | |||||||||
|
Cash and cash equivalents
|
IDR
|
- | 5 | 4 | |||||||||
|
Cash and cash equivalents
|
INR
|
16 | - | - | |||||||||
|
Cash and cash equivalents
|
GBP
|
5 | 2 | 6 | |||||||||
|
Cash and cash equivalents
|
MXN
|
102 | 217 | 809 | |||||||||
|
Subtotal cash and cash equivalents
|
342,311 | 68,832 | 12,622 | ||||||||||
|
Other current financial assets
|
CLP
|
69,818 | 126,198 | - | |||||||||
|
Other current financial assets
|
CLF
|
- | 43,599 | ||||||||||
|
Subtotal other current financial assets
|
69,818 | 169,797 | - | ||||||||||
|
Other current non-financial assets
|
CLP
|
30,966 | 24,442 | 24,607 | |||||||||
|
Other current non-financial assets
|
CLF
|
21 | 758 | 294 | |||||||||
|
Other current non-financial assets
|
EUR
|
4,303 | 2,656 | 10,197 | |||||||||
|
Other current non-financial assets
|
ZAR
|
167 | 17 | 135 | |||||||||
|
Other current non-financial assets
|
ARS
|
42 | - | - | |||||||||
|
Other current non-financial assets
|
AED
|
- | - | 135 | |||||||||
|
Other current non-financial assets
|
BRL
|
2 | 3 | 9 | |||||||||
|
Other current non-financial assets
|
YEN
|
- | - | - | |||||||||
|
Other current non-financial assets
|
CNY
|
23 | - | - | |||||||||
|
Other current non-financial assets
|
PEN
|
331 | - | - | |||||||||
|
Other current non-financial assets
|
MXN
|
552 | 442 | 338 | |||||||||
|
Subtotal other current non-financial assets
|
36,407 | 28,318 | 35,715 | ||||||||||
|
Trade debtors and other accounts receivable
|
CLP
|
114,108 | 103,877 | 100,825 | |||||||||
|
Trade debtors and other accounts receivable
|
CLF
|
1,015 | 1,735 | 1,512 | |||||||||
|
Trade debtors and other accounts receivable
|
EUR
|
97,193 | 62,934 | 43,096 | |||||||||
|
Trade debtors and other accounts receivable
|
ZAR
|
7,292 | 30,977 | 8,524 | |||||||||
|
Trade debtors and other accounts receivable
|
AED
|
- | - | 236 | |||||||||
|
Trade debtors and other accounts receivable
|
BRL
|
64 | 20 | 2 | |||||||||
|
Trade debtors and other accounts receivable
|
ARS
|
5 | - | - | |||||||||
|
Trade debtors and other accounts receivable
|
YEN
|
2 | - | - | |||||||||
|
Trade debtors and other accounts receivable
|
CNY
|
48 | - | - | |||||||||
|
Trade debtors and other accounts receivable
|
PEN
|
2 | - | - | |||||||||
|
Trade debtors and other accounts receivable
|
GBP
|
409 | - | - | |||||||||
|
Trade debtors and other accounts receivable
|
MXN
|
58 | 7 | 119 | |||||||||
|
Subtotal trade debtors and other accounts receivable
|
220,196 | 199,550 | 154,314 | ||||||||||
|
Accounts receivable from related entities
|
CLP
|
111 | 299 | 150 | |||||||||
|
Accounts receivable from related entities
|
EUR
|
2,651 | 1,935 | 3,637 | |||||||||
|
Accounts receivable from related entities
|
AED
|
- | - | 39 | |||||||||
|
Subtotal accounts receivable from related entities
|
2,762 | 2,234 | 3,826 | ||||||||||
|
Current tax assets
|
CLP
|
9,098 | 7,954 | - | |||||||||
|
Current tax assets
|
EUR
|
140 | 208 | 232 | |||||||||
|
Current tax assets
|
ZAR
|
123 | 2 | 195 | |||||||||
|
Current tax assets
|
YEN
|
16 | 32 | 721 | |||||||||
|
Current tax assets
|
CNY
|
20 | - | - | |||||||||
|
Current tax assets
|
PEN
|
61 | - | - | |||||||||
|
Current tax assets
|
MXN
|
39 | 469 | - | |||||||||
|
Subtotal current tax assets
|
9,497 | 8,665 | 1,148 | ||||||||||
|
Total current assets
|
680,991 | 477,396 | 207,625 | ||||||||||
F-171
Notes to the consolidated Financial Statements as of December 31, 2010
(Translation of consolidated financial statements originally issued in Spanish – see Note 2.2)
Note 30 - Disclosures on accounts maintained in foreign currency (continued)
|
Types of Assets
|
Currency
|
12.31.2010
ThUS$
|
12.31.2009
ThUS$
|
01.01.2009
ThUS$
|
|||||||||
|
Non-current assets
|
|||||||||||||
|
Other non-current financial assets
|
CLP
|
20 | 20 | - | |||||||||
|
Other non-current financial assets
|
EUR
|
3 | 10 | 10 | |||||||||
|
Other non-current financial assets
|
BRL
|
34 | 28 | 19 | |||||||||
|
Other non-current financial assets
|
YEN
|
58 | 52 | 51 | |||||||||
|
Subtotal other non-current financial assets
|
115 | 110 | 80 | ||||||||||
|
Other non-financial non-current assets
|
CLP
|
599 | 2,757 | 353 | |||||||||
|
Other non-financial non-current assets
|
CLF
|
- | 5,939 | 2,449 | |||||||||
|
Other non-financial non-current assets
|
BRL
|
227 | 245 | 160 | |||||||||
|
Other non-financial non-current assets
|
YEN
|
373 | 297 | 256 | |||||||||
|
Subtotal other non-financial non-current assets
|
1,199 | 9,238 | 3,218 | ||||||||||
|
Non-current rights receivable
|
CLP
|
469 | 883 | 327 | |||||||||
|
Non-current rights receivable
|
CLF
|
633 | 787 | 439 | |||||||||
|
Subtotal non-current rights receivable
|
1,102 | 1,670 | 766 | ||||||||||
|
Investments accounted for using the equity method
|
CLP
|
1,352 | 328 | 473 | |||||||||
|
Investments accounted for using the equity method
|
EUR
|
9,560 | 12,121 | 12,483 | |||||||||
|
Investments accounted for using the equity method
|
AED
|
24,168 | 22,575 | 5,277 | |||||||||
|
Investments accounted for using the equity method
|
INR
|
432 | 530 | 94 | |||||||||
|
Investments accounted for using the equity method
|
TRY
|
11,988 | 8,693 | 11,212 | |||||||||
|
Investments accounted for using the equity method
|
EGP
|
1,435 | 1,780 | 2,247 | |||||||||
|
Investments accounted for using the equity method
|
THB
|
1,543 | 1,477 | 1,414 | |||||||||
|
Subtotal investments accounted for using the equity method
|
50,478 | 47,504 | 33,200 | ||||||||||
|
Increase in value
|
CLP
|
735 | - | - | |||||||||
|
Subtotal Increase in value
|
735 | - | - | ||||||||||
|
Property, plant and equipment
|
CLP
|
1,762 | 577 | 290 | |||||||||
|
Subtotal property, plant and equipment
|
1,762 | 577 | 290 | ||||||||||
|
Total non-current assets
|
55,391 | 59,099 | 37,554 | ||||||||||
|
Total assets
|
736,382 | 536,495 | 245,179 | ||||||||||
F-172
Notes to the consolidated Financial Statements as of December 31, 2010
(Translation of consolidated financial statements originally issued in Spanish – see Note 2.2)
Note 30 - Disclosures on accounts maintained in foreign currency (continued)
Liabilities maintained in foreign currency are detailed as follows:
|
12.31.2010
|
12.31.2009
|
|||||||||||||||||||||||||
|
Types of Liabilities
|
Currency
|
Up to 90 days
ThUS$
|
Over 90 days
to 1 year
ThUS$
|
Total
ThUS$
|
Up to 90 days
ThUS$
|
Over 90 days
to 1 year
ThUS$
|
Total
ThUS$
|
|||||||||||||||||||
|
Current liabilities
|
||||||||||||||||||||||||||
|
Other current financial liabilities
|
CLF
|
3,577 | 7,749 | 11,326 | 3,649 | 6,541 | 10,190 | |||||||||||||||||||
|
Other current financial liabilities
|
CLP
|
814 | 1,508 | 2,322 | 30,647 | 1,268 | 31,915 | |||||||||||||||||||
|
Other current financial liabilities
|
EUR
|
- | - | - | - | 3,327 | 3,327 | |||||||||||||||||||
|
Subtotal other current financial liabilities
|
4,391 | 9,257 | 13,648 | 34,296 | 11,136 | 45,432 | ||||||||||||||||||||
|
Trade and other accounts payable
|
CLP
|
85,403 | - | 85,403 | 72,888 | 66 | 72,954 | |||||||||||||||||||
|
Trade and other accounts payable
|
EUR
|
22,356 | 1,535 | 23,891 | 65,031 | - | 65,031 | |||||||||||||||||||
|
Trade and other accounts payable
|
INR
|
1 | - | 1 | - | - | - | |||||||||||||||||||
|
Trade and other accounts payable
|
ARS
|
1 | - | 1 | - | - | - | |||||||||||||||||||
|
Trade and other accounts payable
|
BRL
|
341 | - | 341 | - | - | - | |||||||||||||||||||
|
Trade and other accounts payable
|
PEN
|
43 | - | 43 | - | - | - | |||||||||||||||||||
|
Trade and other accounts payable
|
MXN
|
1,020 | 140 | 1,160 | 570 | 19 | 589 | |||||||||||||||||||
|
Trade and other accounts payable
|
GBP
|
40 | - | 40 | - | - | - | |||||||||||||||||||
|
Trade and other accounts payable
|
CNY
|
57 | - | 57 | - | - | - | |||||||||||||||||||
|
Trade and other accounts payable
|
ZAR
|
1,280 | 1,062 | 2,342 | 3,840 | - | 3,840 | |||||||||||||||||||
|
Subtotal trade accounts payable and other accounts payable
|
110,542 | 2,737 | 113,279 | 142,329 | 85 | 142,414 | ||||||||||||||||||||
|
Accounts payable to related entities
|
EUR
|
- | 997 | 997 | - | 23 | 23 | |||||||||||||||||||
|
Accounts payable to related entities
|
CLP
|
- | - | - | - | 233 | 233 | |||||||||||||||||||
|
Subtotal accounts payable to related entities
|
- | 997 | 997 | - | 256 | 256 | ||||||||||||||||||||
|
Other short term accruals
|
CLP
|
20 | - | 20 | - | 418 | 418 | |||||||||||||||||||
|
Other short term accruals
|
EUR
|
323 | - | 323 | - | 118 | 118 | |||||||||||||||||||
|
Other short term accruals
|
BRL
|
- | 1,634 | 1,634 | - | 1579 | 1579 | |||||||||||||||||||
|
Subtotal other short-term accruals
|
343 | 1,634 | 1,977 | - | 2,115 | 2,115 | ||||||||||||||||||||
|
Current tax liabilities
|
CLP
|
- | - | - | - | 27 | 27 | |||||||||||||||||||
|
Current tax liabilities
|
EUR
|
- | 335 | 335 | - | 422 | 422 | |||||||||||||||||||
|
Current tax liabilities
|
MXN
|
- | - | - | - | 2 | 2 | |||||||||||||||||||
|
Subtotal current tax liabilities
|
- | 335 | 335 | - | 451 | 451 | ||||||||||||||||||||
|
Employee benefits current accruals
|
MXN
|
- | 292 | 292 | - | - | - | |||||||||||||||||||
|
Employee benefits current accruals
|
CLP
|
34,211 | 9,455 | 43,666 | - | 16,375 | 16,375 | |||||||||||||||||||
|
Subtotal employee benefits current provisions
|
34,211 | 9,747 | 43,958 | - | 16,375 | 16,375 | ||||||||||||||||||||
|
Other current non-financial liabilities
|
CLP
|
6,299 | 12,557 | 18,856 | 14,187 | 13,530 | 27,717 | |||||||||||||||||||
|
Other current non-financial liabilities
|
EUR
|
29 | 84 | 113 | 128 | 299 | 427 | |||||||||||||||||||
|
Other current non-financial liabilities
|
BRL
|
12 | - | 12 | - | 48 | 48 | |||||||||||||||||||
|
Other current non-financial liabilities
|
MXN
|
710 | 54 | 764 | 162 | - | 162 | |||||||||||||||||||
|
Other current non-financial liabilities
|
PEN
|
79 | - | 79 | - | - | - | |||||||||||||||||||
|
Other current non-financial liabilities
|
AUD
|
- | 4 | 4 | - | - | - | |||||||||||||||||||
|
Other current non-financial liabilities
|
CNY
|
18 | - | 18 | - | - | - | |||||||||||||||||||
|
Other current non-financial liabilities
|
ZAR
|
- | - | - | 856 | - | 856 | |||||||||||||||||||
|
Subtotal other current non-financial liabilities
|
7,147 | 12,699 | 19,846 | 15,333 | 13,877 | 29,210 | ||||||||||||||||||||
|
Total current liabilities
|
156,634 | 37,406 | 194,040 | 191,958 | 44,295 | 236,253 | ||||||||||||||||||||
F-173
Notes to the consolidated Financial Statements as of December 31, 2010
(Translation of consolidated financial statements originally issued in Spanish – see Note 2.2)
Note 30 - Disclosures on accounts maintained in foreign currency (continued)
|
01.01.2009
|
|||||||||||||
|
Types of Liabilities
|
Currency
|
Up to 90
days
ThUS$
|
Over 90
days to 1
year
ThUS$
|
Total
ThUS$
|
|||||||||
|
Current liabilities
|
|||||||||||||
|
Other current financial liabilities
|
CLF
|
- | 5,352 | 5,352 | |||||||||
|
Other current financial liabilities
|
EUR
|
1,633 | - | 1,633 | |||||||||
|
Subtotal other current financial liabilities
|
1,633 | 5,352 | 6,985 | ||||||||||
|
Trade accounts payable and other accounts payable
|
CLP
|
68,914 | - | 68,914 | |||||||||
|
Trade accounts payable and other accounts payable
|
CFL
|
55 | 171 | 226 | |||||||||
|
Trade accounts payable and other accounts payable
|
EUR
|
9,962 | - | 9,962 | |||||||||
|
Trade accounts payable and other accounts payable
|
BRL
|
249 | - | 249 | |||||||||
|
Trade accounts payable and other accounts payable
|
AED
|
169 | - | 169 | |||||||||
|
Trade accounts payable and other accounts payable
|
MXN
|
643 | - | 643 | |||||||||
|
Trade accounts payable and other accounts payable
|
ZAR
|
599 | - | 599 | |||||||||
|
Subtotal trade accounts payable and other accounts payable
|
80,591 | 171 | 80,762 | ||||||||||
|
Other short term accruals
|
CLP
|
138 | - | 138 | |||||||||
|
Other short term accruals
|
EUR
|
7 | 291 | 298 | |||||||||
|
Other short term accruals
|
BRL
|
- | 1,295 | 1,295 | |||||||||
|
Other short term accruals
|
AED
|
11 | 11 | ||||||||||
|
Subtotal
other short term accruals
|
156 | 1,586 | 1,742 | ||||||||||
|
Employee benefits current accruals
|
CLP
|
- | 22,112 | 22,112 | |||||||||
|
Subtotal employee benefits current accruals
|
22,112 | 22,112 | |||||||||||
|
Other current non-financial liabilities
|
CLP
|
9,303 | 10,042 | 19,345 | |||||||||
|
Other current non-financial liabilities
|
EUR
|
74 | 375 | 449 | |||||||||
|
Other current non-financial liabilities
|
BRL
|
3 | 18 | 21 | |||||||||
|
Other current non-financial liabilities
|
MXN
|
255 | - | 255 | |||||||||
|
Subtotal other current non-financial liabilities
|
9,635 | 10,435 | 20,070 | ||||||||||
|
Total current liabilities
|
92,015 | 39,656 | 131,671 | ||||||||||
F-174
Notes to the consolidated Financial Statements as of December 31, 2010
(Translation of consolidated financial statements originally issued in Spanish – see Note 2.2)
Note 30 - Disclosures on accounts maintained in foreign currency (continued)
|
12.31.2010
|
12.31.2009
|
|||||||||||||||||||||||||||||||||
|
Types of Liabilities
|
Currency
|
Over 1
year to 3
years
ThUS$
|
Over 3
years to 5
years
ThUS$
|
Over 5
years
ThUS$
|
Total
ThUS$
|
Over 1
year to 3
years
ThUS$
|
Over 3
years to 5
years
ThUS$
|
Over 5
years
ThUS$
|
Total
ThUS$
|
|||||||||||||||||||||||||
|
Non-current liabilities
|
||||||||||||||||||||||||||||||||||
|
Other non-current financial liabilities
|
CLF
|
- | 66,081 | 284,056 | 350,137 | 6,195 | 68,144 | 251,926 | 326,265 | |||||||||||||||||||||||||
|
Other non-current financial liabilities
|
CLP
|
- | 154,485 | - | 154,485 | - | 143,956 | - | 143,956 | |||||||||||||||||||||||||
|
Subtotal other non-current financial liabilities
|
- | 220,566 | 284,056 | 504,622 | 6,195 | 212,100 | 251,926 | 470,221 | ||||||||||||||||||||||||||
|
Non-current liabilities
|
CLF
|
- | - | - | - | 187 | - | - | 187 | |||||||||||||||||||||||||
|
Non-current liabilities
|
- | - | - | - | - | - | - | - | ||||||||||||||||||||||||||
|
Subtotal non-current liabilities
|
- | - | - | - | 187 | - | - | 187 | ||||||||||||||||||||||||||
|
Tax liabilities
|
CLP
|
56 | - | 36 | 92 | - | - | - | - | |||||||||||||||||||||||||
|
Subtotal tax liabilities
|
56 | - | 36 | 92 | - | - | - | - | ||||||||||||||||||||||||||
|
Employee benefits non-current accruals
|
CLP
|
- | - | 1,805 | 1,805 | - | - | 28,171 | 28,171 | |||||||||||||||||||||||||
|
Employee benefits non-current accruals
|
MXN
|
- | - | - | - | - | - | 185 | 185 | |||||||||||||||||||||||||
|
Employee benefits non-current accruals
|
JPY
|
- | - | - | - | - | - | 326 | 326 | |||||||||||||||||||||||||
|
Subtotal employee benefits non-current accruals
|
- | - | 1,805 | 1,805 | - | - | 28,682 | 28,682 | ||||||||||||||||||||||||||
|
Total non-current liabilities
|
56 | 220,566 | 285,897 | 506,519 | 6,382 | 212,100 | 280,608 | 499,090 | ||||||||||||||||||||||||||
F-175
Notes to the consolidated Financial Statements as of December 31, 2010
(Translation of consolidated financial statements originally issued in Spanish – see Note 2.2)
|
01.01.2009
|
|||||||||||||||||
|
Types of Liabilities
|
Currency
|
Over 1
year to 3
years
ThUS$
|
Over 3
years to 5
years
ThUS$
|
Over 5
years
ThUS$
|
Total
ThUS$
|
||||||||||||
|
Non-current liabilities
|
|||||||||||||||||
|
Other non-current financial liabilities
|
CLF
|
5,056 | 5,056 | 75,828 | 85,940 | ||||||||||||
|
Subtotal other non-current financial liabilities
|
5,056 | 5,056 | 75,828 | 85,940 | |||||||||||||
|
Non-current liabilities
|
CLF
|
398 | - | - | 398 | ||||||||||||
|
Subtotal non-current liabilities
|
398 | - | - | 398 | |||||||||||||
|
Tax liabilities
|
CLP
|
18 | - | - | 18 | ||||||||||||
|
Subtotal tax liabilities
|
18 | - | - | 18 | |||||||||||||
|
Employee benefits non-current accruals
|
CLP
|
- | - | 19,489 | 19,489 | ||||||||||||
|
Employee benefits non
|
MXN
|
- | - | 403 | 403 | ||||||||||||
|
Employee benefits non
|
JPY
|
- | - | 294 | 294 | ||||||||||||
|
Subtotal
employee benefits non-current accruals
|
- | - | 20,186 | 20,186 | |||||||||||||
|
Total non-current liabilities
|
5,472 | 5,056 | 96,014 | 106,542 | |||||||||||||
F-176
Notes to the consolidated Financial Statements as of December 31, 2010
(Translation of consolidated financial statements originally issued in Spanish – see Note 2.2)
SQM Salar S.A., a consolidated subsidiary of the Company, entered into a contract with a government agency (CORFO) for the rental of land for the purpose of exploration and exploitation of certain minerals. Rental payments (royalties) are stated in US dollars and are determined based on actual mineral sales through 2030 in accordance with rates specified in the agreement. Based on the agreement the Company paid ThUS$ 18,717, ThUS$ 17,747 and ThUS 17,712 in 2010, 2009 and 2008 respectively, including the minimum annual rental, which was ThUS$ 7,567, ThUS$ 11,738 and ThUS$ 3,757 for 2010, 2009 and 2008, respectively. Future estimated minimum annual rentals are as follows:
|
Minimum
|
||||
|
Anual
|
||||
|
Rentals
|
||||
|
Year ended December 31,
|
ThUS$
|
|||
|
2011
|
5,124 | |||
|
2012
|
5,124 | |||
|
2013
|
5,124 | |||
|
2014
|
5,124 | |||
|
2015
|
5,124 | |||
|
Thereafter(2016-2030)
|
81,751 | |||
|
Total
|
107,371 | |||
As of December 31, 2010, SQM Salar S.A. has accrued for the rental payment of ThUS$ 5,182 related to the rental agreement maintained with CORFO.
|
32.1
|
Authorization of the financial statements
|
The consolidated financial statements of Sociedad Química y Minera S.A. and subsidiaries prepared in accordance with International Financial Reporting Standards for the year ended December 31, 2010 were approved and authorized for issuance by the Board of Directors at their meeting held on March 1, 2011.
The consolidated financial statements of Sociedad Química y Minera S.A. and subsidiaries have been translated into English and adapted in order to comply with US SEC requirements. These consolidated financial statements were approved and authorized for issuance by the Board of Directors whose meeting was held on June 28, 2011.
|
32.2
|
Disclosures of subsequent events
|
Management is not aware of any other significant events that occurred between December 31, 2010 and the date of issuance of these consolidated financial statements that may significantly affect them.
|
32.3
|
Detail of dividends declared after the reporting date
|
As of the closing date of these financial statements, there are no dividends declared after the reporting date.
F-177
TABLE OF CONTENTS
Part IItem 1. Identity Of Directors, Senior Management and AdvisersItem 2. Offer Statistics and Expected TimetableItem 3. Key InformationItem 4. Information on The CompanyItem 4A. Unresolved Staff CommentsItem 5. Operating and Financial Review and ProspectsItem 6. Directors, Senior Management and EmployeesItem 7. Major Shareholders and Related Party TransactionsItem 8. Financial InformationItem 9. The Offer and ListingItem 10. Additional InformationItem 11. Quantitative and Qualitative Disclosures About Market RiskItem 12. Description Of Securities Other Than Equity SecuritiesItem 12. A. Debt SecuritiesItem 12. AItem 12. B. Warrants and RightsItem 12. C. Other SecuritiesItem 12. D. American Depositary ReceiptsPart IIItem 13. Defaults, Dividend Arrearages and DelinquenciesItem 14. Material Modifications To The Rights Of Security Holders and Use Of ProceedsItem 15. Controls and ProceduresItem 16. [reserved]Item 16A. Audit Committee Financial ExpertItem 16B. Code Of EthicsItem 16C. Principal Accountant Fees and ServicesItem 16D. Exemptions From The Listing Standards For Audit CommitteeItem 16E. Purchases Of Equity Securities By The Issuer and Affiliated PurchasersItem 16F. Change in Registrant S Certifying AccountantItem 16G. Corporate GovernancePart IIIItem 17. Financial StatementsItem 18. Financial StatementsItem 19. ExhibitsNote 1 - Corporate Information For Sociedad Qu Mica Y Minera De Chile S.a. and SubsidiariesNote 2 - Basis Of Presentation For The Consolidated Financial Statements and Summary Of Significant Accounting PoliciesNote 2 - Basis Of Presentation For Consolidated Financial Statements and Summary Of Significant Accounting Policies (continued)Note 2 - Basis Of Presentationof Consolidated Financial Statements and Summary Of Significant Accounting Principles (continued)Note 2 - Basis Of Presentationof Consolidated Financial Statements and Summary Of Significant Accounting Principles, ContinuedNote 3 - First-time Adoption Of International Financial Reporting Standards (ifrs)Note 3 - First-time Adoption Of International Financial Reporting Standards (ifrs) (continued)Note 4 - Financial Risk Management, Objectives and PoliciesNote 4 - Financial Risk Management, Objectives and Policies (continued)Note 5 - Changes in Accounting Estimates and Policies (uniformity)Note 5 - Changes in Accounting Estimates and Policies (uniformity) (continued)Note 6 - Cash and Cash EquivalentsNote 6 - Cash and Cash Equivalents (continued)Note 8 - Related Party DisclosuresNote 8 - Related Party Disclosures (continued)Note 9 - Financial InstrumentsNote 9 - Financial Instruments (continued)Note 10 - Investments and Disclosures on Investments in SubsidiariesNote 10 - Investments and Disclosures on Investments in Subsidiaries (continued )Note 10 - Investments and Disclosures on Investments in Subsidiaries (continuedNote 11 - Investments in Associates Accounted For Using The Equity MethodNote 11 - Investments in Associates Accounted For Using The Equity Method (continued)Note 12 - Joint VenturesNote 12 - Joint Venturesn (continued)Note 13 - Intangible Assets and GoodwillNote 13 - Intangible Assets and Goodwill (continued)Note 14 - Property, Plant and EquipmentNote 14 - Property, Plant and Equipment (continued)Note 15 - LeasesNote 16 - Employee BenefitsNote 16 - Employee Benefits (continued)Note 17 - Executive Compensation PlanNote 17 - Executive Compensation Plan (continued)Note 18 - Equity DisclosuresNote 18 - Equity Disclosures (continued)Note 18 - Shareholders Equity Disclosures (continued)Note 19 - Provisions and Other Non-financial LiabilitiesNote 19 - Provisions and Other Non-financial Liabilities (continued)Note 20 - Contingencies and RestrictionsNote 20 - Contingencies and Restrictions (continued)Note 21 - RevenueNote 22 - Earnings Per ShareNote 23 - Loan CostsNote 24 - Effect Of Variations in The Foreign Currency Exchange RatesNote 24 - Effect Of Variations in The Foreign Currency Exchange Rates (continued)Note 25 - The EnvironmentNote 25 - The Environment (continued)Note 26 - Other Current and Non-current Non-financial AssetsNote 26 - Other Current and Non-current Non-financial Assets (continued)Note 27 - Operating SegmentsNote 27 - Operating Segments (continued)Note 28 - Other Income, Other Expenses By Function and Other Gains Or LossesNote 28 - Other Income, Other Expenses By Function and Other Gains Or Losses (continued)Note 29 - Income TaxesNote 29 - Income and Deferred Taxes (continued)Note 30 - Disclosures on Accounts Maintained in Foreign CurrencyNote 30 - Disclosures on Accounts Maintained in Foreign Currency (continued)Note 31 Lease CommitmentsNote 32 - Events After The Reporting Period