UNITED STATES
SECURITIES AND EXCHANGE COMMISSION
Washington, D.C. 20549
FORM 20-F
(Mark One)
| ¨ | REGISTRATION STATEMENT PURSUANT TO SECTION 12(b) OR (g) OF THE SECURITIES EXCHANGE ACT OF 1934 |
OR
| x | ANNUAL REPORT PURSUANT TO SECTION 13 OR 15(d) OF THE SECURITIES EXCHANGE ACT OF 1934 |
For the fiscal year ended December 31, 2018
OR
| ¨ | TRANSITION REPORT PURSUANT TO SECTION 13 OR 15(d) OF THE SECURITIES EXCHANGE ACT OF 1934 |
for the transition period from to
OR
| ¨ | SHELL COMPANY REPORT PURSUANT TO SECTION 13 OR 15(d) OF THE SECURITIES EXCHANGE ACT OF 1934 |
Date of event requiring this shell company report
Commission file number 33-65728
SOCIEDAD QUIMICA Y MINERA DE CHILE S.A.
(Exact name of Registrant as specified in its charter)
CHEMICAL AND MINING COMPANY OF CHILE INC.
(Translation of Registrant’s name into English)
CHILE
(Jurisdiction of incorporation)
El Trovador 4285, 6 th floor, Santiago, Chile +56 2 2425 2000
(Address of principal executive offices)
Gerardo Illanes +56 2 2425-2485, gerardo.illanes@sqm.com, El Trovador 4285, 6 th floor, Santiago, Chile
(Name, Telephone, E-mail and/or Facsimile Number and Address of Company Contact Person)
Securities registered or to be registered, pursuant to Section 12(b) of the Act:
| Title of each class | Name of each exchange on which registered | |
| Series B common shares, in the form of American Depositary Shares each representing one Series B share | New York Stock Exchange |
Securities registered or to be registered pursuant to Section 12(g) of the Act:
None
Securities for which there is a reporting obligation pursuant to Section 15(d) of the Act:
None
Indicate by check mark if the registrant is a well-known seasoned issuer, as defined in Rule 405 of the Securities Act. Yes x No ¨
If this report is an annual or transition report, indicate by check mark if the registrant is not required to file reports pursuant to Section 13 or 15(d) of the Securities Exchange Act of 1934. Yes ¨ No x
Indicate by check mark whether the registrant (1) has filed all reports required to be filed by Section 13 or 15(d) of the Securities Exchange Act of 1934 during the preceding 12 months (or for such shorter period that the registrant was required to file such reports), and (2) has been subject to such filing requirements for the past 90 days. Yes x No ¨
Indicate by check mark whether the registrant has submitted, electronically every Interactive Data File required to be submitted pursuant to Rule 405 of Regulation S-T during the preceding 12 months (or for such shorter period that the registrant was required to submit such files). Yes x No ¨
Indicate by check mark whether the registrant is a large accelerated filer, an accelerated filer, a non-accelerated filer, or an emerging growth company. See the definitions of “large accelerated filer,” “accelerated filer,” and “emerging growth company” in Rule 12b-2 of the Exchange Act.
Large accelerated filer x Accelerated filer ¨ Non-accelerated filer ¨ Emerging growth company ¨
If an emerging growth company that prepares its financial statements in accordance with U.S. GAAP, indicate by check mark if the registrant has elected not to use the extended transition period for complying with any new or revised financial accounting standards † provided pursuant to Section 13(a) of the Exchange Act. ¨
† The term “new or revised financial accounting standard” refers to any update issued by the Financial Accounting Standards Board to its Accounting Standards Codification after April 5, 2012.
Indicate by check mark which basis of accounting the registrant has used to prepare the financial statements included in this filing:
| U.S. GAAP ¨ |
International Financial Reporting Standards as issued by the International Accounting Standards Board x |
Other ¨ |
If “Other” has been checked in response to the previous question indicate by check mark which financial statement item the registrant has elected to follow. Item 17 ¨ Item 18 ¨
If this is an annual report, indicate by check mark whether the registrant is a shell company (as defined in Rule 12b-2 of the Exchange Act). Yes ¨ No x
Indicate the number of outstanding shares of each of the issuer’s classes of capital stock or common stock as of the close of business covered by the annual report.
| Series A Common Shares | 142,819,552 |
| Series B Common Shares | 120,376,972 |
TABLE OF CONTENTS
Page
| EXHIBIT 1.1 | |
| EXHIBIT 8.1 | |
| EXHIBIT 12.1 | |
| EXHIBIT 12.2 | |
| EXHIBIT 13.1 | |
| EXHIBIT 13.2 | |
| EXHIBIT 23.1 | |
| EXHIBIT 23.2 | |
| EXHIBIT 23.3 | |
| EXHIBIT 99.1 | |
| EXHIBIT 99.2 | |
| EXHIBIT 99.3 |
iii
In this Annual Report on Form 20-F, except as otherwise provided or unless the context requires otherwise, all references to “ we ,” “ us ,” “ Company ” or “ SQM ” are to Sociedad Química y Minera de Chile S.A., an open stock corporation ( sociedad anónima abierta ) organized under the laws of the Republic of Chile, and its consolidated subsidiaries.
All references to “ US$ ,” “ U.S. dollars, ” “ USD ” and “ dollars ” are to United States dollars, references to “ pesos, ” “ CLP ” and “ Ch$ ” are to Chilean pesos, references to ThUS$ are to thousands of United States dollars, references to ThCh$ are to thousands of Chilean pesos and references to “ UF ” are to Unidades de Fomento . The UF is an inflation-indexed, peso-denominated unit that is linked to, and adjusted daily to reflect changes in, the previous month’s Chilean consumer price index. As of December 31, 2018, UF 1.00 was equivalent to US$38.19 and Ch$26,565.79 according to the Chilean Central Bank ( Banco Central de Chile ). As of April 1, 2019, UF 1.00 was equivalent to US$40.63 and Ch$27,565.76.
The Republic of Chile is governed by a democratic government, organized in fifteen regions plus the Metropolitan Region (surrounding and including Santiago, the capital of Chile). Our production operations are concentrated in northern Chile, specifically in the Tarapacá Region and in the Antofagasta Region.
We use the metric system of weights and measures in calculating our operating and other data. The United States equivalent units of the most common metric units used by us are as shown below:
1 kilometer equals approximately 0.6214 miles
1 meter equals approximately 3.2808 feet
1 centimeter equals approximately 0.3937 inches
1 hectare equals approximately 2.4710 acres
1 metric ton (“MT” or “metric ton”) equals 1,000 kilograms or approximately 2,205 pounds.
We are not aware of any independent, authoritative source of information regarding sizes, growth rates or market shares for most of our markets. Accordingly, the market size, market growth rate and market share estimates contained herein have been developed by us using internal and external sources and reflect our best current estimates. These estimates have not been confirmed by independent sources.
Percentages and certain amounts contained herein have been rounded for ease of presentation. Any discrepancies in any figure between totals and the sums of the amounts presented are due to rounding.
“ assay values ” Chemical result or mineral component amount contained by the sample.
“ average global metallurgical recoveries ” Percentage that measures the metallurgical treatment effectiveness based on the quantitative relationship between the initial product contained in the mine-extracted material and the final product produced in the plant.
“ average mining exploitation factor ” Index or ratio that measures the mineral exploitation effectiveness, based on the quantitative relationship between (in-situ mineral minus exploitation losses) / in-situ mineral.
“ CAGR ” Compound annual growth rate, the year over year growth rate of an investment over a specified period of time.
“ cash and cash equivalents ” The International Accounting Standards Board (IASB) defines cash and cash equivalents as short-term, highly liquid investments that are readily convertible to known amounts of cash and which are subject to an insignificant risk of changes in value.
“ Controller Group ” * A person or company or group of persons or companies that according to Chilean law, have executed a joint performance agreement, that have a direct or indirect share in a company’s ownership and have the power to influence the decisions of the company’s management.
“ Corfo ” Production Development Corporation ( Corporación de Fomento de la Producción ), formed in 1939, a Chilean national organization in charge of promoting Chile’s manufacturing productivity and commercial development.
iv
“ CMF ” The Chilean Financial Market Commission. ( La Comisión para el Mercado Financiero ), formerly known as the Superintendence of Securities and Insurance ( Superintendencia de Valores y Seguros or SVS ).
“ cut-off grade ” The minimal assay value or chemical amount of some mineral component above which exploitation is economical.
“ dilution ” Loss of mineral grade because of contamination with barren material (or waste) incorporated in some exploited ore mineral.
“ exploitation losses ” Amounts of ore mineral that have not been extracted in accordance with exploitation designs.
“ fertigation ” The process by which plant nutrients are applied to the ground using an irrigation system.
“ geostatistical analysis ” Statistical tools applied to mining planning, geology and geochemical data that allow estimation of averages, grades and quantities of mineral resources and reserves.
“ heap leaching ” A process whereby minerals are leached from a heap, or pad, of ROM (run of mine) ore by leaching solutions percolating down through the heap and collected from a sloping, impermeable liner below the pad.
“ horizontal layering ” Rock mass (stratiform seam) with generally uniform thickness that conform to the sedimentary fields (mineralized and horizontal rock in these cases).
“ hypothetical resources ” Mineral resources that have limited geochemical reconnaissance, based mainly on geological data and sample assay values spaced between 500–1000 meters.
“ Indicated Mineral Resource ” See “Resources—Indicated Mineral Resource.”
“ Inferred Mineral Resource ” See “Resources—Inferred Mineral Resource.”
“ industrial crops ” Refers to crops that require processing after harvest in order to be ready for consumption or sale. Tobacco, tea and seed crops are examples of industrial crops.
“ Kriging Method” A technique used to estimate ore reserves, in which the spatial distribution of continuous geophysical variables is estimated using control points where values are known.
“LIBOR” London Inter Bank Offered Rate.
“ limited reconnaissance ” Low or limited level of geological knowledge.
“ Measured Mineral Resource ” See “Resources—Measured Mineral Resource.”
“ metallurgical treatment ” A set of chemical and physical processes applied to the caliche ore and to the salar brines to extract their useful minerals (or metals).
“ ore depth ” Depth of the mineral that may be economically exploited.
“ ore type ” Main mineral having economic value contained in the caliche ore (sodium nitrate or iodine).
“ ore ” A mineral or rock from which a substance having economic value may be extracted.
“ Probable Mineral Reserve ” See “Reserves—Probable Mineral Reserve.”
“ Proven Mineral Reserve ” See “Reserves—Proven Mineral Reserve.”
“ Reserves—Probable Mineral Reserve ” ** The economically mineable part of an Indicated Mineral Resource and, in some circumstances, Measured Mineral Resource. The calculation of the reserves includes diluting of materials and allowances for losses which may occur when the material is mined. Appropriate assessments, which may include feasibility studies, have been carried out and include consideration of and modification by realistically assumed mining, metallurgical, economic, marketing, legal, environmental, social and governmental factors. These assessments demonstrate at the time of reporting that extraction is reasonably justified. A Probable Mineral Reserve has a lower level of confidence than a Proven Mineral Reserve.
“ Reserves—Proven Mineral Reserve ” ** The economically mineable part of a Measured Mineral Resource. The calculation of the reserves includes diluting of materials and allowances for losses which may occur when the material is mined. Appropriate assessments, which may include feasibility studies, have been carried out and include consideration of and modification by realistically assumed mining, metallurgical, economic, marketing, legal, environmental, social and governmental factors. These assessments demonstrate at the time of reporting that extraction is reasonably justified.
v
“ Resources—Indicated Mineral Resource ” ** The part of a Mineral Resource for which tonnage, densities, shape, physical characteristics, grade and mineral content can be estimated with a reasonable level of confidence. The calculation is based on detailed exploration, sampling and testing information gathered through appropriate sampling techniques from locations such as outcrops, trenches and exploratory drill holes. The locations are too widely or inappropriately spaced to confirm geological continuity and/or grade continuity but are spaced closely enough for continuity to be assumed. An Indicated Mineral Resource has a lower level of confidence than a Measured Mineral Resource, but has a higher level of confidence than an Inferred Mineral Resource.
A deposit may be classified as an Indicated Mineral Resource when the nature, quality, amount and distribution of data are such as to allow the Competent Person, as that term is defined under Chilean Law No. 20,235, determining the Mineral Resource to confidently interpret the geological framework and to assume continuity of mineralization. Confidence in the estimate is sufficient to allow the appropriate application of technical and economic parameters and to enable an evaluation of economic viability.
“ Resources—Inferred Mineral Resource ” ** The part of a Mineral Resource for which tonnage, grade and mineral content can be estimated with a low level of confidence, by inferring them on the basis of geological evidence and assumed but not verified geological and/or grade continuity. The estimate is based on information gathered through appropriate sampling techniques from locations such as outcrops, trenches, pits, workings and drill holes, and this information is of limited or uncertain quality and/or reliability. An Inferred Mineral Resource has a lower level of confidence than an Indicated Mineral Resource.
“ Resources—Measured Mineral Resource ” ** The part of a Mineral Resource for which tonnage, densities, shape, physical characteristics, grade and mineral content can be estimated with a high level of confidence. The estimate is based on detailed exploration, sampling and testing information gathered through appropriate sampling techniques from locations such as outcrops, trenches and exploratory drill holes. The locations are spaced closely enough to confirm geological and/or grade continuity.
A deposit may be classified as a Measured Mineral Resource when the nature, quality, amount and distribution of data are such as to leave no reasonable doubt, in the opinion of the Competent Person, as that term is defined under Chilean Law No. 20,235, determining the Mineral Resource, that the tonnage and grade of the deposit can be estimated within close limits and that any variation from the estimate would not significantly affect potential economic viability. This category requires a high level of confidence in, and understanding of, the geology and controls of the mineral deposit. Confidence in the estimate is sufficient to allow the appropriate application of technical and economic parameters and to enable an evaluation of economic viability.
“ Resources—Mineral Resource ” ** A concentration or occurrence of natural, solid, inorganic or fossilized organic material in or on the Earth’s crust in such form or quantity and of such grade or quality that it has reasonable prospects for economically viable extraction. The location, quantity, grade, geological characteristics and continuity of a mineral resource are known, estimated or interpreted from specific geological, metallurgical and technological evidence.
“ solar salts ” A mixture of 60% sodium nitrate and 40% potassium nitrate used in the storage of thermo-energy.
“ vat leaching ” A process whereby minerals are extracted from crushed ore by placing the ore in large vats containing leaching solutions.
“ waste ” Rock or mineral which is not economical for metallurgical treatment.
“ Weighted average age ” The sum of the product of the age of each fixed asset at a given facility and its current gross book value as of December 31, 2018 divided by the total gross book value of the Company’s fixed assets at such facility as of December 31, 2018.
| * | The definition of a Controller Group that has been provided is the one that applied to the Company. Chilean law provides for a broader definition of a “controller group”, as such term is defined in Title XV of Chilean Law No. 18,045. |
| ** | The definitions we use for resources and reserves are based on those provided by the “ Instituto de Ingenieros de Minas de Chile ” (Chilean Institute of Mining Engineers). |
vi
CAUTIONARY STATEMENT REGARDING FORWARD-LOOKING STATEMENTS
This Form 20-F contains statements that are or may constitute forward-looking statements within the meaning of the Private Securities Litigation Reform Act of 1995. These statements are not based on historical facts and reflect our expectations for future events and results. Words such as “believe,” “expect,” “predict,” “anticipate,” “intend,” “estimate,” “should,” “may,” “likely,” “could” or similar expressions may identify forward-looking information. These statements appear throughout this Form 20-F and include statements regarding the intent, belief or current expectations of the Company and its management, including but not limited to any statements concerning:
| · | trends affecting the prices and volumes of the products we sell; |
| · | level of reserves, quality of the ore and brines, and production levels and yields; |
| · | our capital investment program and development of new products; |
| · | the future impact of competition; and |
| · | regulatory changes. |
Such forward-looking statements are not guarantees of future performance and involve risks and uncertainties. Actual results may differ materially from those described in such forward-looking statements included in this Form 20-F, including, without limitation, the information under Item 4. Information on the Company, Item Number 5. Operating and Financial Review and Prospects and Item 11. Quantitative and Qualitative Disclosures About Market Risk. Factors that could cause actual results to differ materially include, but are not limited to:
| · | volatility of global prices for our products; |
| · | political, economic and demographic developments in certain emerging market countries, where we conduct a large portion of our business; |
| · | changes in production capacities; |
| · | the nature and extent of future competition in our principal markets; |
| · | our ability to implement our capital expenditures program, including our ability to obtain financing when required; |
| · | changes in raw material and energy prices; |
| · | currency and interest rate fluctuations; |
| · | risks relating to the estimation of our reserves; |
| · | changes in quality standards or technology applications; |
| · | adverse legal, regulatory or labor disputes or proceedings; |
| · | changes in governmental regulations; |
| · | a potential change of control of our company; and |
| · | additional risk factors discussed below under Item 3. Key Information—Risk Factors. |
vii
| ITEM 1. | IDENTITY OF DIRECTORS, SENIOR MANAGEMENT AND ADVISERS |
Not Applicable.
| ITEM 2. | OFFER STATISTICS AND EXPECTED TIMETABLE |
Not Applicable.
| ITEM 3. | KEY INFORMATION |
3.A. Selected Financial Data
The following table presents selected financial data as of and for the years ended December 31, 2018, 2017, 2016, 2015, and 2014. The selected financial data should be read in conjunction with the Consolidated Financial Statements and notes thereto, “Item 5. Operating and Financial Review and Prospects” and other financial information included herein.
| For the years ended December 31, | ||||||||||||||||||||
| (in millions of US$) (1) | 2018 | 2017 | 2016 | 2015 | 2014 | |||||||||||||||
| Statement of income: | ||||||||||||||||||||
| Revenues | 2,265.8 | 2,157.3 | 1,939.3 | 1,728.3 | 2,014.2 | |||||||||||||||
| Cost of sales | (1,483.5 | ) | (1,394.8 | ) | (1,328.3 | ) | (1,185.6 | ) | (1,431.2 | ) | ||||||||||
| Gross profit | 782.3 | 762.5 | 611.0 | 542.7 | 583.0 | |||||||||||||||
| Other income (2) | 32.0 | 17.8 | 15.2 | 15.3 | 24.1 | |||||||||||||||
| Administrative expenses | (118.1 | ) | (101.2 | ) | (88.4 | ) | (86.8 | ) | (96.5 | ) | ||||||||||
| Other expenses by function (3)(4)(5)(6)(7)(8) | (36.9 | ) | (53.6 | ) | (82.5 | ) | (106.4 | ) | (64.3 | ) | ||||||||||
| Other gains (losses) | 6.4 | 0.5 | 0.7 | 3.8 | 4.4 | |||||||||||||||
| Net impairment gains on reversal (losses) on financial assets | 3.0 | (8.0 | ) | (7.2 | ) | (2.9 | ) | 13.2 | ||||||||||||
| Finance income | 22.5 | 13.5 | 10.1 | 11.6 | 16.1 | |||||||||||||||
| Finance expenses | (59.9 | ) | (50.1 | ) | (57.5 | ) | (69.9 | ) | (63.4 | ) | ||||||||||
| Equity income of associates and joint ventures accounted for using the equity method | 6.4 | 14.5 | 13.0 | 10.3 | 18.1 | |||||||||||||||
| Foreign currency exchange differences | (16.6 | ) | (1.3 | ) | 0.5 | (12.4 | ) | (16.5 | ) | |||||||||||
| Income before income tax expense (3) | 621.1 | 594.6 | 414.9 | 308.3 | 405.0 | |||||||||||||||
| Income tax expense (9) | (179.0 | ) | (166.2 | ) | (133.0 | ) | (83.8 | ) | (160.7 | ) | ||||||||||
| Profit for the year (3) (9) | 442.1 | 428.4 | 281.9 | 224.5 | 244.3 | |||||||||||||||
| Profit attributable to: | ||||||||||||||||||||
| Controlling interests (3) (9) | 439.8 | 427.7 | 278.3 | 220.4 | 236.9 | |||||||||||||||
| Non-controlling interests | 2.2 | 0.7 | 3.6 | 4.2 | 7.4 | |||||||||||||||
| Profit for the year (3) (9) | 442.1 | 428.4 | 281.9 | 224.6 | 244.3 | |||||||||||||||
| Basic earnings per share (10) | 1.67 | 1.63 | 1.06 | 0.84 | 0.90 | |||||||||||||||
| Basic earnings per ADS (11) | 1.67 | 1.63 | 1.06 | 0.84 | 0.90 | |||||||||||||||
| Dividends per share (12) (13) | 2.09 | 1.84 | 1.44 | 0.47 | 1.42 | |||||||||||||||
| Dividends per ADS (12) (13) (14) | 2.09 | 1.84 | 1.44 | 0.47 | 1.42 | |||||||||||||||
| Weighted average (10)(11) shares outstanding (000s) | 263,197 | 263,197 | 263,197 | 263,197 | 263,197 | |||||||||||||||
| 1 |
| (1) | Except shares outstanding, dividend and net earnings per share and net earnings per American Depositary Share (“ADS”). |
| (2) | Other income for 2018 includes pre-tax income of US$14.5 million related to the sale of our interest in the Mínera Exar S.A. lithium project in Argentina. |
| (3) | Other expenses for 2014 includes provisions of US$7 million corresponding to payments made in 2015 to the Chilean Internal Revenue Service ( Servicio de Impuestos Internos or “SII”) for expenses that may not have qualified as tax expenses under the Chilean tax code. However, since such payments were made after March 3, 2015, the date on which the Company filed its statutory consolidated financial statements filed with the CMF, such provisions were included in net income for the period ended December 31, 2015 for purposes of the Company’s statutory consolidated financial statements. For more information, see “Item 3D. Risk Factors—Risks Relating to our Business—We could be subject to numerous risks as a result of legal proceedings and deferred prosecution agreements with U.S. and Chilean governmental authorities in relation to certain payments made by SQM between the tax years 2009 and 2015.”, and “Item 8.A.7. Legal Proceedings.” |
| (4) | Other expenses for 2015 include a charge of US$57.7 million for impairment and severance indemnities related to the restructuring of our Pedro de Valdivia operations. |
| (5) | Other expenses for 2016 include a charge of US$32.8 million for impairment related to the closing of the train between Coya Sur and Tocopilla. Other expenses for 2016 also include charges of US$30.5 million related to the Company's agreement with the U.S. Department of Justice and the administrative cease and desist order issued by the U.S. Securities and Exchange Commission in connection the inquiries arising out of the alleged violations of the books and records and internal controls provisions of the Foreign Corrupt Practices Act. For more information, see “Item 3D. Risk Factors—Risks Relating to our Business—We could be subject to numerous risks as a result of legal proceedings and deferred prosecution agreements with U.S. and Chilean governmental authorities in relation to certain payments made by SQM between the tax years 2009 and 2015.” and “Item 8.A.7 Legal Proceedings.” |
| (6) | Other expenses for 2017 include a charge of US$20.4 million relating to payment by our subsidiary SQM Salar S.A. to Corfo after entering into the Corfo Arbitration Agreement (as defined in “Item 3.D. Risk Factors - Risks Relating to our Business”) to terminate the arbitration proceedings and amend the existing Lease Agreement and Project Agreement (each as defined in “Item 3.D. Risks Factors - Risks Relating to our Business”). For more information, see “Item 8.A.7 Legal Proceedings.” |
| (7) | Other expenses include the rent under lease contract with Corfo, which is described in Note 18.2 of the Consolidated Financial Statements. The payment made to Corfo were US$84.8 million in 2018, US$32.3 million in 2017, US$11.5 million in 2016, US$6.3 million in 2015, and US$6.2 million in 2014. |
| (8) | As a result of the adoption of IFRS 9, a reclassification was made to present gains on reversal (losses) separately from other expenses as function. The corresponding reclassifications for prior periods are described in Note 2.4 of the Consolidated Financial Statements. |
| (9) | In accordance with IAS 12, the effects generated by the change in the income tax rate approved by Law No. 20.780 on income and deferred taxes have been applied to the income statement. For purposes of the Company’s statutory consolidated financial statements filed with the CMF, in accordance with the instructions issued by the CMF in its circular 856 of October 17, 2014, the effects generated by the change in the income tax rate were accounted for as retained earnings. The amount charged to equity as of December 31, 2014 was US$52.3 million, thereby giving rise to a difference of US$52.3 million in profit and income tax expense in 2014 as presented in the Company’s Audited Consolidated Financial Statements compared with profit and income tax expense presented in the Company’s statutory consolidated financial statements filed with the CMF. The effects of subsequent changes in the income tax rate are recognized in profit or loss for the period in the Company’s statutory consolidated financial statements in accordance with IAS 12. |
| (10) | The Company has not conducted any transaction that would give rise to a potential dilutive effect on its earnings per share in any of the indicated years. The total number of outstanding shares as of each period end is the same as the weighted average shares outstanding. |
| (11) | The calculation of earnings per ADSs and dividends per ADS for the years indicated is based on the ADS ratio of 1:1. |
| (12) | Dividends are paid from net income as determined in accordance with CMF regulations. See “Item 8.A. Dividend Policy.” For dividends in Ch$, see “Item 8.A. Dividend Policy—Dividends.” |
| (13) | Dividend amount paid per calendar year to shareholders of the Company. See “Item 8.A. Dividend Policy.” |
| (14) | Dividend amounts per share paid in Chilean pesos were Ch$1,310.05 in 2018, Ch$916.32 in 2017, Ch$993.41 in 2016, Ch$316.06 in 2015, and Ch$806.79 in 2014. |
| 2 |
| As of December 31, | ||||||||||||||||||||
| (in millions of US$) | 2018 | 2017 | 2016 | 2015 | 2014 | |||||||||||||||
| Balance sheet data: | ||||||||||||||||||||
| Total assets | 4,268.1 | 4,296.2 | 4,218.0 | 4,643.8 | 4,663.7 | |||||||||||||||
| Total liabilities | 2,130.3 | 2,048.8 | 1,910.8 | 2,243.4 | 2,371.1 | |||||||||||||||
| Total equity | 2,137.8 | 2,247.5 | 2,307.3 | 2,400.4 | 2,292.5 | |||||||||||||||
| Equity attributable to controlling interests | 2,085.5 | 2,187.8 | 2,246.1 | 2,339.8 | 2,232.6 | |||||||||||||||
| Equity attributable to non-controlling interest | 52.3 | 59.6 | 61.2 | 60.6 | 59.9 | |||||||||||||||
| Capital stock | 477.4 | 477.4 | 477.4 | 477.4 | 477.4 | |||||||||||||||
| 3 |
3.B. Capitalization and Indebtedness
Not applicable.
3.C. Reasons for the Offer and Use of Proceeds
Not applicable.
3.D. Risk Factors
Our operations are subject to certain risk factors that may affect SQM’s business, financial condition, cash flows, or results of operations. In addition to other information contained in this Annual Report on Form 20-F, you should carefully consider the risks described below. These risks are not the only ones we face. Additional risks not currently known to us or that are known but that we currently believe are not significant may also affect our business operations. Our business, financial condition, cash flows or results of operations could be materially affected by any of these risks.
Risks Relating to our Business
We could be subject to numerous risks as a result of legal proceedings and deferred prosecution agreements with U.S. and Chilean governmental authorities in relation to certain payments made by SQM between the tax years 2009 and 2015.
In 2015, the Chilean Internal Revenue Service ( Servicio de Impuestos Internos or “SII”) and the Chilean Public Prosecutor brought a number of criminal and administrative proceedings following investigations related to the payment of invoices by SQM and its subsidiaries SQM Salar S.A. (“SQM Salar”) and SQM Industrial S.A., for services that may not have been properly supported or that may not have been necessary to generate corporate income, against (i) Patricio Contesse G., the Company’s former CEO whose employment was terminated in May 2015, (ii) Mr. Contesse and the Company’s then-current CEO, Patricio de Solminihac, as well as the then-current CFO (now CEO), Ricardo Ramos, in their capacities as the Company’s tax representatives and (iii) five then-current and former members of the Company’s Board of Directors. All the claims against Messrs. de Solminihac and Ramos were subsequently dismissed. The lawsuits against Mr. Contesse continue and the five Board members are appealing the fines of approximately US$36,000 imposed on each of them. For a further discussion of these lawsuits, see “Item 8.A.7. Legal Proceedings.”
On October 14, 2015, two class action complaints then pending against the Company, our former CEO and then-current CEO and CFO, alleging violations of the U.S. securities laws in connection with the subject matter of the investigations described above, were consolidated into a single action in the United States District Court for the Southern District of New York. On November 13, 2015, our former CEO and then-current CEO and CFO were voluntarily dismissed from the case without prejudice. On January 15, 2016, the lead plaintiff filed a consolidated class action complaint exclusively against the Company. On January 10, 2018, the lead plaintiff filed a motion to certify a class consisting of all persons who purchased SQM American Depositary Shares (“ADS”) between June 30, 2010 and March 18, 2015, and such motion remains pending before the court. For more information on the consolidated class action, see “Item 8.A.7 Legal Proceedings.”
During 2015, the ad-hoc committee of the Board of Directors (the “ad-hoc Committee”) established in February 2015 to conduct an internal investigation into the matters that were the subject of the SII and Chilean Public Prosecutor investigation also conducted an investigation into whether the Company faced possible liability under the Foreign Corrupt Practices Act (“FCPA"). The ad-hoc Committee engaged its own U.S. separate counsel, which presented a report to the Board of Directors on December 15, 2015.
Following the presentation by the ad-hoc Committee of its findings to the Board of Directors, the Company voluntarily shared the findings of the ad-hoc Committee investigation with authorities in Chile and the U.S. (including the U.S. Securities and Exchange Commission (“SEC”) and the U.S. Department of Justice (“DOJ”)).
| 4 |
On January 13, 2017, the Company and the DOJ reached agreement on the terms of a Deferred Prosecution Agreement (“DPA”) that would resolve the DOJ’s inquiry, based on alleged violations of the books and records and internal controls provisions of the Foreign Corrupt Practices Act. Among other terms, the DPA called for the Company to pay a monetary penalty of US$15,487,500, and engage a compliance monitor for a term of two (2) years. Upon successful completion of the three (3) year term of the DPA, all charges against the Company will be dismissed. On the same date, the SEC agreed to resolve its inquiry through an administrative cease and desist order, arising out of the alleged violations of the same accounting provisions of the FCPA. Among other terms, the SEC order called for the Company to pay an additional monetary penalty of US$15 million.
On January 26, 2018, the Eighth Lower Criminal Court of Santiago approved a deferred prosecution agreement proposed by the Chilean Public Prosecutor relating to SQM and its subsidiaries, SQM Salar and SQM Nitratos S.A., to suspend an investigation against these entities related to potential corruption issues and responsibility for the lack of supervision and management. Under the deferred prosecution agreement, SQM, SQM Salar and SQM Nitratos S.A., have not admitted responsibility in the matter subject to the investigation but agreed to pay an aggregate amount of (i) Ch$900,000,000 to the Chilean government, and (ii) Ch$1,650,000,000 to various charitable organizations. As of January 26, 2018, these amounts were equivalent to approximately US$1.5 million and US$2.8 million, respectively. In addition, the companies have agreed to provide the Chilean Public Prosecutor with a report on the enhancements to their compliance program, implemented in recent years, with special emphasis on the incorporation of best practices in various jurisdictions. On August 17, 2018, the Eighth Lower Criminal Court of Santiago considered the conditions and decided to terminate the legal process. See “Item 8.A.7 Legal Proceedings.”
In the event that the applicable regulatory authorities believe that the terms of the DPA or the deferred prosecution agreement with the Chilean Public Prosecutor are not complied with, it is possible that such regulatory authorities may reinstate the suspended proceedings against us and may bring further action against us, including in the form of additional inquiries or legal proceedings. Responding to our regulators’ inquiries and any future civil, criminal or regulatory inquiries or proceedings diverts our management’s attention from day-to-day operations. Additionally, expenses that may arise from responding to such inquiries or proceedings, our review of responsive materials, any related litigation or other associated activities may continue to be significant. Current and former employees, officers and directors may seek indemnification, advancement or reimbursement of expenses from us, including attorneys’ fees, with respect to the current inquiry or future proceedings related to this matter. The occurrence of any of the foregoing or adverse determination in litigation or other proceedings or similar actions could materially and adversely affect our business, financial condition, cash flows, results of operations and the prices of our securities.
| 5 |
Legal challenges to the amendments of the Lease Agreement and the Project Agreement relating to the Salar de Atacama concession, if successful, or failure to comply with the requirements of either agreement, could have a material adverse effect on our business, financial condition and results of operations.
Our subsidiary SQM Salar S.A. (“SQM Salar”), as leaseholder, holds exclusive and temporary rights over the mineral resources in an area covering approximately 140,000 hectares of land in the Salar de Atacama in northern Chile, of which SQM Salar is entitled to exploit the mineral resources in 81,920 hectares. These rights are owned by Corfo and leased to SQM Salar pursuant to (i) a 1993 lease agreement over mining exploitation concessions between SQM Salar and Corfo, a Chilean government entity (the “Lease Agreement”), and (ii) the Salar de Atacama project agreement between Corfo and SQM Salar (the “Project Agreement”). Corfo may not unilaterally amend the Lease Agreement or the Project Agreement. The Lease Agreement establishes that SQM Salar is responsible for making quarterly lease payments to Corfo, maintaining Corfo’s rights over the mining exploitation concessions, and making annual payments to the Chilean government for such concession rights. The Lease Agreement expires on December 31, 2030. Furthermore, under the regulations of the Chilean Nuclear Energy Commission ( Comisión Chilena de Energía Nuclear or “CCHEN”), we were originally limited to 180,100 tons of total lithium metallic equivalent (958,672 tons of lithium carbonate equivalent) extraction in the aggregate for all periods. On January 17, 2018, Corfo and our subsidiaries SQM Potasio S.A. and SQM Salar reached an agreement (the “Corfo Arbitration Agreement”) to (i) terminate the previously disclosed arbitration proceedings between Corfo and SQM Salar, which, among other things, sought early termination of the Lease Agreement and (ii) amend the Lease Agreement and the Project Agreement. As part of the agreement to amend the Lease Agreement, Corfo authorized an increase of the production and sales of lithium products produced in the Salar de Atacama up to 349,553 metric tons of lithium metallic equivalent (1,860,670 tons of lithium carbonate equivalent), which is in addition to the approximately 64,816 metric tons of lithium metallic equivalent (345,015 tons of lithium carbonate equivalent) remaining from the originally authorized amount. The amendments of the Lease Agreement and the Project Agreement required under Chilean law the issuance of the applicable resolutions of the Office of the Controller General of the Republic ( Contraloría General de la República ) and the CCHEN, which were issued.
Our business is substantially dependent on the exploitation rights under the Lease Agreement and the Project Agreement, since all of our products originating from the Salar de Atacama are derived from our extraction operations under the Lease Agreement. For the year ended December 31, 2018, revenues related to products originating from the Salar de Atacama represented 44% of our consolidated revenues, consisting of revenues from our potassium business line and our lithium and derivatives business line for the period. As of December 31, 2018, only 12 years remain on the term of the Lease Agreement and we had extracted approximately 23% of the total permitted accumulated extraction and sales limit of lithium under the increased lithium extraction and sales limits.
These agreements expire in 2030 and establish a series of obligations with which SQM Salar must comply. A serious failure to comply with these obligations may jeopardize the exploitation rights under the agreements and the continuity of our operations in the Salar de Atacama. While we believe that we have taken the appropriate precautions to ensure compliance with the obligations and conditions in the agreements, there can be no assurance that we will be able to maintain such compliance, which could jeopardize the continued benefits to us of the agreements and could have a material adverse effect on our business, financial condition and results of operations.
On February 15, 2018 and February 16, 2018, the Atacamenos Indigenous Organization ( Consejo de Pueblos Atacamenos ) initiated legal actions challenging the amendments of the Lease Agreement and the Project Agreement. The legal actions are pending before the Supreme Court of Chile. See “Item 8.A.7 Legal Proceedings.”
In the event the amendments to the Lease Agreement and the Project Agreement under the Corfo Arbitration Agreement are successfully challenged, or the CCHEN authorization for the increased extraction is revoked, there can be no assurance that we will not reach the lithium extraction limit referred to above prior to the expiration of the term of the Lease Agreement. In such event, we would then be unable to continue extraction of lithium under the Lease Agreement, which could have a material adverse effect on our business, financial condition and results of operations.
| 6 |
Our market reputation, commercial dealings or the price of our securities could be adversely affected by the negative outcome of certain proceedings against certain former members of our Board and certain other named defendants.
On September 10, 2013, the CMF issued a press release disclosing it had instituted certain administrative proceedings (the “Cascading Companies Proceedings”) against (i) Julio Ponce Lerou (who was the Chairman of the Board and a director of the Company until April 24, 2015), (ii) Patricio Contesse Fica, who was a director of the Company until April 24, 2015 and was later re-elected as a director on April 27, 2018, and is the son of Patricio Contesse González (who was the Company’s CEO until March 16, 2015), and (iii) other named defendants. The Company has been informed that Mr. Ponce and persons related to him beneficially owned 32% of SQM’s total shares as of December 31, 2018. See “Item 6.E. Share Ownership.” The CMF alleged breaches of Chilean corporate and securities laws in connection with acts performed by entities with direct or indirect share ownership interests in SQM (the “Cascading Companies”). The allegations made in connection with the Cascading Companies Proceedings do not relate to the Company’s operations, nor do they relate to any acts or omissions of the Company or any of its directors, officers or employees in their capacities as such.
In connection with the Cascading Companies Proceedings, the CMF alleged the existence of a scheme involving the named defendants whereby, through a number of transactions occurring between 2008 and 2011, the Cascading Companies allegedly sold securities of various companies, at below-market prices to companies related to Mr. Ponce and other named defendants. These companies allegedly subsequently sold such securities after a lapse of time, in most cases back to the Cascading Companies, at prices higher than the purchase price. The CMF alleged violations by the defendants of a number of Chilean corporate and securities laws in furtherance of the alleged scheme.
On January 31, 2014, the CMF added a number of Chilean financial institutions and asset managers, and certain of their controlling persons, executives or other principals, as named defendants to the Cascading Companies Proceedings. On September 2, 2014, the CMF issued a decision imposing an aggregate fine against all of the defendants of UF 4.0 million (approximately US$174 million as of December 31, 2018), including a fine against Mr. Ponce of UF 1.7 million (approximately US$74 million as of December 31, 2018) and a fine against Mr. Contesse Fica of UF 60,000 (approximately US$2.6 million as of December 31, 2018). The defendants are currently challenging the CMF administrative decision before Chilean courts.
The High Complexity Crimes Unit ( Unidad de Delitos de Alta Complejidad ) of the Metropolitan District Central Northern Attorney’s Office ( Fiscalía Metropolitana Centro Norte ) is also investigating various criminal complaints filed against various parties to the Cascading Companies Proceedings. The SII requested payment of taxes by the Cascading Companies, and the Cascading Companies filed a complaint with the tax courts.
If, for any reason, the Company is unable to differentiate itself from the named defendants, such failure could have a material adverse effect on the Company’s market reputation and commercial dealings. Furthermore, we cannot assure you that a non-appealable ruling in connection with the Cascading Companies Proceedings or the investigations of the High Complexity Crimes Unit or the SII that is adverse to Mr. Ponce or Mr. Contesse Fica will not have a material adverse effect on our market reputation, commercial dealings and the price of our securities.
We identified a material weakness in our internal controls over payments directed by the office of the former Chief Executive Officer.
In the past, our management determined that the Company did not maintain effective control over payments directed by the office of the former CEO. This determination was reported in our annual report for the year ended December 31, 2014 on Form 20-F, filed with the SEC on May 18, 2015.
We believe we have taken the necessary steps to remediate the identified material weakness and enhance our internal controls. However, any failure to maintain effective internal control over financial reporting could (i) result in a material misstatement in our financial reporting or financial statements that would not be prevented or detected, (ii) cause us to fail to meet our reporting obligations under applicable securities laws or (iii) cause investors to lose confidence in our financial reporting or financial statements, the occurrence of any of which could materially and adversely affect our business, financial condition, cash flows, results of operations and the prices of our securities.
| 7 |
Volatility of world lithium, fertilizer and other chemical prices and changes in production capacities could affect our business, financial condition and results of operations.
The prices of our products are determined principally by world prices, which, in some cases, have been subject to substantial volatility in recent years. World lithium, fertilizer and other chemical prices constantly vary depending upon the relationship between supply and demand at any given time. Supply and demand dynamics for our products are tied to a certain extent to global economic cycles, and have been impacted by circumstances related to such cycles. Furthermore, the supply of lithium, certain fertilizers or other chemical products, including certain products that we provide, varies principally depending on the production of the major producers, (including us) and their respective business strategies.
World prices of potassium-based fertilizers (including some of our specialty plant nutrients and potassium chloride) fluctuated as a result of the broader global economic and financial conditions. During the second half of 2013, potassium prices declined as a result of an unexpected announcement made by the Russian company Uralkali (“Uralkali”) that it was terminating its participation in Belarus Potash Corporation (“BPC”). As a result of the termination of Uralkali’s participation in BPC, there was increased price competition in the market. In 2018, the average price for our potassium chloride and potassium sulfate business line was approximately 14% higher than in 2017. Our sales volumes for this business line were approximately 38% lower in 2018 compared to 2017. We cannot assure you that potassium-based fertilizer prices and sales volumes will not decline in the future.
Iodine prices followed an upward trend beginning at the end of 2008 and continuing through 2012, reaching an average price of approximately US$53 per kilogram in 2012, over 40% higher than average prices in 2011. During the following years, supply growth outpaced demand growth, causing a decline in iodine prices. We obtained an average price for iodine of approximately US$24 per kilogram in 2018, approximately 23% more than average prices obtained in 2017. We cannot assure you that iodine prices or sales volumes will not continue to decline in the future.
In 2018, lithium demand continued to grow creating tight market conditions and increasing prices by 26% compared to 2017, driven mostly by an increase in demand related to battery use. During the second half of 2018, lithium supply increased, and prices slightly decreased in the fourth quarter. We cannot assure you that lithium prices and sales volumes will not decline in the future.
We expect that prices for the products we manufacture will continue to be influenced, among other things, by worldwide supply and demand and the business strategies of major producers. Some of the major producers (including us) have increased or have the ability to increase production. As a result, the prices of our products may be subject to substantial volatility. High volatility or a substantial decline in the prices or sales volumes of one or more of our products could have a material adverse effect on our business, financial condition and results of operations.
Our sales to emerging markets and expansion strategy expose us to risks related to economic conditions and trends in those countries.
We sell our products in more than 110 countries around the world. In 2018, approximately 34% of our sales were made in emerging market countries: 8% in Latin America (excluding Chile); 8% in Africa and the Middle East (excluding Israel); 8% in Chile and 11% in Asia and Oceania (excluding Australia, Japan, New Zealand, South Korea and Singapore). In note 26.6 of our consolidated financial statements, we reported revenues from Chile, Latin America and the Carribean and Asia and others of US$1.3 billion. We expect to expand our sales in these and other emerging markets in the future. In addition, we may carry out acquisitions or joint ventures in jurisdictions in which we currently do not operate, relating to any of our businesses or to new businesses in which we believe we may have sustainable competitive advantages. The results of our operations and our prospects in other countries in which we establish operations will depend, in part, on the general level of political stability and economic activity and policies in those countries. Future developments in the political systems or economies of these countries or the implementation of future governmental policies in those countries, including the imposition of withholding and other taxes, restrictions on the payment of dividends or repatriation of capital, the imposition of import duties or other restrictions, the imposition of new environmental regulations or price controls or changes in relevant laws or regulations, could have a material adverse effect on our business, financial condition and results of operations in those countries.
| 8 |
Our inventory levels may vary for economic or operational reasons.
In general, economic conditions or operational factors can affect our inventory levels. Higher inventories carry a financial risk due to increased need for cash to fund working capital and could imply increased risk of loss of product. At the same time, lower levels of inventory can hinder the distribution network and process, thus impacting sales volumes. There can be no assurance that inventory levels will remain stable. These factors could have a material adverse effect on our business, financial condition and results of operations.
Our measures to minimize our exposure to bad debt may not be effective and a significant increase in our accounts receivable coupled with the financial condition of customers may result in losses that could have a material adverse effect on our business, financial condition and results of operations.
Potentially negative effects of global economic conditions on the financial condition of our customers may include the extension of the payment terms of our accounts receivable and may increase our exposure to bad debt. While we have implemented certain safeguards, such as using credit insurance, letters of credit and prepayment for a portion of sales, to minimize the risk, we cannot assure you that such safeguards will be effective and a significant increase in our accounts receivable coupled with the financial condition of customers may result in losses that could have a material adverse effect on our business, financial condition and results of operations.
New production of iodine or lithium from current or new competitors in the markets in which we operate could adversely affect prices.
In recent years, new and existing competitors have increased the supply of iodine and lithium, which has affected prices for both products. Further production increases could negatively impact prices. There is limited information on the status of new iodine or lithium production capacity expansion projects being developed by current and potential competitors and, as such, we cannot make accurate projections regarding the capacities of possible new entrants into the market and the dates on which they could become operational. If these potential projects are completed in the short term, they could adversely affect market prices and our market share, which, in turn, could have a material adverse effect on our business, financial condition and results of operations.
We have a capital expenditure program that is subject to significant risks and uncertainties.
Our business is capital intensive. Specifically, the exploration and exploitation of reserves, mining and processing costs, the maintenance of machinery and equipment and compliance with applicable laws and regulations require substantial capital expenditures. We must continue to invest capital to maintain or to increase our exploitation levels and the amount of finished products we produce.
In addition, we require environmental permits for our new projects. Obtaining permits in certain cases may cause significant delays in the execution and implementation of new projects and, consequently, may require us to reassess the related risks and economic incentives. We cannot assure you that we will be able to maintain our production levels or generate sufficient cash flow, or that we will have access to sufficient investments, loans or other financing alternatives, to continue our activities at or above present levels, or that we will be able to implement our projects or receive the necessary permits required for them in time. Any or all of these factors may have a material adverse effect on our business, financial condition and results of operations.
| 9 |
High raw materials and energy prices could increase our production costs and cost of sales, and energy may become unavailable at any price.
We rely on certain raw materials and various energy sources (diesel, electricity, liquefied natural gas, fuel oil and others) to manufacture our products. Purchases of energy and raw materials we do not produce constitute an important part of our cost of sales, approximately 14% in 2018. In addition, we may not be able to obtain energy at any price if supplies are curtailed or otherwise become unavailable. To the extent we are unable to pass on increases in the prices of energy and raw materials to our customers or we are unable to obtain energy, our business, financial condition and results of operations could be materially adversely affected.
Our reserve estimates are internally prepared and not subject to review by external geologists or an external auditing firm and could be subject to significant changes, which may have a material adverse effect on our business, financial condition and results of operations.
Our caliche ore mining reserve estimates and our Salar de Atacama brine mining reserve estimates are prepared by our own geologists and hydrogeologists and are not subject to review by external geologists or an external auditing firm. Estimation methods involve numerous uncertainties as to the quantity and quality of the reserves, and reserve estimates could change upwards or downwards. A downward change in the quantity and/or quality of our reserves could affect future volumes and costs of production and therefore have a material adverse effect on our business, financial condition and results of operations.
Quality standards in markets in which we sell our products could become stricter over time.
In the markets in which we do business, customers may impose quality standards on our products and/or governments may enact stricter regulations for the distribution and/or use of our products. As a result, if we cannot meet such new standards or regulations, we may not be able to sell our products. In addition, our cost of production may increase in order to meet any such newly imposed or enacted standards or regulations. Failure to sell our products in one or more markets or to important customers could materially adversely affect our business, financial condition and results of operations.
Chemical and physical properties of our products could adversely affect their commercialization.
Since our products are derived from natural resources, they contain inorganic impurities that may not meet certain customer or government standards. As a result, we may not be able to sell our products if we cannot meet such requirements. In addition, our cost of production may increase in order to meet such standards. Failure to meet such standards could materially adversely affect our business, financial condition and results of operations if we are unable to sell our products in one or more markets or to important customers in such markets.
Our business is subject to many operating and other risks for which we may not be fully covered under our insurance policies.
Our facilities and business operations in Chile and abroad are insured against losses, damage or other risks by insurance policies that are standard for the industry and that would reasonably be expected to be sufficient by prudent and experienced persons engaged in businesses similar to ours.
We may be subject to certain events that may not be covered under our insurance policies, which could have a material adverse effect on our business, financial condition and results of operations. Additionally, as a result of major earthquakes and unexpected rains and flooding in Chile, as well as other natural disasters worldwide, conditions in the insurance market have changed and may continue to change in the future, and as a result, we may face higher premiums and reduced coverage, which could have a material adverse effect on our business, financial condition and results of operations.
| 10 |
Changes in technology or other developments could result in preferences for substitute products.
Our products, particularly iodine, lithium and their derivatives, are preferred raw materials for certain industrial applications, such as rechargeable batteries and liquid-crystal displays (LCDs). Changes in technology, the development of substitute products or other developments could adversely affect demand for these and other products which we produce. In addition, other alternatives to our products may become more economically attractive as global commodity prices shift. Any of these events could have a material adverse effect on our business, financial condition and results of operations.
We are exposed to labor strikes and labor liabilities that could impact our production levels and costs.
Over 93% of our employees are employed in Chile, of which approximately 65% were represented by 22 labor unions as of December 31, 2018. As in past years, we renegotiated collective bargaining agreements with 14 unions, achieving the anticipated renegotiation of 17 collective bargaining agreements by December 31, 2018, one year before the expiration of the agreements. The 17 collective bargaining agreements were renegotiated for the next three years as of that date. We are exposed to labor strikes and illegal work stoppages that could impact our production levels. If a strike or illegal work stoppage occurs and continues for a sustained period of time, we could be faced with increased costs and even disruption in our product flow that could have a material adverse effect on our business, financial condition and results of operations.
Chilean Law No. 20,123, known as the Subcontracting Law, provides that when a serious workplace accident occurs, the company in charge of the workplace must halt work at the site where the accident took place until authorities from either the National Geology and Mining Service ( Servicio Nacional de Geología y Minería or “Sernageomin”), the Labor Board ( Dirección del Trabajo or “Labor Board”), or the National Health Service ( Servicio Nacional de Salud ), inspect the site and prescribe the measures such company must take to minimize the risk of similar accidents taking place in the future. Work may not be resumed until the applicable company has taken the prescribed measures, and the period of time before work may be resumed may last for a number of hours, days, or longer. The effects of this law could have a material adverse effect on our business, financial condition and results of operations.
On September 8, 2016, Chilean Law No. 20,940 was published and modified the Labor Code by introducing, among other things, changes to the formation of trade unions, the election of inter-company union delegates, the presence of women on union boards, anti-union practices and related sanctions, and collective negotiations. Due to these changes to the labor regulations, we may face an increase in our expenses that may have a significant adverse effect on our business, financial condition, and results of operations.
Lawsuits and arbitrations could adversely impact us.
We are party to a range of lawsuits and arbitrations involving different matters as described in Note 22.1 of our Consolidated Financial Statements and “Item 8.A. Legal Proceedings.” Although we intend to defend our positions vigorously, our defense of these actions may not be successful and responding to such lawsuits and arbitrations diverts our management’s attention from day-to-day operations. Adverse judgments or settlements in these lawsuits may have a material adverse effect on our business, financial condition and results of operations. In addition, our strategy of being a world leader includes entering into commercial and production alliances, joint ventures and acquisitions to improve our global competitive position. As these operations increase in complexity and are carried out in different jurisdictions, we may be subject to legal proceedings that, if settled against us, could have a material adverse effect on our business, financial condition and results of operations.
| 11 |
We have operations in multiple jurisdictions with differing regulatory, tax and other regimes.
We operate in multiple jurisdictions with complex regulatory environments that are subject to different interpretations by companies and respective governmental authorities. These jurisdictions may have different tax codes, environmental regulations, labor codes and legal framework, which adds complexity to our compliance with these regulations. Any failure to comply with such regulations could have a material adverse effect on our business, financial condition and results of operations.
Environmental laws and regulations could expose us to higher costs, liabilities, claims and failure to meet current and future production targets.
Our operations in Chile are subject to national and local regulations relating to environmental protection. In accordance with such regulations, we are required to conduct environmental impact studies or statements before we conduct any new projects or activities or significant modifications of existing projects that could impact the environment or the health of people in the surrounding areas. We are also required to obtain an environmental license for certain projects and activities. The Environmental Evaluation Service ( Servicio de Evaluación Ambiental ) evaluates environmental impact studies submitted for its approval. The public, government agencies or local authorities may review and challenge projects that may adversely affect the environment, either before these projects are executed or once they are operating, if they fail to comply with applicable regulations. In order to ensure compliance with environmental regulations, Chilean authorities may impose fines up to approximately US$9 million per infraction, revoke environmental permits or temporarily or permanently close facilities, among other enforcement measures.
Chilean environmental regulations have become increasingly stringent in recent years, both with respect to the approval of new projects and in connection with the implementation and development of projects already approved, and we believe that this trend is likely to continue. Given public interest in environmental enforcement matters, these regulations or their application may also be subject to political considerations that are beyond our control.
We regularly monitor the impact of our operations on the environment and on the health of people in the surrounding areas and have, from time to time, made modifications to our facilities to minimize any adverse impact. Future developments in the creation or implementation of environmental requirements or their interpretation could result in substantially increased capital, operation or compliance costs or otherwise adversely affect our business, financial condition and results of operations.
The success of our current investments at the Salar de Atacama and Nueva Victoria is dependent on the behavior of the ecosystem variables being monitored over time. If the behavior of these variables in future years does not meet environmental requirements, our operation may be subject to important restrictions by the authorities on the maximum allowable amounts of brine and water extraction. For example, on December 13, 2017, the First Environmental Court of Antofagasta ordered the temporary and partial closure of certain water extraction wells located in the Salar de Llamara. These wells allow the Company to extract approximately 124 liters per second of water, almost 15% of the water used in the Company´s operations in the First Region of Chile for iodine and nitrate production. In October 2018, the First Environmental Court of Antofagasta, accepted the Company’s claim, and dismissed the restrictions without prejudice. It is possible that third parties could seek to reinstate these restrictions in the future.
Our future development depends on our ability to sustain future production levels, which requires additional investments and the submission of the corresponding environmental impact studies or statements. If we fail to obtain approval or required environmental licenses, our ability to maintain production at specified levels will be seriously impaired, thus having a material adverse effect on our business, financial condition and results of operations.
| 12 |
In addition, our worldwide operations are subject to international and other local environmental regulations. Since environmental laws and regulations in the different jurisdictions in which we operate may change, we cannot guarantee that future environmental laws, or changes to existing environmental laws, will not materially adversely impact our business, financial condition and results of operations.
Our water supply could be affected by geological changes or climate change.
Our access to water may be impacted by changes in geology, climate change or other natural factors, such as wells drying up or reductions in the amount of water available in the wells or rivers from which we obtain water, that we cannot control. Any such change may have a material adverse effect on our business, financial condition and results of operations.
Any loss of key personnel may materially and adversely affect our business.
Our success depends in large part on the skills, experience and efforts of our senior management team and other key personnel. The loss of the services of key members of our senior management or employees with critical skills could have a negative effect on our business, financial condition and results of operations. If we are not able to attract or retain highly skilled, talented and qualified senior managers or other key personnel, our ability to fully implement our business objectives may be materially and adversely affected.
A significant percentage of our shares are held by two principal shareholder groups who may have interests that are different from that of other shareholders and of each other. Any change in such principal shareholder groups may result in a change of control of the Company or of its Board of Directors or its management, which may have a material adverse effect on our business, financial condition and results of operations.
As of December 5, 2018, two principal shareholder groups held in the aggregate 55.77% of the total outstanding shares of SQM, including a majority of our Series A common shares, and have the power to elect seven of our eight directors. The interests of the two principal shareholder groups may in some cases differ from those of other shareholders and of each other.
One principal shareholder group is the Pampa Group, as defined in “Item 7.A. Major Shareholders”, which currently owns 32% of the total outstanding shares of SQM. Until November 30, 2 018, the CMF considered the Pampa Group the controller of SQM. On this date, the CMF determined that in accordance with the distribution of the shares of SQM, “the Pampa Group does not exert decisive power over the management of the Company, and is therefore not considered a controlling shareholder”. The CMF could change its decision in the future if circumstances change. See “Item 7.A. Major Shareholders”.
Nutrien (formerly PCS before the merger with Agrium Inc. on January 1, 2018) was one of the principal shareholders of the Company. On June 1, 2018, Nutrien sold its Series B shares of SQM, representing 7.66% of the total shares of SQM, held through Inversiones El Boldo Limitada, Inversiones PCS Chile Limitada and Inversiones RAC Chile, in a bookbuild auction process (subasta de libro de ordenes) on the Santiago Stock Exchange..On December 5, 2018, Inversiones TLC SpA, a subsidiary of Tianqi Lithium Corporation (“Tianqi”), acquired the Series A shares of SQM held by Nutrien through Inversiones El Boldo Limitada, Inversiones PCS Chile Limitada and Inversiones RAC Chile, representing 23.77% of the total shares of SQM. Tianqi currently owns 23.77% of the total outstanding shares of SQM.
The divestiture by the Pampa Group or Tianqi, or potential changes in the circumstances that have led to the determination of the CMF related to the controller status of the shareholders of the Company, or a combination thereof, may have a material adverse effect on our business, financial condition and results of operations.
| 13 |
Tianqi is a significant shareholder and a competitor of the Company, which can increase the risks of competition.
Tianqi is a competitor in the lithium business, and as a result of the number of shares that its owns of the Company, it has the right to choose up to three Board members. Under Chilean law, the Company is restricted in its ability to decline to provide information about the Company, which may include competitively sensitive information, to a director of the Company. On August 27, 2018, Tianqi and the Chilean antitrust regulator (the Chilean National Economic Prosecutor’s Office, or FNE for its initials in Spanish), entered into an extrajudicial settlement agreement, under which certain restrictive measures in order to (i) maintain the competitive conditions of the lithium market, (ii) mitigate the risks described in the agreement and (iii) limit Tianqi’s access to certain information of the Company and its subsidiaries, which are defined as “sensitive information” under the agreement, were implemented.
During the approval process of the extrajudicial agreement before the FNE, the Company expressed its concerns regarding the measures contained in the extrajudicial agreement since (i) it could not effectively resolve the risks that Tianqi and the FNE have sought to mitigate, (ii) they are not correctly oriented to avoid the access to the Company’s “sensitive information” that, in the possession of a competitor, could harm the Company and the proper functioning of the market and (iii) it could contradict the Corporation Law in Chile.
The presence of a shareholder which is at the same time a competitor of the Company and the right of this competitor to choose Board members could generate risks to free competition and/or increase the risks of an investigation of free competition against the Company, whether in Chile or in other countries, all of which could have an adverse material effect in our business.
Our information technology systems may be vulnerable to disruption which could place our systems at risk from data loss, operational failure, or compromise of confidential information.
We rely on various computer and information technology systems, and on third party developers and contractors, in connection with our operations, including two networks that link our principal subsidiaries to our operating and administrative facilities in Chile and other parts of the world and ERP software systems, which are used mainly for accounting, monitoring of supplies and inventories, billing, quality control, research activities, and production process and maintenance control. In addition, we use Cloud technologies to support new business processes related to the Internet of Things (IoT) and Advanced Analytics, which allow us to collect information enabling us to advance the predictive short-term and medium-term analysis of our production process and its possible automation in the long term. Our information technology systems are susceptible to disruption, damage or failure from a variety of sources, including errors by employees or contractors, computer viruses, cyber-attacks, misappropriation of data by outside parties, and various other threats. We have taken certain measures to identify and mitigate these risks, including conducting a cybersecurity review and initiating process automation and digitalization projects at various sites with the object of reducing operational risk and improving security and operational efficiency, which also includes modernization of existing information technology infrastructure and communications systems. However, we cannot guarantee that due to the increasing sophistication of cyber-attacks our systems will not be compromised and because we do not maintain specialized cybersecurity insurance, our insurance coverage for protection against cybersecurity risk may not be sufficient. Cybersecurity breaches could result in losses of assets or production, operational delays, equipment failure, inaccurate recordkeeping, or disclosure of confidential information, any of which could result in business interruption, reputational damage, lost revenue, litigation, penalties or additional expenses and could have a material adverse effect on our business, financial condition and results of operations.
| 14 |
Risks Relating to Financial Markets
Currency fluctuations may have a negative effect on our financial performance.
We transact a significant portion of our business in U.S. dollars, and the U.S. dollar is the currency of the primary economic environment in which we operate. In addition, the U.S. dollar is our functional currency for financial statement reporting purposes. A significant portion of our costs, however, is related to the Chilean peso. Therefore, an increase or decrease in the exchange rate between the Chilean peso and the U.S. dollar would affect our costs of production. The Chilean peso has been subject to large devaluations and revaluations in the past and may be subject to significant fluctuations in the future. As of December 31, 2018, the Chilean peso exchange rate was Ch$694.77 per U.S. dollar, while as of December 31, 2017, the Chilean peso exchange rate was Ch$614.75 per U.S. dollar. The Chilean peso therefore depreciated against the U.S. dollar by 13.0% in 2018. As of April 1, 2019, the Observed Exchange Rate was Ch$678.53 per U.S. dollar.
As an international company operating in several other countries, we also transact business and have assets and liabilities in other non-U.S. dollar currencies, such as, among others, the Euro, the South African rand, the Mexican peso, the Chinese yuan, the Thai baht and the Brazilian real. As a result, fluctuations in the exchange rates of such foreign currencies to the U.S. dollar may have a material adverse effect on our business, financial condition and results of operations.
Interest rate fluctuations may have a material impact on our financial performance
As of December 31, 2018, we had US$70 million of outstanding short and long-term debt bearing interest based on LIBOR. A relative increase in the rate could materially impact our business, financial condition and results of operations.
We may be subject to risks associated with the discontinuation, reform or replacement of benchmark indices.
Interest rate, foreign exchange rate and other types of indices which are deemed to be “benchmarks” are the subject of increased regulatory scrutiny and may be discontinued, reformed or replaced. For example, in 2017, the U.K. Financial Conduct Authority announced that it will no longer persuade or compel banks to submit rates for the calculation of the London interbank offered rate (“LIBOR”) benchmark after 2021. This announcement indicates that the continuation of LIBOR on the current basis cannot and will not be guaranteed after 2021, and it appears likely that LIBOR will be discontinued or modified by 2021. This and other reforms may cause benchmarks to be different than they have been in the past, or to disappear entirely, or have other consequences which cannot be fully anticipated which introduces a number of risks for our business. These risks include (i) legal risks arising from potential changes required to document new and existing transactions; (ii) financial risks arising from any changes in the valuation of financial instruments linked to benchmark rates; (iii) pricing risks arising from how changes to benchmark indices could impact pricing mechanisms on some instruments; (iv) operational risks arising from the potential requirement to adapt IT systems, trade reporting infrastructure and operational processes;] and (v) conduct risks arising from the potential impact of communication with customers and engagement during the transition period. The replacement benchmarks, and the timing of and mechanisms for implementation have not yet been confirmed by central banks. Although as of December 31, 2018 we had approximately US$70 million short- and long-term debt that use a LIBOR benchmark, it is not currently possible to determine whether, or to what extent, any such changes would affect us. However, the discontinuation or reformation of existing benchmark rates or the implementation of alternative benchmark rates may have a material adverse effect on our business, results of operations, financial condition and prospects.
| 15 |
Risks Relating to Chile
As we are a company based in Chile, we are exposed to Chilean political risks.
Our business, results of operations, financial condition and prospects could be affected by changes in policies of the Chilean government, other political developments in or affecting Chile, legal changes in the standards or administrative practices of Chilean authorities or the interpretation of such standards and practices, over which we have no control.
Changes in regulations regarding, or any revocation or suspension of our concessions could negatively affect our business.
Any changes to regulations to which we are subject or adverse changes to our concession rights, or a revocation or suspension of our concessions, could have a material adverse effect on our business, financial condition and results of operations.
Changes in mining or port concessions could affect our operating costs.
We conduct our mining operations, including brine extraction, under exploitation and exploration concessions granted in accordance with provisions of the Chilean constitution and related laws and statutes. Our exploitation concessions essentially grant a perpetual right (with the exception of the rights granted to SQM Salar with respect to the Salar de Atacama concessions under the Lease Agreement described above, which expires in 2030) to conduct mining operations in the areas covered by the concessions, provided that we pay annual concession fees. Our exploration concessions permit us to explore for mineral resources on the land covered thereby for a specified period of time and to subsequently request a corresponding exploitation concession.
We also operate port facilities at Tocopilla, Chile, for the shipment of products and the delivery of raw materials pursuant to maritime concessions, which have been granted under applicable Chilean laws and are normally renewable on application, provided that such facilities are used as authorized and annual concession fees are paid.
Any significant adverse changes to any of these concessions could have a material adverse effect on our business, financial condition and results of operations.
Changes in water rights laws and other regulations could affect our operating costs.
We hold water use rights that are key to our operations. These rights were obtained from the Chilean Water Authority ( Dirección General de Aguas ) for supply of water from rivers and wells near our production facilities, which we believe are sufficient to meet current operating requirements. However, the Chilean Water Rights Code ( Código de Aguas or the “Water Code”) is subject to changes, which could have a material adverse impact on our business, financial condition and results of operations. For example, a series of bills are currently being discussed at the Chilean National Congress that seek to desalinate seawater for use in mining production processes, amend the Mining Code for water use in mining operations, amend the Political Constitution on water and introduce changes to the regulatory framework governing the terms of inspection and sanction of water. As a result, the amount of water that we can actually use under our existing rights may be reduced or the cost of such use could increase. These and potential future changes to the Water Code or other relevant regulations could have a material adverse effect on our business, financial condition and results of operations.
The Chilean government could levy additional taxes on corporations operating in Chile.
In Chile, there is a royalty tax that is applied to mining activities developed in the country.
| 16 |
On September 29, 2014, Law No. 20,780 was published (as amended by Law No. 20,899, the “Tax Reform”), introducing significant changes to the Chilean taxation system and strengthening the powers of the SII to control and prevent tax avoidance. Subsequently, on February 8, 2016, Law No. 20,899 that simplifies the income tax system and modifies other legal tax provisions was published. As a result of these reforms, open stock corporations like SQM are subject to the partially integrated shareholder tax regime ( sistema parcialmente integrado ). The corporate tax rate applicable to us increased to 25.5% in 2017 and increased to the maximum rate of 27% in 2018.
Under the partially integrated shareholder taxation regime, shareholders bear the tax on dividends upon payment, but they will only be permitted to credit against such shareholder taxes a portion of the Chilean corporate tax paid by us on our earnings, unless the shareholder is resident in a country with a tax treaty in force with Chile. In that case, 100% of the Chilean corporate tax paid by us may be credited against the final taxes at the shareholder level.
As a result, foreign shareholders resident in a non-treaty jurisdiction will be subject to a higher effective tax rate than residents of treaty jurisdictions. There is a temporary rule in effect from January 1, 2017 through December 31, 2019 that treaty jurisdictions for this purpose will include jurisdictions with tax treaties signed with Chile prior to January 1, 2017, whether or not such treaties are in force. This is currently the status of the treaty signed between Chile and United States. After December 31, 2019, if no treaty is in effect, shareholders in those jurisdictions will be subject to a higher effective tax rate.
The Tax Reform tax increase prompted a US$52.3 million increase in our deferred tax liabilities as of December 31, 2014. In accordance with IAS 12, the effects generated by the change in the income tax rate approved by the Tax Reform on income and deferred taxes were applied to the income statement. For purposes of the Company’s statutory consolidated financial statements filed with the CMF, in accordance with the instructions issued by the CMF in its circular 856 of October 17, 2014, the effects generated by the change in the income tax rate were accounted for as retained earnings. The amount charged to equity as of December 31, 2014 was US$52.3 million, thereby giving rise to a difference of US$52.3 million in profit for the year and income tax expense as presented in the Company’s 2014 audited consolidated financial statements in its annual report on Form 20-F compared with profit and income tax expense as presented in the Company’s 2014 statutory consolidated financial statements filed with the CMF.
In addition, in August 2018, a tax reform bill was presented in the Chilean congress, which proposes to reverse the current coexistence of two alternative tax regimes established in the Tax Reform by going back to a fully integrated system with a 100% credit of the corporate tax against individual or foreign entity taxes. Additionally, this tax reform bill seeks to modernize and provide more certainty with respect to the current tax system. For example, the bill proposes to modernize the current ledgers system and to include tax deductions for certain ordinary course business disbursements that are a part of, but not directly associated with, an entity’s primary business activities. As currently proposed, we do not expect any material adverse effect on our business from this reform bill. However, we cannot offer any assurance that there will not be additional changes made to the tax bill that would negatively affect our business, results of operations or financial condition.
In addition, the Tax Reform may have other material adverse effects on our business, financial condition and results of operations. Likewise, we cannot assure you that the manner in which the Royalty Law (as defined below) or the corporate tax rate are interpreted and applied will not change in the future. The Chilean government may decide to levy additional taxes on mining companies or other corporations in Chile. Such changes could have a material adverse effect on our business, financial condition and results of operations.
Ratification of the International Labor Organization’s Convention 169 concerning indigenous and tribal peoples might affect our development plans.
Chile, a member of the International Labor Organization (“ILO”), has ratified the ILO’s Convention 169 (the “Indigenous Rights Convention”) concerning indigenous and tribal people. The Indigenous Rights Convention established several rights for indigenous people and communities. Among other rights, the Indigenous Rights Convention states that (i) indigenous groups should be notified and consulted prior to the development of any project on land deemed indigenous, although veto rights are not mentioned, and (ii) indigenous groups have, to the extent possible, a stake in benefits resulting from the exploitation of natural resources in indigenous land. The extent of these benefits has not been defined by the Chilean government. The Chilean government has addressed item (i) above through Supreme Decree No. 66, issued by the Social Development Ministry. This decree requires government entities to consult indigenous groups that may be directly affected by the adoption of legislative or administrative measures, and it also defines criteria for the projects or activities that must be reviewed through the environmental evaluation system that also require such consultation. To the extent that the new rights outlined in the Indigenous Rights Convention become laws or regulations in Chile, judicial interpretations of the convention of those laws or regulations could affect the development of our investment projects in lands that have been defined as indigenous, which could have a material adverse effect on our business, financial condition and results of operations. The Chilean Supreme Court has consistently held that consultation processes must be carried out in the manner prescribed by Indigenous Rights Convention.
| 17 |
The consultation process may cause delays in obtaining regulatory approvals, including environmental permits, as well as public opposition by local and/or international political, environmental and ethnic groups, particularly in environmentally sensitive areas or in areas inhabited by indigenous populations. Furthermore, the omission of the consultation process when required by law may result in the revocation or annulment of regulatory approvals, including environmental permits already granted.
Consequently, operating projects may be affected since the omission of the consultation process, when required by law, could lead to public law annulment actions pursuing the annulment of the environmental permits granted.
However, this risk frequently arises during the environmental assessment phase when the environmental permits are to be obtained. In such scenario, affected parties may take several legal actions to declare null or void the environmental permits that omitted the consultation process, and in some cases courts have overturned environmental approvals in which consultation was not made as prescribed in the Indigenous Rights Convention.
We are subject to Chilean and international anti-corruption, anti-bribery, anti-money laundering and international trade laws. Failure to comply with these laws could adversely impact our business and operations.
We are required to be in compliance with all applicable laws and regulations in Chile and internationally with respect to anti-corruption, anti-money laundering, receipt of stolen property, sanctions and other regulatory matters, including the FCPA. Although we and our subsidiaries maintain policies and processes intended to comply with these laws, we cannot ensure that these compliance policies and processes will prevent intentional, reckless or negligent acts committed by our officers or employees.
If we or our subsidiaries fail to comply with any applicable anti-corruption, anti-bribery, receipt of stolen property or anti-money laundering laws, we and our officers and employees may be subject to criminal, administrative or civil penalties and other remedial measures, which could have material adverse effects on our and our subsidiaries’ business, financial condition and results of operations. Any investigation of potential violations of anti-corruption, anti-bribery or anti-money laundering laws by governmental authorities in Chile or other jurisdictions could result in an inability to prepare our consolidated financial statements in a timely manner. This could adversely impact our reputation, ability to access the financial markets and ability to obtain contracts, assignments, permits and other government authorizations necessary to participate in our and our subsidiaries’ industry, which, in turn, could have adverse effects on our and our subsidiaries’ business, results of operations and financial condition.
Chile has different corporate disclosure and accounting standards than those you may be familiar with in the United States.
Accounting, financial reporting and securities disclosure requirements in Chile differ in certain significant respects from those required in the United States. Accordingly, the information about us available to you will not be the same as the information available to holders of notes issued by a U.S. company. In addition, although Chilean law imposes restrictions on insider trading and price manipulation, applicable Chilean laws are different from those in the United States, and the Chilean securities markets are not as highly regulated and supervised as the U.S. securities markets.
| 18 |
Chile is located in a seismically active region.
Chile is prone to earthquakes because it is located along major fault lines. The most recent major earthquakes in Chile, which occurred in April 2017 in the Valparaiso region and in December 2016 in Chiloe Island, had a magnitude of 6.9 and 7.6, respectively, on the Richter scale. There were also earthquakes in 2015, 2014 and 2010 that caused substantial damage to some areas of the country. Chile has also experienced volcanic activity. A major earthquake or a volcanic eruption could have significant negative consequences for our operations and for the general infrastructure, such as roads, rail, and access to goods, in Chile. Although we maintain industry standard insurance policies that include earthquake coverage, we cannot assure you that a future seismic or volcanic event will not have a material adverse effect on our business, financial condition and results of operations.
Risks Relating to our Shares and to our ADSs
The price of our ADSs and the U.S. dollar value of any dividends will be affected by fluctuations in the U.S. dollar/Chilean peso exchange rate.
Chilean trading in the shares underlying our ADSs is conducted in Chilean pesos. The depositary will receive cash distributions that we make with respect to the shares in Chilean pesos. The depositary will convert such Chilean pesos to U.S. dollars at the then prevailing exchange rate to make dividend and other distribution payments in respect of ADSs. If the value of the Chilean peso falls relative to the U.S. dollar, the value of the ADSs and any distributions to be received from the depositary will decrease.
Developments in other emerging markets could materially affect the value of our ADSs and our shares.
The Chilean financial and securities markets are, to varying degrees, influenced by economic and market conditions in other emerging market countries or regions of the world. Although economic conditions are different in each country or region, investor reaction to developments in one country or region can have significant effects on the securities of issuers in other countries and regions, including Chile and Latin America. Events in other parts of the world may have a material effect on Chilean financial and securities markets and on the value of our ADSs and our shares.
The volatility and low liquidity of the Chilean securities markets could affect the ability of our shareholders to sell our ADSs.
The Chilean securities markets are substantially smaller, less liquid and more volatile than the major securities markets in the United States. The volatility and low liquidity of the Chilean markets could increase the price volatility of our ADSs and may impair the ability of a holder to sell our ADSs into the Chilean market in the amount and at the price and time the holder wishes to do so.
Our share or ADS price may react negatively to future acquisitions and investments.
As world leaders in our core businesses, part of our strategy is to look for opportunities that will allow us to consolidate and strengthen our competitive position in jurisdictions in which we currently do not operate. Pursuant to this strategy, we may carry out acquisitions or joint ventures relating to any of our businesses or to new businesses in which we believe we may have sustainable competitive advantages. Depending on our capital structure at the time of such acquisitions or joint ventures, we may need to raise significant debt and/or equity which will affect our financial condition and future cash flows. Any change in our financial condition could affect our results of operations, negatively impacting our share or ADS price.
| 19 |
ADS holders may be unable to enforce rights under U.S. securities laws.
Because we are a Chilean company subject to Chilean law, the rights of our shareholders may differ from the rights of shareholders in companies incorporated in the United States, and ADS holders may not be able to enforce or may have difficulty enforcing rights currently in effect under U.S. federal or state securities laws.
Our Company is an open stock corporation incorporated under the laws of the Republic of Chile. Most of our directors and officers reside outside the United States, principally in Chile. All or a substantial portion of the assets of these persons are located outside the United States. As a result, if any of our shareholders, including holders of our ADSs, were to bring a lawsuit against our officers or directors in the United States, it may be difficult for them to effect service of legal process within the United States upon these persons. Likewise, it may be difficult for them to enforce judgments obtained in United States courts based upon the civil liability provisions of the federal securities laws in the United States against them in the United States.
In addition, there is no treaty between the United States and Chile providing for the reciprocal enforcement of foreign judgments. However, Chilean courts have enforced judgments rendered in the United States, provided that the Chilean court finds that the United States court respected basic principles of due process and public policy. Nevertheless, there is doubt as to whether an action could be brought successfully in Chile in the first instance on the basis of liability based solely upon the civil liability provisions of the United States federal securities laws.
As preemptive rights may be unavailable for our ADS holders, they have the risk of their holdings being diluted if we issue new stock.
Chilean laws require companies to offer their shareholders preemptive rights whenever issuing new shares of capital stock so shareholders can maintain their existing ownership percentage in a company. If we increase our capital by issuing new shares, a holder may subscribe for up to the number of shares that would prevent dilution of the holder’s ownership interest.
If we issue preemptive rights, United States holders of ADSs would not be able to exercise their rights unless a registration statement under the Securities Act were effective with respect to such rights and the shares issuable upon exercise of such rights or an exemption from registration were available. We cannot assure holders of ADSs that we will file a registration statement or that an exemption from registration will be available. We may, in our absolute discretion, decide not to prepare and file such a registration statement. If our holders were unable to exercise their preemptive rights because we did not file a registration statement, the depositary bank would attempt to sell their rights and distribute the net proceeds from the sale to them, after deducting the depositary’s fees and expenses. If the depositary could not sell the rights, they would expire and holders of ADSs would not realize any value from them. In either case, ADS holders’ equity interests in us would be diluted in proportion to the increase in our capital stock.
If we were classified as a Passive Foreign Investment Company by the U.S. Internal Revenue Service, there could be adverse consequences for U.S. investors.
We believe that we were not classified as a Passive Foreign Investment Company (“PFIC”) for 2018. Characterization as a PFIC could result in adverse U.S. tax consequences to you if you are a U.S. investor in our shares or ADSs. For example, if we (or any of our subsidiaries) are a PFIC, our U.S. investors may become subject to increased tax liabilities under U.S. tax laws and regulations and will become subject to burdensome reporting requirements. The determination of whether or not we (or any of our subsidiaries or portfolio companies) are a PFIC is made on an annual basis and will depend on the composition of our (or their) income and assets from time to time. See “Item 10.E. Taxation—Material United States Tax Considerations.”
| 20 |
Changes in Chilean tax regulations could have adverse consequences for U.S. investors.
Currently cash dividends paid by us to foreign shareholders are subject to a 35% Chilean withholding tax. When the Company pays a corporate income tax on the income from which the dividend is paid, known as a “First Category Tax”, a credit for the full amount of the First Category Tax effectively reduces the rate of Withholding Tax. Changes in Chilean tax regulations could have adverse consequences for U.S. investors. See “Item 3.D. Risk Factors—Risks Relating to Chile—The Chilean Government Could Levy Additional Taxes on Corporations Operating in Chile” and “Item 10.E. Taxation—Material Chilean Tax Considerations.”
| ITEM 4. | INFORMATION ON THE COMPANY |
4.A. History and Development of the Company
Historical Background
Sociedad Química y Minera de Chile S.A. is an open stock corporation organized under the laws of the Republic of Chile. We were constituted by public deed issued on June 17, 1968 by the Notary Public of Santiago, Mr. Sergio Rodríguez Garcés. Our existence was approved by Decree No. 1,164 of June 22, 1968 of the Ministry of Finance, and we were registered on June 29, 1968 in the Registry of Commerce of Santiago, on page 4,537 No. 1,992. Our headquarters is located at El Trovador 4285, Fl. 6, Las Condes, Santiago, Chile. Our telephone number is +56 2 2425-2000. We are legally referred to by our full name Sociedad Química y Minera de Chile S.A. as well as commercially by the abbreviated name “SQM.”
Commercial exploitation of the caliche ore deposits in northern Chile began in the 1830s, when sodium nitrate was extracted from the ore for use in the manufacturing of explosives and fertilizers. By the end of the nineteenth century, nitrate production had become the leading industry in Chile, and the country was the world’s leading supplier of nitrates. The accelerated commercial development of synthetic nitrates in the 1920s and the global economic depression in the 1930s caused a serious contraction of the Chilean nitrate business, which did not recover significantly until shortly before the Second World War. After the war, the widespread commercial production of synthetic nitrates resulted in a further contraction of the natural nitrate industry in Chile, which continued to operate at depressed levels into the 1960s.
We were formed in 1968 through a joint venture between Compañía Salitrera Anglo Lautaro S.A. (“Anglo Lautaro”) and Corfo, a Chilean government entity. Three years after our formation, in 1971, Anglo Lautaro sold all of its shares to Corfo, and we were wholly owned by the Chilean government until 1983. In 1983, Corfo began a process of privatization by selling our shares to the public and subsequently listing such shares on the Santiago Stock Exchange. By 1988, all of our shares were publicly owned. Our ADSs have traded on the NYSE under the ticker symbol “SQM” since 1993. Each ADS represents one Series B common share. We accessed international capital markets for the issuance of additional ADSs in 1995 and 1999.
Since our inception, we have produced nitrates and iodine, which are obtained from the caliche ore deposits in northern Chile. In 1985, we began to use heap leaching processes to extract nitrates and iodine, and in 1986 we started to produce potassium nitrate at our Coya Sur facility. Between 1994 and 1999, we invested approximately US$300 million in the development of the Salar de Atacama project in northern Chile, which has enabled us to produce potassium chloride, lithium carbonate, lithium hydroxide, potassium sulfate and boric acid.
From 2000 through 2004, we principally consolidated the investments carried out in the preceding five years. We focused on reducing costs and improving efficiencies throughout the organization. In addition, in 2001, we signed a commercial distribution agreement with the Norwegian company Yara International ASA, in order to take advantage of cost synergies in the Specialty Plant Nutrition business line.
| 21 |
Starting in 2005, we began strengthening our leadership position in our core businesses through a combination of capital expenditures and advantageous acquisitions and divestitures. Our acquisitions have included the Kemira Emirates Fertiliser Company (“Kefco”) in Dubai in 2005 and the iodine business of Royal DSM N.V. (“DSM”) in 2006. We also entered into a number of joint ventures, including a joint venture with Migao Corporation (“Migao”), signed in 2008, for the production of potassium nitrate, and SQM VITAS, our joint venture with the French Roullier Group. Pursuant to the latter joint venture, in 2010, we launched a new line of soluble phosphate products, and in 2012 we built new plants for the production of water-soluble fertilizers in Brazil (Candeias), Peru and South Africa (Durban). We also sold: (i) Fertilizantes Olmeca, our former Mexican subsidiary, in 2006, (ii) our stake in Impronta S.R.L., our former Italian subsidiary, in 2007 and (iii) our former butyllithium plant located in Houston, Texas, in 2008. These sales allowed us to concentrate our efforts on our core products.
The capital expenditure program has allowed us to add new products to our product lines and increase the production capacity of our existing products. In 2005, we started production of lithium hydroxide at a plant in the Salar del Carmen, near the city of Antofagasta in the north of Chile. In 2007, we completed the construction of a new prilling and granulating plant for nitrates in Coya Sur. In 2011, we completed expansions of our lithium carbonate capacity, achieving 48,000 metric tons of capacity per year. Since 2010, we have continued to expand our production capacity of potassium products in our operations in the Salar de Atacama. In 2011, we completed the construction of a new potassium nitrate facility in Coya Sur, increasing our overall production capacity of potassium nitrate by 300,000 metric tons per year. In 2013, we completed expansions in the production capacity of our iodine plants in Nueva Victoria. Our capital expenditure program also includes exploration for metallic minerals. Our exploration efforts have led to discoveries that in some cases may result in sales of the discovery and the generation of royalty income in the future. Within this context, in 2013 we sold our royalty rights to the Antucoya mining project to Antofagasta Minerals.
In 2014, we invested in the development of new extraction sectors and production increases in both nitrates and iodine at Nueva Victoria, reaching an approximate production capacity (including the Iris facility) of 8,500 metric tons per year of iodine at the facility.
In 2015, we focused on increasing the efficiency of our operations. Within this context, we announced a plan to restructure our iodine and nitrate operations. In an effort to take advantage of our highly efficient production facilities at our Nueva Victoria site, we decided to suspend the mining and nitrate operations and reduce iodine production at our Pedro de Valdivia site. During 2017, we increased our iodine production capacity at Nueva Victoria to approximately 10,000 metric tons per year. We continued expanding in 2018, and today, including Pedro de Valdivia and Nueva Victoria, our current effective iodine capacity is approximately 14,000 metric tons per year.
In 2016, we entered into a 50/50 joint venture with Lithium Americas to develop the Minera Exar lithium project in Caucharí-Olaroz in the Jujuy province of Argentina. We also made a capital contribution of US$20 million to Elemental Minerals Limited (“Elemental Minerals”), an Australian based company whose main assets are various potassium deposits in the Republic of Congo. We invested approximately US$20 million in exchange for 18% of the company, and a right of first refusal for approximately 20% of the total potash production of Elemental Minerals. Following this transaction at the end of 2016, Elemental Minerals changed its name to Kore Potash Limited. The State General Reserve Fund of Oman contributed US$20 million. These investments are not included in the capital expenditure program amounts discussed in the section below. These investments were carried out with internal financing. In 2018, SQM Potasio sold to Ganfeng Lithium Netherlands Co., BV (Ganfeng) its entire shareholding and irrevocable contributions in the Minera Exar project joint venture (“Exar”). Exar has paid SQM Potasio all outstanding loans it received from the company; and Exar has paid SQM for the services rendered to Exar during the project's development stage. SQM received cash of US$87.5 million for its joint venture interest in Exar, and Gangfeng is responsible for a US$50 million deferred payment to SQM if certain sales goals are met by the project.
| 22 |
In 2017, we continued to expand our operations outside Chile and, together with our subsidiary SQM Australia Pty, we entered into an agreement to acquire 50% of the assets of the Mount Holland lithium project in Western Australia. We entered into a 50/50 unincorporated joint operation with Kidman Resources Limited (“Kidman”), the Mt Holland Lithium Project, to design, construct and operate a mine, concentrator and refinery to produce approximately 45,000 metric tons of lithium hydroxide per year. Kidman retained the exclusive right to exploit gold within the project area. SQM Australia Pty committed to pay a price of US$70 million for the 50% of the Mt Holland assets, which was split into an initial payment of US$15 million and a deferred payment of US$ 55 million, both payments subject to certain conditions precedent. SQM Australia paid an additional (i) US$10 million as part of the initial payment, and (ii) US$30 million once the deferred payment took place. All payments subject to conditions under the purchase agreement with Kidman were executed by December 2018.
On December 13, 2018, the Minister for Mines and Petroleum in Western Australia granted Kidman the exemption from relevant expenditure requirements in relation to mining tenements of the Mount Holland project that were subject to exemption objections.
Capital Expenditure Program
We regularly review different opportunities to improve our production methods, reduce costs, increase production capacity of existing products and develop new products and markets. Additionally, significant capital expenditures are required every year in order to sustain our production capacity. We are focused on developing new products in response to identified customer demand, as well as new products that can be derived as part of our existing production or other products that could fit our long-term development strategy. Our capital expenditures in Chile have been mainly related to the organic growth and sustainability of our business, including the construction of new facilities and the renovation of plants and equipment. From 2016, we began to invest in lithium projects outside Chile, starting with the Minera Exar project in Argentina and continuing with Mount Holland project in Australia in 2017. In 2018, we sold our stake in Minera Exar and continued the development of the Mount Holland project. We also expanded our lithium carbonate capacity in Chile, reaching capacity 70,000 metric tons per year.
Our capital expenditures for the years ended December 31, 2018, 2017 and 2016 were as follows:
| (in millions of US$) | 2018 | 2017 | 2016 | |||||||||
| Capital expenditures | 244.7 | 142.1 | 131.3 | |||||||||
During 2018, we had total capital expenditure of US$244.7 million, primarily related to:
| · | Capacity expansion projects related to increasing lithium carbonate production to 70,000 metric tons per year and lithium hydroxide production to 13,500 metric tons per year in Chile; |
| · | Investments to increase iodine capacity to 14,000 metric tons per year in the Nueva Victoria mine; |
| · | Capacity expansion project related to potassium nitrate production plants III and IV in Coya Sur; and |
| · | General maintenance of all production units and the Port of Tocopilla in order to ensure the fulfillment of production and sales targets. |
| 23 |
During 2017, we had total capital expenditures of US$142.1 million, primarily related to:
| · | Capacity expansion projects related to lithium carbonate and lithium hydroxide production in Chile; |
| · | Investments in mining workshop and operations centers to relocate operations from the Nueva Victoria mine to mining sector Tente en el Aire; |
| · | Capacity expansion project related to potassium nitrate production; and |
| · | General maintenance of all production units and the Port of Tocopilla in order to ensure the fulfillment of production and sales targets. |
During 2016, we had total capital expenditures of US$131.3 million, primarily related to:
| · | Completion of the project related to the expansion of ponds at Nueva Victoria to increase the production of iodine and nitrates; |
| · | Capacity expansion projects related to our potassium nitrate production; |
| · | Capacity expansion project related to our lithium hydroxide production; |
| · | Improvements in the open storage areas at the Port of Tocopilla; and |
| · | General maintenance of all production units in order to ensure the fulfillment of production targets and the safety of all of our employees. |
The Board of Directors has approved a capital expenditure framework for 2019 of approximately US$360 million focused on the maintenance of our production facilities in order to strengthen our ability to meet our production goals and to increase our production capacity, primarily related to lithium carbonate capacity expansion and nitrates capacity in Chile and development of lithium project in Australia. We expect our installed capacity of lithium carbonate in Chile to reach approximately 120,000 metric tons by the end of 2020, an increase of 50,000 metric tons compared to our current capacity of 70,000 metric tons. From that point, we will continue to work to reach an installed capacity of 180,000 metric tons in Chile in the future. The capital expenditure associated with this expansion is expected to be in the range of approximately US$4,000 per ton. We expect to complete the feasibility study related to the Mount Holland lithium project in Australia in the second half of 2019, at which time we believe we will have a better estimate associated with the capital expenditure and costs of the project.
We do not expect that our 2019 capital investment program will require external financing. However, we always have the option to access capital markets in order to optimize our financial position.
4.B. Business Overview
The Company
We believe that we are the world’s largest producer of potassium nitrate and iodine and one of the world´s largest lithium producers. We also produce specialty plant nutrients, iodine derivatives, lithium derivatives, potassium chloride, potassium sulfate and certain industrial chemicals (including industrial nitrates and solar salts). Our products are sold in over 110 countries through our worldwide distribution network, with 92% of our sales in 2018 derived from countries outside Chile.
Our products are mainly derived from mineral deposits found in northern Chile. We mine and process caliche ore and brine deposits. The caliche ore in northern Chile contains the only known nitrate and iodine deposits in the world and is the world’s largest commercially exploited source of natural nitrates. The brine deposits of the Salar de Atacama, a salt-encrusted depression in the Atacama Desert in northern Chile, contain high concentrations of lithium and potassium as well as significant concentrations of sulfate and boron.
From our caliche ore deposits, we produce a wide range of nitrate-based products used for specialty plant nutrients and industrial applications, as well as iodine and iodine derivatives. At the Salar de Atacama, we extract brines rich in potassium, lithium, sulfate and boron in order to produce potassium chloride, potassium sulfate, lithium solutions and bischofite (magnesium chloride). We produce lithium carbonate and lithium hydroxide at our plant near the city of Antofagasta, Chile, from the solutions brought from the Salar de Atacama. We market all of these products through an established worldwide distribution network.
| 24 |
Our products are divided into six categories: specialty plant nutrients; iodine and its derivatives; lithium and its derivatives; potassium chloride and potassium sulfate; industrial chemicals and other commodity fertilizers. Specialty plant nutrients are premium fertilizers that enable farmers to improve yields and the quality of certain crops. Iodine and its derivatives are mainly used in the X-ray contrast media and biocides industries and in the production of polarizing film, which is an important component in LCD screens. Lithium and its derivatives are mainly used in batteries, greases and frits for production of ceramics. Potassium chloride is a commodity fertilizer that is produced and sold by us worldwide. Potassium sulfate is a specialty fertilizer used primarily in crops such as vegetables, fruits and industrial crops. Industrial chemicals have a wide range of applications in certain chemical processes such as the manufacturing of glass, explosives and ceramics, and, more recently, industrial nitrates are being used in concentrated solar power plants as a means for energy storage. In addition, we complement our portfolio of plant nutrients through the buying and selling of other commodity fertilizers for use mainly in Chile.
For the year ended December 31, 2018, we had revenues of US$2,265.8 million, gross profit of US$782.3 million and profit attributable to controlling interests of US$439.8 million. Our worldwide market capitalization as of December 31, 2018 was approximately US$10.1 billion.
Specialty Plant Nutrition : We produce four main types of specialty plant nutrients: potassium nitrate, sodium nitrate, sodium potassium nitrate and specialty blends. We also sell other specialty fertilizers including third party products. All of these specialty plant nutrients are used in either solid or liquid form mainly on high value crops such as vegetables, fruits and flowers. Our nutrients are widely used in crops that employ modern agricultural techniques such as hydroponics, green housing, fertigation (where fertilizer is dissolved in water prior to irrigation) and foliar application. According to the type of use or application, our products are primarily marketed under the following brands: Ultrasol R (fertigation), Qrop R (open field application), Speedfol R (foliar application) and Allganic R (organic farming). Specialty plant nutrients have certain advantages over commodity fertilizers, such as rapid and effective absorption (without requiring nitrification), superior water solubility, increased soil pH (which reduces soil acidity) and low chloride content. One of the most important products in this business line is potassium nitrate, which is sold in crystalline or prill form, allowing for multiple application methods. Crystalline potassium nitrate products are ideal for application by fertigation and foliar sprays, and potassium nitrate prills are suitable for soil applications.
The new needs of more sophisticated customers demand that the industry provide integrated solutions rather than individual products. Our products, including customized specialty blends that meet specific needs along with the agronomic service provided, allow to create plant nutrition solutions that add value to crops through higher yields and better quality production. Because our products are derived from natural nitrate compounds or natural potassium brines, they have certain advantages over synthetically produced fertilizers, including the presence of certain beneficial trace elements, which makes them more attractive to customers who prefer products of natural origin. As a result, specialty plant nutrients are sold at a premium price compared to commodity fertilizers.
Iodine and its Derivatives: We believe that we are the world’s leading producer of iodine and iodine derivatives, which are used in a wide range of medical, pharmaceutical, agricultural and industrial applications, including x-ray contrast media, polarizing films for LCD and LED, antiseptics, biocides and disinfectants, in the synthesis of pharmaceuticals, electronics, pigments and dye components.
Lithium and its Derivatives : We are a leading producer of lithium carbonate, which is used in a variety of applications, including electrochemical materials for batteries, frits for the ceramic and enamel industries, heat-resistant glass (ceramic glass), air conditioning chemicals, continuous casting powder for steel extrusion, pharmaceuticals and lithium derivatives. We are also a leading supplier of lithium hydroxide, which is primarily used as an input for the lubricating greases industry and for certain cathodes for batteries.
| 25 |
Potassium: We produce potassium chloride and potassium sulfate from brines extracted from the Salar de Atacama. Potassium chloride is a commodity fertilizer used to fertilize a variety of crops including corn, rice, sugar, soybean and wheat. Potassium sulfate is a specialty fertilizer used mainly in crops such as vegetables, fruits and industrial crops.
Industrial Chemicals : We produce three industrial chemicals: sodium nitrate, potassium nitrate and potassium chloride. Sodium nitrate is used primarily in the production of glass, explosives, and metal treatment. Potassium nitrate is used in the manufacturing of specialty glass, and it is also an important raw material for the production of frits for the ceramics and enamel industries. Solar salts, a combination of potassium nitrate and sodium nitrate, are used as a thermal storage medium in concentrated solar power plants. Potassium chloride is a basic chemical used to produce potassium hydroxide, and it is also used as an additive in oil drilling as well as in food processing, among other uses. We market our industrial chemicals using the following brands: QSodiumNitrate ™, QPotassiumNitrate ™ , and QPotassiumChloride ™ .
Other Products and Services: We also sell other fertilizers and blends, some of which we do not produce. We are the largest company that produces and distributes the three main potassium sources: potassium nitrate, potassium sulfate and potassium chloride.
The following table shows the percentage breakdown of our revenues for 2018, 2017 and 2016 according to our product lines:
| 2018 | 2017 | 2016 | ||||||||||
| Specialty Plant Nutrition | 35 | % | 32 | % | 32 | % | ||||||
| Iodine and Derivatives | 14 | % | 12 | % | 12 | % | ||||||
| Lithium and Derivatives | 32 | % | 30 | % | 27 | % | ||||||
| Potassium | 12 | % | 18 | % | 21 | % | ||||||
| Industrial Chemicals | 5 | % | 6 | % | 5 | % | ||||||
| Other | 2 | % | 2 | % | 3 | % | ||||||
| Total | 100 | % | 100 | % | 100 | % | ||||||
Business Strategy
Our business strategy is to be a global company with people committed to excellence, dedicated to the extraction of minerals and selectively integrated in the production and sale of products for the industries essential for human development (e.g., food, health, technology). This strategy was built on the following five principles:
| · | ensure availability of key resources required to support current goals and medium and long-term growth of the business; |
| · | consolidate a culture of lean operations (M1 excellence) through the entire organization, including operations, sales and support areas; |
| · | significantly increase nitrate sales in all its applications and ensure consistency with iodine commercial strategy; |
| · | maximize the margins of each business line through appropriate pricing strategy; |
| · | successfully develop and implement all lithium expansion projects of the Company, acquire more lithium and potassium assets to generate a competitive portfolio. |
| 26 |
These principles are based on the following key concepts:
| · | strengthen the organizational structure to supports the development of the Company's strategic plan, focusing on the development of critical capabilities and the application of the corporate values of Excellence, Integrity and Safety; |
| · | develop a robust risk control and mitigation process to actively manage business risk; |
| · | improve our stakeholder management to establish links with the community and communicate to Chile and worldwide our contribution to industries essential for human development. |
We have identified market demand in each of our major product lines, both within our existing customer base and in new markets, for existing products and for additional products that can be produced from our natural resources. To take advantage of these opportunities, we have developed specific strategies for each of our product lines.
Specialty Plant Nutrition
Our strategy in our specialty plant nutrition business is to: (i) leverage the advantages of our specialty products over commodity-type fertilizers; (ii) selectively expand our business by increasing our sales of higher margin specialty plant nutrients based on potassium and natural nitrates, particularly soluble potassium nitrate and specialty blends; (iii) pursue investment opportunities in complementary businesses to enhance our product portfolio, increase production, reduce costs, and add value to the marketing of our products; (iv) develop new specialty nutrient blends produced in our mixing plants that are strategically located in or near our principal markets in order to meet specific customer needs; (v) focus primarily on the markets where we can sell our plant nutrients in soluble and foliar applications in order to establish a leadership position; (vi) further develop our global distribution and marketing system directly and through strategic alliances with other producers and global or local distributors; (vii) reduce our production costs through improved processes and higher labor productivity so as to compete more effectively and (viii) supply a product with consistent quality according to the specific requirements of our customers.
Iodine and its Derivatives
Our strategy in our iodine business is to: (i) reach and maintain a sufficient market share of the iodine market in order to optimize the use of our available production capacity; (ii) encourage demand growth and promote new iodine uses; (iii) participate in iodine recycling projects through the Ajay-SQM Group (“ASG”); (iv) reduce our production costs through improved processes and higher productivity in order to compete more effectively and (v) supply a product with consistent quality according to the requirements of our customers.
Lithium and its Derivatives
Our strategy in our lithium business is to: (i) strategically allocate our sales of lithium carbonate and lithium hydroxide; (ii) encourage demand growth and promote new lithium uses; (iii) selectively pursue opportunities in the lithium derivatives business by creating new lithium compounds; (iv) reduce our production costs through improved processes and higher productivity in order to compete more effectively; (v) supply a product with consistent quality according to the requirements of our customers and (vi) diversify our operations geographically and jurisdictionally.
Potassium
Our strategy in our potassium business is to: (i) offer a portfolio of potassium products, including potassium sulfate, potassium chloride and other fertilizers, to our traditional markets; (ii) have flexibility to offer crystalized (standard) or granular (compacted) form products according to market requirements; (iii) focus on markets where we have logistical advantages and synergies with our specialty plant nutrition business and (iv) supply a product with consistent quality according to the specific requirements of our customers.
Industrial Chemicals
Our strategy in our industrial chemical business is to: (i) maintain our leadership position in the industrial nitrates market as well as increase our supply of potassium chloride in markets where we have natural advantages; (ii) encourage demand growth in different applications; (iii) become a long-term, reliable supplier for the thermal storage industry, maintaining close relationships with R&D programs; (iv) reduce our production costs through improved processes and higher productivity in order to compete more effectively and (v) supply a product with consistent quality according to the requirements of our customers.
| 27 |
New Business Ventures
We constantly evaluate opportunities that are consistent with our existing and new businesses. We seek to acquire interests in projects both inside and outside of Chile where we believe we have sustainable competitive advantages, and we hope to continue doing so in the future.
In addition, we are actively conducting exploration for metallic minerals in the mining properties we own. If such minerals are found, we may decide to exploit, sell or enter into an association to extract these resources. Our exploration efforts are currently focused on the layer of bedrock that lies beneath the caliche ore that we use as the primary raw material in the production of iodine and nitrates. This bedrock has significant potential for metallic mineralization, particularly copper and gold. A significant portion of our mining properties are located in the Antofagasta region of Chile, where many large copper producers operate.
We have an in-house geological exploration team that explores the area directly, identifying drilling targets and assessing new prospects. In 2018, the team identified eight new targets and confirmed mineralization in four of the targets, using its own truck-mounted drill rigs. The number of perforated meters reached 32,862 meters, and were made with four machines of which three were internal and the other external. We also have a metal business development team that works to engage partners interested in investing in metal exploration within our mining properties. As of December 31, 2018, we had six option agreements in place with five companies, including small junior mining companies, private equity firms and large mining companies. We have entered into an exploration and purchase option agreement with a private Chilean company for an area of interest. We are participating in the formation of two joint ventures as a result of exercising an option agreement a junior company.
Main Business Lines
Specialty Plant Nutrition
In 2018, specialty plant nutrients revenues increased to US$781.8 million, representing 34.5% of our total revenues for that year. We believe that we are the world’s largest producer of potassium nitrate. We estimate that our sales accounted for approximately 56% of global potassium nitrate sales for all applications by volume in 2018, an increase from 53% in 2017. During 2018, the potassium nitrate market increased by approximately 7%. These estimates do not include potassium nitrate produced and sold locally in China, only Chinese net imports and exports.
In addition to potassium nitrate, we produce the following specialty plant nutrients: sodium nitrate, sodium potassium nitrate and specialty blends (containing various combinations of nitrogen, phosphate and potassium and generally known as “NPK blends”).
Our specialty plant nutrients have specific characteristics that increase productivity and enhance quality when used on certain crops and soils. Our specialty plant nutrients have significant advantages for certain applications over commodity fertilizers based on nitrogen and potassium, such as urea and potassium chloride.
Our specialty plant nutrients advantages are:
| · | fully water soluble, allowing their more efficient use in hydroponics, fertigation, foliar applications and other advanced agricultural techniques thus improving the water use efficiently of crops to help conserve water; |
| 28 |
| · | chloride-free, which prevents chloride toxicity in certain crops associated with high levels of chlorine in plant nutrients; |
| · | provide nitrogen in nitric form, thereby allowing crops to absorb nutrients faster than they absorb urea or ammonium-based fertilizers; |
| · | do not release hydrogen after application, thereby avoiding increased soil acidity; |
| · | possess trace elements, which promote disease resistance in plants; and |
| · | more attractive to customers who prefer products of natural origin. |
Specialty Plant Nutrition: Market
The target market for our specialty plant nutrients includes producers of high-value crops such as vegetables, fruits, industrial crops, flowers, cotton and others. Furthermore, we sell specialty plant nutrients to producers of chloride-sensitive crops. Since 1990, the international market for specialty plant nutrients has grown at a faster rate than the international market for commodity-type fertilizers. This is mostly due to: (i) the application of new agricultural technologies such as fertigation and hydroponics, and the increasing use of greenhouses; (ii) the increase in the cost of land and the scarcity of water, which has forced farmers to improve their yields and reduce water use; and (iii) the increase in demand for higher quality crops, such as fruits and vegetables.
Over the last ten years, the compound annual growth rate for vegetable production per capita was 3% while the compound annual growth rate for the world population was closer to 1%.
Worldwide scarcity of water and arable land drives the development of new agricultural techniques to maximize the use of these resources. Irrigation has grown at an average annual rate of 1% during the last 20 years (a pace similar to population growth). However, micro irrigation has grown at 10% per year over the same period. Micro irrigation systems, which include drip irrigation and micro-sprinklers, are the most efficient forms of technical irrigation. These applications require fully water-soluble plant nutrients. Our nitrate-based specialty plant nutrients are fully soluble in water and provide nitrogen in nitric form, which helps crops absorb these nutrients faster than they absorb urea- or ammonium-based fertilizers, facilitating a more efficient application of nutrients to the plant and thereby increasing the crop’s yield and improving its quality.
The ratio of micro irrigation to total irrigated hectares in Asia is approximately 3%, the lowest ratio of any region in the world. This represents a high potential for micro irrigation, which is reflected in the high growth rates in Asia in recent years.
Potassium nitrate in China is an important market, although currently its demand is largely fulfilled by domestic producers. Demand totals approximately 400,000 to 420,000 metric tons, of which approximately 130,000 is related to the tobacco industry and approximately 120,000 is related to the horticulture business. Of the total, between 20,000 and 30,000 metric tons are imports.
Specialty Plant Nutrition: Our Products
Potassium nitrate, sodium potassium nitrate and specialty blends are higher margin products derived from, or consisting of, sodium nitrate, and they are all produced in crystallized or prilled form. Specialty blends are produced using our own specialty plant nutrients and other components at blending plants operated by us or our affiliates and related companies in Chile, the United States, Mexico, the United Arab Emirates, South Africa, Turkey, China, India, Thailand, Brazil, Spain, the Netherlands and Peru.
| 29 |
The following table shows our sales volumes of and revenues from specialty plant nutrients for 2018, 2017 and 2016:
| 2018 | 2017 | 2016 | ||||||||||
| Sales volumes (Th. MT) | ||||||||||||
| Sodium nitrate | 25.0 | 26.7 | 24.4 | |||||||||
| Potassium nitrate and sodium potassium nitrate | 673.4 | 601.4 | 475.8 | |||||||||
| Specialty blends (1) | 242.5 | 209.0 | 213.5 | |||||||||
| Other specialty plant nutrients (2) | 141.6 | 129.1 | 127.2 | |||||||||
| Total revenues (in US$ millions) | 781.8 | 697.3 | 623.9 | |||||||||
| (1) | Includes Yara’s products sold pursuant to our commercial agreement. |
| (2) | Includes trading of other specialty fertilizers. |
In 2018, our specialty plant nutrients revenues increased to US$781.8 million, representing 35% of our total revenues for that year and a 12.1% increase from US$697.3 million in specialty plant nutrients revenues in 2017. Prices increased approximately 0.07% in 2018.
Depending on the systems used to apply specialty nutrients, fertilizers can be classified as specialty field fertilizers or water-soluble fertilizers.
Specialty field fertilizers are applied directly to the soil, manually or in a mechanized fashion. Their high solubility levels, lack of chloride and absence of acidic reactions make them particularly advantageous for tobacco, potatoes, coffee, cotton and a wide range of fruits and vegetables.
Water-soluble fertilizers are specialty nutrients that are delivered to the crops using modern irrigation systems. As these systems feature refined technology, the products used in them must be highly soluble, rich in nutrients, free of impurities and insoluble substances, and with a low salinity index. The leading nutrient in this segment is potassium nitrate, whose optimal balance of nitric nitrogen and chloride-free potassium (the two macronutrients most needed by plants) make it an indispensable source of nutrition for crops that use modern irrigation systems.
Potassium nitrate is widely known to be a vital component in foliar feeding applications, where usage is recommended in order to stave off nutritional deficiencies before the first symptoms appear, correct any deficiencies that arise and prevent physiological stress. This nutrient also helps promote a suitable balance between fruit production and/or growth, and plant development, particularly in crops with physiological disorders.
Foliar feeding with potassium nitrate can have beneficial effects:
| · | when soil chemistry limits nutrient solubility and availability (pH, organic matter, type and percentage of clay); |
| · | when nutrient absorption through the roots is limited as a result of conditions that hamper root growth (temperature, moisture, oxygen and loss of soil structure); |
| · | when the plant’s local internal demand may surpass real internal nutrient redistribution capacity, leaving the demand unsatisfied; |
| · | when nutrient mobility is limited, when plants flower before the leaf growth phase, imposing limiting factors on xylem nutrient transport; and |
| · | to achieve rapid recovery from leaf stress caused by climatic conditions, soil conditions and irrigation management. |
Another benefit of our potassium nitrate is that, according to a 2014 study by the consulting firm Arthur D. Little Benelux, our production process generates up to 40% less greenhouse gases compared to other major potassium nitrate producers in the world.
| 30 |
SQM has consolidated a product portfolio of over 200 specialty fertilizer blends, including top brands such as Ultrasol ® , for fertigation; Qrop ® , for application to the soil; Speedfol ® , for foliar feeding and Allganic ® for organic crops.
Qrop TM KS was added to our portfolio of specialty field fertilizers in 2015. This product was developed by our research and development team and is an improvement to existing products. It is more physically stable and is not required to be transported as hazardous cargo, which means it can be sold in other markets.
During 2017, we worked on the restructuring of the Qrop products portfolio: chloride-free line for direct application to the soil with a variety of specialized formulas and unique mixtures, which make these products highly accurate and quickly available for the plant.
In 2018, we launched new products to the market, such as the Ultrasol® K line in the United States. Ultrasol® K will address the need for potassium-free chloride and a nitrate safe for handling in the liquid fertilizer market, opening new opportunities for SQM in in the cultivation of almonds and strawberries, in which water quality and efficiency are very important.
Specialty Plant Nutrition: Marketing and Customers
In 2018, we sold our specialty plant nutrients in approximately 100 countries and to more than 760 customers. One customer represented more than 10% of our specialty plant nutrition revenues during 2018, representing approximately 23% of our total specialty plant nutrition revenues, and our ten largest customers accounted in the aggregate for approximately 49% of revenues during that period. No supplier accounted for more than 10% of the costs of sales for this business line.
The table below shows the geographical breakdown of our revenues:
| Revenues breakdown | 2018 | 2017 | 2016 | |||||||||
| North America | 31 | % | 33 | % | 33 | % | ||||||
| Europe | 25 | % | 25 | % | 18 | % | ||||||
| Central and South America (excluding Chile) | 10 | % | 10 | % | 11 | % | ||||||
| Asia and Others | 34 | % | 31 | % | 37 | % | ||||||
We sell our specialty plant nutrition products outside Chile mainly through our own worldwide network of representative offices and through our distribution affiliates.
We maintain inventory of our specialty plant nutrients in our commercial offices in the main markets of the Americas, Asia, Europe, the Middle East and Africa in order to facilitate prompt deliveries to customers. In addition, we sell specialty plant nutrients directly to some of our large customers. Sales are made pursuant to spot purchase orders and short-term contracts.
As part of our marketing strategy, we provide technical and agronomical assistance and support to our clients. We have specific knowledge resulting from extensive research and numerous studies conducted by our agronomical teams in close contact with producers throughout the world. The solid agronomical knowledge is key for the development of specific formulas and hydroponic and fertirrigation nutritional plans, which allows us to provide expert advice for producing crops that meet high quality standards for the most efficient markets and in the most environmentally challenging conditions.
By working closely with our customers, we are able to identify their needs for new products and a possible existence of higher-value-added markets. Our specialty plant nutrients are used on a wide variety of crops, particularly value-added crops, where the use of our products enables our customers to increase yields and achieve a premium price for their own products.
| 31 |
Our customers are located in both the northern and southern hemispheres. Consequently, we do not believe there are any seasonal or cyclical factors that can materially affect the sales of our specialty plant nutrients.
Specialty Plant Nutrition: Joint Ventures and Agreements
Consistent with our business strategy, we regularly evaluate opportunities to expand in our current core businesses, including our specialty plant nutrition business, or within new businesses in which we believe we may have sustainable competitive advantages. We evaluate potential acquisitions, joint ventures and alliances with companies both within and outside of Chile, including in other emerging markets.
In May 2008, we signed a joint venture agreement with Migao for the production and distribution of specialty plant nutrients in China. Through the joint venture, Sichuan SQM-Migao Chemical Fertilizers Co., Ltd., we constructed a potassium nitrate plant with a production capacity of 40,000 metric tons per year. The plant began operating in January 2011.
In May 2009, our subsidiary Soquimich European Holdings entered into an agreement with Coromandel Fertilizers Ltd. to create a joint venture, Coromandel SQM Private Limited, for the production and distribution of water soluble fertilizers in India. The agreement established a 50⁄50 joint venture. As part of the agreement, a new 15,000 metric ton facility was constructed in the city of Kakinada to produce water soluble NPK grade fertilizers. This new facility began operating in January 2012.
In December 2009, we signed an agreement with the French Roullier Group to form the joint venture SQM Vitas FZCO. This agreement joins two of the largest companies in the businesses of specialty plant nutrition, specialty animal nutrition and professional hygiene. Peru, Brazil and Dubai are the main focus markets of this joint venture. As part of the agreement, our phosphate plant located in Dubai became part of this joint venture.
Between 2010 and 2012, we continued to expand our production capacity of potassium products in our operations in the Salar de Atacama. In 2011, we completed the construction of a new potassium nitrate facility in Coya Sur, increasing our overall production capacity of potassium nitrate by 300,000 metric tons.
In 2012, SQM Vitas FZCO. started the construction of new plants in Brazil (Candeias), Peru and South Africa (Durban) for the production of water soluble fertilizers containing different relative amounts of nitrogen, phosphorus and potassium, and at times, smaller amounts of other chemicals. The Candeias Industrial Complex plant in Brazil began operating in March 2012 and has a production capacity of 25,000 metric tons per year.
In 2013, the operations of SQM Vitas Spain began in Spain with a water soluble NPK fertilizer plant that has a production capacity of 15,000 metric tons per year. In 2016, this operation became fully controlled by SQM.
In 2015, an asset transfer agreement, that was signed in December 2014 between Plantacote B.V. and Plantacote N.V., entered into effect. As a result of this agreement, the business and Plantacote® brand were transferred to the new company Plantacote N.V., but with no changes to the business or the Controlled Release Fertilizer project. SQM continues to hold a 50% ownership stake in the company.
In 2015, SQM Vitas South Africa, was acquired by Roulliers and the production facilities in Durban were transferred to SQM Africa Pty Ltd.
In 2016, we began operating soluble specialty plant nutrient production facilities through our joint ventures in Peru. SQM Vítas Perú S.A.C. and the Netherlands, Plantacote N.V. P.E. Netherlands. In addition, a new logistics terminal was opened in the port of Terneuzen in the Netherlands.
| 32 |
In 2017, three new offices started their operations in Imbituba, Rio Grande and Sao Paulo, Brazil, SQM Vitas Brazil Agroindustria, importação e exporação ltda.
In May 2018, our we began operating a new joint venture, Pavoni & C. Spa with Pavoni, one of the largest specialty fertilizer companies in Italy. The main objective of this business is to improve the nutritional efficiency of crops, the existing fertigation, the quality of fertilizers and their applications, as well as extend the use of fertigation (from microirrigation).
In 2018, our new office and storage facility in Pamira, managed by SQM Colombia SAS near the Port of Buenaventura in Colombia became operational. The new office was set up to meet the growing needs of customers in the Colombian market, especially those who grow roses and ornamental plants, coffee, bananas and fruit through a complete portfolio of soluble fertilizers and Qrop mixes.
In 2018, we sold our interest in the Charlee SQM Thailand Co. Ltd. joint venture.
In 2018, the production activities of the SQM Vitas FZCO ceased due to changes in the expiry of the lease with the port authorities.
Specialty Plant Nutrition: Fertilizer Sales in Chile
We market specialty plant nutrients in Chile through our subsidiary Soquimich Comercial S.A. (“SQMC”).
SQMC is one of the main players in the Chilean market, offering a wide range of products developed specifically for the crops grown in the country which require specialty plant nutrients.
SQMC sells local products as well as products imported from different countries around the world.
All contracts and agreements between SQMC and its foreign suppliers of fertilizers contain standard and customary commercial terms and conditions. SQMC has been able to obtain adequate supplies of these products with good pricing conditions.
SQMC’s total sales reached US$147 million and US$133 million in 2018 and 2017, respectively. During 2018, no client represented more than 10% of the sales of the Company. According to the customs information related to fertilizers, the market participation of fertilizers imported directly by SQMC during 2018 was approximately 13%.
Specialty Plant Nutrition: Competition
The principal means of competition in the sale of potassium nitrate are product quality, customer service, location, logistics, agronomic expertise and price.
We believe that we are the world’s largest producer of sodium nitrate and potassium nitrate for agricultural use. Our sodium nitrate products compete indirectly with specialty and commodity-type substitutes, which may be used by some customers instead of sodium nitrate depending on the type of soil and crop to which the product will be applied. Such substitute products include calcium nitrate, ammonium nitrate and calcium ammonium nitrate.
In the potassium nitrate market our largest competitor is Haifa Chemicals Ltd. (“Haifa”), in Israel, which is a subsidiary of Trans Resources International Inc. We estimate that sales of potassium nitrate by Haifa accounted for approximately 13% of total world sales during 2018 (excluding sales by Chinese producers to the domestic Chinese market). Haifa had production issues during 2017 and is currently operating at its 50% capacity (one plant). Our sales accounted for approximately 56% of global potassium nitrate sales by volume for the period.
| 33 |
ACF, another Chilean producer, mainly oriented to iodine production, has produced potassium nitrate from caliche ore and potassium chloride since 2005. Kemapco, a Jordanian producer owned by Arab Potash, produces potassium nitrate in a plant located close to the Port of Aqaba, Jordan. In addition, there are several potassium nitrate producers in China, the largest of which are Yuantong and Migao. Most of the Chinese production is consumed by the Chinese domestic market.
In Chile, our products mainly compete with imported fertilizer blends that use calcium ammonium nitrate or potassium magnesium sulfate. Our specialty plant nutrients also compete indirectly with lower-priced synthetic commodity-type fertilizers such as ammonia and urea, which are produced by many producers in a highly price-competitive market. Our products compete on the basis of advantages that make them more suitable for certain applications as described above.
Iodine and its Derivatives
We believe that we are the world’s largest producer of iodine. In 2018, our revenues from iodine and iodine derivatives amounted to US$325.0 million, representing 14.3% of our total revenues in that year. We estimate that our sales accounted for approximately 36% of world iodine sales by volume in 2018.
Iodine: Market
Iodine and iodine derivatives are used in a wide range of medical, agricultural and industrial applications as well as in human and animal nutrition products. Iodine and iodine derivatives are used as raw materials or catalysts in the formulation of products such as X-ray contrast media, biocides, antiseptics and disinfectants, pharmaceutical intermediates, polarizing films for LCD and LED screens, chemicals, organic compounds and pigments. Iodine is also added in the form of potassium iodate or potassium iodide to edible salt to prevent iodine deficiency disorders.
X-ray contrast media is the leading application of iodine, accounting for approximately 23% of demand. Iodine’s high atomic number and density make it ideally suited for this application, as its presence in the body can help to increase contrast between tissues, organs, and blood vessels with similar X-ray densities. Other applications include pharmaceuticals, which we believe account for 13% of demand; LCD and LED screens, 12%; iodophors and povidone-iodine, 9%; animal nutrition, 8%; fluoride derivatives, 7%; biocides, 6%; nylon, 4%; human nutrition, 3% and other applications, 15%.
During 2018, iodine demand grew at a similar rate as in 2017, reaching 36,300 metric tons. Although more traditional uses grew at the same rate as during the previous year, new applications such as carbon energy plants emission control industries and demand growth related to the LED and LCD market resulted higher demand for iodine and derivatives.
Iodine: Our Products
We produce iodine in our Nueva Victoria plant, near Iquique, and our Pedro de Valdivia plant, close to María Elena. We have a total effective production capacity of approximately 14,000 metric tons per year of iodine, including the Iris plant, which is located close to the Nueva Victoria plant.
Through ASG, we produce organic and inorganic iodine derivatives. ASG was established in the mid-1990s and has production plants in the United States, Chile and France. ASG is the world’s leading inorganic and organic iodine derivatives producer.
Consistent with our business strategy, we are constantly working on the development of new applications for our iodine-based products, pursuing a continuing expansion of our businesses and maintaining our market leadership.
| 34 |
We manufacture our iodine and iodine derivatives in accordance with international quality standards and have qualified our iodine facilities and production processes under the ISO-9001:2008 program, providing third party certification of the quality management system and international quality control standards that we have implemented.
The following table shows our total sales volumes and revenues from iodine and iodine derivatives for 2018, 2017 and 2016:
| 2018 | 2017 | 2016 | ||||||||||
| Sales volumes (Th. MT) | ||||||||||||
| Iodine and derivatives | 13.3 | 12.7 | 10.2 | |||||||||
| Total revenues (in US$ millions) | 325.0 | 252.1 | 231.1 | |||||||||
Our revenues increased to US$325.0 million in 2018 from US$252.1 million in 2017. This increase was primarily attributable to the increase in iodine sales volume and higher prices during 2018. Average iodine prices were more than 22.6% higher in 2018 than in 2017. Our sales volumes increased 5.1% in 2018, outpacing global iodine demand growth.
Iodine: Marketing and Customers
In 2018, we sold our iodine products in approximately 52 countries to approximately 283 customers, and most of our sales were exports. Four customers each accounted for more than 10% of our iodine revenues in 2017. These four customers accounted for approximately 53% of revenues, and our ten largest customers accounted in the aggregate for approximately 77% of revenues. No supplier accounted for more than 10% of the cost of sales of this business line.
The following table shows the geographical breakdown of our revenues:
| Revenues breakdown | 2018 | 2017 | 2016 | |||||||||
| North America | 26 | % | 25 | % | 25 | % | ||||||
| Europe | 34 | % | 31 | % | 36 | % | ||||||
| Central and South America (excluding Chile) | 2 | % | 0 | % | 0 | % | ||||||
| Asia and Others | 38 | % | 43 | % | 38 | % | ||||||
We sell iodine through our own worldwide network of representative offices and through our sales, support and distribution affiliates. We maintain inventories of iodine at our facilities throughout the world to facilitate prompt delivery to customers. Iodine sales are made pursuant to spot purchase orders or within the framework of supply agreements. Supply agreements generally specify annual minimum and maximum purchase commitments, and prices are adjusted periodically, according to prevailing market prices.
Iodine: Competition
The world’s main iodine producers are based in Chile, Japan and the United States. Iodine is also produced in Russia, Turkmenistan, Azerbaijan, Indonesia and China.
Iodine is produced in Chile using a unique mineral known as caliche ore, whereas in Japan, the United States, Russia, Turkmenistan, Azerbaijan, and Indonesia, producers extract iodine from underground brines that are mainly obtained together with the extraction of natural gas and petroleum. In China, iodine is extracted from seaweed.
| 35 |
Five Chilean companies accounted for approximately 59% of total global sales of iodine in 2018, including SQM, with approximately 36%, and four other producers, accounting for the remaining 23%. The other Chilean producers are: Atacama Chemical S.A. (Cosayach), controlled by the Chilean holding Inverraz S.A.; ACF Minera S.A. owned by the Chilean family Urruticoechea; Algorta Norte S.A., a joint venture between ACF Minera S.A. and Toyota Tsusho; and Atacama Minerals, recently acquired by Chinese company Tewoo.
We estimate that eight Japanese iodine producers accounted for approximately 29% of global iodine sales in 2018, including recycled iodine.
We estimate that iodine producers in the United States (one of which is owned by Toyota Tsusho and another is owned by Ise Chemicals Ltd., both of which are Japanese companies) accounted for nearly 5% of world iodine sales in 2018.
Iodine recycling is a growing trend worldwide. Several producers have recycling facilities where they recover iodine and iodine derivatives from iodine waste streams.
We estimate the 17% of the iodine supply come from iodine recycling. Through ASG or alone, we are also actively participating in the iodine recycling business using iodinated side-streams from a variety of chemical processes in Europe and the United States.
The prices of iodine and iodine derivative products are determined by market conditions. World iodine prices vary depending upon, among other things, the relationship between supply and demand at any given time. Iodine supply varies primarily as a result of the production levels of the iodine producers (including us) and their respective business strategies. Our annual average iodine sales prices increased to approximately US$24 per kilogram in 2018, higher than the prices observed in 2017.
Demand for iodine varies depending upon overall levels of economic activity and the level of demand in the medical, pharmaceutical, industrial and other sectors that are the main users of iodine and iodine-derivative products. Certain substitutes for iodine are available for certain applications, such as antiseptics and disinfectants, which could represent a cost-effective alternative to iodine depending on prevailing prices.
The main factors of competition in the sale of iodine and iodine derivative products are reliability, price, quality, customer service and the price and availability of substitutes. We believe we have competitive advantages compared to other producers due to the size and quality of our mining reserves and the available production capacity. We believe our iodine is competitive with that produced by other manufacturers in certain advanced industrial processes. We also believe we benefit competitively from the long-term relationships we have established with our largest customers.
Lithium and its Derivatives
In 2018, our revenues from lithium sales amounted to US$734.8 million, representing 32.4% of our total revenues. We believe we are one of the world’s largest producers of lithium carbonate and lithium hydroxide, and we estimate that our sales volumes accounted for approximately 17% of the global lithium chemicals sales volumes.
Lithium: Market
The lithium market can be divided into (i) lithium minerals for direct use (in which market SQM does not participate directly), (ii) basic lithium chemicals, which include lithium carbonate and lithium hydroxide (as well as lithium chloride, from which lithium carbonate may be made), and (iii) inorganic and organic lithium derivatives, which include numerous compounds produced from basic lithium chemicals (in which market SQM does not participate directly).
| 36 |
Lithium carbonate and lithium hydroxide are principally used to produce the cathodes for rechargeable batteries, taking advantage of lithium’s extreme electrochemical potential and low density. Batteries are the leading application for lithium, accounting for approximately 65% of total lithium demand, including batteries for electric vehicles, which accounted for approximately 36% of total lithium demand.
There are many other applications both for basic lithium chemicals and lithium derivatives, such as lubricating greases (approximately 7% of total lithium demand), heat-resistant glass (ceramic glass) (approximately 5% of total lithium demand), chips for the ceramics and glaze industry (approximately 3% of total lithium demand), chemicals for air conditioning (approximately 2% of total lithium demand), and many others, including air treatment systems, pharmaceutical synthesis and metal alloys.
Lithium’s main properties, which facilitate its use in this range of applications, are that it:
| · | is the lightest solid metal and element at room temperature; |
| · | is low density; |
| · | has a low coefficient of thermal expansion; |
| · | has high electrochemical potential; and |
| · | has a high specific heat capacity. |
During 2018, lithium chemicals demand increased by approximately 27%, reaching approximately 269,000 metric tons. We expect applications related to energy storage to continue driving demand in the coming years.
Lithium: Our Products
We produce lithium carbonate at our Salar del Carmen facilities, near Antofagasta, Chile, from highly concentrated lithium chloride produced in the Salar de Atacama, as a by-product of the potassium chloride production. The annual production capacity of our lithium carbonate plant at the Salar del Carmen is 70,000 metric tons per year. In the future, we plan to increase our production capacity to 180,000 metric tons per year. We believe that the technologies we use, together with the high concentrations of lithium and the characteristics of the Salar de Atacama, such as high evaporation rate and concentration of other minerals, allow us to be one of the lowest cost producers worldwide.
We also produce lithium hydroxide at the same plant at the Salar del Carmen, next to the lithium carbonate operation. The lithium hydroxide facility has a production capacity of 13,500 metric tons per year and is one of the largest plants in the world.
The following table shows our total sales volumes and revenues from lithium carbonate and its derivatives for 2018, 2017 and 2016:
| 2018 | 2017 | 2016 | ||||||||||
| Sales volumes (Th. MT) | ||||||||||||
| Lithium and derivatives | 45.1 | 49.7 | 49.7 | |||||||||
| Total revenues (in US$ millions) | 734.8 | 644.6 | 514.6 | |||||||||
Our revenues in 2018 were US$734.8 million, a 14.0% increase from US$644.6 million in 2017, due to significantly higher prices during the year. The average price for 2018 was approximately 25.6% higher than the average price in 2017.
| 37 |
Lithium: Marketing and Customers
In 2018, we sold our lithium products in approximately 42 countries to approximately 160 customers, and most of our sales were to customers outside of Chile. Two customers each accounted for more than 10% of our lithium revenues in 2018, accounting for approximately 30% of our lithium revenues. Our ten largest customers accounted in the aggregate for approximately 74% of revenues. No supplier accounted for more than 10% of the cost of sales of this business line.
The following table shows the geographical breakdown of our revenues:
| Revenues breakdown | 2018 | 2017 | 2016 | |||||||||
| North America | 9 | % | 7 | % | 8 | % | ||||||
| Europe | 14 | % | 14 | % | 19 | % | ||||||
| Central and South America (excluding Chile) | 1 | % | 1 | % | 1 | % | ||||||
| Asia and Others | 76 | % | 79 | % | 73 | % | ||||||
We sell lithium carbonate and lithium hydroxide through our own worldwide network of representative offices and through our sales, support and distribution affiliates. We maintain inventories of these products at our facilities throughout the world to facilitate prompt delivery to customers. Sales of lithium carbonate and lithium hydroxide are made pursuant to spot purchase orders or within the framework of supply agreements. Supply agreements generally specify annual minimum and maximum purchase commitments, and prices are adjusted periodically, according to prevailing market prices.
Lithium: Competition
Lithium is produced mainly from two sources: (i) concentrated brines and (ii) minerals. During 2018, the main lithium brines producers were Chile, Argentina and China, while the main lithium mineral producers were Australia and China. With total sales of approximately 45,100 metric tons of lithium carbonate equivalent (LCE), SQM’s market share of lithium chemicals was approximately 17% in 2018. One of our main competitors is Albemarle Corporation (“Albemarle”), which produces lithium carbonate and lithium chloride in Chile and the United States, along with lithium derivatives in the United States, Germany, Taiwan and China, with a market share of approximately 28%. Albemarle also owns 49% of Talison Lithium Pty Ltd. (“Talison”), an Australian company, that is the largest producer of concentrated lithium minerals in the world, based in Western Australia. The remaining 51% of Talison is owned by Sichuan Tianqi Lithium Industries (“Tianqi”), a Chinese company producing basic lithium chemicals in China from concentrated lithium minerals. Talison sells a part of its concentrated lithium mineral production to the direct use market, but most of its production, representing approximately 26% of total lithium chemical demand, is converted into basic lithium chemicals in China by Tianqi and Albemarle.
Another important competitor is FMC Corporation (“FMC”), with an estimated market share of approximately 7%. FMC has production facilities in Argentina through Minera del Altiplano S.A., where it produces lithium chloride and lithium carbonate. In addition, FMC produces lithium derivatives in the United States and in the United Kingdom. Orocobre Ltd. is also based in Argentina and produces lithium carbonate, reaching a market share of approximately 4%.
Australia is an important source of concentrated lithium minerals. In 2018, two producers doubled their production of concentrated mineral, which is then converted into lithium chemicals in China. One of these producers is a joint venture between Ganfeng Lithium Co. (“Ganfeng”) and Mineral Resources Ltd in the Mt. Marion project. Galaxy Resources Ltd. is another important producer with operations in Mt. Cattlin. Additionally, three new players began shipping concentrated lithium minerals in 2018, Pilbara Minerals and Altura Mining, both producing from the Pilgangoora deposit, and Alliance Mineral Assets Ltd., producing from the Bald Hill deposit. In addition, there were at least ten other companies producing lithium in China from brines or minerals in 2018.
| 38 |
We believe that lithium production will increase in the near future, balancing the explosive growth in demand. A number of new projects to develop lithium deposits has been announced recently. Some of these projects are already in the advanced stages of development and others could materialize in the medium term.
Potassium
In 2018, our potassium chloride and potassium sulfate revenues amounted to US$267.5 million, representing 11.8% of our total revenues and a 29.5% decrease compared to 2017, as a result of reduced sales volumes. We estimate that we accounted for less than 2% of global sales of potassium chloride in 2018.
We produce potassium chloride by extracting brines from the Salar de Atacama that are rich in potassium chloride and other salts.
Potassium is one of the three macronutrients that a plant needs to develop. Although potassium does not form part of a plant’s structure, it is essential to the development of its basic functions. Potassium chloride is the most commonly used potassium-based fertilizer. It is used to fertilize crops that can tolerate relatively high levels of chloride, and to fertilize crops that are grown under conditions with sufficient rainfall or irrigation practices that prevent chloride from accumulating to excess levels in the rooting systems of the plant.
Some benefits that may be obtained through the use of potassium are:
| · | increased yield and quality; |
| · | increased production of proteins; |
| · | increased photosynthesis; |
| · | intensified transport and storage of assimilates; |
| · | prolonged and more intense assimilation period; |
| · | improved water efficiency; |
| · | regulated opening and closure of stomata; and |
| · | synthesis of lycopene. |
Potassium chloride is also an important component for our specialty plant nutrition product line, where it is used as a raw material to produce potassium nitrate.
Since 2009, our effective end product capacity has increased to over 2 million metric tons per year, granting us improved flexibility and market coverage.
Potassium: Market
During the last decade, growth in demand for potassium chloride, and for fertilizers in general, has been driven by several key factors, such as a growing world population, higher demand for protein-based diets and less arable land. All of these factors contribute to fertilizer demand growth as a result of efforts to maximize crop yields and use resources more efficiently. For the last ten years, the compound annual growth for the global potassium chloride market was approximately 1-2%. We estimate that demand totaled approximately 66 million metric tons in 2018, an increase from 64 million metric tons in 2017.
According to studies prepared by the International Fertilizer Industry Association, cereals account for approximately 45% of world potassium consumption, including corn (14%), rice (13%) and wheat (3%). Oilseeds, predominantly soybeans and palm oil, represent approximately 16% of total potassium demand. Fruits and vegetables account for approximately 22% of world potassium demand, and sugar crops account for close to 7%.
| 39 |
Potassium: Our Products
Potassium chloride differs from our specialty plant nutrition products because it is a commodity fertilizer and contains chloride. We offer potassium chloride in two grades: standard and compacted. Potassium sulfate is considered a specialty fertilizer and we offer this product in soluble grades.
The following table shows our sales volumes of and revenues from potassium chloride and potassium sulfate for 2018, 2017 and 2016:
| 2018 | 2017 | 2016 | ||||||||||
| Sales volumes (Th. MT) | ||||||||||||
| Potassium chloride and potassium sulfate | 831.8 | 1,344.3 | 1,534.7 | |||||||||
| Total revenues (in US$ millions) | 267.5 | 379.3 | 403.3 | |||||||||
Our revenues in 2018 were US$267.5 million, a 29.5% decrease from US$379.3 million in 2017, due to significantly lower sales volumes during the year. Our sales volumes in 2018 were approximately 38.1% lower than sales volumes reported last year as we focused on maximizing our yields of lithium in the Salar de Atacama.
Potassium: Marketing and Customers
In 2018, we sold potassium chloride and potassium sulfate to approximately 475 customers in over 58 countries. There were no individual customers that each accounted for more than 10% of our revenues of potassium chloride and potassium sulfate in 2018. We estimate that our ten largest customers accounted in the aggregate for approximately 47% of such revenues. One supplier accounted for more than 10% of the cost of sales of this business line, accounting for approximately 20% of the cost of sales for the business line.
The following table shows the geographical breakdown of our revenues:
| Revenues breakdown | 2018 | 2017 | 2016 | |||||||||
| North America | 19 | % | 18 | % | 20 | % | ||||||
| Europe | 17 | % | 19 | % | 20 | % | ||||||
| Central and South America (excluding Chile) | 30 | % | 38 | % | 38 | % | ||||||
| Asia and Others | 34 | % | 25 | % | 22 | % | ||||||
Potassium: Competition
We estimate that we accounted for less than 3% of global sales of potassium chloride in 2018. Our main competitors are Nutrien (formerly PCS), Uralkali, Belaruskali and Mosaic. We estimate that in 2018, PCS accounted for approximately 20% of global sales, Uralkali accounted for approximately 18% of global sales, Belaruskali accounted for approximately 18% of global sales and Mosaic accounted for approximately 15% of global sales.
In the potassium sulfate market, we have several competitors, of which the most important are K+S KALI GmbH (Germany), Tessenderlo Chemie (Belgium) and Great Salt Lake Minerals Corp. (United States). We estimate that these three producers account for approximately 30% of its worldwide production of potassium sulfate. SQM is no longer in the potassium sulfate market with own production.
| 40 |
Industrial Chemicals
In 2018, our revenues from industrial chemicals were US$108.3 million, representing approximately 4.8% of our total revenues for that year. We estimate that our market share in the industrial potassium nitrate market was approximately 34% for 2018.
In addition to producing sodium and potassium nitrate for agricultural applications, we produce different grades of these products for industrial applications. The different grades differ mainly in their chemical purity. We enjoy certain operational flexibility producing industrial nitrates, because they are produced from the same process as their equivalent agricultural grades, needing only an additional step of purification. We may, with certain constraints, shift production from one grade to the other depending on market conditions. This flexibility allows us to maximize yields and to reduce commercial risk.
In addition to producing industrial nitrates, we produce, market and sell industrial-grade potassium chloride.
Industrial Chemicals: Market
Industrial sodium and potassium nitrates are used in a wide range of industrial applications, including the production of glass, ceramics, explosives, charcoal briquettes, metal treatments together with various chemical processes.
In addition, this product line has also experienced growth from the use of industrial nitrates as thermal storage in concentrated solar power plants (commonly known as “CSP”). Solar salts for this specific application contain a blend of 60% sodium nitrate and 40% potassium nitrate by weight ratio used as a storage and heat transfer medium. Unlike traditional photovoltaic plants, these new plants use a “thermal battery” that contains molten sodium nitrate and potassium nitrate, which store the heat collected during the day. The salts are heated up during the day, while the plants are operating under direct sunlight, and at night they release the solar energy that they have captured, allowing the plants to operate even during hours of darkness. Depending on the power plant technology, solar salts are also used as a heat transfer fluid in the plant system and thereby make CSP plants even more efficient, increasing their output and reducing the Levelized Cost of Electricity (LCOE).
Experts believe that CSPs play a critical role in electricity grid stabilization and manageability due to their inherent large scale storage capability. Nevertheless, such large installations are capital intensive and are strongly influenced by the generation mix in each country. Therefore, fluctuations in solar salts demand are unavoidable in terms of quantity and timing. In 2017, we supplied CSP projects in South Africa, Morocco, Kuwait and Israel totaling over 88,000 metric tons. In 2018, we further supplied CSP plants reaching 47,000 metric tons.
We are also experiencing a growing interest in using solar salts in thermal storage solutions not related to CSP technology. Due to their proven performance, solar salts are being tested in industrial heat processes and heat waste solutions. These new applications may open new opportunities to the solar salts uses in the near future.
Industrial-grade potassium chloride is used as an additive in oil drilling as well as in food processing, among other applications.
| 41 |
Industrial Chemicals: Our Products
The following table shows our sales volumes of industrial chemicals and total revenues for 2018, 2017 and 2016:
| 2018 | 2017 | 2016 | ||||||||||
| Sales volumes (Th. MT) | ||||||||||||
| Industrial chemicals | 135.9 | 167.6 | 128.9 | |||||||||
| Total revenues (in US$ millions) | 108.3 | 135.6 | 104.1 | |||||||||
Revenues for industrial chemicals decreased from US$135.6 million in 2017 to US$108.3 million in 2018, as a result of lower sales volumes of solar salts in this business line. Sales volumes in 2018 decreased 18.9% compared to sales volumes reported last year.
Industrial Chemicals: Marketing and Customers
We sold our industrial nitrate products in approximately 54 countries in 2018 to approximately 293 customers. One customer accounted for more than 10% of our revenues of industrial chemicals in 2018, accounting for approximately 28%, and our ten largest customers accounted in the aggregate for approximately 56% of such revenues. No supplier accounted for more than 10% of the cost of sales of this business line.
The following table shows the geographical breakdown of our revenues for 2018, 2017 and 2016:
| Revenues breakdown | 2018 | 2017 | 2016 | |||||||||
| North America | 25 | % | 19 | % | 24 | % | ||||||
| Europe | 16 | % | 21 | % | 14 | % | ||||||
| Central and South America (excluding Chile) | 11 | % | 7 | % | 9 | % | ||||||
| Asia and Others | 48 | % | 53 | % | 54 | % | ||||||
We sell our industrial chemical products mainly through our own worldwide network of representative offices and through our sales and distribution affiliates. We maintain inventories of our different grades of sodium nitrate and potassium nitrate products at our facilities in Europe, North America, South Africa, Asia and South America to achieve prompt deliveries to customers. Our Research and Development department, together with our foreign affiliates, provides technical support to our customers and continuously works with them to develop new products or applications for our products.
Industrial Chemicals: Competition
We believe we are one of the leading producers of sodium nitrate and potassium nitrate for industrial uses. In the case of industrial sodium nitrate, we estimate that our sales represented close to 41% of world demand in 2018 (excluding internal demand for China and India, for which we believe reliable estimates are not available). Our competitors are mainly based in Europe and Asia, producing sodium nitrate as a by-product of other production processes. In refined grade sodium nitrate, BASF AG (“BASF”), a German corporation and several producers in China and Eastern Europe are highly competitive in the European and Asian markets. Our industrial sodium nitrate products also compete indirectly with substitute chemicals, including sodium carbonate, sodium sulfate, calcium nitrate and ammonium nitrate, which may be used in certain applications instead of sodium nitrate and are available from a large number of producers worldwide.
Our main competitor in the industrial potassium nitrate business is Haifa, which we estimate had a market share of 19%. We estimate that our market share was approximately 34% for 2018.
Producers compete in the market for industrial sodium and potassium nitrate based on reliability, product quality, price and customer service. We believe that we are a low-cost producer of both products and are able to produce high quality products.
| 42 |
In the industrial potassium chloride market, we are a relatively small producer, mainly supplying regional needs.
In the solar salts business, we believe we have been the market leader since we started selling to commercial projects in 2007. Our competitors include Haifa, which is a potassium nitrate supplier, and BASF, which is a sodium nitrate supplier.
Other Products
A large part of our other revenue is related to fertilizer trading, usually commodities. These fertilizers are traded in large volumes worldwide. We have developed a trade, supply and inventory management business that allows us to respond quickly and effectively to the changing fertilizer market in which we operate and profit on these trades.
Production Process
Our integrated production process can be classified according to our natural resources:
| · | caliche ore deposits, which contain nitrates, iodine and potassium; and |
| · | brines from the Salar de Atacama, which contain potassium, lithium, sulfate, boron and magnesium. |
Caliche Ore Deposits
Caliche ore deposits are located in northern Chile. During 2018, our mining operations concentrated in the first Region where we mainly worked in the mining sector Tente en el Aire and in the mining sector Nueva Victoria Oeste. Mining operations at the Pampa Blanca site, the El Toco mine (which is part of the María Elena site) and the Pedro de Valdivia site were suspended in March 2010, November 2013 and November 2015, respectively, in an effort to optimize our production facilities with lower production costs.
Caliche ore is found under a layer of barren overburden in seams with variable thickness from twenty centimeters to four meters, and with the overburden varying in thickness between half a meter and two meters.
Before proper mining begins, the exploration stage is carried out, including complete geological reconnaissance, sampling and drilling caliche ore to determine the quality and characteristics of each deposit. Drill-hole samples are properly identified and tested at our chemical laboratories. With the exploration information on a closed grid pattern of drill holes, the ore evaluation stage provides information for mine planning purposes. Mine planning is done on a long-term basis (ten years), medium-term basis (three years) and short-term basis (one year). Once all of this information has been compiled, detailed planning for the exploitation of the mine takes place.
The mining process generally begins with bulldozers first breaking and then removing the overburden in the mining area. This process is followed by an inspection and review of the drill holes before production drilling and blasting occurs to break the caliche seams. Front-end loaders load the ore onto off-road trucks, which take it to the leaching heaps to be processed.
During 2018, SQM continued running various tests with a continuous mining equipment replacing the drilling and blasting process and obtaining a smaller ore size (under 6 inches) that allows a better metallurgical recovery. The tests will continue into 2019.
| 43 |
The run of mine ore is loaded in heaps and leached with water to produce concentrated solutions containing iodine, nitrate and potassium. These solutions are then sent to plants where iodine is extracted through both solvent-extraction and blow out processes. The remaining solutions are subsequently sent to solar evaporation ponds where the solutions are evaporated and salts rich in nitrate and potassium are produced. These concentrated salts are then sent to Coya Sur where they are used to produce potassium nitrate.
During 2018, the Pedro de Valdivia site generated solutions produced by leaching the mine tailings. These solutions are treated at the iodide plant at Pedro de Valdivia. After iodide is obtained, the remaining solutions, which are rich in nitrate and potassium, are sent to the solar evaporation ponds at Coya Sur in order to be used in the production of potassium nitrate.
Caliche Ore-Derived Products
Caliche ore-derived products are: sodium nitrate, potassium nitrate, sodium potassium nitrate and iodine.
Sodium Nitrate
During 2018, sodium nitrate for both agricultural and industrial applications was produced by inventory generated at the Pedro de Valdivia facility and subsequently processed at the Coya Sur plants. The production at the Pedro de Valdivia facility, until November 2015, generated approximately 700,000 tons of inventory. As of December 2018, we had approximately 160,000 tons of crystallized sodium nitrate in inventory, which will provide us with enough sodium nitrate to produce finished nitrates for approximately one year. For subsequent production, we are developing the project of adapting the available crystallization plants at Coya Sur to be able to produce sodium nitrate using nitrate salts from our Nueva Victoria facility, which should be completed in 2019.
Crystallized sodium nitrate is an intermediate product that is subsequently processed further at the Coya Sur production plants to produce sodium nitrate, potassium nitrate and sodium potassium nitrate in different chemical and physical forms, including crystallized and prilled products. Finally, the products are transported by truck to our port facilities in Tocopilla for shipping to customers and distributors worldwide.
Potassium Nitrate
Potassium nitrate is produced at our Coya Sur facility using a production process developed in-house. The brines generated by the leaching process at Pedro de Valdivia are pumped to Coya Sur’s solar evaporation ponds for a nitrate concentration process. After the nitrate concentration process, the brine is pumped to a conversion plant where potassium salts from the Salar de Atacama and nitrate and potassium salts produced at Nueva Victoria or Coya Sur, are added. A chemical reaction begins, transforming sodium nitrate into potassium nitrate and discarding formed sodium chloride. This brine is pumped to a crystallization plant, which crystallizes the potassium nitrate by cooling it at atmospheric pressure, and separating it from the liquid by centrifuge.
Our current potassium nitrate production capacity at Coya Sur is approximately 1,300,000 metric tons per year. Since the end of 2013, we have been working with external advisors to implement the “lean” method of manufacturing in our potassium nitrate plants. We achieved complete implementation of this method of manufacturing during 2015. The improvements we have achieved have enabled us to reduce costs, improve energy consumption, increase the production of potassium nitrate and decrease our accident rates. This method is based on increasing the involvement of our workers in decision-making, and strengthening the leadership of our production supervisors. The goal is to identify opportunities to improve the production process and reduce waste on an ongoing basis.
During 2018, new operational improvements have been achieved by significantly integrating the production process of the Coya Sur facilities, allowing new increases in production capacity without major investments and improving the use of raw materials from the Salar de Atacama and Nueva Victoria.
| 44 |
Sodium Potassium Nitrate
Sodium potassium nitrate is a mixture of approximately two parts sodium nitrate per one part potassium nitrate. We produce sodium potassium nitrate at our Coya Sur prilling facilities using standard, non-patented production methods we have developed. Crystallized sodium nitrate is supplied together with the crystallized potassium nitrate to the prilling plant where it is mixed producing sodium potassium nitrate, which is then melted and prilled. The prilled sodium potassium nitrate is transported to Tocopilla for bulk shipment to customers.
The production process for sodium potassium nitrate is basically the same as that for sodium nitrate and potassium nitrate. With certain production restraints and following market conditions, we may supply sodium nitrate, potassium nitrate or sodium potassium nitrate, either in prilled or crystallized form.
The sodium nitrate and potassium nitrate produced at Coya Sur are transported to Tocopilla for shipping and delivery to customers and distributors. All potassium nitrate produced in crystallized or prilled form at Coya Sur has been certified by TÜV-Rheiland under the quality standard ISO 9001:2008.
Iodine and Iodine Derivatives
During 2018, we produced iodine at our facilities at Nueva Victoria (including the Iris facility) and Pedro de Valdivia. Iodine is extracted from solutions produced by leaching caliche ore.
As in the case of nitrates, the process of extracting iodine from the caliche ore is well established, but variations in the iodine and other chemical contents of the treated ore and other operating parameters require a high level of know-how to manage the process effectively and efficiently.
The solutions resulting from the leaching of caliche carry iodine in iodate form. Part of the iodate solution is reduced to iodide using sulfur dioxide, which is produced by combusting (burning) sulfur. The resulting iodide is combined with the rest of the untreated iodate solution to release elemental iodine in low concentrations. The iodine is then extracted from the aqueous solutions and concentrated in iodide form using a solvent extraction and stripping plant in the Pedro de Valdivia and Nueva Victoria facilities and using a blow out plant in Iris. The concentrated iodide is oxidized to metallic iodine, which is then refined through a smelting process and prilled. We have obtained patents in the United States and Chile (Chilean patent number 47,080) for our iodine prilling process.
Prilled iodine is tested for quality control purposes, using international standard procedures that we have implemented. It is then packed in 20 to 50 kilogram drums or 350 to 700 kilogram maxibags and transported by truck to Antofagasta, Mejillones, or Iquique for export. Our iodine and iodine derivatives production facilities have qualified under the ISO-9001:2008 program, providing third-party certification—by TÜV-Rheiland—of the quality management system. The last recertification process was approved in February 2011. Iodine from the Iris plant was certified under ISO-9001:2008 in April 2012.
Our total iodine production in 2018 was 11,255 metric tons: 8,842 metric tons from Nueva Victoria, 1,368 metric tons from Iris, and 1,046 metric tons from Pedro de Valdivia. Nueva Victoria is also equipped to toll iodine from iodide delivered from our other facilities. We have the flexibility to adjust our production according to market conditions. Following the production facility restructuring at Pedro de Valdivia and Nueva Victoria, along with the ramp-up of our new iodide plant in Nueva Victoria, our total current effective production capacity at our iodine production plants is approximately 14,000 metric tons per year
We use a portion of the iodine we produce to manufacture inorganic iodine derivatives, which are intermediate products used for manufacturing agricultural and nutritional applications, at facilities located near Santiago, Chile. We also produce inorganic and organic iodine derivative products together with Ajay, which purchases iodine from us. In the past, we have primarily sold our iodine derivative products in South America, Africa and Asia, while Ajay and its affiliates have primarily sold their iodine derivative products in North America and Europe.
| 45 |
In September 2010, CONAMA, currently known as the Environmental Evaluation Service, approved the environmental study of our Pampa Hermosa project in the Tarapacá Region of Chile. This environmental permit allows for an increase in the production capacity of our Nueva Victoria operations to 11,000 metric tons of iodine per year and to produce up to 1.2 million metric tons of crystallized nitrates, mine up to 37 million metric tons of caliche per year and use new water rights of up to 666.2 liters per second. In Iris, we are approved for 2,000 metric tons of iodine production per year, with an annual extraction of caliche ore up to 6.48 million metric tons per year. In recent years, we have made investments in order to increase the water capacity in the Nueva Victoria operations from two water sources approved by the environmental study of Pampa Hermosa, expand the capacity of solar evaporation ponds, and implement new areas of mining and collection of solutions. Our current production capacity at Nueva Victoria is approximately 12,500 metric tons per year of iodine (including the Iris operations) and 900,000 metric tons per year of nitrates. Additional expansions may be implemented from time to time in the future, depending on market conditions.
Salar de Atacama Brine Deposits
The Salar de Atacama, located approximately 250 kilometers east of Antofagasta, is a salt-encrusted depression in the Atacama Desert, within which lies an underground deposit of brines contained in porous sodium chloride rock fed by an underground inflow from the Andes mountains. Brines are pumped from depths of 1.5 to 60 meters below surface, through a field of wells that are located in the Salar de Atacama, distributed in areas authorized for exploitation, and which contain relatively high concentrations of potassium, lithium, sulfates, boron and other minerals.
The brines are estimated to cover a surface of approximately 2,800 square kilometers and contain commercially exploitable deposits of potassium, lithium, sulfates and boron. Concentrations vary at different locations throughout the Salar de Atacama. Our mining exploitation rights to the Salar de Atacama are pursuant to the Lease Agreement, which expires in 2030. The Lease Agreement, as amended in January 2019 by the Corfo Arbitration Agreement, permits the CCHEN to establish a total accumulated production and sales limit of up to 349,553 metric tons of lithium metallic equivalent (1,860,670 tons of lithium carbonate equivalent), which is in addition to the approximately 64,816 metric tons of lithium metallic equivalent (345,015 tons of lithium carbonate equivalent) remaining from the originally authorized amount. See “Item 3.D. Risk Factors” and “Item 8.A.7 Legal Proceedings.”
For the year ended December 31, 2018, revenues related to products originating from the Salar de Atacama represented 44% of our consolidated revenues, consisting of revenues from our potassium business line and our lithium and derivatives business line for the period. All of our products originating from the Salar de Atacama are derived from our extraction operations under the Lease Agreement. As of December 31, 2018, only 12 years remain on the term of the Lease Agreement.
Products Derived from the Salar de Atacama Brines
The products derived from the Salar de Atacama brines are: potassium chloride, potassium sulfate, potassium salts, lithium carbonate, lithium hydroxide, lithium chloride, boric acid and bischofite (magnesium chloride).
Potassium Chloride
We use potassium chloride in the production of potassium nitrate. Production of our own supplies of potassium chloride provides us with substantial raw material cost savings. We also sell potassium chloride to third parties, primarily as a commodity fertilizer.
| 46 |
In order to produce potassium chloride, brines from the Salar de Atacama are pumped to solar evaporation ponds. Evaporation of the water contained in the brine, results in a crystallized mixture of salts with various content levels of potassium, sodium and magnesium. In the first stage of the precipitation, sodium chloride salts are removed; these salts are not used in the production process of other products. After further evaporation, the sodium and potassium salts are harvested and sent for treatment at one of the wet potassium chloride plants where potassium chloride is separated by a grinding, flotation, and filtering process. In the final evaporation stage, salts containing magnesium are harvested and eventually can be treated at one of the cold leach plants where magnesium is removed. Potassium chloride is transported approximately 300 kilometers to our Coya Sur facilities via a dedicated truck transport system, where it is used in the production of potassium nitrate. We sell potassium chloride produced at the Salar de Atacama in excess of our needs to third parties. All of our potassium-related plants in the Salar de Atacama currently have a nominal production capacity in excess of up to 2.6 million metric tons per year. Actual production capacity depends on volume, metallurgical recovery rates and quality of the mining resources pumped from the Salar de Atacama.
The by-products of the potassium chloride production process are (i) solutions remaining after removal of the potassium chloride, which are used to produce lithium carbonate as described below, with the excess amount not required for lithium carbonate production being reinjected into the Salar de Atacama; (ii) sodium chloride, which is similar to the surface material of the Salar de Atacama and is deposited at sites near the production facility and (iii) other salts containing magnesium chloride.
Lithium Carbonate and Lithium Chloride
After the production of potassium chloride, a portion of the solutions remaining is sent to additional solar concentration ponds adjacent to the potassium concentration ponds. At this stage, the solution is concentrated and purified by precipitation to remove impurities it may still contain, including calcium, sulfate, potassium, sodium and magnesium. Next is the process of concentration and purification of the remaining concentrated solution of lithium chloride, which is transported by truck to the Salar del Carmen production facility located near Antofagasta, approximately 230 kilometers from the Salar de Atacama. At this plant, the solution is further purified and treated with sodium carbonate to produce lithium carbonate, which is dried and then, if necessary, compacted and finally packaged for shipment. The production capacity of our lithium carbonate facility at the end of 2018, following an expansion project was 70,000 metric tons per year. We are now beginning the preparation for the further expansion to 180,000 metric tons per year in the future.
Future production will depend on the actual volumes and quality of the lithium solutions sent by the Salar de Atacama operations, as well as prevailing market conditions. Our future production will also be subject to the extraction limit described in the Lease Agreement mentioned above. See “—Salar de Atacama Brine Deposits” and “Item 8.A.7 Legal Proceedings.”
Our lithium carbonate production quality assurance program has been certified by TÜV-Rheiland under ISO 9001 since 2005 and specifically under ISO 9001:2015 since September 2018.
Lithium Hydroxide
Lithium carbonate is sold to customers, and we also use it as a raw material for our lithium hydroxide production, which started operations at the end of 2005. We currently have two lithium hydroxide plants, one of which entered into operations at the end of 2018, and have a total production capacity of 13,500 metric tons per year. These plants are located in the Salar del Carmen, adjacent to our lithium carbonate operations. In the production process, lithium carbonate is reacted with a lime solution to produce lithium hydroxide brine and calcium carbonate salt, which is filtered and piled in reservoirs. The lithium hydroxide solution is evaporated in a multiple effect evaporator and crystallized to produce the lithium hydroxide, which is filtered, dried and packaged for shipment to customers.
| 47 |
Our lithium hydroxide production quality assurance program has been certified by TÜV-Rheiland under ISO 9001 since 2007 and specifically under ISO 9001:2015 since September 2018.
Potassium Sulfate and Boric Acid
Approximately 12 kilometers northeast of the potassium chloride facilities at the Salar de Atacama, we use the brines from the Salar de Atacama to produce potassium sulfate, potassium chloride (as a by-product of the potassium sulfate process) and, depending on market conditions, boric acid. The plant is located in an area of the Salar de Atacama where high sulfate and potassium concentrations are found in the brines to produce potassium sulfate. The brine is pumped to solar evaporation ponds, where sodium chloride salts are precipitated, harvested and put into piles. After further evaporation, the sulfate and potassium salts precipitate in different concentrations and are harvested and sent for processing to the potassium sulfate plant. Potassium sulfate is produced using flotation, concentration and reaction processes, after which it is crystallized, filtered, dried, classified and packaged for shipment.
Production capacity for the potassium sulfate plant is approximately 340,000 metric tons per year, of which approximately 95,000 metric tons correspond to potassium chloride obtained as a byproduct of the potassium sulfate process. This capacity is part of the total nominal plant capacity of 2.6 million metric tons per year. In our dual plant complex, we may switch, to some extent, between potassium chloride and potassium sulfate production. Part of the pond system in this area is also used to process potassium chloride brines extracted from the low sulfate concentration areas found in the Salar de Atacama. Depending on the conditions for the optimization of the deposit operation and/or market conditions, potassium sulfate production can be modified to produce potassium chloride.
The principal by-products of the production of potassium sulfate are: (i) non-commercial sodium chloride, which is deposited at sites near the production facility and (ii) remaining solutions, which are re-injected into the Salar de Atacama or returned to the evaporation ponds. The principal by-products of the boric acid production process are remaining solutions that are treated with sodium carbonate to neutralize acidity and then are reinjected into the Salar de Atacama.
Raw Materials
The main raw material that we require in the production of nitrate and iodine is caliche ore, which is obtained from our surface mines. The main raw material in the production of potassium chloride, lithium carbonate and potassium sulfate is the brine extracted from our operations at the Salar de Atacama.
Other important raw materials are sodium carbonate (used for lithium carbonate production and for the neutralization of iodine solutions), sulfuric acid, kerosene, anti-caking and anti-dust agents, ammonium nitrate (used for the preparation of explosives in the mining operations), woven bags for packaging our final products, electricity acquired from electric utilities companies, and liquefied natural gas and fuel oil for heat generation. Our raw material costs (excluding caliche ore and salar brines and including energy) represented approximately 14% of our cost of sales in 2018.
We have been connected to the northern power grid in Chile, which currently supplies electricity to most cities and industrial facilities in northern Chile, since April 2000. We have several electricity supply agreements signed with major producers in Chile, which are within the contract terms. Our electricity needs are primarily covered by the Electrical Energy Supply Agreement that we entered into with AES Gener S.A. on December 31, 2012. Pursuant to the terms of the Electrical Energy Supply Agreement, we are required to purchase an amount of electricity that exceeds the amount that we estimate we will need for our operations. The excess amount is sold at marginal cost, which could result in a material loss for us.
For the supply of liquefied natural gas, in 2013 and 2014 we had a contract with Solgas. For 2015, 2016 2017 and 2018, we executed supply contracts with Enel Chile S.A. as with Solgas, primarily to serve our operations at the Salar del Carmen and Coya Sur.
| 48 |
We obtain ammonium nitrate, sulfuric acid, kerosene and soda ash from several large suppliers, mainly in Chile and the United States, under long-term contracts or general agreements, some of which contain provisions for annual revisions of prices, quantities and deliveries. Diesel fuel is obtained under contracts that provide fuel at international market prices.
We believe that all of our contracts and agreements with third-party suppliers with respect to our main raw materials contain standard and customary commercial terms and conditions.
Water Supply
We hold water rights for the supply of surface and subterranean water near our production facilities. The main sources of water for our nitrate and iodine facilities at Pedro de Valdivia, María Elena and Coya Sur are the Loa and San Salvador rivers, which run near our production facilities. Water for our Nueva Victoria and Salar de Atacama facilities is obtained from wells near the production facilities. In addition, we buy water from third parties for our production processes at the Salar del Carmen lithium carbonate and lithium hydroxide plants, and we also purchase potable water from local utility companies. We have not experienced significant difficulties obtaining the necessary water to conduct our operations.
Government Regulations
Regulations in Chile Generally
We are subject to the full range of government regulations and supervision generally applicable to companies engaged in business in Chile, including labor laws, social security laws, public health laws, consumer protection laws, tax laws, environmental laws, free competition laws, and securities laws. These include regulations to ensure sanitary and safety conditions in manufacturing plants.
We conduct our mining operations pursuant to judicial exploration concessions and exploitation concessions granted pursuant to applicable Chilean law. Exploitation concessions essentially grant a perpetual right (with the exception of the Salar de Atacama rights, which have been leased to us until 2030) to conduct mining operations in the areas covered by such concessions, provided that annual concession fees are paid. Exploration concessions permit us to explore for mineral resources on the land covered thereby for a specified period of time, and to subsequently request a corresponding exploitation concession.
Under Law No. 16,319 that created the CCHEN, we have an obligation to the CCHEN regarding the exploitation and sale of lithium from the Salar de Atacama, which prohibits the use of lithium for nuclear fusion. In addition, CCHEN has imposed quotas that limit the total tonnage of lithium authorized to be sold.
We also hold water use rights granted by the respective administrative authorities and which enable us to have a supply of water from rivers or wells near our production facilities sufficient to meet our current operating requirements. See “Item 3.D. Risk Factors—Risks Relating to Chile—Changes in water rights laws and other regulations could affect our operating costs.” The Water Code and related regulations are subject to change, which could have a material adverse impact on our business, financial condition and results of operations.
We operate port facilities at Tocopilla, Chile for the shipment of products and the delivery of raw materials in conformity with maritime concessions, which have been granted by the respective administrative authority. These concessions are normally renewable on application, provided that such facilities are used as authorized and annual concession fees are paid.
| 49 |
In 2005, Law No. 20,026, known as the Law to Establish a Specific Tax on Mining Activity” ( Ley que Establece un Impuesto Específico a la Actividad Minera or the “Royalty Law”), established a royalty tax to be applied to mining activities developed in Chile. In 2010, modifications were made to the law and taxes were increased.
In 2012, new modifications to the tax laws were enacted to set the corporate tax rate at 20% for companies like SQM.
On September 29, 2014, Law No. 20,780 was published (the “Tax Reform”), introducing significant changes to the Chilean taxation system and strengthening the powers of the SII to control and prevent tax avoidance. Subsequently, on February 8, 2016, Law No. 20,899 that simplifies the income tax system and modifies other legal tax provisions was published. As a result of these reforms, open stock corporations, like SQM, are subject to the partially integrated shareholder tax regime ( sistema parcialmente integrado ). The corporate tax rate applicable to us increased gradually from 20% to 25.5% in 2017, and to the maximum rate of 27% in 2018.
The Tax Reform tax increase prompted a US$52.3 million increase in our deferred tax liabilities as of December 31, 2014. In accordance with IAS 12, the effects generated by the change in the income tax rate approved by the Tax Reform on income and deferred taxes were applied to the income statement. For purposes of the Company’s statutory consolidated financial statements filed with the CMF, in accordance with the instructions issued by the CMF in its circular 856 of October 17, 2014, the effects generated by the change in the income tax rate were accounted for as retained earnings. The amount charged to equity as of December 31, 2014 was US$52.3 million, thereby giving rise to a difference of US$52.3 million in profit for the year and income tax expense as presented in the Company’s 2014 audited consolidated financial statements in its annual report on Form 20-F compared with profit and income tax expense as presented in the Company’s 2014 statutory consolidated financial statements filed with the CMF.
The Chilean government may again decide to levy additional taxes on mining companies or other corporations in Chile, and such taxes could have a material adverse impact on our business, financial condition and results of operations.
We are also subject to the Chilean Labor Code and the Subcontracting Law, which are overseen by the Labor Authority ( Dirección del Trabajo), the National Geology and Mining Service ( Servicio Nacional de Geología y Minería or “Sernageomin”), and the National Health Service. Recent changes to these laws and their application may have a material adverse effect on our business, financial condition and results of operations. See “Item 3.D. Risk Factors—Risks Relating to Our Business—We are exposed to labor strikes and labor liabilities that could impact our production levels and costs.”
In addition, we are subject to Law No. 20,393, which establishes criminal liability for legal entities, for the crimes of (a) asset laundering, (b) financing terrorism and (c) bribery. Potential sanctions for violations under this law could include (i) fines, (ii) loss of certain governmental benefits during a given period, (iii) a temporary or permanent bar against the corporation executing contracts with governmental entities, and (iv) dissolution of corporation.
Finally, we are governed by the Securities Law and Law No. 18,046 on Corporations ( Ley de Sociedades Anónimas or the “Chilean Corporations Act”), which regulates corporate governance. Specifically, the Chilean Corporations Act regulates, among other things, independent director requirements, disclosure obligations to the general public and to the CMF, as well as regulations relating to the use of inside information, the independence of external auditors, and procedures for the analysis of transactions with related parties. See “Item 6.C. Board Practices” and “Item 7.B. Related Party Transactions.”
There are currently no material legal or administrative proceedings pending against us except as discussed under “Item 8.A.7 Legal Proceedings”, in Note 22.1 to our Consolidated Financial Statements and below under “Safety, Health and Environmental Regulations in Chile.”
| 50 |
Safety, Health and Environmental Regulations in Chile
Our operations in Chile are subject to both national and local regulations related to safety, health and environmental protection. In Chile, the main regulations on these matters that are applicable to us are the Mine Health and Safety Act of 1989 ( Reglamento de Seguridad Minera or the “Mine Health and Safety Act”), the Health Code ( Código Sanitario ), the Health and Basic Conditions Act of 1999 ( Reglamento sobre Condiciones Sanitarias y Ambientales Básicas en los Lugares de Trabajo or the “Health and Basic Conditions Act”), the Subcontracting Law and the Environmental Law of 1994, amended in 2010 ( Ley sobre Bases Generales del Medio Ambiente or the “Environmental Law”).
Health and safety at work are fundamental aspects in the management of mining operations, which is why we have made constant efforts to maintain good health and safety conditions for the people working at our mining sites and facilities. In addition to the role played by us in this important matter, the Chilean government has a regulatory role, enacting and enforcing regulations in order to protect and ensure the health and safety of workers. The Chilean government, acting through the Ministry of Health and the Sernageomin, performs health and safety inspections at the mining sites and oversees mining projects, among other tasks, and it has exclusive powers to enforce standards related to environmental conditions and the health and safety of the people performing activities related to mining.
The Mine Health and Safety Act protects workers and nearby communities against health and safety hazards, and it provides for enforcement of the law where compliance has not been achieved. Our Internal Mining Standards ( Reglamentos Internos Mineros ) establish our obligation to maintain a workplace where safety and health risks are managed appropriately. We are subject to the general provisions of the Health and Basic Conditions Act, our own internal standards and the provisions of the Mine Health and Safety Act. In the event of non-compliance, the Ministry of Health and particularly the Sernageomin are entitled to use their enforcement powers to ensure compliance with the law.
In November 2011, the Ministry of Mining enacted Law No. 20,551 that Regulates the Closure of Mining Sites and Facilities ( Ley que Regula el Cierre de Faenas e Instalaciones Mineras ). This statute entered in force in November 2012 and required all mining sites to present or update their closure plans as of November 2014. SQM has fulfilled this requirement for all of its mining sites and facilities. The main requirements of the law are related to disclosures to the Sernageomin regarding decommissioning plans for each mining site and its facilities, along with the estimated cost to implement such plans. The mining site closure plans are approved by Sernageomin and the corresponding financial assurances are subject to approval by the CMF. In both cases, SQM has received the requisite approvals.
The new and modified Chilean Environmental Law defines the Ministry of the Environment as the governmental agency responsible for coordinating and supervising environmental issues. The Environmental Assessment Service is responsible for reviewing environmental assessments of new projects or significant modifications of existing ones, and the decision to grant or reject environmental permits rests with the Environmental Assessment Commission. On the other hand, the Superintendence for the Environment is responsible for supervising environmental performance during the construction, operation and closure of the projects that have been evaluated for environmental permits, and it is also responsible for enforcing compliance with prevention and atmospheric decontamination plans. The Environmental Law also promotes citizen participation in project evaluation and implementation, providing more opportunities for observations or objections to be made during the environmental evaluation process. Annually, the Superintendence for the Environment audits a sample of approved projects to verify compliance with the environmental permits, and it may pursue fines or sanctions if applicable, which can be challenged in the Environmental Court.
| 51 |
We continuously monitor the impact of our operations on the environment and on the health of our employees and other persons who may be affected by such operations. We have made modifications to our facilities in an effort to eliminate any adverse impacts. Also, over time, new environmental standards and regulations have been enacted, which have required minor adjustments or modifications of our operations. We anticipate that additional laws and regulations will be enacted over time with respect to environmental matters. There can be no assurance that future legislative or regulatory developments will not impose new restrictions on our operations. We are committed to continuously improving our environmental performance through our Environmental Management System (“EMS”), voluntary evaluations, such as Ecovadis, and international certifications, such as the Responsible Conduct certification from the Chilean Industrial Chemicals Association, which applies to our operations at Nueva Victoria, and the Protect&Sustain certification from the International Fertilizer Association, which applies to our operations at Coya Sur, the Salar de Atacama, Tocopilla, Antofagasta and Santiago.
We have submitted and will continue to submit several environmental impact assessment studies related to our projects to the governmental authorities. We require the authorization of these submissions in order to maintain and to increase our production capacity.
International Regulations
We are subject to complex regulatory requirements in the various jurisdictions in which we operate, including the following:
At the end of 2018, the European Parliament, the Council of Member States of the European Union and the European Commission agreed to a new regulation for fertilizers. The new European regulation reduces the maximum content limit of perchlorates in inorganic fertilizer with macronutrients, such as the potassium nitrate sold by us, to 0.005%. In addition to this limit, the regulation incorporates maximum levels of other pollutants, such as heavy metals, and establishes a new procedure – called a conformity assessment – to be undertaken prior to the commercialization of fertilizers in Europe. The fertilizers that we sell contain less than 0.005% of perchlorate; however, the Food Chain Security unit of the General Health and Consumer Affairs Council initiated a revision of the perchlorate limits in food that have been in force and effect since June 2015, following the European Food Safety Authority’s (“EFSA”) evaluation of human exposure to perchlorate in food and in drinkable water. We expect a new definition of the new limits of perchlorates in food in the near term.
Under the requirements of Regulation (EC) No. 1907/2006, the records of potassium nitrate and sodium nitrate were updated according to the latest format IUCLID. In turn, during the year 2018, ten new registrations were made corresponding to the substances sold by our new subsidiary SQM International. The strategy for the implementation of the requirements of the Article 45 of Regulation (EC) No. 1272/2008 was defined, under which the Toxicological Information Centers must be informed about the composition of hazardous mixtures prior to their commercialization. For this implementation, an internal numerical code was developed for the identification of all the fertilizer mixtures sold by SQM Europe and SQM Iberian.
In August 2017, United States Environmental Protection Agency (“US-EPA”) published the Inventory Notification (Active-Inactive) Requirements regulation under the Toxic Substances Control Act which established that as of February 7, 2018, SQM North America Corp. must provide information with respect to all chemical substances imported into the United States during 2006-2016. In January 2018, this notification was made, and all substances sold are listed as active, which has been reported to customers who have requested it. In the United States, SQM North America re-certified before the Organic Materials Review Institute all products sold by it in this market.
In South Korea, SQM registered sodium nitrate under the K-REACH standard, using an Exclusive Representative to facilitate the regulatory compliance of our customers in this market. At the end of December 2018, an amendment to the K-REACH regulation was passed, pursuant to which all chemical substances are subject to registration. SQM is evaluating the regulatory change, which applies to four SQM products currently sold in South Korea, establishing the necessary alliances to facilitate compliance with this new requirement, which considers as a first stage a pre-notification in June 2019.
| 52 |
On August 8, 2018, Normative Instruction No. 39 became effective in Brazil, establishing definitions, requirements, specifications, guarantees, product registrations, authorizations, packaging, fertilizer product labels, mineral fertilizer tolerances, among others, repealing Normative Instruction No. 46 of 2016 and defining new requirements for exports to Brazil.
During 2018, the Ecuadorian Agricultural Quality Assurance Agency (AGROCALIDAD) made two modifications (resolutions 031 of March 2018 and 0218 of December 2018) to the general regulations for the registration and control of fertilizers. As a result of both modifications, SQM Ecuador had to adapt its fertilizer registration and labeling processes.
The opening of SQM Colombia during 2018 opened a new challenge for the processing of new fertilizer registrations. Currently, eight products are registered and work is being done on the definition of all the new products to be registered.
On October 9, 2018, NOM-018-STPS-2015 on the Harmonized System for the identification and communication of hazards and risks by hazardous chemical substances in the workplace came into effect in Mexico. SQM Mexico has implemented this regulation in all its productive tasks, in the Safety Data Sheets and in the labeling of applicable products.
Research and Development, Patents and Licenses
See “Item 5.C. Research and Development, Patents and Licenses.”
4.C. Organizational Structure
All of our principal operating subsidiaries are essentially wholly-owned, except for SQMC, which is approximately 61% owned by us and whose shares are listed and traded on the Santiago Stock Exchange, and Ajay SQM Chile S.A., which is 51% owned by us. The following is a summary of our main subsidiaries as of December 31, 2018. For a list of all our consolidated subsidiaries, see Note 2.5 to our Consolidated Financial Statements.
| 53 |
| Principal subsidiaries | Activity |
Country of
Incorporation |
SQM Beneficial
Ownership Interest (Direct/Indirect) |
|||||
| SQM Nitrates S.A. | Extracts and sells caliche ore to subsidiaries and affiliates of SQM | Chile | 100 | % | ||||
| SQM Industrial S.A. | Produces and markets SQM’s products directly and through other subsidiaries and affiliates of SQM | Chile | 100 | % | ||||
| SQM Salar S.A. | Exploits the Salar de Atacama to produce and market SQM’s products directly and through other subsidiaries and affiliates of SQM | Chile | 100 | % | ||||
| SQM Potasios S.A. | Produces and markets SQM’s products directly and through other subsidiaries and affiliates of SQM | Chile | 100 | % | ||||
| Servicios Integrates de Transitos y Transferencias S.A. (SIT) | Owns and operates a rail transport system and also owns and operates the Tocopilla port facilities | Chile | 100 | % | ||||
| Soquimich Comercial S.A. | Markets SQM’s specialty plant nutrition products domestically and imports fertilizers for resale in Chile | Chile | 61 | % | ||||
| Ajay-SQM Chile S.A. | Produces and markets SQM’s iodine and iodine derivatives | Chile | 51 | % | ||||
| Sales and distribution subsidiaries in the United States, Argentina, Belgium, Brazil, China, Colombia, Ecuador, Mexico, Peru, South Africa, Spain, and other locations. | Market SQM’s products throughout the world | Various | ||||||
4.D. Property, Plant and Equipment
We carry out our operations through the use of mining rights, production facilities and transportation and storage facilities. Discussion of our mining rights is organized below according to the geographic location of our mining operations. Our caliche ore mining interests are located throughout the valley of the Tarapacá and Antofagasta regions of northern Chile (in a part of the country known as “el Norte Grande”). From caliche ore, we produce products based on nitrates and iodine, and caliche also contains concentrations of potassium. Our mining interests in the brine deposits of the Salar de Atacama are found within the Atacama Desert, in the eastern region of el Norte Grande. From these brines we produce products based on potassium, sulfate, lithium and boron.
| 54 |
The map below shows the location of our principal mining operations and the exploitation and exploration mining concessions that have been granted to us, as well as the mining properties that we lease from Corfo:
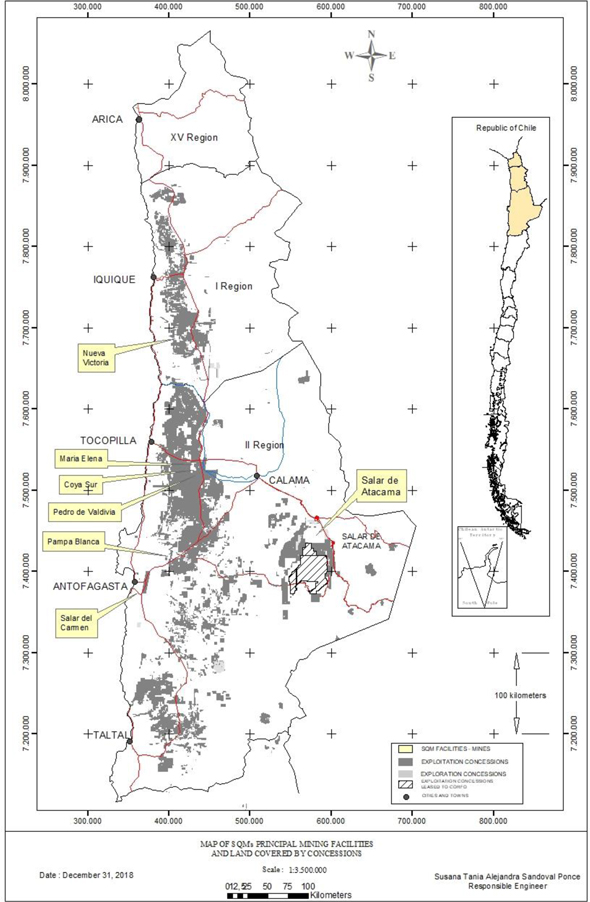
| 55 |
Mining Concessions
Mining Concessions for the Exploration and Exploitation of Caliche Ore Mining Resources
We hold our mining rights pursuant to mining concessions for exploration and exploitation of mining resources that have been granted pursuant to applicable law in Chile:
| (1) | “Mining Exploitation Concessions”: entitle us to use the land in order to exploit the mineral resources contained therein on a perpetual basis, subject to annual payments to the Chilean government; and |
| (2) | “Mining Exploration Concessions”: entitle us to use the land in order to explore for and verify the existence of mineral resources for a period of two years, at the expiration of which the concession may be extended one time only for two additional years, if the area covered by the concession is reduced by half. We may alternatively request an exploitation concession in respect of the area covered by the original exploration concession, which must be made within the timeframe established by the original exploration concession. |
A Mining Exploration Concession is generally obtained for purposes of evaluating the mineral resources in a defined area. If the holder of the Mining Exploration Concession determines that the area does not contain commercially exploitable mineral resources, the Mining Exploration Concession is usually allowed to lapse. An application also can be made for a Mining Exploitation Concession without first having obtained a Mining Exploration Concession for the area involved.
As of December 31, 2018, the surface area covered by Mining Exploitation Concessions that have been granted in relation to the caliche resources of our mining sites is approximately 573,599 hectares. In addition, as of December 31, 2018, the surface area covered by Mining Exploration Concessions in relation to the caliche resources of our mining sites is approximately 1,700 hectares. We have not requested additional mining rights.
Mining Concessions for the Exploitation of Brines at the Salar de Atacama
As of December 31, 2018, our subsidiary SQM Salar held exclusive rights to exploit the mineral resources in an area covering approximately 140,000 hectares of land in the Salar de Atacama in northern Chile, of which SQM Salar is only entitled to exploit the mineral resources in 81,920 hectares. These rights are owned by Corfo and leased to SQM Salar pursuant to the Lease Agreement. Corfo cannot unilaterally amend the Lease Agreement, and the rights to exploit the resources cannot be transferred. The Lease Agreement establishes that SQM Salar is responsible for making quarterly lease payments to Corfo according to specified percentages of the value of production of minerals extracted from the Salar de Atacama brines, maintaining Corfo’s rights over the Mining Exploitation Concessions and making annual payments to the Chilean government for such concession rights. The Lease Agreement was entered into in 1993 and expires on December 31, 2030.
Under the terms of the Project Agreement, Corfo has agreed that it will not permit any other person to explore, exploit or mine any mineral resources in the approximately 140,000 hectares area of the Salar de Atacama mentioned above. The Project Agreement expires on December 31, 2030.
SQM Salar holds an additional 236,842 hectares of constituted Mining Exploitation Concessions in areas near the Salar de Atacama, which correspond to mining reserves that have not been exploited. SQM Salar also holds Mining Exploitation Concessions that are in the process of being granted covering 3,900 hectares in areas near the Salar de Atacama.
| 56 |
In addition, as of December 31, 2018, SQM Salar held Mining Exploration Concessions covering approximately 22,100 hectares and had applied for additional Mining Exploration Concessions of approximately 2,600 hectares. Exploration rights are valid for a period of two years, after which we can (i) request a Mining Exploitation Concession for the land, (ii) request an extension of the Mining Exploration Concession for an additional two years (the extension only applies to a reduced surface area equal to 50% of the initial area) or (iii) allow the concession to expire.
According to the terms of the Lease Agreement, with respect to lithium production, the CCHEN established a total accumulated extraction limit set as amended by the Corfo Arbitration Agreement in January 2018, up to 349,553 metric tons of lithium metallic equivalent (1,860,670 tons of lithium carbonate equivalent), which is in addition to the approximately 64,816 metric tons of lithium metallic equivalent (345,015 tons of lithium carbonate equivalent) remaining from the originally authorized amount in the aggregate for all periods while the Lease Agreement is in force. As of December 31, 2018, only 12 years remain on the term of the Lease Agreement. See “Item 3.D. Risk Factors” and “Item 8.A.7 Legal Proceedings.”
Concessions Generally
As of December 31, 2018, approximately 97% of SQM’s mining interests were held pursuant to Mining Exploitation Concessions and 3% pursuant to Mining Exploration Concessions. Of the Mining Exploitation Concessions, approximately 97% already have been granted pursuant to applicable Chilean law, and approximately 3% are in the process of being granted. Of the Mining Exploration Concessions, approximately 87% already have been granted pursuant to applicable Chilean law, and approximately 13% are in the process of being granted.
In 2018, we made payments of US$8.2 million to the Chilean government for Mining Exploration and Exploitation Concessions, including the concessions we lease from Corfo. These payments do not include the payments we made directly to Corfo pursuant to the Lease Agreement, according to the percentages of the sales price of products produced using brines from the Salar de Atacama.
The following table shows the Mining Exploitation and Exploration Concessions held by SQM, including the mining properties we lease from Corfo, as of December 31, 2018:
|
Exploitation
Concessions |
Exploration
Concessions |
Total | ||||||||||||||||||||||
| Region of Chile |
Total
Number |
Hectares |
Total
Number |
Hectares |
Total
Number |
Hectares | ||||||||||||||||||
| Region I | 2,803 | 525,946 | 47 | 16,200 | 2,850 | 542,146 | ||||||||||||||||||
| Region II | 8,807 | 2,320,527 | 125 | 53,100 | 8,932 | 2,373,627 | ||||||||||||||||||
| Region III and others | 441 | 99,885 | 40 | 11,400 | 481 | 111,285 | ||||||||||||||||||
| Total | 12,051 | 2,946,358 | 212 | 80,700 | 12,363 | 3,027,058 | ||||||||||||||||||
The majority of the Mining Exploitation Concessions held by SQM were requested primarily for non-metallic mining purposes. However, a small percentage of our Mining Exploration Concessions were requested for metallic mining purposes. The annual payment to the Chilean government for this group of concessions is higher.
Geological studies over mining properties that were requested primarily for non-metallic mining purposes may show that the concession area is of interest for metallic mining purposes, in which case we must inform the Sernageomin, indicating that the type of substance contained by such Mining Concessions has changed, for purposes of the annual payment for these rights.
| 57 |
Caliche: Facilities and Reserves
Caliche: Facilities
During 2018, caliche ore mining operations were focused in the first region of Chile, and our Nueva Victoria mine was exploited at two sites: Tente en el Aire and Oeste. In November 2015, the mining and nitrate operations at Pedro de Valdivia were suspended, and iodine production was reduced at the Pedro de Valdivia site, in order to take advantage of the highly efficient production facilities at Nueva Victoria. Operations at the Pampa Blanca site were suspended in 2010, and heap leaching operations at the María Elena site were suspended in October 2013, although iodine processing continued until 2017.
Nueva Victoria
The Nueva Victoria mine and facilities are located 140 kilometers southeast of Iquique and are accessible by highway. Since 2007, the Nueva Victoria mine includes the mining properties Soronal, Mapocho and Iris. At this site, we use caliche to produce salts rich in nitrates and iodine, through heap leaching and the use of solar evaporation ponds. The main production facilities at this site include the operation centers for the heap leaching process, the iodide and iodine plants at Nueva Victoria and Iris and the evaporation ponds at the Sur Viejo sector of the site. The areas currently being mined are located approximately 4 kilometers northeast of Nueva Victoria. Solar energy and electricity are the primary sources of power for this operation.
Pampa Blanca
The mining facilities at Pampa Blanca, which is located 100 kilometers northeast of Antofagasta, have been suspended since March 2010. At this site, we used caliche to produce nitrates and iodine through heap leaching and the use of solar evaporation ponds. The main production facilities at this site included the operation centers for the heap leaching system and the iodide plant. Electricity was the primary source of power for this operation.
Pedro de Valdivia
The Pedro de Valdivia mine and facilities are located 170 kilometers northeast of Antofagasta and are accessible by highway. At this site, we used caliche to produce nitrates and iodine through vat leaching and solar evaporation ponds. The main production facilities at this site include the crushing, vat leaching, fines processing, nitrate crystallization plant, and iodide and iodine plants. In November 2015, the mining and nitrate operations at Pedro de Valdivia were suspended, and iodine production was reduced. Electricity, natural gas and fuel oil are the primary sources of power for this operation.
María Elena
The María Elena mine and facilities, named El Toco, are located 220 kilometers northeast of Antofagasta and are accessible by highway. Until February 2010, caliche was used at this facility to produce nitrates and iodine through vat leaching. Subsequently, these facilities were equipped to produce nitrates and iodine through the use of heap leaching and solar evaporation ponds. Heap leaching operations at this site were suspended in October 2013. During 2017, we continued to produce solutions rich in iodine and nitrates by leaching the mine tailings. which were treated at the iodide plant at María Elena, and subsequently the prilled iodine is produced at Pedro de Valdivia. This process was discontinued at the end of 2017.
Caliche: Reserves
Our in-house staff of geologists and mining engineers prepares our estimates of caliche ore reserves. The Proven and Probable Reserve figures presented below are estimates, and may be subject to modifications due to natural factors that affect the distribution of mineral grades, which would, in turn, modify the recovery of nitrate and iodine. Therefore, no assurance can be given that the indicated levels of recovery of nitrates and iodine will be realized.
| 58 |
We estimate ore reserves based on evaluations, performed by engineers and geologists, of assay values derived from sampling of drill-holes and other openings. Drill-holes have been made at different space intervals in order to recognize mining resources. Normally, we start with 400x400 meters and then we reduce spacing to 200x200 meters, 100x100 meters and 50x50 meters. The geological occurrence of caliche ore is unique and different from other metallic and non-metallic minerals. Caliche ore is found in large horizontal layers at depths ranging from one to four meters and has an overburden between zero and two meters. This horizontal layering is a natural geological condition and allows the Company to estimate the continuity of the caliche bed based on surface geological reconnaissance and analysis of samples and trenches. Mineral resources can be calculated using the information from the drill-hole sampling.
A Mineral Resource is a concentration or occurrence of natural, solid, inorganic or fossilized organic material in or on the Earth’s crust in such form or quantity and of such grade or quality that it has reasonable prospects for economic extraction. The location, quantity, grade, geological characteristics and continuity of a mineral resource are known, estimated or interpreted from specific geological, metallurgical and technological evidence.
A Measured Resource is the part of a Mineral Resource for which tonnage, densities, shape, physical characteristics, grade and mineral content can be estimated with a high level of confidence. The estimate is based on detailed exploration, sampling and testing information gathered through appropriate sampling techniques from locations such as outcrops, trenches, and exploratory drill holes.
An Indicated Mineral Resource is the part of a Mineral Resource for which tonnage, densities, shape, physical characteristics, grade and mineral content can be estimated with a reasonable level of confidence. The estimate is based on detailed exploration, sampling and testing information gathered through appropriate sampling techniques from locations such as outcrops, trenches and exploratory drill holes.
According to our experience in caliche ore, the grid pattern drill-holes with spacing equal to or less than 100 meters produce data on the caliche resources that is sufficiently defined to consider them Measured Resources and then, adjusting for technical, economic and legal aspects, as Proven Reserves. These reserves are obtained using the Kriging Method and the application of operating parameters to obtain economically profitable reserves.
Similarly, the information obtained from detailed geologic work and samples taken from grid pattern drill-holes with spacing equal to or less than 200 meters can be used to determine Indicated Resources. By adjusting such Indicated Resources to account for technical, economic and legal factors, it is possible to calculate Probable Reserves. Probable Reserves are calculated by using a polygon-based methodology and have an uncertainty or margin of error greater than that of Proven Reserves. However, the degree of certainty of Probable Reserves is high enough to assume continuity between points of observation.
Proven Reserves are the economically mineable part of a Measured Resource. The calculation of the reserves includes the application of mining parameters including maximum overburden, minimum thickness of caliche ore, stripping ratio, cutoff grade and application of dilution factors to the grade values. Appropriate assessments, including pre-feasibility studies or feasibility studies, have been carried out and include consideration of metallurgical, economic, marketing, legal, environmental, social and governmental factors. These assessments demonstrate at the time of reporting that extraction is reasonably justified.
Probable Reserves are the economically mineable part of an Indicated Resource and in some cases a Measured Resource. The calculation of the reserves includes the application of mining parameters including maximum overburden, minimum thickness of caliche ore, stripping ratio, cutoff grade and application of dilution factors to the grade values. Appropriate assessments, including pre-feasibility studies, have been carried out or are in process and include consideration of metallurgical, economic, marketing, legal, environmental, social and governmental factors. These assessments demonstrate at the time of reporting that extraction is reasonably justified.
| 59 |
The estimates of Proven Reserves of caliche ore at each of our mines as of December 31, 2018 are set forth below. The Company holds 100% of the concession rights for each of these mines.
| Mine |
Proven Reserves (1)
(millions of metric tons) |
Nitrate Average
Grade (percentage by weight) |
Iodine Average
Grade (parts per million) |
Cutoff Grade
Average for Mine (2) |
||||||||||
| Pedro de Valdivia | 109.0 | 7.1 | % | 377 | Nitrate 6.0 % | |||||||||
| María Elena | 83.3 | 7.2 | % | 436 | Iodine 300 ppm | |||||||||
| Pampa Blanca | 54.7 | 5.7 | % | 538 | Iodine 300 ppm | |||||||||
| Nueva Victoria | 280.6 | 6.4 | % | 423 | Iodine 300 ppm | |||||||||
In addition, the estimates of our Probable Reserves of caliche ore at each of our principal mines as of December 31, 2018, are as follows:
| Mine |
Probable
Reserves (3) (millions of metric tons) |
Nitrate Average Grade
(percentage by weight) |
Iodine Average
Grade (parts per million) |
Cutoff Grade (2) | ||||||||||
| Pedro de Valdivia | 334.7 | 7.3 | % | 421 | Nitrate 6.0 % | |||||||||
| María Elena | 148.8 | 7.2 | % | 381 | Iodine 300 ppm | |||||||||
| Pampa Blanca | 464.6 | 5.7 | % | 540 | Iodine 300 ppm | |||||||||
| Nueva Victoria | 1,020.7 | 5.3 | % | 421 | Iodine 300 ppm | |||||||||
| (1) | The Proven Reserves set forth in the table above are shown before losses related to exploitation and mineral treatment. Proven Reserves are affected by mining exploitation methods, which result in differences between the estimated reserves that are available for exploitation in the mining plan and the recoverable material that is finally transferred to the leaching vats or heaps. The average mining exploitation factor for each of our different mines ranges between 80% and 90%, whereas the average global metallurgical recoveries of processes for nitrate and iodine contained in the recovered material vary between 60% and 70%. |
| (2) | The cutoff grades for the Proven and Probable Reserves vary according to the objectives of each mine. These amounts correspond to the averages of the different areas. |
| (3) | Probable Reserves can be expressed as Proven Reserves using a conversion factor, only for purposes of obtaining a projection to be used for long-term planning purposes. On average, this conversion factor is higher than 60%, depending on geological conditions and caliche ore continuity, which vary from mine to mine (Pedro de Valdivia 60%, María Elena 50%, Pampa Blanca 70% and Nueva Victoria 60%). |
The complete technical supporting documentation for the information set forth in the table above is contained in the report “Methodology, Procedure, and Classification of SQM’s Nitrate and Iodine Resources and Reserves for the Year 2018,” was prepared for each mine by the geologist Vladimir Tejerina and other engineering professionals employed by SQM and validated by Mr. Sergio Alarcón and Mr. Orlando Rojas.
Mr. Sergio Alarcón is a geologist with more than 30 years of experience in the field. He is currently employed by SQM as a Senior Geologist in the Mining Production area. Mr. Alarcón is a Competent Person ( Persona Competente ), as that term is defined under Chilean Law No. 20,235, known as the Law that Regulates the Position of Competent Person and Creates the Qualifying Committee for Competencies in Mining Resources and Reserves ( Ley que Regula la Figura de las Personas Competentes y Crea la Comisión Calificadora de Competencias de Recursos y Reservas Mineras or “Competent Person Law”). He is registered under No. 164 in the Public Registry of Competent Persons in Mining Resources and Reserves in accordance with the Competent Person Law and related regulations. He has worked as a geologist with both metallic and non-metallic deposits, with vast experience in the latter.
| 60 |
Mr. Orlando Rojas is a civil mining engineer and independent consultant. He is Partner and Chief Executive Officer of the company EMI-Ingenieros y Consultores S.A., whose offices are located at Los Domínicos No 7772, Las Condes, Santiago, Chile. He is a member of the Institute of Mining Engineers and is registered under No. 118 in the Public Registry of Competent Persons in Mining Resources and Reserves in accordance with the Competent Person Law and related regulations. He has worked as a mining engineer for 40 years since graduating from university, including more than 34 years working on estimates for reserves and resources.
Copies of the certificates of qualified competency issued by the Chilean Mining Commission are attached hereto as Exhibits 99.1 and 99.2.
The proven and probable reserves shown above are the result of the evaluation of approximately 23.38% of the total caliche-related mining property of our Company. However, we have explored more intensely the areas in which we believe there is a higher potential of finding high-grade caliche ore minerals. The remaining 77.62% of this area has not been explored or has had limited reconnaissance, which is not sufficient to determine the potential and hypothetical resources. In 2018, we did not carry out basic reconnaissance of new mining properties. With respect to detailed explorations, in 2018, we carried out recategorizations of indicated resources in Tente en el Aire sectors, totaling 1,658 hectares, which is still in process. Our 2019 exploration program includes the exploration of the Tente en el Aire section, which totals 658 hectares, and the basic study of 4,110 hectares of the Hermosa Norte sector. The reserves shown in these tables are calculated based on properties that are not involved in any legal disputes between SQM and other parties.
Caliche ore is the key raw material used in the production of iodine, specialty plant nutrients and industrial chemicals. The following gross margins for the business lines specified were calculated on the same basis as cut off grades used to estimate our reserves. We expect costs to remain relatively stable in the near future.
| 2018 | 2017 | 2016 | ||||||||||||||||
|
Gross
Margin |
Price |
Gross
Margin |
Price |
Gross
Margin |
Price | |||||||||||||
| Iodine and Derivatives | 33 | % | US$24/kg | 21 | % | US$20/kg | 17 | % | US$28/kg | |||||||||
| Specialty Plant Nutrition | 22 | % | US$722/ton | 20 | % | US$722/ton | 23 | % | US$784/ton | |||||||||
| Industrial Chemicals | 33 | % | US$797/ton | 32 | % | US$809/ton | 35 | % | US$770/ton | |||||||||
We maintain an ongoing program of exploration and resource evaluation on the land surrounding our production mines, and other sites for which we have the appropriate concessions.
Brines from the Salar de Atacama: Facilities and Reserves
Salar de Atacama: Facilites
Salar de Atacama
Our facilities at the Salar de Atacama are located 208 kilometers to the east of the city of Antofagasta and 188 kilometers to the southeast of the city of María Elena. At this site we use brines extracted from the salar to produce potassium chloride, potassium sulfate, boric acid, magnesium chloride salts and lithium solutions, which are subsequently sent to our lithium carbonate plant at the Salar del Carmen for processing. The main production plants at this site include the potassium chloride flotation plants (MOP-H I and II), the potassium carnallite plants (PC I and extension), the potassium sulfate flotation plant (SOP-H), the boric acid plant (ABO), the potassium chloride drying plant (Dual Plant or MOP-S), the potassium chloride compacting plant (MOP-G), the potassium sulfate drying plant (SOP-S) and the potassium sulfate compacting plant (SOP-G). Solar energy is the primary energy source used for the Salar de Atacama operations.
| 61 |
Salar de Atacama: Reserves
Our in-house staff of hydrogeologists and geologists prepares our estimates of the reserve base of potassium, sulfate, lithium and boron dissolved in brines at the Salar de Atacama. We have exploitation concessions covering an area of 81,920 hectares, in which we have carried out geological exploitation, brine sampling and geostatistical analysis. We estimate that our proven and probable reserves as of December 31, 2018, based on law, geological exploitation, brine sampling and geostatistical analysis up to a depth of 300 meters of our total exploitation concessions, are as follows:
|
Proven Reserves (1) (millions of metric tons) |
Probable Reserves (1) (millions of metric tons) |
Total Reserves (millions of metric tons) |
||||||||||
| Potassium (K+) (2) | 46.1 | 42.0 | 88.1 | |||||||||
| Sulfate (SO4-2) (3) | 39.0 | 45.2 | 84.2 | |||||||||
| Lithium (Li+) (4) | 4.56 | 3.99 | 8.55 | |||||||||
| Boron (B3+) (5) | 1.38 | 1.46 | 2.84 | |||||||||
| (1) | Metric tons of potassium, sulfate, lithium and boron considered in the proven and probable reserves are shown before losses from evaporation processes and metallurgical treatment. The recoveries of each ion depend on both brine composition and the process applied to produce the desired commercial products. |
| (2) | Recoveries for potassium vary from 47% to 77%. |
| (3) | Recoveries for sulfate vary from 27% to 45%. |
| (4) | Recoveries for lithium vary from 28% to 50%. |
| (5) | Recoveries for boron vary from 28% to 32%. |
The information set forth in the table above was validated in March 2019 by Messrs. Álvaro Henríquez and Orlando Rojas using information that was prepared by SQM’s hydrogeologists, geologists and engineers and external advisors.
Mr. Henríquez is a geologist with more than 15 years of experience in the field of mining hydrogeology. He is currently employed by SQM as Superintendent of Hydrogeology, in the Salar Hydrogeology department. He is a Competent Person and is registered under No. 226 in the Public Registry of Competent Persons in Mining Resources and Reserves, in accordance with the Competent Person Law. As a hydrogeologist in Chile and abroad, he has evaluated multiple brine-based projects and has experience evaluating resources and reserves.
Mr. Orlando Rojas is a civil mining engineer and independent consultant. He is Partner and Chief Executive Officer of EMI-Ingenieros y Consultores S.A., whose offices are located at Los Domínicos No 7772, Las Condes, Santiago, Chile. He is a member of the Institute of Mining Engineers and is registered under No. 118 in the Public Registry of Competent Persons in Mining Resources and Reserves in accordance with the Competent Person Law and related regulations. He has worked as a mining engineer for 40 years since graduating from university, including more than 34 years working on estimates for reserves and resources.
Copies of the certificates of qualified competency issued by the Chilean Mining Commission for Mr. Rojas and Mr. Henríquez are attached hereto as Exhibit 99.2 and 99.3.
The cutoff grade for lithium extraction is set at 0.05% Li. The cost of the process is competitive in the market despite a small cost increase due to the expansions in the evaporation area (to reach the required Li concentration) and to the use of additives to maintain the quality of the brine that is used to feed the plant.
| 62 |
A cutoff grade of 1.0% K is used in the calculation, considering a low margin scenario using only MOP-S as and using diluted brine with higher levels of contaminants as the raw material and with recovery yields of approximately 47%, which is on the lower end of the range. In this scenario, considering current market conditions and market conditions from recent years, the production cost of MOP production is still competitive .
The proven and probable reserves are based on production experience, drilling, brine sampling and geo-statistic reservoir modeling in order to estimate brine volumes and their composition. We calculate the reserve base, which is the volume of brine effectively drainable or exploitable in each evaluation unit, by building a three-dimensional block model. The following variables are used to populate the model:
| · | Porosity : obtained from measurements of drainable porosity and effectiveness in core rocks, test pumping data, geophysical records and changes in the level of the brine. The volume of brine is estimated on the basis of the interpolation of the on-site porosity data. |
| · | Grades: The brine concentration chemistry of the brine measured in the ponds is subjected to an exploratory data analysis and a variographic analysis, in order to determine the chemical populations in the Salar. Subsequently, the grades are interpolated using the Kriging method. |
Based on the chemical characteristics, and the volume of brine, we determine the number of metric tons for each of the chemical ions being evaluated. Reserve classification is finally achieved by using geostatistical criteria and hydrogeological knowledge of the units that have been explored, as an indicator between proven and probable reserves.
Proven reserves are defined as hydrogeological units with proven historical brine yield production, and a quality and piezometric brine monitoring network to control brine evolution over time.
Probable reserves and inferred resources are being continually explored in order to be able to reclassify them as proven reserves and indicated or measured resources, respectively. This exploration includes systematic packer testing, chemical brine sampling and long-term pilot production pumping tests.
We consider chemical parameters to determine the process to be applied to the brines. These parameters are used to estimate potential restrictions on production yields, and the economic feasibility of producing such commercial products as potassium chloride, potassium sulfate, lithium carbonate and boric acid is determined on the basis of the evaluation.
Complementing the reserves information, SQM has an environmental impact assessment (RCA 226/06) which defines a maximum brine extraction until the end of the Lease Agreement (December 31, 2030). Considering the authorized maximum net brine production rates, we have performed hydrogeological simulations using numeric flow and transport models to estimate changes in the volume and quality of the brine during the life of the project, considering the ponds infrastructure projected and existing on January 1, 2019. According to these simulations, a total of 1.24 million metric tons of lithium and 14.9 million metric tons of potassium will be extracted from the producing wells. On the other hand, the proven and probable base reserve in situ, within the authorized area of environmental extraction (RCA 226/06), corresponds to 4.33 million metric tons of lithium and 30.4 million metric tons of potassium, enough to satisfy the demand of the project until the end of the concession.
Brines from the Salar de Atacama are the key raw material used in the production of potassium chloride and potassium sulfate, and lithium and its derivatives. The following gross margins for the business lines specified were calculated on the same basis as cut off grades used to estimate our reserves. We expect costs to remain relatively stable in the near future.
| 63 |
| 2018 | 2017 | 2016 | ||||||||||||||||
|
Gross
Margin |
Price |
Gross
Margin |
Price |
Gross
Margin |
Price | |||||||||||||
| Potassium Chloride and Potassium Sulfate | 19 | % | US$322/ton | 17 | % | US$282/ton | 11 | % | US$263/ton | |||||||||
| Lithium and Derivatives | 57 | % | US$16,289/ton | 71 | % | US$12,970/ton | 66 | % | US$10,362/ton | |||||||||
Other Production Facilities
Coya Sur
The Coya Sur site is located approximately 15 kilometers south of María Elena, and production activities undertaken there are associated with the production of potassium nitrate and finished products. The main production plants at this site include four potassium nitrate plants with a total capacity of 1,300,000 metric tons per year. There are also five production lines for crystallized nitrates, with a total capacity of 1,200,000 metric tons per year, and a prilling plant with a capacity of 360,000 metric tons per year. The potassium nitrate produced at Coya Sur is an intermediate product that is used as a raw material for the production of finished products (crystallized nitrates and prilled nitrates). Therefore, the production capacities listed above are not independent of one another and cannot be added together to obtain an overall total capacity. Natural gas is the main source of energy for our Coya Sur operation.
Salar del Carmen
The Salar del Carmen site is located approximately 14 kilometers to the east of Antofagasta. The production plants at this facility include the lithium carbonate plant, with a production capacity of 70,000 metric tons per year, and the lithium hydroxide plant, with a production capacity of 13,500 metric tons per year. Electricity and natural gas are the main sources of energy for our Salar del Carmen operation.
| 64 |
The following table provides a summary of our production facilities as of December 31, 2018:
| Facility | Type of Facility |
Approximate
(hectares) (1) |
Nominal Production
Capacity (thousands of metric tons/year) |
Weighted
Average Age (years) (2) |
Gross Book
Value (millions of US$) (2) |
|||||||||||
| Coya Sur (3) (4) | Nitrates production | 1.518 |
Potassium nitrate: 1,300
Crystallized nitrates: 1,200 Prilled nitrates: 360 |
5.0 | 571.7 | |||||||||||
| María Elena (5) (6) | Nitrates and iodine production | 35.830 |
Nitrates: n/a
Iodine: 1.6 Prilled nitrates: 300 |
13.8 | 424.0 | |||||||||||
| Nueva Victoria (5) (7) | Concentrated nitrate salts and iodine production | 47.492 | Iodine: 13.0 | 6.6 | 523.7 | |||||||||||
| Pampa Blanca (5) (7) (8) | Concentrated nitrate salts and iodide production | 10.441 |
Nitrates: n/a
Iodine: n/a |
10.5 | 7.1 | |||||||||||
| Pedro de Valdivia (3) (9) | Nitrates and iodine production | 253.880 |
Nitrates: n/a
Iodine: 3.2 |
13.6 | 226.3 | |||||||||||
| Salar de Atacama (3) (10) | Potassium chloride, potassium sulfate, lithium chloride, and boric acid production | 35.911 |
Potassium chloride: 2,680
Potassium sulfate: 245 Boric acid: 15 |
10.8 | 1,554.1 | |||||||||||
| Salar del Carmen, Antofagasta (3) | Lithium carbonate and lithium hydroxide production | 126 |
Lithium carbonate: 70
Lithium hydroxide: 13.5 |
8.7 | 304.3 | |||||||||||
| Tocopilla (11) | Port facilities | 22 | - | 12.2 | 172.8 | |||||||||||
| (1) | Approximate size considers both the production facilities and the mine for María Elena, Nueva Victoria, Pampa Blanca, Pedro de Valdivia and the Salar de Atacama. Mining areas are those authorized for exploitation by the environmental authority and/or Sernageomin. |
| (2) | Weighted average age and gross book value correspond to production facilities, excluding the mine, for María Elena, Nueva Victoria, Pampa Blanca, Pedro de Valdivia and the Salar de Atacama. |
| (3) | Includes production facilities and solar evaporation ponds. |
| (4) | The potassium nitrate produced at Coya Sur is an intermediate product that is used as a raw material for the production of finished products (crystallized nitrates and prilled nitrates). Therefore, the production capacities listed above are not independent of one another and cannot be added together to obtain an overall total capacity. |
| (5) | Includes production facilities, solar evaporation ponds and leaching heaps. |
| (6) | Operations at the El Toco mine at María Elena were suspended in November 2013. |
| (7) | The nominal production capacity for iodine considers the capacity of our plants. The effective capacity is 14,000 metric tons per year. |
| (8) | Operations at Pampa Blanca were suspended in March 2010. |
| (9) | In November 2015, the mining and nitrate operations at Pedro de Valdivia were suspended, and iodine production was reduced at the Pedro de Valdivia site, in order to take advantage of the highly efficient production facilities at Nueva Victoria. |
| (10) | Potassium chloride and potassium sulfate are produced in a dual plant, and the production capacity for each of these products depends on the production mix. Therefore, the production capacities for these two products are not independent of one another and cannot be added together to obtain an overall total capacity. |
| (11) | The Tocopilla port facilities were originally constructed in 1961 and have been refurbished and expanded since that time. |
The railway line that runs between our Coya Sur production facilities and our Tocopilla port facilities was damaged in August 2015 as a result of storms in the north of Chile. The train is not currently operating and as a consequence, we have replaced the train with trucks to ship products from Coya Sur. Detailed engineering studies were performed to assess the damage of the railway. During the third quarter of 2016, the report was completed; it concluded that the cost and time needed to repair the railway at this time is not economical in the short and medium term. As a result of this determination, the Company wrote-off the assets related to the train. We do not believe it will materially impact future sales volumes or transportation costs.
| 65 |
We consider the condition of our principal plant and equipment to be good, with the exception of the railway line.
We directly or indirectly through subsidiaries own, lease or hold concessions over the facilities at which we carry out our operations. Such facilities are free of any material liens, pledges or encumbrances, and we believe they are suitable and adequate for the business we conduct in them.
Extraction Yields
The following table shows certain operating data relating to each of our mines for 2018, 2017 and 2016:
| (in thousands, unless otherwise stated) | 2018 | 2017 | 2016 | |||||||||
| Pedro de Valdivia (1) | ||||||||||||
| Metric tons of ore mined | – | – | – | |||||||||
| Average grade nitrate (% by weight) | – | – | – | |||||||||
| Iodine (parts per million (ppm)) | – | – | – | |||||||||
| Metric tons of crystallized nitrate produced | – | – | – | |||||||||
| Metric tons of iodine produced | 1.0 | 0.9 | 0.6 | |||||||||
| Maria Elena (2) | ||||||||||||
| Metric tons of ore mined | – | – | – | |||||||||
| Average grade nitrate (% by weight) | – | – | – | |||||||||
| Iodine (ppm) | – | – | – | |||||||||
| Metric tons of crystallized nitrate produced | – | – | – | |||||||||
| Metric tons of iodine produced | – | – | 0.2 | |||||||||
| Coya Sur (3) | ||||||||||||
| Metric tons of crystallized nitrate produced | 699 | 613 | 573 | |||||||||
| Pampa Blanca (2) | ||||||||||||
| Metric tons of ore mined | – | – | – | |||||||||
| Iodine (ppm) | – | – | – | |||||||||
| Metric tons of iodine produced | – | – | – | |||||||||
| Nueva Victoria | ||||||||||||
| Metric tons of ore mined | 42,753 | 36,383 | 29,902 | |||||||||
| Iodine (ppm) | 461 | 458 | 454 | |||||||||
| Metric tons of iodine produced | 10.2 | 8.8 | 7.7 | |||||||||
| Salar de Atacama (4) | ||||||||||||
| Metric tons of lithium carbonate produced | 50.4 | 45 | 44 | |||||||||
| Metric tons of potassium chloride and potassium sulfate and potassium salts produced | 1,505 | 1,881 | 2,045 | |||||||||
| 66 |
| (1) | In November 2015, mining and nitrate operations at Pedro de Valdivia were suspended, and iodine production was reduced at the Pedro de Valdivia site, in order to take advantage of the highly efficient production facilities at Nueva Victoria. |
| (2) | Operations at the Pampa Blanca mine were suspended in March 2010. During 2015, María Elena obtained production from caliche ore exploited in prior years. |
| (3) | Includes production at Coya Sur from treatment of nitrates solutions from María Elena and Pedro de Valdivia, nitrate salts from pile treatment at Nueva Victoria, and net production from NPT, or technical grade potassium nitrate, plants. |
| (4) | Lithium carbonate is extracted at the Salar de Atacama and processed at our facilities at the Salar del Carmen. Potassium salts include synthetic sylvinite produced in the plant and other harvested potassium salts (natural sylvinite, carnalites and harvests from plant ponds) that are sent to Coya Sur for the production of crystallized nitrates. |
Transportation and Storage Facilities
The transportation of our products is carried out by trucks that are operated by dedicated third parties through long-term contracts. Furthermore, we own port and storage facilities for the transportation and management of finished products and consumable materials.
Our main centers for the production and storage of raw materials are the Nueva Victoria, Coya Sur and Salar de Atacama facilities. Other facilities include chemical plants for the finished products of lithium carbonate and lithium hydroxide at the Salar del Carmen plant. The Port of Tocopilla terminal, which we own, has a surface area of approximately 22 hectares and is the principal facility for the storage and shipment of our bulk products and packaged potassium chloride (MOP) and nitrates.
The nitrate finished products are produced at our Coya Sur facilities and then transported via trucks to the Port of Tocopilla terminal where they are stored and shipped, either packaged (polypropylene bags, polyethylene or polypropylene FIBC big bags) or in bulk. The potassium chloride is produced at our Salar de Atacama facilities and we transport it by truck, either to the Port of Tocopilla terminal or the Coya Sur facility. The product transported to Coya Sur is an intermediate product that is used as a raw material for the production of potassium nitrate. On the other hand, the product transported to the Port of Tocopilla is a final product that will be shipped or transported to the client or affiliate. The raw material of nitrate for the production of potassium nitrate in Coya Sur is currently produced at Nueva Victoria and the remaining raw material is provided from historical stock stored in Coya Sur that was produced at the Pedro de Valdivia facility when it was operating. This raw material is obtained from the processing of caliche that is extracted from our mines.
The lithium chloride solution, which contains a high concentration of boron, produced at our Salar de Atacama facilities, is transported to the lithium carbon plant in the Salar del Carmen area where the finished lithium carbonate is produced. Part of the lithium carbonate is provided to the adjacent lithium hydroxide plant where the finished lithium hydroxide is produced. These two products are packed in packaging of distinct characteristics (polyethylene bags, multi-layer or polypropylene FIBC big bags), stored within the same facilities and secured in roofed storerooms. Thereafter, they are consolidated into containers that are transported by trucks to a transit warehouse or directly to port terminals for their subsequent shipment. The port terminals used are currently suited to receive container ships and are situated in Antofagasta, Mejillones and Iquique.
Iodine obtained from the same caliche used for the production of nitrates, is processed, packaged and stored exclusively in the Pedro de Valdivia and Nueva Victoria facilities. The packaging used for iodine are drums and polypropylene FIBC big bags with an internal polyethylene bag and oxygen barrier, which at the time of transportation are consolidated into containers and sent by truck to port terminals suited for their management, principally located in Antofagasta, Mejillones and Iquique. Thereafter, they are sent to distinct markets by container ship or by truck to Santiago where iodine derivatives are produced in the Ajay-SQM Chile plants.
| 67 |
The Port of Tocopilla terminal facilities are located approximately 186 kilometers north of Antofagasta, approximately 124 kilometers west of María Elena and Coya Sur and 372 kilometers to the west of Salar de Atacama. Our affiliate, Servicios Integrales de Tránsitos y Transferencias S.A. (SIT), operates facilities for the shipment of products and the delivery of certain raw materials based on renewable concessions granted by Chilean regulatory authorities, provided that the facilities are used in accordance with the authorization granted and we pay an annual concession fee. The Port of Tocopilla terminal facilities include a truck weighing machine that confirms product entry into the port and transfers the product to distinct storage zones, a piezometer within the shipping system to carry out bulk product loaded onto ships and a crane with a 40 ton capacity for the loading of sealed product onto ships.
The storage facilities consist of a system of six silos, with a total storage capacity of 55,000 metric tons, and a mixed storage area of open storehouses with a total storage capacity of approximately 250,000 metric tons. In addition, to fulfill future storage needs, we will continue to make investments in accordance with the investment plan outlined by management. The products are also put into bags at the Port of Tocopilla terminal facilities where the bagging capacity is established by two bag packaging machines, one for sacks and polypropylene FIBC big bags and one for FFS polyethylene. The products that are packaged in Tocopilla may be subsequently shipped at the same port or may also be consolidated into trucks or containers for its subsequent dispatch to clients by land or sea through containers from other ports, principally located in Antofagasta, Mejillones and Iquique.
For the transportation of bulk product, the transportation belt system extends across the coastline to deliver products directly to the hatches of bulk cargo ships. The nominal load capacity of this shipping system is 1,200 tons per hour. The transportation of packaged product is carried out utilizing the same bulk cargo ships using trailers without motors located in the dock and loaded by a crane with a 40 ton capacity from the Port of Tocopilla terminal. Thereafter, they are towed and unloaded using ship cranes to the respective warehouses.
We normally contract bulk cargo ships to transfer the product from the Port of Tocopilla terminal to our hubs around the world or to clients directly, who, in certain instances, use their own contracted vessels for delivery.
Tocopilla processes related to the reception, handling, storage and shipment of bulk/packaged nitrates produced at Coya Sur are certified by the third-party organization TÜV-Rheiland under the quality standard ISO 9001:2008.
Computer System
In addition to the above-listed facilities, we operate varies computer and information systems linking our principal subsidiaries to our operating and administrative facilities throughout Chile, and other parts of the world, via two networks. The computer and information system is used mainly for accounting, monitoring of supplies and inventories, billing, quality control, research activities and production process and maintenance control. The mainframe computing system is located at our offices in Santiago.
In addition, we have Cloud technologies, which allow us to support new business processes related to IoT (Internet of Things) and Advanced Analytics and enables the business to respond quickly and at low cost to changing conditions of the business and of the market.
An Advanced Analytical pilot was carried out in one of our production plants, which allowed to us to collect information to allow us to advance the predictive short-term and medium-term analysis and possible automation in the long term.
A cyber security review is being carried out to highlight possible risks and mitigate them. Process automation and digitalization projects were initiated at various sites, such as the Port of Tocopilla, with the objective of reducing operational risk, and improving security and operational efficiency, which also includes a modernization of current IT infrastructure and existing communications.
| ITEM 4A. | UNRESOLVED STAFF COMMENTS |
None.
| 68 |
| ITEM 5. | OPERATING AND FINANCIAL REVIEW AND PROSPECTS |
The information in this Item 5 should be read in conjunction with the Company’s Consolidated Financial Statements and the notes thereto included elsewhere in this Annual Report.
Since January 1, 2010, the Company’s Consolidated Financial Statements have been prepared in accordance with the International Financial Reporting Standards as published by the International Accounting Standards Board (IASB).
CRITICAL ACCOUNTING POLICIES AND ESTIMATES
Critical accounting policies are defined as those that are reflective of significant judgments and uncertainties, which would potentially result in materially different results under different assumptions and conditions.
We believe that our critical accounting policies applied in the preparation of our Audited Consolidated Financial Statements are limited to those described below. It should be noted that in many cases, IFRS specifically dictates the accounting treatment of a particular transaction, limiting management’s judgment in their application. There are also areas in which management’s judgment in selecting available alternatives would not produce materially different results.
Trade and Other Accounts Receivable
Trade and other accounts receivable relate to non-derivative financial assets with fixed payments that can be determined and are not quoted in any active market. These arise from sales operations involving products and/or services that we sell directly to our customers that were considered financial instruments measured at amortized cost, in accordance with the guidelines of IFRS 9.
These assets are initially recognized at their fair value (which is equivalent to their face value, discounting implicit interest for installment sales) and subsequently at amortized cost according to the effective interest rate method less a provision for impairment loss. When the face value of the account receivable does not significantly differ from its fair value, it is recognized at face value. We apply the IFRS 9 simplified approach to measuring expected credit losses which uses a lifetime expected loss allowance for all trade receivables.
Previously, under IAS 39, an allowance for impairment loss is established for trade accounts receivable when there is objective evidence that we will not be able to collect all the amounts owed to us according to the original terms of accounts receivable. The Company calculates the allowance for doubtful accounts corresponding to receivables that are not guaranteed or insured as a function of the delays that may occur in the collection of such accounts.
Implicit interest in installment sales is recognized as interest income when interest is accrued over the term of the sale.
Income tax
Corporate income tax for the year is determined as the sum of current taxes from the different consolidated companies.
Current taxes are based on the application of the various types of taxes attributable to taxable income for the year.
| 69 |
Differences between the book value of assets and liabilities and their tax basis generate the balance of deferred tax assets or liabilities, which are calculated using the tax rates expected to be applicable when the assets and liabilities are realized.
In conformity with current Chilean tax regulations, the provision for corporate income tax and taxes on mining activity is recognized on an accrual basis, presenting the net balances of accumulated monthly tax provisional payments for the fiscal period and associated credits. The Company operates and recognizes sales in countries other than Chile, and is subject to different tax regimes. These tax implications do not have a material impact on our effective tax rate.
The balances of these accounts are presented in current income taxes recoverable or current taxes payable, as applicable.
Tax on companies and variations in deferred tax assets or liabilities that are not the result of business combinations are recorded in the statement of income accounts or equity accounts in the consolidated statement of financial position, considering the origin of the gains or losses which have generated them.
At each reporting period, the carrying amount of deferred tax assets was reviewed and reduced to the extent where there would not be sufficient taxable income to allow the recovery of all or a portion of the deferred tax assets. Likewise, as of the date of the consolidated financial statements, deferred tax assets are evaluated and recognized if it is more likely than not that future taxable income will allow for recovery of the deferred tax asset.
With respect to deductible temporary differences associated with investments in subsidiaries, associated companies and interest in joint ventures, deferred tax assets are recognized solely provided that it is more likely than not that the temporary differences will be reversed in the near future and that there will be taxable income with which they may be used.
The deferred income tax related to entries directly recognized in equity is recognized with an effect on equity and not with an effect on profit or loss.
Deferred tax assets and liabilities are offset if there is a legally receivable right of offsetting tax assets against tax liabilities and the deferred tax is related to the same tax entity and authority.
Inventories
The Company measures inventories at the lower of production cost and net realizable value. The cost price of finished products and work in progress includes the direct cost of materials and, when applicable, labor costs, the depreciation of goods that are involved in the production process, the indirect costs incurred in transforming raw materials into finished products, and general expenses incurred in carrying inventories to their current location and conditions. The method used to determine the cost of inventories is the weighted average monthly cost and the average cost of warehouse storage.
Commercial discounts, rebates obtained, and other similar entries are deducted when determining the acquisition price.
The net realizable value represents the estimate of the sales price, less all the estimated costs involved in making the finished product and the costs that will be incurred in the commercialization, sales, and distribution processes.
The Company conducts an evaluation of the net realizable value of inventories at the end of each year, recording an estimate with a charge to profit or loss when the inventory costs exceed the realizable value. This estimate is made for all the finished and intermediate products in the Company’s inventory. The valuation of obsolete, impaired or slow-moving products relates to their estimated net realizable value.
| 70 |
The provisions for uncertainties in the technical specifications for the Company’s stocks of finished goods and work in progress have been made based on a technical study which covers the different variables that affect products in stock (such as density and humidity). This study is updated periodically to include new measurement technologies and the results from previous financial periods.
Inventories of raw materials, supplies, materials and parts are recorded at the lower of acquisition cost or market value. The acquisition cost is calculated according to the average acquisition price method. Nonetheless, an estimate is made for each financial period of the potential lower value of that proportion of the inventory that consists of obsolete, defective or slow-moving materials. This provision reduces the value of the Company’s raw materials, supplies, materials and parts.
Obligations related to staff severance indemnities and pension commitments
Our obligations with respect to our employees are established in collective bargaining agreements and individual employment contracts. In the case of certain employees in the United States, our obligations are established through a pension plan, which was terminated in 2002.
These obligations are valued using an actuarial calculation that considers factors such as mortality rate, employee turnover, interest rates, retirement dates, effects related to increases in employees’ salaries, as well as the effects on variations in services derived from variations in the inflation rate.
Actuarial losses and gains that may be generated by variations in previously defined obligations are directly recorded in profit or loss for the year.
Actuarial losses and gains originating from deviations between the estimate and the actual behavior of actuarial hypotheses or in the reformulation of established actuarial hypotheses are recorded in equity.
The discount rate used for calculating obligations outside the United States was 4.6% and 5.1% for the periods ended as of December 31, 2018 and 2017, respectively.
The Company’s subsidiary SQM North America has established pension plans for its retired employees that are calculated by measuring the projected obligation using a net salary progressive rate net of adjustments for inflation, mortality and turnover assumptions, deducting the resulting amounts at present value using a 3.75% interest rate for 2018 and 4.50% for 2017. The net balance of this obligation is presented under the “Provisions for employee benefits, non-current” line item.
Mining development costs
Mine exploration costs and stripping costs to maintain production of mineral resources extracted from operating mines are considered variable production costs and are included in the cost of inventory produced during the period. Mine development costs at new mines, and major development costs at operating mines outside existing areas under extraction that are expected to benefit future production, are capitalized under “other long-term assets” and amortized using a units-of-production method over the associated proven and probable reserves. We determine our proven and probable reserves based on drilling, brine sampling and geostatistical reservoir modeling in order to estimate mineral volume and composition.
All other mine exploration costs, including expenses related to low grade mineral resources rendering reserves that are not economically exploitable, are charged to the statement of income in the period in which they are incurred.
| 71 |
Asset value impairment
We assess on an annual basis any impairment on the value of buildings, plant and equipment, intangible assets, goodwill and investments accounted for using the equity method of accounting in accordance with IAS 36 “Impairment of Assets.” Assets to which this method applies are:
| · | investments recognized using the equity method of accounting; |
| · | property, plant and equipment; |
| · | intangible assets; and |
| · | goodwill. |
Assets are reviewed for impairment as to the existence of any indication that the carrying value is lower than the recoverable amount. If such an indication exists, the asset recoverable amount is calculated in order to determine the extent of the impairment, if any. In the event that the asset does not generate any cash flows independent from other assets, we determine the recoverable amount of the cash generating unit to which this asset belongs according to the corresponding business segment (specialty plant nutrients, iodine and derivatives, lithium and derivatives, potassium, industrial chemicals and other products and services.)
We conduct impairment tests on intangible assets and goodwill with indefinite useful lives on an annual basis and every time there is indication of impairment. If the recoverable value of an asset is estimated at an amount lower than its carrying value, the latter decreases to its recoverable amount.
The results of the impairment tests the Company has performed on its primary intangible assets demonstrated that there was no need for the Company to make any accounting adjustments to such assets. These impairment tests were performed using conservative scenarios. For more information, see Note 13.1 to our Consolidated Financial Statements.
We have recognized impairment events derived from the following:
As a result of the rain storms that affected the Tocopilla Zone at the beginning of August 2015, SQM S.A. confirmed the existence of damages in several zones in the railway between the sites Coya Sur and Tocopilla. SQM has performed several internal and external studies with the purpose of determining the costs and terms necessary to repair the damages in the railway.
Consequently, SQM has adjusted the value of the assets associated with the railway (fixed equipment, facilities and rolling equipment), which has translated into a charge of approximately US$32 million which are reflected in the line other expenses by function in the consolidated statement of income for 2016.
On September 22, 2015, the Company decided to close the mining operations at the Pedro de Valdivia site and a portion of such site’s industrial operations. This decision has been made because the Company has continued to increase its production capacity of iodine and nitrate salts in its industrial mining operations at the Nueva Victoria site and has reduced its production costs to meet sales forecasts and increase its current worldwide market share in the iodine market. The Company recognized the impairment effect of US$58 million in the consolidated statement of income for 2015.
Financial derivatives and hedging transactions
Derivatives are recognized initially at fair value as of the date on which the derivatives contract is signed and, they are subsequently assessed at fair value. The method for recognizing the resulting gain or loss depends on whether the derivative has been designated as an accounting hedge instrument and, if so, it depends on the type of hedging, which may be as follows:
| a) | Fair value hedge of assets and liabilities recognized (fair value hedges), |
| b) | Hedging of a single risk associated with an asset or liability recognized or a highly probable forecast transaction (cash flow hedge). |
| 72 |
At the beginning of the transaction, the Company documents the relationship that exists between hedging instruments and those items hedged, as well as their objectives for risk management purposes and the strategy to conduct different hedging operations.
The Company also documents its evaluation both at the beginning and at the end of each period if the derivatives used in hedging transactions are highly effective to offset changes in the fair value or in cash flows of hedged items.
The fair value of derivative instruments used for hedging purposes is shown in Note 13.3 (hedging assets and liabilities) to our Consolidated Financial Statements. Changes in the cash flow hedge reserve are classified as a non-current asset or liability if the remaining expiration period of the hedged item is more than 12 months, and as a current asset or liability if the remaining expiration period of the entry is less than 12 months.
Derivatives that are not designated or do not qualify as hedging derivatives are classified as current assets or liabilities, and changes in the fair value are directly recognized through profit or loss.
| a. | Fair value hedge |
Changes in the fair value of derivatives that are designated and qualify as fair value hedges are recorded in profit or loss, together with any changes in the fair value of the hedged asset or liability that are attributable to the hedged risk. The gain or loss relating to the effective portion of interest rate swaps that hedge fixed rate borrowings is recognized in profit or loss within finance costs, together with changes in the fair value of the hedged fixed rate borrowings attributable to interest rate risk. The gain or loss relating to the ineffective portion is recognized in profit or loss within other income or other expenses. If the hedge no longer meets the criteria for hedge accounting, the adjustment to the carrying amount of a hedged item for which the effective interest method is used is amortized to profit or loss over the period to maturity using a recalculated effective interest rate.
| b. | Cash flow hedge |
The portion of the derivative instruments used to mitigate cash flow fluctuations related to sales revenue or expenses is recognized in gross margin as a cost or undistributed revenue. The accrued portion of these instruments is recognized in other income or expenditure.
Contingencies
The amount recognized as a provision, including legal, contractual, constructive and other exposures or obligations, is the best estimate of the consideration required to settle the related liability, including any related interest charges, taking into account the risks and uncertainties surrounding the obligation. In addition, contingencies will only be resolved when one or more future events occur or fail to occur. Therefore, the assessment of contingencies inherently involves the exercise of significant judgment and estimates of the outcome of future events. The Company assesses its liabilities and contingencies based upon the best information available, relevant tax laws and other appropriate requirements.
| 73 |
5.A. Operating Results
Introduction
The following discussion should be read in conjunction with the Company’s Consolidated Financial Statements. Certain calculations (including percentages) that appear herein have been rounded.
Our Consolidated Financial Statements are prepared in accordance with IFRS standards and prepared in U.S. dollars. The U.S. dollar is the primary currency in which we operate.
We operate as an independent corporation. Nonetheless we are a “controlled corporation,” as that term is defined under Chilean law. See “Item 7.A. Major Shareholders.”
Overview of Our Results of Operations
We divide our operations into the following business lines:
| · | the production and sale of specialty plant nutrients; |
| · | the production and sale of iodine and its derivatives; |
| · | the production and sale of lithium and its derivatives; |
| · | the production and sale of potassium, including potassium chloride and potassium sulfate; |
| · | the production and sale of industrial chemicals, principally industrial nitrates and solar salts; and |
| · | the purchase and sale of other commodity fertilizers for use primarily in Chile. |
We sell our products through three primary channels: our own sales offices, a network of distributors and, in the case of our fertilizer products, through Yara International ASA’s (“Yara”) distribution network in countries where its presence and commercial infrastructure are larger than ours. Similarly, in those markets where our presence is larger, both our specialty plant nutrients and Yara’s are marketed through our offices.
Factors Affecting Our Results of Operations
Our results of operations substantially depend on:
| · | trends in demand for and supply of our products, including global economic conditions, which impact prices and sales volumes; |
| · | efficient operations of our facilities, particularly as some of them run at production capacity; |
| · | our ability to accomplish our capital expenditures program in a timely manner; |
| · | the levels of our inventories; |
| · | trends in the exchange rate between the U.S. dollar and Chilean peso, as a significant portion of the cost of sales is in Chilean pesos, and trends in the exchange rate between the U.S. dollar and the euro, as a significant portion of our sales is denominated in euros; and |
| · | energy, logistics, raw materials, labor and maintenance costs. |
Impact of Foreign Exchange Rates
We transact a significant portion of our business in U.S. dollars, which is the currency of the primary economic environment in which we operate and is our functional and presentation currency for financial reporting purposes. A significant portion of our costs is related to the Chilean peso as most of our operations occur in Chile, and therefore an increase or decrease in the exchange rate between the Chilean peso and the U.S. dollar affects our costs of production. Additionally, as an international company operating in Chile and several other countries, we transact a portion of our business and have assets and liabilities in Chilean pesos and other non-U.S. dollar currencies, such as the euro, the South African rand and the Mexican peso. As a result, fluctuations in the exchange rate of such currencies to the U.S. dollar may affect our financial condition and results of operations. See Note 28 to our Consolidated Financial Statements.
| 74 |
We monitor and attempt to balance our non-U.S. dollar assets and liabilities position, including through foreign exchange contracts and other hedging instruments, to minimize our exposure to foreign exchange rate risk. As of December 31, 2018, for hedging purposes we had open contracts to buy U.S. dollars and sell euros for approximately US$15.32 million (EUR13.3 million) and to sell South African rand for approximately US$17.06 million (ZAR240.5 million), as well as forward exchange contracts to sell U.S. dollars and buy Chilean pesos for US$108.0 million (Ch$75,035 million). Of the UF11.5 million outstanding bonds issued in the Chilean market, UF 8.5 million were hedged with cross-currency swaps to the U.S. dollar for approximately US$348 million as of December 31, 2018.
In addition, we had open forward exchange contracts to buy U.S. dollars and sell Chilean pesos to hedge our time deposits in Chilean pesos for approximately US$348 million (Ch$241,944 million).
The following table shows our revenues (in millions of US$) and the percentage of revenues accounted for by each of our product lines for each of the periods indicated:
| 2018 | 2017 | 2016 | ||||||||||||||||||||||
| % | US$ | % | US$ | % | US$ | |||||||||||||||||||
| Specialty plant nutrition | 35 | % | 781.8 | 32 | % | 697.3 | 32 | % | 623.9 | |||||||||||||||
| Iodine and derivatives | 14 | % | 325.0 | 12 | % | 252.1 | 12 | % | 231.1 | |||||||||||||||
| Lithium and derivatives | 32 | % | 734.8 | 30 | % | 644.6 | 27 | % | 514.6 | |||||||||||||||
| Potassium | 12 | % | 267.5 | 18 | % | 379.3 | 21 | % | 403.3 | |||||||||||||||
| Industrial chemicals | 5 | % | 108.3 | 6 | % | 135.6 | 5 | % | 104.1 | |||||||||||||||
| Other products and services | 2 | % | 48.5 | 2 | % | 48.5 | 3 | % | 62.2 | |||||||||||||||
| Total | 100 | 2,265.8 | 100 | 2,157.3 | 100 | 1,939.3 | ||||||||||||||||||
The following table shows certain financial information of the Company (in millions of US$) for each of the periods indicated, as a percentage of revenues:
| Year Ended December 31, | ||||||||||||||||||||||||
| 2018 | 2017 | 2016 | ||||||||||||||||||||||
| (in millions of US$) | US$ | % | US$ | % | US$ | % | ||||||||||||||||||
| Revenues | 2,265.8 | 100.0 | 2,157.3 | 100.0 | 1,939.3 | 100.0 | ||||||||||||||||||
| Cost of sales | (1,483.5 | ) | 65.5 | (1,394.8 | ) | 64.7 | (1,328.3 | ) | 68.5 | |||||||||||||||
| Gross profit | 782.3 | 34.5 | 762.5 | 35.3 | 611.0 | 31.5 | ||||||||||||||||||
| Other income (1) | 32.0 | 1.4 | 17.8 | 0.8 | 15.2 | 0.8 | ||||||||||||||||||
| Administrative expenses | (118.1 | ) | 5.2 | (101.2 | ) | 4.7 | (88.4 | ) | 4.6 | |||||||||||||||
| Other expenses (2)(3)(4)(5) | (36.9 | ) | 1.6 | (53.6 | ) | 2.5 | (82.5 | ) | 4.3 | |||||||||||||||
| Net impairment gains or reversal (losses) of financial assets | 3 | - | (8 | ) | - | (7.2 | ) | - | ||||||||||||||||
| Other gains (losses) | 6.4 | 0.3 | 0.5 | 0.0 | 0.6 | 0.0 | ||||||||||||||||||
| Finance income | 22.5 | 1.0 | 13.5 | 0.6 | 10.1 | 0.5 | ||||||||||||||||||
| Finance expenses | (59.9 | ) | 2.6 | (50.1 | ) | 2.3 | (57.5 | ) | 3.0 | |||||||||||||||
| Equity income of associates and joint ventures accounted for using the equity method | 6.4 | 0.3 | 14.5 | 0.7 | 13.0 | 0.7 | ||||||||||||||||||
| Foreign currency exchange differences | (16.6 | ) | 0.7 | (1.3 | ) | 0.1 | 0.4 | 0.0 | ||||||||||||||||
| Income before income tax expense (2)(3) | 621.0 | 27.4 | 594.6 | 27.6 | 414.9 | 21.4 | ||||||||||||||||||
| Income tax expense | (179.0 | ) | 7.9 | (166.2 | ) | 7.7 | (133.0 | ) | 6.9 | |||||||||||||||
| Profit attributable to: | ||||||||||||||||||||||||
| Controlling interests (2)(3) | 439.8 | 19.4 | 427.7 | 19.8 | 278.3 | 14.3 | ||||||||||||||||||
| Non-controlling interests | 2.2 | 0.1 | 0.7 | 0.0 | 3.6 | 0.2 | ||||||||||||||||||
| Profit for the year (2)(3) | 442.1 | 19.5 | 428.4 | 19.9 | 281.9 | 14.5 | ||||||||||||||||||
| 75 |
| (1) | Other income for 2018 includes pre-tax income of US$14.5 million related to the sale of our interest in the Minera Exar S.A. lithium project in Argentina. |
| (2) | Other expenses for 2016 includes a charge of US$32.8 million for impairment related to the closure of our train between Coya Sur and Tocopilla. Other expenses for 2016 also includes charges of approximately US$30.5 million related to our agreement with the DOJ and the administrative cease and desist order issued by the SEC in connection the inquiries arising out of the alleged violations of the books and records and internal controls provisions of the Foreign Corrupt Practices Act. For more information, see “Item 3D. Risk Factors—Risks Relating to our Business—We could be subject to numerous risks as a result of legal proceedings and deferred prosecution agreements with U.S. and Chilean governmental authorities in relation to certain payments made by SQM between the tax years 2009 and 2015.” and “Item 8.A.7 Legal Proceedings.” |
| (3) | Other expenses for 2017 include a charge of US$20.4 million relating to payment by our subsidiary SQM Salar to Corfo after entering into the Corfo Arbitration Agreement to terminate the arbitration proceedings and amend the existing Lease Agreement and Project Agreement. For more information, see “Item 8.A.7 Legal Proceedings.” |
| (4) | Other expenses include the rent under lease contract with Corfo, which is described in Note 18.2 of the Consolidated Financial Statements. The payment made to Corfo were US$84.8 million in 2018, US$32.3 million in 2017, US$11.5 million in 2016, US$6.3 million in 2015, and US$6.2 million in 2014. |
| (5) | As a result of the adoption of IFRS 9, a reclassification was made to present gains on reversal (losses) separately from other expenses as function. The corresponding reclassifications for prior periods are described in Note 2.4 of the Consolidated Financial Statements. |
Results of Operations – 2018 compared to 2017
Revenues
Revenues increased by 5.0% to US$2,265.8 million in 2018 from US$2,157.3 million in 2017. The main factors that caused the increase in revenues and variations in different product lines are described below.
Lithium and Derivatives
Lithium and derivatives revenues increased 14.0% to US$734.8 million in 2018 from US$644.6 million in 2017. Set forth below are sales volume data for the specified years:
| (in Th. MT) | 2018 | 2017 | % Change | |||||||||
| Lithium and derivatives | 45.1 | 49.7 | -9 | % | ||||||||
The lithium market continued its strong growth in 2018, with total lithium demand increasing by over 27% according to our estimates. Supply did not keep the same pace, and therefore market conditions remained tight. Our sales volumes decreased in 2018 when compared to 2017 as a result of the delayed completion and ramp-up of our plant expansion to 70,000 metric tons, which took approximately five weeks more than anticipated mainly due to the calibration and fine tuning of some of the new components. During this period, the plant produced approximately 4,000 MT less battery grade product than originally anticipated.
Average prices in this business line increased 25.6% in 2018 compared to average prices during 2017, reaching almost US$16,300/MT compared to average prices of approximately US$13,000/MT in 2017.
| 76 |
Specialty Plant Nutrition
Specialty plant nutrition revenues increased 12.1% to US$781.8 million in 2018 from US$697.3 million in 2017. Set forth below are sales volume data for the specified years by product category in this product line:
| (in Th. MT) | 2018 | 2017 | % Change | |||||||||
| Potassium nitrate and sodium potassium nitrate | 673.4 | 601.4 | 12 | % | ||||||||
| Specialty blends | 242.5 | 209.0 | 16 | % | ||||||||
| Other specialty plant nutrients (*) | 141.6 | 129.1 | 10 | % | ||||||||
| Sodium nitrate | 25.0 | 26.7 | -6 | % | ||||||||
* Includes trading of other specialty fertilizers.
We sell various products within the specialty plant nutrition business line, and most of our specialty fertilizers are sold as either field fertilizers or water soluble fertilizers. Our sales volumes in this business line increased 12.0% in 2018 compared to 2017 primarily due to demand growth and limited supply from our competitors.
Average prices in the specialty plant nutrition business line were US$722/MT in 2018, the same as prices reported in 2017.
Iodine and Derivatives
Iodine and derivatives revenues increased 28.9% to US$325.0 million in 2018 from US$252.1 million in 2017. Set forth below are sales volume data for the specified years:
| (in Th. MT) | 2018 | 2017 | % Change | |||||||||
| Iodine and derivatives | 13.3 | 12.7 | 5 | % | ||||||||
Our sales volumes in this business line increased by approximately 5.1% in 2018 when compared to 2017, primarily as a result of higher demand and increased average prices.
Average prices during 2018 increased over 22.6% compared to 2017, reaching US$24/kilogram.
Potassium
Potassium revenues decreased 29.5% to US$267.5 million in 2018 from US$379.3 million in 2017. Set forth below are sales volume data for the specified years:
| (in Th. MT) | 2018 | 2017 | % Change | |||||||||
| Potassium chloride and potassium sulfate | 831.8 | 1,344.3 | -38 | % | ||||||||
Our revenues in the potassium chloride and potassium sulfate business line were impacted by reduced sales volumes in 2018. As anticipated, sales volumes decreased over 38% during 2018 as a result of our production limitations as we focused our production efforts in the Salar de Atacama on increasing lithium yields. Furthermore, as a result of environmental compliance plan that was approved by the Chilean Environmental Authority (SMA) at the end of the year, we are temporarily extracting less brine than we had in the past. as we focused our production efforts in the Salar de Atacama on increasing lithium yields. The potassium chloride demand increased an additional 2 million metric tons in 2018, reaching almost 66 million metric tons. As result, potash prices increased slightly during the year. Average prices in the potassium chloride and potassium sulfate business line increased approximately 14% during 2018 when compared to 2017, reaching US$322/MT.
| 77 |
Industrial Chemicals
Industrial chemicals revenues decreased 20.1% to US$108.3 million in 2018 from US$135.6 million in 2017. Set forth below are sales volume data for the specified years by product category:
| (in Th. MT) | 2018 | 2017 | % Change | |||||||||
| Industrial chemicals | 135.9 | 167.6 | -19 | % | ||||||||
Revenues in the industrial chemicals business line decreased as a result of lower sales volumes. These lower sales volumes were primarily related to decreased sales volumes of solar salts, which totaled 47,000 metric tons this year, in line with our estimated volumes for the year, but lower than the 88,000 metric tons sold in 2017.
Other Products and Services
Revenues from sales of other commodity fertilizers and other income was the same in 2018 and 2017, reaching US$48.5 million.
Cost of Sales
Our overall cost of sales increased 6.3% to US$1,483.5 million in 2018, which represented 65.5% of revenues, from US$1,394.3 million in 2017, which represented 64.7% of revenues. The main factors that caused the increase in cost of sales and variations in different product lines are described below.
Lithium and Derivatives
Lithium and derivatives cost of sales increased 67.5% to US$316.9 million in 2018 from US$189.2 million in 2017, primarily as result of higher lease payments to Corfo, and operating our production plant at full capacity for the majority of the year. The average cost of sales in the lithium and derivatives business line was US$6,100.4/MT in 2018, an increase of almost 60.2% from US$3,807.8/MT in 2017.
The agreement signed in January 2018, includes important amendments to the lease agreement and project agreement signed between CORFO and SQM in 1993. The main modifications became effective on April 10, 2018 and requires an increase in the lease payments by increasing the lease rates associated with the sale of the different products produced in the Salar de Atacama, including lithium carbonate, lithium hydroxide and potassium chloride. In regard to lithium carbonate, the former rate of 6.8% on FOB sales was changed to the following structure of progressive rates based on the final sale price (See Note 25.2 for the disclosure of lease payments made to CORFO for all periods presented.):
| Price US$/MT Li2CO3 | Lease payment rate | |||
| $0 - $4,000 | 6.8 | % | ||
| $4,000 - $5,000 | 8.0 | % | ||
| $5,000 - $6,000 | 10.0 | % | ||
| $6,000 - $7,000 | 17.0 | % | ||
| $7,000 - $10,000 | 25.0 | % | ||
Specialty Plant Nutrition
Specialty plant nutrition cost of sales increased 10.4% to US$613.3 million in 2018 from US$555.4 million in 2017, as a result of increased sales volumes in 2018. The average cost of sales in the specialty plant nutrition business line was US$546/MT in 2018, lower than US$575/MT in 2017.
Iodine and Derivatives
Iodine and derivatives cost of sales increased 8.9% to US$217.5 million in 2018 from US$199.8 million in 2017, as a result of increased sales volumes in 2018. The average cost of sales in the iodine and derivatives business line was US$15.4/kilogram in 2018, a decrease of 2.6% from US$15.8/kilogram in 2017.
| 78 |
Potassium
Potassium cost of sales decreased 30.7% to US$217.4 million in 2018 from US$313.7 million in 2017, as a result of decreased sales volumes. The average cost of sales in the potassium business line was US$236.4/MT in 2018, a slight decrease from US$233.3/MT in 2017.
Industrial Chemicals
Industrial chemicals cost of sales decreased 20.5% to US$73.0 million in 2018 from US$91.8 million in 2017, as a result of decreased sales of solar salts. The average cost of sales in the industrial chemicals business line was US$518.1/MT in 2018, a decrease of 5.4% from US$547/MT in 2017. This decrease in cost was a result of a change in product mix.
Gross Profit
Gross profit increased 2.6% to US$782.3 million in 2018, which represented 34.5% of revenues, from US$762.5 million in 2017, which represented 35.3% of revenues. As discussed above, this increase is attributable to the increase in revenues as a result of significantly higher lithium prices and higher sales volumes of specialty plant nutrients and iodine and derivatives.
Other Income
Other income increased 79.8% to US$32.0 million in 2018, which represented 1.4% of revenues, from US$17.8 million in 2017, which represented 0.8% of revenues. Other income for 2018 included pre-tax income of US$14.5 million related to the sale of our interest in the Minera Exar S.A. lithium project in Argentina. As a percentage of revenues, other income remained very similar between 2018 and 2017.
Administrative Expenses
Administrative expenses increased 16.7% to US$118.1 million in 2018, which represented 5.2% of revenues, from US$101.2 million in 2017, which represented 4.7% of revenues, due to increased revenues.
Other Expenses
Other expenses decreased 44.9% to US$33.9 million in 2018, which represented 1.5% of revenues, from US$61.6 million in 2017, which represented 2.9% of revenues. This decrease was primarily attributable to a charge of approximately US$20.4 million related to payment made by our subsidiary SQM Salar S.A. to Corfo after entering into the Corfo Arbitration Agreement and accounted for in our 2017 consolidated financial statements.
Other Gains (Losses)
Other gains increased to US$6.4 million in 2018, which represented 0.28% of revenues, from US$0.5 million in 2017, which represented 0.03% of revenues.
Finance Income
Finance income increased 66.9% to US$22.5 million in 2018, which represented 1.0% of revenues, from US$13.5 million in 2017, which represented 0.6% of revenues, due to higher interest rates earned on our investments and higher investments volumes during 2018.
| 79 |
Finance Expenses
Finance expenses increased 19.5% to US$59.9 million in 2018, which represented 2.6% of revenues, from US$50.1 million in 2017, which represented 2.3% of revenues, due to increased levels of debt that we had outstanding during 2018.
Equity Income of Associates and Joint Ventures Accounted for Using the Equity Method
Equity income of associates and joint ventures accounted for using the equity method decreased 56.1% to US$6.4 million in 2018, which represented 0.3% of revenues, from US$14.5 million in 2017, which represented 0.7% of revenues.
Foreign Currency Exchange Differences
Losses from foreign currency exchange differences amounted to US$16.6 million in 2018, which represented 0.7% of revenues, compared with a loss of US$1.3 million in 2017, which represented 0.1% of revenues. A significant portion of our costs is related to the Chilean peso as most of our operations occur in Chile. Because the U.S. dollar is our functional currency, we are subject to currency fluctuations. We seek to mitigate this impact through an active hedging program. During 2018, the Chilean peso depreciated 13.2% against the U.S. dollar.
Profit Before Taxes
Profit before taxes increased by US$26.4 million, or 4.4%, to US$621.0 million in 2018 from US$594.6 million in 2017. This increase was primarily attributable to increase in revenues by US$108.5 million, a decrease in other expenses by US$27.7 million and an increase in other income by US$14.2 million, partially offset by an increase in cost of sales by US$88.7 million and an increase in administrative expenses by US$17.0 million, as described above.
Income Tax Expense
Income tax expenses increased 7.7% to US$179.0 million in 2018, representing an effective tax rate of 28.8%, compared to US$166.2 million in 2017, representing an effective tax rate of 27.9%. The effective Chilean corporate tax rate was 25.5% during 2017 and increased to 27% during 2018. The difference between the statutory and effective tax rates was primarily due to a decrease related to tax effect of tax rates outside Chile and non-deductible expenses as detailed in the Note 30.3 to our Consolidated Financial Statements.
Profit for the Year
Profit for the year increased 3.2% to US$442.1 million in 2018 from US$428.4 million in 2017, primarily due to higher average prices in the lithium business line, higher specialty plant nutrient sales volumes, and higher average prices and sales volumes in the iodine business line. These factors offset the impact of the lower sales volumes of potassium chloride.
Results of Operations – 2017 compared to 2016
Revenues
Revenues increased by 11.2% to US$2,157.3 million in 2017 from US$1,939.3 million in 2016. The main factors that caused the increase in revenues and variations in different product lines are described below.
| 80 |
Specialty Plant Nutrition
Specialty plant nutrition revenues increased 11.8% to US$697.3 million in 2017 from US$623.9 million in 2016. Set forth below are sales volume data for the specified years by product category in this product line:
| (in Th. MT) | 2017 | 2016 | % Change | |||||||||
| Potassium nitrate and sodium potassium nitrate | 601.4 | 475.8 | 26 | % | ||||||||
| Specialty blends | 209.0 | 213.5 | -2 | % | ||||||||
| Other specialty plant nutrients (*) | 129.1 | 127.2 | 2 | % | ||||||||
| Sodium nitrate | 26.7 | 24.4 | 10 | % | ||||||||
* Includes trading of other specialty fertilizers.
We sell various products within the specialty plant nutrition business line, and most of our specialty fertilizers are sold as either field fertilizers or water soluble fertilizers. Our sales volumes in this business line increased 14.9% in 2017 compared to 2016 primarily due to demand growth and limited supply from our competitors.
Average prices in the specialty plant nutrition business line were US$722/MT in 2017, slightly lower than US$742/MT in 2016.
Iodine and Derivatives
Iodine and derivatives revenues increased 9.1% to US$252.1 million in 2017 from US$231.1 million in 2016. Set forth below are sales volume data for the specified years:
| (in Th. MT) | 2017 | 2016 | % Change | |||||||||
| Iodine and derivatives | 12.7 | 10.2 | 24 | % | ||||||||
Our sales volumes in this business line increased by approximately 24% compared to 2016, primarily as
a result of higher demand due to new applications of iodine in the specialty plastics and carbon energy plants emission control industries.
However, average prices during 2017 continued to face downward pressure. Our average price for the year was US$20/kilogram, a decrease of over 12% compared to 2016.
Lithium and Derivatives
Lithium and derivatives revenues increased 25.3% to US$644.6 million in 2017 from US$514.6 million in 2016. Set forth below are sales volume data for the specified years:
| (in Th. MT) | 2017 | 2016 | % Change | |||||||||
| Lithium and derivatives | 49.7 | 49.7 | 0 | % | ||||||||
The lithium market continued its strong growth in 2017, with total lithium demand increasing by nearly 17% according to our estimates. Supply did not keep the same pace, and therefore market conditions remained tight.
Average prices in this business line increased 25% compared to average prices during 2016, reaching almost US$13,000/MT compared to average prices of approximately US$10,400/MT in 2016.
| 81 |
Potassium
Potassium revenues decreased 5.9% to US$379.3 million in 2017 from US$403.3 million in 2016. Set forth below are sales volume data for the specified years:
| (in Th. MT) | 2017 | 2016 | % Change | |||||||||
| Potassium chloride and potassium sulfate | 1,344.3 | 1,534.7 | -12 | % | ||||||||
Our revenues in the potassium chloride and potassium sulfate business line were impacted by reduced sales volumes in 2017. As anticipated, sales volumes decreased over 12% during 2017 as we focused our production efforts in the Salar de Atacama on increasing lithium yields. The potassium chloride demand increased an additional 4 million metric tons in 2017, reaching almost 63 million metric tons. As result, potash prices increased slightly during the year. Average prices in the potassium chloride and potassium sulfate business line increased approximately 7.4% during 2017 when compared to 2016, reaching US$282/MT.
Industrial Chemicals
Industrial chemicals revenues increased 30.2% to US$135.6 million in 2017 from US$104.1 million in 2016. Set forth below are sales volume data for the specified years by product category:
| (in Th. MT) | 2017 | 2016 | % Change | |||||||||
| Industrial chemicals | 167.6 | 128.9 | 30 | % | ||||||||
Revenues in the industrial chemicals business line increased as a result of higher sales volumes. These higher sales volumes were primarily related to increased sales volumes of solar salts, which totaled almost 88,000 metric tons this year, in line with our estimated volumes for the year.
Other Products and Services
Revenues from sales of other commodity fertilizers and other income decreased 22% to US$48.5 million in 2017 from US$62.2 million in 2016, primarily due to reduced sales volumes.
Cost of Sales
Our overall cost of sales increased 5.0% to US$1,394.8 million in 2017, which represented 64.7% of revenues, from US$1,328.3 million in 2016, which represented 68.5% of revenues. The main factors that caused the increase in cost of sales and variations in different product lines are described below.
Specialty Plant Nutrition
Specialty plant nutrition cost of sales increased 16.2% to US$555.4 million in 2017 from US$478.1 million in 2016, as a result of increased sales volumes in 2017. The average cost of sales in the specialty plant nutrition business line was US$575/MT in 2017, slightly higher than US$569/MT in 2016.
Iodine and Derivatives
Iodine and derivatives cost of sales increased 4.4% to US$199.8 million in 2017 from US$191.3 million in 2016, as a result of increased sales volumes in 2017. The average cost of sales in the iodine and derivatives business line was US$16/kilogram in 2017, a decrease of almost 16% from US$19/kilogram in 2016. We believe that we are the lowest cost producer of iodine and the cost reduction achieved in 2017 is a result of concentrating all of our production in the modern and efficient production facilities at Nueva Victoria after the closure of Pedro de Valdivia plant.
| 82 |
Lithium and Derivatives
Lithium and derivatives cost of sales increased 7.8% to US$189.2 million in 2017 from US$175.6 million in 2016, primarily as result of higher lease payments to Corfo, and operating our production plant at full capacity. The average cost of sales in the lithium and derivatives business line was US$3,808/MT in 2017, an increase of almost 7.7% from US$3,536/MT in 2016.
Potassium
Potassium cost of sales decreased 12.7% to US$313.7 million in 2017 from US$359.5 million in 2016, as a result of decreased sales volumes. The average cost of sales in the potassium business line was US$233/MT in 2017, a slight decrease from US$234/MT in 2016.
Industrial Chemicals
Industrial chemicals cost of sales increased 36.2% to US$91.8 million in 2017 from US$67.4 million in 2015, as a result of increased sales of solar salts. The average cost of sales in the industrial chemicals business line was US$547/MT in 2017, an increase of 4.7% from US$523/MT in 2016. This increase in cost was a result of a change in product mix.
Gross Profit
Gross profit increased 24.8% to US$762.5 million in 2017, which represented 35.3% of revenues, from US$611.0 million in 2016, which represented 31.5% of revenues. As discussed above, this increase is attributable to the increase in revenues as a result of significantly higher lithium prices, higher sales volumes in specialty plant nutrition, iodine and derivatives, and solar salts. A reduction in cost of sales from 68.5% of 2016 revenues to 64.7% of 2017 revenues also contributed to an increase in gross profit.
Other Income
Other income increased 17.3% to US$17.8 million in 2017, which represented 0.8% of revenues, from US$15.2 million in 2016, which represented 0.8% of revenues. As a percentage of revenues, other income remained very similar between 2017 and 2016.
Administrative Expenses
Administrative expenses increased 14.4% to US$101.2 million in 2017, which represented 4.7% of revenues, from US$88.4 million in 2016, which represented 4.6% of revenues, due to increased revenues.
Other Expenses
Other expenses decreased 31.3% to US$61.6 million in 2017, which represented 2.9% of revenues, from US$89.7 million in 2016, which represented 4.6% of revenues. This decrease was primarily attributable to a one-time charge for impairment related to the closing of the train between Coya Sur and Tocopilla of approximately US$32.8 million and a charge of approximately US$30.5 million related to the Company's agreement with the DOJ and the administrative cease and desist order issued by the SEC, both in 2016. The decrease in other expenses seen in 2017 was partially offset by a charge of approximately US$20.4 million relating to payment made by our subsidiary SQM Salar S.A. to Corfo after entering into the Corfo Arbitration Agreement.
| 83 |
Other Gains (Losses)
Other gains (losses) decreased to a gain of US$0.5 million in 2017, which represented 0.03% of revenues, from a gain of US$0.7 million in 2016, which represented 0.04% of revenues.
Finance Income
Finance income increased 33.3% to US$13.5 million in 2017, which represented 0.6% of revenues, from US$10.1 million in 2016, which represented 0.5% of revenues, due to higher interest rates earned on our investments and higher investments volumes during the year.
Finance Expenses
Finance expenses decreased 12.8% to US$50.1 million in 2017, which represented 2.3% of revenues, from US$57.5 million in 2016, which represented 3.0% of revenues, due to decreased levels of debt that we had during 2017.
Equity Income of Associates and Joint Ventures Accounted for Using the Equity Method
Equity income of associates and joint ventures accounted for using the equity method increased 10.8% to US$14.5 million in 2017, which represented 0.7% of revenues, from US$13.0 million in 2016, which represented 0.7% of revenues.
Foreign Currency Exchange Differences
Losses from foreign currency exchange differences amounted to US$1.3 million in 2017, which represented 0.06% of revenues, compared with a profit of US$0.5 million in 2016, which represented 0.2% of revenues. A significant portion of our costs is related to the Chilean peso as most of our operations occur in Chile. Because the U.S. dollar is our functional currency, we are subject to currency fluctuations. We seek to mitigate this impact through an active hedging program. During 2017, the Chilean peso appreciated 8.0% against the U.S. dollar.
Profit Before Taxes
Profit before taxes increased by US$179.7 million, or 43.3%, to US$594.6 million in 2017 from US$414.9 million in 2016. This increase was primarily attributable to increase in revenues by US$218.0 million, a decrease in financial expenses by US$7.4 million and a decrease in other expenses by US$28.1 million, partially offset by an increase in cost of sales by US$66.5 million, each of the reasons described above.
Income Tax Expense
Income tax expenses increased 25.0% to US$166.2 million in 2017, representing an effective tax rate of 27.9%, compared to US$133.0 million in 2016, representing an effective tax rate of 32.0%. The effective Chilean corporate tax rate was 24.0% during 2016 and increased to 25.5% during 2017. The difference between the statutory and effective tax rates was primarily due to a decrease related to tax effect of tax rates outside Chile and non-deductible expenses as detailed in the Note 30.3 to our Consolidated Financial Statements.
| 84 |
Profit for the Year
Profit for the year increased 52.0% to US$428.4 million in 2017 from US$281.9 million in 2016, primarily as a result of significantly higher lithium prices and increased sales volumes in specialty plant nutrients, iodine and derivatives and industrial chemicals business lines.
5.B. Liquidity and Capital Resources
As of December 31, 2018, we had US$868.8 million of cash and cash equivalents and time deposits. In addition, as of December 31, 2018, we had US$481 million of unused uncommitted working capital credit lines.
Shareholders’ equity decreased to US$2,137.8 million as of December 31, 2018 from US$2,247.5 million as of December 31, 2017. Our ratio of total liabilities to total equity (including non-controlling interest) on a consolidated basis increased to 1.00 as of December 31, 2018 from 0.91 as of December 31, 2017.
We evaluate from time to time our cash requirements to fund capital expenditures, dividend payouts and increases in working capital, but we believe our working capital is sufficient for our present requirements. As debt requirements also depend on the level of accounts receivable and inventories, we cannot accurately determine the amount of debt we will require nor are our requirements typically seasonal.
The table below shows our cash flows for 2018, 2017 and 2016:
| (in millions of US$) | 2018 | 2017 | 2016 | |||||||||
| Net cash from operating activities | 524.8 | 758.3 | 633.7 | |||||||||
| Net cash used in financing activities | (387.3 | ) | (411.9 | ) | (816.4 | ) | ||||||
| Net cash from (used in) investing activities | (187.0 | ) | (248.1 | ) | 162.4 | |||||||
| Effects of exchange rate fluctuations on cash and cash equivalents | (24.9 | ) | 17.5 | 7.8 | ||||||||
| Net increase (decrease) in cash and cash equivalents | (74.4 | ) | 115.8 | (12.6 | ) | |||||||
We operate a capital-intensive business that requires significant investments in revenue-generating assets. Our past growth strategies have included purchasing production facilities and equipment and the improvement and expansion of existing facilities. Funds for capital expenditures and working capital requirements have been obtained from net cash from operating activities, borrowing under credit facilities and issuing debt securities.
The Board of Directors approved a capital expenditures plan for 2019 of approximately US$360 million in connection with investments to be made in Chile and abroad. The 2019 capital investment program is primarily focused on the maintenance and expansion of our production facilities as well as investment in new projects. Our 2019 capital investment program does not require external financing but we evaluate from time to time whether to access capital markets in order to optimize our financial position. See “Item 4.A. History and Development of the Company—Capital Expenditure Program.”
Our other major use of funds is for dividend distributions. The Board of Directors approved payment of dividends of US$542 million and US$370 million during 2018 and 2017, respectively. In the consolidated statement of cash flows, we reported dividends paid of US$550 and US$374 during 2018 and 2017, respectively. The difference in the amounts of dividends paid set forth in the consolidated statement of cash flows, and the amount approved by the Board, is due to the differences in the exchange rate. For a disclosure of our 2018 dividend policy and payments, see “Item 8.A.8. Dividend Policy”.
The Dividend Policy proposal for 2019 is expected to be announced at the Annual Shareholders’ Meeting to be held on April 25, 2019.
| 85 |
Financing Activities
Our current ratio, defined as current assets divided by current liabilities, increased to 4.32 as of December 31, 2018 from 3.29 as of December 31, 2017. The following table shows key information about our outstanding long- and short-term debt as of December 31, 2018.
| Debt Instrument (1) | Current Amount (ThUS$) | Non-Current Amount (ThUS$) | Interest Rate | Issue Date | Maturity Date | Amortization | ||||||||||||
| Bilateral loan — US$70 million | 3.98 | % | May 29, 2019 | May 29, 2023 | Bullet | |||||||||||||
| 5.50% Notes due 2020 — US$250 million | 2,288 | 249,869 | 5.50 | % | Apr. 21, 2010 | Apr. 21, 2020 | Bullet | |||||||||||
| 3.625% Notes due 2023 — US$300 million | 2,044 | 247,798 | 3.63 | % | Apr. 03, 2013 | Apr. 03, 2023 | Bullet | |||||||||||
| 4.375% Notes due 2025 — US$250 million | 4,215 | 297,994 | 4.38 | % | Oct. 28, 2014 | Jan. 28, 2025 | Bullet | |||||||||||
| Series H Bond — UF 4 million. | 3,617 | 157,312 | 4.90 | % | Jan. 05, 2009 | Jan. 05, 2030 | Semiannual, beginning in 2019 | |||||||||||
| Series O Bond — UF 1.5 million | 867 | 58,636 | 3.80 | % | Feb. 01, 2012 | Feb. 01, 2033 | Bullet | |||||||||||
| Series P Bond — UF 3 million | 1,772 | 118,927 | 3.25 | % | April 6, 2018 | Jan. 15, 2028 | Bullet | |||||||||||
| Series Q Bond — UF 3 million | 342 | 118,943 | 3.45 | % | Nov. 8, 2018 | Jun. 15, 2038 | Bullet | |||||||||||
(1) With the exception of the Series Q bond, UF denominated bonds are fully hedged to U.S. dollars with cross-currency swaps.
As of December 31, 2018, we had total financial debt of US$1,330 million compared to US$1,031 million as of December 31, 2017. Of the total short-term debt as of December 31, 2018 was US$23.6 million, and as of December 31, 2017 was US$220.3 million.
As of December 31, 2018, all of our long-term debt, including the current portion, was denominated in U.S. dollars, and with the exception of our Series Q Bonds, all our UF-denominated bonds were hedged with cross-currency swaps to the U.S. dollar.
The financial covenants related to our debt instruments include: (i) limitations on the ratio of total liabilities to equity (including non-controlling interest) on a consolidated basis, and (ii) minimum production assets. We believe that the terms and conditions of our debt agreements are standard and customary.
The following table shows the maturities of our nominal long-term debt by year as of December 31, 2018 (in millions of US dollars):
| Maturity (1) | Amount | |||
| 2019 | 7.2 | |||
| 2020 | 264.4 | |||
| 2021 | 14.4 | |||
| 2022 | 14.4 | |||
| 2023 and thereafter | 1,025.8 | |||
| Total | 1,326.3 | |||
(1) Only the principal amount has been included. For the UF-denominated local bonds, the amounts presented reflect the real U.S. dollar obligation as of December 31, 2018 not including the effects of the cross-currency swaps that hedge these bonds to the U.S. dollar and which had, as of December 31, 2018, a market value of US$3.8 million against SQM.
On April 5, 2018, we placed and sold on the Chilean stock market an issue of Series P bonds for a total amount of UF 3,000,000 (approximately US$135 million). The Series P bonds (i) have a maturity date of January 15, 2028, (ii) will accrue interest at the rate of 3.25% per annum on the unpaid capital, expressed in UF, from January 15, 2018 and (iii) have an early redemption option from April 5, 2018.
| 86 |
On November 8, 2018, we placed and sold on the Chilean stock market an issue of Series Q bonds for a total amount of UF 3,000,000 (approximately US$123.6 million). The Series Q bonds have a: (i) maturity date of June 1, 2038, (ii) will accrue interest at a rate of 3.45% per annum on the unpaid capital, expressed in UF, from June 1, 2018 and (iii) have an early redemption option from November 8, 2018.
Environmental and Occupational Safety and Health Projects
We spent US$26.2 million on environmental, safety and health projects in 2018. We have budgeted approximately US$23.0 million in 2019 for environmental, safety and health projects. This amount forms part of the capital expenditure program discussed above.
Non-IFRS Financial Measures
This annual report makes reference to certain non-IFRS financial measures, namely EBITDA and adjusted EBITDA. These non-IFRS financial measures are not recognized measures under IFRS, do not have a standardized meaning prescribed by IFRS and are therefore unlikely to be comparable to similar measures presented by other companies. Rather, these measures are provided as additional information to complement IFRS measures by providing further understanding of the Company’s results of operations from management’s perspective. Accordingly, they should not be considered in isolation nor as a substitute for analysis of our financial information reported under IFRS.
EBITDA represents Profit for the Year + Depreciation and Amortization Expenses + Finance Costs + Income Tax and Adjusted EBITDA is defined as EBITDA – Other income – Other gains (losses) - Share of Profit of associates and joint ventures accounted for using the equity method + Other expenses by function + Net impairment gains on reversal (losses) of financial assets – Finance income – Currency differences. We have included EBITDA and adjusted EBITDA to provide investors with a supplemental measure of our operating performance.
We believe EBITDA and adjusted EBITDA are important supplemental measures of operating performance because it eliminates items that have less bearing on our operating performance and thus highlights trends in our core business that may not otherwise be apparent when relying solely on IFRS financial measures.
EBITDA and adjusted EBITDA have important limitations as analytical tools. For example, EBITDA and adjusted EBITDA do not reflect (a) our cash expenditures, or future requirements for capital expenditures or contractual commitments; (b) changes in, or cash requirements for, our working capital needs; (c) the significant interest expense, or the cash requirements necessary to service interest or principal payments, on our debt; and (d) tax payments or distributions to our parent to make payments with respect to taxes attributable to us that represent a reduction in cash available to us. Although we consider the items excluded in the calculation of non-IFRS measures to be less relevant to evaluate our performance, some of these items may continue to take place and accordingly may reduce the cash available to us. See also note 19.1 of the Consolidated Financial Statements.
| 87 |
We believe that the presentation of the non-IFRS financial measures described above is appropriate. However, these non-IFRS measures have important limitations as analytical tools, and you should not consider them in isolation, or as substitutes for analysis of our results as reported under IFRS. Because of these limitations, we primarily rely on our results as reported in accordance with IFRS and use EBITDA and adjusted EBITDA only supplementally.
| For the year ended December 31, 2018, 2017, 2016 | ||||||||||||
| 2018 | 2017 | 2016 | ||||||||||
| (ThUS$) | (ThUS$) | (ThUS$) | ||||||||||
| Profit for the Year | 442,063 | 428,417 | 281,924 | |||||||||
| (+) Depreciation and amortization expenses | 221,499 | 240,526 | 249,792 | |||||||||
| (+) Finance costs | 59,914 | 50,124 | 57,498 | |||||||||
| (+) Income tax | 178,975 | 166,173 | 132,965 | |||||||||
| EBITDA | 902,451 | 885.240 | 722,179 | |||||||||
| (-) Other income | 32,048 | 17,827 | 15,202 | |||||||||
| (-) Other gains (losses) | 6,404 | 543 | 679 | |||||||||
| (-) Share of Profit of associates and joint ventures accounted for using the equity method | 6,351 | 14,452 | 13,047 | |||||||||
| (+) Other Expenses by Function | 36,907 | 53,600 | 82,533 | |||||||||
| (+) Net impairment gains on reversal (losses) of financial assets | (2,967 | ) | 8,038 | 7,198 | ||||||||
| (-) Finance income | 22,533 | 13,499 | 10,129 | |||||||||
| (-) Currency differences | (16,597 | ) | (1,299 | ) | 460 | |||||||
| Adjusted EBITDA | 885,652 | 901,856 | 772,393 | |||||||||
5.C. Research and Development, Patents and Licenses, etc.
One of the main objectives of our research and development team is to develop new processes and products in order to maximize the returns obtained from the resources that we exploit. Our research is performed by three different units, whose research topics cover all of the processes involved in the production of our products, including chemical process design, phase chemistry, chemical analysis methodologies and physical properties of finished products.
Our research and development policy emphasizes the following: (i) optimizing current processes in order to decrease costs and improve product quality through the implementation of new technology, (ii) developing higher-margin products from current products through vertical integration or different product specifications, (iii) adding value to inventories and (iv) using renewable energy in our processes.
Our research and development activities have been instrumental in improving our production processes and developing new value-added products. As a result, new methods of extraction, crystallization and finishing products have been developed. Technological advances in recent years have enabled us to improve process efficiency for the nitrate, potassium and lithium operations, improve the physical quality of our prilled products and reduce dust emissions and caking by applying specially designed additives to our products handled in bulk. Our research and development efforts have also resulted in new, value-added markets for our products. One example is the use of sodium nitrate and potassium nitrate as thermal storage in solar power plants.
We have patented several production processes for nitrate, iodine and lithium products. These patents have been filed mainly in the United States, Chile and in other countries when necessary. The patents used in our production processes include Chilean patent No. 47,080 for iodine (production of spherical granules of chemicals that sublime), Japanese patent No. 4,889,848 for nitrates (granular fertilizers) and patent Nos. 41,838 from Chile, 5393-B and 5391-B from Bolivia, AR001918B1 and AR001916B1 from Argentina and 5,676,916 and 5,939,038 from the U.S. for lithium (removal of boron from brines).
5.D. Trend Information
Our revenues increased 5.0% to US$2,265.8 million in 2018 from US$2,157.3 million in 2017. Gross profit increased 2.6% to US$782.3 million in 2018, which represented 34.5% of revenues, from US$762.5 million in 2017, which represented 35.3% of revenues. Profit attributable to controlling interests increased 2.8% to US$439.8 million in 2018 from US$427.7 million in 2017.
| 88 |
We saw lower sales volumes in the lithium business line in 2018 compared to 2017 as a result of delayed completion of ramp-up of our lithium carbonate plant expansion to 70,000 metric tons. The lithium market continued its strong growth in 2018, with total demand growth surpassing 27% according to our estimates. Average prices in this business line were 25.6% higher in 2018 when compared to average prices seen during 2017. New supply is entering the market, which could impact our ability to maintain this price premium in 2019. However, there are several lithium grades of different qualities available in the lithium market, and not all products are sold at the same price. We do not believe that all lithium supply entering the market is suitable for all customers. We will focus on providing a high-quality grade lithium to our customers in 2019. We will also rebuild some inventories this year, and as a result of this, we believe our sales volumes in 2019 could be slightly higher than sales volumes seen in 2018. Demand growth in 2018 and continuing into 2019 was led by demand related to batteries for electric vehicles. We believe that full electric vehicle penetration rates reached 2% in 2018, and this number is expected to over double in the next five years. Demand in 2019 is expected to be at least 20% greater than total demand in 2018.
Our sales volumes in the specialty plant nutrition business line increased 12.0% in 2018 compared to 2017, while average prices were flat, increasing by a mere 0.07%. As a result of the higher sales volumes, our revenues in this business line increased by 12.1%. Higher sales volumes seen during 2018 were due to demand growth and limited supply from our competitors. We sell various products within this business line, and most of our specialty fertilizers are sold as either field fertilizers or water soluble fertilizers. Our strategy in this business line has been to focus primarily on the water-soluble fertilizer market, which in general yields higher margins and has more growth potential.
Our sales volumes in the iodine business line increased 5.1% in 2018. We also saw prices increase during 2018; we closed the fourth quarter with average prices of almost US$26/kg, exceeding our original expectations. Average prices in 2018 were 22.6% higher than the average prices seen in 2017. Increased sales volumes and higher prices resulted in an increase of 28.9% in our revenues for this business line. According to our estimates, the global iodine demand grew slightly in 2018 reaching almost 36,300 MT and we increased our market share to over 36%.
Our sales volumes in the potassium business line decreased by 38.1% in 2018 compared to 2017. These lower sales volumes were a result of our production limitations as we focused our production efforts in the Salar de Atacama on increasing lithium yields. Furthermore, as a result of environmental compliance plan that was approved by the Chilean Environmental Authority (SMA) in January 2019, at the end of the year, we are temporarily extracting less brine than we had in the past. We had previously announced that potassium chloride and potassium sulfate sales volumes could decrease significantly in 2019 when compared to 2018, we now believe that sales volumes for 2019 will be below 500,000 metric tons. Average prices in the potassium chloride and potassium sulfate business line increased approximately 14.0% during 2018 when compared to 2017, reaching US$322/MT. The higher prices reflected the stronger global demand for potassium chloride in 2018, reaching almost 66 million metric tons.
Our sales volumes in the industrial chemicals product line decreased 18.9% in 2018 compared to 2017, as a result of lower sales volumes of solar salts. Solar salts sales depend on the ramp up of the concentrated solar power plants (CSP) projects and we expect our sales volumes in 2019 to be approximately 50,000 metric tons, very similar to the 47,000 metric tons sold in 2018.
5.E. Off-Balance Sheet Arrangements
We have not entered into any transactions with unconsolidated entities whereby we have financial guarantees, retained or contingent interests in transferred assets, derivative instruments or other contingent arrangements that would expose us to material continuing risks, contingent liabilities, or any other obligations arising out of a variable interest in an unconsolidated entity that provides financing, liquidity, market risk or credit risk support to us or that engages in leasing, hedging or research and development services with us.
| 89 |
5.F. Tabular Disclosure of Contractual Obligations
The following tables show our material expected obligations and commitments as of December 31, 2018 (in millions of US dollars):
| Less Than | 1 - 3 | 3 - 5 | More Than | |||||||||||||||||
| Total | 1 year | years | years | 5 years | ||||||||||||||||
| ThUS$ | ThUS$ | ThUS$ | ThUS$ | ThUS$ | ||||||||||||||||
| Financial liabilities (1) | 1,682.5 | 65.5 | 360.1 | 543.3 | 713.6 | |||||||||||||||
| Operating leases | 2,051 | 188.6 | 338.5 | 338.5 | 1,185 | |||||||||||||||
| Purchase commitments (2) | 59.9 | 59.9 | - | - | - | |||||||||||||||
| Staff severance indemnities | 28.2 | - | - | - | 28.2 | |||||||||||||||
| Total contractual obligations and commitments | 3,821.2 | 314 | 698.6 | 881.8 | 1,926.8 | |||||||||||||||
(1) Include short-term and long-term financial liabilities with interest calculated based on the contractual agreements and considering the effect of hedging financial instruments.
(2) The purchase commitments held by the Company are recognized as a liability when the services and goods are received by the Company.
5.G. Safe Harbor
The information contained in Items 5.E and 5.F contains statements that may constitute forward-looking statements. See “Cautionary Statement Regarding Forward-Looking Statements” in this Annual Report, for safe harbor provisions.
| ITEM 6. | DIRECTORS, SENIOR MANAGEMENT AND EMPLOYEES |
6.A. Directors and Senior Management
We are managed by our executive officers under the direction of our Board of Directors, which, in accordance with our By-laws, consists of eight directors, seven of whom are elected by holders of Series A common shares and one of whom is elected by holders of Series B common shares. The entire Board of Directors is regularly elected every three years at our Ordinary Shareholders’ Meeting. Cumulative voting is allowed for the election of directors. The Board of Directors may appoint replacements to fill any vacancies that occur during periods between elections. If a vacancy occurs, the entire Board must be elected or re-elected at the next regularly scheduled Ordinary Shareholders’ Meeting. Our Chief Executive Officer is appointed by the Board of Directors and holds office at the discretion of the Board. The Chief Executive Officer appoints our executive officers. There are regularly scheduled meetings of the Board of Directors once a month. Extraordinary meetings may be called by the Chairman when requested by (i) the director elected by holders of the Series B common shares, (ii) any other director with the assent of the Chairman or (iii) an absolute majority of all directors. The Board of Directors has a Directors’ Committee and its regulations are discussed below.
Each of the six members of the current Board of Directors was elected for a three-year term at the Annual Ordinary Shareholders’ Meeting that took place on April 27, 2018. Between January 1, 2018 and April 27, 2018, Messrs. Eugenio Ponce L., Gerardo Jofré M. and Fernando Massu T. served as Board members. Between January 1, 2018 and January 24, 2018, Robert Kirkpatrick and Joanne Boyes served as Board members. On January 24, 2018, Mr. Darryl Stann was appointed as a director replacing Ms. Joanne Boyes. On February 19, 2018, Mr. Mark F. Fracchia was appointed as a director replacing Mr. Kirkpatrick. On December 5, 2018, Messrs. Stann and Fracchia presented to the Board of Directors their resignations from the positions as directors of SQM. As a result of the resignations of Mr. Stann and Mr. Fracchia, there are currently two vacancies on the Board, and pursuant to the Company’s By-laws, the entire Board of Directors will be elected at the next Annual General Shareholders’ Meeting on April 25, 2019 for new three-year terms.
| 90 |
Our current directors are as follows:
| Name | Position and relevant experience |
Current position
held since |
||
| Alberto Salas M. | Chairman of the Board and Director. Mr. Salas earned a degree in Mining Civil Engineering from the Universidad de Chile and holds a post-graduate degree in Corporate Finance from Adolfo Ibáñez University, Chile. He is a Board member of Cia. Minera Valle Central, CAP Minería, ENAEX S. A. and Amerigo Resources Ltd. He is also president of the Mining Engineers-Foundation University of Chile, the Chilean Pacific Foundation, the Inter-American Mining Society and the Latin American Mining Organization. He is currently chairman of the National Institute of Professional Training (INACAP). | April 2018 | ||
| Patricio Contesse F. | Vice Chairman of the Board and Director. Mr. Contesse is a lawyer with a degree from the Pontificia Universidad Católica de Chile. Previously, he served as a Board member of SQM during 2013 until 2015. Since 2011, he has been Board member and held senior executive positions in Pampa Group, where he is currently Vice Chairman of Pampa Calichera, Oro Blanco, Potasios de Chile and Norte Grande, as well as a Board member of Nitratos de Chile. | April 2018 | ||
| Hernán Büchi B. | Director. Mr. Büchi earned a degree in Civil Engineering from the Universidad de Chile. He served on the SQM Board of Directors for several years until April 2016, before rejoining in 2017. He is currently a Board member of Quiñenco S.A. and S.A.C.I. Falabella, among others. He is also Chairman of the Board of Directors of the Universidad del Desarrollo. | April 2017 | ||
| Laurence Golborne R. | Director. Mr. Golborne earned a degree in Industrial Civil Engineering from the Universidad Católica de Chile. He is a member of the Board of Ripley Corp. S.A., Construmart S.A., and Aventura S.A. (Perú), a Board Adviser of Sociedad Inversiones Arrigoni S.A. and Metalúrgica Arrigoni S.A., and President of Tavamay S.A. (Paraguay). Previously, Mr. Golborne was Chilean Minister of the State during 2010-2012, CEO of Cencosud S.A., and Corporate Director of Finance at Gener S.A., among other roles in various companies. | April 2018 |
| 91 |
| Name | Position and relevant experience |
Current position
held since |
||
| Gonzalo Guerrero Y (1). | Director. Mr. Guerrero Yamamoto earned a law degree from the Universidad de Chile and a Masters of Business Law from the Universidad Adolfo Ibáñez. He was General Counsel and substitute Board member of Integramédica S.A. for more than seven years and was a Director of Inversiones Oro Blanco S.A., Asfaltos Chilenos S.A. and VNT S.A. (Vantrust Capital Asset Management), among others, until April 2016. Currently, he is an Executive Board member of Guerrero and Associates, and a Board member of Sanasalud S.A., Club Deportivo Palestino SADP and SMA Clínica Internacional S.A. (Peru). | April 2017 | ||
| Arnfinn F. Prugger | Director. Dr. Prugger is former Vice President, Technical Services of Potash Corporation of Saskatchewan, now Nutrien, retiring from this position on January 30, 2018. He has worked in the potash industry for over 40 years and has a wide range of senior-level experience in mining, mine operations and potash exploration. Dr. Prugger is currently a Canadian Institute of Mining (CIM) Distinguished Lecturer. | April 2015 |
Our current executive officers are as follows:
| Name | Position and relevant experience |
Current position
held since |
||
| Ricardo Ramos R. | Chief Executive Officer. Mr. Ramos earned an industrial engineering degree from the Pontificia Universidad Católica de Chile. In 1989, he joined SQM as Finance Advisor and served as Chief Financial Officer and Vice President of Corporate Services from 1994 until 2018, before assuming his current role in January 2019. | January 2019 | ||
| Gerardo Illanes G. (2) | Chief Financial Officer. Mr. Illanes earned an engineering degree from the Universidad Católica de Chile and a Master of Business Administration from Emory University's Goizueta Business School. In 2006, he joined SQM and has served in several positions within the finance area at our headquarters in Santiago, Chile and in subsidiaries around the world. Mr. Illanes is also a member of the Board of Soquimich Comercial. In May 2016, he became Vice President of Finance, and assumed his current role in October 2018. | October 2018 |
| 92 |
| Name | Position and relevant experience |
Current position
held since |
||
| Gonzalo Aguirre T. | General Counsel. Mr. Aguirre earned a degree in law from the Universidad Católica de Chile and a Master of Laws (LL.M) degree from Georgetown University Law Center. He joined SQM in April 2016 and has served as Legal Vice President since September 2016. Prior to joining SQM, he worked at SunEdison as Head of Legal for Latin America and at AES Gener, where he served as a counsel on corporate and project matters. Prior to his in-house experience, he worked for Carey, Paul Hastings LLP (as an international legal consultant) and Vial and Palma, where his practice focused on corporate and financial matters. He is admitted to practice in Chile and in Washington, D.C., as a special legal consultant. | September 2016 | ||
| Pablo Altimiras C. | Vice President of Lithium and Iodine Business. Mr. Altimiras earned an engineering degree and a Master of Business Administration from the Universidad Católica de Chile. In 2007, he joined SQM as Chief of Logistics Projects. In 2009, he was promoted to Regulatory Affairs Director. He was Business Development Vice Manager from 2010 to 2011 and Development and Planning Manager in 2012. In 2016, he became Vice President of Development and Planning. | October 2018 | ||
| José Miguel Berguño C. (3) | Vice President of Operations, Nitrates and Iodine. Mr. Berguño earned an engineering degree and Master of Business Administration from the Universidad Católica de Chile. In 1998, he joined SQM as Planning Engineer. In 2001, he served as Supply Chain Manager, and in 2006 he was Human Resources Manager. From 2010 to 2011, he was the National Director of Science under the Minister of Labor. In 2012, he was Human Resources Manager for Vitamina Work Life. In 2013, he resumed his role as Supply Chain Manager at SQM, and in 2016 took on the position of Vice President of Human Resources and Performance. In 2019, he became Vice President of Operarions of Nitrates and Iodine. | March 2019 | ||
| Frank Biot | Vice President of Nitrates and Potassium Business Mr. Biot earned a Master in Applied Economics from the University of Antwerp in Belgium and a Master of Business Administration from the Catholic University of Leuven. In 1984, he joined Nitrate Corporation of Chile Ltd. in London. In 1991, he was promoted to President of SQM Europe at SQM’s regional headquarters for Europe, Africa, Asia and Oceania. In 2000, he assumed the position of Commercial Vice President Specialty Plant Nutrition. | October 2018 |
| 93 |
| Name | Position and relevant experience |
Current position
held since |
||
| Carlos Díaz O. | Vice President of Operations, Potassium and Lithium. Mr. Díaz earned an engineering degree and a Master of Business Administration from the Pontificia Universidad Católica de Chile. In 1996, he joined SQM as Planning Engineer in the Sales Division. He was promoted to Planning Manager in 1998. In 2002, he assumed the position of Deputy Financial Manager of the Commercial Offices. In 2006, he became our Logistics Manager, and in 2019 he became Vice President of Operations, Potassium and Lithium. | March 2019 | ||
| Raul Puerto M. |
Internal Audit Manager. He earned a Master of Business Administration from the University of Chile and Tulane University and an industrial engineering degree from the Pontificia Universidad Javeriana de Colombia. Mr. Puerto has 20 years of experience in audit, risk management, internal control, and compliance, having worked in AngloAmerican, BHP, and Deloitte, leading Internal Audit, Risk Management and other Administrative areas in Chile and Latin America.
|
January 2016 | ||
| Francisco Sanchez V. | Risk Management and Compliance Officer. Mr Sanchez earned and engineering degree and is candidate for a Master of Business Administration, both from the Pontificia Universidad Católica de Chile. He joined SQM in 2008 as a Management Control Engineer, then he worked in Finance in Soquimich Comercial S.A., and in 2012 he was promoted to Finance Director, first for SQM Mexico, and then for the Latin America region. In 2017, he assumed the position of Compliance Project Director. | April 2019 |
| (1) | As of December 31, 2018, Mr. Guerrero beneficially owned 1,353 of SQM´s shares. |
| (2) | As of December 31, 2018, Mr. Illanes beneficially owned 800 of SQM’s shares. |
| (3) | As of December 31, 2018, Mr. Berguño beneficially owned 380 of SQM’s shares. |
| 94 |
6.B. Compensation
At the Ordinary Shareholders’ Meeting held on April 27, 2018, shareholders approved the compensation for the Audit and Financial Risk Committee, Corporate Governance Committee and the Safety, Health and Environmental Committee.
During 2018, directors were paid a monthly retainer fee, which was independent of attendance and the number of Board sessions. For the Chairman, the fee amounted to UF 400 per month. For the remaining seven directors, the fee amounted to UF 350 per month. In addition, the directors received variable compensation (in Chilean pesos) based on a profit-sharing program approved by the shareholders. Both the Chairman and the Vice Chairman received the equivalent of 0.12% of the total net profit that the Company obtained during the 2018 fiscal year and each of the remaining six directors received the equivalent of 0.06% of the 2018 total net profit of the Company.
In addition, during 2018, members of the Directors’ Committee were paid UF 113 per month, regardless of the number of sessions held by the Directors’ Committee. The members of the Directors’ Committee also received variable compensation (in Chilean pesos) based on a profit-sharing program approved by the shareholders. Each member of the Directors’ Committee received an amount equal to 0.02% of the total net profit that the Company obtained in 2018 fiscal year.
During 2018, the members of the Safety, Health and Environmental and the Corporate Governance Committees received UF 50 per month, regardless of the number of sessions held.
During 2018, the compensation paid to each of our directors who served on the Board of Directors during the year was as follows (amounts in Chilean pesos):
|
SQM Board
Meeting (CH$) |
SQM
Directors' Committee (CH$) |
SQM Health,
Safety and Environment Committee (CH$) |
Corporate
Governance Committee (CH$) |
SQMC
Meeting
|
Total (CH$) | |||||||||||||||||||
| Alberto Salas Muñoz | 76,419,796 | 21,588,591 | 0 | 0 | 0 | 98,008,387 | ||||||||||||||||||
| Patricio Contesse Fica | 66,867,323 | 0 | 9,552,476 | 0 | 0 | 76,419,799 | ||||||||||||||||||
| Joanne L. Boyes | 126,839,873 | 42,726,820 | 0 | 0 | 0 | 169,566,693 | ||||||||||||||||||
| Hernán Büchi Buc | 248,591,324 | 21,588,590 | 6,725,916 | 16,278,392 | 0 | 293,184,222 | ||||||||||||||||||
| Mark Fracchia | 121,751,455 | 0 | 0 | 9,552,476 | 0 | 131,303,931 | ||||||||||||||||||
| Laurence Golborne Riveros | 66,867,323 | 21,588,591 | 0 | 0 | 0 | 88,455,914 | ||||||||||||||||||
| Gonzalo Guerrero Yamamoto | 243,231,561 | 0 | 14,938,485 | 0 | 0 | 258,170,046 | ||||||||||||||||||
| Gerardo Jofré Miranda | 181,723,866 | 61,695,408 | 0 | 6,725,916 | 0 | 250,145,190 | ||||||||||||||||||
| Robert A. Kirkpatrick | 126,839,873 | 0 | 0 | 2,681,154 | 0 | 129,521,027 | ||||||||||||||||||
| Fernando Massu Taré | 176,339,126 | 59,676,130 | 0 | 0 | 0 | 236,015,256 | ||||||||||||||||||
| Luis Eugenio Ponce Lerou | 430,139,181 | 0 | 0 | 0 | 9,790,063 | 439,929,244 | ||||||||||||||||||
| Arnfinn F. Prugger | 248,591,321 | 0 | 16,278,392 | 0 | 0 | 264,869,713 | ||||||||||||||||||
| Darryl Stann | 121,751,455 | 18,968,836 | 0 | 13,597,238 | 0 | 154,317,529 | ||||||||||||||||||
| Total | 2,235,953,477 | 247,832,966 | 47,495,269 | 48,835,176 | 9,790,063 | 2,589,906,951 | ||||||||||||||||||
| 95 |
For the year ended December 31, 2018, the aggregate compensation paid to our 123 principal executives based in Chile was US$27.9 million. We do not disclose to our shareholders or otherwise make available to the public information as to the compensation of our individual executive officers.
We maintain incentive programs for our employees based on individual performance, company performance and short-term indicators. We provide executives with an annual and a long-term bonus plan. Their incentives are based on target achievement, individual contribution to the Company’s operating results, and the Company’s performance. SQM also operates a compensation plan designed to retain its executives by providing bonuses linked to the Company’s share price.
As of December 31, 2018, we had a provision related to all of the incentive programs in the aggregate of US$28.9 million.
We do not maintain any pension or retirement programs for the members of the Board of Directors or our executive officers in Chile.
6.C. Board Practices
Information regarding the period of time each of SQM’s current Directors has served in his office is provided in the discussion of each member of the Board of Directors above in Item 6.A. Directors and Senior Managers.
The date of expiration of the term of the current Board of Directors is April 2021. The contracts of our executive officers are indefinite. The current Board of Directors was elected at the previous Annual Ordinary Shareholders’ Meeting held on April 27, 2018 for three year terms expiring in April 2021. However, due to the resignations of two directors in December 2018, the entire Board of Directors will be elected at the next Annual General Shareholders’ Meeting on April 25, 2019 for three year terms expiring in April 2022.
The members of the Board of Directors are remunerated in accordance with the information provided above in Item 6.B. Compensation. There are no contracts between SQM, or any of its subsidiaries, and the members of the Board of Directors providing for benefits upon termination of their term.
Directors’ Committee – Audit Committee
As required by Chilean Law, during 2018, we had a Directors’ Committee ( Comité de Directores ) composed of three Directors, which performs many of the functions of an audit committee. Under the NYSE corporate governance rules, the audit committee of a U.S. company must perform the functions detailed in the NYSE Listed Company Manual Rules 303A.06 and 303A.07. Non-U.S. companies are required to comply with Rule 303A.06 but are not required to comply with Rule 303A.07.
Between January 1, 2018 and January 24, 2018, our Directors’ Committee was comprised of three Directors: Mr. Gerardo Jofré M., Mr. Fernando Massu T. and Ms. Joanne L. Boyes. Messrs. Messrs. Jofré and Massu met the NYSE independence and Chilean independence requirements for audit committee members. Ms. Boyes, who was an executive officer of Nutrien (formerly PCS prior to the merger with Agrium Inc. on January 1, 2018) met the Chilean independence requirements for Directors Committee members, but not the NYSE independence standards for audit committee members and during her service on our Directors’ Committee, served as an observer on audit committee matters. On January 24, 2018, Ms. Boyes resigned from her position as director of SQM. On the same day, Mr. Darryl Stann was appointed as a director, replacing Ms. Boyes.
Since April 27, 2018, our Directors’ Committee was comprised of three Directors Mr. Hernán Büchi B., Laurence Golborne R. and Alberto Salas M. Each of the three members met the NYSE and Chilean independence requirements for audit committee members.
| 96 |
During 2018, the Directors’ Committee of SQM (the “Committee”) analyzed (i) the Company’s Unaudited Financial Statements and Reports; (ii) the Company’s Audited Financial Statements and Reports; (iii) the Reports and proposals of external auditors, accounts inspectors and independent risk rating agencies for the Company; (iv) the proposal to SQM’s Board of Directors about the external auditors and independent rating agencies that the Board could recommend to the respective shareholders’ meeting for their subsequent appointment; (v) the tax and other services, other than audit services, provided by the Company’s external auditors and its subsidiaries in Chile and abroad; (vi) the remuneration and compensation plans for the Company’s main executives; (vii) the information related to the Company’s operations as referred to in Title XVI of the Corporations Act; (viii) the report on internal control of the Company and (ix) the various matters referred to in the Chapter titled “Directors’ Committee” included in SQM’s Financial Statements at December 31, 2018.
Regarding the above, the Committee:
| (a) | Examined the information regarding the financial statements of SQM for the 2018 business year and the Report issued thereon by the External Auditors of SQM. Similarly, it also examined the Company’s Interim Consolidated Financial Statements for the 2018 business year. |
| (b) | Examined the information regarding the transactions with related parties. |
| (c) | Proposed to the Company’s Board of Directors the names of the External Auditors and the Independent Credit Rating Agencies for SQM and the Company’s Board of Directors, in turn, suggested their appointment to the respective Annual Ordinary Shareholders Meeting of SQM. The Company’s Board of Directors approved said suggestions and the Shareholders’ Meeting also ratified them. |
| (d) | Examined and approved the remuneration system and the compensation plans for the Company’s employees and senior executives. |
The Committee also (i) authorized the contracting by the Company of various consulting services with PwC, (ii) reviewed the expenses of the Company's CEO, and (iii) reviewed the reports from the Company’s internal audit and risk and compliance areas.
Finally, the Committee issued the Annual Management Report referred to in Law No. 18,046.
On April 27, 2018, the Annual General Shareholders’ Meeting of SQM approved an operational budget for the Committee; the operational budget is equivalent to the annual remuneration of the members of the Committee. The activities carried out by the Committee, as well as the expenses incurred by it, are disclosed at the General Shareholders Meeting. During 2018, the Committee incurred expenses of approximately US$680,400 related to the advisory services of Internal Audit and SOX Audit.
Article 50 bis of the Chilean Corporations Act states that the Committee should consist of three Directors, of which at least one member should preferably be independent from the controller (i.e., any person or entity who “controls” the company for Chilean law purposes), if any, and that their functions be remunerated.
Comparative Summary of Differences in Corporate Governance Standards
The following table provides a comparative summary of differences in corporate governance practices followed by us under our home-country rules and those applicable to U.S. domestic issuers pursuant to Section 303A of the New York Stock Exchange (NYSE) Listed Company Manual.
| 97 |
Listed Companies that are foreign private issuers, such as SQM, are permitted to follow home country practices in lieu of the provisions of Section 303A, except such companies are required to comply with the requirements of Section 303A.06, 303A.11 and 303A.12(b) and (c).
| Section | NYSE Standards | SQM practices pursuant to Chilean Stock Exchange regulations |
| 303A.01 | Listed companies must have a majority of independent directors. | There is no legal obligation to have a majority of independent directors on the Board but, according to Chilean law, the Company’s directors cannot serve as executive officers. |
| 303A.02 |
No director qualifies as “independent” unless the Board of Directors affirmatively determines that the director has no material relationship with the listed company (either directly or as a partner, shareholder or officer of an organization that has a relationship with the company). In addition, a director is not independent if: (i) The director is, or has been within the last three years, an employee of the listed company, or an immediate family member is, or has been within the last three years, an executive officer, of the listed company. (ii) The director has received, or has an immediate family member who has received, during any twelve-month period within the last three years, more than $120,000 in direct compensation from the listed company, other than director and committee fees and pension or other forms of deferred compensation for prior service (provided such compensation is not contingent in any way on continued service). (iii) (A) The director is a current partner or employee of a firm that is the listed company’s internal or external auditor; (B) the director has an immediate family member who is a current partner of such a firm; (C) the director has an immediate family member who is a current employee of such a firm and personally works on the listed company’s audit; or (D) the director or an immediate family member was within the last three years a partner or employee of such a firm and personally worked on the listed company’s audit within that time. (iv) The director or an immediate family member is, or has been with the last three years, employed as an executive officer of another company where any of the listed company’s present executive officers at the same time serves or served on that company’s compensation committee. (v) The director is a current employee, or an immediate family member is a current executive officer, of a company that has made payments to, or received payments from, the listed company for property or services in an amount which, in any of the last three fiscal years, exceeds the greater of $1 million, or 2% of such other company’s consolidated gross revenues.
|
A director would not be considered independent if, at any time, within the last 18 months he or she: (i) Maintained any relationship of a relevant nature and amount with the company, with other companies of the same group, with its controlling shareholder or with the principal officers of any of them or has been a director, manager, administrator or officer of any of them; (ii) Maintained a family relationship with any of the members described in (i) above; (iii) Has been a director, manager, administrator or principal officer of non-profit organizations that have received contributions from (i) above;
(iv) Has been a partner or a shareholder that has had or controlled, directly or indirectly, 10% or more of the capital stock or has been a director, manager, administrator or principal officer of an entity that has provided consulting or legal services for a relevant consideration or external audit services to the persons listed in (i) above;
(v) Has been a partner or a shareholder that has had or controlled, directly or indirectly, 10% or more of the capital stock or has been a director, manager, administrator or principal officer of the principal competitor, supplier or clients.
|
| 303A.03 |
The non-management directors must meet at regularly scheduled executive sessions without management.
|
These meetings are not needed given that directors cannot serve as executive officers.
|
| 303A.04 |
(a) Listed companies must have a nominating/corporate governance committee composed entirely of independent directors. |
This committee is not required as such in the Chilean regulations. However, pursuant to Chilean regulations SQM has a Directors’ Committee (see Board practices above). |
| 98 |
| Section | NYSE Standards | SQM practices pursuant to Chilean Stock Exchange regulations |
|
(b) The nominating/corporate governance committee must have a written charter that addresses: (i) the committee’s purpose and responsibilities – which, at minimum, must be to: identify individuals qualified to become board members, consistent with criteria approved by the board, and to select, or to recommend that the board select, the director nominees for the next annual meeting of shareholders; develop and recommend to the board a set of corporate governance guidelines applicable to the corporation; and oversee the evaluation of the board and management; and (ii) an annual performance evaluation of the committee. |
||
| 303A.05 |
Listed companies must have a compensation committee composed entirely of independent directors, and must have a written charter
|
This committee is not required as such in the Chilean regulations. Pursuant to Chilean regulations, SQM has a Directors’ Committee (see Board practices above) that is responsible for reviewing management’s compensation.
|
|
303A.06
|
Listed companies must have an audit committee that satisfies the requirements of Rule 10A-3 of the Securities Exchange Act of 1934, as amended.
|
This committee is not required as such in the Chilean regulations. Pursuant to Chilean regulations, SQM has a Directors’ Committee that performs the functions of an audit committee and that complies with the requirements of the NYSE corporate governance rules.
|
| 303A.07 |
The audit committee is subject to requirements that are in addition to Section 303A.06. This includes, among others, the following requirements: the audit committee must have a minimum of three members; all audit committee members must satisfy requirements of independence; the audit committee must have a written charter; each listed company must have an internal audit function to provide management with ongoing assistance of the company’s risk management process and the system of internal controls.
|
Pursuant to Section 303A.00, SQM is not required to comply with requirements in 303A.07. Pursuant to Chilean Regulations SQM has a Director’s Committee (see Board practices above) that also performs the functions of an audit committee with certain requirements of independence.
|
| 303A.08 | Shareholders must have the opportunity to vote on all equity-compensation plans and material revisions thereto. |
SQM does not have equity compensation plans. However, as mentioned in Item 6.B. Compensation, SQM does have a long-term cash bonus compensation plan. Directors and executives may only acquire SQM shares by individual purchases. The purchaser must give notice of such purchases to the Company and the Financial Market Commission.
|
| 303A.09 |
Listed companies must adopt and disclose corporate governance guidelines.
|
Chilean law does not require that corporate governance guidelines be adopted. Directors’ responsibilities and access to management and independent advisors are directly provided for by applicable law. Directors’ compensation is approved at the annual meeting of shareholders, pursuant to applicable law.
|
| 303A.10 |
Listed companies must adopt and disclose a code of business conduct and ethics for directors, officers and employees and promptly disclose any waivers of the code for directors or executive officers.
|
Not required in the Chilean regulations. SQM has adopted and disclosed a Code of Business Conduct and Ethics, available at the Company’s website, www.sqm.com.
|
| 303A.11 |
Listed foreign private issuers must disclose any significant ways in which their corporate governance practices differ from those followed by domestic companies under NYSE listed standards.
|
Pursuant to 303A.11, this table shows a comparative summary of differences in corporate governance practices followed by SQM under Chilean regulations and those applicable to U.S. domestic issuers pursuant to Section 303A.
|
| 99 |
| Section | NYSE Standards | SQM practices pursuant to Chilean Stock Exchange regulations |
| 303A.12 |
Each listed company CEO must (a) certify to the NYSE each year that he or she is not aware of any violation by the listed company of NYSE corporate governance listing standards; (b) promptly notify the NYSE in writing after any executive officer becomes aware of any non-compliance with any applicable provisions of Section 303A; and (c) submit an executed Written Affirmation annually to the NYSE. In addition, each listed company must submit an interim Written Affirmation as and when required by the interim Written Affirmation form specified by the NYSE. The annual and interim Written Affirmations must be in the form specified by the NYSE.
|
Not required in the Chilean regulations. The CEO must only comply with Section 303A.12 (b) and (c). |
| 303A.13 | The NYSE may issue a public reprimand letter to any listed company that violates a NYSE listing standard. | Not specified in the Chilean regulations. |
6.D. Employees
As of December 31, 2018, we had 5,290 permanent employees, 353 of whom were employed outside of Chile. The average tenure of our permanent employees is approximately 6.4 years.
| As of December 31, | ||||||||||||
| 2018 | 2017 | 2016 | ||||||||||
| Employees in Chile | 4,937 | 4,630 | 4,535 | |||||||||
| Employees outside of Chile | 353 | 291 | 216 | |||||||||
| Total employees | 5,290 | 4,921 | 4,751 | |||||||||
As of December 31, 2018, 65% of our permanent employees in Chile were represented by 22 labor unions, which represent their members in collective negotiations with us. Compensation for unionized personnel is established in accordance with the relevant collective bargaining agreements. The terms of such agreements currently in effect are three years, and expiration dates of such agreements vary from agreement to agreement. Under these agreements, employees receive a salary according to a scale that depends upon job function. Unionized employees also receive certain benefits provided by law and certain benefits provided under the applicable collective bargaining agreement, which vary depending upon the terms of the collective agreement, such as scholarships, holiday bonuses and additional health death and disability benefits, among others.
In addition, we own all of the equity of Institución de Salud Previsional Norte Grande Limitada (“Isapre Norte Grande”), which is a health care organization that provides medical services primarily to our employees, and of Sociedad Prestadora de Servicios de Salud Cruz de Norte S.A. (“Prestadora”), which is a hospital in María Elena. We make contributions to Isapre Norte Grande and to Prestadora in accordance with Chilean laws and the provisions of our various collective bargaining agreements, but we are not otherwise responsible for their liabilities.
| 100 |
Non-unionized employees receive individually negotiated salaries, benefits provided for by law and certain additional benefits which we provide.
We provide housing and other facilities and services for employees and their families at the María Elena site.
We do not maintain any pension or retirement programs for our Chilean employees. Most workers in Chile are subject to a national pension law, adopted in 1980, which establishes a system of independent pension plans that are administered by the corresponding Pension Fund Administrator (“Sociedad Administradora de Fondos de Pensiones”). We have no liability for the performance of any of these pension plans or any pension payments to be made to our employees. We do, however, sponsor staff severance indemnities plans for our employees and employees of our Chilean subsidiaries whereby we commit to provide a lump sum payment to each employee at the end of his/her employment, whether due to death, termination, or resignation.
Over 93% of our employees are employed in Chile, of which approximately 65% were represented by 22 labor unions as of December 31, 2018. As of December 31, 2018, we concluded renegotiations of 17 collective bargaining agreements with 14 unions. As a result, these collective bargaining agreements were renegotiated for the duration of three years. We are exposed to labor strikes and illegal work stoppages that could impact our production levels. If a strike or illegal work stoppage occurs and continues for a sustained period of time, we could be faced with increased costs and even disruption in our product flow that could have a material adverse effect on our business, financial condition and results of operations.
6.E. Share Ownership
We do not grant stock options or other arrangements involving the capital of SQM to directors, managers or employees. For more information on the shareholdings of current directors and executive officers, see “Item 6. Directors, Senior Management and Employees—Directors and Senior Management.”
| 101 |
| ITEM 7. | MAJOR SHAREHOLDERS AND RELATED PARTY TRANSACTIONS |
7.A. Major Shareholders
The following table shows certain information concerning beneficial ownership of the Series A and Series B common shares of SQM as of April 1, 2019 with respect to each shareholder known by us to beneficially own more than 5% of the outstanding Series A or Series B common shares. The following information is derived from our records and reports filed by certain of the persons named below with the CMF and the Santiago Stock Exchange.
| Shareholder |
Number of
Series A shares beneficially owned |
% Series
A shares |
Number of
Series B shares beneficially owned |
% Series
B shares |
% total
shares |
|||||||||||||||
| Inversiones TLC Spa (1) | 62,556,568 | 43.80 | % | — | — | 23.77 | % | |||||||||||||
| Sociedad de Inversiones Pampa Calichera S.A. (2) (3) | 44,894,152 | 31.43 | % | 9,593,154 | 7.97 | % | 20.70 | % | ||||||||||||
| The Bank of New York | — | — | 32,210,049 | 26.76 | % | 12.24 | % | |||||||||||||
| Potasios de Chile S.A. (3) | 18,179,147 | 12.73 | % | — | — | 6.91 | % | |||||||||||||
| Banco de Chile por Cuenta de Terceros No Residentes | 177,468 | 0.12 | % | 10,683,956 | 8.88 | % | 4.13 | % | ||||||||||||
| Inversiones Global Mining Chile Ltda. (3) | 8,798,539 | 6.16 | % | — | — | 3.34 | % | |||||||||||||
| Banco Itau Corbanca por Cuenta de Inversionistas Extranjeros | — | — | 8,365,633 | 6.95 | % | 3.18 | % | |||||||||||||
| Banco Santander por cuenta de Inversionistas por extranjeros | — | — | 7,509,618 | 6.24 | % | 2.85 | % | |||||||||||||
| BanChile Corredora de Bolsa S.A. | 544,845 | 0.38 | % | 4,138,919 | 3.44 | % | 1.78 | % | ||||||||||||
| Inversiones La Esperanza Chile Limitada | 3,711,598 | 2.60 | % | 46,500 | 0.04 | % | 1.43 | % | ||||||||||||
| (1) | As of April 1, 2019, SQM has been informed that Tianqi Lithium Corporation owns 100% of the shares of Inversiones TLC SpA, and, accordingly, is the beneficial owner of 62,556,568 Series A shares, or 23.77%, of SQM’s total shares. |
| (2) | Pampa Calichera is a publicly held corporation whose shares are traded on the Santiago Stock Exchange. Originally, the shareholders of Pampa Calichera were employees of SQM. Pampa Calichera was formed to hold the capital stock of SQM contributed by such employees or later acquired in the open market. |
| (3) | SQM has been informed that, as of April 1, 2019, Mr. Julio Ponce Lerou, and related persons control 100% of Inversiones SQYA Ltda. (“SQYA”) and 100% of Inversiones SQ Ltda. These two companies control indirectly 32.00% of all shares of SQM (consisting of 71,871,838 Series A shares, 12,341,049 Series B shares of which 2,747,895 owned through various brokers), as follows: (i) Inversiones SQ Ltda. controls 0.0258% of Norte Grande S.A. (“Norte Grande”) and SQYA controls 67.59% of Norte Grande, which controls 76.82% of Sociedad de Inversiones Oro Blanco S.A., which controls 88.64% of Pampa Calichera, which controls 20.70% of SQM; (ii) Pampa Calichera controls 99.99% of Inversiones Global Mining (Chile) Limitada, which controls 3.34% of SQM and (iii) Norte Grande controls 76.34% of Nitratos de Chile S.A., which controls 98.89% of Potasios de Chile S.A., which controls 10.07% of Pampa Calichera and 6.91% of SQM. Thus, Pampa Calichera and its related companies, Inversiones Global Mining Chile Limitada and Potasios de Chile S.A. (together, the “Pampa Group”), control 32.00% of SQM. |
As of April 1, 2019, SQM did not have a Controller Group. However, prior to April 30, 2018, Pampa Group and Kowa Group (as defined below) had a Joint Operation Agreement that was signed on December 21, 2006 and allowed Pampa Group and Kowa Group to have the status of Controller Group of SQM.
As of April 1, 2019, Kowa Holdings America Inc., Inversiones La Esperanza (Chile) Limitada, Kochi S.A., and Kowa Company Ltd. (together, the “Kowa Group”) are owners of 2.11% of all shares in SQM (consisting of 5,457,634 Series A shares and 96,500 Series B shares). See also Note 6.2 to our Consolidated Financial Statements.
| 102 |
On December 5, 2018, Inversiones TLC SpA, acquired the shares of Inversiones El Boldo Limitada, Inversiones PCS Chile Limitada and Inversiones RAC Chile, representing 23.77% of the total shares of SQM.The stake held by Nutrien (formerly PCS before the merger with Agrium) as of December 31, 2018 was 0%. The stake held by PCS as of December 31, 2016 and 2015 was 32.00% of SQM’s total shares.
Pampa Group Agreement
On December 18, 2017, in connection with the Corfo Arbitration Agreement, the companies that are part of the Pampa Group entered into an agreement for the benefit of Corfo (the “Pampa Group Agreement”), which, among other things, provides for: (i) the termination of the Joint Operation Agreement, and (ii) an agreement to not enter into any joint action with third parties that allows Pampa Group to acquire the status of sole controller or joint controller, as defined by article 97 of the Chilean Securities Market Law. The obligations set forth in clause (ii) expire on December 31, 2030. In addition, the Pampa Group Agreement also includes numerous provisions relating to corporate governance and control. The effectiveness of the obligations of the parties to the Pampa Group Agreement is subject to the execution of the amendments of the Lease Agreement and the Project Agreement and the obtainment of all approvals under Chilean Law. See “Item 3.D. Risk Factors” and “Item 8.A.7 Legal Proceedings.” Neither SQM nor any of its subsidiaries, including SQM Potasio S.A. and SQM Salar, is a party to the Pampa Group Agreement. Upon termination of the Joint Operation Agreement pursuant to the Pampa Group Agreement, the Pampa Group and the Kowa Group would cease to be a Controller Group.
On November 30, 2018, the CMF determined that in accordance with the distribution of the shares of SQM, “the Pampa Group does not exert decisive power over the management of the Company, and is therefore not considered a controlling shareholder”. The CMF could change its decision in the future if circumstances change.
Tianqi Settlement Agreement with the Chilean National Economic Prosecutor’s Office (the “FNE”)
In August 2018, after an investigation by the FNE in connection with the proposed acquisition by Tianqi of 23.77% of the Company’s shares, Tianqi and the FNE entered into an extrajudicial settlement agreement (the “Settlement Agreement”) which implemented certain restrictive measures in order to (i) maintain the competitive conditions of the lithium market, (ii) mitigate the risks described in the Settlement Agreement and (iii) limit Tianqi’s access to certain information of the Company and its subsidiaries, which are defined as sensitive under the Settlement Agreement (“Sensitive Information”) (collectively, the “Purpose”). Pursuant to the Settlement Agreement, Tianqi agreed that, among other things:
| · | Tianqi will not nominate any of its directors, executives or employees to the SQM Board of Directors; |
| · | Tianqi and the directors nominated by it will not influence or intervene for the benefit of Tianqi and prejudice the interests of SQM; |
| · | The directors nominated by Tianqi will not participate nor will they be part of any committees, the management or other decision-making bodies related to lithium of SQM or of any companies controlled by SQM, unless nominated by independent directors; |
| · | Tianqi will inform the FNE of any agreement in the lithium market, with Albemarle and/or SQM, prior to its execution; |
| · | Tianqi will notify the FNE of any event from which it acquires control or decisive influence in SQM; |
| · | Tianqi will disassociate any director, executive or employee appointed by third parties, who assumes a position described above in SQM; |
| 103 |
| · | Tianqi will not request access to commercially sensitive information from SQM; |
| · | The directors nominated by Tianqi will not disclose commercially sensitive information of SQM; |
| · | The directors nominated by Tianqi will personally bind themselves to the obligations assumed by Tianqi with the FNE; and |
| · | Tianqi will report to the FNE the appointments and periodic compliance with its obligations. |
The restrictions will remain in place for a period of six years.
During the approval process for the Settlement Agreement before the FNE, the Company expressed its concerns to the Chilean Antitrust Court regarding the measures contained in the Settlement Agreement, including that (i) it could not effectively resolve the risks that Tianqi and the FNE sought to mitigate, (ii) the restrictions are not correctly oriented to avoid the access to Sensitive Information that, in the possession of a competitor, could damage the Company and the proper functioning of the market and (iii) it could contradict the Chilean Corporations Act (Law No. 18,046 on Corporations). The Settlement Agreement was approved in October 2018 by the Chilean Antitrust Court. A copy of the Settlement Agreement, in Spanish, has been made publicly available on the Company’s website at www.sqm.com and is also available on the FNE’s website at http://www.fne.gob.cl
The Company believes that approximately 96.05% of its Series A shares and 51.10% of its Series B shares were beneficially held in Chile as of April 1, 2019. Approximately 1,521 record holders were in Chile as of April 1, 2019.
Series A and Series B common shares have the same economic rights (i.e., both series are entitled to share equally in any dividends declared on the outstanding stock) and voting rights at any shareholders meeting, whether ordinary or extraordinary, with the exception of the election of the Board, in which the Series A shareholders elect seven members and the Series B shareholders elect one member.
Additionally, Series B common shares cannot exceed 50% of SQM’s issued, subscribed and paid shares; shareholders of at least 5% of this Series may call an Ordinary or Extraordinary Shareholders’ Meeting; and the director elected by this Series may request an extraordinary Board meeting without the authorization of the Chairman of the Board. These conditions will remain in effect until 2043. Under our By-laws, the maximum individual voting power personally and/or in representation of other shareholders per Series is limited to 37.5% of the subscribed shares of each Series with voting rights and 32% of the total subscribed shares with voting rights, with any excess being deducted from the number of shares such shareholder may vote. To calculate these percentages, shares that belong to the voting shareholder’s related persons must be added. In addition, the director elected by the Series B shareholders cannot vote in the election of the Chairman of the Board if a tie vote has occurred in the prior voting process. As of April 1, 2019, there were 142,819,552 Series A common shares and 120,376,972 Series B common shares outstanding.
On May 17, 2018, an extraordinary shareholders’ meeting approved technical changes to the By-laws of SQM, as well as an amendment providing for a new “second transitory article” as follows:
“Throughout the period running from the date of the extraordinary shareholders’ meeting at which this transitory article is incorporated, and December 31, 2030, the restriction against voting on behalf of more than 37.5% of any series of shares in the Company, established in Article 31 hereof, shall be subject to the following exception, applicable only to the election of board members by means of Series A shares in the Company: If two or more persons, regardless of whether or not they are related parties to each other (the incoming shareholders), act prior to December 31, 2030 such as to acquire a sufficient number of Series A shares to allow them to hold voting powers for the selection of directors of the Company amounting to more than 37.5% of that series, then any registered shareholder or group of shareholders holding more than 37.5% of all Series A shares in the Company shall be entitled to vote for the selection of directors of the Company amounting to whichever is less, between a number of the Series A shares that are held (i) by existing shareholders as of that date, and (ii) by the incoming shareholders with voting rights. Similarly, if for any reason a registered shareholder in the Company as of the date hereof who holds more than 37.5% of Series A shares in the company between the date hereof and December 31, 2030, comes to hold more voting shares for the selection of directors of the Company than the votes allocated for holding 37.5% of said Series A shares, either through a joint action agreement with other shareholders, including existing shareholders, or by any other means, then any other shareholder or group of shareholders in the Company that is not a related party to the same and holds more than 37.5% of all voting Series A shares in the Company, including both existing and incoming shareholders, shall be entitled to vote for the selection of directors of the Company in accordance with whichever number of Series A shares in the Company is the lesser, between (i) the number held by this shareholder or group of shareholders, and (ii) the existing shareholder may have the capacity to vote in excess of the restriction amounting to 37.5% of said shares.”
| 104 |
Pampa Group and Tianqi Shareholders’ Agreement
On April 10, 2019, the Pampa Group and Inversiones TLC SpA, a subsidiary of Tianqi, entered into a shareholders’ agreement, with respect to certain corporate governance matters. The matters addressed by the shareholders’ agreement include: (i) the management of the business and affairs of the Company by the Board of Directors, (ii) election of each party’s nominees to the Board of Directors as a director elected by the Series A shareholders, (iii) election of certain of Tianqi’s director nominees to the Company’s Directors’ Committee, Corporate Governance Committee and Safety, Health and Environmental Committee, (iv) access for Tianqi’s internal or external auditors to SQM’s management and internal and external auditors for purposes of fulfilling Tianqi’s accounting and disclosure obligations with respect to its investment in SQM, (v) support for having a bilingual (Spanish/English) translator attend all SQM Board and Committee meetings to assist directors who are not bilingual and (vi) support of the Company’s dividend policy for 2019, as proposed by the Board of Directors in March 2019 for approval at the 2019 annual ordinary shareholders’ meeting. The agreement has a term of one year. An English language copy of the agreement is included in an essential fact (hecho esencial) filing made by Inversiones Pampa Calichera S.A. with the CMF on April 11, 2019 available on the CMF’s website at www.cmfchile.cl .
7.B. Related Party Transactions
Title XVI of the Chilean Corporations Act regulates transactions with related parties for publicly held corporations and its related parties.
Articles 146 to 149 of the Chilean Corporations Act requires that our transactions with related parties (i) have as their purpose to contribute to SQM’s interests (ii) be on price, terms and conditions similar to those customarily prevailing in the market at the time of their approval and (iii) satisfy the requirements and procedures established by the Chilean Corporations Act. Violation of such articles may also result in administrative or criminal sanctions and civil liability may be sought by SQM, shareholders or interested third parties that suffer losses as a result of such violations.
In addition, article 89 of the Chilean Corporations Act requires that transactions between affiliates, subsidiaries or related parties of a closed-stock company, such as some of SQM’s main affiliates and subsidiaries, shall also be on terms similar to those customarily prevailing in the market. Directors and executive officers of companies that violate article 89 are liable for losses resulting from such violations.
With respect to SQM, operations with related parties include negotiations, proceedings, contracts or operations involving SQM and its directors, managers and officers, and their spouses and relatives, and other companies and persons connected to the abovementioned parties or mentioned in the By-laws or by the Directors’ Committee. Such operations may only be carried out if (i) their objective is to contribute to SQM’s interests and if their price, terms and conditions conform to prevailing market prices, terms and conditions at the time of their approval and (ii) they satisfy the requirements and procedures established by the Chilean Corporations Act. Such requirements include, among others:
| · | that the operation be informed to the Directors’ Committee and to the Board of Directors prior to its execution; |
| · | that the Board of Directors, excluding any Directors involved in the operation, approves the operation with an absolute majority of its members, or, if an absolute majority is not feasible, with a unanimous vote by the Directors not involved in the transaction, or, if neither of these options is available, that an Extraordinary Shareholders’ Meeting be held and that shareholders representing 2/3 of the outstanding shares with voting rights approve the operation. In the latter case, prior to the meeting, the shareholders must be provided with a report by an independent evaluator and with statements by the directors as to whether or not such operation is in SQM’s interest; |
| · | that the grounds for the decision and for the exclusion be recorded in the respective minutes of the Board meeting; and |
| · | that the agreement and the names of the directors who approved the same be reported at the next shareholders’ meeting. Infractions will not affect the validity of the operation but they will grant SQM or its shareholders the right to demand that the related party committing such infraction refund the amount equivalent to the benefits received by such party in the operation to SQM, and that such party indemnify for any corresponding damages. |
| 105 |
However, the Board of Directors may authorize the following operations with related parties to be carried out without following such requirements and procedures, as long as such authorization is obtained in advance: (a) operations wherein the amount of the transaction is not significant or (b) operations that, according to the general policies on customary practices determined by the Board of Directors, are considered normal based on SQM’s business activities or (c) operations carried out between legal entities wherein SQM holds at least a 95% ownership interest in the counterpart.
Accounts receivable from and payable to related companies are stated in U.S. dollars and accrue no interest. Other than the above, transactions are made under terms and conditions that are similar to those offered to unrelated third parties. We further believe that we could obtain from third parties all raw materials now being provided by related parties that are not our affiliates. The provision of such raw materials by new suppliers could initially entail additional expenses.
In each case, terms and conditions vary depending on the transaction pursuant to which it was generated.
The Company regularly enters into business arrangements with related parties, principally its joint ventures and associates, which are described in Note 9 to our Consolidated Financial Statements.
7.C. Interests of Experts and Counsel
Not applicable.
| ITEM 8. | FINANCIAL INFORMATION |
8.A. Consolidated Statements and Other Financial Information
8.A.1 See “Item 18. Financial Statements.”
8.A.2 See “Item 18. Financial Statements.”
8.A.3 See “Item 19. Exhibits—Index to Financial Statements—Reports of Independent Registered Public Accounting Firm.”
8.A.4 Not applicable.
8.A.5 Not applicable.
8.A.6 Export Sales
We derive most of our revenues from sales outside of Chile. The distribution of sales presented below reflects the location of the Company’s subsidiaries making such sales and does not necessarily reflect the final destination of the products sold.
The following is the composition of the consolidated sales for the periods ending on December 31, 2018, 2017 and 2016:
| Th. US$ | 2018 | 2017 | 2016 | |||||||||
| Foreign sales | 2,076,454 | 2,013,111 | 1,776,845 | |||||||||
| Total sales | 2,265,803 | 2,157,323 | 1,939,323 | |||||||||
| Foreign sales % | 91.6 | % | 93.3 | % | 91.6 | % | ||||||
| 106 |
8.A.7 Legal Proceedings
Chilean Investigations
The SII has conducted investigations related to the payment of invoices by SQM and its subsidiaries, SQM Salar and SQM Industrial S.A., for services that may not have been properly supported or that may not have been necessary to generate corporate income. The Chilean Public Prosecutor also has conducted related inquiries to determine whether such payments may be linked with alleged violations by SQM, these subsidiaries and public officials of political contribution or anti-corruption laws.
On February 26, 2015, SQM’s Board of Directors resolved to establish an ad-hoc Committee authorized to conduct an internal investigation relating to the issues that were the subject of the SII and the Chilean Public Prosecutor investigations and to retain such independent external advice as it deemed appropriate.
The ad-hoc Committee engaged its own lawyers from Chile and the U.S. and forensic accountants from the U.S. to assist with its internal review. The U.S. lawyers retained by the ad-hoc Committee were principally charged with reviewing the relevant facts and analyzing those facts against the requirements of the FCPA. The factual findings of the ad-hoc Committee, however, were ultimately shared with Chilean as well as U.S. authorities.
On March 16, 2015, the Board of Directors decided to terminate the employment contract of the Company’s then-current CEO, Patricio Contesse G. This followed his failure to cooperate with the ad-hoc Committee’s investigation relating to the issue that were the subject of the SII and the Chilean prosecutor investigations.
On March 20, 2015, the Company identified to the SII approximately US$11 million in payments of invoices that may not have been properly supported by services rendered or that may not qualify as tax expenses under the Chilean tax code. These payments originated from the office of the former CEO, Patricio Contesse G., during the six-year tax period from 2009 to 2014. As a result, the Company subsequently submitted amendments to its tax returns for the 2009 to 2014 tax years and thereafter paid taxes and interest relating to such amended returns totaling approximately US$7 million. On April 24, 2015, the Company announced that it had identified up to an additional US$2 million in payments by its subsidiary SQM Salar S.A. during the same six-year tax period that were also authorized by Mr. Contesse, the former CEO, and that may be deemed not properly supported by services rendered or that may not qualify as tax expenses under the Chilean tax code. Subsequently, SQM Salar S.A. filed amended tax returns and paid taxes and interest relating to such amended returns totaling approximately US$1.2 million. On August 14, 2015, the Company announced that it had identified to the SII approximately US$1.6 million in additional payments by SQM and its subsidiary SQM Industrial S.A. that may be deemed not properly supported by services rendered or that may not qualify as tax expenses under the Chilean tax code. SQM and SQM Industrial S.A. subsequently filed amended tax returns and, in early 2016, SQM Industrial S.A. paid taxes and interest relating to such amended returns totaling approximately US$0.3 million, and SQM paid taxes and interest relating to such amended returns totaling approximately US$1.3 million. The statute of limitations under Chilean law for tax claims is up to six years, during which period the former CEO, Mr. Contesse, had an annual discretionary budget covering the Company and its subsidiaries of approximately US$6 million.
On March 23, 2015, the SII, based on the Income Tax Law ( Ley de Impuesto a La Renta) filed a criminal claim against the Company’s former CEO, Mr. Contesse, and the then-current CEO, Patricio de Solminihac, as well as the then-current CFO (now CEO), Ricardo Ramos, in their capacities as the Company’s tax representatives relating to part of the payments referred to above. Apart from the lawsuits and investigations that continue against the former CEO, Mr. Contesse, this and subsequent related similar claims filed by the SII against these officers and third parties have been dismissed by the Chilean Public Prosecutor.
| 107 |
On March 31, 2015, the CMF filed an administrative claim against five current or former members of the Board of Directors, alleging that they did not release information in a timely manner relating to the payments that are subject to the tax claim referred to above. On September 30, 2015, the CMF proceeded to fine the three current and the two former members of the Board of Directors UF1,000 each (approximately US$36,000). They are currently appealing this decision to the Chilean courts.
On April 30, 2015, the Chilean Public Prosecutor, after reviewing the claims filed by the SII, informed the Company’s former CEO, Mr. Contesse, that it was formally investigating allegations that he approved the payment of invoices that may not be properly supported by services rendered or that may not qualify as tax expenses under the Chilean tax code and in connection therewith made intentionally false or incomplete declarations or used fraudulent procedures designed to conceal or disguise the true amount of transactions or to circumvent taxes. If he is finally adjudicated responsible, the Company may also be subject to the payment of a fine by the Chilean Criminal Court totaling 50% to 300% of the taxes paid. The Company believes that there is no legal basis for these claims, and believes no provision is needed at this stage.
On May 11, 2015, the SII filed an additional criminal claim against the former CEO and the then-current CEO, Mr. de Solminihac, as well as the then-current CFO (now CEO), Mr. Ramos, in their capacities as the Company’s tax representatives alleging violations of the Chilean Inheritance and Donations Law ( Ley sobre Impuesto a Las Herencias, Asignaciones y Donaciones ). The claim states that the Company paid two invoices in 2009 and 2010 totaling approximately US$175,000 that are alleged to have been improperly supported. The claim states that these payments should have been classified as donations, and appropriate taxes should have been paid. These payments were accounted for in the amended tax returns filed with the SII. Subsequently, the SII filed a number of additional claims against these officers and third parties alleging violations of Chilean Tax Law and the Chilean Inheritance and Donations Law. The most recent of these criminal claims was filed by the SII on March 9, 2016. All of the claims against the then-current CEO, Mr. de Solminihac, and the then-current CFO (now CEO), Mr. Ramos, have been dismissed by the Chilean Public Prosecutor.
During 2015, the ad-hoc Committee that was established in February 2015 conducted an investigation into whether the Company faced possible liability under the FCPA. The ad-hoc Committee engaged its own separate counsel, Shearman & Sterling LLP, which presented a report to the Board of Directors on December 15, 2015.
Following the presentation by the ad-hoc Committee of its findings to the Board of Directors, the Company voluntarily shared the findings of the ad-hoc Committee investigation with authorities in Chile and the U.S. (including the SEC and the DOJ).
On January 13, 2017, the Company and the DOJ reached agreement on the terms of a DPA that would resolve the DOJ’s inquiry, based on alleged violations of the books and records and internal controls provisions of the Foreign Corrupt Practices Act. Among other terms, the DPA calls for the Company to pay a monetary penalty of US$15,487,500, and engage a compliance monitor for a term of two (2) years. Upon successful completion of the three (3) year term of the DPA, all charges against the Company would be dismissed. On the same date, the SEC agreed to resolve its inquiry through an administrative cease and desist order, arising out of the alleged violations of the same accounting provisions of the FCPA. Among other terms, the SEC order calls for the Company to pay an additional monetary penalty of US$15 million. These penalties were reflected in the Company’s 2016 consolidated financial statements. In the consolidated statement of cash flows, a payment of US$30 million made to the DOJ and SEC was presented in the line item Other payments related to operating activities.
On January 26, 2018, the Eight Lower Criminal Court of Santiago approved a deferred prosecution agreement proposed by the Chilean Public Prosecutor, relating to SQM and its subsidiaries SQM Salar and SQM Nitratos S.A., to suspend an investigation against these entities related to possible corruption issues and responsibility for the lack of supervision and management. Under the deferred prosecution agreement, SQM, SQM Salar and SQM Nitratos S.A., have not admitted responsibility in the matter subject to the investigation but agreed to pay an aggregate amount of (i) Ch$900,000,000 to the Chilean government, and (ii) Ch$1,650,000,000 to various charitable organizations. As of January 26, 2018, these amounts were equivalent to approximately US$1.5 million and US$2.8 million, respectively, and were accrued in the Company’s 2017 consolidated financial statements. In addition, the companies have agreed to provide the Chilean Public Prosecutor with a report on the enhancements to their compliance program, implemented in recent years, with special emphasis on the incorporation of best practices in various jurisdictions. On August 17, 2018, the Eighth Lower Criminal Court of Santiago considered the conditions and decided to terminate the legal process.
| 108 |
In the event that the applicable regulatory authorities believe that the terms of the DPA or the deferred prosecution agreement with the Chilean Public Prosecutor are not complied with, it is possible that such regulatory authorities may reinstate the suspended proceedings against us and may bring further action against us, including in the form of additional inquiries or legal proceedings. Responding to our regulators’ inquiries and any future civil, criminal or regulatory inquiries or proceedings diverts our management’s attention from day-to-day operations. Additionally, expenses that may arise from responding to such inquiries or proceedings, our review of responsive materials, any related litigation or other associated activities may continue to be significant. Current and former employees, officers and directors may seek indemnification, advancement or reimbursement of expenses from us, including attorneys’ fees, with respect to the current inquiry or future proceedings related to this matter.
Class Actions
Since October 2015, a consolidated class action lawsuit has been pending against the Company in the United States District Court for the Southern District of New York, alleging violations of the U.S. securities laws in connection with the subject matter of the investigations described above. The complaint alleges that certain statements made by the Company, principally in the Company’s SEC filings and press releases, were materially false and/or misleading in violation of Section 10(b) of the Securities Exchange Act of 1934 (the “Exchange Act”) and Rule 10b-5 promulgated thereunder. Specifically, the complaint challenges certain of the Company’s statements concerning its compliance with applicable laws and regulations; the effectiveness of its internal controls; its adoption of a code of ethics consistent with SEC requirements; its revenues and taxes owed; and its compliance with applicable accounting standards. The complaint also alleges that the Company made inadequate disclosures concerning the status of the Corfo litigation described below. The lead plaintiff seeks damages of an undetermined amount to recover the economic losses allegedly suffered by the class as a result of the challenged statements.
On March 30, 2016, the Company filed a motion to dismiss the complaint under the doctrine of forum non conveniens or, alternatively, pursuant to Rules 9(b) and 12(b)(6) of the Federal Rules of Civil Procedure for failure to state a claim under Section 10(b) of the Exchange Act. Briefing on that motion to dismiss was completed on June 29, 2016. On March 28, 2017, the district court issued an opinion and order denying in part and granting in part the motion to dismiss. The district court denied the motion to dismiss under the doctrine of forum non conveniens ; denied the motion to dismiss for failure to state a claim with respect to the statements concerning legal compliance, internal controls, and financial reporting and accounting; and granted the motion to dismiss for failure to state a claim with respect to the statements concerning the Company’s code of ethics and the status of the Corfo litigation.
On January 10, 2018, the lead plaintiff filed a motion to certify a class consisting of all persons who purchased SQM ADSs between June 30, 2010 and March 18, 2015, and such motion remains pending before the court.
Corfo Litigation
Our subsidiary SQM Salar holds exclusive and temporary exploitation rights to mineral resources in 81,920 hectares in the Salar de Atacama pursuant to (i) the Lease Agreement, and (ii) the Project Agreement. The mining exploitation concessions related to such rights are owned by Corfo and leased to SQM Salar in exchange for quarterly lease payments to Corfo based on specified percentages associated to the value of the products resulting from the minerals extracted from such concessions. For the year ended December 31, 2018, revenues related to products originating from the Salar de Atacama represented 44% of our consolidated revenues, consisting of revenues from our potassium business line and our lithium and derivatives business line for the period. All of our products originating from the Salar de Atacama are derived from our extraction operations under the Lease Agreement. As of December 31, 2018, only 12 years remain on the term of the Lease Agreement and we had extracted approximately 23% of the total permitted accumulated extraction and sales limit of lithium.
| 109 |
In May 2014, Corfo initiated an arbitration proceeding against SQM Salar alleging (i) SQM Salar had incorrectly applied the formulas to determine lease payments resulting in an underpayment to Corfo of at least US$8.9 million for 2009 through 2013 and (ii) SQM Salar had not complied with its obligation to protect the mining rights of Corfo by failing to construct or replace markers to delineate property lines. Based on the alleged breaches of the Lease Agreement, Corfo sought (i) at least US$8.9 million plus any other amount that may be due in respect of periods after 2013, (ii) early termination of the Lease Agreement, (iii) lease payments that would have been paid through 2030 as compensation for the early termination of the Lease Agreement and (iv) punitive damages ( daño moral ) equal to 30% of the contractual damages awarded.
In August 2016, Corfo initiated a second arbitration proceeding, demanding (i) the early termination of the Project Agreement signed between Corfo, SQM Potasio S.A., SQM Salar, and the Company, (ii) the dissolution of SQM Salar and (iii) the early termination of the Lease Agreement for alleged breaches of the Project Agreement. In addition, Corfo demanded SQM Salar return (i) the assets Corfo contributed to it under a condition subsequent, (ii) the OMA mining properties and the aquifers included in the Lease Agreement, (iii) the water rights granted to SQM Salar and (iv) the legal mining easements identified in the lawsuit. Finally, Corfo requested that the defendants pay damages as a result of the breaches alleged in the lawsuit.
On January 17, 2018, Corfo, SQM Salar and SQM Potasio S.A. entered into the Corfo Arbitration Agreement to (i) terminate the arbitration proceedings and (ii) amend the Lease Agreement and the Project Agreement. The agreement to amend the Lease Agreement for the Salar de Atacama concession and the Project Agreement seeks to reflect, among other terms, the following: (i) an increase in lease payments by increasing the lease rates associated with the sale of the different products produced in the Salar de Atacama; (ii) a commitment by SQM Salar to contribute (a) between US$10.8 and US$18.9 million per year to research and development efforts, (b) between US$10 to US$15 million per year to the communities in close proximity to the Salar de Atacama, and (c) 1.7% of total annual sales of SQM Salar to regional development; (iii) the authorization by Corfo to increase the production and sales of lithium products produced in the Salar de Atacama up to 349,553 metric tons of lithium metallic equivalent (1,860,670 tons of lithium carbonate equivalent), which is in addition to the approximately 64,816 metric tons of lithium metallic equivalent (345,015 tons of lithium carbonate equivalent) remaining from the originally authorized amount; (iv) an obligation of SQM Salar to offer part of its lithium production (up to a maximum of 25%) at a preferential price to value-added producers that will potentially develop in Chile; (v) an obligation of SQM Salar to strengthen its corporate governance by incorporating various audit, environmental control and coordination mechanisms with Corfo, which shall be set forth in amendments to the By-laws of SQM Salar, including among others: (a) incorporating specific rules for the management of the company, including that two of the directors of SQM Salar are independent and meet the requirements established for independent directors of a public company and (b) requiring the Board of Directors of SQM Salar to designate a committee to monitor compliance with the Lease Agreement and the Project Agreement and to establish the regulations that will govern this committee and its functions; (vi) extensive regulation regarding the return of assets upon termination of the contracts and granting purchase options; and (vii) prohibitions against the sale of lithium brine extracted from leased mining concessions by the Company, SQM Salar and SQM Potasio S.A. These amendments were subject to the issuance of the applicable resolutions of the Office of the Comptroller General of the Republic ( Contraloría General de la República ) and the CCHEN.
On February 15, 2018 and February 16, 2018, the Atacamenos Indigenous Organization (Consejo de Pueblos Atacamenos) initiated legal actions challenging the amendments of the Lease Agreement and the Project Agreement. The legal actions are pending before the Supreme Court of Chile.
| 110 |
SQMNA Litigation
In October 2010, the City of Pomona, California, named SQM North America Corporation (“SQMNA”) and SQM as defendants in an action filed in the California Superior Court for Los Angeles County. In this matter, the plaintiff seeks damages for alleged groundwater contamination from the use of defendant’s fertilizer products. The plaintiff subsequently withdrew its lawsuit against SQM. The case was removed to the U.S. District Court for the Central District of California and on June 10, 2015, the jury rejected the lawsuit against SQMNA, and the plaintiff filed an appeal which was granted by the Ninth Circuit Court of Appeals. The matter has been remanded to the District Court for a complete re-trial. On May 17, 2018, after a new trial in the District Court, a jury ruled in favor of SQMNA. On September 14, 2018, the plaintiff filed an appeal, which is pending resolution before the Ninth Circuit Court of Appeals.
In October 2010, the City of Lindsay, California, named SQM and SQMNA as defendants in an action filed in the California Superior Court for Tulare County. In this matter, the plaintiff seeks damages for alleged groundwater contamination from the use of defendant’s fertilizer products. This case was removed to the U.S. District Court for the Eastern District of California and is pending in the trial court. SQMNA and SQM (if it is legally served) intend to vigorously defend this action. The proceeding has been suspended, pending the outcome of the Pomona case. SQMNA and SQM intend to vigorously defend this action.
Other Matters
In addition, various lawsuits, claims and proceedings, other than those specifically disclosed above, have been or may be instituted or asserted against the Company, relating to the conduct of the company’s business, including those pertaining to mining, civil, tort, commercial, labor and regulatory matters, among others. Although the outcome of other litigation cannot be predicted with certainty, and some lawsuits, claims or proceedings may be disposed of unfavorably to the Company, our management believes the disposition of such other pending matters will not have a material effect on the company’s business, financial condition, results of operations or cash flows.
8.A.8. Dividend Policy
As required by Chilean law and regulations, our dividend policy is decided upon from time to time by our Board of Directors and is announced at the Annual Ordinary Shareholders’ Meeting, which is generally held in April of each year. Shareholder approval of the dividend policy is not required. However, each year the Board must submit the declaration of the final dividend or dividends in respect of the preceding year, consistent with the then-established dividend policy, to the Annual Ordinary Shareholders’ Meeting for approval. As required by the Chilean Companies Act, unless otherwise decided by unanimous vote of the holders of issued shares, we must distribute a cash dividend in an amount equal to at least 30% of our consolidated net income for that year (determined in accordance with CMF regulations), unless and to the extent the Company has a deficit in retained earnings.
On March 28, 2018, the Board of Directors, agreed to recommend to the shareholders the payment of a definitive dividend representing 100% of the 2017 net income and the payment of a special dividend ( dividendo eventual ) of US$100 million to be charged against the retained earnings. These dividend payments were presented for consideration at the Annual General Shareholders’ Meeting held on April 27, 2018. The amount of the definitive dividend approved by shareholders at the Annual General Shareholders’ Meeting held on April 27, 2018 was US$1.62501 per share; the amount of US$1.20533 per share had to be deducted from the definitive dividend as it had been already paid in a form of interim dividends during 2018. The balance, in the amount of US$0.41968 per share, was paid and distributed to Company’s shareholders on May 10, 2018. The special dividend, approved by shareholders at the Annual General Shareholders’ Meeting held on April 27, 2018, in the amount of US$0.37994 per share was paid and distributed to Company’s shareholders on May 10, 2018.
| 111 |
Our 2018 dividend policy, as disclosed at our 2018 Annual General Shareholders’ Meeting held on April 27, 2018, was to pay a percentage of our net income that is determined as per following financial parameters:
(i) 100% of the 2018 net income, when the following financial parameters are met: (a) the total sum of cash and cash equivalent, and other current financial assets (“Cash”) divided by the total sum of the current financial liabilities (“Current Financial Liabilities”) is equal to or greater than 2.5 times, and (b) the total sum of the current liabilities and the non-current liabilities (“Total Liabilities”) divided by the total sum of the equity (“Equity”) is equal to or less than 1.1 times.
(ii) 80% of the 2018 net income when the following financial parameters are met: (a) Cash divided by Current Financial Liabilities is equal to or greater than 2.0 times, and (b) the total sum of the Total Liabilities divided by the total Equity is equal to or less than 1.2 times.
(iii) 60% of the 2018 net income when the following financial parameters are met: (a) Cash divided by Current Financial Liabilities is equal to or greater than 1.5 times, and (b) Total Liabilities divided by Equity is equal to or less than 1.3 times.
If none of the foregoing financial parameters are met, the Company shall distribute and pay, as a final dividend, and in favor of the respective shareholders, 50% of the 2018 net income.
On May 23, 2018, the Board of Directors agreed to pay and distribute on June 15, 2018 an interim dividend of US$114 million, equivalent to US$0.43247 per share, to be charged against the 2018 net income.
On August 22, 2018, the Board of Directors agreed to pay and distribute on September 12, 2018 an interim dividend of US$134 million, equivalent to US$0.50864 per share, to be charged against the 2018 net income.
On November 21, 2018, the Board of Directors agreed to pay and distribute on December 12, 2018 an interim dividend of US$84 million, equivalent to US$0.31726 per share, to be charged against the 2018 net income.
On March 27, 2019, the Board of Directors agreed to recommend to the shareholders the payment of a definitive dividend representing 100% of the 2018 net income. The payment of these dividends will be presented for consideration at the Annual General Shareholders’ Meeting held on April 25, 2019. Therefore, and subject to the approval at the shareholders’ meeting, the Company shall pay a final dividend of US$1.67111 per share to be charged against the 2018 net income. The amount of US$1.25837 per share must be deducted from the final dividend, as it was already paid in the form of interim dividends. The balance, in the amount of US$0.41274 per share shall be paid and distributed to Company´s shareholders, pending shareholders´ approval.
On March 27, 2019, the Board of Directors agreed to recommend to the shareholders the 2019 Dividend Policy. If approved, the Company will pay and distribute a percentage of the net income per the following financial parameters:
| (i) | 100% of the 2019 net income, when the following financial parameters are met: (a) that the total current assets, divided by the total current financial liabilities is equal to or greater than 2.5 times, and (b) the sum of the total current liabilities and total non-current liabilities, excluding both cash and cash equivalents and other current financial assets, divided by the total equity is equal to or less than 0.8 times. |
| 112 |
| (ii) | 80% of the 2019 net income, when the following financial parameters are met: (a) that the total current assets, divided by the total sum of the total current financial liabilities is equal to or greater than 2.0 times, and (b) the total sum of the current liabilities and total non-current liabilities, excluding both cash and cash equivalents and other current financial assets divided by the total equity is equal to or less than 0.9 times. |
| (iii) | 60% of the 2019 net income, when the following financial parameters are met: (a) that the total current assets, divided by the total sum of the total current financial liabilities is equal to or greater than 1.5 times, and (b) the total sum of the current liabilities and total non-current liabilities, excluding both cash and cash equivalents and other current financial assets divided by the total equity is equal to or less than 1.0 times. |
If none of the foregoing financial parameters are met, the Company shall distribute and pay, as a final dividend, and in favor of the respective shareholders, 50% of the 2019 net income. The Company will distribute and pay if possible and during 2019, three interim dividends ( dividendos provisorios ) that will be charged against the aforementioned final dividend. These interim dividends will likely be paid during the month following the approval of the March, June, and September 2019 interim financial statements, respectively.
The Dividend Policy proposal for 2019 is expected to be announced at the Annual Shareholders’ Meeting to be held on April 25, 2019.
We generally declare dividends in U.S. dollars (but may declare dividends in Chilean pesos) and pay such dividends in Chilean pesos. When a dividend is declared in U.S. dollars, the exchange rate to be used to convert the dividend into Chilean pesos is decided by the shareholders at the meeting that approves the dividend, which has usually been the Observed Exchange Rate on the date the dividend is declared. In the case of interim dividends, the exchange rate to be used is the Observed Exchange Rate published a minimum of five business days before the payment date.
The amount and timing for payment of dividends is subject to revision from time to time, depending upon our then current level of sales, costs, cash flow and capital requirements, as well as market conditions. Accordingly, there can be no assurance as to the amount or timing of declaration or payment of dividends in the future. Any change in dividend policy would ordinarily be effective for dividends declared in the year following adoption of the change, and a notice as to any such change of policy must be filed with Chilean regulatory authorities and would be publicly available information.
Dividends
Each Series A common share and Series B common share is entitled to share equally in any dividends declared on the outstanding capital stock of SQM.
The following table shows the U.S. dollar equivalent of dividends per share and per ADS paid in each of the years indicated, based on the Observed Exchange Rate for the date on which the dividend was declared.
| Dividends | Per Share | Per ADS | ||||||||||
| Declared for the business year | Paid in | Ch$ | US$ | |||||||||
| n/a ( eventual) | 2014 | 479.51 | 0.87387 | |||||||||
| 2014 (interim) | 2014 | 253.80 | 0.41493 | |||||||||
| 2014 | 2015 | 91.55 | 0.14811 | |||||||||
| 2015 (interim) | 2015 | 224.51 | 0.31915 | |||||||||
| 2015 | 2016 | 57.35 | 0.08581 | |||||||||
| n/a ( eventual) | 2016 | 380.91 | 0.56992 | |||||||||
| 2016 (interim) | 2016 | 555.15 | 0.85487 | |||||||||
| 2016 | 2017 | 134.50 | 0.20248 | |||||||||
| 2017 (interim) | 2017 | 264.87 | 0.39222 | |||||||||
| 2017 (interim) | 2017 | 241.49 | 0.38432 | |||||||||
| 2017 (interim) | 2017 | 275.46 | 0.42879 | |||||||||
| 2017 | 2018 | 253.19 | 0.41968 | |||||||||
| n/a ( eventual ) | 2018 | 229.22 | 0.37994 | |||||||||
| 2018 | 2018 | 271.73 | 0.43247 | |||||||||
| 2018 | 2018 | 343.53 | 0.50864 | |||||||||
| 2018 | 2018 | 212.38 | 0.31726 | |||||||||
| 113 |
Dividends payable to holders of ADSs will be paid net of conversion expenses of the Depositary and will be subject to Chilean withholding tax, currently imposed at the rate of 35% (subject to credits in certain cases).
As a general requirement, a shareholder who is not a resident of Chile must register as a foreign investor under one of the foreign investment regimes contemplated by Chilean law to have dividends, sale proceeds or other amounts with respect to its shares remitted outside Chile through the Formal Exchange Market. Under the Foreign Investment Contract, the Depositary, on behalf of ADR holders, will be granted access to the Formal Exchange Market to convert cash dividends from Chilean Pesos to U.S. dollars and to pay such U.S. dollars to ADS holders outside Chile net of taxes, and no separate registration of ADS holders is required.
8.B. Significant Changes
No significant change has occurred since the date of the financial statements set forth in Item 18.
| 114 |
| ITEM 9. | THE OFFER AND LISTING |
9.A. Offer and Listing Details
Our Series A shares and Series B shares are currently traded on the Santiago Stock Exchange, and the Bolsa Electrónica de Chile Bolsa de Valores S.A., (the Electronic Stock Exchange) under the trading symbols “SQM-A” and “SQM-B”, respectively. ADSs, each representing one share of our Series B shares are also traded on the New York Stock Exchange under the trading symbol “SQM”.
| 9.B | Plan of Distribution |
Not Applicable.
| 9.C | Markets |
Our Series A shares and Series B shares have traded on the Santiago Stock Exchange and the Electronic Stock Exchange and also traded on the Valparaiso Stock Exchange until it ceased operations on October 8, 2018.The ADSs representing Series B shares have traded on the NYSE since September 20, 1993. The depositary bank for these ADSs is the Bank of New York Mellon.
| 9.D | Selling Shareholders |
Not applicable.
| 9.E | Dilution |
Not applicable.
| 9.F | Expenses of the Issue |
Not applicable.
| 115 |
| ITEM 10. | ADDITIONAL INFORMATION |
10.A. Share Capital
Not applicable.
10.B. Memorandum and Articles of Association
Sociedad Química y Minera de Chile S.A., headquartered at El Trovador No. 4285, 6th Floor, Santiago, Chile, is an open stock corporation organized under the laws of the Republic of Chile. The Company was constituted by public deed issued on June 17, 1968 by Mr. Sergio Rodríguez Garcés, Notary Public of Santiago. Its existence was approved by Decree No. 1,164 of June 22, 1968, of the Ministry of Finance, and it was registered on June 29, 1968, in the Business Registry of Santiago, on page 4,537 No. 1,992.
Corporate purposes
Our main purposes, which appear in article 4 of our By-laws, are to: (a) perform all kinds of chemical or mining activities and businesses and, among others, those related to researching, prospecting, extracting, producing, working, processing, purchasing, disposing of, and marketing properties, as applicable, of all metallic and non-metallic and fossil mining substances and elements of any type or nature, to be obtained from them or from one or more concessions or mining deposits, and in their natural or converted state, or transformed into different raw materials or manufactured or partially manufactured products, and of all rights and properties thereon; (b) manufacture, produce, work, purchase, transfer ownership, import, export, distribute, transport, and market in any way, all kinds of fertilizers, components, raw materials, chemical, mining, agricultural, and industrial products, and their by-products; (c) generate, produce, distribute, purchase, transfer ownership, and market, in any way, all kinds of electrical, thermal, geothermic or other type of power, and hydric resources or water rights in general; (d) request, manifest, claim, constitute, explore, work, lease, transfer ownership, and purchase, in any way, all kinds of mining concessions; (e) purchase, transfer ownership, and administer, in any way, any kind of telecommunications, railroads, ships, ports, and any means of transport, and represent and manage shipping companies, common carriers by water, airlines, and carries in general; (f) manufacture, produce, market, maintain, repair, assemble, construct, disassemble, purchase and transfer ownership, and in any way, any kind of electromechanical structure, and substructure in general, components, parts, spares, or parts of equipment, and machines, and execute, develop, advice, and market, any kind of electromechanical or smelting activities; (g) purchase, transfer ownership, lease, and market any kind of agro industrial and farm forestry activities, in any way (h) purchase, transfer ownership, lease, and market, in any way, any kind of urban or rural real estate; (i) render any kind of health services and manage hospitals, private clinics, or similar facilities; (j) construct, maintain, purchase, transfer ownership, and manage, in any way, any kind of roads, tunnels, bridges, water supply systems, and other required infrastructure works, without any limitation, regardless of whether they may be public or private, among others, to participate in bids and enter into any kind of contracts, and to be the legal owner of the applicable concessions; and (k) purchase, transfer ownership, and market, in any way, any kind of intangible properties such as stocks, bonds, debentures, financial assets, commercial papers, shares or rights in corporations, and any kind of bearer securities or instruments, and to administer such investments, acting always within the Investment and Financing Policies approved by the applicable General Shareholders Meeting. We may comply with the foregoing by acting ourselves or through or with other different legal entities or natural persons, within the country or abroad, with properties of our own or owned by third parties, and additionally, in the ways and territories, and with the aforementioned properties and purposes, we may also construct and operate industrial or agricultural facilities or installations; constitute, administer, purchase, transfer ownership, dissolve, liquidate, transform, modify, or form part of partnerships, institutions, foundations, corporations, or associations of any kind or nature; perform all actions, enter into all contracts, and incur in all obligations convenient or necessary for the foregoing; perform any business or activity related to our properties, assets, or patrimony, or with that of our affiliates, associated companies, or related companies; and render financial, commercial, technical, legal, auditing, administrative, advisory, and other pertinent services.
| 116 |
Directors
As stated in article 9 of the Company’s By-laws, the Company has eight Directors. One of the directors must be “independent” as such term is defined in article 50 bis of Law No. 18,046. Moreover, the possession of shares is not a condition necessary to become a director of the Company.
As stated in article 10 of the Company’s By-laws, the term of the directors is of three years and they can be reelected indefinitely; thus, there is no age limit for their retirement.
The Company’s By-laws, in articles 16 and 16 bis, essentially establish that the transactions in which a director has a material interest must comply with the provisions set forth in articles 136 and 146 to 149 of Law No. 18,046 and the applicable regulations of such Law.
The Board of Directors duties are remunerated, as stated in article 17 of the Company’s By-laws, and the amount of that compensation is fixed yearly by the Ordinary Shareholders’ Meeting. Therefore, directors can neither determine nor modify their compensation.
Directors cannot authorize Company loans on their behalf.
The Board of Directors must provide shareholders and the public with sufficient, reliable and timely information pertaining to the Company’s legal, economic and financial situation, as required by the Law or the CMF. The Board of Directors must adopt the appropriate measures in order to avoid the disclosure of such information to persons other than those persons who should possess such information as a result of their title, position or activity within the Company before such information is disclosed to shareholders and the public. The Board of Directors must treat business dealings and other information about the Company as confidential until such information is officially disclosed. No Director may take advantage of the knowledge about commercial opportunities that he has obtained through his position as Director.
Independent Directors and Directors Committee
According to Chilean Law, SQM must appoint at least one Independent Director and a Directors’ Committee, due to the fact that (a) the Company has a market capitalization greater than or equal to UF 1,500,000 and (b) at least 12.5% of the Company’s shares with voting rights are held by shareholders who, on an individual basis, control or possess less than 10% of such shares.
Persons who have not been involved in any of the circumstances described in the Law at any time during the preceding 18 months are considered independent. Candidates for the position of Independent Director must be proposed by shareholders representing 1% or more of the Company’s shares, at least 10 days prior to the date of the shareholders’ meeting that has been called in order to elect the Directors. No less than two days prior to the respective shareholders’ meeting, the candidate must provide the Chief Executive Officer with a sworn statement indicating that he: (a) accepts his candidacy for the position of Independent Director (b) does not meet any of the conditions that would prevent him from being the Independent Director (c) is not related to the Company, the other companies of the group to which the Company belongs, the controller of the Company, or any of the Company’s officers in such a way that would deprive a sensible person of a reasonable degree of autonomy, interfere with his ability to perform his duties objectively and effectively, generate a potential conflict of interest, or interfere with his independent judgment, and (d) assumes the commitment to remain independent as long as he holds the position of Director.
The Directors’ Committee shall have the following powers and duties: (a) to examine the reports of the external auditors, the balance sheet and other financial statements presented by the Company’s managers or liquidators to its shareholders and issue an opinion about the same prior to their submission for the approval of the shareholders (b) to propose to the Board of Directors the external auditors and risk rating agencies to be proposed to the shareholders at the respective shareholders’ meeting. In the event that an agreement cannot be reached, the Board of Directors shall formulate its own suggestion, and both options shall be submitted for shareholder consideration at such shareholders’ meeting (c) to examine the information relating to operations referred to in articles 146 to 149 of Law No. 18,046 and to prepare a report about such operations. A copy of such report shall be sent to the Board of Directors, and such report must be read at the Board Meeting called for the purpose of approving or rejecting the respective operation or operations (d) to examine the remuneration system and compensation plans for the Company’s management, officers and employees (e) to prepare an annual report on its activities, including its main recommendations to the shareholders (f) to inform the Board of Directors about whether or not it is advisable to hire the external audit firm to provide non-audit services where the audit firm is not prohibited from providing such services because the nature of the same could pose a threat to the audit firm’s independence, and (g) any other issues indicated in the Company’s By-laws or authorized by a shareholders’ meeting or the Board of Directors.
| 117 |
The Directors’ Committee shall be comprised of three members, with at least one independent member. In the event that more than three Directors have the right to form part of the Committee, these same Directors shall unanimously determine who shall make up the Committee. In the event that an agreement cannot be reached, the Directors who were elected with a greater percentage of votes by shareholders controlling or possessing less than 10% of the Company’s shares shall be given priority. If there is only one Independent Director, this Director shall name the other members of the Committee among the other Directors who are not independent. Such other members of the Committee shall have all of the rights associated with such position. The members of the Committee shall be compensated for their role. The amount of their remuneration shall be set annually at the General Shareholders’ Meeting, and it may not be less than the remuneration set for the Company Directors, plus an additional 1/3 of that amount. The General Shareholders’ Meeting shall determine a budget for the expenses of the Committee and its advisors. Such budget may not be less than the sum of the annual remunerations of the Committee members. The Committee may need to hire professional advisory services in order to carry out its duties in accordance with the abovementioned budget. The proposals made by the Committee to the Board of Directors that are not accepted by the latter must be reported to the shareholders’ meeting prior to the vote by shareholders on the corresponding matter or matters. In addition to the responsibilities that are associated with the position of Director, the members of the Committee are jointly and severally liable for any damages they cause in performing their duties as such to the shareholders and to the Company.
Shares
Dividends are annually distributed to the Series A and Series B shareholders of record on the fifth business day prior to the date for payment of the dividends. The By-laws do not specify a time limit after which dividend entitlement elapses but Chilean regulations establish that after five years, unclaimed dividends are to be donated to the fire department.
Article 5 of the Company’s By-laws establishes that Series B shares may in no case exceed 50% of SQM’s issued, outstanding and paid stock. SQM Series B shares have a restricted right to vote as they can only elect one director of the Company, regardless of their capital stock’s share. Series B shares have the right to call for an Ordinary or Extraordinary Shareholders’ Meeting when the shareholders of at least 5% of the Series B issued shares request so and for an Extraordinary Board of Directors Meeting without the Chairman’s authorization when it is requested by the director elected by the shareholders of the Series B shares. Series A shares have the option to exclude the director elected by Series B shareholders from the voting process in which the Chairman of the Board is to be elected, if there is a tie in the first voting process. However, articles 31 and 31 bis of the Company’s By-laws establish that in General Shareholders’ Meetings each shareholder will have a right to one vote for each share he owns or represents and (a) that no shareholder will have the right to vote for himself or on behalf of other shareholders of the same Series A or Series B shares representing more than 37.5% of the total outstanding shares with right to vote of each Series and (b) that no shareholder will have the right to vote for himself or on behalf of other shareholders representing more than 32% of the total outstanding shares with a right to vote, with any excess being deducted from the number of shares such shareholder may vote. In calculating a single shareholder’s ownership of Series A or B shares, the shareholder’s stock and those pertaining to third parties related to them are to be added.
| 118 |
Article 5 bis of the Company’s By-laws establishes that no person may directly or by means of related third persons concentrate more than 32% of the Company’s total shares with right to vote.
Each Series A share and Series B share is entitled to share equally in the Company’s profits, i.e., they have the same rights on any dividends declared on the outstanding shares of SQM.
The Company By-laws do not contain any provision relating to (a) redemption provisions (b) sinking funds or (c) liability to capital calls by the Company.
As established in article 103 of Law No. 18,046, a company subject to the supervision of the CMF may be liquidated in the following cases:
(a) Expiration of the duration term, if any, as established in its By-laws;
(b) All the shares end up in the possession of one individual for more than ten continuous days;
(c) By agreement of an Extraordinary Shareholders Meeting;
(d) By abolition, pursuant to applicable laws, of the decree that authorized its existence;
(e) Any other reason contemplated in its By-laws.
Article 40 of the Company’s By-laws states that in the event of liquidation, the shareholders’ meeting will appoint a three-member receiver committee that will have the authority to carry out the liquidation process. Any surplus will be distributed equally among the shareholders.
The only way to change the rights of the holders of the SQM shares is by modifying its By-laws, which can only be carried out by an Extraordinary Shareholders’ Meeting, as established in article 28 of the Company By-laws.
Shareholders’ Meetings
Article 29 of the Company’s By-laws states that the call to a shareholders’ meeting, either Ordinary or Extraordinary, will be by means of a highlighted public notice that will be published at least three times, and on different days, in the newspaper of the legal address determined by the shareholders’ meeting, and in the way and under the conditions indicated by the regulations. Additionally, a notice will be sent by mail to each shareholder at least fifteen days prior to the date of the Meeting, which shall include a reference of the matters to be addressed at the meeting. However, those meetings with the full attendance of the shares with right to vote may be legally held, even if the foregoing formal notice requirements are not met. Notice of any shareholders’ meeting shall be delivered to the CMF at least fifteen days in advance of such meeting.
Any holder of Series A and/or Series B shares registered in the Company’s shareholder registry on the fifth business day prior to the date of the meeting will have a right to participate at that meeting
| 119 |
Article 67 of Law No. 18,046 provides that decisions made at Extraordinary Shareholders’ Meeting on the following matters require the approval of 2/3 of the outstanding shares with voting rights: (1) transformation or division of the Company and its merger with another company; (2) modification of the Company’s term of duration, if any; (3) early dissolution of the Company; (4) change of the corporate domicile; (5) capital decrease; (6) approval of contributions and estimation of non-cash assets; (7) modification of powers reserved for Shareholders Meetings or limitations on powers of the Board of Directors; (8) reduction in the number of members of the Board of Directors; (9) disposal of 50% or more of the Company’s assets; formulation or modification of any business plan exceeding the above percentage; disposal of 50% or more of an asset belonging to a subsidiary that represents at least 20% of the Company’s assets and disposal of shares of the referred subsidiary such that the parent company would lose its position as controller of the same; (10) method in which profits are distributed; (11) granting of real or personal guarantees as sureties for third-party obligations that exceed 50% of the Company assets, except for subsidiaries, in which case approval of the Board of Directors shall suffice; (12) acquisition of own shares as set forth in articles 27A and 27B of the said law; (13) other matters indicated in the By-laws; (14) amendment of the Company By-laws as a result of errors in the constitution process and amendments in the By-laws involving one or more of the matters stated in the preceding numbers; (15) forced sale of shares carried out by the controller who would acquire more than 95% of the Company’s shares in a tender offer, and (16) approval or ratification of proceedings or contracts with related parties in accordance with the provisions of articles 44 and 147 of Law No. 18,046.
Amendments to the By-laws that are intended to create, modify, defer or suspend preferential rights shall be approved by 2/3 of the shares of the affected Series.
The transformation of the Company, the merger of the same, the disposal of assets referred to in number (9) above, the constitution of guarantees set forth in number (11) above, the constitution of preferences or the increase, postponement or decrease of the existing preferences, the reparation of formal nullities incurred in the By-laws and the possession of more than 95% of the Company’s shares and other matters contemplated in the Law or in the By-laws, confer “withdrawal rights.”
Foreign Shareholders
There are no restrictions on ownership or share concentration, or limiting the exercise of the related right to vote, by local or foreign shareholders other than those discussed under Item 10.B. Memorandum and Articles of Association.
Change in Control
The Company By-laws provide that no shareholder may hold more than 32% of the Company’s shares, unless the By-laws are modified at an Extraordinary Shareholders’ Meeting. Moreover, on December 12, 2000, the Chilean Government published the Ley de Oferta Pública de Acciones (“Public Share Offering Law”) or (OPA law) that seeks to protect the interests of minority shareholders of open stock corporations in transactions involving a change in control, by requiring that the potential new controller purchase the shares owned by the remaining shareholders either in total or pro rata. The law applies to those transactions in which the controlling party would receive a material premium price compared with the price that would be received by the minority shareholders.
There are three conditions that would make it mandatory to operate under the OPA law:
| 1) | When an investor wants to take control of a company’s stock. |
| 2) | When a controlling shareholder holds two-thirds of the company’s stock. If such shareholder buys one more share, it will be mandatory to offer to acquire the rest of the outstanding stock within 30 days of surpassing that threshold. |
| 3) | When an investor wants to take control of a corporation, which, in turn, controls an open stock corporation that represents 75% or more of the consolidated assets of the former corporation. |
Parties interested in taking control of a company must (i) notify the company of such intention in writing, and notify its controllers, the companies controlled by it, the CMF and the markets where its stocks are traded and (ii) publish a highlighted public notice in two newspapers of national circulation at least 10 business days prior to the date of materialization of the OPA.
Disclosure of Share Ownership
The Company’s By-laws do not provide for a minimum threshold at which share ownership must be disclosed.
| 120 |
Board Protocol for Presentation and Use of Sensitive Information
On December 5, 2018, the Company learned that Inversiones TLC SpA, a subsidiary of Tianqi, acquired 62,556,568 Series A shares of the Company, representing approximately 23.77% of the total shares issued by SQM. In connection with the acquisition, Tianqi entered into the Settlement Agreement with the FNE with respect to the implementation of certain measures to maintain competitive market conditions and mitigate any risks identified in the transaction, having as a fundamental principle the limitation of access to commercially sensitive information of SQM by Tianqi. For a description of the Settlement Agreement, see “Item 7.A. Major Shareholders — Tianqi Settlement Agreement with the Chilean National Economic Prosecutor Office (the ‘FNE’).” Before this acquisition, and after the approval of this transaction by the Chilean Antitrust Court, the Company’s Board of Directors deemed it necessary to adopt measures aimed at achieving the purpose of the Settlement Agreement, avoiding greater points of contact between Sensitive Information and Tianqi, to complement the Settlement Agreement. On January 23, 2019, the Board of Directors approved a protocol for the presentation and use of Sensitive Information (as defined in the Settlement Agreement), which was amended on April 15, 2019 in response to comments received from the CMF. The protocol as currently in effect, among other things, (i) establishes that all of the Company’s directors, including those nominated or elected by a competitor shareholder, have the right under the Chilean Corporations Act to receive all of the Company’s information without restrictions, provided that any request for Sensitive Information made by a director outside of a Board meeting must be made in writing to the Company’s Chief Executive Officer, (ii) provides that the directors have the right to be informed fully and in all documents and at all times by the Chief Executive Officer of everything related to the Company’s performance and (iii) provides that the Chief Executive Officer may not deny Sensitive Information to a director, nor information that has been treated or known in the subsidiaries of the Company, unless required by the FNE, the TDLC, the CMF or any other governmental or judicial authority with the legal power to request such information.
10.C. Material Contracts
The Company, during the normal course of business, has entered into different contracts, some of which have been described herein, related to its production, commercial and legal operations. We believe all of these contracts are standard for this type of industry, and none of them is expected to have a material effect on the Company’s results of operations.
10.D. Exchange Controls
The Central Bank of Chile is responsible for, among other things, monetary policies and exchange controls in Chile. Appropriate registration of a foreign investment in Chile permits the investor access to the Formal Exchange Market. Foreign investments can be registered with the Foreign Investment Committee under Decree Law No. 600 of 1974, as amended, or can be registered with the Central Bank of Chile under the Central Bank Act, Law No 18,840 of October 1989. The Central Bank Act is an organic constitutional law requiring a “special majority” vote of the Chilean Congress to be modified. Effective January 1, 2016, Decree Law No. 600 was repealed by Article 9 of the 2014 Tax Reform. Therefore, foreign investments made on or after January 1, 2016 cannot be registered with the Foreign Investment Committee.
Our 1993, 1995 and 1998 capital increases were carried out under and subject to the then current legal regulations, whose summary is hereafter included:
A Convención Capítulo XXVI del Título I del Compendio de Normas de Cambios Internacionales or Compendium of Foreign Exchange Regulations of the Central Bank of Chile the “Foreign Investment Contract”, was entered into and among the Central Bank of Chile, our Company and the Depositary pursuant to Article 47 of the Central Bank Act and to Chapter XXVI of the Compendium of Foreign Exchange Regulations of the Central Bank of Chile, “Chapter XXVI,” which addresses the issuance of ADSs by a Chilean company. Absent the Foreign Investment Contract, under applicable Chilean exchange controls, investors would not be granted access to the Formal Exchange Market for the purposes of converting from Chilean pesos to U.S. dollars and repatriating from Chile amounts received in respect to deposited Series B shares, or Series B shares withdrawn from deposit on surrender of ADSs (including amounts received as cash dividends and proceeds from the sale in Chile of the underlying Series B shares and any rights arising therefrom). The following is a summary of the material provisions contained in the Foreign Investment Contract. This summary does not purport to be complete and is qualified in its entirety by reference to Chapter XXVI and the Foreign Investment Contract.
| 121 |
Under Chapter XXVI and the Foreign Investment Contract, the Central Bank of Chile has agreed to grant to the Depositary, on behalf of ADS holders, and to any investor not residing or not domiciled in Chile who withdraws Series B shares upon delivery of ADSs (such Series B shares being referred to herein as “Withdrawn Shares”) access to the Formal Exchange Market to convert Chilean pesos to U.S. dollars (and remit such U.S. dollars outside of Chile) in respect of the Withdrawn Shares, including amounts received as (a) cash dividends, (b) proceeds from the sale in Chile of Withdrawn Shares, or from shares distributed because of the liquidation, merger or consolidation of the Company, subject to receipt by the Central Bank of Chile of a certificate from the holder of such shares (or from an institution authorized by the Central Bank of Chile) that such holder’s residence and domicile are outside Chile and a certificate from a Chilean stock exchange (or from a brokerage or securities firm established in Chile) that such shares were sold on a Chilean Exchange, (c) proceeds from the sale in Chile of preemptive rights to subscribe for additional Series A and Series B shares, (d) proceeds from the liquidation, merger or consolidation of the Company and (e) other distributions, including without limitation those resulting from any recapitalization, as a result of holding Withdrawn Shares. Transferees of Withdrawn Shares will not be entitled to any of the foregoing rights under Chapter XXVI unless the Withdrawn Shares are redeposited with the Depositary. Investors receiving Withdrawn Shares in exchange for ADSs will have the right to redeposit such shares in exchange for ADSs, provided that the conditions to redeposit described hereunder are satisfied.
Chapter XXVI provided that access to the Formal Exchange Market in connection with dividend payments will be conditioned upon certification by the Company to the Central Bank of Chile that a dividend payment has been made and any applicable tax has been withheld. Chapter XXVI also provided that access to the Formal Exchange Market in connection with the sale of Withdrawn Shares or distributions thereon will be conditioned upon receipt by the Central Bank of Chile of certification by the Depositary that such shares have been withdrawn in exchange for ADSs and receipt of a waiver of the benefit of the Foreign Investment Contract with respect thereto until such Withdrawn Shares are redeposited.
Chapter XXVI and the Foreign Investment Contract provide that a person who brings certain types of foreign currency into Chile, including U.S. dollars, to purchase Series B shares with the benefit of the Foreign Investment Contract must convert it into Chilean pesos on the same date and has 5 banking business days within which to invest in Series B shares in order to receive the benefits of the Foreign Investment Contract. If such person decides within such period not to acquire Series B shares, he can access the Formal Exchange Market to reacquire foreign currency, provided that the applicable request is presented to the Central Bank within 7 banking business days of the initial conversion into Chilean pesos. Series B shares acquired as described above may be deposited for ADSs and receive the benefits of the Foreign Investment Contract, subject to receipt by the Central Bank of Chile of a certificate from the Depositary that such deposit has been effected and that the related ADSs have been issued and receipt by the Custodian of a declaration from the person making such deposit waiving the benefits of the Foreign Investment Contract with respect to the deposited Series B shares.
Access to the Formal Exchange Market under any of the circumstances described above is not automatic. Pursuant to Chapter XXVI, such access requires approval of the Central Bank of Chile based on a request presented through a banking institution established in Chile. The Foreign Investment Contract will provide that if the Central Bank of Chile has not acted on such request within seven banking days, the request will be deemed approved.
Under current Chilean law, foreign investments abiding by the Foreign Investment Contract cannot be changed unilaterally by the Central Bank of Chile. No assurance can be given, however, that additional Chilean restrictions applicable to the holders of ADSs, the disposition of underlying Series B shares or the repatriation of the proceeds from such disposition could not be imposed in the future, nor can there be any assessment of the duration or impact of such restrictions if imposed.
| 122 |
As of April 19, 2001, Chapter XXVI of Title I of the Compendio de Normas de Cambios Internacionales of the Central Bank of Chile was eliminated and new investments in ADSs by non-residents of Chile, are now governed by Chapter XIV of the Compendio de Normas de Cambios Internacionales of the Central Bank of Chile. This was made with the purpose of simplifying and facilitating the flow of capital to and from Chile. According to the new regulations, such investments must be carried out through Chile’s Formal Exchange Market and only reported to the Central Bank of Chile.
The Central Bank is also responsible for controlling incurrence of loan obligations to be paid from Chile and by a Chilean borrower to banks and certain other financial institutions outside Chile. Chapter XIV establishes what type of loans, investments, capital increases and foreign currency transactions are subject to the current Chapter XIV framework. Foreign currency transactions related to foreign loans must be performed through the Formal Exchange Market, and such transactions and the subsequent modifications of original loans must be properly informed to the Central Bank. Transactions prior to April 19, 2001, will continue to be regulated by the previous legal framework, except in cases where an express request has been presented to the Central Bank resigning previous rights to be regulated by the provisions of Chapter XIV. This summary does not purport to be complete and is qualified in its entirety by reference to the provisions of Chapter XIV.
As of December 31, 2018, we had bonds issued in the international markets under Rule 144A/Regulation S in the principal amounts of US$250 million, US$250 million and US$300 million.
Any purchases of U.S. dollars in connection with payments on these loans will occur with the Formal Exchange Market. There can be no assurance, however, that restrictions applicable to payments in respect to the loans could not be imposed in the future, nor can there be any assessment of the duration or impact of such restrictions if imposed.
10.E. Taxation
Material Chilean Tax Considerations
The following describes the material Chilean income tax consequences of an investment in SQM ADSs by an individual who is not domiciled or resident in Chile or any legal entity that is not organized under the laws of Chile and does not have a permanent establishment located in Chile, a (“foreign holder”). This discussion is based upon Chilean income tax laws presently in force, including Ruling No. 324 (1990) of the Chilean Internal Revenue Service and other applicable regulations and rulings. The discussion is not intended as tax advice to any particular investor, which can be rendered only in light of that investor’s particular tax situation.
Under Chilean law, provisions contained in statutes such as tax rates applicable to foreign holders, the computation of taxable income for Chilean purposes and the manner in which Chilean taxes are imposed and collected may only be amended by another statute. In addition, the Chilean tax authorities issue rulings and regulations of either general or specific application and interpret the provisions of Chilean tax law. Chilean tax may not be assessed retroactively against taxpayers who act in good faith relying on such rulings, regulations and interpretations, but Chilean tax authorities may change said rulings, regulations and interpretations prospectively.
Cash Dividends and Other Distributions
On September 29, 2014, the Tax Reform was published, introducing significant changes to the Chilean taxation system and strengthening the powers of the SII to control and prevent tax avoidance. Subsequently, on February 8, 2016, Law No. 20,899 that simplifies the income tax system and modifies other legal tax provisions was published. As a result of these reforms, open stock corporations like SQM are subject to the partially integrated shareholder tax regime ( sistema parcialmente integrado ). The corporate tax rate applicable to us increased to 25.5% in 2017. It increased to a maximum rate of 27% in 2018.
| 123 |
Under the partially integrated shareholder taxation regime, shareholders bear the tax on dividends upon payment, but they will only be permitted to credit against such shareholder taxes a portion of the Chilean corporate tax paid by us on our earnings, unless the shareholder is resident in a country with a tax treaty in force with Chile or signed with Chile prior to January 1, 2017, whether or not in force. In that case, 100% of the Chilean corporate tax paid by us may be credited against the final taxes at the shareholder level.
As a result, foreign shareholders, resident in a non-treaty jurisdiction will be subject to a higher effective tax rate than residents of treaty jurisdictions. There is a temporary rule in effect from January 1, 2017 through December 31, 2019 that treaty jurisdictions for this purpose will include jurisdictions with tax treaties signed with Chile prior to January 1, 2017, whether or not such treaties are in force. This is currently the status of the treaty signed between Chile and United States.
Cash dividends paid by the Company with respect to the shares, including shares represented by ADSs held by a U.S. Holder (as defined below), will be subject to a 35% Chilean withholding tax, which is withheld and paid by the Company (the “Withholding Tax”). The effective rate of Withholding Tax imposed on dividends attributed to 2018 earnings of the Company and distributed during the same period was 20.99239%.
Capital Gains
Gains from the sale or other disposition by a foreign holder of ADSs outside Chile will not be subject to Chilean taxation. The deposit and withdrawal of the shares in exchange for ADRs will not be subject to any Chilean taxes.
The tax basis of the shares received in exchange for ADSs (repatriation) will be the acquisition value of the shares. The Series B shares exchanged for ADSs are valued at the highest price at which they trade on the Chilean Stock Exchange on the date of the exchange or on either of the two business days preceding the exchange. Consequently, the conversion of ADSs into the shares and the immediate sale of such shares at a price equal to or less than the highest price for Series B shares on the Chilean Stock Exchange on such dates will not generate a gain subject to Chilean taxation.
Gain recognized on a sale or exchange of shares (as distinguished from sales or exchanges of ADSs representing such shares) will be subject to both the First Category Tax and the Withholding Tax if either (i) the foreign holder has held the shares for less than one year since exchanging the ADSs for the shares, (ii) the foreign holder acquired and disposed of the shares in the ordinary course of its business or as a regular trader of shares, or (iii) the foreign holder and the purchaser of the shares are related parties within the meaning of Chilean tax law. The amount of the First Category Tax may be credited against the amount of the Withholding Tax. In all other cases, gain on the disposition of the shares will be subject only to a capital gains tax, which is assessed at the same rate as the First Category Tax. Gain recognized in the transfer of common shares that have significant trading volumes in the stock exchange, however, is not subject to capital gains tax in Chile, provided that the common shares are transferred in a local stock exchange authorized by the CMF, within the process of a public tender of common shares governed by the Chilean Securities Market Act. Law No. 20,448 states that common shares must also have been acquired after April 19, 2001, either on a local stock exchange authorized by the CMF, within the referred process of public tender of a common shares governed by the Chilean Securities Market Act, in an initial public offering of common shares resulting from the formation of a corporation or a capital increase of the same, in an exchange of convertible securities subject to public offer, or in the redemption of mutual funds shares. According to Ruling No. 224 (2008) of the Chilean Internal Revenue Service, common shares received by exchange of ADRs are also considered as “acquired on a stock exchange” if the respective ADRs have been acquired on a foreign stock exchange authorized by the CMF ( i.e., London Stock Exchange, New York Stock Exchange and Bolsa de Valores de Madrid ). Common shares are considered to have a high presence in the stock exchange when they: (a) are registered in the Securities Registry, (b) are registered in a Chilean Stock Exchange, (c) have an adjusted presence equal to or above 25%.
| 124 |
As of June 19, 2001, capital gains obtained in the sale of common shares that are publicly traded in a stock exchange are also exempt from capital gains tax in Chile when the sale is made by “foreign institutional investors” such as mutual funds and pension funds, provided that the sale is made in a local stock exchange authorized by the CMF, or in accordance with the provisions of the securities market law (Law 18,045). To qualify as foreign institutional investors, the referred entities must be formed outside of Chile, not have a domicile in Chile, and they must be an “investment fund” in according with the Chilean tax law.
Starting January 1, 2017, capital gains obtained in the sales of shares owned by foreign holders are subject to First Category Tax and Withholding Tax, and the First Category Tax serves as a credit in Chile to reduce the Withholding Tax. The exercise of pre-emptive rights relating to shares will not be subject to Chilean taxation. Any gain on the sale or assignment of pre-emptive rights relating to shares will be subject to both the First Category Tax and the Withholding Tax (the former being creditable against the latter).
Other Chilean Taxes
No Chilean inheritance, gift or succession taxes apply to the transfer or disposition of the ADSs by a foreign holder, but such taxes generally will apply to the transfer at death or by gift of the shares by a foreign holder. No Chilean stamp, issue, registration or similar taxes or duties apply to foreign holders of ADSs or shares.
Withholding Tax Certificates
Upon request, the Company will provide to foreign holders appropriate documentation evidencing the payment of Chilean withholding taxes.
Material U.S. Federal Income Tax Considerations
The following discussion summarizes the material U.S. federal income tax consequences to U.S. Holders (defined below) arising from ownership and disposition of the Series A shares and the Series B common shares, together the “shares”, and the ADSs. The discussion which follows is based on the U.S. Internal Revenue Code of 1986, as amended, the “Code,” the Treasury regulations promulgated thereunder, and judicial and administrative interpretations thereof, all as in effect and available on the date hereof. These authorities are subject to change, possibly with retroactive effect, which could affect the continued validity of this summary. In addition, the summary assumes that the depositary’s activities are clearly and appropriately defined so as to ensure that the U.S. federal income tax treatment of ADSs will be identical to the U.S. federal income tax treatment of the underlying shares.
The discussion that follows is not intended as tax advice to any particular investor and is limited to investors who will hold the shares or ADSs as “capital assets” within the meaning of Section 1221 of the Code and whose functional currency is the U.S. dollar. The summary does not address the tax treatment of holders that may be subject to special U.S. federal income tax rules, such as insurance companies, tax-exempt organizations, financial institutions, persons who are subject to the alternative minimum tax, persons who are broker-dealers in securities or foreign currency or dealers and traders in securities who use a mark-to-market method of tax accounting, persons who hold the shares or ADSs as a hedge against currency risks, as a position in a “straddle” for tax purposes, or as part of a conversion or other integrated transaction, persons holding our shares or ADSs in connection with a trade or business conducted outside of the U.S., partnerships or other entities classified as partnerships or other pass-through entities for U.S. federal income tax purposes or partners in such partnerships or entities, or persons who own (directly, indirectly or by attribution) 10% or more of the combined voting power of all classes of equity in the Company or 10% or more of the combined value of all classes of equity in the Company. PERSONS OR ENTITIES DESCRIBED ABOVE, INCLUDING PARTNERSHIPS HOLDING SHARES OR ADSs OR PARTNERS IN SUCH PARTNERSHIPS, SHOULD CONSULT THEIR OWN TAX ADVISORS AS TO THE PARTICULAR U.S. FEDERAL INCOME TAX CONSEQUENCES OF HOLDING AND DISPOSING OF SHARES OR ADSs.
| 125 |
For purposes of this summary, the term “U.S. Holder” means a beneficial owner of shares or ADSs that is, for U.S. federal income tax purposes, (a) an individual who is a U.S. citizen or resident, (b) a corporation or other entity taxable as a corporation created or organized under the laws of the U.S. or any political subdivision thereof, (c) an estate, the income of which is subject to U.S. federal income tax regardless of the source, or (d) a trust (i) that validly elects to be treated as a U.S. person for U.S. federal income tax purposes or (ii) if (A) a court within the U.S. is able to exercise primary supervision over the administration of the trust and (B) one or more U.S. persons have the authority to control all substantial decisions of the trust.
If a partnership (or any other entity treated as a partnership for U.S. federal income tax purposes) holds shares or ADSs, the tax treatment of the partnership and a partner in such partnership generally will depend on the status of the partner and the tax treatment of the partnership. Such a partner or partnership should consult its own tax advisor as to its consequences.
As of this date, there is currently no applicable income tax treaty in effect between the U.S. and Chile. However, in 2010, the U.S. and Chile signed an income tax treaty that will enter into force once the treaty is ratified by both countries. There can be no assurance that the treaty will be ratified by either country. The following summary assumes that there is no applicable income tax treaty in effect between the U.S. and Chile.
The discussion below does not address the effect of any U.S. state, local, estate or gift tax law or non-U.S. tax law or tax considerations that arise from rules of general application to all taxpayers on a U.S. Holder of the shares or ADSs. U.S. HOLDERS OF SHARES OR ADSs SHOULD CONSULT THEIR OWN TAX ADVISORS TO DETERMINE THE PARTICULAR CONSEQUENCES UNDER ANY SUCH LAW OF OWNING OR DISPOSING THE SHARES OR ADSs.
For purposes of applying U.S. federal income tax law, any U.S. Holder of an ADS generally will be treated as the owner of the underlying shares represented thereby. The U.S. Treasury has expressed concerns that parties to whom ADSs are released before shares are delivered to the depositary (pre-release) or intermediaries in the chain of ownership between beneficial owners and the issuer of the security underlying the ADSs may be taking actions that are inconsistent with the claiming of foreign tax credits for beneficial owners of depositary shares. Such actions would also be inconsistent with the claiming of the reduced tax rate, described below, applicable to dividends received by certain non-corporate beneficial owners. Accordingly, the analysis of the creditability of Chilean taxes, and the availability of the reduced tax rate for dividends received by certain non-corporate holders, each described below, could be affected by actions taken by such parties or intermediaries.
Cash Dividends and Other Distributions
The following discussion of cash dividends and other distributions is subject to the discussion below under “Passive Foreign Investment Company Rules.” Distributions received by a U.S. Holder on shares or ADSs, including the amount of any Chilean taxes withheld, other than certain pro rata distributions of shares to all shareholders, will constitute foreign-source income to the extent paid out of our current or accumulated earnings and profits (as determined for U.S. federal income tax purposes). Because we do not maintain calculations of our earnings and profits under U.S. federal income tax principles, it is expected that distributions generally will be reported to U.S. Holders as dividends. The amount of dividend income paid in Chilean pesos that a U.S. Holder will be required to include in income will equal the U.S. dollar value of the distributed Chilean peso, calculated by reference to the exchange rate in effect on the date the payment is received, regardless of whether the payment is converted into U.S. dollars on the date of receipt. If the dividend is converted into U.S. dollars on the date of receipt, a U.S. Holder will generally not be required to recognize foreign currency gain or loss in respect of the dividend income. A U.S. Holder may have foreign currency gain or loss if the dividend is converted into U.S. dollars after the date of its receipt, which would be ordinary income or loss and would be treated as income from U.S. sources for foreign tax credit purposes. Dividends will be included in a U.S. Holder’s income on the date of the U.S. Holder’s, or in the case of ADSs, the depositary’s, receipt of the dividend. Corporate U.S. Holders will not be entitled to claim the dividends-received deduction with respect to dividends paid by us.
| 126 |
Subject to certain exceptions for short-term and hedged positions, the discussion above regarding concerns expressed by the U.S. Treasury and the discussion below regarding rules intended to be promulgated by the U.S. Treasury, the U.S. dollar amount of dividends received by a noncorporate U.S. Holder in respect of our shares or ADSs generally will be subject to taxation at preferential rates if the dividends are “qualified dividends.” Dividends paid on our ADSs generally will be treated as qualified dividends if (i) our ADSs are readily tradable on an established securities market in the U.S. (ii) SQM was not, in the year prior to the year in which the dividend was paid, and is not, in the year in which the dividend is paid, a passive foreign investment company (“PFIC”) and (iii) the holder thereof has satisfied certain holding period requirements. Our ADSs are listed on the New York Stock Exchange and generally will qualify as readily tradable on an established securities market in the U.S. so long as they are so listed. We do not believe that we were a PFIC for U.S. federal income tax purposes with respect to our 2017 taxable year. In addition, based on our current expectations regarding the value and nature of our assets, the sources and nature of our income, and relevant market and shareholder data, we do not anticipate becoming a PFIC for our 2018 taxable year. However, because PFIC status depends upon the composition of a company’s income and assets and the market value of its assets from time to time, and because it is unclear whether certain types of our income constitute passive income for PFIC purposes, there can be no assurance that we will not be considered a PFIC for any current, prior or future taxable year. Based on existing guidance, it is not entirely clear whether dividends received with respect to our shares will be treated as qualified dividends, because our shares are not themselves listed on a U.S. exchange. In addition, the U.S. Treasury has announced its intention to promulgate rules pursuant to which holders of ADSs and intermediaries through whom such securities are held will be permitted to rely on certifications from issuers to establish that dividends are treated as qualified dividends. Because such procedures have not yet been issued, it is not clear whether we will be able to comply with them. A U.S. HOLDER SHOULD CONSULT ITS TAX ADVISORS TO DETERMINE WHETHER THE FAVORABLE RATE WILL APPLY TO DIVIDENDS IT RECEIVES AND WHETHER IT IS SUBJECT TO ANY SPECIAL RULES THAT LIMIT ITS ABILITY TO BE TAXED AT THIS FAVORABLE RATE.
The amount of a dividend generally will be treated as foreign-source dividend income to a U.S. Holder for foreign tax credit purposes. As discussed in more detail below under “—Foreign Tax Credits,” it is not free from doubt whether Chilean withholding taxes imposed on distributions on our shares or ADSs will be treated as income taxes eligible for a foreign tax credit for U.S. federal income tax purposes. If a Chilean withholding tax is treated as an eligible foreign income tax, subject to generally applicable limitations, you may claim a credit against your U.S. federal income tax liability for the eligible Chilean taxes withheld from distributions on our shares or ADSs. If the dividends are taxed as qualified dividend income (as discussed above), special rules will apply in determining the amount of the dividend taken into account for purposes of calculating the foreign tax credit limitation. THE RULES RELATING TO FOREIGN TAX CREDITS ARE COMPLEX. YOU ARE URGED TO CONSULT YOUR OWN TAX ADVISORS REGARDING THE TREATMENT OF CHILEAN WITHHOLDING TAXES IMPOSED ON DISTRIBUTIONS ON OUR SHARES OR ADSs.
| 127 |
Sale or Other Disposition of our Shares or ADSs
For U.S. federal income tax purposes, the gain or loss a U.S. Holder realizes on the sale or other disposition of our shares or ADSs generally will be U.S.-source capital gain or loss for foreign tax credit purposes, and generally will be a long-term capital gain or loss if the U.S. Holder has held our shares or ADSs for more than one year. The amount of a U.S. Holder’s gain or loss will equal the difference between the U.S. Holder’s tax basis in our shares or ADSs disposed of and the amount realized on the disposition (including any amount withheld in respect of Chilean withholding taxes), in each case as determined in U.S. dollars.
In certain circumstances, Chilean taxes may be imposed upon the sale of shares. See “—Material Chilean Tax Considerations—Capital Gains” above. As discussed in more detail below under “—Foreign Tax Credits,” subject to generally applicable limitations and substantiation requirements, a U.S. Holder may be eligible to claim a credit against its U.S. federal income tax liability for the eligible Chilean taxes withheld pursuant to a sale or other disposition of our shares or ADSs. U.S. HOLDERS ARE URGED TO CONSULT THEIR OWN U.S. TAX ADVISORS WITH RESPECT TO THE PARTICULAR CONSEQUENCES TO THEM OF OWNING OR DISPOSING OF OUR SHARES OR ADSs.
Foreign Tax Credits
Subject to applicable limitations that may vary depending upon a U.S. Holder’s circumstances and subject to the discussion above regarding concerns expressed by the U.S. Treasury, you may be eligible to claim a credit against your U.S. tax liability for Chilean income taxes (or taxes imposed in lieu of an income tax) imposed in connection with distributions on and proceeds from the sale or other disposition of our shares or ADSs. Chilean dividend withholding taxes generally are expected to be income taxes eligible for the foreign tax credit. The Chilean capital gains tax is likely to be treated as an income tax (or a tax paid in lieu of an income tax) and thus eligible for the foreign tax credit; however, you generally may claim a foreign tax credit only after taking into account any available opportunity to reduce the Chilean capital gains tax, such as the reduction for the credit for Chilean corporate income tax that is taken into account when calculating Chilean withholding tax. If a Chilean tax is imposed on the sale or disposition of our shares or ADSs, and a U.S. Holder does not receive significant foreign source income from other sources, such U.S. Holder may not be able to credit such Chilean tax against its U.S. federal income tax liability. If a Chilean tax is not treated as an income tax (or a tax paid in lieu of an income tax) for U.S. federal income tax purposes, a U.S. Holder would be unable to claim a foreign tax credit for any such Chilean tax withheld; however, a U.S. Holder may be able to deduct such tax in computing its U.S. federal income tax liability, subject to applicable limitations. In addition, instead of claiming a credit, a U.S. Holder may, at the U.S. Holder’s election, deduct such Chilean taxes in computing the U.S. Holder’s taxable income, subject to generally applicable limitations under U.S. law. An election to deduct foreign taxes instead of claiming foreign tax credits applies to all taxes paid or accrued in the taxable year to foreign countries and possessions of the U.S. THE CALCULATION OF FOREIGN TAX CREDITS AND, IN THE CASE OF A U.S. HOLDER THAT ELECTS TO DEDUCT FOREIGN INCOME TAXES, THE AVAILABILITY OF DEDUCTIONS, INVOLVES THE APPLICATION OF COMPLEX RULES THAT DEPEND ON YOUR PARTICULAR CIRCUMSTANCES. U.S. HOLDERS ARE URGED TO CONSULT THEIR TAX ADVISORS REGARDING THE AVAILABILITY OF FOREIGN TAX CREDITS IN THEIR PARTICULAR CIRCUMSTANCES.
Passive Foreign Investment Company Rules
We do not expect to be a PFIC for U.S. federal income tax purposes for our 2018 taxable year and do not anticipate being a PFIC for our 2019 taxable year. However, because PFIC status depends upon the composition of a company’s income and assets and the market value of its assets from time to time, and because it is unclear whether certain types of our income constitute passive income for PFIC purposes, there can be no assurance that we will not be considered a PFIC for any current, prior or future taxable year. If we were a PFIC for any taxable year during which a U.S. Holder held our shares or ADSs, certain adverse consequences could apply to the U.S. Holder, including the imposition of higher amounts of tax than would otherwise apply, and additional filing requirements. In addition, if we were treated as a PFIC in a taxable year in which we pay a dividend or in the prior taxable year, the favorable dividend rates discussed above with respect to dividends paid to certain non-corporate U.S. Holders would not apply (see “—Cash Dividends and Other Distributions” above). A U.S. Holder should consult its tax advisors regarding the consequences to it if we were a PFIC, as well as the availability and advisability of making any election that might mitigate the adverse consequences of PFIC status.
| 128 |
Information Reporting and Backup Withholding
Required Disclosure with Respect to Foreign Financial Assets
Certain U.S. Holders are required to report information relating to an interest in our shares or ADSs, subject to certain exceptions (including an exception for our shares or ADSs held in accounts maintained by certain financial institutions), by attaching a completed IRS Form 8938, Statement of Specified Foreign Financial Assets, with their tax return for each year in which they hold an interest in our shares or ADSs. U.S. HOLDERS ARE URGED TO CONSULT THEIR OWN U.S. TAX ADVISORS REGARDING INFORMATION REPORTING REQUIREMENTS RELATING TO THEIR OWNERSHIP OF OUR SHARES OR ADSs.
Information Reporting and Backup Withholding
Payments of dividends and sales proceeds that are made within the U.S. or through certain U.S.-related financial intermediaries generally are subject to information reporting and to backup withholding unless (i) the U.S. Holder is an exempt recipient or (ii) in the case of backup withholding, the U.S. Holder provides a correct taxpayer identification number and certifies that it is not subject to backup withholding.
The amount of any backup withholding from a payment to a U.S. Holder will be allowed as a credit against its U.S. federal income tax liability and may entitle it to a refund, provided that the required information is timely furnished to the U.S. Internal Revenue Service.
Medicare Contribution Tax
Legislation enacted in 2010 generally imposes a tax of 3.8% on the “net investment income” of certain individuals, trusts and estates. Among other items, net investment income generally includes gross income from dividends and net gain attributable to the disposition of certain property, like our shares or ADSs, less certain deductions. A U.S. Holder should consult the U.S. Holder’s tax advisor regarding the possible application of this legislation in the U.S. Holder’s particular circumstances.
A U.S. HOLDER SHOULD CONSULT ITS OWN TAX ADVISORS WITH RESPECT TO THE PARTICULAR CONSEQUENCES TO IT OF OWNING AND DISPOSING OF OUR SHARES OR ADSs.
| 10.F. | Dividends and Paying Agents |
Not applicable.
| 10.G. | Statement by Experts |
Not applicable.
| 10.H. | Documents on Display |
We are subject to the information requirements of the Exchange Act, except that as a foreign issuer, we are not subject to the SEC proxy rules (other than general anti-fraud rules) or the short-swing profit disclosure rules of the Exchange Act. In accordance with these statutory requirements, we file or furnish reports and other information with the SEC. Reports, information statements and other information we filed with or furnish to the SEC are available electronically on the SEC’s website http://www.sec.gov, and on our website www.sqm.com.
| 129 |
| 10.I. | Subsidiary Information |
See “Item 4.C. Organizational Structure.”
| ITEM 11. | QUANTITATIVE AND QUALITATIVE DISCLOSURES ABOUT MARKET RISK |
As discussed elsewhere in this Annual Report, we transact our businesses in more than 110 countries, thereby rendering our market risk dependent upon the fluctuations of foreign currencies and local and international interest rates. These fluctuations may generate losses in the value of financial instruments taken in the normal course of business.
We, from time to time and depending upon then current market conditions, review and re-establish our financial policies to protect our operations. Management is authorized by our Board of Directors to engage in certain derivative contracts such as forwards and swaps to specifically hedge the fluctuations in interest rates and in currencies other than the U.S. dollar.
Derivative instruments used by us are generally transaction-specific so that a specific debt instrument or contract determines the amount, maturity and other terms of the hedge. We do not use derivative instruments for speculative purposes.
Interest Rate Risk. As of December 31, 2018, approximately 5% of our financial debt was effectively priced at LIBOR. Interest rate fluctuations, due to the uncertain future behavior of markets, may have a material impact on our financial results should we have such debts.
As of December 31, 2018, our total financial debt is primarily long-term, with 1% of maturities less than 12 months, which we believe decreases the exposure to changes in the interest rates.
Exchange Rate Risk. Although the U.S. dollar is the primary currency in which we transact our businesses, our operations throughout the world expose us to exchange rate variations for non-U.S. dollar currencies. Therefore, fluctuations in the exchange rate of such local currencies may affect our financial condition and results of operations. To lessen these effects, we maintain derivative contracts to protect the net difference between our principal assets and liabilities for currencies other than the U.S. dollar. These contracts are renewed periodically depending on the amount covered in each currency. Aside from this, we do not hedge potential future income and expenses in currencies other than the U.S. dollar with the exception of the euro and Chilean peso. We estimate annual sales in euros and expenses in Chilean pesos, and depending on the circumstances we secure the exchange difference with derivative contracts.
The following is a summary of the aggregate net monetary assets and liabilities that are denominated in non-U.S. dollar currencies as of December 31, 2018, 2017 and 2016. Figures do not include our financial hedging positions for year-end:
| 2018 | 2017 | 2016 | ||||||||||
| Th US$ | Th US$ | Th US$ | ||||||||||
| Chilean pesos | (267,032 | ) | (173,907 | ) | (240,563 | ) | ||||||
| Brazilian real | (756 | ) | (708 | ) | 183 | |||||||
| Euro | 14,568 | 31,291 | 15,621 | |||||||||
| Japanese yen | 77,975 | 42,789 | 1,892 | |||||||||
| Mexican pesos | 5,471 | (1,650 | ) | 1,166 | ||||||||
| South African rand | 5,283 | 28,454 | 25,542 | |||||||||
| Dirhams | 46,864 | 35,960 | 31,297 | |||||||||
| Other currencies | 69,968 | 38,853 | 24,367 | |||||||||
| Total, net | (47,659 | ) | 1,084 | (140,495 | ) | |||||||
| 130 |
Also, we had open forward exchange contracts to buy U.S. dollars and sell Chilean pesos to hedge our time deposits in Chilean pesos for approximately US348 million (Ch$229,244 million).
The information contained in Item 11. Quantitative and Qualitative Disclosures About Market Risk, contains statements that may constitute forward-looking statements. See “Cautionary Statement Regarding Forward-Looking Statements” in this Annual Report, for safe harbor provisions.
| ITEM 12. | DESCRIPTION OF SECURITIES OTHER THAN EQUITY SECURITIES |
|
|
|
Not applicable.
|
|
WARRANTS AND RIGHTS |
Not applicable.
|
|
OTHER SECURITIES |
Not applicable.
|
|
AMERICAN DEPOSITARY RECEIPTS |
Depositary Fees and Charges
The Company’s American Depositary Shares (“ADS”) program is administered by The Bank of New York Mellon (101 Barclay St., 22 Fl. W., New York, NY 10286), as Depositary. Under the terms of the Deposit Agreement, an ADS holder may have to pay the following service fees to the Depositary:
| Service Fees | Fees |
| Execution and delivery of ADSs and the surrender of ADRs | $0.05 per share |
Depositary Payments Fiscal Year 2018
The Depositary has agreed to reimburse certain expenses related to the Company’s ADS program and incurred by the Company in connection with the program. In 2018, the Depositary reimbursed expenses related to investor relations for a total amount of US$315,591.
| 131 |
PART II
| ITEM 13. | DEFAULTS, DIVIDEND ARREARAGES AND DELINQUENCIES |
None.
| ITEM 14. | MATERIAL MODIFICATIONS TO THE RIGHTS OF SECURITY HOLDERS AND USE OF PROCEEDS |
None.
| ITEM 15. | CONTROLS AND PROCEDURES |
| (a) | Disclosure Control and Procedures |
SQM management, with the participation of the Company’s Chief Executive Officer and Chief Financial Officer and other members of the Company’s executive management, evaluated the effectiveness of our disclosure controls and procedures, pursuant to Rule 13a-15(b) promulgated under the Exchange Act, as of the end of the period covered by this Annual Report. Based upon that evaluation, our Chief Executive Officer and Chief Financial Officer have concluded that the Company’s disclosure controls and procedures were effective in providing reasonable assurance that material information is made known to management and that financial and non-financial information is properly recorded, processed, summarized and reported as of December 31, 2018.
The Company’s disclosure controls and procedures are designed to provide reasonable assurance that information required to be disclosed by the issuer in the reports that it files or submits under the Exchange Act is recorded, processed, summarized and reported, within the time periods specified in the Commission’s rules and forms, and that such information is accumulated and communicated to management of the Company, with the participation of its Chief Executive Officer and Chief Financial Officer, as appropriate to allow timely decisions regarding required disclosures. However, through the same design and evaluation period of the disclosure controls and procedures, the Company’s management, including the Company’s Chief Executive Officer and Chief Financial Officer, recognized that there are inherent limitations to the effectiveness of any control system regardless of how well designed and operated. In such a way they can provide only reasonable assurance of achieving the desired control objectives, and no evaluation can provide absolute assurance that all control issues or instances of fraud, if any, within the Company have been detected.
| (b) | Management’s Annual Report on Internal Control Over Financial Reporting |
SQM management is responsible for establishing and maintaining adequate internal control over financial reporting as such term is defined in Exchange Act Rule 13a-15(f). The Company’s internal control over financial reporting is designed to provide reasonable assurance regarding the reliability of financial reporting and the preparation of the financial statements for external purposes in accordance with generally accepted accounting principles.
Because of its inherent limitations, internal control over financial reporting may not necessarily prevent or detect some misstatements. It can only provide reasonable assurance regarding financial statement preparation and presentation. Also, projections of any evaluation of effectiveness for future periods are subject to the risk that controls may become inadequate because of changes in conditions or because the degree of compliance with the polices or procedures may deteriorate over time.
Management assessed the effectiveness of its internal control over financial reporting as of December 31, 2018. The assessment was based on criteria established in the framework “Internal Controls — Integrated Framework (2013)” issued by the Committee of Sponsoring Organizations of the Treadway Commission (COSO). Based on the assessment, SQM management has concluded that as of December 31, 2018, the Company’s internal control over financial reporting was effective.
| 132 |
| (c) | Attestation Report of the Registered Public Accounting Firm |
For the report of PricewaterhouseCoopers Consultores Auditores SpA, independent registered public accounting firm, dated April
17, 2019, on the effectiveness of our internal control over financial reporting as of December 31, 2018, see page F-2 of our Audited
Consolidated Financial Statements.
| (d) | Changes in Internal Control Over Financial Reporting |
There has been no change in the Company’s internal control over financial reporting (as defined in Rule 13a-15(f) under the Exchange Act) that occurred during the period covered by this Annual Report that has materially affected, or is reasonably likely to materially affect, internal control over financial reporting.
| ITEM 16. | [Reserved] |
| ITEM 16A. | AUDIT COMMITTEE FINANCIAL EXPERT |
The Board of Directors has determined that the Company does not have an audit committee financial expert within the meaning of the regulations adopted under the Sarbanes-Oxley Act of 2002.
Pursuant to Chilean regulations, the Company has a Directors’ Committee whose main duties are similar to those of an audit committee. Each of the members of the Directors’ Committee is a member of the audit committee. See “Item 6.C. Board Practices.”
Our Board believes that the members of the Directors’ Committee have the necessary expertise and experience to perform the functions of the Directors’ Committee pursuant to Chilean regulations.
| ITEM 16B. | CODE OF ETHICS |
We have adopted a Code of Business Conduct that applies to the Chief Executive Officer, the Chief Financial Officer, the Internal Auditor as well as all our officers and employees. Our Code adheres to the definition set forth in Item 16B. of Form 20-F under the Exchange Act.
No waivers have been granted therefrom to the officers mentioned above.
The full text of the code is available on our website at http://www.sqm.com in the Investor Relations section under “Corporate Governance.”
Amendments to, or waivers from, one or more provisions of the code will be disclosed on our website.
| ITEM 16C. | PRINCIPAL ACCOUNTANT FEES AND SERVICES |
The table shows the amount of fees billed to SQM by our independent auditors, PwC for the 2018 and 2017 fiscal years, in relation to audit, tax and other assurance services provided to us (in thousands of US$):
| 2018 | 2017 | |||||||
| Audit fees | 1,408 | 1,599 | ||||||
| Tax fees | 289 | 265 | ||||||
| All other fees | 17 | 36 | ||||||
| Total fees | 1,715 | 1,900 | ||||||
| 133 |
Audit fees in the above table are the
fees approved by the Directors’ Committee for PwC in 2018 and 2017 in connection with the audits of our annual consolidated
financial statements.
All other fees in the above table are aggregate fees approved by the Directors’ Committee for PwC in 2018 and 2017 in connection
with services such as transfer pricing and other assurance services that were not related to the audit. These fees were pre-approved
by the Directors’ Committee in accordance with our pre-approval policies and procedures.
Directors’ Committee PreApproval Policies and Procedures.
Chilean law states that public companies are subject to “pre-approval” requirements under which all audit and non-audit
services provided by the independent auditor must be pre-approved by the Directors’ Committee. Our Directors’ Committee
approves all audits, audit related, tax and other services provided by our auditors.
Any services provided by our auditors that are not specifically included within the scope of the audit must be pre-approved by the Directors’ Committee prior to any engagement.
| ITEM 16D. | EXEMPTIONS FROM THE LISTING STANDARDS FOR AUDIT COMMITTEES |
Our Directors’ Committee performs many of the functions of an audit committee under NYSE corporate governance rules and the Exchange Act but also performs other functions as prescribed under Chilean law. See “Item 6.C. Board Practices.”
Ms. Joanne L. Boyes was an executive officer of Nutrien (formerly PCS prior to the merger with Agrium Inc. on January 1, 2018) during her service on our Directors’ Committee. Nutrien and its affiliates owned and currently owns an aggregate of 32% of the total outstanding shares of SQM. See “Item 7.A. Major Shareholders.”
Ms. Boyes resigned from our Directors’ Committee and Board of Directors on January 24, 2018. During her service on the Directors’ Committee, Ms. Boyes served as an observer on audit committee matters and did not have voting rights on such matters. Ms. Boyes was neither the chair of the Directors’ Committee nor an executive officer of SQM. Accordingly, we relied on the exemption provided in Rule 10A-3(b)(1)(iv)(D) of the Exchange Act for Ms. Boyes’ service on the Directors’ Committee. We do not believe that Ms. Boyes’ affiliation with Nutrien had a materially adverse effect on the ability of the Directors’ Committee to act independently or to satisfy the other requirements relating to audit committees contained in Rule 10A-3 under the Exchange Act.
| ITEM 16E. | PURCHASES OF EQUITY SECURITIES BY THE ISSUER AND AFFILIATED PURCHASERS |
None.
| ITEM 16F. | CHANGE IN REGISTRANT’S CERTIFYING ACCOUNTANT |
None.
| ITEM 16G. | CORPORATE GOVERNANCE |
For a summary of the significant differences between our corporate governance practices and the NYSE corporate governance standards, see “Item 6.C. Board Practices.”
| ITEM 16H. | MINE SAFETY AND DISCLOSURE |
Not applicable.
| 134 |
See “Item 18. Financial Statements.”
For a list of all financial statements filed as part of this Form 20-F Annual Report, see “Item 19. Exhibits.”
(a) Index to Financial Statements
*All other schedules have been omitted because they are not applicable or the required information is shown in the Consolidated Financial Statements or notes thereto.
| 135 |
(b) Exhibits
| 136 |
The registrant hereby certifies that it meets all of the requirements for filing on Form 20-F and that it has duly caused and authorized the undersigned to sign this annual report on its behalf.
SOCIEDAD QUIMICA Y MINERA DE CHILE S.A.
(CHEMICAL AND MINING COMPANY OF CHILE INC.)
| /s/ Gerardo Illanes | ||
| Gerardo Illanes G. | ||
| Chief Financial Officer | ||
| Date: April 17, 2019 |
| 137 |
SOCIEDAD QUIMICA Y MINERA DE CHILE S.A. AND SUBSIDIARIES
Index to Consolidated Financial Statements
Contents
| Ch$ | - | Chilean pesos |
| ThCh$ | - | Thousands of Chilean pesos |
| US$ | - | United States dollars |
| ThUS$ | - | Thousands of United States dollars |
| UF | - | The UF is an inflation-indexed, Chilean peso-denominated monetary unit. The UF rate is set daily in advance, based on the change in the Consumer Price Index of the previous month |
| 138 |
REPORT OF INDEPENDENT REGISTERED PUBLIC ACCOUNTING FIRM
To the Board of Directors and shareholders of Sociedad Química y Minera de Chile S.A.
Opinions on the Financial Statements and Internal Control over Financial Reporting
We have audited the accompanying consolidated statements of financial position of Sociedad Química y Minera de Chile S.A. and its subsidiaries (the “Company”) as of December 31, 2018 and 2017, and the related consolidated statements of income, comprehensive income, changes in equity and cash flows for each of the three years in the period ended December 31, 2018, including the related notes (collectively referred to as the “consolidated financial statements”). We also have audited the Company’s internal control over financial reporting as of December 31, 2018, based on criteria established in Internal Control - Integrated Framework (2013) issued by the Committee of Sponsoring Organizations of the Treadway Commission (COSO).
In our opinion, the consolidated financial statements referred to above present fairly, in all material respects, the financial position of the Company as of December 31, 2018 and 2017, and the results of its operations and its cash flows for each of the three years in the period ended December, 31, 2018 in conformity with International Financial Reporting Standards as issued by the International Accounting Standards Board. Also in our opinion, the Company maintained, in all material respects, effective internal control over financial reporting as of December 31, 2018, based on criteria established in Internal Control - Integrated Framework (2013) issued by the COSO.
Basis for Opinions
The Company's management is responsible for these consolidated financial statements, for maintaining effective internal control over financial reporting, and for its assessment of the effectiveness of internal control over financial reporting, included in Management’s Annual Report on Internal Control over Financial Reporting appearing under Item 15. Our responsibility is to express opinions on the Company’s consolidated financial statements and on the Company's internal control over financial reporting based on our audits. We are a public accounting firm registered with the Public Company Accounting Oversight Board (United States) (PCAOB) and are required to be independent with respect to the Company in accordance with the U.S. federal securities laws and the applicable rules and regulations of the Securities and Exchange Commission and the PCAOB.
We conducted our audits in accordance with the standards of the PCAOB. Those standards require that we plan and perform the audits to obtain reasonable assurance about whether the consolidated financial statements are free of material misstatement, whether due to error or fraud, and whether effective internal control over financial reporting was maintained in all material respects.
| F- 1 |
Our audits of the consolidated financial statements included performing procedures to assess the risks of material misstatement of the consolidated financial statements, whether due to error or fraud, and performing procedures that respond to those risks. Such procedures included examining, on a test basis, evidence regarding the amounts and disclosures in the consolidated financial statements. Our audits also included evaluating the accounting principles used and significant estimates made by management, as well as evaluating the overall presentation of the consolidated financial statements. Our audit of internal control over financial reporting included obtaining an understanding of internal control over financial reporting, assessing the risk that a material weakness exists, and testing and evaluating the design and operating effectiveness of internal control based on the assessed risk. Our audits also included performing such other procedures as we considered necessary in the circumstances. We believe that our audits provide a reasonable basis for our opinions.
Definition and Limitations of Internal Control over Financial Reporting
A company’s internal control over financial reporting is a process designed to provide reasonable assurance regarding the reliability of financial reporting and the preparation of financial statements for external purposes in accordance with generally accepted accounting principles. A company’s internal control over financial reporting includes those policies and procedures that (i) pertain to the maintenance of records that, in reasonable detail, accurately and fairly reflect the transactions and dispositions of the assets of the company; (ii) provide reasonable assurance that transactions are recorded as necessary to permit preparation of financial statements in accordance with generally accepted accounting principles, and that receipts and expenditures of the company are being made only in accordance with authorizations of management and directors of the company; and (iii) provide reasonable assurance regarding prevention or timely detection of unauthorized acquisition, use, or disposition of the company’s assets that could have a material effect on the financial statements.
Because of its inherent limitations, internal control over financial reporting may not prevent or detect misstatements. Also, projections of any evaluation of effectiveness to future periods are subject to the risk that controls may become inadequate because of changes in conditions, or that the degree of compliance with the policies or procedures may deteriorate.
/s/ PricewaterhouseCoopers Consultores Auditores SpA
Santiago – Chile
April 17, 2019
We have served as the Company’s auditor since 2011.
| F- 2 |
| Note |
As of December 31,
ThUS$ |
As of December 31,
ThUS$ |
||||||||||
| Assets | ||||||||||||
| Current assets | ||||||||||||
| Cash and cash equivalents | 10.1 | 556,066 | 630,438 | |||||||||
| Other current financial assets | 13.1 | 312,721 | 366,979 | |||||||||
| Other current non-financial assets | 16 | 49,186 | 26,883 | |||||||||
| Trade and other receivables, current | 13.2 | 464,855 | 446,875 | |||||||||
| Trade receivables due from related parties, current | 12.4 | 44,554 | 59,132 | |||||||||
| Current inventories | 11 | 913,674 | 902,074 | |||||||||
| Current tax assets | 30.1 | 57,110 | 32,291 | |||||||||
| Current assets other than those classified as held for sale or disposal | 2,398,166 | 2,464,672 | ||||||||||
| Non-current assets or groups of assets classified as held for sale | 31 | 1,430 | 1,589 | |||||||||
| Total current assets | 2,399,596 | 2,466,261 | ||||||||||
| Non-current assets | ||||||||||||
| Other non-current financial assets | 13.1 | 17,131 | 42,879 | |||||||||
| Other non-current non-financial assets | 16 | 27,540 | 19,262 | |||||||||
| Trade receivables, non-current | 13.2 | 2,275 | 1,912 | |||||||||
| Investments classified using the equity method of accounting | 8.1-9.3 | 111,549 | 152,630 | |||||||||
| Intangible assets other than goodwill | 14.1 | 188,283 | 113,787 | |||||||||
| Goodwill | 14.1 | 34,718 | 37,972 | |||||||||
| Property, plant and equipment | 15.1 | 1,454,823 | 1,429,354 | |||||||||
| Tax assets, non-current | 30.1 | 32,179 | 32,179 | |||||||||
| Total non-current assets | 1,868,498 | 1,829,975 | ||||||||||
| Total assets | 4,268,094 | 4,296,236 | ||||||||||
The accompanying notes form an integral part of these consolidated financial statements.
| F- 3 |
Consolidated Classified Statements of Financial Position, (continued)
| Note |
As of December 31, 2018 ThUS$ |
As of December 31,
ThUS$ |
||||||||||
| Liabilities and Equity | ||||||||||||
| Current liabilities | ||||||||||||
| Other current financial liabilities | 13.4 | 23,585 | 220,328 | |||||||||
| Trade and other payables, current | 13.5 | 163,751 | 196,280 | |||||||||
| Trade payables due to related parties, current | 12.5-13.7 | 9 | 1,365 | |||||||||
| Other current provisions | 18.1 | 106,197 | 63,445 | |||||||||
| Current tax liabilities | 30.2 | 47,412 | 75,402 | |||||||||
| Provisions for employee benefits, current | 17.1 | 20,085 | 22,421 | |||||||||
| Other current liabilities | 18.3 | 194,624 | 168,804 | |||||||||
| Total current liabilities | 555,663 | 748,045 | ||||||||||
| Non-current liabilities | ||||||||||||
| Other non-current financial liabilities | 13.4 | 1,330,382 | 1,031,507 | |||||||||
| Other non-current provisions | 18.1 | 31,822 | 30,001 | |||||||||
| Deferred tax liabilities | 30.3 | 175,361 | 205,283 | |||||||||
| Provisions for employee benefits, non-current | 17.1 | 37,064 | 33,932 | |||||||||
| Total non-current liabilities | 1,574,629 | 1,300,723 | ||||||||||
| Total liabilities | 2,130,292 | 2,048,768 | ||||||||||
| Equity | 19 | |||||||||||
| Share capital | 477,386 | 477,386 | ||||||||||
| Retained earnings | 1,623,104 | 1,724,784 | ||||||||||
| Other reserves | (14,999 | ) | (14,349 | ) | ||||||||
| Equity attributable to owners of the Parent | 2,085,491 | 2,187,821 | ||||||||||
| Non-controlling interests | 52,311 | 59,647 | ||||||||||
| Total equity | 2,137,802 | 2,247,468 | ||||||||||
| Total liabilities and equity | 4,268,094 | 4,296,236 | ||||||||||
The accompanying notes form an integral part of these consolidated financial statements.
| F- 4 |
| January to December | ||||||||||||||||
| Note |
2018 ThUS$ |
2017 ThUS$ |
2016 ThUS$ |
|||||||||||||
| Revenue | 25.1 | 2,265,803 | 2,157,323 | 1,939,322 | ||||||||||||
| Cost of sales | 25.2 | (1,483,524 | ) | (1,394,822 | ) | (1,328,285 | ) | |||||||||
| Gross profit | 782,279 | 762,501 | 611,037 | |||||||||||||
| Other income | 25.3 | 32,048 | 17,827 | 15,202 | ||||||||||||
| Administrative expenses | 25.4 | (118,126 | ) | (101,171 | ) | (88,436 | ) | |||||||||
| Other expenses by function | 25.5 | (36,907 | ) | (53,600 | ) | (82,533 | ) | |||||||||
| Net impairment gains on reversal (losses) of financial assets | 2,967 | (8,038 | ) | (7,198 | ) | |||||||||||
| Other gains (losses) | 25.6 | 6,404 | 543 | 679 | ||||||||||||
| Profit from operating activities | 668,665 | 618,062 | 448,751 | |||||||||||||
| Finance income | 22,533 | 13,499 | 10,129 | |||||||||||||
| Finance costs | 25.9-27 | (59,914 | ) | (50,124 | ) | (57,498 | ) | |||||||||
| Share of profit of associates and joint ventures accounted for using the equity method | 8.1-9.3 | 6,351 | 14,452 | 13,047 | ||||||||||||
| Foreign currency translation differences | 28 | (16,597 | ) | (1,299 | ) | 460 | ||||||||||
| Profit before taxes | 621,038 | 594,590 | 414,889 | |||||||||||||
| Income tax expense, continuing operations | 30.3 | (178,975 | ) | (166,173 | ) | (132,965 | ) | |||||||||
| Profit from continuing operations | 442,063 | 428,417 | 281,924 | |||||||||||||
| Profit attributable to | ||||||||||||||||
| Owners of the Parent | 439,830 | 427,697 | 278,290 | |||||||||||||
| Non-controlling interests | 2,233 | 720 | 3,634 | |||||||||||||
| Profit for the year | 442,063 | 428,417 | 281,924 | |||||||||||||
The accompanying notes form an integral part of these consolidated financial statements.
| F- 5 |
Consolidated Statements of Income by Function, (continued)
| January to December | ||||||||||||||||
| Note | 2018 | 2017 | 2016 | |||||||||||||
| US$ | US$ | US$ | ||||||||||||||
| Earnings per share | ||||||||||||||||
| Common shares | ||||||||||||||||
| Basic earnings per share (US$ per share) | 20 | 1.6711 | 1.6250 | 1.0573 | ||||||||||||
| Diluted common shares | ||||||||||||||||
| Diluted earnings per share (US$ per share) | 20 | 1.6711 | 1.6250 | 1.0573 | ||||||||||||
The accompanying notes form an integral part of these consolidated financial statements.
| F- 6 |
Consolidated Statements of Comprehensive Income
| January to December | ||||||||||||
| 2018 | 2017 | 2016 | ||||||||||
| Statement of comprehensive income | ThUS$ | ThUS$ | ThUS$ | |||||||||
| Profit for the year | 442,063 | 428,417 | 281,924 | |||||||||
| Other comprehensive income | ||||||||||||
| Items of other comprehensive income that will not be reclassified to profit for the year, before taxes | ||||||||||||
| Losses from measurements of defined benefit plans | (1,338 | ) | (1,392 | ) | (3,397 | ) | ||||||
| Loss from financial assets measured irrevocably at fair value through other comprehensive income | (5,546 | ) | ||||||||||
| Total other comprehensive income that will not be reclassified to profit for the year, before taxes | (6,884 | ) | (1,392 | ) | (3,397 | ) | ||||||
| Items of other comprehensive income that will be reclassified to profit for the year, before taxes | ||||||||||||
| Foreign currency exchange losses | (1,219 | ) | (5,446 | ) | (2,252 | ) | ||||||
| (Loss) gain from financial assets measured at fair value through other comprehensive income | - | (26 | ) | 4,813 | ||||||||
| Gain from cash flow hedges | 5,723 | 2,184 | 2,233 | |||||||||
| Total other comprehensive income that will be reclassified to profit for the year, before taxes | 4,504 | (3,288 | ) | 4,794 | ||||||||
| Total other comprehensive income before taxes | (2,380 | ) | (4,680 | ) | 1,397 | |||||||
| Income taxes related to items of other comprehensive income that will not be reclassified to profit for the year | ||||||||||||
| Income tax related to financial assets measured irrevocably at fair value through other comprehensive income | 1,498 | - | - | |||||||||
| Income taxes related to new measurements of defined benefit plans in other comprehensive income | 396 | 282 | 921 | |||||||||
| Total income taxes related to items of other comprehensive income that will not be reclassified to profit for the year | 1,894 | 282 | 921 | |||||||||
| Income tax relating to components of other comprehensive income that will be reclassified to profit (loss) for the year | ||||||||||||
| Income taxes related to cash flow hedges | - | - | (470 | ) | ||||||||
| Income tax related to financial assets measured at fair value through other comprehensive income | - | (550 | ) | (1,300 | ) | |||||||
| Total income tax relating to components of other comprehensive income that will be reclassified to profit (loss) for the year | - | (550 | ) | (1,770 | ) | |||||||
| Total other comprehensive income | (486 | ) | (4,948 | ) | 548 | |||||||
| Total comprehensive income | 441,577 | 423,469 | 282,472 | |||||||||
| Comprehensive income attributable to | ||||||||||||
| Owners of the Parent | 439,180 | 422,736 | 278,831 | |||||||||
| Non-controlling interests | 2,397 | 733 | 3,641 | |||||||||
| Total comprehensive income | 441,577 | 423,469 | 282,472 | |||||||||
The accompanying notes form an integral part of these consolidated financial statements.
| F- 7 |
| Consolidated Statements of cash flows |
12/31/2018 ThUS$ |
12/31/2017 ThUS$ |
12/31/2016 ThUS$ |
|||||||||
| Cash flows from operating activities | ||||||||||||
| Cash receipts from sales of goods and rendering of services | 2,284,514 | 2,082,366 | 1,874,202 | |||||||||
| Cash receipts from premiums and benefits, annuities and other benefits from policies entered | 2,140 | 2,967 | 5,071 | |||||||||
| Cash payments to suppliers for the provision of goods and services | (1,201,674 | ) | (842,079 | ) | (851,972 | ) | ||||||
| Cash payments to and on behalf of employees | (230,007 | ) | (227,103 | ) | (204,609 | ) | ||||||
| Other payments related to operating activities (1) | (21,240 | ) | (65,444 | ) | (32,185 | ) | ||||||
| Net cash generated from (used in) operating activities | 833,733 | 950,707 | 790,507 | |||||||||
| Dividends received | 8,815 | 2,091 | 4,345 | |||||||||
| Interest paid | (59,565 | ) | (51,335 | ) | (55,217 | ) | ||||||
| Interest received | 22,533 | 13,499 | 10,550 | |||||||||
| Income taxes paid | (240,115 | ) | (148,568 | ) | (113,991 | ) | ||||||
| Other (outflows) of cash (2) | (40,562 | ) | (8,122 | ) | (2,532 | ) | ||||||
| Net cash generated from operating activities | 524,839 | 758,272 | 633,662 | |||||||||
| Cash flows from (used in) investing activities | ||||||||||||
| Cash flows arising from the loss of control of subsidiaries and other businesses | 68,988 | - | - | |||||||||
| Payments made to acquire interest in joint ventures | (19,989 | ) | (38,088 | ) | (45,000 | ) | ||||||
| Proceeds from the sale of property, plant and equipment | 61 | 229 | 4,347 | |||||||||
| Acquisition of property, plant and equipment | (244,693 | ) | (142,144 | ) | (131,251 | ) | ||||||
| Proceeds from sales of intangible assets | 14,056 | 8,640 | 3,435 | |||||||||
| Purchases of intangible assets | (74,374 | ) | - | (2,090 | ) | |||||||
| Proceeds from the repayment of advances and loans granted to third parties | (204 | ) | 78 | (163 | ) | |||||||
| Other inflows (outflows) of cash (3) | 69,151 | (76,782 | ) | 333,108 | ||||||||
| Net cash (used in) generated from investing activities | (187,004 | ) | (248,067 | ) | 162,386 | |||||||
(1) Includes a payment of ThUS$30,000 made to the SEC and the DOJ, which was provisioned in 2016 and paid in 2017.
(2) Other inflows (outflows) of cash from operating activities include increases (decreases) net of Value Added Tax.
(3) Other inflows (outflows) of cash include investments and redemptions of time deposits and other financial instruments that do not qualify as cash and cash equivalent in accordance with IAS 7, paragraph 7, since they mature in more than 90 days from the original investment date.
The accompanying notes form an integral part of these consolidated financial statements.
| F- 8 |
Consolidated Statements of Cash Flows, (continued)
| Note |
12/31/2018 ThUS$ |
12/31/2017 ThUS$ |
12/31/2016 ThUS$ |
|||||||||||
| Cash flows used in financing activities | ||||||||||||||
| Proceeds from long-term loans | 256,039 | - | - | |||||||||||
| Proceeds from short-term borrowings | 120,000 | 143,000 | 100,000 | |||||||||||
| Repayment of borrowings | (213,000 | ) | (180,987 | ) | (517,000) | |||||||||
| Dividends paid | (550,352 | ) | (373,933 | ) | (399,410) | |||||||||
| Net cash generated used in financing activities | (387,313 | ) | (411,920 | ) | (816,410) | |||||||||
| Net (decrease) increase in cash and cash equivalents before the effect of changes in the exchange rate | (49,478 | ) | 98,285 | (20,362) | ||||||||||
| Effects of exchange rate fluctuations on cash and cash equivalents | (24,894 | ) | 17,484 | 7,772 | ||||||||||
| Net (decrease) increase in cash and cash equivalents | (74,372 | ) | 115,769 | (12,590) | ||||||||||
| Cash and cash equivalents at beginning of period | 630,438 | 514,669 | 527,259 | |||||||||||
| Cash and cash equivalents at end of period | 556,066 | 630,438 | 514,669 | |||||||||||
The accompanying notes form an integral part of these consolidated financial statements.
| F- 9 |
Consolidated Statements of Changes in Equity
| 2018 |
Share
capital |
Foreign
currency translation difference reserves |
Gains
from cash flow hedge |
Gains (losses)
from financial assets measured at fair value through other comprehensive income |
Losses from
measurement of defined benefit plans |
Other
miscellaneous reserves |
Total
Other
|
Retained
earnings |
Equity
attributable to owners of the Parent |
Non-
controlling interests |
Total | |||||||||||||||||||||||||||||||||
| ThUS$ | ThUS$ | ThUS$ | ThUS$ | ThUS$ | ThUS$ | ThUS$ | ThUS$ | ThUS$ | ThUS$ | ThUS$ | ||||||||||||||||||||||||||||||||||
| Equity at beginning of the year | 477,386 | (24,913 | ) | 2,248 | 2,937 | (5,953 | ) | 11,332 | (14,349 | ) | 1,724,784 | 2,187,821 | 59,647 | 2,247,468 | ||||||||||||||||||||||||||||||
| Increase (decrease) due to changes in accounting policies (1) | - | - | - | - | - | - | - | (1,680 | ) | (1,680 | ) | - | (1,680 | ) | ||||||||||||||||||||||||||||||
| Restated opening balance of equity | 477,386 | (24,913 | ) | 2,248 | 2,937 | (5,953 | ) | 11,332 | (14,349 | ) | 1,723,104 | 2,186,141 | 59,647 | 2,245,788 | ||||||||||||||||||||||||||||||
| Profit for the year | - | - | - | - | - | - | 439,830 | 439,830 | 2,233 | 442,063 | ||||||||||||||||||||||||||||||||||
| Other comprehensive income | - | (1,394 | ) | 5,723 | (4,048 | ) | (931 | ) | - | (650 | ) | - | (650 | ) | 164 | (486 | ) | |||||||||||||||||||||||||||
| Comprehensive income | - | (1,394 | ) | 5,723 | (4,048 | ) | (931 | ) | - | (650 | ) | 439,830 | 439,180 | 2,397 | 441,577 | |||||||||||||||||||||||||||||
| Dividends | - | - | - | - | - | - | - | (539,830 | ) | (539,830 | ) | (9,733 | ) | (549,563 | ) | |||||||||||||||||||||||||||||
| Increase (decrease) in equity | - | (1,394 | ) | 5,723 | (4,048 | ) | (931 | ) | - | (650 | ) | (100,000 | ) | (100,650 | ) | (7,336 | ) | (107,986 | ) | |||||||||||||||||||||||||
|
Equity as of December 31, 2018
|
477,386 | (26,307 | ) | 7,971 | (1,111 | ) | (6,884 | ) | 11,332 | (14,999 | ) | 1,623,104 | 2,085,491 | 52,311 | 2,137,802 | |||||||||||||||||||||||||||||
| (1) | See Note 2.4 for description of changes in accounting policies |
The accompanying notes form an integral part of these consolidated financial statements.
| F- 10 |
Consolidated Statements of Changes in Equity, (continued)
| 2017 |
Share
capital |
Foreign
currency translation difference reserves |
Gains
from cash flow hedge |
Gains (losses)
from financial assets measured at fair value through other comprehensive income |
Losses from
measurement of defined benefit plans |
Other
miscellaneous reserves |
Total
Other
|
Retained
earnings |
Equity
attributable to owners of the Parent |
Non-
controlling interests |
Total | |||||||||||||||||||||||||||||||||
| ThUS$ | ThUS$ | ThUS$ | ThUS$ | ThUS$ | ThUS$ | ThUS$ | ThUS$ | ThUS$ | ThUS$ | ThUS$ | ||||||||||||||||||||||||||||||||||
| Equity at beginning of the year | 477,386 | (19,463 | ) | 64 | 3,513 | (4,834 | ) | 7,832 | (12,888 | ) | 1,781,576 | 2,246,074 | 61,198 | 2,307,272 | ||||||||||||||||||||||||||||||
| Profit for the year | - | - | - | - | - | - | 427,697 | 427,697 | 720 | 428,417 | ||||||||||||||||||||||||||||||||||
| Other comprehensive income | - | (5,450 | ) | 2,184 | (576 | ) | (1,119 | ) | - | (4,961 | ) | - | (4,961 | ) | 13 | (4,948 | ) | |||||||||||||||||||||||||||
| Comprehensive income | - | (5,450 | ) | 2,184 | (576 | ) | (1,119 | ) | - | (4,961 | ) | 427,697 | 422,736 | 733 | 423,469 | |||||||||||||||||||||||||||||
| Dividends | - | - | - | - | - | - | - | (480,989 | ) | (480,989 | ) | (2284 | ) | (483,273 | ) | |||||||||||||||||||||||||||||
| Increase (decrease) due to transfers and other changes | - | - | - | - | - | 3,500 | 3,500 | (3,500 | ) | - | - | - | ||||||||||||||||||||||||||||||||
| Increase (decrease) in equity | - | (5,450 | ) | 2,184 | (576 | ) | (1,119 | ) | 3,500 | (1,461 | ) | (56,792 | ) | (58,253 | ) | (1,551 | ) | (59,804 | ) | |||||||||||||||||||||||||
| Equity as of December 31, 2017 | 477,386 | (24,913 | ) | 2,248 | 2,937 | (5,953 | ) | 11,332 | (14,349 | ) | 1,724,784 | 2,187,821 | 59,647 | 2,247,468 | ||||||||||||||||||||||||||||||
The accompanying notes form an integral part of these consolidated financial statements.
| F- 11 |
Consolidated Statements of Changes in Equity, (continued)
| 2016 |
Share
capital |
Foreign
currency translation difference reserves |
Gains
from cash flow hedge |
Gains (losses)
from financial assets measured at fair value through other comprehensive income |
Losses from
measurement of defined benefit plans |
Other
miscellaneous reserves |
Other
reserves |
Retained
earnings |
Equity
attributable to owners of the Parent |
Non-
controlling interests |
Total | |||||||||||||||||||||||||||||||||
| ThUS$ | ThUS$ | ThUS$ | ThUS$ | ThUS$ | ThUS$ | ThUS$ | ThUS$ | ThUS$ | ThUS$ | ThUS$ | ||||||||||||||||||||||||||||||||||
| Equity at beginning of the year | 477,386 | (14,035 | ) | (1,699 | ) | (2,386 | ) | (1,677 | ) | (19,797 | ) | 1,882,196 | 2,339,785 | 60,571 | 2,400,356 | |||||||||||||||||||||||||||||
| Profit for the year | - | - | - | - | - | - | 278,290 | 278,290 | 3,634 | 281,924 | ||||||||||||||||||||||||||||||||||
| Other comprehensive income | - | (2,287 | ) | 1,763 | 3,513 | (2,448 | ) | - | 541 | - | 541 | 7 | 548 | |||||||||||||||||||||||||||||||
| Comprehensive income | - | (2,287 | ) | 1,763 | 3,513 | (2,448 | ) | - | 541 | 278,290 | 278,831 | 3,641 | 282,472 | |||||||||||||||||||||||||||||||
| Dividends | - | - | - | - | - | - | - | (375,000 | ) | (375,000 | ) | (3,014 | ) | (378,014 | ) | |||||||||||||||||||||||||||||
| (Decrease) increase due to transfers and other changes | (3,141 | ) | - | - | - | 9,509 | 6,368 | (3,910 | ) | 2,458 | - | 2,458 | ||||||||||||||||||||||||||||||||
| (Decrease) increase in equity | - | (5,428 | ) | 1,763 | 3,513 | (2,448 | ) | 9,509 | 6,909 | (100,620 | ) | (93,711 | ) | 627 | (93,084 | ) | ||||||||||||||||||||||||||||
| Equity as of December 31, 2016 | 477,386 | (19,463 | ) | 64 | 3,513 | (4,834 | ) | 7,832 | (12,888 | ) | 1,781,576 | 2,246,074 | 61,198 | 2,307,272 | ||||||||||||||||||||||||||||||
The accompanying notes form an integral part of these consolidated financial statements.
| F- 12 |
Notes to the Consolidated Financial Statements as of December 31, 2018
| Note 1 | Identification and Activities of the Company and Subsidiaries |
| 1.1 | Historical background |
Sociedad Química y Minera de Chile S.A. "SQM" is an open stock corporation founded under the laws of the Republic of Chile and its Chilean Tax Identification Number is 93.007.000-9.
The Company was incorporated through a public deed dated June 17, 1968 by the public notary of Santiago Mr. Sergio Rodríguez Garcés. Its existence was approved by Decree No. 1,164 of June 22, 1968 of the Ministry of Finance, and it was registered on June 29, 1968 in the Registry of Commerce of Santiago, on page 4,537 No. 1,992. SQM’s headquarters are located at El Trovador 4285, Floor 6, Las Condes, Santiago, Chile. The Company's telephone number is +56 2 2425-2000.
The Company is registered with the Commission for Financial Markets (CMF) (formerly the Chilean Superintendence of Securities and Insurance (SVS)) under number 184 of March 18, 1983 and is therefore subject to oversight by that entity.
| 1.2 | Main domicile where the Company performs its production activities |
The Company’s main domiciles are: Calle Dos Sur plot No. 5 - Antofagasta; Arturo Prat 1060 - Tocopilla; Administration Building w/n - Maria Elena; Administration Building w/n Pedro de Valdivia - María Elena, Anibal Pinto 3228 - Antofagasta, Kilometer 1378 Ruta 5 Norte Highway - Antofagasta, Coya Sur Plant w/n - Maria Elena, kilometer 1760 Ruta 5 Norte Highway - Pozo Almonte, Salar de Atacama (Atacama Saltpeter deposit) potassium chloride plant w/n - San Pedro de Atacama, potassium sulfate plant at Salar de Atacama w/n – San Pedro de Atacama, Minsal Mining Camp w/n CL Plant CL, Potassium– San Pedro de Atacama, formerly the Iris Saltpeter office w/n, Commune of Pozo Almonte, Iquique.
| 1.3 | Codes of main activities |
The codes of the main activities as established by the CMF, as follows:
| - | 1700 (Mining) |
| - | 2200 (Chemical products) |
| - | 1300 (Investment) |
| 1.4 | Description of the nature of operations and main activities |
Our products are mainly derived from mineral deposits found in northern Chile. We mine and process caliche ore and brine deposits. The caliche ore in northern Chile contains the only known nitrate and iodine deposits in the world and is the world’s largest commercially exploited source of natural nitrates. The brine deposits of the Salar de Atacama, a salt-encrusted depression in the Atacama Desert in northern Chile, contain high concentrations of lithium and potassium as well as significant concentrations of sulfate and boron.
| F- 13 |
Notes to the Consolidated Financial Statements as of December 31, 2018
| Note 1 | Identification and Activities of the Company and Subsidiaries (continued) |
| 1.4 | Description of the nature of operations and main activities, continued |
From our caliche ore deposits, we produce a wide range of nitrate-based products used for specialty plant nutrients and industrial applications, as well as iodine and iodine derivatives. At the Salar de Atacama, we extract brines rich in potassium, lithium, sulfate and boron in order to produce potassium chloride, potassium sulfate, lithium solutions and bischofite (magnesium chloride). We produce lithium carbonate and lithium hydroxide at our plant near the city of Antofagasta, Chile, from the solutions brought from the Salar de Atacama. We market all of these products through an established worldwide distribution network.
Our products are sold in over 110 countries through our worldwide distribution network, with the majority of our sales derived from countries outside Chile.
Our products are divided into six categories: specialty plant nutrients; iodine and its derivatives; lithium and its derivatives; potassium chloride and potassium sulfate; industrial chemicals and other commodity fertilizers, described as follows:
Specialty plant nutrition: We produce four main types of specialty plant nutrients: potassium nitrate, sodium nitrate, sodium potassium nitrate and specialty blends. We also sell other specialty fertilizers including third party products. All of these specialty plant nutrients are used in either solid or liquid form mainly on high value crops such as vegetables, fruits and flowers. Our nutrients are widely used in crops that employ modern agricultural techniques such as hydroponics, green housing, fertigation (where fertilizer is dissolved in water prior to irrigation) and foliar application. Specialty plant nutrients have certain advantages over commodity fertilizers, such as rapid and effective absorption (without requiring nitrification), superior water solubility, increased soil pH (which reduces soil acidity) and low chloride content. One of the most important products in this business line is potassium nitrate, which is sold in crystalline or prill form, allowing for multiple application methods. Crystalline potassium nitrate products are ideal for application by fertigation and foliar sprays, and potassium nitrate prills are suitable for soil applications.
The new needs of more sophisticated customers demand that the industry provide integrated solutions rather than individual products. Our products, including customized specialty blends that meet specific needs along with the agronomic service provided, allow to create plant nutrition solutions that add value to crops through higher yields and better quality production. Because our products are derived from natural nitrate compounds or natural potassium brines, they have certain advantages over synthetically produced fertilizers, including the presence of certain beneficial trace elements, which makes them more attractive to customers who prefer products of natural origin. As a result, specialty plant nutrients are sold at a premium price compared to commodity fertilizers.
Iodine: We believe that we are the world’s leading producer of iodine and iodine derivatives, which are used in a wide range of medical, pharmaceutical, agricultural and industrial applications, including x-ray contrast media, polarizing films for LCD and LED, antiseptics, biocides and disinfectants, in the synthesis of pharmaceuticals, electronics, pigments and dye components.
| F- 14 |
Notes to the Consolidated Financial Statements as of December 31, 2018
| Note 1 | Identification and Activities of the Company and Subsidiaries (continued) |
| 1.4 | Description of the nature of operations and main activities, continued |
Lithium: We are a leading producer of lithium carbonate, which is used in a variety of applications, including electrochemical materials for batteries, frits for the ceramic and enamel industries, heat-resistant glass (ceramic glass), air conditioning chemicals, continuous casting powder for steel extrusion, primary aluminum smelting process, pharmaceuticals and lithium derivatives. We are also a leading supplier of lithium hydroxide, which is primarily used as an input for the lubricating greases industry and for certain cathodes for batteries.
Industrial chemicals: We produce three industrial chemicals: sodium nitrate, potassium nitrate and potassium chloride. Sodium nitrate is used primarily in the production of glass, explosives, and metal treatment. Potassium nitrate is used in the manufacturing of specialty glass, and it is also an important raw material for the production of frits for the ceramics and enamel industries. Solar salts, a combination of potassium nitrate and sodium nitrate, are used as a thermal storage medium in concentrated solar power plants. Potassium chloride is a basic chemical used to produce potassium hydroxide, and it is also used as an additive in oil drilling as well as in food processing, among other uses. Potassium: We produce potassium chloride and potassium sulfate from brines extracted from the Salar de Atacama. Potassium chloride is a commodity fertilizer used to fertilize a variety of crops including corn, rice, sugar, soybean and wheat. Potassium sulfate is a specialty fertilizer used mainly in crops such as vegetables, fruits and industrial crops.
Other products and services: We also sell other fertilizers and blends, some of which we do not produce. We are the largest company that produces and distributes the three main potassium sources: potassium nitrate, potassium sulfate and potassium chloride. This business line also includes revenue from commodities, services, interests, royalties and dividends.
Our subsidiary SQM Salar holds exclusive rights to exploit the mineral resources in an area covering approximately 140,000 hectares of land in the Salar de Atacama in northern Chile, of which SQM Salar is only entitled to exploit the mineral resources in 81,920 hectares. These rights are owned by Corfo and leased to SQM Salar pursuant to the Lease Agreement. Corfo cannot unilaterally amend the Lease Agreement and the Project Agreement, and the rights to exploit the resources cannot be transferred. The Lease Agreement establishes that SQM Salar is responsible for making quarterly lease payments to Corfo according to specified percentages of the value of production of minerals extracted from the Salar de Atacama brines, maintaining Corfo’s rights over the Mining Exploitation Concessions and making annual payments to the Chilean government for such concession rights. The Lease Agreement was entered into in 1993 and expires on December 31, 2030. On January 17, 2018, SQM and CORFO reached an agreement to end an arbitration process directed by the arbitrator, Mr. Héctor Humeres Noguer, in case 1954-2014 of the Arbitration and Mediation Center of Santiago Chamber of Commerce ( Centro de Arbitrajes y Mediación de la Cámara de Comercio de Santiago ) and other cases related to it.
The agreement signed in January 2018, includes important amendments to the lease agreement and project agreement signed between CORFO and SQM in 1993. The main modifications became effective on April 10, 2018 and requires an increase in the lease payments by increasing the lease rates associated with the sale of the different products produced in the Salar de Atacama, including lithium carbonate, lithium hydroxide and potassium chloride. In regard to lithium carbonate, the former rate of 6.8% on FOB sales was changed to the following structure of progressive rates based on the final sale price:
| Price US$/MT Li2CO3 |
Lease payment rate |
|||
| $0 - $4,000 | 6.8 | % | ||
| $4,000 - $5,000 | 8.0 | % | ||
| $5,000 - $6,000 | 10.0 | % | ||
| $6,000 - $7,000 | 17.0 | % | ||
| $7,000 - $10,000 | 25.0 | % | ||
| > $10,000 | 40.0 | % | ||
| F- 15 |
Notes to the Consolidated Financial Statements as of December 31, 2018
| Note 1 | Identification and Activities of the Company and Subsidiaries (continued) |
| 1.4 | Description of the nature of operations and main activities, continued |
See Note 25.2 for the disclosure of lease payments made to CORFO for all periods presented.
In regard to potassium chloride, the former rate of 1.8% on FOB sales was changed to the following structure of progressive rates based on the final sale price:
| Price US$/MT KCL | Lease payment rate | |||
| $0 - $300 | 3.0 | % | ||
| $300 - $400 | 7.0 | % | ||
| $400 - $500 | 10.0 | % | ||
| $500 - $600 | 15.0 | % | ||
| > $600 | 20.0 | % | ||
Similarly, the lease rates associated with the other products (lithium hydroxide, potassium sulfate and others) shall have similar changes to those described in the previous products.
SQM Salar commits to contribute between US$10.8 and US$18.9 million per year to research and development efforts, between US$10 to US$15 million per year to the communities in close proximity to the Salar de Atacama, and 1.7% of total annual sales of SQM Salar to regional development.
| 1.5 | Other background |
Staff
As of December 31, 2018, and December 31, 2017, the workforce was as follows:
| 12/31/2018 | 12/31/2017 | |||||||||||||||||||||||
| Employees | SQM S.A. |
Other subsidiaries |
Total | SQM S.A. |
Other subsidiaries |
Total | ||||||||||||||||||
| Executives | 33 | 89 | 122 | 43 | 77 | 120 | ||||||||||||||||||
| Professionals | 115 | 1,078 | 1,193 | 143 | 942 | 1,085 | ||||||||||||||||||
| Technicians and operators | 260 | 3,287 | 3,547 | 248 | 3,177 | 3,425 | ||||||||||||||||||
| Foreign employees | 11 | 417 | 428 | 19 | 272 | 291 | ||||||||||||||||||
| Overall total | 419 | 4,871 | 5,290 | 453 | 4,468 | 4,921 | ||||||||||||||||||
| F- 16 |
Notes to the Consolidated Financial Statements as of December 31, 2018
| Note 1 | Identification and Activities of the Company and subsidiaries (continued) |
| 1.5 | Other background, continued |
Main shareholders
The following table shows information about the main shareholders of the Company’s Series A or Series B shares in circulation as of December 31, 2018 and December 31, 2017, in line with information provided by the Central Securities Depository:
The following table presents the information about the beneficial ownership of Series A and Series B shares of the Company as of December 31, 2018 and December 31, 2017, with respect to each shareholder that, to our knowledge, owns more than 5% of the outstanding Series A or Series B shares. The following information is derived from our registry and reports managed by the Central Securities Depository and informed to the CMF and the Chilean Stock Exchanges.
| Shareholder as of December 31, 2018 |
No, of Series A with
ownership |
% of Series A shares |
No, of Series B with
ownership |
% of Series B
shares |
% of total shares | |||||||||||||||
| Inversiones TLC SPA | 62,556,568 | 43.80 | % | - | - | 23.77 | % | |||||||||||||
| Sociedad de Inversiones Pampa Calichera S.A. (*) | 44,894,152 | 31.43 | % | 10,093,154 | 8.38 | % | 20.89 | % | ||||||||||||
| The Bank of New York Mellon, ADRs | - | - | 35,254,267 | 29.29 | % | 13.39 | % | |||||||||||||
| Potasios de Chile S.A. (*) | 18,179,147 | 12.73 | % | - | - | 6.91 | % | |||||||||||||
| Banco de Chile via non-resident third party accounts | 15,687 | 0.01 | % | 10,703,812 | 8.89 | % | 4.07 | % | ||||||||||||
| Inversiones Global Mining (Chile) Limitada (*) | 8,798,539 | 6.16 | % | - | - | 3.34 | % | |||||||||||||
| Banco Itaú through Corpbanca on behalf of foreign investors | - | - | 8,085,730 | 6.72 | % | 3.07 | % | |||||||||||||
| Banco Santander via foreign investor accounts | - | - | 7,138,685 | 5.93 | % | 2.71 | % | |||||||||||||
| Banchile C de B S A | 528,092 | 0.37 | % | 4,028,611 | 3.35 | % | 1.73 | % | ||||||||||||
| Inversiones la Esperanza de Chile Limitada | 3,711,598 | 2.60 | % | 46,500 | 0.04 | % | 1.43 | % | ||||||||||||
(*) Total Pampa Group 32% (2.247.895 Series B shares are in the custody of different brokers).
| Shareholder as of December 31, 2017 |
No, of Series A with
ownership |
% of Series A shares |
No, of Series B with
ownership |
% of Series B
shares |
% of total shares | |||||||||||||||
| The Bank of New York Mellon, ADRs | - | - | 54,599,961 | 45.36 | % | 20.74 | % | |||||||||||||
| Sociedad de Inversiones Pampa Calichera S.A. (*) | 44,894,152 | 31.43 | % | 7,007,688 | 5.82 | % | 19.72 | % | ||||||||||||
| Inversiones El Boldo Limitada | 29,330,326 | 20.54 | % | 16,363,546 | 13.59 | % | 17.36 | % | ||||||||||||
| Inversiones RAC Chile Limitada | 19,200,242 | 13.44 | % | 2,202,773 | 1.83 | % | 8.13 | % | ||||||||||||
| Potasios de Chile S.A. (*) | 18,179,147 | 12.73 | % | - | - | 6.91 | % | |||||||||||||
| Inversiones PCS Chile Limitada | 15,526,000 | 10.87 | % | 1,600,000 | 1.33 | % | 6.51 | % | ||||||||||||
| Inversiones Global Mining (Chile) Limitada (*) | 8,798,539 | 6.16 | % | - | - | 3.34 | % | |||||||||||||
| Banco de Chile via non-resident third party accounts | - | - | 8,394,289 | 6.97 | % | 3.19 | % | |||||||||||||
| Banco Itau via Investor Accounts | 19,125 | 0.01 | % | 7,017,504 | 5.83 | % | 2.67 | % | ||||||||||||
| Banco Santander via foreign investor accounts | - | - | 4,593,336 | 3.82 | % | 1.75 | % | |||||||||||||
(*) Total Pampa Group 29,97%
On December 31, 2018 the total number of shareholders had risen to 1,508.
| F- 17 |
Notes to the Consolidated Financial Statements as of December 31, 2018
| Note 2 | Basis of presentation for the consolidated financial statements |
| 2.1 | Accounting period |
These consolidated financial statements cover the following periods:
| - | Consolidated Statements of Financial Position as of December 31, 2018 and, 2017. |
| - | Consolidated Statements of Changes in Equity for the three years ended December 31, 2018. |
| - | Consolidated Statements of Comprehensive Income for the three years ended December 31, 2018. |
| - | Consolidated Statements of Direct-Method Cash Flows for the three years ended December 31, 2018. |
| 2.2 | Consolidated financial statements |
The consolidated financial statements of Sociedad Química y Minera de Chile S.A. and its Subsidiaries were prepared in accordance with International Financial Reporting Standards (hereinafter “IFRS”) and represent the full, explicit and unreserved adoption of International Financial Reporting Standards as issued by the International Accounting Standards Board (the “IASB”).
These consolidated financial statements fairly present the Company’s financial position as of December 31, 2018 and 2017, and the results of operations and cash flows for each of the three years in the period ended on December 31, 2018.
IFRS establish certain alternatives for their application. Those applied by the Company are detailed in this Note.
| F- 18 |
Notes to the Consolidated Financial Statements as of December 31, 2018
| Note 2 | Basis of presentation for the consolidated financial statements (continued) |
| 2.2 | Consolidated financial statements, continued |
The accounting policies used in the preparation of these consolidated annual accounts comply with each IFRS in force at their date of presentation.
For the closing date of these consolidated financial statements certain reclassifications have been made for the captions other non-current financial assets, Intangible assets other than goodwill, Goodwill as of December 31, 2017 to correct the prior year presentation. These revisions were not considered material to the previously issued financial statements.
A reconciliation of such differences is presented as follows:
|
Balances originally
reported as of December 31, 2017 |
Reclassified
balances as of December 31, 2017 |
Reclassification | ||||||||||
| ThUS$ | ThUS$ | ThUS$ | ||||||||||
| Assets | ||||||||||||
| Investments classified using the equity method of accounting | 146,425 | 152,630 | 6,205 | |||||||||
| Intangible assets other than goodwill | 105,948 | 113,787 | 7,839 | |||||||||
| Goodwill | 44,177 | 37,972 | (6,205 | ) | ||||||||
| Property, plant and equipment | 1,437,193 | 1,429,354 | (7,839 | ) | ||||||||
| Total | 1,733,743 | 1,733,743 | - | |||||||||
In addition, revisions were made to notes 19 and 26.
| F- 19 |
Notes to the Consolidated Financial Statements as of December 31, 2018
| Note 2 | Basis of presentation for the consolidated financial statements (continued) |
| 2.3 | Basis of measurement |
The consolidated financial statements have been prepared on the historical cost basis except for the following:
| - | Inventories are recorded at the lower of cost and net realizable value. |
| - | Financial derivatives at fair value; and |
| - | Staff severance indemnities and pension commitments at actuarial value |
| - | Certain financial investments classified as available for sale measured at fair through other comprehensive income. |
| - | Other current and non-current assets and financial liabilities at amortized cost |
| F- 20 |
Notes to the Consolidated Financial Statements as of December 31, 2018
| Note 2 | Basis of presentation for the consolidated financial statements (continued) |
| 2.4 | Accounting pronouncements |
New accounting pronouncements
a) The following standards, interpretations and amendments are mandatory for the first time for annual periods beginning on January 1, 2018:
| Standards and Interpretations |
Mandatory for annual
periods beginning on or after |
|
| IFRS 9 Financial Instruments - Published in July 2014. The IASB published the complete version of IFRS 9, which replaces the guidance in IAS 39. This final version includes requirements regarding the classification and measurement of financial assets and liabilities and a new model for the recognition of expected credit losses that replaces the incurred loss impairment model used today. It also includes the final hedging part of IFRS 9 that was issued in November 2013. | 01/01/2018 | |
| IFRS 15 Revenue from Contracts with Customers – Published in May 2014. This standard establishes principles for reporting useful information to users of financial statements about the nature, amount, timing and uncertainty of revenue and cash flows arising from an entity's contracts with customers. The core principle is that an entity recognizes revenue to depict the transfer of promised goods or services to customers in an amount that reflects the consideration to which the entity expects to be entitled in exchange for those goods or services. It replaces IAS 11 Construction Contracts; IAS 18 Revenue; IFRIC 13 Customer Loyalty Programmes; IFRIC 15 Agreements for the Construction of Real Estate; IFRIC 18 Transfers of Assets from Customers; and SIC-31 Revenue-Barter Transactions Involving Advertising Services. | 01/01/2018 | |
| IFRIC 22 “Foreign Currency Transactions and Advance Consideration”. Published in December 2016. This Interpretation applies to a foreign currency transaction (or part of one) if an entity recognizes a non-financial asset or non-financial liability arising from the payment or receipt of an advance consideration prior to the entity recognizing the related asset, expense or income (or the applicable portion thereof). The interpretation provides a guideline for the transaction date to be used for both single payments/receipts and situations when there are multiple payments/receipts. Its objective is to reduce diversity in practice. | 01/01/2018 |
| Amendments and improvements |
Mandatory for annual
periods beginning on or after |
|
| Amendment to IFRS 2 Share-based Payments. Published in June 2016. The amendment clarifies the measurement basis for cash-settled, share-based payments and the accounting for modifications that change an award from cash-settled to equity-settled. It also introduces an exception to the principles in IFRS 2 that will require an award to be treated as if it was wholly equity-settled, where an employer is obliged to withhold an amount for the employee’s tax obligation associated with a share-based payment. | 01/01/2018 | |
| Amendment to IFRS 15 “Revenue from Contracts with Customers”. Published in April 2016. The amendment provides clarifications with regard to identifying performance obligations in contracts with customers, accounting for licensing involving intellectual property and assessing principal versus agent considerations (i.e. recording revenue on a gross basis versus the net amount it retains). New and amended illustrative examples have been added for each of those areas of guidance, as well as additional practical expedients related to transition to the new revenue standard. | 01/01/2018 | |
| Amendment to IAS 28 “Investments in Associates and Joint Ventures” in regard to measuring an associate or joint venture at fair value. Published in December 2016. | 01/01/2018 |
| F- 21 |
Notes to the Consolidated Financial Statements as of December 31, 2018
| Note 2 | Basis of presentation for the consolidated financial statements (continued) |
| 2.4 | Accounting pronouncements, continued |
b) Standards, interpretations and amendments issued that had not become effective for financial statements beginning on January 1, 2018 and which the Company has not adopted early are as follows:
| Standards and Interpretations |
Mandatory
for annual
periods beginning on or after |
|
|
On January 13, 2016, the IASB published IFRS 16 Leases. IFRS 16 introduces a comprehensive model to identify lease agreements and accounting treatments for both lessees and lessors. When the application of IFRS 16 goes into effect, it will replace the current lease guidelines including IAS 17 Leases and the related interpretations.
IFRS 16 makes a distinction between leases and service contracts based on the fact that an identified asset is controlled by an entity. Under IAS 17, the distinction between operating leases (outside the statement of financial position) and financial leases is removed for the accounting of the lessees, and is replaced by a model where an right-of-use asset and the corresponding liability must be recognized by lessees for all leases, except short-term leases and low-value asset leases.
The right-of-use asset is initially measured at cost and subsequently measured at cost (subject to certain exceptions) less accumulated depreciation and impairment losses, adjusted by any remeasurement of the lease liability. The lease liability is initially measured at the present value of the lease payments that have not been paid as of that date. Subsequently, the lease liability is adjusted for interest and lease payments, as well as lease modifications, among others. In addition, the classification of cash flows will also be affected considering that under IAS 17, operating lease payments are presented as operating cash flows; while under the IFRS 16 model, lease payments will be divided between the portion of principal and interest payments, which will be presented as financing and operating cash flows or financing, respectively.
In contrast to accounting for lessees, IFRS 16 substantially maintains the accounting requirements of IAS 17 for lessors, and continues to require lessees to classify leases as either operating or financial leases.
Additionally, IFRS 16 requires more extensive disclosures.
IFRS 16 is effective for annual periods beginning on or after January 1, 2019. Early application is permitted for entities that apply IFRS 15 on or before the initial application of IFRS 16. Entities can apply IFRS 16 using either a retrospective full application approach or a modified retrospective application approach. If the latter approach is chosen, an entity is not required to restate comparative financial information and the cumulative effect of the initial application of IFRS 16 must be presented as an adjustment to the initial balance of retained earnings (or other equity component, when appropriate). |
01/01/2019 |
| F- 22 |
Notes to the Consolidated Financial Statements as of December 31, 2018
| Note 2 | Basis of presentation for the consolidated financial statements (continued) |
| 2.4 | Accounting pronouncements, continued |
| Standards and Interpretations |
Mandatory for annual periods
beginning on or after |
|
| IFRIC 23 Uncertainty over Income Tax Treatments. Published in June 2016. This interpretation clarifies how to apply the recognition and measurement requirements in IAS 12, when there is uncertainty over income tax treatments. | 01/01/2019 |
| Amendments and improvements |
Mandatory for annual periods
beginning on or after |
|
| Amendment to IFRS 9 “Financial Instruments”. Published in October 2017. The amendment permits more assets to be measured at amortized cost than under the previous version of IFRS 9, in particular some prepayable financial assets with negative compensation. The assets affected, which include some loans and debt securities, would otherwise have been measured at fair value through profit and loss (FVTPL). For them to qualify for amortized cost measurement, the negative compensation must be “reasonable compensation for early termination of the contract.” | 01/01/2019 | |
| Amendment to IAS 28 “Investments in Associates and Joint Ventures” Published in October 2017. This amendment clarifies that companies should apply IFRS 9 to account for long-term interests in an associate or joint venture to which the equity method is not applied. The Board IASB has published an example that illustrates how companies should apply the requirements of IFRS 9 and IAS 28 to long-term interests in an associate or joint venture. | 01/01/2019 | |
| Amendment to IFRS 3 “Business Combinations” Published in December 2017. The amendment clarified that gaining control of a company that is a joint venture deals with a business combination that is achieved in stages. The acquirer must remeasure previously held interests in that business at fair value at the date of acquisition. | 01/01/2019 | |
| Amendment to IFRS 11 “Joint Arrangements” Published in December 2017. The amendment clarified that when an entity obtains joint control of a business that is a joint operation, the entity does not remeasure previously held interests in that business. | 01/01/2019 | |
| Amendment to IAS 12 Income Taxes - Published in December 2017. This modification clarified that the income tax consequences of dividends on financial instruments classified as equity should be recognized when the past transactions or events that generated distributable profits were originally recognized | 01/01/2019 | |
| Amendment to IFRS 23 “Loan Costs” Published in December 2017. This amendment clarifies that the borrowing costs of specific borrowings that remain outstanding after the related qualifying asset is ready for intended use or for sale will be considered as part of the general borrowing costs of the entity. | 01/01/2019 | |
| Amendment to IAS 19 Employee Benefits - Published in February 2018. The amendment requires entities to use updated assumptions to determine the current service cost and net interest for the remainder of the period after a modification, reduction or settlement of the plan; and to recognize in profit or loss as part of the cost of the past service, or a profit or loss in the settlement, any reduction in a surplus, even if that surplus was not previously recognized because it did not exceed the upper limit of the asset. | 01/01/2019 |
| F- 23 |
Notes to the Consolidated Financial Statements as of December 31, 2018
| Note 2 | Basis of presentation for the consolidated financial statements (continued) |
| 2.4 | Accounting pronouncements, continued |
| Amendments and improvements |
Mandatory for annual periods
beginning on or after |
|
| Amendment to IFRS 3 “Definition of a business” Published in October 2018. This amendment revises the definition of a business. Based on the feedback received by the IASB, the application of the current guidance is frequently seen as too complex, and results in too many transactions that qualify as business combinations. | 01/01/2020 | |
| The following amendment was issued by the IASB and was originally scheduled to take effect in 2016. However, the organization has changed its position and the mandatory effective date is yet to be determined. | ||
Management believes the adoption of the standards, interpretations and amendments applicable as of Tuesday, January 1, 2019, will have no significant impact on the Company’s financial statements.
IFRS 16, Leases
The Company is currently preparing its assessment of the impact of the adoption of IFRS 16. The initial application method of the aforementioned standard chosen by the Company is the modified retrospective approach for which comparatives will not be restated.
For contracts qualified as leases under IFRS 16, the following right-of-use assets, among others, are potentially identified: trucks, cranes, excavators, facilities (buildings, warehouses, shops, land), where SQM has the power (control) to direct their activities and to use them during contract term, without the supplier changing the operating instructions.
| F- 24 |
Notes to the Consolidated Financial Statements as of December 31, 2018
| Note 2 | Basis of presentation for the consolidated financial statements (continued) |
| 2.4 | Accounting pronouncements, continued |
IFRS 15 - Revenue from Contracts with Customers
For the adoption of IFRS 15 - Revenue from Contracts with Customers, the Company undertook a detailed assessment of its performance obligations underlying revenue recognition, such as the performance obligation to transport products to customers, in line with the terms and conditions previously established in contracts and there is no significant impact - the performance obligation has been satisfied. With regard to products invoiced with a deferred shipment date, the transfer of control has been assessed over and above the transfer of risks and benefits established in the previous standard and a prepayment is estimated in revenue recognition, without a significant impact. Other considerations were also assessed, such as rebates, discounts, guarantees, financing components and product personalization. Based on this analysis, the Company has concluded that no impact nor significant changes were recognized as a result of applying this new standard, except for the impact on disclosures. The adoption of IFRS 15 was based on the modified retrospective approach for which comparatives were not restated.
IFRS 9, Financial Instruments
|IFRS 9 establishes the requirements for the recognition and measurement of financial assets, financial liabilities and certain
contracts for the purchase or sale of non-financial items. This standard replaces IAS 39 Financial Instruments: Recognition
and Measurement
Classification and measurement of financial assets and financial liabilities
IFRS 9 includes three main classification categories for financial assets: measured at amortized cost, at fair value through changes in other comprehensive income (FVTOCI), and at fair value through profit or loss (FVTPL). The classification of financial assets under IFRS 9 is based on the business model in which a financial asset is managed and its contractual cash flow characteristics. IFRS 9 eliminates the previous categories of IAS 39 from held-to-maturity, loans and receivables and available-for-sale.
| F- 25 |
Notes to the Consolidated Financial Statements as of December 31, 2018
| Note 2 | Basis of presentation for the consolidated financial statements (continued) |
| 2.4 | Accounting pronouncements, continued |
The following is a summary with the classification, measurement and effects by the application of IFRS 9:
| Financial Assets |
Measurement
Category under IAS 39 |
Measurement
category under IFRS 9 |
12/31/2017
Total Amount ThUS$ |
IFRS 9
Adjustment ThUS$ |
01/01/2018
Total Amount Restated ThUS$ |
|||||||||||
| Description of financial current assets | ||||||||||||||||
| Cash and cash equivalent | Amortized cost | Amortized cost | 630,438 | - | 630,438 | |||||||||||
| Trade receivables due from related parties | Amortized cost | Amortized cost | 59,132 | - | 59,132 | |||||||||||
| Financial assets measured at amortized cost | Amortized cost | Amortized cost | 360,941 | - | 360,941 | |||||||||||
| Loans and receivables measured at amortized cost | Amortized cost | Amortized cost | 446,875 | (2,301 | ) | 444,574 | ||||||||||
| Derivatives held for trading at fair value through profit or loss | FVTPL | FVTPL | 6,038 | - | 6,038 | |||||||||||
| Non-current Assets | ||||||||||||||||
| Financial assets | Amortized cost | Amortized cost | 45 | - | 45 | |||||||||||
| Loans and receivables | Amortized cost | Amortized cost | 1,912 | - | 1,912 | |||||||||||
| Derivatives for hedging purposes | FVTOCI | FVTOCI | 8,910 | - | 8,910 | |||||||||||
| Financial assets classified as available for sale at fair value through equity | Irrevocable FVTOCI | FVTOCI | 33,924 | - | 33,924 | |||||||||||
| Total IFRS 9 Adjustment | (2,301 | ) | ||||||||||||||
| F- 26 |
Notes to the Consolidated Financial Statements as of December 31, 2018
| Note 2 | Basis of presentation for the consolidated financial statements (continued) |
| 2.4 | Accounting pronouncements, continued |
| Financial Liabilities |
Measurement
Category under IAS 39 |
Measurement
category under IFRS 9 |
12/31/2017
Total Amount ThUS$ |
IFRS 9
Adjustment ThUS$ |
01/01/2018
Total Amount Restated ThUS$ |
|||||||||||
| Description of financial Current liabilities | ||||||||||||||||
| Accounts payable to related entities | Amortized cost | Amortized cost | 1,365 | 1,365 | ||||||||||||
| Derivatives for hedging purposes | FVTOCI | FVTOCI | 37,287 | 37,287 | ||||||||||||
| Derivatives at fair value through profit or loss | FVTOCI | FVTPL | 5,979 | 5,979 | ||||||||||||
| Bank loans | Amortized cost | Amortized cost | 163,568 | 163,568 | ||||||||||||
| Obligations to the public | Amortized cost | Amortized cost | 13,494 | 13,494 | ||||||||||||
| Financial liabilities at amortized cost (trade and other payables) | Amortized cost | Amortized cost | 196,280 | 196,280 | ||||||||||||
| Financial Liabilities Non-Current | ||||||||||||||||
| Obligations to the public | Amortized cost | Amortized cost | 1,031,507 | 1,031,507 | ||||||||||||
| Financial liabilities at amortized cost (trade and other payables) | Amortized cost | Amortized cost | - | - | ||||||||||||
| Deferred tax liabilities | 205,904 | (621 | ) | 205,283 | ||||||||||||
| Equity | ||||||||||||||||
| Total equity | 2,247,468 | (1,680 | ) | 2,245,788 | ||||||||||||
| Total IFRS 9 Adjustment | (2.301 | ) | ||||||||||||||
| F- 27 |
Notes to the Consolidated Financial Statements as of December 31, 2018
| Note 2 | Basis of presentation for the consolidated financial statements (continued) |
| 2.4 | Accounting pronouncements, continued |
No changes were made to financial liabilities regarding classification and measurement as a result of the adoption of IFRS 9.
IFRS 9 introduces a new model of deterioration losses on financial assets, the expected credit loss model, which replaces the loss model incurred under IAS 39. The Company applies the simplified approach described by IFRS 9 for financial losses. expected credit losses of the account portfolio receivable from customers, as they are short-term financial instruments less than 12 months, without a significant financing component and which are held until maturity. This approach allows the use of the estimated credit losses expected over the life of the instrument.
Accounts receivable with a low probability of recovery are fully provisioned, while, to measure the expected credit losses of the
rest of the portfolio, it is segmented by grouping the commercial accounts receivable based on the characteristics of shared credit
risk, and delinquency. The expected loss rates are obtained based on the default rates of the last seven years. To convert the
historical loss into projected loss, the behavior of the implicit default probability indicator is used in the prices of financial
derivatives that cover the risk of non-payment of sovereign bonds in those countries where the Company generates income from the
sale of the product.
The application of IFRS 9 had an impact on January 1, 2018 due to the application of the new deterioration model described in the Company's Consolidated Financial Statements of ThUS $ 2,301 (net of deferred taxes ThUS $ 1680), of greater deterioration this amount was taken to equity according to IAS 8. (See Note 13.2).
In addition, as a result of the adoption of IFRS 9, a reclassification was made to present gains on reversal (losses) on impairment of financial assets separately from other expenses as function. The corresponding reclassifications for prior periods are described below:
|
Balances
originally reported as of December 31, 2017 |
Reclassified
balances as of December 31, 2017 |
Reclassification as of
December 31, 2017 |
||||||||||
| ThUS$ | ThUS$ | ThUS$ | ||||||||||
| Expenses | ||||||||||||
| Other expenses by function | (61,638 | ) | (53,600 | ) | 8,038 | |||||||
| Net gains on reversal (losses) on impairment of financial assets | - | (8,038 | ) | (8,038 | ) | |||||||
| Total | (61,638 | ) | (61,638 | ) | - | |||||||
|
Balances
originally reported as of December 31, 2016 |
Reclassified
balances as of December 31, 2016 |
Reclassification as
of December 31, 2016 |
||||||||||
| ThUS$ | ThUS$ | ThUS$ | ||||||||||
| Expenses | ||||||||||||
| Other expenses by function | (89,731 | ) | (82,533 | ) | 7,198 | |||||||
| Net gains on reversal (losses) on impairment of financial assets | - | (7,198 | ) | (7,198 | ) | |||||||
| Total | (89,731 | ) | (89,731 | ) | - | |||||||
| F- 28 |
Notes to the Consolidated Financial Statements as of December 31, 2018
| Note 2 | Basis of presentation for the consolidated financial statements (continued) |
| 2.5 | Basis of consolidation |
(a) Subsidiaries
These are all those entities where Sociedad Química y Minera de Chile S.A. has control over directing their financial and operational policies. This is generally accompanied by a share of more than half of the voting rights. Subsidiaries apply the same accounting policies of their Parent.
To account for the acquisition, the Company uses the acquisition method. Under this method the acquisition cost is the fair value of assets delivered, equity securities issued, and liabilities incurred or assumed at the date of exchange. Identifiable assets acquired, and liabilities and contingencies assumed in a business combination are measured initially at fair value at the acquisition date. For each business combination, the Company will measure non-controlling interest of the acquiree either at fair value or as proportional share of net identifiable assets of the acquiree. For more information, please see Note 8.1.
Companies included in consolidation:
| Ownership interest | ||||||||||||||||||||||
| TAX ID | Country of | 12/31/2018 | 12/31/2017 | |||||||||||||||||||
| No. | Foreign subsidiaries | origin | Functional currency | Direct | Indirect | Total | Total | |||||||||||||||
| Foreign | Nitratos Naturais Do Chile Ltda, | Brazil | US$ | 0.0000 | 100.0000 | 100.0000 | 100.0000 | |||||||||||||||
| Foreign | Nitrate Corporation Of Chile Ltd, | United Kingdom | US$ | 0.0000 | 100.0000 | 100.0000 | 100.0000 | |||||||||||||||
| Foreign | SQM North America Corp, | USA | US$ | 40.0000 | 60.0000 | 100.0000 | 100.0000 | |||||||||||||||
| Foreign | SQM Europe N.V. | Belgium | US$ | 0.5800 | 99.4200 | 100.0000 | 100.0000 | |||||||||||||||
| Foreign | Soquimich S.R.L. Argentina | Argentina | US$ | 0.0000 | 100.0000 | 100.0000 | 100.0000 | |||||||||||||||
| Foreign | Soquimich European Holding B.V. | Netherlands | US$ | 0.0000 | 100.0000 | 100.0000 | 100.0000 | |||||||||||||||
| Foreign | SQM Corporation N.V. | Netherlands | US$ | 0.0002 | 99.9998 | 100.0000 | 100.0000 | |||||||||||||||
| Foreign | SQI Corporation N.V. | Netherlands | US$ | 0.0159 | 99.9841 | 100.0000 | 100.0000 | |||||||||||||||
| Foreign | SQM Comercial De México S.A. de C.V. | Mexico | US$ | 0.0100 | 99.9900 | 100.0000 | 100.0000 | |||||||||||||||
| Foreign | North American Trading Company | USA | US$ | 0.0000 | 100.0000 | 100.0000 | 100.0000 | |||||||||||||||
| Foreign | Administración y Servicios Santiago S.A. de C.V. | Mexico | US$ | 0.0000 | 100.0000 | 100.0000 | 100.0000 | |||||||||||||||
| Foreign | SQM Peru S.A. | Peru | US$ | 0.9800 | 99.0200 | 100.0000 | 100.0000 | |||||||||||||||
| Foreign | SQM Ecuador S.A. | Ecuador | US$ | 0.0040 | 99.9960 | 100.0000 | 100.0000 | |||||||||||||||
| Foreign | SQM Nitratos Mexico S.A. de C.V. | Mexico | US$ | 0.0000 | 100.0000 | 100.0000 | 100.0000 | |||||||||||||||
| Foreign | SQMC Holding Corporation L.L.P. | USA | US$ | 0.1000 | 99.9000 | 100.0000 | 100.0000 | |||||||||||||||
| Foreign | SQM Investment Corporation N.V. | Netherlands | US$ | 1.0000 | 99.0000 | 100.0000 | 100.0000 | |||||||||||||||
| Foreign | SQM Brasil Limitada | Brazil | US$ | 1.0900 | 98.9100 | 100.0000 | 100.0000 | |||||||||||||||
| Foreign | SQM France S.A. | France | US$ | 0.0000 | 100.0000 | 100.0000 | 100.0000 | |||||||||||||||
| Foreign | SQM Japan Co. Ltd. | Japan | US$ | 0.1597 | 99.8403 | 100.0000 | 100.0000 | |||||||||||||||
| Foreign | Royal Seed Trading Corporation A.V.V. | Aruba | US$ | 1.6700 | 98.3300 | 100.0000 | 100.0000 | |||||||||||||||
| Foreign | SQM Oceania Pty Limited | Australia | US$ | 0.0000 | 100.0000 | 100.0000 | 100.0000 | |||||||||||||||
| Foreign | Rs Agro-Chemical Trading Corporation A.V.V. | Aruba | US$ | 98.3333 | 1.6667 | 100.0000 | 100.0000 | |||||||||||||||
| Foreign | SQM Colombia SAS | Colombia | US$ | 0.0000 | 100.0000 | 100.0000 | 100.0000 | |||||||||||||||
| Foreign | SQM Australia PTY | Australia | Australian dollar | 0.0000 | 100.0000 | 100.0000 | 100.0000 | |||||||||||||||
| Foreign | SACAL S.A. | Argentina | Argentine peso | 0.0000 | 100.0000 | 100.0000 | 100.0000 | |||||||||||||||
| F- 29 |
Notes to the Consolidated Financial Statements as of December 31, 2018
| Note 2 | Basis of presentation for the consolidated financial statements (continued) |
| 2.5 | Basis of consolidation, continued |
| Ownership interest | ||||||||||||||||||||||
| TAX ID | Country | 12/31/2018 | 12/31/2017 | |||||||||||||||||||
| No. | Foreign subsidiaries | of origin | Functional currency | Direct | Indirect | Total | Total | |||||||||||||||
| Foreign | SQM Indonesia S.A. | Indonesia | US$ | 0.0000 | 80.0000 | 80.0000 | 80.0000 | |||||||||||||||
| Foreign | SQM Virginia L.L.C. | USA | US$ | 0.0000 | 100.0000 | 100.0000 | 100.0000 | |||||||||||||||
| Foreign | SQM Italia SRL | Italy | US$ | 0.0000 | 100.0000 | 100.0000 | 100.0000 | |||||||||||||||
| Foreign | Comercial Caimán Internacional S.A. | Panama | US$ | 0.0000 | 100.0000 | 100.0000 | 100.0000 | |||||||||||||||
| Foreign | SQM Africa Pty. | South Africa | US$ | 0.0000 | 100.0000 | 100.0000 | 100.0000 | |||||||||||||||
| Foreign | SQM Lithium Specialties LLC | USA | US$ | 0.0000 | 100.0000 | 100.0000 | 100.0000 | |||||||||||||||
| Foreign | SQM Iberian S.A. | Spain | US$ | 0.0000 | 100.0000 | 100.0000 | 100.0000 | |||||||||||||||
| Foreign | SQM Beijing Commercial Co. Ltd. | China | US$ | 0.0000 | 100.0000 | 100.0000 | 100.0000 | |||||||||||||||
| Foreign | SQM Thailand Limited | Thailand | US$ | 0.0000 | 99.996 | 99.996 | 99.996 | |||||||||||||||
| Foreign | SQM Internacional N.V. | Belgium | US$ | 0.5800 | 99.4200 | 100.0000 | 0.0000 | |||||||||||||||
| Foreign | SQM (Shanghai) Chemicals Co. Ltd. | China | US$ | 0.0000 | 100.0000 | 100.0000 | 0.0000 | |||||||||||||||
| Ownership interest | ||||||||||||||||||||||
| TAX ID | Country | 12/31/2018 | 12/31/2017 | |||||||||||||||||||
| No. | Domestic subsidiaries | of origin | Functional currency | Direct | Indirect | Total | Total | |||||||||||||||
| 96.801.610-5 | Comercial Hydro S.A. | Chile | US$ | 0,0000 | 60,6383 | 60,6383 | 60,6383 | |||||||||||||||
| 96.651.060-9 | SQM Potasio S.A. | Chile | US$ | 99,9999 | 0,0000 | 99,9999 | 99,9999 | |||||||||||||||
| 96.592.190-7 | SQM Nitratos S.A. | Chile | US$ | 99,9999 | 0,0001 | 100,0000 | 100,0000 | |||||||||||||||
| 96.592.180-K | Ajay SQM Chile S.A. | Chile | US$ | 51,0000 | 0,0000 | 51,0000 | 51,0000 | |||||||||||||||
| 86.630.200-6 | SQMC Internacional Ltda. | Chile | Ch$ | 0,0000 | 60,6381 | 60,6381 | 60,6381 | |||||||||||||||
| 79.947.100-0 | SQM Industrial S.A. | Chile | US$ | 99,0470 | 0,9530 | 100,0000 | 100,0000 | |||||||||||||||
| 79.906.120-1 | Isapre Norte Grande Ltda. | Chile | Ch$ | 1,0000 | 99,0000 | 100,0000 | 100,0000 | |||||||||||||||
| 79.876.080-7 | Almacenes y Depósitos Ltda. | Chile | Ch$ | 1,0000 | 99,0000 | 100,0000 | 100,0000 | |||||||||||||||
| 79.770.780-5 | Servicios Integrales de Tránsitos y Transferencias S.A. | Chile | US$ | 0,0003 | 99,9997 | 100,0000 | 100,0000 | |||||||||||||||
| 79.768.170-9 | Soquimich Comercial S.A. | Chile | US$ | 0,0000 | 60,6383 | 60,6383 | 60,6383 | |||||||||||||||
| 79.626.800-K | SQM Salar S.A. | Chile | US$ | 18,1800 | 81,8200 | 100,0000 | 100,0000 | |||||||||||||||
| 78.053.910-0 | Proinsa Ltda. | Chile | Ch$ | 0,0000 | 60,5800 | 60,5800 | 60,5800 | |||||||||||||||
| 76.534.490-5 | Sociedad Prestadora de Servicios de Salud Cruz del Norte S.A. | Chile | Ch$ | 0,0000 | 100,0000 | 100,0000 | 100,0000 | |||||||||||||||
| 76.425.380-9 | Exploraciones Mineras S.A. | Chile | US$ | 0,2691 | 99,7309 | 100,0000 | 100,0000 | |||||||||||||||
| 76.064.419-6 | Comercial Agrorama Ltda. (a) | Chile | Ch$ | 0,0000 | 42,4468 | 42,4468 | 42,4468 | |||||||||||||||
| 76.145.229-0 | Agrorama S.A. | Chile | Ch$ | 0,0000 | 60,6377 | 60,6377 | 60,6377 | |||||||||||||||
| 76.359.919-1 | Orcoma Estudios SPA | Chile | US$ | 51,0000 | 0,0000 | 51,0000 | 51,0000 | |||||||||||||||
| 76.360.575-2 | Orcoma SPA | Chile | US$ | 100,0000 | 0,0000 | 100,0000 | 100,0000 | |||||||||||||||
| 76.686.311-9 | SQM MaG SpA. | Chile | US$ | 0,0000 | 100,0000 | 100,0000 | 100,0000 | |||||||||||||||
| (a) | The Company consolidated Comercial Agrorama Ltda. as it has the control of this company’s relevant activities. |
| F- 30 |
Notes to the Consolidated Financial Statements as of December 31, 2018
| Note 2 | Basis of presentation for the consolidated financial statements (continued) |
| 2.5 | Basis of consolidation, continued |
Subsidiaries are consolidated using the line-by-line method, adding the items that represent assets, liabilities, revenues, and expenses of similar content, and eliminating those related to intragroup transactions.
Profit or loss of subsidiaries acquired or divested during the year are included in profit or loss accounts consolidated from the date control is transferred to the Group, or up to the date control is lost, as applicable.
Non-controlling interest represents the equity of a subsidiary not directly or indirectly attributable to the Parent.
| F- 31 |
Notes to the Consolidated Financial Statements as of December 31, 2018
| Note 3 | Significant accounting policies |
| 3.1 | Classification of balances as current and non-current |
In the attached consolidated statement of financial position, balances are classified in consideration of their recovery (maturity) dates; i.e. those maturing within a period equal to or less than 12 months are classified as current counted from the closing date of the consolidated financial statements and those with maturity dates exceeding the aforementioned period are classified as non-current.
The exception to the foregoing relates to deferred taxes, which are classified as non-current, regardless of the maturity they have.
| 3.2 | Functional and presentation currency |
The Company’s consolidated financial statements are presented in United States dollars (“U.S. dollars”), which is the Company’s functional and presentation currency and is the currency of the main economic environment in which it operates.
Consequently, the term foreign currency is defined as any currency other than the U.S. dollar.
The consolidated financial statements are presented in thousands of United States dollars without decimals.
| 3.3 | Foreign currency translation |
(a) Group entities:
The revenue, expenses, assets and liabilities of all entities that have a functional currency other than the presentation currency are converted to the presentation currency as follows:
| - | Assets and liabilities are converted at the closing exchange rate prevailing on the reporting date. |
| - | Revenues and expenses of each profit or loss account are converted at monthly average exchange rates. |
| - | All resulting foreign currency translation gains and losses are recognized as a separate component in translation reserves. |
In consolidation, foreign currency differences arising from the translation of a net investment in foreign entities are recorded in equity (other reserves). At the date of disposal, such foreign currency translation differences are recognized in the statement of income as part of the gain or loss from the sale.
| F- 32 |
Notes to the Consolidated Financial Statements as of December 31, 2018
| Note 3 | Significant accounting policies (continued) |
| 3.3 | Foreign currency translation, continued |
The main exchange rates and the adjustment unit used to translate monetary assets and liabilities, expressed in foreign currency at the end of each period in respect to U.S. dollars, are as follows:
| 12/31/2018 | 12/31/2017 | |||||||
| US$ | US$ | |||||||
| Brazilian real | 3.87 | 3.02 | ||||||
| New Peruvian sol | 3.37 | 3.08 | ||||||
| Argentine peso | 37.74 | 18.40 | ||||||
| Japanese yen | 110.38 | 113.00 | ||||||
| Euro | 0.87 | 0.83 | ||||||
| Mexican peso | 19.68 | 19.65 | ||||||
| Australian dollar | 1.42 | 1.28 | ||||||
| Pound Sterling | 0.79 | 0.74 | ||||||
| South African rand | 14.35 | 12.35 | ||||||
| Ecuadorian dollar | 1.00 | 1.00 | ||||||
| Chilean peso | 694.77 | 614.75 | ||||||
| Chinese yuan | 6.88 | 6.51 | ||||||
| Indian rupee | 69.93 | 63.84 | ||||||
| Thai baht | 32.53 | 32.85 | ||||||
| Turkish lira | 5.27 | 3.79 | ||||||
| UF (*) | 39.68 | 43.59 | ||||||
(*) The Unidad de Fomento (UF) is an indexed monetary unit used in Chile, calculated based on the variation in the Consumer Price Index (CPI). It is represented as dollars to UF.
(b) Transactions and balances
Non-monetary transactions in currencies other than the functional currency (Dollar) are translated to the respective functional currencies of Group entities at the exchange rate on the date of the transaction. Monetary assets and liabilities denominated in foreign currencies at the reporting date are retranslated to the functional currency at the exchange rate at that date. All differences are recorded in the statement of income except for all monetary items that provide an effective hedge for a net investment in a foreign operation. These items are recognized in other comprehensive income on the divestment, when they are recognized in the statement of income. Charges and credits attributable to foreign currency translation differences on those hedge monetary items are also recognized in other comprehensive income.
Non-monetary assets and liabilities that are measured at historical cost in a foreign currency are retranslated to the functional currency at the historical exchange rate of the transaction. Non-monetary items that are measured based on fair value in a foreign currency are translated using the exchange rate at the date on which the fair value is determined.
| F- 33 |
Notes to the Consolidated Financial Statements as of December 31, 2018
| Note 3 | Significant accounting policies (continued) |
| 3.4 | Subsidiaries |
SQM S.A. uses the level of control it has in subsidiaries as a basis to determine their share in the consolidated financial statements. This control consists of the Company’s ability to exercise power in the subsidiary, exposure, or right, to variable performance from its share in the investee and the ability to use its power on the investee to have an influence on the amount of the investor’s performance.
The Company prepares the consolidated financial statements using consistent accounting policies for the entire Group. The consolidation of a subsidiary commences when the Company has control over the subsidiary and stops when control ceases.
| 3.5 | Consolidated statement of cash flows |
Cash equivalents correspond to highly-liquid short-term investments that are easily convertible into known amounts of cash. They are subject to insignificant risk of changes in their value and mature in less than three months from the date of acquisition of the instrument.
For the purposes of the statement of cash flows, cash and cash equivalents comprise cash and cash equivalents as defined above.
The statement of cash flows includes movements in cash performed during the year, determined using the direct method.
| 3.6 | Financial assets |
As of January 1, 2018, the Company's Management (the "Administration") determines the classification of its financial assets, in accordance with the provisions of IFRS 9, at fair value (either through other comprehensive income, or through profits or losses), and at amortized cost. The classification depends on the business model of the entity to manage the financial assets and the contractual terms of the cash flows.
In the initial recognition, the Company measures its financial assets at fair value more or less, in the case of a financial asset that is not accounted for at fair value through profit or loss, the transaction costs that are directly attributable to the acquisition of the financial asset. In the case of commercial debtors and other accounts receivable, the initial recognition will measure their transaction price in accordance with the provisions of IFRS 15.
After initial recognition, the Company measures its financial assets according to the following:
| i) | Financial instruments to Fair Value Through Profit and Loss (FVTPL). A financial asset should be measured at fair value through profit or loss unless it is measured at amortized cost or at Fair Value with changes in Other Comprehensive Income |
| ii) | Financial instruments measured at amortized cost. Financial assets that meet the following conditions are included in this category (a) the business model that supports it aims to maintain the financial assets to obtain the contractual cash flows and (b) the Contractual conditions of the financial asset give place, on specified dates, to cash flows that are only payments of the principal and interest on the outstanding principal amount. |
| iii) | Financial assets at fair value through other comprehensive income. Equity securities which are not held for trading, and which the group has irrevocably elected at initial recognition to recognise in this category. |
Until December 31, 2017, the Company determined the classification of its financial assets at the time of initial recognition, based on the basis of the business model for the management of financial assets and the characteristics of the contractual cash flows of the financial assets. financial assets. In accordance with IAS 39, financial assets were initially measured at fair value plus the transaction costs incurred that were directly attributable to the acquisition of the financial asset. Subsequently, financial assets were measured at amortized cost or at fair value.
The Company evaluated at the date of each report, whether there was objective evidence that any asset or group of financial assets presented any impairment. An asset or group of financial assets presented a deterioration, if and only if, there was objective evidence of impairment as a result of one or more events that occurred after the initial recognition of the asset or group of these. In order for impairment to be recognized, the loss event must have an impact on the estimation of future flows of the asset or groups of financial assets.
| F- 34 |
Notes to the Consolidated Financial Statements as of December 31, 2018
| Note 3 | Significant accounting policies (continued) |
| 3.7 | Financial liabilities |
As of January 1, 2018, the Company determines the classification of its financial liabilities, in accordance with the provisions of IFRS 9, at fair value or at amortized cost. The classification depends on the business model of the entity to manage the financial assets and the contractual terms of the cash flows.
In the initial recognition, the Company measures its financial liabilities by their fair value more or less, in the case of a financial liability that is not accounted for at fair value through profit or loss, the transaction costs that are directly attributable to the acquisition of the financial liability.
After initial recognition, the Company measures its financial liabilities at amortized cost unless the Company, at the initial moment, irrevocably designates the financial liability as measured at fair value through profit or loss.
Financial liabilities measured at amortized cost are commercial accounts payable and other accounts payable and other financial liabilities.
Until December 31, 2017, the Company determined the classification of its financial liabilities at the time of initial recognition in accordance with the provisions of IAS 39. Financial liabilities at the time of initial recognition were measured at fair value, minus costs of the transaction in which they were incurred and which are directly attributable to the issuance of the financial liability. Subsequently, they were measured at amortized cost using the effective interest method. In the case of financial liabilities that were initially recognized at fair value through profit or loss, they were measured after fair value.
| 3.8 | Reclassification of financial instruments |
At such time when the Company changes its business model for managing financial assets, it will reclassify those financial assets affected by the new business model.
Financial liabilities could not be reclassified.
| 3.9 | Derecognition of financial instruments |
In accordance with IFRS 9, the Company derecognizes a financial asset when the contractual rights to the cash flows from the asset expire, or it transfers the rights to receive the contractual cash flows in a transaction in which substantially all the risks and rewards of ownership of the financial asset are transferred; and the control of the financial assets has not been retained.
The Company derecognizes a financial liability when its contractual obligations or a part of these are discharged, paid to the creditor or legally extinguished.
| 3.10 | Derivative and hedging financial instruments |
Derivatives are recognized initially at fair value as of the date on which the derivatives contract is signed and, they are subsequently assessed at fair value. The method for recognizing the resulting gain or loss depends on whether the derivative has been designated as an accounting hedge instrument and, if so, it depends on the type of hedging, which may be as follows:
| a) | Fair value hedge of assets and liabilities recognized (fair value hedges); |
| b) | Hedging of a single risk associated with an asset or liability recognized or a highly probable forecast transaction (cash flow hedge). |
| F- 35 |
Notes to the Consolidated Financial Statements as of December 31, 2018
| Note 3 | Significant accounting policies (continued) |
| 3.10 | Derivative and hedging financial instruments, continued |
At the beginning of the transaction, the Company documents the relationship that exists between hedging instruments and those items hedged, as well as their objectives for risk management purposes and the strategy to conduct different hedging operations.
The Company also documents its evaluation both at the beginning and at the end of each period if the derivatives used in hedging transactions are highly effective to offset changes in the fair value or in cash flows of hedged items.
The fair value of derivative instruments used for hedging purposes is shown in Note 14.3 (hedging assets and liabilities). Changes in the cash flow hedge reserve are classified as a non-current asset or liability if the remaining expiration period of the hedged item is more than 12 months, and as a current asset or liability if the remaining expiration period of the entry is less than 12 months.
Derivatives that are not designated or do not qualify as hedging derivatives are classified as current assets or liabilities, and changes in the fair value are directly recognized through profit or loss.
a) Fair value hedge
Changes in the fair value of derivatives that are designated and qualify as fair value hedges are recorded in profit or loss, together with any changes in the fair value of the hedged asset or liability that are attributable to the hedged risk. The gain or loss relating to the effective portion of interest rate swaps that hedge fixed rate borrowings is recognized in profit or loss within finance costs, together with changes in the fair value of the hedged fixed rate borrowings attributable to interest rate risk. The gain or loss relating to the ineffective portion is recognized in profit or loss within other income or other expenses. If the hedge no longer meets the criteria for hedge accounting, the adjustment to the carrying amount of a hedged item for which the effective interest method is used is amortized to profit or loss over the period to maturity using a recalculated effective interest rate.
b) Cash flow hedges
Amounts taken to equity are transferred to profit or loss when the hedged transaction affects profit or loss, as when the hedged interest income or expense is recognized when a projected sale occurs. When the hedged entry is the cost of a non-financial asset or liability, amounts taken to other reserves are transferred to the initial carrying value of the non-financial asset or liability.
If the expected firm transaction or commitment is no longer expected to occur, the amounts previously recognized in equity are transferred to profit or loss. If a hedge instrument expires, is sold, finished, or exercised without any replacement, or if a rollover is performed or if its designation as hedging is revoked, the amounts previously recognized in other reserves are maintained in equity until the expected firm transaction or commitment occurs.
| F- 36 |
Notes to the Consolidated Financial Statements as of December 31, 2018
| Note 3 | Significant accounting policies (continued) |
| 3.11 | Derivative financial instruments |
The Company maintains derivative financial instruments to hedge its exposure to foreign currencies. Derivative financial instruments are recognized initially at fair value; attributable transact ion costs are recognized when incurred. Subsequent to initial recognition, any changes in the fair value of such derivatives are recognized in profit or loss as part of gains and losses.
The Company permanently assesses the existence of embedded derivatives, both in its contracts and financial instruments, As of December 31, 2018, and December 31, 2017, there were no embedded derivatives.
| 3.12 | Fair value initial measurements |
From the initial recognition, the Company measures its assets and liabilities at fair value plus or minus transaction costs incurred that are directly attributable to the acquisition of a financial asset or issuance of a financial liability
| 3.13 | Deferred acquisition costs from insurance contracts |
Acquisition costs from insurance contracts are classified as prepayments and correspond to insurance contracts in force, recognized using the straight-line method and on an accrual basis, and are recognized under other non-financial assets.
| F- 37 |
Notes to the Consolidated Financial Statements as of December 31, 2018
| Note 3 | Significant accounting policies (continued) |
| 3.14 | Classification Leases |
(a) Lease - Finance lease
Leases are classified as finance leases when the Company substantially owns all the risks and rewards inherent in the ownership of the asset. Finance leases are capitalized at the commencement of the lease term at the lower of the fair value of the leased asset and the present value of the minimum lease payments.
Each finance lease payment is apportioned between the liability and the finance charges so as to obtain the constant rate of interest on the remaining balance of the liability. The respective lease obligations, net of finance charges, are included in other non-current liabilities. The interest part of the finance cost is charged to the consolidated financial statements for the lease term so as to produce a constant periodic rate of interest on the remaining balance of the liability for each year.
(b) Lease - Operating lease
Leases where the lessor retains a significant part of the risks and benefits derived from the property are classified as operating leases. Operating lease payments (net of any incentive received by the lessor) should be recognized as an expense in the income statement or capitalized (as appropriate) over the lease term on a straight-line basis.
| F- 38 |
Notes to the Consolidated Financial Statements as of December 31, 2018
| Note 3 | Significant accounting policies (continued) |
| 3.15 | Inventory measurement |
The method used to determine the cost of inventories is the weighted average monthly cost of warehouse storage.
In determining production costs for own products, the company includes the costs of labor, raw materials, materials and supplies used in production, depreciation and maintenance of the goods that participate in the production process, the costs of product movement necessary to maintain stock on location and in the condition in which they are found, and also includes the indirect costs of each task such as laboratories, process and planning areas, and personnel expenses related to production, among others.
For finished and in-process products, the company has four types of provisions, which are reviewed quarterly:
| 1. | Provision associated with the lower value of stock, which is directly identified with the product that generates it and involves three types: provision of lower realizable value, which corresponds to the difference between the inventory cost of intermediary or finished products, and the sale price minus the necessary costs to bring them to the same conditions and location as the product with which they are compared; provision for future uncertain use that corresponds to the value of those products in process that are likely not going to be used in sales based on the company’s long-term plans; reprocessing costs of products that are unfeasible for sale due to current specifications. |
| 2. | Provision associated with physical differences in inventory: a provision is made for differences that exceed the tolerance considered in the respective inventory process (production units in Chile and the port of Tocopilla carry out at least two inventories a year, the business subsidiaries depend on the last zero ground obtained, but in general it is at least once a year), these differences are recognized immediately. |
| F- 39 |
Notes to the Consolidated Financial Statements as of December 31, 2018
| Note 3 | Significant accounting policies (continued) |
| 3.15 | Inventory measurement, continued |
| 3. | Potential errors in the determination of stock: The company has an algorithm that is reviewed at least once a year and corresponds to diverse percentages assigned to each inventory based on the product, location, complexity involved in the associated measurement, rotation and control mechanisms. |
| 4. | Provisions undertaken by business subsidiaries: these are historical percentages that are adjusted as zero ground is attained based on normal inventory management. |
Inventories of raw materials, materials and supplies for production are recorded at acquisition cost. Cyclical inventories are performed in warehouses, as well as general inventories every three years. Differences are recognized the moment they are detected. The company has a provision that makes quarterly calculations from percentages associated with each type of material (classification by warehouse and rotation). These percentages use the lower value resulting from deterioration or obsolescence as well as potential losses. This provision is reviewed at least annually, and considers the historical profit and loss obtained in the inventory processes.
| 3.16 | Investments in associates and joint ventures |
Under IFRS 11 Joint Arrangements investments in joint arrangements are classified as either joint operations or joint ventures. The classification depends on the contractual rights and obligations of each investor, rather than the legal structure of the joint arrangement.
Joint Ventures and Associates
Interests in companies over which joint control is exercised (joint venture) or where an entity has a significant influence (associates)
are recognized using the equity method of accounting. Significant influence is presumed to exist when interest greater than 20%
is held in the capital of an investee. Under this method, the investment is recognized in the statement of financial position at
cost plus changes, subsequent to the acquisition, and considering the proportional share in the equity of the associate. For such
purposes, the interest percentage in the ownership of the associate is used. The associated goodwill acquired is included in the
carrying amount of the investee and is not amortized. The debit or credit to profit or loss reflects the proportional share in
the profit or loss of the associate.
Unrealized gains for transactions with affiliates or associates are eliminated according to the Company’s interest percentage
in such entities. Unrealized losses are also eliminated, except if the transaction provides evidence of impairment loss of the
transferred asset.
Changes in the equity of associates are recognized on a proportional basis with a charge or credit to “Other reserves”
and classified according to their origin. Reporting dates of the associate, the Company and related policies are similar for equivalent
transactions and events under similar circumstances. In the event that the significant influence is lost or the investment is sold
or is held as available for sale, the equity method is discontinued, suspending the recognition of the proportional share of profit
or loss. If the resulting amount according to the equity method is negative, the share of profit or loss is reflected as zero in
the consolidated financial statements, unless a commitment exists by the Company to reinstate the Company’s equity position,
in which case the related provision for risks and expenses is recorded.
Dividends received by these companies are
recorded by reducing the equity value, and the proportional share of profit or loss recognized according to the equity share are
included in the consolidated profit or loss accounts in the caption “Equity share of profit (loss) of associates and joint
ventures that are accounted for using the equity method of accounting”.
Joint Operation
Regarding joint operations, the Company recognizes its direct right to the assets, liabilities, revenues and expenses of joint operations and its share of any jointly held or incurred assets, liabilities, revenues and expenses.
| F- 40 |
Notes to the Consolidated Financial Statements as of December 31, 2018
| Note 3 | Significant accounting policies (continued) |
| 3.17 | Transactions with non-controlling interests |
Non-controlling interests are recorded in the consolidated statement of financial position within equity, but separate from equity attributable to the owners of the Parent.
| 3.18 | Related party transactions |
Transactions between the Company and its subsidiaries are part of the Company’s normal operations within its scope of business activities. Conditions for such transactions are those normally effective for those types of operations with regard to terms and market prices. These transactions have been eliminated in consolidation. The expiration conditions vary according to the originating transaction.
| 3.19 | Property, plant and equipment |
The assets tangible property, plant and equipment assets are stated at acquisition cost, net of the related accumulated depreciation, amortization and impairment losses that they might have experienced.
In addition to the price paid for the acquisition of tangible property, plant and equipment, the Company has considered the following concepts as part of the acquisition cost, as applicable:
| 1. | Accrued interest expenses during the construction period that are directly attributable to the acquisition, construction or production of qualifying assets, which are those that require a substantial period prior to being ready for use. The interest rate used is that related to the project’s specific financing or, should this not exist, the average financing rate of the investor company. |
| 2. | The future costs that the Company will have to experience, related to the closure of its facilities at the end of their useful life, are included at the present value of disbursements expected to be required to settle the obligation. Having initially recognized provisions for closure and refurbishment, the corresponding cost is capitalized as an asset in Property, plant and equipment and amortized in line with the amortization criteria for the associated assets. |
Construction-in-progress is transferred to property, plant and equipment in operation once the assets are available for use and the related depreciation and amortization begins on that date.
Extension, modernization or improvement costs that represent an increase in productivity, ability or efficiency or an extension of the useful lives of property, plant and equipment are capitalized as a higher cost of the related assets. All the remaining maintenance, preservation and repair expenses are charged to expense as they are incurred.
The replacement of full assets, which increase the asset’s useful life or its economic capacity, are recorded as a higher value of property, plant and equipment with the related derecognition of replaced or renewed elements.
Gains or losses which are generated from the sale or disposal of property, plant and equipment are recognized as income (or loss) in the period, and calculated as the difference between the asset’s sales value and its net carrying value.
Costs derived from the daily maintenance of property, plant and equipment are recognized when incurred.
| F- 41 |
Notes to the Consolidated Financial Statements as of December 31, 2018
| Note 3 | Significant accounting policies (continued) |
| 3.20 | Depreciation of property, plant and equipment |
Property, plant and equipment are depreciated through the straight-line distribution of cost over the estimated technical useful life of the asset, which is the period in which the Company expects to use the asset. When components of one item of property, plant and equipment have different useful lives, they are recorded as separate assets. Useful lives are reviewed on an annual basis.
Fixed assets associated with the Salar de Atacama consider useful life to be the lesser value between the technical useful life and the years remaining until 2030.
In the case of mobile equipment, depreciation is performed depending on the hours of operation
The useful lives used for the depreciation and amortization of assets included in property, plant and equipment in years are presented below.
| Classes of property, plant and equipment |
Minimum life or
rate (years) |
Maximum life or
rate (years) |
life or average
rate in years |
|||||||||
| Mining assets | 3 | 8 | 7 | |||||||||
| Energy generating assets | 3 | 16 | 7 | |||||||||
| Buildings | 2 | 40 | 11 | |||||||||
| Supplies and accessories | 2 | 16 | 6 | |||||||||
| Office equipment | 2 | 20 | 6 | |||||||||
| Transport equipment | 2 | 20 | 9 | |||||||||
| Network and communication equipment | 3 | 15 | 5 | |||||||||
| IT equipment | 2 | 16 | 4 | |||||||||
| Machinery, plant and equipment | 1 | 28 | 9 | |||||||||
| Other property, plant and equipment | 1 | 26 | 6 | |||||||||
| 3.21 | Goodwill |
Goodwill acquired represents the excess in acquisition cost on the fair value of the Company's ownership of the net identifiable assets of the subsidiary on the acquisition date. Goodwill acquired related to the acquisition of subsidiaries is included in goodwill, which is subject to impairment tests annually or more frequently if events or changes in circumstances indicate that it might be impaired, and is stated at cost less accumulated impairment losses. Gains and losses related to the sale of an entity include the carrying value of goodwill related to the entity sold.
This intangible asset is assigned to cash-generating units with the purpose of testing impairment losses. It is allocated based on cash-generating units expected to obtain benefits from the business combination from which the aforementioned goodwill acquired arose.
| F- 42 |
Notes to the Consolidated Financial Statements as of December 31, 2018
| Note 3 | Significant accounting policies (continued) |
| 3.22 | Intangible assets other than goodwill |
Intangible assets other than goodwill mainly relate to water rights, emission rights, commercial brands, costs for rights of way for electricity lines, license costs and the development of computer software and mining property and concession rights, client portfolio and commercial agent.
| (a) | Water rights |
Water rights acquired by the Company relate to water from natural sources and are recorded at acquisition cost. Given that these assets represent legal rights granted in perpetuity to the Company, they are not amortized, but are subject to annual impairment tests.
| (b) | Rights of way for electric lines |
As required for the operation of industrial plants, the Company has paid rights of way in order to install wires for the different electric lines on third party land. These rights are presented under intangible assets. Amounts paid are capitalized at the date of the agreement and charged to the statement of income, according to the life of the right of way.
| (c) | Computer software |
Licenses for IT programs acquired are capitalized based on their acquisition and customization costs. These costs are amortized over their estimated useful lives.
Expenses related to the development or maintenance of IT programs are recognized as an expense as and when incurred. Costs directly related to the production of unique and identifiable IT programs controlled by the Group, and which will probably generate economic benefits that are higher than its costs during more than a year, are recognized as intangible assets. Direct costs include the expenses of employees who develop information technology software and general expenses in accordance with corporate charges received.
The costs of development for IT programs recognized as assets are amortized over their estimated useful lives.
| (d) | Mining property and concession rights |
The Company holds mining property and concession rights from the Chilean and Australian Governments. Property rights are usually obtained at no initial cost (other than the payment of mining patents and minor recording expenses) and once the rights on these concessions have been obtained, they are retained by the Company while annual patents are paid. Such patents, which are paid annually, are recorded as prepaid assets and amortized over the following twelve months. Amounts attributable to mining concessions acquired from third parties that are not from the Chilean Government are recorded at acquisition cost within intangible assets.
| (e) | Client portfolio |
The period for exploiting these portfolios is unlimited so they are considered assets with an indefinite useful life and are therefore not subject to amortization. However, they are subjected to an annual impairment test and the corresponding amounts are recorded in the profit or loss.
| F- 43 |
Notes to the Consolidated Financial Statements as of December 31, 2018
| Note 3 | Significant accounting policies (continued) |
| 3.22 | Intangible assets other than goodwill, continued |
| (f) | Commercial agent |
The rights obtained through the acquisition of the commercial agent of Sociedad Agrocom Ltda. corresponded to the fair value of that company’s line of business. The period for exploiting these rights is unlimited so they are considered assets with an indefinite useful life and are therefore not subject to amortization. However, the indefinite useful life is subject to review for every reporting period, to see whether indefinite useful life continues to apply.
| 3.23 | Research and development expenses |
Research and development expenses are charged to profit or loss in the period in which the expenditure was incurred.
| 3.24 | Prospecting expenses |
The Company holds mining concessions for exploration and exploitation of ore. The Company gives the following treatment to expenses associated with exploration and assessment of these resources:
| · | Caliche |
Once the rights have been obtained, the Company records the disbursements directly associated with the exploration and assessment of the deposit as an at cost asset. These disbursements include the following items:
| - | Disbursements for geological surveys, drilling, borehole extraction and sampling, activities related to the technical assessment and commercial viability of the extraction, and in general, any disbursement directly related to specific projects where the objective is to find ore resources. |
If the technical studies determine that the ore grade is not economically viable, the asset is directly charged to profit and loss. If determined otherwise, the asset described above is associated with the extractable ore tonnage which is amortized as it is used. These assets are presented in the other non-current assets category, reclassifying the portion related to the area to by extracted that year as stock.
| · | Expenses related to metal exploration are charged to profit or loss in the period in which they are registered. |
| · | Salar de Atacama exploration expenses are presented in non-current assets in the property, plant and equipment category and correspond mainly to wells that can also be used in the extraction of the deposit and/or monitoring. These are amortized over 10 years. |
| · | Mt Holland exploration expenses primarily consider exploration boreholes and complementary studies for the lithium ore study of the area. These expenses will begin to be amortized in the development stage. |
| F- 44 |
Notes to the Consolidated Financial Statements as of December 31, 2018
| Note 3 | Significant accounting policies (continued) |
| 3.25 | Impairment of non-financial assets |
Assets subject to depreciation and amortization are also subject to impairment testing, provided that an event or change in the circumstances indicates that the amounts in the accounting records may not be recoverable. An impairment loss is recognized for the excess of the book value of the asset over its recoverable amount.
The recoverable amount of an asset is the higher between the fair value of an asset or cash generating unit (“CGU”) less costs of sales and its value in use, and is determined for an individual asset unless the asset does not generate any cash inflows that are clearly independent from other assets or groups of assets.
When the carrying value of an asset exceeds its recoverable amount, the asset is considered an impaired asset and is reduced to its net recoverable amount.
In evaluating value in use, estimated future cash flows are discounted using a pre-tax discount rate that reflects current market assessment, the value of money over time and the specific asset risks.
To determine the fair value less costs to sell, an appropriate valuation model is used.
Impairment losses from continuing operations are recognized with a debit to profit or loss in the categories of expenses associated with the impaired asset function, except for properties reevaluated previously where the revaluation was taken to equity.
For assets other than acquired goodwill, an annual evaluation is carried out to determine whether any previously recognized impairment losses have already decreased or ceased to exist. If this should be the case, the recoverable amount is estimated. A previously recognized impairment loss is only reversed if there have been changes in the estimates used to determine the asset’s recoverable amount since the last time an impairment loss was recognized. If this is the case, the carrying value of the asset is increased to its recoverable amount. This increased amount cannot exceed the carrying value that would have been determined, net of depreciation, if an asset impairment loss had not been recognized in prior years. This reversal is recognized with a credit to profit or loss.
| 3.26 | Minimum dividend |
As required by Chilean law and regulations, our dividend policy is decided upon from time to time by our Board of Directors and is announced at the Annual Ordinary Shareholders’ Meeting, which is generally held in April of each year. Shareholder approval of the dividend policy is not required. However, each year the Board must submit the declaration of the final dividend or dividends in respect of the preceding year, consistent with the then-established dividend policy, to the Annual Ordinary Shareholders’ Meeting for approval. As required by the Chilean Companies Act, unless otherwise decided by unanimous vote of the holders of issued shares, we must distribute a cash dividend in an amount equal to at least 30% of our consolidated net income for that year (determined in accordance with CMF regulations), unless and to the extent the Company has a deficit in retained earnings.
| 3.27 | Earnings per share |
The basic earnings per share amounts are calculated by dividing the profit for the year attributable to the ordinary owners of the parent by the weighted average number of ordinary shares outstanding during the year.
The Company has not conducted any type of operation of potential dilutive effect that would entail the disclosure of diluted earnings per share.
| F- 45 |
Notes to the Consolidated Financial Statements as of December 31, 2018
| Note 3 | Significant accounting policies (continued) |
| 3.28 | Trade and other payables |
Trade and other payables are measured at fair value plus all costs associated with the transaction. Subsequently, these are carried out at amortized cost using the effective interest rate method.
| 3.29 | Interest-bearing borrowings |
At initial recognition, interest-bearing borrowings are measured at fair value net of transaction costs incurred. Subsequently, they are measured at amortized cost using the effective interest rate method. Amortized cost is calculated considering any premium or discount from the acquisition and includes costs of transactions which are an integral part of the effective interest rate.
These are recorded as non-current when their expiration period exceeds twelve months and as current when the term is lower than such term. Interest expense is calculated in the year in which it is accrued following a financial criterion.
| 3.30 | Other provisions |
Provisions are recognized when:
| - | The Company has a present obligation or constructive obligation as the result of a past event. |
| - | It is more likely than not that certain resources must be used, including benefits, to settle the obligation. |
| - | A reliable estimate can be made of the amount of the obligation. |
In the event that the provision or a portion of it is reimbursed, the reimbursement is recognized as a separate asset solely if there is certainty of income.
In the consolidated statement of income, the expense for any provision is presented net of any reimbursement.
Should the effect of the value of money over time be significant, provisions are discounted using a discount rate before tax that reflects the liability’s specific risks. When a discount rate is used, the increase in the provision over time is recognized as a finance cost
The Company’s policy is to maintain provisions to cover risks and expenses based on a better estimate to deal with possible or certain and quantifiable responsibilities from current litigation, compensations or obligations, pending expenses for which the amount has not yet been determined, collaterals and other similar guarantees for which the Company is responsible. These are recorded at the time the responsibility or the obligation that determines the compensation or payment is generated.
| F- 46 |
Notes to the Consolidated Financial Statements as of December 31, 2018
| Note 3 | Significant accounting policies (continued) |
| 3.31 | Obligations related to employee termination benefits and pension commitments |
Obligations towards the Company’s employees comply with the provisions of the collective bargaining agreements in force, which are formalized through collective employment agreements and individual employment contracts, except for the United States, which is regulated in accordance with employment plans in force up to 2002. (See more details in Note 17.4).
These obligations are valued using actuarial calculations, according to the projected unit credit method which considers such assumptions as the mortality rate, employee turnover, interest rates, retirement dates, effects related to increases in employees’ salaries, as well as the effects on variations in services derived from variations in the inflation rate. The criteria in force contained in the revised IAS 19 are also taken into account.
Actuarial gains and losses that may be generated by variations in defined, pre-established obligations are directly recorded in other comprehensive income.
Actuarial losses and gains have their origin in departures between the estimate and the actual behavior of actuarial assumptions or in the reformulation of established actuarial assumptions.
The discount rate used by the Company for calculating the obligation was 4.642% and 5.114% for the periods ended December 31, 2018 and December 31, 2017, respectively.
The Company’s subsidiary SQM North America has established pension plans for its retired employees that are calculated by measuring the projected obligation using a net salary progressive rate net of adjustments for inflation, mortality and turnover assumptions, deducting the resulting amounts at present value using a 3.75% interest rate for 2018 and 4.50% for 2017. The net balance of this obligation is presented under the non-current provisions for employee benefits (refer to Note 17.4).
| 3.32 | Compensation plans |
Compensation plans implemented through benefits provided in share-based payments settled in cash are recognized in the financial statements at their fair value, in accordance with International Financial Reporting Standards No. 2 "Share-based Payments.” Changes in the fair value of options granted are recognized with a charge to payroll on a straight-line basis during the period between the date on which these options are granted and the payment date (see Note 18.6).
| F- 47 |
Notes to the Consolidated Financial Statements as of December 31, 2018
| Note 3 | Significant accounting policies (continued) |
| 3.33 | Revenue recognition |
Revenue includes the fair value of the consideration received or to be received for the sale of goods and services in the ordinary course of the Company's activities. Revenue is presented net of value added tax, returns, rebates and discounts and after eliminating sales made between subsidiaries.
Revenue is recognized when the amount of the income can be reliably valued, it is probable that the future economic benefits will flow to the entity and the specific conditions for each of the types of income from activities will be met, as described below:
| (a) | Sale of goods |
The sale of goods is recognized when the Company has delivered products to the customer, and there is no obligation pending compliance that could affect the acceptance of products by the customer. The delivery does not occur until products have been shipped to the customer or confirmed as received by the customer, and the related risks of obsolescence and loss have been transferred to the customer and the customer has accepted the products in accordance with the conditions established in the sale, when the acceptance period has ended, or when there is objective evidence that those criteria required for acceptance have been met.
Sales are recognized in consideration of the price set in the sales agreement, net of volume discounts and estimated returns at the date of the sale. Volume discounts are evaluated in consideration of annual foreseen purchases and in accordance with the criteria defined in agreements.
| (b) | Sale of services |
Revenue associated with the rendering of services is recognized considering the degree of completion of the service as of the date of presentation of the consolidated classified statement of financial position, provided that the result from the transaction can be estimated reliably.
| (c) | Interest income |
Interest income is recognized when interest is accrued in consideration of the principal pending payment using the effective interest rate method.
| (d) | Income from dividends |
Income from dividends is recognized when the right to receive the payment is established.
| F- 48 |
Notes to the Consolidated Financial Statements as of December 31, 2018
| Note 3 | Significant accounting policies (continued) |
| 3.34 | Finance income and finance costs |
Finance income is mainly composed of interest income in financial instruments such as term deposits and mutual fund deposits. Interest income is recognized in profit or loss at amortized cost, using the effective interest rate method.
Finance costs are mainly composed of interest on bank borrowing expenses, interest on bonds issued and interest capitalized for borrowing costs for the acquisition, construction or production or qualifying assets.
Borrowing costs and bonds issued are recognized in profit or loss using the effective interest rate method.
For finance costs accrued during the construction period that are directly attributable to the acquisition, construction or production of qualifying assets, the effective interest rate related to the project’s specific financing is used. If none exists, the average financing rate of the subsidiary making the investment is utilized.
Borrowing and financing costs that are directly attributable to the acquisition, construction or production of an asset are capitalized as part of that asset’s cost.
| 3.35 | Income tax and deferred taxes |
Corporate income tax for the year is determined as the sum of current taxes from the different consolidated companies.
Current taxes are based on the application of the various types of taxes attributable to taxable income for the year.
Differences between the book value of assets and liabilities and their tax basis generate the balance of deferred tax assets or liabilities, which are calculated using the tax rates expected to be applicable when the assets and liabilities are realized.
In conformity with current Chilean tax regulations, the provision for corporate income tax and taxes on mining activity is recognized on an accrual basis, presenting the net balances of accumulated monthly tax provisional payments for the fiscal period and associated credits. The balances of these accounts are presented in current income taxes recoverable or current taxes payable, as applicable.
Tax on companies and variations in deferred tax assets or liabilities that are not the result of business combinations are recorded in the statement of income accounts or equity accounts in the consolidated statement of financial position, considering the origin of the gains or losses which have generated them.
At each reporting period, the carrying amount of deferred tax assets has been reviewed and reduced to the extent where there will not be sufficient taxable income to allow the recovery of all or a portion of the deferred tax assets. Likewise, as of the date of the consolidated financial statements, deferred tax assets that are not recognized were evaluated and not recognized as it was more likely than not that future taxable income will allow for recovery of the deferred tax asset.
With respect to deductible temporary differences associated with investments in subsidiaries, associated companies and interest in joint ventures, deferred tax assets are recognized solely provided that it is more likely than not that the temporary differences will be reversed in the near future and that there will be taxable income with which they may be used.
The deferred income tax related to entries directly recognized in equity is recognized with an effect on equity and not with an effect on profit or loss.
Deferred tax assets and liabilities are offset if there is a legally receivable right of offsetting tax assets against tax liabilities and the deferred tax is related to the same tax entity and authority.
| F- 49 |
Notes to the Consolidated Financial Statements as of December 31, 2018
| Note 3 | Significant accounting policies (continued) |
| 3.36 | Segment reporting |
IFRS 8 requires that companies adopt a “management approach” to disclose information on the operations generated by its operating segments. In general, this is the information that management uses internally for the evaluation of segment performance and making the decision on how to allocate resources for this purpose.
An operating segment is a group of assets and operations responsible for providing products or services subject to risks and performance that are different from those of other business segments. A geographical segment is responsible for providing products or services in a given economic environment subject to risks and performance that are different from those of other segments operating in other economic environments.
For assets and liabilities, the allocation to each segment is not possible given that these are associated with more than one segment, except for depreciation, amortization and impairment of assets, which are directly allocated to the applicable segments, in accordance with the criteria established in the costing process for product inventories.
The following operating segments have been identified by the Company:
| - | Specialty plant nutrients |
| - | Industrial chemicals |
| - | Iodine and derivatives |
| - | Lithium and derivatives |
| - | Potassium |
| - | Other products and services |
| F- 50 |
Notes to the Consolidated Financial Statements as of December 31, 2018
| Note 3 | Significant accounting policies (continued) |
| 3.37 | Responsibility for Information and Estimates Made |
The Management of Sociedad Química y Minera de Chile S.A. and its subsidiaries is responsible for the information contained in these consolidated financial statements, which expressly indicate that all the principles and criteria included in IFRS, as issued by the International Accounting Standards Board (IASB), have been applied in full.
In preparing the consolidated financial statements of Sociedad Química y Minera de Chile S.A. and its subsidiaries, Management has made judgments and estimates to quantify certain assets, liabilities, revenues, expenses and commitments included therein. Basically, these estimates refer to:
| - | Estimated useful lives are determined based on current facts and past experience, and take into consideration the anticipated physical life of the asset, the potential for technological obsolescence, and regulations. See Notes 3.22, 14 and 15. |
| - | Impairment losses of certain assets - Assets, including property, plant and equipment, exploration assets, goodwill and intangible assets are reviewed for impairment whenever events or changes in circumstances indicate that their carrying amounts exceed their recoverable amounts. If an impairment assessment is required, the assessment of fair value often requires estimates and assumptions such as discount rates, exchange rates, commodity prices, future capital requirements and future operating performance. Changes in such estimates could impact the recoverable values of these assets. Estimates are reviewed regularly by management. See Notes 14 and 15. |
| - | Assumptions used in calculating the actuarial amount of pension-related and severance indemnity payment benefit commitments. See Note 17. |
| - | Contingencies – The amount recognized as a provision, including legal, contractual, constructive and other exposures or obligations, is the best estimate of the consideration required to settle the related liability, including any related interest charges, taking into account the risks and uncertainties surrounding the obligation. In addition, contingencies will only be resolved when one or more future events occur or fail to occur. Therefore, the assessment of contingencies inherently involves the exercise of significant judgment and estimates of the outcome of future events. The Company assesses its liabilities and contingencies based upon the best information available, relevant tax laws and other appropriate requirements. See Notes 18 and 21. |
| - | Provisions on the basis of technical studies that cover the different variables affecting products in stock (density and moisture, among others), and related allowance. |
| - | Obsolescence to ensure that the carrying value of inventory is not in excess of the net realizable Inventory valuation requires judgment to determine obsolescence and estimates of provisions for value. See Note 11. |
Despite the fact that these estimates have been made on the basis of the best information available on the date of preparation of these consolidated financial statements, certain events may occur in the future and oblige their amendment (upwards or downwards) over the next few years, which would be made prospectively, recognizing the effects of the change in estimates in the related future consolidated financial statements.
| F- 51 |
Notes to the Consolidated Financial Statements as of December 31, 2018
| Note 3 | Significant accounting policies (continued) |
| 3.38 | Environment |
In general, the Company follows the criteria of considering amounts used in environmental protection and improvement as environmental expenses. However, the cost of facilities, machinery and equipment used for the same purpose are considered property, plant and equipment, as the case may be.
| Note 4 | Changes in accounting estimates and policies (consistent presentation) |
| 4.1 | Changes in accounting estimates |
In the preparation of the consolidated financial statements of the Company and subsidiaries, the management has made estimates regarding the useful lives of Properties, Plants and Equipment, assumptions used for the actuarial calculation of employee benefits, contingencies and provisions (for more information, see Note 3.41)
| 4.2 | Changes in accounting policies |
As of December 31, 2018, the consolidated financial statements of the Company present changes in the accounting policies with respect to the previous period due to application of IFRS 9 and IFRS 15 from January 1, 2018. (for further details refer to Note 2.2)
Except as described above, the accounting principles were applied consistently for all periods presented.
| F- 52 |
Notes to the Consolidated Financial Statements as of December 31, 2018
| Note 5 | Financial risk management |
| 5.1 | Financial risk management policy |
The Company’s financial risk management policy is focused on safeguarding the stability and sustainability of the Company and its subsidiaries with regard to all such relevant financial uncertainty components.
The Company’s operations are subject to certain financial risk factors that may affect its financial position or results. The most significant risk exposures are market risk, liquidity risk, currency risk, doubtful accounts risk, and interest rate risk, among others.
There could also be additional risks, which are either unknown or known but not currently deemed to be significant, which could also affect the Company’s business operations, its business, financial position, or profit or loss.
The financial risk management structure includes identifying, determining, analyzing, quantifying, measuring and controlling these events. Management and, in particular, Finance Management, is responsible for constantly assessing the financial risk. The Company uses derivatives to hedge a significant portion of those risks.
| F- 53 |
Notes to the Consolidated Financial Statements as of December 31, 2018
| Note 5 | Financial Risk Management (continued) |
| 5.2 | Risk Factors |
| 5.2.1 | Credit risk |
A global economic downturn - and its potentially negative effects on the financial situation of our customers - could extend the payment terms of the Company's receivables by increasing its exposure to credit risk. Although measures are taken to minimize the risk, this global economic situation could mean losses with adverse material effects on the business, financial position or profit and loss of the Company's operations.
To mitigate these risks, the Company maintains active control of collection and uses measures such as the use of credit insurance, letters of credit and prepayments for a portion of receivables.
Financial investments correspond to time deposits whose maturity date is greater than 90 days and less than 360 days from the date of investment, so they are not exposed to excessive market risks.
The credit quality of financial assets that are not past due or impaired can be evaluated by reference to external credit ratings (if available) or historical information on counterparty late payment rates:
| Rating Institution | 12/31/2018 | |||||||||||
| Financial institution | Financial assets | Moody´s | S&P | Fitch | ThUS$ | |||||||
| Banco de Chile | Time deposits | P-1 | A-1 | - | 7,305 | |||||||
| Banco de Crédito e Inversiones | Time deposits | P-1 | A-1 | 27,428 | ||||||||
| Banco Itau Corpbanca | Time deposits | P-2 | A-2 | 61,946 | ||||||||
| Banco Santander | Time deposits | - | - | 432 | ||||||||
| Banco Estado | Time deposits | - | - | 3,602 | ||||||||
| BBVA Banco Francés | Time deposits | - | - | - | 84 | |||||||
| Nedbank | Time deposits | P-3 | B | - | 647 | |||||||
| JP Morgan US dollar Liquidity Fund Institutional | Investment fund deposits | - | - | - | 133,809 | |||||||
| Legg Mason - Western Asset Institutional Cash Reserves | Investment fund deposits | - | - | - | 132,108 | |||||||
| Total | 367,361 | |||||||||||
| Rating Institution | 12/31/2018 | |||||||||||
| Financial institution | Financial assets | Moody´s | S&P | Fitch | ThUS$ | |||||||
| Banco Sud Americano | 90 days to 1 year | - | - | - | 24,898 | |||||||
| Banco de Crédito e Inversiones | 90 days to 1 year | P-1 | A-1 | - | 145,834 | |||||||
| Banco Santander | 90 days to 1 year | P-1 | A-1 | - | 23,124 | |||||||
| Banco Itaú-Corpbanca | 90 days to 1 year | P-2 | A-2 | - | 70,719 | |||||||
| Banco Security | 90 days to 1 year | - | - | - | 27,215 | |||||||
| Total | 291,790 | |||||||||||
The following table presents comparative information as of December 2017:
| Rating Institution | 12/31/2017 | |||||||||||
| Financial institution | Financial assets | Moody´s | S&P | Fitch | ThUS$ | |||||||
| Banco BBVA Chile | Time deposits | P-2 | A-2 | - | 41,860 | |||||||
| Banco de Crédito e Inversiones | Time deposits | P-1 | A-1 | F1 | 120,616 | |||||||
| Banco Santander - Santiago | Time deposits | P-1 | A-1 | F1 | 35,558 | |||||||
| BBVA Banco Francés | Time deposits | - | - | - | 163 | |||||||
| Itau-Corpbanca | Time deposits | P-2 | A-2 | - | 75,072 | |||||||
| JP Morgan US dollar Liquidity Fund Institutional | Investment fund deposits | - | - | - | 143,333 | |||||||
| Legg Mason - Western Asset Institutional Cash Reserves | - | - | ||||||||||
| Reserves | Investment fund deposits | - | - | - | 144.464 | |||||||
| Scotiabank Sud Americano | Time deposit | - | - | 12,520 | ||||||||
| Nedank | Time deposit | P-3 | B | - | 3,686 | |||||||
| ABN Amro Bank | Time deposit | - | - | - | 1,439 | |||||||
| Total | 578,711 | |||||||||||
| F- 54 |
Notes to the Consolidated Financial Statements as of December 31, 2018
| Note 5 | Financial risk management, continued |
| 5.2.1 | Credit risk, Continued |
| Rating Institution | 12/31/2017 | |||||||||||
| Financial institution | Financial assets | Moody´s | S&P | Fitch | ThUS$ | |||||||
| Banco BBVA Chile | 90 days to 1 year | - | - | - | 1,207 | |||||||
| Banco de Crédito e Inversiones | 90 days to 1 year | P-1 | A-1 | F1 | 71,748 | |||||||
| Banco de Chile | 90 days to 1 year | 4,834 | ||||||||||
| Banco Itaú-Corpbanca | 90 days to 1 year | P-1 | A-2 | - | 77,526 | |||||||
| Banco Santander - Santiago | 90 days to 1 year | P-1 | A-1 | F1 | 163,269 | |||||||
| Morgan Stanley | 90 days to 1 year | P-2 | A-2 | F1 | 4,191 | |||||||
| Banco Security | 90 days to 1 year | - | - | - | 28,592 | |||||||
| Scotiabank Sud Americano | 90 days to 1 year | - | - | AA | 13,765 | |||||||
| Total | 365,132 | |||||||||||
| F- 55 |
Notes to the Consolidated Financial Statements as of December 31, 2018
| Note 5 | Financial risk management, continued |
| 5.2.2 | Currency risk |
The functional currency of the Company is the US Dollar, due to its influence on the determination of price levels, its relation to the cost of sales and considering that a significant part of the Company’s business is conducted in this currency. However, the global nature of the Company's business generates an exposure to exchange rate variations of several currencies with the US Dollar. Therefore, the Company maintains hedge contracts to mitigate the exposure generated by its main mismatches (net between assets and liabilities) in currencies other than the US dollar against the exchange rate variation, updating these contracts periodically depending on the amount of mismatching to be covered in these currencies. Occasionally, subject to the approval of the Company’s Board of Directors (the “Board”), the Company ensures short-term cash flows from certain specific line items in currencies other than the US Dollar.
A significant portion of the Company’s costs, especially salary payments, is associated with the Chilean peso (the “Peso”). Therefore, an increase or decrease in its exchange rate with the US Dollar would affect the Company's profit and loss. By the fourth quarter, approximately US$400 million accumulated in expenses are associated with the Peso. A significant part of the effect of these liabilities on the Statement of Financial Position is covered by derivative instrument operations that cover the balance sheet mismatch.
As of December 31, 2018, the Company held derivative instruments classified as hedges of foreign exchange risks associated with all of the bond liabilities denominated in UF, for a fair value of US$3.9 million against the Company. and as of December 31, 2017, it totaled US$5 million against the Company.
As of December 31, 2018, the exchange rate value for equivalent Pesos to US Dollars was Ch$694.77 per US Dollar, and as of December 31, 2017, it was Ch$614.75 per US Dollar.
| F- 56 |
Notes to the Consolidated Financial Statements as of December 31, 2018
| Note 5 | Financial risk management, continued |
| 5.2.3 | Interest rate risk |
Interest rate fluctuations, primarily due to the uncertain future behavior of markets, may have a material impact on the financial results of the Company.
The Company maintains current and non-current financial debt valued at the LIBOR rate plus spread.
As of December 31, 2018, the Company has around 5% of its financial liabilities linked to variations in the LIBOR rate and therefore any significant increases in that rate would impact its financial position. A change of 100 base points over that rate could generate variations in finance costs of around US$0.06 million.
Additionally, as of December 31, 2018, the Company does not maintain maturities of less than 12 months on all capital of the financial debt, thereby reducing exposure to variations in interest rates.
| 5.2.4 | Liquidity risk |
Liquidity risk relates to the funds needed to comply with payment obligations. The Company’s objective is to maintain financial flexibility through a comfortable balance between fund requirements and cash flows from regular business operations, bank borrowings, bonds, short term investments, and marketable securities, among others.
The Company has an important capital expense program which is subject to change over time.
On the other hand, world financial markets go through periods of contraction and expansion that are unforeseeable in the long-term and may affect SQM’s access to financial resources. Such factors may have a material adverse impact on the Company’s business, financial position and results of operations.
SQM constantly monitors the matching of its obligations with its investments, taking due care of maturities of both, from a conservative perspective, as part of this financial risk management strategy. As of December 31, 2018, the Company had unused, available revolving credit facilities with banks, for a total of approximately US$481 million.
The position in other cash and cash equivalents generated by the Company are invested in highly liquid mutual funds with an AAA risk rating.
| F- 57 |
Notes to the Consolidated Financial Statements as of December 31, 2018
| Note 5 | Financial risk management, continued |
| 5.2.4 | Liquidity risk, continued |
| As of December 31, 2018 | Nature of undiscounted cash flows | |||||||||||||||||||
| (in millions of US$) | Carrying amount | Less than 1 year | 1 to 5 years | Over 5 years | Total | |||||||||||||||
| Other non-derivative financial liabilities | ||||||||||||||||||||
| Bank borrowings | 70.25 | 4.10 | 79.66 | - | 83.76 | |||||||||||||||
| Unsecured obligations | 1,273.07 | 61.37 | 823.76 | 713.60 | 1,598.73 | |||||||||||||||
| Subtotal | 1,343.32 | 65.47 | 903.42 | 713.60 | 1,682.49 | |||||||||||||||
| Other derivative financial liabilities | ||||||||||||||||||||
| Hedging liabilities | (14.34 | ) | 5.52 | 15.64 | 29.27 | 50.43 | ||||||||||||||
| Derivative financial instruments | 0.16 | 0.16 | - | - | 0.16 | |||||||||||||||
| Subtotal | (14.18 | ) | 5.68 | 15.64 | 29.27 | 50.59 | ||||||||||||||
| Trade accounts payable and other accounts payable | 163.75 | 163.17 | 0.58 | - | - | |||||||||||||||
| Total | 1,492.89 | 234.32 | 919.64 | 742.87 | 1,733.08 | |||||||||||||||
| As of December 31, 2017 | Nature of undiscounted cash flows | |||||||||||||||||||
| (in millions of US$) | Carrying amount | Less than 1 year | 1 to 5 years | Over 5 years | Total | |||||||||||||||
| Other non-derivative financial liabilities | ||||||||||||||||||||
| Bank borrowings | 163.57 | 164.78 | - | - | 164.78 | |||||||||||||||
| Unsecured obligations | 1,054.89 | 47.45 | 522.52 | 751.67 | 1,321.64 | |||||||||||||||
| Subtotal | 1,218.46 | 212.23 | 522.52 | 751.67 | 1,486.42 | |||||||||||||||
| Other derivative financial liabilities | ||||||||||||||||||||
| Hedging liabilities | 28,38 | 37.01 | (9.51 | ) | (18.36 | ) | 9.14 | |||||||||||||
| Derivative financial instruments | 0,80 | 0.80 | - | - | 0.80 | |||||||||||||||
| Subtotal | 29,18 | 37.81 | (9.51 | ) | (18.36 | ) | 9.94 | |||||||||||||
| Trade accounts payable and other accounts payable | 196,28 | 196.18 | 0.10 | - | - | |||||||||||||||
| Total | 1,247.64 | 446.22 | 513.11 | 733.31 | 1,496.36 | |||||||||||||||
| 5.3 | Risk measurement |
The Company has methods to measure the effectiveness and efficiency of financial risk hedging strategies, both prospectively and retrospectively. These methods are consistent with the risk management profile of the Group.
| F- 58 |
Notes to the Consolidated Financial Statements as of December 31, 2018
| Note 6 | Background of companies included in consolidation |
| 6.1 | Parent’s stand-alone assets and liabilities |
| 12/31/2018 | 12/31/2017 | |||||||
| ThUS$ | ThUS$ | |||||||
| Assets | 3,737,892 | 3,658,528 | ||||||
| Liabilities | (1,652,401 | ) | (1,470,707 | ) | ||||
| Equity | 2,085,491 | 2,187,821 | ||||||
| 6.2 | Parent entity |
Pursuant to Article 99 of Law No. 18,045 of the Securities Market (the "Securities Market Law"), the Commission for Financial Market (the "CMF") may determine that a company does not have a controller in accordance with the distribution and dispersion of its ownership. On November 30, 2018, the CMF issued the ordinary letter No. 32.131 whereby it determined that Sociedad de Inversiones Pampa Calichera S.A., Potasios de Chile S.A. and Inversiones Global Mining (Chile) Limitada (the "Pampa Group"), do not exert decisive power over the management of the Company since it does not have a predominance in the ownership that allows it to make management decisions. Therefore, the CMF has determined not to consider Grupo Pampa the controller of the Company and that the Company does not have a controller given its current ownership structure.
| F- 59 |
Notes to the Consolidated Financial Statements as of December 31, 2018
| Note 6 | Background of companies included in consolidation (continued) |
| 6.3 | Background on non-controlling interests |
| Subsidiary |
% of interests in
the ownership held by non-controlling interests, |
Profit (loss) attributable to non-
controlling interests |
Equity, non-controlling
interests |
Dividends paid to non-
controlling interests |
||||||||||||||||||||||||
| 12/31/2018 | 12/31/2017 | 12/31/2018 | 12/31/2017 | 12/31/2018 | 12/31/2017 | |||||||||||||||||||||||
| ThUS$ | ThUS$ | ThUS$ | ThUS$ | ThUS$ | ThUS$ | |||||||||||||||||||||||
| Proinsa Ltda. | 0.1 | % | - | - | - | - | - | - | ||||||||||||||||||||
| SQM Potasio S.A. | 0.0000001 | % | - | - | - | - | - | - | ||||||||||||||||||||
| Ajay SQM Chile S.A. | 49 | % | 1,176 | 1,023 | 8,659 | 8,306 | 823 | 989 | ||||||||||||||||||||
| SQM Indonesia S.A. | 20 | % | - | - | 1 | 1 | - | - | ||||||||||||||||||||
| Soquimich Comercial S.A. | 39.3616784 | % | 1,375 | 100 | 41,855 | 49,247 | 8,910 | 1,264 | ||||||||||||||||||||
| Comercial Agrorama Ltda. | 30 | % | (318 | ) | (403 | ) | (481 | ) | (184 | ) | - | - | ||||||||||||||||
| Agrorama S.A. | 0.001 | % | - | - | - | - | - | - | ||||||||||||||||||||
| Orcoma Estudios SPA | 49 | % | - | - | 2,277 | 2,277 | - | - | ||||||||||||||||||||
| SQM (Thailand) Limited. | 0.004 | % | - | - | - | - | - | - | ||||||||||||||||||||
| Total | 2,233 | 720 | 52,311 | 59,647 | 9,733 | 2,253 | ||||||||||||||||||||||
| F- 60 |
Notes to the Consolidated Financial Statements as of December 31, 2018
| Note 7 | Board of Directors, Senior Management and Key management personnel |
| 7.1 | Board of Directors and Senior Management |
| 1) | Board of directors |
SQM S.A. is managed by a Board of Directors which is composed of 8 regular directors, 2 of whom are independent directors, who are elected for a three-year period. The present Board of Directors was elected by the shareholders at the Ordinary Shareholders' Meeting on April 27, 2018.
On December 5, 2018, directors Darryl Stann and Mark F. Fracchia presented their resignations to the Board of Directors, and to date no replacements have been named.
As of December 31, 2018, the Company has the following Committees:
| - | Directors’ Committee: This committee comprises Hernán Büchi Buc, Laurence Golbome Riveros and Alberto Salas Muñoz and fulfills the functions established in Article 50 bis of Chilean Law no. 18.046 on publicly-held corporations. |
| - | The Company’s Health, Safety and Environmental Matters Committee: This committee comprises Arnfinn F. Prugger, Patricio Contesse Fica and Gonzalo Guerrero Yamamoto. |
| - | Corporate Governance Committee: Comprised of Hernán Büchi Buc. In the session held in December 2018, in consideration of the resignation of directors Darryl Stann and Mark F. Fracchia, the Board of Directors decided move forward on issues pertaining to this committee. |
During the periods covered by these financial statements, there are no pending balances receivable and payable between the Company, its directors or members of Senior Management, other than those related to remuneration, fee allowances and profit-sharing. In addition, there were no transactions conducted between the Company, its directors or members of Senior Management.
| F- 61 |
Notes to the Consolidated Financial Statements as of December 31, 2018
| Note 7 | Board of Directors, Senior Management and Key management personnel (continued) |
| 7.1 | Board of Directors and Senior Management, continued |
| 2) | Directors’ Compensation |
Directors’ compensation is detailed as follows:
| a) | The payment of a fixed, gross and monthly amount of UF 400 in favor of the Chairman of the Board of Directors of SQM S.A. and of UF 350 in favor of the remaining seven Directors of SQM S.A. and regardless of the number of Board of Directors’ Meetings held or not held during the related month. |
| b) | A payment in domestic currency in favor of the Chairman of the Company’s Board of Directors consisting of a variable and gross amount equivalent to 0.12% of profit for the period effectively earned by the Company during the 2018 fiscal year. |
| c) | A payment in domestic currency in favor of each Company’s directors excluding the Chairman of the Board, consisting of a variable and gross amount equivalent to 0.06% of profit for the period effectively earned by the Company during the 2018 fiscal year. |
| d) | The fixed and variable amounts indicated above cannot be altered and those expressed in percentages will be paid after the related General Shareholders’ Meeting of SQM S.A. approves the Balance Sheet, Financial Statements, Annual Report, the Account Inspectors’ Report and Independent Auditor’s Report of SQM S.A. for the commercial year ended December 31, 2018. |
| e) | The amounts expressed in UF will be paid in accordance with the value determined by the Chilean Superintendence of Banks and Financial Institutions (SBIF), the Central Bank of Chile (Banco Central de Chile) or another relevant institution replacing them during the last day of the calendar year applicable. The amounts reflected in or referred to in U.S. dollars will be converted to Chilean pesos and paid in Chilean pesos in accordance with the exchange rate in force when the dividend for the 2018 fiscal year is paid. |
| f) | Therefore, the remunerations and profit sharing paid to members of the Board of Directors and Audit Committee as of December 31, 2018, amount to ThUS$3,791, and ThUS$ 3,231 as of December 31, 2017. |
| 3) | Directors’ Committee |
The remuneration of the Directors Committee comprises:
| a) | The payment of a fixed, gross and monthly amount of UF 113 in favor of each of the 3 directors that are members of the Directors’ Committee, regardless of the number of meetings of the Directors’ Committee that have or have not been held during the month concerned. |
| b) | The payment in domestic currency and in favor of each of the 3 directors of a variable and gross amount equivalent to 0.02% of total net profit that the Company effectively obtains during the 2018 fiscal year. |
| c) | Approval of a budget for operating costs for the Directors’ Committee equal to the total of their joint annual remunerations plus ThUS$825. |
| F- 62 |
Notes to the Consolidated Financial Statements as of December 31, 2018
| Note 7 | Board of Directors, Senior Management and Key management personnel (continued) |
| 7.1 | Board of Directors and Senior Management, continued |
| d) | The fixed and variable amounts indicated above cannot be altered and those expressed in percentages will be paid after the related General Shareholders’ Meeting of SQM S.A. approves the Balance Sheet, Financial Statements, Annual Report, the Account Inspectors’ Report and Independent Auditor’s Report of SQM S.A. for the commercial year ended December 31, 2018. |
| e) | The amounts expressed in UF will be paid in accordance with the value determined by the Chilean Superintendence of Banks and Financial Institutions (SBIF), the Central Bank of Chile (Banco Central de Chile) or another relevant institution replacing them during the last day of the calendar year applicable. The amounts reflected in or referred to in U.S. dollars will be converted to Chilean pesos and paid in Chilean pesos in accordance with the exchange rate in force when the dividend for the 2018 fiscal year is paid. |
| 4) | Health, Safety and Environmental Matters Committee: |
The remuneration for this committee is composed of the payment of a fixed, gross and monthly amount of UF 50 for each of the 3 Directors on the committee, regardless of the number of meetings it has held.
| 5) | Corporate Governance Committee |
The remuneration for this committee is composed of the payment of a fixed, gross, monthly amount of UF 50 for each of the 3 Directors on the committee regardless of the number of meetings it has held.
| F- 63 |
Notes to the Consolidated Financial Statements as of December 31, 2018
| Note 7 | Board of Directors, Senior Management and Key management personnel (continued) |
| 7.1 | Board of Directors and Senior Management, continued |
| 6) | No guarantees have been constituted in favor of the directors. |
| 7) | Senior management compensation: |
| a) | As of December 31, 2018, the global compensation paid to the 123 main executives amounts to ThUS$27,907, the global compensation paid to the 115 main executives as of December 31, 2017 amounted to ThUS$27,367. This includes monthly fixed salary and variable performance bonuses. |
| b) | SQM S.A. has an annual bonus plan based on goal achievement and individual contribution to the Company’s results. These incentives are structured as a minimum and maximum number of gross monthly salaries and are paid once a year. |
| c) | The Company also has retention bonuses for its executives. The value of these bonuses is linked to the Company's stock price and is payable in cash during the first quarter of 2021 (see Note 18.6). |
| 8) | No guarantees have been constituted in favor of the Company’s management. |
| 9) | The Company’s Managers and Directors do not receive or have not received any benefit during the period ended December 31, 2018 and the year ended December 31, 2017 or compensation for the concept of pensions, life insurance, paid time off, profit sharing, incentives, or benefits due to disability other than those mentioned in the preceding points. |
| 7.2 | Key management personnel compensation |
As of December 31, 2018, there are 123 people occupying key management positions and 115 as of December 31, 2017.
| 12/31/2018 | 12/31/2017 | |||||||
| ThUS$ | ThUS$ | |||||||
| Key management personnel compensation (1) | 27,907 | 27,367 | ||||||
| (1) | Corresponds to a number of executives (see Note 7.1 number 3) a). |
| F- 64 |
Notes to the Consolidated Financial Statements as of December 31, 2018
| Note 8 | Equity-accounted investees |
| 8.1 | Investments in associates recognized according to the equity method of accounting |
As of December 31, 2018 and December 31, 2017, in accordance with criteria established in Note 3.19, investment in associates recognized according to the equity method of accounting and joint ventures are as follows:
| Associates | Equity-accounted investees |
Share in profit
(loss) of associates and
joint ventures accounted for using the equity method |
Share in other
comprehensive
income of associates and joint ventures accounted for using the equity method, net of tax |
Share in total
other comprehensive income of
associates and joint ventures accounted for using the equity method |
||||||||||||||||||||||||||||||||||||
| 12/31/2018 | 12/31/2017 | 12/31/2018 | 12/31/2017 | 12/31/2016 | 12/31/2018 | 12/31/2017 | 12/31/2018 | 12/31/2017 | 12/31/2016 | |||||||||||||||||||||||||||||||
| ThUS$ | ThUS$ | ThUS$ | ThUS$ | ThUS$ | ThUS$ | ThUS$ | ThUS$ | ThUS$ | ThUS$ | |||||||||||||||||||||||||||||||
| Sales de Magnesio Ltda. | - | - | - | - | 514 | - | - | - | - | 514 | ||||||||||||||||||||||||||||||
| Abu Dhabi Fertilizer Industries WWL | 10,821 | 15,936 | 596 | 1,483 | 1,482 | - | - | 596 | 1,483 | 1,482 | ||||||||||||||||||||||||||||||
| Doktor Tarsa Tarim Sanayi AS | 21,582 | 21,788 | 241 | 6,427 | 4,026 | 489 | - | 730 | 6,427 | 4,616 | ||||||||||||||||||||||||||||||
| Ajay North America | 14,951 | 14,432 | 3,728 | 3,677 | 2,794 | - | - | 3,728 | 3,677 | 2,794 | ||||||||||||||||||||||||||||||
| Ajay Europe SARL | 7,845 | 8,144 | 1,373 | 1,049 | 1,132 | (439 | ) | 26 | 934 | 1,075 | 1,126 | |||||||||||||||||||||||||||||
| Charlee SQM Thailand Co, Ltd, | - | 2,301 | 316 | 393 | 244 | - | - | 316 | 393 | 244 | ||||||||||||||||||||||||||||||
| SQM Eastmed Turkey, | 310 | - | 370 | (25 | ) | - | (21 | ) | - | 349 | (25 | ) | - | |||||||||||||||||||||||||||
| Kore Potash Ltd, | 20,467 | 20,000 | (1,543 | ) | - | - | (1,206 | ) | - | (2,749 | ) | - | - | |||||||||||||||||||||||||||
| Total | 75,976 | 82,601 | 5,081 | 13,004 | 10,192 | (1,177 | ) | 26 | 3,904 | 13,030 | 10,776 | |||||||||||||||||||||||||||||
| F- 65 |
Notes to the Consolidated Financial Statements as of December 31, 2018
| Note 8 | Equity-accounted investees (continued) |
| 8.1 | Investments in associates recognized according to the equity method of accounting, continued |
| Associate | Description of the nature of the relationship | Domicile |
Country of
incorporation |
Share of
ownership
in associates |
Dividends received | |||||||||||||
| 12/31/2018 | 12/31/2017 | |||||||||||||||||
| ThUS$ | ThUS$ | |||||||||||||||||
| Abu Dhabi Fertilizer Industries WWL | Distribution and commercialization of specialty plant nutrients in the Middle East. | PO Box 71871, Abu Dhabi | United Arab Emirates | 37 | % | 5,641 | - | |||||||||||
| Doktor Tarsa Tarim Sanayi AS | Distribution and commercialization of specialty plant nutrients in Turkey. | Organize Sanayi Bolgesi, Ikinci Kisim, 22 cadde TR07100 Antalya | Turkey | 50 | % | - | - | |||||||||||
| Ajay North America | Production and distribution of iodine derivatives. | 1400 Industry RD Power Springs GA 30129 | United States | 49 | % | 2,807 | 1,123 | |||||||||||
| Ajay Europe SARL | Production and commercialization of iodine derivatives. | Z.I. du Grand Verger BP 227 53602 Evron Cedex | France | 50 | % | 811 | 968 | |||||||||||
| SQM Eastmed Turkey | Production and commercialization of specialty products. | Organize Sanayi Bolgesi, Ikinci Kisim, 22 cadde TR07100 Antalya | Turkey | 50 | % | - | - | |||||||||||
| Charlee SQM Thailand Co. Ltd. | Distribution and commercialization of specialty plant nutrients. | 31 Soi 138 (Meesuk) LLapdrawrd, Bangkapi, 10240 Bangkok | Thailand | 40 | % | 362 | - | |||||||||||
| Kore Potash Ltd. | Prospecting, exploration and mining development. | L 3 88 William St Perth, was 6000 | Australia | 17,52 | % | - | - | |||||||||||
| Total | 9,621 | 2,091 | ||||||||||||||||
| F- 66 |
Notes to the Consolidated Financial Statements as of December 31, 2018
| Note 8 | Equity-accounted investees (continued) |
| 8.1 | Investments in associates recognized according to the equity method of accounting, continued |
The companies described in the table below are related parties of the following associates:
| (1) | Doktor Tarsa Tarim Sanayi AS |
| (2) | Terra Tarsa B.V |
| (3) | Abu Dhabi Fertilizer Industries WWL |
|
Company
|
Description of the nature of the relationship | Domicile |
Country of
incorporation |
Share of
ownership in associates |
Dividends
received |
|||||||||||||
| Terra Tarsa B.V. (1) | Distribution and trading of specialty plant nutrients, | Herikerbergweg 238, Luna Arena, 1101CM Amsterdam PO Box 23393, 1100DW Amsterdam Zuidoost | Holland | 50 | % | - | - | |||||||||||
| Plantacote N.V. (1) | Sale of CRF and production and sales of WSNPK | Houtdok-Noordkaai 25a, 2030 Antwerpen, Belgium | Belgium | 100 | % | - | - | |||||||||||
| Doktolab Tarim Arastima San, Tic As (1) | Laboratory services | 27, Cd, No:2, 07190 Aosb 2, Kısım/Döşemealtı, Antalya, Turkey | Turkey | 100 | % | - | - | |||||||||||
| Terra Tarsa Ukraine LLC (2) | Distribution and trading of specialty plant nutrients, | 74800 Ukraine, Kakhovka, 4 Yuzhnaya Str, | Ukraine | 100 | % | - | - | |||||||||||
| Terra Tarsa Don LLC (2 | Distribution and sale of specialty fertilizers | Zorge Street, house 17, 344090, Rostov-on-Don | Russian Federation | 100 | % | - | - | |||||||||||
| Internacional Technical and Trading Agenies Co. WLL (3) | Distribution and trading of specialty plant nutrients, in the Middle East | P.O Box: 950918 Amman 11195 | Jordania | 50 | % | - | - | |||||||||||
| Total | - | - | ||||||||||||||||
| F- 67 |
Notes to the Consolidated Financial Statements as of December 31, 2018
| Note 8 | Equity-accounted investees (continued) |
| 8.2 | Assets, liabilities, revenue and expenses of associates |
| 12/31/2018 | ||||||||||||||||||||||||||||||||
| Associate | Assets | Liabilities |
Gain (loss)
from
continuing |
Other
comprehensive |
Comprehensive
|
|||||||||||||||||||||||||||
| Current | Non-current | Current | Non-current | Revenue | operations | income | income | |||||||||||||||||||||||||
| ThUS$ | ThUS$ | ThUS$ | ThUS$ | ThUS$ | ThUS$ | ThUS$ | ThUS$ | |||||||||||||||||||||||||
| Abu Dhabi Fertilizer Industries WWL | 32,093 | 2,847 | 5,695 | - | 33,098 | 1,611 | (1 | ) | 1,610 | |||||||||||||||||||||||
| Doktor Tarsa Tarim Sanayi AS | 66,498 | 12,242 | 27,067 | 8,509 | 74,144 | 481 | 978 | 1,459 | ||||||||||||||||||||||||
| Ajay North America | 21,644 | 12,409 | 3,542 | - | 40,290 | 7,608 | - | 7,608 | ||||||||||||||||||||||||
| Ajay Europe SARL | 21,219 | 1,214 | 6,743 | - | 36,337 | 2,747 | (878 | ) | 1,869 | |||||||||||||||||||||||
| SQM Eastmed Turkey | 1,724 | 2,160 | 1,829 | 1,434 | 3,192 | 740 | (42 | ) | 698 | |||||||||||||||||||||||
| Kore Potash Ltd. | 6,659 | 148,426 | 2,180 | - | - | (8,198 | ) | (6,882 | ) | (15,080 | ) | |||||||||||||||||||||
| Total | 149,837 | 179,298 | 47,056 | 9,943 | 187,061 | 4,989 | (6,825 | ) | (1,836 | ) | ||||||||||||||||||||||
| 12/31/2017 | ||||||||||||||||||||||||||||||||
| Associate | Assets | Liabilities |
Gain
(loss) from
continuing |
Other
comprehensive |
Comprehensive
|
|||||||||||||||||||||||||||
| Current | Non-current | Current | Non-current | Revenue | operations | income | income | |||||||||||||||||||||||||
| ThUS$ | ThUS$ | ThUS$ | ThUS$ | ThUS$ | ThUS$ | ThUS$ | ThUS$ | |||||||||||||||||||||||||
| Abu Dhabi Fertilizer Industries WWL | 44,801 | 2,032 | 3,764 | - | 35,131 | 4,008 | (4 | ) | 4,004 | |||||||||||||||||||||||
| Doktor Tarsa Tarim Sanayi AS | 81,057 | 10,731 | 36,960 | 11,251 | 75,269 | 12,854 | (4,367 | ) | 8,487 | |||||||||||||||||||||||
| Ajay North America | 19,426 | 12,498 | 2,470 | - | 36,185 | 7,505 | - | 7,505 | ||||||||||||||||||||||||
| Ajay Europe SARL | 23,555 | 1,266 | 8,534 | - | 32,310 | 2,098 | 2,208 | 4,306 | ||||||||||||||||||||||||
| Charlee SQM Thailand Co. Ltd. | 8,585 | 712 | 3,292 | 255 | 13,618 | 981 | 414 | 1,395 | ||||||||||||||||||||||||
| SQM Eastmed Turkey | 3,981 | 2,671 | 4,487 | 2,260 | 2,389 | (49 | ) | (12 | ) | (61 | ) | |||||||||||||||||||||
| Total | 181,405 | 29,910 | 59,507 | 13,766 | 194,902 | 27,397 | (1,761 | ) | 25,636 | |||||||||||||||||||||||
| F- 68 |
Notes to the Consolidated Financial Statements as of December 31, 2018
| Note 8 | Equity-accounted investees (continued) |
| 8.2 | Assets, liabilities, revenue and expenses of associates |
| 12/31/2016 | ||||||||||||||||||||||||||||||||
| Associate | Assets | Liabilities |
Gain
(loss) from
continuing |
Other
comprehensive |
Comprehensive
|
|||||||||||||||||||||||||||
| Current | Non-current | Current | Non-current | Revenue | operations | income | income | |||||||||||||||||||||||||
| ThUS$ | ThUS$ | ThUS$ | ThUS$ | ThUS$ | ThUS$ | ThUS$ | ThUS$ | |||||||||||||||||||||||||
| Abu Dhabi Fertilizer Industries WWL | 37,801 | 2,104 | 3,843 | - | 41,442 | 4,005 | - | 4,005 | ||||||||||||||||||||||||
| Doktor Tarsa Tarim Sanayi AS | 68,449 | 5,984 | 39,729 | 1,281 | 83,905 | 8,052 | 1,180 | 9,232 | ||||||||||||||||||||||||
| Ajay North America | 18,844 | 11,633 | 3,015 | - | 35,715 | 5,702 | - | 5,702 | ||||||||||||||||||||||||
| Ajay Europe SARL | 20,675 | 1,361 | 7,290 | - | 33,319 | 2,265 | (13 | ) | 2,252 | |||||||||||||||||||||||
| Charlee SQM Thailand Co. Ltd. | 6,264 | 591 | 2,448 | - | 12,065 | 609 | - | 609 | ||||||||||||||||||||||||
| SQM Eastmed Turkey | 727 | 2,265 | 719 | 2,362 | 833 | (200 | ) | - | (200 | ) | ||||||||||||||||||||||
| Total | 152,760 | 23,938 | 57,044 | 3,643 | 207,279 | 20,433 | 1,167 | 21,600 | ||||||||||||||||||||||||
| F- 69 |
Notes to the Consolidated Financial Statements as of December 31, 2018
| Note 8 | Equity-accounted investees (continued) |
| 8.3 | Other information |
The Company has no participation in unrecognized losses in investments in associates.
| 8.4 | Disclosures on interest in associates |
a) Transactions conducted in 2018:
During the first quarter, SQM S.A. increased its capital in Kore Potash Ltd, by ThUS$ 3,000.
In March 2018, the company Abu Dhabi Fertilizer Industries WLL paid dividends of ThUS$ 10,890. 50% of the distributed dividend was charged to retained earnings subsequent to 2014, in line with the Company’s statutes that establish that 37% of the distributed dividend corresponds to SQM. The remaining 50% was charged to retained earnings generated between 2004 and 2014, in line with the Company’s statutes that establish that 50% of the distributed dividend corresponds to SQM.
In March 2018, the company Ajay North America paid dividends of ThUS$ 1,432.
In June 2018, the associate company Doktor Tarsa Tarim, made a capital increase of 86 million Turkish Lira (ThUS$ 18,753), which was generated by the reclassification of retained earnings.
In June 2018, the company Abu Dhabi Fertilizer Industries WWL paid dividends of ThUS$ 4,348. 50% of the distributed dividend was charged to retained earnings subsequent to 2014, in line with the Company’s statutes that establish that 37% of the distributed dividend corresponds to SQM. The remaining 50% was charged to retained earnings generated between 2004 and 2014, in line with the Company’s statutes that establish that 50% of the distributed dividend corresponds to SQM.
In June 2018, the company Ajay North America paid dividends of ThUS$1,432.
In June 2018, the company Ajay North Europe SARL paid dividends of ThUS$1,622.
In June 2018, the company Charlee SQM Thailand Co. Ltd. paid dividends of ThUS$906.
In September 2018, the company Ajay North America paid dividends of ThUS$1,432.
| F- 70 |
Notes to the Consolidated Financial Statements as of December 31, 2018
| Note 8 | Equity-accounted investees (continued) |
| 8.4 | Disclosures on interest in associates, continued |
a) Transactions conducted in 2018, continued:
In September 2018 the company Ajay North America paid total dividends of ThUS$1,432.
On November 14, 2018, Soquimich European Holdings B.V. sold its share in Charlee SQM Thailand Co. Ltd., generating a loss of ThUS$759.
In December 2018 the company Ajay North America paid total dividends of ThUS$1.432.
b) Transactions conducted in 2017:
As of December 31, 2017, a capital increase was registered for Plantacote N.V. in a sum of ThUS$4,208 (equivalent to Th€3,500), which is 100% owned by the associate company Doktor Tarsa Tarim. The functional currency of Plantacote N.V. is the Euro. The contribution was made under the heading “Subordinated loan from Dr. Tarsa”. This contribution had no impact on the Company's consolidated results.
| F- 71 |
Notes to the Consolidated Financial Statements as of December 31, 2018
| Note 9 | Joint Ventures |
| 9.1 | Policy for the accounting of equity accounted investment in joint ventures |
The method for recognizing joint ventures is that in which participation is initially recorded at cost, and subsequently adjusted, considering changes after the acquisition in the portion of the entity’s net assets that correspond to the investor. Profit or loss for the period will include the portion of the entity’s entire profit or loss that correspond to the investor. For these joint ventures there is no quoted market price to measure these investments. (See Note 3.20)
There are no significant restrictions on these joint ventures for the transfer of funds as payment of dividends or others.
At the date of issuance of these financial statements, SQM is not aware of the existence of any significant contingent liabilities associated with the partnerships in joint ventures.
| 9.2 | Disclosures of interest in joint ventures |
a) Operations conducted in 2018
During the first quarter of 2018, Minera Exar S.A. increased its capital by ThUS$13,000. The entity is a joint venture and contributions were made on January 25, 2018 (ThUS$6,000) and February 14, 2018 (ThUS$7,000) by SQM Potasio S.A. and Lithium Americas Corporation (LAC). Both partners share 50% ownership of the respective company, each contributing the same share in these capital increases.
In April 2018, Minera Exar made a new capital increase of ThUS$7,000, which was contributed in equal parts by its partners.
On March 14, 2018, the company SQM Vitas Plantacote B.V. was closed.
As of the date of the presentation of these financial statements, Minera Exar S.A. has changed its functional currency from the Argentine peso to the United States dollar.
On May 15, 2018, the subsidiary Soquimich European Holdings BV, signed a joint venture agreement with PAVONI & C., SpA in Italy. US$6.8 million were paid for a 50% share.
The goodwill generated in the purchase of this joint venture was ThUS$3,206.
| F- 72 |
Notes to the Consolidated Financial Statements as of December 31, 2018
| Note 9 | Joint Ventures (continued) |
| 9.2 | Disclosures of interest in joint ventures, continued |
On December 31, 2018, as part of the investment in Pavoni & C., SpA, the goodwill generated in the purchase of this joint venture was ThUS$3,206.
In December 2018, SQM S.A. sold the share it held in Minera Exar S.A. generating a pre-tax profit of ThUS$14,507, which was presented in the Consolidated Statement of Income by Function in Other gains (losses) (See Note 25.6)
The subsidiary SQM Industrial S.A., has recorded an impairment loss of ThUS$8,802, corresponding to its Sichuan SQM-Migao Chemical Fertilizer Co. Ltd. joint venture. The impairment is disclosed by deducting the value of the aforementioned investment, in the caption “Equity method investments".
b) Operations conducted in 2017
On December 1, 2017, SQM Potasio S.A. recognized the goodwill value generated by the acquisition of 50% of the joint venture Minera Exar S.A. in the amount ThUS$6,205.
On October 6, 2017, a capital contribution of ThUS$13,300 (ThARS230,422,5) was made in mining company EXAR S.A., which is 50% owned by the subsidiary SQM Potasio S.A. The functional currency of EXAR S.A. is the Argentine peso (ARS). This contribution had no impact on the Company's consolidated results.
| F- 73 |
Notes to the Consolidated Financial Statements as of December 31, 2018
| Note 9 | Joint Ventures (continued) |
| 9.3 | Investment in joint ventures accounted for under the equity method of accounting |
| Country of | Share of interest in | Dividends received | ||||||||||||||||
| Joint venture | Description of the nature of the relationship | Domicile | incorporation | ownership | 12/31/2018 | 12/31/2017 | ||||||||||||
| ThUS$ | ThUS$ | |||||||||||||||||
| Sichuan SQM Migao Chemical Fertilizers Co. Ltda. | Production and distribution of soluble fertilizers, | Huangjing Road, Dawan Town, Qingbaijiang District, Chengdu Municipality, Sichuan Province | China | 50 | % | - | - | |||||||||||
| Coromandel SQM India | Production and distribution of potassium nitrate, | 1-2-10 Sardar Patel Road, Secunderabad – 500003 Andhra Pradesh | India | 50 | % | - | - | |||||||||||
| SQM Vitas Fzco. | Production and commercialization of specialty plant and animal nutrition and industrial hygiene, | Jebel ALI Free Zone P.O. Box 18222, Dubai | United Arab Emirates | 50 | % | - | - | |||||||||||
| SQM Star Qingdao Corp Nutrition, Co. Ltd. | Production and distribution of nutrient plant solutions with specialties NPK soluble | Longquan Town, Jimo City, Qingdao Municipality, Shangdong Province | China | 50 | % | - | - | |||||||||||
| SQM Vitas Holland B.V. (1) | Without information | Herikerbergweg 238, 1101 CM Amsterdam Zuidoost | Holland | 50 | % | - | - | |||||||||||
| Pavoni & C. Spa | Production of specialized fertilizers and other products for distribution in Italy and other countries | Corso Italia 172, 95129 Catania (CT), Sicily | Italy | 50 | % | - | - | |||||||||||
| Covalent Lithium Pty Ltd. | development and operation of the Mt Holland Lithium project, which will include the construction of a lithium extraction and refining mine | L18, 109 St. Georges Tce Perth WA 6000 PO Box Z5200 St Georges Tce Perth WA 6831 | Australia | 50 | % | - | - | |||||||||||
| Minera Exar S.A. | Exploration and exploitation of minerals, processing and trading of such minerals | Dr. Sabín 1082 Ciudad de Nieva – San Salvador de Jujuy- Jujuy- República Argentina | Argentina | 50 | % | - | - | |||||||||||
| (1) | During May 2016, SQM Vitas Holland B.V. sold its interest in SQM Vitas Spain, to SQM Iberian S.A. resulting in the latter obtaining 100% in this transaction generating a loss of ThUS$104. |
| F- 74 |
Notes to the Consolidated Financial Statements as of December 31, 2018
| Note 9 | Joint Ventures (continued) |
| 9.3 | Investment in joint ventures accounted for under the equity method of accounting, continued |
The companies described in the following table are related to the following joint ventures:
| (1) | SQM Vitas Fzco. |
| (2) | Pavoni & C Spa. |
| (3) | SQM Vitas Holland B.V. |
| Domicile |
Country of
incorporation |
Share of interest in
ownership |
Dividends received | |||||||||||
| SQM Vitas Brazil Agroindustria (1) | Production and commercialization of specialty plant and animal nutrition and industrial hygiene, | Via Cndeias, Km, 01 Sem Numero, Lote 4, Bairro Cia Norte, Candeias, Bahia, | Brazil | 49.99 | % | - | - | |||||||
| SQM Vitas Peru S.A.C (1), | Production and commercialization of specialty plant and animal nutrition and industrial hygiene | Av, Juan de Arona 187, Torre B, Oficina 301-II, San Isidro, Lima | Peru | 50 | % | - | - | |||||||
| Arpa Speciali S.R.L. (2) | Production of specialty fertilizers and other products for distribution in Italy and other countries. | Mantova (MN) via Cremona 27 Int. 25 | Italy | 50.48 | % | - | - | |||||||
| SQM Vitas Plantacote B.V. (3) | Production and commercialization of controlled-released fertilizers | Herikerbergweg 238, 1101 CM Amsterdam Zuidoost | Holland | 50 | % | - | - | |||||||
| Joint Venture | Final reporting period date | Accounting method | ||
| Coromandel SQM India | December 31, 2018 | Equity method | ||
| SQM Vitas Fzco. | December 31, 2018 | Equity method | ||
| SQM Star Qingdao Corp Nutrition Co., Ltd. | December 31, 2018 | Equity method | ||
| SQM Vitas Brazil Agroindustria | December 31, 2018 | Equity method | ||
| SQM Vitas Perú S.A.C. | December 31, 2018 | Equity method | ||
| SQM Vitas Holland B.V. | December 31, 2018 | Equity method | ||
| Pavoni & C. Spa. | December 31, 2018 | Equity method | ||
| Arpa Speciali S.R.L. | December 31, 2018 | Equity method | ||
| Covalent Lithium Pty Ltd. | December 31, 2018 | Equity method |
| F- 75 |
Notes to the Consolidated Financial Statements as of December 31, 2018
| Note 9 | Joint Ventures (continued) |
| 9.3 | Investment in joint ventures accounted for under the equity method of accounting, continued: |
| Joint Venture | Equity-accounted investees |
Share
in profit (loss) of associates and joint
ventures accounted for using the equity method |
||||||||||||||||||||||
| 12/31/2018 | 12/31/2017 | 12/31/2016 | 12/31/2018 | 12/31/2017 | 12/31/2016 | |||||||||||||||||||
| ThUS$ | ThUS$ | ThUS$ | ThUS$ | ThUS$ | ThUS$ | |||||||||||||||||||
| Sichuan SQM Migao Chemical Fertilizers Co. Ltd. (1) | 1,992 | 11,444 | 12,150 | (650 | ) | (535 | ) | (1,372 | ) | |||||||||||||||
| Coromandel SQM India | 1,729 | 1,633 | 1,499 | 174 | 165 | 435 | ||||||||||||||||||
| SQM Vitas Fzco. | 20,202 | 19,478 | 17,956 | 1,781 | 1,502 | 3,458 | ||||||||||||||||||
| SQM Star Qingdao Corp. Nutrition Co. Ltd. | 3,168 | 2,980 | 2,618 | 188 | 361 | 163 | ||||||||||||||||||
| SQM Vitas Holland | 1,345 | 1,429 | 1,269 | (14 | ) | (18 | ) | 171 | ||||||||||||||||
| Minera Exar S.A. (1) | - | 33,065 | 25,000 | (206 | ) | (27 | ) | - | ||||||||||||||||
| Pavoni & C., Spa | 7,084 | - | - | (39 | ) | - | - | |||||||||||||||||
| Covalent Lithium Pty Ltd. | 53 | - | - | 36 | - | - | ||||||||||||||||||
| Total | 35,573 | 70,029 | 60,492 | 1,270 | 1,448 | 2,855 | ||||||||||||||||||
| Joint Venture |
Share
on other comprehensive income of
associates and joint ventures accounted for using the equity method, net of tax |
Share
on total other comprehensive income of
associates and joint ventures accounted for using the equity method |
||||||||||||||||||||||
| 12/31/2018 | 12/31/2017 | 12/31/2016 | 12/31/2018 | 12/31/2017 | 12/31/2016 | |||||||||||||||||||
| ThUS$ | ThUS$ | ThUS$ | ThUS$ | ThUS$ | ThUS$ | |||||||||||||||||||
| Sichuan SQM Migao Chemical Fertilizers Co. Ltd. (1) | - | - | - | (650 | ) | (535 | ) | (1,372 | ) | |||||||||||||||
| Coromandel SQM India | - | - | - | 174 | 165 | 435 | ||||||||||||||||||
| SQM Vitas Fzco. | - | (5 | ) | 449 | 1,781 | 1,497 | 3,907 | |||||||||||||||||
| SQM Star Qingdao Corp. Nutrition Co. Ltd. | 1 | - | - | 189 | 361 | 163 | ||||||||||||||||||
| SQM Vitas Holland | - | - | - | (14 | ) | (18 | ) | 171 | ||||||||||||||||
| Minera Exar S.A. (1) | (1 | ) | - | - | (206 | ) | (27 | ) | - | |||||||||||||||
| Pavoni & C., Spa | - | - | - | (40 | ) | - | - | |||||||||||||||||
| Covalent Lithium Pty Ltd. | - | - | - | 53 | - | - | ||||||||||||||||||
| Total | - | (5 | ) | 449 | 1,287 | 1,443 | 3,304 | |||||||||||||||||
| (1) | As of December 31, 2018, the table below does not present investments in joint ventures transferred to the item non-current assets or groups of assets classified as held for sale. For more information, see Note 31. |
| F- 76 |
Notes to the Consolidated Financial Statements as of December 31, 2018
| Note 9 | Joint Ventures (continued) |
| 9.3 | Investment in joint ventures accounted for under the equity method of accounting, continued: |
| Joint Venture | Equity-accounted investees |
Share
in profit (loss) of associates and joint
ventures accounted for using the equity method |
||||||||||||||||||||||
| 12/31/2018 | 12/31/2017 | 12/31/2016 | 12/31/2018 | 12/31/2017 | 12/31/2016 | |||||||||||||||||||
| ThUS$ | ThUS$ | ThUS$ | ThUS$ | ThUS$ | ThUS$ | |||||||||||||||||||
| SQM Vitas Brazil Agroindustria (1) | 12,405 | 11,003 | 9,343 | 2,879 | 1,753 | 4,570 | ||||||||||||||||||
| SQM Vitas Peru S.A.C (1) | 5,188 | 5,961 | 5,964 | (550 | ) | (216 | ) | 815 | ||||||||||||||||
| SQM Vitas Plantacote B.V. (2) | - | 669 | 588 | - | (1 | ) | 187 | |||||||||||||||||
| Arpa Speciali S.R.L. (3) | 122 | - | - | (88 | ) | - | - | |||||||||||||||||
| Total | 17,715 | 17,633 | 15,895 | 2,241 | 1,536 | 5,572 | ||||||||||||||||||
| Joint Venture |
Share
in other comprehensive income of associates
and joint ventures accounted for using the equity method, net of tax |
Share
in total other comprehensive income of
associates and joint ventures accounted for using the equity method |
||||||||||||||||||||||
| 12/31/2018 | 12/31/2017 | 12/31/2016 | 12/31/2018 | 12/31/2017 | 12/31/2016 | |||||||||||||||||||
| ThUS$ | ThUS$ | ThUS$ | ThUS$ | ThUS$ | ThUS$ | |||||||||||||||||||
| SQM Vitas Brazil Agroindustria (1) | (661 | ) | (51 | ) | 2,845 | 779 | 826 | 5,130 | ||||||||||||||||
| SQM Vitas Peru S.A.C (1) | - | - | - | (275 | ) | (108 | ) | 408 | ||||||||||||||||
| SQM Vitas Plantacote B.V. (2) | - | - | - | - | (1 | ) | (80 | ) | ||||||||||||||||
| Arpa Speciali S.R.L. (3) | - | - | - | - | - | - | ||||||||||||||||||
| Total | (661 | ) | (51 | ) | 2,845 | 504 | 717 | 5,458 | ||||||||||||||||
The following companies are subsidiaries of
| (1) | SQM Vitas Fzco. |
| (2) | SQM Vitas Holland |
| (3) | Pavoni &C.SPA |
| F- 77 |
Notes to the Consolidated Financial Statements as of December 31, 2018
| Note 9 | Joint Ventures (continued) |
| 9.4 | Assets, liabilities, revenue and expenses from joint ventures: |
| 12/31/2018 | ||||||||||||||||||||||||||||||||
| Gain (loss) from | Other | |||||||||||||||||||||||||||||||
| Assets | Liabilities | continuing | comprehensive | Comprehensive | ||||||||||||||||||||||||||||
| Joint Venture | Current | Non-current | Current | Non-current | Revenue | operations | income | income | ||||||||||||||||||||||||
| ThUS$ | ThUS$ | ThUS$ | ThUS$ | ThUS$ | ThUS$ | ThUS$ | ThUS$ | |||||||||||||||||||||||||
| Sichuan SQM Migao Chemical Fertilizers Co. Ltd. | 28,699 | 6,098 | 13,281 | - | 12 | (1,372 | ) | - | (1,372 | ) | ||||||||||||||||||||||
| Coromandel SQM India | 5,656 | 852 | 3,050 | - | 11,605 | 348 | - | 348 | ||||||||||||||||||||||||
| SQM Vitas Fzco. | 25,489 | 17,592 | 2,678 | - | 16,583 | 3,561 | 1 | 3,562 | ||||||||||||||||||||||||
| SQM Star Qingdao Corp. Nutrition Co. Ltd. | 7,754 | 114 | 1,533 | - | 13,004 | 377 | - | 377 | ||||||||||||||||||||||||
| SQM Vitas Brazil Agroindustria | 36,648 | 7,566 | 31,808 | - | 82,625 | 2,879 | (1,322 | ) | 1,557 | |||||||||||||||||||||||
| SQM Vitas Peru S.A.C | 22,365 | 7,785 | 18,996 | 5,966 | 28,619 | (550 | ) | - | (550 | ) | ||||||||||||||||||||||
| SQM Vitas Holland B.V. | 2,692 | - | 1 | - | - | (28 | ) | - | (28 | ) | ||||||||||||||||||||||
| SQM Vitas Plantacote B.V. | - | - | - | - | - | - | - | - | ||||||||||||||||||||||||
| Pavoni & C. Spa | 10,062 | 6,490 | 8,098 | 698 | 15,461 | (79 | ) | - | (79 | ) | ||||||||||||||||||||||
| Arpa Speciali S.R.L. | - | - | - | - | - | - | - | - | ||||||||||||||||||||||||
| Covalent Lithium Pty Ltd. | 239 | 100 | 233 | - | - | 106 | - | 106 | ||||||||||||||||||||||||
| Total | 139,604 | 46,597 | 79,678 | 6,664 | 167,909 | 5,242 | (1,321 | ) | 3,921 | |||||||||||||||||||||||
| 12/31/2017 | ||||||||||||||||||||||||||||||||
| Gain (loss) from | Other | |||||||||||||||||||||||||||||||
| Assets | Liabilities | continuing | comprehensive | Comprehensive | ||||||||||||||||||||||||||||
| Joint Venture | Current | Non-current | Current | Non-current | Revenue | operations | income | income | ||||||||||||||||||||||||
| ThUS$ | ThUS$ | ThUS$ | ThUS$ | ThUS$ | ThUS$ | ThUS$ | ThUS$ | |||||||||||||||||||||||||
| Sichuan SQM Migao Chemical Fertilizers Co. Ltda. | 31,461 | 6,656 | 15,228 | - | 13,326 | (1,070 | ) | - | (1,070 | ) | ||||||||||||||||||||||
| Coromandel SQM India | 6,659 | 862 | 4,205 | 53 | 10,381 | 332 | - | 332 | ||||||||||||||||||||||||
| SQM Vitas Fzco. | 23,699 | 17,479 | 2,221 | - | 15,518 | 3,003 | (9 | ) | 2,994 | |||||||||||||||||||||||
| SQM Star Qingdao Corp. Nutrition Co. Ltd. | 6,941 | 171 | 1,152 | - | 12,631 | 721 | - | 721 | ||||||||||||||||||||||||
| SQM Vitas Brazil Agroindustria | 30,303 | 8,453 | 27,752 | - | 60,131 | 1,753 | (101 | ) | 1,652 | |||||||||||||||||||||||
| SQM Vitas Peru S.A.C | 20,933 | 8,534 | 17,380 | 6,126 | 35,299 | (216 | ) | - | (216 | ) | ||||||||||||||||||||||
| SQM Vitas Holland B.V. | 2,190 | 669 | - | - | - | (36 | ) | - | (36 | ) | ||||||||||||||||||||||
| SQM Vitas Plantacote B.V. | 679 | - | 10 | - | - | (1 | ) | - | (1 | ) | ||||||||||||||||||||||
| Minera Exar S.A. | 19,277 | 73,114 | 38,670 | - | - | (53 | ) | - | (53 | ) | ||||||||||||||||||||||
| Total | 142,142 | 115,938 | 106,618 | 6,179 | 147,286 | 4,433 | (110 | ) | 4,323 | |||||||||||||||||||||||
| F- 78 |
Notes to the Consolidated Financial Statements as of December 31, 2018
| Note 9 | Joint Ventures (continued) |
| 9.4 | Assets, liabilities, revenue and expenses from joint ventures: |
| 12/31/2016 | ||||||||||||||||||||||||||||||||
| Gain (loss) from | Other | |||||||||||||||||||||||||||||||
| Assets | Liabilities | continuing | comprehensive | Comprehensive | ||||||||||||||||||||||||||||
| Joint Venture | Current | Non-current | Current | Non-current | Revenue | operations | income | income | ||||||||||||||||||||||||
| ThUS$ | ThUS$ | ThUS$ | ThUS$ | ThUS$ | ThUS$ | ThUS$ | ThUS$ | |||||||||||||||||||||||||
| Sichuan SQM Migao Chemical Fertilizers Co. Ltda. | 43,639 | 7,399 | 26,738 | - | 16,051 | (2,744 | ) | - | (2,744 | ) | ||||||||||||||||||||||
| Coromandel SQM India | 4,485 | 847 | 2,334 | - | 8,034 | 870 | - | 870 | ||||||||||||||||||||||||
| SQM Vitas Fzco. | 20,896 | 16,395 | 1,380 | - | 16,210 | 6,916 | 897 | 7,813 | ||||||||||||||||||||||||
| SQM Star Qingdao Corp. Nutrition Co. Ltd. | 5,733 | 203 | 697 | - | 7,553 | 325 | - | 325 | ||||||||||||||||||||||||
| SQM Vitas Brazil Agroindustria | 21,511 | 8,917 | 21,085 | - | 63,055 | 4,570 | 5,690 | 10,260 | ||||||||||||||||||||||||
| SQM Vitas Peru S.A.C | 23,598 | 8,931 | 20,333 | 6,231 | 36,926 | 815 | - | 815 | ||||||||||||||||||||||||
| SQM Vitas Holland B.V. | 1,961 | 588 | 11 | - | - | 342 | - | 342 | ||||||||||||||||||||||||
| SQM Vitas Plantacote B.V. | 619 | - | 31 | - | - | (159 | ) | - | (159 | ) | ||||||||||||||||||||||
| Total | 122,442 | 43,280 | 72,609 | 6,231 | 147,829 | 10,935 | 6,587 | 17,522 | ||||||||||||||||||||||||
| F- 79 |
Notes to the Consolidated Financial Statements as of December 31, 2018
| Note 9 | Joint Ventures (continued) |
| 9.5 | Other Joint Venture disclosures: |
| Cash and cash equivalents | Other current financial liabilities | Other non-current financial liabilities | ||||||||||||||||||||||
| 12/31/2018 | 12/31/2017 | 12/31/2018 | 12/31/2017 | 12/31/2018 | 12/31/2017 | |||||||||||||||||||
| ThUS$ | ThUS$ | ThUS$ | ThUS$ | ThUS$ | ThUS$$ | |||||||||||||||||||
| Sichuan SQM Migao Chemical Fertilizers Co. Ltd. | 106 | 6,198 | - | - | - | - | ||||||||||||||||||
| Coromandel SQM India | 308 | 1,118 | - | - | - | - | ||||||||||||||||||
| SQM Vitas Fzco. | 19,312 | 15,307 | - | - | - | - | ||||||||||||||||||
| SQM Star Qingdao Corp. Nutrition Co. Ltd. | 4,543 | 3,675 | - | - | - | - | ||||||||||||||||||
| SQM Vitas Brazil Agroindustria | 1,869 | 5,139 | 13,380 | 7,342 | - | - | ||||||||||||||||||
| SQM Vitas Peru S.A.C. | 371 | 687 | 3,819 | 2,215 | 801 | 1,372 | ||||||||||||||||||
| SQM Vitas Holland B.V. | 2,692 | 2,190 | - | - | - | - | ||||||||||||||||||
| SQM Vitas Plantacote B.V. | - | 679 | - | - | - | - | ||||||||||||||||||
| Minera Exar S.A. | - | 9,189 | - | - | - | - | ||||||||||||||||||
| Pavoni &C., Spa | 407 | - | 5,464 | - | - | - | ||||||||||||||||||
| Arpa Speciali S.R.L. | - | - | - | - | - | - | ||||||||||||||||||
| Covalent Lithium Pty Ltd. | 156 | - | - | - | - | - | ||||||||||||||||||
| Total | 29,764 | 44,182 | 22,663 | 9,557 | 801 | 1,372 | ||||||||||||||||||
| Depreciation and amortization expense | Interest expense | Income tax expense, continuing operations | ||||||||||||||||||||||||||||||||||
| 12/31/2018 | 12/31/2017 | 12/31/2016 | 12/31/2018 | 12/31/2017 | 12/31/2016 | 12/31/2018 | 12/31/2017 | 12/31/2016 | ||||||||||||||||||||||||||||
| ThUS$ | ThUS$ | ThUS$ | ThUS$ | ThUS$ | ThUS$ | ThUS$ | ThUS$ | ThUS$ | ||||||||||||||||||||||||||||
| Sichuan SQM Migao Chemical Fertilizers Co. Ltd. | (948 | ) | (696 | ) | (691 | ) | (1 | ) | (25 | ) | (433 | ) | 97 | 303 | 200 | |||||||||||||||||||||
| Coromandel SQM India | 445 | - | - | (9 | ) | (16 | ) | (49 | ) | (38 | ) | (485 | ) | (44 | ) | |||||||||||||||||||||
| SQM Vitas Fzco. | (509 | ) | (553 | ) | (717 | ) | (8 | ) | (19 | ) | (16 | ) | - | - | - | |||||||||||||||||||||
| SQM Star Qingdao Corp. Nutrition Co. Ltd. | (67 | ) | (68 | ) | (64 | ) | - | - | (1 | ) | (187 | ) | (174 | ) | (195 | ) | ||||||||||||||||||||
| SQM Vitas Brazil Agroindustria | (408 | ) | (453 | ) | (438 | ) | (886 | ) | (1,253 | ) | (2,127 | ) | (117 | ) | (283 | ) | (337 | ) | ||||||||||||||||||
| SQM Vitas Peru S.A.C. | (347 | ) | (375 | ) | (82 | ) | (425 | ) | (432 | ) | (323 | ) | (230 | ) | (214 | ) | (362 | ) | ||||||||||||||||||
| SQM Vitas Holland B.V. | - | - | - | - | - | - | - | - | - | |||||||||||||||||||||||||||
| SQM Vitas Plantacote B.V. | - | - | - | - | (1 | ) | (1 | ) | - | - | - | |||||||||||||||||||||||||
| Minera Exar S.A. | - | (523 | ) | - | - | (32 | ) | - | - | (620 | ) | - | ||||||||||||||||||||||||
| Pavoni & C., Spa | (542 | ) | - | - | (335 | ) | - | - | - | - | - | |||||||||||||||||||||||||
| Arpa Speciali S.R.L. | - | - | - | - | - | - | - | - | - | |||||||||||||||||||||||||||
| Covalent Lithium Pty Ltd. | (16 | ) | - | - | (5 | ) | - | - | (46 | ) | - | - | ||||||||||||||||||||||||
| Total | (2,392 | ) | (2,668 | ) | (1,992 | ) | (1,669 | ) | (1,778 | ) | (2,950 | ) | (521 | ) | (1,473 | ) | (738 | ) | ||||||||||||||||||
The basis of preparation of the financial information of joint ventures corresponds to the amounts included in the financial statements in conformity with the entity’s IFRS.
| F- 80 |
Notes to the Consolidated Financial Statements as of December 31, 2018
| Note 9 | Joint Ventures (continued) |
| 9.6 | Joint Operation |
In 2017, we continued to expand our operations outside Chile and, together with our subsidiary SQM Australia Pty, we entered into an agreement to acquire 50% of the assets of the Mount Holland lithium project in Western Australia. We entered into a 50/50 unincorporated joint operation with Kidman Resources Limited (“Kidman”), the Mt Holland Lithium Project, to design, construct and operate a mine, concentrator and refinery to produce approximately 45,000 metric tons of lithium hydroxide per year. Kidman retained the exclusive right to exploit gold within the project area. SQM Australia Pty committed to pay a price of US$70 million for the 50% of the Mt Holland assets, which was split into an initial payment of US$ 15 million and a deferred payment of US$ 55 million, both payments subject to certain conditions precedent. SQM Australia paid an additional (i) US$10 million as part of the initial payment, and (ii) US$30 million once the deferred payment took place.
All payments subject to conditions under the purchase agreement with Kidman were executed by December 2018
| F- 81 |
Notes to the Consolidated Financial Statements as of December 31, 2018
| Note 10 | Cash and cash equivalents |
| 10.1 | Types of cash and cash equivalents |
As of December 31, 2018 and December 31, 2017, cash and cash equivalents are detailed as follows:
| a) Cash | 12/31/2018 | 12/31/20171 | ||||||
| ThUS$ | ThUS$ | |||||||
| Cash on hand | 75 | 60 | ||||||
| Cash in banks | 101,662 | 50,137 | ||||||
| Other demand deposits | 746 | 1,530 | ||||||
| Total cash | 102,483 | 51,727 | ||||||
| b) Cash equivalents | 12/31/2018 | 12/31/2017 | ||||||
| ThUS$ | ThUS$ | |||||||
| Short-term deposits, classified as cash equivalents | 187,666 | 290,914 | ||||||
| Short-term investments, classified as cash equivalents | 265,917 | 287,797 | ||||||
| Total cash equivalents | 453,583 | 578,711 | ||||||
| Total cash and cash equivalents | 556,066 | 630,438 | ||||||
| 10.2 | Short-term investments, classified as cash equivalents |
As of December 31, 2018 and December 31, 2017, the short-term investments classified as cash and cash equivalents relate to mutual funds (investment liquidity funds) for investments in:
| Institution |
12/31/2018 ThUS$ |
12/31/2017 ThUS$ |
||||||
| Legg Mason - Western Asset Institutional Cash Reserves | 132,108 | 144,464 | ||||||
| JP Morgan US dollar Liquidity Fund Institutional | 133,809 | 143,333 | ||||||
| Total | 265,917 | 287,797 | ||||||
Short-term investments are highly liquid fund manager accounts that are basically invested in short-term fixed rate notes in the U.S. market.
| F- 82 |
Notes to the Consolidated Financial Statements as of December 31, 2018
| Note 10 | Cash and cash equivalents (continued) |
| 10.3 | Information on cash and cash equivalents by currency |
As of December 31, 2018 and December 31, 2017, information on cash and cash equivalents by currency is detailed as follows:
| Original currency | 12/31/2018 | 12/31/2017 | ||||||
| ThUS$ | ThUS$ | |||||||
| Chilean Peso (*) | 157,500 | 579 | ||||||
| US Dollar | 353,037 | 612,727 | ||||||
| Euro | 4,739 | 9,782 | ||||||
| Mexican Peso | 1,242 | 258 | ||||||
| South African Rand | 5,843 | 4,074 | ||||||
| Japanese Yen | 1,786 | 1,773 | ||||||
| Peruvian Sol | 7 | 8 | ||||||
| Brazilian Real | - | 38 | ||||||
| Chinese Yuan | 2,305 | 1,143 | ||||||
| Dírham United Arab Emirates | 1 | - | ||||||
| Indian rupee | 3 | - | ||||||
| Argentine Peso | 2 | 1 | ||||||
| Pound Sterling | 3 | 55 | ||||||
| Australian dollar | 29,598 | - | ||||||
| Total | 556,066 | 630,438 | ||||||
(*) The Company maintains financial derivative policies which allow to minimize the risk of the variation in Chilean pesos exchange rate .
| 10.4 | Amount restricted (unavailable) cash balances |
Cash on hand and in current bank accounts are available resources, and their carrying value is equal to their fair value.
As of December 31, 2018 and December 31, 2017, restricted cash balances are presented in Note 14.
| F- 83 |
Notes to the Consolidated Financial Statements as of December 31, 2018
| Note 10 | Cash and cash equivalents (continued) |
| 10.5 | Short-term deposits, classified as cash equivalents |
The detail at the end of each period is as follows:
|
2018
Receiver of the deposit |
Type of deposit | Original Currency | Interest rate | Placement date | Expiration date |
Principal
|
Interest
accrued
|
12/31/2018 | ||||||||||||||||
| ThUS$ | ThUS$ | ThUS$ | ||||||||||||||||||||||
| Scotiabank | Fixed term | Ch$ | 2.50 | 10/18/2018 | 1/16/2019 | 14,606 | 90 | 14,696 | ||||||||||||||||
| Banco Crédito e Inversiones | Fixed term | Ch$ | 2.55 | 11/6/2018 | 1/9/2019 | 19,632 | 92 | 19,724 | ||||||||||||||||
| Scotiabank | Fixed term | Ch$ | 2.55 | 11/30/2018 | 1/3/2019 | 14,393 | 38 | 14,431 | ||||||||||||||||
| Scotiabank | Fixed term | Ch$ | 2.55 | 12/3/2018 | 1/3/2019 | 11,515 | 27 | 11,542 | ||||||||||||||||
| Itau-Corpbanca | Fixed term | Ch$ | 2.50 | 12/3/2018 | 1/3/2019 | 14,393 | 34 | 14,427 | ||||||||||||||||
| Itau-Corpbanca | Fixed term | Ch$ | 2.50 | 12/7/2018 | 1/9/2019 | 14,393 | 29 | 14,422 | ||||||||||||||||
| Itau-Corpbanca | Fixed term | Ch$ | 2.50 | 12/10/2018 | 1/9/2019 | 12,954 | 23 | 12,977 | ||||||||||||||||
| Scotiabank | Fixed term | Ch$ | 2.35 | 12/10/2018 | 1/9/2019 | 12,954 | 21 | 12,975 | ||||||||||||||||
| Itau-Corpbanca | Fixed term | US$ | 3.06 | 12/11/2018 | 1/11/2019 | 1,300 | 2 | 1,302 | ||||||||||||||||
| Banco Estado | Fixed term | US$ | 2.75 | 12/12/2018 | 1/15/2019 | 1,000 | 1 | 1,001 | ||||||||||||||||
| Itau-Corpbanca | Fixed term | Ch$ | 2.50 | 12/14/2018 | 1/9/2019 | 14,392 | 20 | 14,412 | ||||||||||||||||
| Scotiabank | Fixed term | Ch$ | 2.65 | 12/17/2018 | 1/17/2019 | 14,393 | 18 | 14,411 | ||||||||||||||||
| Scotiabank | Fixed term | Ch$ | 2.60 | 12/17/2018 | 1/17/2019 | 10,892 | 13 | 10,905 | ||||||||||||||||
| Banco Crédito e Inversiones | Fixed term | US$ | 2.93 | 12/17/2018 | 1/31/2019 | 1,400 | 2 | 1,402 | ||||||||||||||||
| Itau-Corpbanca | Fixed term | US$ | 3.30 | 12/17/2018 | 1/31/2019 | 1,400 | 2 | 1,402 | ||||||||||||||||
| Itau-Corpbanca | Fixed term | US$ | 3.40 | 12/17/2018 | 1/31/2019 | 3,000 | 4 | 3,004 | ||||||||||||||||
| Banco de Chile | Fixed term | US$ | 3.06 | 12/17/2018 | 1/31/2019 | 1,700 | 2 | 1,702 | ||||||||||||||||
| Scotiabank Sud Americano | Fixed term | US$ | 2.95 | 12/17/2018 | 1/31/2019 | 1,500 | 2 | 1,502 | ||||||||||||||||
| Banco de Chile | Fixed term | US$ | 3.26 | 12/19/2018 | 1/31/2019 | 800 | 1 | 801 | ||||||||||||||||
| Banco Crédito e Inversiones | Fixed term | US$ | 3.42 | 12/26/2018 | 2/26/2019 | 2,800 | 1 | 2,801 | ||||||||||||||||
| Banco de Chile | Fixed term | US$ | 3.26 | 12/26/2018 | 2/26/2019 | 2,800 | 1 | 2,801 | ||||||||||||||||
| Scotiabank Sud Americano (*) | Fixed term | Ch$ | 0.26 | 12/27/2018 | 1/7/2019 | 1,439 | 1 | 1,440 | ||||||||||||||||
| Scotiabank Sud Americano (*) | Fixed term | Ch$ | 0.26 | 12/27/2018 | 1/14/2019 | 2,879 | 1 | 2,880 | ||||||||||||||||
| Scotiabank Sud Americano (*) | Fixed term | Ch$ | 0.26 | 12/27/2018 | 1/21/2019 | 1,439 | 1 | 1,440 | ||||||||||||||||
| Banco Estado | Fixed term | US$ | 3.15 | 12/28/2018 | 1/28/2019 | 2,000 | 1 | 2,001 | ||||||||||||||||
| Banco Estado | Fixed term | US$ | 3.15 | 12/28/2018 | 1/28/2019 | 600 | - | 600 | ||||||||||||||||
| Banco de Chile | Fixed term | US$ | 3.16 | 12/28/2018 | 1/28/2019 | 2,000 | 1 | 2,001 | ||||||||||||||||
| Banco Crédito e Inversiones | Fixed term | US$ | 2.53 | 12/28/2018 | 1/8/2019 | 1,000 | - | 1,000 | ||||||||||||||||
| Banco Crédito e Inversiones | Fixed term | US$ | 3.08 | 12/28/2018 | 1/28/2019 | 2,500 | 1 | 2,501 | ||||||||||||||||
| Banco Santander- Santiago | Fixed term | Ch$ | 0.20 | 12/28/2018 | 1/4/2019 | 432 | - | 432 | ||||||||||||||||
| BBVA Banco Francés | Fixed term | US$ | - | 12/31/2018 | 1/21/2019 | 81 | 3 | 84 | ||||||||||||||||
| Nedbank | On demand | US$ | - | 12/31/2018 | 1/1/2019 | 647 | - | 647 | ||||||||||||||||
| Total | 187,234 | 432 | 187,666 | |||||||||||||||||||||
(*) Corresponds to monthly rate.
| F- 84 |
Notes to the Consolidated Financial Statements as of December 31, 2018
| Note 10 | Cash and cash equivalents (continued) |
| 10.5 | Short-term deposits, classified as cash equivalents, continued |
|
2017 Receiver of the deposit |
Type of deposit | Original Currency | Interest rate | Placement date | Expiration date |
Principal
|
Interest accrued to-date
|
12/31/2017
|
||||||||||||||||
| ThUS$ | ThUS$ | ThUS$ | ||||||||||||||||||||||
| Scotiabank Sud Americano | Fixed term | Ch$ | 0.24 | 11/21/2017 | 1/02/2018 | 8,943 | 30 | 8,973 | ||||||||||||||||
| Banco Itau Chile | Fixed term | Ch$ | 0.24 | 11/28/2017 | 1/02/2018 | 15,652 | 41 | 15,693 | ||||||||||||||||
| Banco Itau Chile | Fixed term | Ch$ | 0.24 | 11/28/2017 | 1/02/2018 | 15,652 | 41 | 15,693 | ||||||||||||||||
| Banco BBVA Chile | Fixed term | Ch$ | 0.23 | 11/28/2017 | 1/02/2018 | 15,652 | 40 | 15,692 | ||||||||||||||||
| Banco BBVA Chile | Fixed term | Ch$ | 0.23 | 11/28/2017 | 1/02/2018 | 15,652 | 40 | 15,692 | ||||||||||||||||
| Banco Itau Chile | Fixed term | Ch$ | 0.25 | 11/29/2017 | 2/27/2018 | 18,857 | 50 | 18,907 | ||||||||||||||||
| Banco Crédito e Inversiones | Fixed term | Ch$ | 0.26 | 12/12/2017 | 1/11/2018 | 15,982 | 26 | 16,008 | ||||||||||||||||
| Banco Crédito e Inversiones | Fixed term | Ch$ | 0.26 | 12/12/2017 | 1/11/2018 | 8,524 | 14 | 8,538 | ||||||||||||||||
| Banco Itau Chile | Fixed term | Ch$ | 0.24 | 12/12/2017 | 1/11/2018 | 15,982 | 24 | 16,006 | ||||||||||||||||
| Banco Itau Chile | Fixed term | Ch$ | 0.24 | 12/12/2017 | 1/11/2018 | 7,458 | 11 | 7,469 | ||||||||||||||||
| Banco Crédito e Inversiones | Fixed term | Ch$ | 0.26 | 12/14/2017 | 1/16/2018 | 19,780 | 29 | 19,809 | ||||||||||||||||
| Banco Crédito e Inversiones | Fixed term | Ch$ | 0.26 | 12/14/2017 | 1/16/2018 | 15,665 | 23 | 15,688 | ||||||||||||||||
| Banco Crédito e Inversiones | Fixed term | Ch$ | 0.26 | 12/14/2017 | 1/16/2018 | 11,488 | 17 | 11,505 | ||||||||||||||||
| Banco Crédito e Inversiones | Fixed term | Ch$ | 0.26 | 12/15/2017 | 1/16/2018 | 15,568 | 22 | 15,590 | ||||||||||||||||
| Banco Crédito e Inversiones | Fixed term | Ch$ | 0.26 | 12/15/2017 | 1/16/2018 | 15,568 | 22 | 15,590 | ||||||||||||||||
| Banco Crédito e Inversiones | Fixed term | Ch$ | 0.26 | 12/15/2017 | 1/16/2018 | 15,568 | 22 | 15,590 | ||||||||||||||||
| Banco BBVA Chile | Fixed term | Ch$ | 0.24 | 12/29/2017 | 1/10/2018 | 4,107 | 1 | 4,108 | ||||||||||||||||
| Banco BBVA Chile | Fixed term | Ch$ | 0.24 | 12/29/2017 | 1/10/2018 | 2,765 | - | 2,765 | ||||||||||||||||
| Banco Santander - Santiago | Fixed term | US$ | 0.28 | 12/27/2017 | 1/18/2018 | 700 | - | 700 | ||||||||||||||||
| Banco Santander - Santiago | Fixed term | US$ | 0.4 | 12/15/2017 | 2/13/2018 | 15,000 | 27 | 15,027 | ||||||||||||||||
| Banco Santander - Santiago | Fixed term | US$ | 0.4 | 12/15/2017 | 2/13/2018 | 14,000 | 25 | 14,025 | ||||||||||||||||
| Corpbanca | Fixed term | Ch$ | 0.22 | 12/28/2017 | 1/04/2018 | 1,301 | - | 1,301 | ||||||||||||||||
| Scotiabank Sud Americano | Fixed term | Ch$ | 0.21 | 12/29/2017 | 1/05/2018 | 976 | - | 976 | ||||||||||||||||
| Scotiabank Sud Americano | Fixed term | Ch$ | 0.21 | 12/29/2017 | 1/05/2018 | 569 | - | 569 | ||||||||||||||||
| Banco Santander - Santiago | Fixed term | US$ | 2.45 | 12/06/2017 | 1/05/2018 | 3,500 | 6 | 3,506 | ||||||||||||||||
| Scotiabank Sud Americano | Fixed term | US$ | 3.40 | 12/15/2017 | 1/16/2018 | 2,000 | 3 | 2,003 | ||||||||||||||||
| Banco BBVA Chile | Fixed term | US$ | 2.80 | 12/26/2017 | 1/26/2018 | 2,200 | 1 | 2,201 | ||||||||||||||||
| Banco Crédito e Inversiones | Fixed term | US$ | 2.3 | 12/27/2017 | 1/04/2018 | 2,300 | 1 | 2,301 | ||||||||||||||||
| Banco Santander - Santiago | Fixed term | US$ | 2.88 | 12/27/2017 | 1/04/2018 | 2,300 | 1 | 2,301 | ||||||||||||||||
| Banco BBVA Chile | Fixed term | US$ | 2.80 | 12/27/2017 | 1/04/2018 | 1,400 | - | 1,400 | ||||||||||||||||
| BBVA Banco Francés | Fixed term | US$ | 0.19 | 12/11/2017 | 1/31/2018 | 163 | - | 163 | ||||||||||||||||
| Nedbank | On demand | US$ | - | 12/01/2017 | 1/31/2018 | 3,686 | - | 3,686 | ||||||||||||||||
| ABN Amro Bank | Fixed term | US$ | - | 12/31/2017 | 1/02/2018 | 1,439 | - | 1,439 | ||||||||||||||||
| Total | 290,397 | 517 | 290,914 | |||||||||||||||||||||
| F- 85 |
Notes to the Consolidated Financial Statements as of December 31, 2018
| Note 10 | Cash and cash equivalents (continued) |
| 10.6 | Other information |
Net Debt reconciliation
This section sets out an analysis of net debt and the movements in net debt for each of the periods presented.
| Net debt | 12/31/2018 | 12/31/2017 | ||||||
| ThUS$ | ThUS$ | |||||||
| Cash and cash equivalents | 556,066 | 630,438 | ||||||
| Other current financial assets | 312,721 | 366,979 | ||||||
| Other non-current financial hedge assets | 13,425 | 8,910 | ||||||
| Borrowings - repayable within one year (including overdraft) | (23,585 | ) | (220,328 | ) | ||||
| Borrowings - repayable after one year | (1,330,382 | ) | (1,031,507 | ) | ||||
| Net debt | (471,755 | ) | (245,508 | ) | ||||
| Cash and liquid investments | 882,212 | 1,006,327 | ||||||
| Gross debt - fixed interest rates | (1,353,967 | ) | (1,251,835 | ) | ||||
| Net debt | (471,755 | ) | (245,508 | ) | ||||
|
|
12/31/2017
ThUS$ |
Repayment
of
borrowings ThUS$ |
Proceeds
from
borrowings ThUS$ |
Other
inflows
(outflows) of cash ThUS$ |
Hedging
effects
ThUS$ |
Foreign
currency translation differences ThUS$ |
Other
ThUS$ |
12/31/2018
ThUS$ |
||||||||||||||||||||||||
| Current financial liabilities and non-current | (1,251,835 | ) | 213,000 | (376,039 | ) | - | 23,092 | 39,520 | (1,704 | ) | (1,353,967 | ) | ||||||||||||||||||||
| Cash and cash equivalents | 630,438 | - | - | (49,478 | ) | - | (24,894 | ) | - | 556,066 | ||||||||||||||||||||||
| Other current financial assets | 375,889 | - | - | (69,151 | ) | 19,408 | - | - | 326,146 | |||||||||||||||||||||||
| Net Debt | (245,508 | ) | 213,000 | (376,039 | ) | (118,629 | ) | 42,500 | 14,626 | (1,704 | ) | (471,755 | ) | |||||||||||||||||||
| F- 86 |
Notes to the Consolidated Financial Statements as of December 31, 2018
| Note 11 | Inventories |
The composition of inventory at each period-end is as follows:
| Type of inventory |
12/31/2018 ThUS$ |
12/31/2017 ThUS$ |
12/31/2016 ThUS$ |
|||||||||
| Raw material reserves | 6,764 | 9,364 | 7,536 | |||||||||
| Supplies for production reserves | 26,840 | 22,257 | 23,610 | |||||||||
| Products-in-progress reserves | 423,621 | 456,333 | 482,261 | |||||||||
| Finished product reserves | 456,449 | 414,120 | 479,665 | |||||||||
| Total | 913,674 | 902,074 | 993,072 | |||||||||
As of December 31, 2018, the Company has inventory of caliche ore (in piles or undergoing leaching process) available for processing valued at ThUS$347,100 and ThUS$333,194 as of December 31, 2017, (included in work in progress).
Inventory reserves recognized as of December 31, 2018 amount to ThUS$105,282, and ThUS$96,284 as of December 31, 2017. For finished and in-process products, the provisions constituted include the provision associated with the lower value of stock (considers lower realizable value, uncertain future use, reprocessing costs, etc.), inventory differences and potential errors in the determination of inventories (e.g., errors in topography, grade, humidity, etc.), see Note 3.19.
For inventories of raw materials, supplies, materials and parts, lower value provisions have been associated with the proportion of obsolete, defective or slow-moving materials and potential differences.
The amount from of inventory that was reclassified to cost of sales during 2018 was ThUS$1,300,940.
The amount from of inventory that was reclassified to cost of sales during 2017 was ThUS$1,230,321.
The amount from of inventory that was reclassified to cost of sales during 2016 was ThUS$1,130,799.
The breakdown of inventory reserves is detailed as follows:
| Type of inventory |
12/31/2018 ThUS$ |
12/31/2017 ThUS$ |
12/31/2016 ThUS$ |
|||||||||
| Raw material reserves | 1,838 | 93 | 93 | |||||||||
| Supplies for production | - | - | 920 | |||||||||
| Products-in-progress reserves | 82,673 | 80,249 | 50,925 | |||||||||
| Finished product reserves | 20,771 | 15,942 | 29,357 | |||||||||
| Total | 105,282 | 96,284 | 81,295 | |||||||||
The Company has not delivered inventory as collateral for the periods indicated above.
| F- 87 |
Notes to the Consolidated Financial Statements as of December 31, 2018
| Note 11 | Inventories (continued) |
As of December 31, 2018 and, 2017, movements in provisions are detailed as follows:
| Conciliation | 12/31/2018 | 12/31/2017 | 12/31/2016 | |||||||||
| ThUS$ | ThUS$ | ThUS$ | ||||||||||
| Beginning balance | 96,284 | 81,295 | 80,369 | |||||||||
| Increase in Lower Value (1) | 7,845 | 19,515 | 2,255 | |||||||||
| Additional Provision Differences of Inventory. (2) | 3,176 | 573 | 6,071 | |||||||||
| Increase / Decrease eventual differences and others (3) | 2,436 | (178 | ) | (6,339 | ) | |||||||
| Provision Used | (4,459 | ) | (4,921 | ) | (1,061 | ) | ||||||
| Total changes | 8,998 | 14,989 | 926 | |||||||||
| Final balance | 105,282 | 96,284 | 81,295 | |||||||||
| (1) | There are three types of Lower Value Provisions: Economic Realizable Lower Value, Potential Inventory with Uncertain Future Use and Reprocessing Costs of Off-Specification Products. |
| (2) | Provisions for Inventory Differences generated when physical differences are detected when taking inventory, which exceed the tolerance levels for this process. At least two annual inventories are taken in the production sites and in the port in Chile (“zero sum” systems have immediate potential adjustments). |
| (3) | This algorithm corresponds to diverse provision percentages based on the complexity in the measurement and rotation of stock, as well as standard differences based on previous profit and loss, as is the case with provisions in Commercial Offices. |
| F- 88 |
Notes to the Consolidated Financial Statements as of December 31, 2018
| Note 12 | Related party disclosures |
| 12.1 | Related party disclosures |
Balances pending at period-end are not guaranteed, accrue no interest and are settled in cash. No guarantees have been delivered or received for trade and other receivables due from related parties or trade and other payables due to related parties.
| F- 89 |
Notes to the Consolidated Financial Statements as of December 31, 2018
| Note 12 | Related party disclosures (continued) |
| 12.2 | Detailed identification of the link between the Parent and subsidiary |
As of December 31, 2018 and December 31, 2017, the detail of entities that are related parties of the SQM S.A. Group is as follows:
| Tax ID No. | Name | Country of origin | Functional currency | Nature | ||||
| Foreign | Nitratos Naturais Do Chile Ltda. | Brazil | US$ | Subsidiary | ||||
| Foreign | Nitrate Corporation Of Chile Ltd. | United Kingdom | US$ | Subsidiary | ||||
| Foreign | SQM North America Corp. | United States | US$ | Subsidiary | ||||
| Foreign | SQM Europe N.V. | Belgium | US$ | Subsidiary | ||||
| Foreign | Soquimich S.R.L. Argentina | Argentina | US$ | Subsidiary | ||||
| Foreign | Soquimich European Holding B.V. | The Netherlands | US$ | Subsidiary | ||||
| Foreign | SQM Corporation N.V. | The Netherlands | US$ | Subsidiary | ||||
| Foreign | SQI Corporation N.V. | The Netherlands | US$ | Subsidiary | ||||
| Foreign | SQM Comercial De México S.A. de C.V. | Mexico | US$ | Subsidiary | ||||
| Foreign | North American Trading Company | United States | US$ | Subsidiary | ||||
| Foreign | Administración y Servicios Santiago S.A. de C.V. | Mexico | US$ | Subsidiary | ||||
| Foreign | SQM Peru S.A. | Peru | US$ | Subsidiary | ||||
| Foreign | SQM Ecuador S.A. | Ecuador | US$ | Subsidiary | ||||
| Foreign | SQM Nitratos Mexico S.A. de C.V. | Mexico | US$ | Subsidiary | ||||
| Foreign | SQMC Holding Corporation L.L.P. | United States | US$ | Subsidiary | ||||
| Foreign | SQM Investment Corporation N.V. | The Netherlands | US$ | Subsidiary | ||||
| Foreign | SQM Brasil Limitada | Brazil | US$ | Subsidiary | ||||
| Foreign | SQM France S.A. | France | US$ | Subsidiary | ||||
| Foreign | SQM Japan Co. Ltd. | Japan | US$ | Subsidiary | ||||
| Foreign | Royal Seed Trading Corporation A.V.V. | Aruba | US$ | Subsidiary | ||||
| Foreign | SQM Oceania Pty Limited | Australia | US$ | Subsidiary | ||||
| Foreign | Rs Agro-Chemical Trading Corporation A.V.V. | Aruba | US$ | Subsidiary | ||||
| Foreign | SQM Indonesia S.A. | Indonesia | US$ | Subsidiary | ||||
| Foreign | SQM Virginia L.L.C. | United States | US$ | Subsidiary | ||||
| Foreign | SQM Italia SRL | Italy | US$ | Subsidiary | ||||
| Foreign | Comercial Caiman Internacional S.A. | Panama | US$ | Subsidiary | ||||
| Foreign | SQM Africa Pty Ltd, | South Africa | US$ | Subsidiary | ||||
| Foreign | SQM Colombia SAS | Colombia | US$ | Subsidiary | ||||
| Foreign | SQM Internacional N.V. | Belgium | US$ | Subsidiary | ||||
| Foreign | SQM (Shanghai) Chemicals Co. Ltd. | China | US$ | Subsidiary | ||||
| Foreign | SQM Lithium Specialties LLC | United States | US$ | Subsidiary | ||||
| Foreign | SQM Iberian S.A. | Spain | US$ | Subsidiary | ||||
| Foreign | SQM Beijing Commercial Co. Ltd. | China | US$ | Subsidiary | ||||
| Foreign | SQM Thailand Limited | Thailand | US$ | Subsidiary | ||||
| Foreign | SQM Australia PTY | Australia | Australian dollar | Subsidiary | ||||
| Foreign | SACAL S.A. | Argentina | Argentine peso | Subsidiary | ||||
| 96,801,610-5 | Comercial Hydro S.A. | Chile | US$ | Subsidiary | ||||
| 96,651,060-9 | SQM Potasio S.A. | Chile | US$ | Subsidiary | ||||
| 96,592,190-7 | SQM Nitratos S.A. | Chile | US$ | Subsidiary | ||||
| 96,592,180-K | Ajay SQM Chile S.A. | Chile | US$ | Subsidiary | ||||
| 86,630,200-6 | SQMC Internacional Ltda. | Chile | Chilean peso | Subsidiary | ||||
| 79,947,100-0 | SQM Industrial S.A. | Chile | US$ | Subsidiary | ||||
| 79,906,120-1 | Isapre Norte Grande Ltda. | Chile | Chilean peso | Subsidiary | ||||
| 79,876,080-7 | Almacenes y Depósitos Ltda. | Chile | Chilean peso | Subsidiary | ||||
| 79,770,780-5 | Servicios Integrales de Tránsitos y Transferencias S.A. | Chile | US$ | Subsidiary | ||||
| 79,768,170-9 | Soquimich Comercial S.A. | Chile | US$ | Subsidiary | ||||
| 79,626,800-K | SQM Salar S.A. | Chile | US$ | Subsidiary | ||||
| 78,053,910-0 | Proinsa Ltda. | Chile | Chilean peso | Subsidiary |
| F- 90 |
Notes to the Consolidated Financial Statements as of December 31, 2018
| Note 12 | Related party disclosures (continued) |
| 12.2 | Detailed identification of the link between the Parent and subsidiary, continued |
As of December 31, 2018 and December 31, 2017, the detail of entities that are related parties of the SQM S.A.: Group is as follows:
| Tax ID No, | Name | Country of origin | Functional currency | Nature | ||||
| 76,534,490-5 | Sociedad Prestadora de Servicios de Salud Cruz del Norte S.A. | Chile | Chilean peso | Subsidiary | ||||
| 76,425,380-9 | Exploraciones Mineras S.A. | Chile | US$ | Subsidiary | ||||
| 76,064,419-6 | Comercial Agrorama Ltda. | Chile | Chilean peso | Subsidiary | ||||
| 76,145,229-0 | Agrorama S.A. | Chile | Chilean peso | Subsidiary | ||||
| 76,359,919-1 | Orcoma Estudios SPA | Chile | US$ | Subsidiary | ||||
| 76,360,575-2 | Orcoma SPA | Chile | US$ | Subsidiary | ||||
| 76,686,311-9 | SQM MaG SpA | Chile | US$ | Subsidiary | ||||
| Foreign | Abu Dhabi Fertilizer Industries WWL | Arab Emirates | Arab Emirates dirham | Associate | ||||
| Foreign | Doktor Tarsa Tarim Sanayi AS | Turkey | US$ | Associate | ||||
| Foreign | Ajay North America | United States | US$ | Associate | ||||
| Foreign | Ajay Europe SARL | France | Euro | Associate | ||||
| Foreign | SQM Eastmed Turkey | Turkey | Euro | Associate | ||||
| Foreign | Charlee SQM Thailand Co. Ltd. (1) | Thailand | Thai baht | Associate | ||||
| Foreign | Kore Potash Ltd. | Australia | US$ | Associate | ||||
| Foreign | Sichuan SQM Migao Chemical Fertilizers Co Ltda. | China | US$ | Joint venture | ||||
| Foreign | Coromandel SQM India | India | Indian rupee | Joint venture | ||||
| Foreign | SQM Vitas Fzco. | Arab Emirates | Arab Emirates dirham | Joint venture | ||||
| Foreign | SQM Star Qingdao Corp Nutrition Co., Ltd. | China | US$ | Joint venture | ||||
| Foreign | SQM Vitas Holland B.V. | Dutch Antilles | Euro | Joint venture | ||||
| Foreign | Minera Exar S.A. (2) | Argentina | US$ | Joint venture | ||||
| Foreign | Covalent Lithium Pty Ltd. | Australia | Australian dollar | Joint venture | ||||
| Foreign | Pavoni & C, SPA | Italy | Euro | Joint venture | ||||
| 96,511,530-7 | Sociedad de Inversiones Pampa Calichera | Chile | US$ | Other related parties | ||||
| 96,529,340-k | Norte Grande S.A. | Chile | Chilean peso | Other related parties | ||||
| 79,049,778-9 | Callegari Agricola S.A. | Chile | Chilean peso | Other related parties | ||||
| Foreign | SQM Vitas Brazil Agroindustria (3) | Brazil | US$ | Other related parties | ||||
| Foreign | SQM Vitas Peru S.A.C. (3) | Peru | US$ | Other related parties | ||||
| Foreign | Terra Tarsa B.V. (4) | Holland | Euro | Other related parties | ||||
| Foreign | Plantacote N.V (4) | Belgium | Euro | Other related parties | ||||
| Foreign | Doktolab Tarim Arastima San. Tic As (4) | Turkey | Turkish Lira | Other related parties | ||||
| Foreign | Terra Tarsa Ukraine LLC (4) | Ukraine | Ukrainian Grivna | Other related parties | ||||
| Foreign | Terra Tarsa Don LLC (4) | Russian Federation | Russian ruble | Other related parties | ||||
| Foreign | Abu Dhabi Fertilizer Industries WLL | Oman | United Arab Emirates dirham | Other related parties | ||||
| Foreign | Internacional Technical and Trading Agencies CO WLL (5) | Jordan | United Arab Emirates dirham | Other related parties | ||||
| Foreign | Arpa Speciali S.R.L (6) | Italy | Euro | Other related parties |
(1) During the month of November 2018, the stake held in Charlee SQM Thailand Co. Ltd. was sold.
(2) During the month of December 2018, the stake held in Minera Exar S.A. was sold.
(3) These Companies are subsidiaries of the SQM Vitas Fzco joint venture.
(4) These Companies are subsidiaries of the associate Doktor Tarsa Tarim Sanayi AS.
(5) These Companies are subsidiaries of the joint venture Abu Dhabi Fertilizer Industries WWL
(6) These companies are subsidiaries of the joint venture Pavoni & C, SPA
| F- 91 |
Notes to the Consolidated Financial Statements as of December 31, 2018
| Note 12 | Related party disclosures (continued) |
| 12.2 | Detailed identification of the link between the Parent and subsidiary, continued |
| TAX ID No. | Name | Country of Origin | Functional currency | Relationship | ||||
| N/A | Ara Dos Primera del Salar de Pampa Blanca, Sierra Gorda (*) | Chile | Chilean peso | Other related parties | ||||
| N/A | Ara Tres Primera del Salar de Pampa Blanca, Sierra Gorda (*) | Chile | Chilean peso | Other related parties | ||||
| N/A | Ara Cuatro Primera del Salar de Pampa Blanca, Sierra Gorda (*) | Chile | Chilean peso | Other related parties | ||||
| N/A | Ara Cinco Primera del Salar de Pampa Blanca, Sierra Gorda (*) | Chile | Chilean peso | Other related parties | ||||
| N/A | Curicó Dos Primera del Salar de Pampa Alta, Sierra Gorda (*) | Chile | Chilean peso | Other related parties | ||||
| N/A | Curicó Tres Primera del Sector de Pampa Alta, Sierra Gorda (*) | Chile | Chilean peso | Other related parties | ||||
| N/A | Evelyn Veinticuatro Primera de Sierra Gorda (*) | Chile | Chilean peso | Other related parties | ||||
| N/A | Filomena Tres Primera de Oficina Filomena, Sierra Gorda (*) | Chile | Chilean peso | Other related parties | ||||
| N/A | Filomena Cuatro Primera de Oficina Filomena, Sierra Gorda (*) | Chile | Chilean peso | Other related parties | ||||
| N/A | Francis Cuatro Primera de Pampa Blanca, Sierra Gorda (*) | Chile | Chilean peso | Other related parties | ||||
| N/A | Francis Cuatro Segunda del Salar de Pampa Blanca, Sierra Gorda (*) | Chile | Chilean peso | Other related parties | ||||
| N/A | Francis Cuatro Tercera de Pampa Blanca, Sierra Gorda (*) | Chile | Chilean peso | Other related parties | ||||
| N/A | Francis Cuatro Cuarta de Pampa Blanca, Sierra Gorda (*) | Chile | Chilean peso | Other related parties | ||||
| N/A | Francis Cuatro Quinta de Pampa Blanca, Sierra Gorda (*) | Chile | Chilean peso | Other related parties | ||||
| N/A | Francis Primera del Salar de Pampa Blanca de Sierra Gorda (*) | Chile | Chilean peso | Other related parties | ||||
| N/A | Francis Segunda del Salar de Pampa Blanca de Sierra Gorda (*) | Chile | Chilean peso | Other related parties | ||||
| N/A | Francis Tercera del Salar de Pampa Blanca de Sierra Gorda (*) | Chile | Chilean peso | Other related parties | ||||
| N/A | Ivon Primera de Sierra Gorda (*) | Chile | Chilean peso | Other related parties | ||||
| N/A | Ivon Décima Segunda de Sierra Gorda (*) | Chile | Chilean peso | Other related parties | ||||
| N/A | Ivon Sexta de Sierra Gorda (*) | Chile | Chilean peso | Other related parties | ||||
| N/A | Julia Primera de Sierra Gorda (*) | Chile | Chilean peso | Other related parties | ||||
| N/A | Lorena Trigésimo Quinta de Sierra Gorda (*) | Chile | Chilean peso | Other related parties | ||||
| N/A | Perseverancia Primera de Sierra Gorda (*) | Chile | Chilean peso | Other related parties | ||||
| N/A | Tamara 40 Primera del Sector S.E. OF. Concepción, Sierra Gorda (*) | Chile | Chilean peso | Other related parties | ||||
| N/A | Tamara Tercera de Oficina Concepción, Sierra Gorda (*) | Chile | Chilean peso | Other related parties | ||||
| N/A | Tamara 40 Segunda del Sector S.E. OF Concepción, Sierra Gorda (*) | Chile | Chilean peso | Other related parties |
(*) Correspond to Mining Contractual Societies
| F- 92 |
Notes to the Consolidated Financial Statements as of December 31, 2018
| Note 12 | Related party disclosures (continued) |
| 12.3 | Detail of related parties and related party transactions |
Transactions between the Parent and its subsidiaries, associated businesses, joint ventures and other related parties are part of the Company's common transactions. Their conditions are those customary for this type of transactions in respect of terms and market prices. In addition, these have been eliminated in consolidation and are not detailed in this note.
Maturity terms for each case vary by virtue of the transaction giving rise to them.
As of December 31, 2018, 2017 and 2016, the detail of significant transactions with related parties is as follows:
| Tax ID No, | Company | Nature |
Country
of
origin |
Transaction |
12/31/2018 ThUS$ |
12/31/2017 ThUS$ |
12/31/2016 ThUS$ |
|||||||||||||
| Foreign | Doktor Tarsa Tarim Sanayi As | Associate | Turkey | Sale of products | 16,726 | 17,538 | 11,619 | |||||||||||||
| Foreign | Ajay Europe S.A.R.L. | Associate | France | Sale of products | 19,470 | 15,706 | 17,977 | |||||||||||||
| Foreign | Ajay Europe S.A.R.L. | Associate | France | Dividends | 811 | 969 | 1,338 | |||||||||||||
| Foreign | Ajay North America LLC. | Associate | United States | Sale of products | 16,810 | 13,206 | 12,865 | |||||||||||||
| Foreign | Ajay North America LLC. | Associate | United States | Dividends | 2,807 | 1,123 | 2,605 | |||||||||||||
| Foreign | Abu Dhabi Fertilizer Industries WWL | Associate | United Arab Emirates | Sale of products | 5,811 | 4,351 | 8,312 | |||||||||||||
| Foreign | Abu Dhabi Fertilizer Industries WWL | Associate | United Arab Emirates | Dividends | 5,641 | - | - | |||||||||||||
| Foreign | Charlee SQM Thailand Co. Ltd. (1) | Associate | Thailand | Sale of products | 4,960 | 5,102 | 3,798 | |||||||||||||
| Foreign | Charlee SQM Thailand Co. Ltd. (1) | Associate | Thailand | Dividends | 362 | - | - | |||||||||||||
| 77.557.430-5 | Sales de Magnesio Ltda. | Associate | Chile | Sale of products | - | 45 | - | |||||||||||||
| Foreign | Kowa Company Ltd. (3) | Other related parties | Japan | Sale of products | - | 132,495 | 91,678 | |||||||||||||
| Foreign | SQM Vitas Brasil Agroindustria | Joint control or significant influence | Brazil | Sale of products | 44,827 | 31,137 | 17,686 | |||||||||||||
| Foreign | SQM Vitas Peru S.A.C. | Joint control or significant influence | Peru | Sale of products | 17,204 | 23,058 | 22,090 | |||||||||||||
| Foreign | SQM Vitas Fzco. | Joint venture | United Arab Emirates | Sale of products | - | 85 | 965 | |||||||||||||
| Foreign | Sichuan SQM Migao Chemical Fertilizers Co Ltda. | Joint venture | China | Sale of products | - | - | 9,950 | |||||||||||||
| Foreign | Sichuan SQM Migao Chemical Fertilizers Co Ltda. | Joint venture | China | Sale of services | - | 252 | 257 | |||||||||||||
| Foreign | Coromandel SQM India | Joint venture | India | Sale of products | 7,696 | 8,011 | 4,630 | |||||||||||||
| Foreign | SQM Vitas Spain | Joint venture | Spain | Sale of products | - | - | 5,528 | |||||||||||||
| Foreign | SQM Vitas Plantacote B.V. | Joint venture | Netherlands | Sale of products | - | - | 49 | |||||||||||||
| Foreign | SQM Star Qingdao Corp Nutrition Co., Ltd. | Joint venture | China | Sale of products | - | 200 | 166 | |||||||||||||
| Foreign | SQM Vitas Holland B.V. | Joint venture | Holland | Sale of products | - | - | 634 | |||||||||||||
| 79.049.778-9 | Callegari Agrícola S.A. | Other related parties | Chile | Sale of products | - | 210 | 44 | |||||||||||||
| Foreign | Minera Exar S.A. (2) | Joint venture | Argentina | Loans | - | 11,000 | - | |||||||||||||
| Foreign | Terra Tarsa Ukraine LLC | Associate | Turkey | Sale of services | 1,674 | 1,218 | - | |||||||||||||
| Foreign | Terra Tarsa Don LLC | Associate | Russian Federation | Sale of products | 187 | 423 | - | |||||||||||||
|
Foreign |
Plantacote N.V. | Associate | Belgium | Sale of products | 4,554 | 2,108 | - | |||||||||||||
|
Foreign |
SQM eastmed Turkey | Associate | Turkey | Sale of products | 30 | - | - | |||||||||||||
|
Foreign |
Pavoni & C., SpA | Joint venture | Italy | Sale of products | 201 | - | - | |||||||||||||
| Foreing | Arpa Speciali S.R.L | Other related parties | Italy | Sale of products | 207 | - | - | |||||||||||||
| Total | 149,978 | 268,237 | 212,191 | |||||||||||||||||
| (1) | As of November 2018, the ownership interest in Charlee SQM Thailand Co. Ltd. was sold. |
| (2) | During the month of December 2018, the stake held in Minera Exar S.A. was sold. |
| (3) | As of December 31, 2018, Kowa Company Ltd. is not considered a related party. |
| F- 93 |
Notes to the Consolidated Financial Statements as of December 31, 2018
| Note 12 | Related party disclosures (continued) |
| 12.4 | Trade receivables due from related parties, current: |
Transactions between the Company, its subsidiaries, joint ventures and other related parties are considered customary transactions. In addition, they have been eliminated upon consolidation and are not disclosed in this note.
| Tax ID N° | Company | Nature | Country of origin | Currency | 12/31/2018 | 12/31/2017 | ||||||||||
| ThUS$ | ThUS$ | |||||||||||||||
| Foreign | Charlee SQM Thailand Co. Ltd(1) | Associate | Thailand | US$ | - | 1,204 | ||||||||||
| Foreign | Ajay Europe S.A.R.L. | Associate | France | Euro | 3,756 | 4,689 | ||||||||||
| Foreign | Ajay North America LLC. | Associate | United States | US$ | 2,079 | 2,005 | ||||||||||
| Foreign | Abu Dhabi Fertilizer Industries WWL | Associate | United Arab Emirates | Arab Emirates dirham | 857 | 73 | ||||||||||
| Foreign | Kowa Company Ltd.(1) | Jointly controlled entity | Japan | US$ | - | 5,008 | ||||||||||
| 96.511.530-7 | Soc.de Inversiones Pampa Calichera | Jointly controlled entity | Chile | US$ | 6 | 6 | ||||||||||
| Foreign | SQM Vitas Brasil Agroindustria | Joint venture | Brazil | US$ | 15,818 | 17,293 | ||||||||||
| Foreign | SQM Vitas Peru S.A.C. | Joint venture | Peru | US$ | 12,768 | 13,766 | ||||||||||
| Foreign | Coromandel SQM India | Joint venture | India | Indian rupee | 2,025 | 3,804 | ||||||||||
| Foreign | SQM Vitas Fzco. | Joint venture | United Arab Emirates | Emirates dirham | 105 | - | ||||||||||
| Foreign | SQM Star Qingdao Corp Nutrition Co., Ltd. | Joint venture | China | US$ | 248 | 50 | ||||||||||
| Foreign | Plantacote N.V. | Associate | Belgium | Euro | 312 | 190 | ||||||||||
| Foreign | Terra Tarsa Don LLC | Associate | Russian Federation | Russian ruble | 41 | 44 | ||||||||||
| Foreign | Minera Exar S.A. (2) | Joint venture | Argentina | US$ | - | 11,000 | ||||||||||
| Foreign | SQM Eastmed Turkey | Associate | Turkey | Euro | 30 | - | ||||||||||
| Foreing | SQM Pavoni & C. SPA | Joint venture | Italy | Euro | 12 | - | ||||||||||
| Foreign | Doktor Tarsa Tarim Sanayi As | Joint venture | Turkey | US$ | 6,497 | - | ||||||||||
| Total | 44,554 | 59,132 | ||||||||||||||
(1) As of November 2018, the ownership interest in Charlee SQM Thailand Co. Ltd. sold.
(2) During the month of December 2018, the stake held in Minera Exar S.A.
The accounts receivable presented are net of provision (provision for 2018 ThUS$ 10,966 and 2017 for ThUS $ 14,125, see Note 13.2)
| 12.5 | Trade payables due to related parties, current: |
| Tax ID No. | Company | Nature |
Country of
origin |
Currency |
12/31/2018
ThUS$ |
12/31/2017
ThUS$ |
||||||||||
| Foreign | Doktor Tarsa Tarim Sanayi AS | Associate | Turkey | YTL | - | 11 | ||||||||||
| Foreign | Terra Tarsa Ukraine LLC | Other related parties | Ukraine | Ukrainian Grivna | - | 7 | ||||||||||
| Foreign | SQM Star Qingdao Corp Nutrition Co., Ltd. | Joint venture | China | US$ | - | 725 | ||||||||||
| Foreign | Sichuan SQM Migao Chemical Fertilizers Co Ltda. | Joint venture | China | US$ | - | 584 | ||||||||||
| Foreign | SQM Vitas Fzco. | Joint venture | United Arab Emirates | Arab Emirates dirham | - | 38 | ||||||||||
| Foreign | Covalent Lithium Pty Ltd | Associate | Australia | Australian dollar | 9 | - | ||||||||||
| Current Total | 9 | 1,365 | ||||||||||||||
| F- 94 |
Notes to the Consolidated Financial Statements as of December 31, 2018
| Note 13 | Financial instruments |
Financial instruments are detailed as follows:
| 13.1 | Types of other financial assets |
| Description of other financial assets |
12/31/2018 ThUS$ |
12/31/2017 ThUS$ |
||||||
| Financial assets at amortized cost (1) | 291,790 | 360,941 | ||||||
| Derivative financial instruments | ||||||||
| - - For hedging | 18,238 | - | ||||||
| - At fair value through profit or loss (2) | 2,693 | 6,038 | ||||||
| Total other current financial assets | 312,721 | 366,979 | ||||||
| Investments classified as available for sale at fair value through profit or loss | - | 9,179 | ||||||
| Financial assets at fair value through other comprehensive income | 3,631 | - | ||||||
| Derivative financial instruments | ||||||||
| - For hedging | 13,425 | 8,910 | ||||||
| Financial assets at amortized cost (3) | 75 | 24,790 | ||||||
| Total other non-current financial assets | 17,131 | 42,879 | ||||||
| (1) | Corresponds to term deposits whose maturity date is greater than 90 days and less than 360 days from the investment date constituted in the following financial institutions: |
| (2) | Correspond to forwards and options that were not classified as hedging instruments (See detail in Note 13.3). |
| (3) | SQM Potassium S.A. contributed ThUS$24,745 to Western Australia Lithium (WAL). As of December 31, 2017, this had not been legally incorporated as a Company and the funds remained in trust pending transfer to WAL. |
| Institution |
12/31/2018
ThUS$ |
12/31/2017
ThUS$ |
||||||
| Banco Santander | 23,124 | 163,269 | ||||||
| Banco de Crédito e Inversiones | 145,834 | 71,748 | ||||||
| Banco Itaú-Corpbanca | 70,719 | 77,527 | ||||||
| Banco Security | 27,215 | 28,592 | ||||||
| Scotiabank Sud Americano | 24,898 | 13,764 | ||||||
| Banco Chile | - | 4,834 | ||||||
| Banco BBVA Chile | - | 1,207 | ||||||
| Total | 291,790 | 360,941 | ||||||
| F- 95 |
Notes to the Consolidated Financial Statements as of December 31, 2018
| Note 13 | Financial instruments (continued) |
| 13.2 | Trade and other receivables |
| 12/31/2018 | 12/31/2017 | |||||||||||||||||||||||
| Current | Non-current | Total | Current | Non-current | Total | |||||||||||||||||||
| ThUS$ | ThUS$ | ThUS$ | ThUS$ | ThUS$$ | ThUS$ | |||||||||||||||||||
| Trade receivables | 429,150 | - | 429,150 | 412,321 | - | 412,321 | ||||||||||||||||||
| Prepayments | 16,147 | - | 16,147 | 16,177 | - | 16,177 | ||||||||||||||||||
| Other receivables | 19,558 | 2,275 | 21,833 | 18,377 | 1,912 | 20,289 | ||||||||||||||||||
| Total trade and other receivables | 464,855 | 2,275 | 467,130 | 446,875 | 1,912 | 448,787 | ||||||||||||||||||
| 12/31/2018 | 12/31/2017 | |||||||||||||||||||||||
|
Assets
before
allowances |
Allowance
for
doubtful trade receivables |
Assets
for trade
receivables, net |
Assets
before
allowances |
Allowance
for
doubtful trade receivables |
Assets
for trade
receivables, net |
|||||||||||||||||||
| ThUS$ | ThUS$ | ThUS$ | ThUS$ | ThUS$ | ThUS$ | |||||||||||||||||||
| Receivables related to credit operations, current | 445,670 | (16,520 | ) | 429,150 | 427,400 | (15,079 | ) | 412,321 | ||||||||||||||||
| Trade receivables, current | 445,670 | (16,520 | ) | 429,150 | 427,400 | (15,079 | ) | 412,321 | ||||||||||||||||
| Prepayments, current | 16,990 | (843 | ) | 16,147 | 16,877 | (700 | ) | 16,177 | ||||||||||||||||
| Other receivables, current | 23,863 | (4,305 | ) | 19,558 | 23,409 | (5,032 | ) | 18,377 | ||||||||||||||||
| Current trade and other receivables | 40,853 | (5,148 | ) | 35,705 | 40,286 | (5,732 | ) | 34,554 | ||||||||||||||||
| Other receivables, non-current | 2,275 | - | 2,275 | 1,912 | - | 1,912 | ||||||||||||||||||
| Non-current receivables | 2,275 | - | 2,275 | 1,912 | - | 1,912 | ||||||||||||||||||
| Total trade and other receivables | 488,798 | (21,668 | ) | 467,130 | 469,598 | (20,811 | ) | 448,787 | ||||||||||||||||
| F- 96 |
Notes to the Consolidated Financial Statements as of December 31, 2018
| Note 13 | Financial instruments, (continued) |
| 13.2 | Trade and other receivables, continued |
Portfolio stratification, continued
The Company’s policy is to require guarantees (such as letters of credit, guarantee clauses and others) and/or maintaining insurance policies for certain accounts as deemed necessary by management.
Uncollateralized portfolio
As of December 31, 2018 the detail of the uncollateralized portfolio is as follows:
| 2018 | ||||||||||||||||
| Total uncollateralized portfolio | ||||||||||||||||
|
Past due
segments |
Number of
customers non- renegotiated portfolio |
Gross non-
renegotiated portfolio ThUS$ |
Number of
customers renegotiated portfolio |
Gross renegotiated
portfolio ThUS$ |
||||||||||||
| Current | 1,429 | 403,805 | 136 | 668 | ||||||||||||
| 1-30 days | 1,284 | 17,899 | 390 | 596 | ||||||||||||
| 31-60 days | 940 | 8,063 | 154 | 118 | ||||||||||||
| 61-90 days | 661 | 2,147 | 41 | 75 | ||||||||||||
| 91-120 days | 498 | 1,210 | 27 | 47 | ||||||||||||
| 121-150 days | 85 | 385 | 16 | 29 | ||||||||||||
| 151-180 days | 49 | 177 | 21 | 176 | ||||||||||||
| 181-210 days | 14 | 1,289 | 41 | 231 | ||||||||||||
| 211-250 days | 12 | 107 | 101 | 242 | ||||||||||||
| >250 days | 1,756 | 7,258 | 305 | 1,148 | ||||||||||||
| Total | 6,728 | 442,340 | 1,232 | 3,330 | ||||||||||||
As of December 31, 2017 the detail of the uncollateralized portfolio is as follows:
| 2017 | ||||||||||||||||
| Total uncollateralized portfolio | ||||||||||||||||
|
Past due
segments |
Number of
customers non- renegotiated portfolio |
Gross non-
renegotiated portfolio ThUS$ |
Number of
customers renegotiated portfolio |
Gross renegotiated
portfolio ThUS$ |
||||||||||||
| Current | 3,039 | 344,802 | 23 | 706 | ||||||||||||
| 1-30 days | 1,598 | 41,510 | 376 | 924 | ||||||||||||
| 31-60 days | 824 | 8,813 | 130 | 272 | ||||||||||||
| 61-90 days | 756 | 3,740 | 50 | 119 | ||||||||||||
| 91-120 days | 548 | 7,367 | 22 | 54 | ||||||||||||
| 121-150 days | 182 | 2,914 | 22 | 56 | ||||||||||||
| 151-180 days | 443 | 5,602 | 45 | 75 | ||||||||||||
| 181-210 days | 365 | 4,470 | 27 | 45 | ||||||||||||
| 211-250 days | 682 | 112 | 29 | 138 | ||||||||||||
| >250 days | 1,837 | 3,050 | 350 | 2,631 | ||||||||||||
| Total | 10,274 | 422,380 | 1,074 | 5,020 | ||||||||||||
| F- 97 |
Notes to the Consolidated Financial Statements as of December 31, 2018
| Note 13 | Financial instruments, (continued) |
| 13.2 | Trade and other receivables, continued |
| Accounts Receivable | ||||||||||||||||||||||||
| 2018 | Current |
1 to 30
days |
31 to 60
days |
61 to 90
days |
Over 90
days |
Total
ThUS$ |
||||||||||||||||||
|
Expected Loss Rate
|
0 | % | 0 | % | 87 | % | 100 | % | 100 | % | ||||||||||||||
| Total Gross Book Value | 404,473 | 18,495 | 8,181 | 2,222 | 12,299 | 445,670 | ||||||||||||||||||
| Deterioration Estimate | - | - | 7,147 | 2,222 | 12,299 | 21,668 | ||||||||||||||||||
| Accounts Receivable | ||||||||||||||||||||||||
| 2017 | Current |
1 to 30
days |
31 to 60
days |
61 to 90
days |
Over 90
days |
Total
ThUS$ |
||||||||||||||||||
|
Expected Loss Rate
|
0 | % | 0 | % | 0 | % | 27 | % | 74 | % | ||||||||||||||
| Total Gross Book Value | 345,508 | 42,434 | 9,085 | 3,859 | 26,514 | 427,400 | ||||||||||||||||||
| Deterioration Estimate | - | - | - | 1,061 | 19,750 | 20,811 | ||||||||||||||||||
As of December 31, 2018 and December 31, 2017, movements in provisions are as follows:
| 12/31/2018 | 12/31/2017 | |||||||
| ThUS$ | ThUS$ | |||||||
| Provision Impairment Accounts receivable at the beginning of the Period | 34,936 | 31,616 | ||||||
| Adjustment to Starting Balance through New Model Calculations (IFRS 9) | 2,301 | - | ||||||
| Increase / (decrease) impairment of accounts receivable for the period to profit and loss | (2,967 | ) | 8,037 | |||||
| Use of Provision Applied to Accounts Receivable | (1,636 | ) | (4,717 | ) | ||||
| Impairment of Accounts Receivable Provision at the beginning of the Period (1)+(2) | 32,634 | 34,936 | ||||||
| (1) Trade and Other Receivables Provision | 21,668 | 20,811 | ||||||
| (2) Current Related Party Receivables Provision | 10,966 | 14,125 | ||||||
| Recovery of Insurance | 827 | 126 | ||||||
| Impairment of Accounts Receivable Provision | 32,634 | 34,936 | ||||||
| Renegotiated Provision | 2,056 | 2,580 | ||||||
| Non-renegotiated Provision | 30,578 | 32,356 | ||||||
Credit risk concentration.
Credit risk concentration with respect to trade receivables is reduced due to the great number of entities in the Company’s client base and their distribution throughout the world.
| F- 98 |
Notes to the Consolidated Financial Statements as of December 31, 2018
| Note 13 | Financial instruments (continued) |
| 13.3 | Hedging assets and liabilities |
The balance represents derivative instruments measured at fair value which have been classified as hedges from exchange and interest rate risks related to the total obligations associated with bonds in Chilean pesos and UF in Chilean pesos. As of December 31, 2017, the notional amount of cash flows in Cross Currency Swap contracts agreed upon in US dollars amounted to ThUS$ 461,659, and as of December 31, 2017 such contracts amounted to ThUS$ 266,335.
|
Hedging assets with
underlying debt |
Derivative
instruments (Fwds) |
Effect on profit or loss
for the period Derivative instruments |
Hedging reserve in
equity before tax |
Deferred tax
hedging reserve in equity |
Hedging reserve
in equity |
|||||||||||||||
| ThUS$ | ThUS$ | ThUS$ | ThUS$ | ThUS$ | ||||||||||||||||
| December 31, 2018 | 13,516 | (3,004 | ) | 8,256 | - | 8,256 | ||||||||||||||
|
Hedging liabilities with
underlying debt |
Derivative
instruments (CCS) |
Effect on profit or loss
for the period Derivative instruments |
Hedging reserve in
equity before tax |
Deferred tax
hedging reserve in equity |
Hedging
reserve in equity |
|||||||||||||||
| ThUS$ | ThUS$ | ThUS$ | ThUS$ | ThUS$ | ||||||||||||||||
| December 31, 2018 | (17,318 | ) | 16,636 | 1,541 | - | 1,541 | ||||||||||||||
|
Hedging assets with
underlying investments |
Derivative
|
Effect on profit or loss
for the period Derivative instruments |
Hedging reserve in
equity before tax |
Deferred tax
hedging reserve in equity |
Hedging
reserve in equity |
|||||||||||||||
| ThUS$ | ThUS$ | ThUS$ | ThUS$ | ThUS$ | ||||||||||||||||
| December 31, 2018 | 18,146 | 19,911 | (1,765 | ) | - | (1,765 | ) | |||||||||||||
|
Hedging assets with
underlying debt |
Derivative
instruments (Fwds) |
Effect on profit or loss
for the period Derivative instruments |
Hedging reserve in
equity before tax |
Deferred tax
hedging reserve in equity |
Hedging reserve
in equity |
|||||||||||||||
| ThUS$ | ThUS$ | ThUS$ | ThUS$ | ThUS$ | ||||||||||||||||
| December 31, 2017 | 8,910 | 5,641 | 2,170 | - | 2,170 | |||||||||||||||
|
Hedging liabilities with
underlying debt |
Derivative
instruments (CCS) |
Effect on profit or loss
for the period Derivative instruments |
Hedging reserve in
equity before tax |
Deferred tax
hedging reserve in equity |
Hedging
reserve in equity |
|||||||||||||||
| ThUS$ | ThUS$ | ThUS$ | ThUS$ | ThUS$ | ||||||||||||||||
| December 31, 2017 | 17,128 | 33,696 | 41 | - | 41 | |||||||||||||||
| F- 99 |
Notes to the Consolidated Financial Statements as of December 31, 2018
| Note 13 | Financial instruments (continued) |
| 13.3 | Hedging assets and liabilities, continued |
|
Hedging liabilities with
underlying investments |
Derivative
instruments (CCS) |
Effect on profit or loss
for the period Derivative instruments |
Hedging reserve in
equity before tax |
Deferred tax
hedging reserve in equity |
Hedging
reserve in equity |
|||||||||||||||
| ThUS$ | ThUS$ | ThUS$ | ThUS$ | ThUS$ | ||||||||||||||||
| December 31, 2017 | (20,159 | ) | (20,256 | ) | 97 | - | 97 | |||||||||||||
The balances in the “effect on profit or loss for the period” column consider the amounts reclassified from other comprehensive income to the statement of comprehensive income. Derivative contract maturities are detailed as follows:
| Series |
Contract amount
ThUS$ |
Currency | Maturity date | |||||
| H | 155,214 | UF | 01/05/2023 | |||||
| O | 58,748 | UF | 02/01/2022 | |||||
| P | 134,228 | UF | 01/15/2028 | |||||
The Company uses cross currency swap derivative instruments to hedge the possible financial risk associated with the volatility of the exchange rate associated with Chilean pesos and UF. The objective is to hedge the exchange rate financial risks associated with bonds payable. Hedges are documented and tested to measure their effectiveness.
Based on a comparison of critical terms, hedging is highly effective, given that the hedged amount is consistent with obligations maintained for bonds denominated in Chilean pesos and UF. Likewise, hedging contracts are denominated in the same currencies and have the same expiration dates of bond principal and interest payments.
Hedge Accounting
The Company classifies derivative instruments as hedging that may include derivative or embedded derivatives either as fair value hedge derivative instruments, cash flow hedge derivative instruments, or hedge derivative instruments for net investment in a business abroad.
a) Fair value hedge
Changes in fair values of derivative instruments classified as fair value hedge derivative instruments are accounted for in gains and losses immediately along with any change in the fair value of the hedged item that is attributable to the risk being hedged.
| F- 100 |
Notes to the Consolidated Financial Statements as of December 31, 2018
| Note 13 | Financial instruments (continued) |
| 13.3 | Hedging assets and liabilities, continued |
b) Cash flow hedges
Cash flow hedges cover exposure to the cash flow variations attributable to a risk associated with a specific transaction that is very likely to be executed, which may have material effects on the results of the Company.
The Company documents the relationship between hedge instruments and the hedged item along with the objectives of its risk management and strategy to carry out different hedging transactions. In addition, upon commencement of the period hedged and then on a quarterly basis, the Company documents whether hedge instruments have been efficient and met the objective of hedging market fluctuations. For this purpose, we use the effectiveness test.
The hedge instruments are classified as effective or not effective on the basis of the effectiveness test results. At present, hedges are classified as effective on the basis of the effectiveness tests. This note includes the detail of fair values of derivatives classified as hedging instruments.
| 13.4 | Financial liabilities |
Other current and non-current financial liabilities
As of December 31, 2018 and December 31, 2017, the detail is as follows:
| 31/12/2018 | 31/12/2017 | |||||||||||||||||||||||
| Current | Non-current | Total | Current | Non-current | Total | |||||||||||||||||||
| ThUS$ | ThUS$ | ThUS$ | ThUS$ | ThUS$ | ThUS$ | |||||||||||||||||||
| Liabilities at amortized cost | ||||||||||||||||||||||||
| - Bank borrowings | 300 | 68,870 | 69,170 | 163,568 | - | 163,568 | ||||||||||||||||||
| - Obligations with the public (bonds) | 15,145 | 1,249,479 | 1,264,624 | 13,494 | 1,031,507 | 1,045,001 | ||||||||||||||||||
| Derivative financial instruments | ||||||||||||||||||||||||
| - For hedging | 5,285 | 12,033 | 17,318 | 37,287 | - | 37,287 | ||||||||||||||||||
| - At fair value through profit or loss | 2,855 | - | 2,855 | 5,979 | - | 5,979 | ||||||||||||||||||
| Total | 23,585 | 1,330,382 | 1,353,967 | 220,328 | 1,031,507 | 1,251,835 | ||||||||||||||||||
| F- 101 |
Notes to the Consolidated Financial Statements as of December 31, 2018
| Note 13 | Financial instruments (continued) |
| 13.4 | Financial liabilities, continued |
Current and non-current bank borrowings
As of December 31, 2018 and December 31, 2017, the detail is as follows:
| 12/31/2018 | 12/31/2017 | |||||||
| ThUS$ | ThUS$ | |||||||
| Long-term bank borrowings | 68,870 | - | ||||||
| Short-term bank borrowings | - | 163,568 | ||||||
| Current portion of long-term loans | 300 | - | ||||||
| Short-term borrowings and current portion of long-term borrowings | 69,170 | 163,568 | ||||||
| Total bank borrowings | 69,170 | 163,568 | ||||||
| F- 102 |
Notes to the Consolidated Financial Statements as of December 31, 2018
| Note 13 | Financial instruments (continued) |
| 13.4 | Financial liabilities, continued |
a) Bank borrowings, current:
As of December 31, 2018 and December 31, 2017, the detail of this caption is as follows:
| Currency or | ||||||||||||||||||||||||
| Debtor | Creditor | adjustment | Effective | Nominal | ||||||||||||||||||||
| Tax ID No | Company | Country | Tax ID No, | Financial institution | Country | index | Repayment | Vencimiento | rate | rate | ||||||||||||||
| 93,007,000-9 | SQM.S.A. | Chile | 0-E | Scotiabank Cayman | USA | US$ | Upon maturity | 05/29/2023 | 3.60 | % | 3.98 | % | ||||||||||||
| Foreign | Nitratos Naturais do Chile Lim | Brazil | 0-E | Banco ITAU Brasil | Brasil | BRL | Upon maturity | 01/31/2019 | 5.17 | % | 5.17 | % | ||||||||||||
| Foreign | SQM Brasil Limitada | Brazil | 0-E | Banco ITAU Brasil | Brasil | BRL | Upon maturity | 01/31/2019 | 5.5 | % | 5.5 | % | ||||||||||||
| 12/31/2018 | 12/31/2018 | |||||||||||||||||||||||||||||||||
| Debtor | Creditor | Nominal amounts | Current amounts | |||||||||||||||||||||||||||||||
| Company | Financial institution |
Up
to 90
ThUS$ |
90
days to
ThUS$ |
Total ThUS$ |
Up
to 90
ThUS$ |
90
days to
ThUS$ |
Subtotal ThUS$ |
Borrowing
costs ThUS$ |
Total ThUS$ | |||||||||||||||||||||||||
| SQM S.A. | Scotiabank Cayman | - | - | - | - | 248 | 248 | - | 248 | |||||||||||||||||||||||||
| Nitratos Naturais do Chile Lim | Banco ITAU Brasil | - | - | - | 11 | - | 11 | - | 11 | |||||||||||||||||||||||||
| SQM Brasil Limitada | Banco ITAU Brasil | - | - | - | 41 | - | 41 | - | 41 | |||||||||||||||||||||||||
| Total | - | - | - | 52 | 248 | 300 | - | 300 | ||||||||||||||||||||||||||
| F- 103 |
Notes to the Consolidated Financial Statements as of December 31, 2018
| Note 13 | Financial instruments (continued) |
| 13.4 | Financial liabilities, continued |
| Debtor | Creditor |
Currency or
adjustment |
Repayment | Effective | Nominal | |||||||||||||||||
| Tax ID No | Company | Country | Tax ID No, | Financial institution | Country | index | rate | rate | ||||||||||||||
| 93,007,000-9 | SQM.S.A. | CHILE | 97,018,000-1 | Scotiabank Sud Americano | CHILE | US$ | Upon maturity | 1.63 | % | 1.63 | % | |||||||||||
| 93,007,000-9 | SQM.S.A. | CHILE | 97,018,000-1 | Scotiabank Sud Americano | CHILE | US$ | Upon maturity | 1.73 | % | 1.73 | % | |||||||||||
| 93,007,000-9 | SQM.S.A. | CHILE | 97,018,000-1 | Scotiabank Sud Americano | CHILE | US$ | Upon maturity | 1.73 | % | 1.73 | % | |||||||||||
| 93,007,000-9 | SQM S.A. | CHILE | 97,018,000-1 | Banco Estado | CHILE | US$ | Upon maturity | 1.64 | % | 1.64 | % | |||||||||||
| 93,007,000-9 | SQM S.A. | CHILE | 97,018,000-1 | Banco Estado | CHILE | US$ | Upon maturity | 1.67 | % | 1.67 | % | |||||||||||
| 93,007,000-9 | SQM S.A. | CHILE | 97,018,000-1 | Banco Estado | CHILE | US$ | Upon maturity | 1.67 | % | 1.67 | % | |||||||||||
| 79,626,800-K | SQM Salar S.A. | CHILE | 97,018,000-1 | Banco Estado | CHILE | US$ | Upon maturity | 1.91 | % | 1.91 | % | |||||||||||
| 79,626,800-K | SQM Salar S.A. | CHILE | 97,018,000-1 | Scotiabank Sud Americano | CHILE | US$ | Upon maturity | 1.94 | % | 1.94 | % | |||||||||||
| 79,947,100-0 | SQM Industrial S.A. | CHILE | 97,030,000-7 | Banco Estado | CHILE | US$ | Upon maturity | 1.74 | % | 1.74 | % | |||||||||||
| 79,947,100-0 | SQM Industrial S.A. | CHILE | 97,030,000-7 | Banco Estado | CHILE | US$ | Upon maturity | 1.65 | % | 1.65 | % | |||||||||||
| 12/31/2017 | 12/31/2017 | |||||||||||||||||||||||||||||||||
| Debtor | Creditor | Nominal amounts | Current amounts | |||||||||||||||||||||||||||||||
| Company | Financial institution |
Up
to 90
ThUS$ |
90
days to
ThUS$ |
Total ThUS$ |
Up
to 90
ThUS$ |
90
days to
ThUS$ |
Subtotal ThUS$ |
Borrowing
costs ThUS$ |
Total ThUS$ | |||||||||||||||||||||||||
| SQM S.A. | Scotiabank Sud Americano | - | 20,000 | 20,000 | - | 20,137 | 20,137 | - | 20,137 | |||||||||||||||||||||||||
| SQM S.A. | Scotiabank Sud Americano | - | 17,000 | 17,000 | - | 17,140 | 17,140 | - | 17,140 | |||||||||||||||||||||||||
| SQM S.A. | Scotiabank Sud Americano | - | 3,000 | 3,000 | - | 3,025 | 3,025 | - | 3,025 | |||||||||||||||||||||||||
| SQM S.A. | Banco Estado | 15,000 | - | 15,000 | 15,011 | - | 15,011 | - | 15,011 | |||||||||||||||||||||||||
| SQM S.A. | Banco Estado | 15,000 | - | 15,000 | 15,011 | - | 15,011 | - | 15,011 | |||||||||||||||||||||||||
| SQM S.A. | Banco Estado | 15,000 | - | 15,000 | 15,011 | - | 15,011 | - | 15,011 | |||||||||||||||||||||||||
| SQM Salar S.A. | Banco Estado | - | 20,000 | 20,000 | - | 20,071 | 20,071 | - | 20,071 | |||||||||||||||||||||||||
| SQM Salar S.A. | Scotiabank Sud Americano | - | 20,000 | 20,000 | - | 20,072 | 20,072 | - | 20,072 | |||||||||||||||||||||||||
| SQM Industrial S.A. | Banco Estado | - | 20,000 | 20,000 | - | 20,064 | 20,064 | - | 20,064 | |||||||||||||||||||||||||
| SQM Industrial S.A. | Banco Estado | 18,000 | - | 18,000 | 18,026 | - | 18,026 | - | 18,026 | |||||||||||||||||||||||||
| Total | 63,000 | 100,000 | 163,000 | 63,059 | 100,509 | 163,568 | - | 163,568 | ||||||||||||||||||||||||||
| F- 104 |
Notes to the Consolidated Financial Statements as of December 31, 2018
| Note 13 | Financial instruments (continued) |
| 13.4 | Financial liabilities, continued |
b) Unsecured obligations, current:
As of December 31, 2018 and December 31, 2017, the detail of current unsecured interest-bearing obligations is composed of promissory notes and bonds, as follows:
Bonds
| Tax ID No. | Company | Country |
Number of
registration or ID of the instrument |
Series |
Maturity
date |
Currency or
adjustment index |
Payment of
interest |
Repayment |
Effective
rate |
Nominal
rate |
||||||||||||||||
| 93,007,000-9 | SQM S.A. | CHILE | - | MMUS$250 | 4/21/2019 | US$ | Semiannual | Upon maturity | 0.95 | % | 5,50 | % | ||||||||||||||
| 93,007,000-9 | SQM S.A. | CHILE | - | MMUS$250 | 1/28/2019 | US$ | Semiannual | Upon maturity | 2,75 | % | 4,38 | % | ||||||||||||||
| 93,007,000-9 | SQM S.A. | CHILE | - | MMUS$300 | 4/03/2019 | US$ | Semiannual | Upon maturity | 1,77 | % | 3,63 | % | ||||||||||||||
| 93,007,000-9 | SQM S.A. | CHILE | 564 | H | 1/05/2019 | UF | Semiannual | Semiannual | 1,90 | % | 4,90 | % | ||||||||||||||
| 93,007,000-9 | SQM S.A. | CHILE | 699 | O | 2/01/2019 | UF | Semiannual | Upon maturity | 2,60 | % | 3,80 | % | ||||||||||||||
| 93,007,000-9 | SQM S.A. | CHILE | 563 | P | 1/15/2019 | UF | Semiannual | Upon maturity | 3,07 | % | 3,25 | % | ||||||||||||||
| 93.007.000-9 | SQM S.A. | Chile | 700 | Q | 6/01/2019 | UF | Semiannual | Upon maturity | 3,34 | % | 3,45 | % | ||||||||||||||
| 12/31/2018 | 12/31/2018 | |||||||||||||||||||||||||||||||||||
| Nominal maturities | Current maturities | |||||||||||||||||||||||||||||||||||
| Bond | ||||||||||||||||||||||||||||||||||||
| 91 days to 1 | 91 days to 1 | issuance | ||||||||||||||||||||||||||||||||||
| Up to 90 days | year | Total | Up to 90 days | Year | Subtotal | costs | Total | |||||||||||||||||||||||||||||
| Company | Country | Series | ThUS$ | ThUS$ | ThUS$ | ThUS$ | ThUS$ | ThUS$ | ThUS$ | ThUS$ | ||||||||||||||||||||||||||
| SQM S.A. | CHILE | ThUS$250,000 | 2,674 | - | 2,674 | 2,674 | - | 2,674 | (386 | ) | 2,288 | |||||||||||||||||||||||||
| SQM S.A. | CHILE | ThUS$250,000 | - | 4,648 | 4,648 | - | 4,648 | 4,648 | (433 | ) | 4,215 | |||||||||||||||||||||||||
| SQM S.A. | CHILE | ThUS$300,000 | 2,658 | - | 2,658 | 2,658 | - | 2,658 | (614 | ) | 2,044 | |||||||||||||||||||||||||
| SQM S.A. | CHILE | H | - | 3,756 | 3,756 | - | 3,756 | 3,756 | (139 | ) | 3,617 | |||||||||||||||||||||||||
| SQM S.A. | CHILE | O | - | 934 | 934 | - | 934 | 934 | (67 | ) | 867 | |||||||||||||||||||||||||
| SQM S.A. | CHILE | P | - | 1,784 | 1,784 | - | 1,784 | 1,784 | (12 | ) | 1,772 | |||||||||||||||||||||||||
| SQM S.A. | CHILE | Q | 342 | - | 342 | 342 | - | 342 | - | 342 | ||||||||||||||||||||||||||
| Total | 5,674 | 11,122 | 16,796 | 5,674 | 11,122 | 16,796 | (1,651 | ) | 15,145 | |||||||||||||||||||||||||||
Effective rates of bonds in Chilean pesos and UF are expressed and calculated in U.S. dollars based on the flows agreed in Cross Currency Swap Agreements.
| F- 105 |
Notes to the Consolidated Financial Statements as of December 31, 2018
| Note 13 | Financial instruments (continued) |
| 13.4 | Financial liabilities, continued |
| Tax ID No. | Company | Country |
Number of
registration or ID of the instrument |
Series |
Maturity
date |
Currency or
adjustment index |
Payment of
interest |
Repayment |
Effective
rate |
Nominal
rate |
||||||||||||||||
| 93,007,000-9 | SQM S.A. | CHILE | - | ThUS$250,000 | 04/21/2018 | US$ | Semiannual | Upon maturity | 1.47 | % | 5.50 | % | ||||||||||||||
| 93,007,000-9 | SQM S.A. | CHILE | - | ThUS$250,000 | 01/28/2018 | US$ | Semiannual | Upon maturity | 3.17 | % | 4.38 | % | ||||||||||||||
| 93,007,000-9 | SQM S.A. | CHILE | - | ThUS$300,000 | 04/03/2018 | US$ | Semiannual | Upon maturity | 2.12 | % | 3.63 | % | ||||||||||||||
| 93,007,000-9 | SQM S.A. | CHILE | 564 | H | 01/05/2018 | UF | Semiannual | Semiannual | 2.18 | % | 4.90 | % | ||||||||||||||
| 93,007,000-9 | SQM S.A. | CHILE | 699 | O | 02/01/2018 | UF | Semiannual | Upon maturity | 2.80 | % | 3.80 | % | ||||||||||||||
| 12/31/2017 | 12/31/2017 | |||||||||||||||||||||||||||||||||||
| Nominal maturities | Current maturities | |||||||||||||||||||||||||||||||||||
| Company | Country | Series | Up to 90 days |
91 days to 1
year |
Total | Up to 90 days |
91 days to 1
year |
Subtotal |
Bond
issuance costs |
Total | ||||||||||||||||||||||||||
| ThUS$ | ThUS$ | ThUS$ | ThUS$ | ThUS$ | ThUS$ | ThUS$ | ThUS$ | |||||||||||||||||||||||||||||
| SQM S.A. | CHILE | ThUS$250,000 | - | - | - | - | 2,674 | 2,674 | (385 | ) | 2,289 | |||||||||||||||||||||||||
| SQM S.A. | CHILE | ThUS$250,000 | - | - | - | 4,648 | - | 4,648 | (433 | ) | 4,215 | |||||||||||||||||||||||||
| SQM S.A. | CHILE | ThUS$300,000 | - | - | - | - | 2,658 | 2,658 | (615 | ) | 2,043 | |||||||||||||||||||||||||
| SQM S.A. | CHILE | H | - | - | - | 4,127 | - | 4,127 | (139 | ) | 3,988 | |||||||||||||||||||||||||
| SQM S.A. | CHILE | O | - | - | - | 1,026 | - | 1,026 | (67 | ) | 959 | |||||||||||||||||||||||||
| Total | - | - | - | 9,801 | 5,332 | 15,133 | (1,639 | ) | 13,494 | |||||||||||||||||||||||||||
Effective rates of bonds in Chilean pesos and UF are expressed and calculated in U.S. dollars based on the flows agreed in Cross Currency Swap Agreements.
| F- 106 |
NOTES TO THE CONSOLIDATED FINANCIAL STATEMENTS AS OF DECEMBER 31, 2018
| Note 13 | Financial instruments (continued) |
| 13.4 | Financial liabilities, continued |
| c) | Classes of interest-bearing loans, non-current |
The following table shows the details of bank loans that accrue non-current interest as of December 31, 2018. As of December 31, there were no loans:
| Debtor | Creditor |
|
|
Currency or adjustment index |
Type of amortization |
Effective rate |
Nominal rate |
|||||||||||||||
|
Chilean Tax ID |
Company | Country |
Chilean Tax ID |
Financial institution | Country | |||||||||||||||||
| 93,007,000-9 | SQM.S.A. | Chile | 0-E | Scotiabank Cayman | USA | USD | Maturity | 3.98 | % | 3.98 | % | |||||||||||
| 12/31/2018 | 12/31/2018 | |||||||||||||||||||||||||||||||||||||||
| Creditor | Creditor | Nominal non-current maturities | Non-current maturities | |||||||||||||||||||||||||||||||||||||
| Company | Financial institution |
Between 1 and 2 ThUS$ |
Between 2
and 3 ThUS$ |
Between 3
and 4 ThUS$ |
Total ThUS$ |
Between 1 and 2 ThUS$ |
Between 2
and 3 ThUS$ |
Between 3 and 4
ThUS$ |
Subtotal
ThUS$ |
Costs of obtaining loans ThUS$ |
Total
ThUS$ |
|||||||||||||||||||||||||||||
| SQM S.A. | Scotiabank Cayman | - | 70,000 | 70,000 | - | - | 70,000 | 70,000 | (1,130 | ) | 68,870 | |||||||||||||||||||||||||||||
| Total | - | - | 70,000 | 70,000 | - | - | 70,000 | 70,000 | (1,130 | ) | 68,870 | |||||||||||||||||||||||||||||
| F- 107 |
NOTES TO THE CONSOLIDATED FINANCIAL STATEMENTS AS OF DECEMBER 31, 2018
| Note 13 | Financial instruments (continued) |
| 13.4 | Financial liabilities, continued |
| d) | Non-current unsecured interest-bearing bonds |
The breakdown of non-current unsecured interest-bearing bonds as of December 31, 2018 and December 31, 2017 is detailed as follows:
| Number of | Periodicity | |||||||||||||||||||||||||
| Tax ID No. | Company | Country |
registration or ID of
the instrument |
Series |
Maturity
date |
Currency or
adjustment index |
Payment of
interest |
Repayment |
Effective
rate |
Nominal
rate |
||||||||||||||||
| 93.007.000-9 | SQM S.A. | CHILE | - | ThUS$250,000 | 04/21/2020 | US$ | Semiannual | Upon maturity | 5.50 | % | 5.50 | % | ||||||||||||||
| 93.007.000-9 | SQM S.A. | CHILE | - | ThUS$250,000 | 01/28/2025 | US$ | Semiannual | Upon maturity | 4.38 | % | 4.38 | % | ||||||||||||||
| 93.007.000-9 | SQM S.A. | CHILE | - | ThUS$300,000 | 04/03/2023 | US$ | Semiannual | Upon maturity | 3.63 | % | 3.63 | % | ||||||||||||||
| 93.007.000-9 | SQM S.A. | CHILE | 564 | H | 01/05/2030 | UF | Semiannual | Semiannual | 4.90 | % | 4.90 | % | ||||||||||||||
| 93.007.000-9 | SQM S.A. | CHILE | 699 | O | 02/01/2033 | UF | Semiannual | Upon maturity | 3.80 | % | 5.50 | % | ||||||||||||||
| 93.007.000-9 | SQM S.A. | CHILE | 563 | P | 01/15/2028 | UF | Semiannual | Upon maturity | 3.25 | % | 3.25 | % | ||||||||||||||
| 93.007.000-9 | SQM S.A. | CHILE | 700 | Q | 06/01/2038 | UF | Semiannual | Upon maturity | 3.45 | % | 3.45 | % | ||||||||||||||
|
Nominal non-current maturities 12/31/2018 |
Non-current maturities 12/31/2018 |
|||||||||||||||||||||||||||||||||||||||||||||||||||||||
| Series |
Over 1
year to 2 |
Over 2
years to 3 |
Over 3
Years to 4 |
Over 4
Years to 5 |
Over 5
years |
Total |
Over 1
year to 2 |
Over 2
years to 3 |
Over 3
Years to 4 |
Over 4
Years to 5 |
Over 5
years |
Subtotal |
Bond
issuance costs |
Total | ||||||||||||||||||||||||||||||||||||||||||
| ThUS$ | ThUS$ | ThUS$ | ThUS$ | ThUS$ | ThUS$ | ThUS$ | ThUS$ | ThUS$ | ThUS$ | ThUS$ | ThUS$ | ThUS$ | ThUS$ | |||||||||||||||||||||||||||||||||||||||||||
| MUS$250 | 250,000 | - | - | - | - | 250,000 | 250,000 | - | - | - | - | 250,000 | (131 | ) | 249,869 | |||||||||||||||||||||||||||||||||||||||||
| MUS$250 | - | - | - | - | 250,000 | 250,000 | - | - | - | - | 250,000 | 250,000 | (2,202 | ) | 247,798 | |||||||||||||||||||||||||||||||||||||||||
| MUS$300 | - | - | 300,000 | - | - | 300,000 | - | - | 300,000 | - | - | 300,000 | (2,006 | ) | 297,994 | |||||||||||||||||||||||||||||||||||||||||
| H | - | - | - | - | 158,704 | 158,704 | - | - | - | - | 158,704 | 158,704 | (1,392 | ) | 157,312 | |||||||||||||||||||||||||||||||||||||||||
| O | - | - | - | - | 59,514 | 59,514 | - | - | - | - | 59,514 | 59,514 | (878 | ) | 58,636 | |||||||||||||||||||||||||||||||||||||||||
| P | - | - | - | - | 119,028 | 119,028 | - | - | - | - | 119,028 | 119,028 | (101 | ) | 118,927 | |||||||||||||||||||||||||||||||||||||||||
| Q | - | - | - | - | 119,028 | 119,028 | - | - | - | - | 119,028 | 119,028 | (85 | ) | 118,943 | |||||||||||||||||||||||||||||||||||||||||
| Total | 250,000 | - | 300,000 | - | 706,274 | 1,256,274 | 250,000 | - | 300,000 | - | 706,274 | 1,256,274 | (6,795 | ) | 1,249,479 | |||||||||||||||||||||||||||||||||||||||||
| F- 108 |
NOTES TO THE CONSOLIDATED FINANCIAL STATEMENTS AS OF DECEMBER 31, 2018
| Note 13 | Financial instruments (continued) |
| 13.4 | Financial liabilities, continued |
| d) | Non-current unsecured interest-bearing bonds, continued |
As of December 31, 2018 and December 31, 2017, the breakdown of unsecured interest-bearing liabilities, non-current is as follows:
| Number of | Periodicity | |||||||||||||||||||||||||
| Tax ID No, | Company | Country |
registration or ID of the instrument |
Series |
Maturity
date |
Currency or
|
Payment of interest |
Repayment |
Effective rate |
Nominal rate |
||||||||||||||||
| 93.007.000-9 | SQM S.A. | CHILE | - | MMUS$250 | 04/21/2020 | US$ | Semiannual | Upon maturity | 5.50 | % | 5.50 | % | ||||||||||||||
| 93.007.000-9 | SQM S.A. | CHILE | - | MMUS$250 | 01/28/2025 | US$ | Semiannual | Upon maturity | 4.38 | % | 4.38 | % | ||||||||||||||
| 93.007.000-9 | SQM S.A. | CHILE | - | MMUS$300 | 04/03/2023 | US$ | Semiannual | Upon maturity | 3.63 | % | 3.63 | % | ||||||||||||||
| 93.007.000-9 | SQM S.A. | CHILE | 564 | H | 01/05/2030 | UF | Semiannual | Semiannual | 4.90 | % | 6.01 | % | ||||||||||||||
| 93.007.000-9 | SQM S.A. | CHILE | 699 | O | 01/02/2033 | UF | Semiannual | Upon maturity | 3.80 | % | 3.80 | % | ||||||||||||||
|
Nominal non-current maturities 12/31/2017 |
Non-current maturities 12/31/2017 |
|||||||||||||||||||||||||||||||||||||||||||||||||||||||
| Series |
Over 1 year to 2 |
Over 2 years to 3 |
Over 3 Years to 4 |
Over 4 Years to 5 |
Over 5 years |
Total |
Over 1 year to 2 |
Over 2 years to 3 |
Over 3 Years to 4 |
Over 4 Years to 5 |
Over 5 years |
Subtotal |
Bond issuance costs |
Total | ||||||||||||||||||||||||||||||||||||||||||
| ThUS$ | ThUS$ | ThUS$ | ThUS$ | ThUS$ | ThUS$ | ThUS$ | ThUS$ | ThUS$ | ThUS$ | ThUS$ | ThUS$ | ThUS$ | ThUS$ | |||||||||||||||||||||||||||||||||||||||||||
| MUS$250 | 250,000 | - | - | - | - | 250,000 | 250,000 | - | - | - | - | 250,000 | (517 | ) | 249,483 | |||||||||||||||||||||||||||||||||||||||||
| MUS$250 | - | - | - | - | 250,000 | 250,000 | - | - | - | - | 250,000 | 250,000 | (2,636 | ) | 247,364 | |||||||||||||||||||||||||||||||||||||||||
| MUS$300 | - | - | - | - | 300,000 | 300,000 | - | - | - | - | 300,000 | 300,000 | (2,618 | ) | 297,382 | |||||||||||||||||||||||||||||||||||||||||
| H | - | - | - | - | 174,367 | 174,367 | - | - | - | - | 174,367 | 174,367 | (1,532 | ) | 172,835 | |||||||||||||||||||||||||||||||||||||||||
| O | - | - | - | - | 65,388 | 65,388 | - | - | - | - | 65,388 | 65,388 | (945 | ) | 64,443 | |||||||||||||||||||||||||||||||||||||||||
| Total | 250,000 | - | - | - | 789,755 | 1,039,755 | 250,000 | - | - | - | 789,755 | 1,039,755 | (8,248 | ) | 1,031,507 | |||||||||||||||||||||||||||||||||||||||||
| F- 109 |
NOTES TO THE CONSOLIDATED FINANCIAL STATEMENTS AS OF DECEMBER 31, 2018
| Note 13 | Financial instruments (continued) |
| 13.4 | Financial liabilities, continued |
e) Additional information
Bonds
On December 31, 2018 and December 31, 2017, short term bonds of ThUS$15,145 and ThUS$13,494 respectively were classified as short-term, consisting of the current portion due plus accrued interest to date; debt is presented net of bond issuance costs. The non-current portion consisted of ThUS$1,249,479 on December 31, 2018 and ThUS$1,031,507 on December 31, 2017, corresponding to the issuance series H bonds second issue single series bonds (ThUS$250), series M bonds, series O bonds, third issue single series bonds (ThUS$300) and fourth issue single series bonds (ThUS$250), series P bonds and series Q bonds, net of bond issuance costs
As of December 31, 2018 and, 2017, the details of each issuance are as follows:
Series “C” bonds
On January 24, 2006, the Company placed Series C bonds for UF 3,000,000 (ThUS$101,918) at an annual rate of 4.00%.
On July 5, 2017, the Series C bond was prepaid.
As of December 31, 2018, and December 31, 2017, the Company has made the following payments with a charge to the Series C bonds:
| Payments made | 12/31/2018 | 12/31/2017 | 12/31/2016 | |||||||||
| ThUS$ | ThUS$ | ThUS$ | ||||||||||
| Principal payment | - | 57,290 | 5,729 | |||||||||
| Interest payment | - | 1,515 | 3,275 | |||||||||
| F- 110 |
NOTES TO THE CONSOLIDATED FINANCIAL STATEMENTS AS OF DECEMBER 31, 2018
| Note 13 | Financial instruments (continued) |
| 13.4 | Financial liabilities, continued |
Serie “H” bonds
On January 13, 2009, the Company placed two bond series in the domestic market. The first was Series H for UF 4,000,000 (ThUS$139,216) at an annual interest rate of 4.9%, with a term of 21 years and payment of the principal beginning in 2019.
As of December 31, 2018, and December 31, 2017, the Company has made the following payments with a charge to the Series H bonds:
| Payments made |
12/31/2018 ThUS$ |
12/31/2017 ThUS$ |
12/31/2016 ThUS$ |
|||||||||
| Payments of interest, Series H bonds | 8,325 | 7,691 | 7,289 | |||||||||
Single series bonds, second issue ThUS$250,000
On April 21, 2010, the Company informed the CMF of its placement in international markets of an unsecured bond of ThUS$250,000 with a maturity of 10 years beginning on the aforementioned date with an annual interest rate of 5.5% and destined to refinance long-term liabilities.
As of December 31, 2018, and December 31, 2017, the detail of payments charged to the line of single series bonds, second issue is as follows:
| Payments made |
12/31/2018 ThUS$ |
12/31/2017 ThUS$ |
12/31/2016 ThUS$ |
|||||||||
| Interest payment | 13,750 | 13,750 | 13,750 | |||||||||
| F- 111 |
NOTES TO THE CONSOLIDATED FINANCIAL STATEMENTS AS OF DECEMBER 31, 2018
| Note 13 | Financial instruments (continued) |
| 13.4 | Financial liabilities, continued |
Series “M” and “O” bonds
On April 4, 2012, the Company placed two bond series in the domestic market. Series M for UF 1,000,000 (ThUS$46,601) was placed at a term of 5 years with a single payment at the maturity of the term and an annual interest rate of 3.3%. On February 1, 2017, the M bond was canceled.
| Payments made |
12/31/2018 ThUS$ |
12/31/2017 ThUS$ |
12/31/2016 ThUS$ |
|||||||||
| Principal payment Series M bonds | - | 40,726 | - | |||||||||
| Payment of interest, Series M bonds | - | 667 | 1,242 | |||||||||
Series O for UF 1,500,000 (ThUS$69,901) was placed at a term of 21 years with a single payment at the maturity of the term and an annual interest rate of 3.80%.
As of December 31, 2018, and December 31, 2017the Company has made the following payments with a charge to the Series O bonds:
| Payments made |
12/31/2018 ThUS$ |
12/31/2017 ThUS$ |
12/31/2017 ThUS$ |
|||||||||
| Payment of interest, Series O bonds | 2,457 | 2,301 | 2,142 | |||||||||
Single series bonds, third issue ThUS$300,000
On April 3, 2013, the Company issued a non-guaranteed bond in the United States with a value of US$300 million. The bond is for a 10-year term with an annual coupon rate of 3.625% and an annual yield of 3.716%. This rate equates to a difference of 180 basis points to comparable US Treasury bonds. The funds raised will be used to refinance long term liabilities and finance general corporate objectives.
As of December 31, 2018, and December 31, 2017, the following payments have been made with a debit to the line of single-series bonds, third issue:
| Payments made |
12/31/2018 ThUS$ |
12/31/2017 ThUS$ |
12/31/2016 ThUS$ |
|||||||||
| Payment of interest | 10,875 | 10,875 | 10,875 | |||||||||
| F- 112 |
NOTES TO THE CONSOLIDATED FINANCIAL STATEMENTS AS OF DECEMBER 31, 2018
| Note 13 | Financial instruments (continued) |
| 13.4 | Financial liabilities, continued |
Single series bonds, fourth issuance ThUS$250,000
On October 23, 2014, the Company informed the CMF that Sociedad Química y Minera de Chile S.A. had agreed to issue and place unsecured bonds of ThUS$250,000 in international markets. These mature in 2025 and have annual interest rate of 4.375%, equivalent to a spread of 215 basis points on comparable US Treasury bonds, which were offered to investors at a price of 99.410% with respect to capital. The aforementioned agreement was agreed on October 23, 2014 and the issuance and placement of such bonds was performed in conformity with the provisions of Rule 144A of the US Securities Act of 1933 and these bonds will not be publicly offered in Chile.
As of December 31, 2018, and December 31, 2017, the following payments have been made.
| Payments made |
12/31/2018 ThUS$ |
12/31/2017 ThUS$ |
12/31/2016 ThUS$ |
|||||||||
| Payment of interest | 10,938 | 10,938 | 10,938 | |||||||||
Series “P” bonds
On April 5, 2018, the Company informed the Financial Markets Commission that it had authorized the placement on the stock market of the Series “P” bond with a value of UF 3 million, with a charge to the 10 year Bonds Line registered in the FMC Securities Registry dated December 31, 2008 under number 563.
The Bonds (i) mature on January 15, 2028; (ii) will accrue on the unpaid principal, expressed in UF, at an annual interest rate of 3.25% from January 15, 2018; and (iii) can be called early by the Company as of the date of placement, that is, as of April 5, 2018.
| Payments made |
12/31/2018 ThUS$ |
|||
| Payment of interest | 2,027 | |||
| F- 113 |
NOTES TO THE CONSOLIDATED FINANCIAL STATEMENTS AS OF DECEMBER 31, 2018
| Note 13 | Financial instruments (continued) |
| 13.4 | Financial liabilities, continued |
Series Q Bonds
On October 31, 2018, the issuance of Series Q bonds (the "Bonds") was authorized in the general stock market for the sum of UF 3,000,000, which were issued with a charge to the 30-year Bonds Line registered in the Securities Registry of your Commission on February 14, 2012 under number 700.
The Bonds (i) mature on the first day of June 2038; (ii) will earn an interest rate of 3.45% per annum on the outstanding capital, expressed in Unidades de Fomento, as of June 1, 2018; and (iii) may be redeemed early by the Company as of the placement date, that is, as of November 8, 2018.
On November 8, 2018, all the Series Q Bonds have been placed and sold to Euroamerica S.A. for a total amount of $83,567,623,842, which was paid in full and in cash by Euroamerica S.A. to the Company.
The funds obtained from the aforementioned placement will be used approximately 90% to finance the expansion program of lithium, potassium nitrate and iodine plants in Chile; the remainder will be used for the investment plan of the Company and its subsidiaries, and to finance working capital.
| Payments made |
12/31/2018 ThUS$ |
|||
| Payment of interest | 319 | |||
| F- 114 |
NOTES TO THE CONSOLIDATED FINANCIAL STATEMENTS AS OF DECEMBER 31, 2018
| Note 13 | Financial instruments (continued) |
| 13.5 | Trade and other payables |
| 12/31/2018 | 12/31/2017 | |||||||||||||||||||||||
| Current | Non-current | Total | Current | Non-current | Total | |||||||||||||||||||
| ThUS$ | ThUS$ | ThUS$ | ThUS$ | ThUS$ | ThUS$ | |||||||||||||||||||
| Accounts payable | 163,373 | - | 163,373 | 195,858 | - | 195,858 | ||||||||||||||||||
| Other accounts payable | 378 | - | 378 | 422 | - | 422 | ||||||||||||||||||
| Total | 163,751 | - | 163,751 | 196,280 | - | 196,280 | ||||||||||||||||||
As of December 31, 2018 and December 31, 2017, the balance of current and past due suppliers is as follows:
Suppliers current on all payments
| Amounts according to payment periods as of 12/31/2018 | ||||||||||||||||||||||||||||
| Up to 30 | 31 - 60 | 61 - 90 | 91 - 120 | 121 - 365 |
366 and more |
Total | ||||||||||||||||||||||
| Type of Supplier | Days | days | Days | days | days | days | ThUS$ | |||||||||||||||||||||
| Goods | 48,969 | 1,919 | 912 | 25 | 278 | 2 | 52,105 | |||||||||||||||||||||
| Services | 37,376 | 314 | 157 | 107 | 19 | 35 | 38,008 | |||||||||||||||||||||
| Others | 54,978 | 161 | 20 | - | - | 3 | 55,162 | |||||||||||||||||||||
| Total | 141,323 | 2,394 | 1,089 | 132 | 297 | 40 | 145,275 | |||||||||||||||||||||
| Amounts according to payment periods as of 12/31/2017 | ||||||||||||||||||||||||||||
| Up to 30 | 31 - 60 | 61 - 90 | 91 - 120 | 121 - 365 |
366 and
more |
Total | ||||||||||||||||||||||
| Type of Supplier | days | days | days | days | days | days | ThUS$ | |||||||||||||||||||||
| Goods | 72,567 | - | - | - | - | - | 72,567 | |||||||||||||||||||||
| Services | 36,855 | - | - | - | - | 3 | 36,858 | |||||||||||||||||||||
| Others | 45,104 | - | - | - | - | - | 45,104 | |||||||||||||||||||||
| Total | 154,526 | - | - | - | - | 3 | 154,529 | |||||||||||||||||||||
Suppliers past due on payments
| Amounts according to payment periods as of 12/31/2018 | ||||||||||||||||||||||||||||
| Up to 30 | 31 - 60 | 61 - 90 | 91 - 120 | 121 - 365 |
366 and more |
Total | ||||||||||||||||||||||
| Type of Supplier | days | days | days | days | days | days | ThUS$ | |||||||||||||||||||||
| Goods | 1,533 | 209 | 210 | 255 | 175 | 287 | 2,669 | |||||||||||||||||||||
| Services | 12,229 | 838 | 109 | 111 | 309 | 141 | 13,737 | |||||||||||||||||||||
| Others | 1,039 | 385 | 92 | 6 | 60 | 110 | 1,692 | |||||||||||||||||||||
| Total | 14,801 | 1,432 | 411 | 372 | 544 | 538 | 18,098 | |||||||||||||||||||||
| Amounts according to payment periods as of 12/31/2017 | ||||||||||||||||||||||||||||
| Up to 30 | 31 - 60 | 61 - 90 | 91 - 120 | 121 - 365 |
366 and more |
Total | ||||||||||||||||||||||
| Type of Supplier | days | days | days | days | days | days | ThUS$ | |||||||||||||||||||||
| Goods | 16,693 | 448 | 3,965 | 1,784 | 1,602 | 42 | 24,534 | |||||||||||||||||||||
| Services | 11,704 | 1,913 | 547 | 681 | 1,325 | 17 | 16,187 | |||||||||||||||||||||
| Others | 479 | 9 | 13 | 20 | 46 | 41 | 608 | |||||||||||||||||||||
| Total | 28,876 | 2,370 | 4,525 | 2,485 | 2,973 | 100 | 41,329 | |||||||||||||||||||||
Purchase commitments held by the Company are recognized as liabilities when the goods and services are received by the Company, As of December 31, 2018, the Company has purchase orders amounting to ThUS$59,919 (ThUS$41,601 as of December 31, 2017).
| F- 115 |
NOTES TO THE CONSOLIDATED FINANCIAL STATEMENTS AS OF DECEMBER 31, 2018
| Note 13 | Financial instruments (continued) |
| 13.6 | Financial liabilities at fair value through profit or loss |
This balance relates to derivative instruments measured at their fair value, which have generated balances against the Company. The detail of this type of instrument is as follows:
|
Financial liabilities at fair value with
an impact on profit or loss |
12/31/2018 |
Effect on
profit or loss as of 12/31/2018 |
12/31/2017 |
Effect on profit
or loss as of 12/31/2017 |
12/31/2016 |
Effect on profit
or loss as of 12/31/2016 |
||||||||||||||||||
| ThUS$ | ThUS$ | ThUS$ | ThUS$ | ThUS$ | ThUS$ | |||||||||||||||||||
| Current | ||||||||||||||||||||||||
| Derivative instruments (IRS) | - | - | - | - | - | (229 | ) | |||||||||||||||||
| Total | - | - | - | - | - | (229 | ) | |||||||||||||||||
| F- 116 |
NOTES TO THE CONSOLIDATED FINANCIAL STATEMENTS AS OF DECEMBER 31, 2018
| Note 13 | Financial instruments (continued) |
| 13.7 | Financial asset and liability categories |
| a) | Financial Assets |
| 12/31/2018 | 12/31/2017 | |||||||||||||||||||||||
| Current | Non-current | Total | Current | Non-current | Total | |||||||||||||||||||
| Description of financial assets |
Amount ThUS$ |
Amount ThUS$ |
Amount ThUS$ |
Amount ThUS$ |
Amount ThUS$ |
Amount ThUS$ |
||||||||||||||||||
| Cash and cash equivalent | 556,066 | - | 556,066 | 630,438 | - | 630,438 | ||||||||||||||||||
| Trade receivables due from related parties | 44,554 | - | 44,554 | 59,132 | - | 59,132 | ||||||||||||||||||
| Financial assets measured at amortized cost | 291,790 | 75 | 291,865 | 360,941 | 45 | 360,986 | ||||||||||||||||||
| Loans and receivables measured at amortized cost | 464,855 | 2,275 | 467,130 | 446,875 | 1,912 | 448,787 | ||||||||||||||||||
| Total financial assets measured at amortized cost | 1,357,265 | 2,350 | 1,359,615 | 1,497,386 | 1,957 | 1,499,343 | ||||||||||||||||||
| Derivative financial instruments | ||||||||||||||||||||||||
| -For hedging purposes | 18,238 | 13,425 | 31,663 | - | 8,910 | 8,910 | ||||||||||||||||||
| -At fair value through profit or loss | 2,693 | - | 2,693 | 6,038 | - | 6,038 | ||||||||||||||||||
| Financial assets at fair value through other comprehensive income | - | 3,631 | 3,631 | - | 33,924 | 33,924 | ||||||||||||||||||
| Total financial assets at fair value | 20,931 | 17,056 | 37,987 | 6,038 | 42,834 | 48,872 | ||||||||||||||||||
| Total financial assets | 1,378,196 | 19,406 | 1,397,602 | 1,503,424 | 44,791 | 1,548,215 | ||||||||||||||||||
| F- 117 |
NOTES TO THE CONSOLIDATED FINANCIAL STATEMENTS AS OF DECEMBER 31, 2018
| Note 13 | Financial instruments (continued) |
| 13.7 | Financial asset and liability categories (continued) |
| b) | Financial liabilities |
| 12/31/2018 | 12/31/2017 | |||||||||||||||||||||||
| Current | Non- Current | Total | Current | Non- Current | Total | |||||||||||||||||||
| Description of financial liabilities | ThUS$ | ThUS$ | ThUS$ | ThUS$ | ThUS$ | ThUS$ | ||||||||||||||||||
| Derivative financial instruments | ||||||||||||||||||||||||
| For hedging purposes | 5,285 | 12,033 | 17,318 | 37,287 | - | 37,287 | ||||||||||||||||||
| Held for trading at fair value through profit or loss | 2,855 | - | 2,855 | 5,979 | - | 5,979 | ||||||||||||||||||
| Financial liabilities at fair value | 8,140 | 12,033 | 20,173 | 43.266 | - | 43.266 | ||||||||||||||||||
| Liabilities at amortized cost | ||||||||||||||||||||||||
| Bank loans | 300 | 68,870 | 69,170 | 163,568 | - | 163,568 | ||||||||||||||||||
| Obligations to the public | 15,145 | 1,249,479 | 1,264,624 | 13,494 | 1,031,507 | 1,045,001 | ||||||||||||||||||
| Financial liabilities at amortized cost (trade and other payables) | 163,751 | - | 163,751 | 196,280 | - | 196,280 | ||||||||||||||||||
| Accounts payable to related entities | 9 | - | 9 | 1,365 | - | 1,365 | ||||||||||||||||||
| Total financial liabilities at amortized cost | 179,205 | 1,318,349 | 1,497,554 | 374.707 | 1,031,507 | 1,406.214 | ||||||||||||||||||
| Total financial liabilities | 187,345 | 1,330,382 | 1,517,727 | 417,973 | 1,031,507 | 1,449,480 | ||||||||||||||||||
| F- 118 |
NOTES TO THE CONSOLIDATED FINANCIAL STATEMENTS AS OF DECEMBER 31, 2018
| Note 13 | Financial instruments (continued) |
| 13.8 | Fair value measurement of assets and liabilities |
Financial assets and liabilities measured at fair value consist of Options and Forwards hedging the mismatch in the balance sheet and cash flows, Cross Currency Swaps (CCS) to hedge bonds issued in local currency ($/UF), and Interest Rate Swaps (IRS) to hedge LIBOR rate debt issued.
The value of the Company’s assets and liabilities recognized by CCS contracts is calculated as the difference between the present value of discounted cash flows of the asset (pesos/UF) and liability (US$) parts of the derivative. In the case of the IRS, the asset value recognized is calculated as the difference between the discounted cash flows of the asset (variable rate) and liability (fixed rate) parts of the derivative. Forwards are calculated as the difference between the strike price of the contract and the spot price plus the forwards points at the date of the contract. Options: the value recognized is calculated using the Black-Scholes method.
In the case of CCS, the entry data used for the valuation models are UF, peso, USD and basis swap rates. In the case of fair value calculations for IRS, the FRA (Forward Rate Agreement) rate and ICVS 23 Curve (Bloomberg: cash/deposits rates, futures, swaps). In the case of forwards, the forwards curve for the currency in question is used. Finally, with options, the spot price, risk-free rate and volatility of exchange rate are used, all in accordance with the currencies used in each valuation. The financial information used as entry data for the Company’s valuation models is obtained from Bloomberg, the well-known financial software company. Conversely, the fair value provided by the counterparties of derivatives contracts is used only as a control and not for valuation.
The effects on profit or loss of movements in these amounts may be recognized in the caption Finance costs, foreign currency translation gain (loss) or cash flow hedges in the statement of comprehensive income, depending on each particular case.
The fair value measurement of debt is only performed to determine the present market value of secured and unsecured long-term obligations; bonds denominated in local currency (Ch$/UF) and foreign currency (US$), credits denominated in foreign currency (US$), which is classified under Level 2 in the fair value hierarchy established by IFRS.
The value of the Company’s reported liabilities is calculated as the present value of discounted cash flows at market rates at the time of valuation, taking into account the maturity date and exchange rate. The entry data used for the model includes the UF and peso rates, which are obtained using Bloomberg, the well-known financial software company and the ‘Asociación de Bancos e Instituciones Financieras’ (ABIF) (Association of Banks and Financial Institutions’).
| F- 119 |
NOTES TO THE CONSOLIDATED FINANCIAL STATEMENTS AS OF DECEMBER 31, 2018
| Note 13 | Financial instruments (continued) |
| 13.8 | Fair value measurement of assets and liabilities, continued |
Fair value hierarchy
The fair value hierarchy is detailed as follows:
| a) | Level 1: using quoted prices (unadjusted) only in active markets, |
| b) | Level 2: when in any phase in the valuation process inputs other than quoted prices have been used in Level 1 that are observable directly in markets. |
| c) | Level 3: inputs for the asset or liability that are not based on observable market data. |
The valuation technique used for determining fair value of our hedging instruments is that indicated in Level 2.
| F- 120 |
NOTES TO THE CONSOLIDATED FINANCIAL STATEMENTS AS OF DECEMBER 31, 2018
| Note 13 | Financial instruments (continued) |
| 13.8 | Fair value measurement of assets and liabilities, continued |
|
Carrying
Amount at Amortized Cost |
Fair value of
amounts measured at amoirtized cost |
Amounts
measured at Fair value |
Measurement Methodology | |||||||||||||||||||||
| 12/31/2018 | 12/31/2018 | 12/31/2018 | Level 1 | Level 2 | Level 3 | |||||||||||||||||||
| ThUS$ | ThUS$ | ThUS$ | ThUS$ | ThUS$ | ThUS$ | |||||||||||||||||||
| Financial Assets | ||||||||||||||||||||||||
| Cash and cash equivalents | 556,066 | 556,066 | - | - | 556,066 | - | ||||||||||||||||||
| Trade and other receivables, current | 464,855 | 464,855 | - | - | 464,855 | - | ||||||||||||||||||
| Trade receivables due from related parties, current | 44,554 | 44,554 | - | - | 44,554 | - | ||||||||||||||||||
| Other current financial assets: | - | - | - | - | - | - | ||||||||||||||||||
| - Time deposits | 291,790 | 291,790 | - | - | 291,790 | - | ||||||||||||||||||
| - Derivative instruments | - | - | - | - | - | - | ||||||||||||||||||
| - Forwards | - | - | 2,637 | - | 2,637 | - | ||||||||||||||||||
| - Options | - | - | 56 | - | 56 | - | ||||||||||||||||||
| - Hedging assets | - | - | - | - | - | - | ||||||||||||||||||
| - Investment hedge swaps | - | - | 18,238 | - | 18,238 | - | ||||||||||||||||||
| Non-current accounts receivable | 424 | 424 | - | - | - | - | ||||||||||||||||||
| Other non-current financial assets: | - | - | - | - | - | - | ||||||||||||||||||
| - Other | 95 | 95 | - | - | 95 | - | ||||||||||||||||||
| - Investment in Shares | - | - | 3,611 | - | - | - | ||||||||||||||||||
| - Hedging assets - Swaps | - | - | 13,425 | - | 13,425 | - | ||||||||||||||||||
| Other current financial liabilities | - | - | - | - | - | - | ||||||||||||||||||
| - Bank loans | 300 | 300 | - | - | 300 | - | ||||||||||||||||||
| - Derivative instruments | - | - | - | - | - | - | ||||||||||||||||||
| - Forwards | - | - | 2,723 | - | 2,723 | - | ||||||||||||||||||
| - Options | - | - | 132 | - | 132 | - | ||||||||||||||||||
| - Hedging liabilities - Swaps | - | - | 5,285 | - | 5,285 | - | ||||||||||||||||||
| - Unsecured obligations | 15,145 | 15,145 | - | - | 15,145 | - | ||||||||||||||||||
| Trade and other payables, current and non current | 163,751 | 163,751 | - | - | 163,751 | - | ||||||||||||||||||
| Trade payables due to related parties, current | 9 | 9 | - | - | 9 | - | ||||||||||||||||||
| Other non-current financial liabilities: | - | - | - | - | - | - | ||||||||||||||||||
| - Bank loans | 68,870 | 71,826 | - | - | 71,826 | - | ||||||||||||||||||
| - Unsecured obligations | 1,249,479 | 1,357,640 | - | - | 1,357,640 | - | ||||||||||||||||||
| - Non-current hedging liabilities | - | - | 12,033 | - | 12,033 | - | ||||||||||||||||||
| F- 121 |
NOTES TO THE CONSOLIDATED FINANCIAL STATEMENTS AS OF DECEMBER 31, 2018
| Note 13 | Financial instruments (continued) |
| 13.8 | Fair value measurement of assets and liabilities, continued |
|
Carrying
Amount at Amortized Cost |
Fair value of
amounts measured at amoirtized cost |
Amounts
measured at Fair value |
Measurement Methodology | |||||||||||||||||||||
| 12/31/2017 | 12/31/2017 | 12/31/2017 | Level 1 | Level 2 | Level 3 | |||||||||||||||||||
| ThUS$ | ThUS$ | ThUS$ | ThUS$ | ThUS$ | ThUS$ | |||||||||||||||||||
| Financial Assets | ||||||||||||||||||||||||
| Cash and cash equivalents | 630,438 | 630,438 | - | - | 630,438 | - | ||||||||||||||||||
| Trade and other receivables, current | 446,875 | 446,875 | - | - | 446,875 | - | ||||||||||||||||||
| Trade receivables due from related parties, current | 59,132 | 59,132 | - | - | 59,132 | - | ||||||||||||||||||
| Other current financial assets: | - | - | - | - | - | - | ||||||||||||||||||
| - Time deposits | 360,941 | 360,941 | - | - | 360,941 | - | ||||||||||||||||||
| - Derivative instruments | - | - | - | - | - | - | ||||||||||||||||||
| - Forwards | - | - | 2,744 | - | 2,744 | - | ||||||||||||||||||
| - Options | - | - | 110 | - | 110 | - | ||||||||||||||||||
| - Hedging assets | - | - | 3,184 | - | 3,184 | - | ||||||||||||||||||
| - Investment hedge swaps | - | - | - | - | - | - | ||||||||||||||||||
| Non-current accounts receivable | 1,912 | 1,912 | - | - | 1,912 | - | ||||||||||||||||||
| Other non-current financial assets: | - | - | - | - | - | - | ||||||||||||||||||
| - Other | 24,811 | 24,811 | - | - | 24,811 | - | ||||||||||||||||||
| - Investment in Shares | - | - | 9,159 | 9,159 | - | - | ||||||||||||||||||
| - Hedging assets - Swaps | - | - | 8,909 | - | 8,909 | - | ||||||||||||||||||
| Other current financial liabilities | - | - | - | - | - | - | ||||||||||||||||||
| - Bank loans | 163,568 | 163,568 | - | - | 163,568 | - | ||||||||||||||||||
| - Derivative instruments | - | - | - | - | - | - | ||||||||||||||||||
| - Forwards | - | - | 5,534 | - | 5,534 | - | ||||||||||||||||||
| - Options | - | - | 445 | - | 445 | - | ||||||||||||||||||
| - Hedging liabilities - Swaps | - | - | 37,287 | - | 37,287 | - | ||||||||||||||||||
| - Unsecured obligations | 13,494 | 13,494 | - | - | 13,494 | - | ||||||||||||||||||
| Trade and other payables, current and non current | 196,280 | 196,280 | - | - | 196,280 | - | ||||||||||||||||||
| Trade payables due to related parties, current | 1,365 | 1,365 | - | - | 1,365 | - | ||||||||||||||||||
| Other non-current financial liabilities: | - | - | - | - | - | - | ||||||||||||||||||
| - Bank loans | - | - | - | - | - | - | ||||||||||||||||||
| - Unsecured obligations | 1,031,507 | 1,131,639 | - | - | 1,131,639 | - | ||||||||||||||||||
| - Non-current hedging liabilities | - | - | - | - | - | |||||||||||||||||||
| F- 122 |
NOTES TO THE CONSOLIDATED FINANCIAL STATEMENTS AS OF DECEMBER 31, 2018
| Note 13 | Financial instruments (continued) |
| 13.9 | Financial assets pledged as a guarantee |
On November 4, 2004, Isapre Norte Grande maintains a guarantee equivalent to the total amount owed to its members and healthcare providers, which is managed and maintained by Banco de Chile.
As of December 31, 2018 and December 31, 2017, assets pledged as guarantees are as follows:
| Restricted cash |
12/31/2018 ThUS$ |
12/31/2017 ThUS$ |
||||||
| Isapre Norte Grande Ltda, | 712 | 771 | ||||||
| Total | 712 | 771 | ||||||
| F- 123 |
NOTES TO THE CONSOLIDATED FINANCIAL STATEMENTS AS OF DECEMBER 31, 2018
| Note 13 | Financial instruments (continued) |
| 13.10 | Estimated fair value of financial instruments and financial derivatives |
As required by IFRS 7, the following information is presented for the disclosure of the estimated fair value of financial assets and liabilities.
Although inputs represent Management's best estimate, they are subjective and involve significant estimates related to the current economic and market conditions, as well as risk features.
Methodologies and assumptions used depend on the risk terms and characteristics of instruments and include the following as a summary:
| - | Cash equivalent approximates fair value due to the short-term maturities of these instruments. |
| - | The fair value of trade receivables, current is considered to be equal to the carrying amount due to the maturity of such accounts at short-term. |
| - | The fair value of other current financial liabilities is considered to be equal to their carrying values. |
| - | For interest-bearing liabilities with original maturity of more than a year, fair values are calculated by discounting contractual cash flows at their original current market rates with similar terms. |
| - | The fair value of debt is considered in Level 2. |
| - | For forward and swap contracts, fair value is determined using quoted market prices of financial instruments with similar characteristics. |
| F- 124 |
NOTES TO THE CONSOLIDATED FINANCIAL STATEMENTS AS OF DECEMBER 31, 2018
| Note 13 | Financial instruments (continued) |
| 13.10 | Estimated fair value of financial instruments and financial derivatives, continued |
The detail of the Company’s instruments at carrying value and estimated fair value is as follows:
| 12/31/2018 | 12/31/2017 | |||||||||||||||
| Carrying value | Fair value | Carrying value | Fair value | |||||||||||||
| ThUS$ | ThUS$ | ThUS$ | ThUS$ | |||||||||||||
| Cash and cash equivalents | 556,066 | 556,066 | 630,438 | 630,438 | ||||||||||||
| Current trade and other receivables | 464,855 | 464,855 | 446,875 | 446,875 | ||||||||||||
| Receivables due from related parties, current | 44,554 | 44,554 | 59,132 | 59,132 | ||||||||||||
| Other financial assets, current: | ||||||||||||||||
| - Time deposits | 291,790 | 291,790 | 360,941 | 360,941 | ||||||||||||
| - Derivative instruments | 2,693 | 2,693 | 6,038 | 6,038 | ||||||||||||
| - Hedging assets | 18,238 | 18,238 | - | - | ||||||||||||
| Total other current financial assets | 312,721 | 312,721 | 366,979 | 366,979 | ||||||||||||
| Non-Current Trade Receivables | 424 | 424 | 1,912 | 1,912 | ||||||||||||
| Other non-current financial assets: | 17,131 | 17,131 | 42,879 | 42,879 | ||||||||||||
| Total other non-current financial assets: | 17,131 | 17,131 | 42,879 | 42,879 | ||||||||||||
| Other financial liabilities, current: | ||||||||||||||||
| - Bank loans | 300 | 300 | 163,568 | 163,568 | ||||||||||||
| - Derivative instruments | 2,855 | 2,855 | 5,979 | 5,979 | ||||||||||||
| - Hedging liabilities | 5,285 | 5,285 | 37,287 | 37,287 | ||||||||||||
| - Unsecured obligations | 15,145 | 15,145 | 13,494 | 13,494 | ||||||||||||
| Other financial liabilities, current | 23,585 | 23,585 | 220,328 | 220,328 | ||||||||||||
| Current and non-current accounts payable | 163,751 | 163,751 | 196,280 | 196,280 | ||||||||||||
| Payables due to related parties, non-current | 9 | 9 | 1,365 | 1,365 | ||||||||||||
| Other non-current financial liabilities: | ||||||||||||||||
| - Bank loans | 68,870 | 71,826 | - | - | ||||||||||||
| - Unsecured obligations | 1,249,479 | 1,404,614 | 1,031,507 | 1,131,639 | ||||||||||||
| - Non-current hedging liabilities | 12,033 | 2,657 | - | - | ||||||||||||
| Other non-current financial liabilities: | 1,330,382 | 1,479,097 | 1,031,507 | 1,131,639 | ||||||||||||
All the fair value estimates are included in levels 1 and 2.
| 13.11 | Nature and scope of risks arising from financing instruments |
As indicated in paragraphs 33 to 42 of IFRS 7 the disclosure of information associated with the nature and scope of risks arising from financial instruments is presented in Note 5 - Financial Risk Management.
| F- 125 |
NOTES TO THE CONSOLIDATED FINANCIAL STATEMENTS AS OF DECEMBER 31, 2018
| Note 14 | Intangible assets and goodwill |
| 14.1 | Balances |
| 12/31/2018 | 12/31/2017 | |||||||
| ThUS$ | ThUS$ | |||||||
| Intangible assets other than goodwill | 188,283 | 113,787 | ||||||
| Goodwill (1) | 34,718 | 37,972 | ||||||
| Total | 223,001 | 151,759 | ||||||
1) The recoverable amount of the cash-generating unit has been determined based on a calculation of the value in use which used cash flow projections for a 5-year period, plus perpetuity.
The present value of the future cash flows generated by these assets has been estimated given a variance in sales volumes, market prices and costs, discounted at weighted average cost of capital (WACC) of 9.80%.
| 14.2 | Disclosures on intangible assets and goodwill |
Intangible assets relate to goodwill, water rights, trademarks, industrial patents, rights of way, software, and mining claims which correspond to exploitation rights acquired from third-parties.
Balances and movements in the main classes of intangible assets as of December 31, 2018 and December 31, 2017 are detailed as follows:
| 12/31/2018 | ||||||||||||||||||
| Intangible assets and goodwill | Useful life |
Gross amount ThUS$ |
Accumulated Amortization ThUS$ |
Accumulated Impairment losses ThUS$ |
Net Value ThUS$ |
|||||||||||||
| Software | Finite | 28,833 | (25,455 | ) | - | 3,378 | ||||||||||||
| Intellectual property rights, patents and other industrial property rights, service | Finite | 1,254 | (1,096 | ) | (7 | ) | 151 | |||||||||||
| Mining property, water rights and rights of way. | Indefinite | 184,849 | (88 | ) | (1,729 | ) | 183,032 | |||||||||||
| Customer-related intangible assets | Indefinite | 1,778 | - | (205 | ) | 1,573 | ||||||||||||
| Other intangible assets | Indefinite | 149 | - | - | 149 | |||||||||||||
| Intangible assets other than goodwill | 216,863 | (26,639 | ) | (1,941 | ) | 188,283 | ||||||||||||
| Goodwill | Indefinite | 37,972 | - | (3,254 | ) | 34,718 | ||||||||||||
| Total intangible assets and goodwill | 254,835 | (26,639 | ) | (5,195 | ) | 223,001 | ||||||||||||
| F- 126 |
NOTES TO THE CONSOLIDATED FINANCIAL STATEMENTS AS OF DECEMBER 31, 2018
| Note 14 | Intangible assets and goodwill (continued) |
| 14.2 | Disclosures on intangible assets and goodwill, continued |
| 12/31/2017 | ||||||||||||||
| Intangible assets and goodwill | Useful life |
Gross amount ThUS$ |
Accumulated Amortization ThUS$ |
Net Value ThUS$ |
||||||||||
| Software | Finite | 25,060 | (19,769 | ) | 5,291 | |||||||||
| Intellectual property rights, patents and other industrial property rights, service | Finite | 1,250 | (1,061 | ) | 189 | |||||||||
| Mining property, water rights and rights of way | Indefinite | 106,358 | - | 106,358 | ||||||||||
| Customer-related intangible assets | Indefinite | 1,778 | - | 1,778 | ||||||||||
| Other intangible assets | Indefinite | 171 | - | 171 | ||||||||||
| Intangible assets other than goodwill | 134,617 | (20,830 | ) | 113,787 | ||||||||||
| Goodwill | Indefinite | 37,972 | - | 37,972 | ||||||||||
| Total intangible assets and goodwill | 172,589 | (20,830 | ) | 151,759 | ||||||||||
| a) | Estimated useful lives or amortization rates used for finite identifiable intangible assets |
Finite useful life measures the length of, or number of production or similar units constituting that useful life.
The estimated useful life for software is 2-6 years, for other assets with a finite useful life, the useful life over which they are amortized corresponds to the periods defined by the contracts or rights from which they originate.
Intellectual property rights, patents and other industrial property rights, service and exploitation rights, mainly relate to water rights and have a finite useful life to the extent to which they are subject to a fixed-term contract or otherwise they are considered to be indefinite.
The company owns mining claims granted by Corfo, which correspond to assets subject to restitution. For this reason, they are considered assets with a finite useful life and their useful life is assigned until the year 2030 when the contract ends.
| b) | Method used to assess identifiable intangible assets with indefinite useful life |
The recoverable value of the cash-generating unit has been determined based on a calculation of value-in-use using cash flow projections for a period of 5 years, plus perpetuity. The present value of future cash flows generated by these assets was calculated given a variation in sales volumes, market prices and costs, discounted at a WACC rate of 8.04%.
This group of intangible assets includes water rights acquired in Chile, and mining concessions held by the company in Chile and Australia, and these rights are recorded at acquisition cost.
| F- 127 |
NOTES TO THE CONSOLIDATED FINANCIAL STATEMENTS AS OF DECEMBER 31, 2018
| Note 14 | Intangible assets and goodwill (continued) |
| 14.2 | Disclosures on intangible assets and goodwill, continued |
| c) | Minimum and maximum amortization lives or rates of intangible assets: |
| Estimated useful lives or amortization rate | Minimum life or rate | Maximum life or rate | ||
| Mining property, water rights and rights of way | Indefinite | Indefinite | ||
| Intangible assets other than goodwill | Indefinite | Indefinite | ||
| Intellectual property rights, patents and other industrial property rights, service and exploitation rights | 1 year | 16 years | ||
| Trademarks | 1 year | 5 years | ||
| Software | 2 years | 6 years |
The following table shows the movements in goodwill as of December 31, 2018:
| Company |
Goodwill 01/01/2018 |
Additional recognition |
Impairment losses |
Transferred to available for sale |
Goodwill 12/31/2018 |
|||||||||||||||
| ThUS$ | ThUS$ | ThUS$ | ThUS$ | ThUS$ | ||||||||||||||||
| SQM Industrial S.A. | 3,214 | - | (3,214 | ) | - | - | ||||||||||||||
| SQM S.A. | 22,255 | - | - | - | 22,255 | |||||||||||||||
| SQM Investment Corporation | 86 | - | - | - | 86 | |||||||||||||||
| Soquimich Comercial S.A. | 320 | - | (40 | ) | - | 280 | ||||||||||||||
| Soquimich European Holding | 11,373 | - | - | - | 11,373 | |||||||||||||||
| SQM Potasio S.A. | 724 | - | - | - | 724 | |||||||||||||||
| Total | 37,972 | - | (3,254 | ) | - | 34,718 | ||||||||||||||
| d) | Information to be disclosed on assets generated internally |
The Company has no intangible assets generated internally.
| F- 128 |
NOTES TO THE CONSOLIDATED FINANCIAL STATEMENTS AS OF DECEMBER 31, 2018
| Note 14 | Intangible assets and goodwill (continued) |
| 14.2 | Disclosures on intangible assets and goodwill, continued |
| e) | Movements in identifiable intangible assets as of December 31, 2018: |
|
Movements in identifiable
intangible assets, gross |
Trademarks | Software | Intellectual property rights, patents and other industrial property rights, service, rights of way | Mining property, water rights and rights of way Indefinite | Customer-related intangible assets | Other intangible assets | Goodwill | Identifiable intangible assets | ||||||||||||||||||||||||
| ThUS$ | ThUS$ | ThUS$ | ThUS$ | ThUS$ | ThUS$ | ThUS$ | ThUS$ | |||||||||||||||||||||||||
| Opening Balance | 25,060 | 1,250 | 106,358 | 1,778 | 171 | 37,972 | 172,589 | |||||||||||||||||||||||||
| Additions | 1,159 | 5 | 77,201 | - | 11 | - | 78,376 | |||||||||||||||||||||||||
| Increases (decreases) for transfers | - | - | - | - | - | - | - | |||||||||||||||||||||||||
| Other increases / decreases for foreign currency exchange rates | (5 | ) | (1 | ) | (4 | ) | - | - | - | (10 | ) | |||||||||||||||||||||
| (-) Impairment losses recognized in profit or loss for the year | - | - | - | - | - | - | - | |||||||||||||||||||||||||
| Transferred to available for sale | - | - | - | - | - | - | - | |||||||||||||||||||||||||
| Other increases (decreases) | 2,619 | - | 1,294 | - | (33 | ) | - | 3,880 | ||||||||||||||||||||||||
| Total increases (decreases) | 3,773 | 4 | 78,491 | 1,778 | (22 | ) | - | 82,246 | ||||||||||||||||||||||||
| Final balance | 28,833 | 1,254 | 184,849 | 1,778 | 149 | 37,972 | 254,835 | |||||||||||||||||||||||||
|
Accumulated
amortization
|
IT programs | Intellectual property rights, patents and other industrial property rights, service. Finite | Mining property, water rights and rights of way Indefinite | Customer-related intangible assets | Other intangible assets | Goodwill | Identifiable intangible assets | |||||||||||||||||||||||||
| ThUS$ | ThUS$ | ThUS$ | ThUS$ | ThUS$ | ThUS$ | ThUS$ | ||||||||||||||||||||||||||
| Opening Balance | (19,769 | ) | (1,061 | ) | - | - | - | - | (20,830 | ) | ||||||||||||||||||||||
| Additions | - | - | - | - | - | - | - | |||||||||||||||||||||||||
| Other increases / decreases for foreign currency exchange rates | 4 | - | - | - | - | - | 4 | |||||||||||||||||||||||||
| (-) Impairment losses recognized in profit or loss for the year | - | (7 | ) | (1,729 | ) | (205 | ) | - | (3,254 | ) | (5,195 | ) | ||||||||||||||||||||
| Amortization | (2,880 | ) | (35 | ) | (88 | ) | - | - | - | (3,003 | ) | |||||||||||||||||||||
| Other increases (decreases) | (2,810 | ) | - | - | - | - | - | (2,810 | ) | |||||||||||||||||||||||
| Total increases (decreases) | (5,686 | ) | (42 | ) | (1,817 | ) | (205 | ) | - | (3,254 | ) | (11,004 | ) | |||||||||||||||||||
| Final balance | (25,455 | ) | (1,103 | ) | (1,817 | ) | (205 | ) | - | (3,254 | ) | (31,834 | ) | |||||||||||||||||||
| F- 129 |
NOTES TO THE CONSOLIDATED FINANCIAL STATEMENTS AS OF DECEMBER 31, 2018
| Note 14 | Intangible assets and goodwill (continued) |
| 14.2 | Disclosures on intangible assets and goodwill, continued |
| f) | Movements in identifiable intangible assets as of December 31, 2018, continued |
|
Net value Movements in Identifiable intangible assets |
IT programs |
Intellectual property rights, patents and other industrial property rights, service. Finite |
Mining property, water rights and rights of way Indefinite |
Customer- related intangible assets |
Other intangible assets |
Goodwill |
Identifiable intangible assets |
|||||||||||||||||||||
| ThUS$ | ThUS$ | ThUS$ | ThUS$ | ThUS$ | ThUS$ | ThUS$ | ||||||||||||||||||||||
| Opening Balance | 5,291 | 189 | 106,358 | 1,778 | 171 | 37,972 | 151,759 | |||||||||||||||||||||
| Additions | 1,159 | 5 | 77,201 | - | 11 | - | 78,376 | |||||||||||||||||||||
| Increases (decreases) for transfers | - | - | - | - | - | - | ||||||||||||||||||||||
| Amortization | (2,880 | ) | (35 | ) | (88 | ) | - | - | - | (3,003 | ) | |||||||||||||||||
| Impairment losses recognized in profit or loss for the year | - | (7 | ) | (1,729 | ) | (205 | ) | - | (3,254 | ) | (5,195 | ) | ||||||||||||||||
| Other increases / decreases for foreign currency exchange rates | (1 | ) | (1 | ) | (4 | ) | - | - | - | (6 | ) | |||||||||||||||||
| Transferred to available for sale | - | - | - | - | - | - | - | |||||||||||||||||||||
| Other increases (decreases) | (191 | ) | - | 1,294 | - | (33 | ) | - | 1,070 | |||||||||||||||||||
| Total increases (decreases) | (1,913 | ) | (38 | ) | 76,674 | (205 | ) | (22 | ) | (3,254 | ) | 71,242 | ||||||||||||||||
| Final balance | 3,378 | 151 | 183,032 | 1,573 | 149 | 34,718 | 223,001 | |||||||||||||||||||||
| g) | Movements in identifiable intangible assets as of December 31, 2017: |
|
Gross value Movements in Identifiable intangible assets |
IT programs |
Intellectual property rights, patents and other industrial property rights, service. Finite |
Mining property, water rights and rights of way Indefinite |
Customer- related intangible assets |
Other intangible assets |
Goodwill |
Identifiable intangible assets |
|||||||||||||||||||||
| ThUS$ | ThUS$ | ThUS$ | ThUS$ | ThUS$ | ThUS$ | ThUS$ | ||||||||||||||||||||||
| Opening Balance | 23,280 | 1,483 | 106,436 | 2,942 | - | 37,972 | 172,113 | |||||||||||||||||||||
| Additions | 939 | 8 | - | - | 171 | - | 1,118 | |||||||||||||||||||||
| Increases (decreases) for transfers | - | - | (205 | ) | - | - | - | (205 | ) | |||||||||||||||||||
| (-) Impairment losses recognized in profit or loss for the year | - | - | - | - | - | - | - | |||||||||||||||||||||
| Other increases (decreases) | 841 | (241 | ) | 127 | (1,164 | ) | - | - | (437 | ) | ||||||||||||||||||
| Total increases (decreases) | 1,780 | (233 | ) | (78 | ) | (1,164 | ) | 171 | - | 476 | ||||||||||||||||||
| Final balance | 25,060 | 1,250 | 106,358 | 1,778 | 171 | 37,972 | 172,589 | |||||||||||||||||||||
| F- 130 |
NOTES TO THE CONSOLIDATED FINANCIAL STATEMENTS AS OF DECEMBER 31, 2018
| Note 14 | Intangible assets and goodwill (continued) |
| 14.2 | Disclosures on intangible assets and goodwill, continued |
| g) | Movements in identifiable intangible assets as of December 31, 2017: |
|
Movements in identifiable
intangible assets,
|
Software |
Intellectual property rights, patents and other industrial property rights, service, rights of way |
Mining property, water rights and rights of way. Indefinite. |
Customer- related intangible assets |
Other intangible assets |
Goodwill |
Identifiable intangible assets |
|||||||||||||||||||||
| ThUS$ | ThUS$ | ThUS$ | ThUS$ | ThUS$ | ThUS$ | |||||||||||||||||||||||
| Opening balance | (16,234 | ) | (1,023 | ) | - | - | - | - | (17,257 | ) | ||||||||||||||||||
| Additions | - | - | - | - | - | - | - | |||||||||||||||||||||
| Amortization | (2,653 | ) | (38 | ) | - | - | - | - | (2,691 | ) | ||||||||||||||||||
| Other increases (decreases) | (882 | ) | - | - | - | - | - | (882 | ) | |||||||||||||||||||
| Total Increases (decreases) | (3,535 | ) | (38 | ) | - | - | - | - | (3,573 | ) | ||||||||||||||||||
| Final balance | (19,769 | ) | (1,061 | ) | - | - | - | (20,830 | ) | |||||||||||||||||||
| Movements in identifiable intangible assets, net | Software |
Intellectual property rights, patents and other industrial property rights, service, rights of way |
Mining property, water rights and rights of way. Indefinite. |
Customer- related intangible assets |
Other intangible assets |
Goodwill |
Identifiable intangible assets |
|||||||||||||||||||||
| ThUS$ | ThUS$ | ThUS$ | ThUS$ | ThUS$ | ThUS$ | |||||||||||||||||||||||
| Opening balance | 7,046 | 460 | 106,436 | 2,942 | - | 37,972 | 154,856 | |||||||||||||||||||||
| Additions | 939 | 8 | - | - | 171 | - | 1,118 | |||||||||||||||||||||
| Increases (decreases) for transfers | - | - | (205 | ) | - | - | - | (205 | ) | |||||||||||||||||||
| Amortization | (2,653 | ) | (38 | ) | - | - | - | - | (2,691 | ) | ||||||||||||||||||
| Impairment | - | - | - | - | - | - | - | |||||||||||||||||||||
| Increases (decreases) for transfers | - | - | - | - | - | - | ||||||||||||||||||||||
| Other increases (decreases) | (41 | ) | (241 | ) | 127 | (1,164 | ) | - | - | (1,319 | ) | |||||||||||||||||
| Total Increases (decreases) | (1,755 | ) | (271 | ) | (78 | ) | (1,164 | ) | 171 | - | (3,097 | ) | ||||||||||||||||
| Final balance | 5,291 | 189 | 106,358 | 1,778 | 171 | 37,972 | 151,759 | |||||||||||||||||||||
| F- 131 |
NOTES TO THE CONSOLIDATED FINANCIAL STATEMENTS AS OF DECEMBER 31, 2018
| Note 14 | Intangible assets and goodwill (continued) |
| 14.2 | Disclosures on intangible assets and goodwill, continued |
| h) | Movements in identifiable intangible assets as of December 31, 2016: |
| Movements in identifiable intangible assets, gross | Trademarks | Software |
Intellectual property rights, patents and other industrial
property
rights, service,
|
Mining
property, water rights
|
Customer related intangible assets |
Goodwill |
Identifiable intangible assets |
|||||||||||||||||||||
| ThUS$ | ThUS$ | ThUS$ | ThUS$ | ThUS$ | ThUS$ | ThUS$ | ||||||||||||||||||||||
| Opening balance | 3,821 | 23,251 | 1,448 | 96,500 | 3,651 | 38,388 | 167,059 | |||||||||||||||||||||
| Additions | - | 160 | 25 | 2,100 | - | - | 2,285 | |||||||||||||||||||||
| Other increases (decreases) | (3,821 | ) | (131 | ) | 10 | (4 | ) | (314 | ) | (416 | ) | (4,676 | ) | |||||||||||||||
| Final balance | - | 23,280 | 1,483 | 98,596 | 3,337 | 37,972 | 164,668 | |||||||||||||||||||||
|
Movements in identifiable intangible assets,
accumulated amortization |
Trademarks | Software |
Intellectual property rights, patents and other industrial
property
rights, service,
|
Mining
property, water rights
|
Other intangible assets |
Goodwill |
Identifiable intangible assets |
|||||||||||||||||||||
| ThUS$ | ThUS$ | ThUS$ | ThUS$ | ThUS$ | ThUS$ | ThUS$ | ||||||||||||||||||||||
| Opening balance | (3,821 | ) | (13,438 | ) | (984 | ) | - | - | - | (18,243 | ) | |||||||||||||||||
| Additions | - | - | - | - | - | - | - | |||||||||||||||||||||
| Amortization | - | (2,796 | ) | (38 | ) | - | - | - | (2,834 | ) | ||||||||||||||||||
| Other increases (decreases) | 3,821 | - | (1 | ) | - | - | - | 3,820 | ||||||||||||||||||||
| Final balance | - | (16,234 | ) | (1,023 | ) | - | - | - | (17,257 | ) | ||||||||||||||||||
| F- 132 |
NOTES TO THE CONSOLIDATED FINANCIAL STATEMENTS AS OF DECEMBER 31, 2018
| Note 14 | Intangible assets and goodwill (continued) |
| 14.2 | Disclosures on intangible assets and goodwill, continued |
| h) | Movements in identifiable intangible assets as of December 31, 2016: |
| Movements in identifiable intangible assets, net | Trademarks | Software |
Intellectual property rights, patents and other industrial property rights, service rights of way |
Intellectual property rights, patents and other industrial property rights, service rights of way |
Other intangible assets |
Goodwill |
Identifiable intangible assets |
|||||||||||||||||||||
| ThUS$ | ThUS$ | ThUS$ | ThUS$ | ThUS$ | ThUS$ | ThUS$ | ||||||||||||||||||||||
| Opening balance | - | 9,813 | 464 | 96,500 | 3,651 | 38,388 | 148,816 | |||||||||||||||||||||
| Additions | - | 160 | 25 | 2,100 | - | - | 2,285 | |||||||||||||||||||||
| Amortization | - | (2,796 | ) | (38 | ) | - | - | - | (2,834 | ) | ||||||||||||||||||
| Other increases (decreases) | - | (131 | ) | 9 | (4 | ) | (314 | ) | (416 | ) | (856 | ) | ||||||||||||||||
| Final balance | - | 7,046 | 460 | 98,596 | 3,337 | 37,972 | 147,411 | |||||||||||||||||||||
| F- 133 |
NOTES TO THE CONSOLIDATED FINANCIAL STATEMENTS AS OF DECEMBER 31, 2018
| Note 15 | Property, plant and equipment |
As of December 31, 2018 and December 31, 2017, the detail of property, plant and equipment is as follows:
| 15.1 | Types of property, plant and equipment |
| Description of types of property, plant and equipment |
12/31/2018 ThUS$ |
12/31/2017 ThUS$ |
||||||
| Property, plant and equipment, net | ||||||||
| Land | 24,695 | 24,900 | ||||||
| Buildings | 238,808 | 230,319 | ||||||
| Other property, plant and equipment | 28,175 | 24,862 | ||||||
| Transport equipment | 2,892 | 3,257 | ||||||
| Supplies and accessories | 4,722 | 1,872 | ||||||
| Office equipment | 513 | 487 | ||||||
| Network and communication equipment | 692 | 1,050 | ||||||
| Mining assets | 11,501 | 16,237 | ||||||
| IT equipment | 4,980 | 3,401 | ||||||
| Energy generating assets | 6,117 | 7,861 | ||||||
| Constructions in progress | 207,830 | 165,054 | ||||||
| Machinery, plant and equipment (1) | 923,898 | 950,054 | ||||||
| Total | 1,454,823 | 1,429,354 | ||||||
| Property, plant and equipment, gross | ||||||||
| Land | 24,695 | 24,900 | ||||||
| Buildings | 648,719 | 610,264 | ||||||
| Other property, plant and equipment | 245,731 | 244,831 | ||||||
| Transport equipment | 11,668 | 11,195 | ||||||
| Supplies and accessories | 24,456 | 19,498 | ||||||
| Office equipment | 11,377 | 11,105 | ||||||
| Network and communication equipment | 7,505 | 7,356 | ||||||
| Mining assets | 132,309 | 129,028 | ||||||
| IT equipment | 29,955 | 27,038 | ||||||
| Energy generating assets | 36,930 | 36,643 | ||||||
| Constructions in progress | 207,830 | 165,054 | ||||||
| Machinery, plant and equipment | 3,068,862 | 2,938,287 | ||||||
| Total | 4,450,037 | 4,225,199 | ||||||
| Accumulated depreciation and value impairment of property, plant and equipment, total | ||||||||
| Accumulated depreciation and impairment of buildings | (409,911 | ) | (379,945 | ) | ||||
| Accumulated depreciation and impairment of other property, plant and equipment | (217,556 | ) | (219,969 | ) | ||||
| Accumulated depreciation and impairment of transport equipment | (8,776 | ) | (7,938 | ) | ||||
| Accumulated depreciation and impairment of supplies and accessories | (19,734 | ) | (17,626 | ) | ||||
| Accumulated depreciation and impairment of office equipment | (10,864 | ) | (10,618 | ) | ||||
| Accumulated depreciation and impairment of network and communication equipment | (6,813 | ) | (6,306 | ) | ||||
| Accumulated depreciation and impairment of mining assets | (120,808 | ) | (112,791 | ) | ||||
| Accumulated depreciation and impairment of IT equipment | (24,975 | ) | (23,637 | ) | ||||
| Accumulated depreciation and impairment of energy generating assets | (30,813 | ) | (28,782 | ) | ||||
| Accumulated depreciation and impairment of machinery, plant and equipment | (2,144,964 | ) | (1,988,233 | ) | ||||
| Total | (2,995,214 | ) | (2,795,845 | ) | ||||
| F- 134 |
NOTES TO THE CONSOLIDATED FINANCIAL STATEMENTS AS OF DECEMBER 31, 2018
| Note 15 | Property, plant and equipment, (continued) |
| 15.1 | Types of property, plant and equipment, continued |
(1) The detail of machinery, plant and equipment is as follows:
| Description of classes of property, plant and equipment |
12/31/2018 ThUS$ |
12/31/2017 ThUS$ |
||||||
| Property, plant and equipment, net | ||||||||
| Pumps | 34,145 | 33,614 | ||||||
| Conveyor belt | 22,082 | 24,832 | ||||||
| Crystallizer | 27,112 | 15,519 | ||||||
| Plant equipment | 188,934 | 186,885 | ||||||
| Water tanks | 14,876 | 11,296 | ||||||
| Filter | 29,300 | 18,572 | ||||||
| Facilities/electrical equipment | 96,179 | 105,600 | ||||||
| Other machinery, plant and equipment | 71,964 | 72,812 | ||||||
| Piping | 98,498 | 113,641 | ||||||
| Pond | 250,045 | 275,731 | ||||||
| Well | 42,903 | 46,802 | ||||||
| Parts | 47,860 | 44,750 | ||||||
| Total | 923,898 | 950,054 | ||||||
* The net balance of other machinery, plant and equipment includes capitalized site closure expenses of ThUS$12,967 as of December 31, 2018 and ThUS$14,104 as of December 31, 2017.
| F- 135 |
NOTES TO THE CONSOLIDATED FINANCIAL STATEMENTS AS OF DECEMBER 31, 2018
| Note 15 | Property, plant and equipment (continued) |
| 15.2 | Reconciliation of changes in property, plant and equipment by type: |
Reconciliation of changes in property, plant and equipment by class as of December 31, 2018 and December 31, 2017:
|
Reconciliation of changes in property, plant
and equipment by class as of December 31, 2018, gross amount |
Land | Buildings |
Other property, plant and equipment |
Transport equipment |
Supplies and accessories |
Equipment office |
Network and communication equipment |
Mining assets | IT equipment |
Energy generating assets |
Assets under construction |
Machinery, plant and equipment |
Property, plant and equipment |
|||||||||||||||||||||||||||||||||||||||
| ThUS$ | ThUS$ | ThUS$ | ThUS$ | ThUS$ | ThUS$ | ThUS$ | ThUS$ | ThUS$ | ThUS$ | ThUS$ | ThUS$ | ThUS$ | ||||||||||||||||||||||||||||||||||||||||
| Opening balance | 24,900 | 610,264 | 244,831 | 11,195 | 19,498 | 11,105 | 7,356 | 129,028 | 27,038 | 36,643 | 165,054 | 2,938,287 | 4,225,199 | |||||||||||||||||||||||||||||||||||||||
| Changes | ||||||||||||||||||||||||||||||||||||||||||||||||||||
| Additions | - | 28 | 833 | - | 41 | 15 | - | - | 489 | - | 263,290 | 1,448 | 266,144 | |||||||||||||||||||||||||||||||||||||||
| Disposals | - | (38 | ) | (7,811 | ) | (51 | ) | - | - | - | - | (10 | ) | - | (6,582 | ) | (1,666 | ) | (16,158 | ) | ||||||||||||||||||||||||||||||||
| Increase (decrease) in foreign currency translation difference | (64 | ) | (134 | ) | (8 | ) | (3 | ) | (19 | ) | (6 | ) | - | - | (11 | ) | - | - | (153 | ) | (398 | ) | ||||||||||||||||||||||||||||||
| Reclassifications | - | 38,746 | 10,330 | 529 | 4,889 | 268 | 150 | 3,281 | 2,100 | 75 | (184,095 | ) | 123,726 | (1 | ) | |||||||||||||||||||||||||||||||||||||
| Other increases (decreases) (*) | - | (147 | ) | (2,444 | ) | (2 | ) | 47 | (5 | ) | (1 | ) | - | 349 | 212 | (29,837 | ) | 7,220 | (24,608 | ) | ||||||||||||||||||||||||||||||||
| Decreases for classification as held for sale (1) | (141 | ) | - | - | - | - | - | - | - | - | - | - | - | (141 | ) | |||||||||||||||||||||||||||||||||||||
| Total changes | (205 | ) | 38,455 | 900 | 473 | 4,958 | 272 | 149 | 3,281 | 2,917 | 287 | 42,776 | 130,575 | 224,838 | ||||||||||||||||||||||||||||||||||||||
| Closing balance | 24,695 | 648,719 | 245,731 | 11,668 | 24,456 | 11,377 | 7,505 | 132,309 | 29,955 | 36,930 | 207,830 | 3,068,862 | 4,450,037 | |||||||||||||||||||||||||||||||||||||||
|
Reconciliation of changes in property, plant and
equipment by class as of December 31, 2018, accumulated depreciation |
Land | Buildings |
Other property, plant and equipment |
Transport equipment |
Supplies and accessories |
Equipment office |
Network and communication equipment |
Mining assets | IT equipment |
Energy generating assets |
Assets under construction |
Machinery, plant and equipment |
Property, plant and equipment |
|||||||||||||||||||||||||||||||||||||||
| ThUS$ | ThUS$ | ThUS$ | ThUS$ | ThUS$ | ThUS$ | ThUS$ | ThUS$ | ThUS$ | ThUS$ | ThUS$ | ThUS$ | ThUS$ | ||||||||||||||||||||||||||||||||||||||||
| Opening balance | - | (379,945 | ) | (219,969 | ) | (7,938 | ) | (17,626 | ) | (10,618 | ) | (6,306 | ) | (112,791 | ) | (23,637 | ) | (28,782 | ) | - | (1,988,233 | ) | (2,795,845 | ) | ||||||||||||||||||||||||||||
| Changes | ||||||||||||||||||||||||||||||||||||||||||||||||||||
| Disposals | - | 38 | 7,737 | 8 | - | - | - | - | 10 | - | - | 1,722 | 9,515 | |||||||||||||||||||||||||||||||||||||||
| Depreciation expense | - | (29,829 | ) | (7,415 | ) | (880 | ) | (2,056 | ) | (271 | ) | (483 | ) | (8,017 | ) | (1,374 | ) | (2,026 | ) | - | (158,900 | ) | (211,251 | ) | ||||||||||||||||||||||||||||
| Impairment | - | (437 | ) | - | - | - | - | - | - | - | (12 | ) | - | (941 | ) | (1,390 | ) | |||||||||||||||||||||||||||||||||||
| Increase (decrease) in foreign currency translation difference | - | 41 | 4 | 1 | 12 | 3 | - | - | (1 | ) | - | - | 61 | 121 | ||||||||||||||||||||||||||||||||||||||
| Reclassifications | - | 106 | (483 | ) | - | (87 | ) | (17 | ) | (28 | ) | - | 90 | 1 | - | 419 | 1 | |||||||||||||||||||||||||||||||||||
| Other increases (decreases) (*) | - | 115 | 2,570 | 33 | 23 | 39 | 4 | - | (63 | ) | 6 | - | 908 | 3,635 | ||||||||||||||||||||||||||||||||||||||
| Decreases for classification as held for sale (1) | - | - | - | - | - | - | - | - | - | - | - | - | - | |||||||||||||||||||||||||||||||||||||||
| Total changes | - | (29,966 | ) | 2,413 | (838 | ) | (2,108 | ) | (246 | ) | (507 | ) | (8,017 | ) | (1,338 | ) | (2,031 | ) | - | (156,731 | ) | (199,369 | ) | |||||||||||||||||||||||||||||
| Closing balance | - | (409,911 | ) | (217,556 | ) | (8,776 | ) | (19,734 | ) | (10,864 | ) | (6,813 | ) | (120,808 | ) | (24,975 | ) | (30,813 | ) | - | (2,144,964 | ) | (2,995,214 | ) | ||||||||||||||||||||||||||||
| F- 136 |
NOTES TO THE CONSOLIDATED FINANCIAL STATEMENTS AS OF DECEMBER 31, 2018
| Note 15 | Property, plant and equipment (continued) |
| 15.2 | Reconciliation of changes in property, plant and equipment by type, continued: |
|
Reconciliation of changes in property,
plant and equipment by class as of December 31, 2018, net amount |
Land | Buildings |
Other property, plant and equipment |
Transport equipment |
Supplies and accessories |
Equipment office |
Network and communication equipment |
Mining assets | IT equipment |
Energy generating assets |
Assets under construction |
Machinery, plant and equipment |
Property, plant and equipment |
|||||||||||||||||||||||||||||||||||||||
| ThUS$ | ThUS$ | ThUS$ | ThUS$ | ThUS$ | ThUS$ | ThUS$ | ThUS$ | ThUS$ | ThUS$ | ThUS$ | ThUS$ | ThUS$ | ||||||||||||||||||||||||||||||||||||||||
| Opening balance | 24,900 | 230,319 | 24,862 | 3,257 | 1,872 | 487 | 1,050 | 16,237 | 3,401 | 7,861 | 165,054 | 950,054 | 1,429,354 | |||||||||||||||||||||||||||||||||||||||
| Changes | ||||||||||||||||||||||||||||||||||||||||||||||||||||
| Additions | - | 28 | 833 | - | 41 | 15 | - | - | 489 | - | 263,290 | 1,448 | 266,144 | |||||||||||||||||||||||||||||||||||||||
| Disposals | - | - | (74 | ) | (43 | ) | - | - | - | - | - | - | (6,582 | ) | 56 | (6,643 | ) | |||||||||||||||||||||||||||||||||||
| Depreciation expense | - | (29,829 | ) | (7,415 | ) | (880 | ) | (2,056 | ) | (271 | ) | (483 | ) | (8,017 | ) | (1,374 | ) | (2,026 | ) | - | (158,900 | ) | (211,251 | ) | ||||||||||||||||||||||||||||
| Impairment | - | (437 | ) | - | - | - | - | - | - | - | (12 | ) | - | (941 | ) | (1,390 | ) | |||||||||||||||||||||||||||||||||||
| Increase (decrease) in foreign currency translation difference | (64 | ) | (93 | ) | (4 | ) | (2 | ) | (7 | ) | (3 | ) | - | - | (12 | ) | - | - | (92 | ) | (277 | ) | ||||||||||||||||||||||||||||||
| Reclassifications | - | 38,852 | 9,847 | 529 | 4,802 | 251 | 122 | 3,281 | 2,190 | 76 | (184,095 | ) | 124,145 | - | ||||||||||||||||||||||||||||||||||||||
| Other increases (decreases) (*) | - | (32 | ) | 126 | 31 | 70 | 34 | 3 | - | 286 | 218 | (29,837 | ) | 8,128 | (20,973 | ) | ||||||||||||||||||||||||||||||||||||
| Decreases for classification as held for sale (1) | (141 | ) | - | - | - | - | - | - | - | - | - | - | - | (141 | ) | |||||||||||||||||||||||||||||||||||||
| Total changes | (205 | ) | 8,489 | 3,313 | (365 | ) | 2,850 | 26 | (358 | ) | (4,736 | ) | 1,579 | (1,744 | ) | 42,776 | (26,156 | ) | 25,469 | |||||||||||||||||||||||||||||||||
| Closing balance | 24,695 | 238,808 | 28,175 | 2,892 | 4,722 | 513 | 692 | 11,501 | 4,980 | 6,117 | 207,830 | 923,898 | 1,454,823 | |||||||||||||||||||||||||||||||||||||||
(*) The net balance of other increases (decreases) corresponds to all those items that are reclassified to or from property, plant and equipment. They can have the following origin:1) work in progress which is expensed to profit or loss, forming part of operating costs or other expenses per function, as appropriate; 2) the variation representing the purchase and use of materials and spare parts; 3) projects corresponding mainly to exploration expenditures and ground studies that are reclassified to the item other non-current financial assets; 4) software that is reclassified to Intangibles.
(1) Any property, plant and equipment (disposal group) that, at the closing date of the financial statements, is subject to a commitment for sale or where the sales process has been initiated and where the sale is expected to occur within twelve months of that date, is classified by the Company as non-current assets held for sale.
These assets or disposal groups are valued at the lower of carrying amount or the estimated sales value less the costs to sell and stop being amortized from the moment they are classified as non-current assets held for sale.
| F- 137 |
NOTES TO THE CONSOLIDATED FINANCIAL STATEMENTS AS OF DECEMBER 31, 2018
| Note 15 | Property, plant and equipment (continued) |
| 15.2 | Reconciliation of changes in property, plant and equipment by type, continued: |
|
Reconciliation
of changes in property, plant
|
Land | Buildings |
Other property, plant and equipment |
Transport equipment |
Supplies and accessories |
Equipment office |
Network and communication equipment |
Mining assets | IT equipment |
Energy generating assets |
Assets under construction |
Machinery, plant and equipment |
Property, plant and equipment |
|||||||||||||||||||||||||||||||||||||||
| ThUS$ | ThUS$ | ThUS$ | ThUS$ | ThUS$ | ThUS$ | ThUS$ | ThUS$ | ThUS$ | ThUS$ | ThUS$ | ThUS$ | ThUS$ | ||||||||||||||||||||||||||||||||||||||||
| Opening balance | 32,702 | 582,082 | 253,555 | 10,819 | 18,259 | 17,731 | 7,522 | 158,514 | 20,316 | 34,812 | 170,710 | 2,833,819 | 4,140,841 | |||||||||||||||||||||||||||||||||||||||
| Changes | ||||||||||||||||||||||||||||||||||||||||||||||||||||
| Additions | - | 189 | 541 | - | 115 | 42 | 12 | - | 899 | 122 | 149,133 | 10,747 | 161,800 | |||||||||||||||||||||||||||||||||||||||
| Disposals | - | (59 | ) | (11,623 | ) | (321 | ) | - | (23 | ) | - | (30,082 | ) | (57 | ) | - | - | (3,374 | ) | (45,539 | ) | |||||||||||||||||||||||||||||||
| Increase (decrease) in foreign currency translation difference | 45 | 103 | 3 | 1 | - | - | - | - | (2 | ) | - | 1 | 118 | 269 | ||||||||||||||||||||||||||||||||||||||
| Reclassifications | - | 23,336 | 8,255 | 696 | 1,044 | 172 | 123 | 596 | 122 | 1,709 | (135,988 | ) | 99,744 | (191 | ) | |||||||||||||||||||||||||||||||||||||
| Other increases (decreases) (*) | (7,436 | ) | 4,669 | (5,900 | ) | - | 80 | (6,817 | ) | (301 | ) | - | 5,760 | - | (18,802 | ) | (2,767 | ) | (31,514 | ) | ||||||||||||||||||||||||||||||||
| Decreases for classification as held for sale (1) | (411 | ) | (56 | ) | - | - | - | - | - | - | - | - | - | - | (467 | ) | ||||||||||||||||||||||||||||||||||||
| Total changes | (7,802 | ) | 28,182 | (8,724 | ) | 376 | 1,239 | (6,626 | ) | (166 | ) | (29,486 | ) | 6,722 | 1,831 | (5,656 | ) | 104,468 | 84,358 | |||||||||||||||||||||||||||||||||
| Closing balance | 24,900 | 610,264 | 244,831 | 11,195 | 19,498 | 11,105 | 7,356 | 129,028 | 27,038 | 36,643 | 165,054 | 2,938,287 | 4,225,199 | |||||||||||||||||||||||||||||||||||||||
|
Reconciliation
of changes in property, plant and
|
Land | Buildings |
Other property, plant and equipment |
Transport equipment |
Supplies and accessories |
Equipment office |
Network and communication equipment |
Mining assets | IT equipment |
Energy generating assets |
Assets under construction |
Machinery, plant and equipment |
Property, plant and equipment |
|||||||||||||||||||||||||||||||||||||||
| ThUS$ | ThUS$ | ThUS$ | ThUS$ | ThUS$ | ThUS$ | ThUS$ | ThUS$ | ThUS$ | ThUS$ | ThUS$ | ThUS$ | ThUS$ | ||||||||||||||||||||||||||||||||||||||||
| Opening balance | - | (344,497 | ) | (227,138 | ) | (7,464 | ) | (16,486 | ) | (14,089 | ) | (5,836 | ) | (133,871 | ) | (19,950 | ) | (26,621 | ) | - | (1,812,179 | ) | (2,608,131 | ) | ||||||||||||||||||||||||||||
| Changes | ||||||||||||||||||||||||||||||||||||||||||||||||||||
| Disposals | - | 58 | 11,622 | 312 | - | 3 | - | 30,083 | 25 | - | - | 3,210 | 45,313 | |||||||||||||||||||||||||||||||||||||||
| Depreciation expense | - | (33,306 | ) | (6,759 | ) | (730 | ) | (1,047 | ) | (357 | ) | (665 | ) | (10,638 | ) | (909 | ) | (2,184 | ) | - | (170,565 | ) | (227,160 | ) | ||||||||||||||||||||||||||||
| Impairment | - | - | - | - | - | - | - | - | - | - | - | (5,205 | ) | (5,205 | ) | |||||||||||||||||||||||||||||||||||||
| Increase (decrease) in foreign currency translation difference | - | (35 | ) | (3 | ) | (2 | ) | - | - | - | - | (11 | ) | - | - | (58 | ) | (109 | ) | |||||||||||||||||||||||||||||||||
| Reclassifications | - | (62 | ) | 38 | (32 | ) | (110 | ) | (69 | ) | (25 | ) | - | (46 | ) | 26 | - | 344 | 64 | |||||||||||||||||||||||||||||||||
| Other increases (decreases) (*) | - | (2,102 | ) | 2,271 | (22 | ) | 17 | 3,894 | 220 | 1,635 | (2,746 | ) | (3 | ) | - | (3,780 | ) | (616 | ) | |||||||||||||||||||||||||||||||||
| Decreases for classification as held for sale (1) | - | (1 | ) | - | - | - | - | - | - | - | - | - | - | (1 | ) | |||||||||||||||||||||||||||||||||||||
| Total changes | - | (35,448 | ) | 7,169 | (474 | ) | (1,140 | ) | 3,471 | (470 | ) | 21,080 | (3,687 | ) | (2,161 | ) | - | (176,054 | ) | (187,714 | ) | |||||||||||||||||||||||||||||||
| Closing balance | - | (379,945 | ) | (219,969 | ) | (7,938 | ) | (17,626 | ) | (10,618 | ) | (6,306 | ) | (112,791 | ) | (23,637 | ) | (28,782 | ) | - | (1,988,233 | ) | (2,795,845 | ) | ||||||||||||||||||||||||||||
| F- 138 |
NOTES TO THE CONSOLIDATED FINANCIAL STATEMENTS AS OF DECEMBER 31, 2018
| Note 15 | Property, plant and equipment (continued) |
| 15.2 | Reconciliation of changes in property, plant and equipment by type, continued: |
|
Reconciliation of changes in property, plant
and equipment by class as of December 31, 2017, net amount |
Land | Buildings |
Other property, plant and equipment |
Transport equipment |
Supplies and accessories |
Equipment office |
Network and communication equipment |
Mining assets | IT equipment |
Energy generating assets |
Assets under construction |
Machinery, plant and equipment |
Property, plant and equipment |
|||||||||||||||||||||||||||||||||||||||
| ThUS$ | ThUS$ | ThUS$ | ThUS$ | ThUS$ | ThUS$ | ThUS$ | ThUS$ | ThUS$ | ThUS$ | ThUS$ | ThUS$ | ThUS$ | ||||||||||||||||||||||||||||||||||||||||
| Opening balance | 32,702 | 237,585 | 26,417 | 3,355 | 1,773 | 3,642 | 1,686 | 24,643 | 366 | 8,191 | 170,710 | 1,021,640 | 1,532,710 | |||||||||||||||||||||||||||||||||||||||
| Changes | ||||||||||||||||||||||||||||||||||||||||||||||||||||
| Additions | - | 189 | 541 | - | 115 | 42 | 12 | - | 899 | 122 | 149,133 | 10,747 | 161,800 | |||||||||||||||||||||||||||||||||||||||
| Disposals | - | (1 | ) | (1 | ) | (9 | ) | - | (20 | ) | - | 1 | (32 | ) | - | - | (164 | ) | (226 | ) | ||||||||||||||||||||||||||||||||
| Depreciation expense | - | (33,306 | ) | (6,759 | ) | (730 | ) | (1,047 | ) | (357 | ) | (665 | ) | (10,638 | ) | (909 | ) | (2,184 | ) | - | (170,565 | ) | (227,160 | ) | ||||||||||||||||||||||||||||
| Impairment | - | - | - | - | - | - | - | - | - | - | - | (5,205 | ) | (5,205 | ) | |||||||||||||||||||||||||||||||||||||
| Increase (decrease) in foreign currency translation difference | 45 | 68 | - | (1 | ) | - | - | - | - | (13 | ) | - | 1 | 60 | 160 | |||||||||||||||||||||||||||||||||||||
| Reclassifications | - | 23,274 | 8,293 | 664 | 934 | 103 | 98 | 596 | 76 | 1,735 | (135,988 | ) | 100,088 | (127 | ) | |||||||||||||||||||||||||||||||||||||
| Other increases (decreases) (*) | (7,436 | ) | 2,567 | (3,629 | ) | (22 | ) | 97 | (2,923 | ) | (81 | ) | 1,635 | 3,014 | (3 | ) | (18,802 | ) | (6,547 | ) | (32,130 | ) | ||||||||||||||||||||||||||||||
| Decreases for classification as held for sale (1) | (411 | ) | (57 | ) | - | - | - | - | - | - | - | - | - | - | (468 | ) | ||||||||||||||||||||||||||||||||||||
| Total changes | (7,802 | ) | (7,266 | ) | (1,555 | ) | (98 | ) | 99 | (3,155 | ) | (636 | ) | (8,406 | ) | 3,035 | (330 | ) | (5,656 | ) | (71,586 | ) | (103,356 | ) | ||||||||||||||||||||||||||||
| Closing balance | 24,900 | 230,319 | 24,862 | 3,257 | 1,872 | 487 | 1,050 | 16,237 | 3,401 | 7,861 | 165,054 | 950,054 | 1,429,354 | |||||||||||||||||||||||||||||||||||||||
(*) The net balance of other increases (decreases) corresponds to all those items that are reclassified to or from property, plant and equipment, They can have the following origin:1) work in progress which is expensed to profit or loss, forming part of operating costs or other expenses per function, as appropriate; 2) the variation representing the purchase and use of materials and spare parts; 3) projects corresponding mainly to exploration expenditures and ground studies that are reclassified to the item other non-current financial assets; 4) assets for retirement obligations and 5) software that is reclassified to Intangibles.
(1) Any property, plant and equipment (disposal group) that, at the closing date of the financial statements, is subject to a commitment for sale or where the sales process has been initiated and where the sale is expected to occur within twelve months of that date, is classified by the Company as non-current assets held for sale.
These assets or disposal groups are valued at the lower of carrying amount or the estimated sales value less the costs to sell and stop being amortized from the moment they are classified as non-current assets held for sale.
| F- 139 |
NOTES TO THE CONSOLIDATED FINANCIAL STATEMENTS AS OF DECEMBER 31, 2018
| Note 15 | Property, plant and equipment (continued) |
| 15.3 | Detail of property, plant and equipment pledged as guarantee |
There are no restrictions in title or guarantees for compliance with obligations that affect property, plant and equipment.
| 15.4 | Impairment of assets |
As indicated in Note 3.28 to the financial statements, the recoverable amount of property, plant and equipment is measured provided that there is an indication that the asset could be impaired. As of December 31, 2018, impairment of ThUS$1,390 was recorded, while impairment of ThUS$5,205 was recorded as of December 31, 2017.
| 15.5 | Additional Information |
Capitalized interest
As of December 31, 2018, capitalized interest totaled ThUS$5,021, while for the period January to December 2017, this item totaled ThUS$4,382.
No borrowing costs are capitalized for periods beyond the normal period for acquiring, constructing or installing an asset such as delays, interruptions or temporary suspension of projects due to technical, financial or other problems that render the asset unusable.
| F- 140 |
NOTES TO THE CONSOLIDATED FINANCIAL STATEMENTS AS OF DECEMBER 31, 2018
| Note 16 | Other current and non-current non-financial assets |
As of December 31, 2018, and December 31, 2017, the detail of other current and non-current assets is as follows:
| Other non-financial assets, current | 12/31/2018 | 12/31/2017 | ||||||
| ThUS$ | ThUS$ | |||||||
| Domestic Value Added Tax | 20,209 | 11,484 | ||||||
| Foreign Value Added Tax | 7,211 | 5,122 | ||||||
| Prepaid mining licenses | 1,329 | 1,205 | ||||||
| Prepaid insurance | 1,763 | 2,446 | ||||||
| Other prepayments | 2,988 | 1,443 | ||||||
| Refund of Value Added Tax to exporters | 12,545 | 941 | ||||||
| Other taxes | 2,800 | 4,027 | ||||||
| Other assets | 341 | 215 | ||||||
| Total | 49,186 | 26,883 | ||||||
| Other non-financial assets, non-current | 12/31/2018 | 12/31/2017 | ||||||
| ThUS$ | ThUS$ | |||||||
| Stain development expenses and prospecting expenses (1) | 26,189 | 17,721 | ||||||
| Guarantee deposits | 712 | 771 | ||||||
| Other assets | 639 | 770 | ||||||
| Total | 27,540 | 19,262 | ||||||
| 1) | Reconciliation of changes in assets for exploration and mineral resource evaluation, by type. |
Movements in assets for the exploration and evaluation of mineral resources as of December 31, 2018, and December 31, 2017:
| Reconciliation | 12/31/2018 | 12/31/2017 | ||||||
| ThUS$ | ThUS$ | |||||||
| Opening balance | 17,721 | 23,008 | ||||||
| Changes | ||||||||
| Additions, other than business combinations | 11,298 | - | ||||||
| Reclassifications | 1,987 | 595 | ||||||
| Increase (decrease) due to transfers and other charges | (4,817 | ) | (5,882 | ) | ||||
| Total changes | 8,468 | (5,287 | ) | |||||
| Total | 26,189 | 17,721 | ||||||
As of the presentation date, no reevaluations of assets for exploration and assessment of mineral resources have been conducted.
| F- 141 |
NOTES TO THE CONSOLIDATED FINANCIAL STATEMENTS AS OF DECEMBER 31, 2018
| Note 17 | Employee benefits |
| 17.1 | Provisions for employee benefits |
| Classes of benefits and expenses by employee | 12/31/2018 | 12/31/2017 | ||||||
| ThUS$ | ThUS$ | |||||||
| Current | ||||||||
| Profit sharing and bonuses | 20,085 | 22,421 | ||||||
| Total | 20,085 | 22,421 | ||||||
| Non-current | ||||||||
| Profit sharing and bonuses | 8,831 | 6,487 | ||||||
| Severance indemnity payments | 28,233 | 27,445 | ||||||
| Total | 37,064 | 33,932 | ||||||
| 17.2 | Policies on defined benefit plan |
This policy is applied to all benefits received for services provided by the Company's employees.
Short-term benefits for active employees are represented by salaries, social welfare benefits, paid time off, sickness and other types of leave, profit sharing and incentives and non-monetary benefits; e.g., healthcare service, housing, subsidized or free goods or services. These will be paid in a term which does not exceed twelve months.
The Company only provides compensation and benefits to active employees, with the exemption of SQM North America, which applies the definitions under 17.4 below.
SQM maintains incentive programs for its employees based on their personal performance, the Company’s performance and other short-term and long-term indicators.
For each incentive bonus delivered to the Company’s employees, there will be a disbursement in the first quarter of the following year and this will be calculated based on profit for the period at the end of each period applying a factor obtained subsequent to each employee’s appraisal process.
Employee benefits include retention bonuses for the Company’s executives, which are linked to the Company’s share price and are paid in cash. The short-term portion is presented as a provision for current employee benefits and the long-term portion as non-current.
Staff severance indemnities are agreed and payable based on the final salary, calculated in accordance with each year of service to the Company, with certain maximum limits in respect of either the number of years or in monetary terms, In general, this benefit is payable when the employee or worker ceases to provide his/her services to the Company and there are a number of different circumstances through which a person can be eligible for it, as indicated in the respective agreements; e.g., retirement, dismissal, voluntary retirement, incapacity or disability, death, etc.
Law No, 19,728 published on May 14, 2001 which became effective on October 1, 2002 required “Compulsory Unemployment Insurance” in favor of all dependent employees regulated by the Chilean Labor Code. Article 5 of this law established that this insurance is paid through monthly contribution payments by both the employee and the employer.
| F- 142 |
NOTES TO THE CONSOLIDATED FINANCIAL STATEMENTS AS OF DECEMBER 31, 2018
| Note 17 | Employee benefits (continued) |
| 17.3 | Other long-term benefits |
The other long-term benefits relate to staff severance indemnities and are recorded at their actuarial value, and an executive compensation plan (see Note 18.6).
| Staff severance indemnities at actuarial value | 12/31/2018 | 12/31/2017 | ||||||
| ThUS$ | ThUS$ | |||||||
| Staff severance indemnities, Chile | 27,562 | 25,893 | ||||||
| Executive severance plan | 8,831 | 6,487 | ||||||
| Severance for foreigners | 671 | 1,552 | ||||||
| Total other non-current liabilities | 37,064 | 33,932 | ||||||
The actuarial assessment method has been used to calculate the Company’s obligations with respect to staff severance indemnities, which relate to defined benefit plans consisting of days of remuneration per year served at the time of retirement under conditions agreed in the respective agreements established between the Company and its employees.
Under this benefit plan, the Company retains the obligation to pay staff severance indemnities related to retirement, without establishing a separate fund with specific assets, which is referred to as not funded. The discount interest rate of expected flows to be used was 4,89%.
Benefit payment conditions
The staff severance indemnity benefit relates to remuneration days for years worked for the Company without a limit being imposed in regard of amount of salary or years of service. It applies when employees cease to work for the Company because they are made redundant or in the event of their death. This benefit is applicable up to a maximum age of 65 for men and 60 for women, which are the usual retirement ages according to the Chilean pensions system as established in Decree Law 3,500 of 1980.
Methodology
The Company’s benefits obligation under IAS 19 Projected Benefit Obligation (PBO) is determined as follows:
To determine the Company's total liability, we used computer software to develop a mathematical simulation model using the data for each individual employee.
| F- 143 |
NOTES TO THE CONSOLIDATED FINANCIAL STATEMENTS AS OF DECEMBER 31, 2018
| Note 17 | Employee benefits (continued) |
| 17.3 | Other long-term benefits, continued |
This model considered months as discrete time; i.e., the Company determined the age of each person and his/her salary on a monthly basis according to the growth rate. This information on each person was simulated from the beginning of his/her employment contract or when he/she started earning benefits up to the month in which he/she reaches normal retirement age, generating in each period the possible retirement according to the Company’s turnover rate and the mortality rate according to the age reached. When he/she reaches the retirement age, the employee finishes his/her service for the Company and receives a retirement indemnity.
The methodology followed to determine the accrual for all the employees covered by agreements took account of the turnover rates and the mortality rate RV-2009 established by the CMF to calculate pension-related life insurance reserves in Chile according to the Accumulated Benefit Valuation or Accrued Cost of Benefit Method. This methodology is established in IAS 19 on Retirement Benefit Costs.
| 17.4 | Post-employment benefit obligations |
Our subsidiary SQM North America, together with its employees established a pension plan until 2002 called the “SQM North America Retirement Income Plan”. This obligation is calculated measuring the expected future forecast staff severance indemnity obligation using a net salary gradual rate of restatements for inflation, mortality and turnover assumptions, discounting the resulting amounts at present value using the interest rate defined by the authorities.
Since 2003, SQM North America offers to its employees benefits related to pension plans based on the 401-K system, which do not generate obligations for the Company.
| Reconciliation | 12/31/2018 | 12/31/2017 | 12/31/2016 | |||||||||
| Changes in the benefit obligation | ThUS$ | ThUS$ | ThUS$ | |||||||||
| Benefit obligation at the beginning of the year | 8,755 | 8,185 | 7,949 | |||||||||
| Service cost | - | 2 | 2 | |||||||||
| Interest cost | 319 | 359 | 387 | |||||||||
| Actuarial loss | 63 | 556 | 200 | |||||||||
| Benefits paid | (480 | ) | (347 | ) | (353 | ) | ||||||
| Benefit obligation at the end of the year | 8,657 | 8,755 | 8,185 | |||||||||
| F- 144 |
NOTES TO THE CONSOLIDATED FINANCIAL STATEMENTS AS OF DECEMBER 31, 2018
| Note 17 | Employee benefits (continued) |
| 17.4 | Post-employment benefit obligations, continued |
| 12/31/2018 | 12/31/2017 | 12/31/2016 | ||||||||||
| ThUS$ | ThUS$ | ThUS$ | ||||||||||
| Changes in the plan assets: | ||||||||||||
| Fair value of plan assets at the beginning of the year | 8,751 | 7,404 | 7,464 | |||||||||
| Actual return (loss) in plan assets | 133 | 1,694 | 293 | |||||||||
| Benefits paid | (480 | ) | (347 | ) | (353 | ) | ||||||
| Fair value of plan assets at the end of the year | 8,404 | 8,751 | 7,404 | |||||||||
| Financing status | (253 | ) | (4 | ) | (781 | ) | ||||||
| Items not yet recognized as net periodic pension cost components: | ||||||||||||
| Net actuarial loss at the beginning of the year | (2,614 | ) | (3,432 | ) | (3,165 | ) | ||||||
| Amortization during the year | 160 | 219 | 184 | |||||||||
| Net estimated gain or loss occurred during the year | (568 | ) | 599 | (451 | ) | |||||||
| Adjustment to recognize the minimum pension obligation | (3,022 | ) | (2,614 | ) | (3,432 | ) | ||||||
The net periodic pension expense was composed of the following components for the years ended December 31, 2018, 2017 and 2016:
| Reconciliation | 12/31/2018 | 12/31/2017 | 12/31/2016 | |||||||||
| ThUS$ | ThUS$ | ThUS$ | ||||||||||
| Service cost or benefits received during the year | - | 2 | 2 | |||||||||
| Interest cost in benefit obligation | 319 | 359 | 387 | |||||||||
| Actual return in plan assets | 133 | 1,694 | 293 | |||||||||
| Amortization of prior year losses | 160 | 219 | 184 | |||||||||
| Net gain during the year | (568 | ) | 599 | 610 | ||||||||
| Net periodic pension expense | (159 | ) | 41 | 29 | ||||||||
| 17.5 | Staff severance indemnities |
As of December 31, 2018 and 2017, severance indemnities calculated at the actuarial value are as follows:
|
12/31/2018 ThUS$ |
12/31/2017 ThUS$ |
12/31/2016 ThUS$ |
||||||||||
| Opening balance | (27,445 | ) | (22,532 | ) | (21,995 | ) | ||||||
| Current cost of service | (1,529 | ) | (934 | ) | (1,333 | ) | ||||||
| Interest cost | (1,658 | ) | (1,488 | ) | (1,407 | ) | ||||||
| Actuarial gain/loss | (1,617 | ) | (1,144 | ) | (2,253 | ) | ||||||
| Exchange rate difference | 2,710 | (2,284 | ) | (1,215 | ) | |||||||
| Benefits paid during the year | 1,306 | 937 | 5,671 | |||||||||
| Balance | (28,233 | ) | (27,445 | ) | (22,532 | ) | ||||||
| F- 145 |
NOTES TO THE CONSOLIDATED FINANCIAL STATEMENTS AS OF DECEMBER 31, 2018
| Note 17 | Employee benefits (continued) |
| 17.5 | Staff severance indemnities, continued |
| a) | Actuarial assumptions |
The liability recorded for staff severance indemnity is valued at the actuarial value method, using the following actuarial assumptions:
| 12/31/2018 | 12/31/2017 | 12/31/2016 | ||||||||||||
| Mortality rate | RV - 2014 | RV - 2014 | RV - 2009 | |||||||||||
| Actual annual interest rate | 4.642 | % | 5.114 | % | 4.522 | % | ||||||||
| Voluntary retirement rate: | ||||||||||||||
| Men | 6.49 | % | 6.49 | % | 7.16 | % | annual | |||||||
| Women | 6.49 | % | 6.49 | % | 7.16 | % | annual | |||||||
| Salary increase | 3.00 | % | 3.00 | % | 3.60 | % | annual | |||||||
| Retirement age: | ||||||||||||||
| Men | 65 | 65 | 65 | years | ||||||||||
| Women | 60 | 60 | 60 | years | ||||||||||
| b) | Sensitivity analysis of assumptions |
As of December 31, 2018 and December 31, 2017, the Company has conducted a sensitivity analysis of the main assumptions of the actuarial calculation, determining the following:
| Sensitivity analysis 12/31/2018 |
Effect + 100 basis points ThUS$ |
Effect - 100 basis points ThUS$ |
||||||
| Discount rate | (1,807 | ) | 2,033 | |||||
| Employee turnover rate | (237 | ) | 265 | |||||
| Sensitivity analysis 12/31/2017 |
Effect + 100 basis points ThUS$ |
Effect - 100 basis points ThUS$ |
||||||
| Discount rate | (1,991 | ) | 2,436 | |||||
| Employee turnover rate | (252 | ) | 281 | |||||
Sensitivity relates to an increase/decrease of 100 basis points.
| F- 146 |
NOTES TO THE CONSOLIDATED FINANCIAL STATEMENTS AS OF DECEMBER 31, 2018
| Note 17 | Employee benefits (continued) |
| 17.6 | Executive compensation plan |
The Company currently has a compensation plan with the purpose of motivating the Company’s executives and encouraging them to remain with the Company, by granting payments based on the change in the price of SQM’s shares. There is a partial payment of the share benefit program in the event of termination of the contract for causes other than the resignation and application of Article 160 of the Chilean Labor Code.
Average Share Price Spread
Plan characteristics
This compensation plan is related to the Company’s performance through the SQM Series B share price (Santiago Stock Exchange).
Plan participants
A total of 37 Company executives are entitled to this plan, provided that they continue to work for the Company through to the end of 2020. The payment dates, if applicable, will be during the first quarter of 2021.
Compensation
The compensation payable to each executive is calculated by multiplying a) by b):
| a) | The average price of Series B shares on the Santiago Stock Exchange during the fourth quarter of 2020, at its equivalent amount in dollars (with a maximum amount or limit amount of US$54 per share). |
| b) | By a number equal to the quantity of shares that have been individually assigned to each executive included in the plan. |
This compensation plan was approved by the Company’s Board of Directors and its application started on January 1, 2017.
The effect of the plan considers 476,302 shares reflected as a cost of ThUS$3,754 in the results for the period ending December 31, 2018. As of December 31, 2017, the effect of the plan was 533,476 shares, equal to ThUS$6,487 in costs in the profit or loss for 2017.
| F- 147 |
NOTES TO THE CONSOLIDATED FINANCIAL STATEMENTS AS OF DECEMBER 31, 2018
| Note 18 | Provisions and other non-financial liabilities |
| 18.1 | Types of provisions |
| 12/31/2018 | 12/31/2017 | |||||||||||||||||||||||
| Current | Non-current | Total | Current | Non-current | Total | |||||||||||||||||||
| ThUS$ | ThUS$ | ThUS$ | ThUS$ | ThUS$ | ThUS$ | |||||||||||||||||||
| Provision for legal complaints (*) | 11,862 | 3,000 | 14,862 | 16,419 | 3,000 | 19,419 | ||||||||||||||||||
| Provision for dismantling, restoration and rehabilitation cost (**) | - | 28,822 | 28,822 | - | 26,954 | 26,954 | ||||||||||||||||||
| Other provisions (***) | 94,335 | - | 94,335 | 47,026 | 47 | 47,073 | ||||||||||||||||||
| Total | 106,197 | 31,822 | 138,019 | 63,445 | 30,001 | 93,446 | ||||||||||||||||||
(*) These provisions correspond to legal processes that are pending resolution or that have not yet been disbursed. These provisions are mainly related to litigation involving the subsidiaries located in Chile, Brazil and the United States (see note 22.1).
(**) The commitments related to Sernageomin have been incorporated through the issuance of the guarantee for the restoration of the place where the production sites are located.
(***) See Note 18.2
| F- 148 |
NOTES TO THE CONSOLIDATED FINANCIAL STATEMENTS AS OF DECEMBER 31, 2018
| Note 18 | Provisions and other non-financial liabilities (continued) |
| 18.2 | Description of other provisions |
| Current provisions, other short-term provisions | 12/31/2018 | 12/31/2017 | ||||||
| ThUS$ | ThUS$ | |||||||
| Rent under Lease contract with Corfo (*) | 84,826 | 32,331 | ||||||
| Provision for additional tax related to foreign loans | 471 | 416 | ||||||
| End of agreement bonus | 5,129 | 4,522 | ||||||
| Directors’ per diem allowance | 2,881 | 2,630 | ||||||
| Provision for subsidiary restructuring | - | 6,000 | ||||||
| Miscellaneous provisions | 1,028 | 1,127 | ||||||
| Total | 94,335 | 47,026 | ||||||
| Other long-term provisions | ||||||||
| Investments with negative equity | - | 47 | ||||||
| Total | - | 47 | ||||||
(*) Payment Obligations for the lease contract with CORFO: These correspond to obligations assumed in the modification of the Lease Agreement for extraction of mining claims owned by the Chilean Economic Development Agency (CORFO). Part of the obligations include quarterly lease payments to CORFO, based on SQM Salar’s sales for the period of products obtained from the claims leased; another part corresponds to annual contributions that SQM Salar must make, since 2018, to Research and Development and to Communities and Regional Development. 2017 includes US$20.4 million corresponding to the payment that formed part of the agreement reached between SQM Salar and CORFO due to the end of Arbitration. (See Note 21.1)
| F- 149 |
NOTES TO THE CONSOLIDATED FINANCIAL STATEMENTS AS OF DECEMBER 31, 2018
| Note 18 | Provisions and other non-financial liabilities (continued) |
| 18.3 | Other current liabilities |
Other liabilities non-financial current
| Description of other liabilities | 12/31/2018 | 12/31/2017 | ||||||
| ThUS$ | ThUS$ | |||||||
| Tax withholdings | 4,782 | 7,404 | ||||||
| VAT payable | 7,345 | 3,344 | ||||||
| Guarantees received | 2,641 | 2,638 | ||||||
| Accrual for dividend | 109,670 | 110,529 | ||||||
| Monthly tax provisional payments | 21,001 | 11,684 | ||||||
| Deferred income | 18,574 | 5,301 | ||||||
| Withholdings from employees and salaries payable | 6,052 | 6,725 | ||||||
| Accrued vacations (*) | 20,070 | 19,042 | ||||||
| Other current liabilities | 4,489 | 2,137 | ||||||
| Total | 194,624 | 168,804 | ||||||
(*) Vacation benefit (short-term benefits to employees, current) is in line with the provisions established in Chile’s Labor Code, which indicates that employees with more than a year of service will be entitled to annual vacation for a period of at least fifteen paid business days. The Company provides the benefit of two additional vacation days.
| F- 150 |
NOTES TO THE CONSOLIDATED FINANCIAL STATEMENTS AS OF DECEMBER 31, 2018
| Note 18 | Provisions and other non-financial liabilities (continued) |
| 18.4 | Changes in provisions |
|
Description of items that gave rise to variations as of 12/31/2018 |
Legal complaints |
Provision for dismantling, restoration and rehabilitation cost |
Other provisions |
Total | ||||||||||||
| ThUS$ | ThUS$ | ThUS$ | ThUS$ | |||||||||||||
| Total provisions, initial balance | 19,419 | 26,954 | 47,073 | 93,446 | ||||||||||||
| Changes in provisions: | ||||||||||||||||
| Additional provisions | 1,000 | 1,820 | 96,516 | 99,336 | ||||||||||||
| Provision used | (5,557 | ) | - | (49,221 | ) | (54,778 | ) | |||||||||
| Increase(decrease) in foreign currency exchange | - | - | - | - | ||||||||||||
| others | - | 48 | (33 | ) | 15 | |||||||||||
| Total Increase (decreases) | (4,557 | ) | 1,868 | 47,262 | 44,573 | |||||||||||
| Total provisions, final balance | 14,862 | 28,822 | 94,335 | 138,019 | ||||||||||||
|
Description of items that gave rise to variations as of 12/31/2017 |
Legal complaints |
Provision for dismantling, restoration and rehabilitation cost |
Other provisions |
Total | ||||||||||||
| ThUS$ | ThUS$ | ThUS$ | ThUS$ | |||||||||||||
| Total provisions, initial balance | 23,867 | 5,890 | 21,089 | 50,846 | ||||||||||||
| Changes in provisions: | ||||||||||||||||
| Additional provisions | 6,352 | 21,064 | 33,507 | 60,923 | ||||||||||||
| Provision used | (10,800 | ) | - | (7,538 | ) | (18,338 | ) | |||||||||
| Increase(decrease) in foreign currency exchange | - | - | 9 | 9 | ||||||||||||
| Others | - | - | 6 | 6 | ||||||||||||
| Total Increase (decreases) | (4,448 | ) | 21,064 | 25,984 | 42,600 | |||||||||||
| Total provisions, final balance | 19,419 | 26,954 | 47,073 | 93,446 | ||||||||||||
| F- 151 |
NOTES TO THE CONSOLIDATED FINANCIAL STATEMENTS AS OF DECEMBER 31, 2018
| Note 18 | Provisions and other non-financial liabilities (continued) |
| 18.4 | Changes in provisions, continued |
|
Description of items that gave rise to variations as of December 31, 2016 |
Legal complaints |
Provision for dismantling, restoration and rehabilitation cost |
Other provisions |
Total | ||||||||||||
| ThUS$ | ThUS$ | ThUS$ | ThUS$ | |||||||||||||
| Total provisions, initial balance | 21,067 | 5,890 | 13,445 | 40,402 | ||||||||||||
| Changes in provisions: | ||||||||||||||||
| Additional provisions | 2,800 | - | 54,310 | 57,110 | ||||||||||||
| Provision used | - | - | (47,261 | ) | (47,261 | ) | ||||||||||
| Increase(decrease) in foreign currency exchange | - | - | 128 | 128 | ||||||||||||
| Others | - | - | 467 | 467 | ||||||||||||
| Total Increase (decreases) | 2,800 | - | 7,644 | 10.444 | ||||||||||||
| Total provisions, final balance | 23,867 | 5,890 | 21,089 | 50,846 | ||||||||||||
| F- 152 |
NOTES TO THE CONSOLIDATED FINANCIAL STATEMENTS AS OF DECEMBER 31, 2018
| Note 19 | Disclosures on equity |
The detail and movements in the funds of equity accounts are shown in the consolidated statement of changes in equity.
| 19.1 | Capital management |
The main object of capital management relative to the administration of the Company’s financial debt and equity is to ensure the regular conduct of operations and business continuity in the long term, with the constant intention of maintaining an adequate level of liquidity and in compliance with the financial safeguards established in the debt contracts in force. Within this framework, decisions are made in order to maximize the value of SQM.
Capital management must comply with, among others, the limits contemplated in the Financing Policy approved by the Shareholders’ Meeting, which establish a maximum consolidated indebtedness level of 1.5 times the debt to equity ratio. This limit can be exceeded only if the Company’s management has first obtained express approval at an Extraordinary Shareholders’ Meeting.
In addition, capital management must comply with the external capital requirements (or covenants) imposed in its financial obligations, which regulate the indebtedness level to 1.2 times, its strictest level.
In conjunction with the level of indebtedness, it is also important for the Company to maintain a comfortable profile of maturities for its financial obligations, in order to oversee the relation between its short-term financial obligations and the long-term maturities, and the relation they have with the Company’s asset distribution. Consequently, the Company has maintained a liquidity level of 3 times during the last periods.
The Company’s management controls capital management based on the following ratios:
|
CAPITAL MANAGEMENT |
12/31/2018 | 12/31/2017 | Description (1) | Calculation (1) | ||||||||
| Net Financial Debt ThUS$ | 471,755 | 245,508 | Financial Debt – Financial Resources | Other current Financial Liabilities + Other Non-Current Financial Liabilities – Cash and Cash Equivalents – Other Current Financial Assets – Hedging Assets, non-current | ||||||||
| Liquidity | 4.32 | 3.29 | Current Assets divided by Current Liabilities | Total Current Assets / Total Current Liabilities | ||||||||
| Net Debt / Capitalization | 0.18 | 0.10 | Net Financial Debt divided by Total Equity | Net financial debt / Total Equity | ||||||||
| ROE | 20.7 | % | 19.1 | % | Profit for the year divided by Total Equity | LTM (2) Profit for the year / Equity | ||||||
| Adjusted EBITDA (ThUS$) | 885,652 | 901,856 | Adjusted EBITDA | Profit for the year + Depreciation and Amortization Expenses + Finance Costs + Income Tax – Other income – Other gains (losses) - Share of Profit of associates and joint ventures accounted for using the equity method + Other expenses by function + Net impairment gains or reversal (losses) of financial assets – Finance income – Currency differences | ||||||||
| EBITDA (ThUS$) | 902,450 | 885,240 | EBITDA | Profit for the year + Depreciation and Amortization Expenses + Finance Costs + Income Tax | ||||||||
| ROA | 20.31 | % | 21.3 | % | (Adjusted EBITDA – Depreciation) divided by Total Assets net of financial resources less related parties’ investments | (LTM Gross Profit – Administrative Expenses)/ (Total Assets – Cash and Cash Equivalents – Other Current Financial Assets – Other Non-Current Financial Assets – Equity-accounted Investments) | ||||||
| Indebtedness | 1.00 | 0.91 | Total Liabilities on Equity | Total Liabilities / Total Equity | ||||||||
|
(1) Assumes the absolute value of the accounting records
(2) Last 12 months |
||||||||||||
| F- 153 |
NOTES TO THE CONSOLIDATED FINANCIAL STATEMENTS AS OF DECEMBER 31, 2018
| Note 19 | Disclosures on equity (continued) |
| 19.1 | Capital management, continued |
The Company’s capital requirements change according to variables such as working capital needs, new investment financing and dividends, among others. The Company manages its capital structure and makes adjustments on the basis of the predominant economic conditions so as to mitigate the risks associated with adverse market conditions and take advantage of the opportunities there may be to improve the liquidity position.
There have been no changes in the capital management objectives or policy within the years reported in this document. No breaches of external requirements of capital imposed (or covenants) have been recorded.
| 19.2 | Disclosures on preferred share capital |
Issued share capital is divided into 263,196,524 fully paid and subscribed shares composed of 142,819,552 Series "A" shares and 120,376,972 Series “B” shares. All such shares are nominative, have no par value and are fully issued, subscribed and paid.
Series B shares may not exceed 50% of the total issued, subscribed and paid-in shares of the Company and have a limited voting right, in that all of them can only elect one director of the Company, regardless of their equity interest and preferences:
| (a) | require the calling of an Ordinary or Extraordinary Shareholders' Meeting when so requested by Series B shareholders representing at least 5% of the issued shares thereof; and |
| (b) | require the calling of an extraordinary meeting of the board of directors, without the president being able to qualify the need for such a request, when so requested by the director who has been elected by the shareholders of said Series B. |
The limitation and preferences of Series B shares have a duration of 50 consecutive and continuous years as of June 3, 1993.
The Series A shares have the preference of being able to exclude the director elected by the Series B shareholders in the voting process in which the president of the board of directors and of the Company must be elected and which follows the one in which the tie that allows such exclusion resulted.
The preference of the Series A shares will have a term of 50 consecutive and continuous years as of June 3, 1993. The form of the titles of the shares, their issuance, exchange, disablement, loss, replacement, assignment and other circumstances thereof shall be governed by the provisions of Law No. 18,046 and its regulations.
At December 31, 2018 and December 31, 2017, the Group does not hold shares of the Parent Company either directly or through its investees.
| F- 154 |
Notes to the Consolidated Financial Statements as of December 31, 2018
| Note 19 | Disclosures on equity (continued) |
| 19.2 | Disclosures on preferred share capital, continued |
Detail of types of capital in preference shares:
| Type of capital in preferred shares | 12/31/2018 | 12/31/2017 | ||||||||||||||
| Description of type of capital in preferred shares | Series A | Series B | Series A | Series B | ||||||||||||
| Number of authorized shares | 142,819,552 | 120,376,972 | 142,819,552 | 120,376,972 | ||||||||||||
| Number of fully subscribed and paid shares | 142,819,552 | 120,376,972 | 142,819,552 | 120,376,972 | ||||||||||||
| Number of subscribed, partially paid shares | - | - | - | - | ||||||||||||
| Par value of shares in ThUS$ | 0.9435 | 2.8464 | 0.9435 | 2.8464 | ||||||||||||
| Increase (decrease) in the number of current shares | - | - | - | - | ||||||||||||
| Number of current shares | 142,819,552 | 120,376,972 | 142,819,552 | 120,376,972 | ||||||||||||
| Number of shares owned by the entity or its subsidiaries or associates | - | - | - | - | ||||||||||||
| Number of shares whose issuance is reserved due to the existence of options or agreements to dispose shares | - | - | - | - | ||||||||||||
| Capital amount in shares ThUS$ | 134,750 | 342,636 | 134,750 | 342,636 | ||||||||||||
| Amount of premium issuance ThUS$ | - | - | - | - | ||||||||||||
| Amount of reserves ThUS$ | - | - | - | - | ||||||||||||
| Total number of subscribed shares, total | 142,819,552 | 120,376,972 | 142,819,552 | 120,376,972 | ||||||||||||
As of December 31, 2018 and December 31, 2017, the Company has not placed any new issuances of shares on the market.
| F- 155 |
Notes to the Consolidated Financial Statements as of December 31, 2018
| Note 19 | Disclosures on equity (continued) |
| 19.3 | Disclosures on reserves in equity |
As of December 31, 2018 and December 31, 2017, this caption comprises the following:
| 12/31/2018 | 12/31/2017 | 12/31/2016 | ||||||||||
| ThUS$ | ThUS$ | ThUS$ | ||||||||||
| Reserve for currency exchange conversion | (26,307 | ) | (24,913 | ) | (19,463 | ) | ||||||
| Reserve for cash flow hedges | 7,971 | 2,248 | 64 | |||||||||
| Reserve for gains and losses from financial assets measured at fair value through other comprehensive income | (1,111 | ) | 2,937 | 3,513 | ||||||||
| Reserve for actuarial gains or losses in defined benefit plans | (6,884 | ) | (5,953 | ) | (4,834 | ) | ||||||
| Other reserves | 11,332 | 11,332 | 7,832 | |||||||||
| Total other reserves | (14,999 | ) | (14,349 | ) | (12,888 | ) | ||||||
Reserves for foreign currency translation differences
This balance reflects retained earnings for changes in the exchange rate when converting the financial statements of subsidiaries whose functional currency is that of each company’s origin country and the presentation currency is the US dollar.
Reserve for cash flow hedges
The Company maintains, as hedge instruments, financial derivatives related to obligations with the public issued in UF and Chilean pesos. Changes from the fair value of derivatives designated and classified as hedges are recognized under this classification.
Reserve for gains and losses from financial assets measured at fair value through other comprehensive income
This caption includes equity securities which are not held for trading, and which the group has irrevocably elected at initial recognition to recognise in this category. In the event that such equity instruments are fully or partially disposed of, the proportional accumulated effect of accumulated fair value will be transferred to retained earnings.
Reserve for actuarial gains or losses in defined benefit plans
For domestic subsidiaries the effects of changes in assumptions are considered, mainly changes in the discount rate.
The subsidiary SQM North America has established pension plans for its retired employees that are calculated by measuring the projected obligation of staff severance indemnities using a net salary progressive rate net of adjustments to inflation, mortality and turnover assumptions, deducting the resulting amounts at present value using a 5.5% interest rate for 2017 and 2016.
| F- 156 |
Notes to the Consolidated Financial Statements as of December 31, 2018
| Note 19 | Disclosures on equity (continued) |
| 19.3 | Disclosures on reserves in equity, continued |
Movements in other reserves and changes in interest were as follows:
|
Foreign
currency translation difference |
Gains from cash flow hedge |
Losses
from
measurement of defined benefit plans |
Gains
(losses) from
financial assets measured at fair value through other comprehensive income |
Other reserves | Total reserves | |||||||||||||||||||||||||||||||||||||||
| Movements | Before taxes | Before taxes | Tax | Before taxes |
Deferred
taxes |
Before taxes |
Deferred
taxes |
Before taxes | Reserves |
Deferred
taxes |
Total
reserves |
|||||||||||||||||||||||||||||||||
| ThUS$ | ThUS$ | ThUS$ | ThUS$ | ThUS$ | ThUS$ | ThUS$ | ThUS$ | ThUS$ | ThUS$ | ThUS$ | ||||||||||||||||||||||||||||||||||
| Opening balance as of 1/1/2017 | (19,463 | ) | 89 | (25 | ) | (5,446 | ) | 612 | 4,813 | (1,300 | ) | 7,832 | (12,175 | ) | (713 | ) | (12,888 | ) | ||||||||||||||||||||||||||
| Increase (decrease) in reserves | (5,450 | ) | 2,159 | - | (1,401 | ) | (26 | ) | - | 3,500 | (1,218 | ) | - | (1,218 | ) | |||||||||||||||||||||||||||||
| Deferred taxes | - | - | 25 | - | 282 | - | (550 | ) | - | - | (243 | ) | (243 | ) | ||||||||||||||||||||||||||||||
| Reclassification of loss in reserves | - | - | - | - | - | - | - | - | - | - | - | |||||||||||||||||||||||||||||||||
| Closing balance as of 12/31/2017 | (24,913 | ) | 2,248 | - | (6,847 | ) | 894 | 4,787 | (1,850 | ) | 11,332 | (13,393 | ) | (956 | ) | (14,349 | ) | |||||||||||||||||||||||||||
| Increase (decrease) in reserves | (1,394 | ) | 5,723 | - | (1,329 | ) | - | (5,546 | ) | - | - | (2,546 | ) | - | (2,546 | ) | ||||||||||||||||||||||||||||
| Deferred taxes | - | - | - | - | 398 | - | 1,498 | - | - | 1,896 | 1,896 | |||||||||||||||||||||||||||||||||
| Reclassification of loss in reserves | - | - | - | - | - | - | - | - | - | - | - | |||||||||||||||||||||||||||||||||
| Closing balance as of 12/31/2018 | (26,307 | ) | 7,971 | - | (8,176 | ) | 1,292 | (759 | ) | (352 | ) | 11,332 | (15,939 | ) | 940 | (14,999 | ) | |||||||||||||||||||||||||||
| F- 157 |
Notes to the Consolidated Financial Statements as of December 31, 2018
| Note 19 | Disclosures on equity (continued) |
| 19.3 | Disclosures on reserves in equity, continued |
Other reserves
This caption corresponds to the legal reserves reported in the individual financial statements of the subsidiaries that are mentioned below and that have been recognized in SQM’s equity through the application of the equity method.
(*) In the case of SQM Iberian S.A., the balance corresponds to the results obtained in the previous financial year which are presented as forming part of other reserves because of local regulations.
| 12/31/2018 | 12/31/2017 | 12/31/2016 | ||||||||||
| Subsidiary - Associate | ThUS$ | ThUS$ | ThUS$ | |||||||||
| SQM Iberian S.A. (*) | 9,464 | 9,464 | 5,964 | |||||||||
| SQM Europe NV | 1,957 | 1,957 | 1,957 | |||||||||
| Soquimich European holding B.V. | 828 | 828 | 828 | |||||||||
| Abu Dhabi Fertilizer Industries WWL | 455 | 455 | 455 | |||||||||
| Doktor Tarsa Tarim Sanayi AS | 305 | 305 | 305 | |||||||||
| Total | 13,009 | 13,009 | 9,509 | |||||||||
| Corresponds to the acquisition of the subsidiary SQM Iberian S.A., which was already under Company ownership at the acquisition date (IAS 27 R). | (1,677 | ) | (1,677 | ) | (1,677 | ) | ||||||
| Total Other reserves | 11,332 | 11,332 | 7,832 | |||||||||
| F- 158 |
Notes to the Consolidated Financial Statements as of December 31, 2018
| Note 19 | Disclosures on equity (continued) |
| 19.4 | Dividend policies |
As required by Article 79 of the Chilean Companies Act, unless otherwise decided by unanimous vote of the holders of issued and subscribed shares, we must distribute a cash dividend in an amount equal to at least 30% of our consolidated profit for the year ended as of December 31, unless and except to the extent it has a deficit in retained earnings (losses not absorbed in prior years).
Dividend policy for commercial year 2018.
The Company has defined the following dividend policy:
| a) | Distribute and pay, as a final dividend ( dividendo definitivo ) and in favor of the respective shareholders, a percentage of the net income that shall be determined per the following financial parameters: |
| (i) | 100% of the 2018 net income, when the following financial parameters are met: (a) that the total sum of cash and cash equivalent, and other current financial assets (“Cash”) divided by the total sum of the current financial liabilities (“Current Financial Liabilities”) is equal to or greater than 2.5 times, and (b) the total sum of the current liabilities and the non-current liabilities (“Total Liabilities”) divided by the total sum of the equity (“Equity”) is equal to or less than 1.1 times. |
| (ii) | 80% of the 2018 net income when the following financial parameters are met: (a) that Cash divided by Current Financial Liabilities is equal to or greater than 2.0 times, and (b) the total sum of the Total Liabilities divided by the total Equity is equal to or less than 1.2 times. |
| (iii) | 60% of the 2018 net income when the following financial parameters are met: (a) that Cash divided by Current Financial Liabilities is equal to or greater than 1.5 times, and (b) Total Liabilities divided by Equity is equal to or less than 1.3 times. |
If none of the foregoing financial parameters are met, the Company shall distribute and pay, as a final dividend, and in favor of the respective shareholders, 50% of the 2018 net income.
| b) | Distribute and pay, if possible and during 2018, three interim dividends ( dividendos provisorios ) that will be charged against the aforementioned final dividend. These interim dividends shall likely be paid during the month following the approval of the March, June, and September 2018 interim financial statements, respectively. Its amounts shall be calculated as follows: |
| (i) | For the interim dividends that will be charged to the accumulated net income reflected in the March 2018 interim financial statements, the percentage distributed shall be determined per the financial parameters expressed in letter a) above. |
| (ii) | For the interim dividends that will be charged to the accumulated net income reflected in the June 2018 interim financial statements, the percentage distributed shall be determined per the financial parameters expressed in letter a) above, discounting the total amount of interim dividends previously distributed during 2017. |
| F- 159 |
Notes to the Consolidated Financial Statements as of December 31, 2018
| Note 19 | Disclosures on equity (continued) |
| 19.4 | Dividend policies, continued |
| (iii) | For the interim dividends that will be charged to the accumulated net income reflected in the September 2018 interim financial statements, the percentage distributed shall be determined per the financial parameters expressed in letter a) above, discounting the total amount of interim dividends previously distributed during 2018. |
| c) | The amount of the interim dividends mentioned above may vary, pursuant to the information available to the Board of Directors on the date on which it agrees to the distribution of said dividends given that the dividend will not materially or negatively affect SQM’s capacity to impact its investments, fulfill its liabilities, or in general, comply with the investment and finance policy approved at the ordinary shareholders’ meeting. |
| d) | At the ordinary shareholders meeting that will be held in 2019, the Board of Directors shall propose a final dividend pursuant to the financial parameters expressed in letter a) above, discounting the total amount of the interim dividends previously distributed during 2018. |
| e) | If there is an excess of net income in 2018, this may be retained and assigned or allocated for financing its own operations, to one or more investment projects of the Company, notwithstanding a future distribution of special dividends ( dividendos eventuales ) charged to the accumulated net income previously approved at the shareholders’ meeting, or the possible and future capitalization of all or part of the latter. |
| f) | The payment of additional dividends ( dividendos adicionales ) is not considered. |
The dividend policy described above corresponds to the intention of the Board of Directors, and the compliance of it shall depend on the net income that the Company ultimately obtains, as well as the results of periodic projections that could impact the Company, or to the existence of determined conditions that may affect it, as applicable. If the dividend policy exposed by the Board of Directors suffers a substantial change, the Company must communicate it as an essential fact.
| F- 160 |
Notes to the Consolidated Financial Statements as of December 31, 2018
| Note 19 | Disclosures on equity (continued) |
| 19.5 | Interim and provisional dividends |
At the General Ordinary Shareholders' Meeting of April 27, 2018, the shareholders agreed to the payment of a final dividend of US$1.62501 per share from the net profit obtained during the 2017 fiscal year, the amount of US$1.20533 per share must be discounted from the final dividend as it had been already paid in a form of interim dividends. The remaining balance of US$0.41968 per share was paid to shareholders on May 10, 2018.
The Ordinary Shareholders’ Meeting held on April 27, 2018 agreed to change the Company’s Dividend Policy for 2017 which was presented to the Ordinary Shareholders’ Meeting held on April 28, 2017, by incorporating a special dividend of US$100,000,000, equivalent to US$0.37994 per share which would be paid with a charge to the Company’s retained earnings. This dividend was paid to shareholders on May 10, 2018.
On May 23, 2018, the Company's Board of Directors approved the payment of an interim dividend equivalent to US$ 0.43247 per share, charged to 2018 net income. On August 22, 2018, the Board of Directors approved the payment of an interim dividend equivalent to US$ 0.50864 per share, charged to net income for 2018. This amount was paid in its equivalent in national currency according to the value of the Observed Dollar published in the Official Gazette on August 31, 2018.
On November 21, 2018, the Board of Directors approved the payment of an interim dividend equivalent to US$0.31726 per share, charged to net income for 2018. This amount was paid in its equivalent in national currency according to the value of the Dollar Observed in the Official Journal of November 30, 2018.
| F- 161 |
Notes to the Consolidated Financial Statements as of December 31, 2018
| Note 19 | Disclosures on equity (continued) |
| 19.5 | Interim and provisional dividends, continued |
The dividends presented as deducted from equity are as follows:
|
12/31/2018 ThUS$ |
12/31/2017 ThUS$ |
12/31/2016 ThUS$ |
||||||||||
| Dividends attributable to owners of the parent | 823 | 55,501 | 3,014 | |||||||||
| Provisional dividend | 331,199 | 317,243 | 225,000 | |||||||||
| Additional dividend | 107,872 | - | 150,000 | |||||||||
| Dividend payable | 109,669 | 110,529 | - | |||||||||
| Total | 549,563 | 483,273 | 378,014 | |||||||||
| F- 162 |
Notes to the Consolidated Financial Statements as of December 31, 2018
| Note 20 | Earnings per share |
Basic earnings per share are calculated by dividing net income attributable to the Company’s shareholders by the weighted average of the number of shares in circulation during that period.
As expressed, earnings per share are detailed as follows:
| Basic earnings per share |
12/31/2018 ThUS$ |
12/31/2017 ThUS$ |
12/31/2016 ThUS$ |
|||||||||
| Earnings (losses) attributable to owners of the parent | 439,830 | 427,697 | 278,290 | |||||||||
|
12/31/2018 Units |
12/31/2017 Units |
12/31/2016 Units |
||||||||||
| Number of common shares in circulation | 263,196,524 | 263,196,524 | 263,196,524 | |||||||||
| 12/31/2018 | 12/31/2017 | 12/31/2016 | ||||||||||
| Basic earnings per share (US$ per share) | 1.6711 | 1.6250 | 1.05732 | |||||||||
The Company has not made any operations with a potential dilutive effect that assumes diluted earnings per share are different from the basic earnings per share.
| F- 163 |
Notes to the Consolidated Financial Statements as of December 31, 2018
| Note 21 | Contingencies and restrictions |
In accordance with note 18,1, the Company has only registered a provision for those lawsuits in which there is a probability that the judgments will be unfavorable to the Company. The Company is party to the following lawsuits and other relevant legal actions:
21.1 Lawsuits and other relevant events
| 1. | Plaintiff | : | Nancy Erika Urra Muñoz, |
| Defendants | : | Fresia Flores Zamorano, Duratec-Vinilit S.A. and the Company and their Insurers. | |
| Date | : | December 2008. | |
| Court | : | 1st Civil Court of Santiago. | |
| Reason | : | Labor Accident. | |
| Status | : | Judgment favorable for the Company. Dated March 11, 2016. Appeal filed by the plaintiff which has not been pronounced on. Awaiting notification of the sentence, case filed on December 28, 2016 | |
| Nominal value | : | ThUS$550. |
| 2. | Plaintiff | : | City of Pomona, California USA. |
| Defendant | : | SQM North America Corporation (“ SQM NA ”). | |
| Date | : | December 2010. | |
| Court | : | United States District Court Central District of California. | |
| Reason | : | Payment of expenses and other amounts related to the treatment of groundwater to allow for its consumption by removing the existing perchlorate in such groundwater that allegedly comes from Chilean fertilizers. | |
| Status | : | On May 17, 2018, district judge Gary Klausner sentenced in favor of SQM NA following the verdict of the jury. On September 14, 2018, the plaintiff filed a motion to appeal, which is pending resolution. | |
| Nominal value | : | ThUS$32,000. |
| 3. | Plaintiff | : | City of Lindsay, California USA. |
| Defendant | : | SQM NA and the Company (still not noticed) | |
| Date | : | December 2010. | |
| Court | : | United States District Court Eastern District of California. | |
| Reason | : | Payment of expenses and other amounts related to the treatment of groundwater to allow for its consumption by removing the existing perchlorate in such groundwater that allegedly comes from Chilean fertilizers. | |
| Status | : | Filing of the case, processing suspended. | |
| Nominal value | : | Not possible to determine. |
| F- 164 |
Notes to the Consolidated Financial Statements as of December 31, 2018
| Note 21 | Contingencies and restrictions (continued) |
| 21.1 | Lawsuits and other relevant events, continued |
| 4. | Plaintiff | : | H&V Van Mele N.V. |
| Defendant | : | NV Euroports, SQM Europe N.V. and its insurance companies, | |
| Date | : | July 2013. | |
| Court | : | Commercial Court of Dendermonde, | |
| Reason | : | Alleged indirect responsibility for the absence of adequate specifications for the SOP–WS by the Belgian distributor. | |
| Status | : | Sentencing against NV Euroports and subsidy SQM Europe N.V., for EUR 206,675.91. Appeal presented in November 2017. | |
| Nominal value | : | ThUS$430. | |
| 5. | Plaintiff | : | Carlos Aravena Carrizo et al. |
| Defendant | : | SQM Nitratos S.A. (“SQM Nitratos”) and its insurers. | |
| Date | : | May 2014. | |
| Court | : | 18th Civil Court of Santiago. | |
| Reason | : | Lawsuit seeking compensation for damages for alleged civil liability under tort as a result of an explosion that occurred during 2010 near Baquedano, causing the death of 6 employees. | |
| Status | : | Summons to hear sentence | |
| Nominal value | : | ThUS$1,235. | |
| 6. | Plaintiff | : | Evt Consulting SpA. |
| Defendant | : | SQM Nitratos. | |
| Date | : | October 2014. | |
| Court | : | 23th Civil Court of Santiago. | |
| Reason | : | Lawsuit seeking compensation for damages related to the termination of the purchase and sale agreement for metallic structures. | |
| Status | : | On November 13, 2017, the Santiago Appeals Court sentenced SQM Nitratos S.A. to pay US$304,620. An appeal in form and substance was presented before the Supreme Court in December 2017. | |
| Nominal value | : | ThUS$835. |
| F- 165 |
Notes to the Consolidated Financial Statements as of December 31, 2018
| Note 21 | Contingencies and restrictions (continued) |
| 21.1 | Lawsuits and other relevant events, continued |
| 7. | Plaintiff | : | SQM Salar S.A. (“ SQM Salar ”) and the Company. |
| Defendant | : | Seguros Generales Suramericana S.A. (formerly - RSA Seguros Chile S.A.) | |
| Date | : | August 29, 2016. | |
| Court | : | Arbitration Court – Arbitrator Mr. Gonzalo Fernández. | |
| Reason | : | Complaint for forced compliance and collection of indemnification for insurance claim of February 7 and 8, 2013. | |
| Status | : | Evidence stage. | |
| Nominal value | : | ThUS$20,658. | |
| 8. | Plaintiff | : | Tyne and Wear Pension Fund as represented by the Council of the Borough of South Tyneside acting as Lead Plaintiff. |
| Defendant | : | The Company | |
| Date | : | January 2016. | |
| Court | : | United States District Court – Southern District of New York. | |
| Reason | : | Alleged damage to ADS holders of the Company resulting from alleged noncompliance with the securities regulations in the United States by the Company. | |
| Status | : | Initial stage of disclosure of background information. | |
| Nominal value | : | Not determined. | |
| 9. | Plaintiff | : | Ernesto Saldaña González et al. |
| Defendant | : | SQM Salar S.A., SQM Industrial S.A. (“SQM Industrial”) and their insurance companies. | |
| Date | : | May 2016. | |
| Court | : | 13 th Civil Court of Santiago. | |
| Reason | : | Lawsuit seeking compensation for damages for alleged civil liability under tort law arising from the accident that occurred in July 2014 in the María Elena location. | |
| Status | : | Summons to hear sentence | |
| Nominal value | : | ThUS$515. |
| F- 166 |
Notes to the Consolidated Financial Statements as of December 31, 2018
| Note 21 | Contingencies and restrictions (continued) |
| 21.1 | Lawsuits and other relevant events, continued |
| 10. | Plaintiff | : | María Yolanda Achiardi Tapia et al. |
| Defendant | : | SQM Salar and its insurance companies and other 5 defendants | |
| Date | : | February 2015. | |
| Court | : | 1 st Civil Court of Antofagasta. | |
| Reason | : | Lawsuit seeking compensation for damages for alleged civil liability under tort law arising from a traffic accident that occurred in April 2011 in the city of Antofagasta. | |
| Status | : | Summons to hear sentence. | |
| Nominal value | : | ThUS$1,265. | |
| 11. | Plaintiff | : | The Company |
| Defendants | : | AES Gener S.A. (“Gener”) and Empresa Eléctrica Cochrane SpA (“Cochrane”). | |
| Date | : | May 11, 2017. | |
| Court | : | Arbitration award in accordance with the arbitration rules established by the Center for Arbitration and Mediation of the Santiago Chamber of Commerce (“CAM). | |
| Reason | : | Request for the interpretation of an electricity supply agreement alleging the right by the plaintiff to receive a collection in conformity with such agreement. | |
| Instance | : | Evidentiary stage. | |
| Nominal value | : | Not determined. | |
| 12. | Plaintiff | : | Gener and Cochrane. |
| Defendant | : | The Company. | |
| Date | : | May 2017. | |
| Court | : | Arbitration in accordance with the rules established by the Center for Arbitration and Mediation (CAM). | |
| Reason | : | Discrepancy with respect to the amount of an alleged right by the plaintiff to receive a collection in conformity with the agreement entered into by the parties. | |
| Instance | : | Evidentiary stage. | |
| Nominal value | : | Not determined. |
| F- 167 |
Notes to the Consolidated Financial Statements as of December 31, 2018
| Note 21 | Contingencies and restrictions (continued) |
| 21.1 | Lawsuits and other relevant events, continued |
| 13. | Plaintiffs | : | Transportes Buen Destino |
| Defendant | : | SQM Salar. | |
| Date | : | None. | |
| Court | : | Arbitration in accordance with the rules established by the Center for Arbitration and Mediation (CAM). | |
| Reason | : | Discrepancies generated in the implementation of the following contracts entered into between TBD and SQM Salar: (i) lithium brine transportation; and (ii) salt transportation. | |
| Instance | : | Prior stage. The audience for setting procedure rules is pending. | |
| Nominal value | : | Undetermined. | |
| 14. | Plaintiffs | : | Castillo, Hernán et al. |
| Defendants | : | Servicios Integrales de Tránsitos y Transferencias S.A. and SQM Industrial S.A. | |
| Date | : | September 15, 2017. | |
| Court | : | 1st Labor Court of Santiago. | |
| Reason | : | Lawsuit to assert labor rights, seeking collection of wages owed and other amounts. | |
| Instance | : | On August 24, 2018, a judgment is issued rejecting the application in its entirety. On September 6, 2018, plaintiffs deduct an appeal for nullity before the Santiago Court of Appeals, which is still in branch. | |
| Nominal value | : | ThUS$1,940. | |
| 15. | Plaintiffs | : | Acosta Tapia, Eloisa del Tránsito and others as successors and assigns of Araya Castillo, Raimundo del Rosario. |
| Defendants | : | SQM Salar. | |
| Date | : | January 19, 2018. | |
| Court | : | 2nd Labor Court of Santiago. | |
| Reason: | : | Lawsuit for damages for pain and suffering as a result of occupational illness. | |
| Instance | : | On October 22, the final ruling was issued, wherein the claim was denied. The plaintiff filed an appeal for annulment, which is pending with the Court of Appeals of Santiago | |
| Nominal value | : | ThUS$472. |
| F- 168 |
Notes to the Consolidated Financial Statements as of December 31, 2018
| Note 21 | Contingencies and restrictions (continued) |
| 21.1 | Lawsuits and other relevant events, continued |
| 16. | Appellants | : | Asociación Indígena Consejo Pueblos Atacameños and others. |
| Appellees | : | Corfo, the Company, SQM Salar and SQM Potasio S.A. | |
| Date of appeal | : | February 15, 2018. | |
| Court | : | Santiago Court of Appeals | |
| Reason | : | Appeal requesting annulment of modifications to contracts signed by the defendants on January 17, 2018. | |
| Instance | : | On September 25, the Court of Appeals of Santiago rejected the appeal for protection. On October 12, the Supreme Court ordered the revision of the appeal filed by the appellants. | |
| Nominal value | : | Undetermined. | |
| 17. | Claimant | : | The Society. |
| Defendant | : | Office of the Superintendent of the Environment (“SMA”) | |
| Date | : | 20 July 2017 | |
| Court | : | Second Environmental Court of Santiago | |
| Reason | : | Motion for review filed by the Company against ruling rejecting the compliance program for the Pampa Hermosa project. | |
| Instance | : | On August 21, 2018, the Second Environmental Court of Santiago accepted the Company’s claim and ordered the SMA to take the procedure back to the stage prior to their sentencing that rejected the compliance program. This ruling was appealed with the Supreme Court on August 8, 2018. |
Nominal value: Amount involved: Undetermined.
| 18. | Claimant | : | Congresspersons Claudia Nathalie Mix Jiménez, Gael Fernanda Yeomans Araya, Camila Ruslay Rojas Valderrama et al. |
| Defendant | : | CORFO. The entity has intervened as an independent third party. | |
| Date | : | September 6, 2018. | |
| Court | : | Special Magistrate, Mr. Alejandro Madrid Crohare. | |
| Reason | : | To render null and void the contract for the Salar de Atacama Project signed between CORFO and SQM Salar. | |
| Instance | : | Pending ruling on dilatory pleas and independent third-party status of companies and subsidiaries. | |
| Nominal value | : | Undetermined. |
| F- 169 |
Notes to the Consolidated Financial Statements as of December 31, 2018
| Note 21 | Contingencies and restrictions (continued) |
| 21.1 | Lawsuits and other relevant events, continued |
The Company and its subsidiaries have been involved and will probably continue to be involved either as plaintiffs or defendants in certain judicial proceedings that have been and will be heard by the arbitration or ordinary courts of justice that will make the final decision. Those proceedings that are regulated by the appropriate legal regulations are intended to exercise or oppose certain actions or exceptions related to certain mining claims either granted or to be granted and that do not or will not affect in an essential manner the development of the Company and its subsidiaries.
Soquimich Comercial S.A. has been involved and will probably continue being involved either as plaintiff or defendant in certain judicial proceedings through which it intends to collect and receive the amounts owed, the total nominal value of which is approximately US$1.2 million.
The Company has made efforts and continues making efforts to obtain payment of certain amounts that are still owed to the Company due to its activities. Such amounts will continue to be required using judicial or non-judicial means by the plaintiffs, and the actions and exercise related to these are currently in full force and effect.
The Company and its subsidiaries have received no legal notice on lawsuits other than those indicated above, which exceed US$0.2 million.
| F- 170 |
Notes to the Consolidated Financial Statements as of December 31, 2018
| Note 21 | Contingencies and restrictions (continued) |
| 21.2 | Restrictions to management or financial limits |
Contracts that subscribed the issuance of bond in the local and international market require the Company to comply with the following level of consolidated financial indicators, calculated for the last 12 month period:
To maintain Leverage Ratio not higher than 1.2 times at its strictest level. The Leverage ratio is defined as the Total Liabilities divided by Total Equity.
As of December 31, 2018, the above mentioned financial indicator has the following values:
| Indicator | 12/31/2018 | 12/31/2017 | ||||||
| Leverage | 1.00 | 0.91 | ||||||
Bond issue agreements issued abroad require the Company to neither merge nor dispose of the whole or a substantial part of its assets, unless all the following conditions are met: (i) the legal successor company is an entity subject to either Chilean or United States law, and assumes SQM S.A.’s obligations under a complimentary contract, (ii) the Issuer does not fail to comply immediately after the merger or disposal, and (iii) the Issuer delivers a legal opinion stating that the merger or disposal and the complimentary contract meet the requirements described in the original contract.
In addition, SQM S.A. is committed to disclosing financial information on quarterly basis.
The Company and its subsidiaries have complied and are fully complying with all the aforementioned limitations, restrictions and obligations.
| F- 171 |
Notes to the Consolidated Financial Statements as of December 31, 2018
| Note 21 | Contingencies and restrictions (continued) |
| 21.3 | Environmental contingencies |
On June 6, 2016, the “SMA” filed charges against the Company with respect to the Pampa Hermosa project for possible noncompliance with RCA 890/2010.
This relates to charges related to certain variables of the follow-up plan and the implementation of a mitigation measure included in the respective environmental impact assessment. The Company has presented for the approval of SMA a compliance program detailing the actions and commitments it will carry out to address the SMA's objections.
On June 29, 2017, the SMA rejected the compliance program presented by the Company. On July 10, 2017, the Company presented its rebuttals to the charges made by the SMA. On August 21, 2018, the Second Environmental Court accepted the Company’s claim, ordering the SMA to take the procedure back to the stage prior to their resolution rejecting the compliance program presented by the Company.
On December 13, 2017, the First Environmental Court of Antofagasta authorized the SMA to apply the temporary and partial closure of the water extraction wells located in the Salar de Llamara. These wells allow the Company to extract around 124 liters/second of water, which is approximately 15% of the water used in Chile’s First Region. In October 2018, the First Environmental Court of Antofagasta accepted the Company’s claim, leaving the indicated closure without effect, maintaining only the requirement to prepare reports to increase knowledge of ecosystems. In mid-October, the Court denied authorization to SMA to renew the closure measure. In December 2018, the First Environmental Court accepted the Company’s second claim, ratifying the previous decision.
On January 10, 2019, the SMA carried out the sentence of the Second Environmental Court, taking the procedure back to the stage prior to their resolution rejecting the compliance program presented by the Company. On January 14, 2019, the SMA made new observations to the compliance program formulated by the Company. The term granted for the Company to address these observations is currently underway, after which the SMA will issue a new ruling on the proposal.
Through a ruling dated November 28, 2016, which was modified by a ruling dated December 23, 2016, the SMA filed charges against SQM Salar for extracting brine in excess of authorized amounts, progressively impacting the vitality of algarrobo trees, delivering incomplete information, modifying variables and other matters.
| F- 172 |
Notes to the Consolidated Financial Statements as of December 31, 2018
| Note 21 | Contingencies and restrictions (continued) |
| 21.3 | Environmental contingencies, continued |
SQM Salar presented a compliance program that details the actions and commitments that will be undertaken to overcome the objections formulated by the SMA. This program was accepted by SMA ruling dated January 7, 2019, thus suspending the process initiated against SQM Salar. The Atacameño Indigenous Community of Peine, the Indigenous Association Council of Atacameño Peoples and the Atacameño Indigenous Community of Camar have filed against this ruling with the First Environmental Court. In keeping with the monitoring plans established in the current environmental qualification resolution for the operation at the Salar de Atacama, SQM Salar periodically monitors the flora, fauna, hydrogeological and meteorological variables, including 225 monitoring points and 48 continuous measuring points for the brine and water levels in different parts of the salar basin, which it periodically reports to the corresponding authorities. If any of the monitoring points fall below predefined levels, various actions are considered, which are part of the environmental monitoring plan.
On May 20, 2018, 2 of the 225 points were 1 cm below the predefined level for those points. These points are on the route of an outlet sector for a lagoon located on the eastern edge of the Salar de Atacama. Historically flows from the lagoons of the deposit have varied in location and route. That has happened in this case and the flow has moved with regard to the location of the monitoring well in question. Both the levels and the flows from the lagoons have behaved normally and no changes in the ecosystem that is being monitored in the area have been observed.
Following the protocols established for these cases, SQM Salar’s total extraction volume in the Salar de Atacama, has been reduced from a maximum average of 1,500 liters per second per year to 1,250 liters per second per year for a period of six months.
The Company estimates that an average annual decrease of brine extraction of 250 liters per second would have no impact on current and estimated production volumes of lithium carbonate and hydroxide. In the case of potassium chloride, it is estimated that the reduction in brine extraction could imply a reduction in production and sales volumes of approximately 170.000 metric tons on an annual basis.
| F- 173 |
Notes to the Consolidated Financial Statements as of December 31, 2018
| Note 21 | Contingencies and restrictions (continued) |
| 21.4 | Tax contingency |
During 2015, the Company, SQM Salar and SQM Industrial submitted to the Chilean IRS four tax amendments (two by the Company, one by SQM Salar and one by SQM Industrial).
The first two (one for SQM and one for SQM Salar), after being approved by the SII, generated payments for taxes, interests and other charges of US$8.1 million. A provision for such amount was made in the profit or loss for the first quarter of 2015.
Additionally, during August 2015, the Chilean IRS was provided, for its review and approval, with the documentation necessary for amending the annual tax returns of the Company and SQM Industrial. As a result of such amendments, the Company paid an approximate amount of US$1.4 million for taxes, interests and other charges. This amount was recorded in a provision in the profit or loss for the second quarter of 2015.
Finally, during 2016, the last 12 invoices were amended with a payment of approximately US$50,000.
Accordingly, the SQM Group considers terminated the internal analysis which has been performed. The purpose of the analysis was to identify the expenses incurred by the SQM Group during the fiscal years 2008 to 2014 and which could be a matter of tax rectification.
| F- 174 |
Notes to the Consolidated Financial Statements as of December 31, 2018
| Note 21 | Contingencies and restrictions (continued) |
| 21.4 | Tax contingency, continued |
Because of the aforementioned amendments, the Company, SQM Salar and SQM Industrial might be affected by additional penalties established in the first subparagraph, No. 4 of Article 97 of the Tax Code, for an amount ranging between 50% and 300% of the taxes paid. The Company has not considered it necessary to make any provisions related to this possible additional penalty.
On Friday, August 26, 2016, SQM Salar filed with the Third Tax and Customs Court of the Metropolitan Region a tax claim against tax assessments No. 169, 170, 171 and 172, which seek to expand application of the specific tax on mining activities to include lithium exploitation. The amount involved is approximately US$17.8 million. On November 28, 2018, the Third Tax and Customs Court rejected the claim, and the case is in the Santiago Court of Appeals, based on the appeal filed by SQM Salar.
On March 24, 2017, SQM Salar filed with the Third Tax and Customs Court of the Metropolitan Region a tax claim against tax assessment No. 207 of 2016 and ruling No. 156 of 2016, both issued by the Chilean IRS, which seek to expand application of the specific tax on mining activities to include lithium exploitation for tax years 2015 and 2016. The amount involved is approximately US$14.4 million. On November 28, 2018, the Third Tax and Customs Court accepted SQM Salar’s claim for US$7.0 million corresponding to the overcharge made by the SII and rejected the remainder of the claim. The case is in the Santiago Court of Appeals, based on the appeal filed by SQM Salar.
These amounts are classified as taxes for current assets, non-current, as of December 31, 2017 and the same as of December 31, 2018.
The amount involved is approximately US$32.2 million. The Chilean IRS has not issued an assessment claiming differences in the specific tax on mining activities filed for business years 2016, 2017 and 2018. As of the date of these financial statements, the Company has not made any provisions for these possible differences.
If the Chilean IRS uses criteria similar to that used in previous years, it may issue an assessment in the future for the 2016, 2017 and 2018 financial years. It is reasonable to expect that should these assessments for the period 2016 to the quarter half of 2018 be issued, the value would be approximately US$57 million (without considering potential interest and fines).
| F- 175 |
Notes to the Consolidated Financial Statements as of December 31, 2018
| Note 21 | Contingencies and restrictions (continued) |
| 21.5 | Contingencies regarding the Changes to the Contracts with Corfo. Appeal No. 10301-2018, Santiago Court of Appeals: |
| (a) | In January 2018, indigenous communities and various parties presented an appeal for legal protection against Corfo, the Company, SQM Salar and SQM Potasio (the “Companies”), with regard to the amendments to the contract for the project in the Salar de Atacama and the OMA mining property lease contract dated January 17, 2018, both granted as a result of a conciliation process proposed by the arbitration court which took place at the end of arbitration between the parties (the “Amendments”). According to the appellants, the Amendments will deprive, disturb and threaten in an illegal and arbitrary way the constitutional rights of the appellants established in article 19, numbers 8, 21 and 24 of the Political Constitution. The appellants have therefore requested the following: (i) that the acts subject to appeal be declared invalid, vacated or without effect, (ii) that the Amendments be reviewed according to the provisions of Convention 169 (iii) that the counterparts be expressly made liable for the costs, given the clearly illegal and arbitrary nature of what has occurred. |
Once informed of the appeal, the Companies requested that it be rejected for the following reasons. Firstly, because it is extemporaneous. Secondly, as the matter is one that requires the interpretation and verification of the application or effects of contractual clauses, it goes beyond the scope of this cautionary action. Thirdly it should be challenged on the principle of specialty, because there is a special procedure which would better apply. In terms of substance, the Companies have indicated to the Court that an increase in the lithium quota, authorized through contractual changes adopted through a conciliation process proposed by the Arbitration Judge does not constitute an arbitrary or illegal act and that no indigenous consultation took place as per article 6 of Convention 169 because the Amendments were not legislative or administrative measures likely to directly affect the indigenous peoples. The Companies have sustained that the Amendments are the implementation of a conciliation agreement, that is the jurisdictional equivalent of res judicata, which was proposed by the arbitration judge and does not correspond to the exercise of public powers, as required in article 6 of Convention 169.
On September 25, 2018, the Santiago Court of Appeals rejected the appeal for protection. The appeal for protection is currently pending before the Supreme Court.
| F- 176 |
Notes to the Consolidated Financial Statements as of December 31, 2018
| Note 21 | Contingencies and restrictions (continued) |
| 21.5 | Contingencies regarding the Changes to the Contracts with Corfo. Appeal No. 10301-2018, Santiago Court of Appeals, continued |
In the event that a ruling is made to leave without effect the Amendments and if there are no appeals by the parties, the contracts prior to the Amendments will once again be valid, although this resolution should not affect the efficiency and validity of the conciliation reached regarding the matters debated in arbitration.
The court has the faculties to adopt the decisions it considers necessary to reestablish the rule of law and ensure the protection of the affected party.
(b) On September 6, 2018, a public law annulment lawsuit was filed by the congresspersons Mss. Claudia Nathalie Mix Jiménez, Gael Fernanda Yeomans Araya and Camila Ruslay Rojas Valderrama and the Citizen Power Party (Partido Poder Ciudadano) to render null and void the contract for the Salar de Atacama Project signed between Corfo and the Companies. The Companies have joined the suit as interested third parties.
In the suit, the plaintiffs request a pretrial measure against Corfo for the signing of agreements and contracts related to the exploitation of lithium. On October 31, 2018, the special magistrate rejected the measure, which was appealed by the plaintiffs.
In the event that the contract for the Salar de Atacama Project is rendered null and void, SQM Salar could be unable to exploit the mining claims in the Salar de Atacama that it has leased from Corfo.
| F- 177 |
Notes to the Consolidated Financial Statements as of December 31, 2018
| Note 21 | Contingencies and restrictions (continued) |
| 21.6 | Restricted or pledged cash |
The subsidiary Isapre Norte Grande Ltda., in compliance with the provisions established by the Chilean Superintendence of Healthcare, which regulates the running of pension-related health institutions, maintains a guarantee in financial instruments delivered in deposits, custody and administration to Banco de Chile.
This guarantee, according to the regulations issued by the Chilean Superintendence of Healthcare is equivalent to the total amount owed to its members and medical providers. Banco de Chile reports the present value of the guarantee to the Chilean Superintendence of Healthcare and Isapre Norte Grande Ltda on a daily basis. As of December 31, 2018, the guarantee amounts to ThUS$712.
| F- 178 |
Notes to the Consolidated Financial Statements as of December 31, 2018
| Note 21 | Contingencies and restrictions (continued) |
| 21.7 | Securities obtained from third parties |
The main security received (exceeding ThUS$100) from third parties to guarantee Soquimich Comercial S.A. their compliance with obligations in contracts of commercial mandates for the distribution and sale of fertilizers amounted to ThUS$9,423 and ThUS$12,103 on December 31, 2018 and December 31, 2017 respectively; which is detailed as follows:
| Grantor | Relationship | 12/31/2018 | 12/31/2017 | |||||||
| ThUS$ | ThUS$ | |||||||||
| Ferosor Agrícola S.A. | Unrelated third party | 3,598 | 4,067 | |||||||
| Tattersall Agroinsumos S.A. | Unrelated third party | 2,000 | 2,000 | |||||||
| Contador Frutos S.A. | Unrelated third party | 1,587 | 1,743 | |||||||
| Agrícola Lobert Ltda. | Unrelated third party | - | 1,264 | |||||||
| Covepa SPA | Unrelated third party | 720 | 813 | |||||||
| Johannes Epple Davanzo | Unrelated third party | 321 | 363 | |||||||
| Hortofrutícola La Serena | Unrelated third party | 294 | 323 | |||||||
| Juan Luis Gaete Chesta | Unrelated third party | 195 | 262 | |||||||
| Arena Fertilizantes y Semillas | Unrelated third party | 216 | 244 | |||||||
| Vicente Oyarce Castro | Unrelated third party | 222 | 244 | |||||||
| Soc. Agrocom. Julio Polanco | Unrelated third party | 144 | 163 | |||||||
| Bernardo Guzmán Schmidt | Unrelated third party | 126 | 138 | |||||||
| Gilberto Rivas Y Cia. Ltda. | Unrelated third party | - | 138 | |||||||
| Lemp Martin Julian | Unrelated third party | - | 124 | |||||||
| Comercial Agrosal Ltda. | Unrelated third party | - | 116 | |||||||
| Soc.Comercial el Mimbral | Unrelated third party | - | 101 | |||||||
| Total | 9,423 | 12,103 | ||||||||
| F- 179 |
Notes to the Consolidated Financial Statements as of December 31, 2018
| Note 22 | Lawsuits and complaints |
Lawsuits and complaints
During 2015, the Chilean IRS filed several lawsuits and complaints against a number of individuals related to the so-called “SQM Case”, which were associated with the irregular financing of politicians. Amongst those affected by these legal claims were the legal representatives of the Company the then-current CEO, Patricio de Sominihac T., as well as the then-current Vice President of Corporate Services and CFO, Ricardo Ramos R., now Chief Executive Officer. Those lawsuits and complaints related to alleged tax crimes associated with a possible undue decrease in the taxable net income of the Company and two of its subsidiaries over the last seven years by recording as expenses varios invoices and fee receipts, which could be considered as ideologically false. Similar legal actions were also filed against the taxpayers who provided the tax documents that allowed the alleged commission of the related illicit acts.
Actions performed by the Authority and Termination of research in Chile
The Public Ministry and the Chilean IRS (Servicio de Impuestos Internos (SII) have performed a number of actions within the framework of the so-called “SQM Case”, where the Company and its executives have provided their cooperation. Several of the Company’s executives have granted access to their computers and made several statements at the request of the Prosecutors responsible for the investigation. Additionally, SQM has provided physical and digital copies of its accounting records and its subsidiaries’ accounting records. SQM has also provided the Public Ministry with its email files and all the documentation that has been requested by the authority.
On August 17, 2018, the Eighth Guarantee Court declared the definitive dismissal of the Company, SQM Salar and SQM Nitratos with respect to the case in which their criminal liability was being investigated.
On January 15, 2019, the MP communicated to the Eighth Criminal Court its decision not to continue with the criminal investigation against Messrs. Patricio de Solminihac T, Ricardo Ramos R. and Enrique Olivares C.
| F- 180 |
Notes to the Consolidated Financial Statements as of December 31, 2018
| Note 22 | Lawsuits and complaints, (continued) |
Shearman & Sterling and Ad-Hoc Committee
On February 26, 2015, the Board of Directors of SQM established an ad-hoc committee comprised of three directors (the “Ad-hoc Committee”), which was authorized to conduct an investigation on the matters described in the preceding paragraph and to request any external advisory services it deemed necessary. The original members of the Ad-hoc Committee were José María Eyzaguirre B., Juan Antonio Guzmán M., and Wolf von Appen B.
The Ad-hoc Committee hired its own legal counsel in Chile and the United States as well as forensic accountants in the United States to support its internal investigation. The U.S. attorneys hired by the Ad-hoc Committee were mainly charged with reviewing the important facts and analyzing them in the context of the United States Foreign Corrupt Practices Act (“FCPA”). However, the Ad-hoc Committee’s factual conclusions were shared with both Chilean authorities and U.S. authorities.
On December 15, 2015, the Ad-hoc Committee presented the conclusions of its investigation to the Board of Directors. In addition to discussing the facts related to the referenced payments, the Ad-hoc Committee concluded that, for the purposes of the FCPA:
| a. | payments were identified that had been authorized by the former CEO of SQM for which the Company did not find sufficient supporting documentation; |
| b. | no evidence was identified that demonstrated that such payments were made in order to prompt a public official to act or abstain from acting in order to help SQM obtain economic benefits; |
| c. | in relation to the cost centers managed by the former CEO of SQM, it was concluded that the Company's books did not accurately reflect the transactions in question but that these transactions were determined to be quantitatively immaterial in comparison to SQM's equity, sales, expenses and profits during that period; and that. |
| d. | SQM's internal controls were insufficient to supervise the expenses within the cost center managed by the former CEO of SQM and relied on the proper use of resources by Patricio Contesse G. himself. |
After the Ad-hoc Committee presented its conclusions to the Board of Directors, the Company voluntarily shared these conclusions with the Chilean and U.S. Authorities (including the Securities and Exchange Commission (the “SEC”) and the U.S. Department of Justice (the “DOJ”) and has since collaborated by handing over documents and additional information requested by these authorities regarding this investigation.
| F- 181 |
Notes to the Consolidated Financial Statements as of December 31, 2018
| Note 22 | Lawsuits and complaints, (continued) |
Investigation by the Department of Justice and the Securities Exchange Commission and Agreements
The Company reported on the investigation by Shearman & Sterling for North American regulatory entities (DOJ and Securities and Exchange Commission, the “SEC”), in accordance with the regulations in force in the United States of America. The results of this investigation were given to these regulatory entities, which have opened investigations to determine the existence of possible noncompliance with the FCPA or Internal control standards.
On January 13, 2017, the Company and the DOJ reached agreement on the terms of a Deferred Prosecution Agreement (the “DPA”) that would resolve the DOJ’s inquiry, based on alleged violations of the books and records and internal controls provisions of the Foreign Corrupt Practices Act. Among other terms, the DPA calls for the Company to pay a monetary penalty of US$15,487,500, and engage a compliance monitor for a term of two (2) years. Upon successful completion of the three (3) year term of the DPA, all charges against the Company would be dismissed. On the same date, the SEC agreed to resolve its inquiry through an administrative cease and desist order, arising out of the alleged violations of the same accounting provisions of the FCPA. Among other terms, the SEC order calls for the Company to pay an additional monetary penalty of US$15 million. These penalties were reflected in the 2016 financial statements.
In accordance with the terms of the Deferred Prosecution Agreement (the “DPA”) with the DOJ, the Company has accepted that the DOJ formulates (i) a charge for infractions for the lack of implementation of effective internal accounting systems and internal accounting controls and (ii) a charge for infractions for failure to adequately maintain books, records and accounting sections in relation to the events investigated. Under the DPA, the DOJ has agreed not to pursue such charges against the Company for a period of 3 years and release the Company from liability after such period, inasmuch as within that period the Company complies with the terms of the DPA. These include payment of a fine of US$15,487,500 and acceptance of an external monitor for a period of 24 months (the “Monitor”) that will assess the Company’s compliance program, and continue to report on the Company independently for an additional year.
In relation to the agreement with the SEC, the Company has agreed to (i) pay a fine of 15 million dollars and (ii) maintain the Monitor for the aforementioned period.
The SEC has issued a Cease and Desist Order that does not identify other breaches of United States regulations.
The aforementioned amounts, approximately US$30.5 million, were reflected in the Company’s profit and loss during the fourth quarter of 2016 in the Other Expenses by function line.
| F- 182 |
Notes to the Consolidated Financial Statements as of December 31, 2018
| Note 23 | Sanction proceedings |
On April 03, 2018, the National Directorate of the “Dirección Nacional del Servicio Nacional de Geología y Minería” (National Geology and Mining Service) filed charges against SQM Industrial for the alleged violation of Article 40 letter c) of Law No. 20,551 that regulates the closure of mining works and facilities for Pampa Blanca, located in the district of Sierra Gorda. On April 26, 2018, SQM Industrial gave its deposition. According to current regulations, the National Geology and Mining Service can impose fines of up to 10 UTMs (monthly tax units) for each day of infringement, with a total maximum of 10,000 UTMs per month.
| F- 183 |
Notes to the Consolidated Financial Statements as of December 31, 2018
| Note 24 | Mineral resource exploration and evaluation expenditure |
Given the nature of operations of the Sociedad Química y Minera de Chile S.A. and Subsidiaries and the type of exploration it undertakes, disbursements for exploration can be found in 4 stages: Implementation, economically feasible, not economically feasible and in exploitation:
| 1. | Implementation: Disbursements for prospecting under implementation and therefore prior to determination of economic feasibility, are classified in the caption of Non-Current Assets, found in Works in Progress for Properties, Plant and Equipment, which include, exploration of caliche, and brine from the Salar de Atacama (these processes are generally developed over a one-year period), both totaling ThUS$8,355 in this caption, as of December 31, 2018, and ThUS$8,942 as of December 31, 2017. For Mt Holland, exploration disbursements fall under Other Non-Current Non-Financial Assets and correspond to ThUS$11,298 as of December 31, 2018. As of December 31, 2017 there were no disbursements for this concept. |
| 2. | Economically feasible : Prospecting disbursements corresponding to caliche exploration, wherein the study concluded that its economic feasibility is viable, are classified under Non-Current Assets in Other Non-current Financial Assets. The balance as of December 31, 2018, is ThUS$5,099 and as of December 31, 2017, it is ThUS$12,530. |
| For the exploration of the Salar de Atacama, the associated assets correspond to wells that can be used both in monitoring and exploitation of the Salar. Therefore, once the studies are concluded, these are classified as Non-current Assets in Properties, Plants and Equipment, assigning them a technical useful life of 10 years. |
| 3. | Not economically feasible : Prospecting disbursements, once finalized and concluded to be not economically feasible, will be charged to profit and loss. As of December 31, 2018 and December 31, 2017, there is no existing disbursement for this item. |
| 4. | In Exploitation: Caliche exploration disbursements that are found in this area are amortized based on the material exploited. The portion that is exploited in the following 12 months is presented as current assets in the inventories. As of December 31, 2018, the amount is ThUS$2,028 and the balance as of December 31, 2017 for this concept is ThUS$521. The portion that will be amortized in the following years is classified as non-current assets under Other Non-current Assets. As of December 31, 2018, there is a balance of ThUS$9,791 for this concept, and as of December 31, 2017, the balance is ThUS$5,191. |
Disbursements corresponding to metal exploration are charged to profit or loss in the period in which they are incurred.
| F- 184 |
Notes to the Consolidated Financial Statements as of December 31, 2018
| Note 25 | Gains (losses) from operating activities in the statement of income by function of expenses, included according to their nature |
| 25.1 | Revenue from operating activities |
The Group derives revenues from the sale of goods (which are recognised at one point in time) and from the provision of services (which are recognised over time) and are distributed among the following geographical areas and main product and service lines:
| 12/31/2018 | ||||||||||||||||||||||||||||
| Geographic areas |
Specialty plant
nutrition |
Iodine and
derivatives |
Lithium and
derivatives |
Potassium |
Industrial
chemicals |
Other |
Total ThUS$ |
|||||||||||||||||||||
| Chile | 111,595 | 1,052 | 700 | 25,593 | 4,575 | 45,834 | 189,349 | |||||||||||||||||||||
| Latin America and the Caribbean | 77,737 | 6,390 | 3,596 | 80,192 | 12,097 | 177 | 180,189 | |||||||||||||||||||||
| Europe | 200,229 | 112,080 | 103,430 | 46,068 | 17,384 | 473 | 479,664 | |||||||||||||||||||||
| North America | 240,995 | 83,587 | 68,254 | 50,685 | 27,347 | 647 | 471,515 | |||||||||||||||||||||
| Asia and Others | 151,194 | 121,863 | 558,821 | 64,936 | 46,865 | 1,407 | 945,086 | |||||||||||||||||||||
| Total | 781,750 | 324,972 | 734,801 | 267,474 | 108,268 | 48,538 | 2,265,803 | |||||||||||||||||||||
| 12/31/2017 | ||||||||||||||||||||||||||||
| Geographic areas |
Specialty plant
nutrition |
Iodine and
derivatives |
Lithium and
derivatives |
Potassium |
Industrial
chemicals |
Other |
Total ThUS$ |
|||||||||||||||||||||
| Chile | 91,243 | 1,054 | 802 | 20,001 | 2,522 | 45,942 | 161,564 | |||||||||||||||||||||
| Latin America and the Caribbean | 71,335 | 5,756 | 3,109 | 142,610 | 9,180 | 155 | 232,145 | |||||||||||||||||||||
| Europe | 177,997 | 81,557 | 88,443 | 72,405 | 28,346 | 305 | 449,053 | |||||||||||||||||||||
| North America | 235,963 | 67,491 | 42,918 | 69,105 | 25,824 | 553 | 441,854 | |||||||||||||||||||||
| Asia and Others | 120,713 | 96,265 | 509,301 | 75,205 | 69,706 | 1,517 | 872,707 | |||||||||||||||||||||
| Total | 697,251 | 252,123 | 644,573 | 379,326 | 135,578 | 48,472 | 2,157,323 | |||||||||||||||||||||
| 12/31/2016 | ||||||||||||||||||||||||||||
| Geographic areas |
Specialty plant
nutrition |
Iodine and
derivatives |
Lithium and
derivatives |
Potassium |
Industrial
chemicals |
Other |
Total ThUS$ |
|||||||||||||||||||||
| Chile | 102,804 | 1,319 | 500 | 18,940 | 3,398 | 60,108 | 187,069 | |||||||||||||||||||||
| Latin America and the Caribbean | 69,805 | 6,136 | 3,002 | 154,012 | 9,194 | 223 | 242,372 | |||||||||||||||||||||
| Europe | 116,863 | 86,095 | 77,850 | 82,040 | 14,391 | 887 | 378,126 | |||||||||||||||||||||
| North America | 211,954 | 63,193 | 41,226 | 81,043 | 24,485 | 337 | 422,238 | |||||||||||||||||||||
| Asia and Others | 122,427 | 74,401 | 392,049 | 67,288 | 52,669 | 683 | 709,517 | |||||||||||||||||||||
| Total | 623,853 | 231,144 | 514,627 | 403,323 | 104,137 | 62,238 | 1,939,322 | |||||||||||||||||||||
| a) |
|
| F- 185 |
Notes to the Consolidated Financial Statements as of December 31, 2018
| Note 25 | Gains (losses) from operating activities in the statement of income by function of expenses, included according to their nature |
| 25.1 | Revenue from operating activities, continued |
b) Main product lines:
| January to December | ||||||||||||
| 2018 | 2017 | 2016 | ||||||||||
| Products and Services | ThUS$ | ThUS$ | ThUS$ | |||||||||
| Specialty plant nutrition | 781,750 | 697,251 | 623,853 | |||||||||
| Sodium Nitrates | 17,688 | 18,555 | 16,891 | |||||||||
| Potassium nitrate and sodium potassium nitrate | 527,945 | 474,451 | 390,964 | |||||||||
| Specialty Blends | 145,512 | 121,263 | 129,943 | |||||||||
| Other specialty fertilizers | 90,605 | 82,982 | 86,055 | |||||||||
| Iodine and derivatives | 324,972 | 252,123 | 231,144 | |||||||||
| Lithium and derivatives | 734,801 | 644,573 | 514,627 | |||||||||
| Potassium | 267,474 | 379,326 | 403,323 | |||||||||
| Industrial chemicals | 108,268 | 135,578 | 104,137 | |||||||||
| Other | 48,538 | 48,472 | 62,238 | |||||||||
| Commodities | 18,582 | 11,822 | 19,842 | |||||||||
| Other ordinary income Commercial Offices | 24,465 | 32,784 | 37,068 | |||||||||
| Income from services rendered and others | ||||||||||||
| Other | ||||||||||||
| Income from the provision of services | 4,017 | 3,795 | 4,122 | |||||||||
| Income from leasing properties | 1,474 | 71 | 1,205 | |||||||||
| Total | 2,265,803 | 2,157,323 | 1,939,322 | |||||||||
| F- 186 |
Notes to the Consolidated Financial Statements as of December 31, 2018
| Note 25 | Gains (losses) from operating activities in the statement of income by function of expenses, included according to their nature |
| 25.2 | Cost of sales |
| 12/31/2018 | 12/31/2017 | 12/31/2016 | ||||||||||
| ThUS$ | ThUS$ | ThUS$ | ||||||||||
| Raw materials and consumables used | (260,863 | ) | (227,620 | ) | (208,697 | ) | ||||||
| Classes of employee benefit expenses | (203,569 | ) | (172,084 | ) | (162,335 | ) | ||||||
| Depreciation expense | (212,582 | ) | (232,275 | ) | (271,128 | ) | ||||||
| Amortization expense | (7,194 | ) | (8,153 | ) | (12,438 | ) | ||||||
| Operating leases | (75,395 | ) | (80,160 | ) | (71,548 | ) | ||||||
| Investment plan expenses | (13,384 | ) | (17,180 | ) | (17,697 | ) | ||||||
| Contractors | (78,825 | ) | (72,348 | ) | (66,051 | ) | ||||||
| Mining concessions | (8,168 | ) | (7,802 | ) | (7,313 | ) | ||||||
| Operations transport | (64,352 | ) | (69,052 | ) | (59,399 | ) | ||||||
| Freight and product transport costs | (43,510 | ) | (55,383 | ) | (64,857 | ) | ||||||
| Purchase of products from third parties | (239,781 | ) | (208,147 | ) | (211,928 | ) | ||||||
| Insurance | (9,816 | ) | (10,255 | ) | (12,033 | ) | ||||||
| CORFO rights | (182,954 | ) | (46,274 | ) | (41,962 | ) | ||||||
| Export costs | (84,816 | ) | (83,057 | ) | (105,307 | ) | ||||||
| Variation in inventory | 11,600 | (90,998 | ) | (10,774 | ) | |||||||
| Other expenses, by nature | (9,915 | ) | (14,034 | ) | (4,818 | ) | ||||||
| Total | (1,483,524 | ) | (1,394,822 | ) | (1,328,285 | ) | ||||||
| F- 187 |
Notes to the Consolidated Financial Statements as of December 31, 2018
| Note 25 | Gains (losses) from operating activities in the statement of income by function of expenses, included according to their nature (continued) |
| 25.3 | Other income |
| 12/31/2018 | 12/31/2017 | 12/31/2016 | ||||||||||
| ThUS$ | ThUS$ | ThUS$ | ||||||||||
| Discounts obtained from suppliers | 705 | 345 | 771 | |||||||||
| Fines charged to suppliers | 698 | 199 | 358 | |||||||||
| Taxes recovered | 685 | 1,278 | 657 | |||||||||
| Amounts recovered from insurance | 443 | 154 | 5,636 | |||||||||
| Overestimate of provisions for third-party obligations | 375 | 586 | 573 | |||||||||
| Other operating income | 1,847 | 4,543 | 2,690 | |||||||||
| Options on mining claims | 16,095 | 2,607 | 2,577 | |||||||||
| Easements, pipelines and roads | 10,806 | 4,656 | 219 | |||||||||
| Reimbursement mining licenses and notary expenses | 394 | 1,196 | 1,300 | |||||||||
| Shares obtained in junior mining companies through options | - | 2,263 | 421 | |||||||||
| Total | 32,048 | 17,827 | 15,202 | |||||||||
| 25.4 | Administrative expenses |
| 12/31/2018 | 13/31/2017 | 13/31/2016 | ||||||||||
| ThUS$ | ThUS$ | ThUS$ | ||||||||||
| Employee benefit expenses by nature | ||||||||||||
| Remuneration and benefits to employees | (63,880 | ) | (51,761 | ) | (47,192 | ) | ||||||
| Marketing costs | (3,078 | ) | (2,539 | ) | (1,535 | ) | ||||||
| Amortization expenses | (15 | ) | (8 | ) | (6 | ) | ||||||
| Entertainment expenses | (4,805 | ) | (4,781 | ) | (4,022 | ) | ||||||
| Advisory services | (12,848 | ) | (14,348 | ) | (16,474 | ) | ||||||
| Leases | (4,556 | ) | (4,097 | ) | (4,236 | ) | ||||||
| Insurance | (1,758 | ) | (1,767 | ) | (1,732 | ) | ||||||
| Office expenses | (8,165 | ) | (5,357 | ) | (5,182 | ) | ||||||
| Contractors | (5,730 | ) | (4,805 | ) | (4,329 | ) | ||||||
| Other expenses, by nature | (13,291 | ) | (11,708 | ) | (3,728 | ) | ||||||
| Total | (118,126 | ) | (101,171 | ) | (88,436 | ) |
| F- 188 |
Notes to the Consolidated Financial Statements as of December 31, 2018
| Note 25 | Gains (losses) from operating activities in the statement of income by function of expenses, included according to their nature (continued) |
| 25.5 | Other expenses by function |
| 12/31/2018 | 12/31/2017 | 12/31/2016 | ||||||||||
| ThUS$ | ThUS$ | ThUS$ | ||||||||||
| Classes of Employee Benefit Expenses | ||||||||||||
| Depreciation and amortization expense | ||||||||||||
| Depreciation of assets not in use | (59 | ) | (90 | ) | (111 | ) | ||||||
| Subtotal | (59 | ) | (90 | ) | (111 | ) | ||||||
| Impairment losses (reversals of impairment losses) recognized in profit (loss) for the year | ||||||||||||
| Amortization expense intangible | (1,649 | ) | - | - | ||||||||
| Subtotal | (1,649 | ) | - | - | ||||||||
| Other expenses, by nature | ||||||||||||
| Legal expenses | (15,139 | ) | (25,176 | ) | (5,737 | ) | ||||||
| VAT and other unrecoverable taxes | (1,187 | ) | (1,295 | ) | (1,015 | ) | ||||||
| Fines paid | (965 | ) | (1,112 | ) | (31,867 | ) | ||||||
| Investment plan expenses | (13,419 | ) | (10,006 | ) | (6,657 | ) | ||||||
| Donations not accepted as tax credit | (4,502 | ) | (5,527 | ) | (1,692 | ) | ||||||
| Reorganization of related businesses | 6,000 | (6,000 | ) | - | ||||||||
| Expenses to cease operations | - | - | (32,061 | ) | ||||||||
| Other operating expenses | (7,636 | ) | (4,394 | ) | (3,393 | ) | ||||||
| Subtotal | (35,199 | ) | (53,510 | ) | (82,422 | ) | ||||||
| Total | (36,907 | ) | (53,600 | ) | (82,533 | ) | ||||||
| 25.6 | Other gains (losses) |
| 12/31/2018 | 12/31/2017 | 12/31/2016 | ||||||||||
| ThUS$ | ThUS$ | ThUS$ | ||||||||||
| Adjust previous year application method of participation | (664 | ) | 500 | (721 | ) | |||||||
| Impairment of interests in joint ventures (1) | (8,802 | ) | - | - | ||||||||
| Sales of investments (2) | 13,748 | - | 7,636 | |||||||||
| Others | 2,122 | 43 | (6,236 | ) | ||||||||
| Total | 6,404 | 543 | 679 | |||||||||
| (1) | See Note 10.2. |
| (2) | During the month of December 2018, SQM S.A. sold its interest in Minera Exar S.A. generating a pre-tax profit of ThUS$14,507. |
| F- 189 |
Notes to the Consolidated Financial Statements as of December 31, 2018
| Note 25 | Gains (losses) from operating activities in the statement of income by function of expenses, included according to their nature (continued) |
| 25.7 | Impairment of gains and reversal of impairment losses |
| 12/31/2018 | 12/31/2017 | 12/31/2016 | ||||||||||
| ThUS$ | ThUS$ | ThUS$ | ||||||||||
| Net impairment gains on reversal (losses) of financial assets | 2,967 | (8,038 | ) | (7,198 | ) | |||||||
| Total | 2,967 | (8,038 | ) | (7,198 | ) | |||||||
| 25.8 | Summary of expenses by nature |
| January to December | ||||||||||||
| 2018 | 2017 | 2016 | ||||||||||
| ThUS$ | ThUS$ | ThUS$ | ||||||||||
| Raw materials and consumables | (260,863 | ) | (227,620 | ) | (208,697 | ) | ||||||
| Classes of Employee Benefit Expenses | ||||||||||||
| Personnel expenses | (267,449 | ) | (223,845 | ) | (209,527 | ) | ||||||
| Depreciation and amortization expense | ||||||||||||
| Depreciation expense | (212,641 | ) | (232,365 | ) | (271,239 | ) | ||||||
| Amortization expense | (8,858 | ) | (8,161 | ) | (12,444 | ) | ||||||
| Operating leases | (79,951 | ) | (84,257 | ) | (75,784 | ) | ||||||
| Legal expenses | (15,139 | ) | (25,176 | ) | (5,737 | ) | ||||||
| Investment plan expenses | (26,803 | ) | (27,186 | ) | (24,354 | ) | ||||||
| Contractors | (86,313 | ) | (78,920 | ) | (72,112 | ) | ||||||
| Mining concessions | (8,168 | ) | (7,802 | ) | (7,313 | ) | ||||||
| Operation transport | (64,352 | ) | (69,052 | ) | (59,399 | ) | ||||||
| Freight and product transport costs | (43,510 | ) | (55,383 | ) | (64,857 | ) | ||||||
| Purchase of products from third parties | (239,781 | ) | (208,147 | ) | (211,928 | ) | ||||||
| Office expenses | (17,981 | ) | (15,612 | ) | (17,215 | ) | ||||||
| CORFO rights | (182,954 | ) | (46,274 | ) | (41,962 | ) | ||||||
| Export costs | (84,816 | ) | (83,057 | ) | (105,307 | ) | ||||||
| Representation expenses | (4,805 | ) | (4,781 | ) | (4,022 | ) | ||||||
| Restructuring of joint ventures | 6,000 | (6,000 | ) | - | ||||||||
| Plant suspension expenses | - | - | (32,061 | ) | ||||||||
| Consultant and advisor services | (12,848 | ) | (14,348 | ) | (16,474 | ) | ||||||
| Variation in inventory | 11,600 | (90,998 | ) | (10,774 | ) | |||||||
| Other expenses, by nature | (38,925 | ) | (40,609 | ) | (48,048 | ) | ||||||
| Other expenses by nature | (1,638,557 | ) | (1,549,593 | ) | (1,499,254 | ) | ||||||
| F- 190 |
Notes to the Consolidated Financial Statements as of December 31, 2018
| Note 25 | Gains (losses) from operating activities in the statement of income by function of expenses, included according to their nature (continued) |
| 25.9 | Finance expenses |
| January to December | ||||||||||||
| 2018 | 2017 | 2016 | ||||||||||
| ThUS$ | ThUS$ | ThUS$ | ||||||||||
| Interest expense from bank borrowings and overdrafts | (1,707 | ) | (1,650 | ) | (1,847 | ) | ||||||
| Interest expense from bonds | (55,887 | ) | (49,373 | ) | (55,563 | ) | ||||||
| Interest expense from loans | (3,093 | ) | (2,002 | ) | (4,419 | ) | ||||||
| Capitalized interest expenses | 5,021 | 4,382 | 5,406 | |||||||||
| Financial expenses for site closure | (960 | ) | - | - | ||||||||
| Other finance costs | (3,288 | ) | (1,481 | ) | (1,075 | ) | ||||||
| Total | (59,914 | ) | (50,124 | ) | (57,498 | ) | ||||||
| F- 191 |
Notes to the Consolidated Financial Statements as of December 31, 2018
| Note 26 | Reportable segments |
| 26.1 | Reportable segments |
General information:
The Company revised its segment reporting as of December 31, 2017 and for the years ended December 31, 2017 and 2016 to make the following modifications:
1. Elimination of “Revenues from transactions with other operating segments of the same entity” amounts since the amounts presented in this line corresponded to transactions between companies within the same segment and did not represent inter-segment transactions.
2. Elimination of “Elimination of inter-segments amounts” column as this information intended to present consolidation adjustments that were not applicable for segment reporting. All the amounts presented in this column were reallocated into the “Unallocated amounts” column.
The amount of each item presented in each operating segment is equal to that reported to the highest authority that makes decisions regarding the operation, in order to decide on the allocation of resources to the defined segments and to assess its performance.
These operating segments mentioned are consistent with the way the Company is managed and how results will be reported by the Company. These segments reflect separate operating results that are regularly reviewed by the executive responsible for operational decisions in order to make decisions about the resources to be allocated to the segment and assess its performance (See Note 26.2).
The performance of each segment is measured based on net income and revenues.
Factors used to identify segments on which a report should be presented:
The segments covered in the report are strategic business units that offer different products and services. These are managed separately because each business requires different technology and marketing strategies.
Description of the types of products and services from which each reportable segment obtains its income from ordinary activities
The operating segments, which obtain income from ordinary activities, generate expenses and have its operating results reviewed on a regular basis by the highest authority who makes decisions regarding operations, relate to the following groups of products:
| 1. | Specialty plant nutrients |
| 2. | Iodine and its derivatives |
| 3. | Lithium and its derivatives |
| 4. | Industrial chemicals |
| 5. | Potassium |
| 6. | Other products and services |
Description of income sources for all the other segments
Information regarding assets, liabilities, profits and expenses that cannot be assigned to the segments indicated above, due to the nature of production processes, is included under the "Unallocated amounts” category of the disclosed information.
| F- 192 |
Notes to the Consolidated Financial Statements as of December 31, 2018
| Note 26 | Reportable segments (continued) |
| 26.1 | Reportable segments, continued |
Basis of accounting for transactions between reportable segments
Description of the nature of the differences between measurements of results of reportable segments and the result of the entity before the expense or income tax expense of incomes and discontinued operations
The information reported in the segments is extracted from the Company’s consolidated financial statements and therefore there is no need to prepare reconciliations between the data mentioned above and those reported in the respective segments, according to what is stated in paragraph 28 of IFRS 8, "Operating Segments".
For the allocation of inventory valuation costs, we identify the direct expenses (can be directly allocated to products) and the common expenses (belong to coproduction processes, for example common leaching expenses for production of Iodine and Nitrates). Direct costs are directly allocated to the product and the common costs are distributed according to percentages that consider different variables in their determination, such as margins, rotation of inventories, revenue, production and etc.
The allocation of other common costs that are not included in the inventory valuation process, but go straight to the cost of sales, use similar criteria: the costs associated with a product or sales in particular are assigned to that particular product or sales, and the common costs associated with different products or business lines are allocated according to the sales.
Description of the nature of the differences between measurements of assets of reportable segments and the Company´s assets
Assets are not shown classified by segments, as this information is not readily available. Some of these assets are not separable by the type of activity by which they are affected since this information is not used by management in decision-making with respect to resources to be allocated to each defined segment. All assets are disclosed in the "unallocated amounts" category.
Description of the nature of the differences between measurements of liabilities of reportable segments and the Company’s liabilities
Liabilities are not shown classified by segments, as this information is not readily available. Some of these liabilities are not separable by the type of activity by which they are affected, since this information is not used by management in decision-making regarding resources to be allocated to each defined segment. All liabilities are disclosed in the "unallocated amounts" category.
| F- 193 |
Notes to the Consolidated Financial Statements as of December 31, 2018
| Note 26 | Reportable segments (continued) |
| 26.2 | Reportable segment disclosures: |
|
Specialty
plant nutrients |
Iodine and its
derivatives |
Lithium and its
derivatives |
Industrial
chemicals |
Potassium |
Other
products and services |
Reportable
segments |
Operating
segments |
Unallocated
amounts |
Total 12/31/2018 |
|||||||||||||||||||||||||||||||
| Operating segment items | ThUS$ | ThUS$ | ThUS$ | ThUS$ | ThUS$ | ThUS$ | ThUS$ | ThUS$ | ThUS$ | ThUS$ | ||||||||||||||||||||||||||||||
| Revenue | 781,750 | 324,972 | 734,801 | 108,268 | 267,474 | 48,538 | 2,265,803 | 2,265,803 | 2,265,803 | |||||||||||||||||||||||||||||||
| Revenues from transactions with other operating segments of the same entity | - | - | - | - | - | - | - | - | - | - | ||||||||||||||||||||||||||||||
| Revenues from external customers and transactions with other operating segments of the same entity | 781,750 | 324,972 | 734,801 | 108,268 | 267,474 | 48,538 | 2,265,803 | 2,265,803 | 2,265,803 | |||||||||||||||||||||||||||||||
| Costs of sales | (613,267 | ) | (217,464 | ) | (316,875 | ) | (72,964 | ) | (217,386 | ) | (45,568 | ) | (1,483,524 | ) | (1,483,524 | ) | (1,483,524 | ) | ||||||||||||||||||||||
| Administrative expenses | - | - | - | - | - | - | - | - | (118,126 | ) | (118,126 | ) | ||||||||||||||||||||||||||||
| Interest expense | - | - | - | - | - | - | - | - | (59,914 | ) | (59,914 | ) | ||||||||||||||||||||||||||||
| Depreciation and amortization expense | (73,073 | ) | (45,280 | ) | (44,837 | ) | (16,041 | ) | (41,891 | ) | (377 | ) | (221,499 | ) | (221,499 | ) | (221,499 | ) | ||||||||||||||||||||||
| The entity’s interest in the profit or loss of associates and joint ventures accounted for by the equity method | - | - | - | - | - | - | - | - | 6,351 | 6,351 | ||||||||||||||||||||||||||||||
| Income tax expense, continuing operations | - | - | - | - | - | - | - | - | (178,975 | ) | (178,975 | ) | ||||||||||||||||||||||||||||
| Other items other than significant cash | ||||||||||||||||||||||||||||||||||||||||
| Income (loss) before taxes | 168,483 | 107,508 | 417,926 | 35,304 | 50,088 | 2,970 | 782,279 | 782,279 | (161,241 | ) | 621,038 | |||||||||||||||||||||||||||||
| Net income (loss) from continuing operations | 168,483 | 107,508 | 417,926 | 35,304 | 50,088 | 2,970 | 782,279 | 782,279 | (340,216 | ) | 442,063 | |||||||||||||||||||||||||||||
| Net income (loss) from discontinued operations | ||||||||||||||||||||||||||||||||||||||||
| Net income (loss) | 168,483 | 107,508 | 417,926 | 35,304 | 50,088 | 2,970 | 782,279 | 782,279 | (340,216 | ) | 442,063 | |||||||||||||||||||||||||||||
| Assets | - | - | - | - | - | - | - | - | 4,268,094 | 4,268,094 | ||||||||||||||||||||||||||||||
| Equity-accounted investees | - | - | - | - | - | - | - | - | 111,549 | 111,549 | ||||||||||||||||||||||||||||||
| Incorporation of non-current assets other than financial instruments, deferred tax assets, net defined benefit assets and rights arising from insurance contracts | (15,028 | ) | (15,028 | ) | ||||||||||||||||||||||||||||||||||||
| Increase of non-current assets | - | - | - | - | - | - | - | - | ||||||||||||||||||||||||||||||||
| Liabilities | - | - | - | - | - | - | - | - | 2,130,291 | 2,130,291 | ||||||||||||||||||||||||||||||
| Impairment loss recognized in profit or loss | (2,227 | ) | (1,171 | ) | (243 | ) | (79 | ) | (3,006 | ) | (553 | ) | (7,279 | ) | (7,279 | ) | 2,985 | (4,294 | ) | |||||||||||||||||||||
| Reversal of impairment losses recognized in profit or loss for the period | - | - | - | - | - | - | - | - | - | - | ||||||||||||||||||||||||||||||
| Cash flows from (used in) operating activities | - | - | - | - | - | - | - | - | 524,1839 | 524,839 | ||||||||||||||||||||||||||||||
| Cash flows from (used in) investing activities | - | - | - | - | - | - | - | - | (187,004 | ) | (187,004 | ) | ||||||||||||||||||||||||||||
| Cash flows from (used in) financing activities | - | - | - | - | - | - | - | - | (387,313 | ) | (387,313 | ) | ||||||||||||||||||||||||||||
| F- 194 |
Notes to the Consolidated Financial Statements as of December 31, 2018
| Note 26 | Reportable segments (continued) |
| 26.2 | Reportable segment disclosures, continued |
|
Specialty
plant nutrients |
Iodine and its
derivatives |
Lithium and its
derivatives |
Industrial
chemicals |
Potassium |
Other
products and services |
Reportable
segments |
Operating
segments |
Unallocated
amounts |
Total 12/31/2017 |
|||||||||||||||||||||||||||||||
| Operating segment items | ThUS$ | ThUS$ | ThUS$ | ThUS$ | ThUS$ | ThUS$ | ThUS$ | ThUS$ | ThUS$ | ThUS$ | ||||||||||||||||||||||||||||||
| Revenue | 697,251 | 252,123 | 644,573 | 135,578 | 379,326 | 48,472 | 2,157,323 | 2,157,323 | - | 2,157,323 | ||||||||||||||||||||||||||||||
| Revenues from transactions with other operating segments of the same entity | - | - | - | - | - | - | - | - | - | - | ||||||||||||||||||||||||||||||
| Revenues from external customers and transactions with other operating segments of the same entity | 697,251 | 252,123 | 644,573 | 135,578 | 379,326 | 48,472 | 2,157,323 | 2,157,323 | - | 2,157,323 | ||||||||||||||||||||||||||||||
| Costs of sales | (555,356 | ) | (199,808 | ) | (189,242 | ) | (91,753 | ) | (313,690 | ) | (44,973 | ) | (1,394,822 | ) | (1,394,822 | ) | - | (1,394,822 | ) | |||||||||||||||||||||
| Administrative expenses | - | - | - | - | - | - | - | - | (101,171 | ) | (101,171 | ) | ||||||||||||||||||||||||||||
| Interest expense | - | - | - | - | - | - | - | - | (50,124 | ) | (50,124 | ) | ||||||||||||||||||||||||||||
| Depreciation and amortization expense | (73,702 | ) | (44,252 | ) | (18,036 | ) | (16,050 | ) | (88,130 | ) | (356 | ) | (240,526 | ) | (240,526 | ) | - | (240,526 | ) | |||||||||||||||||||||
| The entity’s interest in the profit or loss of associates and joint ventures accounted for by the equity method | - | - | - | - | - | - | - | - | 14,452 | 14,452 | ||||||||||||||||||||||||||||||
| Income tax expense, continuing operations | - | - | - | - | - | - | - | - | (166,173 | ) | (166,173 | ) | ||||||||||||||||||||||||||||
| Other items other than significant cash | ||||||||||||||||||||||||||||||||||||||||
| Income (loss) before taxes | 141,895 | 52,315 | 455,331 | 43,825 | 65,636 | 3,499 | 762,501 | 762,501 | (167,911 | ) | 594,590 | |||||||||||||||||||||||||||||
| Net income (loss) from continuing operations | 141,895 | 52,315 | 455,331 | 43,825 | 65,636 | 3,499 | 762,501 | 762,501 | (334,084 | ) | 428,417 | |||||||||||||||||||||||||||||
| Net income (loss) from discontinued operations | ||||||||||||||||||||||||||||||||||||||||
| Net income (loss) | 141,895 | 52,315 | 455,331 | 43,825 | 65,636 | 3,499 | 762,501 | 762,501 | (334,084 | ) | 428,417 | |||||||||||||||||||||||||||||
| Assets | - | - | - | - | - | - | - | - | 4,296,236 | 4,296,236 | ||||||||||||||||||||||||||||||
| Equity-accounted investees | - | - | - | - | - | - | - | - | 152,630 | 152,630 | ||||||||||||||||||||||||||||||
| Incorporation of non-current assets other than financial instruments, deferred tax assets, net defined benefit assets and rights arising from insurance contracts | - | - | ||||||||||||||||||||||||||||||||||||||
| Increase of non-current assets | - | - | - | - | - | - | - | - | - | - | ||||||||||||||||||||||||||||||
| Liabilities | - | - | - | - | - | - | - | - | 2,048,768 | 2,048,768 | ||||||||||||||||||||||||||||||
| Impairment loss recognized in profit or loss | (15,025 | ) | 335 | 1,112 | (3,546 | ) | (240 | ) | (219 | ) | (17,583 | ) | (17,583 | ) | (14,316 | ) | (31,899 | ) | ||||||||||||||||||||||
| Reversal of impairment losses recognized in profit or loss for the period | - | - | - | - | - | - | - | - | - | - | ||||||||||||||||||||||||||||||
| Cash flows from (used in) operating activities | - | - | - | - | - | - | - | - | 758,272 | 758,272 | ||||||||||||||||||||||||||||||
| Cash flows from (used in) investing activities | - | - | - | - | - | - | - | - | (248,067 | ) | (248,067 | ) | ||||||||||||||||||||||||||||
| Cash flows from (used in) financing activities | - | - | - | - | - | - | - | - | (411,920 | ) | (411,920 | ) | ||||||||||||||||||||||||||||
| F- 195 |
Notes to the Consolidated Financial Statements as of December 31, 2018
| Note 26 | Reportable segments (continued) |
| 26.2 | Reportable segment disclosures, continued |
| 12/31/2016 | ||||||||||||||||||||||||||||||||||||||||
|
Specialty plant
nutrients |
Iodine and its
derivatives |
Lithium and its
derivatives |
Industrial
chemicals |
Potassium |
Other products
and services |
Reportable
segments |
Operating
segments |
Unallocated
amounts |
Total 12/31/2016 |
|||||||||||||||||||||||||||||||
| Operating segment items | ThUS$ | ThUS$ | ThUS$ | ThUS$ | ThUS$ | ThUS$ | ThUS$ | ThUS$ | ThUS$ | ThUS$ | ||||||||||||||||||||||||||||||
| Revenue | 623,853 | 231,144 | 514,627 | 104,137 | 403,323 | 62,238 | 1,939,322 | 1,939,322 | - | 1,939,322 | ||||||||||||||||||||||||||||||
| Revenues from transactions with other operating segments of the same entity | - | - | - | - | - | - | - | - | - | - | ||||||||||||||||||||||||||||||
| Revenues from external customers and transactions with other operating segments of the same entity | 623,853 | 231,144 | 514,627 | 104,137 | 403,323 | 62,238 | 1,939,322 | 1,939,322 | - | 1,939,322 | ||||||||||||||||||||||||||||||
| Costs of sales | (478,074 | ) | (191,298 | ) | (175,616 | ) | (67,378 | ) | (359,477 | ) | (56,442 | ) | (1,328,285 | ) | (1,328,285 | ) | - | (1,328,285 | ) | |||||||||||||||||||||
| Administrative expenses | - | - | - | - | - | - | - | - | (88,436 | ) | (88,436 | ) | ||||||||||||||||||||||||||||
| Interest expense | - | - | - | - | - | - | - | - | (57,498 | ) | (57,498 | ) | ||||||||||||||||||||||||||||
| Depreciation and amortization expense | (89,864 | ) | (35,958 | ) | (33,010 | ) | (12,666 | ) | (67,571 | ) | (10,612 | ) | (249,681 | ) | (249,681 | ) | (111 | ) | (249,792 | ) | ||||||||||||||||||||
| The entity’s interest in the profit or loss of associates and joint ventures accounted for by the equity method | - | - | - | - | - | - | - | - | 13,047 | 13,047 | ||||||||||||||||||||||||||||||
| Income tax expense, continuing operations | - | - | - | - | - | - | - | - | (132,965 | ) | (132,965 | ) | ||||||||||||||||||||||||||||
| Other items other than significant cash | - | - | - | - | - | - | - | - | - | - | ||||||||||||||||||||||||||||||
| Income (loss) before taxes | 145,779 | 39,846 | 339,011 | 36,759 | 43,846 | 5,796 | 611,037 | 611,037 | (196,148 | ) | 414,889 | |||||||||||||||||||||||||||||
| Net income (loss) from continuing operations | 145,779 | 39,846 | 339,011 | 36,759 | 43,846 | 5,796 | 611,037 | 611,037 | (329,113 | ) | 281,924 | |||||||||||||||||||||||||||||
| Net income (loss) from discontinued operations | ||||||||||||||||||||||||||||||||||||||||
| Net income (loss) | 145,779 | 39,846 | 339,011 | 36,759 | 43,846 | 5,796 | 611,037 | 611,037 | (329,113 | ) | 281,924 | |||||||||||||||||||||||||||||
| Assets | - | - | - | - | - | - | - | - | 4,217,980 | 4,217,980 | ||||||||||||||||||||||||||||||
| Equity-accounted investees | - | - | - | - | - | - | - | - | 133,140 | 133,140 | ||||||||||||||||||||||||||||||
| Increase of non-current assets | - | - | - | - | - | - | - | - | (107,268 | ) | (107,268 | ) | ||||||||||||||||||||||||||||
| Liabilities | - | - | - | - | - | - | - | - | 1,910,708 | 1,910,708 | ||||||||||||||||||||||||||||||
| Impairment loss recognized in profit or loss | - | - | (251 | ) | - | - | (698 | ) | (949 | ) | (949 | ) | (39,595 | ) | (40,544 | ) | ||||||||||||||||||||||||
| Reversal of impairment losses recognized in profit or loss for the period | 133 | 325 | - | 233 | 2,216 | - | 2,907 | 2907 | - | 2,907 | ||||||||||||||||||||||||||||||
| F- 196 |
Notes to the Consolidated Financial Statements as of December 31, 2018
| Note 26 | Reportable segments (continued) |
| 26.3 | Statement of comprehensive income classified by reportable segments based on groups of products |
| 12/31/2018 | ||||||||||||||||||||||||||||||||
| Items in the statement of comprehensive income |
Specialty
plant
ThUS$ |
Iodine
and its
ThUS$ |
Lithium
and its
ThUS$ |
Industrial
ThUS$ |
Potassium ThUS$ |
Other
products
ThUS$ |
Corporate
Unit
ThUS$ |
Total
segments and
ThUS$ |
||||||||||||||||||||||||
| Revenue | 781,750 | 324,972 | 734,801 | 108,268 | 267,474 | 48,538 | - | 2,265,803 | ||||||||||||||||||||||||
| Cost of sales | (613,267 | ) | (217,464 | ) | (316,875 | ) | (72,964 | ) | (217,386 | ) | (45,568 | ) | - | (1,483,524 | ) | |||||||||||||||||
| Gross profit | 168,483 | 107,508 | 417,926 | 35,304 | 50,088 | 2,970 | - | 782,279 | ||||||||||||||||||||||||
| Other incomes by function | - | - | - | - | - | - | 32,048 | 32,048 | ||||||||||||||||||||||||
| Administrative expenses | - | - | - | - | - | - | (118,126 | ) | (118,126 | ) | ||||||||||||||||||||||
| Other expenses by function | - | - | - | - | - | - | (36,907 | ) | (36,907 | ) | ||||||||||||||||||||||
| Deterioro de valor de ganancias y revisión de pérdidas por deterioro de valor (pérdidas por deterioro de valor) determinado de acuerdo con la NIIF 9 | - | - | - | - | - | - | 2,967 | 2,967 | ||||||||||||||||||||||||
| Other gains (losses) | - | - | - | - | - | - | 6,404 | 6,404 | ||||||||||||||||||||||||
| Financial income | - | - | - | - | - | - | 22,533 | 22,533 | ||||||||||||||||||||||||
| Financial costs | - | - | - | - | - | - | (59,914 | ) | (59,914 | ) | ||||||||||||||||||||||
| interest in the profit or loss of associates and joint ventures accounted for by the equity method | - | - | - | - | - | - | 6,351 | 6,351 | ||||||||||||||||||||||||
| Exchange differences | - | - | - | - | - | - | (16,597 | ) | (16,597 | ) | ||||||||||||||||||||||
| Profit (loss) before taxes | 168,483 | 107,508 | 417,926 | 35,304 | 50,088 | 2,970 | (161,241 | ) | 621,038 | |||||||||||||||||||||||
| Income tax expense | - | - | - | - | - | - | (178,975 | ) | (178,975 | ) | ||||||||||||||||||||||
| Profit (loss) from continuing operations | 168,483 | 107,508 | 417,926 | 35,304 | 50,088 | 2,970 | (340,216 | ) | 442,063 | |||||||||||||||||||||||
| Profit (loss) from discontinued operations | - | - | - | - | - | - | - | - | ||||||||||||||||||||||||
| Profit (loss) | 168,483 | 107,508 | 417,926 | 35,304 | 50,088 | 2,970 | (340,216 | ) | 442,063 | |||||||||||||||||||||||
| Profit (loss), attributable to | ||||||||||||||||||||||||||||||||
| Profit (loss) attributable to the controller´s owners | - | - | - | - | - | - | - | 439,830 | ||||||||||||||||||||||||
| Profit (loss) attributable to the non-controllers | - | - | - | - | - | - | - | 2,233 | ||||||||||||||||||||||||
| Profit (loss) | - | - | - | - | - | - | - | 442,063 | ||||||||||||||||||||||||
| F- 197 |
Notes to the Consolidated Financial Statements as of December 31, 2018
| Note 26 | Reportable segments (continued) |
| 26.3 | Statement of comprehensive income classified by reportable segments based on groups of products, continued |
| 12/31/2017 | ||||||||||||||||||||||||||||||||
| Items in the statement of comprehensive income |
Specialty
plant
ThUS$ |
Iodine
and its
ThUS$ |
Lithium
and its
ThUS$ |
Industrial
ThUS$ |
Potassium ThUS$ |
Other
ThUS$ |
Corporate Unit ThUS$ |
Total
segments and
ThUS$ |
||||||||||||||||||||||||
| Revenue | 697,251 | 252,123 | 644,573 | 135,578 | 379,326 | 48,472 | - | 2,157,323 | ||||||||||||||||||||||||
| Cost of sales | (555,356 | ) | (199,808 | ) | (189,242 | ) | (91,753 | ) | (313,690 | ) | (44,973 | ) | - | (1,394,822 | ) | |||||||||||||||||
| Gross profit | 141,895 | 52,315 | 455,331 | 43,825 | 65,636 | 3,499 | - | 762,501 | ||||||||||||||||||||||||
| Other incomes by function | - | - | - | - | - | - | 17,827 | 17,827 | ||||||||||||||||||||||||
| Administrative expenses | - | - | - | - | - | - | (101,171 | ) | (101,171 | ) | ||||||||||||||||||||||
| Other expenses by function | - | - | - | - | - | - | (53,600 | ) | (53,600 | ) | ||||||||||||||||||||||
| Other gains (losses) | - | - | - | - | - | - | 543 | 543 | ||||||||||||||||||||||||
| Financial income | - | - | - | - | - | - | 13,499 | 13,499 | ||||||||||||||||||||||||
| Financial costs | - | - | - | - | - | - | (50,124 | ) | (50,124 | ) | ||||||||||||||||||||||
| Deterioro de valor de ganancias y revisión de pérdidas por deterioro de valor (pérdidas por deterioro de valor) determinado de acuerdo con la NIIF 9 | - | - | - | - | - | - | (8,038 | ) | (8,038 | ) | ||||||||||||||||||||||
| interest in the profit or loss of associates and joint ventures accounted for by the equity method | - | - | - | - | - | - | 14,452 | 14,452 | ||||||||||||||||||||||||
| Exchange differences | - | - | - | - | - | - | (1,299 | ) | (1,299 | ) | ||||||||||||||||||||||
| Profit (loss) before taxes | 141,895 | 52,315 | 455,331 | 43,825 | 65,636 | 3,499 | (167,911 | ) | 594,590 | |||||||||||||||||||||||
| Income tax expense | - | - | - | - | - | - | (166,173 | ) | (166,173 | ) | ||||||||||||||||||||||
| Profit (loss) from continuing operations | 141,895 | 52,315 | 455,331 | 43,825 | 65,636 | 3,499 | (334,084 | ) | 428,417 | |||||||||||||||||||||||
| Profit (loss) from discontinued operations | - | - | - | - | - | - | - | - | ||||||||||||||||||||||||
| Profit (loss) | 141,895 | 52,315 | 455,331 | 43,825 | 65,636 | 3,499 | (334,084 | ) | 428,417 | |||||||||||||||||||||||
| Profit (loss), attributable to | - | - | - | - | - | - | - | - | ||||||||||||||||||||||||
| Profit (loss) attributable to the controller´s owners | - | - | - | - | - | - | - | 427,697 | ||||||||||||||||||||||||
| Profit (loss) attributable to the non-controllers | - | - | - | - | - | - | - | 720 | ||||||||||||||||||||||||
| Profit (loss) | - | - | - | - | - | - | - | 428,417 | ||||||||||||||||||||||||
| F- 198 |
Notes to the Consolidated Financial Statements as of December 31, 2018
| Note 26 | Reportable segments (continued) |
| 26.3 | Statement of comprehensive income classified by reportable segments based on groups of products, continued |
| 12/31/2016 | ||||||||||||||||||||||||||||||||
| Items in the statement of comprehensive income |
Specialty
plant
ThUS$ |
Iodine
and its
ThUS$ |
Lithium
and its
ThUS$ |
Industrial
ThUS$ |
Potassium ThUS$ |
Other
products
ThUS$ |
Corporate
Unit
ThUS$ |
Total
segments and
ThUS$ |
||||||||||||||||||||||||
| Revenue | 623,853 | 231,144 | 514,627 | 104,137 | 403,323 | 62,238 | - | 1,939,322 | ||||||||||||||||||||||||
| Cost of sales | (478,074 | ) | (191,298 | ) | (175,616 | ) | (67,378 | ) | (359,477 | ) | (56,442 | ) | - | (1,328,285 | ) | |||||||||||||||||
| Gross profit | 145,779 | 39,846 | 339,011 | 36,759 | 43,846 | 5,796 | - | 611,037 | ||||||||||||||||||||||||
| Other incomes by function | - | - | - | - | - | - | 15,202 | 15,202 | ||||||||||||||||||||||||
| Administrative expenses | - | - | - | - | - | - | (88,436 | ) | (88,436 | ) | ||||||||||||||||||||||
| Other expenses by function | - | - | - | - | - | - | (82,533 | ) | (82,533 | ) | ||||||||||||||||||||||
| Other gains (losses) | - | - | - | - | - | - | 679 | 679 | ||||||||||||||||||||||||
| Financial income | - | - | - | - | - | - | 10,129 | 10,129 | ||||||||||||||||||||||||
| Financial costs | - | - | - | - | - | - | (57,498 | ) | (57,498 | ) | ||||||||||||||||||||||
| Deterioro de valor de ganancias y revisión de pérdidas por deterioro de valor (pérdidas por deterioro de valor) determinado de acuerdo con la NIIF 9 | - | - | - | - | - | - | 7,198 | 7,198 | ||||||||||||||||||||||||
| interest in the profit or loss of associates and joint ventures accounted for by the equity method | - | - | - | - | - | - | 13,047 | 13,047 | ||||||||||||||||||||||||
| Exchange differences | - | - | - | - | - | - | 460 | 460 | ||||||||||||||||||||||||
| Profit (loss) before taxes | 145,779 | 39,846 | 339,011 | 36,759 | 43,846 | 5,796 | (196,148 | ) | 414,889 | |||||||||||||||||||||||
| Income tax expense | - | - | - | - | - | - | (132,965 | ) | (132,965 | ) | ||||||||||||||||||||||
| Profit (loss) from continuing operations | 145,779 | 39,846 | 339,011 | 36,759 | 43,846 | 5,796 | (329,113 | ) | 281,924 | |||||||||||||||||||||||
| Profit (loss) from discontinued operations | - | - | - | - | - | - | - | - | ||||||||||||||||||||||||
| Profit (loss) | 145,779 | 39,846 | 339,011 | 36,759 | 43,846 | 5,796 | (329,113 | ) | 281,924 | |||||||||||||||||||||||
| Profit (loss), attributable to | ||||||||||||||||||||||||||||||||
| Profit (loss) attributable to the controller´s owners | - | - | - | - | - | - | - | 278,290 | ||||||||||||||||||||||||
| Profit (loss) attributable to the non-controllers | - | - | - | - | - | - | - | 3,634 | ||||||||||||||||||||||||
| Profit (loss) | - | - | - | - | - | - | - | 281,924 | ||||||||||||||||||||||||
| F- 199 |
Notes to the Consolidated Financial Statements as of December 31, 2018
| Note 26 | Reportable segments (continued) |
| 26.4 | Disclosures on geographical areas |
As indicated in paragraph 33 of IFRS 8, the entity discloses geographical information on its revenue from operating activities with external customers and from non-current assets that are not financial instruments, deferred income tax assets, assets related to post-employment benefits.
| 26.5 | Disclosures on main customers |
With respect to the degree of dependency of the Company on its customers, in accordance with paragraph N° 34 of IFRS N° 8, the Company has no external customers who individually represent 10% or more of its revenue. Credit risk concentrations with respect to trade and other accounts receivable are limited due to the significant number of entities in the Company’s portfolio and its worldwide distribution.
The Company’s policy requires guarantees (such as letters of credit, guarantee clauses and others) and/or to maintain insurance policies for certain accounts as deemed necessary by the Company's Management.
| F- 200 |
Notes to the Consolidated Financial Statements as of December 31, 2018
| Note 26 | Reportable segments (continued) |
| 26.6 | Segments by geographical areas as of December 31, 2018, 2017 and 2016 |
| 12/31/2018 | ||||||||||||||||||||||||
| Items |
Chile ThUS$ |
Latin
America and
ThUS$ |
Europe ThUS$ |
North
America
ThUS$ |
Asia
and others
ThUS$ |
Total ThUS$ |
||||||||||||||||||
| Revenue | 189,349 | 180,189 | 479,664 | 471,515 | 945,086 | 2,265,803 | ||||||||||||||||||
| Investment accounted for under the equity method | (6,588 | ) | - | 61,256 | 16,115 | 40,766 | 111,549 | |||||||||||||||||
| Intangible assets other than goodwill | 110,544 | - | 386 | 152 | 77,201 | 188,283 | ||||||||||||||||||
| Goodwill | 22,535 | 86 | 11,373 | 724 | - | 34,718 | ||||||||||||||||||
| Property, plant and equipment, net | 1,445,349 | 347 | 4,451 | 3,098 | 1,578 | 1,454,823 | ||||||||||||||||||
| Investment property | - | - | - | - | - | - | ||||||||||||||||||
| Other non-current assets | 17,111 | 23 | - | (892 | ) | 11,298 | 27,540 | |||||||||||||||||
| Non-current assets that are not financial instruments | 1,588,951 | 456 | 77,466 | 19,197 | 130,843 | 1,816,913 | ||||||||||||||||||
| 12/31/2017 | ||||||||||||||||||||||||
| Items |
Chile ThUS$ |
Latin America and
ThUS$ |
Europe ThUS$ |
North America
ThUS$ |
Asia and others
ThUS$ |
Total ThUS$ |
||||||||||||||||||
| Revenue | 140,764 | 228,759 | 1,048,556 | 441,377 | 297,867 | 2,157,323 | ||||||||||||||||||
| Investment accounted for under the equity method | (5,513 | ) | 33,065 | 33,318 | 15,193 | 76,567 | 152,630 | |||||||||||||||||
| Intangible assets other than goodwill | 113,152 | - | 453 | 182 | - | 113,787 | ||||||||||||||||||
| Goodwill | 23,731 | 6,290 | 11,374 | 724 | 2,058 | 44,177 | ||||||||||||||||||
| Property, plant and equipment, net | 1,421,141 | 313 | 3,857 | 2,469 | 1,574 | 1,429,354 | ||||||||||||||||||
| Investment property | - | - | - | - | - | - | ||||||||||||||||||
| Other non-current assets | 19,234 | 28 | - | - | - | 19,262 | ||||||||||||||||||
| Non-current assets that are not financial instruments | 1,571,745 | 39,696 | 49,002 | 18,568 | 80,199 | 1,759,210 | ||||||||||||||||||
| 12/31/2016 | ||||||||||||||||||||||||
| Items |
Chile ThUS$ |
Latin
America and
ThUS$ |
Europe ThUS$ |
North
America
ThUS$ |
Asia
and others
ThUS$ |
Total ThUS$ |
||||||||||||||||||
| Revenue | 162,477 | 240,607 | 411,807 | 416,380 | 708,051 | 1,939,323 | ||||||||||||||||||
| Investment accounted for under the equity method | - | 5,000 | 25,009 | 13,456 | 69,675 | 113,140 | ||||||||||||||||||
| Intangible assets other than goodwill | 109,227 | - | - | 211 | 1 | 109,439 | ||||||||||||||||||
| Goodwill | 23,731 | 86 | 11,373 | 724 | 2,058 | 37,972 | ||||||||||||||||||
| Property, plant and equipment, net | 1,526,992 | 234 | 3,521 | 2,536 | 1,483 | 1,534,766 | ||||||||||||||||||
| Investment property | - | - | - | - | - | - | ||||||||||||||||||
| Other non-current assets | 24,551 | 139 | - | - | - | 24,690 | ||||||||||||||||||
| Non-current assets that are not financial instruments | 1,684,501 | 5,459 | 39,903 | 16,927 | 73,217 | 1,820,007 | ||||||||||||||||||
| F- 201 |
Notes to the Consolidated Financial Statements as of December 31, 2018
| Note 26 | Reportable segments (continued) |
| 26.7 | Property, plant and equipment classified by geographical areas |
The company's main production facilities are located near their mines and extraction facilities in northern Chile. The following table presents the main production facilities as of December 31, 2018 and December 31, 2017:
| Location | Products | ||
| - | Pedro de Valdivia | : | Production of iodine and nitrate salts |
| - | María Elena | : | Production of iodine and nitrate salts |
| - | Coya Sur | : | Production of nitrate salts |
| - | Nueva Victoria | : | Production of iodine and nitrate salts |
| - | Salar de Atacama | : | Potassium chloride, lithium chloride, boric acid and potassium sulfate |
| - | Salar del Carmen | : | Production of lithium carbonate and lithium hydroxide |
| - | Tocopilla | : | Port facilities |
| F- 202 |
Notes to the Consolidated Financial Statements as of December 31, 2018
| Note 27 | Borrowing costs |
The cost of interest is recognized as an expense in the year in which it is incurred, except for interest that is directly related to the acquisition and construction of tangible property, plant and equipment assets and that complies with the requirements of IAS 23. As of December 31, 2018, total interest expenses incurred amount to ThUS$59,914 (ThUS$50,124 as of December 31, 2017).
The Company capitalizes all interest costs directly related to the construction or to the acquisition of property, plant and equipment, which require a substantial time to be suitable for use.
| 27.1 | Costs of capitalized interest, property, plant and equipment |
The cost of capitalized interest is determined by applying the average or weighted average of all financing costs incurred by the Company to the monthly end balances of works-in-progress meeting the requirements of IAS 23.
The rates and costs for capitalized interest of property, plant and equipment are detailed as follows:
| 12/31/2018 | 12/31/2017 | |||||||
| Capitalization rate of costs for capitalized interest, property, plant and equipment | 4 | % | 4 | % | ||||
| Amount of costs for interest capitalized in ThUS$ | 5,021 | 4,382 |
| F- 203 |
Notes to the Consolidated Financial Statements as of December 31, 2018
| Note 28 | Effect of fluctuations in foreign currency exchange rates |
| a) | Foreign currency exchange differences recognized in profit or loss except for financial instruments measured at fair value through profit or loss: |
|
12/31/2018 ThUS$ |
12/31/2017 ThUS$ |
12/31/2016 ThUS$ |
||||||||||
| Conversion foreign exchange gains (losses) recognized in the result of the year. | (16,597 | ) | (1,299 | ) | 460 | |||||||
| Conversion foreign exchange reserves attributable to the owners of the controlling entity. | (1,394 | ) | (5,450 | ) | (5,428 | ) | ||||||
| Conversion foreign exchange reserves attributable to the non-controlling entity. | 168 | 4 | 35 | |||||||||
| b) | Reserves for foreign currency exchange differences: |
As of December 31, 2018 and 2017, foreign currency exchange differences are detailed as follows:
|
Detail |
12/31/2018 ThUS$ |
12/31/2017 ThUS$ |
12/31/2016 ThUS$ |
|||||||||
| Changes in equity generated by conversion of equity value: | ||||||||||||
| Comercial Hydro S.A. | 1,004 | 1,004 | 1,004 | |||||||||
| SQMC Internacional Ltda. | (17 | ) | (2 | ) | (13 | ) | ||||||
| Proinsa Ltda. | (11 | ) | (7 | ) | (10 | ) | ||||||
| Comercial Agrorama Ltda. | (21 | ) | (44 | ) | (69 | ) | ||||||
| Isapre Norte Grande Ltda. | (1 | ) | (74 | ) | (124 | ) | ||||||
| Almacenes y Depósitos Ltda. | 113 | 97 | 47 | |||||||||
| Sacal S.A. | (3 | ) | - | (29 | ) | |||||||
| Sociedad Prestadora de Servicios de Salud Cruz del Norte S.A. | (10 | ) | - | (6 | ) | |||||||
| Agrorama S.A. | 132 | (98 | ) | (49 | ) | |||||||
| Doktor Tarsa | (13,811 | ) | (14,447 | ) | (12,264 | ) | ||||||
| SQM Vitas Fzco | (2,682 | ) | (1,779 | ) | (1,801 | ) | ||||||
| Ajay Europe | (1,270 | ) | (831 | ) | (1,935 | ) | ||||||
| SQM Eastmed Turkey | (113 | ) | (92 | ) | (95 | ) | ||||||
| Charlee SQM (Thailand) Co. Ltd. | - | (285 | ) | (460 | ) | |||||||
| Coromandel SQM India | (393 | ) | (234 | ) | (282 | ) | ||||||
| SQM Italia SRL | (213 | ) | (154 | ) | (287 | ) | ||||||
| SQM Oceanía Pty Ltd. | (634 | ) | (634 | ) | (634 | ) | ||||||
| SQM Indonesia S.A. | (124 | ) | (124 | ) | (124 | ) | ||||||
| Abu Dhabi Fertillizers Industries WWL. | (435 | ) | (435 | ) | (434 | ) | ||||||
| SQM Vitas Holland | (170 | ) | (101 | ) | (280 | ) | ||||||
| SQM Thailand Limited | (68 | ) | (68 | ) | (68 | ) | ||||||
| SQM Europe | (1,983 | ) | (1,550 | ) | (1,550 | ) | ||||||
| Minera Exar S.A. | - | (5,209 | ) | - | ||||||||
| SQM Australia Pty Ltd. | (4,222 | ) | 154 | - | ||||||||
| Pavoni & C. Spa | 70 | - | - | |||||||||
| Terra Tarsa BV | (82 | ) | - | - | ||||||||
| Plantacote NV | (34 | ) | - | - | ||||||||
| Doktolab Tarim Arastirma San. | (29 | ) | - | - | ||||||||
| Kore Potash PLC (a) | (1,206 | ) | - | - | ||||||||
| SQM Colombia SAS | (94 | ) | - | - | ||||||||
| Total | (26,307 | ) | (24,913 | ) | (19,463 | ) | ||||||
| F- 204 |
NOTES TO THE CONSOLIDATED FINANCIAL STATEMENTS AS OF DECEMBER 31, 2018
| Note 28 | Effect of fluctuations in foreign currency exchange rates (continued) |
| c) | Functional and presentation currency |
The functional currency of these companies corresponds to the currency of the country of origin of each entity, and its presentation currency is the U.S. dollar.
| d) | Reasons to use one presentation currency and a different functional currency |
| - | The total revenues of these subsidiaries are associated with the local currency. |
| - | The commercialization cost structure of these companies is affected by the local currency. |
| F- 205 |
NOTES TO THE CONSOLIDATED FINANCIAL STATEMENTS AS OF DECEMBER 31, 2018
| Note 29 | Disclosures on the effects of fluctuations in foreign currency exchange rates |
Assets held in foreign currency subject to fluctuations in exchange rates are detailed as follows:
| Class of assets | Currency |
12/31/2018 ThUS |
12/31/2017 ThUS$ |
|||||||
| Current assets: | ||||||||||
| Cash and cash equivalents | ARS | 2 | 1 | |||||||
| Cash and cash equivalents | BRL | - | 38 | |||||||
| Cash and cash equivalents | CLP | 157,500 | 579 | |||||||
| Cash and cash equivalents | CNY | 2,305 | 1,143 | |||||||
| Cash and cash equivalents | EUR | 4,738 | 9,782 | |||||||
| Cash and cash equivalents | GBP | - | 55 | |||||||
| Cash and cash equivalents | AUD | 29,598 | - | |||||||
| Cash and cash equivalents | MXN | 1,242 | 258 | |||||||
| Cash and cash equivalents | PEN | 1 | 8 | |||||||
| Cash and cash equivalents | THB | 1 | - | |||||||
| Cash and cash equivalents | YEN | 1,786 | 1,773 | |||||||
| Cash and cash equivalents | ZAR | 5,219 | 4,074 | |||||||
| Subtotal cash and cash equivalents | 202,392 | 17,711 | ||||||||
| Other current financial assets | CLP | 20,931 | 39,126 | |||||||
| Subtotal other current financial assets | 20,931 | 39,126 | ||||||||
| Other current non-financial assets | BRL | - | 1 | |||||||
| Other current non-financial assets | ARS | 2 | - | |||||||
| Other current non-financial assets | AUD | 102 | - | |||||||
| Other current non-financial assets | COP | - | 30 | |||||||
| Other current non-financial assets | CLF | 47 | 46 | |||||||
| Other current non-financial assets | CLP | 20,276 | 12,172 | |||||||
| Other current non-financial assets | CNY | 8 | 12 | |||||||
| Other current non-financial assets | EUR | 3,153 | 235 | |||||||
| Other current non-financial assets | MXN | 3,274 | 1,429 | |||||||
| Other current non-financial assets | THB | 19 | 279 | |||||||
| Other current non-financial assets | PEN | - | 20 | |||||||
| Other current non-financial assets | YEN | 21 | 18 | |||||||
| Other current non-financial assets | ZAR | 1,547 | 2,941 | |||||||
| Subtotal other current non-financial assets | 28,449 | 17,183 | ||||||||
| Trade and other receivables | ARS | - | 6 | |||||||
| Trade and other receivables | BRL | 20 | 23 | |||||||
| Trade and other receivables | CLF | 453 | 427 | |||||||
| Trade and other receivables | CLP | 71,730 | 85,837 | |||||||
| Trade and other receivables | CNY | 11,361 | 10,426 | |||||||
| Trade and other receivables | EUR | 31,426 | 49,627 | |||||||
| Trade and other receivables | GBP | - | 90 | |||||||
| Trade and other receivables | MXN | 452 | 195 | |||||||
| Trade and other receivables | AED | 15,841 | 546 | |||||||
| Trade and other receivables | THB | 2,970 | 791 | |||||||
| Trade and other receivables | YEN | 76,267 | 41,582 | |||||||
| Trade and other receivables | ZAR | 571 | 23,825 | |||||||
| Subtotal trade and other receivables | 211,091 | 213,375 | ||||||||
| Receivables from related parties | EUR | 105 | 58 | |||||||
| Receivables from related parties | THB | - | 74 | |||||||
| Subtotal receivables from related parties | 105 | 132 | ||||||||
| F- 206 |
NOTES TO THE CONSOLIDATED FINANCIAL STATEMENTS AS OF DECEMBER 31, 2018
| Note 29 | Disclosures on the effects of fluctuations in foreign currency exchange rates (continued) |
| Class of assets | Currency |
12/31/2018 ThUS$ |
12/31/2017 ThUS$ |
|||||||
| Current tax assets | ARS | 2 | 4 | |||||||
| Current tax assets | CLP | 601 | 1,413 | |||||||
| Current tax assets | EUR | 3,500 | 183 | |||||||
| Current tax assets | ZAR | - | 431 | |||||||
| Current tax assets | MXN | 843 | - | |||||||
| Current tax assets | PEN | 131 | 201 | |||||||
| Subtotal current tax assets | 5,077 | 2,232 | ||||||||
| Subtotal current assets | 468,045 | 289,759 | ||||||||
| Non-current assets | ||||||||||
| Other non-current financial assets | CLP | 20 | 20 | |||||||
| Other non-current financial assets | YEN | 72 | 42 | |||||||
| Subtotal other non-current financial assets | 92 | 62 | ||||||||
| Other non-current non-financial assets | BRL | 23 | 27 | |||||||
| Other non-current non-financial assets | CLP | 758 | 822 | |||||||
| Subtotal other non-current non-financial assets | 781 | 849 | ||||||||
| Non-current right receivable | CLF | 329 | 209 | |||||||
| Non-current right receivable | COP | - | 47 | |||||||
| Non-current right receivable | CLP | 1,807 | 1,256 | |||||||
| Subtotal non-current rights receivable | 2,136 | 1,512 | ||||||||
| Equity-accounted investees | AED | 31,023 | 35,414 | |||||||
| Equity-accounted investees | EUR | 14,929 | 8,144 | |||||||
| Equity-accounted investees | INR | 1,729 | 1,632 | |||||||
| Equity-accounted investees | THB | 53 | 2,491 | |||||||
| Equity-accounted investees | TRY | 21,892 | 21,741 | |||||||
| Subtotal equity-accounted investees | 69,626 | 69,422 | ||||||||
| Intangible assets other than goodwill | CLP | 85 | 48 | |||||||
| Subtotal intangible assets other than goodwill | 85 | 48 | ||||||||
| Property, plant and equipment | CLP | 3,387 | 3,574 | |||||||
| Subtotal property, plant and equipment | 3,387 | 3,574 | ||||||||
| Total non-current assets | 76,107 | 75,467 | ||||||||
| Total assets | 544,152 | 365,226 | ||||||||
| F- 207 |
NOTES TO THE CONSOLIDATED FINANCIAL STATEMENTS AS OF DECEMBER 31, 2018
| Note 29 | Disclosures on the effects of fluctuations in foreign currency exchange rates (continued) |
Liabilities held in foreign currencies are detailed as follows:
| 12/31/2018 | 12/31/2017 | |||||||||||||||||||||||||
| Class of liability | Currency |
91 days to 1
year ThUS$ |
91 days to 1
year ThUS$ |
Total
ThUS$ |
Up to90 days
ThUS$ |
91 days to 1
year ThUS$ |
Total
ThUS$ |
|||||||||||||||||||
| Current liabilities | ||||||||||||||||||||||||||
| Other current financial liabilities | CLF | 342 | 6,256 | 6,598 | 4,947 | - | 4,947 | |||||||||||||||||||
| Other current financial liabilities | BRL | 52 | - | 52 | - | - | - | |||||||||||||||||||
| Subtotal other current financial liabilities | 394 | 6,256 | 6,650 | 4,947 | - | 4,947 | ||||||||||||||||||||
| Trade and other payables | BRL | 34 | - | 34 | 37 | - | 37 | |||||||||||||||||||
| Trade and other payables | THB | 65 | - | 65 | 91 | - | 91 | |||||||||||||||||||
| Trade and other payables | CLP | 69,789 | - | 69,789 | 61,310 | 4,361 | 65,671 | |||||||||||||||||||
| Trade and other payables | EUR | 36,439 | 36,439 | 32,896 | - | 32,896 | ||||||||||||||||||||
| Trade and other payables | GBP | - | - | - | 11 | - | 11 | |||||||||||||||||||
| Trade and other payables | INR | 1 | - | 1 | 1 | - | 1 | |||||||||||||||||||
| Trade and other payables | MXN | 7 | - | 7 | 13 | - | 13 | |||||||||||||||||||
| Trade and other payables | PEN | - | - | - | 3 | - | 3 | |||||||||||||||||||
| Trade and other payables | ZAR | 1,842 | 1,842 | 2,541 | - | 2,541 | ||||||||||||||||||||
| Subtotal trade and other payables | 108,177 | - | 108,177 | 96,903 | 4,361 | 101,264 | ||||||||||||||||||||
| Other current provisions | ARS | - | 13 | 13 | - | 12 | 12 | |||||||||||||||||||
| Other current provisions | BRL | 707 | - | 707 | 739 | - | 739 | |||||||||||||||||||
| Other current provisions | CLP | - | 64 | 64 | - | 80 | 80 | |||||||||||||||||||
| Other current provisions | EUR | 243 | - | 243 | 243 | - | 243 | |||||||||||||||||||
| Subtotal other current provisions | 950 | 77 | 1,027 | 982 | 92 | 1,074 | ||||||||||||||||||||
| Current tax liabilities | CLP | - | 31 | 31 | - | 326 | 326 | |||||||||||||||||||
| Current tax liabilities | BRL | - | 3 | 3 | - | 6 | 6 | |||||||||||||||||||
| Current tax liabilities | CNY | - | 8 | 8 | 3 | - | 3 | |||||||||||||||||||
| Current tax liabilities | EUR | 4,548 | 1,000 | 5,548 | - | 644 | 644 | |||||||||||||||||||
| Current tax liabilities | ZAR | - | 201 | 201 | 264 | - | 264 | |||||||||||||||||||
| Current tax liabilities | MXN | - | 9 | 9 | 3 | 3,071 | 3,074 | |||||||||||||||||||
| Subtotal current tax liabilities | 4,548 | 1,252 | 5,800 | 270 | 4,047 | 4,317 | ||||||||||||||||||||
| F- 208 |
NOTES TO THE CONSOLIDATED FINANCIAL STATEMENTS AS OF DECEMBER 31, 2018
| Note 29 | Disclosures on the effects of fluctuations in foreign currency exchange rates (continued) |
| 12/31/2018 | 12/31/2017 | |||||||||||||||||||||||||
| Class of liability | Currency |
Up to 90
days ThUS$ |
over 90 days
to 1 year ThUS$ |
Total
ThUS$ |
Up to 90
days ThUS$ |
Over 90 days
to 1 year ThUS$ |
Total
ThUS$ |
|||||||||||||||||||
| Other current non-financial liabilities | BRL | 3 | - | 3 | 15 | - | 15 | |||||||||||||||||||
| Other current non-financial liabilities | CLP | 7,703 | 6,431 | 14,134 | 8,708 | 1,824 | 10,532 | |||||||||||||||||||
| Other current non-financial liabilities | CNY | 11 | 40 | 51 | 7 | - | 7 | |||||||||||||||||||
| Other current non-financial liabilities | EUR | 1,053 | - | 1,053 | 2,955 | - | 2,955 | |||||||||||||||||||
| Other current non-financial liabilities | MXN | 103 | 46 | 149 | 346 | 34 | 380 | |||||||||||||||||||
| Other current non-financial liabilities | YEN | - | - | - | - | - | - | |||||||||||||||||||
| Other current non-financial liabilities | PEN | 70 | - | 70 | 70 | - | 70 | |||||||||||||||||||
| Other current non-financial liabilities | ZAR | 11 | - | 11 | 12 | - | 12 | |||||||||||||||||||
| Subtotal other current non-financial liabilities | 8,954 | 6,517 | 15,471 | 12,113 | 1,858 | 13,971 | ||||||||||||||||||||
| Total current liabilities | 123,023 | 14,102 | 137,125 | 115,215 | 10,358 | 125,573 | ||||||||||||||||||||
| F- 209 |
NOTES TO THE CONSOLIDATED FINANCIAL STATEMENTS AS OF DECEMBER 31, 2018
| Note 29 | Disclosures on the effects of fluctuations in foreign currency exchange rates (continued) |
| 12/31/2018 | ||||||||||||||||||||||||||
| Class of liability | Currency |
1 to 2
years ThUS$ |
2 to 3
years ThUS$ |
3 to 4
years ThUS$ |
4 to 5
years ThUS$ |
Over 5
years ThUS$ |
Total
ThUS$ |
|||||||||||||||||||
| Non-current liabilities | ||||||||||||||||||||||||||
| Other non-current financial liabilities | CLF | - | - | - | - | 453,818 | 453,818 | |||||||||||||||||||
| Subtotal other non-current financial liabilities | - | - | - | - | 453,818 | 453,818 | ||||||||||||||||||||
| Non-current provisions for employee benefits | CLP | - | - | - | - | 521 | 521 | |||||||||||||||||||
| Non-current provisions for employee benefits | MXN | - | - | - | - | 175 | 175 | |||||||||||||||||||
| Non-current provisions for employee benefits | YEN | - | - | - | - | 171 | 171 | |||||||||||||||||||
| Subtotal non-current provisions for employee benefits | - | - | - | - | 867 | 867 | ||||||||||||||||||||
| Total non-current liabilities | - | - | - | - | 454,685 | 454,685 | ||||||||||||||||||||
| 12/31/2017 | ||||||||||||||||||||||||||
| Class of liability | Currency |
1
to 2
ThUS$ |
2
to 3
ThUS$ |
3
to 4
ThUS$ |
4
to 5
ThUS$ |
Over
5
ThUS$ |
Total ThUS$ |
|||||||||||||||||||
| Non-current liabilities | ||||||||||||||||||||||||||
| Other non-current financial liabilities | CLF | - | - | - | - | 237,279 | 237,279 | |||||||||||||||||||
| Subtotal other non-current financial liabilities | - | - | - | - | 237,279 | 237,279 | ||||||||||||||||||||
| Non-current provisions for employee benefits | CLP | - | - | - | - | 601 | 601 | |||||||||||||||||||
| Non-current provisions for employee benefits | MXN | - | - | - | - | 65 | 65 | |||||||||||||||||||
| Non-current provisions for employee benefits | YEN | - | - | - | - | 626 | 626 | |||||||||||||||||||
| Subtotal non-current provisions for employee benefits | - | - | - | - | 1,292 | 1,292 | ||||||||||||||||||||
| Total non-current liabilities | - | - | - | - | 238,571 | 238,571 | ||||||||||||||||||||
| F- 210 |
NOTES TO THE CONSOLIDATED FINANCIAL STATEMENTS AS OF DECEMBER 31, 2018
| Note 30 | Income tax and deferred taxes |
Accounts receivable from taxes as of December 31, 2018 and December 31, 2017, are as follows:
| 30.1 | Current and non-current tax assets |
| a) | Current tax assets |
| 12/31/2018 | 12/31/2017 | |||||||
| ThUS$ | ThUS$ | |||||||
| Monthly provisional income tax payments, Chilean companies | 21,172 | 2,802 | ||||||
| Monthly provisional income tax payments, foreign companies | 5,199 | 808 | ||||||
| Corporate tax credits (1) | 1,858 | 456 | ||||||
| Taxes in recovery process | 28,881 | 28,225 | ||||||
| Total | 57,110 | 32,291 | ||||||
| b) | Non-current tax assets |
| 12/31/2018 | 12/31/2017 | |||||||
| ThUS$ | ThUS$ | |||||||
| Monthly provisional income tax payments, Chilean companies | 6,398 | 6,398 | ||||||
| Specific tax on mining activities paid (on consignment) | 25,781 | 25,781 | ||||||
| Total | 32,179 | 32,179 | ||||||
| (1) | These credits are available for Companies and are related to corporate tax payments in April of the following year. These credits include, among others, credits for training expenses (SENCE), credits for acquisition of fixed assets, donations and credits in Chile for taxes paid abroad. |
| F- 211 |
NOTES TO THE CONSOLIDATED FINANCIAL STATEMENTS AS OF DECEMBER 31, 2018
| Note 30 | Income tax and deferred taxes (continued) |
| 30.2 | Current tax liabilities |
| Current tax liabilities | 12/31/2018 | 12/31/2017 | ||||||
| ThUS$ | ThUS$ | |||||||
| 1st Category income tax | 25,163 | 45,479 | ||||||
| Foreign company income tax | 21,097 | 28,996 | ||||||
| Article 21 single tax | 1,152 | 927 | ||||||
| Total | 47,412 | 75,402 | ||||||
Income tax is calculated based on the profit or loss for tax purposes that is applied to the effective tax rate applicable in Chile. As established by Law No.20,780, a progressive income tax rate has been established, which is 27% from 2018.
The royalty is determined by applying the taxable rate to the net operating income obtained. According to the chart in force, the Company currently provisioned 5% for mining royalties that involve operations in the Salar de Atacama and 5.64% for caliche extraction operations.
The income tax rate for the main countries where the Company operates is presented below :
| Country |
Income tax 2018 |
Income tax 2017 |
||
| Spain | 25% | 25% | ||
| Belgium | 29.58% | 33.99% | ||
| Mexico | 30% | 30% | ||
| United States | 21% + 6% | 34%+6% | ||
| South Africa | 28% | 28% |
| 30.3 | Income tax and deferred taxes |
Assets and liabilities recognized in the statement of financial position are offset if and only if:
| 1 | The Company has recognized legally before the tax authority the right to offset the amounts recognized in these entries; and |
| F- 212 |
NOTES TO THE CONSOLIDATED FINANCIAL STATEMENTS AS OF DECEMBER 31, 2018
| Note 30 | Income tax and deferred taxes (continued) |
| 30.3 | Income tax and deferred taxes, continued |
| 2 | Deferred income tax assets and liabilities are derived from income tax related to the same tax authority on: |
| (i) | the same entity or tax subject; or |
| (ii) | different entities or tax subjects who intend either to settle current fiscal assets and liabilities for their net amount, or to exercise tax assets and pay liabilities simultaneously in each of the future periods in which the Company expects to settle or recover significant amounts of deferred tax assets or liabilities. |
Recognized deferred income tax assets are the income taxes that are to be recovered in future periods, related to:
| a) | deductible temporary differences. |
| b) | the offsetting of losses obtained in prior periods and not yet subject to tax deduction; and |
| c) | the offsetting of unused credits from prior periods. |
The Company recognizes a deferred tax asset when there is certainty that these can be offset with tax income from subsequent periods, losses or fiscal credits not yet used, but solely as long as it is more likely than not that there will be tax earnings in the future against which to charge these losses or unused fiscal credits.
Recognized deferred tax liabilities refer to the amounts of income taxes payable in future periods related to taxable temporary differences.
| F- 213 |
NOTES TO THE CONSOLIDATED FINANCIAL STATEMENTS AS OF DECEMBER 31, 2018
| Note 30 | Income tax and deferred taxes (continued) |
| 30.3 | Income tax and deferred taxes, continued |
| d.1) | Income tax assets and liabilities as of December 31, 2018 are detailed as follows: |
| Net liability position | ||||||||
| Description of deferred tax assets and liabilities | Assets | Liabilities | ||||||
| ThUS$ | ThUS$ | |||||||
| Unrealized loss | 75,832 | - | ||||||
| Property, plant and equipment and capitalized interest | - | (196,843 | ) | |||||
| Facility closure provision | 4,280 | - | ||||||
| Manufacturing expenses | - | (103,760 | ) | |||||
| Staff severance indemnities, unemployment insurance | - | (5,679 | ) | |||||
| Vacation accrual | 5,155 | - | ||||||
| Inventory provision | 28,155 | - | ||||||
| Materials provision | 6,239 | - | ||||||
| Forwards | 2,169 | - | ||||||
| Employee benefits | 3,309 | - | ||||||
| Research and development expenses | - | (2,216 | ) | |||||
| Accounts receivable | 4,188 | - | ||||||
| Provision for legal complaints and expenses | 4,013 | - | ||||||
| Loan approval expenses | - | (2,337 | ) | |||||
| Junior mining companies (valued based on stock price) | - | (976 | ) | |||||
| Royalty | - | (3,278 | ) | |||||
| Tax loss benefit | 1,124 | - | ||||||
| Other | 5,005 | - | ||||||
| Foreign items (other) | 259 | - | ||||||
| Balances to date | 139,728 | (315,089 | ) | |||||
| Net balance | - | (175,361 | ) | |||||
| F- 214 |
NOTES TO THE CONSOLIDATED FINANCIAL STATEMENTS AS OF DECEMBER 31, 2018
| Note 30 | Income tax and deferred taxes (continued) |
| 30.3 | Income tax and deferred taxes, continued |
| d.2) | Income tax assets and liabilities as of December 31, 2017 are detailed as follows |
| Net liability position | ||||||||
| Description of deferred tax assets and liabilities | Assets | Liabilities | ||||||
| ThUS$ | ThUS$ | |||||||
| Unrealized loss | 68,544 | - | ||||||
| Property, plant and equipment and capitalized interest | - | (211,374 | ) | |||||
| Facility closure provision | 3,469 | - | ||||||
| Manufacturing expenses | - | (102,748 | ) | |||||
| Staff severance indemnities, unemployment | - | (6,792 | ) | |||||
| Vacation accrual | 4,887 | - | ||||||
| Inventory provision | 25,172 | - | ||||||
| Materials provision | 7,107 | - | ||||||
| Forwards | 624 | - | ||||||
| Employee benefits | 2,317 | - | ||||||
| Research and development expenses | - | (3,501 | ) | |||||
| Accounts receivable | 4,253 | - | ||||||
| Provision for legal complaints and expenses | 5,243 | - | ||||||
| Loan approval expenses | - | (2,670 | ) | |||||
| Junior mining companies (valued based on stock price) | - | (2,474 | ) | |||||
| Royalty | - | (4,084 | ) | |||||
| Tax loss benefit | 1,437 | - | ||||||
| Other | 5,002 | - | ||||||
| Foreign items (other) | 305 | - | ||||||
| Balances to date | 128,360 | (333,643 | ) | |||||
| Net balance | - | (205,283 | ) | |||||
| F- 215 |
NOTES TO THE CONSOLIDATED FINANCIAL STATEMENTS AS OF DECEMBER 31, 2018
| Note 30 | Income tax and deferred taxes (continued) |
| 30.3 | Income tax and deferred taxes, continued |
| d.3) | Reconciliation of changes in deferred tax liabilities (assets) as of December 31, 2018 |
|
Deferred tax
liability (asset) at beginning of period |
Deferred tax
expense (benefit) recognized in profit (loss) for the year |
Deferred
taxes related to items credited (charged) directly to equity |
Total increases
(decreases) in deferred tax liabilities (assets) |
Deferred tax
liability (asset) at end of period |
||||||||||||||||
| ThUS$ | ThUS$ | ThUS$ | ThUS$ | ThUS$ | ||||||||||||||||
| Unrealized loss | (68,544 | ) | (7,288 | ) | - | (7,288 | ) | (75,832 | ) | |||||||||||
| Property, plant and equipment and capitalized interest | 211,374 | (14,531 | ) | - | (14,531 | ) | 196,843 | |||||||||||||
| Facility closure provision | (3,469 | ) | (811 | ) | - | (811 | ) | (4,280 | ) | |||||||||||
| Manufacturing expenses | 102,748 | 1,012 | - | 1,012 | 103,760 | |||||||||||||||
| Individual savings plans, unemployment insurance | 6,792 | (667 | ) | (446 | ) | (1,113 | ) | 5,679 | ||||||||||||
| Vacation accrual | (4,887 | ) | (268 | ) | - | (268 | ) | (5,155 | ) | |||||||||||
| Inventory provision | (25,172 | ) | (2,983 | ) | - | (2,983 | ) | (28,155 | ) | |||||||||||
| Materials provision | (7,107 | ) | 868 | - | 868 | (6,239 | ) | |||||||||||||
| Forwards | (624 | ) | (1,545 | ) | - | (1,545 | ) | (2,169 | ) | |||||||||||
| Employee benefits | (2,317 | ) | (992 | ) | - | (992 | ) | (3,309 | ) | |||||||||||
| Research and development expenses | 3,501 | (1,285 | ) | - | (1,285 | ) | 2,216 | |||||||||||||
| Accounts receivable | (4,253 | ) | 686 | (621 | ) | 65 | (4,188 | ) | ||||||||||||
| Provision for legal complaints and expenses | (5,243 | ) | 1,230 | - | 1,230 | (4,013 | ) | |||||||||||||
| Loan approval expenses | 2,670 | (333 | ) | - | (333 | ) | 2,337 | |||||||||||||
| Junior mining companies (valued based on stock price) | 2,474 | - | (1,498 | ) | (1,498 | ) | 976 | |||||||||||||
| Royalty | 4,084 | (795 | ) | (11 | ) | (806 | ) | 3,278 | ||||||||||||
| Tax loss benefit | (1,437 | ) | 313 | - | 313 | (1,124 | ) | |||||||||||||
| Other | (5,002 | ) | (64 | ) | 61 | (3 | ) | (5,005 | ) | |||||||||||
| Foreign items (other) | (305 | ) | 46 | - | 46 | (259 | ) | |||||||||||||
| Total temporary differences, unused losses and unused tax credits | 205,283 | (27,407 | ) | (2,515 | ) | (29,922 | ) | 175,361 | ||||||||||||
| F- 216 |
NOTES TO THE CONSOLIDATED FINANCIAL STATEMENTS AS OF DECEMBER 31, 2018
| Note 30 | Income tax and deferred taxes (continued) |
| 30.3 | Income tax and deferred taxes, continued |
| d.4) | Reconciliation of changes in deferred tax liabilities (assets) as of December 31, 2017 |
|
Deferred tax
liability (asset) at beginning of period |
Deferred tax
expense (benefit) recognized in profit (loss) for the year |
Deferred
taxes related to items credited (charged) directly to equity |
Total increases
(decreases) in deferred tax liabilities (assets) |
Deferred tax
liability (asset) at end of period |
||||||||||||||||
| ThUS$ | ThUS$ | ThUS$ | ThUS$ | ThUS$ | ||||||||||||||||
| Unrealized loss | (86,156 | ) | 17,612 | - | 17,612 | (68,544 | ) | |||||||||||||
| Property, plant and equipment and capitalized interest | 225,124 | (13,750 | ) | - | (13,750 | ) | 211,374 | |||||||||||||
| Facility closure provision | (1,589 | ) | (1,880 | ) | - | (1,880 | ) | (3,469 | ) | |||||||||||
| Manufacturing expenses | 110,630 | (7,882 | ) | - | (7,882 | ) | 102,748 | |||||||||||||
| Individual savings plans, unemployment insurance | 5,214 | 1,876 | (298 | ) | 1,578 | 6,792 | ||||||||||||||
| Vacation accrual | (4,061 | ) | (826 | ) | - | (826 | ) | (4,887 | ) | |||||||||||
| Inventory provision | (20,684 | ) | (4,488 | ) | - | (4,488 | ) | (25,172 | ) | |||||||||||
| Materials provision | (7,776 | ) | 669 | - | 669 | (7,107 | ) | |||||||||||||
| Forwards | (10,206 | ) | 9,582 | - | 9,582 | (624 | ) | |||||||||||||
| Employee benefits | (6,783 | ) | 4,466 | - | 4,466 | (2,317 | ) | |||||||||||||
| Research and development expenses | 4,641 | (1,140 | ) | - | (1,140 | ) | 3,501 | |||||||||||||
| Accounts receivable | (4,305 | ) | 52 | - | 52 | (4,253 | ) | |||||||||||||
| Provision for legal complaints and expenses | (7,686 | ) | 2,443 | - | 2,443 | (5,243 | ) | |||||||||||||
| Loan approval expenses | 3,115 | (445 | ) | - | (445 | ) | 2,670 | |||||||||||||
| Junior mining companies (valued based on stock price) | 1,300 | 624 | 550 | 1,174 | 2,474 | |||||||||||||||
| Royalty | 6,457 | (2,389 | ) | 16 | (2,373 | ) | 4,084 | |||||||||||||
| Tax loss benefit | (1,302 | ) | (135 | ) | - | (135 | ) | (1,437 | ) | |||||||||||
| Other | (266 | ) | (4,736 | ) | - | (4,736 | ) | (5,002 | ) | |||||||||||
| Foreign items (other) | (212 | ) | (93 | ) | - | (93 | ) | (305 | ) | |||||||||||
| Total temporary differences, unused losses and unused tax credits | 205,455 | (440 | ) | 268 | (172 | ) | 205,283 | |||||||||||||
During the period ended December 31, 2018 and December 31, 2017, the Company calculated and accounted for taxable income considering a rate of 27% and 25.5% respectively, in conformity with Law No. 20,780, Tax Reform, published in the Official Gazette on September 29, 2014.
The main amendments include a gradual increase in the corporate income tax rate up to 27% starting from 2018.
| F- 217 |
NOTES TO THE CONSOLIDATED FINANCIAL STATEMENTS AS OF DECEMBER 31, 2018
| Note 30 | Income tax and deferred taxes (continued) |
| 30.3 | Income tax and deferred taxes, continued |
| d.5) | Deferred taxes related to benefits for tax losses |
The Company’s tax loss carryforwards were mainly generated by losses in Chile, which in accordance with current Chilean tax regulations have no expiration date.
As of December 31, 2018 and December 31, 2017, tax loss carryforwards are detailed as follows:
| 12/31/2018 | 12/31/2017 | |||||||
| ThUS$ | ThUS$ | |||||||
| Chile | 1,125 | 1,437 | ||||||
| Total | 1,125 | 1,437 | ||||||
Tax losses as of December 31, 2018 correspond mainly to SQM S.A., Exploraciones Mineras S.A. Comercial Agrorama S.A., Agrorama Ltd. and SIT S.A.
d.6) Unrecognized deferred income tax assets and liabilities
Unrecognized deferred tax assets and liabilities as of December 31, 2018 and December 31, 2017 are as follows:
| 12/31/2018 | 12/31/2017 | |||||||
| ThUS$ | ThUS$ | |||||||
| Assets (liabilities) | Assets (liabilities) | |||||||
| Tax losses (NOLs) | 32 | 37 | ||||||
| Doubtful accounts impairment | 47 | 48 | ||||||
| Inventory impairment | 947 | 1,347 | ||||||
| Pensions plan | 62 | 1 | ||||||
| Accrued vacations | 19 | 19 | ||||||
| Depreciation | (127 | ) | (139 | ) | ||||
| Other | (28 | ) | (36 | ) | ||||
| Balances to date | 952 | 1,277 | ||||||
| F- 218 |
NOTES TO THE CONSOLIDATED FINANCIAL STATEMENTS AS OF DECEMBER 31, 2018
| Note 30 | Income tax and deferred taxes (continued) |
| 30.3 | Income tax and deferred taxes, continued |
| d.7) | Movements in deferred tax assets and liabilities |
Movements in deferred tax assets and liabilities as of December 31, 2018 and December 31, 2017 are detailed as follows:
| 12/31/2018 | 12/31/2017 | |||||||
| ThUS$ | ThUS$ | |||||||
|
Liabilities
(assets) |
Liabilities
(assets) |
|||||||
| Deferred tax assets and liabilities, net opening balance | (205,283 | ) | (205,455 | ) | ||||
| Increase (decrease) in deferred taxes in profit or loss | 27,407 | 440 | ||||||
| Increase (decrease) in deferred taxes in equity | 2,515 | (268 | ) | |||||
| Balances to date | (175,361 | ) | (205,283 | ) | ||||
| d.8) | Disclosures on income tax expense (income) |
The Company recognizes current and deferred taxes as income or expenses, and they are included in profit or loss, unless they arise from:
| (a) | a transaction or event recognized in the same period or in a different period, outside profit or loss either in other comprehensive income or directly in equity; or |
| (b) | a business combination |
Current and deferred tax expenses (income) are detailed as follows:
| 12/31/2018 | 12/31/2017 | 12/31/2016 | ||||||||||
| ThUS$ | ThUS$ | ThUS$ | ||||||||||
|
Income
(expenses) |
Income
(expenses) |
Income
(expenses) |
||||||||||
| Current income tax expense | ||||||||||||
| Current income tax expense | (207,959 | ) | (182,567 | ) | (149,669 | ) | ||||||
| Adjustments to prior year current income tax | 1,577 | 15,954 | 2,080 | |||||||||
| Current income tax expense, net, total | (206,382 | ) | (166,613 | ) | (147,589 | ) | ||||||
| Deferred tax expense | ||||||||||||
| Deferred tax expense (income) relating to the creation and reversal of temporary differences | 27,407 | 440 | 14,624 | |||||||||
| Deferred tax expense, net, total | 27,407 | 440 | 14,624 | |||||||||
| Tax expense (income) | (178,975 | ) | (166,173 | ) | (132,965 | ) | ||||||
| F- 219 |
NOTES TO THE CONSOLIDATED FINANCIAL STATEMENTS AS OF DECEMBER 31, 2018
| Note 30 | Income tax and deferred taxes (continued) |
| 30.3 | Income tax and deferred taxes, continued |
Tax expenses (income) for foreign and domestic parties are detailed as follows:
| 12/31/2018 | 12/31/2017 | 12/31/2016 | ||||||||||
| ThUS$ | ThUS$ | ThUS$ | ||||||||||
|
Income
(expenses) |
Income
(expenses) |
Income
(expenses) |
||||||||||
| Current income tax expense by foreign and domestic parties, net | ||||||||||||
| Current income tax expense, foreign parties, net | (7,516 | ) | (14,396 | ) | (10,844 | ) | ||||||
| Current income tax expense, domestic, net | (198,866 | ) | (152,217 | ) | (136,745 | ) | ||||||
| Current income tax expense, net, total | (206,382 | ) | (166,613 | ) | (147,589 | ) | ||||||
| Deferred tax expense by foreign and domestic parties, net | ||||||||||||
| Deferred tax expense, foreign parties, net | (1,885 | ) | (154 | ) | 626 | |||||||
| Deferred tax expense, domestic, net | 29,292 | 594 | 13,998 | |||||||||
| Deferred tax expense, net, total | 27,407 | 440 | 14,624 | |||||||||
| Income tax expense | (178,975 | ) | (166,173 | ) | (132,965 | ) | ||||||
| d.9) | Equity interest in taxation attributable to equity-accounted investees |
The Company does not recognize any deferred tax liability in all cases of taxable temporary differences associated with investments in subsidiaries, branches and associated companies or interest in joint ventures, because as indicated in the standard, the following two conditions are jointly met:
| (a) | the parent, investor or interest holder is able to control the time for reversal of the temporary difference; and |
| (b) | It is more likely than not that the temporary difference will not be reversed in the foreseeable future. |
In addition, the Company does not recognize deferred income tax assets for all deductible temporary differences from investments in subsidiaries, branches and associated companies or interests in joint ventures because it is unlikely that they will meet the following requirements:
| (a) | Temporary differences are reversed in a foreseeable future; and |
| (b) | The Company has tax earnings, against which temporary differences can be used. |
| F- 220 |
NOTES TO THE CONSOLIDATED FINANCIAL STATEMENTS AS OF DECEMBER 31, 2018
| Note 30 | Income tax and deferred taxes (continued) |
| 30.3 | Income tax and deferred taxes, continued |
| d.10) | Disclosures on the tax effects of other comprehensive income components: |
|
Income tax related to other income and expense components with a
charge or credit to net equity |
Amount before
taxes (expense) gain |
Gains
(losses) for income taxes |
Amount after
taxes |
|||||||||
| 12/31/2018 | 12/31/2018 | 12/31/2018 | ||||||||||
| ThUS$ | ThUS$ | ThUS$ | ||||||||||
| Gain (loss) from defined benefit plans | (1,327 | ) | 396 | (931 | ) | |||||||
| Cash flow hedge | 5,723 | - | 5,723 | |||||||||
| Reserve for gains (losses) from financial assets measured at fair value through other comprehensive income | (5,546 | ) | 1,498 | (4,048 | ) | |||||||
| Total | (1,150 | ) | 1,894 | (744 | ) | |||||||
|
Income tax related to other income and expense components with
a charge or credit to net equity |
Amount before
taxes (expense) gain |
Gains
(losses) for income taxes |
Amount after
taxes |
|||||||||
| 12/31/2017 | 12/31/2017 | 12/31/2017 | ||||||||||
| ThUS$ | ThUS$ | ThUS$ | ||||||||||
| Gain (loss) from defined benefit plans | (1,401 | ) | 282 | (1,119 | ) | |||||||
| Cash flow hedge | 2,184 | - | 2,184 | |||||||||
| Reserve for gains (losses) from financial assets measured at fair value through other comprehensive income | (26 | ) | (550 | ) | (576 | ) | ||||||
| Total | 757 | (268 | ) | 489 | ||||||||
|
Income tax related to other income and expense components with
a charge or credit to net equity |
Amount before
taxes (expense) gain |
Gains
(losses) for income taxes |
Amount after
taxes |
|||||||||
| 12/31/2016 | 12/31/2016 | 12/31/2016 | ||||||||||
| ThUS$ | ThUS$ | ThUS$ | ||||||||||
| Gain (loss) from defined benefit plans | (3,397 | ) | 921 | (2,476 | ) | |||||||
| Cash flow hedge | 2,233 | (470 | ) | 1,763 | ||||||||
| Reserve for gains (losses) from financial assets measured at fair value through other comprehensive income | 4,813 | (1,300 | ) | 3,513 | ||||||||
| Total | 3,649 | (849 | ) | 2,800 | ||||||||
| F- 221 |
NOTES TO THE CONSOLIDATED FINANCIAL STATEMENTS AS OF DECEMBER 31, 2018
| Note 30 | Income tax and deferred taxes (continued) |
| 30.3 | Income tax and deferred taxes, continued |
| d.11) | Explanation of the relationship between expense (income) for tax purposes and accounting income. |
Based on IAS 12, paragraph 81, letter “c”, the company has estimated that the method that reveals the most significant information for users of the financial statements is the numeric reconciliation between the tax expense (income) and the result of multiplying the accounting profit by the current rate in Chile. The aforementioned election is based on the fact that the main office and subsidiaries established in Chile generate a large part of the Company’s tax expense (income).
Reconciliation of numbers in income tax expenses (income) and the result of multiplying financial gain by the rate prevailing in Chile,
| Income (expense) | ||||||||||||
| 12/31/2018 | 12/31/2017 | 12/31/2016 | ||||||||||
| ThUS$ | ThUS$ | ThUS$ | ||||||||||
| Consolidated income before taxes | 621,038 | 594,590 | 414,889 | |||||||||
| Income tax rate in force in Chile | 27 | % | 25.5 | % | 24 | % | ||||||
| Tax expense using the legal rate | (167,680 | ) | (151,620 | ) | (99,573 | ) | ||||||
| Effect of royalty tax payments. | (4,919 | ) | (3,372 | ) | (6,311 | ) | ||||||
| Tax effect of revenue from regular activities exempt from taxation | 1,446 | 2,886 | 2,461 | |||||||||
| Tax rate effect of non-tax-deductible expenses for determining taxable profit (loss) | (4,566 | ) | (4,764 | ) | (10,202 | ) | ||||||
| Tax effect of tax rates supported abroad | (8,714 | ) | (8,061 | ) | (15,933 | ) | ||||||
| IRS provision surplus | 3,517 | - | - | |||||||||
| Fines affected by Article 21 | (718 | ) | (1,517 | ) | (151 | ) | ||||||
| Other tax effects from reconciliation between accounting gains and tax expenses | 2,659 | 275 | (3,256 | ) | ||||||||
| Tax expense using the effective rate | (178,975 | ) | (166,173 | ) | (132,965 | ) | ||||||
| d.12) | Tax periods potentially subject to verification: |
The Group’s Companies are potentially subject to income tax audits by tax authorities in each country. These audits are limited to a number of interim tax periods, which, in general, when they elapse, give rise to the expiration of these inspections.
| F- 222 |
NOTES TO THE CONSOLIDATED FINANCIAL STATEMENTS AS OF DECEMBER 31, 2018
| Note 30 | Income tax and deferred taxes (continued) |
| 30.3 | Income tax and deferred taxes, continued |
Tax audits, due to their nature, are often complex and may require several years. Below, we provide a summary of tax periods that are potentially subject to verification, in accordance with the tax regulations in force in the country of origin:
Chile
According to article 200 of Decree Law No 830, the taxes will be reviewed for any deficiencies in terms of payment and to generate any taxes that might arise. There is a 3-year prescriptive period for such review, dating from the expiration of the legal deadline when payment should have been made. This prescriptive period can be extended to 6 years for the revision of taxes subject to declaration, when such declaration has not been filed or has been presented with maliciously false information.
United States
In the United States, the tax authority may review tax returns for up to 3 years from the expiration date of the tax return. In the event that an omission or error is detected in the tax return of sales or cost of sales, the review can be extended for a period of up to 6 years.
As a result of the audit performed by the tax authority, SQM North America Corp., a subsidiary of the Company, paid in November 2018, for income tax and interest between 2013 and 2015, approximately US$3.8 million. On top of this, SQM North America Corp would have to pay an additional US$0.4 million in state taxes for the same period. These charges are already provisioned in the financial statements.
Mexico:
In Mexico, the tax authority can review tax returns up to 5 years from the expiration date of the tax return.
Spain:
In Spain, the tax authority can review tax returns up to 4 years from the expiration date of the tax return.
Belgium:
In Belgium, the tax authority may review tax returns for up to 3 years from the expiration date of the tax return if no tax losses exist. In the event of detecting an omission or error in the tax return, the review can be extended for a period of up to 5 years.
South Africa:
In South Africa, the tax authority may review tax returns for up to 3 years from the expiration date of the tax return. In the event that an omission or error in the tax return is detected, the review can be extended for a period of up to 5 years.
| F- 223 |
NOTES TO THE CONSOLIDATED FINANCIAL STATEMENTS AS OF DECEMBER 31, 2018
| Note 31 | Assets held for sale |
The non-current assets held for sale and the components of the disposal groups classified as held for sale are presented in the Consolidated Statement of Financial Position under the item “Non-current assets or groups of assets classified as held for sale”.
The following table shows the movements in assets held for sale:
| Assets held for sale | 12/31/2018 | 12/31/2017 | ||||||
| ThUS$ | ThUS$ | |||||||
| Terrenos Soquimich Comercial S.A. | 1,430 | 1,480 | ||||||
| Facilities and fixtures at Soquimich Comercial S.A. | - | 109 | ||||||
| Total assets held for sale | 1,430 | 1,589 | ||||||
| a) | Below, details of assets sold |
As of December 31, 2018, the following investments in associates and joint ventures were sold:
During the month of December 2018, SQM S.A. sold the stake it held in Minera Exar S.A. generating a profit before tax of ThUS $ 14,507, which is presented in the Consolidated Statement of Income by function in Other income (loss) (See Note 27.6)
On November 14, 2018, Soquimich European Holdings B.V. sold its participation in Charlee SQM Thailand Co. Ltd, generaating a los of ThUS$ 759. See Note 27.6)
| Financial Performace and Cash Flow information |
Minera
Exar S.A. |
Charlee
SQM Thailand Co. Ltd. |
Total
12/31/2018 |
|||||||||
| ThUS$ | ThUS$ | ThUS$ | ||||||||||
| Share in the profits (losses) of associates and joint ventures accounted for using the equity method | (206 | ) | 316 | 110 | ||||||||
| Income before tax | (206 | ) | 316 | 110 | ||||||||
| Cash detail from Sale of Investments | ||||||||||||
| Net cash generated from operating activities | 13,232 | - | 13,232 | |||||||||
| Net cash generated from investment activities | 68,000 | 988 | 68,988 | |||||||||
| Net increase in cash generated by sales of investments | 81,232 | 988 | 82,220 | |||||||||
| F- 224 |
NOTES TO THE CONSOLIDATED FINANCIAL STATEMENTS AS OF DECEMBER 31, 2018
| Note 31 | Assets held for sale and assets for sale, continued: |
Determination of profit from sale of investments
| Details of the sale of investments in associates and joint ventures |
Minera
Exar S.A. |
Charlee
SQM Thailand Co. Ltd. |
Total
12/31/2018 |
|||||||||
| ThUS$ | ThUS$ | ThUS$ | ||||||||||
| Considerations received or to be received | ||||||||||||
| Cash | 87,500 | 988 | 88,488 | |||||||||
| Commercial debts and other accounts payable | - | 1,022 | 1,022 | |||||||||
| Total consideration for the provision Book value of net assets sold | (67,635 | ) | (2,343 | ) | (69,978 | ) | ||||||
| Gain on the sale before the income tax and reclassification of the foreign currency conversion | 19,865 | (333 | ) | 19,532 | ||||||||
| Reclassification of the foreign currency conversion reserve | (5,358 | ) | (426 | ) | (5,784 | ) | ||||||
| Income tax expense on income derived from gains | (6,268 | ) | - | (6,268 | ) | |||||||
| Profit after tax | 8,239 | (759 | ) | 7,480 | ||||||||
The book value of the assets and liabilities on the date of sale were:
| Items |
Minera
Exar S.A. |
Charlee
SQM Thailand Co. Ltd. |
Total
12/31/2018 |
|||||||||
| ThUS$ | ThUS$ | ThUS$ | ||||||||||
| Accounts receivable from current related entities | (19,500 | ) | - | (19,500 | ) | |||||||
| Investments accounted for using the equity method | (35,628 | ) | (2,343 | ) | (37,971 | ) | ||||||
| Capital Gains | (6,205 | ) | - | (6,205 | ) | |||||||
| Property, Plant and Equipment | (6,302 | ) | - | (6,302 | ) | |||||||
| Total Assets | (67,635 | ) | (2,343 | ) | (69,978 | ) | ||||||
| Total liabilities | - | - | - | |||||||||
| Net assets | (67,635 | ) | (2,343 | ) | (69,978 | ) | ||||||
| F- 225 |
NOTES TO THE CONSOLIDATED FINANCIAL STATEMENTS AS OF DECEMBER 31, 2018
| Note 32 | Events occurred after the reporting date |
| 32.1 | Authorization of the financial statements |
The consolidated financial statements of Sociedad Química y Minera de Chile S.A. and subsidiaries, prepared in accordance with International Financial Reporting Standards for the period ended December 31, 2018, were approved and authorized for issuance by the Company´s Board of Directors on February 27, 2019.
| 32.2 | Disclosures on events occurring after the reporting date |
On January 7, 2019, the Superintendency of the Environment (SMA) accepted the compliance program presented by SQM Salar, thus suspending the process initiated against SQM Salar. On January 30, 2019, the Atacameño Indigenous Community of Peine filed against this ruling with the First Environmental Court. More details in note 22.3.
On April 15, 2019 Sociedad Química y Minera de Chile S.A. (SQM) (NYSE SQM, Santiago Stock Exchange SQM-B, SOM-A) informs that today the Extraordinary Board of Directors of SQM approved to amend the SQM Board Protocol for the presentation and use of sensitive information:
SQM BOARD PROTOCOL FOR THE PRESENTATION AND USE OF SENSITIVE INFORMATION
| 1) | Background |
a) On July 26, 2017, the Board of Directors of Sociedad Química y Minera de Chile S.A. (respectively the "Board of Directors" and "the Company") approved a list of the main competitors, suppliers and customers of the Company, where Tianqi Lithium Corporation ("Tianqi") was included as a competitor of the Company.
b) In May 2018, Tianqi and Nutrien Ltd. announced that Tianqi agreed to acquire from Nutrien Ltd. the amount of 62,556,568 Series A shares of the Company, which corresponds to approximately 23.77% of the total shares issued by the Company.
c) On August 27, 2018, Tianqi and the Chilean National Economic Prosecutor Office (the "FNE") signed an out-of-court settlement (the "Agreement"), pursuant to which the FNE sought to implement behavioral measures in order to (i) maintain the competitive conditions of the lithium market, (ii) mitigate the risks described in the Agreement and (iii) limit the possibility of accessing certain information related to the Company and its subsidiaries, which is defined as sensitive under the Agreement (the "Sensitive Information") (1) by Tianqi (the "Purpose").
d) The Antitrust Court (the "TDLC") approved the Agreement by resolution of October 4, 2018, which was finalized on October 30, 2018. In Agreement approval process, the Company expressed its concerns to the TDLC regarding the measures described in the Agreement as (i) not effectively resolving the risks that Tianqi and the FNE wanted to mitigate, (ii) not being correctly oriented to avoid the access to Sensitive Information that, could damage the Company and the correct functioning of the market when in the possession of a competitor, and (iii) contradicting Law 18,046 on Corporations (the "Corporations Act") and other regulatory bodies applicable to the Company.
e) On December 5, 2018, the Company learned that Inversiones TLC SpA, a subsidiary of Tianqi Lithium Corporation, acquired 62,556,568 Series A shares of the Company, representing approximately 23.77% of the total shares issued by the Company (the "Acquisition"). Before the Acquisition, and after the approval of the Agreement by the TDLC, the Board of Directors had deemed it necessary to adopt measures aimed at achieving the Purpose, avoiding greater points of contact between the Sensitive Information and Tianqi, in a complementary manner, and not contradictory with the Agreement.
f) In consideration of the foregoing, on January 23, 2019, the Board of Directors unanimously resolved to adopt, the following protocol on the presentation and use of information in the Board of Directors, in the committees of the Board of Directors and in the Boards of Directors of Company’s subsidiaries (the "Protocol"). This information was published the with Commission for Financial Markets (Comisión para el Mercado Financiero, “CMF”) the same day it was approved.
| F- 226 |
NOTES TO THE CONSOLIDATED FINANCIAL STATEMENTS AS OF DECEMBER 31, 2018
| Note 32 | Events occurred after the reporting date (continued) |
| 32.2 | Disclosures on events occurring after the reporting date (continued) |
g) On March 14th, 2019, the CMF ordered the company to adopt certain measurements to adjust the Protocol to the provisions of the Corporations Act. In particular, and within other matters, the CMF expressed that (i) the restrictions by objective that the Sensitive Information can only be known by the members of the lithium committee do not meet to the established in the subsection 2° of the article 39 of the Corporations Act (ii) that the delegation made by the Board to the lithium committee, in no case, can limit the correct performance of the Board directors’ duties or limit the right to access the information on everything related to the performance of the Company and (iii) that the prior agreement of the Board set forth in the Protocol gives powers to a committee with access to information that would not be available to all Board members, which could result in generating lack of knowledge related to the Company´s performance in its administration body and make it impossible to comply with its duties in accordance with the established in the article 41 of the Corporations Act. Likewise, the CMF indicated that the measures must be communicated to it as soon as they are agreed upon by the Board of Directors and prior to the date on which the next ordinary meeting of shareholders takes place.
h) Considering that it is publicly known that the next Annual General Shareholders’ Meeting will be on April 25, 2019, and that at this meeting Tianqi will designate three Board members, the Board met to review the CMF comments, and implement the necessary measures within the required time frame, and approve a new version of the Protocol as indicated below.
i) The above considers that the current Board has the expectation to review the Protocol again once the new Board has been elected at the next Annual General Shareholders’ Meeting when three directors are designated by Tianqi, when the new Board directors will have the opportunity to propose modifications to the Protocol, which are believed to be necessary or adequate for the protection of sensitive information.
| II. | Protocol |
1. Managing of information in the Board of Directors
1.1 The Board of Directors has defined that the directors and senior executives of the Company have the duty and responsibility to cooperate with the fulfillment of the Purpose, subject to compliance with the Corporations Act and other applicable regulations.
1.2 According to the Corporations Act, all of the Company’s Directors, including those nominated or elected by a Competitor Shareholder, have the right to receive all Company information without restrictions. Every Director request to the Company for Sensitive Information, that is not made within a Board meeting, must be made in writing to the CEO of the Company.
1.3 For the purposes of section 1.2 above, a "Competitor Shareholder" is understood to be one who has been identified as a competitor of the Company in the lithium business, by any of the following persons or entities: (i) the shareholder himself, (ii) the Board of Directors, (iii) the FNE, the TDLC or any other antitrust authority that exercises jurisdiction over the Company or said shareholder, or (iv) the Agreement or any other instrument that modifies or replaces it.
| F- 227 |
NOTES TO THE CONSOLIDATED FINANCIAL STATEMENTS AS OF DECEMBER 31, 2018
| Note 32 | Events occurred after the reporting date (continued) |
| 32.2 | Disclosures on events occurring after the reporting date (continued) |
2. Board of Directors of Subsidiaries
2.1 The Board of Directors does not contemplate making changes in the manner in which the boards of the Company's subsidiaries are carried out and structured.
2.2 The directors of the Company can attend the meetings of the boards of the Company's subsidiaries with the right to comment and will have the access to the books and records of said subsidiaries.
2.3 The Board of Directors agrees to authorize the full exchange of information between its subsidiaries SQM Salar S.A. and SQM Potasio S.A., in order to allow the executives of the Company and the board directors of both subsidiaries to have consolidated and detailed information of their businesses, for their best management and in the best interest of the Company, in accordance with the guidelines established by the Board from time to time.
3. Right to Information
3.1 The directors of the Company have the right to be fully informed by the CEO, of everything related to the Company performance at any time in a documented manner.
3.2 The CEO cannot deny Sensitive Information to a director, nor information that has been treated or known in the Committee or in subsidiaries of the Company, unless this is required by the FNE, TDLC, CMF, or any other governmental or judicial authrotiy with the legal power to request such information.
4. Incident Reports
4.1 Given the risks identified by the FNE with respect to the Acquisition, any director, senior executive or employee of the Company is obliged to inform the CEO and the Compliance Officer of the Company about any breach of this Protocol or the Agreement as soon as reasonably possible.
5. Deferred Term and Modifications
5.1 The term of the present Protocol shall be indefinite starting from the time when the next Annual General Shareholders’ Meeting of the Company is concluded.
5.2 This Protocol can be modified or dissolved at any time by the Board of Directors, according to its discretion. If this happens, it will be communicated as outlined in section 6.
| F- 228 |
NOTES TO THE CONSOLIDATED FINANCIAL STATEMENTS AS OF DECEMBER 31, 2018
| Note 32 | Events occurred after the reporting date (continued) |
| 32.2 | Disclosures on events occurring after the reporting date (continued) |
6. Communication
The Board of Directors agreed that this Protocol is (i) informed as an essential fact to the Commission for the Financial Markets, (ii) informed to the Head of the FNE Antitrust Division, (iii) informed and distributed to each of the Vice Presidencies and management of the Company and its subsidiaries, and (iv) published immediately on the Company's website www.sqm.com.
(1) Under the Agreement, "Sensitive Information" is defined as SQM's Commercially Sensitive Information in SQM’s Lithium Business, specifically related to its strategic information regarding production quantities, inventory policies, investments, technologies, know how, sales contracts, pricing policies, patents, new exploitation, refining or expansion projects, new businesses, costs and other competitive strategic variables, whether communicated by any means or contained in internal summaries, minutes, presentations, agreements or other documents. In turn, SQM's Lithium Business is defined in the Agreement as present or future business related to the lithium industry, such as the current or future production, processing, marketing and/or distribution of brine, lithium carbonate, hydroxide of lithium and any other lithium compound produced by SQM and / or the companies controlled by said company or on which it exercises a Decisive Influence. Finally, a Decisive Influence is defined in the Agreement as the ability of a person or entity to determine or influence the administration and competitive decisions of another under the terms of letter b) of article 47 of Decree Law No. 211 and in accordance with terms indicated by the FNE in the Competition Guide.
| F- 229 |
NOTES TO THE CONSOLIDATED FINANCIAL STATEMENTS AS OF DECEMBER 31, 2018
| Note 32 | Events occurred after the reporting date (continued) |
| 32.2 | Disclosures on events occurring after the reporting date (continued) |
On January 7, 2019, the resignation of the Company’s Chief Executive Officer, Mr. Patricio de Solminihac Tampier, became effective. Likewise, as of January 8, 2019, Mr. Ricardo Ramos Rodríguez has assumed the position of Chief Executive Officer for the Company.
Management is not aware of any other significant events occurring between December 31, 2018 and the date of issuance of these consolidated financial statements, which affect them.
| 32.3 | Details of dividends declared after the reporting date |
Payment of Provisional Dividend
As of the closing date of the financial statements, there are no dividends declared after the reporting date.
Management is not aware of any other significant events that occurred between December 31, 2018, and the date of issuance of these consolidated financial statements that may significantly affect them.
| F- 230 |