|
|
|
|
|
|
|
|
|
|
|
|
|
|
|
|
|
|
|
|
|
|
|
|
|
|
|
|
|
|
|
|
F21
UNITED STATES
SECURITIES AND EXCHANGE COMMISSION
WASHINGTON, D.C. 20549
FORM 10-K
|
☒ |
ANNUAL REPORT PURSUANT TO SECTION 13 OR 15(d) OF THE SECURITIES EXCHANGE ACT OF 1934 |
For the fiscal year ended December 31, 2017
Commission file number 001-37420
SERITAGE GROWTH PROPERTIES
(Exact name of registrant as specified in its charter)
|
Maryland |
38-3976287 |
|
(State or Other Jurisdiction of Incorporation or Organization) |
(I.R.S. Employer Identification No.) |
|
500 Fifth Avenue, Suite 1530, New York, New York |
10110 |
|
(Address of principal executive offices) |
(Zip Code) |
Registrant’s telephone number, including area code (212) 355-7800
Securities registered pursuant to Section 12(b) of the Act:
|
Title of each class |
|
Name of each exchange on which registered |
|
Class A common shares of beneficial interest, par value $0.01 per share |
|
New York Stock Exchange |
|
7.00% Series A cumulative redeemable preferred shares of beneficial interest, par value $0.01 per share |
|
New York Stock Exchange |
Indicate by check mark if the registrant is a well-known seasoned issuer, as defined in Rule 405 of the Securities Act. Yes ☒ No ☐
Indicate by check mark if the registrant is not required to file reports pursuant to Section 13 or Section 15(d) of the Act. Yes ☐ No ☒
Indicate by check mark whether the registrant (1) has filed all reports required to be filed by Section 13 or 15(d) of the Securities Exchange Act of 1934 during the preceding 12 months (or for such shorter period that the registrant was required to file such reports), and (2) has been subject to such filing requirements for the past 90 days. Yes ☒ No ☐
Indicate by check mark whether the registrant has submitted electronically and posted on its corporate Web site, if any, every Interactive Data File required to be submitted and posted pursuant to Rule 405 of Regulation S-T (§232.405 of this chapter) during the preceding 12 months (or for such shorter period that the registrant was required to submit and post such files). Yes ☒ No ☐
Indicate by check mark if disclosure of delinquent filers pursuant to Item 405 of Regulation S-K (§232.405 of this chapter) is not contained herein, and will not be contained, to the best of registrant’s knowledge, in definitive proxy or information statements incorporated by reference in Part III of this Form 10-K or any amendment to this Form 10-K. ☐
Indicate by check mark whether the registrant is a large accelerated filer, an accelerated filer, a non-accelerated filer a smaller reporting company or an emerging growth company. See the definitions of "large accelerated filer," "accelerated filer," "smaller reporting company" and “emerging growth company” in Rule 12b-2 of the Exchange Act (Check one):
|
Large accelerated filer |
☒ |
|
Accelerated filer |
☐ |
|
Non-accelerated filer |
☐ |
(Do not check if a smaller reporting company) |
Smaller reporting company |
☐ |
|
Emerging growth company |
☐ |
|
|
|
If an emerging growth company, indicate by check mark if the registrant has elected not to use the extended transition period for complying with any new or revised financial accounting standards provided pursuant to Section 13(a) of the Exchange Act. ☐
Indicate by check mark whether the registrant is a shell company (as defined in Rule 12b-2 of the Act). Yes ☐ No ☒
On June 30, 2017, the last business day of the most recently completed second quarter of the registrant, the aggregate market value of the voting and non-voting common equity held by non-affiliates of the registrant was approximately $1,379,900,000 based upon the closing price of $41.95 of the common stock as reported on the New York Stock Exchange on such date.
As of February 21, 2018, the registrant had the following common shares outstanding:
|
Class |
|
Shares Outstanding |
|
Class A common shares of beneficial interest, par value $0.01 per share |
|
34,042,416 |
|
Class B common shares of beneficial interest, par value $0.01 per share |
|
1,328,866 |
|
Class C common shares of beneficial interest, par value $0.01 per share |
|
1,524,449 |
DOCUMENTS INCORPORATED BY REFERENCE
Portions of Seritage Growth Properties’ Proxy Statement for its 2018 Annual Meeting of Shareholders, to be held April 24, 2018, are incorporated by reference into Part III of this Annual Report on Form 10-K.
ANNUAL REPORT ON FORM 10-K
DECEMBER 31, 2017
TABLE OF CONTENTS
|
|
|
|
|
Page |
|
|
|
|
|
|
|
Item 1. |
|
|
1 |
|
|
Item 1A. |
|
|
6 |
|
|
Item 1B. |
|
|
26 |
|
|
Item 2. |
|
|
27 |
|
|
Item 3. |
|
|
40 |
|
|
Item 4. |
|
|
40 |
|
|
|
|
|
|
|
|
Item 5. |
|
|
41 |
|
|
Item 6. |
|
|
43 |
|
|
Item 7. |
|
Management’s Discussion and Analysis of Financial Condition and Results of Operations |
|
44 |
|
Item 7A. |
|
|
64 |
|
|
Item 8. |
|
|
64 |
|
|
Item 9. |
|
Changes in and Disagreements with Accountants on Accounting and Financial Disclosure |
|
64 |
|
Item 9A. |
|
|
64 |
|
|
Item 9B. |
|
|
65 |
|
|
|
|
|
|
|
|
Item 10. |
|
|
65 |
|
|
Item 11. |
|
|
65 |
|
|
Item 12. |
|
Security Ownership of Certain Beneficial Owners and Management and Related Stockholder Matters |
|
65 |
|
Item 13. |
|
Certain Relationships and Related Transactions, and Director Independence |
|
65 |
|
Item 14. |
|
|
65 |
|
|
|
|
|
|
|
|
Item 15. |
|
|
66 |
|
|
|
|
|
69 |
i
CAUTIONARY STATEMENT REGARDING FORWARD-LOOKING STATEMENTS
This Annual Report on Form 10-K (the “Annual Report”) of Seritage Growth Properties contains statements that constitute forward-looking statements within the meaning of the federal securities laws. Any statements that do not relate to historical or current facts or matters are forward-looking statements. You can identify forward-looking statements by the use of forward-looking terminology such as “believes,” “expects,” “may,” “will,” “should,” “seeks,” “approximately,” “intends,” “plans,” “pro forma,” “estimates” or “anticipates” or the opposite of these words and phrases or similar words or phrases which are predictions of or indicate future events or trends and which do not relate solely to historical matters. Statements concerning current conditions may also be forward-looking if they imply a continuation of current conditions. You can also identify forward-looking statements by discussions of strategy, plans or intentions.
Forward-looking statements involve numerous risks and uncertainties and you should not rely on them as predictions of future events. Forward-looking statements depend on assumptions, data or methods which may be incorrect or imprecise and we may not be able to realize them. The following factors, among others, could cause actual results and future events to differ materially from those set forth or contemplated in the forward-looking statements:
|
|
• |
Declines in retail, real estate and general economic conditions; |
|
|
• |
Our current dependence on Sears Holdings Corporation for a majority of our in-place revenue; |
|
|
• |
Sears Holdings Corporation’s termination and other rights under its master lease with us; |
|
|
• |
Risks relating to our recapture and redevelopment activities and potential acquisition or disposition of properties; |
|
|
• |
Our relatively limited operating history as an independent public company; |
|
|
• |
The terms of our indebtedness; |
|
|
• |
Environmental, health, safety and land use laws and regulations; |
|
|
• |
The effects of the recently enacted legislation known as the “Tax Cuts and Jobs Act” and any future amendments or interpretive guidance in connection therewith, as well as any other changes in federal, state, or local tax law, including legislative, administrative, regulatory or other actions affecting REITs or changes in interpretations thereof or increased taxes resulting from tax audits; and |
|
|
• |
Restrictions with which we are required to comply in order to maintain REIT status. |
While forward-looking statements reflect our good faith beliefs, they are not guarantees of future performance. Except as required by law, we disclaim any obligation to publicly update or revise any forward-looking statement to reflect changes in underlying assumptions or factors of new information, data or methods, future events or other changes. For a further discussion of these and other factors that could impact our future results, performance or transactions, see “Item 1A. Risk Factors.”
ii
Seritage Growth Properties (“Seritage”) (NYSE: SRG), a Maryland real estate investment trust formed on June 3, 2015, is a fully integrated, self-administered and self-managed real estate investment trust (“REIT”) as defined under Section 856(c) of the Internal Revenue Code (the “Code”). Seritage’s assets are held by and its operations are primarily conducted through, directly or indirectly, Seritage Growth Properties, L.P., a Delaware limited partnership (the “Operating Partnership”). Under the partnership agreement of the Operating Partnership, Seritage, as the sole general partner, has exclusive responsibility and discretion in the management and control of the Operating Partnership. Unless otherwise expressly stated or the context otherwise requires, the “Company”, “we,” “us,” and “our” as used herein refer to Seritage, the Operating Partnership and its owned and controlled subsidiaries.
Seritage is principally engaged in the acquisition, ownership, development, redevelopment, management and leasing of diversified retail real estate throughout the United States. As of December 31, 2017, our portfolio consisted of approximately 39.4 million square feet of gross leasable area (“GLA”), including 230 wholly owned properties totaling approximately 35.2 million square feet of GLA across 49 states and Puerto Rico, and interests in 23 joint venture properties totaling over 4.2 million square feet of GLA across 13 states.
On June 11, 2015 Sears Holdings Corporation (“Sears Holdings”) effected a rights offering (the “Rights Offering”) to Sears Holdings stockholders to purchase common shares of Seritage in order to fund, in part, the $2.7 billion acquisition of 234 of Sears Holdings’ owned properties and one of its ground leased properties (the “Wholly Owned Properties”), and its 50% interests in three joint ventures (such joint ventures, the “JVs,” and such 50% joint venture interests the “JV Interests”) that collectively own 28 properties, ground lease one property and lease two properties (collectively, the “Original JV Properties”) (collectively, the “Transaction”). The Rights Offering ended on July 2, 2015, and the Company’s Class A common shares were listed on the New York Stock Exchange on July 6, 2015.
On July 7, 2015, the Company completed the Transaction with Sears Holdings and commenced operations. The Company’s only operations prior to the completion of the Rights Offering and Transaction were those incidental to the completion of such activities.
During the year ended December 31, 2017, the Company completed transactions whereby it (i) sold its JV Interests in 13 Original JV Properties and (ii) sold a 50% interest in five Wholly Owned Properties a retained 50% interest in five new joint venture properties (the “New JV Properties” and, together with the Original JV Properties, the “JV Properties”).
As of December 31, 2017, we leased space at 148 Wholly Owned Properties to Sears Holdings under a master lease agreement (the “Master Lease”), including 76 properties leased only to Sears Holdings and 72 properties leased to both Sears Holdings and one or more third-party tenants. The remaining 92 Wholly Owned Properties include 51 properties that are leased solely to third-party tenants and do not have any space leased to Sears Holdings, and 31 vacant properties. As of December 31, 2017, space at 22 JV Properties is also leased to Sears Holdings by, as applicable, (i) GS Portfolio Holdings II LLC (the “GGP I JV”), a joint venture between Seritage and a subsidiary of GGP Inc. (together with its subsidiaries, “GGP”); (ii) GS Portfolio Holdings (2017) LLC (the “GGP II JV” and, together with the GGP I JV, the “GGP JVs”), a joint venture between Seritage and a subsidiary of GGP; (iii) SPS Portfolio Holdings II LLC (the “Simon JV”), a joint venture between Seritage and a subsidiary of Simon Property Group, Inc. (together with its subsidiaries, “Simon”); and (iv) MS Portfolio LLC (the “Macerich JV”), a joint venture between Seritage and a subsidiary of The Macerich Company (together with its subsidiaries, “Macerich”), in each case under a separate master lease with each JV (the “JV Master Leases”). Sears Holdings is the sole tenant at nine JV properties and 13 JV properties are leased to both Sears Holdings and one or more third-party tenants. One JV Property was vacant as of December 31, 2017.
The Master Lease and the JV Master Leases provide the Company and the JVs with certain recapture rights, including the right to recapture up to 50% of the space occupied by Sears Holdings at substantially all of the properties subject to the Master Leases and JV Master Leases. The Company and the JVs will generally exercise these rights to facilitate the redevelopment and retenanting of the subject properties. See “Item 2. Properties” for a description of our current portfolio.
- 1 -
Our primary objective is to create value for our shareholders through the re-leasing and redevelopment of the majority of our Wholly Owned Properties and JV Properties. In doing so, we expect to meaningfully grow net operating income (“NOI”) by re-leasing space to third-party retailers at materially higher rents while also substantially diversifying our tenant base. In order to achieve our objective, we intend to execute the following strategies:
|
|
• |
Convert single-tenant buildings into multi-tenant properties at meaningfully higher rents . We intend to increase NOI and diversify our portfolio by actively recapturing space at our properties and re-leasing such space to third-party retailers for higher rents than are payable under the Master Lease by Sears Holdings. |
We seek to optimize the mix of tenants at, and maximize the value of, our properties by focusing on growing national retailers and taking into account customer demographics and the competitive environment of each property's market area. We believe that the superior real estate locations, diversity of property types and national footprint that characterize our portfolio, combined with the recapture features of the Master Lease, make us well-positioned to meet the store growth needs of retailers across a variety of sectors and concepts. As we lease space to such retailers, we aim to create multi-tenant shopping centers that command superior rents and valuations due to their prime locations, synergies with adjoining retailers and proximity to productive malls and shopping centers.
|
|
• |
Maximize value of vast land holdings through retail and mixed-use densification . Our portfolio includes over 2,900 acres of land, or approximately 13 acres per site for our Wholly Owned Properties, and our most significant geographic concentrations are in higher growth markets in California, Florida, Texas and the Northeast. We believe these land holdings will provide meaningful opportunities for additional retail and mixed-use development. |
In addition to the right to recapture up to approximately 50% of the space occupied by Sears Holdings at each of our Wholly Owned Properties, the Master Lease provides us with the right to recapture (i) 100% of the stores located at 21 identified properties; (ii) all of any automotive care centers which are free-standing or attached as “appendages” to the stores; and (iii) outparcels or outlots, as well as certain portions of parking areas and common areas. During the year ended December 31, 2017, we also converted partial recapture rights at seven properties to 100% recapture rights and exercised such recapture rights.
The 28 properties for which we have, or have exercised, 100% recapture rights include approximately 5.0 million square feet of entitled commercial space on over 450 acres of land, and our portfolio of automotive care centers encompasses approximately 3.5 million square feet of scarce real estate typically located on the most visible and highly-trafficked site at a property. Given our fee ownership of these properties and control over parking lots and outparcels, we believe that many of these sites, as well as others throughout the portfolio, will provide attractive and value-enhancing development, redevelopment and densification opportunities.
|
|
• |
Leverage existing and future joint venture relationships with leading real estate and financial partners. We currently own 50% interests in 23 JV Properties with leading regional mall REITs each of which, we believe, is focused on driving value creation at the JV Properties through recapturing and re-leasing space pursuant to the JV Master Leases. |
We participate in 50% of all net value created at the JV Properties and expect to benefit from the leasing and redevelopment platforms of our JV partners, as well as stores that are, generally, located at high-productivity malls within their respective portfolios.
We may participate in future joint ventures to leverage our human and capital resources and pursue additional value-creating projects. We will generally seek partners that provide incremental expertise and/or capital, or, as a result of circumstances, allow us to create more value together than we believe we could create on our own.
|
|
• |
Maintain a flexible capital structure to support value creation activities . We expect to maintain a capital structure that provides us with the financial flexibility and capacity to fund our redevelopment opportunities. We believe that the capital structure resulting from the Transaction positioned us with sufficient liquidity and flexibility to commence the execution of our redevelopment business strategy, and that we have access to multiple forms of capital to continue investing in value-creating projects, including internally generated cash from operations. We may also raise capital through the public or private issuance of equity and debt securities, as well as through asset sales and additional joint ventures. |
- 2 -
A majority of the Company’s real estate properties are leased to Sears Holdings, and the majority of our in-place rental revenues are derived from the Master Lease. See “Risk Factors—Risks Related to Our Business and Operations.”
The Master Lease provides Seritage the right to recapture up to approximately 50% of the space occupied by Sears Holdings at each of the Wholly Owned Properties included in the Master Lease (subject to certain exceptions). In addition, Seritage has the right to recapture any automotive care centers which are freestanding or attached as “appendages” to the stores, and all outparcels or outlots, as well as certain portions of parking areas and common areas. We also have the right to recapture 100% of the space occupied by Sears Holdings at each of 21 identified Wholly Owned Properties by making a specified lease termination payment to Sears Holdings and, during the year ended December 13, 2017, we converted partial recapture rights at seven properties to 100% recapture rights and exercised such recapture rights. While we will be permitted to exercise our recapture rights all at once or in stages as to any particular property, we will not be permitted to recapture all or substantially all of the space subject to the recapture right at more than 50 Wholly Owned Properties during any lease year.
The Master Lease also provides for certain rights to Sears Holdings to terminate the Master Lease with respect to Wholly Owned Properties that cease to be profitable for operation by Sears Holdings. In order to terminate the Master Lease with respect to a certain property, Sears Holdings must make a payment to us of an amount equal to one year of rent (together with taxes and other expenses) with respect to such property. Such termination right, however, will be limited so that it will not have the effect of reducing the fixed rent under the Master Lease by more than 20% per annum.
A substantial majority of the space at the JV Properties is leased to Sears Holdings under the JV Master Leases which include recapture rights and termination rights with similar terms as the Master Lease.
Sears Holdings is a publicly traded company and is subject to the informational filing requirements of the Securities Exchange Act of 1934, as amended (the “Exchange Act”), and is required to file periodic reports on Form 10-K and Form 10-Q with the Securities and Exchange Commission (“SEC”). Sears Holdings’ SEC filings, including its publicly available financial information, may be accessed by the public on the SEC’s website at www.sec.gov . We make no representation as to the accuracy or completeness of the information regarding Sears Holdings that is available through the SEC’s website or otherwise made available by Sears Holdings or any third party, and none of such information is incorporated by reference herein.
Competition
We compete for investment opportunities and prospective tenants with other REITs, real estate partnerships and other real estate companies, private individuals, investment companies, private equity and hedge fund investors, sovereign funds, pension funds, insurance companies, lenders and other investors, including retailer operators that may close stores and pursue similar real estate strategies. In addition, revenues from our properties are dependent on the ability of our tenants and operators to compete with other retail operators.
Some of our competitors are significantly larger and have greater financial resources and lower costs of capital than we have. Increased competition will make it more challenging to identify and successfully capitalize on investment opportunities that meet our objectives. Our ability to compete is also impacted by national and local economic trends, availability of investment alternatives, availability and cost of capital, construction and renovation costs, existing laws and regulations, new legislation and population trends.
As a landlord, we compete in the real estate market with numerous developers and owners of properties, including the shopping centers in which our properties are located. Some of our competitors have greater economies of scale, relationships with national tenants at multiple properties which are owned or operated by such competitors, access to more resources and greater name recognition than we do. If our competitors offer space at rental rates below the current market rates or below the rentals we currently charge, or on terms and conditions which include locations at multiple properties, we may lose our existing and/or potential tenants and we may be pressured to reduce our rental rates or to offer substantial rent abatements, tenant improvement allowances, early termination rights or below-market renewal options in order to win new tenants and retain tenants when our leases expire.
Environmental Matters
Our properties are subject to environmental laws regulating, among other things, air emissions, wastewater discharges and the handling and disposal of wastes. Certain of the properties were built during the time that asbestos-containing building materials were routinely installed in residential and commercial structures. In addition, a substantial portion of the properties we acquired from Sears Holdings currently include, or previously included, automotive care center facilities and retail fueling facilities, and are or were subject to laws and regulations governing the handling, storage and disposal of hazardous substances contained in some of the products or materials used or sold in the automotive care center facilities (such as motor oil, fluid in hydraulic lifts, antifreeze and solvents and lubricants), the recycling/disposal of batteries and tires, air emissions, wastewater discharges and waste management. In
- 3 -
addition to these products or materials, the equipment in use or previously used at such properties, such as service equipmen t, car lifts, oil/water separators, and storage tanks, has been subject to increasing environmental regulation relating to, among other things, the storage, handling, use, disposal, and transportation of hazardous materials. The Master Lease obligates Sea rs Holdings to comply with applicable environmental laws and to indemnify us if their noncompliance results in losses or claims against us, and to remove all automotive care center equipment and facilities upon the expiration or sooner termination of the M aster Lease. We expect other leases to include similar provisions for other operators of their respective spaces with respect to environmental matters first arising during their occupancy. An operator’s failure to comply could result in fines and penaltie s or the requirement to undertake corrective actions which may result in significant costs to the operator and thus adversely affect their ability to meet their obligations to us.
Pursuant to U.S. federal, state and local environmental laws and regulations, a current or previous owner or operator of real property may be required to investigate, remove and/or remediate a release of hazardous substances or other regulated materials at, or emanating from, such property. Further, under certain circumstances, such owners or operators of real property may be held liable for property damage, personal injury and/or natural resource damage resulting from or arising in connection with such releases. Certain of these laws have been interpreted to be joint and several unless the harm is divisible and there is a reasonable basis for allocation of responsibility. We also may be liable under certain of these laws for damage that occurred prior to our ownership of a property or at a site where we sent wastes for disposal. The failure to properly remediate a property may also adversely affect our ability to lease, sell or rent the property or to borrow funds using the property as collateral.
Under the Master Lease, Sears Holdings is required to indemnify us from certain environmental liabilities at the Wholly Owned Properties before or during the period in which each Wholly Owned Property is leased to Sears Holdings, including removal and remediation of all affected facilities and equipment constituting the automotive care center facilities (and each JV Master Lease includes a similar requirement of Sears Holdings). In addition, pursuant to the terms our debt financing agreements, an escrow account for environment remediation was funded at the closing of the Transaction in the amount of approximately $12.0 million. As of December 31, 2017, the balance of the escrow account was approximately $10.8 million.
In connection with the ownership of our current or past properties and any properties that we may acquire in the future, we could be legally responsible for environmental liabilities or costs relating to a release of hazardous substances or other regulated materials at or emanating from such property. We are not aware of any environmental issues that are expected to have a material impact on the operations of our properties.
Insurance
We have comprehensive liability, property and rental loss insurance with respect to our portfolio of properties. We believe that such insurance provides adequate coverage.
REIT Qualification
We elected to be treated as a REIT commencing with the taxable year ended December 31, 2015 and expect to continue to operate so as to qualify as a REIT. So long as we qualify as a REIT, we generally will not be subject to U.S. federal income tax on net taxable income that we distribute annually to our shareholders. In order to qualify as a REIT for U.S. federal income tax purposes, we must continually satisfy tests concerning, including, but not limited to, the real estate qualification of sources of our income, the composition and values of our assets, the amounts we distribute to our shareholders and the diversity of ownership of our stock. In order to comply with REIT requirements, we may need to forego otherwise attractive opportunities and limit our expansion opportunities and the manner in which we conduct our operations. See “Risk Factors—Risks Related to Status as a REIT.”
Financial Information about Industry Segments
We currently operate in a single reportable segment, which includes the acquisition, ownership, development, redevelopment, management and leasing of retail properties. We review operating and financial results for each property on an individual basis and do not distinguish or group our properties based on geography, size, or type. We, therefore, aggregate all of our properties into one reportable segment due to their similarities with regard to the nature and economics of the properties, tenants and operational process.
Employees
As of February 21, 2018, we had 56 full-time employees. Our employees are not covered by a collective bargaining agreement, and we consider our employee relations to be satisfactory.
- 4 -
Our principal offices are located at 500 Fifth Avenue, New York, New York 10110 and our telephone number is (212) 355-7800. Our website address is www.seritage.com. Our reports electronically filed with or furnished to the SEC pursuant to Section 13(a) or 15(d) of the Exchange Act can be accessed through this site, free of charge, as soon as reasonably practicable after we electronically file or furnish such reports. These filings are also available on the SEC’s website at www.sec.gov. Our website also contains copies of our corporate governance guidelines and code of business conduct and ethics as well as the charters of our audit, compensation and nominating and corporate governance committees. The information on our website is not part of this or any other report we file with or furnish to the SEC.
- 5 -
Certain factors may have a material adverse effect on our business, financial condition and results of operations. You should consider carefully the risks and uncertainties described below, in addition to other information contained in this Annual Report, including our consolidated financial statements and related notes. The risks and uncertainties described below are not the only ones we face. Additional risks and uncertainties that we are unaware of, or that we currently believe are not material, may also become important factors that adversely affect our business. If any of the following risks actually occurs, our business, financial condition, results of operations, and future prospects could be materially and adversely affected. In that event, the trading price of our common shares of beneficial interest could decline, and you could lose part or all of your investment.
Risks Related to Our Business and Operations
We will be substantially dependent on Sears Holdings, as a tenant, until we further diversify the tenancy of our portfolio, and an event that has a material adverse effect on Sears Holdings’ business, financial condition or results of operations could have a material adverse effect on our business, financial condition or results of operations.
Sears Holdings is the lessee of a majority of our properties and accounts for a majority of our in-place revenues. Under the Master Lease, Sears Holdings is required to pay all insurance, taxes, utilities and maintenance and repair expenses in connection with these leased properties and to indemnify, defend and hold us harmless from and against various claims, litigation and liabilities arising in connection with its business, subject to proportionate sharing of certain of these expenses with occupants of the remainder of the space not leased to Sears Holdings. Sears Holdings may not in the short term or long term have sufficient assets, income and access to financing to enable it to satisfy its payment obligations, including those under the Master Lease. In its Form 10-K for its fiscal year ended January 28, 2017, Sears Holdings disclosed, among other things, that its historical operating results indicate substantial doubt exists related to Sears Holdings’ ability to continue as a going concern. In addition, Sears Holdings has disclosed that its domestic pension and postretirement benefit plan obligations are currently underfunded. Sears Holdings may have to make significant cash payments to some or all of its pension and postretirement benefit plans, which would reduce the cash available for its businesses, potentially including its rent obligations under the Master Lease. The inability or unwillingness of Sears Holdings to meet its rent obligations and other obligations under the Master Lease could materially adversely affect our business, financial condition or results of operations, including our ability to pay the interest, principal and other costs and expenses under our financings, or to pay cash dividends to Seritage shareholders. For these reasons, if Sears Holdings were to experience a material adverse effect on its business, financial condition or results of operations, our business, financial condition or results of operations could also be materially adversely affected.
Our dependence on rental payments from Sears Holdings as a significant source of revenues may limit our ability to enforce our rights under the Master Lease. In addition, we may be limited in our ability to enforce our rights under the Master Lease because it is a unitary lease and does not provide for termination with respect to individual properties by reason of the default of the tenant. Failure by Sears Holdings to comply with the terms of the Master Lease or to comply with the regulations to which the leased properties are subject could require us to find another master lessee for all such leased property and there could be a decrease or cessation of rental payments by Sears Holdings. In such event, we may be unable to locate a suitable master lessee or a lessee for individual properties at similar rental rates and other obligations and in a timely manner or at all, which would have the effect of reducing our rental revenues. In addition, each JV is subject to similar limitations on enforcements of remedies and risks under its respective JV Master Lease, which could reduce the value of our investment in, or distributions to us by, one or more of the JVs.
The bankruptcy or insolvency of any of our tenants, particularly Sears Holdings, could result in the termination of such tenant’s lease and material losses to us.
A tenant bankruptcy or insolvency could diminish the rental revenue we receive from that property or could force us to “take back” tenant space as a result of a default or a rejection of the lease by a tenant in bankruptcy. In particular, a bankruptcy or insolvency of Sears Holdings, which is our largest tenant, could result in a loss of a majority of our in-place rental revenue and materially and adversely affect us. Any claims against bankrupt tenants for unpaid future rent would be subject to statutory limitations that would likely result in our receipt of rental revenues that are substantially less than the contractually specified rent we are owed under their leases or no payments at all. In addition, any claim we have for unpaid past rent will likely not be paid in full. If a tenant becomes bankrupt or insolvent, federal law may prohibit us from evicting such tenant based solely upon such bankruptcy or insolvency. We may also be unable to re-lease a terminated or rejected space or re-lease it on comparable or more favorable terms. If we do re-lease rejected space, we may incur costs for brokerage, marketing and tenant expenses.
Sears Holdings leases a majority of our properties. Bankruptcy laws afford certain protections to tenants that may also affect the Master Lease or JV Master Leases. Subject to certain restrictions, a tenant under a master lease generally is required to assume or reject the master lease as a whole, rather than making the decision on a property-by-property basis. This prevents the tenant from assuming only the better performing properties and terminating the master lease with respect to the poorer performing properties. While we believe that our Master Lease and JV Master Lease are unitary leases that would need to be assumed or rejected as a whole
- 6 -
in any bankruptcy proceeding, whether or not a bankruptcy court would require that a master lease be assumed or rejected as a whole depends upon a “facts and circumstances” analysis considering a number of factors, includ ing the parties’ intent, the nature and purpose of the relevant documents, whether there was separate and distinct consideration for each property included in the master lease, the provisions contained in the relevant documents and applicable state law. I f a bankruptcy court in a Sears Holdings bankruptcy were to allow the Master Lease or a JV Master Lease to be rejected in part, certain underperforming leases related to properties we or the applicable JV as landlord under a JV Master Lease, respectively, own could be rejected by the tenant in bankruptcy while tenant-favorable leases are allowed to remain in place, thereby adversely affecting payments to us derived from the properties. For this and other reasons, a Sears Holdings bankruptcy could materiall y and adversely affect us.
In addition, although we believe that the Master Lease is a “true lease” for purposes of bankruptcy law, it is possible that a bankruptcy court could re-characterize the lease transaction set forth in the Master Lease as a secured lending transaction. If the Master Lease were judicially recharacterized as a secured lending transaction, we would not be treated as the owner of the property and could lose certain rights as the owner in the bankruptcy proceeding. In addition, each JV is subject to this risk with respect to its JV Master Lease, which could reduce the value of our investment in, or distribution to us by, one or more of the JVs.
Sears Holdings’ right to terminate the Master Lease with respect to a portion of our properties could negatively impact our business, results of operations and financial condition.
Under the terms of the Master Lease, in each year after the first lease year, Sears Holdings will have the right to terminate the Master Lease with respect to properties representing up to 20% of the aggregate annual rent payment under the Master Lease with respect to all properties, if, with respect to a property leased under the Master Lease, the EBITDAR for the 12-month period ending as of the most recent fiscal quarter end produced by the Sears Holdings store operated there is less than the rent allocated to such property payable during that year. While Sears Holdings must pay a termination fee equal to one year of rent (together with taxes and other expenses) with respect to such property, the value of some of the properties could be materially adversely affected if we are not able to re-lease such properties at the same rates which Sears Holdings was paying in a timely manner or at all, and this may negatively impact our business, results of operations and financial condition.
In addition, Sears Holdings has the right to terminate a portion of the JV Master Leases with each of the GGP JVs, the Simon JV and the Macerich JV if, with respect to a JV Property owned by the applicable JV, the same EBITDAR condition is satisfied, which could reduce the value of our investment in, or distributions to us by, one or more of the JVs.
As of December 31, 2017, Sears Holdings had terminated the Master Lease with respect to 56 stores totaling approximately 7.4 million square feet of gross leasable area. The aggregate base rent at these 56 stores was approximately $23.6 million at the time of termination.
We may not be able to renew leases or re-lease space at our properties, or lease space in newly recaptured properties, and property vacancies could result in significant capital expenditures.
When leases for our properties expire, or when the Master Lease is terminated with respect to certain stores, the premises may not be re-released in a timely manner or at all, or the terms of re-releasing, including the cost of allowances and concessions to tenants, may be less favorable than the current lease terms. The loss of a tenant through lease expiration or other circumstances may require us to spend (in addition to other re-letting expenses) significant amounts of capital to renovate the property before it is suitable for a new tenant and cause us to incur significant costs in the form of ongoing expenses for property maintenance, taxes, insurance and other expenses. Many of the leases we will enter into or acquire may be for properties that are especially suited to the particular business of the tenants operating on those properties. Because these properties have been designed or physically modified for a particular tenant, if the current lease is terminated or not renewed, we may be required to renovate the property at substantial costs, decrease the rent we charge or provide other concessions to re-lease the property. In addition, if we are required or otherwise determine to sell the property, we may have difficulty selling it to a party other than the tenant due to the special purpose for which the property may have been designed or modified. This potential illiquidity may limit our ability to quickly modify our portfolio in response to changes in economic or other conditions, including tenant demand. Also, we may not be able to lease new properties to an appropriate mix of tenants or for rents that are consistent with our expectations. To the extent that our leasing plans are not achieved or we incur significant capital expenditures as a result of property vacancies, our business, results of operations and financial condition could be materially adversely affected.
Real estate investments are relatively illiquid.
Our properties represent a substantial portion of our total consolidated assets, and these investments are relatively illiquid. Significant expenditures associated with each equity investment, such as mortgage payments, real estate taxes, insurance, and repair and maintenance costs, are generally not reduced when circumstances cause a reduction in income from the investment. If income from a property declines while the related expenses do not decline, our income and cash available to us would be adversely affected. If it
- 7 -
becomes necessary or desirable for us to dispose of one or more of our mortgaged properties, we might not be able to obtain a release of the lien on the mortgaged property without payment of the associated debt or other costs and expenses. As a result, our ability to sell one or more of our properties or investments in real estate in response to any changes in economic or other conditions may be limited. If we want to sell a property, we may not be able to dispo se of it in the desired time period or at a sale price that would exceed the cost of our investment in that property.
The number of potential buyers for certain properties that we may seek to sell may be limited by the presence of such properties in retail or mall complexes owned or managed by other property owners. In addition, our ability to sell or dispose of certain properties may be hindered by the fact that such properties are subject to the Master Lease or a JV Master Lease, as the terms of the Master Lease and the JV Master Leases or the fact that Sears Holdings is the lessee may make such properties less attractive to a potential buyer than alternative properties that may be for sale. Furthermore, if we decide to sell any of our properties, we may provide financing to purchasers and bear the risk that the purchasers may default, which may delay or prevent our use of the proceeds of the sales for other purposes or the distribution of such proceeds to our shareholders.
Both we and our tenants face a wide range of competition that could affect our ability to operate profitably.
The presence of competitive alternatives, both to our properties and the businesses that lease our properties, affects our ability to lease space and the level of rents we can obtain. Our properties operate in locations that compete with other retail properties and also compete with other forms of retailing, such as catalogs and e-commerce websites. Competition may also come from strip centers, outlet centers, lifestyle centers and malls, and both existing and future development projects. New construction, renovations and expansions at competing sites could also negatively affect our properties. In addition, we compete with other retail property companies for tenants and qualified management. These other retail property companies may have relationships with tenants that we do not have since we have a limited operating history, including with respect to national chains that may be desirable tenants. If we are unable to successfully compete, our business, results of operations and financial condition could be materially adversely affected. See also “Item 1. Business – Competition.”
In addition, the retail business is highly competitive and if our tenants fail to differentiate their shopping experiences, create an attractive value proposition or execute their business strategies, they may terminate, default on, or fail to renew their leases with us, and our results of operations and financial condition could be materially adversely affected. Furthermore, we believe that the increase in digital and mobile technology usage has increased the speed of the transition from shopping at physical locations to web-based purchases and that our tenants, including Sears Holdings, may be negatively affected by these changing consumer spending habits. If our tenants are unsuccessful in adapting their businesses, and, as a result terminate, default on, or fail to renew their leases with us, our results of operations and financial condition could be materially adversely affected.
Our pursuit of investments in and redevelopment of properties, and investments in and acquisitions or development of additional properties, may be unsuccessful or fail to meet our expectations.
We intend to grow our business through investments in, and acquisitions or development of, properties, including through the recapture and redevelopment of space at many of our properties. However, our industry is highly competitive, and we face competition from other REITs, investment companies, private equity and hedge fund investors, sovereign funds, lenders, and other investors, some of whom are significantly larger and have greater resources and lower costs of capital. This competition will make it more challenging to identify and successfully capitalize on acquisition and development opportunities that meet our investment objectives. If we are unable to finance acquisitions or other development opportunities on commercially favorable terms, our business, financial condition or results of operations could be materially adversely affected. Additionally, the fact that we must distribute 90% of our net taxable income in order to maintain our qualification as a REIT may limit our ability to rely upon rental payments from leased properties or subsequently acquired properties in order to finance acquisitions. As a result, if debt or equity financing is not available on acceptable terms, further acquisitions or other development opportunities might be limited or curtailed.
Investments in, and acquisitions of, properties we might seek to acquire entail risks associated with real estate investments generally, including (but not limited to) the following risks and as noted elsewhere in this section:
|
|
• |
we may be unable to acquire a desired property because of competition; |
|
|
• |
even if we are able to acquire a desired property, competition from other potential acquirers may significantly increase the purchase price; |
|
|
• |
even if we enter into agreements for the acquisition of properties, these agreements are subject to customary conditions to closing, including completion of due diligence investigations to our satisfaction; |
|
|
• |
we may incur significant costs and divert management attention in connection with evaluation and negotiation of potential acquisitions, including ones that we are subsequently unable to complete; |
- 8 -
|
|
• |
we may acquire properties that are not initially accretive to our results upon acquisition, and we may not successfully manage and lease those properties to meet our expectations; |
|
|
• |
we may be unable to finance the acquisition on favorable terms in the time period we desire, or at all; |
|
|
• |
even if we are able to finance the acquisition, our cash flow may be insufficient to meet our required principal and interest payments; |
|
|
• |
we may spend more than budgeted to make necessary improvements or renovations to acquired properties; |
|
|
• |
we may be unable to quickly and efficiently integrate new acquisitions, particularly the acquisition of portfolios of properties, into our existing operations; |
|
|
• |
market conditions may result in higher than expected vacancy rates and lower than expected rental rates; and |
|
|
• |
we may acquire properties subject to liabilities and without any recourse, or with only limited recourse, with respect to unknown liabilities. |
In addition, we intend to redevelop a significant portion of the properties purchased from Sears Holdings in order to make space available for lease to additional retail tenants and potentially other third-party lessees for other uses. The redevelopment of these properties involves the risks associated with real estate development activities generally. Our redevelopment strategies also involve additional risks, including that Sears Holdings may terminate or fail to renew leases with us for the applicable portion of the redeveloped space as a result of our redevelopment activities. If we are unable to successfully redevelop properties or to lease the redeveloped properties to third parties on acceptable terms, our business, results of operations and financial condition could be materially adversely affected.
Current and future redevelopment may not yield expected returns.
We expect to undertake redevelopment, expansion and reinvestment projects involving our properties as part of our long-term strategy. Likewise, each JV expects to undertake redevelopment, expansion and reinvestment projects involving its JV Properties, with respect to which we may be required to make additional capital contributions to the applicable JV under certain circumstances. These projects are subject to a number of risks, including (but not limited to):
|
|
• |
abandonment of redevelopment activities after expending resources to determine feasibility; |
|
|
• |
loss of rental income, as well as payments of maintenance, repair, real estate taxes and other charges, from Sears Holdings related to space that is recaptured pursuant to the Master Lease (or the JV Master Leases) and which may not be re-leased to third parties; |
|
|
• |
restrictions or obligations imposed pursuant to other agreements; |
|
|
• |
construction and/or lease-up costs (including tenant improvements or allowances) and delays and cost overruns, including construction costs that exceed original estimates; |
|
|
• |
failure to achieve expected occupancy and/or rent levels within the projected time frame or at all; |
|
|
• |
inability to operate successfully in new markets where new properties are located; |
|
|
• |
inability to successfully integrate new or redeveloped properties into existing operations; |
|
|
• |
difficulty obtaining financing on acceptable terms or paying operating expenses and debt service costs associated with redevelopment properties prior to sufficient occupancy and commencement of rental obligations under new leases; |
|
|
• |
changes in zoning, building and land use laws, and conditions, restrictions or limitations of, and delays or failures to obtain, necessary zoning, building, occupancy, land use and other governmental permits; |
|
|
• |
changes in local real estate market conditions, including an oversupply of, or a reduction in demand for, retail space or retail goods, and the availability and creditworthiness of current and prospective tenants; |
|
|
• |
negative perceptions by retailers or shoppers of the safety, convenience and attractiveness of the property; |
|
|
• |
exposure to fluctuations in the general economy due to the significant time lag between commencement and completion of redevelopment projects; and |
|
|
• |
vacancies or ability to rent space on favorable terms, including possible market pressures to offer tenants rent abatements, tenant improvements, early termination rights or below-market renewal options. |
- 9 -
If any of these events occur at any time during the process with respect to any project, overall project costs may significantly exceed initial cost estimates, which could result in reduced returns or losses from such investments. In addition, we may not have sufficient liquidity to fund such projects, and delays in the completion of a redevelopment project may provide various tenants the right to withdraw from a property.
Rising expenses could reduce cash flow and funds available for future development.
If any property is not fully occupied or becomes vacant in whole or in part, or if rents are being paid in an amount that is insufficient to cover operating costs and expenses, we could be required to expend funds with respect to that property for operating expenses. Our properties are subject to increases in tax rates and tax assessments, utility costs, insurance costs, repairs, maintenance and administrative expenses, and other operating expenses. We may also incur significant expenditures as a result of deferred maintenance for the properties we have already acquired (subject to reserved funds to cover certain of these costs) and other properties we may acquire in the future. While properties under the Master Lease and the JV Master Leases are generally leased on a triple-net basis (subject to proportionate sharing of operating expenses with respect to space not leased by Sears Holdings), renewals of leases or future leases may not be negotiated on that basis, in which event we may have to pay those costs. If we are unable to lease properties on a triple-net-lease basis or on a basis requiring the tenants to pay all or some of such expenses, or if tenants fail to pay required tax, utility and other impositions and other operating expenses, we could be required to pay those costs which could adversely affect funds available for future development or cash available for distributions.
Recently enacted changes in federal tax law could materially adversely affect our business, financial condition and profitability by increasing our tax or tax compliance costs.
On December 20, 2017, the U.S. Congress passed H.R. 1, known as the “Tax Cuts and Jobs Act” (the “TCJA”), which was signed into law on December 22, 2017. The enactment of the TCJA has given rise to numerous interpretive issues and ambiguities and future legislation may be enacted to clarify or modify the TCJA. Any such future legislation, as well as any regulations or other interpretive guidance, may have a material and adverse impact on us.
Real estate related taxes may increase, and if these increases are not passed on to tenants, our income will be reduced.
Some local real property tax assessors may seek to reassess some of our properties as a result of our acquisitions and/or redevelopment of properties. Generally, from time to time, our property taxes increase as property values or assessment rates change or for other reasons deemed relevant by the assessors. An increase in the assessed valuation of a property for real estate tax purposes will result in an increase in the related real estate taxes on that property. Although the Master Lease and some third-party tenant leases may permit us to pass through such tax increases to the tenants for payment, there is no assurance that renewal leases or future leases will be negotiated on the same basis. Increases not passed through to tenants will reduce our income and the cash available for distributions to our shareholders.
Changes in building and/or zoning laws may require us to update a property in the event of recapture or prevent us from fully restoring a property in the event of a substantial casualty loss and/or require us to meet additional or more stringent construction requirements.
Due to changes, among other things, in applicable building and zoning laws, ordinances and codes that may affect certain of our properties that have come into effect after the initial construction of the properties, certain properties may not comply fully with current building and/or zoning laws, including electrical, fire, health and safety codes and regulations, use, lot coverage, parking and setback requirements, but may qualify as permitted non-conforming uses. Such changes in building and zoning laws may require updating various existing physical conditions of buildings in connection with our recapture, renovation, and/or redevelopment of properties. In addition, such changes in building and zoning laws may limit our or our tenants’ ability to restore the premises of a property to its previous condition in the event of a substantial casualty loss with respect to the property or the ability to refurbish, expand or renovate such property to remain compliant, or increase the cost of construction in order to comply with changes in building or zoning codes and regulations. If we are unable to restore a property to its prior use after a substantial casualty loss or are required to comply with more stringent building or zoning codes and regulations, we may be unable to re-lease the space at a comparable effective rent or sell the property at an acceptable price, which may materially and adversely affect us.
Our real estate assets may be subject to impairment charges.
On a periodic basis, we must assess whether there are any indicators that the value of our real estate assets and other investments may be impaired. If an impairment indicator is identified, a property’s value is considered to be impaired only if management’s estimate of current and projected operating cash flows (undiscounted and unlevered), taking into account the anticipated and probability weighted holdings periods, are less than the carrying value of the property. In our estimate of cash flows model, we consider factors such as expected future operating income, trends and prospects, the effects of demand, competition and other factors. If we are evaluating the potential sale of an asset or development alternatives, the undiscounted future cash flows considers the most likely course of action at
- 10 -
the balance sheet date based on current plans, intended holding periods and available market information. We are required to make subjective assessments as to whether there are impairments in the value of our rea l estate assets and other investments. These assessments may have a direct impact on our earnings because recording an impairment charge results in an immediate negative adjustment to earnings. We may take impairment charges in the future related to the im pairment of our assets, and any future impairment could have a material adverse effect on our results of operations in the period in which the impairment charge is taken.
Properties in our portfolio may be subject to ground leases; if we are found to be in breach of these ground leases or are unable to renew them, we could be materially and adversely affected.
We currently have one property in our wholly-owned portfolio that is on land subject to a ground lease. Accordingly, we only own a long-term leasehold in the land underlying this property, and we own the improvements thereon only during the term of the ground lease. In the future, our portfolio may include additional properties subject to ground leases or similar interests. If we are found to be in breach of a ground lease, we could lose the right to use the property and could also be liable to the ground lessor for damages. In addition, unless we can purchase a fee interest in the underlying land or extend the terms of these leases before their expiration, which we may be unable to do, we will lose our right to operate these properties and our interest in the improvements upon expiration of the leases. Our ability to exercise options to extend the term of our ground lease is subject to the condition that we are not in default under the terms of the ground lease at the time that we exercise such options, and we may not be able to exercise our options at such time. In addition, three JV Properties are currently ground leased or leased and, therefore, subject to similar risks. Furthermore, we may not be able to renew our ground lease or future ground leases upon their expiration (after the exercise of all renewal options). If we were to lose the right to use a property due to a breach or non-renewal or final expiration of the ground lease, we would be unable to derive income from such property, which could materially and adversely affect our business, financial conditions or results of operations.
Certain properties within our portfolio are subject to restrictions pursuant to reciprocal easement agreements, operating agreements, or similar agreements, some of which contain a purchase option or right of first refusal or right of first offer in favor of a third party.
Many of the properties in our portfolio are, and properties that we acquire in the future may be, subject to use restrictions and/or operational requirements imposed pursuant to ground leases, restrictive covenants or conditions, reciprocal easement agreements or operating agreements (collectively, “Property Restrictions”) that could adversely affect our ability to redevelop the properties or lease space to third parties. Such Property Restrictions could include, for example, limitations on alterations, changes, expansions, or reconfiguration of properties; limitations on use of properties, including for retail uses only; limitations affecting parking requirements; restrictions on exterior or interior signage or facades; or access to an adjoining mall, among other things. In certain cases, consent of the other party or parties to such agreements may be required when altering, reconfiguring, expanding, redeveloping or re-leasing properties. Failure to secure such consents when necessary may harm our ability to execute leasing, redevelopment or expansion strategies, which could adversely affect our business, financial condition or results of operations. In certain cases, a third party may have a purchase option or right of first refusal or right of first offer that is activated by a sale or transfer of the property, or a change in use or operations, including a closing of the Sears Holdings operation or cessation of business operations, on the encumbered property.
Economic conditions may affect the cost of borrowing, which could materially adversely affect our business.
Our business is affected by a number of factors that are largely beyond our control but may nevertheless have a significant negative impact on us. These factors include, but are not limited to:
|
|
• |
interest rates and credit spreads; |
|
|
• |
the availability of credit, including the price, terms and conditions under which it can be obtained; |
|
|
• |
a decrease in consumer spending or sentiment, including as a result of increases in savings rates and tax increases, and any effect that this may have on retail activity; |
|
|
• |
the actual and perceived state of the real estate and retail markets, market for dividend-paying stocks and public capital markets in general; and |
|
|
• |
unemployment rates, both nationwide and within the primary markets in which we operate. |
In addition, economic conditions such as inflation or deflation could materially adversely affect our business, financial condition and results of operations. Deflation may have an impact on our ability to repay our debt. Deflation may delay consumption and thus weaken tenant sales, which may reduce our tenants’ ability to pay rents. Deflationary pressure on retailers may diminish their ability to rent our space and decrease our ability to re-lease the space on favorable terms to us. In an inflationary economic environment, increased inflation may have a pronounced negative impact on the interest expense we pay in connection with our indebtedness and our general and administrative expenses, as these costs could increase at a rate higher than rents we collect. Also, inflation may
- 11 -
adversely affect tenant leases with stated rent increases, which could be lower than the increase in inflation at any given time. Inflation could also have an adverse effect on consumer spending, which could impact our tenants’ sales and, in turn, ou r own results of operations. Restricted lending practices may impact our ability to obtain financing for our properties and may also negatively impact our tenants’ ability to obtain credit. Decreases in consumer demand can have a direct impact on our tenan ts and the rents we receive.
Compliance with the Americans with Disabilities Act may require us to make expenditures that adversely affect our cash flows.
The Americans with Disabilities Act (the “ADA”) has separate compliance requirements for “public accommodations” and “commercial facilities,” but generally requires that buildings be made accessible to people with disabilities. Compliance with the ADA requirements could require removal of access barriers, and non-compliance could result in imposition of fines by the United States government or an award of damages to private litigants, or both. While the tenants to whom our properties are leased are generally obligated by law or lease to comply with the ADA provisions applicable to the property being leased to them, if required changes involve other property not being leased to such tenants, if the required changes include greater expenditures than anticipated, or if the changes must be made on a more accelerated basis than anticipated, the ability of these tenants to cover costs could be adversely affected. Moreover, certain third-party leases may require the landlord to comply with the ADA with respect to the building as a whole and/or the tenant’s space. As a result of any of the foregoing circumstances, we could be required to expend funds to comply with the provisions of the ADA, which could adversely affect our results of operations and financial condition.
Environmental, health, safety and land use laws and regulations may limit or restrict some of our operations.
As the owner or operator of various real properties and facilities, we must comply with various federal, state and local environmental, health, safety and land use laws and regulations. We and our properties are subject to such laws and regulations relating to the use, storage, disposal, emission and release of hazardous and non-hazardous substances and employee health and safety, as well as zoning restrictions. Historically, Sears Holdings has not incurred significant expenditures to comply with these laws with respect to the substantial majority of the space at the properties. However, a substantial portion of our properties that have resulted in certain remediation activities currently include, or previously included, automotive care center facilities and retail fueling facilities, and/or above-ground or underground storage tanks, and are or were subject to laws and regulations governing the handling, storage and disposal of hazardous substances contained in some of the products or materials used or sold in the automotive care center facilities (such as gasoline, motor oil, fluid in hydraulic lifts, antifreeze, solvents and lubricants), the recycling/disposal of batteries and tires, air emissions, wastewater discharges and waste management. In addition to these products, the equipment in use or previously used at such properties, such as service equipment, car lifts, oil/water separators, and storage tanks, has been subject to increasing environmental regulation relating to, among other things, the storage, handling, use, disposal and transportation of hazardous materials. There are also federal, state and local laws, regulations and ordinances that govern the use, removal and/or replacement of underground storage tanks in the event of a release on, or an upgrade or redevelopment of, certain properties. Such laws, as well as common-law standards, may impose liability for any releases of hazardous substances associated with the underground storage tanks and may provide for third parties to seek recovery from owners or operators of such properties for damages associated with such releases. If hazardous substances are released from any underground storage tanks on any of our properties, we may be materially and adversely affected. In a few states, transfers of some types of sites are conditioned upon clean-up of contamination prior to transfer. If any of our properties are subject to such contamination, we may be subject to substantial clean-up costs before we are able to sell or otherwise transfer the property.
Under the Master Lease, Sears Holdings is required to indemnify us from certain environmental liabilities at the properties purchased from Sears Holdings before or during the period in which each property is leased to Sears Holdings, including removal and remediation of all affected facilities and equipment constituting the automotive care center facilities (and each JV Master Lease includes a similar requirement of Sears Holdings). Although existing and future third-party leases are expected to require tenants generally to indemnify us for such tenants’ non-compliance with environmental laws as a result of their occupancy, such tenants typically will not be required to indemnify us for environmental non-compliance arising prior to their occupancy. In such cases, we may incur costs and expenses under such leases or as a matter of law. The amount of any environmental liabilities could exceed the amounts for which Sears Holdings or other third parties are required to indemnify us (or the applicable JV) or their financial ability to do so. In addition, under the terms of the agreements governing our indebtedness, we have deposited funds in a reserve account that will be used to fund costs incurred in correcting certain environmental and other conditions. The amount of such funds may not be sufficient to correct the environmental and other conditions to which they are expected to be applied.
In addition, additional laws which may be passed in the future, or a finding of a violation of or liability under existing laws, could require us and/or one or more of the JVs to make significant expenditures and otherwise limit or restrict some of our or its or their operations, which could have an adverse effect on our business, financial condition and results of operations.
- 12 -
Environmental compliance costs and liabilities associated with real estate properties owned by us may materially and adversely affect us.
Our properties may be subject to known and unknown environmental liabilities under various federal, state and local laws and regulations relating to human health and the environment. Certain of these laws and regulations may impose joint and several liability on certain statutory classes of persons, including owners or operators, for the costs of investigation or remediation of contaminated properties. These laws and regulations apply to past and present business operations on the properties, and the use, storage, handling and recycling or disposal of hazardous substances or wastes. We may face liability regardless of our knowledge of the contamination, the timing of the contamination, the cause of the contamination or the party responsible for the contamination of the property.
We may be held primarily or jointly and severally liable for costs relating to the investigation and clean-up of any of our properties from which there has been a release or threatened release of a regulated material as well as other affected properties, regardless of whether we knew of or caused the release.
As the owner or operator of real property, we may also incur liability based on various building conditions. For example, buildings and other structures on properties that we currently own or operate or those we acquire or operate in the future contain, may contain, or may have contained, asbestos-containing material (or “ACM”). Environmental, health and safety laws require that ACM be properly managed and maintained and may impose fines or penalties on owners, operators or employers for non-compliance with those requirements. These requirements include special precautions, such as removal, abatement or air monitoring, if ACM would be disturbed during maintenance, renovation or demolition of a building, potentially resulting in substantial costs. In addition, we may be subject to liability for personal injury or property damage sustained as a result of exposure to ACM or releases of ACM into the environment. In addition, the presence of significant mold or other airborne contaminants at any of our properties could require us to undertake a costly remediation program to contain or remove the mold or other airborne contaminants or increase ventilation and/or expose us to liability from our tenants, employees of our tenants, or others if property damage or personal injury occurs.
In addition to these costs, which are typically not limited by law or regulation and could exceed a property’s value, we could be liable for certain other costs, including governmental fines, and injuries to persons, property or natural resources. Further, some environmental laws create a lien on the contaminated site in favor of the government for damages and the costs the government incurs in connection with such contamination. Any such costs or liens could have a material adverse effect on our business or financial condition.
Although we intend to require our tenants to undertake to indemnify us for certain environmental liabilities, including environmental liabilities they cause, the amount of such liabilities could exceed the financial ability of the tenant to indemnify us. The presence of contamination or the failure to remediate contamination may adversely affect our ability to sell or lease the real estate or to borrow using the real estate as collateral.
Each JV is subject to similar risks relating to environmental compliance costs and liabilities associated with its JV Properties, which may reduce the value of our investment in, or distributions to us by, one or more JVs, or require that we make additional capital contributions to one or more JVs.
Possible terrorist activity or other acts of violence could adversely affect our financial condition and results of operations.
Terrorist attacks or other acts of violence may result in declining economic activity, which could harm the demand for goods and services offered by our tenants and the value of our properties and might adversely affect the value of an investment in our securities. Such a resulting decrease in retail demand, could make it difficult for us to renew or re-lease our properties at lease rates equal to or above historical rates. Terrorist activities or violence also could directly affect the value of our properties through damage, destruction or loss, and the availability of insurance for such acts, or of insurance generally, might be lower or cost more, which could increase our operating expenses and adversely affect our financial condition and results of operations. To the extent that our tenants are affected by future attacks, their businesses similarly could be adversely affected, including their ability to continue to meet obligations under their existing leases. These acts might erode business and consumer confidence and spending and might result in increased volatility in national and international financial markets and economies. Any one of these events might decrease demand for real estate, decrease or delay the occupancy of our new or redeveloped properties, and limit our access to capital or increase our cost of raising capital.
We may have future capital needs and may not be able to obtain additional financing on acceptable terms.
As of December 31, 2017, we had aggregate outstanding indebtedness of approximately $1.36 billion. We may incur additional indebtedness in the future to refinance our existing indebtedness, to finance newly acquired properties or capital contributions to joint ventures, or to fund retenanting and redevelopment projects. Our existing debt and any significant additional indebtedness could require a substantial portion of our cash flow to make interest and principal payments. Demands on our cash resources from debt service will reduce funds available to us to pay dividends, make capital expenditures and acquisitions or carry out other aspects of our business strategy. Our indebtedness may also limit our ability to adjust rapidly to changing market conditions, make us more
- 13 -
vulnerable to general adverse economic and industry conditions and create competitive disadvantages for us compared to other companies with relatively lower debt levels. Increased future debt service ob ligations may limit our operational flexibility, including our ability to acquire properties, finance or refinance our properties, contribute properties to joint ventures or sell properties as needed.
Moreover, our ability to obtain additional financing and satisfy our financial obligations under indebtedness outstanding from time to time will depend upon our future operating performance, which is subject to then-prevailing general economic, real estate and credit market conditions, including interest rate levels and the availability of credit generally, and financial, business and other factors, many of which are beyond our control. A prolonged worsening of credit market conditions would have a material adverse effect on our ability to obtain financing on favorable terms, if at all.
We may be unable to obtain additional financing or financing on favorable terms or our operating cash flow may be insufficient to satisfy our financial obligations under any indebtedness outstanding from time to time. Among other things, the absence of an investment grade credit rating or any credit rating downgrade could increase our financing costs and could limit our access to financing sources. If financing is not available when needed, or is available only on unfavorable terms, we may be unable to enhance our properties or develop new properties, complete acquisitions or otherwise take advantage of business opportunities or respond to competitive pressures, any of which could have a material adverse effect on our business, financial condition and results of operations.
If additional funds are raised through the issuance of equity securities, our shareholders may experience significant dilution. Additionally, sales of substantial amounts of Class A common shares in the public market, or the perception that such sales could occur, could adversely affect the market price of Class A common shares, may make it more difficult for our shareholders to sell their common shares at a time and price that they deem appropriate, and could impair our future ability to raise capital through an offering of our equity securities.
We expect to incur mortgage indebtedness and other borrowings, which may increase our business risks.
We may incur mortgage debt and pledge all or some of our real properties as security for that debt to finance newly acquired properties or capital contributions to joint ventures, or to fund retenanting and redevelopment projects. The Company may also borrow if it needs funds or deems it necessary or advisable to assure that it maintains its qualification as a REIT for U.S. federal income tax purposes. If there is a shortfall between the cash flow from a property and the cash flow needed to service mortgage debt on a property, then the amount available for distributions to shareholders may be reduced. In addition, incurring mortgage debt increases the risk of loss since defaults on indebtedness secured by a property may result in lenders initiating foreclosure actions. In that case, we could lose the property securing the loan that is in default. For tax purposes, a foreclosure of any of our properties would be treated as a sale of the property for a purchase price equal to the outstanding balance of the debt secured by the mortgage. If the outstanding balance of the debt secured by the mortgage exceeds our tax basis in the property, we would recognize taxable income on foreclosure, but would not receive any cash proceeds. In such event, the Company may be unable to pay the amount of distributions required in order to maintain its REIT status. If any mortgages contain cross-collateralization or cross-default provisions, a default on a single property could affect multiple properties. If any properties are foreclosed upon due to a default, our ability to pay cash distributions to our shareholders may be adversely affected, which could result in our being required to pay taxable stock dividends in order to maintain our REIT status.
Covenants in our debt agreements may limit our operational flexibility, and a covenant breach or default could materially adversely affect our business and financial condition.
The agreements governing our secured indebtedness contain customary covenants for a real estate financing, including restrictions on the ability of the borrowers under the agreements governing our existing indebtedness to grant liens on their assets (including the Wholly Owned Properties and JV Interests, which comprise substantially all of our assets), incur additional indebtedness, or transfer or sell assets. Such restrictions also include cash flow sweep provisions based upon certain measures of the Company’s and Sears Holdings’ financial and operating performance, including (a) where the “Debt Yield” (the ratio of net operating income for the mortgage borrowers to their debt) is less than 11.0%, (b) if the performance of Sears Holdings at the stores subject to the Master Lease with Sears Holdings fails to meet specified rent ratio thresholds, (c) if the Company fails to meet specified tenant diversification tests and (d) upon the occurrence of a bankruptcy or insolvency action with respect to Sears Holdings or if there is a payment default under the Master Lease with Sears Holdings, in each case, subject to cure rights, including providing specified amounts of cash collateral or satisfying tenant diversification thresholds.
In November 2016, the Company and the servicer for our Mortgage Loans (as defined below) entered into amendments to our Loan Agreements to resolve a disagreement regarding one of the cash flow sweep provisions in our Loan Agreements. The principal terms of these amendments are that the Company has (i) posted $30 million, and will post $3.3 million on a monthly basis, to a redevelopment reserve account, which amounts may be used by the Company to fund redevelopment projects and (ii) extended the spread maintenance provision for prepayment of the loan by two months through March 9, 2018 (with the spread maintenance premium for the second month at a reduced amount). As a result of this amendment and the resolution of the related disagreement, no cash flow sweep was imposed.
- 14 -
Were a cash flow sweep to be imposed (and for so long as a cash flow sweep period is imposed), we potentially could be constrained in our ability to use cash generated by the Wholly Owned Proper ties. In addition, during the pendency of the cash flow sweep, the lender would have certain consent rights over, among other things, our annual budget and variances thereto, redevelopment budgets and variances thereto, and capital improvements requiring capital expenditures that are not consistent with the approved annual budget or an approved redevelopment plan and budget. These enhanced consent rights potentially could limit our operational flexibility.
The covenants in our Loan Agreements (as defined below) and Unsecured Term Loan (as defined below) also require Seritage to maintain a minimum consolidated liquidity, minimum consolidated net worth and minimum loan to value. Covenants that limit our operational flexibility as well as defaults under our debt instruments could have a material adverse effect on our business and financial condition.
We have limited operating history as a REIT and an independent public company, and our inexperience may impede our ability to successfully manage our business or implement effective internal controls.
We have limited operating history owning, leasing or developing properties independent from Sears Holdings or operating as a REIT. Similarly, we have limited operating history as an independent public company. We cannot assure you that our past experience will be sufficient to successfully operate our company as a REIT and an independent public company. The Company is required to implement substantial control systems and procedures in order to maintain its qualification as a REIT, satisfy its periodic and current reporting requirements under applicable SEC regulations and comply with the Sarbanes-Oxley Act, the Dodd-Frank Wall Street Reform and Consumer Protection Act of 2010 and the NYSE listing standards. As a result, our management and other personnel need to devote a substantial amount of time to comply with these rules and regulations and establish the corporate infrastructure and controls demanded of a publicly traded REIT. These costs and time commitments could be substantially more than we currently expect. If our finance and accounting organization is unable for any reason to respond adequately to the increased demands, the quality and timeliness of our financial reporting may suffer, and we could experience significant deficiencies or material weaknesses in our disclosure controls and procedures or our internal control over financial reporting.
An inability to establish effective disclosure controls and procedures and internal control over financial reporting or remediate existing deficiencies could cause us to fail to meet our reporting obligations under the Exchange Act, or result in material weaknesses, material misstatements or omissions in our Exchange Act reports, any of which could cause investors to lose confidence in our company, which could have an adverse effect on our revenues and results of operations or the market price of Class A common shares, par value $0.01 per share, Class B non-economic common shares of beneficial interest, par value $0.01 per share (“Class B non-economic common shares”), and Class C non-voting common shares of beneficial interest, par value $0.01 per share (“Class C non-voting common shares”).
Our rights and the rights of our shareholders to take action against our trustees and officers are limited.
As permitted by the Maryland REIT Law, the Company’s Declaration of Trust limits the liability of its trustees and officers to Seritage and its shareholders for money damages, except for liability resulting from:
|
|
• |
actual receipt of an improper benefit or profit in money, property or services; or |
|
|
• |
a final judgment based upon a finding of active and deliberate dishonesty by the trustee or officer that was material to the cause of action adjudicated. |
In addition, the Company’s Declaration of Trust authorizes it and Seritage’s bylaws obligate it to indemnify its present and former trustees and officers for actions taken by them in those capacities and to pay or reimburse their reasonable expenses in advance of final disposition of a proceeding to the maximum extent permitted by Maryland law, and we have entered into indemnification agreements with our trustees and executive officers. As a result, the Company and our shareholders may have more limited rights against our trustees and officers than might otherwise exist absent the provisions in our Declaration of Trust and bylaws or that might exist with other companies. Accordingly, in the event that actions taken by any of our trustees or officers are immune or exculpated from, or indemnified against, liability but which impede our performance, the Company and our shareholders’ ability to recover damages from that trustee or officer will be limited.
- 15 -
Seritage’s Declaration of Trust and bylaws, Maryland law, and the partnership agreement of Operat ing Partnership contain provisions that may delay, defer or prevent an acquisition of Class A common shares or a change in control.
The Company’s Declaration of Trust and bylaws, Maryland law and the partnership agreement of Operating Partnership contain a number of provisions, the exercise or existence of which could delay, defer or prevent a transaction or a change in control that might involve a premium price for our shareholders or otherwise be in their best interests, including the following:
|
|
• |
The Company’s Declaration of Trust Contains Restrictions on the Ownership and Transfer of Seritage Shares of Beneficial Interest. In order for us to qualify as a REIT, no more than 50% of the value of all outstanding common shares may be owned, beneficially or constructively, by five or fewer individuals at any time during the last half of each taxable year other than 2015, the first taxable year for which we elected to be taxed as a REIT. Additionally, at least 100 persons must beneficially own Class A common shares during at least 335 days of a taxable year (other than the first taxable year for which we elect to be taxed as a REIT). The Company’s Declaration of Trust, with certain exceptions, authorizes the Board of Trustees to take such actions as are necessary and desirable to preserve its qualification as a REIT. For this and other purposes, subject to certain exceptions, our Declaration of Trust provides that no person may beneficially or constructively own more than 9.6%, in value or in number of shares, whichever is more restrictive, of all outstanding shares, or all outstanding common shares (including our Class A common shares, our Class B non-economic common shares and our Class C non-voting common shares), of beneficial interest of the Company. We refer to these restrictions collectively as the “ownership limits.” The constructive ownership rules under the Code are complex and may cause shares owned directly or constructively by a group of related individuals or entities to be deemed to be constructively owned by one individual or entity. As a result, the acquisition of less than 9.6% of the outstanding shares of beneficial interest of our shares by an individual or entity could cause that individual or entity or another individual or entity to own, beneficially or constructively, the Company’s shares of beneficial interest in violation of the ownership limits. In addition, because we have multiple classes of common shares, the acquisition of Class A common shares may result in a shareholder inadvertently owning, beneficially or constructively, the Company’s shares of beneficial interest in violation of the ownership limits. Our Declaration of Trust also prohibits any person from owning Class A common shares that would result in our being “closely held” under Section 856(h) of the Code or otherwise cause us to fail to qualify as a REIT. Any attempt to own or transfer Class A common shares or any of our other shares of beneficial interest in violation of these restrictions or other restrictions on ownership or transfer in our Declaration of Trust may result in the transfer being automatically void. The Company’s Declaration of Trust also provides that Class A common shares in excess of the ownership limits will be transferred to a trust for the exclusive benefit of a designated charitable beneficiary, and that any person who acquires Class A common shares in violation of the ownership limits will not be entitled to any dividends on the shares or be entitled to vote the shares or receive any proceeds from the subsequent sale of the shares in excess of the lesser of the price paid by such person for the shares (or, if such person did not give value for such shares, the market price on the day the shares were transferred to the trust) or the amount realized from the sale. We or our designee will have the right to purchase the shares from the trustee at this calculated price as well. The ownership limits and other restrictions on ownership and transfer in our Declaration of Trust may have the effect of preventing, or may be relied upon to prevent, a third party from acquiring control of us if the Board of Trustees does not grant an exemption from the ownership limits, even if our shareholders believe the change in control is in their best interests. |
|
|
• |
The Company’s Board of Trustees Has the Power to Cause Us to Issue Additional Shares of Beneficial Interest and Classify and Reclassify Any Unissued Class A Common Shares without Shareholder Approval. The Company has issued and outstanding, in addition to the Class A common shares, Class B non-economic common shares having, in the aggregate, approximately 3.9% of the voting power of the Company, all of which are held by ESL Partners, L.P. and Edward S. Lampert (“ESL”), and Class C non-voting common shares entitled to, in the aggregate, 8.9% of the dividends or other distributions issued to holders of shares of beneficial interest of the Company, all of which are held by clients (“Fairholme Clients”) of Fairholme Capital Management L.L.C. (“FCM”). We have also issued 2,800,000 shares of Series A Cumulative Redeemable Preferred Shares (the “Series A Preferred Shares”) that are senior to our common shares with respect to priority of dividend payments and rights upon liquidation, dissolution or winding up. Our Declaration of Trust authorizes us to issue additional authorized but unissued common shares or preferred shares of beneficial interest. In addition, the Board of Trustees may, without shareholder approval, (i) amend the Declaration of Trust to increase or decrease the aggregate number of shares of beneficial interest or the number of shares of beneficial interest of any class or series that we have authority to issue and (ii) classify or reclassify any unissued common shares or preferred shares of beneficial interest and set the preferences, rights and other terms of the classified or reclassified shares. As a result, the Board of Trustees may establish a class or series of common shares or preferred shares of beneficial interest that could delay or prevent a transaction or a change in control that might involve a premium price for Class A common shares or otherwise be in the best interests of our shareholders. |
- 16 -
|
|
• |
The Partnership Agreement of Operating Partnership Provides Holders of Operating Partnership Units Approval Rights over Certain Change in Control Transactions Involving the Company or Operating Partnership. Pursuant to the partnership agreement of Operating Partnership, certain transactions, including mergers, consolidations, conversions or other combinations or extraordinary transactions or transactions that constitute a “change of control” of the Company or Operating Partnership, as defined in the partnership agreement, will require the approval of the partners (other than the Company and entities controlled by it) holding a majority of all the outstanding Operating Partnership units held by all partners (other than the Company and entities controlled by it). These provisions could have the effect of delaying or preventing a change in control. ESL holds all of the Operating Partnership units not held by the Company and entities controlled by it. |
|
|
• |
Certain Provisions of Maryland Law May Limit the Ability of a Third Party to Acquire Control of Us. Certain provisions of the Maryland General Corporation Law (the “MGCL”) applicable to Maryland REITs may have the effect of inhibiting a third party from acquiring us or of impeding a change of control of the Company under circumstances that otherwise could provide Class A common shareholders with the opportunity to realize a premium over the then-prevailing market price of such shares or otherwise be in the best interest of shareholders, including: |
|
|
• |
“business combination” provisions that, subject to certain exceptions and limitations, prohibit certain business combinations between a Maryland REIT and an “interested shareholder” (defined generally as any person who beneficially owns, directly or indirectly, 10% or more of the voting power of the Company’s outstanding voting shares or an affiliate or associate of the Maryland REIT who, at any time within the two-year period immediately prior to the date in question, was the beneficial owner of 10% or more of the voting power of the then-outstanding shares of the Company) or an affiliate of any interested shareholder and the Maryland REIT for five years after the most recent date on which the shareholder becomes an interested shareholder, and thereafter imposes two supermajority shareholder voting requirements on these combinations; |
|
|
• |
“control share” provisions that provide that, subject to certain exceptions, holders of “control shares” of our company (defined as voting shares that, if aggregated with all other shares owned or controlled by the acquirer, would entitle the acquirer to exercise one of three increasing ranges of voting power in electing trustees) acquired in a “control share acquisition” (defined as the direct or indirect acquisition of issued and outstanding “control shares”) have no voting rights with respect to the control shares except to the extent approved by our shareholders by the affirmative vote of at least two-thirds of all of the votes entitled to be cast on the matter, excluding all interested shares; and |
|
|
• |
Additionally, Title 3, Subtitle 8 of the MGCL permits the Board of Trustees, without shareholder approval and regardless of what is currently provided in our Declaration of Trust or bylaws, to implement certain takeover defenses. |
The Board of Trustees has, by resolution, exempted from the provisions of the Maryland Business Combination Act all business combinations (a) between us and (i) Sears Holdings or its affiliates or (ii) ESL or FCM and/or Fairholme Clients and their respective affiliates and (b) between us and any other person, provided that such business combination is first approved by the Board of Trustees (including a majority of our trustees who are not affiliates or associates of such person). In addition, our bylaws contain a provision opting out of the Maryland control share acquisition act.
- 17 -
We may experience uninsured or underinsured losses, or insurance proceeds may not otherwise be available to us which could result in a significant loss of the capital we have invested in a property, decrea se anticipated future revenues or cause us to incur unanticipated expense.
While the Master Lease and other existing third-party leases require, and new lease agreements are expected to require, that comprehensive general insurance and hazard insurance be maintained by the tenants with respect to their premises, and we have obtained casualty insurance with respect to our properties, there are certain types of losses, generally of a catastrophic nature, such as earthquakes, hurricanes and floods, that may be uninsurable or not economically insurable. Insurance coverage (net of deductibles) may not be effective or be sufficient to pay the full current market value or current replacement cost of a loss. Inflation, changes in building and zoning codes and ordinances, environmental considerations, and other factors also might make it infeasible to use insurance proceeds to restore or replace the property after such property has been damaged or destroyed. Under such circumstances, the insurance proceeds received might not be adequate to restore the economic position with respect to such property or to comply with the requirements of our mortgages and Property Restrictions. Moreover, the holders of any mortgage indebtedness may require some or all property insurance proceeds to be applied to reduce such indebtedness, rather than being made available for property restoration.
If we experience a loss that is uninsured or that exceeds our policy coverage limits, we could lose the capital invested in the damaged properties as well as the anticipated future cash flows from those properties. In addition, if the damaged properties were subject to recourse indebtedness, Property Restrictions or ground leases, we could continue to be liable for the indebtedness or subject to claims for damages even if these properties were irreparably damaged.
In addition, even if damage to our properties is covered by insurance, a disruption of our business or that of our tenants caused by a casualty event may result in the loss of business and/or tenants. The business interruption insurance we or our tenants carry may not fully compensate us for the loss of business or tenants due to an interruption caused by a casualty event. Further, if one of our tenants has insurance but is underinsured, that tenant may be unable to satisfy its payment obligations under its lease with us or its other payment or other obligations.
A disruption in the financial markets may make it more difficult to evaluate the stability, net assets and capitalization of insurance companies and any insurer’s ability to meet its claim payment obligations. A failure of an insurance company to make payments to us upon an event of loss covered by an insurance policy, losses in excess of our policy coverage limits or disruptions to our business or the business of our tenants caused by a casualty event could adversely affect our business, financial condition and results of operations.
Each JV may also experience uninsured or underinsured losses, and also faces other risks related to insurance that are similar to those we face, which could reduce the value of our investment in, or distributions to us by, one or more JVs, or require that we make additional capital contributions to one or more JVs.
Conflicts of interest may exist or could arise in the future between the interests of Seritage shareholders and the interests of holders of Operating Partnership units, and the partnership agreement of Operating Partnership grants holders of Operating Partnership units certain rights, which may harm the interests of Seritage shareholders.
Conflicts of interest may exist or could arise in the future as a result of the relationships between Seritage and its affiliates, on the one hand, and Operating Partnership or any of its partners, on the other. Seritage’s trustees and officers have duties to Seritage under Maryland law in connection with their oversight and management of the company. At the same time, Seritage, as general partner of Operating Partnership, will have duties and obligations to Operating Partnership and its limited partners under Delaware law, as modified by the partnership agreement of Operating Partnership in connection with the management of Operating Partnership.
For example, without the approval of the majority of the Operating Partnership units not held by Seritage and entities controlled by it, Seritage will be prohibited from taking certain extraordinary actions, including change of control transactions of Seritage or Operating Partnership.
ESL owns a substantial percentage of the Operating Partnership Units, which may be exchanged for cash or, at the election of Seritage, Class A common shares, and which will result in certain transactions involving Seritage or Operating Partnership requiring the approval of ESL.
ESL owns approximately 36.2% of the Operating Partnership units, with the remainder of the units held by the Company. In addition, ESL will have the right to acquire additional Operating Partnership units in order to allow it to maintain its relative ownership interest in Operating Partnership if Operating Partnership issues additional units to the Company under certain circumstances, including if we issue additional equity and contribute the funds to Operating Partnership to fund acquisitions or redevelopment of properties, among other uses. In addition, ESL will have the right to require the Operating Partnership to redeem its Operating Partnership units in whole
- 18 -
or in part in exchange for cash or, at the election of the Company, Class A common shares, except as descri bed below. Due to the ownership limits set forth in our Declaration of Trust, ESL may dispose of some or all of the Class A common shares it beneficially owns prior to exercising its right to require Operating Partnership to redeem Operating Partnership un its, and the partnership agreement of Operating Partnership will permit ESL (and only ESL) to transfer its Operating Partnership units to one or more underwriters to be exchanged for Class A common shares in connection with certain dispositions in order to achieve the same effect as would occur if ESL were to exchange a larger portion of its Operating Partnership units for Class A common shares and then dispose of those shares in an underwritten offering. Sales of a substantial number of Class A common shar es in connection with or to raise cash proceeds to facilitate, such a redemption, or the perception that such sales may occur, could adversely affect the market price of the Class A common shares.
In addition, the partnership agreement of Operating Partnership requires the approval of a majority of the Operating Partnership units not held by the Company and entities controlled by it for certain transactions and other actions, including certain change of control transactions involving Seritage or Operating Partnership, sales of all or substantially all of the assets of Operating Partnership, waivers to the excess share provision in the Declaration of Trust of the Company, certain modifications to the partnership agreement, withdrawal or succession of the Company as general partner of Operating Partnership, limits on the right of holders of Operating Partnership units to redeem their units, tax elections and certain other matters. As long as ESL owns a majority of the outstanding Operating Partnership units not held by the Company and entities controlled by it (and, for certain actions, as long as ESL holds at least 40% of the economic interests of Seritage and Operating Partnership on a combined basis), ESL’s approval will be required in order for the general partner to undertake such actions. If ESL refuses to approve a transaction, our business could be materially adversely affected. Furthermore, ESL owns approximately 2.9% of the outstanding Class A common shares, as well as Class B non-economic common shares having, in the aggregate, 3.9% of the voting power of the Company. In any of these matters, the interests of ESL may differ from or conflict with the interests of our other shareholders.
ESL exerts substantial influence over us and Sears Holdings, and its interests may differ from or conflict with the interests of our other shareholders.
ESL beneficially owns approximately 36.2% of the Operating Partnership units, and approximately 2.9% of the outstanding Class A common shares and Class B non-economic common shares having, in the aggregate, 3.9% of the voting power of Seritage. ESL also beneficially owns approximately 54.0% of the outstanding common stock of Sears Holdings. In addition, Mr. Lampert, the Chairman of the Board and Chief Executive Officer of Sears Holdings and Chairman and Chief Executive Officer of ESL, serves as the Chairman of the Seritage Board of Trustees. As a result, ESL and its affiliates have substantial influence over us and Sears Holdings. In any matter affecting us, including our relationship with Sears Holdings, the interests of ESL may differ from or conflict with the interests of our other shareholders.
The businesses of each of the GGP JVs, the Simon JV, and the Macerich JV are similar to our business and the occurrence of risks that adversely affect us could also adversely affect our investment in the GGP JVs, the Simon JV and/or the Macerich JV.
The GGP JVs are joint ventures that own and operate certain JV Properties, which consist of nine properties formerly owned or leased by Sears Holdings, the Simon JV is a joint venture that owns and operates certain other JV Properties, which consist of five other properties formerly owned by Sears Holdings and the Macerich JV is a joint venture that owns and operates the remaining JV Properties, which consist of nine other properties formerly owned by Sears Holdings. A substantial majority of the space at the JV Properties is leased by the applicable JV to Sears Holdings under the applicable JV Master Lease. Except with respect to the rent amounts and the properties covered, the general formats of the JV Master Leases are similar to one another and to the Master Lease, including with respect to the lessor’s right to recapture space leased to Sears Holdings (other than at one property owned by the Macerich JV) and Sears Holdings’ right to terminate a portion of the lease as to certain properties. As a result, each JV’s business is similar to our business, and each JV is subject to many of the same risks that we face. The occurrence of risks that adversely affect us could also adversely affect one or more JVs and reduce the value of our investment in, or distributions to us from, one or more JVs, or require that we make additional capital contributions to one or more JVs.
In addition, our influence over each JV may be limited by the fact that day-to-day operation of the GGP JVs, the Simon JV and the Macerich JV, and responsibility for leasing and redevelopment activities related to the JV Properties owned by the GGP JVs, the Simon JV and the Macerich JV, as applicable, are generally delegated to GGP, Simon and Macerich, respectively, subject to certain exceptions. The JV Properties owned by the GGP JVs are located at malls owned and operated by GGP, the JV Properties owned by the Simon JV are located at malls owned and operated by the Simon JV and the JV Properties owned by the Macerich JV are located at malls owned and operated by the Macerich JV. As a result, conflicts of interest may exist or could arise in the future between the interests of GGP, Simon or Macerich and our interests as a holder of 50% interests in the GGP JVs, the Simon JV and the Macerich JV, respectively, including, for example, with respect to decisions as to whether to lease to third parties space at a JV Property or other space at the mall at which such JV Property is located.
- 19 -
We depend on Sears Holdings to provide certain services at properties where Sears Holdings is the sole or primary tenant and may have difficulty finding replacement services or be required to pay incr eased costs to replace these services after our agreements with Sears Holdings expire.
We entered into various agreements that effected the purchase and sale of the acquired properties and the lease or sublease of a substantial majority of the acquired properties to Sears Holdings, including, among others, the Subscription, Distribution and Purchase and Sale Agreement and the Master Lease. The Master Lease governs the terms of the use and operation of the properties leased by us to Sears Holdings, including our redevelopment and recapture rights and Sears Holdings’ lease termination rights, and the repair, maintenance and redevelopment-related services Sears Holdings may provide to us. In addition, the Subscription, Distribution and Purchase and Sale Agreement provides for, among other things, our responsibility for liabilities relating to our business and the responsibility of Sears Holdings for liabilities unrelated to our business. The agreements between us and Sears Holdings also govern our various interim and ongoing relationships. The Subscription, Distribution and Purchase and Sale Agreement also contains indemnification obligations and ongoing commitments of us and Sears Holdings.
After the Master Lease expires, or if Sears Holdings is unable to meet its obligations under the Master Lease, we may be forced to seek replacement services from alternate providers. These replacement services may be more costly to us or of lower quality, and the transition process to a new service provider may result in interruptions to our business or operations, which could harm our financial condition or results of operations.
Sears Holdings has agreed to indemnify us for certain liabilities. However, these indemnities may be insufficient to insure us against the full amount of such liabilities, and Sears Holdings’ ability to satisfy its indemnification obligations may be impaired in the future.
Pursuant to the Subscription, Distribution and Purchase and Sale Agreement and the Master Lease, Sears Holdings has agreed to indemnify us for certain liabilities. However, third parties could seek to hold us responsible for any of the liabilities that Sears Holdings has agreed to retain, and Sears Holdings may be unable to fully satisfy its indemnification obligations. Moreover, even if we ultimately succeed in recovering from Sears Holdings any amounts for which we are held liable, we may be temporarily required to bear these losses while seeking recovery from Sears Holdings. Any liabilities in excess of amounts for which we receive timely indemnification from Sears Holdings could have a material adverse effect on our business and financial condition.
Risks Related to Status as a REIT
If we do not qualify to be taxed as a REIT, or fail to remain qualified as a REIT, we will be subject to U.S. federal income tax as a regular corporation and could face a substantial tax liability, which would reduce the amount of cash available for distribution to our shareholders.
We elected to be taxed as a REIT for U.S. federal income tax purposes commencing with our initial taxable year ended December 31, 2015 and have operated, and expect to continue to operate, to qualify as a REIT. In connection with the Transaction, and the December 2017 offering of Series A Preferred Shares, we received opinions of counsel concluding that we have been organized in conformity with the requirements for qualification as a REIT and our current and/or proposed method of operation should enable us to satisfy the requirements for qualification as a REIT as of the respective dates. Investors should be aware, however, that opinions of counsel are not binding on the IRS or any court, and that each opinion was expressed as of the date it was issued and has not been updated. We believe we have continued to operate in conformity with the requirements to qualify as a REIT and that we continue to satisfy all requirements to maintain our REIT status. However, qualification as a REIT involves the application of highly technical and complex provisions of the Code, for which only a limited number of judicial and administrative interpretations exist.
If we were to fail to qualify as a REIT in any taxable year, and no available relief provision applied, we would be subject to U.S. federal income tax, including, for any taxable year ending on or before December 31, 2017, any applicable alternative minimum tax, on our taxable income at regular corporate rates (which, in the case of U.S. federal income tax, is a maximum of 35% for periods ending on or before December 31, 2017 and 21% thereafter), and dividends paid to our shareholders would not be deductible by us in computing our taxable income. Any resulting corporate tax liability could be substantial and would reduce the amount of cash available for distribution to our shareholders, which in turn could have an adverse impact on the value of Class A common shares. Unless we were entitled to relief under certain Code provisions, we also would be disqualified from re-electing to be taxed as a REIT for the four taxable years following the year in which we failed to qualify as a REIT.
Qualifying as a REIT involves highly technical and complex provisions of the Code.
Qualification as a REIT involves the application of highly technical and complex Code provisions for which only limited judicial and administrative authorities exist. Even a technical or inadvertent violation could jeopardize our REIT qualification. Our qualification as a REIT depends on the satisfaction of certain asset, income, organizational, distribution, shareholder ownership and other requirements on a continuing basis. In addition, our ability to satisfy the requirements to qualify as a REIT may depend in part on the
- 20 -
actions of third parties over which we have no control or only limited influence, including in cases where we own an equity interest in an entity that is classified as a partnership for U.S. federal income tax purposes.
We could fail to qualify to be taxed as a REIT if income we receive from Sears Holdings is not treated as qualifying income.
Under applicable provisions of the Code, we will not be treated as a REIT unless we satisfy various requirements, including requirements relating to the sources of our gross income. Rents we receive or accrue from Sears Holdings may not be treated as qualifying rent for purposes of these requirements if the Master Lease is not respected as a true lease for U.S. federal income tax purposes and is instead treated as a service contract, joint venture, financing, or some other type of arrangement. If the Master Lease is not respected as a true lease for U.S. federal income tax purposes, we may fail to qualify to be taxed as a REIT. Furthermore, our qualification as a REIT depends on the satisfaction of certain asset, income, organizational, distribution, shareholder ownership and other requirements on a continuing basis. Our ability to satisfy the asset tests depends upon our analysis of the characterization and fair market values of our assets, some of which are not susceptible to a precise determination, and for some of which we will not obtain independent appraisals.
In addition, subject to certain exceptions, rents we receive or accrue from Sears Holdings (or other tenants) will not be treated as qualifying rent for purposes of these requirements if we or an actual or constructive owner of 10% or more of the Class A common shares actually or constructively owns 10% or more of the total combined voting power of all classes of Sears Holdings stock (or the stock of such other tenant) entitled to vote or 10% or more of the total value of all classes of Sears Holdings stock (or the stock of such other tenant). Our Declaration of Trust provides for restrictions on ownership and transfer of Class A common shares, including restrictions on such ownership or transfer that would cause the rents we receive or accrue from Sears Holdings (or other tenants) to be treated as non-qualifying rent for purposes of the REIT gross income requirements. Nevertheless, such restrictions may not be effective in ensuring that rents we receive or accrue from Sears Holdings (or other tenants) will be treated as qualifying rent for purposes of REIT qualification requirements.
Dividends payable by REITs do not qualify for the reduced tax rates available for certain “qualified dividends,” but would generally qualify for a partial deduction with respect to certain taxpayers.
The maximum U.S. federal income tax rate applicable to income from “qualified dividends” payable by U.S. corporations to U.S. shareholders that are individuals, trusts and estates is currently 20%. Dividends payable by REITs, however, generally are not eligible for the reduced rates. Although these rules do not adversely affect the taxation of REITs, the more favorable rates applicable to regular corporate qualified dividends could cause investors who are individuals, trusts and estates to perceive investments in REITs to be relatively less attractive than investments in the shares of non-REIT corporations that pay dividends, which could adversely affect the value of the shares of REITs, including the Class A common shares. However, for taxable years beginning after December 31, 2017 and ending before January 1, 2026, a U.S. shareholder that is an individual, trust or estate would generally be entitled to deduct up to 20% of certain ordinary REIT dividends, effectively reducing the rate at which such ordinary REIT dividends are subject to tax. U.S. shareholders should consult their own tax advisors regarding all aspects of such rules and their potential application to dividends from us.
REIT distribution requirements could adversely affect our ability to execute our business plan.
We generally must distribute annually at least 90% of our REIT taxable income, determined without regard to the dividends paid deduction and excluding any net capital gains, in order for us to qualify to be taxed as a REIT (assuming that certain other requirements are also satisfied) so that U.S. federal corporate income tax does not apply to earnings that we distribute. To the extent that we satisfy this distribution requirement and qualify for taxation as a REIT but distribute less than 100% of our REIT taxable income, determined without regard to the dividends paid deduction and including any net capital gains, we will be subject to U.S. federal corporate income tax on our undistributed net taxable income. In addition, we will be subject to a 4% nondeductible excise tax if the actual amount that we distribute to our shareholders in a calendar year is less than a minimum amount specified under U.S. federal tax laws. We intend to, at a minimum, make distributions to our shareholders to comply with the REIT requirements of the Code.
From time to time, we may generate taxable income greater than our cash flow as a result of differences in timing between the recognition of taxable income and the actual receipt of cash or the effect of nondeductible capital expenditures, the creation of reserves or required debt or amortization payments. If we do not have other funds available in these situations, we could be required to borrow funds on unfavorable terms, sell assets at disadvantageous prices or distribute amounts that would otherwise be invested in future acquisitions to make distributions sufficient to enable us to pay out enough of our taxable income to satisfy the REIT distribution requirement and to avoid corporate income tax and the 4% excise tax in a particular year; alternatively, we may distribute taxable stock dividends to our shareholders in the form of additional shares of stock – see “We may from time to time make distributions to our shareholders in the form of taxable stock dividends, which could result in shareholders incurring tax liability
- 21 -
without receiving sufficient cash to pay such tax”. These alternatives could increase our costs or reduce our equity. Thus, com pliance with the REIT requirements may hinder our ability to grow, which could adversely affect the value of Class A common shares.
Restrictions in our indebtedness, including restrictions on our ability to incur additional indebtedness or make certain distributions, could preclude us from meeting the 90% distribution requirement. Decreases in funds from operations due to unfinanced expenditures for acquisitions of properties or increases in the number of Class A common shares outstanding without commensurate increases in funds from operations each would adversely affect our ability to maintain distributions to our shareholders. Moreover, the failure of Sears Holdings to make rental payments under the Master Lease would materially impair our ability to make distributions. Consequently, we may be unable to make distributions at the anticipated distribution rate or any other rate.
We may from time to time make distributions to our shareholders in the form of taxable stock dividends, which could result in shareholders incurring tax liability without receiving sufficient cash to pay such tax.
Although we have no current intention to do so, we may in the future distribute taxable stock dividends to our shareholders in the form of additional shares of its stock. Taxable shareholders receiving such dividends will be required to include the full amount of the dividend as ordinary income to the extent of our current and accumulated earnings and profits for U.S. federal income tax purposes. As a result, shareholders may be required to pay income taxes with respect to such dividends in excess of the cash distributions received. If a U.S. shareholder sells our shares that it receives as a dividend in order to pay this tax, the sales proceeds may be less than the amount included in income with respect to the dividend, depending on the market price of our shares at the time of the sale. Furthermore, with respect to certain non-U.S. shareholders, we may be required to withhold U.S. federal income tax with respect to such dividends, including in respect of all or a portion of such dividend that is payable in its common stock.
Even if we remain qualified as a REIT, we may face other tax liabilities that reduce our cash flow.
Even if we remain qualified for taxation as a REIT, we may be subject to certain U.S. federal, state, local and foreign taxes on our income and assets, including taxes on any undistributed income and state, local or foreign income, property and transfer taxes. For example, in order to meet the REIT qualification requirements, we may hold some of our assets or conduct certain of our activities through one or more taxable REIT subsidiaries (“TRSs”) or other subsidiary corporations that will be subject to federal, state and local corporate-level income taxes as regular C corporations. In addition, we may incur a 100% excise tax on transactions with a TRS if they are not conducted on an arm’s-length basis. Any of these taxes would decrease cash available for distribution to our shareholders.
Complying with REIT requirements may cause us to liquidate or forgo otherwise attractive opportunities.
To qualify to be taxed as a REIT, we must ensure that, at the end of each calendar quarter, at least 75% of the value of our assets consists of cash, cash items, government securities and “real estate assets” (as defined in the Code), including certain mortgage loans and securities. The remainder of our investments (other than government securities, qualified real estate assets and securities issued by a TRS) generally cannot include more than 10% of the outstanding voting securities of any one issuer or more than 10% of the total value of the outstanding securities of any one issuer. In addition, in general, no more than 5% of the value of our total assets (other than government securities, qualified real estate assets and securities issued by a TRS) can consist of the securities of any one issuer, and no more than 20% of the value of our total assets can be represented by securities of one or more TRSs. If we fail to comply with these requirements at the end of any calendar quarter, we must correct the failure within 30 days after the end of the calendar quarter or qualify for certain statutory relief provisions to avoid losing our REIT qualification and suffering adverse tax consequences. As a result, we may be required to liquidate or forgo otherwise attractive investments. These actions could have the effect of reducing our income and amounts available for distribution to our shareholders.
In addition to the asset tests set forth above, to qualify to be taxed as a REIT, we must continually satisfy tests concerning, among other things, the sources of our income, the amounts we distribute to our shareholders and the ownership of our shares of beneficial interest. We may be unable to pursue investments that would be otherwise advantageous to us in order to satisfy the source-of-income or asset-diversification requirements for qualifying as a REIT. Thus, compliance with the REIT requirements may hinder our ability to make certain attractive investments.
Complying with REIT requirements may limit our ability to hedge effectively and may cause us to incur tax liabilities.
The REIT provisions of the Code substantially limit our ability to hedge our assets and liabilities. Any income from a hedging transaction that we enter into to manage risk of interest rate changes with respect to borrowings made or to be made to acquire or carry real estate assets (or that we enter into to manage risk with respect to a prior hedge entered into in connection with property that has been disposed of or liabilities that have been extinguished) does not constitute “gross income” for purposes of the 75% or 95% gross income tests that apply to REITs, provided that certain identification requirements are met. To the extent that we enter into other types of hedging transactions or fail to properly identify such transaction as a hedge, the income is likely to be treated as non-qualifying income for purposes of both of the gross income tests. As a result of these rules, we may be required to limit our use of advantageous hedging techniques or implement those hedges through a TRS. This could increase the cost of our hedging activities because our TRS may be subject to tax on gains or expose us to greater risks associated with changes in interest rates than we would otherwise want to
- 22 -
bear. In addition, losses in our TRS will generally not provide any tax benefit, except that such losses could theoretically be carried back or forward against past or future taxable incom e in the TRS.
Recent changes in tax law pursuant to the TCJA will affect the taxation of us and may affect the desirability of investing in a REIT relative to a regular non-REIT corporation.
The TCJA reduces the relative competitive advantage of operating as a REIT as compared with operating as a regular non-REIT corporation by reducing the maximum tax rate applicable to regular corporations from 35% to 21%, beginning on January 1, 2018. On the other hand, the TCJA also decreases the U.S. federal income tax rate applicable to non-corporate shareholders on ordinary REIT dividends as compared to current law, by lowering the maximum applicable individual rate from 39.6% to 37% and permitting non-corporate shareholders of REITs to deduct 20% of ordinary REIT dividends from taxable income for the taxable years beginning after December 31, 2017 and ending before January 1, 2026 (as discussed above). The TCJA will also limit the utilization of net operating loss carryforwards generally incurred after December 31, 2017 by a REIT and any TRS of a REIT to 80% of taxable income in the taxable year in which the carryforward is applied. This could cause a REIT in certain circumstances to have greater taxable income and thus increase the amount of distributions needed to satisfy the 90% distribution requirement and avoid incurring REIT-level tax. The TCJA also provides a new limitation on the deduction of “business interest” (i.e., interest paid or accrued on indebtedness allocable to a trade or business). A taxpayer engaged in certain businesses relating to real property may elect out of the business interest provision; however, the requirements of this election may be onerous to implement and would require the REIT to utilize potentially disadvantageous depreciation methods on some or all of its assets, including certain “qualified improvement property.” We will determine whether or not to make such an election in its sole discretion and based on all the facts and circumstances.
Legislative or other actions affecting REITs or other entities could have a negative effect on us.
The rules dealing with U.S. federal income taxation are constantly under review by persons involved in the legislative process and by the IRS and the U.S. Department of the Treasury (the “Treasury”). Changes to the tax laws or interpretations thereof, with or without retroactive application, could materially and adversely affect our investors or us. We cannot predict how changes in the tax laws might affect our investors or us. New legislation, Treasury regulations, administrative interpretations or court decisions could significantly and negatively affect our ability to qualify as a REIT or the U.S. federal income tax consequences to us and our investors of such qualification.
Risks Related to Ownership of our Securities
The market price and trading volume of our securities may be volatile.
The market price of our securities may be volatile, and the trading volume in our securities may fluctuate and cause significant price variations to occur. Some of the factors that could negatively affect the market price of our securities or result in fluctuations in the price or trading volume of our securities include:
|
|
• |
actual or anticipated variations in our quarterly results of operations or distributions; |
|
|
• |
changes in our funds from operations or earnings estimates; |
|
|
• |
publication of research reports about us or the real estate or retail industries; |
|
|
• |
increases in market interest rates that may cause purchasers of our securities to demand a higher yield; |
|
|
• |
changes in market valuations of similar companies; |
|
|
• |
adverse market reaction to any additional debt we may incur in the future; |
|
|
• |
actions by ESL or FCM and/or Fairholme Clients, or by institutional shareholders; |
|
|
• |
speculation in the press or investment community about our company or industry or the economy in general; |
|
|
• |
adverse performance by Sears Holdings, our largest tenant; |
|
|
• |
the occurrence of any of the other risk factors presented in this filing; |
|
|
• |
specific real estate market and real estate economic conditions; and |
|
|
• |
general market and economic conditions. |
- 23 -
We have issued Series A Preferred Shares, which, along with future offerings of debt or preferred equity securities, rank senior to our common shares for purposes of distributions or upon liquidation, may adversely affect the marke t price of our common shares.
We have issued 2,800,000 Series A Cumulative Redeemable Preferred Shares, which are senior to our common shares for purposes of distributions or upon liquidation. The Series A Preferred Shares may limit our ability to make distributions to holders of our common shares.
In the future, we may attempt to increase our capital resources by making additional offerings of debt or preferred equity securities, including medium-term notes, trust preferred securities, senior or subordinated notes and preferred shares. Upon liquidation, holders of our debt securities, Series A Preferred Shares and any additional preferred shares and lenders with respect to other borrowings may receive distributions of our available assets prior to the holders of our common shares. Any additional equity offerings may dilute the holdings of our existing shareholders or reduce the market price of our common shares, or both. Holders of our common shares are not entitled to preemptive rights or other protections against dilution, and will have no voting rights in connection with the issuance of these securities. Our Series A Preferred Shares have, and any additional preferred shares of beneficial interest issued could have, a preference on liquidating distributions or a preference on distribution payments that could limit our ability to make a distribution to the holders of our common shares. Since our decision to issue securities in any future offering will depend in part on market conditions and other factors beyond our control, we cannot predict or estimate the amount, timing or nature of our future offerings. Thus, our shareholders bear the risk of our future offerings reducing the market price of our common shares and diluting their holdings in us.
The transactions with Sears Holdings could give rise to disputes or other unfavorable effects, which could have a material adverse effect on our business, financial condition or results of operations.
Disputes with third parties could arise out of our transactions with Sears Holdings, and we could experience unfavorable reactions from employees, ratings agencies, regulators or other interested parties. These disputes and reactions of third parties could have a material adverse effect on our business, financial condition or results of operations. In addition, disputes between us and Sears Holdings (and our subsidiaries) could arise in connection with any of the Subscription, Distribution and Purchase and Sale Agreement, the Master Lease or other agreements.
A court could deem aspects of the transactions with Sears Holdings to be a fraudulent conveyance and void the transaction or impose substantial liabilities upon us.
A court could deem aspects of the transactions with Sears Holdings (such as the acquisition of properties from Sears Holdings) to be a fraudulent conveyance upon a subsequent legal challenge by unpaid creditors or a bankruptcy trustee of the debtor that made the conveyance. Fraudulent conveyances include transfers made or obligations incurred with the actual intent to hinder, delay or defraud current or future creditors, or transfers made or obligations incurred in exchange for less than reasonably equivalent value when the debtor was, or was rendered, insolvent, inadequately capitalized or unable to pay its debts as they become due. To remedy a fraudulent conveyance, a court could void the challenged transfer or obligation, requiring us to return consideration that we received, or impose substantial liabilities upon us for the benefit of unpaid creditors of the debtor that made the fraudulent conveyance, which could adversely affect our financial condition and our results of operations. Among other things, the court could require our shareholders to return to Sears Holdings some or all of the Class A common shares issued in the distribution. Whether a transaction is a fraudulent conveyance may vary depending upon, among other things, the jurisdiction whose law is being applied.
The number of shares available for future sale could adversely affect the market price of Class A common shares.
We cannot predict whether future issuances of Class A common shares, the availability of Class A common shares for resale in the open market or the conversion of Class C non-voting common shares into Class A common shares will decrease the market price per share of Class A common shares. Sales of a substantial number of Class A common shares in the public market, or the perception that such sales might occur, could adversely affect the market price of the Class A common shares.
Our earnings and cash distributions will affect the market price of Class A common shares.
We believe that the market value of a REIT’s equity securities is based primarily upon market perception of the REIT’s growth potential and its current and potential future cash distributions, whether from operations, sales, acquisitions, development or refinancing, and is secondarily based upon the value of the underlying assets. For these reasons, Class A common shares and Class C non-voting common shares may trade at prices that are higher or lower than the net asset value per share. To the extent we retain operating cash flow for investment purposes, working capital reserves or other purposes rather than distributing the cash flow to shareholders, these retained funds, while increasing the value of our underlying assets, may negatively impact the market price of Class A common shares. Our failure to meet market expectations with regard to future earnings and cash distributions would likely adversely affect the market price of Class A common shares and Class C non-voting common shares.
- 24 -
The Series A Preferred Shares have not been rated.
The Series A Preferred Shares have not been rated, and may never be rated, by any nationally recognized statistical rating organization, which may negatively affect their market value and your ability to sell such shares. It is possible, however, that one or more rating agencies might independently determine to assign a rating to the Series A Preferred Shares or that we may elect to obtain a rating of the Series A Preferred Shares in the future. Furthermore, we may elect to issue other securities for which we may seek to obtain a rating. If any ratings are assigned to the Series A Preferred Shares in the future or if we issue other securities with a rating, such ratings, if they are lower than market expectations or are subsequently lowered or withdrawn, could adversely affect the market for or the market value of the Series A Preferred Shares. Ratings only reflect the views of the issuing rating agency or agencies, and such ratings could at any time be revised downward or withdrawn entirely at the discretion of the issuing rating agency. Any such downward revision or withdrawal of a rating could have an adverse effect on the market price of the Series A Preferred Shares. Further, a rating is not a recommendation to purchase, sell or hold any particular security, including the Series A Preferred Shares. In addition, ratings do not reflect market prices or suitability of a security for a particular investor and any future rating of the Series A Preferred Shares may not reflect all risks related to us and our business, or the structure or market value of the Series A Preferred Shares.
The Series A Preferred Shares are a new issue of securities, and an active trading market may not develop or, even if it does develop, may not continue, which may negatively affect the market value of, and the ability of holders of our Series A Preferred Shares to transfer or sell, their shares.
The Series A Preferred Shares are a new issue of securities. Since the Series A Preferred Shares have no stated maturity date, investors seeking liquidity will be limited to selling their shares in the secondary market. The Series A Preferred Shares are listed on the NYSE under the symbol “SRG PrA,” but there can be no assurance that an active trading market on the NYSE for the Series A Preferred Shares will develop or continue, in which case the market price of the Series A Preferred Shares could be materially and adversely affected and the ability to transfer or sell Series A Preferred Shares would be limited. The market price of the shares will depend on many factors, including:
|
|
• |
prevailing interest rates; |
|
|
• |
the market for similar securities; |
|
|
• |
investors’ perceptions of us; |
|
|
• |
our issuance of additional preferred equity or indebtedness; |
|
|
• |
general economic and market conditions; and |
|
|
• |
our financial condition, results of operations, business and prospects. |
The Series A Preferred Shares are subordinate in right of payment to our existing and future debt, and your interests could be diluted by the issuance of additional preferred shares, including additional Series A Preferred Shares, and by other transactions.
The Series A Preferred Shares rank junior to all of our existing and future debt and to other non-equity claims on us and our assets available to satisfy claims against us, including claims in bankruptcy, liquidation or similar proceedings. Our future debt may include restrictions on our ability to pay dividends to preferred shareholders. As of December 31, 2017, our total indebtedness was approximately $1.36 billion. In addition, we may incur additional indebtedness in the future. Our declaration of trust currently authorizes the issuance of up to 10,000,000 shares of preferred shares in one or more classes or series. Our board of trustees has the power to reclassify unissued common shares and preferred shares and to amend our declaration of trust, without any action by our shareholders, to increase the aggregate number of shares of beneficial interest of any class or series, including preferred shares, that we are authorized to issue. The issuance of additional preferred shares on parity with or senior to the Series A Preferred Shares with respect to the payment of dividends and the distribution of assets in the event of any liquidation, dissolution or winding up would dilute the interests of the holders of the Series A Preferred Shares, and any issuance of preferred shares senior to the Series A Preferred Shares or of additional indebtedness could adversely affect our ability to pay dividends on, redeem or pay the liquidation preference on the Series A Preferred Shares. Other than the limited conversion right afforded to holders of Series A Preferred Shares that may occur in connection with a Change of Control, none of the provisions relating to the Series A Preferred Shares contain any provisions relating to or limiting our indebtedness or affording the holders of the Series A Preferred Shares protection in the event of a highly leveraged or other transaction, including a merger or the sale, lease or conveyance of all or substantially all our assets or business, that might adversely affect the holders of the Series A Preferred Shares, so long as the rights of holders of the Series A Preferred Shares are not materially and adversely affected.
- 25 -
Dividends on our preferred shares, including the Series A Preferred Shares, are discretionary. We cannot guarantee that we will be able to pay dividends in the future or what the actual dividends will be for any future period.
Future dividends on our preferred shares, including the Series A Preferred Shares, will be authorized by our board of trustees and declared by us at the discretion of our board of trustees and will depend on, among other things, our results of operations, cash flow from operations, financial condition and capital requirements, any debt service requirements and any other factors our board of trustees deems relevant. Accordingly, we cannot guarantee that we will be able to make cash dividends on our preferred shares or what the actual dividends will be for any future period. However, until we declare payment and pay or set apart the accrued dividends on the Series A Preferred Shares, our ability to pay dividends and make other distributions on our common shares and non-voting shares (including redemptions) will be limited by the terms of the Series A Preferred Shares.
Holders of Series A Preferred Shares will have limited voting rights.
Holders of the Series A Preferred Shares have limited voting rights. Our common shares and our non-economic shares are currently the only shares of beneficial interest of our company with full voting rights. Voting rights for holders of Series A Preferred Shares exist primarily with respect to the right to elect two additional trustees to our board of trustees in the event that six quarterly dividends (whether or not consecutive) payable on the Series A Preferred Shares are in arrears, and with respect to voting on amendments to our declaration of trust or articles supplementary relating to the Series A Preferred Shares that would materially and adversely affect the rights of holders of the Series A Preferred Shares or create additional classes or series of our shares that are senior to the Series A Preferred Shares with respect to the payment of dividends and the distribution of assets in the event of any liquidation, dissolution or winding up of our affairs. Other than in limited circumstances, holders of Series A Preferred Shares will not have any voting rights.
There are no unresolved comments from the staff of the SEC as of the date of this Annual Report.
- 26 -
As of December 31, 2017, our portfolio included 230 Wholly Owned Properties totaling approximately 35.2 million square feet of GLA across 49 states and Puerto Rico, and 50% interests in 23 JV Properties totaling over 4.2 million square feet of GLA across 13 states. The following tables set forth certain information regarding our Wholly Owned Properties and JV Properties based on signed leases as of December 31, 2017, including signed but not yet open leases (“SNO leases”):
|
Wholly Owned Properties |
|
||||||||||||||||||||||||||||||
|
|
|
|
|
|
|
Recapture |
|
|
|
|
GLA (3) |
|
|
|
|
|
|
|
|||||||||||||
|
|
|
City |
|
State |
|
Rights (1)(2) |
|
|
Sears or Kmart |
|
Total |
|
|
Sears Holdings |
|
|
Third Parties |
|
|
Not Leased |
|
|
Significant Third Party Tenants (3) |
|
Leased (3) |
|
|||||
|
1 |
|
Anchorage |
|
AK |
|
(4) |
|
|
Sears |
|
|
257,800 |
|
|
|
124,700 |
|
|
|
122,200 |
|
|
|
10,900 |
|
|
Guitar Center, Lands' End, Nordstrom Rack, Safeway |
|
|
95.8 |
% |
|
2 |
|
Cullman |
|
AL |
|
(5) |
|
|
n/a |
|
|
99,000 |
|
|
|
— |
|
|
|
88,500 |
|
|
|
10,500 |
|
|
Bargain Hunt, Tractor Supply, Planet Fitness |
|
|
89.4 |
% |
|
3 |
|
North Little Rock |
|
AR |
|
(4) |
|
|
Sears |
|
|
185,700 |
|
|
|
179,400 |
|
|
|
6,300 |
|
|
|
— |
|
|
Longhorn Steakhouse |
|
|
100.0 |
% |
|
4 |
|
Russellville |
|
AR |
|
50% |
|
|
Kmart |
|
|
88,000 |
|
|
|
88,000 |
|
|
|
— |
|
|
|
— |
|
|
n/a |
|
|
100.0 |
% |
|
5 |
|
Flagstaff |
|
AZ |
|
50% |
|
|
Sears |
|
|
66,200 |
|
|
|
66,200 |
|
|
|
— |
|
|
|
— |
|
|
n/a |
|
|
100.0 |
% |
|
6 |
|
Mesa |
|
AZ |
|
50% |
|
|
Sears |
|
|
121,900 |
|
|
|
121,900 |
|
|
|
— |
|
|
|
— |
|
|
n/a |
|
|
100.0 |
% |
|
7 |
|
Peoria |
|
AZ |
|
n/a |
|
|
n/a |
|
|
104,400 |
|
|
|
— |
|
|
|
104,400 |
|
|
|
— |
|
|
At Home |
|
|
100.0 |
% |
|
8 |
|
Phoenix |
|
AZ |
|
50% |
|
|
Sears |
|
|
144,200 |
|
|
|
144,200 |
|
|
|
— |
|
|
|
— |
|
|
n/a |
|
|
100.0 |
% |
|
9 |
|
Phoenix |
|
AZ |
|
n/a |
|
|
n/a |
|
|
151,200 |
|
|
|
— |
|
|
|
151,200 |
|
|
|
— |
|
|
At Home |
|
|
100.0 |
% |
|
10 |
|
Prescott |
|
AZ |
|
50% |
|
|
Sears |
|
|
102,300 |
|
|
|
102,300 |
|
|
|
— |
|
|
|
— |
|
|
n/a |
|
|
100.0 |
% |
|
11 |
|
Sierra Vista |
|
AZ |
|
50% |
|
|
Sears |
|
|
94,700 |
|
|
|
94,700 |
|
|
|
— |
|
|
|
— |
|
|
n/a |
|
|
100.0 |
% |
|
12 |
|
Sierra Vista |
|
AZ |
|
(5) |
|
|
n/a |
|
|
86,100 |
|
|
|
— |
|
|
|
— |
|
|
|
86,100 |
|
|
n/a |
|
|
0.0 |
% |
|
13 |
|
Tucson |
|
AZ |
|
50% |
|
|
Sears |
|
|
250,100 |
|
|
|
199,500 |
|
|
|
50,600 |
|
|
|
— |
|
|
Round One Entertainment |
|
|
100.0 |
% |
|
14 |
|
Yuma |
|
AZ |
|
50% |
|
|
Sears |
|
|
90,400 |
|
|
|
90,400 |
|
|
|
— |
|
|
|
— |
|
|
n/a |
|
|
100.0 |
% |
|
15 |
|
Antioch |
|
CA |
|
50% |
|
|
Kmart |
|
|
95,200 |
|
|
|
95,200 |
|
|
|
— |
|
|
|
— |
|
|
n/a |
|
|
100.0 |
% |
|
16 |
|
Big Bear Lake |
|
CA |
|
50% |
|
|
Kmart |
|
|
80,400 |
|
|
|
69,300 |
|
|
|
5,600 |
|
|
|
5,500 |
|
|
Subway, Wells Fargo Bank |
|
|
93.2 |
% |
|
17 |
|
Carson |
|
CA |
|
(4) |
|
|
n/a |
|
|
182,900 |
|
|
|
— |
|
|
|
101,200 |
|
|
|
81,700 |
|
|
Burlington Stores, Chipotle, Jersey Mike’s, Ross Dress for Less, Smash Burger |
|
|
55.3 |
% |
|
18 |
|
Chula Vista |
|
CA |
|
50% |
|
|
Sears |
|
|
250,100 |
|
|
|
250,100 |
|
|
|
— |
|
|
|
— |
|
|
n/a |
|
|
100.0 |
% |
|
19 |
|
Citrus Heights |
|
CA |
|
50% |
|
|
Sears |
|
|
289,500 |
|
|
|
280,700 |
|
|
|
8,800 |
|
|
|
— |
|
|
Lands' End |
|
|
100.0 |
% |
|
20 |
|
Delano |
|
CA |
|
50% |
|
|
Kmart |
|
|
86,100 |
|
|
|
86,100 |
|
|
|
— |
|
|
|
— |
|
|
n/a |
|
|
100.0 |
% |
|
21 |
|
El Cajon |
|
CA |
|
50% |
|
|
Sears |
|
|
286,500 |
|
|
|
243,600 |
|
|
|
42,900 |
|
|
|
— |
|
|
Bob's Discount Furniture, Lands' End |
|
|
100.0 |
% |
|
22 |
|
El Centro |
|
CA |
|
50% |
|
|
Sears |
|
|
139,700 |
|
|
|
139,700 |
|
|
|
— |
|
|
|
— |
|
|
n/a |
|
|
100.0 |
% |
|
23 |
|
Fairfield |
|
CA |
|
(4) |
|
|
Sears |
|
|
164,200 |
|
|
|
131,200 |
|
|
|
33,000 |
|
|
|
— |
|
|
Dave & Busters, Lands' End |
|
|
100.0 |
% |
|
24 |
|
Florin |
|
CA |
|
50% |
|
|
Sears |
|
|
272,700 |
|
|
|
272,700 |
|
|
|
— |
|
|
|
— |
|
|
n/a |
|
|
100.0 |
% |
|
25 |
|
Fresno |
|
CA |
|
50% |
|
|
Sears |
|
|
217,600 |
|
|
|
174,200 |
|
|
|
43,400 |
|
|
|
— |
|
|
Ross Dress for Less, dd's Discounts |
|
|
100.0 |
% |
|
26 |
|
McKinleyville |
|
CA |
|
50% |
|
|
Kmart |
|
|
94,800 |
|
|
|
94,800 |
|
|
|
— |
|
|
|
— |
|
|
n/a |
|
|
100.0 |
% |
|
27 |
|
Merced |
|
CA |
|
50% |
|
|
Sears |
|
|
92,600 |
|
|
|
92,600 |
|
|
|
— |
|
|
|
— |
|
|
n/a |
|
|
100.0 |
% |
|
28 |
|
Montclair |
|
CA |
|
50% |
|
|
Sears |
|
|
174,700 |
|
|
|
174,700 |
|
|
|
— |
|
|
|
— |
|
|
n/a |
|
|
100.0 |
% |
|
29 |
|
Moreno Valley |
|
CA |
|
50% |
|
|
Sears |
|
|
169,400 |
|
|
|
169,400 |
|
|
|
— |
|
|
|
— |
|
|
n/a |
|
|
100.0 |
% |
|
30 |
|
Newark |
|
CA |
|
50% |
|
|
Sears |
|
|
145,800 |
|
|
|
145,800 |
|
|
|
— |
|
|
|
— |
|
|
n/a |
|
|
100.0 |
% |
|
31 |
|
North Hollywood |
|
CA |
|
(4) |
|
|
Sears |
|
|
166,800 |
|
|
|
87,000 |
|
|
|
74,900 |
|
|
|
4,900 |
|
|
Burlington Stores, Ross Dress for Less |
|
|
97.1 |
% |
|
32 |
|
Palm Desert |
|
CA |
|
50% |
|
|
Sears |
|
|
136,500 |
|
|
|
136,500 |
|
|
|
— |
|
|
|
— |
|
|
n/a |
|
|
100.0 |
% |
|
33 |
|
Ramona |
|
CA |
|
50% |
|
|
Kmart |
|
|
107,600 |
|
|
|
87,000 |
|
|
|
14,700 |
|
|
|
5,900 |
|
|
Dollar Tree |
|
|
94.5 |
% |
|
34 |
|
Riverside |
|
CA |
|
50% |
|
|
Sears |
|
|
214,200 |
|
|
|
202,000 |
|
|
|
12,200 |
|
|
|
— |
|
|
Bank of America |
|
|
100.0 |
% |
|
35 |
|
Riverside |
|
CA |
|
(5) |
|
|
n/a |
|
|
132,600 |
|
|
|
— |
|
|
|
38,100 |
|
|
|
94,500 |
|
|
Jack in the Box, Stater Brothers |
|
|
28.7 |
% |
|
36 |
|
Roseville |
|
CA |
|
(4) |
|
|
Sears |
|
|
139,000 |
|
|
|
13,200 |
|
|
|
125,800 |
|
|
|
— |
|
|
AAA, Cinemark, Lands' End, Round One Entertainment |
|
|
100.0 |
% |
|
37 |
|
Salinas |
|
CA |
|
50% |
|
|
Sears |
|
|
133,000 |
|
|
|
133,000 |
|
|
|
— |
|
|
|
— |
|
|
n/a |
|
|
100.0 |
% |
|
38 |
|
San Bernardino |
|
CA |
|
100% |
|
|
Sears |
|
|
264,700 |
|
|
|
264,700 |
|
|
|
— |
|
|
|
— |
|
|
n/a |
|
|
100.0 |
% |
|
39 |
|
San Bruno |
|
CA |
|
50% |
|
|
Sears |
|
|
276,600 |
|
|
|
267,900 |
|
|
|
8,700 |
|
|
|
— |
|
|
Lands' End |
|
|
100.0 |
% |
|
40 |
|
San Diego |
|
CA |
|
(4) |
|
|
n/a |
|
|
226,200 |
|
|
|
— |
|
|
|
20,200 |
|
|
|
206,000 |
|
|
n/a |
|
|
8.9 |
% |
- 27 -
|
Wholly Owned Properties |
|
||||||||||||||||||||||||||||||
|
|
|
|
|
|
|
Recapture |
|
|
|
|
GLA (3) |
|
|
|
|
|
|
|
|||||||||||||
|
|
|
City |
|
State |
|
Rights (1)(2) |
|
|
Sears or Kmart |
|
Total |
|
|
Sears Holdings |
|
|
Third Parties |
|
|
Not Leased |
|
|
Significant Third-Party Tenants (3) |
|
Leased (3) |
|
|||||
|
41 |
|
San Jose |
|
CA |
|
50% |
|
|
Sears |
|
|
262,500 |
|
|
|
262,500 |
|
|
|
— |
|
|
|
— |
|
|
n/a |
|
|
100.0 |
% |
|
42 |
|
Santa Cruz |
|
CA |
|
(4) |
|
|
Sears |
|
|
123,800 |
|
|
|
63,300 |
|
|
|
48,900 |
|
|
|
11,600 |
|
|
TJ Maxx |
|
|
90.6 |
% |
|
43 |
|
Santa Maria |
|
CA |
|
50% |
|
|
Sears |
|
|
108,600 |
|
|
|
108,600 |
|
|
|
— |
|
|
|
— |
|
|
n/a |
|
|
100.0 |
% |
|
44 |
|
Santa Monica |
|
CA |
|
(4) |
|
|
Sears |
|
|
117,800 |
|
|
|
112,000 |
|
|
|
5,800 |
|
|
|
— |
|
|
n/a |
|
|
100.0 |
% |
|
45 |
|
Santa Paula |
|
CA |
|
50% |
|
|
Kmart |
|
|
71,300 |
|
|
|
71,300 |
|
|
|
— |
|
|
|
— |
|
|
n/a |
|
|
100.0 |
% |
|
46 |
|
Temecula |
|
CA |
|
(4) |
|
|
Sears |
|
|
115,700 |
|
|
|
67,000 |
|
|
|
48,700 |
|
|
|
— |
|
|
Round One Entertainment |
|
|
100.0 |
% |
|
47 |
|
Thousand Oaks |
|
CA |
|
50% |
|
|
Sears |
|
|
164,000 |
|
|
|
50,300 |
|
|
|
113,700 |
|
|
|
— |
|
|
Dave & Busters, DSW, Nordstrom Rack |
|
|
100.0 |
% |
|
48 |
|
Ventura |
|
CA |
|
50% |
|
|
Sears |
|
|
178,600 |
|
|
|
171,900 |
|
|
|
6,700 |
|
|
|
— |
|
|
Lands' End |
|
|
100.0 |
% |
|
49 |
|
Visalia |
|
CA |
|
50% |
|
|
Sears |
|
|
75,600 |
|
|
|
75,600 |
|
|
|
— |
|
|
|
— |
|
|
n/a |
|
|
100.0 |
% |
|
50 |
|
West Covina |
|
CA |
|
50% |
|
|
Sears |
|
|
142,000 |
|
|
|
142,000 |
|
|
|
— |
|
|
|
— |
|
|
n/a |
|
|
100.0 |
% |
|
51 |
|
Westminster |
|
CA |
|
(4) |
|
|
Sears |
|
|
197,900 |
|
|
|
197,900 |
|
|
|
— |
|
|
|
— |
|
|
n/a |
|
|
100.0 |
% |
|
52 |
|
Lakewood |
|
CO |
|
50% |
|
|
Sears |
|
|
153,000 |
|
|
|
153,000 |
|
|
|
— |
|
|
|
— |
|
|
n/a |
|
|
100.0 |
% |
|
53 |
|
Thornton |
|
CO |
|
(5) |
|
|
n/a |
|
|
186,800 |
|
|
|
— |
|
|
|
57,000 |
|
|
|
129,800 |
|
|
Vasa Fitness |
|
|
30.5 |
% |
|
54 |
|
Waterford |
|
CT |
|
50% |
|
|
Sears |
|
|
149,300 |
|
|
|
141,800 |
|
|
|
7,500 |
|
|
|
— |
|
|
Lands' End |
|
|
100.0 |
% |
|
55 |
|
West Hartford |
|
CT |
|
(4) |
|
|
n/a |
|
|
163,700 |
|
|
|
— |
|
|
|
97,000 |
|
|
|
66,700 |
|
|
buybuy Baby, Cost Plus World Market, Olive Garden, REI, Saks OFF Fifth, Shake Shack |
|
|
59.3 |
% |
|
56 |
|
Rehoboth Beach |
|
DE |
|
(4) |
|
|
Kmart |
|
|
123,300 |
|
|
|
65,200 |
|
|
|
58,100 |
|
|
|
— |
|
|
andThat!, Chick-Fil-A, PetSmart |
|
|
100.0 |
% |
|
57 |
|
Boca Raton |
|
FL |
|
(4) |
|
|
Sears |
|
|
178,500 |
|
|
|
167,600 |
|
|
|
10,900 |
|
|
|
— |
|
|
Lands' End, Washington Mutual |
|
|
100.0 |
% |
|
58 |
|
Bradenton |
|
FL |
|
50% |
|
|
Sears |
|
|
99,900 |
|
|
|
99,900 |
|
|
|
— |
|
|
|
— |
|
|
n/a |
|
|
100.0 |
% |
|
59 |
|
Bradenton |
|
FL |
|
50% |
|
|
Kmart |
|
|
82,900 |
|
|
|
82,900 |
|
|
|
— |
|
|
|
— |
|
|
n/a |
|
|
100.0 |
% |
|
60 |
|
Clearwater |
|
FL |
|
50% |
|
|
Sears |
|
|
211,200 |
|
|
|
129,700 |
|
|
|
81,500 |
|
|
|
— |
|
|
Lands' End, Nordstrom Rack, Whole Foods |
|
|
100.0 |
% |
|
61 |
|
Doral |
|
FL |
|
50% |
|
|
Sears |
|
|
212,900 |
|
|
|
212,900 |
|
|
|
— |
|
|
|
— |
|
|
n/a |
|
|
100.0 |
% |
|
62 |
|
Ft. Myers |
|
FL |
|
50% |
|
|
Sears |
|
|
146,800 |
|
|
|
146,800 |
|
|
|
— |
|
|
|
— |
|
|
n/a |
|
|
100.0 |
% |
|
63 |
|
Gainesville |
|
FL |
|
50% |
|
|
Sears |
|
|
140,500 |
|
|
|
140,500 |
|
|
|
— |
|
|
|
— |
|
|
n/a |
|
|
100.0 |
% |
|
64 |
|
Hialeah |
|
FL |
|
50% |
|
|
Sears |
|
|
197,400 |
|
|
|
184,400 |
|
|
|
13,000 |
|
|
|
— |
|
|
Forever 21, Goodwill |
|
|
100.0 |
% |
|
65 |
|
Hialeah |
|
FL |
|
(4) |
|
|
n/a |
|
|
100,600 |
|
|
|
— |
|
|
|
74,700 |
|
|
|
25,900 |
|
|
Aldi, Bed, Bath & Beyond, Ross Dress for Less |
|
|
74.3 |
% |
|
66 |
|
Kissimmee |
|
FL |
|
(5) |
|
|
n/a |
|
|
148,900 |
|
|
|
— |
|
|
|
36,400 |
|
|
|
112,500 |
|
|
Big Lots |
|
|
24.4 |
% |
|
67 |
|
Lakeland |
|
FL |
|
50% |
|
|
Sears |
|
|
156,200 |
|
|
|
156,200 |
|
|
|
— |
|
|
|
— |
|
|
n/a |
|
|
100.0 |
% |
|
68 |
|
Melbourne |
|
FL |
|
50% |
|
|
Sears |
|
|
102,600 |
|
|
|
102,600 |
|
|
|
— |
|
|
|
— |
|
|
n/a |
|
|
100.0 |
% |
|
69 |
|
Miami |
|
FL |
|
(4) |
|
|
n/a |
|
|
173,300 |
|
|
|
— |
|
|
|
— |
|
|
|
173,300 |
|
|
n/a |
|
|
0.0 |
% |
|
70 |
|
Miami |
|
FL |
|
100% |
|
|
Sears |
|
|
170,100 |
|
|
|
170,100 |
|
|
|
— |
|
|
|
— |
|
|
n/a |
|
|
100.0 |
% |
|
71 |
|
North Miami |
|
FL |
|
(4) |
|
|
n/a |
|
|
119,900 |
|
|
|
— |
|
|
|
119,900 |
|
|
|
— |
|
|
Aldi, Burlington Stores, Michaels Stores, PetSmart, Ross Dress for Less |
|
|
100.0 |
% |
|
72 |
|
Ocala |
|
FL |
|
50% |
|
|
Sears |
|
|
146,200 |
|
|
|
146,200 |
|
|
|
— |
|
|
|
— |
|
|
n/a |
|
|
100.0 |
% |
|
73 |
|
Orange Park |
|
FL |
|
n/a |
|
|
n/a |
|
|
87,400 |
|
|
|
— |
|
|
|
87,400 |
|
|
|
— |
|
|
Freddy's Frozen Custard, Old Time Pottery |
|
|
100.0 |
% |
|
74 |
|
Orlando |
|
FL |
|
(4) |
|
|
n/a |
|
|
130,400 |
|
|
|
— |
|
|
|
114,200 |
|
|
|
16,200 |
|
|
Floor & Décor, Longhorn Steakhouse, Olive Garden, Orchard Supply Hardware |
|
|
87.6 |
% |
|
75 |
|
Panama City |
|
FL |
|
50% |
|
|
Sears |
|
|
139,300 |
|
|
|
139,300 |
|
|
|
— |
|
|
|
— |
|
|
n/a |
|
|
100.0 |
% |
|
76 |
|
Pensacola |
|
FL |
|
50% |
|
|
Sears |
|
|
212,300 |
|
|
|
212,300 |
|
|
|
— |
|
|
|
— |
|
|
n/a |
|
|
100.0 |
% |
|
77 |
|
Plantation |
|
FL |
|
(4) |
|
|
Sears |
|
|
201,600 |
|
|
|
153,600 |
|
|
|
48,000 |
|
|
|
— |
|
|
GameTime |
|
|
100.0 |
% |
|
78 |
|
Sarasota |
|
FL |
|
(5) |
|
|
n/a |
|
|
204,500 |
|
|
|
— |
|
|
|
— |
|
|
|
204,500 |
|
|
n/a |
|
|
0.0 |
% |
|
79 |
|
St. Petersburg |
|
FL |
|
50% |
|
|
Kmart |
|
|
120,600 |
|
|
|
120,600 |
|
|
|
— |
|
|
|
— |
|
|
n/a |
|
|
100.0 |
% |
|
80 |
|
St. Petersburg |
|
FL |
|
(4) |
|
|
n/a |
|
|
147,800 |
|
|
|
— |
|
|
|
138,600 |
|
|
|
9,200 |
|
|
Chili's Grill & Bar, Dick's Sporting Goods, Five Below, Longhorn Steakhouse, Lucky's Market, PetSmart, Pollo Tropical |
|
|
93.8 |
% |
|
81 |
|
Savannah |
|
GA |
|
100% |
|
|
Sears |
|
|
167,300 |
|
|
|
155,700 |
|
|
|
11,600 |
|
|
|
— |
|
|
Golden Corral |
|
|
100.0 |
% |
|
82 |
|
Honolulu |
|
HI |
|
(4) |
|
|
n/a |
|
|
128,900 |
|
|
|
— |
|
|
|
128,900 |
|
|
|
— |
|
|
Long's Drugs (CVS), PetSmart, Ross Dress for Less |
|
|
100.0 |
% |
|
83 |
|
Algona |
|
IA |
|
50% |
|
|
Kmart |
|
|
99,300 |
|
|
|
99,300 |
|
|
|
— |
|
|
|
— |
|
|
n/a |
|
|
100.0 |
% |
- 28 -
|
Wholly Owned Properties |
|
||||||||||||||||||||||||||||||
|
|
|
|
|
|
|
Recapture |
|
|
|
|
GLA (3) |
|
|
|
|
|
|
|
|||||||||||||
|
|
|
City |
|
State |
|
Rights (1)(2) |
|
|
Sears or Kmart |
|
Total |
|
|
Sears Holdings |
|
|
Third Parties |
|
|
Not Leased |
|
|
Significant Third Party Tenants (3) |
|
Leased (3) |
|
|||||
|
84 |
|
Cedar Rapids |
|
IA |
|
50% |
|
|
Sears |
|
|
146,000 |
|
|
|
141,100 |
|
|
|
4,900 |
|
|
|
— |
|
|
Lands' End |
|
|
100.0 |
% |
|
85 |
|
Charles City |
|
IA |
|
50% |
|
|
Kmart |
|
|
96,600 |
|
|
|
96,600 |
|
|
|
— |
|
|
|
— |
|
|
n/a |
|
|
100.0 |
% |
|
86 |
|
Webster City |
|
IA |
|
50% |
|
|
Kmart |
|
|
40,800 |
|
|
|
40,800 |
|
|
|
— |
|
|
|
— |
|
|
n/a |
|
|
100.0 |
% |
|
87 |
|
Boise |
|
ID |
|
50% |
|
|
Sears |
|
|
123,600 |
|
|
|
123,600 |
|
|
|
— |
|
|
|
— |
|
|
n/a |
|
|
100.0 |
% |
|
88 |
|
Chicago |
|
IL |
|
50% |
|
|
Sears |
|
|
356,700 |
|
|
|
356,700 |
|
|
|
— |
|
|
|
— |
|
|
n/a |
|
|
100.0 |
% |
|
89 |
|
Chicago |
|
IL |
|
(5) |
|
|
n/a |
|
|
293,700 |
|
|
|
— |
|
|
|
— |
|
|
|
293,700 |
|
|
n/a |
|
|
0.0 |
% |
|
90 |
|
Chicago |
|
IL |
|
(5) |
|
|
n/a |
|
|
168,500 |
|
|
|
— |
|
|
|
25,700 |
|
|
|
142,800 |
|
|
China Town Buffet, Chuck E Cheese |
|
|
15.3 |
% |
|
91 |
|
Homewood |
|
IL |
|
n/a |
|
|
n/a |
|
|
196,100 |
|
|
|
— |
|
|
|
196,100 |
|
|
|
— |
|
|
Wal-Mart |
|
|
100.0 |
% |
|
92 |
|
Joliet |
|
IL |
|
50% |
|
|
Sears |
|
|
204,600 |
|
|
|
204,600 |
|
|
|
— |
|
|
|
— |
|
|
n/a |
|
|
100.0 |
% |
|
93 |
|
Lombard |
|
IL |
|
n/a |
|
|
n/a |
|
|
139,300 |
|
|
|
— |
|
|
|
139,300 |
|
|
|
— |
|
|
The Dump |
|
|
100.0 |
% |
|
94 |
|
Moline |
|
IL |
|
50% |
|
|
Kmart |
|
|
123,700 |
|
|
|
120,500 |
|
|
|
— |
|
|
|
3,200 |
|
|
n/a |
|
|
97.4 |
% |
|
95 |
|
North Riverside |
|
IL |
|
(4) |
|
|
Sears |
|
|
203,000 |
|
|
|
157,900 |
|
|
|
45,100 |
|
|
|
— |
|
|
Round One Entertainment |
|
|
100.0 |
% |
|
96 |
|
Orland Park |
|
IL |
|
(4) |
|
|
Sears |
|
|
199,600 |
|
|
|
146,600 |
|
|
|
53,000 |
|
|
|
— |
|
|
AMC, Lands' End |
|
|
100.0 |
% |
|
97 |
|
Springfield |
|
IL |
|
(5) |
|
|
n/a |
|
|
133,400 |
|
|
|
— |
|
|
|
88,200 |
|
|
|
45,200 |
|
|
Binny's Beverage Depot, Burlington Stores, Orange Theory Fitness, Outback Steakhouse |
|
|
66.1 |
% |
|
98 |
|
Steger |
|
IL |
|
50% |
|
|
Kmart |
|
|
87,400 |
|
|
|
87,400 |
|
|
|
— |
|
|
|
— |
|
|
n/a |
|
|
100.0 |
% |
|
99 |
|
Elkhart |
|
IN |
|
(5) |
|
|
n/a |
|
|
86,600 |
|
|
|
— |
|
|
|
86,600 |
|
|
|
— |
|
|
Big R Stores |
|
|
100.0 |
% |
|
100 |
|
Ft. Wayne |
|
IN |
|
(4) |
|
|
Sears |
|
|
231,900 |
|
|
|
213,500 |
|
|
|
18,400 |
|
|
|
— |
|
|
Chick-Fil-A, Lands' End, BJ's Brewhouse |
|
|
100.0 |
% |
|
101 |
|
Merrillville |
|
IN |
|
(5) |
|
|
n/a |
|
|
170,900 |
|
|
|
— |
|
|
|
154,300 |
|
|
|
16,600 |
|
|
At Home, Dollar Tree, Powerhouse Gym, Sherwin-Williams |
|
|
90.3 |
% |
|
102 |
|
Leavenworth |
|
KS |
|
(5) |
|
|
n/a |
|
|
83,600 |
|
|
|
— |
|
|
|
— |
|
|
|
83,600 |
|
|
n/a |
|
|
0.0 |
% |
|
103 |
|
Overland Park |
|
KS |
|
(5) |
|
|
n/a |
|
|
215,000 |
|
|
|
— |
|
|
|
— |
|
|
|
215,000 |
|
|
n/a |
|
|
0.0 |
% |
|
104 |
|
Hopkinsville |
|
KY |
|
(5) |
|
|
n/a |
|
|
93,000 |
|
|
|
— |
|
|
|
— |
|
|
|
93,000 |
|
|
n/a |
|
|
0.0 |
% |
|
105 |
|
Owensboro |
|
KY |
|
(5) |
|
|
n/a |
|
|
68,300 |
|
|
|
— |
|
|
|
— |
|
|
|
68,300 |
|
|
n/a |
|
|
0.0 |
% |
|
106 |
|
Paducah |
|
KY |
|
(5) |
|
|
n/a |
|
|
97,300 |
|
|
|
— |
|
|
|
41,000 |
|
|
|
56,300 |
|
|
Burlington Stores |
|
|
42.1 |
% |
|
107 |
|
Houma |
|
LA |
|
(5) |
|
|
n/a |
|
|
101,400 |
|
|
|
— |
|
|
|
4,700 |
|
|
|
96,700 |
|
|
Meineke Car Care |
|
|
4.6 |
% |
|
108 |
|
Lafayette |
|
LA |
|
(5) |
|
|
n/a |
|
|
194,900 |
|
|
|
— |
|
|
|
— |
|
|
|
194,900 |
|
|
n/a |
|
|
0.0 |
% |
|
109 |
|
New Iberia |
|
LA |
|
(5) |
|
|
n/a |
|
|
89,200 |
|
|
|
— |
|
|
|
46,600 |
|
|
|
42,600 |
|
|
Rouse Supermarkets |
|
|
52.2 |
% |
|
110 |
|
Braintree |
|
MA |
|
(4) |
|
|
n/a |
|
|
84,900 |
|
|
|
— |
|
|
|
84,900 |
|
|
|
— |
|
|
Nordstrom Rack, Saks Off 5th, Ulta Beauty |
|
|
100.0 |
% |
|
111 |
|
Saugus |
|
MA |
|
(4) |
|
|
Sears |
|
|
210,700 |
|
|
|
139,400 |
|
|
|
11,700 |
|
|
|
59,600 |
|
|
Lands' End |
|
|
71.7 |
% |
|
112 |
|
Bowie |
|
MD |
|
(4) |
|
|
Sears |
|
|
131,000 |
|
|
|
123,500 |
|
|
|
7,500 |
|
|
|
— |
|
|
BJ's Brewhouse |
|
|
100.0 |
% |
|
113 |
|
Cockeysville |
|
MD |
|
(4)(5) |
|
|
n/a |
|
|
122,800 |
|
|
|
— |
|
|
|
46,300 |
|
|
|
76,500 |
|
|
HomeGoods, Michaels Stores |
|
|
37.7 |
% |
|
114 |
|
Edgewater |
|
MD |
|
50% |
|
|
Kmart |
|
|
117,200 |
|
|
|
117,200 |
|
|
|
— |
|
|
|
— |
|
|
n/a |
|
|
100.0 |
% |
|
115 |
|
Hagerstown |
|
MD |
|
(4)(5) |
|
|
n/a |
|
|
130,100 |
|
|
|
— |
|
|
|
11,200 |
|
|
|
118,900 |
|
|
BJ's Brewhouse, Verizon |
|
|
8.6 |
% |
|
116 |
|
Madawaska |
|
ME |
|
50% |
|
|
Kmart |
|
|
49,700 |
|
|
|
49,700 |
|
|
|
— |
|
|
|
— |
|
|
n/a |
|
|
100.0 |
% |
|
117 |
|
Alpena |
|
MI |
|
(5) |
|
|
n/a |
|
|
118,200 |
|
|
|
— |
|
|
|
— |
|
|
|
118,200 |
|
|
n/a |
|
|
0.0 |
% |
|
118 |
|
Jackson |
|
MI |
|
50% |
|
|
Sears |
|
|
152,700 |
|
|
|
144,200 |
|
|
|
8,500 |
|
|
|
— |
|
|
Panera Bread, Pizza Hut |
|
|
100.0 |
% |
|
119 |
|
Lincoln Park |
|
MI |
|
50% |
|
|
Sears |
|
|
301,700 |
|
|
|
297,900 |
|
|
|
3,800 |
|
|
|
— |
|
|
Bank of America |
|
|
100.0 |
% |
|
120 |
|
Manistee |
|
MI |
|
(5) |
|
|
n/a |
|
|
94,700 |
|
|
|
— |
|
|
|
— |
|
|
|
94,700 |
|
|
n/a |
|
|
0.0 |
% |
|
121 |
|
Roseville |
|
MI |
|
(4)(5) |
|
|
n/a |
|
|
389,700 |
|
|
|
— |
|
|
|
129,700 |
|
|
|
260,000 |
|
|
At Home, Diehard Auto Center, Red Robin |
|
|
33.3 |
% |
|
122 |
|
Sault Ste. Marie |
|
MI |
|
(5) |
|
|
n/a |
|
|
92,700 |
|
|
|
— |
|
|
|
— |
|
|
|
92,700 |
|
|
n/a |
|
|
0.0 |
% |
|
123 |
|
St. Clair Shores |
|
MI |
|
(4) |
|
|
Kmart |
|
|
122,200 |
|
|
|
15,000 |
|
|
|
107,200 |
|
|
|
— |
|
|
Kroger |
|
|
100.0 |
% |
|
124 |
|
Troy |
|
MI |
|
(4) |
|
|
Sears |
|
|
384,100 |
|
|
|
271,300 |
|
|
|
112,800 |
|
|
|
— |
|
|
At Home, Krispy Kreme, Lands' End |
|
|
100.0 |
% |
|
125 |
|
Ypsilanti |
|
MI |
|
n/a |
|
|
n/a |
|
|
99,400 |
|
|
|
— |
|
|
|
99,400 |
|
|
|
— |
|
|
At Home |
|
|
100.0 |
% |
|
126 |
|
Burnsville |
|
MN |
|
(5) |
|
|
n/a |
|
|
161,700 |
|
|
|
— |
|
|
|
— |
|
|
|
161,700 |
|
|
n/a |
|
|
0.0 |
% |
- 29 -
|
Wholly Owned Properties |
|
||||||||||||||||||||||||||||||
|
|
|
|
|
|
|
Recapture |
|
|
|
|
GLA (3) |
|
|
|
|
|
|
|
|||||||||||||
|
|
|
City |
|
State |
|
Rights (1)(2) |
|
|
Sears or Kmart |
|
Total |
|
|
Sears Holdings |
|
|
Third Parties |
|
|
Not Leased |
|
|
Significant Third-Party Tenants (3) |
|
Leased (3) |
|
|||||
|
127 |
|
Detroit Lakes |
|
MN |
|
(5) |
|
|
n/a |
|
|
87,100 |
|
|
|
— |
|
|
|
8,000 |
|
|
|
79,100 |
|
|
Hometown Dealer |
|
|
9.2 |
% |
|
128 |
|
Maplewood |
|
MN |
|
50% |
|
|
Sears |
|
|
174,900 |
|
|
|
168,500 |
|
|
|
6,400 |
|
|
|
— |
|
|
Lands' End |
|
|
100.0 |
% |
|
129 |
|
St. Paul |
|
MN |
|
100% |
|
|
Sears |
|
|
217,900 |
|
|
|
216,300 |
|
|
|
1,600 |
|
|
|
— |
|
|
n/a |
|
|
100.0 |
% |
|
130 |
|
Cape Girardeau |
|
MO |
|
50% |
|
|
Kmart |
|
|
82,600 |
|
|
|
37,600 |
|
|
|
45,000 |
|
|
|
— |
|
|
Orscheln Farm and Home |
|
|
100.0 |
% |
|
131 |
|
Florissant |
|
MO |
|
(4) |
|
|
Kmart |
|
|
124,000 |
|
|
|
114,700 |
|
|
|
9,300 |
|
|
|
— |
|
|
Chick-Fil-A |
|
|
100.0 |
% |
|
132 |
|
Jefferson City |
|
MO |
|
(5) |
|
|
n/a |
|
|
97,700 |
|
|
|
— |
|
|
|
97,700 |
|
|
|
— |
|
|
Orscheln Farm and Home, Ruby Tuesday |
|
|
100.0 |
% |
|
133 |
|
Springfield |
|
MO |
|
n/a |
|
|
n/a |
|
|
112,900 |
|
|
|
— |
|
|
|
112,900 |
|
|
|
— |
|
|
At Home |
|
|
100.0 |
% |
|
134 |
|
Columbus |
|
MS |
|
50% |
|
|
Kmart |
|
|
166,700 |
|
|
|
117,100 |
|
|
|
45,400 |
|
|
|
4,200 |
|
|
Bargain Hunt |
|
|
97.5 |
% |
|
135 |
|
Havre |
|
MT |
|
50% |
|
|
Kmart |
|
|
94,700 |
|
|
|
94,700 |
|
|
|
— |
|
|
|
— |
|
|
n/a |
|
|
100.0 |
% |
|
136 |
|
Asheville |
|
NC |
|
50% |
|
|
Sears |
|
|
240,700 |
|
|
|
232,400 |
|
|
|
8,300 |
|
|
|
— |
|
|
Lands' End |
|
|
100.0 |
% |
|
137 |
|
Concord |
|
NC |
|
(5) |
|
|
n/a |
|
|
171,300 |
|
|
|
— |
|
|
|
33,800 |
|
|
|
137,500 |
|
|
Sears Outlet |
|
|
19.7 |
% |
|
138 |
|
Greensboro |
|
NC |
|
n/a |
|
|
n/a |
|
|
171,600 |
|
|
|
— |
|
|
|
171,600 |
|
|
|
— |
|
|
Floor & Décor, Gabriel Brothers, Sears Outlet |
|
|
100.0 |
% |
|
139 |
|
Minot |
|
ND |
|
50% |
|
|
Kmart |
|
|
110,400 |
|
|
|
108,100 |
|
|
|
2,300 |
|
|
|
— |
|
|
US Bank |
|
|
100.0 |
% |
|
140 |
|
Kearney |
|
NE |
|
(5) |
|
|
n/a |
|
|
80,000 |
|
|
|
— |
|
|
|
38,000 |
|
|
|
42,000 |
|
|
Marshall's, PetSmart |
|
|
47.5 |
% |
|
141 |
|
Manchester |
|
NH |
|
50% |
|
|
Sears |
|
|
144,100 |
|
|
|
135,100 |
|
|
|
9,000 |
|
|
|
— |
|
|
Lands' End |
|
|
100.0 |
% |
|
142 |
|
Nashua |
|
NH |
|
50% |
|
|
Sears |
|
|
167,100 |
|
|
|
159,500 |
|
|
|
7,600 |
|
|
|
— |
|
|
Lands' End |
|
|
100.0 |
% |
|
143 |
|
Portsmouth |
|
NH |
|
50% |
|
|
Sears |
|
|
127,000 |
|
|
|
120,100 |
|
|
|
6,900 |
|
|
|
— |
|
|
Lands' End |
|
|
100.0 |
% |
|
144 |
|
Salem |
|
NH |
|
(4) |
|
|
Sears |
|
|
250,500 |
|
|
|
119,000 |
|
|
|
131,500 |
|
|
|
— |
|
|
Cinemark, Dick's Sporting Goods, Lands' End |
|
|
100.0 |
% |
|
145 |
|
Middletown |
|
NJ |
|
100% |
|
|
n/a |
|
|
199,600 |
|
|
|
— |
|
|
|
199,600 |
|
|
|
— |
|
|
Investors Bank, ShopRite, Wendy's |
|
|
100.0 |
% |
|
146 |
|
Watchung |
|
NJ |
|
(4) |
|
|
n/a |
|
|
126,700 |
|
|
|
— |
|
|
|
90,000 |
|
|
|
36,700 |
|
|
Cinemark, HomeGoods, Sierra Trading Post, Ulta Beauty |
|
|
71.0 |
% |
|
147 |
|
Deming |
|
NM |
|
(5) |
|
|
n/a |
|
|
96,600 |
|
|
|
— |
|
|
|
— |
|
|
|
96,600 |
|
|
n/a |
|
|
0.0 |
% |
|
148 |
|
Farmington |
|
NM |
|
50% |
|
|
Kmart |
|
|
90,700 |
|
|
|
90,700 |
|
|
|
— |
|
|
|
— |
|
|
n/a |
|
|
100.0 |
% |
|
149 |
|
Hobbs |
|
NM |
|
50% |
|
|
Kmart |
|
|
88,900 |
|
|
|
88,900 |
|
|
|
— |
|
|
|
— |
|
|
n/a |
|
|
100.0 |
% |
|
150 |
|
Henderson |
|
NV |
|
(5) |
|
|
n/a |
|
|
124,800 |
|
|
|
— |
|
|
|
124,800 |
|
|
|
— |
|
|
At Home, Seafood City |
|
|
100.0 |
% |
|
151 |
|
Las Vegas |
|
NV |
|
(4) |
|
|
Sears |
|
|
150,200 |
|
|
|
107,700 |
|
|
|
42,500 |
|
|
|
— |
|
|
Round One Entertainment |
|
|
100.0 |
% |
|
152 |
|
Reno |
|
NV |
|
50% |
|
|
Sears |
|
|
198,800 |
|
|
|
157,500 |
|
|
|
41,300 |
|
|
|
— |
|
|
Round One Entertainment |
|
|
100.0 |
% |
|
153 |
|
Albany |
|
NY |
|
(4)(5) |
|
|
n/a |
|
|
277,900 |
|
|
|
— |
|
|
|
41,200 |
|
|
|
236,700 |
|
|
BJ's Brewhouse, Whole Foods |
|
|
14.8 |
% |
|
154 |
|
Clay |
|
NY |
|
50% |
|
|
Sears |
|
|
146,500 |
|
|
|
138,000 |
|
|
|
8,500 |
|
|
|
— |
|
|
Lands' End |
|
|
100.0 |
% |
|
155 |
|
East Northport |
|
NY |
|
(5) |
|
|
n/a |
|
|
179,700 |
|
|
|
— |
|
|
|
87,000 |
|
|
|
92,700 |
|
|
24 Hour Fitness, AMC |
|
|
48.4 |
% |
|
156 |
|
Hicksville |
|
NY |
|
(4) |
|
|
Sears |
|
|
362,500 |
|
|
|
292,100 |
|
|
|
70,400 |
|
|
|
— |
|
|
24 Hour Fitness, Chase Bank, Chipotle, Citigroup, Lands' End, Red Lobster, TD Bank |
|
|
100.0 |
% |
|
157 |
|
Johnson City |
|
NY |
|
(5) |
|
|
n/a |
|
|
155,100 |
|
|
|
— |
|
|
|
— |
|
|
|
155,100 |
|
|
n/a |
|
|
0.0 |
% |
|
158 |
|
Olean |
|
NY |
|
(4)(5) |
|
|
n/a |
|
|
118,000 |
|
|
|
— |
|
|
|
20,000 |
|
|
|
98,000 |
|
|
Marshall's |
|
|
16.9 |
% |
|
159 |
|
Rochester |
|
NY |
|
50% |
|
|
Sears |
|
|
128,500 |
|
|
|
128,500 |
|
|
|
— |
|
|
|
— |
|
|
n/a |
|
|
100.0 |
% |
|
160 |
|
Sidney |
|
NY |
|
50% |
|
|
Kmart |
|
|
94,400 |
|
|
|
94,400 |
|
|
|
— |
|
|
|
— |
|
|
n/a |
|
|
100.0 |
% |
|
161 |
|
Victor |
|
NY |
|
50% |
|
|
Sears |
|
|
123,000 |
|
|
|
115,300 |
|
|
|
7,700 |
|
|
|
— |
|
|
Lands' End |
|
|
100.0 |
% |
|
162 |
|
Yorktown Heights |
|
NY |
|
(4) |
|
|
Sears |
|
|
160,000 |
|
|
|
115,100 |
|
|
|
44,900 |
|
|
|
— |
|
|
24 Hour Fitness, Lands' End |
|
|
100.0 |
% |
|
163 |
|
Canton |
|
OH |
|
(4) |
|
|
Sears |
|
|
219,400 |
|
|
|
177,700 |
|
|
|
41,700 |
|
|
|
— |
|
|
Dave & Busters, Lands' End |
|
|
100.0 |
% |
|
164 |
|
Chapel Hill |
|
OH |
|
(5) |
|
|
n/a |
|
|
193,100 |
|
|
|
— |
|
|
|
— |
|
|
|
193,100 |
|
|
n/a |
|
|
0.0 |
% |
|
165 |
|
Dayton |
|
OH |
|
(4) |
|
|
Sears |
|
|
180,900 |
|
|
|
157,800 |
|
|
|
15,900 |
|
|
|
7,200 |
|
|
Lands' End, Outback Steakhouse |
|
|
96.0 |
% |
|
166 |
|
Kenton |
|
OH |
|
(5) |
|
|
n/a |
|
|
96,100 |
|
|
|
— |
|
|
|
— |
|
|
|
96,100 |
|
|
n/a |
|
|
0.0 |
% |
|
167 |
|
Marietta |
|
OH |
|
50% |
|
|
Kmart |
|
|
87,500 |
|
|
|
87,500 |
|
|
|
— |
|
|
|
— |
|
|
n/a |
|
|
100.0 |
% |
|
168 |
|
Mentor |
|
OH |
|
(5) |
|
|
n/a |
|
|
208,700 |
|
|
|
— |
|
|
|
— |
|
|
|
208,700 |
|
|
n/a |
|
|
0.0 |
% |
|
169 |
|
Middleburg Heights |
|
OH |
|
(5) |
|
|
n/a |
|
|
351,600 |
|
|
|
— |
|
|
|
— |
|
|
|
351,600 |
|
|
n/a |
|
|
0.0 |
% |
- 30 -
|
Wholly Owned Properties |
|
||||||||||||||||||||||||||||||
|
|
|
|
|
|
|
Recapture |
|
|
|
|
GLA (3) |
|
|
|
|
|
|
|
|||||||||||||
|
|
|
City |
|
State |
|
Rights (1)(2) |
|
|
Sears or Kmart |
|
Total |
|
|
Sears Holdings |
|
|
Third Parties |
|
|
Not Leased |
|
|
Significant Third-Party Tenants (3) |
|
Leased (3) |
|
|||||
|
170 |
|
North Canton |
|
OH |
|
50% |
|
|
Kmart |
|
|
87,100 |
|
|
|
84,200 |
|
|
|
2,900 |
|
|
|
— |
|
|
Burger King |
|
|
100.0 |
% |
|
171 |
|
Tallmadge |
|
OH |
|
50% |
|
|
Kmart |
|
|
84,200 |
|
|
|
84,200 |
|
|
|
— |
|
|
|
— |
|
|
n/a |
|
|
100.0 |
% |
|
172 |
|
Toledo |
|
OH |
|
(5) |
|
|
n/a |
|
|
209,900 |
|
|
|
— |
|
|
|
— |
|
|
|
209,900 |
|
|
n/a |
|
|
0.0 |
% |
|
173 |
|
Muskogee |
|
OK |
|
(5) |
|
|
n/a |
|
|
87,500 |
|
|
|
— |
|
|
|
— |
|
|
|
87,500 |
|
|
n/a |
|
|
0.0 |
% |
|
174 |
|
Oklahoma City |
|
OK |
|
50% |
|
|
Sears |
|
|
223,700 |
|
|
|
173,700 |
|
|
|
50,000 |
|
|
|
— |
|
|
Vasa Fitness |
|
|
100.0 |
% |
|
175 |
|
Tulsa |
|
OK |
|
n/a |
|
|
n/a |
|
|
87,200 |
|
|
|
— |
|
|
|
87,200 |
|
|
|
— |
|
|
Long John Silver's, Hobby Lobby |
|
|
100.0 |
% |
|
176 |
|
Happy Valley |
|
OR |
|
50% |
|
|
Sears |
|
|
144,300 |
|
|
|
137,900 |
|
|
|
6,400 |
|
|
|
— |
|
|
Lands' End |
|
|
100.0 |
% |
|
177 |
|
The Dalles |
|
OR |
|
50% |
|
|
Kmart |
|
|
87,100 |
|
|
|
87,100 |
|
|
|
— |
|
|
|
— |
|
|
n/a |
|
|
100.0 |
% |
|
178 |
|
Carlisle |
|
PA |
|
50% |
|
|
Kmart |
|
|
117,800 |
|
|
|
117,800 |
|
|
|
— |
|
|
|
— |
|
|
n/a |
|
|
100.0 |
% |
|
179 |
|
Columbia |
|
PA |
|
50% |
|
|
Kmart |
|
|
86,700 |
|
|
|
86,700 |
|
|
|
— |
|
|
|
— |
|
|
n/a |
|
|
100.0 |
% |
|
180 |
|
King Of Prussia (6) |
|
PA |
|
n/a |
|
|
n/a |
|
|
210,900 |
|
|
|
— |
|
|
|
205,900 |
|
|
|
5,000 |
|
|
Dick's Sporting Goods, Primark, Outback Steakhouse, Yardhouse |
|
|
97.6 |
% |
|
181 |
|
Lebanon |
|
PA |
|
50% |
|
|
Kmart |
|
|
117,200 |
|
|
|
117,200 |
|
|
|
— |
|
|
|
— |
|
|
n/a |
|
|
100.0 |
% |
|
182 |
|
Mount Pleasant |
|
PA |
|
(5) |
|
|
n/a |
|
|
83,500 |
|
|
|
— |
|
|
|
— |
|
|
|
83,500 |
|
|
n/a |
|
|
0.0 |
% |
|
183 |
|
Walnutport |
|
PA |
|
50% |
|
|
Kmart |
|
|
121,200 |
|
|
|
121,200 |
|
|
|
— |
|
|
|
— |
|
|
n/a |
|
|
100.0 |
% |
|
184 |
|
York |
|
PA |
|
(5) |
|
|
n/a |
|
|
82,000 |
|
|
|
— |
|
|
|
— |
|
|
|
82,000 |
|
|
n/a |
|
|
0.0 |
% |
|
185 |
|
Bayamon |
|
PR |
|
50% |
|
|
Kmart |
|
|
115,200 |
|
|
|
115,200 |
|
|
|
— |
|
|
|
— |
|
|
n/a |
|
|
100.0 |
% |
|
186 |
|
Caguas |
|
PR |
|
50% |
|
|
Sears |
|
|
138,700 |
|
|
|
138,700 |
|
|
|
— |
|
|
|
— |
|
|
n/a |
|
|
100.0 |
% |
|
187 |
|
Carolina |
|
PR |
|
50% |
|
|
Sears |
|
|
198,000 |
|
|
|
198,000 |
|
|
|
— |
|
|
|
— |
|
|
n/a |
|
|
100.0 |
% |
|
188 |
|
Guaynabo |
|
PR |
|
(4) |
|
|
Kmart |
|
|
217,100 |
|
|
|
57,700 |
|
|
|
149,400 |
|
|
|
10,000 |
|
|
Capri, McDonald's, Planet Fitness, Supermercado Amigo, Ocean Garden Buffet |
|
|
95.4 |
% |
|
189 |
|
Mayaguez |
|
PR |
|
50% |
|
|
Kmart |
|
|
118,200 |
|
|
|
118,200 |
|
|
|
— |
|
|
|
— |
|
|
n/a |
|
|
100.0 |
% |
|
190 |
|
Ponce |
|
PR |
|
50% |
|
|
Kmart |
|
|
126,900 |
|
|
|
126,900 |
|
|
|
— |
|
|
|
— |
|
|
n/a |
|
|
100.0 |
% |
|
191 |
|
Warwick |
|
RI |
|
(4)(5) |
|
|
n/a |
|
|
211,700 |
|
|
|
— |
|
|
|
191,200 |
|
|
|
20,500 |
|
|
At Home, BJ's Brewhouse, Chuck E Cheese, Raymour & Flanigan, Wendy’s |
|
|
90.3 |
% |
|
192 |
|
Anderson |
|
SC |
|
(4) |
|
|
n/a |
|
|
117,100 |
|
|
|
— |
|
|
|
117,100 |
|
|
|
— |
|
|
Burlington Stores, Gold's Gym, Sportsman's Warehouse |
|
|
100.0 |
% |
|
193 |
|
Charleston |
|
SC |
|
(4) |
|
|
n/a |
|
|
127,500 |
|
|
|
— |
|
|
|
59,700 |
|
|
|
67,800 |
|
|
Burlington Stores, Carrabba’s Italian Grill |
|
|
46.8 |
% |
|
194 |
|
Rock Hill |
|
SC |
|
50% |
|
|
Kmart |
|
|
89,300 |
|
|
|
89,300 |
|
|
|
— |
|
|
|
— |
|
|
n/a |
|
|
100.0 |
% |
|
195 |
|
Sioux Falls |
|
SD |
|
(5) |
|
|
n/a |
|
|
72,500 |
|
|
|
— |
|
|
|
— |
|
|
|
72,500 |
|
|
n/a |
|
|
0.0 |
% |
|
196 |
|
Cordova |
|
TN |
|
50% |
|
|
Sears |
|
|
160,900 |
|
|
|
156,100 |
|
|
|
4,800 |
|
|
|
— |
|
|
Lands' End |
|
|
100.0 |
% |
|
197 |
|
Memphis |
|
TN |
|
(4) |
|
|
n/a |
|
|
112,700 |
|
|
|
— |
|
|
|
88,200 |
|
|
|
24,500 |
|
|
LA Fitness, Hopdoddy, Nordstrom Rack, Ulta Beauty |
|
|
78.3 |
% |
|
198 |
|
Austin |
|
TX |
|
(4) |
|
|
Sears |
|
|
172,000 |
|
|
|
127,000 |
|
|
|
45,000 |
|
|
|
— |
|
|
AMC |
|
|
100.0 |
% |
|
199 |
|
Dallas |
|
TX |
|
50% |
|
|
Sears |
|
|
205,300 |
|
|
|
205,300 |
|
|
|
— |
|
|
|
— |
|
|
n/a |
|
|
100.0 |
% |
|
200 |
|
El Paso |
|
TX |
|
(5) |
|
|
n/a |
|
|
112,100 |
|
|
|
— |
|
|
|
8,400 |
|
|
|
103,700 |
|
|
n/a |
|
|
7.5 |
% |
|
201 |
|
Friendswood |
|
TX |
|
(5) |
|
|
n/a |
|
|
166,000 |
|
|
|
— |
|
|
|
— |
|
|
|
166,000 |
|
|
n/a |
|
|
0.0 |
% |
|
202 |
|
Harlingen |
|
TX |
|
(5) |
|
|
n/a |
|
|
91,700 |
|
|
|
— |
|
|
|
— |
|
|
|
91,700 |
|
|
n/a |
|
|
0.0 |
% |
|
203 |
|
Houston |
|
TX |
|
50% |
|
|
Sears |
|
|
214,400 |
|
|
|
209,500 |
|
|
|
4,900 |
|
|
|
— |
|
|
Lands' End |
|
|
100.0 |
% |
|
204 |
|
Houston |
|
TX |
|
n/a |
|
|
n/a |
|
|
134,000 |
|
|
|
— |
|
|
|
134,000 |
|
|
|
— |
|
|
At Home |
|
|
100.0 |
% |
|
205 |
|
Ingram |
|
TX |
|
50% |
|
|
Sears |
|
|
168,400 |
|
|
|
168,400 |
|
|
|
— |
|
|
|
— |
|
|
n/a |
|
|
100.0 |
% |
|
206 |
|
Irving |
|
TX |
|
50% |
|
|
Sears |
|
|
83,200 |
|
|
|
79,500 |
|
|
|
— |
|
|
|
3,700 |
|
|
n/a |
|
|
95.6 |
% |
|
207 |
|
San Antonio |
|
TX |
|
(4) |
|
|
Sears |
|
|
213,000 |
|
|
|
187,800 |
|
|
|
20,600 |
|
|
|
4,600 |
|
|
Jared the Galleria of Jewelry, Long Horn Steakhouse, Orvis, Shake Shack |
|
|
97.8 |
% |
|
208 |
|
Shepherd |
|
TX |
|
50% |
|
|
Sears |
|
|
201,700 |
|
|
|
201,700 |
|
|
|
— |
|
|
|
— |
|
|
n/a |
|
|
100.0 |
% |
|
209 |
|
Valley View |
|
TX |
|
(4) |
|
|
Sears |
|
|
235,000 |
|
|
|
229,200 |
|
|
|
5,800 |
|
|
|
— |
|
|
Jared the Galleria of Jewelry |
|
|
100.0 |
% |
|
210 |
|
Westwood |
|
TX |
|
(5) |
|
|
n/a |
|
|
213,600 |
|
|
|
— |
|
|
|
— |
|
|
|
213,600 |
|
|
n/a |
|
|
0.0 |
% |
|
211 |
|
Layton |
|
UT |
|
(5) |
|
|
n/a |
|
|
176,900 |
|
|
|
— |
|
|
|
61,800 |
|
|
|
115,100 |
|
|
Arby's, Vasa Fitness |
|
|
34.9 |
% |
- 31 -
|
Wholly Owned Properties |
|
|||||||||||||||||||||||||||||||
|
|
|
|
|
|
|
Recapture |
|
|
|
|
GLA (3) |
|
|
|
|
|
|
|
||||||||||||||
|
|
|
City |
|
State |
|
Rights (1)(2) |
|
|
Sears or Kmart |
|
Total |
|
|
Sears Holdings |
|
|
Third Parties |
|
|
Not Leased |
|
|
Significant Third-Party Tenants (3) |
|
Leased (3) |
|
||||||
|
212 |
|
West Jordan |
|
UT |
|
(4) |
|
|
Sears |
|
|
193,500 |
|
|
|
137,400 |
|
|
|
46,600 |
|
|
|
9,500 |
|
|
Burlington Stores |
|
|
95.1 |
% |
|
|
213 |
|
Alexandria |
|
VA |
|
50% |
|
|
Sears |
|
|
262,100 |
|
|
|
252,500 |
|
|
|
9,600 |
|
|
|
— |
|
|
Lands' End |
|
|
100.0 |
% |
|
|
214 |
|
Chesapeake |
|
VA |
|
50% |
|
|
Sears |
|
|
169,400 |
|
|
|
169,400 |
|
|
|
— |
|
|
|
— |
|
|
n/a |
|
|
100.0 |
% |
|
|
215 |
|
Fairfax |
|
VA |
|
(4) |
|
|
Sears |
|
|
220,700 |
|
|
|
104,400 |
|
|
|
55,100 |
|
|
|
61,200 |
|
|
Dave & Busters, Lands' End, Seasons 52 |
|
|
72.3 |
% |
|
|
216 |
|
Hampton |
|
VA |
|
50% |
|
|
Sears |
|
|
245,000 |
|
|
|
245,000 |
|
|
|
— |
|
|
|
— |
|
|
n/a |
|
|
100.0 |
% |
|
|
217 |
|
Virginia Beach |
|
VA |
|
50% |
|
|
Sears |
|
|
197,300 |
|
|
|
86,900 |
|
|
|
110,400 |
|
|
|
— |
|
|
BB&T, DSW, The Fresh Market, Nordstrom Rack, REI, Smokey Bones |
|
|
100.0 |
% |
|
|
218 |
|
Warrenton |
|
VA |
|
50% |
|
|
Sears |
|
|
121,100 |
|
|
|
92,100 |
|
|
|
29,000 |
|
|
|
— |
|
|
HomeGoods, Lands' End |
|
|
100.0 |
% |
|
|
219 |
|
Redmond |
|
WA |
|
(4) |
|
|
Sears |
|
|
267,400 |
|
|
|
255,900 |
|
|
|
11,500 |
|
|
|
— |
|
|
Lands' End, Red Robin |
|
|
100.0 |
% |
|
|
220 |
|
Vancouver |
|
WA |
|
50% |
|
|
Sears |
|
|
129,700 |
|
|
|
124,900 |
|
|
|
4,800 |
|
|
|
— |
|
|
Lands' End |
|
|
100.0 |
% |
|
|
221 |
|
Yakima |
|
WA |
|
(5) |
|
|
n/a |
|
|
97,300 |
|
|
|
— |
|
|
|
— |
|
|
|
97,300 |
|
|
n/a |
|
|
0.0 |
% |
|
|
222 |
|
Greendale |
|
WI |
|
(5) |
|
|
n/a |
|
|
187,500 |
|
|
|
— |
|
|
|
106,600 |
|
|
|
80,900 |
|
|
Dick's Sporting Goods, Round One Entertainment |
|
|
56.9 |
% |
|
|
223 |
|
Madison |
|
WI |
|
(4) |
|
|
Sears |
|
|
142,400 |
|
|
|
88,100 |
|
|
|
54,300 |
|
|
|
— |
|
|
Dave & Busters, Total Wine & More |
|
|
100.0 |
% |
|
|
224 |
|
Platteville |
|
WI |
|
(5) |
|
|
n/a |
|
|
94,800 |
|
|
|
— |
|
|
|
— |
|
|
|
94,800 |
|
|
n/a |
|
|
0.0 |
% |
|
|
225 |
|
Charleston |
|
WV |
|
50% |
|
|
Kmart |
|
|
105,600 |
|
|
|
105,600 |
|
|
|
— |
|
|
|
— |
|
|
n/a |
|
|
100.0 |
% |
|
|
226 |
|
Elkins |
|
WV |
|
(5) |
|
|
n/a |
|
|
99,600 |
|
|
|
— |
|
|
|
— |
|
|
|
99,600 |
|
|
n/a |
|
|
0.0 |
% |
|
|
227 |
|
Scott Depot |
|
WV |
|
50% |
|
|
Kmart |
|
|
89,800 |
|
|
|
89,800 |
|
|
|
— |
|
|
|
— |
|
|
n/a |
|
|
100.0 |
% |
|
|
228 |
|
Casper |
|
WY |
|
50% |
|
|
Kmart |
|
|
91,400 |
|
|
|
91,300 |
|
|
|
100 |
|
|
|
— |
|
|
n/a |
|
|
100.0 |
% |
|
|
229 |
|
Gillette |
|
WY |
|
50% |
|
|
Kmart |
|
|
94,600 |
|
|
|
94,600 |
|
|
|
— |
|
|
|
— |
|
|
n/a |
|
|
100.0 |
% |
|
|
230 |
|
Riverton |
|
WY |
|
(5) |
|
|
n/a |
|
|
94,800 |
|
|
|
— |
|
|
|
— |
|
|
|
94,800 |
|
|
n/a |
|
|
0.0 |
% |
|
|
|
|
Total - Wholly-Owned Properties |
|
|
|
|
|
|
|
|
35,159,000 |
|
|
|
20,703,900 |
|
|
|
7,130,200 |
|
|
|
7,324,900 |
|
|
|
|
|
79.2 |
% |
||
|
(1) |
Properties with 50% recapture rights are subject to the Company's right to recapture approximately 50% of the space within a store (subject to certain exceptions). In addition, the Company has the right to recapture any automotive care centers which are free-standing or attached as “appendages” to the stores and all outparcels or outlots, as well as certain portions of parking areas and common areas. These properties were referred to as "Type II" properties in the Company's Form S-11 dated June 8, 2015. |
|
(2) |
In addition to the 50% recapture rights described above, properties with 100% recapture rights are subject to the Company's right to recapture the entire space within a store for a specified fee. These properties were referred to as "Type I" properties in the Company's Form S-11 dated June 8, 2015. |
|
(3) |
Based on signed leases as of December 31, 2017, including SNO leases. |
|
(4) |
As of December 31, 2017, the Company had exercised certain recapture rights with respect to this property. |
|
(5) |
As of December 31, 2017, Sears Holdings had exercised its termination rights with respect to this property. |
|
(6) |
Property is subject to a ground lease. |
- 32 -
|
JV Properties |
|
|||||||||||||||||||||||||||||||
|
|
|
|
|
|
|
Recapture |
|
|
|
|
GLA (3) |
|
|
|
|
|
|
|
||||||||||||||
|
|
|
City |
|
State |
|
Rights (1)(2) |
|
|
Sears or Kmart |
|
Total |
|
|
Sears Holdings |
|
|
Third Parties |
|
|
Not Leased |
|
|
Third Party Tenants (3) |
|
Leased (3) |
|
||||||
|
1 |
|
Northridge |
|
CA |
|
|
50 |
% |
|
Sears |
|
|
291,800 |
|
|
|
206,600 |
|
|
|
85,200 |
|
|
|
— |
|
|
Ashley Furniture, Dick's Sporting Goods |
|
|
100.0 |
% |
|
2 |
|
Altamonte Springs |
|
FL |
|
|
50 |
% |
|
Sears |
|
|
214,400 |
|
|
|
205,600 |
|
|
|
8,800 |
|
|
|
— |
|
|
Seasons 52 |
|
|
100.0 |
% |
|
3 |
|
Naples |
|
FL |
|
|
50 |
% |
|
Sears |
|
|
161,800 |
|
|
|
151,800 |
|
|
|
10,000 |
|
|
|
— |
|
|
n/a |
|
|
100.0 |
% |
|
4 |
|
Atlanta |
|
GA |
|
|
50 |
% |
|
Sears |
|
|
226,400 |
|
|
|
218,800 |
|
|
|
7,600 |
|
|
|
— |
|
|
Lands' End |
|
|
100.0 |
% |
|
5 |
|
Natick (5) |
|
MA |
|
(4) |
|
|
Sears |
|
|
190,800 |
|
|
|
136,200 |
|
|
|
54,600 |
|
|
|
— |
|
|
Dave & Busters, Lands' End |
|
|
100 |
% |
|
|
6 |
|
Wayne |
|
NJ |
|
(4) |
|
|
Sears |
|
|
281,200 |
|
|
|
126,400 |
|
|
|
92,000 |
|
|
|
62,800 |
|
|
Cinemark, Dave & Busters |
|
|
77.7 |
% |
|
|
7 |
|
Norman (5) |
|
OK |
|
|
50 |
% |
|
Sears |
|
|
66,800 |
|
|
|
66,800 |
|
|
|
— |
|
|
|
— |
|
|
n/a |
|
|
100 |
% |
|
8 |
|
Frisco |
|
TX |
|
|
50 |
% |
|
Sears |
|
|
163,000 |
|
|
|
163,000 |
|
|
|
— |
|
|
|
— |
|
|
n/a |
|
|
100 |
% |
|
9 |
|
Lynnwood |
|
WA |
|
(4) |
|
|
Sears |
|
|
177,800 |
|
|
|
— |
|
|
|
— |
|
|
|
177,800 |
|
|
n/a |
|
|
0 |
% |
|
|
10 |
|
Chandler |
|
AZ |
|
|
50 |
% |
|
Sears |
|
|
141,600 |
|
|
|
141,600 |
|
|
|
— |
|
|
|
— |
|
|
n/a |
|
|
100 |
% |
|
11 |
|
Glendale |
|
AZ |
|
|
50 |
% |
|
Sears |
|
|
125,000 |
|
|
|
125,000 |
|
|
|
— |
|
|
|
— |
|
|
n/a |
|
|
100 |
% |
|
12 |
|
Cerritos |
|
CA |
|
|
50 |
% |
|
Sears |
|
|
277,600 |
|
|
|
277,600 |
|
|
|
— |
|
|
|
— |
|
|
n/a |
|
|
100 |
% |
|
13 |
|
Modesto |
|
CA |
|
|
50 |
% |
|
Sears |
|
|
148,600 |
|
|
|
148,600 |
|
|
|
— |
|
|
|
— |
|
|
n/a |
|
|
100 |
% |
|
14 |
|
Danbury |
|
CT |
|
|
50 |
% |
|
Sears |
|
|
178,400 |
|
|
|
108,400 |
|
|
|
70,000 |
|
|
|
— |
|
|
Primark |
|
|
100 |
% |
|
15 |
|
Deptford |
|
NJ |
|
|
50 |
% |
|
Sears |
|
|
195,000 |
|
|
|
183,800 |
|
|
|
11,200 |
|
|
|
— |
|
|
Lands' End, Republic Bank |
|
|
100 |
% |
|
16 |
|
Freehold |
|
NJ |
|
|
50 |
% |
|
Sears |
|
|
138,800 |
|
|
|
72,200 |
|
|
|
66,600 |
|
|
|
— |
|
|
Primark |
|
|
100 |
% |
|
17 |
|
Portland |
|
OR |
|
|
50 |
% |
|
Sears |
|
|
220,000 |
|
|
|
205,800 |
|
|
|
14,200 |
|
|
|
— |
|
|
Lands' End |
|
|
100 |
% |
|
18 |
|
Lubbock |
|
TX |
|
|
50 |
% |
|
Sears |
|
|
150,600 |
|
|
|
150,600 |
|
|
|
— |
|
|
|
— |
|
|
n/a |
|
|
100 |
% |
|
19 |
|
Santa Rosa |
|
CA |
|
|
50 |
% |
|
Sears |
|
|
165,400 |
|
|
|
161,600 |
|
|
|
3,800 |
|
|
|
— |
|
|
Lands' End |
|
|
100 |
% |
|
20 |
|
Ann Arbor |
|
MI |
|
|
50 |
% |
|
Sears |
|
|
170,600 |
|
|
|
156,400 |
|
|
|
14,200 |
|
|
|
— |
|
|
Lands' End |
|
|
100 |
% |
|
21 |
|
Nanuet |
|
NY |
|
|
50 |
% |
|
Sears |
|
|
221,400 |
|
|
|
213,800 |
|
|
|
7,600 |
|
|
|
— |
|
|
Lands' End |
|
|
100 |
% |
|
22 |
|
Tulsa |
|
OK |
|
|
50 |
% |
|
Sears |
|
|
150,200 |
|
|
|
150,200 |
|
|
|
— |
|
|
|
— |
|
|
n/a |
|
|
100 |
% |
|
23 |
|
Austin |
|
TX |
|
|
50 |
% |
|
Sears |
|
|
164,600 |
|
|
|
164,600 |
|
|
|
— |
|
|
|
— |
|
|
n/a |
|
|
100 |
% |
|
|
|
Total - JV Properties |
|
|
|
|
|
|
|
|
4,221,800 |
|
|
|
3,535,400 |
|
|
|
445,800 |
|
|
|
240,600 |
|
|
|
|
|
94.3 |
% |
||
|
|
|
|
|
|
|
|
|
|
|
|
|
|
|
|
|
|
|
|
|
|
|
|
|
|
|
|
|
|
|
|
|
|
|
(1) Properties with 50% recapture rights are subject to the JVs' right to recapture approximately 50% of the space within a store (subject to certain exceptions). In addition, the JVs have the right to recapture any automotive care centers which are free-standing or attached as “appendages” to the stores and all outparcels or outlots, as well as certain portions of parking areas and common areas. |
|
|||||||||||||||||||||||||||||||
|
(2) In addition to the 50% recapture rights described above, properties with 100% recapture rights are subject to the JVs; right to recapture the entire space within a store for a specified fee. |
|
|||||||||||||||||||||||||||||||
|
(3) Based on signed leases as of December 31, 2017, including SNO leases. |
|
|||||||||||||||||||||||||||||||
|
(4) As of December 31, 2017, the JVs had exercised certain recapture rights with respect to this property or announced plans to exercise such rights according to a specific schedule. |
|
|||||||||||||||||||||||||||||||
|
(5) Property is subject to a lease or ground lease. |
|
|||||||||||||||||||||||||||||||
|
|
|
|
|
|
|
|
|
|
|
|
|
|
|
|
|
|
|
|
|
|
|
|
|
|
|
|
|
|
|
|
|
|
|
253 |
|
Grand Total - All Properties |
|
|
|
|
|
|
|
|
|
|
39,380,800 |
|
|
|
24,239,300 |
|
|
|
7,576,000 |
|
|
|
7,565,500 |
|
|
|
|
|
80.8 |
% |
|
253 |
|
Grand Total - All Properties (at share) |
|
|
|
|
|
|
|
|
|
|
37,269,900 |
|
|
|
22,471,600 |
|
|
|
7,353,100 |
|
|
|
7,445,200 |
|
|
|
|
|
80.0 |
% |
- 33 -
The following ta ble sets forth information regarding the geographic diversification of our portfolio, with JV Properties presented at our proportional share, based on signed leases as of December 31, 2017, including SNO leases:
|
(in thousands except property count and PSF data) |
|
|
|
|
|
|
|
|
|
|
|
|
|
|
|
|
|
|
|
Number of |
|
|
Annual |
|
|
% of Total |
|
|
Rent |
|
||||
|
State |
|
Properties |
|
|
Rent |
|
|
Annual Rent |
|
|
PSF |
|
||||
|
California |
|
|
41 |
|
|
$ |
45,089 |
|
|
|
21.0 |
% |
|
$ |
6.90 |
|
|
Florida |
|
|
26 |
|
|
|
24,287 |
|
|
|
11.3 |
% |
|
|
6.36 |
|
|
New York |
|
|
11 |
|
|
|
13,061 |
|
|
|
6.1 |
% |
|
|
7.03 |
|
|
Texas |
|
|
16 |
|
|
|
10,509 |
|
|
|
4.9 |
% |
|
|
4.29 |
|
|
Illinois |
|
|
11 |
|
|
|
9,050 |
|
|
|
4.2 |
% |
|
|
4.30 |
|
|
New Jersey |
|
|
5 |
|
|
|
8,568 |
|
|
|
4.0 |
% |
|
|
13.51 |
|
|
Virginia |
|
|
6 |
|
|
|
8,135 |
|
|
|
3.8 |
% |
|
|
6.69 |
|
|
Pennsylvania |
|
|
7 |
|
|
|
7,027 |
|
|
|
3.3 |
% |
|
|
8.58 |
|
|
Puerto Rico |
|
|
6 |
|
|
|
7,023 |
|
|
|
3.3 |
% |
|
|
7.68 |
|
|
Arizona |
|
|
12 |
|
|
|
6,688 |
|
|
|
3.1 |
% |
|
|
5.17 |
|
|
Total Top 10 |
|
|
141 |
|
|
$ |
139,437 |
|
|
|
65.0 |
% |
|
$ |
6.44 |
|
|
Other (1) |
|
|
112 |
|
|
|
75,239 |
|
|
|
35.0 |
% |
|
|
9.20 |
|
|
Total |
|
|
253 |
|
|
$ |
214,676 |
|
|
|
100.0 |
% |
|
$ |
7.20 |
|
|
(1) |
Includes 40 states. |
The Master Lease and JV Master Leases
The Master Lease
The Master Lease is a unitary, non-divisible lease as to all properties, with Sears Holdings’ obligations as to each property cross-defaulted with all obligations of Sears Holdings with respect to all other properties. The Master Lease generally is a triple net lease with respect to all space which is leased thereunder to Sears Holdings, subject to proportional sharing by Sears Holdings for repair and maintenance charges, real property taxes, insurance and other costs and expenses which are common to both the space leased by Sears Holdings and other space occupied by unrelated third-party tenants in the same or other buildings pursuant to third-party leases, space which is recaptured pursuant to the Company recapture rights described below and all other space which is constructed on the properties. Under the Master Lease, Sears Holdings is required to make all expenditures reasonably necessary to maintain the premises in good appearance, repair and condition for as long as they are in occupancy.
The Master Lease has an initial term of 10 years and contains three options for five-year renewals of the term and a final option for a four-year renewal. In each of the initial and first two renewal terms, base rent will be increased by 2.0% per annum for each lease year over the rent for the immediately preceding lease year. For subsequent renewal terms, rent will be set at the commencement of the renewal term at a fair market rent based on a customary third-party appraisal process, taking into account all the terms of the Master Lease and other relevant factors, but in no event will the renewal rent be less than the rent payable in the immediately preceding lease year.
The Master Lease provides the Company with the right to recapture up to approximately 50% of the space occupied by Sears Holdings at the 224 Wholly Owned Properties initially included in the Master Lease (subject to certain exceptions). In addition, Seritage has the right to recapture any automotive care centers which are free-standing or attached as “appendages” to the properties, all outparcels or outlots and certain portions of the parking areas and common areas. Upon exercise of this recapture right, we will generally incur certain costs and expenses for the separation of the recaptured space from the remaining Sears Holdings space and can reconfigure and rent the recaptured space to third-party tenants on potentially superior terms determined by us and for our own account. We also have the right to recapture 100% of the space occupied by Sears Holdings at each of 21 identified Wholly Owned Properties by making a specified lease termination payment to Sears Holdings, after which we expect to be able to reposition and re-lease those stores on potentially superior terms determined by us and for our own account. While we will be permitted to exercise our recapture rights all at once or in stages as to any particular property, we will not be permitted to recapture all or substantially all of the space subject to the recapture right at more than 50 Wholly Owned Properties during any lease year.
- 34 -
As of December 31, 2017, the Company had exercise d certain recapture rights at 56 properties:
|
Property |
|
Recapture Type |
|
|
Notice Date(s) |
|
Anchorage, AK |
|
100% |
|
|
December 2017 |
|
Boca Raton, FL |
|
100% |
|
|
December 2017 |
|
Westminster, CA |
|
100% |
|
|
December 2017 |
|
Hicksville, NY |
|
100% |
|
|
December 2017 |
|
Orland Park, IL |
|
100% (1) |
|
|
December 2017 |
|
Florissant, MO |
|
Out parcel |
|
|
December 2017 |
|
Salem, NH |
|
Out parcel |
|
|
December 2017 |
|
Fairfield, CA |
|
Partial |
|
|
December 2017 |
|
Las Vegas, NV |
|
Partial |
|
|
December 2017 |
|
Plantation, FL |
|
Partial |
|
|
December 2017 |
|
Yorktown Heights |
|
Partial |
|
|
December 2017 |
|
Austin, TX |
|
100% (1) |
|
|
December 2017 / September2017 |
|
North Little Rock, AR |
|
Auto Center |
|
|
September 2017 |
|
Ft. Wayne, IN |
|
Out parcel |
|
|
September 2017 |
|
St. Clair Shores, MI |
|
100% |
|
|
September 2017 |
|
Redmond, WA |
|
Auto Center |
|
|
September 2017 |
|
Temecula, CA |
|
Partial |
|
|
June 2017 |
|
Roseville, CA |
|
Auto center |
|
|
June 2017 |
|
North Riverside, IL |
|
Partial |
|
|
June 2017 |
|
Watchung, NJ |
|
100% |
|
|
June 2017 |
|
Canton, OH |
|
Partial |
|
|
June 2017 |
|
Dayton, OH |
|
Auto center |
|
|
June 2017 |
|
Carson, CA |
|
100% (1) |
|
|
April 2017 / December 2016 |
|
San Diego, CA |
|
100% (1) |
|
|
April 2017 |
|
Aventura, FL |
|
100% |
|
|
April 2017 |
|
Hialeah, FL |
|
100% (1) |
|
|
April 2017 |
|
Anderson, SC |
|
100% (1) |
|
|
April 2017 / July 2016 |
|
Charleston, SC |
|
100% (1) |
|
|
April 2017 / October 2016 |
|
Valley View, TX |
|
100% |
|
|
April 2017 |
|
North Miami, FL |
|
100% |
|
|
March 2017 |
|
Cockeysville, MD |
|
Partial |
|
|
March 2017 |
|
Olean, NY |
|
Partial |
|
|
March 2017 |
|
Santa Cruz, CA |
|
Partial |
|
|
December 2016 |
|
Santa Monica, CA |
|
100% |
|
|
December 2016 |
|
Saugus, MA |
|
Partial |
|
|
December 2016 |
|
Guaynabo, PR |
|
Partial |
|
|
December 2016 |
|
Roseville, MI |
|
Partial |
|
|
November 2016 |
|
Troy, MI |
|
Partial |
|
|
November 2016 |
|
West Hartford, CT |
|
100% |
|
|
October 2016 |
|
Rehoboth Beach, DE |
|
Partial |
|
|
October 2016 |
|
St. Petersburg, FL |
|
100% |
|
|
October 2016 |
|
Warwick, RI |
|
Auto center |
|
|
October 2016 |
|
North Hollywood, CA |
|
Partial |
|
|
July 2016 |
|
Orlando, FL |
|
100% |
|
|
July 2016 |
|
Ft. Wayne, IN |
|
Out parcel |
|
|
July 2016 |
|
West Jordan, UT |
|
Partial + auto center |
|
|
July 2016 |
|
Madison, WI |
|
Partial |
|
|
July 2016 |
|
Bowie, MD |
|
Auto center |
|
|
May 2016 |
|
Hagerstown, MD |
|
Auto center |
|
|
May 2016 |
|
Wayne, NJ (2) |
|
Partial + auto center |
|
|
May 2016 |
|
Albany, NY |
|
Auto center |
|
|
May 2016 |
|
Fairfax, VA |
|
Partial + auto center |
|
|
May 2016 |
|
San Antonio, TX |
|
Auto center |
|
|
March 2016 |
|
Honolulu, HI |
|
100% |
|
|
December 2015 |
|
Memphis, TN |
|
100% |
|
|
December 2015 |
|
Braintree, MA |
|
100% |
|
|
November 2015 |
|
(1) |
In 2017, the Company converted partial recapture rights to 100% recapture rights and exercised such recapture rights. |
|
(2) |
In 2017, the Company contributed this asset to the GGP II JV and retained a 50% ownership interest. |
- 35 -
The Master Lease also provides for certain rights of Sears Holdings to terminate the Master Lease with respect to Wholly Owned Properties that cease to be profitable for operation by Sears Holdings (those stores that possess Earnings Before Interest, Taxes, Depreciation, Amortization and Rent (or “EBITDAR”) for t he 12 month period ending as of the last day of the most recently completed fiscal quarter of Sears Holdings that is less than the base rent for that store) after the first lease year. In order to terminate the Master Lease with respect to a certain prope rty, Sears Holdings must make a payment to us of an amount equal to one year of rent (together with taxes and other expenses) with respect to such property. Sears Holdings’ termination right is limited to terminating the Master Lease with respect to prope rties representing up to 20% of the aggregate annual rent payment under the Master Lease with respect to all properties in any lease year.
As of December 31, 2017, Sears Holdings had terminated the Master Lease with respect to 56 stores totaling 7.4 million square feet of gross leasable area. The aggregate base rent at these stores at the time of termination was approximately $23.6 million. Sears Holdings continued to pay the Company rent until it vacated the stores and also paid aggregate termination fees of approximately $45.1 million, amounts equal to one year of aggregate annual base rent plus one year of estimated real estate taxes and operating expense.
As of December 31, 2017, the Company had announced redevelopment projects at 18 of the terminated properties and will continue to announce redevelopment activity as new leases are signed to occupy the space formerly occupied by Sears Holdings.
- 36 -
A summary of the termination properties is presented below:
|
|
|
|
|
|
|
|
|
|
|
Announced |
|
|
Square Feet |
|
|
Notice |
|
Termination |
|
Redevelopment |
||
|
Cullman, AL |
|
|
98,500 |
|
|
September 2016 |
|
January 2017 |
|
Q2 2017 |
|
Sierra Vista, AZ |
|
|
86,100 |
|
|
September 2016 |
|
January 2017 |
|
|
|
Thornton, CO |
|
|
190,200 |
|
|
September 2016 |
|
January 2017 |
|
Q1 2017 |
|
Chicago, IL |
|
|
118,800 |
|
|
September 2016 |
|
January 2017 |
|
|
|
Springfield, IL |
|
|
84,200 |
|
|
September 2016 |
|
January 2017 |
|
Q3 2016 |
|
Elkhart, IN |
|
|
86,500 |
|
|
September 2016 |
|
January 2017 |
|
Q4 2016 |
|
Merrillville, IN |
|
|
108,300 |
|
|
September 2016 |
|
January 2017 |
|
Q4 2016 |
|
Houma, LA |
|
|
96,700 |
|
|
September 2016 |
|
January 2017 |
|
|
|
New Iberia, LA |
|
|
91,700 |
|
|
September 2016 |
|
January 2017 |
|
Q2 2017 |
|
Alpena, MI |
|
|
118,200 |
|
|
September 2016 |
|
January 2017 |
|
|
|
Manistee, MI |
|
|
87,800 |
|
|
September 2016 |
|
January 2017 |
|
|
|
Sault Sainte Marie, MI |
|
|
92,700 |
|
|
September 2016 |
|
January 2017 |
|
|
|
Kearney, NE |
|
|
86,500 |
|
|
September 2016 |
|
January 2017 |
|
Q3 2016 |
|
Deming, NM |
|
|
96,600 |
|
|
September 2016 |
|
January 2017 |
|
|
|
Harlingen, TX |
|
|
91,700 |
|
|
September 2016 |
|
January 2017 |
|
|
|
Yakima, WA |
|
|
97,300 |
|
|
September 2016 |
|
January 2017 |
|
|
|
Riverton, WY |
|
|
94,800 |
|
|
September 2016 |
|
January 2017 |
|
|
|
Riverside, CA |
|
|
94,500 |
|
|
January 2017 |
|
April 2017 |
|
|
|
Kissimmee, FL |
|
|
112,505 |
|
|
January 2017 |
|
April 2017 |
|
|
|
Leavenworth, KS |
|
|
76,853 |
|
|
January 2017 |
|
April 2017 |
|
|
|
Hopkinsville, KY |
|
|
70,326 |
|
|
January 2017 |
|
April 2017 |
|
|
|
Paducah, KY |
|
|
108,244 |
|
|
January 2017 |
|
April 2017 |
|
Q3 2017 |
|
Owensboro, KY |
|
|
68,334 |
|
|
January 2017 |
|
April 2017 |
|
|
|
Detroit Lakes, MN |
|
|
79,102 |
|
|
January 2017 |
|
April 2017 |
|
|
|
Jefferson City, MO |
|
|
92,016 |
|
|
January 2017 |
|
April 2017 |
|
Q2 2017 |
|
Henderson, NV |
|
|
122,823 |
|
|
January 2017 |
|
April 2017 |
|
Q1 2017 |
|
Concord, NC |
|
|
137,499 |
|
|
January 2017 |
|
April 2017 |
|
|
|
Chapel Hill, OH |
|
|
187,179 |
|
|
January 2017 |
|
April 2017 |
|
|
|
Kenton, OH |
|
|
96,066 |
|
|
January 2017 |
|
April 2017 |
|
|
|
Muskogee, OK |
|
|
87,500 |
|
|
January 2017 |
|
April 2017 |
|
|
|
Mount Pleasant, PA |
|
|
83,536 |
|
|
January 2017 |
|
April 2017 |
|
|
|
Sioux Falls, SD |
|
|
72,511 |
|
|
January 2017 |
|
April 2017 |
|
|
|
El Paso, TX |
|
|
103,657 |
|
|
January 2017 |
|
April 2017 |
|
|
|
Layton, UT |
|
|
90,010 |
|
|
January 2017 |
|
April 2017 |
|
|
|
Elkins, WV |
|
|
94,885 |
|
|
January 2017 |
|
April 2017 |
|
|
|
Platteville, WI |
|
|
94,841 |
|
|
January 2017 |
|
April 2017 |
|
|
|
Sarasota, FL |
|
|
204,500 |
|
|
June 2017 |
|
October 2017 |
|
|
|
Chicago, IL |
|
|
293,700 |
|
|
June 2017 |
|
October 2017 |
|
|
|
Overland Park, KS |
|
|
215,000 |
|
|
June 2017 |
|
October 2017 |
|
|
|
Lafayette, LA |
|
|
194,900 |
|
|
June 2017 |
|
October 2017 |
|
|
|
Cockeysville, MD |
|
|
83,900 |
|
|
June 2017 |
|
October 2017 |
|
Q1 2017 |
|
Hagerstown, MD |
|
|
107,300 |
|
|
June 2017 |
|
October 2017 |
|
Q1 2016 |
|
Roseville, MI |
|
|
277,000 |
|
|
June 2017 |
|
October 2017 |
|
Q3 2016 |
|
Burnsville, MN |
|
|
161,700 |
|
|
June 2017 |
|
October 2017 |
|
|
|
Albany, NY |
|
|
216,200 |
|
|
June 2017 |
|
October 2017 |
|
Q1 2016 |
|
East Northport, NY |
|
|
187,000 |
|
|
June 2017 |
|
October 2017 |
|
Q2 2017 |
|
Johnson City, NY |
|
|
155,100 |
|
|
June 2017 |
|
October 2017 |
|
|
|
Olean, NY |
|
|
75,100 |
|
|
June 2017 |
|
October 2017 |
|
Q1 2017 |
|
Mentor, OH |
|
|
208,700 |
|
|
June 2017 |
|
October 2017 |
|
|
|
Middleburg Heights, OH |
|
|
351,600 |
|
|
June 2017 |
|
October 2017 |
|
|
|
Toledo, OH |
|
|
209,900 |
|
|
June 2017 |
|
October 2017 |
|
|
|
York, PA |
|
|
82,000 |
|
|
June 2017 |
|
October 2017 |
|
|
|
Warwick, RI |
|
|
169,200 |
|
|
June 2017 |
|
October 2017 |
|
Q3 2016 / Q3 2017 |
|
Greendale, WI |
|
|
238,400 |
|
|
June 2017 |
|
October 2017 |
|
Q4 2017 |
|
Friendswood, TX |
|
|
166,000 |
|
|
June 2017 |
|
November 2017 (1) |
|
|
|
Westwood, TX |
|
|
215,000 |
|
|
June 2017 |
|
January 2018 (1) |
|
|
|
Total square feet |
|
|
7,411,187 |
|
|
|
|
|
|
|
|
(1) |
The Company and Sears Holdings agreed to extend occupancy beyond October 2017 under the existing Master Lease terms. |
- 37 -
The JV Master Leases are unitary, non-severable leases for all JV Properties in the applicable JV Master Lease and are generally triple net leases with respect to the space occupied by Sears Holdings, subject to Sears Holdings’ proportionate sharing of taxes and other operating expenses with respect to properties that have third-party tenants of the GGP JVs, the Simon JV and the Macerich JV, as applicable. The JV Master Leases each have an initial term of 10 years, and in each case Sears Holdings has three separate, consecutive five-year renewal options to extend the initial term. For each JV Master Lease in each of the initial and renewal terms, after the third lease year of the initial term, the annual base rent for the remainder of the term and all renewal terms will be increased by 2.0% per annum for each lease year over the rent for the immediately preceding lease year.
Each JV Master Lease provides the GGP JVs, the Simon JV and the Macerich JV, as applicable, with the right to recapture (without additional payment) up to approximately 50% of the space occupied by Sears Holdings under such JV Master Lease (subject to certain exceptions). In addition, the GGP JVs, the Simon JV and the Macerich JV, as applicable, have the right to recapture any automotive care centers which are free-standing or attached as “appendages” to the JV Properties, all outparcels or outlots, and certain portions of parking areas and common areas at the JV Properties (other than with respect to one property owned by the Macerich JV). The Simon JV has the additional right to recapture 100% of the space occupied by Sears Holdings at one of the JV Properties under its JV Master Lease for a termination fee as provided in such JV Master Lease.
Each JV Master Lease also provides Sears Holdings with the right to terminate the lease with respect to underperforming stores upon payment of a termination fee calculated as provided in the JV Master Lease.
Except with respect to the rent amounts and the properties covered, the general formats of the JV Master Leases are similar to one another and to the Master Lease.
Tenant Summary
The following table sets forth information regarding our tenants and our leases, with JV Properties presented at our proportional share, based on signed leases as of December 31, 2017, including SNO leases:
|
(in thousands except number of leases and PSF data) |
|
|
|
|
|
|
|
|
|
|
|
|
|
|
|
|
|
|
|
|
|
|
|
|
|
|
|
Number of |
|
|
Leased |
|
|
% of Total |
|
|
Annual |
|
|
% of Total |
|
|
Annual |
|
||||||
|
Tenant |
|
Leases |
|
|
GLA |
|
|
Leased GLA |
|
|
Rent |
|
|
Annual Rent |
|
|
Rent PSF |
|
||||||
|
Sears Holdings (1) |
|
|
170 |
|
|
|
22,471 |
|
|
|
75.4 |
% |
|
$ |
102,645 |
|
|
|
47.8 |
% |
|
$ |
4.57 |
|
|
In-Place Third-Party Leases |
|
|
225 |
|
|
|
3,819 |
|
|
|
12.8 |
% |
|
|
48,624 |
|
|
|
22.6 |
% |
|
|
12.73 |
|
|
SNO Third-Party Leases |
|
|
114 |
|
|
|
3,534 |
|
|
|
11.8 |
% |
|
|
63,407 |
|
|
|
29.6 |
% |
|
|
17.94 |
|
|
Sub-Total Third-Party Leases |
|
|
339 |
|
|
|
7,353 |
|
|
|
24.6 |
% |
|
|
112,031 |
|
|
|
52.2 |
% |
|
|
15.24 |
|
|
Total |
|
|
509 |
|
|
|
29,824 |
|
|
|
100.0 |
% |
|
$ |
214,676 |
|
|
|
100.0 |
% |
|
$ |
7.20 |
|
|
(1) |
Leases reflects number of properties subject to the Master Lease and JV Master Leases. |
- 38 -
The following table lists the top tenants at our properties, including JV Properties presented at our proportional share, based on signed leases as of December 31, 2017, including SNO leas es:
|
(dollars in thousands) |
|
|
|
|
|
|
|
|
|
|
|
|
|
|
|
|
|
|
|
|
|
|
|
Number of |
|
|
Annual |
|
|
% of Total |
|
|
|
|
|
|
|
|
|
|||
|
Tenant |
|
Leases |
|
|
Rent |
|
|
Annual Rent |
|
|
Concepts/Brands |
|
|
|
|
|
|
|||
|
Sears Holdings (1) |
|
|
170 |
|
|
$ |
102,645 |
|
|
|
47.8 |
% |
|
Sears, Sears Auto Center, Kmart |
||||||
|
Round One Entertainment |
|
|
7 |
|
|
|
6,821 |
|
|
|
3.2 |
% |
|
|
||||||
|
Dave & Busters |
|
|
7 |
|
|
|
6,328 |
|
|
|
2.9 |
% |
|
|
||||||
|
At Home |
|
|
10 |
|
|
|
5,896 |
|
|
|
2.7 |
% |
|
|
||||||
|
Burlington Stores |
|
|
8 |
|
|
|
5,204 |
|
|
|
2.4 |
% |
|
|
||||||
|
Cinemark |
|
|
4 |
|
|
|
4,899 |
|
|
|
2.3 |
% |
|
|
||||||
|
Dick's Sporting Goods |
|
|
5 |
|
|
|
4,640 |
|
|
|
2.2 |
% |
|
|
||||||
|
Nordstrom Rack |
|
|
6 |
|
|
|
4,385 |
|
|
|
2.0 |
% |
|
|
||||||
|
AMC |
|
|
3 |
|
|
|
4,202 |
|
|
|
2.0 |
% |
|
|
||||||
|
Primark |
|
|
3 |
|
|
|
3,925 |
|
|
|
1.8 |
% |
|
|
||||||
|
Ross Dress for Less |
|
|
7 |
|
|
|
3,652 |
|
|
|
1.7 |
% |
|
Ross Dress for Less, dd's Discounts |
||||||
|
Lands' End (2) |
|
|
44 |
|
|
|
3,643 |
|
|
|
1.7 |
% |
|
|
||||||
|
24 Hour Fitness |
|
|
3 |
|
|
|
2,909 |
|
|
|
1.4 |
% |
|
|
||||||
|
TJX Companies |
|
|
7 |
|
|
|
2,849 |
|
|
|
1.3 |
% |
|
TJ Maxx, Marshalls, HomeGoods, HomeSense, Sierra Trading Post |
||||||
|
PetSmart |
|
|
5 |
|
|
|
2,391 |
|
|
|
1.1 |
% |
|
|
||||||
|
(1) |
Leases reflects number of properties subject to the Master Lease and JV Master Leases. |
|
(2) |
Lease agreements between Sears Holdings and Lands’ End were retained as a sublease under the Master Lease. However, Sears Holdings pays us additional rent under the Master Lease (in lieu of base rent attributable to the Lands’ End space leased to Sears Holdings under the Master Lease) an amount equal to rent payments (including expenses) required to be made by Lands’ End under the Lands’ End leases. |
Lease Expirations
The following table sets forth a summary schedule of lease expirations for signed leases, including SNO leases, with JV Properties presented at our proportional share, as of December 31, 2017. The information set forth in the table assumes that no tenants exercise renewal options or early termination rights:
|
(in thousands except number of leases) |
|
|
|
|
|
|
|
|
|
|
|
|
|
|
|
|
|
|
|
|
|
|
|
Number of |
|
|
Leased |
|
|
% of Total |
|
|
Annual |
|
|
% of Total |
|
|||||
|
Year |
|
Leases (1) |
|
|
GLA |
|
|
Leased GLA |
|
|
Rent |
|
|
Annual Rent |
|
|||||
|
Month-to-Month |
|
|
18 |
|
|
|
67 |
|
|
|
0.2 |
% |
|
$ |
931 |
|
|
|
0.4 |
% |
|
2018 |
|
|
30 |
|
|
|
173 |
|
|
|
0.6 |
% |
|
|
2,800 |
|
|
|
1.3 |
% |
|
2019 |
|
|
27 |
|
|
|
493 |
|
|
|
1.7 |
% |
|
|
3,426 |
|
|
|
1.6 |
% |
|
2020 |
|
|
36 |
|
|
|
375 |
|
|
|
1.3 |
% |
|
|
3,402 |
|
|
|
1.6 |
% |
|
2021 |
|
|
17 |
|
|
|
261 |
|
|
|
0.9 |
% |
|
|
2,812 |
|
|
|
1.3 |
% |
|
2022 |
|
|
14 |
|
|
|
196 |
|
|
|
0.7 |
% |
|
|
2,628 |
|
|
|
1.2 |
% |
|
2023 |
|
|
11 |
|
|
|
380 |
|
|
|
1.3 |
% |
|
|
7,118 |
|
|
|
3.3 |
% |
|
2024 |
|
|
5 |
|
|
|
102 |
|
|
|
0.3 |
% |
|
|
971 |
|
|
|
0.5 |
% |
|
2025 |
|
|
176 |
|
|
|
22,735 |
|
|
|
76.2 |
% |
|
|
105,879 |
|
|
|
49.3 |
% |
|
2026 |
|
|
15 |
|
|
|
415 |
|
|
|
1.4 |
% |
|
|
7,186 |
|
|
|
3.3 |
% |
|
2027 |
|
|
12 |
|
|
|
414 |
|
|
|
1.4 |
% |
|
|
4,390 |
|
|
|
2.0 |
% |
|
Thereafter |
|
|
34 |
|
|
|
679 |
|
|
|
2.3 |
% |
|
|
9,726 |
|
|
|
4.5 |
% |
|
SNO Leases |
|
|
114 |
|
|
|
3,534 |
|
|
|
11.8 |
% |
|
|
63,407 |
|
|
|
29.5 |
% |
|
Total |
|
|
509 |
|
|
|
29,824 |
|
|
|
100.0 |
% |
|
$ |
214,676 |
|
|
|
100.0 |
% |
|
(1) |
In 2025, includes 170 properties subject to the Master Lease and JV Master Leases. |
- 39 -
The Company is subject, from time to time, to various legal proceedings and claims that arise in the ordinary course of business. While the resolution of such matters cannot be predicted with certainty, management believes, based on currently available information, that the final outcome of such matters will not have a material effect on the consolidated financial position, results of operations, cash flows or liquidity of the Company.
Litigation Related to the Transaction
In May and June of 2015, four purported Sears Holdings shareholders filed lawsuits in the Delaware Court of Chancery challenging the Transaction, which lawsuits were subsequently consolidated into a single action captioned In re Sears Holdings Corporation Stockholder and Derivative Litigation , Consol. C.A. No. 11081-VCL (the “Action”). On October 15, 2015, plaintiffs filed a verified consolidated stockholder derivative complaint in the Action against the individual members of Sears Holdings’ Board of Directors, ESL Investments, Inc. (together with its affiliates, “ESL”), Sears Holdings’ CEO, Fairholme Capital Management L.L.C. (“FCM”), and Seritage. On July 12, 2016, the plaintiffs filed a verified consolidated amended stockholder derivative complaint (the “Amended Complaint”) against the same defendants and asserting substantially the same claims as set forth in the complaint filed in October 2015. The plaintiffs brought the Action derivatively on behalf of Sears Holdings, which was named as a nominal defendant, and alleged that the Sears Holdings directors, as well as ESL and Edwards S. Lampert (in their capacity as the alleged controlling stockholder of Sears Holdings), breached their fiduciary duties to Sears Holdings shareholders by selling the Wholly Owned Properties to Seritage at a price that was unfairly low and was the result of a process that allegedly was flawed. The Amended Complaint also alleged that Seritage and FCM aided and abetted these alleged fiduciary breaches. Among other forms of relief, the Amended Complaint sought damages in unspecified amounts. In October 2016, following mediation, the parties reached an agreement-in-principle to settle the Action, which ultimately was reflected in a definitive Stipulation and Agreement of Settlement, Compromise and Release executed on February 8, 2017. On May 9, 2017, the Delaware Court of Chancery, after customary notice to Sears Holding stockholders and an in-person settlement hearing, entered a final order and judgment approving the settlement. Pursuant to the settlement, (a) the defendants and the D&O insurers for the individual members of the Sears Holdings’ Board of Directors paid $40.0 million, of which Seritage paid $19.0 million and (b) all defendants received customary releases. The defendants continue to deny the claims asserted and entered into the settlement solely to avoid the burden, expense, distraction, and inherent risk in and of litigation.
Not applicable.
- 40 -
|
ITEM 5. |
MARKET FOR REGISTRANT’S COMMON EQUI TY, RELATED STOCKHOLDER MATTERS AND ISSUER PURCHASES OF EQUITY SECURITIES |
The Company’s Class A common stock is listed and traded on the New York Stock Exchange (“NYSE”) under the symbol “SRG”. The Company's Class A common stock began trading on July 6, 2015. The following table presents the high and low sales prices for our Class A common stock on the NYSE and the dividends declared per share for the periods indicated:
|
|
|
Stock Price |
|
|
Dividends |
|
||||||
|
Quarter Ended |
|
High |
|
|
Low |
|
|
Declared |
|
|||
|
2017 |
|
|
|
|
|
|
|
|
|
|
|
|
|
December 31 |
|
$ |
46.34 |
|
|
$ |
39.68 |
|
|
$ |
0.25 |
|
|
September 30 |
|
|
48.98 |
|
|
|
41.49 |
|
|
|
0.25 |
|
|
June 30 |
|
|
44.04 |
|
|
|
38.76 |
|
|
|
0.25 |
|
|
March 31 |
|
|
47.31 |
|
|
|
39.80 |
|
|
|
0.25 |
|
|
2016 |
|
|
|
|
|
|
|
|
|
|
|
|
|
December 31 |
|
$ |
50.76 |
|
|
$ |
42.48 |
|
|
$ |
0.25 |
|
|
September 30 |
|
|
51.37 |
|
|
|
44.50 |
|
|
|
0.25 |
|
|
June 30 |
|
|
56.47 |
|
|
|
42.91 |
|
|
|
0.25 |
|
|
March 31 |
|
|
51.19 |
|
|
|
37.51 |
|
|
|
0.25 |
|
The following graph provides a comparison, from July 6, 2015 through December 31, 2017, of the percentage change in the cumulative total shareholder return (assuming reinvestment of dividends) on $100 invested in each of Class A shares of the Company, the Standard & Poor's ("S&P") 500 Index and the SNL US REIT Index, an industry index of publicly-traded REITs (including the Company).
Data for the S&P 500 Index and the SNL US REIT Index were provided by SNL Financial LLC.
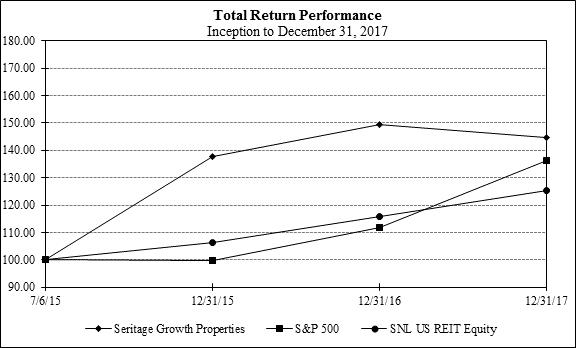
|
Index |
|
|
7/6/15 |
|
12/31/15 |
|
12/31/16 |
|
12/31/17 |
|
||||
|
Seritage Growth Properties |
Cum $ |
|
|
100 |
|
|
138 |
|
|
149 |
|
|
145 |
|
|
|
Return % |
|
|
|
|
|
37.6 |
|
|
49.3 |
|
|
44.7 |
|
|
S&P 500 |
Cum $ |
|
|
100 |
|
|
100 |
|
|
112 |
|
|
136 |
|
|
|
Return % |
|
|
|
|
|
(0.2 |
) |
|
11.8 |
|
|
36.2 |
|
|
SNL US REIT Equity |
Cum $ |
|
|
100 |
|
|
106 |
|
|
116 |
|
|
125 |
|
|
|
Return % |
|
|
|
|
|
6.3 |
|
|
15.7 |
|
|
25.3 |
|
- 41 -
On February 21, 2018, the reported closing sale price per share of our Class A common stock on the NYSE was $40.65 .
As of February 21, 2018, there were 34,042,416 Class A common shares issued and outstanding which were held by approximately 143 shareholders of record. The number of shareholders of record does not reflect persons or entities that held their shares in nominee or “street” name.
In addition, as of February 21, 2018, there were 1,328,866 Class B non-economic common shares issued and outstanding, 1,524,449 Class C non-voting common shares issued and outstanding and 20,218,145 outstanding Operating Partnership units held by limited partners other than the Company.
The Class B non-economic common shares have voting rights, but do not have economic rights and, as such, do not receive dividends and are not included in earnings per share computations.
The Class C non-voting common shares have economic rights, but do not have voting rights. Upon any transfer of a Class C non-voting common share to any person other than an affiliate of the holder of such share, such share shall automatically convert into one Class A common share. During the period from July 7, 2015 (Date Operations Commenced) through December 31, 2017, a total of 3,639,504 net shares of Class C non-voting common shares were converted to Class A common shares.
The Operating Partnership units are generally exchangeable into shares of Class A common stock on a one-for-one basis.
The following table provides information with respect to the Company’s equity compensation plan at December 31, 2017:
|
|
|
Number of securities to be issued upon exercise of outstanding options, warrants and rights |
|
|
Weighted-average exercise price of outstanding options, warrants and rights |
|
|
Number of securities remaining available for future issuance under equity compensation plans (excluding securities reflected in column (a)) |
|
|
|||
|
Plan Category |
|
(a) |
|
|
(b) |
|
|
(c) |
|
|
|||
|
Equity compensation plans approved by security holders |
|
|
88,190 |
|
(1) |
n/a |
|
(2) |
|
2,926,722 |
|
(3) |
|
|
Equity compensation plans not approved by security holders |
|
|
— |
|
|
|
— |
|
|
|
— |
|
|
|
Total |
|
|
88,190 |
|
|
|
— |
|
|
|
2,926,722 |
|
|
|
(1) |
Represents RSUs previously granted and that remain unvested as of December 31, 2017. |
|
(2) |
Weighted average exercise price does not apply to RSUs. |
|
(3) |
Shares remaining available for future issuance under the Seritage Growth Properties 2015 Share Plan, taking into account 216,835 shares of restricted stock previously granted and 106,443 shares subject to grants of RSUs previously granted (including those that remain unvested reported in column (a)). |
We currently intend to pay quarterly distributions in cash. However, the timing, amount and composition of all distributions will be made by the Company at the discretion of its Board of Trustees. Such distributions will depend on the financial position, results of operations, cash flows, capital requirements, debt covenants, applicable law and other factors as the Board of Trustees of Seritage deems relevant.
We have elected to be treated as a REIT for U.S. federal income tax purposes in connection with the filing of our first U.S. federal tax return and intend to maintain this status in future periods. To qualify as a REIT, the Company must meet a number of organizational and operational requirements, including requirements to distribute at least 90% of our ordinary taxable income and to either distribute capital gains to shareholders, or pay corporate income tax on the undistributed capital gains. A REIT will generally not pay federal taxes if it distributes 100% of its capital gains and ordinary income.
- 42 -
The following table sets forth selected financial data which should be read in conjunction with the Consolidated Financial Statements and the related Notes and Management's Discussion and Analysis of Financial Condition and Results of Operations contained in this Annual Report:
|
|
|
|
|
|
|
|
|
|
|
July 7, 2015 |
|
|
|
|
|
|
|
|
|
|
|
|
|
(Date Operations |
|
|
|
|
|
Year Ended |
|
|
Year Ended |
|
|
Commenced) to |
|
|||
|
|
|
December 31, 2017 |
|
|
December 31, 2016 |
|
|
December 31, 2015 |
|
|||
|
Operating Data |
|
|
|
|
|
|
|
|
|
|
|
|
|
Total revenue |
|
$ |
241,017 |
|
|
$ |
248,674 |
|
|
$ |
113,571 |
|
|
Total expenses |
|
|
355,584 |
|
|
|
279,121 |
|
|
|
122,944 |
|
|
Equity in income of unconsolidated joint ventures |
|
|
(7,788 |
) |
|
|
4,646 |
|
|
|
4,772 |
|
|
Net loss |
|
|
(120,813 |
) |
|
|
(91,009 |
) |
|
|
(38,803 |
) |
|
Net loss attributable to common shareholders |
|
|
(73,999 |
) |
|
|
(51,558 |
) |
|
|
(22,338 |
) |
|
Net loss per share attributable to Class A and Class C common shareholders - Basic and diluted |
|
$ |
(2.19 |
) |
|
$ |
(1.64 |
) |
|
$ |
(0.71 |
) |
|
Dividends declared per share |
|
|
1.00 |
|
|
|
1.00 |
|
|
|
0.50 |
|
|
Total NOI (1) |
|
$ |
174,758 |
|
|
$ |
190,492 |
|
|
$ |
89,493 |
|
|
EBITDA (1) |
|
|
235,695 |
|
|
|
171,324 |
|
|
|
67,496 |
|
|
Adjusted EBITDA (1) |
|
|
145,333 |
|
|
|
186,815 |
|
|
|
90,732 |
|
|
Funds from Operations ("FFO") (1) |
|
|
91,690 |
|
|
|
106,475 |
|
|
|
36,061 |
|
|
Company FFO (1) |
|
|
81,797 |
|
|
|
127,326 |
|
|
|
61,954 |
|
|
Cash Flow Data (2) |
|
|
|
|
|
|
|
|
|
|
|
|
|
Operating activities |
|
$ |
69,648 |
|
|
$ |
109,979 |
|
|
$ |
21,432 |
|
|
Investing activities |
|
|
27,150 |
|
|
|
(75,193 |
) |
|
|
(2,641,685 |
) |
|
Financing activities |
|
|
180,794 |
|
|
|
(50,486 |
) |
|
|
2,775,595 |
|
|
|
|
|
|
|
|
|
|
|
|
|
|
|
|
|
|
December 31, 2017 |
|
|
December 31, 2016 |
|
|
December 31, 2015 |
|
|||
|
Balance Sheet Data |
|
|
|
|
|
|
|
|
|
|
|
|
|
Investment in real estate, net |
|
$ |
1,714,560 |
|
|
$ |
1,644,952 |
|
|
$ |
1,639,275 |
|
|
Total assets |
|
|
2,775,817 |
|
|
|
2,712,237 |
|
|
|
2,833,359 |
|
|
Mortgage loans payable, net |
|
|
1,202,314 |
|
|
|
1,166,871 |
|
|
|
1,142,422 |
|
|
Total liabilities |
|
|
1,454,957 |
|
|
|
1,287,926 |
|
|
|
1,263,282 |
|
|
Non-controlling interests |
|
|
434,164 |
|
|
|
619,754 |
|
|
|
683,382 |
|
|
Total equity |
|
|
1,320,860 |
|
|
|
1,424,311 |
|
|
|
1,570,077 |
|
|
Other Data (3) |
|
|
|
|
|
|
|
|
|
|
|
|
|
Number of properties |
|
|
253 |
|
|
|
266 |
|
|
|
266 |
|
|
Gross leasable area (sq. ft.) |
|
|
37,270 |
|
|
|
39,522 |
|
|
|
39,743 |
|
|
Percentage leased |
|
|
80.0 |
% |
|
|
99.2 |
% |
|
|
99.4 |
% |
|
Annual rent |
|
$ |
214,676 |
|
|
$ |
231,675 |
|
|
$ |
202,938 |
|
|
Rent PSF |
|
$ |
7.20 |
|
|
$ |
5.91 |
|
|
$ |
5.13 |
|
|
(1) |
Total NOI, EBITDA, Adjusted EBITDA, FFO and Company FFO are supplemental, non-GAAP financial measurements and do not represent net income as defined by GAAP. |
|
(2) |
Cash flow data only represents the Company's consolidated cash flows as defined by GAAP and as such, operating cash flow does not include the cash received from our unconsolidated joint ventures, except to the extent of operating distributions from our unconsolidated joint ventures. |
|
(3) |
Other than number of properties, data based on signed leases as of December 31, 2017, December 31, 2016 and December 31, 2015, respectively, including SNO leases. JV Properties are presented at our proportional share. |
- 43 -
This section contains forward-looking statements that involve risks and uncertainties. Our actual results may vary materially from those discussed in the forward-looking statements as a result of various factors, including, without limitation, those set forth in "Risk Factors" and the other matters set forth in this Annual Report. See "Cautionary Statement Regarding Forward-Looking Statements."
All references to numbered Notes are to specific footnotes to our Consolidated Financial Statements included in this Annual Report. You should read this discussion in conjunction with our Consolidated Financial Statements, the notes thereto and other financial information included elsewhere in this Annual Report. Our financial statements are prepared in accordance with GAAP. Capitalized terms used, but not defined, in this Management's Discussion and Analysis of Financial Condition and Results of Operations ("MD&A") have the same meanings as in such Notes.
Overview
We are principally engaged in the acquisition, ownership, development, redevelopment, management and leasing of diversified retail real estate throughout the United States. As of December 31, 2017, our portfolio consisted of approximately 39.4 million square feet of GLA, including of 230 Wholly Owned Properties totaling approximately 35.2 million square feet of GLA across 49 states and Puerto Rico, and interests in 23 JV Properties totaling over 4.2 million square feet of GLA across 13 states.
As of December 31, 2017, we leased space at 148 Wholly Owned Properties to Sears Holdings under the Master Lease, including 76 properties leased only to Sears Holdings and 72 properties leased to both Sears Holdings and one or more third-party tenants. The remaining 92 Wholly Owned Properties include 51 properties that are leased solely to third-party tenants and do not have any space leased to Sears Holdings, and 31 vacant properties. As of December 31, 2017, space at 22 JV Properties is also leased to Sears Holdings by, as applicable, the GGP JVs, the Simon JV or the Macerich JV, in each case under a separate JV Master Lease. Sears Holdings is the sole tenant at nine JV properties and 13 JV properties are leased to both Sears Holdings and one or more third-party tenants. One JV Property was vacant as of December 31, 2017.
We generate revenues primarily by leasing our properties to tenants, including both Sears Holdings and third-party tenants, who operate retail stores (and potentially other uses) in the leased premises, a business model common to many publicly traded REITs. In addition to revenues generated under the Master Lease through rent payments from Sears Holdings, we generate revenue through leases to third-party tenants under existing and future leases for space at our properties.
The Master Lease provides us with the right to recapture up to approximately 50% of the space occupied by Sears Holdings at the 224 Wholly Owned Properties initially included in the Master Lease (subject to certain exceptions and limitations). In addition, Seritage has the right to recapture any automotive care centers which are free-standing or attached as “appendages” to the properties, and all outparcels or outlots and certain portions of parking areas and common areas. Upon exercise of this recapture right, we will generally incur certain costs and expenses for the separation of the recaptured space from the remaining Sears Holdings space and can reconfigure and rent the recaptured space to third-party tenants on potentially superior terms determined by us and for our own account. We also have the right to recapture 100% of the space occupied by Sears Holdings at each of 21 identified Wholly Owned Properties by making a specified lease termination payment to Sears Holdings, after which we expect to be able to reposition and re-lease those stores on potentially superior terms determined by us and for our own account.
As of December 31, 2017, we had exercised recapture rights at 56 properties, including 23 properties at which we exercised 100% recapture rights (seven of which were converted from partial recapture rights), 20 properties at which we exercised partial recapture rights and 13 properties at which we exercised our rights to recapture only automotive care centers or outparcels.
With respect to the JV Properties, each JV Master Lease provides for similar recapture rights as the Master Lease governing the Company’s Wholly Owned Properties.
Our primary objective is to create value for our shareholders through the re-leasing and redevelopment of the majority of our Wholly Owned Properties and JV Properties. In doing so, we expect to meaningfully grow NOI and diversify our tenant base while transforming our portfolio from one with a single-tenant orientation to one comprised predominately of first-class, multi-tenant shopping centers. In order to achieve our objective, we intend to execute the following strategies:
|
|
• |
Convert single-tenant buildings into multi-tenant properties at meaningfully higher rents; |
|
|
• |
Maximize value of vast land holdings through retail and mixed-use densification; |
|
|
• |
Leverage existing and future joint venture relationships with leading landlords and financial partners; and |
|
|
• |
Maintain a flexible capital structure to support value creation activities. |
- 44 -
The Company assessed the impact of the natural disasters (wildfires in California and Hurricanes Harvey, Irma, and Maria) that occurred during the year ended December 31, 2017 and determined that these natural disasters did not have a material impact on our operating results or financial position. The Company did not experience interruptions in rental payments nor has it incurred material capital expenditures to repair any property damage.
GGP Transactions
On July 12, 2017, the Company completed two transactions with GGP for gross consideration of $247.6 million whereby the Company (i) sold to GGP the Company’s JV Interests in eight of the 12 assets in the GGP I JV for $190.1 million and recorded a gain of $43.7 million which is included in gain on sale of interest in unconsolidated joint venture within the consolidated statements of operations; and (ii) contributed five Wholly Owned Properties to the GGP II JV and sold a 50% interest in the new JV Properties to GGP for $57.5 million and recorded a gain of $11.5 million which is included in gain on sale of real estate within the consolidated statements of operations.
As a result of the transactions, the Company reduced amounts outstanding under its Mortgage Loans and Future Funding Facility by $50.6 million and received approximately $171.6 million of additional cash proceeds before closing costs, which it has used to fund the Company’s redevelopment pipeline and for general corporate purposes.
Simon Transaction
On November 3, 2017, the Company sold to Simon the its 50% JV Interests in five of the ten assets in the Simon JV for $68.0 million and recorded a gain of $16.6 million which is included in gain on sale of interest in unconsolidated joint venture within the consolidated statements of operations. Net proceeds from the sale have been used to fund the Company’s redevelopment pipeline and for general corporate purposes.
Results of Operations
We derive substantially all of our revenue from rents received from tenants under existing leases at each of our properties. This revenue generally includes fixed base rents and recoveries of expenses that we have incurred and that we pass through to the individual tenants, in each case as provided in the respective leases.
Our primary cash expenses consist of our property operating expenses, general and administrative expenses, interest expense and construction and development related costs. Property operating expenses include: real estate taxes, repairs and maintenance, management expenses, insurance, ground lease costs and utilities; general and administrative expenses include payroll, office expenses, professional fees, and other administrative expenses; and interest expense is primarily on our mortgage loan payable. In addition, we incur substantial non-cash charges for depreciation and amortization on our properties and related intangible assets and liabilities resulting from the Transaction.
We did not have any revenues or expenses until we completed the Transaction on July 7, 2015.
Comparison of the Year Ended December 31, 2017 to the Year Ended December 31, 2016
Rental Income
For the year ended December 31, 2017, the Company recognized total rental income of $178.5 million as compared to $186.4 million for the year ended December 31, 2016. The $7.9 million decrease was driven primarily by (i) reduced rental income under the Master Lease of $20.3 million and (ii) reduced straight-line rent of $9.2 million, offset by (i) termination fee income of $14.0 million and (ii) increased third-party rental income of $7.1 million.
Rental income attributable to Sears Holdings was $112.9 million (excluding termination fee income of $19.3 million and straight-line rental income of $0.8 million), or 73.2% of total rental income earned in the period. For the prior year period, the comparable rental income attributable to Sears Holdings was $133.2 million, or approximately 79.5% of total rental income earned in the period.
Rental income attributable to third-party tenants was $41.4 million (excluding straight-line rental income of $2.9 million), or 26.8% of total rental income earned in the period. For the prior year period, the comparable rental income attributable to third-party tenants was $34.3 million, or approximately 20.5% of total rental income earned in the period.
- 45 -
Straight-line rent was $ 3.7 million as compared to $ 12.9 million for the prior year period. The reduction in straight-line rent was primarily due to reduced rental income under the Master Lease and the amortization of accrued rental revenues related to the straight-line method of reporting that are deemed uncol lectable as result of recapture and termination activity under the Master Lease.
On an annual basis, and taking into account all signed leases, including those which have not yet commenced rental payments, rental income attributable to third-party tenants would have represented approximately 52.2% of total annual base rental income as of December 31, 2017 as compared to 36.1% as of December 31, 2016.
Tenant Reimbursements and Property Operating Expenses
Pursuant to the provisions of the Master Lease and many third-party leases, the Company is entitled to be reimbursed for certain property related expenses. For the years ended December 31, 2017 and December 31, 2016, the Company recorded tenant reimbursement income of $62.5 million and $62.3 million, respectively, compared to property operating expenses and real estate tax expense aggregating of $65.3 million and $65.2 million, respectively.
Depreciation and Amortization Expenses
Depreciation and amortization expenses consist of depreciation of real property, depreciation of furniture, fixtures and equipment, and amortization of certain lease intangible assets.
For the year ended December 31, 2017, the Company incurred depreciation and amortization expenses of $262.2 million as compared to depreciation and amortization expenses of $177.1 million in the prior year period. The increase of $85.6 million was due primarily to (i) $51.5 million of accelerated amortization attributable to certain lease intangible assets and (ii) $58.3 million of accelerated depreciation attributable to certain buildings that were demolished for redevelopment, offset by (i) $23.8 million of lower scheduled amortization and depreciation resulting from an increase in fully-amortized lease intangibles and fully-depreciated buildings and (ii) $0.5 million of lower scheduled amortization and depreciation as a result of the contribution of five Wholly Owned Properties to the GGP II JV July 2017.
Accelerated amortization results from the recapture of space from, or the termination of space by, Sears Holdings. Such recaptures and terminations are deemed lease modifications and require related lease intangibles to be amortized over the shorter of the shortened lease term or the remaining useful life of the asset.
General and Administrative Expenses
General and administrative expenses consist of personnel costs, including stock-based compensation, professional fees, office expenses and overhead expenses.
For the year ended December 31, 2017, the Company incurred general and administrative expenses of $27.9 million compared to general and administrative expenses of $17.5 million for the prior year period. The $10.4 million increase was driven primarily by (i) increased compensation expense of $5.5 million related to equity awards with performance-based vesting and (ii) an increase in personnel.
Compensation expense for equity awards with performance-based vesting is based on the fair value of the common shares at the date of the grant and is recognized, at the date the achievement of performance criteria is deemed probable, an amount equal to that which would have been recognized ratably from the date of the grant through the date the achievement of performance criteria is deemed probable, and then ratably from the date the achievement of performance criteria is deemed probable through the remainder of the vesting period .
Interest Expense
For the year ended December 31, 2017, the Company incurred $70.1 million of interest expense (net of amounts capitalized) as compared to interest expense of $63.6 million for the prior year period. The increase in interest expense in was driven by higher average borrowings under the Future Funding Facility and Unsecured Term Loan, as well as higher average LIBOR rates.
Unrealized Loss on Interest Rate Cap
For the year ended December 31, 2017, the Company recorded a loss of $0.7 million compared to a loss of less than $1.4 million for the year ended December 31, 2016.
- 46 -
Comparison of the Year Ended December 31, 2016 to the Period from July 7, 2015 (Date Operations Com menced) to December 31, 2015
Rental Income
For the year ended December 31, 2016, t he Company recognized total rental income of $186.4 million as compared to $86.6 million for the period from July 7, 2015 (Date Operations Commenced) to December 31, 2015. The $99.8 million increase was primarily due to additional days in the reporting period, new rents from completed redevelopments and the annual increase in base rent under the Master Lease, offset by reduced base rent under the Master Lease as a result of recapture activity initiated by the Company. In addition, the Company recorded $5.3 million of termination fee income as a result of the termination of the Master Lease at 17 properties by Sears Holdings in the year ended December 31, 2016.
Rental income attributable to Sears Holdings was $133.2 million (excluding termination fee income of $5.3 million and straight-line rental income of $9.9 million), or 79.5% of total rental income earned in the period. For the prior year period, the comparable rental income attributable to Sears Holdings was $64.8 million, or approximately 83.5% of total rental income earned in the period.
Rental income attributable to third-party tenants was $34.3 million (excluding straight-line rental income of $3.0 million), or 20.5% of total rental income earned in the period. For the prior year period, the comparable rental income attributable to third-party tenants was $12.9 million, or approximately 16.5% of total rental income earned in the period.
Straight-line rent was $12.9 million as compared to $8.3 million for the prior year period. The increase in straight-line rent was primarily due additional days in the reporting period, offset by the amortization of accrued rental revenues related to the straight-line method of reporting that are deemed uncollectable as result of recapture and termination activity under the Master Lease.
On an annual basis, and taking into account all signed leases, including those which have not yet commenced rental payments, rental income attributable to third-party tenants would have represented approximately 36.1% of total annual base rental income as of December 31, 2016 as compared to 24.0% as of December 31, 2015.
Tenant Reimbursements and Property Operating Expenses
Pursuant to the provisions of the Master Lease and many third-party leases, the Company is entitled to be reimbursed for certain property related expenses. For the year ended December 31, 2016, the Company recorded tenant reimbursement income of $62.3 million, compared to property operating expenses and real estate tax expense aggregating $65.2 million. For the period from July 7, 2015 (Date Operations Commenced) to December 31, 2015, the Company recorded tenant reimbursement income of $26.9 million, compared to property operating expenses and real estate tax expense aggregating $28.7 million. The increase in both tenant reimbursement income and property operating expenses was primarily due to additional days in the reporting period.
Depreciation and Amortization Expenses
Depreciation and amortization expenses consist of depreciation of real property, depreciation of furniture, fixtures and equipment, and amortization of certain lease intangible assets. For the year ended December 31, 2016, the Company incurred depreciation and amortization expenses of $177.1 million as compared to depreciation and amortization expenses of $65.9 million for the period from July 7, 2015 (Date Operations Commenced) to December 31, 2015. The increase of $111.2 million was primarily due to additional days in the reporting period, as well as approximately $40.4 million of accelerated amortization related to certain lease intangible assets. Accelerated amortization results from the recapture of space from, or the termination of space by, Sears Holdings. Such recaptures and terminations are deemed lease modifications and require related lease intangibles to be amortized over the shorter of the shortened lease term or the remaining useful life of the asset.
General and Administrative Expenses
General and administrative expenses consist of personnel costs, including stock-based compensation, professional fees, office expenses, including information technology, and other overhead expenses.
- 47 -
For the year ended December 31, 2016, the Company incurred general an d administrative expenses of $17.5 million compared to general and administrative expenses of $10.0 million for the period from July 7, 2015 (Date Operations Commenced) to December 31, 2015. The increase in general and administrative expenses was primaril y due to additional days in the reporting period and the hiring of additional personnel, offset by reduced up-front personnel costs related to the hiring of certain employees. The period from July 7, 2015 (Date Operations Commenced) to December 31, 2015 in cluded $1.9 million of such up-front personnel costs.
Litigation Charge
In October 2016, an agreement-in-principle was reached to settle a legal action to which we were a party, which agreement ultimately was reflected in a definitive Stipulation and Agreement of Settlement, Compromise and Release executed on February 8, 2017. The defendants, including the Company, denied the claims asserted and entered into the settlement solely to avoid the burden, expense, distraction, and inherent risk in and of litigation. The Company, having determined that a liability was both probable and estimable, recorded a charge of $19.0 million, representing the Company’s share of the settlement as contemplated, during the year ended December 31, 2016.
On May 9, 2017, the Delaware Court of Chancery entered a final order and judgment approving the settlement. Pursuant to the settlement, (a) the defendants and the D&O insurers for the individual members of the Sears Holdings’ Board of Directors paid $40.0 million, of which Seritage paid $19.0 million, and (b) all defendants received customary releases.
Acquisition-Related Expenses
The Company incurred acquisition-related expenses, primarily remaining legal fees, of less than $0.1 million during the year ended December 31, 2016 as compared to acquisition-related expenses of $18.4 million for the period from July 7, 2015 (Date Operations Commenced) to December 31, 2015. These costs consisted of due diligence, legal, consulting and other similar expenses related to the Transaction.
Interest Expense
For the year ended December 31, 2016, the Company incurred $63.6 million of interest expense (net of amounts capitalized) as compared to interest expense of $30.5 million for the period from July 7, 2015 (Date Operations Commenced) to December 31, 2015. Amortization of debt issuance costs was approximately $5.4 million for the year ended December 31, 2016 and $2.7 million for the period from July 7, 2015 (Date Operations Commenced) to December 31, 2015.
The increase in interest expense was driven primarily by additional days in the reporting period, as well as higher average borrowings under the Future Funding Facility and higher average LIBOR rates.
Unrealized Loss on Interest Rate Cap
For the year ended December 31, 2016, the Company recorded an unrealized loss of $1.4 million related to the change in fair value of the interest rate cap associated with its Mortgage Loan as compared to an unrealized loss of $2.9 million for the period from July 7, 2015 (Date Operations Commenced) to December 31, 2015. As of December 31, 2016, the interest rate cap had a fair value of approximately $0.7 million as compared to $2.1 million at December 31, 2015.
Liquidity and Capital Resources
Property rental income is our primary source of cash and is dependent on a number of factors, including occupancy levels and rental rates, as well as our tenants’ ability to pay rent. Our primary uses of cash include payment of operating expenses, debt service, reinvestment in and redevelopment of properties, and distributions to shareholders and unitholders. We believe that we currently have sufficient liquidity to fund such uses in the form of, as of December 31, 2017, (i) $241.6 million of unrestricted cash, (ii) $175.7 million of restricted cash, (iii) anticipated cash provided by operations and (iv) $55.0 million of permitted, but uncommitted, borrowing capacity under our Unsecured Term Loan. We may also raise additional capital through the public or private issuance of debt securities, common or preferred equity or other instruments convertible into or exchangeable for common or preferred equity, as well as through asset sales or joint ventures.
In November 2016, the Company and the servicer for our Mortgage Loans entered into amendments to our Loan Agreements to resolve a disagreement regarding one of the cash flow sweep provisions in our Loan Agreements. The principal terms of these amendments are that the Company has (i) posted $30.0 million, and will post $3.3 million on a monthly basis, to a redevelopment project reserve account, which amounts may be used by the Company to fund redevelopment activity and (ii) extended the spread maintenance provision for prepayment of the loan by two months through March 9, 2018 (with the spread maintenance premium for the second month at a reduced amount).
- 48 -
On July 7, 2015, pursuant to the Transaction, the Company entered into a mortgage loan agreement (the “Mortgage Loan Agreement”) and mezzanine loan agreement (collectively, the “Loan Agreements”), providing for term loans in an initial principal amount of approximately $1,161 million (collectively, the “Mortgage Loans”) and a $100 million future funding facility (the “Future Funding Facility”). Pursuant to the terms of the Loan Agreements, amounts available under the Future Funding Facility were fully drawn by the Company on June 30, 2017. Such amounts were deposited into a redevelopment reserve and will be used to fund redevelopment activity at the Company’s properties.
On July 12, 2017, as a result of the transaction whereby the Company contributed five Wholly Owned Properties to the GGP II JV and sold a 50% interest in the new JV Properties to GGP for $57.5 million, the Company reduced amounts outstanding under its Mortgage Loans and Future Funding Facility by $50.6 million.
As of December 31, 2017, the aggregate principal amount outstanding under the Mortgage Loans and the Future Funding Facility was $1,211 million.
Interest under the Mortgage Loans and Future Funding Facility is due and payable on the payment dates, and all outstanding principal amounts are due when the loan matures on the payment date in July 2019, pursuant to the Loan Agreements. The Company has two one-year extension options subject to the payment of an extension fee and satisfaction of certain other conditions. Borrowings under the Mortgage Loans and Future Funding Facility bear interest at the London Interbank Offered Rates (“LIBOR”) plus, as of December 31, 2017, a weighted-average spread of 470 basis points; payments are made monthly on an interest-only basis. The weighted-average interest rates for the Mortgage Loans and Future Funding Facility for the years ended December 31, 2017 and December 31, 2016 were 6.03% and 5.24%, respectively.
The Loan Agreements contain a yield maintenance provision for the early extinguishment of the debt before March 9, 2018.
The Mortgage Loans and Future Funding Facility are secured by all of the Company’s Wholly Owned Properties and a pledge of its equity in the JVs. The Loan Agreements contain customary covenants for a real estate financing, including restrictions that limit the Company’s ability to grant liens on its assets, incur additional indebtedness, or transfer or sell assets, as well as those that may require the Company to obtain lender approval for certain major tenant leases or significant redevelopment projects. Such restrictions also include cash flow sweep provisions based upon certain measures of the Company’s and Sears Holdings’ financial and operating performance, including (a) where the “Debt Yield” (the ratio of net operating income for the mortgage borrowers to their debt) is less than 11.0%, (b) if the performance of Sears Holdings at the stores subject to the Master Lease with Sears Holdings fails to meet specified rent ratio thresholds, (c) if the Company fails to meet specified tenant diversification tests and (d) upon the occurrence of a bankruptcy or insolvency action with respect to Sears Holdings or if there is a payment default under the Master Lease with Sears Holdings, in each case, subject to cure rights, including providing specified amounts of cash collateral or satisfying tenant diversification thresholds.
In November 2016, the Company and the servicer for its Mortgage Loans entered into amendments to the Loan Agreements to resolve a disagreement regarding one of the cash flow sweep provisions in the Loan Agreements. The principal terms of these amendments are that the Company (i) posted $30.0 million, and will post $3.3 million on a monthly basis, to a redevelopment project reserve account, which amounts may be used by the Company to fund redevelopment activity and (ii) extended the spread maintenance provision for prepayment of the loan by two months through March 9, 2018 (with the spread maintenance premium for the second month at a reduced amount). As a result of this agreement and the resolution of the related disagreement, no cash flow sweep was imposed.
All obligations under the Loan Agreements are non-recourse to the borrowers and the pledgors of the JV Interests and the guarantors thereunder, except that (i) the borrowers and the guarantors will be liable, on a joint and several basis, for losses incurred by the lenders in respect of certain matters customary for commercial real estate loans, including misappropriation of funds and certain environmental liabilities and (ii) the indebtedness under the Loan Agreements will be fully recourse to the borrowers and guarantors upon the occurrence of certain events customary for commercial real estate loans, including without limitation prohibited transfers, prohibited voluntary liens, and bankruptcy. Additionally, the guarantors delivered a limited completion guaranty with respect to future redevelopments undertaken by the borrowers at the properties, and the Company must maintain (i) a net worth of not less than $1.0 billion and (ii) a minimum liquidity of not less than $50.0 million, throughout the term of the Loan Agreements.
The Company believes it is currently in compliance with all material terms and conditions of the Loan Agreements.
The Company incurred $22.3 million of debt issuance costs related to the Mortgage Loans and Future Funding Facility which are recorded as a direct deduction from the carrying amount of the Mortgage Loans and Future Funding Facility and amortized over the term of the Loan Agreements. As of December 31, 2017, the unamortized balance of the Company’s debt issuance costs was $8.2 million as compared to $14.3 million as December 31, 2016.
- 49 -
On February 23, 2017, the Operating Partnership, as borrower, and the Company , as guarantor, entered into a $200 million senior unsecured delayed draw term loan facility (the “Unsecured Delayed Draw Term Loan”) with JPP, LLC and JPP II, LLC as lenders (collectively, the “Original Lenders”) and JPP, LLC as administrative agent.
The total commitment of the Lenders under the Unsecured Delayed Draw Term Loan was $200 million and the maturity date was December 31, 2017.
The principal amount of loans outstanding under the Unsecured Delayed Draw Term Loan bore a base annual interest rate of 6.50%. If a cash flow sweep period were to have occurred and been continuing under the Company’s Mortgage Loan Agreement (i) the interest rate on any outstanding advances would have increased from and after such date by 1.5% per annum above the base interest rate and (ii) the interest rate on any advances made after such date would have increased by 3.5% per annum above the base interest rate. Accrued and unpaid interest was payable in cash, except that during the continuance of a cash flow sweep period under the Company’s Mortgage Loan Agreement, the Operating Partnership could elect to defer the payment of interest which deferred amount would be added to the outstanding principal balance of the loans.
On February 23, 2017 , the Operating Partnership paid to the Original Lenders an upfront commitment fee equal to $1.0 million. On May 24, 2017, the Operating Partnership paid to the Original Lenders an additional, and final, commitment fee of $1.0 million.
The Unsecured Delayed Draw Term Loan required that the Company at all times maintain (i) a net worth of not less than $1.0 billion, and (ii) a leverage ratio not to exceed 60.0%.
The Unsecured Delayed Draw Term Loan included customary representations and warranties, covenants and indemnities. The Unsecured Delayed Draw Term Loan also had customary events of default, including (subject to certain materiality thresholds and grace periods) payment default, failure to comply with covenants, material inaccuracy of representation or warranty, and bankruptcy or insolvency proceedings. If there was an event of default, the Lenders could declare all or any portion of the outstanding indebtedness to be immediately due and payable, exercise any rights they might have under any of the Unsecured Delayed Draw Term Loan documents, and require the Operating Partnership to pay a default interest rate on overdue amounts equal to 1.50% in excess of the applicable base interest rate.
Mr. Edward S. Lampert, the Company’s Chairman, is the Chairman and Chief Executive Officer of ESL, which controls JPP, LLC and JPP II, LLC. The terms of the Unsecured Delayed Draw Term Loan were approved by the Company’s Audit Committee and the Company’s Board of Trustees (with Mr. Edward S. Lampert recusing himself).
On December 27, 2017, the Operating Partnership, as borrower, and the Company , as guarantor, refinanced the Unsecured Delayed Draw Term Loan with a new $200 million unsecured term loan facility (the “Unsecured Term Loan”). The principal amount outstanding under the Unsecured Delayed Draw Term Loan at termination was $85 million. No prepayment penalties were triggered and the Unsecured Delayed Draw Term Loan terminated in accordance with its terms.
The lenders under the Unsecured Delayed Draw Term Loan, JPP, LLC and JPP II, LLC, maintained their funding of $85 million in the Unsecured Term Loan, with JPP, LLC appointed as administrative agent under the Unsecured Term Loan. An affiliate of Empyrean Capital Partners, L.P., a Delaware limited partnership (and together with JPP, LLC and JPP II LLC, each an “Initial Lender” and collectively, the “Initial Lenders”), funded $60 million under the Unsecured Term Loan, resulting in a total of $145 million committed and funded under the Unsecured Term Loan at closing. Under an accordion feature, the Company has the right to increase the total commitments up to $200 million and place an additional $55 million of incremental loans with the Initial Lenders or new lenders. The Initial Lenders under the Unsecured Term Loan are not obligated to make all or any portion of the incremental loans.
The Company used the proceeds of the Unsecured Term Loan, among other things, to refinance the Unsecured Delayed Draw Term Loan, to fund redevelopment projects and for other general corporate purposes. Loans under the Unsecured Term Loan are guaranteed by the Company.
The Unsecured Term Loan matures on the earlier of (i) December 31, 2018 and (ii) the date on which the outstanding indebtedness under the Company’s existing mortgage and mezzanine facilities are repaid in full. The Unsecured Term Loan may be prepaid at any time in whole or in part, without any penalty or premium. Amounts drawn under the Unsecured Term Loan and repaid may not be redrawn.
The principal amount of loans outstanding under the Unsecured Term Loan bears a base annual interest rate of 6.75%. Accrued and unpaid interest is payable in cash.
- 50 -
On December 27, 2017, the Borrower paid to each Initial Lender an upfront fee in an aggre gate amount equal to 1.00% of the principal amount of the loan made by such Initial Lender.
The Unsecured Term Loan requires that the Company at all times maintain (i) a net worth of not less than $1.0 billion, and (ii) a leverage ratio not to exceed 60.0%.
The Unsecured Term Loan includes customary representations and warranties, covenants and indemnities. The Unsecured Term Loan also has customary events of default, including (subject to certain materiality thresholds and grace periods) payment default, failure to comply with covenants, material inaccuracy of representations or warranties, and bankruptcy or insolvency proceedings. If there is an event of default, the lenders may declare all or any portion of the outstanding indebtedness to be immediately due and payable, exercise any rights they might have under any of the Unsecured Term Loan documents, and require the Borrower to pay a default interest rate on overdue amounts equal to 1.50% in excess of the then applicable interest rate.
The Company believes it is currently in compliance with all material terms and conditions of the Unsecured Term Loan.
The Company incurred $1.5 million of debt issuance costs related to the Unsecured Term Loan which are recorded as a direct deduction from the carrying amount of the Unsecured Term Loan and amortized over the term of the loan. As of December 31, 2017, the unamortized balance of the Company’s debt issuance costs was $1.5 million.
Mr. Edward S. Lampert, the Company’s Chairman, is the sole stockholder, chief executive officer and director of ESL Investments, Inc., which controls JPP, LLC and JPP II, LLC. The terms of the Unsecured Term Loan were approved by the Company’s Audit Committee and the Company’s Board of Trustees (with Mr. Edward S. Lampert recusing himself).
Preferred Shares
As of December 31, 2017, we had 2,800,000 7.00% Series A Cumulative Redeemable Preferred Shares (the “Series A Preferred Shares”) outstanding. We may not redeem the Series A Preferred Shares before December 14, 2022, except to preserve our status as a REIT or upon the occurrence of a Change of Control, as defined in the Trust Agreement addendums designating the Series A. On and after December 14, 2022, we may redeem any or all of the Series A Preferred Shares at $25.00 per share plus any accrued and unpaid dividends. In addition, upon the occurrence of a Change of Control, we may redeem any or all of the Series A Preferred Share for cash within 120 days after the first date on which such Change of Control occurred at $25.00 per share plus any accrued and unpaid
Hedging Instruments
In connection with the issuance of the Company’s Mortgage Loans and Future Funding Facility, we purchased for $5.0 million an interest rate cap with a term of four years, a notional amount of $1,261 million and a strike rate of 3.5%. Our objectives in using interest rate derivatives are to add stability to interest expense and to manage our exposure to interest rate movements. The interest rate cap is measured at fair value and included as a component of prepaid expenses, deferred expenses and other assets on the consolidated balance sheets. The Company did not elect hedge accounting and therefore the change in fair value is included within unrealized loss on interest rate cap in the consolidated statements of operations. For the year ended December 31, 2017, the Company recorded an unrealized loss of $0.7 million related to the change in fair value of the interest rate cap as compared to an unrealized loss of $1.4 million for the year ended December 31, 2016. As of December 31, 2017, the interest rate cap had a fair value of less than $0.1 million as compared to $0.7 million on December 31, 2016.
- 51 -
The Company’s Board of Trustees has declared the following common stock dividends, with holders of Operating Partnership units entitled to an equal distribution per Operating Partnership unit held on the record date:
|
|
|
|
|
|
|
Dividends per |
|
|
|
|
|
|
|
|
|
Class A and Class C |
|
|
|
Declaration Date |
|
Record Date |
|
Payment Date |
|
Common Share |
|
|
|
2017 |
|
|
|
|
|
|
|
|
|
October 24 |
|
December 29 |
|
January 11, 2018 |
|
$ |
0.25 |
|
|
July 25 |
|
September 29 |
|
October 12 |
|
|
0.25 |
|
|
April 25 |
|
June 30 |
|
July 13 |
|
|
0.25 |
|
|
February 28 |
|
March 31 |
|
April 13 |
|
|
0.25 |
|
|
2016 |
|
|
|
|
|
|
|
|
|
November 1 |
|
December 31 |
|
January 12, 2017 |
|
$ |
0.25 |
|
|
August 2 |
|
September 30 |
|
October 13 |
|
|
0.25 |
|
|
May 3 |
|
June 30 |
|
July 14 |
|
|
0.25 |
|
|
March 8 |
|
March 31 |
|
April 14 |
|
|
0.25 |
|
We currently intend to pay quarterly dividends and distributions in cash. However, the timing, amount, and composition of all dividends and distributions will be made by the Company at the discretion of its Board of Trustees. Such dividends and distributions will depend on the financial position, results of operations, cash flows, capital requirements, debt covenants, applicable law, and other factors as the Board of Trustees of Seritage deems relevant.
Off-Balance Sheet Arrangements
The Company accounts for its investments in joint ventures that it does not have a controlling interest or is not the primary beneficiary using the equity method of accounting and those investments are reflected on the consolidated balance sheets of the Company as investments in unconsolidated joint ventures. As of December 31, 2017, we did not have any off-balance sheet financing arrangements.
Contractual Obligations
Our contractual obligations relate to our Mortgage Loans, Future Funding Facility, Unsecured Term Loan and non-cancelable operating leases in the form of a ground lease at one of our properties, as well as operating leases for our corporate offices.
Information concerning our obligations and commitments to make future payments under contracts for these loan and lease agreements as of December 31, 2017 is aggregated in the following table (in thousands):
|
|
|
|
|
|
|
Payments due by Period |
|
|||||||||||||
|
|
|
|
|
|
|
Within |
|
|
|
|
|
|
|
|
|
|
After |
|
||
|
Contractual Obligation |
|
Total |
|
|
1 year |
|
|
1 - 3 years |
|
|
3 -5 years |
|
|
5 years |
|
|||||
|
Long-term debt (1) |
|
$ |
1,478,349 |
|
|
$ |
229,885 |
|
|
$ |
1,248,464 |
|
|
$ |
— |
|
|
$ |
— |
|
|
Operating leases |
|
|
10,961 |
|
|
|
1,331 |
|
|
|
2,485 |
|
|
|
1,644 |
|
|
|
5,501 |
|
|
(1) |
Includes expected interest payments. |
Capital Expenditures
Capital expenditures for Wholly Owned Properties under the Master Lease are generally the responsibility of the tenant. Given that the majority of our GLA is subject to the Master Lease as of December 31, 2017, we do not currently anticipate incurring material expenses related to maintenance capital expenditures, tenant improvement costs or leasing commissions, outside of those associated with retenanting and redevelopment projects as described below.
During the year ended December 31, 2017, we incurred maintenance capital expenditures of approximately $0.5 million and tenant improvement costs and leasing commissions of $2.0 million and $0.3 million, respectively, that were not associated with retenanting and redevelopment projects.
During the year ended December 31, 2016, we incurred maintenance capital expenditures of approximately $0.5 million and tenant improvement costs and leasing commissions of $1.3 million and $0.1 million, respectively, that were not associated with retenanting and redevelopment projects.
- 52 -
Cash Flows from Operating Activities
Net cash provided by operating activities was $69.6 million for the year ended December 31, 2017 and $110.0 million for the year ended December 31, 2016. Significant changes in the components of net cash provided by operating activities include:
|
− |
In 2017, a decrease in operating cash inflows of $19.0 million due the payment of a previously recorded litigation expense; and |
|
− |
In 2017, a decrease in operating cash inflows due to net reductions in rental income under the Master Lease, increased general and administrative expense and increased interest expense, offset by increased termination fee income and additional third-party rental income. |
Cash Flows from Investing Activities
Net cash provided by investing activities was $27.2 million for the year ended December 31, 2017 compared to net cash used by investing activities of $75.2 million for the year ended December 31, 2016. Significant components of net cash provided by and used in investing activities include:
|
− |
In 2017, proceeds from the sale of real estate and JV Interests, $308.2 million; |
|
− |
In 2017, development of real estate and property improvements, ($243.1) million; |
|
− |
In 2017, investments in unconsolidated joint ventures, ($38.0) million; |
|
− |
In 2016, development of real estate and property improvements, ($66.2) million; and |
|
− |
In 2016, investments in unconsolidated joint ventures, ($9.0) million. |
Cash Flows from Financing Activities
Net cash provided by financing activities was $180.8 million for the year ended December 31, 2017 compared to net cash used in financing activities of $50.5 million for the year ended December 31, 2016. Significant components of net cash provided by and used in financings activities include:
|
− |
In 2017, proceeds from the Future Funding Facility, $80.0 million; |
|
− |
In 2017, proceeds from the Unsecured Term Loan, $145.0 million; |
|
− |
In 2017, net proceeds from the issuance of preferred stock, $66.5 million; |
|
− |
In 2017, repayment of mortgage loan payables, ($50.6) million; |
|
− |
In 2017, cash distributions to common stockholders and holders of Operating Partnership units, ($55.7) million; |
|
− |
In 2016, proceeds from the Future Funding Facility, $20.0 million; and |
|
− |
In 2016, cash distributions to common stockholders and holders of Operating Partnership units, ($69.6) million. |
Litigation and Other Matters
In accordance with accounting standards regarding loss contingencies, the Company accrues an undiscounted liability for those contingencies where the incurrence of a loss is probable and the amount can be reasonably estimated, and we disclose the amount accrued and the amount of a reasonably possible loss in excess of the amount accrued or disclose the fact that such a range of loss cannot be estimated. We do not record liabilities when the likelihood that the liability has been incurred is probable but the amount cannot be reasonably estimated, or when the liability is believed to be only reasonably possible or remote. In such cases, we disclose the nature of the contingency, and an estimate of the possible loss, range of loss, or disclose the fact that an estimate cannot be made.
- 53 -
The Company is subject, from time to time, to various leg al proceedings and claims that arise in the ordinary course of business. While the resolution of such matters cannot be predicted with certainty, management believes, based on currently available information, that the final outcome of such matters will not have a material effect on the consolidated financial position, results of operations or liquidity of the Company.
In May and June of 2015, four purported Sears Holdings shareholders filed lawsuits in the Delaware Court of Chancery challenging the Transaction, which lawsuits were subsequently consolidated into a single action captioned In re Sears Holdings Corporation Stockholder and Derivative Litigation , Consol. C.A. No. 11081-VCL (the “Action”). On October 15, 2015, plaintiffs filed a verified consolidated stockholder derivative complaint in the Action against the individual members of Sears Holdings’ Board of Directors, ESL Investments, Inc. (together with its affiliates, “ESL”), Sears Holdings’ CEO, Fairholme Capital Management L.L.C. (“FCM”), and Seritage. On July 12, 2016, the plaintiffs filed a verified consolidated amended stockholder derivative complaint (the “Amended Complaint”) against the same defendants and asserting substantially the same claims as set forth in the complaint filed in October 2015. The plaintiffs brought the Action derivatively on behalf of Sears Holdings, which was named as a nominal defendant, and alleged that the Sears Holdings directors, as well as ESL and Edwards S. Lampert (in their capacity as the alleged controlling stockholder of Sears Holdings), breached their fiduciary duties to Sears Holdings shareholders by selling the Wholly Owned Properties to Seritage at a price that was unfairly low and was the result of a process that allegedly was flawed. The Amended Complaint also alleged that Seritage and FCM aided and abetted these alleged fiduciary breaches. Among other forms of relief, the Amended Complaint sought damages in unspecified amounts. In October 2016, following mediation, the parties reached an agreement-in-principle to settle the Action, which ultimately was reflected in a definitive Stipulation and Agreement of Settlement, Compromise and Release executed on February 8, 2017. On May 9, 2017, the Delaware Court of Chancery, after customary notice to Sears Holding stockholders and an in-person settlement hearing, entered a final order and judgment approving the settlement. Pursuant to the settlement, (a) the defendants and the D&O insurers for the individual members of the Sears Holdings’ Board of Directors paid $40.0 million, of which Seritage paid $19.0 million and (b) all defendants received customary releases. The defendants continue to deny the claims asserted and entered into the settlement solely to avoid the burden, expense, distraction, and inherent risk in and of litigation.
- 54 -
Retenanting and Redevelopment Projects
We are currently retenanting or redeveloping several properties primarily to convert single-tenant buildings occupied by Sears Holdings into multi-tenant properties occupied by a diversity of retailers and related concepts. The table below provides a brief description of each of the 63 new redevelopment projects originated on the Seritage platform as of December 31, 2017. These projects represent an estimated total investment of approximately $1,066.9 million, of which approximately $801.7 million remained to be spent.
|
Total Project Costs under $10 Million |
||||||||||||||||||
|
|
|
|
|
|
|
|
|
|
|
|
|
Total |
|
|
Estimated |
|
Estimated |
|
|
|
|
|
|
|
|
|
|
|
|
|
|
Project |
|
|
Construction |
|
Substantial |
|
|
Property |
|
Description |
|
Square Feet |
|
|
Start |
|
Completion |
|||||||||
|
King of Prussia, PA |
|
Repurpose former auto center space for Outback Steakhouse, Yard House and small shop retail |
|
|
29,100 |
|
|
Substantially complete |
||||||||||
|
Merrillville, IN |
|
Termination property; redevelop existing store for At Home, Powerhouse Gym and small shop retail |
|
|
132,000 |
|
|
Substantially complete |
||||||||||
|
Elkhart, IN |
|
Termination property; existing store has been released to Big R Stores |
|
|
86,500 |
|
|
Substantially complete |
||||||||||
|
San Antonio, TX |
|
Recapture and repurpose auto center space for Orvis, Jared's Jeweler, Shake Shack and small shop retail |
|
|
18,900 |
|
|
Substantially complete |
||||||||||
|
Bowie, MD |
|
Recapture and repurpose auto center space for BJ's Brewhouse |
|
|
8,200 |
|
|
Substantially complete |
||||||||||
|
Troy, MI |
|
Partial recapture; redevelop existing store for At Home |
|
|
100,000 |
|
|
Substantially complete |
||||||||||
|
Roseville, MI |
|
Partial recapture; redevelop existing store for At Home |
|
|
100,400 |
|
|
Substantially complete |
||||||||||
|
Henderson, NV |
|
Termination property; redevelop existing store for At Home, Seafood City and additional retail |
|
|
144,400 |
|
|
Substantially complete |
||||||||||
|
Rehoboth Beach, DE |
|
Partial recapture; redevelop existing store for Christmas Tree Shops andThat! and PetSmart |
|
|
56,700 |
|
|
Substantially complete |
||||||||||
|
Cullman, AL |
|
Termination property; redevelop existing store for Bargain Hunt, Tractor Supply and Planet Fitness |
|
|
99,000 |
|
|
Substantially complete |
||||||||||
|
Jefferson City, MO |
|
Termination property; redevelop existing store for Orscheln Farm and Home |
|
|
96,000 |
|
|
Delivered to tenant |
||||||||||
|
Albany, NY |
|
Recapture and repurpose auto center space for BJ's Brewhouse and additional small shop retail |
|
|
28,000 |
|
|
Delivered to tenant |
||||||||||
|
Hagerstown, MD |
|
Recapture and repurpose auto center space for BJ's Brewhouse, Verizon and additional restaurants |
|
|
15,400 |
|
|
Delivered to tenant |
||||||||||
|
Ft. Wayne, IN |
|
Site densification; new outparcels for BJ's Brewhouse (substantially complete) and Chick-Fil-A (project expansion) |
|
|
12,000 |
|
|
Underway |
|
Q1 2018 |
||||||||
|
Kearney, NE |
|
Termination property; redevelop existing store for Marshall's, PetSmart and additional junior anchors |
|
|
92,500 |
|
|
Underway |
|
Q2 2018 |
||||||||
|
Olean, NY |
|
Partial recapture; redevelop existing store for Marshall's and additional retail |
|
|
45,000 |
|
|
Underway |
|
Q2 2018 |
||||||||
|
Roseville, CA |
|
Recapture and repurpose auto center space for AAA Auto Repair Center |
|
|
10,400 |
|
|
Underway |
|
Q2 2018 |
||||||||
|
Guaynabo, PR |
|
Partial recapture; redevelop existing store for Planet Fitness and Capri |
|
|
56,100 |
|
|
Underway |
|
Q3 2018 |
||||||||
|
Florissant, MO |
|
Site densification; new outparcel for Chick-Fil-A |
|
|
5,000 |
|
|
Underway |
|
Q3 2018 |
||||||||
|
Dayton, OH |
|
Recapture and repurpose auto center space for Outback Steakhouse and additional restaurants |
|
|
14,100 |
|
|
Underway |
|
Q4 2018 |
||||||||
|
New Iberia, LA |
|
Termination property; redevelop existing store for Rouses Supermarkets, additional junior anchors and small shop retail |
|
|
93,100 |
|
|
Underway |
|
Q1 2019 |
||||||||
|
North Little Rock, AR |
|
Recapture and repurpose auto center space for LongHorn Steakhouse and additional small shop retail |
|
|
17,300 |
|
|
Q2 2018 |
|
Q2 2019 |
||||||||
|
St. Clair Shores, MI |
|
100% recapture; demolish existing store and develop site for new Kroger store |
|
|
107,200 |
|
|
Q2 2018 |
|
Q2 2019 |
||||||||
|
Oklahoma City, OK |
|
Site densification; new fitness center for Vasa Fitness |
|
|
59,500 |
|
|
Q3 2018 |
|
Q3 2019 |
||||||||
- 55 -
|
|
|
|
|
|
|
|
|
|
|
|
|
Total |
|
|
Estimated |
|
Estimated |
|
|
|
|
|
|
|
|
|
|
|
|
|
|
Project |
|
|
Construction |
|
Substantial |
|
|
Property |
|
Description |
|
Square Feet |
|
|
Start |
|
Completion |
|||||||||
|
Braintree, MA |
|
100% recapture; redevelop existing store for Nordstrom Rack, Saks OFF 5th and additional retail |
|
|
90,000 |
|
|
Substantially complete |
||||||||||
|
Honolulu, HI |
|
100% recapture; redevelop existing store for Longs Drugs (CVS), PetSmart and Ross Dress for Less |
|
|
79,000 |
|
|
Substantially complete |
||||||||||
|
West Jordan, UT |
|
Partial recapture; redevelop existing store and attached auto center for Burlington Stores and additional retail |
|
|
81,400 |
|
|
Substantially complete |
||||||||||
|
Anderson, SC |
|
100% recapture (project expansion); redevelop existing store for Burlington Stores, Sportsman's Warehouse, additional retail and restaurants |
|
|
111,300 |
|
|
Substantially complete |
||||||||||
|
Madison, WI |
|
Partial recapture; redevelop existing store for Dave & Busters, Total Wine & More, additional retail and restaurants |
|
|
75,300 |
|
|
Delivered to tenant |
||||||||||
|
Thornton, CO |
|
Termination property; redevelop existing store for Vasa Fitness and additional junior anchors |
|
|
191,600 |
|
|
Underway |
|
Q1 2018 |
||||||||
|
Fairfax, VA |
|
Partial recapture; redevelop existing store and attached auto center for Dave & Busters, Seasons 52, additional junior anchors and restaurants |
|
|
110,300 |
|
|
Underway |
|
Q1 2018 |
||||||||
|
Orlando, FL |
|
100% recapture; demolish and construct new buildings for Floor & Décor, Orchard Supply Hardware, LongHorn Steakhouse, Olive Garden, additional small shop retail and restaurants |
|
|
139,200 |
|
|
Underway |
|
Q2 2018 |
||||||||
|
Springfield, IL |
|
Termination property; redevelop existing store for Burlington Stores, Binny's Beverage Depot, Orangetheory Fitness, Outback Steakhouse, CoreLife Eatery, additional junior anchors and small shop retail |
|
|
133,400 |
|
|
Underway |
|
Q2 2018 |
||||||||
|
North Miami, FL |
|
100% recapture; redevelop existing store for Michael's, PetSmart and Ross Dress for Less |
|
|
124,300 |
|
|
Underway |
|
Q2 2018 |
||||||||
|
Hialeah, FL |
|
100% recapture; redevelop existing store for Bed, Bath & Beyond, Ross Dress for Less and additional junior anchors to join current tenant, Aldi |
|
|
88,400 |
|
|
Underway |
|
Q2 2018 |
||||||||
|
Cockeysville, MD |
|
Partial recapture; redevelop existing store for HomeGoods, Michael's Stores, additional junior anchors and restaurants |
|
|
83,500 |
|
|
Underway |
|
Q2 2018 |
||||||||
|
North Hollywood, CA |
|
Partial recapture; redevelop existing store for Burlington Stores and additional junior anchors |
|
|
79,800 |
|
|
Underway |
|
Q3 2018 |
||||||||
|
Salem, NH |
|
Site densification; new theatre for Cinemark Recapture and repurpose auto center for restaurant space |
|
|
71,200 |
|
|
Underway |
|
Q3 2018 |
||||||||
|
Charleston, SC |
|
100% recapture (project expansion); redevelop existing store and detached auto center for Burlington Stores and additional retail |
|
|
126,700 |
|
|
Underway |
|
Q3 2018 |
||||||||
|
Paducah, KY |
|
Termination property; redevelop existing store for Burlington Stores and additional retail |
|
|
102,300 |
|
|
Underway |
|
Q3 2018 |
||||||||
|
Warwick, RI |
|
Termination property; repurpose auto center space for BJ's Brewhouse and additional retail Redevelop existing store for At Home and Raymour & Flanigan (project expansion) |
|
|
190,700 |
|
|
Underway |
|
Q4 2018 |
||||||||
|
Temecula, CA |
|
Partial recapture; redevelop existing store and detached auto center for Round One, small shop retail and restaurants |
|
|
65,100 |
|
|
Underway |
|
Q4 2018 |
||||||||
|
Canton, OH |
|
Partial recapture; redevelop existing store for Dave & Busters and restaurants |
|
|
83,900 |
|
|
Underway |
|
Q2 2019 |
||||||||
|
North Riverside, IL |
|
Partial recapture; redevelop existing store and detached auto center for Round One, additional junior anchors, small shop retail and restaurants |
|
|
103,900 |
|
|
Underway |
|
Q2 2019 |
||||||||
|
Santa Cruz, CA |
|
Partial recapture; redevelop existing store for TJ Maxx, HomeGoods and additional junior anchors |
|
|
62,200 |
|
|
Q1 2018 |
|
Q4 2018 |
||||||||
|
Las Vegas, NV |
|
Partial recapture; redevelop existing store for Round One Entertainment and additional retail |
|
|
78,800 |
|
|
Q3 2018 |
|
Q3 2019 |
||||||||
|
Yorktown Heights, NY |
|
Partial recapture; redevelop existing store for 24 Hour Fitness and additional retail |
|
|
85,200 |
|
|
Q3 2018 |
|
Q4 2019 |
||||||||
|
Fairfield, CA |
|
Partial recapture; redevelop existing store for Dave & Busters and additional junior anchors |
|
|
68,400 |
|
|
Q3 2018 |
|
Q4 2019 |
||||||||
|
(1) |
Excludes Saugus, MA project which has been temporarily postponed while the Company identifies a new lead tenant. The original lead tenant was unable to obtain a use permit at the site. |
- 56 -
|
|
|
|
|
|
|
|
|
|
|
|
|
Total |
|
|
Estimated |
|
Estimated |
|
|
|
|
|
|
|
|
|
|
|
|
|
|
Project |
|
|
Construction |
|
Substantial |
|
|
Property |
|
Description |
|
Square Feet |
|
|
Start |
|
Completion |
|||||||||
|
Memphis, TN |
|
100% recapture; demolish and construct new buildings for LA Fitness, Nordstrom Rack, Ulta Beauty, Hopdoddy Burger Bar, additional junior anchors, restaurants and small shop retail |
|
|
135,200 |
|
|
Substantially complete |
||||||||||
|
West Hartford, CT |
|
100% recapture; redevelop existing store and detached auto center for Buy Buy Baby, Cost Plus World Market, REI, Saks OFF Fifth, other junior anchors, Shake Shack and additional small shop retail |
|
|
147,600 |
|
|
Underway |
|
Q1 2018 |
||||||||
|
St. Petersburg, FL |
|
100% recapture; demolish and construct new buildings for Dick's Sporting Goods, Lucky's Market, PetSmart, Five Below, Chili's Grill & Bar, Pollo Tropical, LongHorn Steakhouse and additional small shop retail and restaurants |
|
|
142,400 |
|
|
Underway |
|
Q2 2018 |
||||||||
|
Wayne, NJ |
|
Partial recapture; redevelop existing store for Dave & Busters, additional junior anchors and restaurants Recapture and repurpose detached auto center for Cinemark (project expansion) NOTE: contributed to GGP II JV in July 2017 |
|
|
156,700 |
|
|
Underway |
|
Q3 2018 |
||||||||
|
Carson, CA |
|
100% recapture (project expansion); redevelop existing store for Burlington Stores, Ross Dress for Less and additional retail |
|
|
163,800 |
|
|
Underway |
|
Q1 2019 |
||||||||
|
Watchung, NJ |
|
100% recapture; demolish full-line store and construct new buildings for HomeSense, Sierra Trading Post, Ulta Beauty and additional small shop retail and restaurants Demolish detached auto center and construct a freestanding Cinemark theater |
|
|
126,700 |
|
|
Underway |
|
Q2 2019 |
||||||||
|
Santa Monica, CA |
|
100% recapture; redevelop existing building into premier, mixed-use asset featuring unique, small-shop retail and creative office space |
|
|
96,500 |
|
|
Underway |
|
Q4 2019 |
||||||||
|
Aventura, FL |
|
100% recapture; demolish existing store and construct new, multi-level open air retail destination featuring a leading collection of experiential shopping, dining and entertainment concepts alongside a treelined esplanade and activated plazas |
|
|
216,600 |
|
|
Underway |
|
Q4 2019 |
||||||||
|
San Diego, CA |
|
100% recapture; redevelop existing store into two highly-visible, multi-level buildings with exterior facing retail representing a premier mix of experiential shopping, dining, and entertainment concepts |
|
|
206,000 |
|
|
Underway |
|
Q4 2019 |
||||||||
|
Austin, TX |
|
100% recapture (project expansion); redevelop existing store for AMC Theatres, additional junior anchors and restaurants |
|
|
177,400 |
|
|
Q2 2018 |
|
Q3 2019 |
||||||||
|
Greendale, WI |
|
Termination property; redevelop existing store and attached auto center for Dick's Sporting Goods, Round One Entertainment, additional junior anchors and restaurants |
|
|
223,800 |
|
|
Q2 2018 |
|
Q4 2019 |
||||||||
|
Anchorage, AK |
|
100% recapture; redevelop existing store for Guitar Center, Safeway and additional junior anchors to join current tenant, Nordstrom Rack |
|
|
142,500 |
|
|
Q2 2018 |
|
Q4 2019 |
||||||||
|
East Northport, NY |
|
Termination property; redevelop existing store and attached auto center for AMC Theatres, 24 Hour Fitness, additional junior anchors and small shop retail |
|
|
179,700 |
|
|
Q2 2018 |
|
Q4 2019 |
||||||||
|
Plantation, FL |
|
Partial recapture; redevelop existing store for GameTime, additional retail and restaurants |
|
|
130,500 |
|
|
Q3 2018 |
|
Q4 2019 |
||||||||
We continue to evaluate a number of additional retenanting and redevelopment projects that are consistent with our primary objective to maximize the value of our properties by recapturing space from Sears Holdings and re-leasing it to third-party tenants at higher rents. Investment returns are dependent on the success of the leasing and development plans in place for each project, as well as the successful completion of each project. Investment returns are subject to a number of variables, risks, and uncertainties including those disclosed within Item 1A of our Annual Report. We also refer you to our disclosure related to forward-looking statements.
Critical Accounting Policies
In preparing the consolidated financial statements, we have made estimates and assumptions that affect the reported amounts of assets and liabilities at the date of the financial statements and the reported amounts of revenues and expenses during the reporting periods. Actual results could differ from those estimates. Set forth below is a summary of the accounting policies that we believe are critical to the preparation of our consolidated financial statements. The summary should be read in conjunction with the more complete discussion of our accounting policies included in Note 2 to the audited consolidated financial statements in Part II, Item 8 of this Annual Report.
- 57 -
Accounting for Real Estate Acquisitions
Upon the acquisition of real estate, the Company assesses the fair value of acquired assets and liabilities assumed, including land, buildings, improvements and identified intangibles such as above-market and below-market leases, in-place leases and other items, as applicable, and allocates the purchase price based on these assessments. In making estimates of fair values, the Company may use a number of sources, including data provided by third parties, as well as information obtained by the Company as a result of its due diligence, including expected future cash flows of the property and various characteristics of the markets where the property is located.
The fair values of tangible assets are determined on an "if vacant" basis. The "if vacant" fair value allocated to land is generally estimated via a market or sales comparison approach with the subject site being compared to similar properties that have sold or are currently listed for sale. The comparable properties are adjusted for dissimilar characteristics such as market conditions, location, access/frontage, size, shape/topography, or intended use, including the impact of any encumbrances on such use. The "if vacant" value allocated to buildings and site improvements is generally estimated using an income approach and a cost approach that utilizes published guidelines for current replacement cost or actual construction costs for similar, recently developed properties. Assumptions used in the income approach include capitalization and discount rates, lease-up time, market rents, make ready costs, land value, and site improvement value.
The estimated fair value of in-place tenant leases includes lease origination costs (the costs the Company would have incurred to lease the property to the current occupancy level) and the lost revenues during the period necessary to lease-up from vacant to the current occupancy level. Such estimates include the fair value of leasing commissions, legal costs and tenant coordination costs that would be incurred to lease the property to this occupancy level. Additionally, the Company evaluates the time period over which such occupancy level would be achieved and include an estimate of the net operating costs (primarily real estate taxes, insurance and utilities) incurred during the lease-up period, which generally ranges up to one year. The fair value of acquired in-place tenant leases is included in lease intangible assets on the consolidated balance sheets and amortized over the remaining lease term for each tenant.
Identifiable intangible assets and liabilities are calculated for above-market and below-market tenant and ground leases where the Company is either the lessor or the lessee. The difference between the contractual rental rates and the Company’s estimate of market rental rates is measured over a period equal to the remaining non-cancelable term of the leases, including significantly below-market renewal options for which exercise of the renewal option appears to be reasonably assured. Above-market tenant leases and below-market ground leases are included in lease intangible assets on the consolidated balance sheets and below-market tenant leases are included in accounts payable, accrued expenses and other liabilities on the consolidated balance sheets.
Real Estate Investments
Real estate assets are recorded at cost, less accumulated depreciation and amortization.
Expenditures for ordinary repairs and maintenance will be expensed as incurred. Significant renovations which improve the property or extend the useful life of the assets are capitalized. As real estate is undergoing redevelopment activities, all amounts directly associated with and attributable to the project, including planning, development and construction costs, interest costs, personnel costs of employees directly involved and other miscellaneous costs incurred during the period of redevelopment, are capitalized. The capitalization period begins when redevelopment activities are underway and ends when the project is substantially complete.
Depreciation of real estate assets, excluding land, is recognized on a straight-line basis over their estimated useful lives which generally range from five to 40 years. Tenant improvements are amortized on a straight-line basis over the shorter of the estimated useful life or non-cancelable term of lease.
We amortize identified intangibles that have finite lives over the period they are expected to contribute directly or indirectly to the future cash flows of the property or business acquired, generally the remaining non-cancelable term of a related lease.
On a periodic basis, management assesses whether there are indicators that the value of the Company’s real estate assets (including any related intangible assets or liabilities) may be impaired. If an indicator is identified, a real estate asset is considered impaired only if management’s estimate of current and projected operating cash flows (undiscounted and unleveraged), taking into account the anticipated and probability weighted holding period, are less than a real estate asset’s carrying value. Various factors are considered in the estimation process, including expected future operating income, trends and prospects and the effects of demand, competition, and other economic factors. If management determines that the carrying value of a real estate asset is impaired, a loss will be recorded for the excess of its carrying amount over its estimated fair value.
- 58 -
Investments in Unconsolidated Joint Ventures
The Company accounts for its investments in unconsolidated joint ventures using the equity method of accounting. These investments are initially recorded at cost and are subsequently adjusted for cash contributions, cash distributions and earnings which are recognized in accordance with the terms of the applicable agreement.
To determine the method of accounting for partially owned joint ventures, we evaluate the characteristics of associated entities and determine whether an entity is a variable interest entity ("VIE") and, if so, determine which party is primary beneficiary by analyzing whether we have both the power to direct the entity's significant economic activities and the obligation to absorb potentially significant losses or receive potentially significant benefits. We will consolidate a VIE if we have determined that we are the primary beneficiary.
On a periodic basis, management assesses whether there are indicators, including the operating performance of the underlying real estate and general market conditions, that the value of the Company’s investments in unconsolidated joint ventures may be impaired. An investment’s value is impaired only if management’s estimate of the fair value of the Company’s investment is less than its carrying value and such difference is deemed to be other-than-temporary. To the extent impairment has occurred, the loss is measured as the excess of the carrying amount of the investment over its estimated fair value.
Revenue Recognition
Rental income is recognized on a straight-line basis over the non-cancelable terms of the related leases. For leases that have fixed and measurable rent escalations, the difference between such rental income earned and the cash rent due under the provisions of the lease is recorded as deferred rent receivable and included as a component of tenant and other receivables on the consolidated balance sheets.
In leasing tenant space, we may provide funding to the lessee through a tenant allowance. In accounting for a tenant allowance, we will determine whether the allowance represents funding for the construction of leasehold improvements and evaluate the ownership of such improvements. If we are considered the owner of the improvements for accounting purposes, we capitalize the amount of the tenant allowance and depreciate it over the shorter of the useful life of the improvements or the related lease term. If the tenant allowance represents a payment for a purpose other than funding leasehold improvements, or in the event we are not considered the owner of the improvements for accounting purposes, the allowance is considered to be a lease incentive and is recognized over the lease term as reduction of rental revenue on straight-line basis.
Accounting for Recapture and Termination Activity Pursuant to the Master Lease
We generally treat recapture and termination activity pursuant to the Master Lease as modifications of the Master Lease as of the date of notice. Such notices and lease modifications result in the following accounting adjustments for the recaptured or terminated property:
|
|
• |
Accrued rental revenues related to the straight-line method of reporting rental revenue that are deemed uncollectable as a result of the lease modification are amortized over the remaining shortened life of the lease from the date of notice to the date of vacancy. |
|
|
• |
Intangible lease assets and liabilities that are deemed to be impacted by the lease modification are amortized over the shorter of (i) the shortened life of the lease from the date of notice to the date of vacancy or (ii) the remaining useful life of the asset or liability. |
Additionally, termination fees paid by us to Sears Holding, if any, in connection with a 100% recapture notice are generally capitalized as either an initial direct cost of obtaining a new lease or a necessary cost of the real estate project and depreciated over the life of the new lease obtained or the real estate asset being constructed or improved.
Termination fees required to be paid by Sears Holdings to us in connection with a lease termination by Sears Holdings are recognized, for the portion of the termination fee attributable to the annual base rent of the subject property, on a straight-line basis over the shortened life of the lease from the date the termination fee becomes legally binding to the date of vacancy and, for the portion of the termination fee attributable to estimated real estate taxes and property operating expenses for the subject property, unearned tenant reimbursement income is recorded in the period such fee is received and recognized as tenant reimbursement revenue in the same periods as the expenses are incurred.
Recent Accounting Pronouncements
Refer to Note 2 of the Consolidated Financial Statements for recently issued accounting pronouncements.
- 59 -
Non-GAAP Supplemental Financial Measures and Definitions
The Company makes reference to NOI, Total NOI, FFO, Company FFO, EBITDA and Adjusted EBITDA which are considered non-GAAP measures.
Net Operating Income ("NOI") and Total NOI
We define NOI as income from property operations less property operating expenses. Other REITs may use different methodologies for calculating NOI, and accordingly, the Company's depiction of NOI may not be comparable to other REITs. We believe NOI provides useful information regarding the Company, its financial condition, and results of operations because it reflects only those income and expense items that are incurred at the property level.
The Company also uses Total NOI, which includes its proportional share of unconsolidated properties. We believe this form of presentation offers insights into the financial performance and condition of the Company as a whole given our ownership of unconsolidated properties that are accounted for under GAAP using the equity method. We also consider Total NOI to be a helpful supplemental measure of our operating performance because it excludes from NOI variable items such as termination fee income, as well as non-cash items such as straight-line rent and amortization of lease intangibles.
Due to the adjustments noted, NOI and Total NOI should only be used as an alternative measure of the Company's financial performance.
Earnings Before Interest Expense, Income Tax, Depreciation, and Amortization ("EBITDA") and Adjusted EBITDA
We define EBITDA as net income less depreciation, amortization, interest expense and provision for income and other taxes. EBITDA is a commonly used measure of performance in many industries, but may not be comparable to measures calculated by other companies. We believe EBITDA provides useful information to investors regarding our results of operations because it removes the impact of our capital structure (primarily interest expense) and our asset base (primarily depreciation and amortization). Management also believes the use of EBITDA facilitates comparisons between us and other equity REITs, retail property owners who are not REITs, and other capital-intensive companies.
The Company makes certain adjustments to EBITDA, which it refers to as Adjusted EBITDA, to account for certain non-cash and non-comparable items, such as termination fee income, unrealized loss on interest rate cap, litigation charges, acquisition-related expenses, up-front-hiring and personnel costs and gains (or losses) from property sales, that it does not believe are representative of ongoing operating results.
Due to the adjustments noted, EBITDA and Adjusted EBITDA should only be used as an alternative measure of the Company's financial performance
Funds From Operations ("FFO") and Company FFO
We define FFO using the definition set forth by the National Association of Real Estate Investment Trusts ("NAREIT"), which may not be comparable to measures calculated by other companies who do not use the NAREIT definition of FFO. FFO is calculated as net income computed in accordance with GAAP, excluding gains (or losses) from property sales, real estate related depreciation and amortization, and impairment charges on depreciable real estate assets.
We consider FFO a helpful supplemental measure of the operating performance for equity REITs and a complement to GAAP measures because it is a recognized measure of performance by the real estate industry. FFO facilitates an understanding of the operating performance of our properties between periods because it does not give effect to real estate depreciation and amortization which are calculated to allocate the cost of a property over its useful life. Since values for well-maintained real estate assets have historically increased or decreased based upon prevailing market conditions, the Company believes that FFO provides investors with a clearer view of the Company's operating performance.
The Company makes certain adjustments to FFO, which it refers to as Company FFO, to account for certain non-cash and non-comparable items, such as termination fee income, unrealized loss on interest rate cap, litigations charges, acquisition-related expenses, amortization of deferred financing costs and up-front-hiring and personnel costs, that it does not believe are representative of ongoing operating results. The Company previously referred to this metric as Normalized FFO; the definition and calculation remain the same.
Due to the adjustments noted, FFO and Company FFO should only be used as an alternative measure of the Company's financial performance.
- 60 -
Reconciliation of Non-GAAP Financial Measures to GAAP Financial Measures
None of NOI, Total NOI, EBITDA, Adjusted EBITDA, FFO and Company FFO are measures that (i) represent cash flow from operations as defined by GAAP; (ii) are indicative of cash available to fund all cash flow needs, including the ability to make distributions; (iii) are alternatives to cash flow as a measure of liquidity; or (iv) should be considered alternatives to net income (which is determined in accordance with GAAP) for purposes of evaluating the Company’s operating performance. Reconciliations of these measures to the respective GAAP measures we deem most comparable are presented below on a comparative basis for all periods.
The following table reconciles NOI and Total NOI to GAAP net loss for the years ended December 31, 2016 and December 31, 2017, and for the period from July 7, 2015 (Date Operations Commenced) through December 31, 2015 (in thousands):
|
|
|
|
|
|
|
|
|
|
|
July 7, 2015 |
|
|
|
|
|
Year Ended December 31, |
|
|
(date operations commenced) to |
|
||||||
|
NOI and Total NOI |
|
2017 |
|
|
2016 |
|
|
December 31, 2015 |
|
|||
|
Net loss |
|
$ |
(120,813 |
) |
|
$ |
(91,009 |
) |
|
$ |
(38,803 |
) |
|
Termination fee income |
|
|
(19,314 |
) |
|
|
(5,288 |
) |
|
|
— |
|
|
Depreciation and amortization |
|
|
262,171 |
|
|
|
177,119 |
|
|
|
65,907 |
|
|
General and administrative expenses |
|
|
27,902 |
|
|
|
17,469 |
|
|
|
9,956 |
|
|
Litigation charge |
|
|
— |
|
|
|
19,000 |
|
|
|
— |
|
|
Acquisition-related expenses |
|
|
— |
|
|
|
73 |
|
|
|
18,397 |
|
|
Equity in loss (income) of unconsolidated joint ventures |
|
|
7,788 |
|
|
|
(4,646 |
) |
|
|
(4,772 |
) |
|
Gain on sale of interests in unconsolidated joint ventures |
|
|
(60,302 |
) |
|
|
— |
|
|
|
— |
|
|
Gain on sale of real estate |
|
|
(11,447 |
) |
|
|
— |
|
|
|
— |
|
|
Interest and other income |
|
|
(877 |
) |
|
|
(266 |
) |
|
|
(136 |
) |
|
Interest expense |
|
|
70,112 |
|
|
|
63,591 |
|
|
|
30,461 |
|
|
Unrealized loss on interest rate cap |
|
|
701 |
|
|
|
1,378 |
|
|
|
2,933 |
|
|
Provision for income taxes |
|
|
271 |
|
|
|
505 |
|
|
|
944 |
|
|
NOI |
|
$ |
156,192 |
|
|
$ |
177,926 |
|
|
$ |
84,887 |
|
|
NOI of unconsolidated joint ventures |
|
|
23,547 |
|
|
|
26,611 |
|
|
|
14,456 |
|
|
Straight-line rent adjustment (1) |
|
|
(3,918 |
) |
|
|
(13,168 |
) |
|
|
(9,353 |
) |
|
Above/below market rental income/expense (1) |
|
|
(1,063 |
) |
|
|
(877 |
) |
|
|
(497 |
) |
|
Total NOI |
|
$ |
174,758 |
|
|
$ |
190,492 |
|
|
$ |
89,493 |
|
|
(1) |
Includes adjustments for unconsolidated joint ventures. |
- 61 -
The following table reconciles EBITDA and Adjusted EBITDA to GAAP net loss for the years ended December 31, 2016 and December 31, 2017, and for the period from July 7 , 2015 (Date Operations Commenced) through December 31, 2015 (in thousands):
|
|
|
|
|
|
|
|
|
|
|
July 7, 2015 |
|
|
|
|
|
Year Ended December 31, |
|
|
(date operations commenced) to |
|
||||||
|
EBITDA and Adjusted EBITDA |
|
2017 |
|
|
2016 |
|
|
December 31, 2015 |
|
|||
|
Net loss |
|
$ |
(120,813 |
) |
|
$ |
(91,009 |
) |
|
$ |
(38,803 |
) |
|
Depreciation and amortization |
|
|
262,171 |
|
|
|
177,119 |
|
|
|
65,907 |
|
|
Depreciation and amortization (unconsolidated joint ventures) |
|
|
23,954 |
|
|
|
21,118 |
|
|
|
8,987 |
|
|
Interest expense |
|
|
70,112 |
|
|
|
63,591 |
|
|
|
30,461 |
|
|
Provision for income and other taxes |
|
|
271 |
|
|
|
505 |
|
|
|
944 |
|
|
EBITDA |
|
$ |
235,695 |
|
|
$ |
171,324 |
|
|
$ |
67,496 |
|
|
Termination fee income |
|
|
(19,314 |
) |
|
|
(5,288 |
) |
|
|
— |
|
|
Unrealized loss on interest rate cap |
|
|
701 |
|
|
|
1,378 |
|
|
|
2,933 |
|
|
Litigation charge |
|
|
— |
|
|
|
19,000 |
|
|
|
— |
|
|
Acquisition-related expenses |
|
|
— |
|
|
|
73 |
|
|
|
18,397 |
|
|
Up-front hiring and personnel costs |
|
|
— |
|
|
|
328 |
|
|
|
1,906 |
|
|
Gain on sale of interests in unconsolidated joint ventures |
|
|
(60,302 |
) |
|
|
— |
|
|
|
— |
|
|
Gain on sale of real estate |
|
|
(11,447 |
) |
|
|
— |
|
|
|
— |
|
|
Adjusted EBITDA |
|
$ |
145,333 |
|
|
$ |
186,815 |
|
|
$ |
90,732 |
|
- 62 -
The following table reconciles FFO and Company FFO to GAAP net loss the years ended December 31, 2016 and December 31, 2017, and for the period from July 7, 2015 (Date Operations Commenced) through December 31, 2015 (in thousa nds):
|
|
|
|
|
|
|
|
|
|
|
July 7, 2015 |
|
|
|
|
|
Year Ended December 31, |
|
|
(date operations commenced) to |
|
||||||
|
FFO and Company FFO |
|
2017 |
|
|
2016 |
|
|
December 31, 2015 |
|
|||
|
Net loss |
|
$ |
(120,813 |
) |
|
$ |
(91,009 |
) |
|
$ |
(38,803 |
) |
|
Real estate depreciation and amortization (consolidated properties) |
|
|
260,543 |
|
|
|
176,366 |
|
|
|
65,877 |
|
|
Real estate depreciation and amortization (unconsolidated joint ventures) |
|
|
23,954 |
|
|
|
21,118 |
|
|
|
8,987 |
|
|
Gain on sale of interests in unconsolidated joint ventures |
|
|
(60,302 |
) |
|
|
— |
|
|
|
— |
|
|
Gain on sale of real estate |
|
|
(11,447 |
) |
|
|
— |
|
|
|
— |
|
|
Dividends on preferred shares |
|
|
(245 |
) |
|
|
— |
|
|
|
— |
|
|
FFO attributable to common shareholders and unitholders |
|
$ |
91,690 |
|
|
$ |
106,475 |
|
|
$ |
36,061 |
|
|
Termination fee income |
|
|
(19,314 |
) |
|
|
(5,288 |
) |
|
|
— |
|
|
Unrealized loss on interest rate cap |
|
|
701 |
|
|
|
1,378 |
|
|
|
2,933 |
|
|
Amortization of deferred financing costs |
|
|
8,720 |
|
|
|
5,360 |
|
|
|
2,657 |
|
|
Litigation charge |
|
|
— |
|
|
|
19,000 |
|
|
|
— |
|
|
Acquisition-related expenses |
|
|
— |
|
|
|
73 |
|
|
|
18,397 |
|
|
Up-front hiring and personnel costs |
|
|
— |
|
|
|
328 |
|
|
|
1,906 |
|
|
Company FFO attributable to common shareholders and unitholders |
|
$ |
81,797 |
|
|
$ |
127,326 |
|
|
$ |
61,954 |
|
|
|
|
|
|
|
|
|
|
|
|
|
|
|
|
FFO per diluted common share and unit |
|
$ |
1.65 |
|
|
$ |
1.92 |
|
|
$ |
0.65 |
|
|
Company FFO per diluted common share and unit |
|
$ |
1.47 |
|
|
$ |
2.29 |
|
|
$ |
1.12 |
|
|
|
|
|
|
|
|
|
|
|
|
|
|
|
|
Weighted Average Common Shares and Units Outstanding |
|
|
|
|
|
|
|
|
|
|
|
|
|
Weighted average common shares outstanding |
|
|
33,804 |
|
|
|
31,416 |
|
|
|
31,386 |
|
|
Weighted average OP units outstanding |
|
|
21,820 |
|
|
|
24,176 |
|
|
|
24,176 |
|
|
Weighted average common shares and units outstanding |
|
|
55,624 |
|
|
|
55,592 |
|
|
|
55,562 |
|
- 63 -
We are subject to market risk associated with changes in interest rates both in terms of existing variable-rate debt and the price of new fixed-rate debt upon maturity of existing debt and to fund investments. As of December 31, 2017, we had $1.36 billion of consolidated debt, including our $1.21 billion variable-rate Mortgage Loans and Future Funding Facility. An immediate 100 basis point change in the underlying interest rate would result in a $12.1 million increase to interest expense and corresponding decrease to operating cash flow.
The Company has managed and will continue to manage interest rate risk through the use of interest rate caps and/or swaps and by taking advantage of favorable market conditions for fixed-rate debt and/or equity or equity-linked capital, depending on our analysis of the interest rate environment and the costs and risks of such strategies.
As of December 31, 2017, the estimated fair value of our consolidated debt was $1.36 billion. The estimated fair value of our consolidated debt is calculated based on current market prices and discounted cash flows at the current rate at which similar loans would be made to borrowers with similar credit ratings for the remaining term of such debt.
Reference is made to the Consolidated Financial Statements and Consolidated Financial Statement Schedule beginning on page F-1 for the required information.
None.
Evaluation of Disclosure Controls and Procedures
We maintain disclosure controls and procedures (as defined in Rules 13a-15(e) under the Exchange Act) that are designed to provide reasonable assurance that information required to be disclosed in the reports that we file or submit under the Exchange Act is recorded, processed, summarized and reported within the time periods specified in the SEC’s rules and forms, and that such information is accumulated and communicated to our management, including our Chief Executive Officer and Chief Financial Officer, as appropriate to allow timely decisions regarding required disclosures. Because of inherent limitations, disclosure controls and procedures, no matter how well designed and operated, can provide only reasonable, and not absolute, assurance that the objectives of disclosure controls and procedures are met.
Our management, with the participation of our Chief Executive Officer and Chief Financial Officer, evaluated the effectiveness of the design and operation of our disclosure controls and procedures. Based on that evaluation, our Chief Executive Officer and Chief Financial Officer concluded that, as of the end of the period covered by this report, our disclosure controls and procedures are effective.
Management’s Report on Internal Control over Financial Reporting
Our management is responsible for establishing and maintaining adequate internal control over financial reporting (as defined in Rule 13a-15(f) under the Exchange Act). Our internal control over financial reporting is a process designed under the supervision of our principal executive and principal financial officers to provide reasonable assurance regarding the reliability of financial reporting and preparation of our financial statements for external reporting purposes in accordance with accounting principles generally accepted in the United States of America.
As of December 31, 2017, we conducted an assessment of the effectiveness of our internal control over financial reporting based on the framework utilizing the criteria set forth by the Committee of Sponsoring Organizations of the Treadway Commission in "Internal Control—Integrated Framework (2013)." Based on this assessment, management believes that, as of December 31, 2017, the Company maintained effective internal controls over financial reporting. Deloitte & Touche LLP, the independent registered public accounting firm who audited our consolidated financial statements contained in this Form 10-K, has issued a report on our internal control over financial reporting, which is included herein.
- 64 -
Changes in Internal Controls over Financial Reporting
There were no changes in internal control over financial reporting (as defined in Rule 13a-15(f) under the Exchange Act) that occurred during the three months ended December 31, 2017 that have materially affected, or are reasonably likely to materially affect, our internal control over financial reporting.
None.
The information required by Item 10 is hereby i ncorporated by reference to our definitive proxy statement with respect to our 2018 Annual Meeting of Shareholders , to be filed with the SEC within 120 days following the end of our fiscal year .
The information required by Item 11 is hereby incorporated by reference to our definitive proxy statement with respect to our 2018 Annual Meeting of Shareholders, to be filed with the SEC within 120 days following the end of our fiscal year.
|
ITEM 12. |
SECURITY OWNERSHIP OF CERTAIN BENEFICIAL OWNERS AND MANAGEMENT AND RELATED STOCKHOLDER MATTERS |
The information required by Item 12 is hereby incorporated by reference to our definitive proxy statement with respect to our 2018 Annual Meeting of Shareholders, to be filed with the SEC within 120 days following the end of our fiscal year.
The information required by Item 13 is hereby incorporated by reference to our definitive proxy statement with respect to our 2018 Annual Meeting of Shareholders, to be filed with the SEC within 120 days following the end of our fiscal year.
The information required by Item 14 is hereby incorporated by reference to our definitive proxy statement with respect to our 2018 Annual Meeting of Shareholders, to be filed with the SEC within 120 days following the end of our fiscal year.
- 65 -
|
(a) |
Consolidated Financial Statements and Consolidated Financial Statement Schedule. |
The consolidated financial statements and consolidated financial statement schedule listed in the accompanying Index to Consolidated Financial Statements and Consolidated Financial Statement Schedule are filed as part of this Annual Report.
|
(b) |
Exhibits. |
|
Exhibit No. |
|
Description |
|
SEC Document Reference |
|
|
|
|
|
|
|
|
|
Incorporated by reference to Exhibit 2.1 to our Registration Statement on Form S-11, filed on June 9, 2015. |
||
|
|
|
|
|
|
|
|
|
Incorporated by reference to Exhibit 3.1 to our Current Report on Form 8-K, filed on July 10, 2015. |
||
|
|
|
|
|
|
|
|
|
Incorporated by reference to Exhibit 3.2 to our Registration Statement on Form 8-A, filed on December 14, 2017. |
||
|
|
|
|
|
|
|
|
|
Incorporated by reference to Exhibit 3.2 to our Current Report on Form 8-K, filed on July 10, 2015. |
||
|
|
|
|
|
|
|
|
|
Incorporated by reference to Exhibit 4.1 to our Current Report on Form 8-K, filed on July 10, 2015. |
||
|
|
|
|
|
|
|
|
|
Incorporated by reference to Exhibit 4.1 to our Registration Statement on Form 8-A, filed on December 14, 2017. |
||
|
|
|
|
|
|
|
|
|
Incorporated by reference to Exhibit 10.1 to our Current Report on Form 8-K, filed on July 10, 2015. |
||
|
|
|
|
|
|
|
10.2 |
|
|
Incorporated by reference to Exhibit 10.1 to our Current Report on Form 8-K, filed on December 14, 2017. |
|
|
|
|
|
|
|
|
|
|
Incorporated by reference to Exhibit 10.3 to our Current Report on Form 8-K, filed on July 10, 2015. |
||
|
|
|
|
|
|
|
|
|
Incorporated by reference to Exhibit 10.4 to our Annual Report on Form 10-K, filed on March 1, 2017. |
||
|
|
|
|
|
|
|
10.5 |
|
|
Incorporated by reference to Exhibit 10.4 to our Current Report on Form 8-K, filed on July 10, 2015. |
|
|
|
|
|
|
|
|
10.6 |
|
|
Incorporated by reference to Exhibit 10.6 to our Annual Report on Form 10-K, filed on March 1, 2017. |
|
|
|
|
|
|
- 66 -
|
Exhibit No. |
|
Description |
|
SEC Document Reference |
|
|
|
Incorporated by reference to Exhibit 10.7 to our Annual Report on Form 10-K, filed on March 1, 2017. |
||
|
|
|
|
|
|
|
10.8 |
|
|
Incorporated by reference to Exhibit 10.5 to our Current Report on Form 8-K, filed on July 10, 2015. |
|
|
|
|
|
|
|
|
10.9 |
|
|
Incorporated by reference to Exhibit 10.9 to our Annual Report on Form 10-K, filed on March 1, 2017. |
|
|
|
|
|
|
|
|
10.10 |
|
|
Incorporated by reference to Exhibit 10.10 to our Annual Report on Form 10-K, filed on March 1, 2017. |
|
|
|
|
|
|
|
|
|
|
Filed herewith. |
||
|
|
|
|
|
|
|
10.12 |
|
|
Incorporated by reference to Exhibit 10.1 to our Current Report on Form 8-K, filed on February 24, 2017. |
|
|
10.13 |
|
|
Incorporated by reference to Exhibit 10.1 to our Current Report on Form 8-K, filed on December 28, 2017. |
|
|
|
|
|
|
|
|
|
|
Incorporated by reference to Exhibit 10.6 to our Registration Statement on Form S-11, filed on May 11, 2015. |
||
|
|
|
|
|
|
|
|
|
Incorporated by reference to Exhibit 10.6 to our Current Report on Form 8-K, filed on July 10, 2015. |
||
|
|
|
|
|
|
|
|
Form of Seritage Growth Properties Restricted Share Agreement |
|
Incorporated by reference to Exhibit 10.14 to our Annual Report on Form 10-K, filed on March 1, 2017. |
|
|
|
|
|
|
|
|
|
Form of Seritage Growth Properties Sign-On P-RSU Restricted Share Agreement |
|
Incorporated by reference to Exhibit 10.7 to our Current Report on Form 8-K, filed on July 10, 2015. |
|
|
|
|
|
|
|
|
|
Form of Seritage Growth Properties Time-Vesting Restricted Share Unit Agreement |
|
Incorporated by reference to Exhibit 10.8 to our Current Report on Form 8-K, filed on July 10, 2015. |
|
|
|
|
|
|
|
|
|
Form of Seritage Growth Properties Annual P-RSU Restricted Share Agreement |
|
Incorporated by reference to Exhibit 10.9 to our Current Report on Form 8-K, filed on July 10, 2015. |
|
|
|
|
|
|
|
|
|
Employment Agreement with Brian Dickman, dated as of July 6, 2015. |
|
Incorporated by reference to Exhibit 10.10 to our Current Report on Form 8-K, filed on July 10, 2015. |
|
|
|
|
|
|
- 67 -
|
Exhibit No. |
|
Description |
|
SEC Document Reference |
|
|
Employment Agreement with Mary Rottler, dated as of June 2, 2015 |
|
Incorporated by reference to Exhibit 10.1 to our Current Report on Form 8-K, filed on June 19, 2015. |
|
|
|
|
|
|
|
|
|
Employment Agreement, dated April 17, 2015, between Benjamin Schall and Seritage Growth Properties |
|
Incorporated by reference to Exhibit 10.8 to our Registration Statement on Form S-11, filed on May 26, 2015. |
|
|
|
|
|
|
|
|
|
|
Incorporated by reference to Exhibit 10.9 to our Registration Statement on Form S-11, filed on May 26, 2015. |
||
|
|
|
|
|
|
|
|
Letter Agreement, dated May 15, 2015, between Matthew Fernand and Seritage Growth Properties |
|
Incorporated by reference to Exhibit 10.10 to our Registration Statement on Form S-11, filed on May 26, 2015. |
|
|
|
|
|
|
|
|
|
Letter Agreement, dated May 13, 2015, between James Bry and Seritage Growth Properties |
|
Incorporated by reference to Exhibit 10.11 to our Registration Statement on Form S-11, filed on May 26, 2015. |
|
|
|
|
|
|
|
|
10.26 |
|
|
Incorporated by reference to Exhibit 10.1 to our Current Report on Form 8-K, filed on July 2, 2015. |
|
|
|
|
|
|
|
|
10.27 |
|
|
Incorporated by reference to Exhibit 10.2 to our Current Report on Form 8-K, filed on July 2, 2015. |
|
|
|
|
|
|
|
|
12.1 |
|
Computation of Ratio of Earnings to Combined Fixed Charges and Preferred Stock Dividends |
|
Filed herewith. |
|
|
|
|
|
|
|
21.1 |
|
|
Filed herewith. |
|
|
|
|
|
|
|
|
23.1 |
|
Consent of Deloitte & Touche LLP, Independent Registered Public Accounting Firm |
|
Filed herewith. |
|
|
|
|
|
|
|
31.1 |
|
|
Filed herewith. |
|
|
|
|
|
|
|
|
31.2 |
|
|
Filed herewith. |
|
|
|
|
|
|
|
|
32.1 |
|
|
Filed herewith. |
|
|
|
|
|
|
|
|
32.2 |
|
|
Filed herewith. |
|
|
|
|
|
|
|
|
101.INS |
|
XBRL Instance Document |
|
Filed herewith. |
|
|
|
|
|
|
|
101.SCH |
|
XBRL Taxonomy Extension Schema Document |
|
Filed herewith. |
|
|
|
|
|
|
|
101.CAL |
|
XBRL Taxonomy Extension Calculation Linkbase Document |
|
Filed herewith. |
|
|
|
|
|
|
|
101.DEF |
|
XBRL Taxonomy Extension Definition Linkbase Document |
|
Filed herewith. |
|
|
|
|
|
|
|
101.LAB |
|
XBRL Taxonomy Extension Label Linkbase Document |
|
Filed herewith. |
|
|
|
|
|
|
|
101.PRE |
|
XBRL Taxonomy Extension Presentation Linkbase Document |
|
Filed herewith. |
|
* |
Portions of this exhibit have been omitted and filed separately with the Securities and Exchange Commission pursuant to a request for confidential treatment. |
- 68 -
Pursuant to the requirements of the Securities Exchange Act of 1934, the registrant has duly caused this report to be signed on its behalf by the undersigned thereunto duly authorized.
|
|
|
SERITAGE GROWTH PROPERTIES |
|
|
|
|
|
Dated: February 28, 2018 |
|
/s/ Benjamin W. Schall |
Pursuant to the requirements of the Securities Exchange Act of 1934, this report has been signed below by the following persons on behalf of the registrant and in the capacities and on the dates indicated.
|
Signature |
|
Title |
|
Date |
|
|
|
|
|
|
|
/s/ Edward S. Lampert |
|
Chairman of the Board of Trustees |
|
February 28, 2018 |
|
Edward S. Lampert |
|
|
|
|
|
|
|
|
|
|
|
/s/ Benjamin W. Schall |
|
President, Chief Executive Officer and Trustee (Principal Executive Officer) |
|
February 28, 2018 |
|
Benjamin W. Schall |
|
|
|
|
|
|
|
|
|
|
|
/s/ Brian R. Dickman |
|
Executive Vice President, Chief Financial Officer (Principal Financial and Accounting Officer) |
|
February 28, 2018 |
|
Brian R. Dickman |
|
|
|
|
|
|
|
|
|
|
|
/s/ David S. Fawer |
|
Trustee |
|
February 28, 2018 |
|
David S. Fawer |
|
|
|
|
|
|
|
|
|
|
|
/s/ Kenneth T. Lombard |
|
Trustee |
|
February 28, 2018 |
|
Kenneth T. Lombard |
|
|
|
|
|
|
|
|
|
|
|
/s/ John. T. McClain |
|
Trustee |
|
February 28, 2018 |
|
John T. McClain |
|
|
|
|
|
|
|
|
|
|
|
/s/ Thomas M. Steinberg |
|
Trustee |
|
February 28, 2018 |
|
Thomas M. Steinberg |
|
|
|
|
- 69 -
INDEX TO CONSOLIDATED FINANCIAL STATEMENTS
AND CONSOLIDATED FINANCIAL STATEMENT SCHEDULE
Financial Statements
|
|
|
Page |
|
|
F-2 |
|
|
Consolidated Balance Sheets as of December 31, 2017 and December 31, 2016 |
|
F-4 |
|
|
F-5 |
|
|
|
F-6 |
|
|
|
F-9 |
|
|
|
F-11 |
|
|
Financial Statement Schedule |
|
|
|
|
F-37 |
All other schedules are omitted since the required information is either not present in any amounts, is not present in amounts sufficient to require submission of the schedule or because the information required is included in the consolidated financial statements and related notes.
F-1
REPORT OF INDEPENDENT REGIST ERED PUBLIC ACCOUNTING FIRM
To the Board of Trustees and Shareholders of
Seritage Growth Properties
Opinion on the Financial Statements
We have audited the accompanying consolidated balance sheets of Seritage Growth Properties and subsidiaries (the "Company") as of December 31, 2017 and 2016, the related consolidated statements of operations, equity, and cash flows, for each of the two years in the period ended December 31, 2017 and for the period from July 7, 2015 (Date Operations Commenced) through December 31, 2015, and the related notes and the schedule listed in the Index at Item 15 (collectively referred to as the "financial statements"). In our opinion, the financial statements present fairly, in all material respects, the financial position of the Company as of December 31, 2017 and 2016, and the results of its operations and its cash flows for each of the two years in the period ended December 31, 2017, and for the period from July 7, 2015 (Date Operations Commenced) through December 31, 2015, in conformity with accounting principles generally accepted in the United States of America.
We have also audited, in accordance with the standards of the Public Company Accounting Oversight Board (United States) (PCAOB), the Company's internal control over financial reporting as of December 31, 2017, based on criteria established in Internal Control — Integrated Framework (2013) issued by the Committee of Sponsoring Organizations of the Treadway Commission and our report dated February 28, 2018, expressed an unqualified opinion on the Company's internal control over financial reporting.
Basis for Opinion
These financial statements are the responsibility of the Company's management. Our responsibility is to express an opinion on the Company's financial statements based on our audits. We are a public accounting firm registered with the PCAOB and are required to be independent with respect to the Company in accordance with the U.S. federal securities laws and the applicable rules and regulations of the Securities and Exchange Commission and the PCAOB.
We conducted our audits in accordance with the standards of the PCAOB. Those standards require that we plan and perform the audits to obtain reasonable assurance about whether the financial statements are free of material misstatement, whether due to error or fraud. Our audits included performing procedures to assess the risks of material misstatement of the financial statements, whether due to error or fraud, and performing procedures that respond to those risks. Such procedures included examining, on a test basis, evidence regarding the amounts and disclosures in the financial statements. Our audit also included evaluating the accounting principles used and significant estimates made by management, as well as evaluating the overall presentation of the financial statements. We believe that our audits provide a reasonable basis for our opinion.
/s/ Deloitte & Touche LLP
New York, New York
February 28, 2018
We have served as the Company's auditor since 2015.
F-2
REPORT OF INDEPENDENT REGISTERED PUBLIC ACCOUNTING FIRM
To the Board of Trustees and Shareholders of
Seritage Growth Properties
Opinion on Internal Control over Financial Reporting
We have audited the internal control over financial reporting of Seritage Growth Properties and subsidiaries (the “Company”) as of December 31, 2017, based on criteria established in Internal Control — Integrated Framework (2013) issued by the Committee of Sponsoring Organizations of the Treadway Commission (COSO). In our opinion, the Company maintained, in all material respects, effective internal control over financial reporting as of December 31, 2017, based on criteria established in Internal Control — Integrated Framework (2013) issued by COSO.
We have also audited, in accordance with the standards of the Public Company Accounting Oversight Board (United States) (PCAOB), the consolidated financial statements as of and for the year ended December 31, 2017, of the Company and our report dated February 28, 2018, expressed an unqualified opinion on those financial statements.
Basis for Opinion
The Company’s management is responsible for maintaining effective internal control over financial reporting and for its assessment of the effectiveness of internal control over financial reporting, included in the accompanying Management’s Report on Internal Control over Financial Reporting. Our responsibility is to express an opinion on the Company’s internal control over financial reporting based on our audit. We are a public accounting firm registered with the PCAOB and are required to be independent with respect to the Company in accordance with the U.S. federal securities laws and the applicable rules and regulations of the Securities and Exchange Commission and the PCAOB.
We conducted our audit in accordance with the standards of the PCAOB. Those standards require that we plan and perform the audit to obtain reasonable assurance about whether effective internal control over financial reporting was maintained in all material respects. Our audit included obtaining an understanding of internal control over financial reporting, assessing the risk that a material weakness exists, testing and evaluating the design and operating effectiveness of internal control based on the assessed risk, and performing such other procedures as we considered necessary in the circumstances. We believe that our audit provides a reasonable basis for our opinion.
Definition and Limitations of Internal Control over Financial Reporting
A company’s internal control over financial reporting is a process designed to provide reasonable assurance regarding the reliability of financial reporting and the preparation of financial statements for external purposes in accordance with generally accepted accounting principles. A company’s internal control over financial reporting includes those policies and procedures that (1) pertain to the maintenance of records that, in reasonable detail, accurately and fairly reflect the transactions and dispositions of the assets of the company; (2) provide reasonable assurance that transactions are recorded as necessary to permit preparation of financial statements in accordance with generally accepted accounting principles, and that receipts and expenditures of the company are being made only in accordance with authorizations of management and directors of the company; and (3) provide reasonable assurance regarding prevention or timely detection of unauthorized acquisition, use, or disposition of the company’s assets that could have a material effect on the financial statements.
Because of its inherent limitations, internal control over financial reporting may not prevent or detect misstatements. Also, projections of any evaluation of effectiveness to future periods are subject to the risk that controls may become inadequate because of changes in conditions, or that the degree of compliance with the policies or procedures may deteriorate.
/s/ Deloitte & Touche LLP
New York, New York
February 28, 2018
F-3
(Amounts in thousands, except share and per share amounts)
|
|
|
December 31, 2017 |
|
|
December 31, 2016 |
|
||
|
ASSETS |
|
|
|
|
|
|
|
|
|
Investment in real estate |
|
|
|
|
|
|
|
|
|
Land |
|
$ |
799,971 |
|
|
$ |
840,021 |
|
|
Buildings and improvements |
|
|
829,168 |
|
|
|
839,663 |
|
|
Accumulated depreciation |
|
|
(139,483 |
) |
|
|
(89,940 |
) |
|
|
|
|
1,489,656 |
|
|
|
1,589,744 |
|
|
Construction in progress |
|
|
224,904 |
|
|
|
55,208 |
|
|
Net investment in real estate |
|
|
1,714,560 |
|
|
|
1,644,952 |
|
|
Investment in unconsolidated joint ventures |
|
|
282,990 |
|
|
|
425,020 |
|
|
Cash and cash equivalents |
|
|
241,569 |
|
|
|
52,026 |
|
|
Restricted cash |
|
|
175,665 |
|
|
|
87,616 |
|
|
Tenant and other receivables, net |
|
|
30,787 |
|
|
|
23,172 |
|
|
Lease intangible assets, net |
|
|
310,098 |
|
|
|
464,399 |
|
|
Prepaid expenses, deferred expenses and other assets, net |
|
|
20,148 |
|
|
|
15,052 |
|
|
Total assets |
|
$ |
2,775,817 |
|
|
$ |
2,712,237 |
|
|
|
|
|
|
|
|
|
|
|
|
LIABILITIES AND EQUITY |
|
|
|
|
|
|
|
|
|
Liabilities |
|
|
|
|
|
|
|
|
|
Mortgage loans payable, net |
|
$ |
1,202,314 |
|
|
$ |
1,166,871 |
|
|
Unsecured term loan, net |
|
|
143,210 |
|
|
|
— |
|
|
Accounts payable, accrued expenses and other liabilities |
|
|
109,433 |
|
|
|
121,055 |
|
|
Total liabilities |
|
|
1,454,957 |
|
|
|
1,287,926 |
|
|
|
|
|
|
|
|
|
|
|
|
Commitments and contingencies (Note 9) |
|
|
|
|
|
|
|
|
|
|
|
|
|
|
|
|
|
|
|
Shareholders' Equity |
|
|
|
|
|
|
|
|
|
Class A common shares $0.01 par value; 100,000,000 shares authorized; 32,415,734 and 25,843,251 shares issued and outstanding as of December 31, 2017 and December 31, 2016, respectively |
|
|
324 |
|
|
|
258 |
|
|
Class B common shares $0.01 par value; 5,000,000 shares authorized; 1,328,866 and 1,589,020 shares issued and outstanding as of December 31, 2017 and December 31, 2016, respectively |
|
|
13 |
|
|
|
16 |
|
|
Class C common shares $0.01 par value; 50,000,000 shares authorized; 3,151,131 and 5,754,685 shares issued and outstanding as of December 31, 2017 and December 31, 2016, respectively |
|
|
31 |
|
|
|
58 |
|
|
Series A preferred shares $0.01 par value; 10,000,000 shares authorized; 2,800,000 shares issued and outstanding as of December 31, 2017; liquidation preference of $70,000 |
|
|
28 |
|
|
|
— |
|
|
Additional paid-in capital |
|
|
1,116,060 |
|
|
|
925,563 |
|
|
Accumulated deficit |
|
|
(229,760 |
) |
|
|
(121,338 |
) |
|
Total shareholders' equity |
|
|
886,696 |
|
|
|
804,557 |
|
|
Non-controlling interests |
|
|
434,164 |
|
|
|
619,754 |
|
|
Total equity |
|
|
1,320,860 |
|
|
|
1,424,311 |
|
|
Total liabilities and equity |
|
$ |
2,775,817 |
|
|
$ |
2,712,237 |
|
The accompanying notes are an integral part of these consolidated financial statements.
F-4
CONSOLIDATED STATEMENTS OF OPERATIONS
(Amounts in thousands, except per share amounts)
|
|
|
|
|
|
|
|
|
|
|
July 7, 2015 |
|
|
|
|
|
Year Ended December 31, |
|
|
(date operations commenced) to |
|
||||||
|
|
|
2017 |
|
|
2016 |
|
|
December 31, 2015 |
|
|||
|
REVENUE |
|
|
|
|
|
|
|
|
|
|
|
|
|
Rental income |
|
$ |
178,492 |
|
|
$ |
186,421 |
|
|
$ |
86,645 |
|
|
Tenant reimbursements |
|
|
62,525 |
|
|
|
62,253 |
|
|
|
26,926 |
|
|
Total revenue |
|
|
241,017 |
|
|
|
248,674 |
|
|
|
113,571 |
|
|
EXPENSES |
|
|
|
|
|
|
|
|
|
|
|
|
|
Property operating |
|
|
19,700 |
|
|
|
21,510 |
|
|
|
6,329 |
|
|
Real estate taxes |
|
|
45,653 |
|
|
|
43,681 |
|
|
|
22,355 |
|
|
Depreciation and amortization |
|
|
262,171 |
|
|
|
177,119 |
|
|
|
65,907 |
|
|
General and administrative |
|
|
27,902 |
|
|
|
17,469 |
|
|
|
9,956 |
|
|
Litigation charge |
|
|
— |
|
|
|
19,000 |
|
|
|
— |
|
|
Provision for doubtful accounts |
|
|
158 |
|
|
|
269 |
|
|
|
— |
|
|
Acquisition-related expenses |
|
|
— |
|
|
|
73 |
|
|
|
18,397 |
|
|
Total expenses |
|
|
355,584 |
|
|
|
279,121 |
|
|
|
122,944 |
|
|
Operating loss |
|
|
(114,567 |
) |
|
|
(30,447 |
) |
|
|
(9,373 |
) |
|
Equity in (loss) income of unconsolidated joint ventures |
|
|
(7,788 |
) |
|
|
4,646 |
|
|
|
4,772 |
|
|
Gain on sale of interests in unconsolidated joint ventures |
|
|
60,302 |
|
|
|
— |
|
|
|
— |
|
|
Gain on sale of real estate |
|
|
11,447 |
|
|
|
— |
|
|
|
— |
|
|
Interest and other income |
|
|
877 |
|
|
|
266 |
|
|
|
136 |
|
|
Interest expense |
|
|
(70,112 |
) |
|
|
(63,591 |
) |
|
|
(30,461 |
) |
|
Unrealized (loss) gain on interest rate cap |
|
|
(701 |
) |
|
|
(1,378 |
) |
|
|
(2,933 |
) |
|
Loss before income taxes |
|
|
(120,542 |
) |
|
|
(90,504 |
) |
|
|
(37,859 |
) |
|
Provision for income taxes |
|
|
(271 |
) |
|
|
(505 |
) |
|
|
(944 |
) |
|
Net loss |
|
|
(120,813 |
) |
|
|
(91,009 |
) |
|
|
(38,803 |
) |
|
Net loss attributable to non-controlling interests |
|
|
47,059 |
|
|
|
39,451 |
|
|
|
16,465 |
|
|
Net loss attributable to Seritage |
|
$ |
(73,754 |
) |
|
$ |
(51,558 |
) |
|
$ |
(22,338 |
) |
|
Preferred dividends |
|
|
(245 |
) |
|
|
— |
|
|
|
— |
|
|
Net loss attributable to Seritage common shareholders |
|
$ |
(73,999 |
) |
|
$ |
(51,558 |
) |
|
$ |
(22,338 |
) |
|
|
|
|
|
|
|
|
|
|
|
|
|
|
|
Net loss per share attributable to Class A and Class C common shareholders - Basic and diluted |
|
$ |
(2.19 |
) |
|
$ |
(1.64 |
) |
|
$ |
(0.71 |
) |
|
Weighted average Class A and Class C common shares outstanding - Basic and diluted |
|
|
33,804 |
|
|
|
31,416 |
|
|
|
31,386 |
|
The accompanying notes are an integral part of these consolidated financial statements.
F-5
CONSOLIDATED STATEMENT OF EQUITY
(Amounts in thousands)
|
|
|
|
|
|
|
|
|
|
|
|
|
|
|
|
|
|
|
|
|
|
|
|
|
|
|
|
|
|
|
|
|
|
|
Additional |
|
|
|
|
|
|
Non- |
|
|
|
|
|
||
|
|
|
Class A Common |
|
|
Class B Common |
|
|
Class C Common |
|
|
Series A Preferred |
|
|
Paid-In |
|
|
Accumulated |
|
|
Controlling |
|
|
Total |
|
||||||||||||||||||||||||
|
|
|
Shares |
|
|
Amount |
|
|
Shares |
|
|
Amount |
|
|
Shares |
|
|
Amount |
|
|
Shares |
|
|
Amount |
|
|
Capital |
|
|
Deficit |
|
|
Interests |
|
|
Equity |
|
||||||||||||
|
Balance at July 7, 2015 (date operations commenced) |
|
|
24,584 |
|
|
$ |
246 |
|
|
|
1,589 |
|
|
$ |
16 |
|
|
|
6,790 |
|
|
$ |
68 |
|
|
|
— |
|
|
$ |
— |
|
|
$ |
923,636 |
|
|
$ |
— |
|
|
$ |
711,991 |
|
|
$ |
1,635,957 |
|
|
|
|
|
|
|
|
|
|
|
|
|
|
|
|
|
|
|
|
|
|
|
|
|
|
|
|
|
|
|
|
|
|
|
|
|
|
|
|
|
|
|
|
|
|
|
|
|
|
|
|
Net loss |
|
|
— |
|
|
|
— |
|
|
|
— |
|
|
|
— |
|
|
|
— |
|
|
|
— |
|
|
|
— |
|
|
|
— |
|
|
|
— |
|
|
|
(22,338 |
) |
|
|
(16,465 |
) |
|
|
(38,803 |
) |
|
Offering related costs |
|
|
— |
|
|
|
— |
|
|
|
— |
|
|
|
— |
|
|
|
— |
|
|
|
— |
|
|
|
— |
|
|
|
— |
|
|
|
(70 |
) |
|
|
— |
|
|
|
(56 |
) |
|
|
(126 |
) |
|
Dividends and distributions declared ($0.50 per share and unit) |
|
|
— |
|
|
|
— |
|
|
|
— |
|
|
|
— |
|
|
|
— |
|
|
|
— |
|
|
|
— |
|
|
|
— |
|
|
|
— |
|
|
|
(15,807 |
) |
|
|
(12,088 |
) |
|
|
(27,895 |
) |
|
Vesting of restricted share units |
|
|
217 |
|
|
|
2 |
|
|
|
— |
|
|
|
— |
|
|
|
— |
|
|
|
— |
|
|
|
— |
|
|
|
— |
|
|
|
(2 |
) |
|
|
— |
|
|
|
— |
|
|
|
— |
|
|
Stock-based compensation |
|
|
— |
|
|
|
— |
|
|
|
— |
|
|
|
— |
|
|
|
— |
|
|
|
— |
|
|
|
— |
|
|
|
— |
|
|
|
944 |
|
|
|
— |
|
|
|
— |
|
|
|
944 |
|
|
Share class exchanges, net (17,450 common shares) |
|
|
17 |
|
|
|
0 |
|
|
|
— |
|
|
|
— |
|
|
|
(17 |
) |
|
|
(0 |
) |
|
|
— |
|
|
|
— |
|
|
|
— |
|
|
|
— |
|
|
|
— |
|
|
|
— |
|
|
|
|
|
|
|
|
|
|
|
|
|
|
|
|
|
|
|
|
|
|
|
|
|
|
|
|
|
|
|
|
|
|
|
|
|
|
|
|
|
|
|
|
|
|
|
|
|
|
|
|
Balance at December 31, 2015 |
|
|
24,818 |
|
|
$ |
248 |
|
|
|
1,589 |
|
|
$ |
16 |
|
|
|
6,773 |
|
|
$ |
68 |
|
|
|
— |
|
|
$ |
— |
|
|
$ |
924,508 |
|
|
$ |
(38,145 |
) |
|
$ |
683,382 |
|
|
$ |
1,570,077 |
|
F-6
CONSOLIDATED STATEMENT OF EQUITY (Continued)
(Amounts in thousands)
|
|
|
|
|
|
|
|
|
|
|
|
|
|
|
|
|
|
|
|
|
|
|
|
|
|
|
|
|
|
|
|
|
|
|
Additional |
|
|
|
|
|
|
Non- |
|
|
|
|
|
||
|
|
|
Class A Common |
|
|
Class B Common |
|
|
Class C Common |
|
|
Series A Preferred |
|
|
Paid-In |
|
|
Accumulated |
|
|
Controlling |
|
|
Total |
|
||||||||||||||||||||||||
|
|
|
Shares |
|
|
Amount |
|
|
Shares |
|
|
Amount |
|
|
Shares |
|
|
Amount |
|
|
Shares |
|
|
Amount |
|
|
Capital |
|
|
Deficit |
|
|
Interests |
|
|
Equity |
|
||||||||||||
|
Balance at January 1, 2016 |
|
|
24,818 |
|
|
$ |
248 |
|
|
|
1,589 |
|
|
$ |
16 |
|
|
|
6,773 |
|
|
$ |
68 |
|
|
|
— |
|
|
$ |
— |
|
|
$ |
924,508 |
|
|
$ |
(38,145 |
) |
|
$ |
683,382 |
|
|
$ |
1,570,077 |
|
|
|
|
|
|
|
|
|
|
|
|
|
|
|
|
|
|
|
|
|
|
|
|
|
|
|
|
|
|
|
|
|
|
|
|
|
|
|
|
|
|
|
|
|
|
|
|
|
|
|
|
Net loss |
|
|
— |
|
|
|
— |
|
|
|
— |
|
|
|
— |
|
|
|
— |
|
|
|
— |
|
|
|
— |
|
|
|
— |
|
|
|
— |
|
|
|
(51,558 |
) |
|
|
(39,451 |
) |
|
|
(91,009 |
) |
|
Dividends and distributions declared ($1.00 per share and unit) |
|
|
— |
|
|
|
— |
|
|
|
— |
|
|
|
— |
|
|
|
— |
|
|
|
— |
|
|
|
— |
|
|
|
— |
|
|
|
— |
|
|
|
(31,635 |
) |
|
|
(24,177 |
) |
|
|
(55,812 |
) |
|
Vesting of restricted share units |
|
|
7 |
|
|
|
0 |
|
|
|
— |
|
|
|
— |
|
|
|
— |
|
|
|
— |
|
|
|
— |
|
|
|
— |
|
|
|
(13 |
) |
|
|
— |
|
|
|
— |
|
|
|
(13 |
) |
|
Stock-based compensation |
|
|
— |
|
|
|
— |
|
|
|
— |
|
|
|
— |
|
|
|
— |
|
|
|
— |
|
|
|
— |
|
|
|
— |
|
|
|
1,068 |
|
|
|
— |
|
|
|
— |
|
|
|
1,068 |
|
|
Share class exchanges, net (1,018,500 common shares) |
|
|
1,018 |
|
|
|
10 |
|
|
|
— |
|
|
|
— |
|
|
|
(1,018 |
) |
|
|
(10 |
) |
|
|
— |
|
|
|
— |
|
|
|
— |
|
|
|
— |
|
|
|
— |
|
|
|
— |
|
|
|
|
|
|
|
|
|
|
|
|
|
|
|
|
|
|
|
|
|
|
|
|
|
|
|
|
|
|
|
|
|
|
|
|
|
|
|
|
|
|
|
|
|
|
|
|
|
|
|
|
Balance at December 31, 2016 |
|
|
25,843 |
|
|
$ |
258 |
|
|
|
1,589 |
|
|
$ |
16 |
|
|
|
5,755 |
|
|
$ |
58 |
|
|
|
— |
|
|
$ |
— |
|
|
$ |
925,563 |
|
|
$ |
(121,338 |
) |
|
$ |
619,754 |
|
|
$ |
1,424,311 |
|
F-7
CONSOLIDATED STATEMENT OF EQUITY (Continued)
(Amounts in thousands)
|
|
|
|
|
|
|
|
|
|
|
|
|
|
|
|
|
|
|
|
|
|
|
|
|
|
|
|
|
|
|
|
|
|
|
Additional |
|
|
|
|
|
|
Non- |
|
|
|
|
|
||
|
|
|
Class A Common |
|
|
Class B Common |
|
|
Class C Common |
|
|
Series A Preferred |
|
|
Paid-In |
|
|
Accumulated |
|
|
Controlling |
|
|
Total |
|
||||||||||||||||||||||||
|
|
|
Shares |
|
|
Amount |
|
|
Shares |
|
|
Amount |
|
|
Shares |
|
|
Amount |
|
|
Shares |
|
|
Amount |
|
|
Capital |
|
|
Deficit |
|
|
Interests |
|
|
Equity |
|
||||||||||||
|
Balance at January 1, 2017 |
|
|
25,843 |
|
|
$ |
258 |
|
|
|
1,589 |
|
|
$ |
16 |
|
|
|
5,755 |
|
|
$ |
58 |
|
|
|
— |
|
|
$ |
— |
|
|
$ |
925,563 |
|
|
$ |
(121,338 |
) |
|
$ |
619,754 |
|
|
$ |
1,424,311 |
|
|
|
|
|
|
|
|
|
|
|
|
|
|
|
|
|
|
|
|
|
|
|
|
|
|
|
|
|
|
|
|
|
|
|
|
|
|
|
|
|
|
|
|
|
|
|
|
|
|
|
|
Net loss |
|
|
— |
|
|
|
— |
|
|
|
— |
|
|
|
— |
|
|
|
— |
|
|
|
— |
|
|
|
— |
|
|
|
— |
|
|
|
— |
|
|
|
(73,754 |
) |
|
|
(47,059 |
) |
|
|
(120,813 |
) |
|
Dividends and distributions declared ($1.00 per share and unit) |
|
|
— |
|
|
|
— |
|
|
|
— |
|
|
|
— |
|
|
|
— |
|
|
|
— |
|
|
|
— |
|
|
|
— |
|
|
|
— |
|
|
|
(34,668 |
) |
|
|
(21,449 |
) |
|
|
(56,117 |
) |
|
Vesting of restricted share units |
|
|
11 |
|
|
|
— |
|
|
|
— |
|
|
|
— |
|
|
|
— |
|
|
|
— |
|
|
|
— |
|
|
|
— |
|
|
|
(13 |
) |
|
|
— |
|
|
|
— |
|
|
|
(13 |
) |
|
Stock-based compensation |
|
|
— |
|
|
|
— |
|
|
|
— |
|
|
|
— |
|
|
|
— |
|
|
|
— |
|
|
|
— |
|
|
|
— |
|
|
|
7,018 |
|
|
|
— |
|
|
|
— |
|
|
|
7,018 |
|
|
Issuance of preferred stock |
|
|
— |
|
|
|
— |
|
|
|
— |
|
|
|
— |
|
|
|
— |
|
|
|
— |
|
|
|
2,800 |
|
|
|
28 |
|
|
|
66,446 |
|
|
|
— |
|
|
|
— |
|
|
|
66,474 |
|
|
Share class exchanges, net (2,603,554 common shares) |
|
|
2,604 |
|
|
|
27 |
|
|
|
— |
|
|
|
— |
|
|
|
(2,604 |
) |
|
|
(27 |
) |
|
|
— |
|
|
|
— |
|
|
|
— |
|
|
|
— |
|
|
|
— |
|
|
|
— |
|
|
Share class surrenders (260,154 common shares) |
|
|
— |
|
|
|
— |
|
|
|
(260 |
) |
|
|
(3 |
) |
|
|
— |
|
|
|
— |
|
|
|
— |
|
|
|
— |
|
|
|
3 |
|
|
|
— |
|
|
|
— |
|
|
|
— |
|
|
OP Unit exchanges (3,958,182 units) |
|
|
3,958 |
|
|
|
39 |
|
|
|
— |
|
|
|
— |
|
|
|
— |
|
|
|
— |
|
|
|
— |
|
|
|
— |
|
|
|
117,043 |
|
|
|
— |
|
|
|
(117,082 |
) |
|
|
— |
|
|
|
|
|
|
|
|
|
|
|
|
|
|
|
|
|
|
|
|
|
|
|
|
|
|
|
|
|
|
|
|
|
|
|
|
|
|
|
|
|
|
|
|
|
|
|
|
|
|
|
|
Balance at December 31, 2017 |
|
|
32,416 |
|
|
$ |
324 |
|
|
|
1,329 |
|
|
$ |
13 |
|
|
|
3,151 |
|
|
$ |
31 |
|
|
|
2,800 |
|
|
$ |
28 |
|
|
$ |
1,116,060 |
|
|
$ |
(229,760 |
) |
|
$ |
434,164 |
|
|
$ |
1,320,860 |
|
The accompanying notes are an integral part of these consolidated financial statements.
F-8
CONSOLIDATED STATEMENT OF CASH FLOWS
(Amounts in thousands)
|
|
|
|
|
|
|
|
|
|
|
July 7, 2015 |
|
|
|
|
|
Year Ended December 31, |
|
|
(date operations commenced) to |
|
||||||
|
|
|
2017 |
|
|
2016 |
|
|
December 31, 2015 |
|
|||
|
CASH FLOW FROM OPERATING ACTIVITIES |
|
|
|
|
|
|
|
|
|
|
|
|
|
Net loss |
|
$ |
(120,813 |
) |
|
$ |
(91,009 |
) |
|
$ |
(38,803 |
) |
|
Adjustments to reconcile net loss to net cash provided by operating activities: |
|
|
|
|
|
|
|
|
|
|
|
|
|
Equity in loss (income) of unconsolidated joint ventures |
|
|
7,788 |
|
|
|
(4,646 |
) |
|
|
(4,772 |
) |
|
Distributions from unconsolidated joint ventures |
|
|
14,344 |
|
|
|
15,677 |
|
|
|
6,733 |
|
|
Gain on sale of interest in unconsolidated joint venture |
|
|
(60,302 |
) |
|
|
— |
|
|
|
— |
|
|
Gain on sale of real estate |
|
|
(11,447 |
) |
|
|
— |
|
|
|
— |
|
|
Unrealized loss on interest rate cap |
|
|
701 |
|
|
|
1,378 |
|
|
|
2,933 |
|
|
Stock-based compensation |
|
|
7,018 |
|
|
|
1,068 |
|
|
|
944 |
|
|
Depreciation and amortization |
|
|
262,171 |
|
|
|
177,119 |
|
|
|
65,907 |
|
|
Amortization of deferred financing costs |
|
|
8,719 |
|
|
|
5,361 |
|
|
|
2,657 |
|
|
Amortization of above and below market leases, net |
|
|
(720 |
) |
|
|
(680 |
) |
|
|
(388 |
) |
|
Straight-line rent adjustment |
|
|
(3,719 |
) |
|
|
(12,862 |
) |
|
|
(8,299 |
) |
|
Change in operating assets and liabilities |
|
|
|
|
|
|
|
|
|
|
|
|
|
Tenants and other receivables |
|
|
(4,753 |
) |
|
|
350 |
|
|
|
(1,473 |
) |
|
Prepaid expenses, deferred expenses and other assets |
|
|
(7,877 |
) |
|
|
6,080 |
|
|
|
(25,596 |
) |
|
Accounts payable, accrued expenses and other liabilities |
|
|
(21,462 |
) |
|
|
12,143 |
|
|
|
21,589 |
|
|
Net cash provided by operating activities |
|
|
69,648 |
|
|
|
109,979 |
|
|
|
21,432 |
|
|
CASH FLOW FROM INVESTING ACTIVITIES |
|
|
|
|
|
|
|
|
|
|
|
|
|
Acquisition of real estate and unconsolidated joint ventures |
|
|
— |
|
|
|
— |
|
|
|
(2,630,412 |
) |
|
Investment in unconsolidated joint ventures |
|
|
(37,993 |
) |
|
|
(9,000 |
) |
|
|
— |
|
|
Net proceeds from sale of real estate |
|
|
50,875 |
|
|
|
— |
|
|
|
— |
|
|
Net proceeds from disposition of interest in unconsolidated joint venture |
|
|
257,373 |
|
|
|
— |
|
|
|
— |
|
|
Development of real estate |
|
|
(243,105 |
) |
|
|
(66,193 |
) |
|
|
(11,273 |
) |
|
Net cash provided by (used in) investing activities |
|
|
27,150 |
|
|
|
(75,193 |
) |
|
|
(2,641,685 |
) |
|
CASH FLOW FROM FINANCING ACTIVITIES |
|
|
|
|
|
|
|
|
|
|
|
|
|
Proceeds from issuance of mortgage loans payable |
|
|
— |
|
|
|
— |
|
|
|
1,161,196 |
|
|
Repayment of mortgage loans payable |
|
|
(50,634 |
) |
|
|
— |
|
|
|
— |
|
|
Proceeds from Future Funding Facility |
|
|
79,998 |
|
|
|
20,002 |
|
|
|
— |
|
|
Proceeds from Unsecured Term Loan |
|
|
230,000 |
|
|
|
— |
|
|
|
— |
|
|
Repayment of Unsecured Delayed Draw Term Loan |
|
|
(85,000 |
) |
|
|
— |
|
|
|
— |
|
|
Payment of deferred financing costs |
|
|
(4,348 |
) |
|
|
(914 |
) |
|
|
(21,431 |
) |
|
Proceeds from issuance of common stock and non-controlling interest |
|
|
— |
|
|
|
— |
|
|
|
1,644,042 |
|
|
Proceeds from issuance of preferred stock |
|
|
70,000 |
|
|
|
— |
|
|
|
— |
|
|
Offering related costs |
|
|
(3,526 |
) |
|
|
— |
|
|
|
(8,212 |
) |
|
Common dividends paid |
|
|
(34,248 |
) |
|
|
(39,354 |
) |
|
|
— |
|
|
Non-controlling interests distributions paid |
|
|
(21,448 |
) |
|
|
(30,220 |
) |
|
|
— |
|
|
Net cash provided by (used in) financing activities |
|
|
180,794 |
|
|
|
(50,486 |
) |
|
|
2,775,595 |
|
|
Net increase (decrease) in cash, cash equivalents, and restricted cash |
|
|
277,592 |
|
|
|
(15,700 |
) |
|
|
155,342 |
|
|
Cash, cash equivalents, and restricted cash, beginning of period |
|
|
139,642 |
|
|
|
155,342 |
|
|
|
— |
|
|
Cash, cash equivalents, and restricted cash, end of period |
|
$ |
417,234 |
|
|
$ |
139,642 |
|
|
$ |
155,342 |
|
F-9
CONSOLIDATED STATEMENT OF CASH FLOWS (Continued)
(Amounts in thousands)
|
|
|
|
|
|
|
|
|
|
|
July 7, 2015 |
|
|
|
|
|
Year Ended December 31, |
|
|
(date operations commenced) to |
|
||||||
|
|
|
2017 |
|
|
2016 |
|
|
December 31, 2015 |
|
|||
|
SUPPLEMENTAL DISCLOSURE OF CASH FLOW INFORMATION |
|
|
|
|
|
|
|
|
|
|
|
|
|
Cash payments for interest |
|
$ |
73,870 |
|
|
$ |
61,051 |
|
|
$ |
25,325 |
|
|
Capitalized interest |
|
|
13,142 |
|
|
|
3,077 |
|
|
|
226 |
|
|
Income taxes paid |
|
|
271 |
|
|
|
505 |
|
|
|
944 |
|
|
SUPPLEMENTAL DISCLOSURE OF NON-CASH INVESTING AND FINANCING ACTIVITIES |
|
|
|
|
|
|
|
|
|
|
|
|
|
Development of real estate financed with accounts payable |
|
$ |
21,449 |
|
|
$ |
6,369 |
|
|
$ |
2,856 |
|
|
Dividends and distribution declared and unpaid |
|
|
13,968 |
|
|
|
13,954 |
|
|
|
27,894 |
|
|
Decrease in assets and liabilities resulting from deconsolidated properties |
|
|
|
|
|
|
|
|
|
|
|
|
|
Real estate, net |
|
|
(67,616 |
) |
|
|
— |
|
|
|
— |
|
|
Tenant and other receivables, net |
|
|
(814 |
) |
|
|
— |
|
|
|
— |
|
|
Lease intangible assets, net |
|
|
(13,480 |
) |
|
|
— |
|
|
|
— |
|
|
Prepaid expenses, deferred expenses and other assets, net |
|
|
(8 |
) |
|
|
— |
|
|
|
— |
|
|
Accounts payable, accrued expenses and other liabilities |
|
|
3,612 |
|
|
|
— |
|
|
|
— |
|
The accompanying notes are an integral part of these consolidated financial statements.
F-10
NOTES TO CONSOLIDATED FINANCIAL STATEMENTS
Note 1 – Organization
Seritage Growth Properties was organized in Maryland on June 3, 2015 and initially capitalized with 100 shares of Class A common shares. The Company conducts its operations through Seritage Growth Properties, L.P. (the “Operating Partnership”), a Delaware limited partnership that was formed on April 22, 2015. Unless the context otherwise requires, “Seritage” and the “Company” refer to Seritage Growth Properties, the Operating Partnership and its subsidiaries.
On June 11, 2015 Sears Holdings Corporation (“Sears Holdings”) effected a rights offering (the “Rights Offering”) to Sears Holdings stockholders to purchase common shares of Seritage in order to fund, in part, the $2.7 billion acquisition of 234 of Sears Holdings’ owned properties and one of its ground leased properties (the “Wholly Owned Properties”), and its 50% interests in three joint ventures (such joint ventures, the “JVs,” and such 50% joint venture interests the “JV Interests”) that collectively own 28 properties, ground lease one property and lease two properties (collectively, the “Original JV Properties”) (collectively, the “Transaction”). The Rights Offering ended on July 2, 2015 and the Company’s Class A common shares were listed on the New York Stock Exchange (“NYSE”) on July 6, 2015.
On July 7, 2015, the Company completed the Transaction with Sears Holdings and commenced operations. The Company did not have any operations prior to the completion of the Rights Offering and Transaction.
During the year ended December 31, 2017, the Company completed transactions whereby it (i) sold its 50% JV Interests in 13 Original JV Properties and (ii) sold a 50% interest in five Wholly Owned Properties and retained a 50% interest in five new joint venture properties (the “New JV Properties” and, together with the Original JV Properties, the “JV Properties”).
Seritage is a fully-integrated, self-administered, self-managed real estate investment trust (“REIT”) primarily engaged in the real property business through the Company’s investment in the Operating Partnership. As of December 31, 2017, our portfolio consisted of approximately 39.4 million square feet of gross leasable area (“GLA”), including 230 wholly owned properties totaling approximately 35.2 million square feet of GLA across 49 states and Puerto Rico, and interests in 23 joint venture properties totaling over 4.2 million square feet of GLA across 13 states.
As of December 31, 2017, we leased space at 148 Wholly Owned Properties to Sears Holdings under the Master Lease, including 76 properties leased only to Sears Holdings and 72 properties leased to both Sears Holdings and one or more third-party tenants. The remaining 92 Wholly Owned Properties include 51 properties that are leased solely to third-party tenants and do not have any space leased to Sears Holdings, and 31 vacant properties. As of December 31, 2017, space at 22 JV Properties is also leased to Sears Holdings by, as applicable, the GGP JVs, the Simon JV or the Macerich JV, in each case under a separate JV Master Lease. Sears Holdings is the sole tenant at nine JV properties and 13 JV properties are leased to both Sears Holdings and one or more third-party tenants. One JV Property was vacant as of December 31, 2017.
The Master Lease and the JV Master Leases provide the Company and the JVs with the right to recapture certain space from Sears Holdings at each property for retenanting or redevelopment purposes.
Note 2 – Summary of Significant Accounting Policies
Basis of Presentation and Principles of Consolidation
The accompanying consolidated financial statements are prepared in accordance with accounting principles generally accepted in the United States (“GAAP”). The consolidated financial statements include the accounts of the Company, the Operating Partnership, each of their wholly-owned subsidiaries, and all other entities in which they have a controlling financial interest or entities that meet the definition of a variable interest entity (“VIE”) in which the Company has, as a result of ownership, contractual interests or other financial interests, both the power to direct activities that most significantly impact the economic performance of the VIE and the obligation to absorb losses or the right to receive benefits that could potentially be significant to the VIE. All intercompany accounts and transactions have been eliminated.
If the Company has an interest in a VIE but it is not determined to be the primary beneficiary, the Company accounts for its interest under the equity method of accounting. Similarly, for those entities which are not VIEs and over which the Company has the ability to exercise significant influence, but does not have a controlling financial interest, the Company accounts for its interests under the equity method of accounting. The Company continually reconsiders its determination of whether an entity is a VIE and whether the Company qualifies as its primary beneficiary.
F-11
To the extent such variable interests are in entities that are not evaluated under the VIE model, the Company evaluates its interests usi ng the voting interest entity model. The Company holds a 63.8% interest in the Operating Partnership and is the sole general partner which gives the Company exclusive and complete responsibility for the day-to-day management, authority to make decisions, and control of the Operating Partnership. Through consideration of new consolidation guidance effective for the Company as of January 1, 2016, it has been concluded that the Operating Partnership is a VIE as the limited partners in the Operating Partnersh ip, although entitled to vote on certain matters, do not possess kick-out rights or substantive participating rights. Accordingly, the Company consolidates its interest in the Operating Partnership. However, as the Company holds what is deemed a majority voting interest in the Operating Partnership, it qualifies for the exemption from providing certain of the disclosure requirements associated with investments in VIEs.
The portions of consolidated entities not owned by the Company and the Operating Partnership are presented as non-controlling interests as of and during the periods presented.
Use of Estimates
The preparation of financial statements in conformity with GAAP requires management to make estimates and assumptions. These estimates and assumptions affect the reported amounts of assets and liabilities and the disclosure of contingent assets and liabilities at the date of the financial statements and the reported amounts of revenues and expenses during the reporting periods. The most significant assumptions and estimates relate to fair values of acquired assets and liabilities assumed for purposes of applying the acquisition method of accounting, the useful lives of tangible and intangible assets, real estate impairment assessments, and assessing the recoverability of accounts receivables. These estimates are based on historical experience and other assumptions which management believes are reasonable under the circumstances. Management evaluates its estimates on an ongoing basis and makes revisions to these estimates and related disclosures as experience develops or new information becomes known. Actual results could differ from these estimates.
Segment Reporting
The Company currently operates in a single reportable segment, which includes the acquisition, ownership, development, redevelopment, management and leasing of real estate properties. The Company’s chief operating decision maker, its Chief Executive Officer, assesses and measures the operating and financial results for each property on an individual basis and does not distinguish or group properties based on geography, size, or type. The Company, therefore, aggregates all properties into one reportable segment due to their similarities with regard to the nature and economics of the properties, tenants and operational process.
Accounting for Real Estate Acquisitions
Upon the acquisition of real estate, the Company assesses the fair value of acquired assets and liabilities assumed, including land, buildings, improvements and identified intangibles such as above-market and below-market leases, in-place leases and other items, as applicable, and allocates the purchase price based on these assessments. In making estimates of fair values, the Company may use a number of sources, including data provided by third parties, as well as information obtained by the Company as a result of its due diligence, including expected future cash flows of the property and various characteristics of the markets where the property is located.
The fair values of tangible assets are determined on an "if vacant" basis. The "if vacant" fair value allocated to land is generally estimated via a market or sales comparison approach with the subject site being compared to similar properties that have sold or are currently listed for sale. The comparable properties are adjusted for dissimilar characteristics such as market conditions, location, access/frontage, size, shape/topography, or intended use, including the impact of any encumbrances on such use. The "if vacant" value allocated to buildings and site improvements is generally estimated using an income approach and a cost approach that utilizes published guidelines for current replacement cost or actual construction costs for similar, recently developed properties. Assumptions used in the income approach include capitalization and discount rates, lease-up time, market rents, make ready costs, land value, and site improvement value.
The estimated fair value of in-place tenant leases includes lease origination costs (the costs the Company would have incurred to lease the property to the current occupancy level) and the lost revenues during the period necessary to lease-up from vacant to the current occupancy level. Such estimates include the fair value of leasing commissions, legal costs and tenant coordination costs that would be incurred to lease the property to this occupancy level. Additionally, the Company evaluates the time period over which such occupancy level would be achieved and include an estimate of the net operating costs (primarily real estate taxes, insurance and utilities) incurred during the lease-up period, which generally ranges up to one year. The fair value of acquired in-place tenant leases is included in lease intangible assets on the consolidated balance sheets and amortized over the remaining lease term for each tenant.
F-12
Identifiable intangible assets and liabilities are calculated for above-market and below-market tenant and ground leases where the Company is either the lessor or the lessee. The difference between the contractual rental rates and the Company’s estimate of market rental rates is measured over a period equal to the remaining non-cancelable term of the leases, including significantly below-market renewal options for which exercise of the renewal option appears to be reasonably assured. Above-market tenant leases and below-market ground leases are included in lease intangible assets on the consolidated balance sheets; below-market tenant leases and above-market ground leases are includ ed in accounts payable, accrued expenses and other liabilities on the consolidated balance sheets. The values assigned to above-market and below-market tenant leases are amortized as reductions and increases, respectively, to base rental revenue over the remaining term of the respective leases. The values assigned to below-market and above-market ground leases are amortized as increases and reductions, respectively, to property operating expenses over the remaining term of the respective leases.
The Company expenses transaction costs associated with business combinations in the period incurred. These costs are included in acquisition-related expenses within the consolidated statements of operations.
Real Estate Investments
Real estate assets are recorded at cost, less accumulated depreciation and amortization.
Expenditures for ordinary repairs and maintenance will be expensed as incurred. Significant renovations which improve the property or extend the useful life of the assets are capitalized. As real estate is undergoing redevelopment activities, all amounts directly associated with and attributable to the project, including planning, development and construction costs, interest costs, personnel costs of employees directly involved and other miscellaneous costs incurred during the period of redevelopment, are capitalized. The capitalization period begins when redevelopment activities are underway and ends when the project is substantially complete.
Depreciation of real estate assets, excluding land, is recognized on a straight-line basis over their estimated useful lives as follows:
|
Building: |
25 – 40 years |
|
Site improvements: |
5 – 15 years |
|
Tenant improvements: |
shorter of the estimated useful life or non-cancelable term of lease |
The Company amortizes identified intangibles that have finite lives over the period they are expected to contribute directly or indirectly to the future cash flows of the property or business acquired, generally the remaining non-cancelable term of a related lease.
On a periodic basis, management assesses whether there are indicators that the value of the Company’s real estate assets (including any related intangible assets or liabilities) may be impaired. If an indicator is identified, a real estate asset is considered impaired only if management’s estimate of current and projected operating cash flows (undiscounted and unleveraged), taking into account the anticipated and probability weighted holding period, are less than a real estate asset’s carrying value. Various factors are considered in the estimation process, including expected future operating income, trends and prospects and the effects of demand, competition, and other economic factors. If management determines that the carrying value of a real estate asset is impaired, a loss will be recorded for the excess of its carrying amount over its estimated fair value. No such impairment losses were recognized for the years ended December 31, 2017 or December 31, 2016, or for the period from July 7, 2015 (Date Operations Commenced) to December 31, 2015.
Investments in Unconsolidated Joint Ventures
The Company accounts for its investments in unconsolidated joint ventures using the equity method of accounting as the Company exercises significant influence, but does not control these entities. These investments are initially recorded at cost and are subsequently adjusted for cash contributions, cash distributions and earnings which are recognized in accordance with the terms of the applicable agreement.
On a periodic basis, management assesses whether there are indicators, including the operating performance of the underlying real estate and general market conditions, that the value of the Company’s investments in unconsolidated joint ventures may be impaired. An investment’s value is impaired only if management’s estimate of the fair value of the Company’s investment is less than its carrying value and such difference is deemed to be other-than-temporary. To the extent impairment has occurred, the loss is measured as the excess of the carrying amount of the investment over its estimated fair value. No such impairment losses were recognized for the years ended December 31, 2017 or December 31, 2016, or for the period from July 7, 2015 (Date Operations Commenced) to December 31, 2015.
F-13
The Company considers instruments with an original maturity of three months or less to be cash and cash equivalents. Cash and cash equivalent balances may, at a limited number of banks and financial institutions, exceed insurable amounts. The Company believes it mitigates this risk by investing in or through major financial institutions and primarily in funds that are insured by the United States federal government.
Restricted Cash
Restricted cash represents cash deposited in escrow accounts, which generally can only be used for the payment of real estate taxes, debt service, insurance, and future capital expenditures as required by certain loan and lease agreements, as well as legally restricted tenant security deposits. As of December 31, 2017, the Company had approximately $175.7 million of restricted cash, consisting of $151.3 million reserved for redevelopment costs, tenant allowances and leasing commissions, deferred maintenance, environmental remediation and other capital expenditures, $21.7 million related to basic property carrying costs such as real estate taxes, insurance and ground rent; and $2.7 million of other restricted cash which consists primarily of prepaid rental income.
As of December 31, 2016, the Company had approximately $87.6 million of restricted cash, including $65.5 million reserved for redevelopment costs, deferred maintenance, environmental remediation and other capital expenditures; $19.2 million related to basic property carrying costs such as real estate taxes, insurance and ground rent and $2.9 million of other restricted cash which consists primarily of prepaid rental income.
Tenant and Other Receivables
Accounts receivable includes unpaid amounts billed to tenants, accrued revenues for future billings to tenants for property expenses and amounts arising from the straight-lining of rent. The Company periodically reviews its receivables for collectability, taking into consideration changes in factors such as the tenant’s payment history, the financial condition of the tenant, business conditions in the industry in which the tenant operates and economic conditions in the area where the property is located. In the event that the collectability of a receivable with respect to any tenant is in doubt, a provision for uncollectible amounts will be established or a direct write-off of the specific rent receivable will be made. For accrued rental revenues related to the straight-line method of reporting rental revenue, the Company performs a periodic review of receivable balances to assess the risk of uncollectible amounts and establish appropriate provisions.
Revenue Recognition
Rental income is recognized on a straight-line basis over the non-cancelable terms of the related leases. For leases that have fixed and measurable rent escalations, the difference between such rental income earned and the cash rent due under the provisions of the lease is recorded as deferred rent receivable and included as a component of tenant and other receivables on the consolidated balance sheets.
In leasing tenant space, the Company may provide funding to the lessee through a tenant allowance. In accounting for a tenant allowance, the Company will determine whether the allowance represents funding for the construction of leasehold improvements and evaluate the ownership of such improvements. If the Company is considered the owner of the improvements for accounting purposes, the Company will capitalize the amount of the tenant allowance and depreciate it over the shorter of the useful life of the improvements or the related lease term. If the tenant allowance represents a payment for a purpose other than funding leasehold improvements, or in the event the Company is not considered the owner of the improvements for accounting purposes, the allowance is considered to be a lease incentive and is recognized over the lease term as reduction of rental revenue on straight-line basis.
The Company commences recognizing revenue based on an evaluation of a number of factors. In most cases, revenue recognition under a lease begins when the lessee takes possession of or controls the physical use of the leased asset. Generally, this occurs on the lease commencement date.
Tenant reimbursement income arises from tenant leases which provide for the recovery of all or a portion of the operating expenses and real estate taxes of the respective property. This revenue is accrued in the same periods as the related expenses are incurred.
F-14
Accounting for Recapture and Termination Activity Pursuant to the Master Lease
Seritage 100% Recapture Rights. The Company generally treats the delivery of a 100% recapture notice as a modification of the Master Lease as of the date of notice. Such a notice and lease modification result in the following accounting adjustments for the recaptured property:
|
|
• |
Accrued rental revenues related to the straight-line method of reporting rental revenue that are deemed uncollectable as result of the lease modification are amortized over the remaining shortened life of the lease from the date of notice to the date of vacancy. |
|
|
• |
Intangible lease assets and liabilities that are deemed to be impacted by the lease modification are amortized over the shorter of the shortened lease term from the date of notice to the date of vacancy or the remaining useful life of the asset or liability. |
A 100% recapture will generally occur in conjunction with obtaining a new tenant or a real estate development project. As such, termination fees, if any, associated with the 100% recapture notice are generally capitalized as either an initial direct cost of obtaining a new lease or a necessary cost of the real estate project and depreciated over the life of the new lease obtained or the real estate asset being constructed or improved.
Seritage 50% Recapture Rights. The Company generally treats the delivery of a 50% recapture notice as a modification of the Master Lease as of the date of notice. Such a notice and lease modification result in the following accounting adjustments for the recaptured property:
|
|
• |
The portion of accrued rental revenues related to the straight-line method of reporting rental revenue that are subject to the lease modification are amortized over the remaining shortened life of the lease from the date of notice to the date of vacancy. The portion of accrued rental revenues related to the straight-line method of reporting rental revenue that is attributable to the retained space is amortized over the remaining life of the Master Lease. |
|
|
• |
The portion of intangible lease assets and liabilities that is deemed to be impacted by the lease modification is amortized over the shorter of the shortened lease term from the date of notice to the date of vacancy or the remaining useful life of the asset or liability. The portion of intangible lease assets and liabilities that is attributable to the retained space is amortized over the remaining useful life of the asset or liability. |
Sears Holdings Termination Rights. The Master Lease provides Sears Holdings with certain rights to terminate the Master Lease with respect to properties that cease to be profitable for operation by Sears Holdings. Such a termination would generally result in the following accounting adjustments for the terminated property:
|
|
• |
Accrued rental revenues related to the straight-line method of reporting rental revenue that are subject to the termination are amortized over the remaining shortened life of the lease from the date of notice to the date of vacancy. |
|
|
• |
Intangible lease assets and liabilities that are deemed to be impacted by the termination are amortized over the shorter of the shortened lease term from the date of notice to the date of vacancy or the remaining useful life of the asset or liability. |
|
|
• |
Termination fees required to be paid by Sears Holdings are recognized as follows: |
|
|
− |
For the portion of the termination fee attributable to the annual base rent of the subject property, termination income is recognized on a straight-line basis over the shortened life of the lease from the date the termination fee becomes legally binding to the date of vacancy. |
|
|
− |
For the portion of the termination fee attributable to estimated real estate taxes and property operating expenses for the subject property, prepaid rental income is recorded in the period such fee is received and recognized as tenant reimbursement revenue in the same periods as the expenses are incurred. |
Derivatives
The Company’s use of derivative instruments is limited to the management of interest rate exposure and not for speculative purposes. In connection with the issuance of the Company’s Mortgage Loans and Future Funding Facility, the Company purchased for $5.0 million an interest rate cap with a term of four years, a notional amount of $1,261 million and a strike rate of 3.5%. The interest rate cap is measured at fair value and included as a component of prepaid expenses, deferred expenses and other assets on the consolidated balance sheets. The Company has elected not to utilize hedge accounting and therefore the change in fair value is included within change in fair value of interest rate cap on the consolidated statements of operations.
For the years ended December 31, 2017 and December 31, 2016, and for the period from July 7, 2015 (Date Operations Commenced) to December 31, 2015, the Company recorded unrealized losses $0.7 million, $1.4 million and $2.9 million, respectively.
F-15
As of December 31, 2017, the interest rate cap had a fair value of less than $0.1 million as compared to approximately $0.7 million at December 31, 2016.
Stock-Based Compensation
The Company generally recognizes equity awards to employees as compensation expense and includes such expense within general and administrative expenses in the consolidated statements of operations. Compensation expense for equity awards is generally based on the fair value of the common shares at the date of the grant and is recognized (i) ratably over the vesting period for awards with time-based vesting and (ii) for awards with performance-based vesting, at the date the achievement of performance criteria is deemed probable, an amount equal to that which would have been recognized ratably from the date of the grant through the date the achievement of performance criteria is deemed probable, and then ratably from the date the achievement of performance criteria is deemed probable through the remainder of the vesting period.
Concentration of Credit Risk
Concentrations of credit risk arise when a number of operators, tenants, or obligors related to the Company's investments are engaged in similar business activities, or activities in the same geographic region, or have similar economic features that would cause their ability to meet contractual obligations, including those to the Company, to be similarly affected by changes in economic conditions. As of December 31, 2017, a majority of the Company's real estate properties were leased to Sears Holdings, and the majority of Company’s rental revenues were derived from the Master Lease (see Note 5). Until the Company further diversifies the tenancy of its portfolio, an event that has a material adverse effect on Sears Holdings’ business, financial condition or results of operations could have a material adverse effect on the Company’s business, financial condition or results of operations. Sears Holdings is a publicly traded company that is subject to the informational filing requirements of the Securities Exchange Act of 1934, as amended, and is required to file periodic reports on Form 10-K and Form 10-Q with the SEC. Refer to www.sec.gov for Sears Holdings publicly-available financial information.
Other than the Company's tenant concentration, management believes the Company's portfolio was reasonably diversified by geographical location and did not contain any other significant concentrations of credit risk. As of December 31, 2017, the Company's portfolio of 230 Wholly Owned Properties was diversified by location across 49 states and Puerto Rico.
Earnings (Loss) per Share
The Company has three classes of common stock. The rights, including the liquidation and dividend rights, of the holders of the Company’s Class A common shares and Class C non-voting common shares are identical, except with respect to voting. As the liquidation and dividend rights are identical, the undistributed earnings are allocated on a proportionate basis. The net earnings (loss) per share amounts are the same for Class A and Class C common shares because the holders of each class are legally entitled to equal per share distributions whether through dividends or in liquidation. Class B non-economic common shares are excluded from earnings (loss) per share computations as they do not have economic rights.
All outstanding non-vested shares that contain non-forfeitable rights to dividends are considered participating securities and are included in computing earnings per share pursuant to the two-class method which specifies that all outstanding non-vested share-based payment awards that contain non-forfeitable rights to distributions are considered participating securities and should be included in the computation of earnings per share.
Recently Issued Accounting Pronouncements
In February 2017, the Financial Accounting Standards Boards (“FASB”) issued Accounting Standards Update (“ASU”) 2017-05, “Other Income—Gains and Losses from the Derecognition of Nonfinancial Assets” to provide guidance for recognizing gains and losses from the transfer of nonfinancial assets. The standard requires a company to derecognize nonfinancial assets once it transfers control of a distinct nonfinancial asset or distinct in substance nonfinancial assets to noncustomers. Additionally, when a company transfers its controlling interest in a nonfinancial asset, but retains a non-controlling ownership interest, the company is required to measure any non-controlling interest it receives or retains at fair value. ASU 2017-15 is effective for annual reporting periods beginning after December 15, 2017, including interim reporting periods within that reporting period. The effective date of this guidance coincides with revenue recognition guidance. The Company will implement this guidance for reporting periods starting January 1, 2018.
F-16
In January 2017, the FASB issued ASU 2017-01 which changes the definition of a business to exclude acquisitions where substantially all of the fair value of the assets acquired are concentrated in a single identifiable asset or a group of similar identifiable assets. While there are various differences between the accounting for an asset acquisition and a business combination, the Company e xpects that the largest impact will be the capitalization of transaction costs for asset acquisitions which are expensed for business combinations. ASU 2017-01 is effective, on a prospective basis, for interim and annual periods beginning after January 1, 2019. The Company adopted the guidance on the issuance date effective January 5, 2017 on a prospective basis and it did not have an impact on the consolidated financial statements.
In November 2016, the FASB issued ASU 2016-18, "Statement of Cash Flows - Restricted Cash." ASU 2016-18 requires that the statement of cash flows explain the change during the period in the total of cash, cash equivalents, and amounts generally described as restricted cash or cash equivalents. Therefore, amounts generally described as restricted cash and equivalents should be included with cash and cash equivalents when reconciling the beginning and end of period total amounts on the statement of cash flows. ASU 2016-18 is effective, on a retroactive basis, for interim and annual periods beginning after December 15, 2017; early adoption is permitted. The Company early adopted this guidance on March 31, 2017, which changes our statements of cash flows and related disclosure for all periods presented and accordingly, the following is a summary of our cash, cash equivalents, and restricted cash total as presented in our statements of cash flows for the year ended December 31, 2017 and December 31, 2016, and for the period from July 7, 2015 (Date Operations Commenced) to December 31, 2016 (in thousands):
|
|
|
December 31, |
|
|||||||||
|
|
|
2017 |
|
|
2016 |
|
|
2015 |
|
|||
|
Cash and cash equivalents |
|
$ |
241,569 |
|
|
$ |
52,026 |
|
|
$ |
62,867 |
|
|
Restricted cash |
|
|
175,665 |
|
|
|
87,616 |
|
|
|
92,475 |
|
|
Total cash, cash equivalents, and restricted cash shown in the statement of cash flows |
|
$ |
417,234 |
|
|
$ |
139,642 |
|
|
$ |
155,342 |
|
In August 2016, the FASB issued ASU 2016-15, "Classification of Certain Cash Receipts and Cash Payments." ASU 2016-15 provides classification guidance for eight specific topics including debt extinguishment costs, contingent consideration payments made after a business combination, and distributions received from equity method investees. ASU 2016-15 is effective, on a prospective basis, for interim and annual periods beginning after December 15, 2017; early adoption is permitted. The Company will retrospectively adopt ASU 2016-15 on the effective date of January 1, 2018, applying the cumulative earnings approach to classify distributions received from our equity method investees, which will impact our consolidated statements of cash flows upon adoption where distributions from unconsolidated joint ventures in excess of cumulative equity in earnings will be classified as an inflow from investing activities.
On February 25, 2016, the FASB issued Accounting Standards Codification (“ASC”) 842 (“ASC 842”), “Leases” which replaces the existing guidance in ASC 840, Leases. ASC 842 is effective for fiscal years, and interim periods within those years, beginning after December 15, 2018. ASC 842 requires a dual approach for lessee accounting under which a lessee would account for leases as finance leases or operating leases. Both finance leases and operating leases will result in the lessee recognizing a right-of-use (ROU) asset and a corresponding lease liability. For finance leases, the lessee will recognize interest expense and amortization of the ROU asset and for operating leases, the lessee will recognize a straight-line total lease expense. Under ASC 842, there will be modifications to conform lessor accounting with the lessee model, eliminate real estate specific guidance, further define certain lease and non-lease components, and change the definition of initial direct costs of leases requiring significantly more leasing related costs to be expensed upfront.
We have considered the effect of ASC 842, and believe the lease standard will impact our revenue recognition applied to executory costs and other components of revenue due under leases that are deemed to be non-lease components, which could affect our recognition pattern for such revenue. The guidance will require that lessees and lessors capitalize, as initial direct costs, only those costs that are incurred due to the execution of a lease. Under this guidance, allocated payroll costs and other costs that are incurred regardless of whether the lease is obtained will no longer be capitalized as initial direct costs and instead will be expensed as incurred. Tenant reimbursement and common area maintenance will be considered an additional service to the lessee and therefore will be required to be presented as a non-lease component. The Company is currently in the process of evaluating the impact the adoption of the guidance will have on its consolidated financial statements.
In September 2015, the FASB issued ASU 2015-16, which amends Topic 805, “Business Combinations”, and requires the recognition of purchase price allocation adjustments that are identified during the measurement period in the reporting period in which the adjustment amounts are determined, and eliminates the requirement to retrospectively account for these adjustments. ASU 2015-16 is effective, on a prospective basis, for interim and annual periods beginning after December 15, 2015; early adoption is permitted. The Company early adopted ASU 2015-16 on the issuance date effective September 2015 on a prospective basis and it did not have an impact on the consolidated financial statements.
F-17
In May 2014, with subsequent updates issued in August 2015 and March, April, May and December 2016, the FASB issued ASU 2014-09, “Revenue from Contracts with Customers,” which outlines a single comprehensive model for entities to use in accounting for revenue arising from contracts with customers and supersedes most current revenue recognition guidance, including industry-s pecific guidance. ASU 2014-09 states that “an entity recognizes revenue to depict the transfer of promised goods or services to customers in an amount that reflects the consideration to which the entity expects to be entitled in exchange for those goods o r services.” While ASU 2014-09 specifically references contracts with customers, it does not apply to contracts within the scope of ASC 840 and ASC 842 (leases) and it may apply to certain other transactions such as the sale of real estate or equipment. In July 2015, the FASB voted to defer the effective date of ASU 2014-09 by one year. Accordingly, ASU 2014-09 is effective for annual periods beginning after December 15, 2017, with early adoption permitted for annual periods beginning after December 15, 2016. The standard can be applied either retrospectively to each prior reporting period presented or as a cumulative-effect adjustment recognized as of the date of initial application. Expanded quantitative and qualitative disclosures regarding revenue re cognition will be required for contracts that are subject to this guidance .
We have considered the sources of revenue that will be affected by ASU 2014-09, and do not believe our revenue recognition will be impacted by the new standard, as leases (the source of the majority of the Company's revenues) are excluded from ASU 2014-09. However, once the new lease guidance goes into effect on January 1, 2019 which sets forth principles for the recognition, measurement, presentation and disclosure of leases, we believe that the new revenue standard will apply to executory costs and other components of revenue due under leases that are deemed to be non-lease components (such as common area maintenance), which could affect our recognition pattern for such revenue.
Note 3 – Lease Intangible Assets and Liabilities
Lease intangible assets (acquired in-place leases, above-market leases and below-market ground leases) and liabilities (acquired below-market leases), net of accumulated amortization, were $310.1 million and $14.5 million, respectively, as of December 31, 2017, and $464.4 million and $16.8 million, respectively, as of December 31, 2016. The following table summarizes the Company’s lease intangible assets and liabilities (in thousands):
|
December 31, 2017 |
|
|
|
|
|
|
|
|
|
|
|
|
|
|
|
|
|
|
|
|
|
|
|
|
|
|
|
|
|
Gross |
|
|
Accumulated |
|
|
|
|
|
||
|
Lease Intangible Assets |
|
Asset |
|
|
Amortization |
|
|
Balance |
|
|||
|
In-place leases, net |
|
$ |
542,655 |
|
|
$ |
(249,569 |
) |
|
$ |
293,086 |
|
|
Below-market ground leases, net |
|
|
11,766 |
|
|
|
(508 |
) |
|
|
11,258 |
|
|
Above-market leases, net |
|
|
8,925 |
|
|
|
(3,171 |
) |
|
|
5,754 |
|
|
Total |
|
$ |
563,346 |
|
|
$ |
(253,248 |
) |
|
$ |
310,098 |
|
|
|
|
Gross |
|
|
Accumulated |
|
|
|
|
|
||
|
Lease Intangible Liabilities |
|
Liability |
|
|
Amortization |
|
|
Balance |
|
|||
|
Below-market leases, net |
|
$ |
19,658 |
|
|
$ |
(5,182 |
) |
|
$ |
14,476 |
|
|
Total |
|
$ |
19,658 |
|
|
$ |
(5,182 |
) |
|
$ |
14,476 |
|
|
December 31, 2016 |
|
|
|
|
|
|
|
|
|
|
|
|
|
|
|
|
|
|
|
|
|
|
|
|
|
|
|
|
|
Gross |
|
|
Accumulated |
|
|
|
|
|
||
|
Lease Intangible Assets |
|
Asset |
|
|
Amortization |
|
|
Balance |
|
|||
|
In-place leases, net |
|
$ |
592,871 |
|
|
$ |
(146,964 |
) |
|
$ |
445,907 |
|
|
Below-market ground leases, net |
|
|
11,766 |
|
|
|
(305 |
) |
|
|
11,461 |
|
|
Above-market leases, net |
|
|
8,964 |
|
|
|
(1,933 |
) |
|
|
7,031 |
|
|
Total |
|
$ |
613,601 |
|
|
$ |
(149,202 |
) |
|
$ |
464,399 |
|
|
|
|
Gross |
|
|
Accumulated |
|
|
|
|
|
||
|
Lease Intangible Liabilities |
|
Liability |
|
|
Amortization |
|
|
Balance |
|
|||
|
Below-market leases, net |
|
$ |
20,011 |
|
|
$ |
(3,184 |
) |
|
$ |
16,827 |
|
|
Total |
|
$ |
20,011 |
|
|
$ |
(3,184 |
) |
|
$ |
16,827 |
|
F-18
Amortization of acquired below-market leases, net of acquired above-market leases, resulted in additional rental income of $1.2 million, $0.9 million and $0.5 million for the year ended December 31, 2017, the year ended Decembe r 31, 2016 and the period from July 7, 2015 (Date Operations Commenced) to December 31, 2015, respectively. Estimated annual amortization of acquired below-market leases, net of acquired above-market leases, for each of the five succeeding years commencin g January 1, 2018 is as follows (in thousands):
Amortization of acquired below-market ground leases resulted in additional rent expense of $0.2 , $0.2 million and $0.1 million for the year ended December 31, 2017, the year ended December 31, 2016 and the period from July 7, 2015 (Date Operations Commenced) to December 31, 2015, respectively. Estimated annual amortization of acquired below-market ground leases for each of the five succeeding years commencing January 1, 2018 is as follows (in thousands):
Amortization of acquired in-place leases resulted in additional depreciation and amortization expense of $139.5 million, $110.2 million and $36.8 million for the year ended December 31, 2017, the year ended December 31, 2016 and the period from July 7, 2015 (Date Operations Commenced) to December 31, 2015, respectively. Estimated annual amortization of acquired in-place leases for each of the five succeeding years commencing January 1, 2018 is as follows (in thousands):
Note 4 – Investments in Unconsolidated Joint Ventures
The Company conducts a portion of its property rental activities through investments in unconsolidated joint ventures for which the Company holds less than a controlling interest. The Company’s partners in these unconsolidated joint ventures are unrelated real estate entities or commercial enterprises. The Company and its unconsolidated joint venture partners make initial and/or ongoing capital contributions to these unconsolidated joint ventures. The obligations to make capital contributions are governed by each unconsolidated joint venture’s respective operating agreement and related governing documents.
The Company currently has investments in four unconsolidated entities: (i) GS Portfolio Holdings II LLC (the “GGP I JV”), a joint venture between Seritage and a subsidiary of GGP Inc. (together with its subsidiaries, “GGP”); (ii) GS Portfolio Holdings (2017) LLC (the “GGP II JV” and, together with GGP I JV, the “GGP JVs”), a joint venture between Seritage and a subsidiary of GGP; (iii) SPS Portfolio Holdings II LLC (the “Simon JV”), a joint venture between Seritage and a subsidiary of Simon Property Group, Inc. (together with its subsidiaries, “Simon”); and (iv) MS Portfolio LLC (the “Macerich JV”), a joint venture between Seritage and a subsidiary of The Macerich Company (together with its subsidiaries, “Macerich”). A substantial majority of the space at the JV Properties is leased to Sears Holdings under the JV Master Leases which include recapture rights and termination rights with similar terms as those described under the Master Lease.
GGP Transactions
On July 12, 2017, the Company completed two transactions with GGP for gross consideration of $247.6 million whereby the Company (i) sold to GGP the Company’s 50% JV Interests in eight of the 12 assets in the GGP I JV for $190.1 million and recorded a gain of $43.7 million which is included in gain on sale of interest in unconsolidated joint venture within the consolidated statements of operations; and (ii) contributed five Wholly Owned Properties to the GGP II JV and sold a 50% interest in the new JV Properties to GGP for $57.5 million and recorded a gain of $11.5 million which is included in gain on sale of real estate within the consolidated statements of operations.
F-19
As a result of the transactions, the Company reduced amounts outstanding under its Mortgage Loans and Future Funding Facility by $50.6 million and received approximately $171.6 million of additional cash proceeds before closing costs, which it has used to fund the Company’s redevelopment pipeline and for general corporate purposes.
Simon Transaction
On November 3, 2017, the Company sold to Simon the its 50% JV Interests in five of the ten assets in the Simon JV for $68.0 million and recorded a gain of $16.6 million which is included in gain on sale of interest in unconsolidated joint venture within the consolidated statements of operations. Net proceeds from the sale have been used to fund the Company’s redevelopment pipeline and for general corporate purposes.
The Company’s investments in unconsolidated joint ventures at December 31, 2017, consisted of (in thousands, except number of properties):
|
|
|
Seritage % |
|
|
# of |
|
|
Total |
|
|
Contribution |
|
||||
|
Joint Venture |
|
Ownership |
|
|
Properties |
|
|
GLA |
|
|
Value (1) |
|
||||
|
GGP I JV |
|
|
50 |
% |
|
|
4 |
|
|
|
598 |
|
|
$ |
37,570 |
|
|
GGP II JV |
|
|
50 |
% |
|
|
5 |
|
|
|
1,187 |
|
|
|
57,500 |
|
|
Macerich JV |
|
|
50 |
% |
|
|
9 |
|
|
|
1,576 |
|
|
|
150,000 |
|
|
Simon JV |
|
|
50 |
% |
|
|
5 |
|
|
|
872 |
|
|
|
52,590 |
|
|
Total |
|
|
|
|
|
|
23 |
|
|
|
4,233 |
|
|
$ |
297,660 |
|
|
(1) |
Represents contribution value at formation of each JV. |
Each unconsolidated joint venture is obligated to prepare financial statements in accordance with GAAP. The Company generally shares in the profits and losses of these unconsolidated joint ventures in accordance with the Company’s respective equity interests. In some instances, the Company may recognize profits and losses related to investment in an unconsolidated joint venture that differ from the Company’s equity interest in the unconsolidated joint venture. This may arise from impairments that the Company recognizes related to its investment that differ from the impairments the unconsolidated joint venture recognizes with respect to its assets; differences between the Company’s basis in assets it has transferred to the unconsolidated joint venture and the unconsolidated joint venture’s basis in those assets; the Company’s deferral of the unconsolidated joint venture’s profits from land sales to the Company; or other items. There were no joint venture impairment charges during the years ended December 31, 2017 or December 31, 2016, or the period from July 7, 2015 (Date Operations Commenced) to December 31, 2015.
F-20
The foll owing tables presents combined condensed financial data for all of the Company’s unconsolidated joint ventures as of December 31, 2017 and December 31, 2016, and for the years ended December 31, 2017 and December 31, 2016, and the period from July 7, 2015 (Date Operations Commenced) to December 31, 2015:
|
|
|
December 31, 2017 |
|
|
December 31, 2016 |
|
||
|
ASSETS |
|
|
|
|
|
|
|
|
|
Investment in real estate |
|
|
|
|
|
|
|
|
|
Land |
|
$ |
191,853 |
|
|
$ |
214,109 |
|
|
Buildings and improvements |
|
|
388,363 |
|
|
|
598,978 |
|
|
Accumulated depreciation |
|
|
(48,306 |
) |
|
|
(56,324 |
) |
|
|
|
|
531,910 |
|
|
|
756,763 |
|
|
Construction in progress |
|
|
21,000 |
|
|
|
48,885 |
|
|
Net investment in real estate |
|
|
552,910 |
|
|
|
805,648 |
|
|
Cash and cash equivalents |
|
|
4,549 |
|
|
|
3,434 |
|
|
Tenant and other receivables, net |
|
|
3,843 |
|
|
|
6,133 |
|
|
Other assets, net |
|
|
45,605 |
|
|
|
38,646 |
|
|
Total assets |
|
$ |
606,907 |
|
|
$ |
853,861 |
|
|
LIABILITIES AND MEMBERS INTERESTS |
|
|
|
|
|
|
|
|
|
Liabilities |
|
|
|
|
|
|
|
|
|
Mortgage loans payable, net |
|
$ |
122,875 |
|
|
$ |
— |
|
|
Accounts payable, accrued expenses and other liabilities |
|
|
28,201 |
|
|
|
14,177 |
|
|
Total liabilities |
|
|
151,076 |
|
|
|
14,177 |
|
|
Members Interest |
|
|
|
|
|
|
|
|
|
Additional paid in capital |
|
|
473,098 |
|
|
|
830,389 |
|
|
Retained earnings |
|
|
(17,267 |
) |
|
|
9,295 |
|
|
Total members interest |
|
|
455,831 |
|
|
|
839,684 |
|
|
Total liabilities and members interest |
|
$ |
606,907 |
|
|
$ |
853,861 |
|
|
|
|
|
|
|
|
|
|
|
|
July 7, 2015 |
|
|
|
|
|
Year Ended December 31, |
|
|
(date operations commenced) to |
|
||||||
|
|
|
2017 |
|
|
2016 |
|
|
December 31, 2015 |
|
|||
|
EQUITY IN INCOME OF UNCONSOLIDATED JOINT VENTURES |
|
|
|
|
|
|
|
|
|
|
|
|
|
Total revenue |
|
$ |
58,264 |
|
|
$ |
66,417 |
|
|
$ |
35,150 |
|
|
Property operating expenses |
|
|
(11,358 |
) |
|
|
(12,787 |
) |
|
|
(7,339 |
) |
|
Depreciation and amortization |
|
|
(47,948 |
) |
|
|
(42,233 |
) |
|
|
(17,975 |
) |
|
Operating income |
|
|
(1,042 |
) |
|
|
11,397 |
|
|
|
9,836 |
|
|
Other expenses |
|
|
(14,533 |
) |
|
|
(2,105 |
) |
|
|
(292 |
) |
|
Net (loss) income |
|
$ |
(15,575 |
) |
|
$ |
9,292 |
|
|
$ |
9,544 |
|
|
Equity in (loss) income of unconsolidated joint ventures |
|
$ |
(7,788 |
) |
|
$ |
4,646 |
|
|
$ |
4,772 |
|
Note 5 – Leases
Master Lease
On July 7, 2015, subsidiaries of Seritage and subsidiaries of Sears Holdings entered into the Master Lease. The Master Lease generally is a triple net lease with respect to all space which is leased thereunder to Sears Holdings, subject to proportional sharing by Sears Holdings for repair and maintenance charges, real property taxes, insurance and other costs and expenses which are common to both the space leased by Sears Holdings and other space occupied by unrelated third-party tenants in the same or other buildings pursuant to third-party leases, space which is recaptured pursuant to the Company recapture rights described below and all other space which is constructed on the properties. Under the Master Lease, Sears Holdings and/or one or more of its subsidiaries will be required to make all expenditures reasonably necessary to maintain the premises in good appearance, repair and condition for as long as they lease the space.
F-21
The Master Lease has an initial term of 10 years and contains three options for five-year renewals of the term and a final option for a four-year renewal. As of December 31, 2017 and December 31, 2016, the annual base rent paid directly by Sears Holdings and its subsidiaries under the Master Leas e was approximately $93.3 million and $134.0 million, respectively. In each of the initial and first two renewal terms, annual base rent will be increased by 2.0% per annum for each lease year over the rent for the immediately preceding lease year. For s ubsequent renewal terms, rent will be set at the commencement of the renewal term at a fair market rent based on a customary third-party appraisal process, taking into account all the terms of the Master Lease and other relevant factors, but in no event wi ll the renewal rent be less than the rent payable in the immediately preceding lease year.
Revenues from the Master Lease for the years ended December 31, 2017 and December 31, 2016, and for the period from July 7, 2015 (Date Operations Commenced) through December 31, 2015 are as follows (in thousands and excluding straight-line rent of $0.8 million, $9.9 million and $5.6 million, respectively):
|
|
|
|
|
|
|
|
|
|
|
July 7, 2015 |
|
|
|
|
|
Year Ended December 31, |
|
|
(date operations commenced) to |
|
||||||
|
|
|
2017 |
|
|
2016 |
|
|
December 31, 2015 |
|
|||
|
Rental income |
|
$ |
112,881 |
|
|
$ |
133,237 |
|
|
$ |
64,838 |
|
|
Termination fee income |
|
|
19,315 |
|
|
|
— |
|
|
|
— |
|
|
Tenant reimbursements |
|
|
51,672 |
|
|
|
55,823 |
|
|
|
25,204 |
|
|
Total revenue |
|
$ |
183,868 |
|
|
$ |
189,060 |
|
|
$ |
90,042 |
|
The Master Lease provides the Company with the right to recapture up to approximately 50% of the space occupied by Sears Holdings at the 224 Wholly Owned Properties initially included in the Master Lease (subject to certain exceptions). While the Company will be permitted to exercise its recapture rights all at once or in stages as to any particular property, it will not be permitted to recapture all or substantially all of the space subject to the recapture right at more than 50 Wholly Owned Properties during any lease year. In addition, Seritage has the right to recapture any automotive care centers which are free-standing or attached as “appendages” to the properties, all outparcels or outlots and certain portions of the parking areas and common areas. Upon exercise of these recapture rights, the Company will generally incur certain costs and expenses for the separation of the recaptured space from the remaining Sears Holdings space and can reconfigure and rent the recaptured space to third-party tenants.
The Company also has the right to recapture 100% of the space occupied by Sears Holdings at each of 21 identified Wholly Owned Properties by making a specified lease termination payment to Sears Holdings, after which the Company can reposition and re-lease those stores. The lease termination payment is calculated as the greater of an amount specified at the time the Company entered into the Master Lease with Sears Holdings and an amount equal to 10 times the adjusted EBITDA attributable to such space within the Sears Holdings main store which is not attributable to the space subject to the separate 50% recapture right discussed above for the 12-month period ending at the end of the fiscal quarter ending immediately prior to recapturing such space.
F-22
As of December 31, 2017, the Company had exercised certain recapture rights with respect to 56 properties as follows:
|
Property |
|
Recapture Type |
|
|
Notice Date(s) |
|
Anchorage, AK |
|
100% |
|
|
December 2017 |
|
Boca Raton, FL |
|
100% |
|
|
December 2017 |
|
Westminster, CA |
|
100% |
|
|
December 2017 |
|
Hicksville, NY |
|
100% |
|
|
December 2017 |
|
Orland Park, IL |
|
100% (1) |
|
|
December 2017 |
|
Florissant, MO |
|
Out parcel |
|
|
December 2017 |
|
Salem, NH |
|
Out parcel |
|
|
December 2017 |
|
Fairfield, CA |
|
Partial |
|
|
December 2017 |
|
Las Vegas, NV |
|
Partial |
|
|
December 2017 |
|
Plantation, FL |
|
Partial |
|
|
December 2017 |
|
Yorktown Heights |
|
Partial |
|
|
December 2017 |
|
Austin, TX |
|
100% (1) |
|
|
December 2017 / September2017 |
|
North Little Rock, AR |
|
Auto Center |
|
|
September 2017 |
|
Ft. Wayne, IN |
|
Out parcel |
|
|
September 2017 |
|
St. Clair Shores, MI |
|
100% |
|
|
September 2017 |
|
Redmond, WA |
|
Auto Center |
|
|
September 2017 |
|
Temecula, CA |
|
Partial |
|
|
June 2017 |
|
Roseville, CA |
|
Auto center |
|
|
June 2017 |
|
North Riverside, IL |
|
Partial |
|
|
June 2017 |
|
Watchung, NJ |
|
100% |
|
|
June 2017 |
|
Canton, OH |
|
Partial |
|
|
June 2017 |
|
Dayton, OH |
|
Auto center |
|
|
June 2017 |
|
Carson, CA |
|
100% (1) |
|
|
April 2017 / December 2016 |
|
San Diego, CA |
|
100% (1) |
|
|
April 2017 |
|
Aventura, FL |
|
100% |
|
|
April 2017 |
|
Hialeah, FL |
|
100% (1) |
|
|
April 2017 |
|
Anderson, SC |
|
100% (1) |
|
|
April 2017 / July 2016 |
|
Charleston, SC |
|
100% (1) |
|
|
April 2017 / October 2016 |
|
Valley View, TX |
|
100% |
|
|
April 2017 |
|
North Miami, FL |
|
100% |
|
|
March 2017 |
|
Cockeysville, MD |
|
Partial |
|
|
March 2017 |
|
Olean, NY |
|
Partial |
|
|
March 2017 |
|
Santa Cruz, CA |
|
Partial |
|
|
December 2016 |
|
Santa Monica, CA |
|
100% |
|
|
December 2016 |
|
Saugus, MA |
|
Partial |
|
|
December 2016 |
|
Guaynabo, PR |
|
Partial |
|
|
December 2016 |
|
Roseville, MI |
|
Partial |
|
|
November 2016 |
|
Troy, MI |
|
Partial |
|
|
November 2016 |
|
West Hartford, CT |
|
100% |
|
|
October 2016 |
|
Rehoboth Beach, DE |
|
Partial |
|
|
October 2016 |
|
St. Petersburg, FL |
|
100% |
|
|
October 2016 |
|
Warwick, RI |
|
Auto center |
|
|
October 2016 |
|
North Hollywood, CA |
|
Partial |
|
|
July 2016 |
|
Orlando, FL |
|
100% |
|
|
July 2016 |
|
Ft. Wayne, IN |
|
Out parcel |
|
|
July 2016 |
|
West Jordan, UT |
|
Partial + auto center |
|
|
July 2016 |
|
Madison, WI |
|
Partial |
|
|
July 2016 |
|
Bowie, MD |
|
Auto center |
|
|
May 2016 |
|
Hagerstown, MD |
|
Auto center |
|
|
May 2016 |
|
Wayne, NJ (2) |
|
Partial + auto center |
|
|
May 2016 |
|
Albany, NY |
|
Auto center |
|
|
May 2016 |
|
Fairfax, VA |
|
Partial + auto center |
|
|
May 2016 |
|
San Antonio, TX |
|
Auto center |
|
|
March 2016 |
|
Honolulu, HI |
|
100% |
|
|
December 2015 |
|
Memphis, TN |
|
100% |
|
|
December 2015 |
|
Braintree, MA |
|
100% |
|
|
November 2015 |
|
(1) |
In 2017, the Company converted partial recapture rights to 100% recapture rights and exercised such recapture rights. |
|
(2) |
In 2017, the Company contributed this asset to the GGP II JV and retained a 50% ownership interest. |
The Master Lease also provides for certain rights to Sears Holdings to terminate the Master Lease with respect to Wholly Owned Properties that cease to be profitable for operation by Sears Holdings. In order to terminate the Master Lease with respect to a certain
F-23
property, Sears Holdings must make a payment to the Company of an amount equal to one year of rent (together with taxes and other expenses) with respect to such property. Sears Holdings must provide notice of not less than 90 days of their intent to exercise such termination right and such termination right will be limited so that it will not have the effect of reducing the fixed rent under the Master Lease by more than 20% per annum.
As of December 31, 2017, Sears Holdings had terminated the Master Lease with respect to 56 stores totaling 7.4 million square feet of gross leasable area. The aggregate annual base rent at these stores was approximately $23.6 million. Sears Holdings continued to pay the Company rent until it vacated the stores and also paid aggregate termination fees of approximately $45.1 million, an amount equal to one year of aggregate annual base rent plus one year of estimated real estate taxes and operating expenses.
F-24
As of December 31, 2017, the Company had announced redevelopme nt projects at 18 of the terminated properties and will continue to announce redevelopment activity as new leases are signed to occupy the space formerly occupied by Sears Holdings.
|
|
|
|
|
|
|
|
|
|
|
Announced |
|
Property |
|
Square Feet |
|
|
Notice |
|
Termination |
|
Redevelopment |
|
|
Cullman, AL |
|
|
98,500 |
|
|
September 2016 |
|
January 2017 |
|
Q2 2017 |
|
Sierra Vista, AZ |
|
|
86,100 |
|
|
September 2016 |
|
January 2017 |
|
|
|
Thornton, CO |
|
|
190,200 |
|
|
September 2016 |
|
January 2017 |
|
Q1 2017 |
|
Chicago, IL |
|
|
118,800 |
|
|
September 2016 |
|
January 2017 |
|
|
|
Springfield, IL |
|
|
84,200 |
|
|
September 2016 |
|
January 2017 |
|
Q3 2016 |
|
Elkhart, IN |
|
|
86,500 |
|
|
September 2016 |
|
January 2017 |
|
Q4 2016 |
|
Merrillville, IN |
|
|
108,300 |
|
|
September 2016 |
|
January 2017 |
|
Q4 2016 |
|
Houma, LA |
|
|
96,700 |
|
|
September 2016 |
|
January 2017 |
|
|
|
New Iberia, LA |
|
|
91,700 |
|
|
September 2016 |
|
January 2017 |
|
Q2 2017 |
|
Alpena, MI |
|
|
118,200 |
|
|
September 2016 |
|
January 2017 |
|
|
|
Manistee, MI |
|
|
87,800 |
|
|
September 2016 |
|
January 2017 |
|
|
|
Sault Sainte Marie, MI |
|
|
92,700 |
|
|
September 2016 |
|
January 2017 |
|
|
|
Kearney, NE |
|
|
86,500 |
|
|
September 2016 |
|
January 2017 |
|
Q3 2016 |
|
Deming, NM |
|
|
96,600 |
|
|
September 2016 |
|
January 2017 |
|
|
|
Harlingen, TX |
|
|
91,700 |
|
|
September 2016 |
|
January 2017 |
|
|
|
Yakima, WA |
|
|
97,300 |
|
|
September 2016 |
|
January 2017 |
|
|
|
Riverton, WY |
|
|
94,800 |
|
|
September 2016 |
|
January 2017 |
|
|
|
Riverside, CA |
|
|
94,500 |
|
|
January 2017 |
|
April 2017 |
|
|
|
Kissimmee, FL |
|
|
112,505 |
|
|
January 2017 |
|
April 2017 |
|
|
|
Leavenworth, KS |
|
|
76,853 |
|
|
January 2017 |
|
April 2017 |
|
|
|
Hopkinsville, KY |
|
|
70,326 |
|
|
January 2017 |
|
April 2017 |
|
|
|
Paducah, KY |
|
|
108,244 |
|
|
January 2017 |
|
April 2017 |
|
Q3 2017 |
|
Owensboro, KY |
|
|
68,334 |
|
|
January 2017 |
|
April 2017 |
|
|
|
Detroit Lakes, MN |
|
|
79,102 |
|
|
January 2017 |
|
April 2017 |
|
|
|
Jefferson City, MO |
|
|
92,016 |
|
|
January 2017 |
|
April 2017 |
|
Q2 2017 |
|
Henderson, NV |
|
|
122,823 |
|
|
January 2017 |
|
April 2017 |
|
Q1 2017 |
|
Concord, NC |
|
|
137,499 |
|
|
January 2017 |
|
April 2017 |
|
|
|
Chapel Hill, OH |
|
|
187,179 |
|
|
January 2017 |
|
April 2017 |
|
|
|
Kenton, OH |
|
|
96,066 |
|
|
January 2017 |
|
April 2017 |
|
|
|
Muskogee, OK |
|
|
87,500 |
|
|
January 2017 |
|
April 2017 |
|
|
|
Mount Pleasant, PA |
|
|
83,536 |
|
|
January 2017 |
|
April 2017 |
|
|
|
Sioux Falls, SD |
|
|
72,511 |
|
|
January 2017 |
|
April 2017 |
|
|
|
El Paso, TX |
|
|
103,657 |
|
|
January 2017 |
|
April 2017 |
|
|
|
Layton, UT |
|
|
90,010 |
|
|
January 2017 |
|
April 2017 |
|
|
|
Elkins, WV |
|
|
94,885 |
|
|
January 2017 |
|
April 2017 |
|
|
|
Platteville, WI |
|
|
94,841 |
|
|
January 2017 |
|
April 2017 |
|
|
|
Sarasota, FL |
|
|
204,500 |
|
|
June 2017 |
|
October 2017 |
|
|
|
Chicago, IL |
|
|
293,700 |
|
|
June 2017 |
|
October 2017 |
|
|
|
Overland Park, KS |
|
|
215,000 |
|
|
June 2017 |
|
October 2017 |
|
|
|
Lafayette, LA |
|
|
194,900 |
|
|
June 2017 |
|
October 2017 |
|
|
|
Cockeysville, MD |
|
|
83,900 |
|
|
June 2017 |
|
October 2017 |
|
Q1 2017 |
|
Hagerstown, MD |
|
|
107,300 |
|
|
June 2017 |
|
October 2017 |
|
Q1 2016 |
|
Roseville, MI |
|
|
277,000 |
|
|
June 2017 |
|
October 2017 |
|
Q3 2016 |
|
Burnsville, MN |
|
|
161,700 |
|
|
June 2017 |
|
October 2017 |
|
|
|
Albany, NY |
|
|
216,200 |
|
|
June 2017 |
|
October 2017 |
|
Q1 2016 |
|
East Northport, NY |
|
|
187,000 |
|
|
June 2017 |
|
October 2017 |
|
Q2 2017 |
|
Johnson City, NY |
|
|
155,100 |
|
|
June 2017 |
|
October 2017 |
|
|
|
Olean, NY |
|
|
75,100 |
|
|
June 2017 |
|
October 2017 |
|
Q1 2017 |
|
Mentor, OH |
|
|
208,700 |
|
|
June 2017 |
|
October 2017 |
|
|
|
Middleburg Heights, OH |
|
|
351,600 |
|
|
June 2017 |
|
October 2017 |
|
|
|
Toledo, OH |
|
|
209,900 |
|
|
June 2017 |
|
October 2017 |
|
|
|
York, PA |
|
|
82,000 |
|
|
June 2017 |
|
October 2017 |
|
|
|
Warwick, RI |
|
|
169,200 |
|
|
June 2017 |
|
October 2017 |
|
Q3 2016 / Q3 2017 |
|
Greendale, WI |
|
|
238,400 |
|
|
June 2017 |
|
October 2017 |
|
Q4 2017 |
|
Friendswood, TX (1) |
|
|
166,000 |
|
|
June 2017 |
|
November 2017 |
|
|
|
Westwood, TX (1) |
|
|
215,000 |
|
|
June 2017 |
|
January 2018 |
|
|
|
Total square feet |
|
|
7,411,187 |
|
|
|
|
|
|
|
|
(1) |
The Company and Sears Holdings agreed to extend occupancy beyond October 2017 under the existing Master Lease terms. |
F-25
The Company generally leases space to tenants under non-cancelable operating leases. The leases typically provide for the payment of fixed base rents, as well as reimbursements of real estate taxes, insurance, maintenance and other costs. Certain leases also provide for the payment by the lessee of additional rents based on a percentage of their sales.
As of December 31, 2017, future base rental revenue under non-cancelable operating leases, excluding extension options and signed leases for which rental payments have not yet commenced, is as follows (in thousands):
|
Year ending December 31, |
|
|
|
|
|
2018 |
|
$ |
138,488 |
|
|
2019 |
|
|
141,216 |
|
|
2020 |
|
|
139,516 |
|
|
2021 |
|
|
140,120 |
|
|
2022 |
|
|
140,086 |
|
|
Thereafter |
|
|
465,736 |
|
|
|
|
$ |
1,165,162 |
|
These future minimum amounts do not include tenant reimbursement income or additional rents based on a percentage of tenants’ sales. For the year ended December 31, 2017, the Company recognized $62.5 million of tenant reimbursement income, as well as approximately $0.5 million of additional rent based on a percentage of tenants’ sales which was included in rental income. For the year ended December 31, 2016, the Company recognized $62.3 million of tenant reimbursement income, as well as approximately $0.1 million of additional rent based on a percentage of tenants’ sales which was included in rental income.
As Lessee
The Company recorded rent expense related to leased corporate office space of $0.7 million, $0.6 million and $0.6 million for the year ended December 31, 2017, the year ended December 31, 2016 and the period from July 7, 2015 (Date Operations Commenced) to December 31, 2015. Such rent expense is classified within general and administrative expenses on the consolidated statements of operations.
In addition, in connection with the Transaction, the Company acquired a ground lease for one property. The Company recorded ground rent expense of approximately $50 thousand, $50 thousand and $25 thousand for the year ended December 31, 2017, the year ended December 31, 2016 and the period from July 7, 2015 (Date Operations Commenced) to December 31, 2015. Such ground rent expense is classified within property operating expenses on the consolidated statements of operations. The ground lease requires the Company to make fixed annual rental payments and expires in 2073 assuming all extension options are exercised.
Note 6 – Debt
Mortgage Loans Payable
On July 7, 2015, pursuant to the Transaction, the Company entered into a mortgage loan agreement (the “Mortgage Loan Agreement”) and mezzanine loan agreement (collectively, the “Loan Agreements”), providing for term loans in an initial principal amount of approximately $1,161 million (collectively, the “Mortgage Loans”) and a $100 million future funding facility (the “Future Funding Facility”). Pursuant to the terms of the Loan Agreements, amounts available under the Future Funding Facility were fully drawn by the Company on June 30, 2017. Such amounts were deposited into a redevelopment reserve and used to fund redevelopment activity at the Company’s properties.
On July 12, 2017, as a result of the transaction whereby the Company contributed five Wholly Owned Properties to the GGP II JV and sold a 50% interest in the new JV Properties to GGP for $57.5 million, the Company reduced amounts outstanding under its Mortgage Loans and Future Funding Facility by $50.6 million.
As of December 31, 2017, the aggregate principal amount outstanding under the Mortgage Loans and the Future Funding Facility was $1,211 million.
Interest under the Mortgage Loans and Future Funding Facility is due and payable on the payment dates, and all outstanding principal amounts are due when the loan matures on the payment date in July 2019, pursuant to the Loan Agreements. The Company has two one-year extension options subject to the payment of an extension fee and satisfaction of certain other conditions. Borrowings under the Mortgage Loans and Future Funding Facility bear interest at the London Interbank Offered Rates (“LIBOR”) plus, as of December 31, 2017, a weighted-average spread of 470 basis points; payments are made monthly on an interest-only basis. The weighted-average
F-26
interest rates for the Mortgage Loans and Future Funding Facility for the years ended December 31, 2017 and December 31, 2016 were 6.03 % and 5.24 %, respectively.
The Loan Agreements contain a yield maintenance provision for the early extinguishment of the debt before March 9, 2018.
The Mortgage Loans and Future Funding Facility are secured by all of the Company’s Wholly Owned Properties and a pledge of its equity in the JVs. The Loan Agreements contain customary covenants for a real estate financing, including restrictions that limit the Company’s ability to grant liens on its assets, incur additional indebtedness, or transfer or sell assets, as well as those that may require the Company to obtain lender approval for certain major tenant leases or significant redevelopment projects. Such restrictions also include cash flow sweep provisions based upon certain measures of the Company’s and Sears Holdings’ financial and operating performance, including (a) where the “Debt Yield” (the ratio of net operating income for the mortgage borrowers to their debt) is less than 11.0%, (b) if the performance of Sears Holdings at the stores subject to the Master Lease with Sears Holdings fails to meet specified rent ratio thresholds, (c) if the Company fails to meet specified tenant diversification tests and (d) upon the occurrence of a bankruptcy or insolvency action with respect to Sears Holdings or if there is a payment default under the Master Lease with Sears Holdings, in each case, subject to cure rights, including providing specified amounts of cash collateral or satisfying tenant diversification thresholds.
In November 2016, the Company and the servicer for its Mortgage Loans entered into amendments to the Loan Agreements to resolve a disagreement regarding one of the cash flow sweep provisions in the Loan Agreements. The principal terms of these amendments are that the Company (i) posted $30.0 million, and will post $3.3 million on a monthly basis, to a redevelopment project reserve account, which amounts may be used by the Company to fund redevelopment activity and (ii) extended the spread maintenance provision for prepayment of the loan by two months through March 9, 2018 (with the spread maintenance premium for the second month at a reduced amount). As a result of this agreement and the resolution of the related disagreement, no cash flow sweep was imposed.
All obligations under the Loan Agreements are non-recourse to the borrowers and the pledgors of the JV Interests and the guarantors thereunder, except that (i) the borrowers and the guarantors will be liable, on a joint and several basis, for losses incurred by the lenders in respect of certain matters customary for commercial real estate loans, including misappropriation of funds and certain environmental liabilities and (ii) the indebtedness under the Loan Agreements will be fully recourse to the borrowers and guarantors upon the occurrence of certain events customary for commercial real estate loans, including without limitation prohibited transfers, prohibited voluntary liens, and bankruptcy. Additionally, the guarantors delivered a limited completion guaranty with respect to future redevelopments undertaken by the borrowers at the properties, and the Company must maintain (i) a net worth of not less than $1.0 billion and (ii) a minimum liquidity of not less than $50.0 million, throughout the term of the Loan Agreements.
The Company believes it is currently in compliance with all material terms and conditions of the Loan Agreements.
The Company incurred $22.3 million of debt issuance costs related to the Mortgage Loans and Future Funding Facility which are recorded as a direct deduction from the carrying amount of the Mortgage Loans and Future Funding Facility and amortized over the term of the Loan Agreements. As of December 31, 2017, the unamortized balance of the Company’s debt issuance costs was $8.5 million as compared to $14.3 million as December 31, 2016.
Unsecured Term Loan
On February 23, 2017, the Operating Partnership, as borrower, and the Company, as guarantor, entered into a $200 million senior unsecured delayed draw term loan facility (the “Unsecured Delayed Draw Term Loan”) with JPP, LLC and JPP II, LLC as lenders (collectively, the “Original Lenders”) and JPP, LLC as administrative agent.
The total commitment of the Lenders under the Unsecured Delayed Draw Term Loan was $200 million and the maturity date was December 31, 2017.
The principal amount of loans outstanding under the Unsecured Delayed Draw Term Loan bore a base annual interest rate of 6.50%. If a cash flow sweep period were to have occurred and been continuing under the Company’s Mortgage Loan Agreement (i) the interest rate on any outstanding advances would have increased from and after such date by 1.5% per annum above the base interest rate and (ii) the interest rate on any advances made after such date would have increased by 3.5% per annum above the base interest rate. Accrued and unpaid interest was payable in cash, except that during the continuance of a cash flow sweep period under the Company’s Mortgage Loan Agreement, the Operating Partnership could elect to defer the payment of interest which deferred amount would be added to the outstanding principal balance of the loans.
On February 23, 2017, the Operating Partnership paid to the Original Lenders an upfront commitment fee equal to $1.0 million. On May 24, 2017, the Operating Partnership paid to the Original Lenders an additional, and final, commitment fee of $1.0 million.
F-27
The Unsecured Delayed Draw Term Loan required that the Company at all times maint ain (i) a net worth of not less than $1.0 billion, and (ii) a leverage ratio not to exceed 60.0%.
The Unsecured Delayed Draw Term Loan included customary representations and warranties, covenants and indemnities. The Unsecured Delayed Draw Term Loan also had customary events of default, including (subject to certain materiality thresholds and grace periods) payment default, failure to comply with covenants, material inaccuracy of representation or warranty, and bankruptcy or insolvency proceedings. If there was an event of default, the Lenders could declare all or any portion of the outstanding indebtedness to be immediately due and payable, exercise any rights they might have under any of the Unsecured Delayed Draw Term Loan documents, and require the Operating Partnership to pay a default interest rate on overdue amounts equal to 1.50% in excess of the applicable base interest rate.
Mr. Edward S. Lampert, the Company’s Chairman, is the Chairman and Chief Executive Officer of ESL, which controls JPP, LLC and JPP II, LLC. The terms of the Unsecured Delayed Draw Term Loan were approved by the Company’s Audit Committee and the Company’s Board of Trustees (with Mr. Edward S. Lampert recusing himself).
On December 27, 2017, the Operating Partnership, as borrower, and the Company, as guarantor, refinanced the Unsecured Delayed Draw Term Loan with a new $200 million unsecured term loan facility (the “Unsecured Term Loan”). The principal amount outstanding under the Unsecured Delayed Draw Term Loan at termination was $85 million. No prepayment penalties were triggered and the Unsecured Delayed Draw Term Loan terminated in accordance with its terms.
The lenders under the Unsecured Delayed Draw Term Loan, JPP, LLC and JPP II, LLC, maintained their funding of $85 million in the Unsecured Term Loan, with JPP, LLC appointed as administrative agent under the Unsecured Term Loan. An affiliate of Empyrean Capital Partners, L.P., a Delaware limited partnership (and together with JPP, LLC and JPP II LLC, each an “Initial Lender” and collectively, the “Initial Lenders”), funded $60 million under the Unsecured Term Loan, resulting in a total of $145 million committed and funded under the Unsecured Term Loan at closing. Under an accordion feature, the Company has the right to increase the total commitments up to $200 million and place an additional $55 million of incremental loans with the Initial Lenders or new lenders. The Initial Lenders under the Unsecured Term Loan are not obligated to make all or any portion of the incremental loans.
The Company used the proceeds of the Unsecured Term Loan, among other things, to refinance the Unsecured Delayed Draw Term Loan, to fund redevelopment projects and for other general corporate purposes. Loans under the Unsecured Term Loan are guaranteed by the Company.
The Unsecured Term Loan matures on the earlier of (i) December 31, 2018 and (ii) the date on which the outstanding indebtedness under the Company’s existing mortgage and mezzanine facilities are repaid in full. The Unsecured Term Loan may be prepaid at any time in whole or in part, without any penalty or premium. Amounts drawn under the Unsecured Term Loan and repaid may not be redrawn.
The principal amount of loans outstanding under the Unsecured Term Loan bears a base annual interest rate of 6.75%. Accrued and unpaid interest is payable in cash.
On December 27, 2017, the Borrower paid to each Initial Lender an upfront fee in an aggregate amount equal to 1.00% of the principal amount of the loan made by such Initial Lender.
The Unsecured Term Loan requires that the Company at all times maintain (i) a net worth of not less than $1.0 billion, and (ii) a leverage ratio not to exceed 60.0%.
The Unsecured Term Loan includes customary representations and warranties, covenants and indemnities. The Unsecured Term Loan also has customary events of default, including (subject to certain materiality thresholds and grace periods) payment default, failure to comply with covenants, material inaccuracy of representations or warranties, and bankruptcy or insolvency proceedings. If there is an event of default, the lenders may declare all or any portion of the outstanding indebtedness to be immediately due and payable, exercise any rights they might have under any of the Unsecured Term Loan documents, and require the Borrower to pay a default interest rate on overdue amounts equal to 1.50% in excess of the then applicable interest rate.
The Company believes it is currently in compliance with all material terms and conditions of the Unsecured Term Loan.
The Company incurred $1.5 million of debt issuance costs related to the Unsecured Term Loan which are recorded as a direct deduction from the carrying amount of the Unsecured Term Loan and amortized over the term of the loan. As of December 31, 2017, the unamortized balance of the Company’s debt issuance costs was $1.5 million.
F-28
Mr. Edward S. Lampert, the Company’s Chairman, is the sole stockholder, chief executive officer and director of ESL Investments, Inc., which controls JPP, LLC and JPP II, LL C. The terms of the Unsecured Term Loan were approved by the Company’s Audit Committee and the Company’s Board of Trustees (with Mr. Edward S. Lampert recusing himself).
Note 7 – Income Taxes
The Company has elected to be taxed as a REIT as defined under Section 856(c) of the Code for U.S. federal income tax purposes and expects to continue to operate to qualify as a REIT. To qualify as a REIT, the Company must meet a number of organizational and operational requirements, including a requirement to currently distribute at least 90% of its adjusted REIT taxable income to its shareholders.
As a REIT, the Company generally will not be subject to U.S. federal income tax on taxable income that is distributed to its shareholders. If the Company fails to qualify as a REIT or does not distribute 100% of its taxable income in any taxable year, it will be subject to federal taxes at regular corporate rates (including for any taxable year ended on or before December 31, 2017, any applicable alternative minimum tax) and may not be able to qualify as a REIT for four subsequent taxable years.
Even if the Company qualifies for taxation as a REIT, the Company is subject to certain state, local and Puerto Rico taxes on its income and property, and to federal income and excise taxes on its undistributed taxable income.
The Company evaluated whether any uncertain tax provisions exist as of December 31, 2017 and December 31, 2016 and concluded that there are no uncertain tax positions.
On December 22, 2017, H.R. 1, known as the Tax Cuts and Jobs Act (the “TCJA”) was signed into law and included wide-scale changes to individual, pass-through and corporation tax laws, including those that impact the real estate industry, the ownership of real estate and real estate investments, and REITs. We have reviewed the provisions of the law that pertain to the Company and have determined them to have no material income tax effect for financial statement purposes for the year ended December 31, 2017.
Note 8 – Fair Value Measurements
ASC 820, Fair Value Measurement , defines fair value and establishes a framework for measuring fair value. The objective of fair value is to determine the price that would be received upon the sale of an asset or paid to transfer a liability in an orderly transaction between market participants at the measurement date (the exit price). ASC 820 establishes a fair value hierarchy that prioritizes observable and unobservable inputs used to measure fair value into three levels:
Level 1 - quoted prices (unadjusted) in active markets that are accessible at the measurement date for assets or liabilities
Level 2 - observable prices based on inputs not quoted in active markets, but corroborated by market data
Level 3 - unobservable inputs used when little or no market data is available
The fair value hierarchy gives the highest priority to Level 1 inputs and the lowest priority to Level 3 inputs. In determining fair value, the Company utilizes valuation techniques that maximize the use of observable inputs and minimize the use of unobservable inputs to the extent possible as well as consider counterparty credit risk in its assessment of fair value.
Financial Assets and Liabilities Measured at Fair Value on a Recurring or Non-Recurring Basis
All derivative instruments are carried at fair value and are valued using Level 2 inputs. The Company’s derivative instruments as of December 31, 2017 and December 31, 2016 included an interest rate cap. The Company utilizes an independent third party and interest rate market pricing models to assist management in determining the fair value of this instrument.
The fair value of the Company’s interest rate cap at December 31, 2017 and December 31, 2016 was less than $0.1 million and approximately $0.7 million, respectively, and is included as a component of prepaid expenses, deferred expenses and other assets on the consolidated balance sheets. The Company has elected not to utilize hedge accounting and therefore the change in fair value is included within change in fair value of interest rate cap in the consolidated statements of operations. For the year ended December 31, 2017, the Company recorded an unrealized loss of $0.7 million related to the change in fair value of the interest rate cap as compared to an unrealized loss of $1.4 million for the year ended December 31, 2016.
F-29
Financial Assets and Liabilities not Measured at Fair Value
Financial assets and liabilities that are not measured at fair value on the consolidated balance sheets include cash equivalents and mortgage loans payable. The fair value of cash equivalents is classified as Level 1 and the fair value of mortgage loans payable is classified as Level 2.
Cash equivalents are carried at cost, which approximates fair value. The fair value of mortgages payable is calculated by discounting the future contractual cash flows of these instruments using current risk-adjusted rates available to borrowers with similar credit ratings. As of December 31, 2017 and December 31, 2016, the estimated fair value of the Company’s debt was $1.36 billion and $1.15 billion, respectively, which approximated the carrying value at such dates as the current risk-adjusted rate approximates the stated rates on the Company’s mortgage debt.
Note 9 – Commitments and Contingencies
Insurance
The Company maintains general liability insurance and all-risk property and rental value, with sub-limits for certain perils such as floods and earthquakes on each of the Company’s properties. The Company also maintains coverage for terrorism acts as defined by Terrorism Risk Insurance Program Reauthorization Act, which expires in December 2020.
Insurance premiums are charged directly to each of the retail properties. The Company will be responsible for deductibles and losses in excess of insurance coverage, which could be material. The Company continues to monitor the state of the insurance market and the scope and costs of coverage for acts of terrorism. However, the Company cannot anticipate what coverage will be available on commercially reasonable terms in the future.
Environmental Matters
Under various federal, state and local laws, ordinances and regulations, the Company may be considered an owner or operator of real property or may have arranged for the disposal or treatment of hazardous or toxic substances. As a result, the Company may be liable for certain costs including removal, remediation, government fines and injuries to persons and property. The Company does not believe that any resulting liability from such matters will have a material effect on the consolidated financial position, results of operations or liquidity of the Company. Under the Master Lease, Sears Holdings has indemnified the Company from certain environmental liabilities at the Wholly Owned Properties existing before, or caused by Sears Holdings during, the period in which each Wholly Owned Property is leased to Sears Holdings, including removal and remediation of all affected facilities and equipment constituting the automotive care center facilities (and each JV Master Lease includes a similar requirement of Sears Holdings). As of December 31, 2017 and December 31, 2016, the Company had approximately $10.8 million and $11.8 million, respectively, of restricted cash in a lender reserve account to fund potential environmental costs that were identified during due diligence related to the Transaction.
Litigation and Other Matters
In accordance with accounting standards regarding loss contingencies, the Company accrues an undiscounted liability for those contingencies where the incurrence of a loss is probable and the amount can be reasonably estimated, and the Company discloses the amount accrued and the amount of a reasonably possible loss in excess of the amount accrued or disclose the fact that such a range of loss cannot be estimated. The Company does not record liabilities when the likelihood that the liability has been incurred is probable but the amount cannot be reasonably estimated, or when the liability is believed to be only reasonably possible or remote. In such cases, the Company discloses the nature of the contingency, and an estimate of the possible loss, range of loss, or disclose the fact that an estimate cannot be made.
The Company is subject, from time to time, to various legal proceedings and claims that arise in the ordinary course of business. While the resolution of such matters cannot be predicted with certainty, management believes, based on currently available information, that the final outcome of such matters will not have a material effect on the consolidated financial position, results of operations, cash flows or liquidity of the Company.
In May and June of 2015, four purported Sears Holdings shareholders filed lawsuits in the Delaware Court of Chancery challenging the Transaction, which lawsuits were subsequently consolidated into a single action captioned In re Sears Holdings Corporation Stockholder and Derivative Litigation , Consol. C.A. No. 11081-VCL (the “Action”). On October 15, 2015, plaintiffs filed a verified consolidated stockholder derivative complaint in the Action against the individual members of Sears Holdings’ Board of Directors, ESL Investments, Inc. (together with its affiliates, “ESL”), Sears Holdings’ CEO, Fairholme Capital Management L.L.C. (“FCM”), and Seritage. On July 12, 2016, the plaintiffs filed a verified consolidated amended stockholder derivative complaint (the “Amended Complaint”) against the same defendants and asserting substantially the same claims as set forth in the complaint filed in October 2015. The plaintiffs brought the Action derivatively on behalf of Sears Holdings, which was named as a nominal defendant, and
F-30
alleged that the Sears Holdings directors, as well as ESL and Edwards S. Lampert (in their capacity as the alleged controlling stockholder of Sears Holdings), brea ched their fiduciary duties to Sears Holdings shareholders by selling the Wholly Owned Properties to Seritage at a price that was unfairly low and was the result of a process that allegedly was flawed. The Amended Complaint also alleged that Seritage and FCM aided and abetted these alleged fiduciary breaches. Among other forms of relief, the Amended Complaint sought damages in unspecified amounts. In October 2016, following mediation, the parties reached an agreement-in-principle to settle the Action, wh ich ultimately was reflected in a definitive Stipulation and Agreement of Settlement, Compromise and Release executed on February 8, 2017. On May 9, 2017, the Delaware Court of Chancery, after customary notice to Sears Holding stockholders and an in-perso n settlement hearing, entered a final order and judgment approving the settlement. Pursuant to the settlement, (a) the defendants and the D&O insurers for the individual members of the Sears Holdings’ Board of Directors paid $40.0 million, of which Serita ge paid $19.0 million and (b) all defendants received customary releases. The defendants continue to deny the claims asserted and entered into the settlement solely to avoid the burden, expense, distraction, and inherent risk in and of litigation.
Note 10 – Related Party Disclosure
Edward S. Lampert
Edward S. Lampert is Chairman and Chief Executive Officer of Sears Holdings and is the Chairman and Chief Executive Officer of ESL. ESL beneficially owned approximately 54.0% and 53.2% of Sears Holdings’ outstanding common stock at December 31, 2017 and December 31, 2016, respectively. Mr. Lampert is also the Chairman of Seritage.
As of December 31, 2017, ESL held an approximately 36.2% interest in Operating Partnership and approximately 2.9% and 100% of the outstanding Class A common shares and Class B non-economic common shares, respectively. As of December 31, 2016, ESL held an approximately 43.3% interest in Operating Partnership and approximately 3.7% and 100% of the outstanding Class A common shares and Class B non-economic common shares, respectively
Unsecured Term Loan
On December 27, 2017, the Operating Partnership, as borrower, and the Company , as guarantor, refinanced its Unsecured Delayed Draw Term Loan with a new Unsecured Term Loan. The Unsecured Delayed Draw Term Loan was scheduled to mature on December 31, 2017. The principal amount outstanding at termination was $85 million.
The lenders under the Unsecured Delayed Draw Term Loan, JPP, LLC and JPP II, LLC, each a Delaware limited liability company, which are controlled by ESL Investments, Inc. have maintained their funding of $85 million in the Unsecured Term Loan, with JPP, LLC appointed as administrative agent under the Unsecured Term Loan.
Mr. Edward S. Lampert, the Company’s Chairman, is the Chairman and Chief Executive Officer of ESL, which controls JPP, LLC and JPP II, LLC. The terms of the Unsecured Term Loan were approved by the Company’s Audit Committee and the Company’s Board of Trustees (with Mr. Edward S. Lampert recusing himself).
Transition Services Agreement
On July 7, 2015, the Operating Partnership and Sears Holdings Management Corporation (“SHMC”), a wholly owned subsidiary of Sears Holdings, entered into a transition services agreement (the “Transition Services Agreement”, or “TSA”). Pursuant to the TSA, SHMC was to provide certain limited services to the Operating Partnership during the period from the closing of the Transaction through the 18-month anniversary of the closing. On January 7, 2017, the TSA expired by its terms.
Note 11 – Non-Controlling Interests
Partnership Agreement
On July 7, 2015, Seritage and ESL entered into the agreement of limited partnership of the Operating Partnership (the “Partnership Agreement”). Pursuant to the Partnership Agreement, as the sole general partner of Operating Partnership, Seritage exercises exclusive and complete responsibility and discretion in its day-to-day management, authority to make decisions and control of Operating Partnership, and may not be removed as general partner by the limited partners. As of December 31, 2017, the Company held a 63.8% interest in the Operating Partnership and ESL held a 36.2% interest. The portions of consolidated entities not owned by the Company are presented as non-controlling interest as of and during the period presented.
F-31
Class A Common Shares
On July 7, 2015, the Company issued 22,332,037 Class A common shares at a price of $29.58 per share, for aggregate proceeds of $660.6 million, pursuant to the Rights Offering. The Company incurred costs of approximately $8.2 million related to the Rights Offering. In addition, the Company issued and sold to subsidiaries of each of GGP and Simon 1,125,760 Class A common shares at a price of $29.58 per share, or an aggregate purchase price of $33.3 million, in transactions exempt from registration under the Securities Act. The subsidiary of GGP liquidated its position during the year ended December 31, 2016 and the subsidiary of Simon liquidated its position during the year ended December 31, 2017.
During the year ended December 31, 2017, 3,958,182 Operating Partnership units were converted to Class A common shares and 2,603,554 net Class C non-voting common shares were converted to Class A common shares.
As of December 31, 2017, 32,415,734 Class A common shares were issued and outstanding.
Subsequent to December 31, 2017, 1,626,682 net Class C non-voting common shares were converted to Class A common shares.
Class A shares have a par value of $0.01 per share.
Class B Non-Economic Common Shares
On July 7, 2015, the Company issued and sold to ESL 1,589,020 Class B non-economic common shares of beneficial interest in connection with an exchange of cash and subscription rights for Class B non-economic common shares in a transaction exempt from registration under the Securities Act pursuant to Section 4(a)(2) thereof. The aggregate purchase price for the Class B non-economic common shares purchased by ESL was $0.9 million. The Class B non-economic common shares have voting rights, but do not have economic rights and, as such, do not receive dividends and are not included in earnings per share computations.
During the year ended December 31, 2017, 260,154 Class B non-economic common shares were surrendered to the Company.
As of December 31, 2017, 1,328,866 Class B non-economic common shares were issued and outstanding.
Class B non-economic common shares have a par value of $0.01 per share.
Class C Non-Voting Common Shares
On July 7, 2015, the Company issued 6,790,635 Class C non-voting common shares at a price of $29.58 per share, for aggregate proceeds of $200.9 million, pursuant to the Rights Offering. The Class C non-voting common shares have economic rights, but do not have voting rights. Upon any transfer of a Class C non-voting common share to any person other than an affiliate of the holder of such share, such share shall automatically convert into one Class A common share.
During the year ended December 31, 2017, 2,603,554 net shares of Class C non-voting common shares were converted to Class A common shares.
Subsequent to December 31, 2017, 1,626,682 net Class C non-voting common shares were converted to Class A common shares.
As of December 31, 2017, 3,151,131 shares of Class C non-voting common shares were issued and outstanding.
Class C non-voting shares have a par value of $0.01 per share.
Series A Preferred Shares
In December 2017, we issued 2,800,000 7.00% Series A Cumulative Redeemable Preferred Shares (the “Series A Preferred Shares”) in a public offering at $25.00 per share. We received net proceeds from the offering of approximately $66.7 million after deducting payment of the underwriting discount and offering expenses. We intend to use the proceeds to fund our redevelopment pipeline and for general corporate purposes .
F-32
We may not redeem the Series A Preferred Shares before December 14, 2022 except to preserve our status as a REIT or upon the occurrence of a Change of Control, as defined in the Trust Agreement addendum designating the Series A Preferred Shares. On and after December 14, 2022, we may redeem any or all of the Series A Preferred Shares at $25.00 per share plus any accrued and unpaid dividends. In addition, upon the occurrenc e of a Change of Control, we may redeem any or all of the Series A Preferred Shares for cash within 120 days after the first date on which such Change of Control occurred at $25.00 per share plus any accrued and unpaid dividends. The Series A Preferred Sha res have no stated maturity, are not subject to any sinking fund or mandatory redemption and will remain outstanding indefinitely unless we redeem or otherwise repurchase them or they are converted.
Dividends and Distributions
The Company’s Board of Trustees declared the following common stock dividends during 2017 and 2016, with holders of Operating Partnership units entitled to an equal distribution per Operating Partnership unit held on the record date:
|
|
|
|
|
|
|
Dividends per |
|
|
|
|
|
|
|
|
|
Class A and Class C |
|
|
|
Declaration Date |
|
Record Date |
|
Payment Date |
|
Common Share |
|
|
|
2017 |
|
|
|
|
|
|
|
|
|
October 24 |
|
December 29 |
|
January 11, 2018 |
|
$ |
0.25 |
|
|
July 25 |
|
September 29 |
|
October 12 |
|
|
0.25 |
|
|
April 25 |
|
June 30 |
|
July 13 |
|
|
0.25 |
|
|
February 28 |
|
March 31 |
|
April 13 |
|
|
0.25 |
|
|
2016 |
|
|
|
|
|
|
|
|
|
November 1 |
|
December 31 |
|
January 12, 2017 |
|
$ |
0.25 |
|
|
August 2 |
|
September 30 |
|
October 13 |
|
|
0.25 |
|
|
May 3 |
|
June 30 |
|
July 14 |
|
|
0.25 |
|
|
March 8 |
|
March 31 |
|
April 14 |
|
|
0.25 |
|
The Company declared total dividends of $1.00 per Class A and Class C common share during the years ended December 31, 2017 and December 31, 2016, and $0.50 per Class A and Class C common share during the period from July 7, 2015 (Date Operations Commenced) through December 31, 2015. The dividends have been reflected as follows for U.S. federal income tax purposes:
|
|
|
|
|
|
|
|
|
|
|
July 7, 2015 |
|
|
|
|
|
|
|
|
|
|
|
|
|
(Date Operations |
|
|
|
|
|
Year Ended |
|
|
Year Ended |
|
|
Commenced) to |
|
|||
|
|
|
December 31, 2017 |
|
|
December 31, 2016 |
|
|
December 31, 2015 |
|
|||
|
Ordinary income |
|
$ |
0.53 |
|
|
$ |
1.00 |
|
|
$ |
0.50 |
|
|
Capital gain distributions |
|
$ |
0.47 |
|
|
|
— |
|
|
|
— |
|
|
Return of capital |
|
|
— |
|
|
|
— |
|
|
|
— |
|
|
Total |
|
$ |
1.00 |
|
|
$ |
1.00 |
|
|
$ |
0.50 |
|
On February 20, 2018, the Company’s Board of Trustees declared a cash dividend of $0.25 per Class A and Class C common share for the three months ending March 31, 2018. The holders of Operating Partnership units are entitled to an equal distribution per Operating Partnership unit held on March 30, 2018. These amounts will be paid on April 12, 2018.
On February 20, 2018, the Company’s Board of Trustees also declared a preferred stock dividend of $0.593056 per each Series A Preferred Share. The dividend covers the period from, and including, December 14, 2017 to, but excluding, April 15, 2018. The dividend will be paid on April 16, 2018 to holders of record on March 30, 2018.
Note 13 – Earnings per Share
The table below provides a reconciliation of net loss and the number of common shares used in the computations of “basic” earnings per share (“EPS”), which utilizes the weighted-average number of common shares outstanding without regard to dilutive potential common shares, and “diluted” EPS, which includes all such shares. Potentially dilutive securities consist of shares of non-vested restricted stock and the redeemable non-controlling interests in Operating Partnership.
F-33
All outstanding non-vested shares that contain non-forfe itable rights to dividends are considered participating securities and are included in computing EPS pursuant to the two-class method which specifies that all outstanding non-vested share-based payment awards that contain non-forfeitable rights to distribu tions are considered participating securities and should be included in the computation of EPS.
Earnings per share has not been presented for Class B shareholders as they do not have economic rights.
|
|
|
|
|
|
|
|
|
|
|
July 7, 2015 |
|
|
|
(in thousands except per share amounts) |
|
Year Ended December 31, |
|
|
(date operations commenced) to |
|
||||||
|
|
|
2017 |
|
|
2016 |
|
|
December 31, 2015 |
|
|||
|
Numerator - Basic and Diluted |
|
|
|
|
|
|
|
|
|
|
|
|
|
Net loss |
|
$ |
(120,813 |
) |
|
$ |
(91,009 |
) |
|
$ |
(38,803 |
) |
|
Net loss attributable to non-controlling interests |
|
|
47,059 |
|
|
|
39,451 |
|
|
|
16,465 |
|
|
Preferred dividends |
|
|
(245 |
) |
|
|
— |
|
|
|
— |
|
|
Net loss attributable to common shareholders |
|
$ |
(73,999 |
) |
|
$ |
(51,558 |
) |
|
$ |
(22,338 |
) |
|
|
|
|
|
|
|
|
|
|
|
|
|
|
|
Denominator - Basic and Diluted |
|
|
|
|
|
|
|
|
|
|
|
|
|
Weighted average Class A common shares outstanding |
|
|
28,249 |
|
|
|
25,497 |
|
|
|
24,707 |
|
|
Weighted average Class C common shares outstanding |
|
|
5,555 |
|
|
|
5,919 |
|
|
|
6,679 |
|
|
Weighted average Class A and Class C common shares outstanding |
|
|
33,804 |
|
|
|
31,416 |
|
|
|
31,386 |
|
|
|
|
|
|
|
|
|
|
|
|
|
|
|
|
Net loss per share attributable to Class A and Class C common shareholders |
|
$ |
(2.19 |
) |
|
$ |
(1.64 |
) |
|
$ |
(0.71 |
) |
No adjustments were made to the numerator for the years ended December 31, 2017 or December 31, 2016, or the period from July 7, 2015 (Date Operations Commenced) through December 31, 2015, because the Company generated a net loss. During periods of net loss, undistributed losses are not allocated to the participating securities as they are not required to absorb losses.
No adjustments were made to the denominator for the years ended December 31, 2017 or December 31, 2016, or the period from July 7, 2015 (Date Operations Commenced) through December 31, 2015, because (i) the inclusion of outstanding non-vested restricted shares would have had an anti-dilutive effect and (ii) including the non-controlling interest in the Operating Partnership would also require that the share of Operating Partnership loss attributable to such interests be added back to net loss, therefore, resulting in no effect on earnings per share.
As of December 31, 2017 and December 31, 2016, there were 245,570 and 216,348 shares, respectively, of non-vested restricted stock outstanding.
Note 14 – Stock Based Compensation
On July 7, 2015, the Company adopted the Seritage Growth Properties 2015 Share Plan (the “Plan”). The number of shares of common stock reserved for issuance under the Plan is 3,250,000 shares have been registered with the SEC. The Plan provides for grants of restricted shares, share units, other share-based awards, options, and share appreciation rights, each as defined in the Plan (collectively, the “Awards”). Directors, officers, other employees and consultants of the Company and its subsidiaries and affiliates are eligible for Awards.
Restricted Shares
Pursuant to the Plan, the Company made grants of restricted shares and share units during the years ended December 31, 2017 and December 31, 2016, and the period from July 7, 2015 (Date Operations Commenced) through December 31, 2015. The vesting terms of these grants are specific to the individual grant and vary in that a portion of the restricted shares and share units vest either immediately or in equal annual amounts over the next three years (time-based vesting) and a portion of the restricted shares vest on the third anniversary of the grants subject to the achievement of certain performance criteria (performance-based vesting).
In general, participating employees are required to remain employed for vesting to occur (subject to certain limited exceptions). Restricted shares that do not vest are forfeited. Dividends on restricted shares and share units with time-based vesting are paid to holders of such shares and share units and are not returnable, even if the underlying shares or share units do not ultimately vest.
F-34
Dividends on restricted shares with performance-based vesting are accrued when declared and paid to holders of such shares on the third anniversary of the initial grant subject to the vesting of the underlying shares.
The following table summarizes restricted share activity for the grant periods ended December 31, 2017 and December 31, 2016:
|
|
|
Year Ended December 31, 2017 |
|
|
Year Ended December 31, 2016 |
|
||||||||||
|
|
|
|
|
|
|
Weighted- |
|
|
|
|
|
|
Weighted- |
|
||
|
|
|
|
|
|
|
Average Grant |
|
|
|
|
|
|
Average Grant |
|
||
|
|
|
Shares |
|
|
Date Fair Value |
|
|
Shares |
|
|
Date Fair Value |
|
||||
|
Unvested restricted shares at beginning of period |
|
|
216,348 |
|
|
$ |
38.98 |
|
|
|
221,484 |
|
|
$ |
37.18 |
|
|
Restricted shares granted |
|
|
62,135 |
|
|
|
45.23 |
|
|
|
23,324 |
|
|
|
46.48 |
|
|
Restricted shares vested |
|
|
(32,345 |
) |
|
|
33.02 |
|
|
|
(28,460 |
) |
|
|
31.18 |
|
|
Restricted shares forfeited |
|
|
(568 |
) |
|
|
45.23 |
|
|
|
— |
|
|
|
45.23 |
|
|
Unvested restricted shares at end of period |
|
|
245,570 |
|
|
$ |
41.33 |
|
|
|
216,348 |
|
|
$ |
38.98 |
|
The Company recognized $7.0 million, $1.1 million and $0.9 million for the year ended December 31, 2017, the year ended December 31, 2016 and the period from July 7, 2015 (Date Operations Commenced) to December 31, 2015. Compensation expenses related to the restricted shares are included in general and administrative expenses on the Company's consolidated statements of operations.
As of December 31, 2017, there were $5.1 million of total unrecognized compensation costs related to the outstanding restricted shares which is expected to be recognized over a weighted-average period of approximately 1.6 years. As of December 31, 2016 there were $8.2 million of total unrecognized compensation costs related to the outstanding restricted shares which is expected to be recognized over a weighted-average period of approximately 2.7 years.
Note 15 – Accounts Payable, Accrued Expenses and Other Liabilities
The following table summarizes the significant components of accounts payable, accrued expenses and other liabilities (in thousands):
|
|
|
December 31, 2017 |
|
|
December 31, 2016 |
|
||
|
Accrued development expenditures |
|
$ |
21,449 |
|
|
$ |
6,369 |
|
|
Accrued real estate taxes |
|
|
17,091 |
|
|
|
23,942 |
|
|
Dividends payable |
|
|
14,559 |
|
|
|
14,132 |
|
|
Below-market leases |
|
|
14,476 |
|
|
|
16,827 |
|
|
Environmental reserve |
|
|
11,322 |
|
|
|
11,584 |
|
|
Unearned tenant reimbursements |
|
|
10,522 |
|
|
|
4,039 |
|
|
Accounts payable and accrued expenses |
|
|
9,588 |
|
|
|
16,055 |
|
|
Prepaid rental income |
|
|
4,156 |
|
|
|
1,979 |
|
|
Accrued interest |
|
|
3,689 |
|
|
|
3,004 |
|
|
Deferred maintenance |
|
|
2,581 |
|
|
|
4,124 |
|
|
Litigation charge |
|
|
— |
|
|
|
19,000 |
|
|
Total accounts payable, accrued expenses and other liabilities |
|
$ |
109,433 |
|
|
$ |
121,055 |
|
F-35
The following table sets forth the selected quarterly financial data for the Company (in thousands, except per share amounts):
|
|
|
2017 |
|
|
2016 |
|
||||||||||||||||||||||||||
|
|
|
First |
|
|
Second |
|
|
Third |
|
|
Fourth |
|
|
First |
|
|
Second |
|
|
Third |
|
|
Fourth |
|
||||||||
|
|
|
Quarter |
|
|
Quarter |
|
|
Quarter |
|
|
Quarter |
|
|
Quarter |
|
|
Quarter |
|
|
Quarter |
|
|
Quarter |
|
||||||||
|
Total revenue |
|
$ |
65,398 |
|
|
$ |
57,893 |
|
|
$ |
64,048 |
|
|
$ |
53,678 |
|
|
$ |
63,004 |
|
|
$ |
61,867 |
|
|
$ |
57,607 |
|
|
$ |
66,196 |
|
|
Operating (loss) income |
|
|
(16,742 |
) |
|
|
(14,665 |
) |
|
|
(17,997 |
) |
|
|
(65,163 |
) |
|
|
396 |
|
|
|
2,765 |
|
|
|
(22,771 |
) |
|
|
(10,837 |
) |
|
Net (loss) income |
|
|
(32,844 |
) |
|
|
(34,867 |
) |
|
|
17,276 |
|
|
|
(70,378 |
) |
|
|
(14,714 |
) |
|
|
(12,565 |
) |
|
|
(37,247 |
) |
|
|
(26,483 |
) |
|
Net (loss) income attributable to common shareholders |
|
|
(19,838 |
) |
|
|
(21,219 |
) |
|
|
10,514 |
|
|
|
(43,456 |
) |
|
|
(8,335 |
) |
|
|
(7,117 |
) |
|
|
(21,102 |
) |
|
|
(15,004 |
) |
|
|
|
|
|
|
|
|
|
|
|
|
|
|
|
|
|
|
|
|
|
|
|
|
|
|
|
|
|
|
|
|
|
|
|
Net (loss) income per share attributable to Class A and Class C common shareholders - Basic |
|
|
(0.59 |
) |
|
|
(0.63 |
) |
|
|
0.31 |
|
|
|
(1.27 |
) |
|
|
(0.27 |
) |
|
|
(0.23 |
) |
|
|
(0.67 |
) |
|
|
(0.48 |
) |
|
Net (loss) income per share attributable to Class A and Class C common shareholders - Diluted |
|
|
(0.59 |
) |
|
|
(0.63 |
) |
|
|
0.31 |
|
|
|
(1.27 |
) |
|
|
(0.27 |
) |
|
|
(0.23 |
) |
|
|
(0.67 |
) |
|
|
(0.48 |
) |
|
|
|
|
|
|
|
|
|
|
|
|
|
|
|
|
|
|
|
|
|
|
|
|
|
|
|
|
|
|
|
|
|
|
|
Weighted average Class A and Class C common shares outstanding - Basic |
|
|
33,510 |
|
|
|
33,766 |
|
|
|
33,841 |
|
|
|
34,094 |
|
|
|
31,391 |
|
|
|
31,391 |
|
|
|
31,419 |
|
|
|
31,418 |
|
|
Weighted average Class A and Class C common shares outstanding - Diluted |
|
|
33,510 |
|
|
|
33,766 |
|
|
|
33,841 |
|
|
|
34,094 |
|
|
|
31,391 |
|
|
|
31,391 |
|
|
|
31,419 |
|
|
|
31,418 |
|
Certain of the above selected quarterly financial data includes significant depreciation and amortization expense related to the demolition of certain buildings for redevelopment and the accelerated amortization of certain lease intangibles as a result of the recapture of space from, or the termination of space by, Sears Holdings. These depreciation and amortization amounts were $26.0 million, $19.4 million, $39.5 million and $63.9 million for the quarters ended March 31, 2017, June 30, 2017, September 30, 2017 and December 31, 2017, respectively, and $11.4 million and $22.8 million for the quarters ended September 30, 2016 and December 31, 2016, respectively.
Certain of the above selected quarterly financial data also includes gains on the on the sale of interests in unconsolidated joint ventures and gains on the sale of real estate. These gains totaled $56.7 million and $15.0 million for the quarters ended September 30, 2017 and December 31, 2017, respectively.
F-36
SCHEDULE III—REAL ESTATE AND ACCUMULATED DEPRECIATION
DECEMBER 31, 2017
(Dollars in thousands)
|
|
|
|
|
|
|
|
|
|
|
|
|
|
|
Costs Capitalized |
|
|
Gross Amount at Which Carried |
|
|
|
|
|
|
|
|
|
||||||||||||||
|
|
|
|
|
|
|
Acquisition Costs |
|
|
Subsequent to Acquisition |
|
|
at Close of Period (1) |
|
|
|
|
|
|
|
|
Life Upon Which |
|||||||||||||||||||
|
|
|
|
|
|
|
|
|
|
|
Buildings and |
|
|
|
|
|
|
Buildings and |
|
|
|
|
|
|
Buildings and |
|
|
|
|
|
|
Accumulated |
|
|
Date |
|
Depreciation |
||||
|
Name of Center |
|
Location |
|
Encumbrances |
|
Land |
|
|
Improvements |
|
|
Land |
|
|
Improvements |
|
|
Land |
|
|
Improvements |
|
|
Total |
|
|
Depreciation |
|
|
Acquired |
|
is Computed |
||||||||
|
The Mall at Sears |
|
Anchorage(Sur), AK |
|
(2) |
|
$ |
11,517 |
|
|
$ |
11,729 |
|
|
$ |
— |
|
|
$ |
884 |
|
|
$ |
11,517 |
|
|
$ |
12,613 |
|
|
$ |
24,130 |
|
|
$ |
(2,209 |
) |
|
July, 2015 |
|
(3) |
|
Stand-Alone Location |
|
Cullman, AL |
|
(2) |
|
|
947 |
|
|
|
846 |
|
|
|
— |
|
|
|
1,616 |
|
|
|
947 |
|
|
|
2,462 |
|
|
|
3,409 |
|
|
|
(200 |
) |
|
July, 2015 |
|
(3) |
|
McCain Mall |
|
North Little Rock, AR |
|
(2) |
|
|
1,288 |
|
|
|
2,881 |
|
|
|
— |
|
|
|
— |
|
|
|
1,288 |
|
|
|
2,881 |
|
|
|
4,169 |
|
|
|
(656 |
) |
|
July, 2015 |
|
(3) |
|
Stand-Alone Location |
|
Russellville, AR |
|
(2) |
|
|
318 |
|
|
|
1,270 |
|
|
|
— |
|
|
|
— |
|
|
|
318 |
|
|
|
1,270 |
|
|
|
1,588 |
|
|
|
(253 |
) |
|
July, 2015 |
|
(3) |
|
Flagstaff Mall |
|
Flagstaff, AZ |
|
(2) |
|
|
932 |
|
|
|
2,179 |
|
|
|
— |
|
|
|
— |
|
|
|
932 |
|
|
|
2,179 |
|
|
|
3,111 |
|
|
|
(372 |
) |
|
July, 2015 |
|
(3) |
|
Superstition Springs Center |
|
Mesa/East, AZ |
|
(2) |
|
|
2,661 |
|
|
|
2,559 |
|
|
|
— |
|
|
|
— |
|
|
|
2,661 |
|
|
|
2,559 |
|
|
|
5,220 |
|
|
|
(582 |
) |
|
July, 2015 |
|
(3) |
|
Shopping Center |
|
Peoria, AZ |
|
(2) |
|
|
1,204 |
|
|
|
509 |
|
|
|
— |
|
|
|
— |
|
|
|
1,204 |
|
|
|
509 |
|
|
|
1,713 |
|
|
|
(245 |
) |
|
July, 2015 |
|
(3) |
|
Desert Sky Mall |
|
Phoenix-Desert Sky, AZ |
|
(2) |
|
|
2,605 |
|
|
|
2,448 |
|
|
|
— |
|
|
|
— |
|
|
|
2,605 |
|
|
|
2,448 |
|
|
|
5,053 |
|
|
|
(501 |
) |
|
July, 2015 |
|
(3) |
|
Stand-Alone Location |
|
Phoenix , AZ |
|
(2) |
|
|
568 |
|
|
|
1,088 |
|
|
|
— |
|
|
|
13 |
|
|
|
568 |
|
|
|
1,101 |
|
|
|
1,669 |
|
|
|
(322 |
) |
|
July, 2015 |
|
(3) |
|
Prescott Gateway |
|
Prescott, AZ |
|
(2) |
|
|
1,071 |
|
|
|
835 |
|
|
|
— |
|
|
|
— |
|
|
|
1,071 |
|
|
|
835 |
|
|
|
1,906 |
|
|
|
(314 |
) |
|
July, 2015 |
|
(3) |
|
Mall at Sierra Vista |
|
Sierra Vista, AZ |
|
(2) |
|
|
1,252 |
|
|
|
1,791 |
|
|
|
— |
|
|
|
— |
|
|
|
1,252 |
|
|
|
1,791 |
|
|
|
3,043 |
|
|
|
(305 |
) |
|
July, 2015 |
|
(3) |
|
Stand-Alone Location |
|
Sierra Vista, AZ |
|
(2) |
|
|
938 |
|
|
|
1,736 |
|
|
|
— |
|
|
|
— |
|
|
|
938 |
|
|
|
1,736 |
|
|
|
2,674 |
|
|
|
(470 |
) |
|
July, 2015 |
|
(3) |
|
Park Place |
|
Park Mall, AZ |
|
(2) |
|
|
5,207 |
|
|
|
3,458 |
|
|
|
— |
|
|
|
— |
|
|
|
5,207 |
|
|
|
3,458 |
|
|
|
8,665 |
|
|
|
(683 |
) |
|
July, 2015 |
|
(3) |
|
Southgate Mall |
|
Yuma, AZ |
|
(2) |
|
|
1,485 |
|
|
|
1,596 |
|
|
|
— |
|
|
|
— |
|
|
|
1,485 |
|
|
|
1,596 |
|
|
|
3,081 |
|
|
|
(468 |
) |
|
July, 2015 |
|
(3) |
|
Kmart Center |
|
Antioch, CA |
|
(2) |
|
|
1,594 |
|
|
|
2,525 |
|
|
|
— |
|
|
|
— |
|
|
|
1,594 |
|
|
|
2,525 |
|
|
|
4,119 |
|
|
|
(428 |
) |
|
July, 2015 |
|
(3) |
|
Big Bear Lake Shopping Center |
|
Big Bear Lake, CA |
|
(2) |
|
|
3,664 |
|
|
|
2,945 |
|
|
|
— |
|
|
|
66 |
|
|
|
3,664 |
|
|
|
3,011 |
|
|
|
6,675 |
|
|
|
(426 |
) |
|
July, 2015 |
|
(3) |
|
Southbay Pavilion |
|
Carson, CA |
|
(2) |
|
|
11,476 |
|
|
|
5,223 |
|
|
|
— |
|
|
|
64 |
|
|
|
11,476 |
|
|
|
5,287 |
|
|
|
16,763 |
|
|
|
(958 |
) |
|
July, 2015 |
|
(3) |
|
Chula Vista Center |
|
Chula Vista, CA |
|
(2) |
|
|
7,315 |
|
|
|
6,834 |
|
|
|
— |
|
|
|
— |
|
|
|
7,315 |
|
|
|
6,834 |
|
|
|
14,149 |
|
|
|
(1,044 |
) |
|
July, 2015 |
|
(3) |
|
Sunrise Mall |
|
Citrus Hts-Sunrise, CA |
|
(2) |
|
|
3,778 |
|
|
|
2,088 |
|
|
|
— |
|
|
|
— |
|
|
|
3,778 |
|
|
|
2,088 |
|
|
|
5,866 |
|
|
|
(994 |
) |
|
July, 2015 |
|
(3) |
|
Stand-Alone Location |
|
Delano, CA |
|
(2) |
|
|
1,905 |
|
|
|
2,208 |
|
|
|
— |
|
|
|
— |
|
|
|
1,905 |
|
|
|
2,208 |
|
|
|
4,113 |
|
|
|
(404 |
) |
|
July, 2015 |
|
(3) |
|
Westfield Parkway |
|
El Cajon, CA |
|
(2) |
|
|
10,573 |
|
|
|
2,883 |
|
|
|
— |
|
|
|
— |
|
|
|
10,573 |
|
|
|
2,883 |
|
|
|
13,456 |
|
|
|
(1,111 |
) |
|
July, 2015 |
|
(3) |
|
Imperial Valley Mall |
|
El Centro, CA |
|
(2) |
|
|
3,877 |
|
|
|
3,977 |
|
|
|
— |
|
|
|
— |
|
|
|
3,877 |
|
|
|
3,977 |
|
|
|
7,854 |
|
|
|
(700 |
) |
|
July, 2015 |
|
(3) |
|
Westfield Solano |
|
Fairfield, CA |
|
(2) |
|
|
3,679 |
|
|
|
1,366 |
|
|
|
— |
|
|
|
— |
|
|
|
3,679 |
|
|
|
1,366 |
|
|
|
5,045 |
|
|
|
(310 |
) |
|
July, 2015 |
|
(3) |
|
Florin Mall |
|
Florin, CA |
|
(2) |
|
|
1,022 |
|
|
|
1,366 |
|
|
|
— |
|
|
|
— |
|
|
|
1,022 |
|
|
|
1,366 |
|
|
|
2,388 |
|
|
|
(418 |
) |
|
July, 2015 |
|
(3) |
|
Manchester Center |
|
Fresno, CA |
|
(2) |
|
|
1,370 |
|
|
|
2,000 |
|
|
|
— |
|
|
|
— |
|
|
|
1,370 |
|
|
|
2,000 |
|
|
|
3,370 |
|
|
|
(877 |
) |
|
July, 2015 |
|
(3) |
|
Mill Creek Marketplace |
|
McKinleyville, CA |
|
(2) |
|
|
1,354 |
|
|
|
1,655 |
|
|
|
— |
|
|
|
— |
|
|
|
1,354 |
|
|
|
1,655 |
|
|
|
3,009 |
|
|
|
(394 |
) |
|
July, 2015 |
|
(3) |
|
Merced Mall |
|
Merced, CA |
|
(2) |
|
|
2,534 |
|
|
|
1,604 |
|
|
|
— |
|
|
|
— |
|
|
|
2,534 |
|
|
|
1,604 |
|
|
|
4,138 |
|
|
|
(557 |
) |
|
July, 2015 |
|
(3) |
|
Montclair Plaza |
|
Montclair, CA |
|
(2) |
|
|
2,498 |
|
|
|
2,119 |
|
|
|
— |
|
|
|
— |
|
|
|
2,498 |
|
|
|
2,119 |
|
|
|
4,617 |
|
|
|
(223 |
) |
|
July, 2015 |
|
(3) |
|
Moreno Valley Mall at Towngate |
|
Moreno Vly, CA |
|
(2) |
|
|
3,898 |
|
|
|
3,407 |
|
|
|
— |
|
|
|
— |
|
|
|
3,898 |
|
|
|
3,407 |
|
|
|
7,305 |
|
|
|
(690 |
) |
|
July, 2015 |
|
(3) |
|
Newpark Mall |
|
Newark, CA |
|
(2) |
|
|
4,312 |
|
|
|
3,268 |
|
|
|
— |
|
|
|
— |
|
|
|
4,312 |
|
|
|
3,268 |
|
|
|
7,580 |
|
|
|
(818 |
) |
|
July, 2015 |
|
(3) |
|
Valley Plaza |
|
No Hollywood, CA |
|
(2) |
|
|
8,049 |
|
|
|
3,172 |
|
|
|
— |
|
|
|
— |
|
|
|
8,049 |
|
|
|
3,172 |
|
|
|
11,221 |
|
|
|
(314 |
) |
|
July, 2015 |
|
(3) |
|
Westfield Palm Desert |
|
Palm Desert, CA |
|
(2) |
|
|
5,473 |
|
|
|
1,705 |
|
|
|
(542 |
) |
|
|
(169 |
) |
|
|
4,931 |
|
|
|
1,536 |
|
|
|
6,467 |
|
|
|
(383 |
) |
|
July, 2015 |
|
(3) |
|
Ramona Station |
|
Ramona, CA |
|
(2) |
|
|
7,239 |
|
|
|
1,452 |
|
|
|
— |
|
|
|
16 |
|
|
|
7,239 |
|
|
|
1,468 |
|
|
|
8,707 |
|
|
|
(434 |
) |
|
July, 2015 |
|
(3) |
|
Stand-Alone Location |
|
Riverside, CA |
|
(2) |
|
|
4,397 |
|
|
|
4,407 |
|
|
|
— |
|
|
|
— |
|
|
|
4,397 |
|
|
|
4,407 |
|
|
|
8,804 |
|
|
|
(1,062 |
) |
|
July, 2015 |
|
(3) |
|
Stand-Alone Location |
|
Riverside, CA |
|
(2) |
|
|
2,670 |
|
|
|
2,489 |
|
|
|
— |
|
|
|
54 |
|
|
|
2,670 |
|
|
|
2,543 |
|
|
|
5,213 |
|
|
|
(567 |
) |
|
July, 2015 |
|
(3) |
|
Westfield Galleria at Roseville |
|
Roseville, CA |
|
(2) |
|
|
4,848 |
|
|
|
3,215 |
|
|
|
— |
|
|
|
— |
|
|
|
4,848 |
|
|
|
3,215 |
|
|
|
8,063 |
|
|
|
(553 |
) |
|
July, 2015 |
|
(3) |
|
Northridge Center |
|
Salinas, CA |
|
(2) |
|
|
2,644 |
|
|
|
4,394 |
|
|
|
— |
|
|
|
— |
|
|
|
2,644 |
|
|
|
4,394 |
|
|
|
7,038 |
|
|
|
(844 |
) |
|
July, 2015 |
|
(3) |
|
Inland Center |
|
San Bernardino, CA |
|
(2) |
|
|
4,131 |
|
|
|
2,066 |
|
|
|
— |
|
|
|
— |
|
|
|
4,131 |
|
|
|
2,066 |
|
|
|
6,197 |
|
|
|
(639 |
) |
|
July, 2015 |
|
(3) |
|
Shops at Tanforan |
|
San Bruno, CA |
|
(2) |
|
|
7,854 |
|
|
|
4,642 |
|
|
|
— |
|
|
|
— |
|
|
|
7,854 |
|
|
|
4,642 |
|
|
|
12,496 |
|
|
|
(932 |
) |
|
July, 2015 |
|
(3) |
F-37
|
|
|
|
|
|
|
|
|
|
|
|
|
|
|
Costs Capitalized |
|
|
Gross Amount at Which Carried |
|
|
|
|
|
|
|
|
|
||||||||||||||
|
|
|
|
|
|
|
Acquisition Costs |
|
|
Subsequent to Acquisition |
|
|
at Close of Period (1) |
|
|
|
|
|
|
|
|
Life Upon Which |
|||||||||||||||||||
|
|
|
|
|
|
|
|
|
|
|
Buildings and |
|
|
|
|
|
|
Buildings and |
|
|
|
|
|
|
Buildings and |
|
|
|
|
|
|
Accumulated |
|
|
Date |
|
Depreciation |
||||
|
Name of Center |
|
Location |
|
Encumbrances |
|
Land |
|
|
Improvements |
|
|
Land |
|
|
Improvements |
|
|
Land |
|
|
Improvements |
|
|
Total |
|
|
Depreciation |
|
|
Acquired |
|
is Computed |
||||||||
|
Westfield UTC |
|
San Diego-North, CA |
|
(2) |
|
$ |
22,445 |
|
|
$ |
14,094 |
|
|
$ |
— |
|
|
$ |
2,605 |
|
|
$ |
22,445 |
|
|
$ |
16,699 |
|
|
$ |
39,144 |
|
|
$ |
(1,529 |
) |
|
July, 2015 |
|
(3) |
|
Eastridge Mall |
|
San Jose-Eastridge, CA |
|
(2) |
|
|
1,531 |
|
|
|
2,356 |
|
|
|
— |
|
|
|
— |
|
|
|
1,531 |
|
|
|
2,356 |
|
|
|
3,887 |
|
|
|
(1,042 |
) |
|
July, 2015 |
|
(3) |
|
Capitola Mall |
|
Santa Cruz, CA |
|
(2) |
|
|
4,338 |
|
|
|
4,803 |
|
|
|
— |
|
|
|
— |
|
|
|
4,338 |
|
|
|
4,803 |
|
|
|
9,141 |
|
|
|
(684 |
) |
|
July, 2015 |
|
(3) |
|
Town Center Mall 81 |
|
Santa Maria, CA |
|
(2) |
|
|
3,967 |
|
|
|
2,635 |
|
|
|
— |
|
|
|
— |
|
|
|
3,967 |
|
|
|
2,635 |
|
|
|
6,602 |
|
|
|
(371 |
) |
|
July, 2015 |
|
(3) |
|
Stand-Alone Location |
|
Santa Monica, CA |
|
(2) |
|
|
43,916 |
|
|
|
3,973 |
|
|
|
— |
|
|
|
— |
|
|
|
43,916 |
|
|
|
3,973 |
|
|
|
47,889 |
|
|
|
(395 |
) |
|
July, 2015 |
|
(3) |
|
Stand-Alone Location |
|
Santa Paula, CA |
|
(2) |
|
|
2,002 |
|
|
|
1,147 |
|
|
|
— |
|
|
|
— |
|
|
|
2,002 |
|
|
|
1,147 |
|
|
|
3,149 |
|
|
|
(426 |
) |
|
July, 2015 |
|
(3) |
|
Promenade in Temecula |
|
Temecula, CA |
|
(2) |
|
|
6,098 |
|
|
|
2,214 |
|
|
|
— |
|
|
|
— |
|
|
|
6,098 |
|
|
|
2,214 |
|
|
|
8,312 |
|
|
|
(676 |
) |
|
July, 2015 |
|
(3) |
|
Janss Marketplace |
|
Thousand Oaks, CA |
|
(2) |
|
|
9,853 |
|
|
|
14,785 |
|
|
|
— |
|
|
|
2,804 |
|
|
|
9,853 |
|
|
|
17,589 |
|
|
|
27,442 |
|
|
|
(1,637 |
) |
|
July, 2015 |
|
(3) |
|
Pacific View Mall |
|
Ventura, CA |
|
(2) |
|
|
5,578 |
|
|
|
6,172 |
|
|
|
— |
|
|
|
— |
|
|
|
5,578 |
|
|
|
6,172 |
|
|
|
11,750 |
|
|
|
(385 |
) |
|
July, 2015 |
|
(3) |
|
Sequoia Mall |
|
Visalia, CA |
|
(2) |
|
|
2,967 |
|
|
|
2,243 |
|
|
|
— |
|
|
|
— |
|
|
|
2,967 |
|
|
|
2,243 |
|
|
|
5,210 |
|
|
|
(408 |
) |
|
July, 2015 |
|
(3) |
|
Westfield West Covina |
|
West Covina, CA |
|
(2) |
|
|
5,972 |
|
|
|
2,053 |
|
|
|
— |
|
|
|
— |
|
|
|
5,972 |
|
|
|
2,053 |
|
|
|
8,025 |
|
|
|
(762 |
) |
|
July, 2015 |
|
(3) |
|
Westminster Mall |
|
Westminster, CA |
|
(2) |
|
|
6,845 |
|
|
|
5,651 |
|
|
|
— |
|
|
|
— |
|
|
|
6,845 |
|
|
|
5,651 |
|
|
|
12,496 |
|
|
|
(884 |
) |
|
July, 2015 |
|
(3) |
|
Westland Shopping Center |
|
Lakewood, CO |
|
(2) |
|
|
1,290 |
|
|
|
4,550 |
|
|
|
— |
|
|
|
— |
|
|
|
1,290 |
|
|
|
4,550 |
|
|
|
5,840 |
|
|
|
(571 |
) |
|
July, 2015 |
|
(3) |
|
Thornton Place |
|
Thornton, CO |
|
(2) |
|
|
1,881 |
|
|
|
1,300 |
|
|
|
— |
|
|
|
— |
|
|
|
1,881 |
|
|
|
1,300 |
|
|
|
3,181 |
|
|
|
(839 |
) |
|
July, 2015 |
|
(3) |
|
Crystal Mall |
|
Waterford, CT |
|
(2) |
|
|
1,371 |
|
|
|
2,534 |
|
|
|
— |
|
|
|
— |
|
|
|
1,371 |
|
|
|
2,534 |
|
|
|
3,905 |
|
|
|
(503 |
) |
|
July, 2015 |
|
(3) |
|
Corbin's Corner |
|
West Hartford, CT |
|
(2) |
|
|
6,434 |
|
|
|
10,466 |
|
|
|
— |
|
|
|
— |
|
|
|
6,434 |
|
|
|
10,466 |
|
|
|
16,900 |
|
|
|
(999 |
) |
|
July, 2015 |
|
(3) |
|
Stand-Alone Location |
|
Rehoboth Beach, DE |
|
(2) |
|
|
714 |
|
|
|
4,523 |
|
|
|
— |
|
|
|
5,373 |
|
|
|
714 |
|
|
|
9,896 |
|
|
|
10,610 |
|
|
|
(713 |
) |
|
July, 2015 |
|
(3) |
|
Town Center at Boca Raton |
|
Boca Raton, FL |
|
(2) |
|
|
16,090 |
|
|
|
7,479 |
|
|
|
— |
|
|
|
— |
|
|
|
16,090 |
|
|
|
7,479 |
|
|
|
23,569 |
|
|
|
(1,080 |
) |
|
July, 2015 |
|
(3) |
|
Desoto Square |
|
Bradenton, FL |
|
(2) |
|
|
958 |
|
|
|
900 |
|
|
|
— |
|
|
|
7 |
|
|
|
958 |
|
|
|
907 |
|
|
|
1,865 |
|
|
|
(447 |
) |
|
July, 2015 |
|
(3) |
|
Beachway Plaza |
|
Bradenton, FL |
|
(2) |
|
|
1,420 |
|
|
|
1,479 |
|
|
|
— |
|
|
|
— |
|
|
|
1,420 |
|
|
|
1,479 |
|
|
|
2,899 |
|
|
|
(362 |
) |
|
July, 2015 |
|
(3) |
|
Westfield Countryside |
|
Clearwater/Cntrysd, FL |
|
(2) |
|
|
5,852 |
|
|
|
17,777 |
|
|
|
— |
|
|
|
834 |
|
|
|
5,852 |
|
|
|
18,611 |
|
|
|
24,463 |
|
|
|
(1,726 |
) |
|
July, 2015 |
|
(3) |
|
Miami International Mall |
|
Doral(Miami), FL |
|
(2) |
|
|
9,214 |
|
|
|
2,654 |
|
|
|
— |
|
|
|
— |
|
|
|
9,214 |
|
|
|
2,654 |
|
|
|
11,868 |
|
|
|
(782 |
) |
|
July, 2015 |
|
(3) |
|
Edison Mall |
|
Ft Myers, FL |
|
(2) |
|
|
3,168 |
|
|
|
2,853 |
|
|
|
— |
|
|
|
— |
|
|
|
3,168 |
|
|
|
2,853 |
|
|
|
6,021 |
|
|
|
(484 |
) |
|
July, 2015 |
|
(3) |
|
The Oaks Mall |
|
Gainesville, FL |
|
(2) |
|
|
2,439 |
|
|
|
1,205 |
|
|
|
— |
|
|
|
— |
|
|
|
2,439 |
|
|
|
1,205 |
|
|
|
3,644 |
|
|
|
(277 |
) |
|
July, 2015 |
|
(3) |
|
Westfield Hialeah |
|
Hialeah/Westland, FL |
|
(2) |
|
|
9,683 |
|
|
|
3,472 |
|
|
|
— |
|
|
|
1,438 |
|
|
|
9,683 |
|
|
|
4,910 |
|
|
|
14,593 |
|
|
|
(700 |
) |
|
July, 2015 |
|
(3) |
|
Stand-Alone Location |
|
Hialeah, FL |
|
(2) |
|
|
5,492 |
|
|
|
2,344 |
|
|
|
— |
|
|
|
681 |
|
|
|
5,492 |
|
|
|
3,025 |
|
|
|
8,517 |
|
|
|
(374 |
) |
|
July, 2015 |
|
(3) |
|
Center of Osceola |
|
Kissimmee, FL |
|
(2) |
|
|
2,107 |
|
|
|
2,556 |
|
|
|
— |
|
|
|
7 |
|
|
|
2,107 |
|
|
|
2,563 |
|
|
|
4,670 |
|
|
|
(533 |
) |
|
July, 2015 |
|
(3) |
|
Lakeland Square |
|
Lakeland, FL |
|
(2) |
|
|
1,503 |
|
|
|
1,045 |
|
|
|
— |
|
|
|
— |
|
|
|
1,503 |
|
|
|
1,045 |
|
|
|
2,548 |
|
|
|
(324 |
) |
|
July, 2015 |
|
(3) |
|
Stand-Alone Location |
|
Melbourne, FL |
|
(2) |
|
|
2,441 |
|
|
|
1,981 |
|
|
|
— |
|
|
|
— |
|
|
|
2,441 |
|
|
|
1,981 |
|
|
|
4,422 |
|
|
|
(561 |
) |
|
July, 2015 |
|
(3) |
|
Aventura Mall |
|
Miami, FL |
|
(2) |
|
|
13,265 |
|
|
|
61,576 |
|
|
|
— |
|
|
|
(61,577 |
) |
|
|
13,265 |
|
|
|
— |
|
|
|
13,265 |
|
|
|
— |
|
|
July, 2015 |
|
(3) |
|
Southland Mall |
|
Miami/Cutler Rdg, FL |
|
(2) |
|
|
5,219 |
|
|
|
1,236 |
|
|
|
— |
|
|
|
— |
|
|
|
5,219 |
|
|
|
1,236 |
|
|
|
6,455 |
|
|
|
(409 |
) |
|
July, 2015 |
|
(3) |
|
Stand-Alone Location |
|
North Miami, FL |
|
(2) |
|
|
4,748 |
|
|
|
2,434 |
|
|
|
— |
|
|
|
— |
|
|
|
4,748 |
|
|
|
2,434 |
|
|
|
7,182 |
|
|
|
(473 |
) |
|
July, 2015 |
|
(3) |
|
Paddock Mall |
|
Ocala, FL |
|
(2) |
|
|
2,468 |
|
|
|
1,150 |
|
|
|
— |
|
|
|
— |
|
|
|
2,468 |
|
|
|
1,150 |
|
|
|
3,618 |
|
|
|
(370 |
) |
|
July, 2015 |
|
(3) |
|
Kmart Shopping Center |
|
Orange Park, FL |
|
(2) |
|
|
1,477 |
|
|
|
1,701 |
|
|
|
— |
|
|
|
443 |
|
|
|
1,477 |
|
|
|
2,144 |
|
|
|
3,621 |
|
|
|
(431 |
) |
|
July, 2015 |
|
(3) |
|
Orlando Fashion Square |
|
Orlando Colonial, FL |
|
(2) |
|
|
4,403 |
|
|
|
3,626 |
|
|
|
— |
|
|
|
(3,626 |
) |
|
|
4,403 |
|
|
|
— |
|
|
|
4,403 |
|
|
|
— |
|
|
July, 2015 |
|
(3) |
|
Panama City Mall |
|
Panama City, FL |
|
(2) |
|
|
3,227 |
|
|
|
1,614 |
|
|
|
— |
|
|
|
— |
|
|
|
3,227 |
|
|
|
1,614 |
|
|
|
4,841 |
|
|
|
(1,320 |
) |
|
July, 2015 |
|
(3) |
|
University Mall |
|
Pensacola, FL |
|
(2) |
|
|
2,620 |
|
|
|
2,990 |
|
|
|
— |
|
|
|
— |
|
|
|
2,620 |
|
|
|
2,990 |
|
|
|
5,610 |
|
|
|
(621 |
) |
|
July, 2015 |
|
(3) |
|
Westfield Broward |
|
Plantation, FL |
|
(2) |
|
|
6,933 |
|
|
|
2,509 |
|
|
|
— |
|
|
|
— |
|
|
|
6,933 |
|
|
|
2,509 |
|
|
|
9,442 |
|
|
|
(713 |
) |
|
July, 2015 |
|
(3) |
|
Westfield Sarasota |
|
Sarasota, FL |
|
(2) |
|
|
3,920 |
|
|
|
2,200 |
|
|
|
— |
|
|
|
— |
|
|
|
3,920 |
|
|
|
2,200 |
|
|
|
6,120 |
|
|
|
(545 |
) |
|
July, 2015 |
|
(3) |
|
Stand-Alone Location |
|
St. Petersburg, FL |
|
(2) |
|
|
1,653 |
|
|
|
777 |
|
|
|
— |
|
|
|
— |
|
|
|
1,653 |
|
|
|
777 |
|
|
|
2,430 |
|
|
|
(361 |
) |
|
July, 2015 |
|
(3) |
|
Tyrone Square Mall |
|
St Petersburg, FL |
|
(2) |
|
|
2,381 |
|
|
|
2,420 |
|
|
|
— |
|
|
|
(2,420 |
) |
|
|
2,381 |
|
|
|
— |
|
|
|
2,381 |
|
|
|
— |
|
|
July, 2015 |
|
(3) |
|
Oglethorpe Mall |
|
Savannah, GA |
|
(2) |
|
|
5,285 |
|
|
|
3,012 |
|
|
|
— |
|
|
|
— |
|
|
|
5,285 |
|
|
|
3,012 |
|
|
|
8,297 |
|
|
|
(479 |
) |
|
July, 2015 |
|
(3) |
F-38
|
|
|
|
|
|
|
|
|
|
|
|
|
|
|
Costs Capitalized |
|
|
Gross Amount at Which Carried |
|
|
|
|
|
|
|
|
|
||||||||||||||
|
|
|
|
|
|
|
Acquisition Costs |
|
|
Subsequent to Acquisition |
|
|
at Close of Period (1) |
|
|
|
|
|
|
|
|
Life Upon Which |
|||||||||||||||||||
|
|
|
|
|
|
|
|
|
|
|
Buildings and |
|
|
|
|
|
|
Buildings and |
|
|
|
|
|
|
Buildings and |
|
|
|
|
|
|
Accumulated |
|
|
Date |
|
Depreciation |
||||
|
Name of Center |
|
Location |
|
Encumbrances |
|
Land |
|
|
Improvements |
|
|
Land |
|
|
Improvements |
|
|
Land |
|
|
Improvements |
|
|
Total |
|
|
Depreciation |
|
|
Acquired |
|
is Computed |
||||||||
|
Stand-Alone Location |
|
Honolulu, HI |
|
(2) |
|
$ |
6,824 |
|
|
$ |
2,195 |
|
|
$ |
— |
|
|
$ |
19,207 |
|
|
$ |
6,824 |
|
|
$ |
21,402 |
|
|
$ |
28,226 |
|
|
$ |
(579 |
) |
|
July, 2015 |
|
(3) |
|
Stand-Alone Location |
|
Algona, IA |
|
(2) |
|
|
644 |
|
|
|
2,796 |
|
|
|
— |
|
|
|
— |
|
|
|
644 |
|
|
|
2,796 |
|
|
|
3,440 |
|
|
|
(395 |
) |
|
July, 2015 |
|
(3) |
|
Lindale Mall |
|
Cedar Rapids, IA |
|
(2) |
|
|
2,833 |
|
|
|
2,197 |
|
|
|
— |
|
|
|
— |
|
|
|
2,833 |
|
|
|
2,197 |
|
|
|
5,030 |
|
|
|
(446 |
) |
|
July, 2015 |
|
(3) |
|
Stand-Alone Location |
|
Charles City, IA |
|
(2) |
|
|
793 |
|
|
|
1,914 |
|
|
|
— |
|
|
|
— |
|
|
|
793 |
|
|
|
1,914 |
|
|
|
2,707 |
|
|
|
(453 |
) |
|
July, 2015 |
|
(3) |
|
Webster City Plaza |
|
Webster City, IA |
|
(2) |
|
|
392 |
|
|
|
896 |
|
|
|
— |
|
|
|
— |
|
|
|
392 |
|
|
|
896 |
|
|
|
1,288 |
|
|
|
(177 |
) |
|
July, 2015 |
|
(3) |
|
Boise Towne Center |
|
Boise, ID |
|
(2) |
|
|
1,828 |
|
|
|
1,848 |
|
|
|
— |
|
|
|
— |
|
|
|
1,828 |
|
|
|
1,848 |
|
|
|
3,676 |
|
|
|
(372 |
) |
|
July, 2015 |
|
(3) |
|
Stand-Alone Location |
|
Chicago, IL |
|
(2) |
|
|
3,665 |
|
|
|
3,504 |
|
|
|
— |
|
|
|
— |
|
|
|
3,665 |
|
|
|
3,504 |
|
|
|
7,169 |
|
|
|
(279 |
) |
|
July, 2015 |
|
(3) |
|
Stand-Alone Location |
|
Chicago, IL |
|
(2) |
|
|
905 |
|
|
|
804 |
|
|
|
— |
|
|
|
— |
|
|
|
905 |
|
|
|
804 |
|
|
|
1,709 |
|
|
|
(254 |
) |
|
July, 2015 |
|
(3) |
|
Kedzie Square |
|
Chicago, IL |
|
(2) |
|
|
2,385 |
|
|
|
7,924 |
|
|
|
— |
|
|
|
— |
|
|
|
2,385 |
|
|
|
7,924 |
|
|
|
10,309 |
|
|
|
(855 |
) |
|
July, 2015 |
|
(3) |
|
Homewood Square |
|
Homewood, IL |
|
(2) |
|
|
3,954 |
|
|
|
4,766 |
|
|
|
— |
|
|
|
36 |
|
|
|
3,954 |
|
|
|
4,802 |
|
|
|
8,756 |
|
|
|
(868 |
) |
|
July, 2015 |
|
(3) |
|
Louis Joliet Mall |
|
Joliet, IL |
|
(2) |
|
|
2,557 |
|
|
|
3,108 |
|
|
|
— |
|
|
|
— |
|
|
|
2,557 |
|
|
|
3,108 |
|
|
|
5,665 |
|
|
|
(886 |
) |
|
July, 2015 |
|
(3) |
|
Stand-Alone Location |
|
Lombard, IL |
|
(2) |
|
|
2,685 |
|
|
|
8,281 |
|
|
|
— |
|
|
|
— |
|
|
|
2,685 |
|
|
|
8,281 |
|
|
|
10,966 |
|
|
|
(742 |
) |
|
July, 2015 |
|
(3) |
|
Stand-Alone Location |
|
Moline, IL |
|
(2) |
|
|
2,010 |
|
|
|
751 |
|
|
|
— |
|
|
|
17 |
|
|
|
2,010 |
|
|
|
768 |
|
|
|
2,778 |
|
|
|
(367 |
) |
|
July, 2015 |
|
(3) |
|
North Riverside Park Mall |
|
N Riverside, IL |
|
(2) |
|
|
1,846 |
|
|
|
3,178 |
|
|
|
— |
|
|
|
— |
|
|
|
1,846 |
|
|
|
3,178 |
|
|
|
5,024 |
|
|
|
(665 |
) |
|
July, 2015 |
|
(3) |
|
Orland Square |
|
Orland Park, IL |
|
(2) |
|
|
1,783 |
|
|
|
974 |
|
|
|
— |
|
|
|
— |
|
|
|
1,783 |
|
|
|
974 |
|
|
|
2,757 |
|
|
|
(372 |
) |
|
July, 2015 |
|
(3) |
|
Sherwood Plaza |
|
Springfield, IL |
|
(2) |
|
|
2,182 |
|
|
|
5,051 |
|
|
|
— |
|
|
|
— |
|
|
|
2,182 |
|
|
|
5,051 |
|
|
|
7,233 |
|
|
|
(856 |
) |
|
July, 2015 |
|
(3) |
|
Stand-Alone Location |
|
Steger, IL |
|
(2) |
|
|
589 |
|
|
|
2,846 |
|
|
|
— |
|
|
|
— |
|
|
|
589 |
|
|
|
2,846 |
|
|
|
3,435 |
|
|
|
(260 |
) |
|
July, 2015 |
|
(3) |
|
North Pointe Plaza |
|
Elkhart, IN |
|
(2) |
|
|
1,349 |
|
|
|
869 |
|
|
|
— |
|
|
|
34 |
|
|
|
1,349 |
|
|
|
903 |
|
|
|
2,252 |
|
|
|
(213 |
) |
|
July, 2015 |
|
(3) |
|
Glenbrook Square |
|
Ft Wayne, IN |
|
(2) |
|
|
3,247 |
|
|
|
5,476 |
|
|
|
— |
|
|
|
1,024 |
|
|
|
3,247 |
|
|
|
6,500 |
|
|
|
9,747 |
|
|
|
(863 |
) |
|
July, 2015 |
|
(3) |
|
Broadway Center |
|
Merrillville, IN |
|
(2) |
|
|
3,413 |
|
|
|
3,224 |
|
|
|
— |
|
|
|
280 |
|
|
|
3,413 |
|
|
|
3,504 |
|
|
|
6,917 |
|
|
|
(847 |
) |
|
July, 2015 |
|
(3) |
|
Stand-Alone Location |
|
Leavenworth, KS |
|
(2) |
|
|
397 |
|
|
|
705 |
|
|
|
— |
|
|
|
— |
|
|
|
397 |
|
|
|
705 |
|
|
|
1,102 |
|
|
|
(273 |
) |
|
July, 2015 |
|
(3) |
|
Metcalf South Shopping Center |
|
Overland Pk, KS |
|
(2) |
|
|
2,775 |
|
|
|
1,766 |
|
|
|
— |
|
|
|
— |
|
|
|
2,775 |
|
|
|
1,766 |
|
|
|
4,541 |
|
|
|
(686 |
) |
|
July, 2015 |
|
(3) |
|
Pennyrile Marketplace |
|
Hopkinsville, KY |
|
(2) |
|
|
553 |
|
|
|
2,815 |
|
|
|
— |
|
|
|
— |
|
|
|
553 |
|
|
|
2,815 |
|
|
|
3,368 |
|
|
|
(556 |
) |
|
July, 2015 |
|
(3) |
|
Audubon Plaza |
|
Owensboro, KY |
|
(2) |
|
|
411 |
|
|
|
1,083 |
|
|
|
— |
|
|
|
— |
|
|
|
411 |
|
|
|
1,083 |
|
|
|
1,494 |
|
|
|
(180 |
) |
|
July, 2015 |
|
(3) |
|
Kentucky Oaks Mall |
|
Paducah, KY |
|
(2) |
|
|
1,022 |
|
|
|
2,868 |
|
|
|
— |
|
|
|
— |
|
|
|
1,022 |
|
|
|
2,868 |
|
|
|
3,890 |
|
|
|
(509 |
) |
|
July, 2015 |
|
(3) |
|
Stand-Alone Location |
|
Houma, LA |
|
(2) |
|
|
590 |
|
|
|
2,030 |
|
|
|
— |
|
|
|
— |
|
|
|
590 |
|
|
|
2,030 |
|
|
|
2,620 |
|
|
|
(411 |
) |
|
July, 2015 |
|
(3) |
|
Mall of Acadiana |
|
Lafayette, LA |
|
(2) |
|
|
1,406 |
|
|
|
5,094 |
|
|
|
— |
|
|
|
— |
|
|
|
1,406 |
|
|
|
5,094 |
|
|
|
6,500 |
|
|
|
(875 |
) |
|
July, 2015 |
|
(3) |
|
Stand-Alone Location |
|
New Iberia, LA |
|
(2) |
|
|
450 |
|
|
|
1,819 |
|
|
|
— |
|
|
|
— |
|
|
|
450 |
|
|
|
1,819 |
|
|
|
2,269 |
|
|
|
(504 |
) |
|
July, 2015 |
|
(3) |
|
Braintree Marketplace |
|
Braintree, MA |
|
(2) |
|
|
6,585 |
|
|
|
5,614 |
|
|
|
— |
|
|
|
11,607 |
|
|
|
6,585 |
|
|
|
17,221 |
|
|
|
23,806 |
|
|
|
(1,165 |
) |
|
July, 2015 |
|
(3) |
|
Square One Mall |
|
Saugus, MA |
|
(2) |
|
|
1,656 |
|
|
|
2,835 |
|
|
|
— |
|
|
|
— |
|
|
|
1,656 |
|
|
|
2,835 |
|
|
|
4,491 |
|
|
|
(716 |
) |
|
July, 2015 |
|
(3) |
|
Bowie Town Center |
|
Bowie, MD |
|
(2) |
|
|
4,583 |
|
|
|
2,335 |
|
|
|
— |
|
|
|
492 |
|
|
|
4,583 |
|
|
|
2,827 |
|
|
|
7,410 |
|
|
|
(490 |
) |
|
July, 2015 |
|
(3) |
|
Hunt Valley Mall |
|
Cockeysville, MD |
|
(2) |
|
|
5,768 |
|
|
|
2,319 |
|
|
|
— |
|
|
|
— |
|
|
|
5,768 |
|
|
|
2,319 |
|
|
|
8,087 |
|
|
|
(495 |
) |
|
July, 2015 |
|
(3) |
|
South River Colony |
|
Edgewater, MD |
|
(2) |
|
|
5,534 |
|
|
|
2,116 |
|
|
|
— |
|
|
|
— |
|
|
|
5,534 |
|
|
|
2,116 |
|
|
|
7,650 |
|
|
|
(549 |
) |
|
July, 2015 |
|
(3) |
|
Valley Mall |
|
Hagerstown, MD |
|
(2) |
|
|
2,877 |
|
|
|
1,378 |
|
|
|
— |
|
|
|
33 |
|
|
|
2,877 |
|
|
|
1,411 |
|
|
|
4,288 |
|
|
|
(516 |
) |
|
July, 2015 |
|
(3) |
|
Midtown Shopping Center |
|
Madawaska, ME |
|
(2) |
|
|
140 |
|
|
|
942 |
|
|
|
— |
|
|
|
— |
|
|
|
140 |
|
|
|
942 |
|
|
|
1,082 |
|
|
|
(104 |
) |
|
July, 2015 |
|
(3) |
|
Stand-Alone Location |
|
Alpena, MI |
|
(2) |
|
|
782 |
|
|
|
1,427 |
|
|
|
— |
|
|
|
— |
|
|
|
782 |
|
|
|
1,427 |
|
|
|
2,209 |
|
|
|
(395 |
) |
|
July, 2015 |
|
(3) |
|
Jackson Crossing |
|
Jackson, MI |
|
(2) |
|
|
2,720 |
|
|
|
1,184 |
|
|
|
— |
|
|
|
7 |
|
|
|
2,720 |
|
|
|
1,191 |
|
|
|
3,911 |
|
|
|
(406 |
) |
|
July, 2015 |
|
(3) |
|
Lincoln Park Shopping Center |
|
Lincoln Park, MI |
|
(2) |
|
|
1,106 |
|
|
|
3,198 |
|
|
|
— |
|
|
|
— |
|
|
|
1,106 |
|
|
|
3,198 |
|
|
|
4,304 |
|
|
|
(644 |
) |
|
July, 2015 |
|
(3) |
|
Hillside Plaza |
|
Manistee, MI |
|
(2) |
|
|
508 |
|
|
|
3,045 |
|
|
|
— |
|
|
|
— |
|
|
|
508 |
|
|
|
3,045 |
|
|
|
3,553 |
|
|
|
(608 |
) |
|
July, 2015 |
|
(3) |
|
Macomb Mall |
|
Roseville, MI |
|
(2) |
|
|
3,286 |
|
|
|
4,778 |
|
|
|
— |
|
|
|
740 |
|
|
|
3,286 |
|
|
|
5,518 |
|
|
|
8,804 |
|
|
|
(894 |
) |
|
July, 2015 |
|
(3) |
|
Stand-Alone Location |
|
Sault Ste. Marie, MI |
|
(2) |
|
|
946 |
|
|
|
917 |
|
|
|
— |
|
|
|
— |
|
|
|
946 |
|
|
|
917 |
|
|
|
1,863 |
|
|
|
(344 |
) |
|
July, 2015 |
|
(3) |
|
Stand-Alone Location |
|
St. Clair Shores, MI |
|
(2) |
|
|
2,399 |
|
|
|
1,797 |
|
|
|
— |
|
|
|
15 |
|
|
|
2,399 |
|
|
|
1,812 |
|
|
|
4,211 |
|
|
|
(373 |
) |
|
July, 2015 |
|
(3) |
F-39
|
|
|
|
|
|
|
|
|
|
|
|
|
|
|
Costs Capitalized |
|
|
Gross Amount at Which Carried |
|
|
|
|
|
|
|
|
|
||||||||||||||
|
|
|
|
|
|
|
Acquisition Costs |
|
|
Subsequent to Acquisition |
|
|
at Close of Period (1) |
|
|
|
|
|
|
|
|
Life Upon Which |
|||||||||||||||||||
|
|
|
|
|
|
|
|
|
|
|
Buildings and |
|
|
|
|
|
|
Buildings and |
|
|
|
|
|
|
Buildings and |
|
|
|
|
|
|
Accumulated |
|
|
Date |
|
Depreciation |
||||
|
Name of Center |
|
Location |
|
Encumbrances |
|
Land |
|
|
Improvements |
|
|
Land |
|
|
Improvements |
|
|
Land |
|
|
Improvements |
|
|
Total |
|
|
Depreciation |
|
|
Acquired |
|
is Computed |
||||||||
|
Oakland Mall |
|
Troy, MI |
|
(2) |
|
$ |
7,954 |
|
|
$ |
2,651 |
|
|
$ |
— |
|
|
$ |
4,426 |
|
|
$ |
7,954 |
|
|
$ |
7,077 |
|
|
$ |
15,031 |
|
|
$ |
(1,060 |
) |
|
July, 2015 |
|
(3) |
|
Stand-Alone Location |
|
Ypsilanti, MI |
|
(2) |
|
|
2,462 |
|
|
|
1,277 |
|
|
|
— |
|
|
|
— |
|
|
|
2,462 |
|
|
|
1,277 |
|
|
|
3,739 |
|
|
|
(531 |
) |
|
July, 2015 |
|
(3) |
|
Burnsville Center |
|
Burnsville, MN |
|
(2) |
|
|
3,513 |
|
|
|
1,281 |
|
|
|
— |
|
|
|
— |
|
|
|
3,513 |
|
|
|
1,281 |
|
|
|
4,794 |
|
|
|
(639 |
) |
|
July, 2015 |
|
(3) |
|
Detroit Lakes K Mart Plaza |
|
Detroit Lakes, MN |
|
(2) |
|
|
1,130 |
|
|
|
1,220 |
|
|
|
— |
|
|
|
— |
|
|
|
1,130 |
|
|
|
1,220 |
|
|
|
2,350 |
|
|
|
(501 |
) |
|
July, 2015 |
|
(3) |
|
Maplewood Mall |
|
Maplewood, MN |
|
(2) |
|
|
3,605 |
|
|
|
1,162 |
|
|
|
— |
|
|
|
— |
|
|
|
3,605 |
|
|
|
1,162 |
|
|
|
4,767 |
|
|
|
(504 |
) |
|
July, 2015 |
|
(3) |
|
Stand-Alone Location |
|
St Paul, MN |
|
(2) |
|
|
1,866 |
|
|
|
1,028 |
|
|
|
— |
|
|
|
— |
|
|
|
1,866 |
|
|
|
1,028 |
|
|
|
2,894 |
|
|
|
(458 |
) |
|
July, 2015 |
|
(3) |
|
Stand-Alone Location |
|
Cape Girardeau, MO |
|
(2) |
|
|
609 |
|
|
|
908 |
|
|
|
— |
|
|
|
— |
|
|
|
609 |
|
|
|
908 |
|
|
|
1,517 |
|
|
|
(167 |
) |
|
July, 2015 |
|
(3) |
|
Flower Valley Shopping Center |
|
Florissant, MO |
|
(2) |
|
|
2,430 |
|
|
|
1,607 |
|
|
|
— |
|
|
|
— |
|
|
|
2,430 |
|
|
|
1,607 |
|
|
|
4,037 |
|
|
|
(489 |
) |
|
July, 2015 |
|
(3) |
|
Stand-Alone Location |
|
Jefferson City, MO |
|
(2) |
|
|
957 |
|
|
|
2,224 |
|
|
|
— |
|
|
|
— |
|
|
|
957 |
|
|
|
2,224 |
|
|
|
3,181 |
|
|
|
(406 |
) |
|
July, 2015 |
|
(3) |
|
Kickapoo Corners |
|
Springfield, MO |
|
(2) |
|
|
922 |
|
|
|
2,050 |
|
|
|
— |
|
|
|
31 |
|
|
|
922 |
|
|
|
2,081 |
|
|
|
3,003 |
|
|
|
(330 |
) |
|
July, 2015 |
|
(3) |
|
Columbus Centre |
|
Columbus, MS |
|
(2) |
|
|
2,940 |
|
|
|
2,547 |
|
|
|
— |
|
|
|
1,064 |
|
|
|
2,940 |
|
|
|
3,611 |
|
|
|
6,551 |
|
|
|
(710 |
) |
|
July, 2015 |
|
(3) |
|
Stand-Alone Location |
|
Havre, MT |
|
(2) |
|
|
600 |
|
|
|
790 |
|
|
|
— |
|
|
|
— |
|
|
|
600 |
|
|
|
790 |
|
|
|
1,390 |
|
|
|
(241 |
) |
|
July, 2015 |
|
(3) |
|
Asheville Mall |
|
Asheville, NC |
|
(2) |
|
|
4,141 |
|
|
|
2,036 |
|
|
|
— |
|
|
|
— |
|
|
|
4,141 |
|
|
|
2,036 |
|
|
|
6,177 |
|
|
|
(584 |
) |
|
July, 2015 |
|
(3) |
|
Concord Plaza |
|
Concord, NC |
|
(2) |
|
|
2,325 |
|
|
|
1,275 |
|
|
|
— |
|
|
|
— |
|
|
|
2,325 |
|
|
|
1,275 |
|
|
|
3,600 |
|
|
|
(578 |
) |
|
July, 2015 |
|
(3) |
|
Landmark Center |
|
Greensboro, NC |
|
(2) |
|
|
3,869 |
|
|
|
4,387 |
|
|
|
— |
|
|
|
749 |
|
|
|
3,869 |
|
|
|
5,136 |
|
|
|
9,005 |
|
|
|
(806 |
) |
|
July, 2015 |
|
(3) |
|
Kmart Shopping Center |
|
Minot, ND |
|
(2) |
|
|
1,724 |
|
|
|
2,925 |
|
|
|
— |
|
|
|
— |
|
|
|
1,724 |
|
|
|
2,925 |
|
|
|
4,649 |
|
|
|
(534 |
) |
|
July, 2015 |
|
(3) |
|
Stand-Alone Location |
|
Kearney, NE |
|
(2) |
|
|
272 |
|
|
|
483 |
|
|
|
— |
|
|
|
— |
|
|
|
272 |
|
|
|
483 |
|
|
|
755 |
|
|
|
(164 |
) |
|
July, 2015 |
|
(3) |
|
The Mall of New Hampshire |
|
Manchester, NH |
|
(2) |
|
|
1,458 |
|
|
|
4,160 |
|
|
|
— |
|
|
|
— |
|
|
|
1,458 |
|
|
|
4,160 |
|
|
|
5,618 |
|
|
|
(592 |
) |
|
July, 2015 |
|
(3) |
|
Pheasant Lane Mall |
|
Nashua, NH |
|
(2) |
|
|
1,794 |
|
|
|
7,255 |
|
|
|
— |
|
|
|
— |
|
|
|
1,794 |
|
|
|
7,255 |
|
|
|
9,049 |
|
|
|
(566 |
) |
|
July, 2015 |
|
(3) |
|
Fox Run Mall |
|
Portsmouth, NH |
|
(2) |
|
|
3,934 |
|
|
|
3,375 |
|
|
|
— |
|
|
|
— |
|
|
|
3,934 |
|
|
|
3,375 |
|
|
|
7,309 |
|
|
|
(717 |
) |
|
July, 2015 |
|
(3) |
|
The Mall at Rockingham Park |
|
Salem, NH |
|
(2) |
|
|
3,321 |
|
|
|
12,198 |
|
|
|
— |
|
|
|
— |
|
|
|
3,321 |
|
|
|
12,198 |
|
|
|
15,519 |
|
|
|
(1,285 |
) |
|
July, 2015 |
|
(3) |
|
Stand-Alone Location |
|
Middletown, NJ |
|
(2) |
|
|
5,647 |
|
|
|
2,941 |
|
|
|
— |
|
|
|
233 |
|
|
|
5,647 |
|
|
|
3,174 |
|
|
|
8,821 |
|
|
|
(1,323 |
) |
|
July, 2015 |
|
(3) |
|
Stand-Alone Location |
|
Watchung, NYC |
|
(2) |
|
|
6,704 |
|
|
|
4,110 |
|
|
|
— |
|
|
|
— |
|
|
|
6,704 |
|
|
|
4,110 |
|
|
|
10,814 |
|
|
|
(910 |
) |
|
July, 2015 |
|
(3) |
|
Stand-Alone Location |
|
Deming, NM |
|
(2) |
|
|
1,085 |
|
|
|
1,194 |
|
|
|
— |
|
|
|
— |
|
|
|
1,085 |
|
|
|
1,194 |
|
|
|
2,279 |
|
|
|
(338 |
) |
|
July, 2015 |
|
(3) |
|
Stand-Alone Location |
|
Farmington, NM |
|
(2) |
|
|
1,480 |
|
|
|
1,845 |
|
|
|
— |
|
|
|
— |
|
|
|
1,480 |
|
|
|
1,845 |
|
|
|
3,325 |
|
|
|
(417 |
) |
|
July, 2015 |
|
(3) |
|
Kmart Shopping Center |
|
Hobbs, NM |
|
(2) |
|
|
1,386 |
|
|
|
2,557 |
|
|
|
— |
|
|
|
— |
|
|
|
1,386 |
|
|
|
2,557 |
|
|
|
3,943 |
|
|
|
(438 |
) |
|
July, 2015 |
|
(3) |
|
Eastern Commons Shopping Center |
|
Henderson, NV |
|
(2) |
|
|
3,124 |
|
|
|
1,362 |
|
|
|
— |
|
|
|
2,150 |
|
|
|
3,124 |
|
|
|
3,512 |
|
|
|
6,636 |
|
|
|
(522 |
) |
|
July, 2015 |
|
(3) |
|
Meadows Mall |
|
Las Vegas(Meadows), NV |
|
(2) |
|
|
3,354 |
|
|
|
1,879 |
|
|
|
— |
|
|
|
— |
|
|
|
3,354 |
|
|
|
1,879 |
|
|
|
5,233 |
|
|
|
(554 |
) |
|
July, 2015 |
|
(3) |
|
Meadowood Mall |
|
Reno, NV |
|
(2) |
|
|
2,135 |
|
|
|
5,748 |
|
|
|
— |
|
|
|
— |
|
|
|
2,135 |
|
|
|
5,748 |
|
|
|
7,883 |
|
|
|
(481 |
) |
|
July, 2015 |
|
(3) |
|
Colonie Center |
|
Albany, NY |
|
(2) |
|
|
8,289 |
|
|
|
6,523 |
|
|
|
— |
|
|
|
— |
|
|
|
8,289 |
|
|
|
6,523 |
|
|
|
14,812 |
|
|
|
(1,191 |
) |
|
July, 2015 |
|
(3) |
|
Great Northern Mall |
|
Clay, NY |
|
(2) |
|
|
787 |
|
|
|
4,134 |
|
|
|
— |
|
|
|
— |
|
|
|
787 |
|
|
|
4,134 |
|
|
|
4,921 |
|
|
|
(619 |
) |
|
July, 2015 |
|
(3) |
|
Huntington Square Mall |
|
East Northport, NY |
|
(2) |
|
|
7,617 |
|
|
|
2,065 |
|
|
|
— |
|
|
|
— |
|
|
|
7,617 |
|
|
|
2,065 |
|
|
|
9,682 |
|
|
|
(632 |
) |
|
July, 2015 |
|
(3) |
|
Stand-Alone Location |
|
Hicksville, NYC |
|
(2) |
|
|
38,626 |
|
|
|
19,065 |
|
|
|
— |
|
|
|
9 |
|
|
|
38,626 |
|
|
|
19,074 |
|
|
|
57,700 |
|
|
|
(2,596 |
) |
|
July, 2015 |
|
(3) |
|
Oakdale Mall |
|
Johnson City, NY |
|
(2) |
|
|
2,169 |
|
|
|
934 |
|
|
|
— |
|
|
|
— |
|
|
|
2,169 |
|
|
|
934 |
|
|
|
3,103 |
|
|
|
(307 |
) |
|
July, 2015 |
|
(3) |
|
Stand-Alone Location |
|
Olean, NY |
|
(2) |
|
|
249 |
|
|
|
2,124 |
|
|
|
— |
|
|
|
— |
|
|
|
249 |
|
|
|
2,124 |
|
|
|
2,373 |
|
|
|
(407 |
) |
|
July, 2015 |
|
(3) |
|
Greece Ridge Center |
|
Rochester-Greece, NY |
|
(2) |
|
|
3,082 |
|
|
|
1,560 |
|
|
|
— |
|
|
|
— |
|
|
|
3,082 |
|
|
|
1,560 |
|
|
|
4,642 |
|
|
|
(515 |
) |
|
July, 2015 |
|
(3) |
|
Sidney Plaza |
|
Sidney, NY |
|
(2) |
|
|
1,942 |
|
|
|
1,769 |
|
|
|
— |
|
|
|
— |
|
|
|
1,942 |
|
|
|
1,769 |
|
|
|
3,711 |
|
|
|
(836 |
) |
|
July, 2015 |
|
(3) |
|
Eastview Mal |
|
Victor, NY |
|
(2) |
|
|
4,144 |
|
|
|
1,391 |
|
|
|
— |
|
|
|
— |
|
|
|
4,144 |
|
|
|
1,391 |
|
|
|
5,535 |
|
|
|
(538 |
) |
|
July, 2015 |
|
(3) |
|
Jefferson Valley Mall |
|
Yorktown Hts, NY |
|
(2) |
|
|
3,584 |
|
|
|
1,569 |
|
|
|
— |
|
|
|
— |
|
|
|
3,584 |
|
|
|
1,569 |
|
|
|
5,153 |
|
|
|
(573 |
) |
|
July, 2015 |
|
(3) |
|
Westfield Belden Village |
|
Canton, OH |
|
(2) |
|
|
1,650 |
|
|
|
5,854 |
|
|
|
— |
|
|
|
— |
|
|
|
1,650 |
|
|
|
5,854 |
|
|
|
7,504 |
|
|
|
(1,075 |
) |
|
July, 2015 |
|
(3) |
|
Chapel Hill Mall |
|
Chapel Hill, OH |
|
(2) |
|
|
444 |
|
|
|
1,460 |
|
|
|
— |
|
|
|
— |
|
|
|
444 |
|
|
|
1,460 |
|
|
|
1,904 |
|
|
|
(777 |
) |
|
July, 2015 |
|
(3) |
|
Dayton Mall |
|
Dayton Mall, OH |
|
(2) |
|
|
2,650 |
|
|
|
1,223 |
|
|
|
— |
|
|
|
— |
|
|
|
2,650 |
|
|
|
1,223 |
|
|
|
3,873 |
|
|
|
(528 |
) |
|
July, 2015 |
|
(3) |
F-40
|
|
|
|
|
|
|
|
|
|
|
|
|
|
|
Costs Capitalized |
|
|
Gross Amount at Which Carried |
|
|
|
|
|
|
|
|
|
||||||||||||||
|
|
|
|
|
|
|
Acquisition Costs |
|
|
Subsequent to Acquisition |
|
|
at Close of Period (1) |
|
|
|
|
|
|
|
|
Life Upon Which |
|||||||||||||||||||
|
|
|
|
|
|
|
|
|
|
|
Buildings and |
|
|
|
|
|
|
Buildings and |
|
|
|
|
|
|
Buildings and |
|
|
|
|
|
|
Accumulated |
|
|
Date |
|
Depreciation |
||||
|
Name of Center |
|
Location |
|
Encumbrances |
|
Land |
|
|
Improvements |
|
|
Land |
|
|
Improvements |
|
|
Land |
|
|
Improvements |
|
|
Total |
|
|
Depreciation |
|
|
Acquired |
|
is Computed |
||||||||
|
Stand-Alone Location |
|
Kenton, OH |
|
(2) |
|
$ |
340 |
|
|
$ |
417 |
|
|
$ |
— |
|
|
$ |
— |
|
|
$ |
340 |
|
|
$ |
417 |
|
|
$ |
757 |
|
|
$ |
(273 |
) |
|
July, 2015 |
|
(3) |
|
Stand-Alone Location |
|
Marietta, OH |
|
(2) |
|
|
598 |
|
|
|
706 |
|
|
|
— |
|
|
|
— |
|
|
|
598 |
|
|
|
706 |
|
|
|
1,304 |
|
|
|
(225 |
) |
|
July, 2015 |
|
(3) |
|
Great Lakes Mall |
|
Mentor, OH |
|
(2) |
|
|
1,092 |
|
|
|
1,776 |
|
|
|
— |
|
|
|
— |
|
|
|
1,092 |
|
|
|
1,776 |
|
|
|
2,868 |
|
|
|
(572 |
) |
|
July, 2015 |
|
(3) |
|
Southland Shopping Center |
|
Middleburg Hts, OH |
|
(2) |
|
|
698 |
|
|
|
1,547 |
|
|
|
— |
|
|
|
— |
|
|
|
698 |
|
|
|
1,547 |
|
|
|
2,245 |
|
|
|
(374 |
) |
|
July, 2015 |
|
(3) |
|
Kmart Plaza |
|
North Canton, OH |
|
(2) |
|
|
1,044 |
|
|
|
1,126 |
|
|
|
— |
|
|
|
— |
|
|
|
1,044 |
|
|
|
1,126 |
|
|
|
2,170 |
|
|
|
(324 |
) |
|
July, 2015 |
|
(3) |
|
Stand-Alone Location |
|
Tallmadge, OH |
|
(2) |
|
|
870 |
|
|
|
682 |
|
|
|
— |
|
|
|
— |
|
|
|
870 |
|
|
|
682 |
|
|
|
1,552 |
|
|
|
(296 |
) |
|
July, 2015 |
|
(3) |
|
Westgate Village Shopping Center |
|
Toledo, OH |
|
(2) |
|
|
1,664 |
|
|
|
1,289 |
|
|
|
— |
|
|
|
— |
|
|
|
1,664 |
|
|
|
1,289 |
|
|
|
2,953 |
|
|
|
(378 |
) |
|
July, 2015 |
|
(3) |
|
Stand-Alone Location |
|
Muskogee, OK |
|
(2) |
|
|
647 |
|
|
|
966 |
|
|
|
— |
|
|
|
— |
|
|
|
647 |
|
|
|
966 |
|
|
|
1,613 |
|
|
|
(361 |
) |
|
July, 2015 |
|
(3) |
|
Stand-Alone Location |
|
Okla City/Sequoyah, OK |
|
(2) |
|
|
1,542 |
|
|
|
2,210 |
|
|
|
— |
|
|
|
— |
|
|
|
1,542 |
|
|
|
2,210 |
|
|
|
3,752 |
|
|
|
(1,017 |
) |
|
July, 2015 |
|
(3) |
|
Stand-Alone Location |
|
Tulsa, OK |
|
(2) |
|
|
2,048 |
|
|
|
5,386 |
|
|
|
— |
|
|
|
1,711 |
|
|
|
2,048 |
|
|
|
7,097 |
|
|
|
9,145 |
|
|
|
(921 |
) |
|
July, 2015 |
|
(3) |
|
Clackamas Town Center |
|
Happy Valley, OR |
|
(2) |
|
|
6,659 |
|
|
|
1,271 |
|
|
|
— |
|
|
|
— |
|
|
|
6,659 |
|
|
|
1,271 |
|
|
|
7,930 |
|
|
|
(270 |
) |
|
July, 2015 |
|
(3) |
|
Stand-Alone Location |
|
The Dalles, OR |
|
(2) |
|
|
616 |
|
|
|
775 |
|
|
|
— |
|
|
|
— |
|
|
|
616 |
|
|
|
775 |
|
|
|
1,391 |
|
|
|
(256 |
) |
|
July, 2015 |
|
(3) |
|
Walnut Bottom Towne Centre |
|
Carlisle, PA |
|
(2) |
|
|
1,103 |
|
|
|
1,725 |
|
|
|
— |
|
|
|
— |
|
|
|
1,103 |
|
|
|
1,725 |
|
|
|
2,828 |
|
|
|
(130 |
) |
|
July, 2015 |
|
(3) |
|
Shops at Prospect |
|
Columbia, PA |
|
(2) |
|
|
897 |
|
|
|
2,202 |
|
|
|
— |
|
|
|
6 |
|
|
|
897 |
|
|
|
2,208 |
|
|
|
3,105 |
|
|
|
(342 |
) |
|
July, 2015 |
|
(3) |
|
King of Prussia |
|
King of Prussia, PA |
|
(2) |
|
|
— |
|
|
|
42,300 |
|
|
|
— |
|
|
|
2,705 |
|
|
|
- |
|
|
|
45,005 |
|
|
|
45,005 |
|
|
|
(3,264 |
) |
|
July, 2015 |
|
(3) |
|
Kmart & Lowes Shopping Center |
|
Lebanon, PA |
|
(2) |
|
|
1,333 |
|
|
|
2,085 |
|
|
|
— |
|
|
|
— |
|
|
|
1,333 |
|
|
|
2,085 |
|
|
|
3,418 |
|
|
|
(743 |
) |
|
July, 2015 |
|
(3) |
|
Countryside Shopping Center |
|
Mount Pleasant, PA |
|
(2) |
|
|
970 |
|
|
|
1,520 |
|
|
|
— |
|
|
|
— |
|
|
|
970 |
|
|
|
1,520 |
|
|
|
2,490 |
|
|
|
(474 |
) |
|
July, 2015 |
|
(3) |
|
Stand-Alone Location |
|
Walnutport, PA |
|
(2) |
|
|
885 |
|
|
|
3,452 |
|
|
|
— |
|
|
|
— |
|
|
|
885 |
|
|
|
3,452 |
|
|
|
4,337 |
|
|
|
(756 |
) |
|
July, 2015 |
|
(3) |
|
Haines Acres Shopping Center |
|
York, PA |
|
(2) |
|
|
1,096 |
|
|
|
1,414 |
|
|
|
— |
|
|
|
3 |
|
|
|
1,096 |
|
|
|
1,417 |
|
|
|
2,513 |
|
|
|
(302 |
) |
|
July, 2015 |
|
(3) |
|
Rexville (Bayamon) Towne Center |
|
Bayamon, PR |
|
(2) |
|
|
656 |
|
|
|
7,173 |
|
|
|
— |
|
|
|
1 |
|
|
|
656 |
|
|
|
7,174 |
|
|
|
7,830 |
|
|
|
(731 |
) |
|
July, 2015 |
|
(3) |
|
Caguas Mall |
|
Caguas, PR |
|
(2) |
|
|
431 |
|
|
|
9,362 |
|
|
|
— |
|
|
|
— |
|
|
|
431 |
|
|
|
9,362 |
|
|
|
9,793 |
|
|
|
(902 |
) |
|
July, 2015 |
|
(3) |
|
Plaza Carolina Mall |
|
Carolina, PR |
|
(2) |
|
|
611 |
|
|
|
8,640 |
|
|
|
— |
|
|
|
— |
|
|
|
611 |
|
|
|
8,640 |
|
|
|
9,251 |
|
|
|
(981 |
) |
|
July, 2015 |
|
(3) |
|
Plaza Guaynabo |
|
Guaynabo, PR |
|
(2) |
|
|
1,603 |
|
|
|
26,695 |
|
|
|
— |
|
|
|
123 |
|
|
|
1,603 |
|
|
|
26,818 |
|
|
|
28,421 |
|
|
|
(2,362 |
) |
|
July, 2015 |
|
(3) |
|
Western Plaza |
|
Mayaguez, PR |
|
(2) |
|
|
564 |
|
|
|
4,555 |
|
|
|
— |
|
|
|
— |
|
|
|
564 |
|
|
|
4,555 |
|
|
|
5,119 |
|
|
|
(647 |
) |
|
July, 2015 |
|
(3) |
|
Ponce Towne Center |
|
Ponce, PR |
|
(2) |
|
|
473 |
|
|
|
3,965 |
|
|
|
— |
|
|
|
— |
|
|
|
473 |
|
|
|
3,965 |
|
|
|
4,438 |
|
|
|
(533 |
) |
|
July, 2015 |
|
(3) |
|
Rhode Island Mall |
|
Warwick, RI |
|
(2) |
|
|
9,166 |
|
|
|
3,388 |
|
|
|
— |
|
|
|
— |
|
|
|
9,166 |
|
|
|
3,388 |
|
|
|
12,554 |
|
|
|
(927 |
) |
|
July, 2015 |
|
(3) |
|
Boulevard Market Fair |
|
Anderson, SC |
|
(2) |
|
|
1,297 |
|
|
|
638 |
|
|
|
— |
|
|
|
5,357 |
|
|
|
1,297 |
|
|
|
5,995 |
|
|
|
7,292 |
|
|
|
(289 |
) |
|
July, 2015 |
|
(3) |
|
Northwoods Mall |
|
Chrlstn/Northwoods, SC |
|
(2) |
|
|
3,576 |
|
|
|
1,497 |
|
|
|
— |
|
|
|
— |
|
|
|
3,576 |
|
|
|
1,497 |
|
|
|
5,073 |
|
|
|
(479 |
) |
|
July, 2015 |
|
(3) |
|
Kmart Plaza |
|
Rock Hill, SC |
|
(2) |
|
|
1,432 |
|
|
|
1,079 |
|
|
|
— |
|
|
|
— |
|
|
|
1,432 |
|
|
|
1,079 |
|
|
|
2,511 |
|
|
|
(391 |
) |
|
July, 2015 |
|
(3) |
|
Stand-Alone Location |
|
Sioux Falls, SD |
|
(2) |
|
|
1,025 |
|
|
|
1,783 |
|
|
|
— |
|
|
|
— |
|
|
|
1,025 |
|
|
|
1,783 |
|
|
|
2,808 |
|
|
|
(260 |
) |
|
July, 2015 |
|
(3) |
|
Wolfchase Galleria |
|
Cordova, TN |
|
(2) |
|
|
2,581 |
|
|
|
4,279 |
|
|
|
— |
|
|
|
— |
|
|
|
2,581 |
|
|
|
4,279 |
|
|
|
6,860 |
|
|
|
(578 |
) |
|
July, 2015 |
|
(3) |
|
Stand-Alone Location |
|
Memphis/Poplar, TN |
|
(2) |
|
|
2,827 |
|
|
|
2,475 |
|
|
|
— |
|
|
|
15,581 |
|
|
|
2,827 |
|
|
|
18,056 |
|
|
|
20,883 |
|
|
|
(45 |
) |
|
July, 2015 |
|
(3) |
|
Tech Ridge |
|
Austin, TX |
|
(2) |
|
|
3,164 |
|
|
|
2,858 |
|
|
|
— |
|
|
|
— |
|
|
|
3,164 |
|
|
|
2,858 |
|
|
|
6,022 |
|
|
|
(778 |
) |
|
July, 2015 |
|
(3) |
|
Southwest Center Mall |
|
Southwest Ctr, TX |
|
(2) |
|
|
1,154 |
|
|
|
1,314 |
|
|
|
— |
|
|
|
— |
|
|
|
1,154 |
|
|
|
1,314 |
|
|
|
2,468 |
|
|
|
(475 |
) |
|
July, 2015 |
|
(3) |
|
Stand-Alone Location |
|
El Paso, TX |
|
(2) |
|
|
2,008 |
|
|
|
1,778 |
|
|
|
— |
|
|
|
— |
|
|
|
2,008 |
|
|
|
1,778 |
|
|
|
3,786 |
|
|
|
(415 |
) |
|
July, 2015 |
|
(3) |
|
Baybrook Mall |
|
Friendswd/Baybrk, TX |
|
(2) |
|
|
6,124 |
|
|
|
2,038 |
|
|
|
— |
|
|
|
— |
|
|
|
6,124 |
|
|
|
2,038 |
|
|
|
8,162 |
|
|
|
(530 |
) |
|
July, 2015 |
|
(3) |
|
Kmart Plaza |
|
Harlingen, TX |
|
(2) |
|
|
1,795 |
|
|
|
1,183 |
|
|
|
— |
|
|
|
— |
|
|
|
1,795 |
|
|
|
1,183 |
|
|
|
2,978 |
|
|
|
(207 |
) |
|
July, 2015 |
|
(3) |
|
Memorial City SC |
|
Memorial, TX |
|
(2) |
|
|
7,967 |
|
|
|
4,625 |
|
|
|
— |
|
|
|
— |
|
|
|
7,967 |
|
|
|
4,625 |
|
|
|
12,592 |
|
|
|
(1,062 |
) |
|
July, 2015 |
|
(3) |
|
Stand-Alone Location |
|
Houston, TX |
|
(2) |
|
|
6,110 |
|
|
|
1,525 |
|
|
|
— |
|
|
|
— |
|
|
|
6,110 |
|
|
|
1,525 |
|
|
|
7,635 |
|
|
|
(415 |
) |
|
July, 2015 |
|
(3) |
|
Ingram Park Mall |
|
Ingram, TX |
|
(2) |
|
|
4,651 |
|
|
|
2,560 |
|
|
|
— |
|
|
|
— |
|
|
|
4,651 |
|
|
|
2,560 |
|
|
|
7,211 |
|
|
|
(513 |
) |
|
July, 2015 |
|
(3) |
|
Irving Mall |
|
Irving, TX |
|
(2) |
|
|
4,493 |
|
|
|
5,743 |
|
|
|
— |
|
|
|
— |
|
|
|
4,493 |
|
|
|
5,743 |
|
|
|
10,236 |
|
|
|
(942 |
) |
|
July, 2015 |
|
(3) |
|
Stand-Alone Location |
|
Central Park, TX |
|
(2) |
|
|
5,468 |
|
|
|
1,457 |
|
|
|
— |
|
|
|
2,840 |
|
|
|
5,468 |
|
|
|
4,297 |
|
|
|
9,765 |
|
|
|
(458 |
) |
|
July, 2015 |
|
(3) |
F-41
|
|
|
|
|
|
|
|
|
|
|
|
|
|
|
Costs Capitalized |
|
|
Gross Amount at Which Carried |
|
|
|
|
|
|
|
|
|
||||||||||||||
|
|
|
|
|
|
|
Acquisition Costs |
|
|
Subsequent to Acquisition |
|
|
at Close of Period (1) |
|
|
|
|
|
|
|
|
Life Upon Which |
|||||||||||||||||||
|
|
|
|
|
|
|
|
|
|
|
Buildings and |
|
|
|
|
|
|
Buildings and |
|
|
|
|
|
|
Buildings and |
|
|
|
|
|
|
Accumulated |
|
|
Date |
|
Depreciation |
||||
|
Name of Center |
|
Location |
|
Encumbrances |
|
Land |
|
|
Improvements |
|
|
Land |
|
|
Improvements |
|
|
Land |
|
|
Improvements |
|
|
Total |
|
|
Depreciation |
|
|
Acquired |
|
is Computed |
||||||||
|
Stand-Alone Location |
|
Shepherd, TX |
|
(2) |
|
$ |
5,457 |
|
|
$ |
2,081 |
|
|
$ |
— |
|
|
$ |
— |
|
|
$ |
5,457 |
|
|
$ |
2,081 |
|
|
$ |
7,538 |
|
|
$ |
(468 |
) |
|
July, 2015 |
|
(3) |
|
Valley View Center |
|
Valley View, TX |
|
(2) |
|
|
4,706 |
|
|
|
3,230 |
|
|
|
— |
|
|
|
— |
|
|
|
4,706 |
|
|
|
3,230 |
|
|
|
7,936 |
|
|
|
(984 |
) |
|
July, 2015 |
|
(3) |
|
Stand-Alone Location |
|
Westwood, TX |
|
(2) |
|
|
2,899 |
|
|
|
1,748 |
|
|
|
— |
|
|
|
— |
|
|
|
2,899 |
|
|
|
1,748 |
|
|
|
4,647 |
|
|
|
(598 |
) |
|
July, 2015 |
|
(3) |
|
Antelope Square |
|
Layton, UT |
|
(2) |
|
|
2,234 |
|
|
|
974 |
|
|
|
— |
|
|
|
3,477 |
|
|
|
2,234 |
|
|
|
4,451 |
|
|
|
6,685 |
|
|
|
(590 |
) |
|
July, 2015 |
|
(3) |
|
Jordan Landing Shopping Center |
|
West Jordan, UT |
|
(2) |
|
|
3,190 |
|
|
|
2,305 |
|
|
|
— |
|
|
|
6,014 |
|
|
|
3,190 |
|
|
|
8,319 |
|
|
|
11,509 |
|
|
|
(520 |
) |
|
July, 2015 |
|
(3) |
|
Landmark Mall |
|
Alexandria, VA |
|
(2) |
|
|
3,728 |
|
|
|
3,294 |
|
|
|
— |
|
|
|
— |
|
|
|
3,728 |
|
|
|
3,294 |
|
|
|
7,022 |
|
|
|
(870 |
) |
|
July, 2015 |
|
(3) |
|
Greenbrier Mall |
|
Chspk/Greenbrier, VA |
|
(2) |
|
|
4,236 |
|
|
|
1,700 |
|
|
|
— |
|
|
|
— |
|
|
|
4,236 |
|
|
|
1,700 |
|
|
|
5,936 |
|
|
|
(527 |
) |
|
July, 2015 |
|
(3) |
|
Fair Oaks Mall |
|
Fairfax, VA |
|
(2) |
|
|
10,873 |
|
|
|
1,491 |
|
|
|
— |
|
|
|
— |
|
|
|
10,873 |
|
|
|
1,491 |
|
|
|
12,364 |
|
|
|
(440 |
) |
|
July, 2015 |
|
(3) |
|
Newmarket Fair Mall |
|
Hampton, VA |
|
(2) |
|
|
771 |
|
|
|
1,011 |
|
|
|
— |
|
|
|
— |
|
|
|
771 |
|
|
|
1,011 |
|
|
|
1,782 |
|
|
|
(470 |
) |
|
July, 2015 |
|
(3) |
|
Pembroke Mall |
|
Virginia Beach, VA |
|
(2) |
|
|
10,414 |
|
|
|
4,760 |
|
|
|
— |
|
|
|
13,034 |
|
|
|
10,414 |
|
|
|
17,794 |
|
|
|
28,208 |
|
|
|
(1,581 |
) |
|
July, 2015 |
|
(3) |
|
Warrenton Village |
|
Warrenton, VA |
|
(2) |
|
|
1,956 |
|
|
|
2,480 |
|
|
|
— |
|
|
|
— |
|
|
|
1,956 |
|
|
|
2,480 |
|
|
|
4,436 |
|
|
|
(396 |
) |
|
July, 2015 |
|
(3) |
|
Overlake Plaza |
|
Redmond-Overlake Pk, WA |
|
(2) |
|
|
5,133 |
|
|
|
4,133 |
|
|
|
— |
|
|
|
— |
|
|
|
5,133 |
|
|
|
4,133 |
|
|
|
9,266 |
|
|
|
(849 |
) |
|
July, 2015 |
|
(3) |
|
Westfield Vancouver |
|
Vancouver, WA |
|
(2) |
|
|
3,378 |
|
|
|
1,136 |
|
|
|
— |
|
|
|
— |
|
|
|
3,378 |
|
|
|
1,136 |
|
|
|
4,514 |
|
|
|
(433 |
) |
|
July, 2015 |
|
(3) |
|
Stand-Alone Location |
|
Yakima, WA |
|
(2) |
|
|
1,863 |
|
|
|
2,856 |
|
|
|
— |
|
|
|
— |
|
|
|
1,863 |
|
|
|
2,856 |
|
|
|
4,719 |
|
|
|
(743 |
) |
|
July, 2015 |
|
(3) |
|
Southridge Mall |
|
Greendale, WI |
|
(2) |
|
|
3,208 |
|
|
|
2,340 |
|
|
|
— |
|
|
|
— |
|
|
|
3,208 |
|
|
|
2,340 |
|
|
|
5,548 |
|
|
|
(981 |
) |
|
July, 2015 |
|
(3) |
|
West Towne Mall |
|
Madison-West, WI |
|
(2) |
|
|
3,053 |
|
|
|
2,130 |
|
|
|
— |
|
|
|
— |
|
|
|
3,053 |
|
|
|
2,130 |
|
|
|
5,183 |
|
|
|
(909 |
) |
|
July, 2015 |
|
(3) |
|
Stand-Alone Location |
|
Platteville, WI |
|
(2) |
|
|
748 |
|
|
|
1,195 |
|
|
|
— |
|
|
|
35 |
|
|
|
748 |
|
|
|
1,230 |
|
|
|
1,978 |
|
|
|
(346 |
) |
|
July, 2015 |
|
(3) |
|
Stand-Alone Location |
|
Charleston, WV |
|
(2) |
|
|
2,030 |
|
|
|
797 |
|
|
|
— |
|
|
|
— |
|
|
|
2,030 |
|
|
|
797 |
|
|
|
2,827 |
|
|
|
(371 |
) |
|
July, 2015 |
|
(3) |
|
Valley Point |
|
Elkins, WV |
|
(2) |
|
|
788 |
|
|
|
1,147 |
|
|
|
— |
|
|
|
— |
|
|
|
788 |
|
|
|
1,147 |
|
|
|
1,935 |
|
|
|
(319 |
) |
|
July, 2015 |
|
(3) |
|
Stand-Alone Location |
|
Scott Depot, WV |
|
(2) |
|
|
987 |
|
|
|
484 |
|
|
|
— |
|
|
|
— |
|
|
|
987 |
|
|
|
484 |
|
|
|
1,471 |
|
|
|
(199 |
) |
|
July, 2015 |
|
(3) |
|
Mountain Plaza |
|
Casper, WY |
|
(2) |
|
|
509 |
|
|
|
1,303 |
|
|
|
— |
|
|
|
— |
|
|
|
509 |
|
|
|
1,303 |
|
|
|
1,812 |
|
|
|
(307 |
) |
|
July, 2015 |
|
(3) |
|
Stand-Alone Location |
|
Gillette, WY |
|
(2) |
|
|
846 |
|
|
|
876 |
|
|
|
— |
|
|
|
— |
|
|
|
846 |
|
|
|
876 |
|
|
|
1,722 |
|
|
|
(337 |
) |
|
July, 2015 |
|
(3) |
|
Stand-Alone Location |
|
Riverton, WY |
|
(2) |
|
|
561 |
|
|
|
847 |
|
|
|
— |
|
|
|
— |
|
|
|
561 |
|
|
|
847 |
|
|
|
1,408 |
|
|
|
(310 |
) |
|
July, 2015 |
|
(3) |
|
Construction in Progress |
|
Various |
|
(2) |
|
|
— |
|
|
|
— |
|
|
|
— |
|
|
|
224,904 |
|
|
|
— |
|
|
|
224,904 |
|
|
|
224,904 |
|
|
|
— |
|
|
n/a |
|
n/a |
|
|
|
|
|
|
|
$ |
800,513 |
|
|
$ |
787,014 |
|
|
$ |
(542 |
) |
|
$ |
267,058 |
|
|
$ |
799,971 |
|
|
$ |
1,054,072 |
|
|
$ |
1,854,043 |
|
|
$ |
(139,483 |
) |
|
|
|
|
|
(1) |
The aggregate cost of land, building and improvements (which includes construction in process) for U.S. federal income tax purposes is approximately $2.2 billion. |
|
(2) |
All properties are encumbered by our Mortgage Loans and Future Funding Facility. See Note 6. |
|
(3) |
Depreciation is computed based on the following estimated useful lives: |
|
Building: |
|
25 – 40 years |
|
Site improvements: |
|
5 – 15 years |
|
Tenant improvements: |
|
shorter of the estimated useful life or non-cancelable term of lease |
F-42
NOTES TO SCHEDULE III
(Dollars in thousands)
Reconciliation of Real Estate
|
|
|
2017 |
|
|
2016 |
|
||
|
Balance at beginning of period |
|
$ |
1,734,892 |
|
|
$ |
1,668,351 |
|
|
Additions |
|
|
257,933 |
|
|
|
69,726 |
|
|
Impairments |
|
|
— |
|
|
|
— |
|
|
Dispositions |
|
|
(71,117 |
) |
|
|
— |
|
|
Write-offs |
|
|
(67,665 |
) |
|
|
(3,185 |
) |
|
Balance at end of period |
|
$ |
1,854,043 |
|
|
$ |
1,734,892 |
|
Reconciliation of Accumulated Depreciation
|
|
|
2017 |
|
|
2016 |
|
||
|
Balance at beginning of period |
|
$ |
89,940 |
|
|
$ |
29,076 |
|
|
Depreciation expense |
|
|
120,709 |
|
|
|
60,972 |
|
|
Dispositions |
|
|
(3,501 |
) |
|
|
— |
|
|
Write-offs |
|
|
(67,665 |
) |
|
|
(108 |
) |
|
Balance at end of period |
|
$ |
139,483 |
|
|
$ |
89,940 |
|
F-43