SUNRISE REAL ESTATE GROUP INC
10-Ks and 10-Qs
|
|
|
|
|
UNITED
STATES
SECURITIES
AND EXCHANGE COMMISSION
Washington,
D.C. 20549
FORM
10-K
(Mark
One)
x
ANNUAL REPORT UNDER
SECTION 13 OR 15(d) OF THE SECURITIES EXCHANGE ACT OF
1934
For the
fiscal year ended: December 31, 2009
o
TRANSITION REPORT UNDER SECTION 13 OR 15(d) OF THE SECURITIES
EXCHANGE ACT
OF
1934
Commission
file number: 000-32585
SUNRISE
REAL ESTATE GROUP, INC.
(Name of
Small Business Issuer in its Charter)
|
Texas
|
6351
|
75-2713701
|
|
(State
or Other Jurisdiction of
Incorporation
or Organization)
|
(Primary
Standard Industrial
Classification
Code Number)
|
(I.R.S.
Employer Identification No.)
|
Suite
701, No. 333, Zhaojiabang Road
Shanghai,
PRC 200032
(Address
of Principal Executive Offices) (Zip Code)
Issuer's
telephone number: + 86-21-6422-0505
Securities
registered pursuant to Section 12(b) of the Act: None
Securities
registered pursuant to Section 12(g) of the Act: Common Stock, $0.01 par
value
Indicate
by check mark if the registrant is a well-known seasoned issuer, as defined in
Rule 405 of the Securities Act. Yes
¨
No
þ
Indicate
by check mark if the registrant is not required to file reports pursuant to
Section 13 or Section 15(d) of the Act. Yes
¨
No
þ
Check
whether the issuer(1) filed all reports required to be filed by Section 13 or
15(d) of the Exchange Act during the past 12 months (or for such shorter period
that the issuer was required to file such reports), and (2) has been subject to
such filing requirements for the past 90 days. Yes
þ
No
¨
Indicate
by check mark whether the registrant has submitted electronically and posted on
its corporate Web site, if any, every Interactive Data File required to be
submitted and posted pursuant to Rule 405 of Regulation S-T (§232.405 of this
chapter) during the preceding 12 months (or for such shorter period that the
registrant was required to submit and post such files). Yes
þ
No
¨
Check if
there is no disclosure of delinquent filers in response to Item 405 of
Regulation S-B is contained in this form, and no disclosure will be contained,
to the best of registrant's knowledge, in definitive proxy or information
statements incorporated by reference in Part III of this Form 10-K or any
amendment to this Form 10-K.
¨
Indicate
by checkmark whether the registrant is a shell company (as defined in Rule 12b-2
of the Exchange Act): Yes
¨
No
þ
Indicate
by check mark whether the registrant is a large accelerated filer, an
accelerated filer, a non-accelerated filer, or a smaller reporting company. See
the definitions of “large accelerated filer,” “accelerated filer” and “smaller
reporting company” in Rule 12b-2 of the Exchange Act.
|
Large
accelerated filer
¨
|
Accelerated
filer
¨
|
|||
|
Non-accelerated
filer
¨
(Do
not check if a smaller reporting company)
|
Smaller
reporting company
þ
|
The
issuer's net revenues for its most recent fiscal year ended December 31, 2009
were US$13,110,591.
As of
June 30, 2009, the aggregate market value of the Common Stock held by
non-affiliates, 14,334,375 shares of Common Stock, was $3,009,063 based on an
average of the bid and ask prices of $0.21 per share of Common Stock on such
date.
As of
March 15, 2010, the aggregate market value of the Common Stock held by
non-affiliates, 14,334,375 shares of Common Stock, was $7,883,906 based on an
average of the bid and ask prices of $0.55 per share of Common Stock on such
date.
The
number of shares outstanding of the issuer's Common Stock, $0.01 par value, as
of March 15, 2010 was 23,691,925 shares.
Transitional
Small Business Disclosure Format (check one): Yes
¨
No
þ
SUNRISE
REAL ESTATE GROUP, INC.
FORM
10-K
TABLE
OF CONTENTS
Page
|
PART
I
|
||
|
Item
1.
|
Description
of Business
|
2
|
|
Item
1B
|
Unresolved
Staff Comments
|
7
|
|
Item
2.
|
Description
of Property
|
7
|
|
Item
3.
|
Legal
Proceedings
|
7
|
|
Item
4.
|
[Removed
and Reserved]
|
7
|
|
PART
II
|
||
|
Item
5.
|
Market
for Common Equity and Related Stockholder Matters
|
8
|
|
Item
6.
|
Selected
Financial Data
|
8
|
|
Item
7.
|
Management's
Discussion and Analysis or Plan of Operation
|
9
|
|
Item
8.
|
Financial
Statements
|
23
|
|
Item
9.
|
Changes
In and Disagreements With Accountants on Accounting and Financial
Disclosure
|
38
|
|
Item
9A.
|
Controls
and Procedures
|
38
|
|
Item
9B.
|
Other
Information
|
38
|
|
PART
III
|
||
|
Item
10.
|
Directors,
Executive Officers, Promoters, Control Persons and Corporate Governance;
Compliance With Section 16(A) of the Exchange Act
|
39
|
|
Item
11.
|
Executive
Compensation
|
43
|
|
Item
12.
|
Security
Ownership of Certain Beneficial Owners and Management and Related
Stockholder Matters
|
44
|
|
Item
13.
|
Certain
Relationships and Related Transactions and Director
Independence
|
44
|
|
Item
14.
|
Principal
Accountant Fees and Services
|
45
|
|
Item
15.
|
Exhibits
|
46
|
1
Corporate
History
Sunrise
Real Estate Development Group, Inc. (“CY-SRRE”) was established in the Cayman
Islands on April 30, 2004 as a limited liability company. CY-SRRE was wholly
owned by Ace Develop Properties Limited, a corporation, (“Ace Develop”), of
which Lin Chi-Jung, an individual, is the principal and controlling shareholder.
Shanghai Xin Ji Yang Real Estate Consultation Company Limited (“SHXJY”) was
established in the People’s Republic of China (the “PRC”) on August 14, 2001 as
a limited liability company. SHXJY was originally owned by a
Taiwanese company, of which the principal and controlling shareholder was Lin
Chi-Jung. On June 8, 2004, all the fully paid up capital of SHXJY was
transferred to CY-SRRE. On June 25, 2004 SHXJY and two individuals established a
subsidiary, namely, Suzhou Xin Ji Yang Real Estate Consultation Company Limited
(“SZXJY”) in the PRC, at which point in time, SHXJY held a 90% equity interest
in SZXJY. On December 24, 2004, SHXJY acquired 85% of equity interest in Beijing
Xin Ji Yang Real Estate Consultation Company Limited (“BJXJY”), a PRC company
incorporated on April 16, 2003 with limited liability. On August 9,
2005, SHXJY sold a 10% equity interest in SZXJY to a company owned by a director
of SZXJY, and transferred a 5% equity interest in SZXJY to
CY-SRRE. Following the disposal and the transfer, CY-SRRE effectively
held an 80% equity interest in SZXJY. On November 24, 2006, CY-SRRE, SHXJY, a
director of SZXJY and a third party established a subsidiary, namely, Suzhou
Shang Yang Real Estate Consultation Company Limited (“SZSY”) in the PRC, with
CY-SRRE holding a 12.5% equity interest, SHXJY holding a 26% equity interest and
the director of SZXJY holding a 12.5% equity interest in SZSY. At the date of
incorporation, SRRE and the director of SZXJY entered into a voting agreement
that SRRE is entitled to exercise the voting right in respect of his 12.5%
equity interest in SZSY. Following that, SRRE effectively holds 51% equity
interest in SZSY. On September 24, 2007, CY-SRRE sold a 5% equity interest in
SZXJY to a company owned by a director of SZXJY. Following the
disposal, CY-SRRE effectively holds 75% equity interest in SZXJY. On
November 1, 2007, SZXJY established a wholly owned subsidiary, Suzhou Xin Ji
Yang Real Estate Brokerage Company Limited (“SZXJYB”) in the PRC as a limited
liability company. On May 8, 2008, SHXJY established a wholly owned
subsidiary, Kunshan Shang Yang Real Estate Brokerage Company Limited (“KSSY”) in
the PRC as a limited liability company.
LIN RAY
YANG Enterprise Ltd. (“LRY”) was established in the British Virgin Islands on
November 13, 2003 as a limited liability company. LRY was owned by
Ace Develop, Planet Technology Corporation (“Planet Tech”) and Systems &
Technology Corporation (“Systems Tech”). On February 5, 2004, LRY
established a wholly owned subsidiary, Shanghai Shang Yang Real Estate
Consultation Company Limited (“SHSY”) in the PRC as a limited liability company.
On January 10, 2005, LRY and a PRC third party established a subsidiary, Suzhou
Gao Feng Hui Property Management Company Limited (“SZGFH”), in the PRC, with LRY
holding 80% of the equity interest in SZGFH. On May 8, 2006, LRY acquired 20% of
the equity interest in SZGFH from the third party. Following the acquisition,
LRY effectively holds 100% of the equity interest in SZGFH. On September 11,
2007 SHSY and other third parties established a subsidiary, namely, Suzhou Bin
Fen Nian Dai Administration Consultancy Company Limited (“SZBFND”) in the PRC,
with SHSY holding a 19% equity interest in SZBFND. On September 18, 2008, SHSY
established a wholly owned subsidiary, San Ya Shang Yang Real Estate
Consultation Company Limited (“SYSY”) in the PRC as a limited liability
company.
SHXJY,
SZXJY, BJXJY, SHSY, SZGFH, SZSY, SZXJYB, KSSY and SYSY commenced operations in
November 2001, June 2004, January 2004, February 2004, January 2005, November
2006, November 2007, May 2008 and September 2008 respectively. Each
of SHXJY, SZXJY, BJXJY, SHSY, SZGFH, SZSY, SZXJYB and KSSY has been granted a
twenty-year operation period and SYSY has been granted a thirty-year operation
period from the PRC, which can be extended with approvals from relevant PRC
authorities.
On August
31, 2004, Sunrise Real Estate Group, Inc. (“SRRE”), CY-SRRE and Lin Chi-Jung, an
individual and agent for the beneficial shareholder of CY-SRRE, i.e., Ace
Develop, entered into an exchange agreement under which SRRE issued 5,000,000
shares of common stock to the beneficial shareholder or its designees, in
exchange for all outstanding capital stock of CY-SRRE. The
transaction closed on October 5, 2004. Lin Chi-Jung is Chairman of
the Board of Directors of SRRE, the President of CY-SRRE and the principal and
controlling shareholder of Ace Develop.
Also on
August 31, 2004, SRRE, LRY and Lin Chi-Jung, an individual and agent for
beneficial shareholders of LRY, i.e., Ace Develop, Planet Tech and Systems Tech,
entered into an exchange agreement under which SRRE issued 10,000,000 shares of
common stock to the beneficial shareholders, or their designees, in exchange for
all outstanding capital stock of LRY. The transaction was closed on
October 5, 2004. Lin Chi-Jung is Chairman of the Board of Directors of SRRE, the
President of LRY and the principal and controlling shareholder of Ace
Develop. Regarding the 10,000,000 shares of common stock of SRRE
issued in this transaction, SRRE issued 8,500,000 shares to Ace Develop, 750,000
shares to Planet Tech and 750,000 shares to Systems Tech.
As a
result of the acquisition, the former owners of CY-SRRE and LRY hold a majority
interest in the combined entity. Generally accepted accounting
principles require in certain circumstances that a company whose shareholders
retain the majority voting interest in the combined business be treated as the
acquirer for financial reporting purposes. Accordingly, the
acquisition has been accounted for as a “reverse acquisition” arrangement
whereby CY-SRRE and LRY are deemed to have purchased SRRE. However,
SRRE remains the legal entity and the Registrant for Securities and Exchange
Commission reporting purposes. All shares and per share data prior to
the acquisition have been restated to reflect the stock issuance as a
recapitalization of CY-SRRE and LRY.
2
SRRE was
initially incorporated in Texas on October 10, 1996, under the name of Parallax
Entertainment, Inc. (“Parallax”). On December 12, 2003, Parallax
changed its name to Sunrise Real Estate Development Group, Inc. On
April 25, 2006, Sunrise Estate Development Group, Inc. filed Articles of
Amendment with the Texas Secretary of State, changing the name of Sunrise Real
Estate Development Group, Inc. to Sunrise Real Estate Group, Inc., effective
from May 23, 2006.
SRRE and
its subsidiaries, namely, CY-SRRE, LRY, SHXJY, SZXJY, SZXJYB, SZSY, KSSY, BJXJY,
SHSY, SZGFH and SYSY are sometimes hereinafter collectively referred to as “the
Company.”
The
principal activities of the Company are property brokerage services, real estate
marketing services, property leasing services and property management services
in the PRC
.
General
Business Description
SRRE was
incorporated on October 10, 1996 as a Texas corporation and was formerly known
as Parallax Entertainment, Inc. SRRE has gone through a series of transactions
leading to the completion of a reverse merger on October 5, 2004. Prior to the
closing of the exchange agreements described in “Corporate History” above, SRRE
was an inactive "shell" company. Following the closing, SRRE, through its two
wholly owned subsidiaries, CY-SRRE and LRY, has engaged in the property
brokerage services, real estate marketing services, property leasing services
and property management services in the PRC
.
The
Company recognizes that in order to differentiate itself from the market, it
should avoid direct competition with large-scale property developers who have
their own marketing departments. Our objective is to develop a niche position
with marketing alliances with medium size and smaller developers, and become
their outsourcing marketing and sales agents.
SRRE
operates through a tier of wholly owned subsidiaries of Sunrise Real Estate
Development Group, Inc., a Cayman Islands corporation ("CY-SRRE") and LIN RAY
YANG Enterprise, Ltd., a British Virgin Islands company ("LRY"). Neither CY-SRRE
nor LRY have operations but conduct operations in Mainland China through their
respective subsidiaries that are based in the PRC. CY-SRRE operates through its
wholly owned subsidiary, SHXJY. LRY operates through its two wholly owned
subsidiaries, SHSY and SZGFH. SHXJY and SHSY are property agency business
earning commission revenue from marketing and sales services to developers. The
main business of SZGFH is to render property rental service, buildings
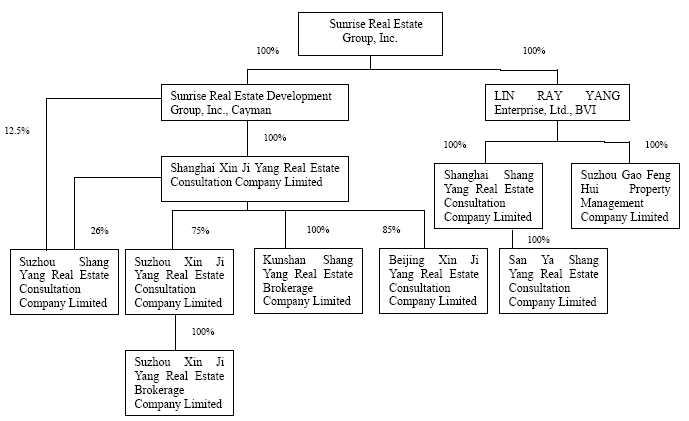
management and maintenance service for office buildings. Our company
organization chart is as follows:
Figure 1:
Company Organization Chart
3
Our major
business was agency sales, whereby our Chinese subsidiaries contracted with
property developers to market and sell their newly developed property
units. For these services we earned a commission fee calculated as a
percentage of the sales prices. We have focused our sales on the whole China
market, especially in secondary cities. To expand our agency business, we have
established subsidiaries in Shanghai, Suzhou, Beijing, Kunshan and Hainan, and
branches in NanChang, YangZhou, NanJing and ChongQing.
During
the year of 2005 and 2006, SZGFH entered into leasing agreements with certain
buyers of the Sovereign Building underwriting project to lease the properties
for them. These leasing agreements on these properties are for 62% of the floor
space that was sold to third party buyers. In accordance with the leasing
agreements, the owners of the properties can have a rental return of 8.5% and
8.8% per annum for a period of 5 years and 8 years, respectively. In regards to
the leasing agreements, we have negotiated with the buyers and have lowered the
annual rental return rate for the remaining leasing period from 8.5% for 5
years to 5.8%, and from 8.8% for 8 years to 6%. As of December 31,
2009, 58% of the buyers agreed upon the lowered rate and 24% of the buyers
agreed to cancel the leasing agreements. The leasing period started in the
second quarter, 2006, and the Company has the right to sublease the leased
properties to cover these lease commitments in the leasing period. As of March
15, 2010, 88 sub-leasing agreements have been signed, the area of these
sub-leasing agreements represented 81% of total area with these lease
commitments.
With a
relatively short history and smaller capital base, we recognize that in order to
differentiate ourselves from the market, we need to avoid direct competition
with large-scale property developers, who have their own marketing departments.
We plan to utilize our professional experience to carve a niche and position by
developing marketing alliances with medium size and smaller developers. This
strategic plan is designed to expand our activities beyond our existing revenue
base, enabling us to assume higher investment risk and giving us flexibility in
collaborating with partnering developers. The plan is aimed at improving our
capital structure, diversifying our revenue base, creating higher values and
equity returns.
In the
past eight years, we have established a reputation as a sales and marketing
agency for new projects. With our accumulated expertise and experience, we
intend to take a more aggressive role by participating in property investments.
We plan to select property developers with outstanding qualifications as our
strategic partners, and continue to build strength in design, planning,
positioning and marketing services.
Business
Activities
Our main
operating subsidiaries, SHXJY and SHSY, have engaged in sales and marketing
agency work for newly built property units. We also have developed a
good network of landowners and earned the trust of developers, allowing us to
explore opportunities in property investments.
In order
to build a cushion against the cyclical nature of the real estate industry and
have a more diversified revenue base, we established another operating
subsidiary, SZGFH, to deal with property management and rental
operations.
Commission Based
Services
Commission
based services refer to marketing and sales agency operations, which provide the
following services:
a.
Integrated Marketing Planning
b.
Advertising Planning & Execution
c. Sales
Planning and Execution
In this
type of business, we sign a marketing and sales agency agreement with property
developers to undertake the marketing and sales activities of a specific
project. The scope of service varies according to clients' needs; it could be a
full package of all the above services, a combination of any two of the above
services or any single service.
A major
part of our existing revenue comes from commission-based services. We secure
these projects via bidding or direct appointments. As a result of our
relationships with existing clients and our sales track record, we have secured
a number of cases from prior clients on subsequent phases of
projects.
Normally,
before a developer retains us, we will evaluate and determine the Average Sales
Value of a project. This value will be proposed to the developer, and the
parties will determine and agree on an Average Sales Value as the basis of our
agency agreement. The actual sales price of the project is generally priced
higher than the Average Sales Value depending on market conditions. On average,
we have been to sell the property at a small premium over Average Sales
Value.
Our
normal commission structure is a combination of the following:
a) Base
Commission of 1.0% - 1.5% based on the Average sales value.
b)
Surplus Commission of 10% - 30% based on the difference between Average Sales
Value and actual sales price.
Our
wholly owned subsidiaries, SHXJY and SHSY, engage in this sales and marketing
phase of our business.
4
Mainland China's Property
Sector
The
industry's macro environment is opening up, and the property sector is gradually
developing to be a more regulated market. Stable economic growth provides a
solid and secure base for investment returns in the property
sector.
GDP
Growth of PRC for the period of 2005 through 2009
|
GDP
GROWTH
|
|
|
2005
|
10.4%
|
|
2006
|
10.7%
|
|
2007
|
11.4%
|
|
2008
|
9.0%
|
|
2009
|
8.7%
|
Government
regulation
On
November 5, 2008, the State Council announced a two-year economic stimulus plan
involving a total investment of RMB4 trillion. The stimulus plan, which the
State Council announced at a general meeting, is called the Ten Measures to
Further Expand Domestic Demand and Promote Steady Economic Development (the Ten
Measures). In the first measure, the government affirms its commitment to
subsidizing low-rent housing, renovating poor and imperiled housing in rural
areas, and providing housing for nomads. The National Development and Reform
Commission (NDRC) announced on December 18, 2008, that the central government
has distributed RMB10 billion for the construction of affordable
housing.
The State
Taxation Administration issued the Regulation of Land Value-added Tax Clearing
and Administrating in May 2009, effective on June 1, 2009. It requires the
developers to clear the land value-added tax
,
which have completed
development projects and have finished sale, or have sold development projects
under constructed, or have transferred the land use right to
others.
On May 27
2009, the China government issued the policy “Notice of the Fix Asset Investment
Ratio” stating that economical housing and residential housing must provide at
least 20% of the purchase price before bank loans. Other real estate project’s
minimum payment, not including bank loans, shall be 30%. This is a decrease from
the 35% minimum required since 2004 and a drop in level back in 1996. This
policy signifies the government loosening of the real estate
sector.
The
Ministry of Finance, Ministry of Land and Resources, Ministry of Supervision,
the Central Government, and five other agencies announced in “Notice Regarding
to Improve Upon Land Sale and Receivable Management,” to increase the initial
payment of land purchases to 50% of the purchase price and the entire purchase
price must be paid in full within the year in Dec 2009. Prior to the increase,
the increase, the initial payment was around 20% to 30%.
Environmental
matters
There is
a growing concern in regards to the global warming issues affecting the world
today. The changing weather patterns and abnormal conditions may affect the
construction and logistics of developers and this may indirectly cause an
adverse effect on our operations. Extreme weather conditions may cause a delay
in the construction of properties; this then may delay the sale of these
properties and therefore delay our future revenue stream.
5
As of
December 31, 2009, we had the following number of employees:
|
Employees
|
|
|
SRRE
|
|
|
Administration
Dept.
|
1
|
|
Accounting
Dept.
|
2
|
|
Investor
Relations Dept.
|
2
|
|
SHXJY
|
|
|
Administration
Dept.
|
14
|
|
Accounting
Dept.
|
2
|
|
Research
& Development Dept.
|
8
|
|
Advertising
& Communication Planning Dept.
|
3
|
|
Marketing
Dept.
|
17
|
|
Nanchang
Branch of SHXJY
|
|
|
Marketing
Dept.
|
1
|
|
Yangzhou
Branch of SHXJY
|
|
|
Accounting
Dept.
|
2
|
|
Marketing
Dept.
|
10
|
|
Chongqing
Branch of SHXJY
|
|
|
Accounting
Dept.
|
2
|
|
Marketing
Dept.
|
17
|
|
SZXJY
and Nanjing Branch
|
|
|
Administration
Dept.
|
11
|
|
Accounting
Dept.
|
3
|
|
Research
& Development Dept.
|
8
|
|
Advertising
& Communication Planning Dept.
|
6
|
|
Marketing
Dept.
|
50
|
|
SZSY
|
|
|
Marketing
Dept.
|
28
|
|
SZXJYB
|
|
|
Marketing
Dept.
|
7
|
|
BJXJY
|
|
|
Administration
Dept.
|
1
|
|
SHSY
|
|
|
Administration
Dept.
|
5
|
|
Research
& Development Dept.
|
11
|
|
Accounting
Dept.
|
2
|
|
Marketing
Dept.
|
14
|
|
SYSY
|
|
|
Marketing
Dept.
|
28
|
|
SZGFH
|
|
|
Administration
Dept.
|
1
|
|
Accounting
Dept.
|
3
|
|
Marketing
Dept.
|
2
|
|
Total
|
261
|
6
Not
Applicable
None.
We
currently rent our facilities at 7
th
Floor,
No.333, Zhaojiabang Road, Shanghai, PRC. We also have regional field support
offices in various cities in Mainland China, namely Suzhou, Beijing, Nanchang,
Yangzhou, Chongqing, Kunshan, Nanjing and Hainan. We lease the facilities that
house our regional field support offices.
During
the past five years, the Company has also acquired two floors and four units of
the Sovereign Building in Suzhou, PRC. The properties under
development were completed on March 31, 2006, and we have paid the full purchase
price to the property developer. In 2007, the title for these properties was
transferred to the Company. The Company decided that one floor will be held for
the Company’s own use, and the remaining properties will be held for long-term
investment purposes. Accordingly, the costs of the properties for the Company’s
own use was $2,214,539 and the investment properties was
$9,068,396.
As of
December 31, 2009, the bank loan secured by the investment properties was
$8,054,831, which has an interest increase of 10% of one year prime rate as
announced by the People’s Bank of China to 5.84% in 2009. The bank loan secured
by the properties for the Company’s own use was $205,032, which has an interest
of five years prime rate as announced by the People’s Bank of China at 5.94% in
2009, is repayable before December 15, 2010 in monthly
installments.
The
Company is not a party to any legal proceedings of a material
nature.
7
Our
common stock is quoted on the Over-the-Counter Bulletin Board system under the
symbol “SRRE.” The following table sets forth the high and low quotations of our
common stock reported by the OTCBB system for the periods
indicated.
Over-the-counter
market quotations reflect inter-dealer prices, without retail mark-up,
mark-down, or commissions, and may not necessarily represent actual
transactions.
(Expressed
in US Dollars)
|
2009
|
2008
|
|||
|
High
|
Low
|
High
|
Low
|
|
|
First
quarter
|
$0.62
|
$0.06
|
$0.38
|
$0.15
|
|
Second
quarter
|
$0.62
|
$0.03
|
$0.52
|
$0.12
|
|
Third
quarter
|
$0.05
|
$0.03
|
$0.70
|
$0.12
|
|
Fourth
quarter
|
$1.05
|
$0.05
|
$0.40
|
$0.05
|
As of
March 15, 2010, we had approximately 594 record holders of our common stock. On
March 15, 2010, the closing price of our common stock was $0.50.
No cash
dividends were declared on our common stock in 2009 and 2008. The major reason
for not declaring any cash dividends is that we are still a growing company and
require sufficient liquidity to fund our business activities. In the future, in
the event we have funds available for distribution, we may consider paying cash
dividends on our common stock.
The
Company did not repurchase any of its outstanding equity securities during the
year ended December 31, 2009.
No
securities of the Company were issued pursuant to any equity compensation plan
during the year ended December 31, 2009.
Not
Applicable
8
The
following Management’s Discussion and Analysis (“MD&A”) is intended to help
the reader understand Sunrise Real Estate Group, Inc. (“SRRE”). MD&A is
provided as a supplement to, and should be read in conjunction with, our
financial statements and the accompanying notes.
OVERVIEW
In
October 2004, the former shareholders of Sunrise Real Estate Development Group,
Inc. (Cayman Islands) (“CY-SRRE”) and LIN RAY YANG Enterprise Ltd. (“LRY”)
acquired a majority of our voting interests in a share exchange. Before the
completion of the share exchange, SRRE had no continuing operations, and its
historical results would not be meaningful if combined with the historical
results of CY-SRRE, LRY and their subsidiaries.
As a
result of the acquisition, the former owners of CY-SRRE and LRY hold a majority
interest in the combined entity. Generally accepted accounting
principles require in certain circumstances that a company whose shareholders
retain the majority voting interest in the combined business be treated as the
acquirer for financial reporting purposes. Accordingly, the acquisition has been
accounted for as a “reverse acquisition” arrangement whereby CY-SRRE and LRY are
deemed to have purchased SRRE. However, SRRE remains the legal entity and the
Registrant for Securities and Exchange Commission reporting purposes. The
historical financial statements prior to October 5, 2004 are those of CY-SRRE
and LRY and their subsidiaries. All equity information and per share
data prior to the acquisition have been restated to reflect the stock issuance
as a recapitalization of CY-SRRE and LRY.
SRRE and
its subsidiaries, namely, CY-SRRE, LRY, Shanghai Xin Ji Yang Real Estate
Consultation Company Limited (“SHXJY”), Suzhou Xin Ji Yang Real Estate
Consultation Company Limited (“SZXJY”), Beijing Xin Ji Yang Real Estate
Consultation Company Limited (“BJXJY”), Shanghai Shangyang Real Estate
Consultation Company Limited (“SHSY”), Suzhou Gao Feng Hui Property Management
Company Limited (“SZGFH”), Suzhou Shang Yang Real Estate Consultation Company
Limited (“SZSY”), Suzhou Xin Ji Yang Real Estate Brokerage Company
Limited(“SZXJYB”), Kunshan Shang Yang Real Estate Brokerage Company Limited
(“KSSY”) and San Ya Shang Yang Real Estate Consultation Company Limited (“SYSY”)
are sometimes hereinafter collectively referred to as “the Company,” “our,” or
“us”.
The
principal activities of the Company are real estate agency sales, real estate
marketing services, real estate investments, property leasing services and
property management services in the PRC
.
RECENT
DEVELOPMENTS
Our major
business was agency sales, whereby our Chinese subsidiaries contracted with
property developers to market and sell their newly developed property
units. For these services we earned a commission fee calculated as a
percentage of the sales prices. We have focused our sales on the whole China
market, especially in secondary cities. To expand our agency business, we have
established subsidiaries in Shanghai, Suzhou, Beijing, Kunshan and Hainan, and
branches in NanChang, YangZhou, NanJing and ChongQing.
During
the year of 2005 and 2006, SZGFH entered into leasing agreements with certain
buyers of the Sovereign Building underwriting project to lease the properties
for them. These leasing agreements on these properties are for 62% of the floor
space that was sold to third party buyers. In accordance with the leasing
agreements, the owners of the properties can have a rental return of 8.5% and
8.8% per annum for a period of 5 years and 8 years, respectively. In regards to
the leasing agreements, we have negotiated with the buyers and have lowered the
annual rental return rate for the remaining leasing period from 8.5% for 5
years to 5.8%, and from 8.8% for 8 years to 6%. As of December 31,
2009, 58% of the buyers agreed upon the lowered rate and 24% of the buyers
agreed to cancel the leasing agreements. The leasing period started in the
second quarter of 2006, and the Company has the right to sublease the leased
properties to cover these lease commitments in the leasing period. As of March
15, 2010, 88 sub-leasing agreements have been signed, the area of these
sub-leasing agreements represented 81% of total area with these lease
commitments.
RISKS
ASSOCIATED WITH FORWARD-LOOKING STATEMENTS INCLUDED IN THIS FORM
10-K
In
addition to historical information, this Form 10-K contains forward-looking
statements. Forward-looking statements are based on our current beliefs and
expectations, information currently available to us, estimates, projections
about our industry, and certain assumptions made by our management. These
statements are not historical facts. We use words such as "anticipates",
"expects", "intends", "plans", "believes", "seeks", "estimates", and similar
expressions to identify our forward-looking statements, which include, among
other things, our anticipated revenue and cost of our agency and investment
business.
Because
we are unable to control or predict many of the factors that will determine our
future performance and financial results, including future economic,
competitive, and market conditions, our forward-looking statements are not
guarantees of future performance. They are subject to risks, uncertainties, and
errors in assumptions that could cause our actual results to differ materially
from those reflected in our forward-looking statements. We believe that the
assumptions underlying our forward-looking statements are reasonable. However,
the investor should not place undue reliance on these forward-looking
statements. They only reflect our view and expectations as of the date of this
Form 10-K. We undertake no obligation to publicly update or revise any
forward-looking statement in light of new information, future events, or other
occurrences.
9
There are
several risks and uncertainties, including those relating to our ability to
raise money and grow our business and potential difficulties in integrating new
acquisitions with our current operations, especially as they pertain to foreign
markets and market conditions. These risks and uncertainties can materially
affect the results predicted. The Company’s future operating results over both
the short and long term will be subject to annual and quarterly fluctuations due
to several factors, some of which are outside our control. These factors include
but are not limited to fluctuating market demand for our services, and general
economic conditions.
RECENTLY
ISSUED ACCOUNTING STANDARDS
In June
2009, the FASB issued FAS 168 “The FASB Accounting Standards CodificationTM and
the Hierarchy of Generally Accepted Accounting Principles—a replacement of FASB
Statement No. 162 (Codification)”. The Codification will become the source of
authoritative U.S. generally accepted accounting principles (GAAP) recognized by
the FASB to be applied by nongovernmental entities. Rules and interpretive
releases of the Securities and Exchange Commission (SEC) under authority of
federal securities laws are also sources of authoritative GAAP for SEC
registrants. On the effective date of this Statement, the Codification will
supersede all then-existing non-SEC accounting and reporting standards. All
other non-grandfathered non-SEC accounting literature not included in the
Codification will become non-authoritative. This statement is effective
for financial statements issued for interim and annual periods ending after
September 15, 2009.
In June
2009, the FASB issued FAS 167, “Amendments to FASB Interpretation No. 46(R)”.
This statement amends certain guidance in Interpretation 46(R) for determining
whether an entity is a variable interest entity. This Statement is effective as
of the beginning of each reporting entity’s first annual reporting period that
begins after November 15, 2009
In May
2009, the FASB issued FAS 165, “Subsequent Events” The objective of this
statement is to establish general standards of accounting for and disclosure of
events that occur after the balance sheet date but before financial statements
are issued or are available to be issued.
Effective
for the fiscal years, and interim periods within those fiscal years, beginning
on or after December 15, 2008, a new guidance addresses the accounting and
reporting for the outstanding noncontrolling interest (previously referred to as
minority interest) in a subsidiary and for the deconsolidation of a subsidiary.
It also establishes additional disclosures in the consolidated financial
statements that identify and distinguish between the interests of the parent’s
owners and of the noncontrolling owners of a subsidiary. On January 1, 2009, the
Company adopted new accounting guidance on noncontrolling
interests.
The
Company does not anticipate that the adoption of the above statements will have
a material effect on the Company's financial condition and results of
operations.
APPLICATION
OF CRITICAL ACCOUNTING POLICIES
The
preparation of financial statements in conformity with accounting principles
generally accepted in the United States requires management to make estimates
and assumptions that affect the reported amounts of assets and liabilities and
disclosure of contingent assets and liabilities at the date of the financial
statements and the reported amounts of revenues and expenses during the
reporting period. Critical accounting policies for us include revenue
recognition, net earnings per common share, income taxes and segment
information.
Revenue
Recognition
Agency
commission revenue from property brokerage is recognized when the property
developer and the buyer complete a property sales transaction, and the property
developer grants confirmation to us to be able to invoice them accordingly. The
time when we receive the commission is normally at the time when the property
developer receives from the buyer a portion of the sales proceeds in accordance
with the terms of the relevant property sales agreement, or the balance of the
bank loan to the buyer has been funded, or recognized under the sales schedule
or other specific items of agency sales agreement with developer. At no point
does the Company handle any monetary transactions nor act as an escrow
intermediary between the developer and the buyer.
Revenue
from marketing consultancy services is recognized when services are provided to
clients, fees associated to services are fixed or determinable, and collection
of the fees is assured..
Rental
revenue from property management and rental business is recognized on a
straight-line basis according to the time pattern of the leasing
agreements.
The
Company accounts for underwriting sales in accordance with SFAS No. 66
“Accounting for Sales of Real Estate” (SFAS 66). The commission revenue on
underwriting sales is recognized when the criteria in SFAS No. 66 have been met,
generally when title is transferred and the Company no longer has substantial
continuing involvement with the real estate asset sold. If the Company provides
certain rent guarantees or other forms of support where the maximum exposure to
loss exceeds the gain, it defers the related commission income and expenses by
applying the deposit method. In future periods, the commission income and
related expenses are recognized when the remaining maximum exposure to loss is
reduced below the amount of income deferred.
All
revenues represent gross revenues less sales and business tax.
10
Net
Earnings per Common Share
The
Company computes net earnings per share in accordance with SFAS No. 128,
“Earnings per Share.” Under the provisions of SFAS No. 128, basic net earnings
per share is computed by dividing the net earnings available to common
shareholders for the period by the weighted average number of shares of common
stock outstanding during the period. The calculation of diluted net earnings per
share recognizes common stock equivalents, however; potential common stock in
the diluted EPS computation is excluded in net loss periods, as their effect is
anti-dilutive.
Income
Taxes
The
Company accounts for income taxes in accordance with SFAS No. 109 “Accounting
for Income Taxes.” Under SFAS No. 109, deferred tax liabilities or assets at the
end of each period are determined using the tax rate expected to be in effect
when taxes are actually paid or recovered. Valuation allowances are established
when necessary to reduce deferred tax assets to the amount expected to be
realized.
Segment
Information
The
Company believes that it operates in one business segment. Management views the
business as consisting of several revenue streams; however it is not possible to
attribute assets or indirect costs to the individual streams other than direct
expenses.
We
provide the following discussion and analyses of our changes in financial
condition and results of operations for the year ended December 31, 2009,
with comparisons to the historical year ended December 31, 2008.
Revenue
The
following table shows the detail for net revenues by line of
business:
|
Years
ended December 31,
|
||||||||||||||||||||
|
2009
|
%
to total
|
2008
|
%
to total
|
%
change
|
||||||||||||||||
|
Agency
sales
|
5,077,307 | 39 | 5,087,634 | 63 | 0 | |||||||||||||||
|
Underwriting
sales
|
5,174,708 | 39 | - | - | N/A | |||||||||||||||
|
Property
management
|
2,858,576 | 22 | 2,987,559 | 37 | (4 | ) | ||||||||||||||
|
Net
revenue
|
13,110,591 | 100 | 8,075,193 | 100 | 62 | |||||||||||||||
The net
revenues for 2009 were $13,110,591, which increased 62% from $8,075,193 of 2008.
In 2009, agency sales represented 39% of the total net revenues, underwriting
sales represented 39% and property management represented 22%. The increase in
2009 was mainly due to the increase in our underwriting sales
revenue.
Agency
sales
In 2009
39% of our net revenue was due to agency sales, which were from the business
activities of SHXJY, SHSY and their subsidiaries and branches. As compared with
2008, net revenue of agency sales in 2009 was relatively unchanged.
Because
of our diverse market locations, the risk of market fluctuations has been
minimized on our business operations in agency sales in 2009, and we are seeking
stable growth in our agency sales business in 2010. However, there can be no
assurance that we will be able to do so.
11
Underwriting
Sales
In
February 2004, SHSY entered into an agreement to underwrite an office building
in Suzhou, known as Suzhou Sovereign Building. Being the sole distribution agent
for this office building, SHSY committed to a sales target of $56.53 million.
Property underwriting sales are comparatively a higher risk business model
compared to our pure commission based agency business. Under this higher risk
business model, the Underwriting Model, our commission is not calculated as a
percentage of the selling price; instead, our commission revenue is equivalent
to the price difference between the final selling price and underwriting price.
We negotiate with a developer for an underwriting price that is as low as
possible, with the guarantee that all or a majority of the units will be sold by
a specific date. In return, we are given the flexibility to establish the final
selling price and earn the price difference between the final selling price and
the underwriting price. The risk of this kind of arrangement is that if there
are any unsold units on the expiration date of the agreement, then we may have
to purchase the unsold property units from the developer at the underwriting
price and hold them in our inventory or as investments.
We
started selling units in the Sovereign Building in January, 2005. As of December
31, 2006, we have achieved the sales target by selling 46,779 square meters with
a total sales price of $70.45 million. However, there are still unsold
properties with floor area of 314 square meters, which represents 1% of total
floor area underwritten, as of December 31, 2006. As of the end of February,
2007, we have sold or acquired all of the units in the building, and we have
achieved the sales target by selling 47,093 square meters with a total sales
price of $75.96 million.
The
Company accounts for its underwriting sales revenue with underwriting rent
guarantees in accordance with SFAS No. 66 “Accounting for Sales of Real Estate”
(SFAS 66). Under SFAS 66, the deposit method should be used for the revenue from
the sales of floor space with underwriting rent guarantees until the revenues
generated by sub-leasing properties exceed the guaranteed rental amount due to
the purchasers. Based on this accounting principle, a significant portion of
underwriting revenue was deferred. In early 2009, the Company renegotiated the
rental payments with buyers. As of December 31, 2009, 58% of the buyers agreed
upon the lowered rate and 24% of the buyers agreed to cancel the leasing
agreements. Based on the renegotiated agreements, $5,174,708 of the deferred
revenue on underwriting sales was recognized.
Property
Management
During
the year of 2005 and 2006, SZGFH entered into leasing agreements with certain
buyers of the Sovereign Building underwriting project to lease the properties
for them. These leasing agreements on these properties are for 62% of the floor
space that was sold to third party buyers. In accordance with the leasing
agreements, the owners of the properties can have a rental return of 8.5% and
8.8% per annum for a period of 5 years and 8 years, respectively. In regards to
the leasing agreements, we have negotiated with the buyers and have lowered the
annual rental return rate for the remaining leasing period from 8.5% for 5
years to 5.8%, and from 8.8% for 8 years to 6%. As of December 31,
2009, 58% of the buyers agreed upon the lowered rate and 24% of the buyers
agreed to cancel the leasing agreements. The leasing period started in the
second quarter, 2006, and the Company has the right to sublease the leased
properties to cover these lease commitments in the leasing period. As of
December 31, 2009, 82 sub-leasing agreements have been signed, the area of these
sub-leasing agreements represented 79% of total area with these lease
commitments.
We expect
that the income from the sub-leasing business will be on a stable growth trend
in 2010 and that it can cover the lease commitments in the leasing period as a
whole. However there can be no assurance that we will achieve these
objectives.
Cost of
Revenues
The
following table shows the cost of revenues detail by line of
business:
|
Years
ended December 31,
|
||||||||||||||||||||
|
2009
|
%
to total
|
2008
|
%
to total
|
%
change
|
||||||||||||||||
|
Agency
sales
|
1,905,931 | 32 | 3,008,265 | 45 | (37 | ) | ||||||||||||||
|
Underwriting
sales
|
1,209,856 | 20 | - | - | N/A | |||||||||||||||
|
Property
management
|
2,879,982 | 48 | 3,654,595 | 55 | (21 | ) | ||||||||||||||
|
Cost
of revenue
|
5,995,769 | 100 | 6,662,860 | 100 | (10 | ) | ||||||||||||||
The cost
of revenues for 2009 was $5,995,769; this was a decrease of 10% from $6,662,860
in 2008. In 2009, agency sales represented 32% of total cost of revenues,
underwriting sales represented 20% and property management represented
48%. The decrease in cost of revenues in 2009 was mainly due to a
decrease in salary expenses and consulting expenses..
Agency
sales
As
compared with 2008, cost of revenue of agency sales in 2009 decreased 37%. The
primary reason for the change was the decrease in salary expenses and consulting
expenses. In 2009, our salary expenses decreased $424,838 compared to 2008 and
consulting expenses decreased $737,180 compared to 2008.
12
Underwriting
Sales
The cost
of underwriting sales represents selling costs, such as staff costs and
advertising expenses, associated with underwriting sales.
Property
management
During
the year of 2005 and 2006, SZGFH entered into leasing agreements with certain
buyers of the Sovereign Building underwriting project to lease the properties
for them. These leasing agreements on these properties are for 62% of the floor
space that was sold to third party buyers. In accordance with the leasing
agreements, the owners of the properties can have a rental return of 8.5% and
8.8% per annum for a period of 5 years and 8 years, respectively. In regards to
the leasing agreements, we have negotiated with the buyers and have lowered the
annual rental return rate for the remaining leasing period from 8.5% for 5
years to 5.8%, and from 8.8% for 8 years to 6%. As of December 31,
2009, 58% of the buyers agreed upon the lowered rate and 24% of the buyers
agreed to cancel the leasing agreements. The leasing period started in the
second quarter, 2006, and the Company has the right to sublease the leased
properties to cover these lease commitments in the leasing period. As of
December 31, 2009, 82 sub-leasing agreements have been signed, the area of these
sub-leasing agreements represented 79% of total area with these lease
commitments. We expect that these properties will be leased out in 20
10
; the gross
margin will be improved. However, no assurance can be given that this will be
the case.
In
connection with our leasing guarantees to third party buyers in the Sovereign
Building, an accrual for onerous contracts was recognized equal to
the difference between the present value of the sublease income and the present
value of the associated lease expense at the appropriate discount rate. The
accrual for onerous contracts was $39,360 as of December 31, 2009 and $446,456
as of December 31, 2008.
Operating
Expenses
The
following table shows operating expenses detail by line of
business:
|
Years
ended December 31,
|
||||||||||||||||||||
|
2009
|
%
to total
|
2008
|
%
to total
|
%
change
|
||||||||||||||||
|
Agency
sales
|
842,788 | 87 | 1,180,917 | 92 | (29 | ) | ||||||||||||||
|
Property
management
|
125,732 | 13 | 105,784 | 8 | 19 | |||||||||||||||
|
Operating
expenses
|
968,520 | 100 | 1,286,701 | 100 | (25 | ) | ||||||||||||||
The
operating expenses of2009 were $968,520; these decreased 25% from $1,286,701 in
2008. In 2009, the expenses pertaining to agency sales represented
87% of the total operating expenses and property management represented
13%. The decrease in operating expenses in 2009 was mainly due to the
decrease in our agency sales expenses.
Agency
sales
When
compared to 2008, the operating expenses for agency sales in 2009 decreased 29%.
The primary reason for the decrease in 2009 was the decrease in staff costs,
business travel expenses and staff benefits of $31,459, $47,820 and $68,765
respectively, compared to 2008. These decreased costs due to several projects
closing.
Property
management
When
compared to 2008, the operating expenses for property management in 2009
increased 19%. The main reason for the increase was the agency commissions of
SZGFH. In 2009, the agency commissions increased $48,456, compared to
2008.
General and Administrative
Expenses
The
general and administrative expenses in 2009 were $2,355,278, decreasing 46% from
$4,380,662 in 2008. Primary reasons for the decrease were the
following:
|
i)
|
The
decrease in our staff cost. In 2009, our staff costs decreased $421,713,
compared to 2008.
|
|
ii)
|
The
decrease in business travel expenses. In 2009, business travel expenses
decreased $139,197, compared to
2008.
|
|
iii)
|
The
decrease in impairment loss on equity investment and impairment loss on
amount due from related party. In 2009, there was no impairment
loss. In 2008, there was an impairment loss on equity
investment of $83,399 and an impairment loss on amount due from related
party of $314,137.
|
|
iv)
|
The
decrease in impairment loss on advances to minority interest of
consolidated project venturers. In 2009, there was no impairment loss
compared with an impairment loss on advances to minority interest of
consolidated project venturers of $989,822 in
2008.
|
Interest
Expenses
When
compared to 2008, the interest expenses in 2009 decreased 11%. The interest
expenses relate to bank loans and promissory notes payable.
13
Major Related Party
Transaction
Certain
Relationships
A related
party is an entity that can control or significantly influence the management or
operating policies of another entity to the extent one of the entities may be
prevented from pursuing its own interests. A related party may also be any party
the entity deals with that can exercise that control.
Amount due to
directors
Amount due to Lin
Chin-Jung
As of
December 31, 2009, the balance includes
one
loan and
advances obtained from Lin Chin-Jung.
The loan includes principal of $198,002
and accrued interest of $28,447 thereon. The principal is unsecured, bears
interest at a rate of 9.6% per annum and the term of repayment is not
specifically defined
.
The
advances and reimbursements of $32,362 represented the salary payable and rental
reimbursement to Lin Chin-Jung outstanding as of December 31, 200
9
.
Amount due to Lin
Chao-Chin
A balance
of $31,399 represented the salary payable and rental reimbursement to Lin
Chao-Chin outstanding as of December 31, 200
9
.
Amount due to related
party
The
amount includes a rental deposit received from SZBFND. This amount is unsecured,
interest free and repayable on demand.
In 2009,
our principal sources of cash were revenues from our agency sales and property
management business. Most of our cash resources were used to fund our revenue
related expenses, such as salaries and commissions paid to the sales force,
daily administrative expenses and the maintenance of regional offices, and the
repayments of our bank loans and promissory notes.
We ended
the period with a cash position of $3,444,600.
The
Company’s operating activities provided cash in the amount of $736,472, which
was primarily attributable to the increase of our net profit.
The
Company’s investing activities provided cash resources of $4,865, which was
primarily attributable to the proceeds from disposal of plant and
equipment
The
Company’s financing activities provided cash resources of $2,100,197, which was
primarily attributable to the bank loan obtained by SHSY.
Our
independent auditor’s report on our financial statements was prepared on the
assumption we will continue as a going concern. The report
acknowledges that we have.significant accumulated losses from operations and a
net capital deficiency. These conditions cause substantial doubt as to our
ability to continue as a going concern.
The
potential cash needs for 2010 will be the repayments of our bank loans and
promissory notes, the rental guarantee payments and promissory deposits for
various property projects.
If our
business otherwise grows more rapidly than we currently predict, we plan to
raise funds through the issuance of additional shares of our equity securities
in one or more public or private offerings. We will also consider raising funds
through credit facilities obtained with lending institutions. There can be no
guarantee that we will be able to obtain such funds through the issuance of debt
or equity that are with terms satisfactory to management and our board of
directors.
OFF BALANCE SHEET
ARRANGEMENTS
The Company has no off-balance sheet
arrangements.
14
RISK
FACTORS
SRRE has
identified a number of risk factors faced by the Company. These factors, among
others, may cause actual results, events or performance to differ materially
from those expressed in this 10-K or in press releases or other public
disclosures. You should be aware of the existence of these factors.
RISKS RELATING TO THE
GROUP
Our
independent auditor’s report was prepared assuming we continue as a going
concern.
Our
independent auditor’s report on our financial statements was prepared on the
assumption we will continue as a going concern. The report
acknowledges that we have.significant accumulated losses from operations and a
net capital deficiency. These conditions cause substantial doubt as to our
ability to continue as a going concern.
SRRE
is a holding company and depends on its subsidiaries’ cash flows to meet its
obligations.
SRRE is a
holding company, and it conducts all of its operations through its subsidiaries.
As a result, its ability to meet any obligations depends upon its subsidiaries’
cash flows and payment of funds as dividends, loans, advances or other payments.
In addition, the payment of dividends or the making of loans, advances or other
payments to SRRE may be subject to regulatory or contractual
restrictions.
Our
invoicing for commissions may be delayed.
Generally,
we recognize our commission revenues after the contracts signed with developers
are completed and confirmations are received from the developers. However,
sometimes we do not recognize income even when we have rendered our services for
any of the following reasons:
|
a.
|
The
developers have not received payments from potential purchasers who have
promised to pay the outstanding sum by
cash;
|
|
b.
|
The
purchasers, who need to obtain mortgage financing to pay the outstanding
balance due, are unable to obtain the necessary financing from their
banks;
|
|
c.
|
Banks
are sometimes unwilling to grant the necessary bridge loan to the
developers in time due to the developers’ relatively low credit
rating;
|
|
d.
|
The
developers tend to be in arrears with sales commissions; therefore, do not
grant confirmation to us to be able to invoice them
accordingly.
|
Development
of new business may stretch our cash flow and strain our operation
efficiency.
Business
expansion and the need to integrate operations arising from the expansion may
place a significant strain on our managerial, operational and financial
resources, and will further contribute to a needed increase in our financial
needs.
Risks
associated with a Guaranteed Rental Return Promotion.
During
the year of 2005 and 2006, SZGFH entered into leasing agreements with certain
buyers of the Sovereign Building underwriting project to lease the properties
for them. These leasing agreements on these properties are for 62% of the floor
space that was sold to third party buyers. In accordance with the leasing
agreements, the owners of the properties can have a rental return of 8.5% and
8.8% per annum for a period of 5 years and 8 years, respectively. In regards to
the leasing agreements, we have negotiated with the buyers and have lowered the
annual rental return rate for the remaining leasing period from 8.5% for 5
years to 5.8%, and from 8.8% for 8 years to 6%. As of December 31,
2009, 58% of the buyers agreed upon the lowered rate and 24% of the buyers
agreed to cancel the leasing agreements. The leasing period started in the
second quarter, 2006, and the Company has the right to sublease the leased
properties to cover these lease commitments in the leasing period.
We are
continuing to promote this package. The return is guaranteed by SZGFH, whereby
SZGFH’s principal activities are real estate leasing and property management
services. However, we may not successfully sublease the targeted properties at
prices higher than what we committed in the promotional package. Our failure to
do so could adversely affect our financial condition.
Our
acquisition of new property may involve risks.
These
acquisitions involve several risks including, but not limited to, the
following:
|
a.
|
The
acquired properties may not perform as well as we expected or ever become
profitable.
|
|
b.
|
Improvements
to the properties may ultimately cost significantly more than we had
originally estimated.
|
15
Additional
acquisitions might harm our business.
As part
of our business strategy, we may seek to acquire or invest in additional
businesses, products, services or technologies that we think could complement or
expand our business. If we identify an appropriate acquisition opportunity, we
might be unable to negotiate the terms of that acquisition successfully, finance
it, or integrate it into our existing business and operations. We may also be
unable to select, manage or absorb any future acquisitions successfully.
Furthermore, the negotiation of potential acquisitions, as well as the
integration of an acquired business, would divert management time and other
resources. We may have to use a substantial portion of our available cash to
consummate an acquisition. If we complete acquisitions through exchange of our
securities, our shareholders could suffer significant dilution. In addition, we
cannot assure you that any particular acquisition, even if successfully
completed, will ultimately benefit our business.
Our
real estate investments are subject to numerous risks.
We are
subject to risks that generally relate to investments in real estate. The
investment returns available from equity investments in real estate depend in
large part on the amount of income earned and capital appreciation generated by
the related properties, as well as the expenses incurred. In addition, a variety
of other factors affect income from properties and real estate values, including
governmental regulations, insurance, zoning, tax and eminent domain laws,
interest rate levels and the availability of financing. For example, new or
existing real estate zoning or tax laws can make it more expensive and/or
time-consuming to develop real property or expand, modify or renovate
properties. When interest rates increase, the cost of acquiring, developing,
expanding or renovating real property increases and real property values may
decrease as the number of potential buyers decrease. Similarly, as financing
becomes less available, it becomes more difficult both to acquire and to sell
real property. Finally, governments can, under eminent domain laws, take real
property. Sometimes this taking is for less compensation than the owner believes
the property is worth. Any of these factors could have a material adverse impact
on results of our operations or financial condition. In addition, equity real
estate investments, such as the investments we hold and any additional
properties that we may acquire, are relatively difficult to sell quickly. If our
properties do not generate sufficient revenue to meet operating expenses,
including debt servicing and capital expenditures, our income will be
reduced.
Competition,
economic conditions and similar factors affecting us, and the real estate
industry in general, could affect our performance.
Our
properties and business are subject to all operating risks common to the real
estate industry. These risks include:
a.
Adverse effects of general and local economic conditions;
b.
Increases in operating costs attributable to inflation and other factors;
and
c.
Overbuilding in certain property sectors.
These
factors could adversely affect our revenues, profitability and results of
operations.
Our business is susceptible to
fluctuations in the real estate market of China, especially in certain areas of
eastern China where a significant portion of our operations are concentrated,
which may adversely affect our revenues and results of
operations.
We
conduct our real estate services business primarily in China. Our business
depends substantially on the conditions of the PRC real estate market. Demand
for private residential real estate in China has grown rapidly in the recent
decade but such growth is often coupled with volatility in market conditions and
fluctuation in real estate prices. Fluctuations of supply and demand in China’s
real estate market are caused by economic, social, political and other factors.
To the extent fluctuations in the real estate market adversely affect real
estate transaction volumes or prices, our financial condition and results of
operations may be materially and adversely affected.
As a
significant portion of our operations is concentrated in Shanghai, Jiangsu
Province, any decrease in demand or real estate prices or any other adverse
developments in these regions may materially and adversely affect our total real
estate transaction volumes and average selling prices, which may in turn
adversely affect our revenues and results of operations.
Our business may be materially and
adversely affected by government measures aimed at China’s real estate
industry.
The real
estate industry in China is subject to government regulations. Until 200
9
, the real estate
markets in a number of major cities in China had experienced rapid and
significant growth. Before the global economic crisis hit all the major
economies worldwide in 200
9
, the PRC
government had adopted a series of measures to restrain what it perceived as
unsustainable growth in the real estate market. From 2003 to 200
9
, the PRC
government introduced a series of specific administrative and credit-control
measures including, but not limited to, setting minimum down payment
requirements for residential and commercial real estate transactions, limiting
availability of mortgage loans, and tightening governmental approval process for
certain real estate transactions.
However,
despite the recent government measures aimed at maintaining the long-term
stability of the real estate market, we cannot assure you that the PRC
government will not adopt new measures in the future that may result in
short-term downward adjustments and uncertainty in the real estate market. Our
business may be materially and adversely affected as a result of decreased
transaction volumes or real estate prices that may follow these adjustments or
market uncertainty.
16
We
operate in a highly competitive environment.
Our
competitors may be able to adapt more quickly to changes in customer needs or to
devote greater resources than we can to developing and expanding our services.
Such competitors could also attempt to increase their presence in our markets by
forming strategic alliances with other competitors, by offering new or improved
services or by increasing their efforts to gain and retain market share through
competitive pricing. As the market for our services matures, price competition
and penetration into the market will intensify. Such competition may adversely
affect our gross profits, margins and results of operations. There can be no
assurance that we will be able to compete successfully with existing or new
competitors.
We
may be unable to effectively manage our growth.
We will
need to manage our growth effectively, which may entail devising and effectively
implementing business and integration plans, training and managing our growing
workforce, managing our costs, and implementing adequate control and reporting
systems in a timely manner. We may not be able to successfully manage our growth
or to integrate and assimilate any acquired business operations. Our failure to
do so could affect our success in executing our business plan and adversely
affect our revenues, profitability and results of operations.
If
we fail to successfully manage our planned expansion of operations, our growth
prospects will be diminished and our operating expenses could exceed budgeted
amounts.
Our
ability to offer our services in an evolving market requires an effective
planning and management process. We have expanded our operations rapidly since
inception, and we intend to continue to expand them in the foreseeable future.
This rapid growth places significant demand on our managerial and operational
resources and our internal training capabilities. This growth will continue to
substantially burden our management team. To manage growth effectively, we
must:
a.
Implement and improve our operational, financial and other systems, procedures
and controls on a timely basis.
b.
Expand, train and manage our workforce, particularly our sales and marketing and
support organizations.
We cannot
be certain that our systems, procedures and controls will be adequate to support
our current or future operations or that our management will be able to handle
such expansion and still achieve the execution necessary to meet our growth
expectations. Failure to manage our growth effectively could diminish our growth
prospects and could result in lost opportunities as well as operating expenses
exceeding the amount budgeted.
We
may be unable to maintain internal funds or obtain financing or renew credit
facilities in the future.
Adequate
financing is one of the major factors, which can affect our ability to execute
our business plan in this regard. We finance our business mainly through
internal funds, bank loans or raising equity funds. There is no guarantee that
we will always have internal funds available for future developments or we will
not experience difficulties in obtaining financing and renewing credit
facilities granted by financial institutions in the future. In addition, there
may be a delay in equity fundraising activities. Our access to obtain debt or
equity financing depends on the banks' willingness to lend and on conditions in
the capital markets, and we may not be able to secure additional sources of
financing on commercially acceptable terms, if at all.
We
may need to raise additional capital that may not be available on terms
favorable to us, if at all.
We may
need to raise additional capital in the future, and we cannot be certain that we
will be able to obtain additional financing on favorable terms, if at all. If we
cannot raise additional capital on acceptable terms, we may not be able to
develop or enhance our services, take advantage of future opportunities or
respond to competitive pressures or unanticipated requirements. To fully realize
our business objectives and potential, we may require additional financing. We
cannot be sure that we will be able to secure the financing we will require, or
that it will be available on favorable terms. If we are unable to obtain any
necessary additional financing, we will be required to substantially curtail our
approach to implementing our business objectives. Additional financing may be
debt, equity or a combination of debt and equity. If equity is used, it could
result in significant dilution to our shareholders.
Our
operations and growth prospects may be significantly impeded if we are unable to
retain our key personnel or attract additional key personnel, particularly since
experienced personnel and new skilled personnel are in short
supply.
Competition
for key personnel is intense. As a small company, our success depends on the
service of our executive officers, and other skilled managerial and technical
personnel, and our ability to attract, hire, train and retain personnel. There
is always the possibility that certain of our key personnel may terminate their
employment with us to work for one of our competitors at any time for any
reason. There can be no assurance that we will be successful in attracting and
retaining key personnel. The loss of services of one or more key personnel could
have a material adverse effect on us and would materially impede the operation
and growth of our business.
17
If
our partnering developers experience financial or other difficulties, our
business and revenues could be adversely affected.
As a
service-based company, we greatly depend on the working relationships and agency
contracts with its partnering developers. We are exposed to the risks that our
partnering developers may experience financial or other difficulties, which may
affect their ability or will to carry out any existing development projects or
resell contracts, thus delaying or canceling the fulfillment of their agency
contracts with us. Any of these factors could adversely affect our revenues,
profitability and results of operations.
If
we fail to establish and maintain strategic relationships, the market acceptance
of our services, and our profitability, may suffer.
To offer
services to a larger customer base, our direct sales force depends on strategic
partnerships, marketing alliances, and partnering developers to obtain customer
leads and referrals. If we are unable to maintain our existing strategic
relationships or fail to enter into additional strategic relationships, we will
have to devote substantially more resources to the marketing of our services. We
would also lose anticipated customer introductions and co-marketing benefits.
Our success depends in part on the success of our strategic partners and their
ability to market our services successfully. In addition, our strategic partners
may not regard us as significant for their own businesses. Therefore, they could
reduce their commitment to us or terminate their respective relationships with
us, pursue other partnerships or relationships, or attempt to develop or acquire
services that compete with our services. Even if we succeed in establishing
these relationships, they may not result in additional customers or
revenues.
We
are subject to the risks associated with projects operated through joint
ventures.
Some of
our projects are operated through joint ventures in which we have controlling
interests. We may enter into similar joint ventures in the future. Any joint
venture investment involves risks such as the possibility that the joint venture
partner may seek relief under federal or state insolvency laws, or have economic
or business interests or goals that are inconsistent with our business interests
or goals. While the bankruptcy or insolvency of our joint venture partner
generally should not disrupt the operations of the joint venture, we could be
forced to purchase the partner’s interest in the joint venture, or the interest
could be sold to a third party. Additionally, we may enter into joint ventures
in the future in which we have non-controlling interests. If we do not have
control over a joint venture, the value of our investment may be affected
adversely by a third party that may have different goals and capabilities than
ours. It may also be difficult for us to exit a joint venture that we do not
control after an impasse. In addition, a joint venture partner may be unable to
meet its economic or other obligations, and we may be required to fulfill those
obligations.
We
are subject to risks relating to acts of God, terrorist activity and
war.
Our
operating income may be reduced by acts of God, such as natural disasters or
acts of terror, in locations where we own and/or operate significant properties
and areas from which we draw customers and partnering developers. Some types of
losses, such as from earthquake, hurricane, terrorism and environmental hazards,
may be either uninsurable or too expensive to justify insuring against. Should
an uninsured loss or a loss in excess of insured limits occur, we could lose all
or a portion of the capital we have invested in any particular property, as well
as any anticipated future revenue from such property. In that event, we might
nevertheless remain obligated for any mortgage debt or other financial
obligations related to the property. Similarly, wars (including the potential
for war), terrorist activity (including threats of terrorist activity),
political unrest and other forms of civil strife as well as geopolitical
uncertainty have caused in the past, and may cause in the future, our results to
differ materially from anticipated results.
We
have limited business insurance coverage in China.
The
insurance industry in China is still at an early stage of development. Insurance
companies in China offer limited business insurance products. As a result, we do
not have any business liability or disruption insurance coverage for our
operations in China. Any business disruption, litigation or natural disaster
might result in substantial costs and diversion of resources.
We
may be affected by global climate change or by legal, regulatory, or market
responses to such change.
There is
a growing concern in regards to the global warming issues affecting the world
today. The changing weather patterns and abnormal conditions may affect the
construction and logistics of developers and this may indirectly cause an
adverse effect on our operations. Extreme weather conditions may cause a delay
in construction of properties; this then may delay the sale of these properties
and therefore delayour future revenue stream. There may be regulations in
manufacturing materials for property construction and new building codes in
response to global warming that may delay construction and/or create further
expenses to the developers. These possible changes may indirectly affect our
business.
18
RISKS RELATING TO OUR
SECURITIES
Our
controlling shareholders could take actions that are not in the public
shareholders’ best interests.
As of
December 31, 2009, Ace Develop directly controls 38.08% of our outstanding
common stock and Lin Chi-Jung, our Chairman, is the principal and controlling
shareholder of Ace Develop. Accordingly, pursuant to our Articles of
Incorporation and bylaws, Ace Develop and Lin Chi-Jung, by virtue of their
controlling ownership of share interests, will be able to exercise substantial
influence over our business by directly or indirectly voting at either
shareholders meetings or the board of directors meetings in matters of
significance to us and our public shareholders, including matters relating
to:
a.
Election of directors and officers;
b. The
amount and timing of dividends and other distributions;
c.
Acquisition of or merger with another company; and
d. Any
proposed amendments to our Articles of Incorporation.
Future
sales of our common stock could adversely affect our stock price.
If our
shareholders sell substantial amounts of our common stock in the public market,
the market price of our common stock could be adversely affected. In addition,
the sale of these shares could impair our ability to raise capital through the
sale of additional equity securities.
We
are listed on the OTC Bulletin Board, which can be a volatile
market.
Our
common stock is quoted on the OTC Bulletin Board, a FINRA sponsored and operated
quotation system for equity securities. It is a more limited trading market than
the Nasdaq Capital Market, and timely and accurate quotations of the price of
our common stock may not always be available. Investors may expect trading
volume to be low in such a market. Consequently, the activity of only a few
shares may affect the market and may result in wide swings in price and in
volume.
We
may be subject to exchange rate fluctuations.
A
majority of our revenues are received, and a majority of our operating costs are
incurred, in Renminbi. Because our financial statements are presented in U.S.
Dollars, any significant fluctuation in the currency exchange rates between the
Renminbi and the U.S. Dollar will affect our reported results of operations. We
do not currently engage in currency-hedging transactions.
Trading
of our common stock is limited, which may make it difficult for investors to
sell their shares at times and prices that investors feel are
appropriate.
Trading
of our common stock has been extremely limited. This adversely effects the
liquidity of our common stock, not only in terms of the number of shares that
can be bought and sold at a given price, but also through delays in the timing
of transactions and reduction in security analysts’ and the media’s coverage of
us. This may result in lower prices for our common stock than might otherwise be
obtained and could also result in a larger spread between the bid and asked
prices for our common stock.
There
is a limited market for our common stock and an active trading market for our
common stock may never develop.
Trading
in our common stock has been limited and has been characterized by wide
fluctuations in trading prices, due to many factors that may have little to do
with a company’s operations or business prospects.
Because
it may be a “penny stock,” it will be more difficult for shareholders to sell
shares of our common stock.
In
addition, our common stock may be considered a “penny stock” under SEC rules
because it has been trading on the OTC Bulletin Board at prices lower than
$1.00. Broker-dealers who sell penny stocks must provide purchasers of these
stocks with a standardized risk-disclosure document prepared by the SEC. This
document provides information about penny stocks and the nature and level of
risks involved in investing in the penny-stock market. A broker must also give a
purchaser, orally or in writing, bid and offer quotations and information
regarding broker and salesperson compensation, make a written determination that
the penny stock is a suitable investment for the purchaser, and obtain the
purchaser’s written agreement for the purchaser. Broker-dealers also must
provide customers that hold penny stocks in their accounts with such
broker-dealers a monthly statement containing price and market information
relating to the penny stock. If a penny stock is sold to investors in violation
of the penny stock rules, investors may be able to cancel the purchase and get
the money back. The penny stock rules may make it difficult for investors to
sell their shares of our stock, and because of these rules, there is less
trading in penny stocks. Moreover, many brokers simply choose not to participate
in penny-stock transactions. Accordingly, investors may not always be able to
resell shares of our common stock publicly at times and at prices that investors
feel are appropriate.
19
Our
stock price is, and we expect it to remain, volatile, which could limit
investors’ ability to sell stock at a profit.
Since the
completion of the SRRE – CY-SRRE/LRY share exchange transactions the market
price of our common stock has ranged from a high of $1.05 per share to a low of
$0.03 per share in the 2009 and 2008. The volatile price of our stock makes it
difficult for investors to predict the value of an investment, to sell shares at
a profit at any given time, or to plan purchases and sales in advance. A variety
of factors may affect the market price of our common stock. These include, but
are not limited to:
a.
Announcements of new technological innovations or new commercial services by our
competitors or us;
b.
Developments concerning proprietary rights;
c.
Regulatory developments in Mainland China and foreign countries;
d.
Period-to-period fluctuations in our revenues and other results of
operations;
e.
Economic or other crises and other external factors;
f.
Changes in financial estimates by securities analysts; and
g. Sales
of our common stock.
We
will not be able to control many of these factors, and we believe that
period-to-period comparisons of our financial results will not necessarily be
indicative of our future performance.
The stock
market in general has experienced extreme price and volume fluctuations that may
have been unrelated and disproportionate to the operating performance of
individual companies. These broad market and industry factors may seriously harm
the market price of our common stock, regardless of our operating
performance.
Because
we have not paid and do not plan to pay cash dividends, investors will not
realize any income from an investment in our common stock unless and until
investors sell their shares at profit.
We did
not pay cash dividends on our common stock in 2009, and we do not anticipate
paying any cash dividends in the near future. Investors should not rely on an
investment in our stock if they require dividend income. Further, investors will
only realize income on an investment in our stock in the event they sell or
otherwise dispose of their shares at a price higher than the price they paid for
their shares. Such a gain would result only from an increase in the market price
of our common stock, which is uncertain and unpredictable.
We
intend to retain all of our earnings for use in our business and do not
anticipate paying any cash dividends in the near future.
The
payment of any future dividends will be at the discretion of the Board of
Directors and will depend upon a number of factors, including future earnings,
the success of our business activities, general financial condition, future
prospects, general business conditions and such other factors as our Board of
Directors may deem relevant.
RISKS RELATING TO THE REAL
ESTATE INDUSTRY IN YANGTZE DELTA AND OTHER AREAS OF THE PRC
The
real estate market in Yangtze Delta and other areas of the PRC is at an early
stage of development.
We are
subject to real estate market conditions in the PRC generally and Yangtze Delta
in particular. Private ownership of property in the PRC is still at an early
stage of development. Although there is a perception that economic growth in the
PRC and the higher standard of living resulting from such growth will lead to a
greater demand for private properties in the PRC, it is not possible to predict
with certainty that such a correlation exists as many social, political,
economic, legal and other factors may affect the development of the property
market.
The PRC
property market, including the Yangtze Delta property market, is volatile and
may experience oversupply and property price fluctuations. The central and local
governments frequently adjust monetary and other economic policies to prevent
and curtail the overheating of the PRC and local economies, and such economic
adjustments may affect the real estate market in Yangtze Delta and other parts
of China. Furthermore, the central and local governments from time to time make
policy adjustments and adopt new regulatory measures in a direct effort to
control the over development of the real estate market in China, including
Yangtze Delta. Such policies may lead to changes in market conditions, including
price instability and an imbalance of supply and demand of residential
properties, which may materially adversely affect our business and financial
conditions. Also, there is no assurance that there will not be over development
in the property sector in Yangtze Delta and other parts of China in the future.
Any future over development in the property sector in Yangtze Delta and other
parts of China may result in an oversupply of properties and a fall of property
prices in Yangtze Delta or any of our other markets, which could adversely
affect our business and financial condition.
20
We
face increasing competition, which may adversely affect our revenues,
profitability and results of operations.
In recent
years, a large number of property companies have begun undertaking property
sales and investment projects in Yangtze Delta and elsewhere in the PRC. Some of
these property companies may have better track records and greater financial and
other resources than we do. The intensity of the competition may adversely
affect our business and financial position. In addition, the real estate market
in Yangtze Delta and elsewhere in the PRC is rapidly changing. If we cannot
respond to the changes in the market conditions more swiftly or effectively than
our competitors do, our business and financial position will be adversely
affected.
If the
availability or attractiveness of mortgage financing were significantly limited,
many of our prospective customers would not be able to purchase the properties,
thus adversely affecting our business and financial position.
Mortgages
are becoming increasingly popular as a means of financing property purchases in
the PRC. An increase in interest rates may significantly increase the cost of
mortgage financing, thus reducing the affordability of mortgages as a source of
financing for residential property purchases. The PRC government has increased
the down payment requirements and imposed certain other conditions that make
mortgage financing unavailable or unattractive for some potential property
purchasers. There is no assurance that the down payment requirements and other
conditions will not be further revised. If the availability or attractiveness of
mortgage financing is further significantly limited, many of our prospective
customers would not be able to purchase the properties and, as a result, our
business and future prospects would be adversely affected.
Our
future prospects are heavily dependent on the performance of property sectors in
specific geographical areas.
The
properties we resell and intend to invest in are mainly based in Yangtze Delta.
Our future prospects are, therefore, heavily dependent on the continued growth
of the property sector around Yangtze Delta, and our business may be affected by
any adverse developments in the supply and demand or housing prices in the
property sector around Yangtze Delta.
The
current level of property development and investment activity in Yangtze Delta
and other markets is substantial. However, there is no assurance that such
property resale and investment activity in Yangtze Delta or any of our other
markets will continue at this level in the future or that we will be able to
benefit from the future growth of these property markets.
Our
revenues and operating income could be reduced by adverse conditions specific to
our property locations.
The
properties we resell and intend to invest in are concentrated geographically and
are located predominately in Yangtze Delta. As a result, our business and our
financial operating results may be materially affected by adverse economic,
weather or business conditions in this area. Adverse conditions that affect
these areas such as economic recession, changes in extreme weather conditions
and natural disasters, may have an adverse impact on our
operations.
RISKS RELATING TO THE
PEOPLES REPUBLIC OF CHINA
All of
our current prospects and deals are generated in Mainland China; thus all of our
revenues are derived from our operations in the PRC. Accordingly, our business,
financial condition, results of operations and prospects are subject, to a
significant extent, to economic, political and legal developments in the
PRC.
PRC
economic, political policies and social conditions could adversely affect our
business.
The
economy of PRC differs from the economies of most developed countries in a
number of respects, including the amount of government involvement, level of
development, growth rate, control of foreign exchange and allocation of
resources.
The PRC
Government has been reforming the PRC economic system from planned economy to
market oriented economy for more than 20 years, and has also begun reforming the
government structure in recent years. These reforms have resulted in significant
economic growth and social progress. Although we believe these reforms will have
a positive effect on our overall and long-term development, we cannot predict
whether any future changes in PRC’s political, economic and social conditions,
laws, regulations and policies will have any adverse effect on our current or
future business, results of operations or financial condition.
Changes
in foreign exchange regulations may adversely affect our ability to pay
dividends and could adversely affect our results of operations and financial
condition.
Substantially
all of our revenues and operating expenses are denominated in Renminbi.
Conversion of Renminbi is under strict government regulation in the PRC. The
Renminbi is currently freely convertible under the "current account", including
trade and service related foreign exchange transactions and payment of
dividends, but not under the "capital account", which includes foreign direct
investment and loans. Under the existing foreign exchange regulations in the
PRC, we will be able to pay dividends in foreign currencies without prior
approval from the State Administration for Foreign Exchange by complying with
certain procedural requirements. However, there is no assurance that the above
foreign policies regarding payment of dividends in foreign currencies will
continue in the future.
21
Fluctuation
of the Renminbi could materially affect the value of, and dividends payable on,
the common stock.
The value
of the Renminbi is subject to changes in the PRC Government’s policies and
depends to a large extent on China’s domestic and international economic and
political developments, as well as supply and demand in the local market. Since
1994, the official exchange rate for the conversion of Renminbi to U.S. Dollars
has generally been stable, and in 2005 the official exchange rate between U.S.
Dollars and Renminbi
had a little
fluctuation
.
However, we
cannot give any assurance that the value of the Renminbi will continue to remain
stable against the U.S. Dollar or any other foreign currency. Since our income
and profit are denominated in Renminbi, any devaluation of the Renminbi would
adversely affect the value of, and dividends, if any, payable on, our shares in
foreign currency terms.
Our
operations could be adversely affected by changes in the political and economic
conditions in the PRC. The PRC is our main market and accounted for
all of our revenue. Therefore, we face risks related to conducting business in
the PRC. Changes in the social, economic and political conditions of the PRC may
adversely affect our business. Unfavorable changes in government policies,
political unrest and economic developments may also have a negative impact on
our operations.
Since the
adoption of the “open door policy” in 1978 and the “socialist market economy” in
1993, the PRC government has been reforming and is expected to continue to
reform its economic and political systems. Any changes in the
political and economic policies of the PRC government may lead to changes in the
laws and regulations or the interpretation of the same, as well as changes in
the foreign exchange regulations, taxation and import and export restrictions,
which may, in turn, adversely affect our financial performance. While the
current policy of the PRC government seems to be one of imposing economic reform
policies to encourage foreign investments and greater economic decentralization,
we cannot assure that such a policy will continue to prevail in the
future.
The
PRC Legal System Embodies Uncertainties
The PRC
legal system is a civil law system based on written statutes. Unlike common law
systems, it is a system in which decided legal cases have little value as
precedents. In 1979, the PRC Government began to promulgate a comprehensive
system of laws and regulations governing economic matters in general. The
overall effect of legislation over the past 28 years has significantly enhanced
the protections afforded to various forms of foreign investment in Mainland
China. Our PRC operating subsidiaries, wholly foreign-owned enterprises
(“WFOEs”), are subject to laws and regulations applicable to foreign investment
in the PRC in general and laws and regulations applicable to WFOEs in
particular. However, these laws, regulations and legal requirements are
constantly changing, and their interpretation and enforcement involve
uncertainties. These uncertainties could limit the legal protections available
to us and other foreign investors. In addition, we cannot predict the effect of
future developments in the PRC legal system, including the promulgation of new
laws, changes to existing laws or the interpretation or enforcement thereof, or
the pre-emption of local regulations by national laws.
Our
shareholders may not be able to enforce U.S. civil liabilities
claims.
Our
assets are located outside the United States and are held through subsidiaries
incorporated under the laws of the Cayman Islands, British Virgin Islands and
the PRC. Our current operations are conducted in the PRC. In addition, our
directors and officers are residents of the PRC. As a result, it may be
difficult for shareholders to implement service of process on these individuals.
In addition, there is uncertainty as to whether the courts of China would
recognize or enforce judgments of United States courts obtained against the
Company or such persons predicated upon the civil liability provisions of the
securities laws of the United States or any state thereof, or be competent to
hear original actions brought in these countries against us or such persons
predicated upon the securities laws of the United States or any state
thereof.
22
INDEX
TO CONSOLIDATED FINANCIAL STATEMENTS
|
Report
of Independent Registered Public Accounting Firm
|
24
|
|
Consolidated
Balance Sheets -
|
|
|
December
31, 2009 and 2008
|
25
|
|
Consolidated
Statements of Operations -
|
|
|
December
31, 2009 and 2008
|
26
|
|
Consolidated
Statements of Stockholders' Deficit -
|
|
|
December
31, 2009 and 2008
|
27
|
|
Consolidated
Statements of Cash Flows -
|
|
|
December
31, 2009 and 2008
|
28
|
|
Notes
to Consolidated Financial Statements
|
29
|
23
Report
of Independent Registered Public Accounting Firm
To the
Board of Directors and Stockholders of
Sunrise
Real Estate Group, Inc.
We have
audited the accompanying consolidated balance sheet of Sunrise Real Estate
Group, Inc. as of December 31, 2009, and the related consolidated statements of
operations, stockholders' deficit and cash flows for the year ended December 31,
2009. These financial statements are the responsibility of the Company's
management. Our responsibility is to express an opinion on these financial
statements based on our audit. The financial statements of Sunrise Real Estate
Group Inc as of December 31, 2008, were audited by other auditors whose report
dated March 14, 2009, expressed an unqualified opinion on those
statements.
We
conducted our audit in accordance with the standards of the Public Company
Accounting Oversight Board (United States). Those standards require that we plan
and perform the audit to obtain reasonable assurance about whether the financial
statements are free of material misstatement. The Company is not required to
have, nor were we engaged to perform, an audit of its internal control over
financial reporting. Our audit included consideration of internal control over
financial reporting as a basis for designing audit procedures that are
appropriate in the circumstances, but not for the purpose of expressing an
opinion on the effectiveness of the Company's internal control over financial
reporting. Accordingly, we express no such opinion. An audit includes examining,
on a test basis, evidence supporting the amounts and disclosures in the
financial statements. An audit also includes assessing the accounting principles
used and significant estimates made by management, as well as evaluating the
overall financial statement presentation. We believe that our audit provides a
reasonable basis for our opinion.
In our
opinion, the consolidated financial statements referred to above present fairly,
in all material respects, the financial position of Sunrise Real Estate Group,
Inc. as of December 31, 2009 and the results of its consolidated operations and
its cash flows for the year then ended in conformity with accounting
principles generally accepted in the United States of America.
The
accompanying financial statements have been prepared assuming that the Company
will continue as a going concern. As discussed in Note 2 to the financial
statements, the Company has significant accumulated losses from
operations and has a net capital deficiency that raise substantial doubt about
its ability to continue as a going concern. Management’s plans in regard to
these matters are also described in Note 2. The financial statements do not
include any adjustments that might result from the outcome of this
uncertainty.
Woodbridge.
CT, USA, April 12, 2009
24
Sunrise
Real Estate Group, Inc.
Consolidated
Balance Sheets
(Expressed
in US Dollars)
|
December
31,
|
December
31,
|
|||||||
|
2009
|
2008
|
|||||||
|
(Audited)
|
(Audited)
|
|||||||
|
ASSETS
|
||||||||
|
Current
assets
|
||||||||
|
Cash
and cash equivalents
|
$ | 3,444,600 | $ | 587,468 | ||||
|
Restricted
cash
|
- | 32,411 | ||||||
|
Accounts
receivable
|
651,329 | 720,789 | ||||||
|
Promissory
deposits (Note 3)
|
732,257 | 1,126,620 | ||||||
|
Other
receivables and deposits (Note 4)
|
$ | 177,001 | 322,095 | |||||
|
|
||||||||
|
Total
current assets
|
5,005,187 | 2,789,383 | ||||||
|
|
||||||||
|
Property,
plant and equipment – net (Note 5)
|
2,291,995 | 2,650,023 | ||||||
|
Investment
properties (Note 6)
|
7,597,074 | 8,194,880 | ||||||
|
Goodwill
(Note 7)
|
- | 13,307 | ||||||
|
|
||||||||
|
Total
assets
|
$ | 14,894,256 | $ | 13,647,593 | ||||
|
|
||||||||
|
LIABILITIES
AND SHAREHOLDERS’ DEFICIT
|
||||||||
|
|
||||||||
|
Current
liabilities
|
||||||||
|
Bank
loans (Note 8)
|
$ | 205,032 | $ | 6,044,893 | ||||
|
Promissory
notes payable (Note 9)
|
1,036,119 | 963,006 | ||||||
|
Accounts
payable
|
316,064 | 340,353 | ||||||
|
Amount
due to directors (Note 10)
|
290,210 | 169,355 | ||||||
|
Amount
due to related party (Note 10)
|
127,996 | 127,900 | ||||||
|
Other
payables and accrued expenses (Note 11)
|
2,283,359 | 2,359,068 | ||||||
|
Other
tax payable (Note 12)
|
384,290 | 593,899 | ||||||
|
Income
tax payable (Note 13)
|
987,187 | 1,083,477 | ||||||
|
Total
current liabilities
|
5,630,257 | 11,681,951 | ||||||
|
Long-term
bank loans (Note 8)
|
8,054,831 | 204,840 | ||||||
|
Long-term
promissory notes payable (Note 9)
|
11,111 | |||||||
|
Deposits
received from underwriting sales (Note 15)
|
4,316,655 | 8,275,725 | ||||||
|
Total
liabilities
|
18,001,743 | 20,173,627 | ||||||
|
Noncontrolling
interests of consolidated subsidiaries
|
636,881 | 488,330 | ||||||
|
Commitments
and contingencies (Note 14)
|
||||||||
|
Shareholders’
deficit
|
||||||||
|
Common
stock, par value $0.01 per share; 200,000,000 shares authorized;
23,691,925 shares issued and outstanding as of December 31, 2009 and
December 31, 2008
|
236,919 | 236,919 | ||||||
|
Additional
paid-in capital
|
3,620,008 | 3,620,008 | ||||||
|
Statutory
reserve (Note 16)
|
759,855 | 731,762 | ||||||
|
Accumulated
losses
|
(9,023,506 | ) | (12,188,648 | ) | ||||
|
Accumulated
other comprehensive income (Note 17)
|
662,356 | 585,595 | ||||||
|
Total
shareholders’ deficit
|
(3,744,368 | ) | (7,014,364 | ) | ||||
|
Total
liabilities and shareholders’ deficit
|
$ | 14,894,256 | $ | 13,647,593 | ||||
See
accompanying notes to consolidated financial statements.
25
Sunrise
Real Estate Group, Inc.
Consolidated
Statements of Operations
(Expressed
in US Dollars)
|
Years
Ended December 31,
|
||||||||
|
2009
|
2008
|
|||||||
|
(Audited)
|
(Audited)
|
|||||||
|
Net
Revenues
|
$ | 13,110,591 | $ | 8,075,193 | ||||
|
Cost
of Revenues
|
(5,995,769 | ) | (6,662,860 | ) | ||||
|
Gross
Profit
|
7,114,822 | 1,412,333 | ||||||
|
Operating
Expenses
|
(968,520 | ) | (1,286,701 | ) | ||||
|
General
and Administrative Expenses
|
(2,355,278 | ) | (4,380,662 | ) | ||||
|
Operating
Profit/(Loss)
|
3,791,024 | (4,255,030 | ) | |||||
|
Other
Income, Net
|
480,618 | 27,665 | ||||||
|
Interest
Income
|
3,557 | 13,199 | ||||||
|
Impairment
loss on goodwill
|
(13,307 | ) | - | |||||
|
Interest
Expenses
|
(555,282 | ) | (623,928 | ) | ||||
|
Profit/(Loss)
Before Income Tax and Minority Interest
|
3,706,610 | (4,838,094 | ) | |||||
|
Income
Tax (Note 13)
|
(201,057 | ) | (1,164,307 | ) | ||||
|
Profit/(Loss)
Before Minority Interest
|
3,505,553 | (6,002,401 | ) | |||||
|
Minority
Interest of Consolidated Subsidiaries
|
(230,169 | ) | (26,506 | ) | ||||
|
Net
Profit
/(Loss)
|
$ | 3,275,384 | $ | (6,028,907 | ) | |||
|
Profit/(Loss)
Per Share – Basic and Fully Diluted
|
$ | 0.14 | $ | (0.25 | ) | |||
|
Weighted
average common shares outstanding
–
Basic and Fully Diluted
|
23,691,925 | 23,691,925 | ||||||
See
accompanying notes to consolidated financial statements.
26
Sunrise
Real Estate Group, Inc.
Consolidated
Statements of Stockholders’ Deficit
(Expressed
in US Dollars)
|
Common
Stock
|
||||||||||||||||||||||||||||
|
Number
of
shares
issued
|
Amount
|
Additional
paid-in
capital
|
Statutory
reserve
|
Accumulated
other comprehensive income
|
Accumulated
Losses
|
Total
stockholders’
equity/
(deficit)
|
||||||||||||||||||||||
|
Balance,
December 31, 2007
|
23,691,925 | $ | 236,919 | $ | 3,620,008 | $ | 729,744 | $ | 724,998 | $ | (6,157,723 | ) | $ | (846,054 | ) | |||||||||||||
|
Issuance
of stock dividend
|
- | - | - | - | - | - | - | |||||||||||||||||||||
|
Loss
for the year
|
- | - | - | - | - | (6,028,907 | ) | (6,028,907 | ) | |||||||||||||||||||
|
Profit
return to minority interest in subsidiary
|
- | - | - | - | - | - | - | |||||||||||||||||||||
|
Transfer
between reserves
|
- | - | - | 2,018 | - | (2,018 | ) | - | ||||||||||||||||||||
|
Translation
of foreign operations
|
- | - | - | - | (139,403 | ) | - | (139,403 | ) | |||||||||||||||||||
|
Balance,
December 31, 2008
|
23,691,925 | $ | 236,919 | $ | 3,620,008 | $ | 731,762 | $ | 585,595 | $ | (12,188,648 | ) | $ | (7,014,364 | ) | |||||||||||||
|
Profit
for the year
|
- | - | - | - | - | $ | 3,275,384 | $ | 3,275,384 | |||||||||||||||||||
|
Transfer
between reserves
|
- | - | - | 28,093 | - | (28,093 | ) | - | ||||||||||||||||||||
|
Profit
return to minority interest in subsidiary
|
- | - | - | - | - | (82,149 | ) | (82,149 | ) | |||||||||||||||||||
|
Translation
of foreign operations
|
- | - | - | - | 76,761 | - | 76,761 | |||||||||||||||||||||
|
Balance,
December 31, 2009
|
23,691,925 | $ | 236,919 | $ | 3,620,008 | $ | 759,855 | 662,356 | $ | (9,023,506 | ) | $ | (3,744,368 | ) | ||||||||||||||
See
accompanying notes to consolidated financial statements.
27
Sunrise
Real Estate Group, Inc.
Consolidated
Statements of Cash Flows
Increase/(Decrease)
in Cash and Cash Equivalents
(Expressed
in US Dollars)
|
Years
Ended December 31,
|
||||||||
|
2009
|
2008
|
|||||||
|
(Audited)
|
(Audited)
|
|||||||
|
Cash
flows from operating activities
|
||||||||
|
Net
profit/(loss)
|
$ |
3,275,384
|
$ | (6,028,907 | ) | |||
|
Adjustments
to reconcile net income to
|
||||||||
|
net
cash used in operating activities
|
||||||||
|
Depreciation
of property, plant and equipment
|
841,775 | 813,776 | ||||||
|
Impairment
loss on amount due from venturers
|
- | 989,822 | ||||||
|
Valuation
allowance for deferred tax assets
|
- | 1,085,723 | ||||||
|
Loss
/(Gain) on disposal of property, plant and equipment
|
22,147 | (2,608 | ) | |||||
|
Impairment
losses
|
13,307 | 397,536 | ||||||
|
Minority
interest
|
230,169 | 26,506 | ||||||
|
Change
in:
|
||||||||
|
Accounts
receivable
|
70,101 | 176,937 | ||||||
|
Promissory
deposits
|
395,222 | (819,613 | ) | |||||
|
Other
receivables and deposits
|
145,324 | 316,155 | ||||||
|
Amount
with related party
|
- | (22,775 | ) | |||||
|
Accounts
payable
|
(24,596 | ) | 92,220 | |||||
|
Amounts
with venturers
|
- | 83,672 | ||||||
|
Other
payables and accrued expenses
|
(77,881 | ) | (257,916 | ) | ||||
|
Deposit
from underwriting sales
|
(3,964,853 | ) | - | |||||
|
Interest
payable on promissory notes
|
68,570 | (377,371 | ) | |||||
|
Interest
payable on amount due to director
|
16,696 | 7,415 | ||||||
|
Other
tax payable
|
(210,061 | ) | 9,256 | |||||
|
Income
tax payable
|
(97,257 | ) | (236,484 | ) | ||||
|
Restricted
cash
|
32,425 | 2,532,640 | ||||||
|
Net
cash
provided
by
/(used in) operating activities
|
736,472 | (1,214,016 | ) | |||||
|
Cash
flows from investing activities
|
||||||||
|
Acquisition
of plant and equipment
|
(6,800 | ) | (372,702 | ) | ||||
|
Proceeds
from disposal of plant and equipment
|
93,814 | 146,679 | ||||||
|
Profit
return to minority interest in subsidiary
|
(82,149 | ) | - | |||||
|
Payment
for investment properties
|
- | (404,009 | ) | |||||
|
Net
cash provide by/(used in) investing activities
|
4,865 | (630,032 | ) | |||||
|
Cash
flows from financing activities
|
||||||||
|
Bank
loans repayment
|
(6,047,548 | ) | (201,308 | ) | ||||
|
Bank
loan obtained
|
8,050,823 | - | ||||||
|
Repayment
of promissory note
|
(153,611 | ) | (175,002 | ) | ||||
|
Proceeds
from promissory note
|
146,451 | 431,375 | ||||||
|
Repayment
to director
|
(91,183 | ) | (104,380 | ) | ||||
|
Advances
from director
|
195,265 | 94,862 | ||||||
|
Net
cash
provided
by
financing activities
|
2,100,197 | 45,547 | ||||||
|
Effect
of exchange rate changes on cash and cash equivalents
|
15,598 | 104,453 | ||||||
|
Net
increase/(decrease) in cash and cash equivalents
|
2,857,132 | (1,694,048 | ) | |||||
|
Cash
and cash equivalents at beginning of year
|
587,468 | 2,281,516 | ||||||
|
Cash
and cash equivalents at end of year
|
$ | 3,444,600 | $ | 587,468 | ||||
|
Supplemental
disclosure of cash flow information
|
||||||||
|
Cash
paid during the period:
|
||||||||
|
Income
tax paid
|
104,127 | 315,067 | ||||||
|
Interest
paid
|
476,507 | 623,928 | ||||||
See
accompanying notes to consolidated financial statements.
28
(Expressed
in US Dollars)
Sunrise
Real Estate Development Group, Inc. (“CY-SRRE”) was established in the Cayman
Islands on April 30, 2004 as a limited liability company. CY-SRRE was wholly
owned by Ace Develop Properties Limited, a corporation, (“Ace Develop”), of
which Lin Chi-Jung, an individual, is the principal and controlling shareholder.
Shanghai Xin Ji Yang Real Estate Consultation Company Limited (“SHXJY”) was
established in the People’s Republic of China (the “PRC”) on August 14, 2001 as
a limited liability company. SHXJY was originally owned by a
Taiwanese company, of which the principal and controlling shareholder was Lin
Chi-Jung. On June 8, 2004, all the fully paid up capital of SHXJY was
transferred to CY-SRRE. On June 25, 2004 SHXJY and two individuals established a
subsidiary, namely, Suzhou Xin Ji Yang Real Estate Consultation Company Limited
(“SZXJY”) in the PRC, at which point in time, SHXJY held a 90% equity interest
in SZXJY. On December 24, 2004, SHXJY acquired 85% of equity interest in Beijing
Xin Ji Yang Real Estate Consultation Company Limited (“BJXJY”), a PRC company
incorporated on April 16, 2003 with limited liability. On August 9,
2005, SHXJY sold a 10% equity interest in SZXJY to a company owned by a director
of SZXJY, and transferred a 5% equity interest in SZXJY to
CY-SRRE. Following the disposal and the transfer, CY-SRRE effectively
held an 80% equity interest in SZXJY. On November 24, 2006, CY-SRRE, SHXJY, a
director of SZXJY and a third party established a subsidiary, namely, Suzhou
Shang Yang Real Estate Consultation Company Limited (“SZSY”) in the PRC, with
CY-SRRE holding a 12.5% equity interest, SHXJY holding a 26% equity interest and
the director of SZXJY holding a 12.5% equity interest in SZSY. At the date of
incorporation, SRRE and the director of SZXJY entered into a voting agreement
that SRRE is entitled to exercise the voting right in respect of his 12.5%
equity interest in SZSY. Following that, SRRE effectively holds 51% equity
interest in SZSY. On September 24, 2007, CY-SRRE sold a 5% equity interest in
SZXJY to a company owned by a director of SZXJY. Following the
disposal, CY-SRRE effectively holds 75% equity interest in SZXJY. On
November 1, 2007, SZXJY established a wholly owned subsidiary, Suzhou Xin Ji
Yang Real Estate Brokerage Company Limited (“SZXJYB”) in the PRC as a limited
liability company. On May 8, 2008, SHXJY established a wholly owned
subsidiary, Kunshan Shang Yang Real Estate Brokerage Company Limited (“KSSY”) in
the PRC as a limited liability company.
LIN RAY
YANG Enterprise Ltd. (“LRY”) was established in the British Virgin Islands on
November 13, 2003 as a limited liability company. LRY was owned by
Ace Develop, Planet Technology Corporation (“Planet Tech”) and Systems &
Technology Corporation (“Systems Tech”). On February 5, 2004, LRY
established a wholly owned subsidiary, Shanghai Shang Yang Real Estate
Consultation Company Limited (“SHSY”) in the PRC as a limited liability company.
On January 10, 2005, LRY and a PRC third party established a subsidiary, Suzhou
Gao Feng Hui Property Management Company Limited (“SZGFH”), in the PRC, with LRY
holding 80% of the equity interest in SZGFH. On May 8, 2006, LRY acquired 20% of
the equity interest in SZGFH from the third party. Following the acquisition,
LRY effectively holds 100% of the equity interest in SZGFH. On September 11,
2007 SHSY and other third parties established a subsidiary, namely, Suzhou Bin
Fen Nian Dai Administration Consultancy Company Limited (“SZBFND”) in the PRC,
with SHSY holding a 19% equity interest in SZBFND. On September 18, 2008, SHSY
established a wholly owned subsidiary, San Ya Shang Yang Real Estate
Consultation Company Limited (“SYSY”) in the PRC as a limited liability
company.
SHXJY,
SZXJY, BJXJY, SHSY, SZGFH, SZSY, SZXJYB, KSSY and SYSY commenced operations in
November 2001, June 2004, January 2004, February 2004, January 2005, November
2006, November 2007, May 2008 and September 2008 respectively. Each
of SHXJY, SZXJY, BJXJY, SHSY, SZGFH, SZSY, SZXJYB and KSSY has been granted a
twenty-year operation period and SYSY has been granted a thirty-year operation
period from the PRC, which can be extended with approvals from relevant PRC
authorities.
On August
31, 2004, Sunrise Real Estate Group, Inc. (“SRRE”), CY-SRRE and Lin Chi-Jung, an
individual and agent for the beneficial shareholder of CY-SRRE, i.e., Ace
Develop, entered into an exchange agreement under which SRRE issued 5,000,000
shares of common stock to the beneficial shareholder or its designees, in
exchange for all outstanding capital stock of CY-SRRE. The
transaction closed on October 5, 2004. Lin Chi-Jung is Chairman of
the Board of Directors of SRRE, the President of CY-SRRE and the principal and
controlling shareholder of Ace Develop.
Also on
August 31, 2004, SRRE, LRY and Lin Chi-Jung, an individual and agent for
beneficial shareholders of LRY, i.e., Ace Develop, Planet Tech and Systems Tech,
entered into an exchange agreement under which SRRE issued 10,000,000 shares of
common stock to the beneficial shareholders, or their designees, in exchange for
all outstanding capital stock of LRY. The transaction was closed on
October 5, 2004. Lin Chi-Jung is Chairman of the Board of Directors of SRRE, the
President of LRY and the principal and controlling shareholder of Ace
Develop. Regarding the 10,000,000 shares of common stock of SRRE
issued in this transaction, SRRE issued 8,500,000 shares to Ace Develop, 750,000
shares to Planet Tech and 750,000 shares to Systems Tech.
As a
result of the acquisition, the former owners of CY-SRRE and LRY hold a majority
interest in the combined entity. Generally accepted accounting
principles require in certain circumstances that a company whose shareholders
retain the majority voting interest in the combined business be treated as the
acquirer for financial reporting purposes. Accordingly, the
acquisition has been accounted for as a “reverse acquisition” arrangement
whereby CY-SRRE and LRY are deemed to have purchased SRRE. However,
SRRE remains the legal entity and the Registrant for Securities and Exchange
Commission reporting purposes. All shares and per share data prior to
the acquisition have been restated to reflect the stock issuance as a
recapitalization of CY-SRRE and LRY.
29
SRRE was
initially incorporated in Texas on October 10, 1996, under the name of Parallax
Entertainment, Inc. (“Parallax”). On December 12, 2003, Parallax
changed its name to Sunrise Real Estate Development Group, Inc. On
April 25, 2006, Sunrise Estate Development Group, Inc. filed Articles of
Amendment with the Texas Secretary of State, changing the name of Sunrise Real
Estate Development Group, Inc. to Sunrise Real Estate Group, Inc., effective
from May 23, 2006.
Figure 1:
Company Organization Chart

SRRE and
its subsidiaries, namely, CY-SRRE, LRY, SHXJY, SZXJY, SZXJYB, SZSY, KSSY, BJXJY,
SHSY, SZGFH and SYSY are sometimes hereinafter collectively referred to as “the
Company.”
The principal activities of the Company
are property brokerage services, real estate marketing services, property
leasing services and property management services in the
PRC
.
Basis
of Accounting and Principles of Consolidation
The
consolidated financial statements are prepared in accordance with generally
accepted accounting principles in the United States of America that include the
financial statements of SRRE and its subsidiaries, CY-SRRE, LRY, SHXJY, SZXJY,
SZXJYB, SZSY, KSSY, BJXJY, SHSY, SZGFH and SYSY. All inter-company
transactions and balances have been eliminated.
30
Going
Concern
The
Company’s financial statements are prepared according to the accounting
principles generally accepted in the United States of America applicable to a
going concern, which contemplates the realization of assets and liquidation of
liabilities in the normal course of business. The Company has accumulated losses
of $9,023,506 for the year ended December 31, 2009 and had a net working capital
deficiency of $625,070 as of December 31, 2009. The Company’s net working
capital deficiency and significant accumulated losses raise substantial doubt
about its ability to continue as a going concern.
However,
management believes that the Company is able to generate sufficient cash flow to
meet its obligations on a timely basis and ultimately to attain successful
operations in respect of the agency sales and property management operations.
Accordingly, the accompanying financial statements do not include any
adjustments that may be necessary if the Company is unable to continue as a
going concern.
Use
of Estimates
The
preparation of financial statements in accordance with generally accepted
accounting principles requires management to make estimates and assumptions that
affect reported amounts of assets and liabilities and disclosure of contingent
assets and liabilities at the date of the financial statements and the reported
amounts of revenues and expenses during the reporting period. Actual
results could differ from those estimates.
Cash
and Cash Equivalents
Cash and
cash equivalents include cash in hand and all highly liquid investments with an
original maturity of three months or less.
Foreign
Currency Translation and Transactions
The
functional currency of SRRE, CY-SRRE and LRY is United States Dollars (“US$”)
and the financial records are maintained and the financial statements prepared
in US $. The functional currency of SHXJY, SZXJY, SZXJYB, SZSY, KSSY, BJXJY,
SHSY, SZGFH and SYSY is Renminbi (“RMB”) and the financial records are
maintained and the financial statements prepared in RMB.
Foreign
currency transactions during the period are translated into each company’s
denominated currency at the exchange rates ruling at the transaction dates. Gain
and loss resulting from foreign currency transactions are included in the
consolidated statement of operations. Assets and liabilities denominated in
foreign currencies at the balance sheet date are translated into each company’s
denominated currency at period end exchange rates. All exchange
differences are dealt with in the consolidated statements of
operations.
The
financial statements of the Company’s operations based outside of the United
States have been translated into US$ in accordance with SFAS
52. Management has determined that the functional currency for each
of the Company’s foreign operations is its applicable local
currency. When translating functional currency financial statements
into US$, period-end exchange rates are applied to the consolidated balance
sheets, while average period rates are applied to consolidated statements of
operations. Translation gains and losses are recorded in translation
reserve as a component of shareholders’ equity.
The
exchange rate between US$ and RMB had little fluctuation during the periods
presented. The rates as of December 31, 2009 and December 31, 2008 are US$1:
RMB6.8282 and US$1: RMB6.8346, respectively.
Property,
Plant, Equipment and Depreciation
Property,
plant and equipment are stated at cost. Depreciation is computed using the
straight-line method to allocate the cost of depreciable assets over the
estimated useful lives of the assets as follows:
|
Estimated
Useful Life (in years)
|
|
|
Furniture
and fixtures
|
5-10
|
|
Computer
and office equipment
|
5
|
|
Motor
vehicles
|
5
|
|
Properties
|
20
|
Maintenance,
repairs and minor renewals are charged directly to the statement of operations
as incurred. Additions and improvements are capitalized. When assets are
disposed of, the related cost and accumulated depreciation thereon are removed
from the accounts and any resulting gain or loss is included in the statement of
operations.
31
Investment
property
Investment
properties are stated at cost. Depreciation is computed using the straight-line
method to allocate the cost of depreciable assets over the estimated useful
lives of 20 years.
Significant
additions that extend property lives are capitalized and are depreciated over
their respective estimated useful lives. Routine maintenance and repair costs
are expensed as incurred. The Company reviews its investment property for
impairment whenever events or changes in circumstances indicate that the
carrying amount of an investment property may not be recoverable.
Goodwill
SFAS No.
142, “Goodwill and Other Intangible Assets,” requires that goodwill be tested
for impairment on an annual basis (December 31 for us) and between annual tests
if an event occurs or circumstances change that would more likely than not
reduce the fair value of a reporting unit below its carrying value. These events
or circumstances could include a significant change in the business climate,
legal factors, operating performance indicators, competition, sale or
disposition of a significant portion of a company. Application of the goodwill
impairment test requires judgment, including the determination of the fair value
of a company. The fair value of a company is estimated using a discounted cash
flow methodology. This requires significant judgments including estimation of
future cash flows, which is dependent on internal forecasts, estimation of the
long-term rate of growth for our business, the useful life over which cash flows
will occur, and the determination of our weighted average cost of capital.
Changes in these estimates and assumptions could materially affect the
determination of fair value and/or goodwill impairment for a
company.
Revenue
Recognition
Agency
commission revenue from property brokerage is recognized when the property
developer and the buyer complete a property sales transaction, and the property
developer grants confirmation to us to be able to invoice them accordingly. The
time when we receive the commission is normally at the time when the property
developer receives from the buyer a portion of the sales proceeds in accordance
with the terms of the relevant property sales agreement, or the balance of the
bank loan to the buyer has been funded, or recognized under the sales schedule
or other specific items of agency sales agreement with developer. At no point
does the Company handle any monetary transactions nor act as an escrow
intermediary between the developer and the buyer.
Revenue
from marketing consultancy services is recognized when services are provided to
clients, fees associated to services are fixed or determinable, and collection
of the fees is assured.
Rental
revenue from property management and rental business is recognized on a
straight-line basis according to the time pattern of the leasing
agreements.
The
Company accounts for underwriting sales in accordance with SFAS No. 66
“Accounting for Sales of Real Estate” (SFAS 66). The commission revenue on
underwriting sales is recognized when the criteria in SFAS No. 66 have been met,
generally when title is transferred and the Company no longer has substantial
continuing involvement with the real estate asset sold. If the Company provides
certain rent guarantees or other forms of support where the maximum exposure to
loss exceeds the gain, it defers the related commission income and expenses by
applying the deposit method. In future periods, the commission income and
related expenses are recognized when the remaining maximum exposure to loss is
reduced below the amount of income deferred.
All
revenues represent gross revenues less sales and business tax.
Net
Earnings per Common Share
The
Company computes net earnings per share in accordance with SFAS No. 128,
“Earnings per Share.” Under the provisions of SFAS No. 128, basic net
earnings per share is computed by dividing the net earnings available to common
shareholders for the period by the weighted average number of shares of common
stock outstanding during the period. The calculation of diluted net earnings per
share recognizes common stock equivalents, however; potential common stock in
the diluted EPS computation is excluded in net loss periods, as their effect is
anti-dilutive.
Income
Taxes
The
Company accounts for income taxes in accordance with SFAS No. 109 “Accounting
for Income Taxes.” Under SFAS No. 109, deferred tax liabilities or assets at the
end of each period are determined using the tax rate expected to be in effect
when taxes are actually paid or recovered. Valuation allowances are established
when necessary to reduce deferred tax assets to the amount expected to be
realized.
We
continue to account for income tax
contingencies using a
benefit recognition model.
Beginning January 1,
2007, if we considered that a tax position is 'more likely than not' of being
sustained upon audit, based solely on the technical merits of the position, we
recognize the benefit. We measure the benefit by determining the amount that is
greater than 50% likely of being realized upon settlement, presuming that the
tax position is examined by the appropriate taxing authority that has full
knowledge of all relevant information. These assessments can be complex and we
often obtain assistance from external advisors.
32
Under the
benefit recognition model, if our initial assessment fails to result in the
recognition of a tax benefit, we regularly monitor our position and subsequently
recognize the tax benefit if there are changes in tax law or analogous case law
that sufficiently raise the likelihood of prevailing on the technical merits of
the position to more likely than not; if the statute of limitations expires; or
if there is a completion of an audit resulting in a settlement of that tax year
with the appropriate agency.
Uncertain
tax positions, represented by liabilities on our balance sheet, are now
classified as current only when we expect to pay cash within the next 12 months.
Interest and penalties, if any, continue to be recorded in Provision for taxes
on income and are classified on the balance sheet with the related tax
liability.
Historically,
our policy had been to account for income tax contingencies based on whether we
determined our tax position to be 'probable' under current tax law of being
sustained, as well as an analysis of potential outcomes under a given set of
facts and circumstances. In addition, we previously considered all tax
liabilities as current once the associated tax year was under
audit.
Segment
information
The
Company believes that it operates in one business segment. Management views the
business as consisting of several revenue streams; however it is not possible to
attribute assets or indirect costs to the individual streams other than direct
expenses.
Recent
Accounting Pronouncements
In June
2009, the FASB issued FAS 168 “The FASB Accounting Standards CodificationTM and
the Hierarchy of Generally Accepted Accounting Principles—a replacement of FASB
Statement No. 162 (Codification)”. The Codification will become the source of
authoritative U.S. generally accepted accounting principles (GAAP) recognized by
the FASB to be applied by nongovernmental entities. Rules and interpretive
releases of the Securities and Exchange Commission (SEC) under authority of
federal securities laws are also sources of authoritative GAAP for SEC
registrants. On the effective date of this Statement, the Codification will
supersede all then-existing non-SEC accounting and reporting standards. All
other non-grandfathered non-SEC accounting literature not included in the
Codification will become non-authoritative. This statement is effective
for financial statements issued for interim and annual periods ending after
September 15, 2009.
In June
2009, the FASB issued FAS 167, “Amendments to FASB Interpretation No. 46(R)”.
This statement amends certain guidance in Interpretation 46(R) for determining
whether an entity is a variable interest entity. This Statement is effective as
of the beginning of each reporting entity’s first annual reporting period that
begins after November 15, 2009
In May
2009, the FASB issued FAS 165, “Subsequent Events” The objective of this
statement is to establish general standards of accounting for and disclosure of
events that occur after the balance sheet date but before financial statements
are issued or are available to be issued.
Effective
for the fiscal years, and interim periods within those fiscal years, beginning
on or after December 15, 2008, a new guidance addresses the accounting and
reporting for the outstanding noncontrolling interest (previously referred to as
minority interest) in a subsidiary and for the deconsolidation of a subsidiary.
It also establishes additional disclosures in the consolidated financial
statements that identify and distinguish between the interests of the parent’s
owners and of the noncontrolling owners of a subsidiary. On January 1, 2009, the
Company adopted new accounting guidance on noncontrolling
interests.
The
Company does not anticipate that the adoption of the above statements will have
a material effect on the Company's financial condition and results of
operations.
The
balance of $732,257 represents the deposits placed with several property
developers in respect of a number of real estate projects where the Company is
appointed as sales agent.
As of
December 31, 2009, $
659
,032 out of the
total promissory deposits was pledged to secure a promissory note payable in
note
9
.
|
December
31
|
December
31,
|
|||||||
|
2009
|
2008
|
|||||||
|
Advances
to staff
|
$ | 80,288 | $ | 11,389 | ||||
|
Rental
deposits
|
72,870 | 72,228 | ||||||
|
Prepaid
rental
|
- | 205,811 | ||||||
|
Other
receivables
|
23,843 | 32,667 | ||||||
| $ | 177,001 | $ | 322,095 | |||||
33
|
December
31,
|
December
31,
|
|||||||
|
2009
|
2008
|
|||||||
|
Furniture
and fixtures
|
$ | 80,938 | $ | 146,873 | ||||
|
Computer
and office equipment
|
349,964 | 325,862 | ||||||
|
Motor
vehicles
|
491,799 | 654,349 | ||||||
|
Properties
|
2,214,539 | 2,213,659 | ||||||
| 3,137,240 | 3,340,743 | |||||||
|
Less:
Accumulated depreciation
|
(
845,245)
|
(690,720 | ) | |||||
| $ | 2,291,995 | $ | 2,650,023 | |||||
All above
properties as of December 31, 2009 and as of December 31, 2008 were pledged to
secure a loan in note 8.
|
December
31,
|
December
31,
|
|||||||
|
2009
|
2008
|
|||||||
|
Investment
property
|
$ | 9,068,396 | $ | 9,059,905 | ||||
|
Less:
Accumulated depreciation
|
(1,471,322 | ) | (865,025 | ) | ||||
| $ | 7,597,074 | $ | 8,194,880 | |||||
The
investment properties included one floor and four units of a commercial building
in Suzhou, the PRC. The investment properties were acquired by the Company for
long-term investment purposes and were pledged to secure a loan in note 8. The
carrying amount of one floor as $2,425,771 was pledged to a promissory note
payable in note
9
.
As of
March 15, 20
10
, the four units
of the investment properties were leased to SZBFND, a related party of the
Company, and 82% of the total area of the one remaining floor was leased
out.
The
Company accounted for the acquisition of 20% of the equity interest in SZGFH as
described in Note 1 in accordance with SFAS No. 141 "Business Combinations",
which resulted in the recognition of goodwill. Goodwill represents the excess of
acquisition cost over the estimated fair value of the net assets acquired as of
May 8, 2006. The portion of the purchase price allocated to goodwill was
$13,307. The Company has tested goodwill for impairment annually
during the forth quarter of each fiscal year using a fair value approach, in
accordance with the provisions of SFAS 142. As of December 31, 2009, the Company
completed the annual impairment test. However, the result of the annual
impairment test for 2009 indicated that the goodwill had been impaired by the
recurring losses. The Company believed that the impairment was other than
temporary. Based on the result of the impairment testing, the balance of $13,307
was written off for the year ended December 31, 2009.
Bank
loans included two bank loans, as listed below:
First,
the balance includes a bank loan of $8,054,831, which has an interest increase
of 10% of one year prime rate as announced by the People’s Bank of China to
5.84% in 2009, and is secured by the properties as mentioned in Note 6 above.
The period of this bank loan was 3 years and can be extended to the next 3 years
automatically.
Second,
the remaining bank loan of $205,032, which has an interest of five years prime
rate as announced by the People’s Bank of China at 5.94% in 2009, is repayable
before December 15, 2010 in monthly installments. As of December 31, 2009, the
bank loan is secured by the properties as mentioned in Note 5
above.
34
There are
five promissory notes, as listed below:
First,
the balance includes a promissory note of $46,666 and accrued interest of
$14,168 thereon. This promissory note of $46,666 bears interest at a rate of 5%
per annum. This promissory note is unsecured and the term of repayment is not
specifically defined.
Second,
the balance includes a promissory note of $75,000 and accrued interest of
$14,479 thereon. This promissory note of $75,000 bears interest at a rate of 5%
per annum. This promissory note is unsecured and the term of repayment is not
specifically defined.
Third,
the balance includes a promissory note of $300,000. This promissory note of
$300,000 bears interest at a rate of 15% per annum. This promissory note is
unsecured and the term of repayment is not specifically defined.
Fourth,
the balance includes a promissory note of $146,451. This promissory note of
$146,451 bears interest at a rate of 15% per annum. This promissory note is
unsecured and the term of repayment is not specifically defined.
Fifth,
the balance includes a promissory note of $439,355. This promissory note of
$439,355 bears interest at a rate of 18% per annum. This promissory note is
secured by the promissory deposit of $659,032 as mentioned in Note 3 above and
one floor of the investment properties as mentioned in Note 6 above and the term
of repayment is not specifically defined.
A related
party is an entity that can control or significantly influence the management or
operating policies of another entity to the extent one of the entities may be
prevented from pursuing its own interests. A related party may also be any party
the entity deals with that can exercise that control.
Amount due to
directors
Amount due to Lin
Chin-Jung
As of
December 31, 2009, the balance includes
one
loan and
advances obtained from Lin Chin-Jung.
The loan includes principal of $198,002
and accrued interest of $28,447 thereon. The principal is unsecured, bears
interest at a rate of 9.6% per annum and the term of repayment is not
specifically defined
.
The
advances and reimbursements of $32,362 represented the salary payable and rental
reimbursement to Lin Chin-Jung outstanding as of December 31, 200
9
.
Amount due to Lin
Chao-Chin
A balance
of $31,399 represented the salary payable and rental reimbursement to Lin
Chao-Chin outstanding as of December 31, 200
9
.
Amount due to related
party
The
amount includes a rental deposit received from SZBFND. This amount is unsecured,
interest free and repayable on demand.
|
December
31,
|
December
31,
|
|||||||
|
2009
|
2008
|
|||||||
|
Accrued
staff commission & bonus
|
$ | 694,717 | $ | 556,293 | ||||
|
Rental
deposits received
|
596,090 | 676,121 | ||||||
|
Accrual
for onerous contracts
|
39,360 | 446,456 | ||||||
|
Other
payables
|
953,192 | 680,198 | ||||||
| $ | 2,283,359 | $ | 2,359,068 | |||||
35
Other tax
payable mainly represents the outstanding payables of business tax, urban real
estate tax and land appreciation tax in the PRC.
FIN 48
We adopted FASB
Interpretation No. 48, “Accounting for Uncertainty in Income Taxes” (FIN 48) on
January 1, 2007. FIN 48 clarifies the accounting for uncertainty in income taxes
recognized in an enterprise’s financial statements in accordance with Statement
of Financial Accounting Standards No. 109, “Accounting for Income Taxes.” The
Interpretation prescribes a threshold for the financial statement recognition
and measurement of a tax position taken or expected to be taken within an income
tax return. For each tax position, the enterprise must determine whether it is
more likely than not that the position will be sustained upon examination based
on the technical merits of the position, including resolution of any related
appeals or litigation. A tax position that meets the more likely than not
recognition threshold is then measured to determine the amount of benefit to
recognize within the financial statements. No benefits may be recognized for tax
positions that do not meet the more likely than not threshold. With respect to
United States federal and Chinese income taxes, no reclassification was
required.
Income
tax represents current PRC income tax, which is calculated at the statutory
income tax rate on the assessable income for the years ended December 31, 2009
and 2008. On January 1, 2008, China unified income tax rates for domestic and
foreign companies at 25 %.
The
provision for China income tax is consisted of:
|
Years
ended December 31,
|
||||||||
|
2009
|
2008
|
|||||||
|
Current
PRC corporate income tax
|
$ | 201,057 | $ | 78,584 | ||||
|
Deferred
tax debit
|
- | - | ||||||
| $ | 201,057 | $ | 78,584 | |||||
Reconciliation
between the provision for income taxes computed by applying the statutory tax
rate in Mainland China to income before income taxes and the actual provision
for income taxes is as follows:
|
Years
ended December 31,
|
||||||||
|
2009
|
2008
|
|||||||
|
Provision
for income taxes benefit at statutory tax rate
|
$ | (1,890,012 | ) | $ | (1,209,524 | ) | ||
|
Tax
concessions
|
- | 249,866 | ||||||
|
Permanent
difference
|
2,360,342 | 87,632 | ||||||
|
Effect
of change in FEIT tax rate
|
- | - | ||||||
|
Valuation
allowances
|
(269,273 | ) | 2,036,333 | |||||
|
Income
tax
|
$ | 201,057 | $ | 1,164,307 | ||||
Operating Lease
Commitments
During
the years ended December 31, 2009 and 2008, the Company incurred lease expenses
amounting to $279,647 and $415,558, respectively. As of December 31, 2009, the
Company had commitments under operating leases, requiring annual minimum rentals
as follows:
|
December
31,
|
December
31,
|
|||||||
|
2009
|
2008
|
|||||||
|
Within
one year
|
$ | 31,878 | $ | 144,325 | ||||
|
Two
to five years
|
4,394 | 42,995 | ||||||
|
Operating
lease commitments
|
$ | 36,272 | $ | 187,320 | ||||
During
the year of 2005 and 2006, SZGFH entered into leasing agreements with certain
buyers of the Sovereign Building underwriting project to lease the properties
for them. These leasing agreements on these properties are for 62% of the floor
space that was sold to third party buyers. In accordance with the leasing
agreements, the owners of the properties can have a rental return of 8.5% and
8.8% per annum for a period of 5 years and 8 years, respectively. In regards to
the leasing agreements, we have negotiated with the buyers and have lowered the
annual rental return rate for the remaining leasing period from 8.5% for 5
years to 5.8%, and from 8.8% for 8 years to 6%. As of December 31,
2009, 58% of the buyers agreed upon the lowered rate and 24% of the buyers
agreed to cancel the leasing agreements. The leasing period started in the
second quarter, 2006, and the Company has the right to sublease the leased
properties to cover these lease commitments in the leasing period. As of
December 31, 2009, 82 sub-leasing agreements have been signed, the area of these
sub-leasing agreements represented 79% of total area with these lease
commitments.
36
As of
December 31, 2009, the lease commitments are as follows:
|
December
31,
|
December
31,
|
|||||||
|
2009
|
2008
|
|||||||
|
Within
one year
|
$ | 2,141,087 | $ | 3,225,101 | ||||
|
Two
to five years
|
4,478,477 | 7,850,226 | ||||||
|
Over
five years
|
- | 346,550 | ||||||
|
Operating
lease commitments arising from the promotional package
|
$ | 6,619,564 | $ | 11,421,877 | ||||
An
accrual for onerous contracts was recognized which is equal to the difference
between the present value of the sublease income and the present value of the
associated lease expense at the appropriate discount rate. The accrual for
onerous contracts was $39,360 as of December 31, 2009 and $446,456 as of
December 31, 2008.
According
to the leasing agreements, the Company has an option to terminate any agreement
by paying a predetermined compensation. As of December 31, 2009, the
compensation to terminate all leasing agreements is $1,842,432. According to the
sub-leasing agreements that have been signed through December 31, 2009, the
rental income from these sub-leasing agreements will be $ 1,363,899 within one
year and $ 467,121 within two to five years. However, no assurance can be given
that we can collect all of the rental income.
The
Company accounts for its underwriting sales revenue with underwriting rent
guarantees in accordance with SFAS No. 66 “Accounting for Sales of Real Estate”
(SFAS 66). Under SFAS 66, the deposit method should be used for the revenue from
the sales of floor space with underwriting rent guarantees until the revenues
generated by sub-leasing properties exceed the guaranteed rental amount due to
the purchasers.
According
to the relevant corporation laws in the PRC, a PRC company is required to
transfer at least 10% of its profit after taxes, as determined under accounting
principles generally accepted in the PRC, to the statutory reserve until the
balance reaches 50% of its registered capital. The statutory reserve can be used
to make good on losses or to increase the capital of the relevant
company.
As of
December 31, 2009and 2008, the only component of accumulated other comprehensive
income was translation reserve.
During
the years ended December 31, 2009 and 2008, the following customers accounted
for more than 10% of total net revenue:
|
Percentage
of Net Revenue for
the
years ended December 31,
|
Percentage
of Accounts Receivable
as
at December 31,
|
||||||
|
2009
|
2008
|
2009
|
2008
|
||||
|
Customer
A
|
*
|
13%
|
*
|
*
|
|||
|
Customer
B
|
*
|
10%
|
*
|
24%
|
|||
|
Customer
C
|
39%
|
*
|
*
|
*
|
|||
* less
than 10%
37
None.
Our Chief
Executive Officer and our Chief Financial Officer have evaluated the
effectiveness of our disclosure controls and procedures as of December 31, 2009.
Based on this evaluation, the Chief Executive Officer and Chief Financial
Officer have concluded that the Company's disclosure controls and procedures
were effective as of December 31, 2009, to ensure that information required to
be disclosed in reports that we file or submit under the Securities Exchange Act
of 1934 is recorded, processed, summarized, and reported within the time periods
specified in Securities and Exchange Commission rules and forms and ensure that
information required to be disclosed is accumulated and communicated to our
management, as appropriate to allow timely decisions regarding required
disclosure.
Management's Report of
Internal Control over Financial Reporting
|
·
|
Pertain
to the maintenance of records that in reasonable detail accurately and
fairly reflect the transactions and dispositions of the assets of the
company;
|
|
·
|
Provide
reasonable assurance that transactions are recorded as necessary to permit
preparation of financial statements in accordance with generally accepted
accounting principles, and that receipts and expenditures of the company
are being made only in accordance with authorizations of management and
directors of the company; and
|
|
·
|
Provide
reasonable assurance regarding prevention or timely detection of
unauthorized acquisition, use or disposition of the company’s assets that
could have a material effect on the financial
statements.
|
Because
of its inherent limitations, internal control over financial reporting may not
prevent or detect misstatements. Projections of any evaluation of effectiveness
to future periods are subject to the risk that controls may become inadequate
because of changes in conditions, or that the degree of compliance with the
policies or procedures may deteriorate.
The
company’s management assessed the effectiveness of the company’s internal
control over financial reporting as of December 31, 2009. In making
this assessment, the company’s management used the criteria set forth by the
Committee of Sponsoring Organizations of the Treadway Commission (COSO) in
Internal Control-Integrated Framework.
This
annual report does not include an attestation report of our independent
registered public accounting firm regarding internal control over financial
reporting. Management’s report was not subject to attestation by our independent
registered public accounting firm pursuant to temporary rules of the Securities
and Exchange Commission that permit us to provide only management’s report in
this annual report. However, in connection with its audit of our financial
statements, our independent registered public accounting firm reported no
material weaknesses in our internal controls over our ability to produce
financial statements free from material misstatements. We determined that there
were no material weaknesses in the Company’s internal controls and therefore
they were effective as of December 31, 2009.
None
38
ITEM
10. DIRECTORS, EXECUTIVE OFFICERS, PROMOTERS, CONTROL PERSONS AND CORPORATE
GOVERNANCE; COMPLIANCE WITH SECTION 16(a) OF THE EXCHANGE ACT
|
Date
of Appointment
|
Name
of Individual
|
Age
|
Position
with Company
|
|
October
28, 2003
|
LIN
CHI-JUNG
|
50
|
Chief
Executive Officer, President and Chairman
|
|
May
23, 2005
|
LIN
CHAO-CHIN
|
60
|
Director
and Senior Vice President
|
|
November
28, 2006
|
LIN
HSIN-HUNG
|
55
|
Executive
Director
|
|
November
23, 2004
|
CHEN
REN
|
62
|
Director
|
|
November
23, 2004
|
FU
XUAN-JIE
|
80
|
Director
|
|
November
23, 2004
|
LI
XIAO-GANG
|
52
|
Director
|
|
August
23, 2005
|
ZHANG
XI
|
39
|
Director
|
Following
is biographical information for each of the 7 directors consisting of the age,
principal occupation, and other relevant information. The designation of
"Affiliated" noted beside the director’s name indicates that the director is an
officer or employee of Sunrise. The designation of “Independent” noted beside
the director’s name indicates that the director is considered an independent
director with in the meaning of the Marketplace Rules of the Nasdaq Stock
Market, Inc., which is the independence standard that we have chosen to report
under.
Lin Chi-Jung, CEO, Chairman,
and President (Affiliated)
Lin
Chi-Jung, age 50, is the Chairman of the Board of Directors of SRRE. He also
serves as our President and CEO and the Chairman of all of our operating
subsidiaries. Mr. Lin began serving as a Director of SRRE on October 28, 2003,
and was appointed Chairman on October 11, 2004. He founded Shanghai Xin Ji Yang
Real Estate Consultation Co., Ltd. (“SHXJY”) in late 2001, Shanghai Shang Yang
Real Estate Consultation Co., Ltd. (“SHSY”) in early 2004 and Suzhou Gao Feng
Hui Property Management Co., Ltd. (“SZGFH”) in early 2005. Under his leadership
and management, SHXJY, SHSY and SZGFH have grown rapidly. Prior to establishing
this property business, Mr. Lin invested in the film making and publishing
businesses. In his younger days, Mr. Lin was a well known actor in Chinese
communities around the world, including Mainland China, Taiwan, North America
and South East Asia. The Board believes that Mr. Lin has the experience and
qualification as a member of the Board of Directors because of his experience in
the real estate industry, his leadership and strategic direction for the Company
and his public personality makes him a invaluable asset to the Company. Mr. Lin
is not a member of the Board of any other public company or any investment
company, neither has he been a member of the boards of directors of such
companies for the past five years.
Lin Chao-Chin, Director
(Affiliated)
Lin
Chao-Chin, age 60, was appointed as a director on May 23, 2005, and serves on
our Compensation and Governance and Nominating Committees. He is one of the
co-founders of SHXJY. The Board believes Mr. Lin has the experience and skill to
serve as a director of the Company because he brings with him 29 years of real
estate industry experience, particularly in the areas of agency, property
investment, and development services. Prior to starting his business in Mainland
China, he co-founded Taipei Xin Lian Yang Property Co. Ltd. in Taiwan in the
early 1980’s. Under Mr. Lin’s leadership, this business had contracted sales of
NTD 120 Billion (approx. US$ 3.4 billion) and 800 employees. In 2001 he joined
Lin Chi-Jung to re-establish his career in Mainland China. Currently, Lin
Chao-Chin is managing the day-to-day business operation of SHXJY. Lin Chao-Chin
graduated from Taiwan Chung Yuan University with a Bachelors Degree in Business
Administration. Mr. Lin is not a member of the Board of any other public company
or any investment company, neither has he been a member of the boards of
directors of such companies for the past five years.
Lin Hsin-Hung, Executive
Director
Lin Hsin
Hung, age 55, was appointed as an executive director on November 28, 2006. He
graduated from the Economics Department of Taiwan Wen Hua College in 1981. Mr.
Lin has served as the Chairman of the Board of Tian Li Manufacture Corporation,
Ding Kai Industry Corporation, Hua Wei Development Corporation and an executive
Director of Di Heng Capital Management Corporation. The Board believes Mr. Lin
has the knowledge and expertise in the capital markets that will benefit the
Company. Mr. Lin is not a member of the board of any other public
company or any investment company in the US, neither has he been a member of the
boards of directors of such companies for the past five years.
39
Chen Ren, Director
(Independent)
Chen Ren,
age 62, was appointed an independent director on November 23, 2004. Mr. Chen is
Chairman and General Manager of Shanghai Real Estate Group of Companies. He has
been involved in the Shanghai real property market for the past 16 years. Among
some of the companies that he has been associated with are: Shanghai She-ye
Property Ltd, Shanghai Rui Nan Property Limited, the General Manager of Shanghai
Gong Zhi Jing Center and Shanghai An Ju Property Development Center. With his
extensive knowledge and experience in the real estate property development
industry in China, the Board believes that Mr. Chen is an asset to the Company
serving as one of its independent directors. Mr. Chen is not a member of the
Board of any other public company or any investment company, neither has he been
a member of the boards of directors of such companies for the past five
years.
Fu Xuan-Jie, Director
(Independent)
Fu
Xuan-Jie, age 80, was appointed an independent director on November 23, 2004,
and serves on our Audit, Compensation, and Governance and Nominating Committees.
Mr. Fu has been an attorney since February 1980 and has practiced law in
his co-founded firm, Fu Xuan-Jie & Associates Law Office since April 1994.
Mr. Fu specializes in corporate and international law, especially in the areas
of international compensation and other financial matters. Among the clientele
that Mr. Fu serves are Coca-Cola, Banque Endosuez, AT&T, and L'Oreal. The
Board believes that Mr. Fu’s is qualified to serve on our Board because of his
knowledge in corporate and international law. Mr. Fu is not a member of the
Board of any other public company or any investment company, neither has he been
a member of the boards of directors of such companies for the past five
years.
Li Xiao-Gang, Director
(Independent)
Li
Xiao-Gang, age 52, was appointed an independent director on November 23, 2004,
and serves on our Audit, Compensation, and Governance and Nominating Committees.
Mr. Li graduated from Shanghai Finance and Economics University in 1984, and
joined the Shanghai Academy of Social Science. In 1992, he was appointed the
deputy director of the Economics Law Consultation Center of the Shanghai
Academy. In 2000, he was the Director of the Foreign Investment Research Center
of the Academy. From 1992 to the present, Mr. Li has served as a Director cum
Deputy Secretary-General of the Shanghai Consultation Association. The Board
believes that Mr. Li’s contribution of his views on the economy as
well as his knowledge of the real estate industry in China is valuable to the
Company. Mr. Li is not a member of the Board of any other public company or any
investment company, neither has he been a member of the boards of directors of
such companies for the past five years.
Zhang Xi, Director
(Independent)
Zhang Xi,
age 39, was appointed an independent director on August 23, 2005, and serves as
Chairman of our Audit Committee. He has a Doctorate Degree in Economics, and he
is a Senior Economist, a Certified Public Accountant and a Certified Public
Appraiser. He is working as a Vice President of Shanghai General Building
Material Group Corporation. He has also served in Shanghai Zhonghua Audit
Company as the manager of the International Department, Shanghai Zhangjiang
Hi-tech Zone Development Company, Ltd. as Vice General Manager and Financial
Controller, and Shanghai Zhang Jiang Semiconductor Industry Park Co., Ltd. as
General Manager. The Board believes that Mr. Zhang’s expertise in financial
auditing matters and his qualification as a CPA is necessary to serve as the
Chairman of our Audit Committee and as one of our independent directors. Mr.
Zhang is not a member of the Board of any other public company or any investment
company, neither has he been a member of the boards of directors of such
companies for the past five years.
Other
Executive Officers
Wang Wen Yan
, the Company’s
Chief Financial Officer. Previously the financial controller, Mr. Wang, 31 years
old, has been with the Company since May 2005. He worked in a real estate
development company for 4 years before joining the Company. He graduated from
Shanghai University with a Bachelor’s degree in accounting and has a Master’s
degree at the Shanghai University of Finance and Economics.
Family
Relationships
There are
no family relationships among directors, executive officers, or person nominated
or chosen to become the directors or executive officers.
40
Involvement
in Certain Legal Proceedings
None of
our directors, executive officers, or control persons have been involved in any
of the following events during the past ten years:
|
l
|
Any
bankruptcy petition filed by or against any business of which such person
was a general partner or executive officer either at the time of
bankruptcy or within two years prior to that time;
or
|
|
l
|
Any
conviction in a criminal proceeding or being subject to a pending criminal
proceeding (excluding traffic violations and other minor offenses);
or
|
|
l
|
Being
subject to any order, judgment, or decree, not subsequently reversed,
suspended or vacated, of any court of competent jurisdiction, permanently
or temporarily enjoining, barring, suspending or otherwise limiting his
involvement in any type of business, securities or banking activities;
or
|
|
l
|
Being
found by a court of competent jurisdiction (in a civil violation), the SEC
or the Commodity Future Trading Commission to have violated a federal or
state securities or commodities law, and the judgment has not been
reversed, suspended, or vacated; or
|
|
l
|
Being
the subject of, or a party to, any Federal or State judicial or
administrative order, judgment, decree, or finding, not subsequently
reversed, suspended or vacated, relating to an alleged violation of: any
Federal or State securities or commodities law or regulation; or any law
or regulation respecting financial institutions or insurance companies
including, but not limited to, a temporary or permanent injunction, order
of disgorgement or restitution, civil money penalty or temporary or
permanent cease-and-desist order, or removal or prohibition order; or any
law or regulation prohibiting mail or wire fraud or fraud in connection
with any business entity. This violation does not apply to any settlement
of a civil proceeding among private litigants;
or
|
|
l
|
Being
the subject of, or a party to, any sanction or order, not subsequently
reversed, suspended or vacated, of any self-regulatory organization (as
defined in Section 3(a)(26) of the Exchange Act (15 U.S.C. 78c(a)(26))),
any registered entity (as defined in Section 1(a)(29) of the Commodity
Exchange Act (7 U.S.C. 1(a)(29))), or any equivalent exchange,
association, entity or organization that has disciplinary authority over
its members or persons associated with a
member.
|
Code
of Ethics
On
October 8, 2005, we adopted a code of ethics. We believe our code of
ethics is reasonably designed to deter wrongdoing and promote honest and ethical
conduct; provide full, fair, accurate, timely and understandable disclosure in
public reports; comply with applicable laws; ensure prompt internal reporting of
code violations; and provide accountability for adherence to the code. The
Company will provide to any person without charge, upon request, a copy of the
corporate code of ethics. Any person wishing a copy should write to Alice Wang,
Sunrise Real Estate Group, Inc., Suite 701, No. 333, Zhaojiabang Road, Shanghai,
PRC 200032.
Section
16(a) Beneficial Ownership Reporting Compliance
Section
16(a) of the Securities Exchange Act of 1934, as amended, requires our executive
officers, directors and persons who own more than 10% of a registered class of
our equity securities to file reports of ownership and changes in ownership with
the Securities and Exchange Commission. Copies of these filings must be
furnished to the Company. Based solely on a review of the copies of such reports
furnished to the Company and written representations that no other reports were
required, during the fiscal year ending December 31, 2009, all Section 16(a)
filing requirements applicable to our executive officers, directors and greater
than 10% beneficial owners have been met on a timely basis.
41
Information
Concerning our Board and Committees of our Board
The
Company’s Board has three standing committees: an Audit Committee, a Governance
and Nominating Committee, and a Compensation Committee. We have a written
Audit Committee Charter, a written Governance and Nominating Committee Charter
and a written Compensation Committee Charter. Except for Lin Chao-Chin, all of
our directors serving on our committees are “independent” within the meaning of
the Marketplace Rules of the Nasdaq Stock Market, Inc., which is the
independence standard that we have chosen to report under.
Audit Committee and Audit
Committee Financial Expert
Our Board
established the Audit Committee on August 23, 2005. The Audit Committee consists
of three members, Fu Xuan-Jie, Li Xiao-Gang, and Zhang Xi, all of whom are
“independent” within the meaning of the Marketplace Rules of the Nasdaq Stock
Market, Inc., which is the independence standard that we have chosen to report
under. At least one member of the Audit Committee, Zhang Xi, is a financial
expert, as that term is used under Item 407(d)(5) of Regulation
S-B.
Governance and Nominating
Committee
The
Governance and Nominating Committee of the Board consists of Mr. Lin Chao-Chin,
Mr. Li Xiao-Gang and Mr. Fu Xuan-Jie. The primary duties of the Governance and
Nominating Committee are to identify and review candidates for the Board and
recommend candidates for election to the Board, periodically review the skills
and characteristics required of Board members in the context of the current
Board, and periodically review the Company’s corporate governance policies and
recommend modifications to the Board as appropriate. The Governance and
Nominating Committee operates pursuant to a charter that was approved by our
Board, a current copy of which is available on our website at
www.sunrise.sh
under the heading
“Investor” and subheading “Corporate Governance.”
Our
shareholders may recommend director nominees, and the Governance and Nominating
Committee will consider nominees recommended by shareholders. We anticipate that
nominees recommended by shareholders will be evaluated in the same manner as
nominees recommended by anyone else, although the Governance and Nominating
Committee may prefer nominees who are personally known to the existing directors
and whose reputations are highly regarded. The Governance and Nominating
Committee will consider all relevant qualifications as well as the needs of the
company in terms of compliance with SEC rules.
While the
selection of qualified directors is a complex, subjective process that requires
consideration of many intangible factors, the Governance and Nominating
Committee and the Board takes into account the following criteria, among others,
in considering directors and candidates for the board: judgment, experience,
skills and personal character of the candidate, and the needs of the
Board.
The
Governance and Nominating Committee conducts a process of making a preliminary
assessment of each proposed nominee based upon the resume and biographical
information, an indication of the individual’s willingness to serve and other
background information. This information is evaluated against the criteria set
forth above and our specific needs at that time. Based upon a preliminary
assessment of the candidate(s), those who appear best suited to meet our needs
may be invited to participate in a series of interviews, which are used as a
further means of evaluating potential candidates. On the basis of information
learned during this process, the Governance and Nominating Committee determines
which nominee(s) to recommend to the Board to submit for election at the next
annual meeting. The Governance and Nominating Committee uses the same process
for evaluating all nominees, regardless of the original source of the
nomination.
Compensation
Committee
The
Compensation Committee of the Board consists of Mr. Lin Chao-Chin, Mr. Li
Xiao-Gang and Mr. Fu Xuan-Jie. The primary duties of the Compensation Committee
are to annually review and approve the Company’s compensation strategy to ensure
that employees are rewarded appropriately; review annually and approve corporate
goals and objectives relevant to executive compensation; annually review and
determine elements of compensation of the CEO and other officers; and review and
recommend compensation for non-employee members of our Board. The Compensation
Committee operates pursuant to a charter that was approved by our Board, a
current copy of which is available on our website at
www.sunrise.sh
under the heading
“Investor” and subheading “Corporate Governance.”
42
Compensation
Philosphy
The
Company has established a compensation committee to ensure that employees are
rewarded appropriately based on performance and to review the compensation of
the CEO and other executive managers annually. Our compensation program for our
executive officers and all other employees is designed such that it will not
incentivize unnecessary risk-taking.
The
following table reflects the compensation paid to the Company’s Chief Executive
Officer and each of the Company’s compensated executive officers whose
compensations exceeded $100,000 in fiscal years 2009 and 2008 for services
rendered to the Company and its subsidiaries.
|
Name
and Principal Position
(a)
|
Year
(b)
|
Salary
($)
(c)
|
Bonus
($)
(d)
|
Stock
Awards
($)
(e)
|
Option
Awards
($)
(f)
|
Non-Equity
Incentive Plan Compensation
($)
(g)
|
Change
in Pension Value and Nonqualified Deferred Compensation
Earnings
($)
(h)
|
All
Other Compensation
($)
(i)
|
Total
($)
(j)
|
|||||||||||||||||||
|
Lin
Chi-Jung
CEO,
President & Chairman
Executive
Officer of subsidiaries
|
2009
2008
|
70,262
130,851
|
0
0
|
0
0
|
0
0
|
0
0
|
0
0
|
4,391
(2)
23,869
|
74,653
154,720
|
|||||||||||||||||||
|
Lin
Chao-Chin
Senior
Vice President
Managing
director of subsidiaries
|
2009
2008
|
70,262
130,851
|
0
0
|
0
0
|
0
0
|
0
0
|
0
0
|
4,391
(2)
23,869
|
74,653
154,720
|
|||||||||||||||||||
|
(1)
|
There
are no stock option, retirement, pension, or profit sharing plans for the
benefit of our officers.
|
|
(2)
|
Lin
Chi-Jung and Lin Chao-Chin each received housing allowance of $4,391
during the year 2009.
|
Option/SAR
Grants
The
Company has no stock option plan or other equity incentive plan in place.
Accordingly, no individual grants of stock options, whether or not in tandem
with Stock Appreciation Rights (“SARs”) and freestanding SARs have been made to
any executive officer or any director since the Company’s inception,
accordingly, no stock options have been exercised by the Company’s officers or
directors in any fiscal year.
DIRECTOR
COMPENSATION
|
Name
(a)
|
Fees
Earned or Paid in Cash
($)
(b)
|
Stock
Awards
($)
(c)
|
Option
Awards
($)
(d)
|
Non-Equity
Incentive Plan Compensation
($)
(e)
|
Change
in Pension Value and Nonqualified Deferred Compensation
Earnings
(f)
|
All
Other Compensation
($)
(g)
|
Total
($)
(h)
|
|||||||||||||||
|
LIN
CHI-JUNG
|
17,574
|
0
|
0
|
0
|
0
|
0
|
17,574
|
|||||||||||||||
|
LIN
CHAO-CHIN
|
17,574
|
0
|
0
|
0
|
0
|
0
|
17,574
|
|||||||||||||||
|
LIN
HSIN-HUNG
|
17,574
|
0
|
0
|
0
|
0
|
0
|
17,574
|
|||||||||||||||
|
FU
XUAN-JIE
|
17,574
|
0
|
0
|
0
|
0
|
0
|
17,574
|
|||||||||||||||
|
LI
XIAO-GANG
|
17,574
|
0
|
0
|
0
|
0
|
0
|
17,574
|
|||||||||||||||
|
CHEN
REN
|
17,574
|
0
|
0
|
0
|
0
|
0
|
17,574
|
|||||||||||||||
|
ZHANG
XI
|
17,574
|
0
|
0
|
0
|
0
|
0
|
17,574
|
|||||||||||||||
|
(1)
|
There
are no stock option, retirement, pension, or profit sharing plans for the
benefit of directors.
|
43
The
following table sets forth, as of March 15, 2010, the number and percentage of
our 23,691,925 shares of common stock outstanding that were beneficially owned
by (1) each person known to the Company to be the beneficial owner of five
percent or more of our common stock, (2) each director and named executive
officer, and (3) all of the Company's directors and executive officers as a
group. Unless otherwise indicated, the person listed in the table is the
beneficial owner of, and has sole voting and investment power with respect to,
the shares indicated.
|
Title
of Class
|
Name
and Address
|
Amount
and Nature of
|
Percent
|
|||
|
Beneficial
Ownership
|
of
Class
|
|||||
|
Common
|
Lin
Chi-Jung
|
9,022,800
(1)
|
38.08%
|
|||
|
Suite
701, No. 333, Zhaojiabang Road
|
||||||
|
Shanghai,
PRC 200032
|
||||||
|
Common
|
LIN
HSIN-HUNG
|
334,750
(2)
|
1.41%
|
|||
|
Suite
701, No. 333, Zhaojiabang Road
|
||||||
|
Shanghai,
PRC 200032
|
All
directors and executive officers as a group
[need to list all directors
individually and have separate lime item for
All directors and executive
officers as a group]
(1) These
shares are owned by Ace Develop Properties Limited, of which Mr. Lin Chi-Jung is
the sole beneficiary owner
(2) These
shares are owned by Glorystar International Enterprise Limited, of which Mr. Lin
Hsing Hung is a minority shareholder and an officer.
Certain
Relationships
A related
party is an entity that can control or significantly influence the management or
operating policies of another entity to the extent one of the entities may be
prevented from pursuing its own interests. A related party may also be any party
the entity deals with that can exercise that control.
Amount due to
directors
Amount due to Lin
Chin-Jung
As of
December 31, 2009, the balance includes
one
loan and
advances obtained from Lin Chin-Jung.
The loan includes principal of $198,002
and accrued interest of $28,447 thereon. The principal is unsecured, bears
interest at a rate of 9.6% per annum and the term of repayment is not
specifically defined
.
The
advances and reimbursements of $32,362 represented the salary payable and rental
reimbursement to Lin Chin-Jung outstanding as of December 31, 200
9
.
Amount due to Lin
Chao-Chin
A balance
of $31,399 represented the salary payable and rental reimbursement to Lin
Chao-Chin outstanding as of December 31, 200
9
.
Amount due to related
party
The
amount includes a rental deposit received from SZBFND. This amount is unsecured,
interest free and repayable on demand.
44
Director
Independence
Fu
Xuan-Jie, Li Xiao-Gang, Chen Ren and Zhang Xi, constitute a majority of the
Board of Directors and are each “independent” within the meaning of the
Marketplace Rules of the Nasdaq Stock Market, Inc..
Audit
Fees
The
aggregate fees billed by Kenne Ruan, CPA, P.C. for services rendered during the
year ended December 31, 2009 are described as follows:
Fees for
audit and review services amounted to $94,974 in 2009. Fees for audit and review
services include the annual audit of the consolidated financial statements of
the Company and its subsidiaries, and review of the Company's Quarterly Reports
on Form 10-Q.
The
aggregate fees billed by BDO Limited (formerly known as BDO McCabe Lo Limited)
for services rendered during the year ended December 31, 2008 are described as
follows:
Fees for
audit and review services amounted to $130,300 in 2008. Fees for audit and
review services include the annual audit of the consolidated financial
statements of the Company and its subsidiaries, and review of the Company's
Quarterly Reports on Form 10-Q.
Audit-Related
Fees
There
were no audit-related fees billed by Kenne Ruan, CPA, P.C. in 2009.
There
were no audit-related fees billed by BDO Limited in 2008.
Tax Fees
There
were no tax services fees paid to Kenne Ruan, CPA, P.C.; they are not the tax
accountants of the Company.
There
were no tax services fees paid to BDO Limited; they are not the tax accountants
of the Company.
All Other
Fees
Kenne
Ruan, CPA, P.C. did not bill the Company any additional fees for professional
services rendered to the Company during fiscal years ended December 31,
2009.
BDO
Limited did not bill the Company any additional fees for professional services
rendered to the Company during fiscal years ended December 31,
2008.
Policy
on Audit Committee Pre-Approval of Audit and Permissible Non-Audit Services of
Independent Auditors
According
to the charter of the Audit Committee, the Company’s policy on pre-approval of
audit and permissible non-audit services of independent auditors is to
pre-approve all audit services and permissible non-audit services by the
independent accountants, as set forth in Section 10A of the Exchange Act and the
rules and regulations promulgated thereunder by the SEC. The Audit Committee may
establish pre-approval policies and procedures, as permitted by Section 10A of
the Exchange Act and the rules and regulations promulgated thereunder by the
SEC, for the engagement of independent accountants to render services to the
Company, including but not limited to policies that would allow the delegation
of pre-approval authority to one or more members of the Audit Committee,
provided that any pre-approvals delegated to one or more members of the Audit
Committee are reported to the Audit Committee at its next scheduled
meeting.
45
|
Exhibit
|
Description
|
|
Number
|
|
|
31.1
|
Certification
of Lin Chi-Jung, pursuant to Rule 15d-14(a).
|
|
31.2
|
Certification
of Wang Wen-Yan, pursuant to Rule 15d-14(a).
|
|
32.1
|
Certifications
of Lin Chi-Jung, pursuant to 18 U.S.C. 1350.
|
|
32.2
|
Certifications
of Wang Wen-Yan, pursuant to 18 U.S.C.
1350.
|
46
SIGNATURES
In
accordance with Section 13 or 15(d) of the Exchange Act, the Registrant caused
this report to be signed on its behalf by the undersigned, thereunto duly
authorized.
| Sunrise Real Estate Group, Inc. | |||
|
|
|
/s/ Lin Chi-Jung | |
| BY: Lin Chi-Jung | |||
| Principal Executive Officer and Director | |||
| DATE: April 12, 2010 | |||
In
accordance with the Exchange Act, this report has been signed below by the
following persons on behalf of the Registrant and in the capacities and on the
dates indicated.
|
Signature
|
Title
|
Date
|
|
|
|
|||
|
/s/
Lin Chi-Jung
|
Principal
Executive Officer
|
April
12, 2010
|
|
|
Lin
Chi-Jung
|
and
Director
|
||
|
/s/
Wang Wen-Yan
|
Chief
Financial Officer
|
April
12, 2010
|
|
|
Wang
Wen-Yan
|
|||
|
/s/
Lin Chao-Chin
|
Director
|
April
12, 2010
|
|
|
Lin
Chao-Chin
|
|||
|
/s/
Lin Hsin-Hung
|
Director
|
April
12, 2010
|
|
|
Lin
Hsin-Hung
|
|||
|
/s/
Fu Xuan-Jie
|
Director
|
April
12,2010
|
|
|
Fu
Xuan-Jie
|
|||
|
/s/
Li Xiao-Gang
|
Director
|
April
12, 2010
|
|
|
Li
Xiao-Gang
|
|||
|
/s/
Chen Ren
|
Director
|
April
12, 2010
|
|
|
Chen
Ren
|
|||
|
/s/
Zhang Xi
|
Director
|
April
12, 2010
|
|
|
Zhang
Xi
|
47
TABLE OF CONTENTS
Part IItem 1. Description Of BusinessItem 1A. Risk FactorsItem 1B. Unresolved Staff CommentsItem 2. Description Of PropertyItem 3. Legal ProceedingsItem 4. [removed and Reserved]Part IIItem 5. Market For Common Equity and Related Stockholder MattersItem 6. Selected Financial DataItem 7. Management's Discussion and Analysis Of Financial Condition and Results Of OperationsItem 8. Financial StatementsNote 1 Organization and Description Of BusinessNote 2 Summary Of Significant Accounting PoliciesNote 3 - Promissory DepositsNote 4 - Other Receivables and DepositsNote 5 Property, Plant and Equipment NetNote 5 Property, Plant and EquipmentNote 6 Investment PropertiesNote 7 - GoodwillNote 8 - Bank LoansNote 9 Promissory Notes PayableNote 10 Amounts with Related Parties and DirectorsNote 11 - Other Payables and Accrued ExpensesNote 12 Other Tax PayableNote 13 Income Tax PayableNote 14- Commitments and ContingenciesNote 15 Deposits Received From Underwrting SalesNote 16 Statutory ReserveNote 17 Accumulated Other Comprehensive IncomeNote 18 Concentration Of CustomersItem 9. Changes in and Disagreements with Accountants on Accounting and Financial DisclosureItem 9a(t). Controls and ProceduresItem 9B. Other InformationPart IIIItem 11. Executive CompensationItem 12. Security Ownership Of Certain Beneficial Owners and Management and Related Stockholder MattersItem 13. Certain Relationships and Related Transactions and Director IndependenceItem 14. Principal Accountant Fees and ServicesItem 15. Exhibits