SIMPSON MANUFACTURING CO., INC.
10-Ks and 10-Qs
|
|
|
|
|
|
|
|
|
|
|
|
|
|
|
|
|
|
|
|
|
|
|
|
|
|
|
|
|
|
|
|
|
|
|
|
|
|
|
|
|
|
|
|
|
|
|
|
|
|
|
|
|
|
|
|
UNITED STATES
SECURITIES AND EXCHANGE COMMISSION
Washington, D.C. 20549
FORM 10-K
(Mark One)
ý
Annual Report Pursuant to Section 13 or 15(d) of the Securities Exchange Act of 1934
For the fiscal year ended
December 31, 2016
OR
o
Transition Report Pursuant to Section 13 or 15(d) of the Securities Exchange Act of 1934
for the transition period from to .
Commission file number: 1-13429
Simpson Manufacturing Co., Inc.
(Exact name of registrant as specified in its charter)
|
Delaware
|
|
94-3196943
|
|
(State or other jurisdiction of
|
|
(I.R.S. Employer
|
|
incorporation or organization)
|
|
Identification No.)
|
5956 W. Las Positas Blvd., Pleasanton, CA 94588
(Address of principal executive offices)
Registrant’s telephone number, including area code:
(925) 560-9000
Securities registered pursuant to Section 12(b) of the Act:
|
Common Stock, par value $0.01
|
|
New York Stock Exchange, Inc.
|
|
(Title of each class)
|
|
(Name of each exchange on which registered)
|
Securities registered pursuant to Section 12(g) of the Act:
None
(Title of class)
Indicate by check mark if the registrant is a well-known seasoned issuer, as defined in Rule 405 of the Securities Act. Yes
ý
No
o
Indicate by check mark if the registrant is not required to file reports pursuant to Section 13 or 15(d) of the Exchange Act. Yes
o
No
ý
Indicate by check mark whether the registrant (1) has filed all reports required to be filed by Section 13 or 15(d) of the Securities Exchange Act of 1934 during the preceding 12 months (or for such shorter period that the registrant was required to file such reports), and (2) has been subject to such filing requirements for the past 90 days. Yes
ý
No
o
Indicate by check mark whether the registrant has submitted electronically and posted on its corporate Web site, if any, every Interactive Data File required to be submitted and posted pursuant to Rule 405 of Regulation S-T (§232.405 of this chapter) during the preceding 12 months (or for such shorter period that the registrant was required to submit and post such files). Yes
ý
No
o
Indicate by check mark if disclosure of delinquent filers pursuant to Item 405 of Regulation S-K is not contained herein, and will not be contained, to the best of registrant’s knowledge, in definitive proxy or information statements incorporated by reference in Part III of this Form 10-K or any amendment to this Form 10-K. [ ]
Indicate by check mark whether the registrant is a large accelerated filer, an accelerated filer, a non-accelerated filer, or a smaller reporting company. See the definitions of “large accelerated filer,” “accelerated filer” and “smaller reporting company” in Rule 12b-2 of the Exchange Act.
|
Large accelerated filer
x
|
|
Accelerated filer
o
|
|
Non-accelerated filer
o
(Do not check if a smaller reporting company)
|
|
Smaller reporting company
o
|
Indicate by check mark whether the registrant is a shell company (as defined in Rule 12b-2 of the Exchange Act). Yes
o
No
ý
As of June 30, 2016, there were outstanding 48,388,534 shares of the registrant’s common stock, par value $0.01, which is the only outstanding class of common or voting stock of the registrant. The aggregate market value of the shares of common stock held by non-affiliates of the registrant (based on the closing price for the common stock on the New York Stock Exchange on June 30, 2016) was approximately $1,649,633,546.
As of February 23, 2017, 47,652,058 shares of the registrant’s common stock were outstanding.
1
Documents Incorporated by Reference
Portions of the registrant's definitive Proxy Statement for the 2017 Annual Meeting of Stockholders are incorporated herein by reference in Part III of this Annual Report on Form 10-K to the extent stated herein. Such Proxy Statement will be filed with the Securities and Exchange Commission (the "SEC") within 120 days of the registrant's fiscal year ended
December 31, 2016
.
2
NOTE ABOUT FORWARD-LOOKING STATEMENTS
This Annual Report on Form 10-K contains forward-looking statements within the meaning of the Private Securities Litigation Reform Act of 1995. All statements relating to events or results that may occur in the future are forward-looking statements, including but not limited to, statements regarding our plans, sales, sales trends, revenues, profits, costs, expenses, unrecognized costs (including those with respect to unvested stock-based compensation), cost savings, repatriation of funds, factory utilization rates, results of operations, tax liabilities, losses, capital spending, price changes (including product prices and raw material (such as steel) prices), profit margins, effective tax rates, depreciation or amortization expenses, amortization periods, stock repurchases, dividends, compensation arrangements, plans or amendments (including those related to profit sharing and stock-based compensation), record dates, company policies, corporate governance practices, documents or amendments (including charter or bylaw amendments, stockholder rights plans or similar arrangements), capital and corporate structure (including major stockholders, board structure and board composition), effects of changes in accounting standards, effects and expenses of mergers and acquisitions and related integrations, effects of changes in foreign exchange rates or interest rates, effects and costs of facility consolidations and expansions (including related savings), effects and costs of software program implementations (including related savings), labor relations, needs for additional facilities, materials and personnel, and the projected impact of any of the foregoing on our business, financial condition and results of operations. Forward-looking statements generally can be identified by words such as “anticipate,” “believe,” “estimate,” “expect,” “intend,” “plan,” “target,” “continue,” “predict,” “project,” “change,” “result,” “future,” “will,” “could,” “may,” “likely,” “potentially,” or similar expressions. Forward-looking statements are necessarily speculative in nature, are based on numerous assumptions, and involve known and unknown risks, uncertainties and other factors (some of which are beyond our control) that could significantly affect our operations and may cause our actual actions, results, financial condition, performance or achievements to be substantially different from any future actions, results, financial condition, performance or achievements expressed or implied by any such forward-looking statements. Those factors include, but are not limited to: (i) general economic cycles and construction business conditions; (ii) customer acceptance of our products; (iii) product liability claims, contractual liability, engineering and design liability and similar liabilities or claims, (iv) relationships with key customers; (v) materials and manufacturing costs; (vi) financial conditions of customers, competitors and suppliers; (vii) technological developments, including software development; (viii) increased competition; (ix) changes in regulations or industry practices; (x) litigation risks, (xi) changes in market conditions; (xii) governmental and business conditions in countries where our products are manufactured and sold; (xiii) effects of merger or acquisition activities; (xiv) actual or potential takeover or other change-of-control threats; (xv) changes in our plans, strategies, objectives, expectations or intentions; and (xvi) other risks and uncertainties indicated from time to time in our filings with the U.S. Securities and Exchange Commission, including this Annual Report on Form 10-K. See below “Part I, Item 1A — Risk Factors.” Each forward-looking statement contained in this Annual Report on Form 10-K is specifically qualified in its entirety by the aforementioned factors. In light of the foregoing, investors are advised to carefully read this Annual Report on Form 10-K in connection with the important disclaimers set forth above and are urged not to rely on any forward-looking statements in reaching any conclusions or making any investment decisions about us or our securities. Except as required by law, we do not intend and undertake no obligation to update, revise or publicly release any updates or revisions to any forward-looking statements hereunder, whether as a result of the receipt of new information, the occurrence of future events, the change of circumstances or otherwise. We further do not accept any responsibility for any projections or reports published by analysts, investors or other third parties.
Each of the terms the “Company,” “we,” “our,” “us” and similar terms used herein refer collectively to Simpson Manufacturing Co., Inc., a Delaware corporation and its wholly-owned subsidiaries, including Simpson Strong-Tie Company Inc., unless otherwise stated.
“Strong-Tie” and our other trademarks appearing in this report are our property. This report contains additional trade names and trademarks of other companies. We do not intend our use or display of other companies’ trade names or trademarks to imply an endorsement or sponsorship of us by such companies, or any relationship with any of these companies.
3
Company Background
The Company, through its wholly owned subsidiary, Simpson Strong-Tie Company Inc. ("SST"), designs, engineers and is a leading manufacturer of wood construction products, including connectors, truss plates, fastening systems, fasteners and pre-fabricated lateral systems used in light-frame construction, and concrete construction products used for concrete, masonry, steel construction and for concrete repair, protection and strengthening, including adhesives, chemicals, mechanical anchors, carbide drill bits, powder actuated tools and fiber reinforced materials. The Company markets its products to the residential construction, light industrial and commercial construction, remodeling and do-it-yourself (“DIY”) markets. The Company also provides engineering services in support of some of its products and increasingly offers design and other software that facilitates the specification, selection and use of its products. The Company believes that the Simpson Strong-Tie brand benefits from strong brand name recognition among architects and engineers who frequently request the use of the Company’s products. The Company has continuously manufactured structural connectors since 1956.
Business Strategy
The Company attracts and retains customers by designing, manufacturing and selling products that are of high quality and performance, easy to use and cost-effective for customers. The Company aims to manufacture and warehouse its products in geographic proximity to its markets to provide availability and rapid delivery of products to customers and prompt response to customer requests for specially designed products and services. The Company maintains levels of inventory intended to operate with little backlog and fill most customer orders within a few days. High levels of manufacturing automation and flexibility allow the Company to maintain its quality standards while continuing to provide prompt delivery.
The Company intends to continue efforts to increase market share in both the wood construction and concrete construction product groups by:
|
•
|
maintaining frequent contact with customers and private organizations that provide information to building code officials;
|
|
•
|
continuing to sponsor seminars to inform architects, engineers, contractors and building officials on appropriate use, proper installation and identification of the Company’s products;
|
|
•
|
continuing to invest in mobile, web and software applications for customers, utilizing social media, blog posts and videos to connect and engage with customers and to help them do their jobs more efficiently; and
|
|
•
|
continuing to diversify product offerings to be less dependent on United States residential housing.
|
The Company’s long-term strategy is to develop, acquire or invest in product lines or businesses that have the potential to increase the Company’s earnings per share over time and that:
|
•
|
complement the Company’s existing product lines;
|
|
•
|
can be marketed through the Company’s existing distribution channels;
|
|
•
|
might benefit from use of the Company’s brand names and expertise;
|
|
•
|
are responsive to needs of the Company’s customers;
|
|
•
|
expand the Company’s markets geographically; and
|
|
•
|
reduce the Company’s dependence on the United States residential construction market.
|
New Products.
The Company commits substantial resources to new product development. The majority of SST’s products have been developed through its internal research and development program. SST’s research and development expense for the three years ended December 31,
2016
,
2015
and
2014
, was
$9.9 million
,
$10.3 million
, and
$11.2 million
, respectively. The Company believes it is the only United States manufacturer with the capability to test multi-story wall systems, thus enabling full scale testing rather than analysis alone to prove system performance. The Company’s engineering, sales, product management, and marketing teams work together with architects, engineers, building inspectors, code officials and customers in the new product development process.
The Company’s product research and development is based largely on products or solutions that are identified within the Company or as customers communicate to the Company as well as the Company’s strategic initiatives to develop new markets or product lines. The Company’s strategy is to develop new products on a proprietary basis, to seek patents when appropriate and to rely on trade secret protection for others. The Company typically develops
15
to
25
new products each year.
4
The Company expanded its product offering in
2016
by adding:
|
•
|
new connectors for wood framing applications;
|
|
•
|
new cold formed steel connectors;
|
|
•
|
new structural screws for wood, metal and composite decking applications;
|
|
•
|
new mechanical anchors and a speed clean drill bit system;
|
|
•
|
new repair, protection and strengthening product formulations; and
|
|
•
|
new ornamental product line.
|
The Company intends to continue to expand its product offering.
Distribution channels.
The Company seeks to expand its product and distribution coverage through several channels:
|
•
|
Distributors.
The Company regularly evaluates its distribution coverage and the service levels provided by its distributors, and from time to time implements changes. The Company evaluates distributor product mix and conducts promotions to encourage distributors to add the Company’s products that complement the mix of product offerings in their markets.
|
|
•
|
Home Centers.
The Company intends to increase penetration of the DIY markets by continuing to solicit home centers and increase product offerings. The Company’s sales force maintains on-going contact with home centers to work with them in a broad range of areas, including inventory levels, retail display maintenance and product knowledge training. The Company’s strategy is to ensure that the home center retail stores are fully stocked with adequate supplies of the Company’s products carried by those stores. The Company has further developed extensive bar coding and merchandising aids and has devoted a portion of its research efforts to the development of DIY products. The Company’s sales to home centers increased year-over-year in
2016
,
2015
and
2014
.
|
|
•
|
Dealers.
In some markets, the Company sells its products directly to lumber dealers and cooperatives.
|
|
•
|
OEM Relationships.
The Company works closely with manufacturers of engineered wood products and OEMs to develop and expand the application and sales of its engineered wood connector and fastener products. The Company has relationships with several of the largest manufacturers of engineered wood products.
|
|
•
|
International Sales
. The Company has established a presence in the European Community through acquisition of companies with existing customer bases and through servicing United States-based customers operating in Europe. The Company also distributes connector, anchor and epoxy products in Mexico, Chile, Australia, New Zealand, South Africa and the Middle East. The Company intends to continue to pursue and expand operations both inside and outside of the United States. Sales of some products may relate primarily to certain regions.
|
See “Item 1A — Risk Factors,” “Item 7 — Management’s Discussion and Analysis of Financial Condition and Results of Operations,” and “Note 14 — Segment Information” to the accompanying audited consolidated financial statements included in Part II, Item 8 — "Financial Statements and Supplementary Data" of this Annual Report on Form 10-K (the "Company’s Consolidated Financial Statements").
Operating Segments and Geographic Areas
The Company is organized into three operating segments consisting of the North America, Europe and Asia/Pacific segments. The North America segment includes operations primarily in the United States and Canada. The Europe segment includes operations primarily in France, the United Kingdom, Germany, Denmark, Switzerland, Portugal, Poland, The Netherlands and Belgium. The Asia/Pacific segment includes operations primarily in Australia, New Zealand, South Africa, China, Taiwan, and Vietnam. These segments are similar in several ways, including similarities in the products manufactured and distributed, the types of materials used, the production processes, the distribution channels and the product applications. See “Note 14 — Segment Information” to the Company’s Consolidated Financial Statements for information regarding the assets, revenue and performance of each of the Company’s operating segments and geographic areas. Also see “Item 1A — Risk Factors.”
Products and Services
The Company manufactures and markets building and construction products and is a recognized brand name in residential and commercial applications. The product lines historically have encompassed connectors, anchors, fasteners, lateral resistive systems, truss plates, as well as repair and strengthening product lines for the marine, industrial and transportation markets. See “Item 7 — Management’s Discussion and Analysis of Financial Condition and Results of Operations,” and “Note 14 — Segment Information” to the Company’s Consolidated Financial Statements for financial information regarding revenues by product category.
5
Most of the Company’s products are approved by building code evaluation agencies. To achieve such approvals, the Company conducts extensive product testing, which is witnessed and certified by independent testing laboratories. The tests also provide the basis of load ratings for the Company’s structural products. This test and load information is used by architects, engineers, contractors, building officials and homeowners and is useful across all applications of the Company’s products, ranging from the deck constructed by a homeowner to a multi-story structure designed by an architect or engineer.
Wood Construction Products.
As described below, the Company’s wood construction products include (1) connectors, (2) truss plates, (3) fastening systems and (4) lateral systems, and are typically made of steel. The Company produces and markets over 16,000 standard and custom wood construction products. These products are used primarily to strengthen, support and connect wood joints in residential and commercial construction and DIY projects. The Company’s wood construction products contribute to structural integrity and resistance to seismic, wind and other forces. Applications range from commercial and residential building, to deck construction, to DIY projects.
|
1.
|
The Company’s connectors are prefabricated metal products that attach wood, concrete, masonry or steel together. Connectors are essential for tying wood construction elements together and create safer and stronger buildings.
|
|
2.
|
The Company’s truss connector plates and software are marketed under the name Integrated Component Systems. Truss plates are toothed metal plates that join wood members together to form a truss. The Company continues to develop sophisticated software to assist truss and component manufacturers’ in modeling, designing trusses and selecting the appropriate truss plates for the applicable jobs.
|
|
3.
|
The Company’s fastener line includes various nails, screws and staples. Complementing these products is the Quik Drive auto-feed screw driving system used in numerous applications such as decking, subfloors, drywall and roofing.
|
|
4.
|
The Company’s lateral resistive systems are assemblies used to resist earthquake or wind forces and include Steel and Wood Shearwalls, Anchor Tiedown Systems (“ATS”) and steel moment frames.
|
Concrete Construction Products.
As described below, the Company’s concrete construction products include (1) anchor products, and (2) construction repair, protection and strengthening products. The Company produces and markets over 2,000 standard and custom concrete construction products. The Company’s concrete construction products are composed of various materials including steel, chemicals and carbon fiber. They are used primarily to strengthen, anchor, support, repair and connect concrete joints in residential and commercial construction and DIY projects used to repair, protect and strengthen concrete, brick and masonry structures. The Company’s concrete construction products contribute to structural integrity and resistance to seismic, wind and other forces. Applications range from industrial, commercial, infrastructure and residential structures, to DIY projects. These products are sold in all segments of the Company worldwide.
|
1.
|
The Company’s concrete construction anchor products include adhesives, mechanical anchors, carbide drill bits and powder-actuated pins and tools used for numerous applications of anchoring or attaching elements onto concrete, brick, masonry and steel.
|
|
2.
|
The Company's concrete construction repair, protection and strengthening products include grouts, coatings, sealers, mortars, fiberglass and fiber-reinforced polymer systems and asphalt products.
|
Engineering and Design Services.
The Company’s engineers not only design and test products, but also provide engineering support for customers in connection with a number of products that the Company manufactures and sells. This support might range from the discussion of a load value in a catalog to testing the suitability of an existing product in a unique application. For certain product lines, industry norms require that the Company’s engineers are more involved in the sales process. For example, in connection with the sale of our truss plates, the Company’s engineers review the output of the Company’s software to assist customers in ensuring that trusses are properly designed and specified, and in some instances seal design diagrams. Generally, in connection with any engineering services the Company provides, the Company’s engineers serve as a point of reference and support for the customer’s engineers and other service professionals, who ultimately determine and are responsible for the engineering approach to any project.
Sales and Marketing
The Company’s sales and marketing programs are implemented through its branch system. The Company currently maintains branches in California, Texas, Ohio, Canada, England, France, Germany, Denmark, Switzerland, Poland, Czech Republic, Portugal, Austria, The Netherlands, Ireland, Belgium, Sweden, Australia, New Zealand, South Africa and Chile. Each branch is served by its own sales force, warehouse and office facilities, while some branches have their own manufacturing facilities. Each branch is responsible for setting and executing sales and marketing strategies that are consistent both with the markets in the geographic area that the branch serves and with the goals of the Company. Branch sales forces in North America are supported by marketing managers in the home office in Pleasanton, California. The home office also coordinates issues affecting customers that operate
6
in multiple regions. The sales
force maintains close working relationships with customers, develops new business, calls on architects, engineers and building officials and participates in a range of educational seminars.
The Company dedicates substantial resources to customer service. The Company produces numerous publications and point-of-sale marketing aids to serve specifiers, distributors, retailers and users for the various markets that it serves. These publications include general catalogs, as well as various specific catalogs, such as those for its fastener products. The catalogs and publications describe the products and provide load and installation information. The Company also maintains several linked websites centered on www.strongtie.com, which include catalogs, product and technical information, code reports and other general information related to the Company, its product lines and promotional programs. The contents of these websites are not incorporated into this filing. Further, the Company’s references to the URLs for these websites are intended to be inactive textual references only.
Manufacturing Process
The Company designs and manufactures most of its products. The Company has developed and uses automated manufacturing processes for many of its products. The Company’s innovative manufacturing systems and techniques have allowed it to control manufacturing costs, even while developing both new products and products that meet customized requirements and specifications. The Company’s development of specialized manufacturing processes has also permitted increased operating flexibility and enhanced product design innovation. As part of ongoing continuous improvement processes in its factories, the Company’s major North American and European manufacturing facilities initiated lean manufacturing practices to improve efficiency and customer service. The Company sources some products from third-party vendors, both domestically and internationally. The Company has 25 manufacturing locations in the United States, Canada, France, Denmark, Germany, Switzerland, Poland, Portugal, Belgium, Sweden, China and England.
Quality Control.
The Company has developed a quality system that manages defined procedures to ensure consistent product quality and also meets the requirements of product evaluation reports of the International Code Council (ICC) and the International Association of Plumbers and Mechanical Officials Uniform Evaluation Services (IAPMO-UES). Since 1996, the Company’s quality system has been registered under ISO 9001, an internationally recognized set of quality-assurance standards. The Company believes that ISO registration is a valuable tool for maintaining and promoting its high quality standards. As the Company establishes new business locations through expansion or acquisitions, projects are established to integrate the Company’s quality systems and achieve ISO 9001 registration. In addition, the Company has six testing laboratories accredited to ISO standard 17025, an internationally accepted standard that provides requirements for the competence of testing and calibration laboratories. The Company implements testing requirements through systematic control of its processes, enhancing the Company’s standard for quality products, whether produced by the Company or purchased from others.
Wood Construction Products Manufacturing.
Most of the Company’s wood construction products are produced with a high level of automation. The Company has significant press capacity and has multiple dies for some of its high volume products to enable production of these products close to the customer and to provide back-up capacity. The balance of production is accomplished through a combination of manual, blanking and numerically controlled (NC) processes that include robotic welders, lasers and turret punches. This capability allows the Company to produce products with little redesign or set-up time, facilitating rapid turnaround for customers. The Company also has smaller specialty production facilities, which primarily use batch production with some automated lines.
Concrete Construction Products Manufacturing.
The Company manufactures its concrete construction products at its facilities in Zhangjiagang, China, Addison, Illinois, Baltimore, Maryland, Cardet, France, Seewen, Switzerland, Malbork, Poland, and Elvas, Portugal. Based on current information and subject to future events and circumstances, the Company anticipates that by the end of the second quarter of 2017, it will finish consolidating the Addison and Baltimore facilities into a single manufacturing facility in West Chicago, Illinois. See "Item 2 — Properties." The mechanical anchor products are produced with a high level of automation. Some products, such as epoxy and adhesive anchors, are mixed in batches and are then loaded into one-part or two-part dispensers, which mix the product on the job site because set-up times are usually very short. In addition, the Company purchases a number of products, powder actuated pins, tools and accessories and certain of its mechanical anchoring products, from various sources around the world. These purchased products undergo inspections on a sample basis for conformance with ordered specifications and tolerances before being distributed.
Regulation
Environmental Regulation.
The Company itself is subject to environmental laws and regulations governing emissions into the air, discharges into water, and generation, handling, storage, transportation, treatment and disposal of waste materials. The Company is also subject to other federal and state laws and regulations regarding health and safety matters. The Company believes that it has obtained all material licenses and permits required by environmental, health and safety laws and regulations in connection
7
with the Company’s operations and that its policies and procedures comply in all material respects with existing environmental, health and safety laws and regulations. See “Item 1A — Risk Factors.”
Other.
The Company’s product lines are subject to federal, state, county, municipal and other governmental and quasi-governmental regulations that affect product development, design, testing, analysis, load rating, application, marketing, sales, exportation, installation and use.
The Company considers product evaluation, recognition and listing to the building code as a significant tool that facilitates and expedites the use of the Company’s products by design professionals, building officials, inspectors, builders, home centers and contractors. Industry members are more likely to use building products that have the appropriate recognition and listing than products that lack this acceptance. The Company devotes considerable time and testing resources to obtaining and maintaining appropriate listings for its products. The Company actively participates in industry related professional associations and building code committees both to keep abreast of regulatory changes and to provide comments and expertise to these regulatory agencies.
A substantial portion of the Company’s products have been evaluated and are recognized by governmental and product evaluation agencies. Some of the entities that recognize the Company’s products include the International Code Council Uniform Evaluation Service (ICC-ES), IAPMO-UES, the City of Los Angeles (LARR’s), California Division of the State Architect, the State of Florida, Underwriters Laboratory (UL), Factory Mutual (FM) and state departments of transportation. In Europe, the Company’s structural products meet European Technical Agreement (ETA) regulations.
Competition
The Company faces a variety of competition in all of the markets in which it participates. This competition ranges from subsidiaries of large national or international corporations to small regional manufacturers. While price is an important factor, the Company also competes on the basis of quality, breadth of product line, proprietary technology, technical support, availability of inventory, service (including custom design and manufacturing), field support and product innovation. As a result of differences in structural design and building practices and codes, the Company’s markets tend to differ by region. Within these regions, the Company competes with companies of varying size, several of which also distribute their products nationally or internationally. See “Item 1A — Risk Factors.”
Raw Materials
The principal raw material used by the Company is steel, including stainless steel. The Company also uses materials such as carbon fiber, epoxies and acrylics in the manufacture of its chemical anchoring and reinforcing products. The Company purchases raw materials from a variety of commercial sources. The Company’s practice is to seek cost savings and enhanced quality by purchasing from a limited number of suppliers.
The steel industry is highly cyclical and prices for the Company’s raw materials are influenced by numerous factors beyond the Company’s control. The steel market continues to be dynamic, with a high degree of uncertainty about future pricing trends. Given current conditions, labor union contract negotiations, anti-dumping and countervailing duty trade cases filed by United States steel producers in 2015 and
2016
, and the current political climate regarding international trade, the Company currently expects that the high degree of uncertainty regarding steel prices will continue. Numerous factors may cause steel prices to increase in the future. In addition to increases in steel prices, steel mills may add surcharges for zinc, energy and freight in response to increases in their costs. See “Item 1A — Risk Factors” and “Item 7 — Management’s Discussion and Analysis of Financial Condition and Results of Operations.” The Company historically has not attempted to hedge against changes in prices of steel or other raw materials.
Patents and Proprietary Rights
The Company has United States and foreign patents, the majority of which cover products that the Company currently manufactures and markets. These patents, and applications for new patents, cover various design aspects of the Company’s products, as well as processes used in their manufacture. The Company continues to develop new potentially patentable products, product enhancements and product designs. Although the Company does not intend to apply for additional foreign patents covering existing products, the Company has developed an international patent program to protect new products that it may develop. In addition to seeking patent protection, the Company relies on unpatented proprietary technology to maintain its competitive position. See “Item 1A — Risk Factors.”
8
Acquisitions and Expansion into New Markets
In August 2016, the Company purchased all of the outstanding shares of Multi Services Dêcoupe S.A. ("MS Decoupe"), a Belgium public limited company, for
$6.9 million
. MS Decoupe primarily manufactures and distributes connectors for wood construction, as well as plastic and metal label products, in Belgium and the Netherlands, including distributing the Company's products manufactured at the Company's production facility in France. With this acquisition, the Company expects to be able to offer the Belgium market a wider-range of its products, shorten delivery lead times, and expand the Company's sales presence into the Netherlands. The Company's provisional measurement of assets acquired and liabilities assumed included cash and cash equivalents of
$1.5 million
, other current assets of
$2.1 million
, non-current assets of
$5.0 million
, current liabilities of
$0.7 million
and non-current deferred income tax liabilities of
$1.0 million
. Included in non-current assets was goodwill of
$1.8 million
, which was assigned to the Europe segment, and intangible assets of
$1.2 million
, both of which are not subject to tax-deductible amortization. The estimated weighted-average amortization period for the intangible assets is
7
years.
In December 2015, the Company purchased all of the business assets, including intellectual property, from Blue Heron Enterprises, LLC, and Fox Chase Enterprises, LLC (collectively, "EBTY"), both New Jersey limited liability companies, for $3.4 million in cash. EBTY manufactured and sold hidden deck clips and associated products and systems. The Company's measurement of assets acquired included goodwill of $2.0 million, which was assigned to the North America segment, and intangible assets of $1.1 million, both of which are subject to tax-deductible amortization. Net assets consisting of inventory and equipment accounted for the balance of the purchase price.
The Company’s growth potential depends, to some extent, on its ability to penetrate new markets, both domestically and internationally. See “Business Strategy” above. The Company currently intends as part of its expansion strategy to continue to pursue acquisitions of product lines or businesses. See “Note 2 — Acquisitions” and “Note 15 — Subsequent Events” to the Company’s Consolidated Financial Statements, as well as “Item 1A — Risk Factors” and “Item 7 — Management’s Discussion and Analysis of Financial Condition and Results of Operations.”
Seasonality and Cyclicality
The Company’s sales are seasonal and cyclical. Operating results vary from quarter to quarter and with economic cycles. The Company’s sales are also dependent, to a large degree, on the North American residential home construction industry. See “Item 1A — Risk Factors” and “Item 7 — Management’s Discussion and Analysis of Financial Condition and Results of Operations.”
Employees and Labor Relations
As of
December 31, 2016
, the Company had
2,647
full-time employees, of whom
1,130
were hourly employees and 1,517 were salaried employees. The Company believes that its overall compensation and benefits for the most part meet industry averages and that its relations with its employees are good.
A significant number of the employees at two of the Company’s facilities are represented by labor unions and are covered by collective bargaining agreements. The Company’s facility in Stockton, California, is a union facility with two collective bargaining agreements, one with tool and die craftsmen and maintenance workers and the other with sheetmetal workers. These two contracts will expire in July and September 2019, respectively. The Company’s facility in San Bernardino County, California, also has two collective bargaining agreements, one with tool and die craftsmen and maintenance workers and the other with sheetmetal workers. These two contracts will expire in February 2017 and June 2018, respectively. The Company expects to agree with the San Bernardino tool and die craftsman and maintenance workers union to extend the existing labor union contract that expires in February 2017, while the parties are negotiating a new agreement. Based on current information and subject to future events and circumstances, the Company believes that, even if a new agreement is not reached before the existing labor union contract expires, it is not likely to have a material adverse effect on the Company’s ability to provide products to customers or on the Company’s profitability. See “Item 1A — Risk Factors.”
Available Information
The Company makes available, free of charge, on its website www.simpsonmfg.com, copies of its annual reports on Form 10-K, quarterly reports on Form 10-Q, current reports on Form 8-K, proxy statements, and amendments to reports filed pursuant to Sections 13(a) and 15(d) of the Securities Exchange Act of 1934, as amended (the “Exchange Act”) after the Company files them with the SEC. Printed copies of any of these materials will also be provided free of charge on request.
You may read and copy any materials filed by the Company with the SEC at the SEC's Public Reference Room at 100 F Street, NE, Room 1580, Washington, DC 20549. The public may obtain information on the operation of the Public Reference Room by
9
calling the SEC at 1-800-SEC-0330. The SEC maintains an Internet site that contains reports, proxy and information statements, and other information regarding issuers that file electronically with the SEC at www.sec.gov.
The contents of the websites referred to above are not incorporated into this filing. Further, our references to the URLs for these websites are intended to be inactive textual references only.
Investing in our common stock involves a high degree of risk. You should carefully consider the risks and uncertainties described below, in addition to other information contained in this Annual Report on Form 10-K, including our consolidated financial statements and related notes thereto, before you decide to buy or hold shares of our common stock. The risks and uncertainties described below are not the only ones we face. Additional risks and uncertainties that we are unaware of, or that we currently believe are not material, may also become important factors that adversely affect our business. We may not be able to control any of those risks and uncertainties. If any of those risks and uncertainties, whether described below or not, actually occurs, our business, results of operations, financial condition and future prospects could be materially and adversely affected, and you may lose all or part of your investment.
To facilitate a review of our risk factors, we have organized our risk factors into general groups of risks, including “General Business Risks,” “Products, Services, and Sales Risks,” “Technological and Intellectual Property Risks,” “Regulatory Risks,” “Capital Expenditures, Expansions, Acquisitions and Divestitures Risk,” “International Operations Risks,” “Capital and Company Structure Risks,” “Employee Risks,” and “Other Risks.” The grouping of risks is to facilitate your review only, and no ranking of importance of risks or other inference should be made on account of such groups.
General Business Risks
Business cycles affect our operating results.
Our operating results and our stock price are heavily tied to the health of the building construction industry, with an estimated 55% to 65% of our total product sales being dependent on housing starts. The construction industry is subject to significant volatility due to real estate market cycles, fluctuations in interest rates, the availability, or lack thereof, of credit to builders and developers, inflation rates, weather, and other factors and trends.
Further, many of our customers in the construction industry are small and medium-sized businesses. These businesses are more likely to be significantly affected by economic downturns than larger, more established businesses. Uncertainty about current global economic conditions may cause these consumers to postpone or refrain from spending or may cause them to switch to lower-cost alternative products, which could reduce demand for our products and materially and adversely affect our financial condition and operating results.
Additionally, declines in commercial and residential construction, such as housing starts and remodeling projects, which generally occur during economic downturns, have in the past significantly reduced, and in the future can be expected to reduce, the demand for our products and our stock price.
Our sales are seasonal and we have little control over the timing of customer purchases. If we miss seasonal forecasts or customers purchase our products in different quarters than we or analysts expect, our stock could materially decline.
Our sales are seasonal, with operating results varying from quarter to quarter. With some exceptions, our sales and income have historically been lower in the first and fourth quarters than in the second and third quarters, as customers tend to purchase construction materials in the late spring and summer months for the construction season. In addition, weather conditions, such as unseasonably warm, cold or wet weather, which affect, and sometimes delay or accelerate installation of some of our products, may significantly affect our results of operations. Sales that we anticipate in one quarter may occur in another quarter, affecting both quarters’ results. If our operating results for a quarter are below the expectations of analysts and investors, it could have a material adverse effect on our stock price.
In addition, we typically ship orders as we receive them and maintain such inventory levels to allow us to operate with little backlog. The efficiency of our inventory system is closely tied to our ability to accurately predict seasonal and quarterly variances. Further, our planned expenditures are also based primarily on sales forecasts. When sales do not
10
meet our expectations, our operating results will be reduced for the relevant quarters, as we will have already incurred expenses based on those expectations. This could result in a material decline in our stock price.
We operate in a competitive industry, and if we fail to anticipate and react appropriately to competitors, technological changes, changing industry trends and other competitive forces our sales and profit margins will decline.
Our ability to compete effectively depends upon our ability to meet changing market conditions and develop enhancements to our products on a timely basis in order to maintain our competitive advantage. Many of our competitors have greater financial and other resources than we do. Our continued growth depends upon our ability to develop additional products, services and technologies that meet our customers’ expectation of our brand and quality. There can be no assurance that we will be successful in developing and marketing new products, product enhancements and additional technologies, that we will not experience difficulties that could delay or prevent the successful development, introduction and marketing of these products, or that our new products and product enhancements will adequately meet the requirements of the marketplace, or will achieve market acceptance.
Further, one of the core elements of our strategy is to provide high quality products and customer services. Many of our competitors are dedicating increasing resources to competing with us, especially as our products and services become more affected by technological advances and software innovations. Some of our competitors have more experience producing software and other technology-driven solutions. As a result, we are dedicating increasing resources to research and development in new and changing technologies in order to stay competitive and provide high quality and innovative products and services. These increased expenditures could reduce our operating results.
Additionally, our ability to compete effectively depends, to a significant extent, on the specification or approval of our products by architects, engineers, building inspectors, building code officials and customers and their acceptance of our premium brand. If a significant segment of those communities were to decide that the design, materials, manufacturing, testing or quality control of our products is inferior to that of any of our competitors or the cost differences between our products and any competitors are not justifiable, our sales and profits would be materially reduced.
Our future growth may depend on our ability to develop new products and penetrate new markets, which could reduce our profitability.
Our future success depends upon our continued investment in research and new product development and our ability to continue to develop new products that allow us to expand into new markets. Expansion into new markets and the development of new products may involve considerable costs and may not generate sufficient revenue to be profitable or cover the costs of development. We might not be able to penetrate these product markets and any market penetration that occurs might not be timely or profitable. We may be unable to recoup part or all of the significant investments we will have made in attempting to penetrate new markets.
Product, Services and Sales Risks
Design defects, labeling defects, product formula defects, inaccurate chemical mixes, product recalls and/or product liability claims could harm our reputation, sales and financial results.
We have on occasion found flaws and deficiencies in the design, manufacturing, assembling, labeling, product formulations, chemical mixes or testing of our products. We also have on occasion found flaws and deficiencies in raw materials and finished goods produced by others and used with or incorporated into our products. Some flaws and deficiencies have not been apparent until after the products were installed by customers.
Many of our products are integral to the structural soundness or safety of the structures in which they are used. If any flaws or deficiencies exist in our products and if such flaws or deficiencies are not discovered and corrected before our products are incorporated into structures, the structures could be unsafe or could suffer severe damage, such as collapse or fire, and personal injury or death could result. Errors in the installation of our products, even if the products are free of flaws and deficiencies, could also cause personal injury or death and unsafe structural conditions. To the extent that such damage or injury is not covered by our product liability insurance and we are held to be liable, we could be required to correct such damage and to compensate persons who might have suffered injury or death, and our reputation, business and financial condition could be materially and adversely affected.
11
Even if a flaw or deficiency is discovered before any damage or injury occurs, we may need to refund customers and/or repair or recall products (to the extent possible), and we may be liable for any costs necessary to replace recalled products or retrofit or remedy the affected structures. Any such recall, retrofit or other remedy could entail substantial costs and adversely affect our reputation, sales and financial condition. We do not carry insurance against recall costs or the adverse business effect of a recall, and our product liability insurance may not cover retrofit or other remedy costs.
As a result of the nature of many of our products and their use in construction projects, claims (including product warranty claims and claims resulting from a natural disaster) may be made against us with regard to damage or destruction of structures incorporating our products whether or not our products failed. Any such claims, if asserted, could require us to expend material time and efforts defending the claim and may materially and adversely affect our business and financial condition. Costs associated with resolving such claims (such as repair or replacement of the affected parts) could be material and may exceed any amounts reserved in our consolidated financial statements.
While we generally attempt to limit our contractual liability and our exposure to price or expense increases, we may have uncapped liabilities or significant exposure under some contracts, and could suffer material losses under such contracts.
We enter into many types of contracts with our customers, suppliers and other third parties, including in connection with our expansion into new markets and new product lines. Under some of these contracts, our overall liability may not be limited to a specified maximum amount or we may have significant potential exposure to price or expense increases. If we receive claims under these contracts or experience significant price increases or comparable expense increases, we may incur liabilities significantly in excess of the revenues associated with such contracts, which could have a material adverse effect on our results of operations.
Our software provides some design functions to customers, and we increasingly are involved both in product sales and engineering services. Any software errors or deficiencies or failures in our engineering services could have material adverse effects on our operations and financial condition.
Our design software increasingly facilitates the creation by customers of complex construction and building designs and we increasingly are involved both in product sales and engineering services. Our software is extremely complex and is continually being modified and improved. As a result, it may contain defects or errors and new versions may introduce new defects and errors. While we have attempted to limit our potential liability for the failure of any designs created by our software, as a result of defects in our software, the structures could be unsafe or could suffer severe damage, such as collapse or fire, and personal injury or death could result. Errors in construction unconnected with our design could also cause personal injury or death and unsafe structural conditions, even if our software design is sufficient. To the extent that a structure designed by our software suffers any failure or deficiency, we could be required to correct deficiencies and may become involved in litigation, even if our software design was not the cause of such deficiency. Further, if any damage or injury is not covered by our insurance and we are held to be liable, we could be required to correct such damage and to compensate persons who might have suffered injury, and our reputation, business and financial condition could be materially and adversely affected.
While we engage in testing and upgrades, there can be no assurance that, despite our testing and upgrades, errors will not be found in new and existing products resulting in loss of revenues or delay in market acceptance, diversion of development resources, damage to our reputation, adverse litigation, or increased service and warranty costs, any of which would have a material adverse effect upon our business, operating results and financial condition.
We are also increasingly involved in providing engineering solutions to our clients. The risks associated with providing these services are materially different than the risks we historically faced when we only produced products. If our engineers prepare, approve or seal drawings that contain defects or otherwise are involved in any design or construction that contains flaws, regardless of whether our engineers caused such flaws, we may be held liable for professional negligence or other damages, which could involve material claims.
We have a few large customers, the loss of any one of which could negatively affect our sales and profits.
Our largest customers accounted for a significant portion of net sales for the years ended December 31, 2016, 2015 and 2014. Any reduction in, or termination of, our sales to these customers would at least temporarily, and possibly on a longer term basis, cause a material reduction in our net sales, income from operations and net income. Such a reduction in or elimination of our sales to any of our largest customers would increase our relative dependence on our remaining large customers.
12
In addition, our distributor customers have increasingly consolidated over time, which has increased the material adverse effect of losing any one of them and may increase their bargaining power in negotiations with us. These trends could negatively affect our sales and profitability.
Increases in prices of raw materials could negatively affect our sales and profits.
Our principal raw material is steel, including stainless steel. The steel industry can have large fluctuations. Numerous factors beyond our control, such as general economic conditions, competition, worldwide demand, material and labor costs, energy costs, foreign exchange rates, import duties and other trade restrictions influence prices for our raw materials. Further, the domestic steel market is heavily influenced by three major United States manufacturers. We have not always been able, and in the future we might not be able, to increase our product prices in amounts that correspond to increases in costs of raw materials, without materially and adversely affecting our sales and profits.
We have historically not hedged against changes in prices of steel or other raw materials. In recent years, however, we have increased our anticipatory purchases of steel in an effort to mitigate the effects of rising steel prices. This strategy, coupled with changing economic conditions, has resulted in substantial fluctuations in our inventory in recent years, which can materially and adversely affect our margins, cash flow and profits.
We depend on third parties for transportation services and the lack of availability of transportation and/or increases in cost could materially adversely affect our business and operations.
Our business depends on the transportation of both finished goods to our customers and distributors and the transportation of raw materials to us. We rely on third parties for transportation services of these items, which services are occasionally in high demand (especially at the end of calendar quarters) and/or subject to price fluctuations.
If the required supply of transportation services is unavailable when needed, our manufacturing processes may be interrupted or we may be unable to sell our products at full value, or at all. This could harm our reputation, negatively impact our customer relationships and have a material adverse effect on our financial condition and results of operation. In addition, a material increase in transportation rates or fuel surcharges could have a material adverse effect on our profitability.
Technological and Intellectual Property Risks
Our recent efforts to increase our technology offerings and integrate new software and application offerings may prove unsuccessful and may affect our future prospects.
Our industry has experienced increased complexity in some home design and builders are more aggressively trying to reduce their costs. One of our responses has been to design and market sophisticated software to facilitate the design and marketing of our product systems. We have continued to commit substantial resources to our software development endeavors in recent years and expect that trend to continue in 2017.
We have a limited operating history in the technology space and may not be able to create commercially successful software and applications. Even if we are able to create initially successful ideas, the technology industry is subject to rapid changes. We may not be able to adapt quickly enough to keep up with changing demands, and our software may become obsolete.
While we see having a software interface with the construction industry as a potential growth area, we also face competition from other companies that are focused solely or primarily on the development of software and applications. These companies may have significantly greater expertise and resources to devote to software development, and we may be unable to compete with them in that space.
If we cannot protect our technology, we will not be able to compete effectively.
Our ability to compete effectively with other companies depends in part on our ability to maintain the proprietary nature of our technology, in part through patents, copyrights, trade secrets and other intellectual property protections. We might not be able to protect or rely on our patents and copyrights. Patents might not issue pursuant to pending patent applications. Our software copyright and other protections might not be adequate to protect our software and application code. Others might independently develop the same or similar technology, develop around the patented aspects of any of our products
13
or proposed products, or otherwise obtain access to or circumvent our proprietary technology. We also rely on unpatented proprietary technology to maintain our competitive position. We might not be able to protect our trade secrets, our know-how or other proprietary information. If we are unable to maintain the proprietary nature of our significant products, our sales and profits are likely to be materially reduced.
In attempting to protect our proprietary information, we sometimes initiate lawsuits against competitors and others that we believe have infringed or are infringing our rights. In such an event, the defendant may assert counterclaims to complicate or delay the litigation or for other reasons. Litigation may be very costly and may result in adverse judgments that affect our sales and profits materially and adversely.
Claims that we infringe intellectual property rights of others may materially increase our expenses and reduce our profits.
Other parties have in the past and may in the future claim that our products or processes infringe their intellectual property rights. We may incur substantial costs and liabilities in investigating, defending and resolving such claims, whether or not they are meritorious, which may materially reduce our profitability and materially and adversely affect our business and financial condition. Litigation can be disruptive to normal business operations and may result in adverse rulings or decisions. If any such infringement claim is asserted against us, we may be required to obtain a license or cross-license, modify our existing technology or design a new non-infringing technology, any of which could be costly and time-consuming. A ruling against us in an infringement lawsuit could include an injunction barring our production or sale of any infringing product. A damages award against us could include an award of royalties or lost profits and, if the court finds willful infringement, treble damages and attorneys’ fees.
If we are unable to protect our information systems against data corruption, cyber-based attacks or network security breaches, our operations could be disrupted and our reputation and profitability could be negatively affected.
We depend on information technology networks and systems, including the internet, to process, transmit and store electronic information. We depend on our information technology infrastructure for electronic communications among our locations around the world and between our personnel and our subsidiaries, customers and suppliers. We collect and retain large volumes of internal and customer, vendor and supplier data, including some personally identifiable information, for business purposes. We also maintain personally identifiable information about our employees. The integrity and protection of our customer, vendor, supplier, employee and other Company data is critical to our business. The regulatory environment governing information, security and privacy laws is increasingly demanding and continues to evolve. Maintaining compliance with applicable security and privacy regulations may increase our operating costs or adversely affect our business operations.
Unauthorized parties may also attempt to gain access to our systems or facilities through fraud, trickery or other forms of deceiving our employees, contractors or other agents or representatives. Security breaches of our infrastructure could create system disruptions, shutdowns or unauthorized disclosures of confidential information. Despite the security measures we have in place, our facilities and systems, and those of the retailers, dealers, licensees and other third party distributors with which we do business, may be vulnerable to security breaches, cyber-attacks, acts of vandalism, computer viruses, misplaced or lost data, programming and/or human errors or other similar events. Any security breach involving the misappropriation, loss or other unauthorized disclosure of confidential customer, employee, supplier or Company information, whether by us or by the retailers, dealers, licensees and other third party distributors with which we do business, could result in losses, severely damage our reputation, expose us to the risks of litigation and liability (including regulatory liability), disrupt our operations and have a material adverse effect on our business, results of operations and financial condition.
We publicly post our privacy policies and practices concerning our processing, use, and disclosure of personally identifiable information on our website. The publication of our privacy policy and other statements we publish that provide assurances about privacy and security can subject us to potential federal, state, or other regulatory action if they are found to be deceptive or misrepresentative of our practices.
We may experience delays or outages in our information technology system and computer networks.
We may be subject to information technology system failures and network disruptions. These may be caused by delays or disruptions due to system updates, natural disasters, malicious attacks, accidents, power disruptions,
14
telecommunications failures, acts of terrorism or war, computer viruses, physical or electronic break-ins or similar events or disruptions.
Despite our security measures, our systems could be vulnerable to disruption, and any such disruption could negatively affect our financial condition and results of operations.
Regulatory Risks
Failure to comply with industry regulations could result in reduced sales and increased costs.
We are subject to environmental laws and regulations governing emissions into the air, discharges into water, and generation, handling, storage, transportation, treatment and disposal of waste materials. We are also subject to other federal and state laws and regulations regarding health and safety matters.
Our manufacturing operations involve the use of solvents, chemicals, oils and other materials that are regarded as hazardous or toxic. We also use complex and heavy machinery and equipment that can pose severe safety hazards, especially if not properly and carefully used. Some of our products also incorporate materials that are hazardous or toxic in some forms, such as zinc and lead used in some steel galvanizing processes, chemicals used in our acrylic and epoxy anchoring products, and chemicals used in our concrete repair, strengthening and protecting products. The gun powder used in our powder-actuated tools is explosive. We have in the past, and may in the future, need to take steps to remedy our failure to properly label, store, transport, use and manufacture such toxic and hazardous materials.
If we do not obtain all material licenses and permits required by environmental, health and safety laws and regulations, we may be subject to regulatory action by governmental authorities. If our policies and procedures are flawed, or our employees fail or neglect to follow our policies and procedures in all respects, we might incur liability. Relevant laws and regulations could change or new ones could be adopted that require us to incur substantial expense to comply.
Complying or failing to comply with conflict minerals regulations could materially and adversely affect our supply chain, our relationships with customers and suppliers and our financial results.
We are currently subject to conflict mineral disclosure regulations in the U.S. and may be affected by new regulations concerning conflict and similar minerals adopted by other jurisdictions where we operate. While we have been successful to date in adapting to such regulations, we have and will continue to incur added costs to comply with the disclosure requirements, including costs related to determining the source of such minerals used in our products. We may not be able to ascertain the origins of such minerals that we use and may not be able to satisfy requests from customers to certify that our products are free of conflict minerals. These requirements also could constrain the pool of suppliers from which we source such minerals. We may be unable to obtain conflict-free minerals at competitive prices. Such consequences will increase costs and may materially and adversely affect our manufacturing operations and profitability.
Capital Expenditures, Expansions, Acquisitions and Divestitures Risks
Our acquisition growth strategy presents unique risks for our business, and any acquisition could materially and adversely affect our business and operating results.
We pursue acquisitions of product lines or businesses as one of our key growth strategies. We compete for acquisitions with other potential acquirers, some of which have greater financial or operational resources than we do. As a result, we may not be able to identify suitable acquisition candidates or strategic opportunities. Any acquisitions we undertake involve numerous risks, including, for example:
|
•
|
inadequate access to information and/or due diligence of acquired businesses;
|
|
•
|
diversion of management’s attention from other business concerns;
|
|
•
|
overvaluation of acquired businesses;
|
|
•
|
difficulties assimilating the operations and products of acquired businesses, including expensive and time consuming integration costs such as employee redeployment, relocation or severance, combining teams and processes in various functional areas, reorganization or closures of facilities, and relocation or disposition of excess equipment;
|
|
•
|
inaccurate accounting or public reporting arising from integration of the financial statements and disclosures of acquired businesses;
|
|
•
|
undisclosed existing or potential liabilities of acquired businesses;
|
15
|
•
|
slow acceptance or rejection of acquired businesses’ products by our customers;
|
|
•
|
risks of entering markets in which we have little or no prior experience;
|
|
•
|
litigation involving activities, properties or products of acquired businesses;
|
|
•
|
increased cost of regulatory compliance and enforcement;
|
|
•
|
consumer and other claims related to products of acquired businesses; and
|
|
•
|
the potential loss of key employees of acquired businesses.
|
In addition, future acquisitions may involve issuance of additional equity securities that dilute the value of our existing equity securities, increase our debt, cause impairment related to goodwill and cause impairment of, and amortization expenses related to, other intangible assets, which could materially and adversely affect our profitability. Any acquisition could materially and adversely affect our business and operating results, and as a result, our business and operating results may differ from any guidance that we may provide.
We may decide to dispose of assets and incur material expenses in doing so.
We have terminated in the past and may terminate in the future product lines or businesses if we determine that the cost of operating them is not warranted by their expected profitability. For example, we closed our sales offices in China, Thailand and Dubai in 2015. There are significant costs with such divestitures, which could materially and adversely affect our sales, assets, profitability and financial condition.
Our capital expenditures may not be adequate to maintain our competitive position and may not be implemented in a timely or cost-effective manner.
Our capital expenditures are limited by our liquidity and capital resources and the amount we have available for capital spending is limited by the need to pay our other expenses and to maintain adequate cash reserves and borrowing capacity to meet unexpected demands that may arise. Productivity improvements through process re-engineering, design efficiency and manufacturing cost improvements may be required to offset potential increases in labor and raw material costs and competitive price pressures. If we are unable to make sufficient capital expenditures, or to maximize the efficiency of the capital expenditures we do make, our competitive position may be harmed and we may be unable to manufacture the products necessary to compete successfully in our targeted market segments.
Additional financing, if needed, to fund our working capital, growth or acquisitions may not be available on reasonable terms, or at all.
If our cash requirements for working capital or to fund our growth or acquisitions increase to a level that exceeds the amount of cash that we generate from operations and have available through our current credit arrangements, we will need to seek additional financing. Additional or new borrowings may not be available on reasonable terms, or at all. Our ability to raise money by issuing and selling shares of our common or preferred stock depends on general market conditions and the demand for our stock. If we sell stock, our existing stockholders could experience substantial dilution. Our inability to secure additional financing could prevent the expansion of our business, internally and through acquisitions.
If we change significantly the location, nature or extent of some of our manufacturing operations, we may reduce our net income.
If we decide to change significantly the location, nature or extent of a portion of our manufacturing operations, we may need to record an impairment of our goodwill. Our goodwill totaled
$124.5 million
at
December 31, 2016
. Recording an impairment of our goodwill correspondingly reduces our net income. Other changes or events in the future could further impair our recorded goodwill, which could also materially and adversely affect our profitability.
International Operations Risks
Our international operations may be materially and adversely affected by factors beyond our control.
Economic, social and political conditions, laws, practices and customs vary widely among the countries where we produce or sell our products. Our operations outside of the United States are subject to a number of risks and potential costs, including, for example, lower profit margins, less protection of intellectual property and economic, political and social uncertainty in some countries. Our sales and profits depend, in part, on our ability to develop and implement policies and strategies that effectively anticipate and manage these and other risks in the countries where we do business. These and other risks may materially and adversely affect our operations in any particular country and our business as a whole.
16
International construction standards, techniques and methods differ from those in the United States. Laws and regulations applicable in new markets may be unfamiliar to us. Compliance may be substantially more costly than we anticipate. As a result, we may need to redesign our products, or invent or design new products, to compete effectively and profitably in international markets. Inflation in emerging markets may also make our products more expensive there and increases the market and credit risks that we are exposed to.
Other significant challenges to conducting business in foreign countries include, among other factors, local acceptance of our products, political instability, changes in import and export regulations, changes in tariff and freight rates, fluctuations in foreign exchange rates, currency controls, cash repatriation restrictions and differing economic outcomes.
International operations expose us to foreign exchange rate risk.
We have foreign exchange rate risk in our international operations and through purchases from foreign vendors. We do not currently hedge this risk. Changes in currency exchange rates could materially and adversely affect our sales and profitability.
Because of our international operations, we could be adversely affected by violations of applicable U.S. federal and state or foreign laws and regulations, such as the United States Foreign Corrupt Practices Act and similar worldwide anti-bribery, anti-corruption and anti-kickback laws.
As a result of our expanded international operations, we face increasing compliance and regulatory oversight related to operating in foreign countries. The foreign and U.S. laws and regulations that are applicable to our operations are complex and may increase the costs of regulatory compliance, or limit or restrict the products or services we sell or subject our business to the possibility of regulatory actions or proceedings. The United States Foreign Corrupt Practices Act, and other similar laws and regulations, generally prohibit companies and their intermediaries from making improper payments to foreign governmental officials for the purpose of obtaining or retaining business. While our policies mandate compliance with applicable laws and regulations, including anti-bribery laws and other anti-corruption laws, we cannot guarantee that we will be successful in preventing our employees or other agents from taking actions in violation of these laws or regulations. Such violations, or allegations of such violations, could disrupt our business and result in a material adverse effect on our financial condition, results of operations and cash flows.
Our international operations depend on our successful management of our subsidiaries outside of the United States.
We conduct our international business through wholly owned subsidiaries. Managing distant subsidiaries and fully integrating them into our business is challenging. We cannot directly supervise every aspect of the operations of our subsidiaries operating outside the United States. As a result, we rely on local managers and staff. Cultural factors and language differences can result in misunderstandings among internationally dispersed personnel. The risk that unauthorized conduct may go undetected may be greater in subsidiaries outside of the United States. These problems could adversely affect our sales and profits.
Failure to comply with export, import, and sanctions laws and regulations could affect us materially and adversely.
We are subject to a number of export, import and economic sanction regulations, including the International Traffic in Arms Regulations (“ITAR”), the Export Administration Regulations (“EAR”) and U.S. sanction regulations administered by the U.S. Department of Treasury, Office of Foreign Assets (“OFAC”). Foreign governments where we have operations also implement export, import and sanction laws and regulations, some of which may be inconsistent or conflict with ITAR and EAR. Where we face such inconsistencies, it may be impossible for us to comply with all applicable regulations.
If we do not obtain all necessary import and export licenses required by applicable export and import regulations, including ITAR and EAR, or do business with sanctioned countries or individuals, we may be subject to fines, penalties and other regulatory action by governmental authorities, including, among other things, having our export or import privileges suspended. Even if our policies and procedures for exports, imports and sanction regulations comply, but our employees fail or neglect to follow them in all respects, we might incur similar liability.
Any changes in applicable export, import or sanction laws or regulations or any legal or regulatory violations could materially and adversely affect our business and financial condition.
17
Our manufacturing facilities in China complicate our supply and inventory management.
We maintain manufacturing capability in various parts of the world, in part to allow us to serve our customers with prompt delivery of needed products. Such customer service is a significant factor in our efforts to compete with larger companies that have greater resources than we have. In recent years, we have substantially expanded our manufacturing in China. Nearly all of our manufacturing output in China was and is currently intended for export to other parts of the world. Because of the great distances between our manufacturing facilities in China and the markets to which the products made there will be shipped, we may have difficulty providing adequate service to our customers, which may put us at a competitive disadvantage. Our attempts to provide prompt delivery may necessitate that in China we produce and keep on hand substantially more inventory of finished products than would otherwise be needed. Inventory fluctuations can materially and adversely affect our margins, cash flow and profits. Any tariffs, duties, taxes, penalties imposed by the United States on imports from China would negatively affect our inventory management and profits.
We are subject to U.S. and international tax laws that could affect our financial results.
We generally conduct international operations through our wholly-owned subsidiaries. Our income tax liabilities in the different countries where we operate depend in part on internal settlement prices and administrative charges among us and our subsidiaries. These arrangements require us to make judgments with which tax authorities may disagree. Tax authorities may impose additional tariffs, duties, taxes, penalties and interest on us. Transactions that we have arranged in light of current tax rules could have material and adverse consequences if tax rules change, and changes in tax rules or imposition of any new or increased tariffs, duties and taxes could materially and adversely affect our sales, profits and financial condition.
As of
December 31, 2016
, we held
$87.2 million
in cash outside the U.S. as a result of operations from our international subsidiaries, and any repatriation of funds currently held in foreign jurisdictions to the U.S. may result in higher effective tax rates for us. In addition, there have been proposals from Congress to change U.S. tax laws that would significantly impact how U.S. multinational corporations like us are taxed on foreign earnings.
Recent changes in applicable law regarding the transfer of personally identifiable information by U.S. companies doing business in the European Union could lead us to spend significant resources trying to comply with the newly developed rules. We may not succeed in meeting such requirements, and we may face governmental actions and suffer business losses.
We have in the past relied on adherence to the U.S. Department of Commerce’s Safe Harbor Policy Principles and compliance with the Safe Harbor Frameworks as agreed to and set forth by the European Commission and the United States, which established a means for legitimating the transfer of personally identifiable information by U.S. companies doing business in the European Union (“EU”) to the U.S. As a result of an October 6, 2015, European Union Court of Justice (“ECJ”) opinion, the Safe Harbor Framework no longer provides a lawful basis to transfer data from the EU to the U.S. On February 2, 2016, the European Commission and the United States agreed on a new framework for transatlantic data sharing; the Privacy Shield. The Privacy Shield aims to strengthen protections of European personal data and monitoring and enforcement of such protections in the U.S., compared to that provided under the prior Safe Harbor Frameworks.
In light of that ECJ opinion and the Privacy Shield, we have made and continue to engage in additional compliance efforts when transferring certain data from the EU. We may be unsuccessful in complying with the new EU data transfer requirements, and as a result, we may be at risk of enforcement actions taken by an EU data protection authority until such point in time that we ensure all data transfers to us from the EU are in compliance with applicable law. We may find it necessary to establish systems to maintain EU-origin data in the European Economic Area, which may involve substantial expense and distraction from other aspects of our business.
Capital Structure and Stock Risks
A stockholder controls approximately 14% of the outstanding shares of our common stock, which may reduce other stockholders' ability to influence our affairs.
As of
December 31, 2016
, Sharon Simpson controlled, directly and indirectly, approximately 14% of the then outstanding shares of our common stock. Ms. Simpson, therefore, has significant influence with respect to our corporate matters requiring stockholder approval such as the election of our directors and proposals that come before the stockholders at the annual meeting or other special meetings.
18
Further, if all or a substantial portion of her shares of our common stock is sold, it could depress the price of our common stock.
Any issuance of preferred stock may dilute your investment and reduce funds available for dividends.
Our Board of Directors is authorized by our Certificate of Incorporation to determine the terms of one or more series of preferred stock and to authorize the issuance of shares of any such series on such terms as our Board of Directors may approve. Any such issuance could be used to impede an acquisition of our business that our Board of Directors does not approve, further dilute the equity investments of holders of our common stock and reduce funds available for the payment of dividends to holders of our common stock.
Future sales of our common stock could adversely affect our stock price.
Our Board of Directors has the authority to issue, from time to time, authorized and unissued shares of our common stock. Our issuance of substantial amounts of new shares of our common stock could adversely affect the prevailing market price for our common stock.
All of the outstanding shares of our common stock are freely tradable without restriction under the Securities Act of 1933, as amended (the "Securities Act"), other than
shares of our common stock held by
our “affiliates,” as that term is defined in Rule 144 under the Securities Act. There were 6,844,696 million shares held by our affiliates as of
February 26, 2017
. In addition as of
December 31, 2016
, options to purchase
0.3 million
shares of our common stock were outstanding and exercisable and restricted stock units with respect to
0.6 million
shares of our common stock were unvested.
If a substantial number of shares of our common stock are sold in the public market pursuant to Rule 144 by our affiliates or issued upon the exercise of our outstanding options, the trading price of our common stock in the public market could be adversely affected.
Delaware law and our corporate governance documents contain anti-takeover provisions that could deter takeover attempts that might otherwise be beneficial to our stockholders.
Provisions of Delaware law could make it more difficult for a third party to acquire us. Section 203 of the Delaware General Corporation Law may make the acquisition of the Company and the removal of our incumbent officers and directors more difficult for potential acquirers by prohibiting stockholders holding 15% or more of our outstanding voting stock from acquiring us without the consent of our Board of Directors for at least three years from the date they first hold 15% or more of the voting stock.
As of February 28, 2017, we also have the following protective measures, among others:
|
•
|
Under our current classified board structure, only a portion of our Board of Directors is elected at each annual meeting.
|
|
•
|
Stockholders cannot call special meetings of the stockholders and cannot take action by written consent.
|
|
•
|
A change in the composition of our Board of Directors that is not approved by the existing Board of Directors could trigger a default under our existing credit facilities.
|
These measures reduce the opportunity for a third party to launch a proxy contest to take control of the Company to once per year. These provisions may discourage, delay or prevent a merger or acquisition of the Company, including a transaction that may offer a premium price for our common stock.
We will continue to incur increased costs as a result of being a publicly-traded company, including costs arising from the scrutiny of our business, practice and governance as a publicly-traded company.
As a U.S. public company, we are generally subject to the reporting and other requirements of applicable federal and state securities laws, rules and regulations and scrutiny by stockholders and proxy advisors. Compliance with these laws, rules and regulations and attending to stockholder requests, requires us to continue to incur significant legal, accounting and other expenses and costs, makes some activities more difficult, time-consuming or costly and increases demands on our systems and resources, and may continue to do so. For example, we recently expended significant time and resources in terminating our stockholder rights plan, creating a compensation recovery policy and an anti-hedging and anti-pledging policy, redesigning our executive compensation program and responding to other requests from our stockholders. We continue to implement strategic and board initiatives to comply with recent and updated best-practices related to our
19
public company status and respond to stockholder feedback, and expect that will have to continue to allocate significant time and resources to such endeavors.
In addition, as a result of disclosure of information in filings required of a public company, our business and financial condition will become more visible, which may result in threatened or actual litigation, including by competitors and other third parties. If such claims are successful, our business and operating results could be harmed, and even if the claims do not result in litigation or are resolved in our favor, these claims, and the time and resources necessary to resolve them, could divert the resources of our management and adversely affect our business, brand and reputation and results of operations.
Employee Risks
We depend on key management and technical personnel, the loss of whom could harm our business.
We depend on our key management and technical personnel. The loss of one or more key employees could materially and adversely affect us.
Our success also depends on our ability to attract and retain highly qualified technical, sales and marketing and management personnel necessary for the maintenance and expansion of our activities. We face strong competition for such personnel and may not be able to attract or retain such personnel. In addition, when we experience periods with little or no profits, a decrease in compensation based on our profits may make it difficult to attract and retain highly qualified personnel.
In order to attract and retain executives and other key employees, we must provide a competitive compensation package, including cash and stock-based compensation. Our primary form of stock-based compensation is restricted stock units (“RSUs”). We have issued a substantial number of RSUs in various forms to our management and staff. We cannot guarantee that such stock-based incentive awards are tax deductible. As a result, we may be required to pay additional tax on stock-based compensation to our employees.
If the anticipated value of our stock-based incentive awards does not materialize so that they cease to be viewed as valuable, if our profits decrease, or if our total compensation package is not viewed as competitive, our ability to attract, retain and motivate executives and key employees could be weakened. The failure to successfully hire and retain executives and key employees or the loss of any executives and key employees could have a significant impact on our operations.
Any work stoppage or interruption by employees could materially and adversely affect our business and financial condition.
A significant number of our employees are represented by labor unions and covered by collective bargaining agreements that will expire in 2017, 2018 and 2019. Although we believe that our relations with our employees are generally good, no assurance can be given that we will be able to successfully extend or renegotiate our collective bargaining agreements as they expire from time to time. If we fail to extend or renegotiate our collective bargaining agreements, if disputes with our unions arise, or if our unionized workers engage in a strike or other work stoppage or interruption, we could experience a significant disruption of, or inefficiencies in, our operations or incur higher labor costs, which could have a material adverse effect on our business, results of operations, financial position and liquidity.
Other Risks
Natural disasters could decrease our manufacturing capacity.
Some of our current manufacturing facilities are located in geographic regions that have experienced major natural disasters, such as earthquakes, floods and hurricanes. Our disaster recovery plan may not be adequate or effective. We do not carry earthquake insurance. Other insurance that we carry is limited in the risks covered and the amount of coverage. Our insurance would not be adequate to cover all of our resulting costs, business interruption and lost profits when a major natural disaster occurs. A natural disaster rendering one or more of our manufacturing facilities totally or partially unusable, whether or not covered by insurance, would materially and adversely affect our business and financial condition.
Climate change could materially and adversely affect our business.
We cannot predict the effects that climate change may have on our business. They might, for example:
20
|
•
|
depress or reverse economic development,
|
|
•
|
reduce the demand for construction,
|
|
•
|
increase the cost and reduce the availability of fresh water,
|
|
•
|
destroy forests, increasing the cost and reducing the availability of wood products used in construction,
|
|
•
|
increase the cost and reduce the availability of raw materials and energy,
|
|
•
|
increase the cost of capital,
|
|
•
|
increase the cost and reduce the availability of insurance covering damage from natural disasters,
|
|
•
|
lead to claims regarding the content or adequacy of our public disclosures, and
|
|
•
|
lead to new laws and regulations that increase our expenses and reduce our sales.
|
Any of these consequences, and other consequences of climate change that we do not foresee, could materially and adversely affect our sales, profits and financial condition.
We may have exposure to greater than anticipated tax liabilities.
We provide guidance on our anticipated tax rates. Failure to meet these anticipated rates could cause us to miss analyst forecasts and could result in material declines in our stock price. Our future income taxes could be adversely affected by earnings being lower than anticipated in jurisdictions that have lower statutory tax rates and higher than anticipated in jurisdictions that have higher statutory tax rates, by changes in the valuation of our deferred tax assets and liabilities, as a result of changes in foreign tax exchanges, or changes in tax laws, regulations, or accounting principles, as well as certain discrete items. The determination of our worldwide provision for income taxes and other tax liabilities requires significant judgment, and there are many transactions and calculations where the ultimate tax determination is uncertain. Although we believe our estimates are reasonable, the ultimate tax outcome may differ from the amounts recorded in our financial statements and may materially affect our financial results in the period or periods for which such determination is made.
Contracts that we file as exhibits to our public reports contain recitals, representations and warranties that may not be factually correct.
The parties to any agreement or other instrument that we file as an exhibit to this or any other report did not necessarily intend that any recital, representation, warranty or other statement of purported fact in the instrument establish or confirm any fact, even if it is worded as such. Often such statements are used to allocate contractual risk between the parties, and the statements often are subject to standards of materiality that differ from the standards applicable to our reports. In addition, such statements may have been qualified by other materials that we have not filed with (or incorporated by reference into) this or any other report or document. Such exhibits should be read in the context of our other disclosures in our reports and it should not be assumed that any statement, representation or warranty of any party is necessarily factually accurate.
Impairment charges on goodwill or other intangible assets adversely affect our financial position and results of operations.
We are required to perform impairment tests on our goodwill, indefinite-lived intangible assets and definite-lived intangible assets annually or at any time when events occur that could affect the value of such assets. To determine whether a goodwill impairment has occurred, we compare fair value of each of our reporting units with its carrying value. In the past, these tests have led us to incur significant impairment charges. Significant and unanticipated changes in circumstances, such as significant adverse changes in business climate, adverse actions by regulatory authorities, unanticipated competition, loss of key customers or changes in technology or markets, can require a charge for impairment that can materially and adversely affect our reported net income and our stockholders’ equity.
Failure of our internal control over financial reporting or our accounting systems could harm our business and financial results.
Because of the inherent limitations of internal control, our internal control over financial reporting might not detect or prevent misstatement of our consolidated financial statements. We have used a commercially available Microsoft accounting software system in connection with our operations in the United States, Europe and Asia. Defects in that third-party system, our other accounting systems, or their implementation could result in errors in our consolidated financial statements. Our growth and entry into globally dispersed markets puts significant additional pressure on our internal control system. Failure to maintain an effective internal control system could limit our ability to report our financial results accurately and timely or to detect and prevent fraud, cause investors to lose confidence in the accuracy and
21
completeness of our financial reports, and subject us to regulatory investigations. As a result, our business and the market price of our common stock could be materially and adversely affected.
Changes in accounting standards could materially and adversely affect our financial results.
The accounting rules applicable to public companies are subject to frequent revision. Future changes in accounting standards, guidance and interpretations could require us to change the way we measure revenue, expense or balance sheet amounts, which could result in material and adverse change to our reported results of operations or financial condition.
None.
The Company owns its home office in Pleasanton, California, and its principal United States manufacturing facilities in Stockton and San Bernardino County, California, McKinney, Texas, West Chicago, Illinois, Columbus, Ohio, and Gallatin, Tennessee. The principal manufacturing facilities located outside the United States, the majority of which are owned, are in Canada, France, Denmark, Germany, Poland, Switzerland, Sweden, Portugal and China. The Company also owns and leases smaller manufacturing facilities, warehouses, research and development facilities and sales offices in the United States, the United Kingdom, Europe, Asia, Australia, New Zealand, South Africa and Chile. As of
February 28, 2017
, the Company’s owned and leased facilities were as follows:
|
|
Number
|
|
|
|
||||||||
|
|
Of
|
Approximate Square Footage
|
||||||||||
|
|
Properties
|
Owned
|
Leased
|
Total
|
||||||||
|
|
|
(in thousands of square feet)
|
||||||||||
|
North America
|
26
|
|
2,323
|
|
675
|
|
2,998
|
|
||||
|
Europe
|
22
|
|
519
|
|
330
|
|
849
|
|
||||
|
Asia/Pacific
|
12
|
|
175
|
|
39
|
|
214
|
|
||||
|
Administrative and all other
|
3
|
|
368
|
|
—
|
|
368
|
|
||||
|
Total
|
63
|
|
3,385
|
|
1,044
|
|
4,429
|
|
||||
The Company’s properties, in management’s opinion, are maintained in good operating condition. The Company’s manufacturing facilities are equipped with specialized equipment and use extensive automation. The Company considers its existing and planned facilities to be adequate for its operations as currently conducted and as planned through
2017
. The Company’s leased facilities typically have renewal options and have expiration dates through 2026. The Company believes it will be able to extend leases on its various facilities as necessary, as they expire. The manufacturing facilities currently are being operated with at least one full shift. Based on current information and subject to future events and circumstances, the Company anticipates that it may require additional facilities to accommodate possible future growth.
In December 2015, the Company purchased for $12.6 million a manufacturing facility in West Chicago, Illinois, for the purposes of combining the operations of two leased chemical facilities into one owned facility. During 2016, the Company incurred $7.3 million in improvement costs to build out the new facility. In 2016, the Company approved the expansion of the McKinney facility. Based on current information and subject to future events and circumstances, the Company estimates that the expansion will cost $17.0 million to $19.0 million and will be completed by the end of 2017.
The Company retained its real estate in Vacaville, California. The Company leased that facility to M&G Dura-Vent, Inc. for approximately $0.9 million per year for ten years. These properties are classified under the “Administrative & All other” segment.
From time to time, the Company is involved in various legal proceedings and other matters arising in the normal course of business.
22
Corrosion, hydrogen enbrittlement, cracking, material hardness, wood pressure-treating chemicals, misinstallations, misuse, design and assembly flaws, manufacturing defects, labeling defects, product formula defects, inaccurate chemical mixes, adulteration, environmental conditions, or other factors can contribute to failure of fasteners, connectors, anchors, adhesives, specialty chemicals, such as fiber reinforced polymers, and tool products. In addition, inaccuracies may occur in product information, descriptions and instructions found in catalogs, packaging, data sheets, and the Company’s website.
As of February 28, 2017, the Company is not a party to any legal proceedings, other than ordinary routine litigation incidental to the Company’s business, which the Company expects individually or in the aggregate to have a material adverse effect on the Company’s financial condition, cash flows or results of operations. Nonetheless, the resolution of any claim or litigation is subject to inherent uncertainty and could have a material adverse effect on the Company’s financial condition, cash flows or results of operations.
Not applicable.
Market Information for Common Stock
The information presented below is our historical data and not necessarily indicative of our future financial condition or results of operations.
The Company’s common stock is listed on the New York Stock Exchange (the “NYSE”) under the symbol “SSD.” The following table shows the range of high and low closing sale prices per share of our common stock as reported by the NYSE and dividends declared per share of our common stock for each quarter of the two most recent fiscal years indicated below, respectively:
|
|
Market Price
|
Dividends
Declared |
|||||||||
|
Quarter
|
High
|
Low
|
|||||||||
|
2016
|
|
|
|
|
|
|
|||||
|
Fourth
|
$
|
48.17
|
|
$
|
40.88
|
|
$
|
0.18
|
|
||
|
Third
|
45.27
|
|
39.32
|
|
0.18
|
|
|||||
|
Second
|
39.97
|
|
37.25
|
|
0.18
|
|
|||||
|
First
|
38.17
|
|
30.49
|
|
0.16
|
|
|||||
|
2015
|
|
|
|
|
|
|
|||||
|
Fourth
|
$
|
38.40
|
|
$
|
33.59
|
|
$
|
0.16
|
|
||
|
Third
|
37.01
|
|
32.94
|
|
0.16
|
|
|||||
|
Second
|
37.41
|
|
32.78
|
|
0.16
|
|
|||||
|
First
|
37.78
|
|
31.73
|
|
0.14
|
|
|||||
Record Holders
As of February 13, 2017, there were
9,484
holders of record of the Company’s common stock. Because many of our shares of common stock are held by brokers and other nominees on behalf of stockholders, including in trust, we are unable to estimate the total number of stockholders represented by these record holders.
Dividends
The Company declared dividends of
$0.14
per share of our common stock in the first quarter of
2015
and
$0.16
per share of our common stock in each of the second, third and fourth quarters of
2015
. The Company declared dividends of
$0.16
per share of
23
our common stock in the first quarter of
2016
, and
$0.18
per share of our common stock in each of the second, third and fourth quarters of
2016
. On January 30, 2017, the Company declared a dividend of $0.18 per share of our common stock. See "Note 15 — Subsequent Events" to the Company's Consolidated Financial Statements. Future dividends, if any, will be determined by the Company’s Board of Directors, based on the Company’s future earnings, cash flows, financial condition and other factors deemed relevant by the Board of Directors. See “Item 7 — Management’s Discussion and Analysis of Financial Condition and Results of Operations.”
Securities Authorized for Issuance under Equity Compensation Plans
The information required by this item with respect to our equity compensation plans is incorporated by reference to our Proxy Statement for the 2017 Annual Meeting of Stockholders to be filed with the SEC within 120 days of the fiscal year ended
December 31, 2016
.
Stock Performance Graph
This performance graph shall not be deemed “soliciting material” or to be “filed” with the SEC for purposes of Section 18 of the Exchange Act, or otherwise subject to the liabilities under that Section, and shall not be deemed to be incorporated by reference into any filing of the Company under the Securities Act or the Exchange Act, except as shall be expressly set forth by specific reference in such filing. The information presented below is our historical data and not necessarily indicative of our future financial condition or results of operations.
The graph below compares the cumulative total stockholder return on the Company’s common stock from December 31, 2011, through
December 31, 2016
, with the cumulative total return on the S&P 500 Index (a broad equity market index) and the Dow Jones U.S. Building Materials & Fixtures Index (a published industry or line-of-business index) over the same period (assuming the investment of $100 in the Company’s common stock and in each of the indices on December 31, 2011, and reinvestment of all dividends into additional shares of the same class of equity securities at the frequency with which dividends are paid on such securities during the applicable fiscal year).
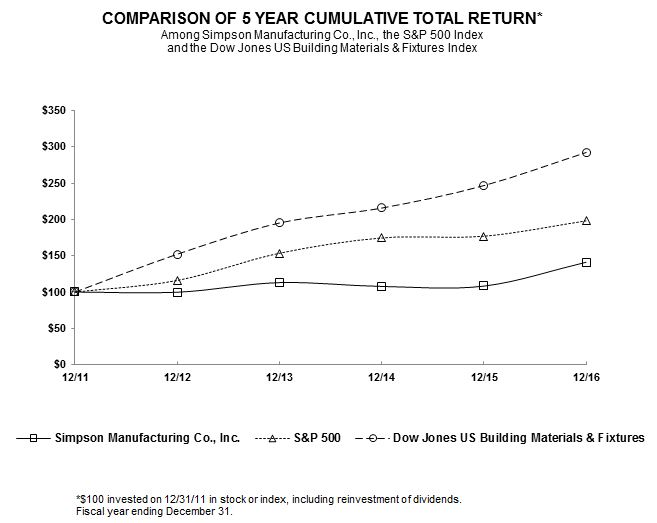
24
Purchases of Equity Securities by the Issuer and Affiliated Purchasers
The table below presents the monthly repurchases of shares of our common stock in the fourth quarter of the fiscal year ended
December 31, 2016
.
|
(a)
|
(b)
|
(c)
|
(d)
|
|||||||
|
Period
|
Total Number of Shares Purchased
|
Average Price Paid per Share
|
Total Number of Shares Purchased as Part of Publicly Announced Plans or Programs
|
Approximate Value of Shares that May Yet Be Purchased Under the Plans or Programs
|
||||||
|
October 1 - October 31, 2016
|
—
|
|
N/A
|
|
—
|
|
$78.0 million
|
|||
|
November 1 - November 30, 2016
|
154,156
|
|
(1)
|
43.95
|
|
154,156
|
|
(2)
|
$71.5 million
|
|
|
December 1 - December 31, 2016
|
—
|
|
N/A
|
|
—
|
|
$71.5 million
|
|||
|
Total
|
154,156
|
|
||||||||
|
(1)
|
All purchases were made pursuant to a publicly announced repurchase plan or program. See footnote (2) to this table.
|
|
(2)
|
At its meeting in August 2016, the Company’s Board of Directors authorized the Company to repurchase up to $125.0 million of the Company’s common stock through 2017. This authorization increased and extended the $50.0 million repurchase authorization from February 2016 and will remain in effect through the end of 2017. In August 2016, the Company entered into a Supplemental Confirmation with Wells Fargo Bank, National Association for a $50.0 million accelerated share repurchase program (the “2016 ASR Agreement”). In 2016, the Company repurchased 1,244,003 shares of its common stock, which included the 1,137,656 shares pursuant to the 2016 ASR agreement, at a cost of approximately $53.5 million. See “Note 1
—
Stock Repurchase Program”
to the Company’s Consolidated Financial Statements.
|
25
You should read the following selected consolidated financial data in conjunction with Part II, Item 7
—
"Management's Discussion and Analysis of Financial Condition and Results of Operations," and the Company’s Consolidated Financial Statements and the related Notes thereto, including any discussion of accounting changes, business combinations or dispositions of business operations therein, to fully understand factors that may affect the comparability of the information presented below.
The consolidated statements of operations data for each of the years ended
December 31, 2016
,
2015
and
2014
and the consolidated balance sheets data as of
December 31, 2016
and
2015
are derived from our audited consolidated financial statements included in the Company's Consolidated Financial Statements. The consolidated statements of operations data for the years ended December 31,
2013
and
2012
and the consolidated balance sheets data as of December 31,
2014
,
2013
and
2012
are derived from our audited consolidated financial statements, except as otherwise noted, that are not included in this Annual Report on Form 10-K. The information presented below is our historical data and not necessarily indicative of our future financial condition or results of operations. The financial data below includes the results of operations of acquired companies beginning on the dates of acquisition. For a summary of recent acquisitions that took place during the fiscal years ended December 31, 2016, 2015 and 2014, see “Note 2 — Acquisitions” to the Company’s Consolidated Financial Statements.
|
|
Years Ended December 31,
|
||||||||||||||||||
|
(in thousands, except per-share data)
|
2016
|
2015
|
2014
|
2013
|
2012
|
||||||||||||||
|
Statement of Operations Data:
|
|
|
|
|
|
|
|
|
|
|
|||||||||
|
Net sales
|
$
|
860,661
|
|
$
|
794,059
|
|
$
|
752,148
|
|
$
|
705,322
|
|
$
|
656,231
|
|
||||
|
Cost of sales
|
448,211
|
|
435,140
|
|
410,118
|
|
391,791
|
|
373,759
|
|
|||||||||
|
Gross profit
|
412,450
|
|
358,919
|
|
342,030
|
|
313,531
|
|
282,472
|
|
|||||||||
|
Research and development and other engineering expense
|
46,248
|
|
46,196
|
|
39,018
|
|
36,843
|
|
35,919
|
|
|||||||||
|
Selling expense
|
98,343
|
|
90,663
|
|
92,031
|
|
85,102
|
|
82,364
|
|
|||||||||
|
General and administrative expense
|
129,162
|
|
113,428
|
|
111,500
|
|
108,070
|
|
99,968
|
|
|||||||||
|
Impairment of goodwill
|
—
|
|
—
|
|
530
|
|
—
|
|
2,346
|
|
|||||||||
|
Net loss (gain) on disposal of assets
|
(780
|
)
|
(389
|
)
|
(325
|
)
|
2,038
|
|
166
|
|
|||||||||
|
Income from operations
|
139,477
|
|
109,021
|
|
99,276
|
|
81,478
|
|
61,709
|
|
|||||||||
|
Interest income (expense), net
|
(577
|
)
|
(342
|
)
|
46
|
|
86
|
|
212
|
|
|||||||||
|
Income from operations
|
138,900
|
|
108,679
|
|
99,322
|
|
81,564
|
|
61,921
|
|
|||||||||
|
Provision for income taxes
|
49,166
|
|
40,791
|
|
35,791
|
|
30,593
|
|
20,003
|
|
|||||||||
|
Net income
|
$
|
89,734
|
|
$
|
67,888
|
|
$
|
63,531
|
|
$
|
50,971
|
|
$
|
41,918
|
|
||||
|
Earnings per share of common stock:
|
|
|
|
|
|
|
|
|
|
|
|||||||||
|
Basic
|
$
|
1.87
|
|
$
|
1.39
|
|
$
|
1.30
|
|
$
|
1.05
|
|
$
|
0.87
|
|
||||
|
Diluted
|
$
|
1.86
|
|
$
|
1.38
|
|
$
|
1.29
|
|
$
|
1.05
|
|
$
|
0.87
|
|
||||
|
Cash dividends declared per share of common stock
|
$
|
0.700
|
|
$
|
0.620
|
|
$
|
0.545
|
|
$
|
0.375
|
|
$
|
0.625
|
|
||||
|
|
December 31,
|
||||||||||||||||||
|
(in thousands)
|
2016
|
2015
|
2014
|
2013
|
2012
|
||||||||||||||
|
Balance Sheet Data:
|
|
|
|
|
|
|
|
|
|
|
|||||||||
|
Working capital
|
$
|
476,451
|
|
$
|
494,308
|
|
$
|
509,838
|
|
$
|
464,901
|
|
$
|
402,538
|
|
||||
|
Property, plant and equipment, net
|
232,810
|
|
213,716
|
|
207,027
|
|
209,533
|
|
213,452
|
|
|||||||||
|
Goodwill
|
124,479
|
|
123,950
|
|
123,881
|
|
129,218
|
|
121,981
|
|
|||||||||
|
Total assets
|
979,974
|
|
961,309
|
|
973,065
|
|
953,613
|
|
890,322
|
|
|||||||||
|
Line of credit and long-term debt, including current portion
|
—
|
|
—
|
|
18
|
|
103
|
|
178
|
|
|||||||||
|
Total liabilities
|
114,132
|
|
111,485
|
|
109,600
|
|
112,334
|
|
100,754
|
|
|||||||||
|
Total stockholders’ equity
|
865,842
|
|
849,824
|
|
863,465
|
|
841,279
|
|
789,568
|
|
|||||||||
26
The following is a discussion and analysis of the financial condition and results of operations, unless stated otherwise, for the Company for the fiscal years ended
December 31, 2016
,
2015
and
2014
, and of certain factors that may affect the Company’s prospective financial condition and results of operations. The following discussion and analysis contain forward-looking statements as discussed in the “Note About Forward-Looking Statements” at the beginning of this Annual Report on Form 10-K and should be read in conjunction with the Company's Consolidated Financial Statements and related Notes included therein. In addition to our historical consolidated financial information, the following discussion contains forward-looking statements that reflect our plans, estimates, and beliefs. Our actual results could differ materially from those plans, estimates, and beliefs. Factors that could cause or contribute to these differences include those discussed below and elsewhere in this Annual Report on Form 10-K, particularly "Item 1A
—
Risk Factors."
Overview
To avoid fractional percentages, all percentages presented in this "
Overview
" section were rounded to the nearest whole number except for the estimated full-year 2017 gross profit margin.
The Company's strategy is to grow its building material product offerings and geographic sales footprint so it is not so heavily dependent on North America housing starts. It is focused on expanding sales in wood products by introducing new products into markets it currently operates in or entering new geographic markets, such as countries in Europe. New wood products, such as fasteners, may be internally developed or acquired. The Company is also focused on growing its concrete products business in all segments it operates in and will also search for new acquisition opportunities, such as concrete repair. The Company's strategy is to grow into new markets and products while leveraging its strengths in engineering, sales and distribution, and strong brand name.
The Company designs, manufactures and sells building construction products that are of high quality and performance, easy to use and cost-effective for customers. It operates in three business segments determined by geographic region; North America, Europe and Asia/Pacific. See "Note 14 — Segment Information."
|
•
|
The North America segment sells both wood and concrete construction products and has been highly dependent on housing starts. The Company has made efforts to be less dependent on new housing construction by expanding its line of concrete construction products. North America concrete construction product net sales increased 22% in
2016
from
2014
net sales, primarily due to improved economic conditions, partly offset by the negative effects of foreign currency translation. To improve operating efficiencies, during the third quarter of 2016, the Company initiated a multi-year plan to increase its North America connector factory production efficiency, aiming to achieve a 75% factory utilization rate on two full shifts by moving high-volume wood connector production from both its San Bernardino County and Western Canada facilities to its other major manufacturing locations in North America. As of December 31, 2016, the Company had relocated 60% of the high-volume connector production and 45% of the related product dies, which is ahead of schedule. Once the transition is completed, based on current information and subject to future events and circumstances, the Company estimates this consolidation will save approximately $3.0 million per year, mostly in production costs. Both the San Bernardino County and Western Canada locations will continue as sales and distribution locations, and maintain the capability to manufacture custom orders to continue to meet the Company's service and product availability commitments to customers in the Southwestern region of the United States and Western region of Canada.
|
|
•
|
The Europe segment also sells both wood and concrete construction products and until recently relied primarily on wood construction products. Europe concrete construction product net sales increased 11% in
2016
from
2014
net sales, primarily due to improved economic conditions and expanded sales activities into new countries, partly offset by the negative effects of foreign currency translation as the result of a generally strengthening United States dollar. In January 2017, to increase fastener product offerings, the Company acquired Gbo Fastening Systems AB ("Gbo Fastening Systems") for approximately $10.2 million. Based on preliminary unaudited information received from Gbo Fastening Systems’ management, the Company currently believes that for the fiscal year ended December 31, 2016, Gbo Fastening Systems had approximately $42.6 million in net sales. Based on current information and subject to future events and circumstances, the Company estimates that 2017 integration expenses related to Gbo Fastening Systems will be approximately $1 million to $2 million. See "Note 15 — Subsequent Events" to the Company's Consolidated Financial Statements.
|
|
•
|
The Asia/Pacific segment also sells both wood and concrete construction products. The Company has closed its sales offices located in China, Thailand and Dubai, as well as eliminated its selling activities in Hong Kong, due to continued losses in the regions. As a result, concrete construction product net sales decreased over 82% in
2016
from
2014
while wood construction product net sales increased 10% in
2016
from
2014
. The Company believes that the Asia/Pacific segment is not significant to the Company's overall performance.
|
|
•
|
Based on current information and subject to future events and circumstances, the Company estimates that its full-year 2017 gross profit margin will be between approximately 46.5% and 47.5%.
|
27
|
•
|
Based on current information and subject to future events and circumstances, the Company currently anticipates that it is possible for the market price of steel to rise during the first quarter of 2017.
|
|
•
|
Based on current information and subject to future events and circumstances, the Company estimates that its full-year 2017 effective tax rate will be between 36% and 37%.
|
The Company continues to invest in its strategic initiatives, such as expanding its offering of concrete construction products (including specialty chemicals), wood construction products (particularly its truss plate and fasteners) and software solutions. In support of these initiatives, the Company expects to commit resources to improve and increase manufacturing capabilities and is prepared to invest resources to acquire products or businesses that meet the Company's goals, such as the recent acquisitions of Gbo Fastening Systems AB ("Gbo Fastening Systems") and CG Visions, Inc. ("CG Visions"). In addition, the Company also expects to continue to invest time and resources in its stockholder engagement and other board-driven initiatives, including harmonizing its corporate governance and executive compensation to reflect current best practices and latest developments.
In January 2017, the Company acquired Gbo Fastening Systems for approximately $10.2 million. Gbo Fastening Systems is headquartered in Gunnebo, Sweden, with fastener production and surface treatment capabilities in Sweden and Poland. Gbo Fastening Systems has over 200 employees located in Sweden, Poland, Norway and Romania. Gbo Fastening Systems manufactures and sells a complete line of European approved CE-marked structural fasteners and provides unique fastener dimensioning software for wood construction applications, mostly in northern and eastern Europe, which the Company expects to eventually distribute and sell in western Europe. The Company also expects that the acquisition will enable the Company to develop and expand distribution into northern Europe its wood construction products manufactured in the Company's manufacturing facilities in western Europe. Further, the Company expects to access Gbo Fastening Systems' expertise in product development and testing, and proficiency in fastener manufacturing, surface treatment and painting, to strengthen Gbo Fastening Systems' global presence and contribute engineering expertise in automatic fastening systems and fastener collation to help Gbo Fastening Systems broaden both its fastener and structural connectors lines.
Based on preliminary unaudited information received from Gbo Fastening Systems’ management, the Company currently believes that for the fiscal year ended December 31, 2016, Gbo Fastening Systems had approximately $42.6 million in net sales and $0.8 million in income from operations before interest, non-recurring expenses and income taxes. Based on such information, and subject to future events and circumstances, the Company believes it is reasonable to expect that the annual return on investment with respect Gbo Fastening Systems will exceed its cost of capital within 4 to 5 years, although the Company will incur integration expenses that are expected to result in operating losses during the next 2 years.
In January 2017, the Company acquired CG Visions, Inc. ("CG Visions") for up to approximately $21.5 million, including an earn-out of $2.15 million subject to meeting sales targets, and subject to specified holdback provisions and post-closing adjustment. CG Visions was founded in 2000 in Lafayette, Indiana, to bring new ideas and experience in the digital media and construction fields. CG Visions provides its scalable technologies and services to a number of the top 100 mid-sized to large builders in the United States of America. This acquisition is expected to enable the Company to build closer partnerships with builders by offering software and services to help them control costs and increase efficiency at all stages of the home building process. The Company expects to look for opportunities to incorporate its products into CG Visions' building information modeling ("BIM") packages and apply CG Visions’ expertise to the Company's existing and future software initiatives.
Based on preliminary unaudited information received from CG Visions’ management team, the Company currently believes that for the fiscal year ended December 31, 2016, CG Visions had approximately $5.9 million in net sales and $1.2 million in income from operations before interest and income taxes. Based on such information, and subject to future events and circumstances, the Company believes that it is reasonable to expect that the annual return on investment with respect to the Company’s investment in CG Visions will exceed its cost of capital within 4 to 5 years.
While we believe that the unaudited third-party information in connection with our recent acquisitions provides investors with useful information about the financial performance of our acquisition targets and allow for greater transparency with respect to information relied on by our management in evaluating and executing such acquisitions, investors are cautioned that there are material limitations associated with the use of such unaudited information as an analytical tool. For example, these measures may be different from financial measures used by the Company and/or other companies, limiting their usefulness for comparison purposes.
In July 2016, the Company's Board of Directors approved a plan to replace the Company's current in-house enterprise resource planning ("ERP") and accounting platforms with a fully integrated ERP platform from SAP America, Inc. ("SAP"). Management plans to replace the current platforms in multiple phases over a period of three to four years, minimize project scope expansion and focus on configuring, instead of customizing, the standard SAP modules with an emphasis on creating a global template that will accommodate all Company product lines and market segments. Based on current information and subject to future events and
28
circumstances, management estimates that the new platform will cost approximately $30 million, including capital expenditures, which will increase annual operating expenses during the implementation phase from 2017 to 2019. When fully implemented, however, the Company anticipates that the new platform could result in annual savings approximately equal to 1% of net sales from improved production scheduling and inventory management, as well as lower labor, administrative and compliance costs.
The Company generally manufactures products and incurs costs in the areas where sales occur. Therefore, for each of the Company’s foreign operations the local currency is the functional currency and each foreign operation transacts primarily in its functional currency. The Company does not currently have or plan to enter into foreign currency contracts to hedge its exposure to foreign exchange rates.
The Administrative & All Other segment primarily includes expenses such as self-insured workers compensation claims costs for employees of the Company’s venting business, which was sold in 2010, stock-based compensation for certain members of management, interest expense, foreign exchange gains or losses and income tax expense, as well as income and expenses related to real estate activities, such as rental income and depreciation expense on the Company’s facility in Vacaville, California, which the Company has leased to a third party for a 10-year term expiring in August 2020.
Unlike lumber or other products that have a more direct correlation to housing starts, the Company’s products are used to a greater
extent in areas that are subject to natural forces, such as seismic or wind events. The Company’s products are used in a sequential process that follows the construction process. Residential and commercial construction begins with the foundation, followed by the wall and the roof systems, and the installation of the Company’s products flow into a project or a house according to these schedules. Foundation product sales could be considered a leading indicator for the Company. Sales of these products in the fourth
quarter of 2016 increased compared to the same period in 2015.
The Company’s sales also tend to be seasonal, with operating results varying from quarter to quarter. With some exceptions, the
Company’s sales and income have historically been lower in the first and fourth quarters than in the second and third quarters of
the year, as customers purchase construction materials in the late spring and summer months for the construction season. In addition,
weather conditions, such as extended wet or cold weather in any region of North America or Europe, which affect and sometimes delay installation of some of the Company’s products, could negatively affect the Company’s net sales and results of operations. Political and economic events can also affect the Company’s sales and profitability. See "Item 1A — Risk Factors."
Results of Operations
The following table sets forth, for the years indicated, the Company's operating results as a percentage of net sales for the years ended December 31, 2016, 2015 and 2014, respectively:
|
|
Years Ended December 31,
|
|||||||
|
|
2016
|
2015
|
2014
|
|||||
|
Net sales
|
100.0
|
%
|
100.0
|
%
|
100.0
|
%
|
||
|
Cost of sales
|
52.1
|
%
|
54.8
|
%
|
54.5
|
%
|
||
|
Gross profit
|
47.9
|
%
|
45.2
|
%
|
45.5
|
%
|
||
|
Research and development and other engineering
|
5.4
|
%
|
5.8
|
%
|
5.2
|
%
|
||
|
Selling expense
|
11.4
|
%
|
11.4
|
%
|
12.2
|
%
|
||
|
General and administrative expense
|
15.0
|
%
|
14.3
|
%
|
14.8
|
%
|
||
|
Impairment of goodwill
|
—
|
%
|
—
|
%
|
0.1
|
%
|
||
|
Net loss on disposal of assets
|
(0.1
|
)%
|
—
|
%
|
—
|
%
|
||
|
Income from operations
|
16.2
|
%
|
13.7
|
%
|
13.2
|
%
|
||
|
Interest income (expense), net
|
(0.1
|
)%
|
—
|
%
|
—
|
%
|
||
|
Income before taxes
|
16.1
|
%
|
13.7
|
%
|
13.2
|
%
|
||
|
Provision for income taxes
|
5.7
|
%
|
5.1
|
%
|
4.8
|
%
|
||
|
Net income
|
10.4
|
%
|
8.6
|
%
|
8.4
|
%
|
||
29
2014
to
2016
Financial Highlights
To avoid fractional percentages, all percentages presented below in this "
2014 to 2016 Financial Highlights
" section were rounded to the nearest whole number except for the 2016 and 2014 operating expenses as a percentage of 2016 and 2014 net sales, respectively.
From
2014
to
2016
, net sales increased to
$860.7 million
from
$752.1 million
. The Company had net income of
$89.7 million
for
2016
compared to net income of
$63.5 million
for
2014
. Diluted net income per common share was
$1.86
for
2016
compared to
$1.29
for
2014
. Income from operations increased 40% to
$139.5 million
in
2016
from
$99.3 million
in
2014
.
Net sales
Net sales increased to
$860.7 million
in
2016
from
$752.1 million
in
2014
, reflecting improved economic conditions in North America.
|
•
|
Segment net sales:
|
|
◦
|
North America — Net sales increased to
$742.0 million
in
2016
from
$613.8 million
in
2014
. Canada net sales decreased due to the effects of foreign currency translation of approximately $7 million. In the local currency, Canada's net sales increased in 2016 compared to 2014. The net sales increases in North America were mostly due to increases in unit sales volume in both concrete construction and wood products from increased building activity, partly offset by a slight decrease in average sales prices.
|
|
◦
|
Europe — Net sales decreased to
$111.3 million
in
2016
from
$123.2 million
in
2014
, primarily due to the effects of foreign currency translation. Net sales in Europe were negatively affected by approximately $22 million due to European currencies weakening against the United States dollar. In local currencies, Europe's overall net sales increased in 2016 compared to 2014, primarily due to increases in unit sales volume from expanding concrete construction products net sales into Denmark and Sweden, as well as the August 2016 acquisition of MS Decoupe (see "Note 2 — Acquisitions" to the Company's Consolidated Financial Statements), partly offset by a slight decrease in average sales prices.
|
|
◦
|
Asia/Pacific — Net sales decreased to
$7.4 million
in
2016
from
$15.1 million
in
2014
, due to the closing of sales offices in China, Thailand and Dubai in the first quarter of 2015, which accounted for an approximately $10 million decrease in net sales. Excluding net sales from the closed sales offices, Asia/Pacific net sales increased $1.9 million, net of the negative effects of foreign currency translation of approximately $1.4 million.
|
|
•
|
Consolidated net sales channels and product groups:
|
|
◦
|
Net sales to contractor distributors, lumber dealers and dealer distributors increased significantly in
2016
compared to
2014
due to increased construction activity.
|
|
◦
|
Wood construction product net sales, including connectors, truss plates, fastening systems, fasteners and shearwalls, increased 15% to
$732.4 million
in
2016
from
$636.0 million
in
2014
, primarily due to increased unit sales volumes on improved economic conditions, partly offset by the negative effects of foreign currency translation.
|
|
◦
|
Concrete construction product sales, including adhesives, chemicals, mechanical anchors, powder actuated tools and reinforcing fiber materials, increased 11% to
$128.2 million
in 2016 from
$115.9 million
in 2014, primarily due to increased unit sales volumes on improved economic conditions, partly offset a decrease of $8.7 million in net sales from the closure of sales offices located in China, Thailand and Dubai, as well as the negative effects of foreign currency translation.
|
Gross profit
Gross profit margin increased to
48%
in
2016
from
46%
in
2014
.
|
•
|
North America — Gross profit margin increased to 49% from 46%, primarily as a result of a decrease in material costs, as a percentage of net sales.
|
|
•
|
Europe — Gross profit margin increased to 40% from 38%, primarily as a as a result of decreases in material costs and factory overhead costs, as a percentage of net sales.
|
|
•
|
Product group — The gross profit margins, including some inter-segment expenses, that are eliminated in consolidation, and excluding other expenses not allocated according to product group, increased to 49% from 46% for wood construction products and increased to 35% from 34% for concrete construction products.
|
30
Operating expenses
Operating expenses increased in dollar amounts, but decreased as a percentage of net sales, and were
$273.0 million
, or
31.7%
of net sales, in
2016
, compared to
$242.8 million
, or
32.3%
of net sales, in
2014
. The increase in operating expenses was primarily due to increased cash profit sharing expense related to increased operating profits, costs in support of new products lines, which included increased personnel costs, mostly related to the addition of staff, increased legal and professional fees, primarily related to acquisition activities, stockholder engagement and board initiatives, such as changes to executive compensation, and corporate governance, write-off of a software development project, and computer and information technology expense related to upgrading and supporting information technology systems.
Comparison of the Years Ended
December 31, 2016
and
2015
Unless otherwise stated, the results announced below, in this
"Comparison of the Years Ended December 31, 2016 and 2015"
section, when providing comparisons (which are generally indicated by words such as “increased,” “decreased,” "remained" or “compared to”), compare the results of operations for the year ended
December 31, 2016
, against the results of operations for the year ended
December 31, 2015
.
To avoid fractional percentages, all percentages presented below in this section were rounded to the nearest whole number.
Net sales increased 8% to $860.7 million from $794.1 million. The Company had net income of $89.7 million compared to $67.9 million. Diluted net income per common share was $1.86 compared to $1.38. Income from operations increased 28% to $139. 5 million from $109.0 million.
The following table shows the change in the Company’s operations from
2015
to
2016
, and the increases or decreases for each category by segment:
|
|
|
Increase (Decrease) in Operating Segment
|
|
||||||||||||||||||||
|
|
|
North America
|
|
Asia/
Pacific
|
Admin &
All Other
|
|
|||||||||||||||||
|
(in thousands)
|
2015
|
Europe
|
2016
|
||||||||||||||||||||
|
Net sales
|
$
|
794,059
|
|
$
|
65,403
|
|
$
|
3,206
|
|
$
|
(2,007
|
)
|
$
|
—
|
|
$
|
860,661
|
|
|||||
|
Cost of sales
|
435,140
|
|
17,273
|
|
680
|
|
(4,174
|
)
|
(708
|
)
|
448,211
|
|
|||||||||||
|
Gross profit
|
358,919
|
|
48,130
|
|
2,526
|
|
2,167
|
|
708
|
|
412,450
|
|
|||||||||||
|
Research and development and other engineering expense
|
46,196
|
|
(33
|
)
|
191
|
|
(90
|
)
|
(16
|
)
|
46,248
|
|
|||||||||||
|
Selling expense
|
90,663
|
|
6,370
|
|
1,920
|
|
(563
|
)
|
(47
|
)
|
98,343
|
|
|||||||||||
|
General and administrative expense
|
113,428
|
|
14,622
|
|
3,337
|
|
(3,027
|
)
|
802
|
|
129,162
|
|
|||||||||||
|
Impairment of goodwill
|
—
|
|
—
|
|
—
|
|
—
|
|
—
|
|
—
|
|
|||||||||||
|
Gain on sale of assets
|
(389
|
)
|
(695
|
)
|
(24
|
)
|
263
|
|
65
|
|
(780
|
)
|
|||||||||||
|
Income from operations
|
109,021
|
|
27,866
|
|
(2,898
|
)
|
5,584
|
|
(96
|
)
|
139,477
|
|
|||||||||||
|
Interest income (expense), net
|
(342
|
)
|
(79
|
)
|
(256
|
)
|
(96
|
)
|
196
|
|
(577
|
)
|
|||||||||||
|
Income before income taxes
|
108,679
|
|
27,787
|
|
(3,154
|
)
|
5,488
|
|
100
|
|
138,900
|
|
|||||||||||
|
Provision for income taxes
|
40,791
|
|
8,547
|
|
(264
|
)
|
140
|
|
(48
|
)
|
49,166
|
|
|||||||||||
|
Net income
|
$
|
67,888
|
|
$
|
19,240
|
|
$
|
(2,890
|
)
|
$
|
5,348
|
|
$
|
148
|
|
$
|
89,734
|
|
|||||
Net Sales
The following table shows net sales by segment for the years ended
December 31, 2015
and
2016
, respectively:
|
(in thousands)
|
North
America
|
Europe
|
Asia/
Pacific
|
Total
|
|||||||||||
|
December 31, 2015
|
$
|
676,618
|
|
$
|
108,068
|
|
$
|
9,373
|
|
$
|
794,059
|
|
|||
|
December 31, 2016
|
742,021
|
|
111,274
|
|
7,366
|
|
860,661
|
|
|||||||
|
Increase (decrease)
|
$
|
65,403
|
|
$
|
3,206
|
|
$
|
(2,007
|
)
|
$
|
66,602
|
|
|||
|
Percentage increase (decrease)
|
10
|
%
|
3
|
%
|
(21
|
)%
|
8
|
%
|
|||||||
31
The following table shows segment net sales as percentages of total net sales for the years ended
December 31, 2015
and
2016
, respectively:
|
North
America
|
Europe
|
Asia/
Pacific
|
Total
|
||||||||
|
Percentage of total 2015 net sales
|
85
|
%
|
14
|
%
|
1
|
%
|
100
|
%
|
|||
|
Percentage of total 2016 net sales
|
86
|
%
|
13
|
%
|
1
|
%
|
100
|
%
|
|||
|
•
|
Segment net sales:
|
|
•
|
North America
—
Net sales increased 10%, mostly due to increased unit sales volumes on improved economic activity as well as a slight increase in average net sales unit prices in both the United States and Canada. Canada's net sales were negatively affected by approximately $1.2 million in foreign currency translation, due to the weakening of the Canadian dollar against the United States dollar.
|
|
•
|
Europe
—
Net sales increased 3%, mostly due to increased unit sales volumes, partly offset by a decrease in average net sales unit prices. Europe's net sales were negatively affected by approximately $3.1 million primarily due to the weakening of the British pound against the United States dollar.
|
|
•
|
Asia/Pacific
—
Net sales decreased 21%, primarily due to the effects of the closing of sales offices in China, Thailand and Dubai late in the first quarter of 2015, which accounted for an approximately $4.1 million decrease in net sales.
|
|
•
|
Consolidated net sales channels and product groups:
|
|
•
|
Net sales to dealer distributors, lumber dealers, contractor distributors and home centers increased, primarily due to increased construction activity.
|
|
•
|
Wood construction product net sales, including sales of connectors, truss plates, fastening systems, fasteners and shearwalls, represented 85% of the Company's total net sales in both 2016 and 2015.
|
|
•
|
Concrete construction product net sales, including sales of adhesives, chemicals, mechanical anchors, powder actuated tools and reinforcing fiber materials, represented 15% of the Company's total net sales in both 2016 and 2015.
|
Gross Profit
The following table shows gross profit by segment for the years ended
December 31, 2015
and
2016
, respectively:
|
(in thousands)
|
North
America
|
Europe
|
Asia/
Pacific
|
Admin &
All Other
|
Total
|
||||||||||||||
|
December 31, 2015
|
$
|
317,628
|
|
$
|
41,512
|
|
$
|
251
|
|
$
|
(472
|
)
|
$
|
358,919
|
|
||||
|
December 31, 2016
|
365,758
|
|
44,038
|
|
2,419
|
|
235
|
|
412,450
|
|
|||||||||
|
Increase
|
$
|
48,130
|
|
$
|
2,526
|
|
$
|
2,168
|
|
$
|
707
|
|
$
|
53,531
|
|
||||
|
Percentage increase
|
15
|
%
|
6
|
%
|
864
|
%
|
N/M
|
|
15
|
%
|
|||||||||
The following table shows gross profit percentages by segment for the years ended
December 31, 2015
and
2016
, respectively:
|
North
America
|
Europe
|
Asia/
Pacific
|
Admin &
All Other
|
Total
|
|||||||||
|
2015 gross profit percentage
|
47
|
%
|
38
|
%
|
3
|
%
|
NM
|
45
|
%
|
||||
|
2016 gross profit percentage
|
49
|
%
|
40
|
%
|
33
|
%
|
NM
|
48
|
%
|
||||
Gross profit increased to $412.5 million from $358.9 million. Gross profit as a percentage of net sales increased to 48% from 45%.
|
•
|
North America
—
Gross profit margin increased to 49% from 47%, primarily as a result of a decrease in material costs, each as a percentage of sales and an increase in average net sales unit price.
|
|
•
|
Europe
—
Gross profit margin increased to 40% from 38%, primarily as a result of decreases in material costs and factory overhead costs, each as a percentage of sales.
|
32
|
•
|
Product group
—
The gross profit margins, including some inter-segment expenses, that are eliminated in consolidation, and excluding other expenses not allocated according to product group, increased to 49% from 47% for wood construction products and increased to 35% from 31% for concrete construction products.
|
Research and development and engineering expense
Research and development and engineering expense was $46.2 million in both 2016 and 2015, primarily due to increases of $2.3 million in cash profit sharing expense on increased profits, $0.7 million in personnel costs, $0.5 million in supply costs, $0.4 million in computer costs and $0.1 in stock-based compensation, offset by decreases of $4.2 million write-offs of software development projects, most of which occurred in the North America segment.
Selling expense
Selling
expense increased 8% to $98.3 million from $90.7 million, primarily due to increases of $5.0 million in personnel costs, $2.6 million in cash profit sharing expense on increased profits, and $0.5 million in advertising expense, partly offset by a decrease of $0.8 million in professional fees.
|
•
|
North America
—
Selling expense increased $6.4 million, primarily due to increases of $4.4 million in personnel costs, mostly related to the addition of staff and pay rate increases instituted on January 1, 2016, $2.3 million in cash profit sharing expense and $0.5 million in advertising expense, partly offset by a decrease of $1.0 million in professional fees.
|
|
•
|
Europe
—
Selling expense increased $1.9 million, primarily due to increases of $1.2 million in personnel costs, mostly related to the addition of staff, and $0.2 million in cash profit sharing expense.
|
|
•
|
Asia/Pacific
—
Selling expense decreased $0.6 million, primarily due to a decrease of $0.6 million in personnel costs related to closing three sales offices and downsizing one sales office in 2015.
|
General and administrative expense
General and administrative
expense increased 14% to $129.2 million from $113.4 million, primarily due to increases of $5.4 million in cash profit sharing expense on increased profits, $4.0 million in legal and professional fees, primarily related to acquisition activities, stockholder engagement and board initiatives, such as changes to executive compensation and corporate governance, $2.2 million in stock-based compensation, $1.8 million in computer and information technology expense, $1.1 million in personnel costs, and $0.4 million in contingent compensation related to prior acquisitions made in Europe, as well as a $0.9 million increase in net foreign currency losses, partly offset by decreases of $0.6 million in bad debt reserve and $0.1 million in facility rent and maintenance expense.
|
•
|
North America
—
General and administrative
expense increased $14.6 million, primarily due to increases of $4.9 million in cash profit sharing expense, $2.5 million in legal and professional fees, $2.3 million in personnel costs, $1.8 million in computer and information technology expense, $1.1 million in stock-based compensation, and $0.5 million in facility rent and maintenance expense, as well as a $0.9 million increase in net foreign currency losses, partly offset by a decrease of $0.4 million in bad debt reserve.
|
|
•
|
Europe
—
General and administrative
expense increased $3.3 million, primarily due to increases of $1.6 million in legal and professional fees related to acquisition activities, $0.6 million in personnel costs, and $0.4 million in contingent compensation related to prior acquisitions, partly offset by a decrease of $0.2 million in stock-based compensation and $0.2 million in bad debt reserves.
|
|
•
|
Asia/Pacific
—
General and administrative
expense decreased $3.0 million, primarily due to decreases of $1.7 million in personnel costs, $0.6 million in facility rent and maintenance expense and $0.2 million in legal and professional fees, each related to the sales office closures in 2015.
|
|
•
|
Administrative and All Other
—
General and administrative
expense increased, primarily due to increases of $1.3 million in stock-based compensation and $0.4 million in cash profit sharing expense.
|
Income taxes
The Company's effective income tax rate decreased to 35% from 38%, primarily due to reduced operating losses in the Asia/Pacific segment, for which no tax benefit was recorded.
33
Comparison of the Years Ended
December 31, 2015
and
2014
Unless otherwise stated, the results announced below, in this
"Comparison of the Years Ended December 31, 2015 and 2014"
section, when providing comparisons (which are generally indicated by words such as “increased,” “decreased,” "remained" or “compared to”), compare the results of operations for the year ended
December 31, 2015
, against the results of operations for the year ended
December 31, 2014
.
To avoid fractional percentages, all percentages presented below in this section were rounded to the nearest whole number except for the 2015 and 2014 gross profit margins (including segment gross profit margins) as a percentage of 2015 and 2014 net sales, respectively, as well as their comparisons.
Net sales increased
6%
to $794.1 million from $752.1 million. The Company had net income of $67.9 million compared to $63.5 million. Diluted net income per common share was $1.38 compared to $1.29. An out-of-period adjustment recorded during 2014 relating to a non-recurring correction had the effect of increasing net income by $1.3 million, or the equivalent of $0.026 per share (see "Note 1 — Out-of-Period Adjustment" to the Company's Consolidated Financial Statements). Income from operations increased
10%
to $109.0 million from $99.3 million.
The following table shows the change in the Company’s operations from
2014
to
2015
, and the increases or decreases for each category by segment.
|
|
|
Increase (Decrease) in Operating Segment
|
|
||||||||||||||||||||
|
|
|
North America
|
|
Asia/
Pacific
|
Admin &
All Other
|
|
|||||||||||||||||
|
(in thousands)
|
2014
|
Europe
|
2015
|
||||||||||||||||||||
|
Net sales
|
$
|
752,148
|
|
$
|
62,775
|
|
$
|
(15,109
|
)
|
$
|
(5,755
|
)
|
$
|
—
|
|
$
|
794,059
|
|
|||||
|
Cost of sales
|
410,118
|
|
36,263
|
|
(9,656
|
)
|
(2,354
|
)
|
769
|
|
435,140
|
|
|||||||||||
|
Gross profit
|
342,030
|
|
26,512
|
|
(5,453
|
)
|
(3,401
|
)
|
(769
|
)
|
358,919
|
|
|||||||||||
|
Research and development and other engineering expense
|
39,018
|
|
7,966
|
|
(570
|
)
|
(316
|
)
|
98
|
|
46,196
|
|
|||||||||||
|
Selling expense
|
92,031
|
|
898
|
|
(941
|
)
|
(1,307
|
)
|
(18
|
)
|
90,663
|
|
|||||||||||
|
General and administrative expense
|
111,500
|
|
2,847
|
|
(2,125
|
)
|
331
|
|
875
|
|
113,428
|
|
|||||||||||
|
Impairment of goodwill
|
530
|
|
—
|
|
(530
|
)
|
—
|
|
—
|
|
—
|
|
|||||||||||
|
Gain on sale of assets
|
(325
|
)
|
243
|
|
(77
|
)
|
(230
|
)
|
—
|
|
(389
|
)
|
|||||||||||
|
Income from operations
|
99,276
|
|
14,558
|
|
(1,210
|
)
|
(1,879
|
)
|
(1,724
|
)
|
109,021
|
|
|||||||||||
|
Interest income (expense), net
|
46
|
|
5
|
|
(234
|
)
|
(18
|
)
|
(141
|
)
|
(342
|
)
|
|||||||||||
|
Income before income taxes
|
99,322
|
|
14,563
|
|
(1,444
|
)
|
(1,897
|
)
|
(1,865
|
)
|
108,679
|
|
|||||||||||
|
Provision for income taxes
|
35,791
|
|
6,713
|
|
(745
|
)
|
(302
|
)
|
(666
|
)
|
40,791
|
|
|||||||||||
|
Net income
|
$
|
63,531
|
|
$
|
7,850
|
|
$
|
(699
|
)
|
$
|
(1,595
|
)
|
$
|
(1,199
|
)
|
$
|
67,888
|
|
|||||
Net Sales
The following table shows net sales by segment for the years ended December 31,
2014
and
2015
, respectively:
|
(in thousands)
|
North
America
|
Europe
|
Asia/
Pacific
|
Total
|
|||||||||||
|
December 31, 2014
|
$
|
613,843
|
|
$
|
123,177
|
|
$
|
15,128
|
|
$
|
752,148
|
|
|||
|
December 31, 2015
|
676,618
|
|
108,068
|
|
9,373
|
|
794,059
|
|
|||||||
|
Increase (decrease)
|
$
|
62,775
|
|
$
|
(15,109
|
)
|
$
|
(5,755
|
)
|
$
|
41,911
|
|
|||
|
Percentage increase (decrease)
|
10
|
%
|
(12
|
)%
|
(38
|
)%
|
6
|
%
|
|||||||
34
The following table shows segment net sales as percentages of total net sales for the years ended December 31,
2014
and
2015
, respectively:
|
North
America
|
Europe
|
Asia/
Pacific
|
Total
|
||||||||
|
Percentage of total 2014 net sales
|
82
|
%
|
16
|
%
|
2
|
%
|
100
|
%
|
|||
|
Percentage of total 2015 net sales
|
85
|
%
|
14
|
%
|
1
|
%
|
100
|
%
|
|||
|
•
|
Segment net sales:
|
|
•
|
North America
—
Net sales increased
10%
, primarily due to increased unit sales volumes in the United States on improved economic activity, partly offset by a slight decrease in average sales prices. Canadian net sales decreased, mostly due to the effects of foreign currency translation, partly offset by an increase in unit sales volumes. Canada's 2015 net sales were negatively affected by approximately $5.6 million due to the Canadian dollar weakening against the United States dollar. In Canadian dollars, Canada's overall net sales increased slightly in 2015.
|
|
•
|
Europe
—
Net sales decreased
12%
, mostly due to the effects of foreign currency translations. Europe's 2015 net sales were negatively affected by approximately $17.6 million due to European currencies weakening against the United States dollar. In local currencies, Europe's overall net sales increased slightly in 2015.
|
|
•
|
Asia/Pacific
—
Net sales decreased
38%
, primarily due to the closing of sales offices in China, Thailand and Dubai, which accounted for approximately $5.6 million of the decreases in net sales. Foreign currency translations due to the weakening of the respective currencies against the United States dollar negatively affected net sales by approximately $0.6 million.
|
|
•
|
Consolidated net sales channels and product groups:
|
|
•
|
Net sales to contractor distributors, dealer distributors, home centers and lumber dealers increased in 2015, primarily due to increased home construction activity.
|
|
•
|
Wood construction product net sales, including connectors, truss plates, fastening systems, fasteners and shearwalls, represented 85% of our total net sales in both 2015 and 2014.
|
|
•
|
Concrete construction product sales, including adhesives, chemicals, mechanical anchors, powder actuated tools and reinforcing fiber materials, represented 15% of our total net sales in both 2015 and 2014.
|
Gross Profit
The following table shows gross profit by segment for the years ended
December 31, 2014
and 2015, respectively:
|
(in thousands)
|
North
America
|
Europe
|
Asia/
Pacific
|
Admin &
All Other
|
Total
|
||||||||||||||
|
December 31, 2014
|
$
|
291,116
|
|
$
|
46,965
|
|
$
|
3,652
|
|
$
|
297
|
|
$
|
342,030
|
|
||||
|
December 31, 2015
|
317,628
|
|
41,512
|
|
251
|
|
(472
|
)
|
358,919
|
|
|||||||||
|
Increase (decrease)
|
$
|
26,512
|
|
$
|
(5,453
|
)
|
$
|
(3,401
|
)
|
$
|
(769
|
)
|
$
|
16,889
|
|
||||
|
Percentage increase (decrease)
|
9
|
%
|
(12
|
)%
|
(93
|
)%
|
N/M
|
|
5
|
%
|
|||||||||
The following table shows gross profit percentages by segment for the years ended December 31,
2014
and
2015
, respectively:
|
North
America
|
Europe
|
Asia/
Pacific
|
Admin &
All Other
|
Total
|
|||||||||
|
2014 gross profit percentage
|
47.4
|
%
|
38.1
|
%
|
24.1
|
%
|
NM
|
45.5
|
%
|
||||
|
2015 gross profit percentage
|
46.9
|
%
|
38.4
|
%
|
2.7
|
%
|
NM
|
45.2
|
%
|
||||
Gross profit increased to $358.9 million from $342.0 million. Gross profit margin as a percentage of net sales decreased to
45.2%
from
45.5%
, partly due to a non-recurring $2.5 million correction to workers' compensation expense in the North America segment that increased the Company's 2014 gross profit margin by 0.3% of net sales and increases in material costs.
|
•
|
North America
—
Gross profit margin decreased to
46.9%
from
47.4%
, primarily as a result of increases in material costs, as a percentage of net sales, partly offset by slight decreases in factory overhead cost and shipping cost, each as a percentage of sales. Factory overhead cost, as a percentage of net sales, in 2014 was affected by a non-recurring $2.5 million correction
|
35
to workers' compensation expense that increased the 2014 gross profit margin by 0.4%. Factory overhead, as a percentage of net sales, in 2015 was reduced by a non-recurring settlement of a union-based defined-benefit pension withdrawal liability that increased gross profit margin by 0.1% as compared to 2014 when an atypical non-recurring $3.3 million pension charge resulted from the Company's withdrawal from a multiemployer union-based defined-benefit pension plan.
|
•
|
Europe
—
Gross profit margin increased by 0.3% as a result of decreases in material costs, factory overhead (on increased production volumes) and warehouse costs, each as a percentage of sales, partly offset by increases in the costs of labor and shipping, each also as a percentage of sales.
|
|
•
|
Product mix
—
The gross profit margins, including some inter-segment expenses, that are eliminated in consolidation, and excluding other expenses not allocated according to product group, increased to 47% from 46% for wood construction products and decreased to 31% from 34% for concrete construction products.
|
Research and development and engineering expense
Research and development and engineering expense increased
18%
to $46.2 million from $39.0 million, primarily due to $5.9 million in write-offs of software development projects, as well as increases of $2.0 million in personnel costs related to the addition of staff and pay rate increases instituted in January 2015 and $0.6 million in cash profit sharing expense on increased operating profits, partly offset by a decrease of $0.7 million in stock-based compensation costs, most of which occurred in the North America segment.
Selling expense
Selling
expense decreased
2%
to $90.7 million from $92.0 million, primarily due to decreases of $0.9 million in professional fees, $0.7 million in stock-based compensation and $0.6 million in advertising costs, partly offset by increases of $0.5 million in cash profit sharing and commission expense, $0.3 million in agent commission expense and $0.2 million in personnel costs related to the addition of staff and pay rate increases instituted in January 2015.
|
•
|
North America
—
Selling expense increased $0.9 million, primarily due to increases of $1.5 million in personnel costs and $1.1 million in cash profit sharing and commission expense, partly offset by decreases of $0.7 million in stock-based compensation, $0.7 million in professional fees and $0.4 million in advertising costs.
|
|
•
|
Europe
—
Selling
expense decreased by $0.9 million, primarily due to decreases of $1.1 million in personnel costs and $0.2 million in professional fees, partly offset by a $0.4 million increase in agent commission expense, primarily attributable to differences in exchange rates used for translating local currencies into United States dollars.
|
|
•
|
Asia/Pacific
—
Selling expense decreased $1.3 million, primarily due to decreases of $0.6 million in personnel costs and $0.5 million in cash profit sharing and sales commissions, both related to closing three sales offices and downsizing one sales office.
|
General and administrative expense
General and administrative
expense increased
2%
to $113.4 million from $111.5 million, primarily due to increases of $2.2 million in personnel costs related to the addition of staff and pay rate increases instituted in January 2015, $0.6 million in stock-based compensation expense, $0.4 million in bad debt expense and $0.1 million in cash profit sharing, partly offset by a decrease of $1.1 million in amortization expense.
|
•
|
North America
—
General and administrative
expense increased $2.8 million, primarily due to increases of $2.4 million in personnel costs, $0.3 million in cash profit sharing expense, $0.3 million in stock-based compensation costs and $0.2 million in bad debt expense, partly offset by a decrease of $0.7 million in amortization expense.
|
|
•
|
Europe
—
General and administrative
expense decreased by $2.1 million, primarily due to decreases of $1.1 million in personnel costs, $0.5 million in cash profit sharing and $0.3 million in intangible amortization expense, primarily attributable to differences in exchange rates used for translating local currencies into United States dollars.
|
|
•
|
Asia/Pacific
—
General and administrative expenses increased by $0.3 million, primarily due to increases of $0.4 million in personnel costs.
|
|
•
|
Administrative and Other
—
General and administrative
expense increased by $0.9 million, primarily due to increases of $0.4 million in personnel cost, $0.3 million in stock-based compensation expense and $0.2 million in cash profit sharing.
|
Income taxes
The effective income tax rate increased to
38%
from
36%
. The 2015 effective income tax rate was higher primarily due to the 2014 release of an uncertain tax position as well as a solar tax credit for installing solar panels at one of the Company's facilities, which were non-recurring.
36
Critical Accounting Policies and Estimates
The critical accounting policies described below affect the Company’s more significant judgments and estimates used in the preparation of the Company's Consolidated Financial Statements. If the Company’s business conditions change or if it uses different assumptions or estimates in the application of these and other accounting policies, the Company’s future results of operations could be adversely affected.
Inventory Valuation
Inventories are stated at the lower of cost or net realizable value (market). Cost includes all costs incurred in bringing each product to its present location and condition, as follows:
|
•
|
Raw materials and purchased finished goods — principally valued at cost determined on a weighted average basis: and
|
|
•
|
In-process products and finished goods — cost of direct materials and labor plus attributable overhead based on a normal level of activity.
|
The Company applies net realizable value and obsolescence to the gross value of inventory. The Company estimates net realizable value based on estimated selling price less further costs to completion and disposal. The Company impairs slow-moving products by comparing inventories on hand to projected demand. If on-hand supply of a product exceeds projected demand or if the Company believes the product is no longer marketable, the product is considered obsolete inventory. The Company revalues obsolete inventory to its net realizable value. The Company has consistently applied this methodology. The Company believes that this approach is prudent and makes suitable impairments for slow-moving and obsolete inventory. When impairments are established, a new cost basis of the inventory is created. Unexpected change in market demand, building codes or buyer preferences could reduce the rate of inventory turnover and require the Company to recognize more obsolete inventory.
Revenue Recognition
The Company recognizes revenue when the earnings process is complete, net of applicable provision for discounts, returns and incentives, whether actual or estimated, based on the Company’s experience. This generally occurs when products are shipped to the customer in accordance with the sales agreement or purchase order, ownership and risk of loss pass to the customer, collectability is reasonably assured and pricing is fixed or determinable. The Company’s general shipping terms are F.O.B. shipping point, where title is transferred and revenue is recognized when the products are shipped to customers. When the Company sells F.O.B. destination point, title is transferred and the Company recognizes revenue on delivery or customer acceptance, depending on terms of the sales agreement. Service sales, representing after-market repair and maintenance, engineering activities, software license sales and service and lease income, though significantly less than 1% of net sales and not material to the Consolidated Financial Statements, are recognized as the services are completed or the software products and services are delivered. If actual costs of sales returns, incentives and discounts were to significantly exceed the recorded estimated allowance, the Company’s sales would be adversely affected.
Business Combinations
The Company recognizes separately from goodwill the assets acquired and the liabilities assumed at their acquisition date fair values. Goodwill as of the acquisition date is measured as the excess of consideration transferred and the net of the acquisition date fair values of the assets acquired and the liabilities assumed. While the Company uses its best estimates and assumptions as a part of the purchase price allocation process to value assets acquired and liabilities assumed at the acquisition date, the Company’s estimates are inherently uncertain and subject to refinement. As a result, during the measurement period, which may be up to one year from the acquisition date, the Company records adjustments to the assets acquired and liabilities assumed, with the corresponding offset to goodwill. On the conclusion of the measurement period or final determination of the values of assets acquired or liabilities assumed, whichever comes first, the Company records subsequent adjustments, if any, to its consolidated statements of operations. None of the subsequent adjustments for the fiscal years ended
2014
,
2015
and
2016
were material.
Accounting for business combinations requires the Company’s management to make significant estimates and assumptions, especially at the acquisition date with respect to intangible assets. Although the Company believes that the assumptions and estimates it has made in the past have been reasonable and appropriate, they are based in part on historical experience and information obtained from the management of the acquired companies and are inherently uncertain.
37
Examples of critical estimates in valuing certain of the intangible assets that the Company has acquired include:
|
•
|
Future expected cash flows from customer relationships and acquired unpatented technologies and patents;
|
|
•
|
The acquired company’s brand and competitive position and assumptions about the period of time the acquired brand will continue to be used in the combined company’s product portfolio; and
|
|
•
|
Discount rates.
|
Unanticipated events and circumstances may affect the accuracy or validity of such assumptions, estimates or actual results.
For a given acquisition, the Company may identify pre-acquisition contingencies as of the acquisition date and may extend its review and evaluation of these pre-acquisition contingencies throughout the measurement period (up to one year from the acquisition date) to obtain sufficient information to assess whether the Company includes these contingencies as a part of the purchase price allocation and, if so, to determine their estimated amounts.
If the Company determines that a pre-acquisition contingency (that is not income-tax related) is probable and estimable as of the acquisition date, the Company records its best estimate for such a contingency as a part of the preliminary purchase price allocation. The Company often continues to gather information and evaluate its pre-acquisition contingencies throughout the measurement period. If the Company changes the amounts recorded or identifies additional pre-acquisition contingencies during the measurement period, such amounts are included in the purchase price allocation during the measurement period and, subsequently, in the Company’s results of operations.
In addition, the Company estimates uncertain tax positions and income tax related valuation allowances assumed in connection with a business combination initially as of the acquisition date. The Company reevaluates these items quarterly with any adjustments to its preliminary estimates being recorded to goodwill if the Company is within the measurement period. The Company continues to collect information to determine estimated values. Subsequent to the measurement period or the Company’s final determination of the uncertain tax positions estimated value or tax-related valuation allowances, whichever comes first, changes to these uncertain tax positions and tax-related valuation allowances will affect the Company’s provision for income taxes in its consolidated statement of operations and could have a material effect on the Company’s results of operations and financial position.
Goodwill Impairment Testing
The Company tests goodwill for impairment at the reporting unit level on an annual basis (in the fourth quarter for the Company). The Company also reviews goodwill for impairment whenever events or changes in circumstances indicate the carrying value of an asset may not be recoverable. These events or circumstances could include a significant change in the business climate, legal factors, operating performance indicators, competition, or disposition or relocation of a significant portion of a reporting unit.
The reporting unit level is generally one level below the operating segment, which is at the country level, except for the United States, Australia and S&P Clever reporting units.
The Company determined that the United States reporting unit includes four components: Northwest United States, Southwest United States, Northeast United States and Southeast United States (collectively, the “U.S. Components”). The Company aggregates the U.S. Components into a single reporting unit because management concluded that they are economically similar and that the goodwill is recoverable from the U.S. Components working in concert. The U.S. Components are economically similar because of a number of factors, including selling similar products to shared customers and sharing assets and services such as intellectual property, manufacturing assets for certain products, research and development projects, manufacturing processes, management of inventory excesses and shortages and administrative services. These activities are managed centrally at the U.S. Components level and costs are allocated among the four U.S. Components.
The Company determined that the Australia reporting unit includes four components: Australia, New Zealand, South Africa and United Arab Emirates (collectively, the “AU Components”). The Company aggregates the AU Components into a single reporting unit because management concluded that they are economically similar and that the goodwill is recoverable from the AU Components working in concert. The AU Components are economically similar because of a number of factors, including that New Zealand, South Africa and United Arab Emirates operate as extensions of their Australian parent company selling similar products and sharing assets and services such as intellectual property, manufacturing assets for certain products, management of inventory excesses and shortages and administrative services. These activities are managed centrally at the AU Components level and costs are allocated among the AU Components.
The Company determined that the S&P Clever reporting unit includes eight components: S&P Switzerland, S&P Poland, S&P Austria, S&P The Netherlands, S&P Portugal, S&P Germany, S&P France and S&P Nordic (collectively, the "S&P Components”).
38
The Company aggregates the S&P Components into a single reporting unit because management concluded that they are economically similar and that the goodwill is recoverable from the S&P Components working in concert. The S&P Components are economically similar because of a number of factors, including sharing assets and services such as intellectual property, manufacturing assets for certain products, research and development projects, manufacturing processes, management of inventory excesses and shortages and administrative services. These activities are managed centrally at the S&P Components level and costs are allocated among the S&P Components.
For certain reporting units, the Company may first assess qualitative factors related to the goodwill of the reporting unit to determine whether it is necessary to perform a two-step impairment test. If the Company judges that it is more likely than not that the fair value of the reporting unit is greater than the carrying amount of the reporting unit, including goodwill, no further testing is required. If the Company judges that it is more likely than not that the fair value of the reporting unit is less than the carrying amount of the reporting unit, including goodwill, management will perform a two-step impairment test on goodwill. In the first step of the Company's annual goodwill impairment test ("Step 1"), the Company compares the fair value of the reporting unit to its carrying value. The fair value calculation uses both the income approach (discounted cash flow method) and the market approach, equally weighted. If the Company judges that the carrying value of the net assets assigned to the reporting unit, including goodwill, exceeds the fair value of the reporting unit, a second step of the impairment test must be performed to determine the implied fair value of the reporting unit’s goodwill. If the Company judges that the carrying value of a reporting unit’s goodwill exceeds its implied fair value, the Company would record an impairment charge equal to the difference between the implied fair value of the goodwill and the carrying value.
Determining the fair value of a reporting unit or an indefinite-lived purchased intangible asset is a judgment involving significant estimates and assumptions. These estimates and assumptions include revenue growth rates, operating margins and working capital requirements used to calculate projected future cash flows, risk-adjusted discount rates, selected multiples, control premiums and future economic and market conditions (Level 3 fair value inputs). The Company bases its fair value estimates on assumptions that it believes to be reasonable, but that are unpredictable and inherently uncertain. Actual future results may differ from those estimates.
Assumptions about a reporting unit’s operating performance in the first year of the discounted cash flow model used to determine whether or not the goodwill related to that reporting unit is impaired are derived from the Company’s budget. The fair value model considers such factors as macro-economic conditions, revenue and expense forecasts, product line changes, material, labor and overhead costs, tax rates, working capital levels and competitive environment. Future estimates, however derived, are inherently uncertain but the Company believes that this is the most appropriate source on which to base its fair value calculations.
The Company uses these parameters only to provide a basis for the determination of whether or not the goodwill related to a reporting unit is impaired. No inference whatsoever should be drawn from these parameters about the Company’s future financial performance and they should not be taken as projections or guidance of any kind.
The
2016
,
2015
and
2014
annual testing of goodwill for impairment did not result in impairment charges. The impairment charge taken in the third quarter of 2014 was associated with assets in the Germany reporting unit acquired from Bierbach GmbH & Co. KG ("Bierbach") in 2013. The factors that led to the third quarter impairment were a failure to retain Bierbach's historical customers and increased competition, which led to the reduction in the contingent consideration liability related to the Bierbach acquisition and resulted in management performing an impairment test to evaluate the recoverability of the Germany reporting unit's goodwill. The test resulted in the impairment of all of the reporting unit’s goodwill in the amount of $0.5 million. In connection with the impairment of the goodwill, the Company also reviewed associated long-lived assets in Germany, such as property and equipment and intangible assets, for recoverability by comparing the projected undiscounted net cash flows associated with those assets to their carrying values. No impairment of long-lived assets was required as a result of that review during the third quarter of 2014.
Effect of New Accounting Standards
See "Note 1
—
Recently Adopted Accounting Standards"
and "Note 1
—
Recently Issued Accounting Standards Not Yet Adopted" to the Company's Consolidated Financial Statements.
Liquidity and Sources of Capital
The Company’s primary sources of liquidity are cash and cash equivalents and income from the Company’s operations. The Company also receives proceeds from the issuance of its common stock through the exercise of stock options granted to its employees. The Company anticipates that it will receive less than $7.5 million from stock option exercises through February 2018 as the last of the stock options that are outstanding, all of which are currently in-the-money, will either be exercised or expire by
39
then. As of December 31, 2016, the Company's cash and cash equivalents consisted of deposits and money market funds held with established national financial institutions.
The Company's principal uses of liquidity are paying the costs and expenses associated with the Company's operations, continuing its capital allocation strategy, which includes growing its business by internal improvements or acquisitions, repurchasing the Company’s common stock, paying cash dividends, and meeting other liquidity requirements. Depending, however, on the Company’s future growth and possible acquisitions, it may become necessary to secure additional sources of financing, which may not be available on reasonable terms, or at all.
On July 25, 2016, the Company entered into a second amendment (the “Amendment”) to its $300.0 million credit facility. For additional information about the Amendment, see the Company's Current Report on Form 8-K dated July 28, 2016. As amended, this credit facility expires on July 23, 2021. See "Note 8 — Debt" to the Company's Consolidated Financial Statements.
As of December 31, 2016, cash and cash equivalents of
$87.2 million
are held by the Company in the local currencies of its foreign operations and could be subject to additional taxation if repatriated to the United States. The Company has no current plans to repatriate cash and cash equivalents held outside the United States, as it expects to use such amounts to fund future international growth and acquisitions.
The following table presents selected financial information as of December 31, 2016, 2015 and 2014, respectively:
|
At December 31,
|
||||||||||||
|
(in thousands)
|
2016
|
2015
|
2014
|
|||||||||
|
Cash and cash equivalents
|
$
|
226,537
|
|
$
|
258,825
|
|
$
|
260,307
|
|
|||
|
Property, plant and equipment, net
|
232,810
|
|
213,716
|
|
207,027
|
|
||||||
|
Equity Investment, goodwill and intangible assets
|
149,843
|
|
151,625
|
|
156,468
|
|
||||||
|
Working capital
(1)
|
476,451
|
|
494,308
|
|
509,838
|
|
||||||
(1
)
Due to the adoption of ASU 2015-17, (see "Note 1 — Recently Adopted Accounting Standards" to the Company's Consolidated Financial Statements), $16.2 million of current deferred income taxes included in current assets and working capital, as of January 1, 2016, were reclassified to non-current assets and long-term liabilities, resulting in decreases in current assets from $589.3 million to $573.1 million and in working capital from $494.3 million to $478.1 million.
The following table provides cash flow indicators for the
twelve months ended
December 31, 2016
, 2015 and 2014, respectively:
|
Years Ended December 31,
|
||||||||||||
|
(in thousands)
|
2016
|
2015
|
2014
|
|||||||||
|
Net cash provided by (used in):
|
||||||||||||
|
Operating activities
|
$
|
94,947
|
|
$
|
114,207
|
|
$
|
67,221
|
|
|||
|
Investing activities
|
(48,543
|
)
|
(37,828
|
)
|
(23,505
|
)
|
||||||
|
Financing activities
|
(79,116
|
)
|
(67,892
|
)
|
(25,608
|
)
|
||||||
Cash flows from operating activities result primarily from the Company's earnings or losses, and are also affected by changes in operating assets and liabilities which consist primarily of working capital balances. As a building materials manufacturer, the Company's operating cash flows are subject to seasonality and are cyclically associated with the volume and timing of construction project starts. For example, trade accounts receivable, net, is generally at its lowest at the end of the fourth quarter and increases during the first, second and third quarters.
In
2016
, operating activities provided
$94.9 million
in cash and cash equivalents, as a result of
$89.7 million
from net income and
$42.1 million
from non-cash adjustments to net income which includes depreciation and amortization expenses, stock-based compensation expenses and software development project write-off, partly offset by a
decrease
of
$36.9 million
in the net change in operating assets and liabilities, including net change decreases in cash and cash equivalents due to increases of $36.6 million in inventory and $7.5 million in trade accounts receivable, net, partly offset by a decrease of $5.8 million in trade accounts payable. Cash used in investing activities of
$48.5 million
during the year ended
December 31, 2016
, consisted primarily of
$42.0 million
for property, plant and equipment expenditures, related to real estate improvements, primarily related to improvements of the West
40
Chicago facility, machinery and equipment purchases, and software in development, $5.4 million, net of acquired cash of $1.5 million, for the acquisition of MS Decoupe, and $2.5 million for the equity investment in Ruby Sketch. See "Note 2 — Acquisitions" and "Note 6 — Investments" to the Company's Consolidated Financial Statements. Cash used in financing activities of
$79.1 million
during the year ended
December 31, 2016
, consisted primarily of
$53.5 million
for the repurchase of the Company's common stock, including a $50.0 million accelerated share repurchase program (see "Note 1 — Stock Repurchase Program" to the Company's Consolidated Financial Statements) and
$32.7 million
used to pay cash dividends, partly offset by
$8.0 million
received from the issuance of common stock on the exercise of stock options.
In
2015
, operating activities provided $114.2 million in cash and cash equivalents, as a result of $67.9 million from net income and
$44.2 million
from non-cash adjustments to net income which includes depreciation and amortization expenses, stock-based compensation expenses, software development project write-offs, and changes in deferred income taxes, as well as an
increase
of
$2.1 million
in the net change in operating assets and liabilities, including net change increases in cash and cash equivalents due to decreases of $17.2 million in inventory and $6.3 million in current assets, partly offset by an increase of $16.8 million in trade accounts receivable, net and $5.1 million in accrued liabilities. Cash used in investing activities of $37.8 million during the year ended December 31, 2015, consisted primarily of $34.2 million for property, plant and equipment expenditures, related to the purchase a manufacturing site in West Chicago, software development and machinery and equipment, and $4.2 million for acquisitions. Cash used in financing activities of $67.9 million during the year ended December 31, 2015, consisted primarily of $47.1 million for the repurchase of the Company's common stock, including a $25.0 million accelerated share repurchase program and $29.4 million used to pay cash dividends, partly offset by $9.7 million received from the issuance of common stock on the exercise of stock options.
In
2014
, operating activities provided $67.2 million in cash and cash equivalents, as a result of $63.5 million from net income and
$43.0 million
from non-cash adjustments to net income which includes depreciation and amortization expenses, stock-based compensation expenses and changes in deferred income taxes, partly offset by a
decrease
of
$39.3 million
in the net change in operating assets and liabilities, including net change decreases in cash and cash equivalents due to increases of $22.4 million in inventory, $11.3 million in current assets and $4.6 million in trade accounts receivable, net. Cash used in investing activities of $23.5 million during the year ended December 31, 2014, consisted primarily of $23.7 million for property, plant and equipment expenditures to expand or replace manufacturing capability and software development. Cash used in financing activities of $25.6 million during the year ended December 31, 2014, consisted primarily of $25.9 million used to pay cash dividends and $3.0 million for the repurchase of the Company's common stock, partly offset by $4.6 million received from the issuance of common stock on the exercise of stock options.
Capital Allocation Strategy
The Company has a strong cash position and remains committed to seeking growth opportunities in the building products range where it can leverage its expertise in engineering, testing, manufacturing and distribution to invest in and grow its business. Those opportunities include internal improvements or acquisitions that fit within the Company’s strategic growth plan. Additionally, the Company has financial flexibility and is committed to providing returns to its stockholders with a current target of returning 50% of cash flows from operations through dividends and repurchases of the Company's common stock. Below are highlights of the Company’s capital allocation strategy since the beginning of 2015.
In December 2015, the Company acquired the assets of Blue Heron Enterprises, LLC, and Fox Chase Enterprises, LLC (collectively, "EBTY") for $3.4 million in cash. The Company's final measurement of EBTY assets acquired included goodwill and intangible assets of $3.1 million. In August 2016. the Company acquired all the shares of MS Decoupe, (a former customer of the Company) for a net cost of $5.4 million. The Company's measurement of MS Decoupe assets acquired included goodwill and intangible assets of $3.4 million. See "Note 2 — Acquisitions" to the Company's Consolidated Financial Statements. In December 2016, the Company acquired a 25.0% equity interest in Ruby Sketch Pty Ltd. (“Ruby Sketch”) for $2.5 million, for which the Company accounts for its ownership interest using the equity accounting method. The Company’s future relationship with Ruby Sketch could potentially include the specification of the Company’s products in the Ruby Sketch software and the Company licensing Ruby Sketch software for use in North America. See "Note 6 — Investments" to the Company's Consolidated Financial Statements.
In January 2017, the Company acquired Gbo Fastening Systems for approximately $10.2 million and CG Visions for up to approximately $21.5 million (including an earn-out of $2.15 million, which is subject to meeting sales targets, and subject to specified holdback provisions and post-closing adjustment). The Company is in the process of evaluating the information required to determine the purchase price allocation of both acquisitions. See "Note 15 — Subsequent Events" to the Company's Consolidated Financial Statements.
Based on current information and subject to future events and circumstances, the Company estimates that its full-year 2017 capital spending will be approximately $50 million to $55 million, which includes expenditures for completing both the expansion of our
41
facility in Texas and equipment fit-out of our West Chicago chemical facility, as well as for the purchase of manufacturing equipment, information technology equipment and development and licensing of software.
Based on current information and subject to future events and circumstances, the Company estimates that its full-year 2017 depreciation expense will be approximately $25 million to $27 million, and that its full-year amortization expense will be approximately $5 million to $6 million.
The following table presents the Company’s dividends paid and share repurchases for the year ended
December 31, 2016
and
December 31, 2015
, respectively, in aggregated amounts:
|
(in thousands)
|
Dividends Paid
|
Open Market Share Repurchases
|
Accelerated Share Repurchases
|
Total
|
|||||||||||
|
January 1 - December 31, 2016
|
$
|
32,711
|
|
$
|
3,502
|
|
$
|
50,000
|
|
$
|
86,213
|
|
|||
|
January 1 - December 31, 2015
|
29,352
|
|
22,144
|
|
25,000
|
|
76,496
|
|
|||||||
|
Total
|
$
|
62,063
|
|
$
|
25,646
|
|
$
|
75,000
|
|
$
|
162,709
|
|
|||
In April 2016, the Company’s Board of Directors raised the quarterly cash dividend by 12.5% to $0.18 per share. In January 2017, the Company’s Board of Directors declared a quarterly cash dividend of $0.18 per share, estimated to be
$8.6 million
in total, to be paid on
April 27, 2017
, to stockholders of record on
April 6, 2017
.
In August 2016, the Company's Board of Directors increased and extended its $50.0 million repurchase authorization from February 2016 by authorizing the Company to repurchase up to $125.0 million of the Company's common stock through December 31, 2017, including from the public securities market and through one or more accelerated share repurchase programs. During 2016, the Company received 1,137,656 shares of its common stock at an average price of $43.95 per share under the Company’s $50.0 million accelerated share repurchase program that the Company entered into with Wells Fargo Bank, National Association in August 2016.
Contractual Obligations
The following table summarizes our known material contractual obligations and commitments as of
December 31, 2016
:
|
|
Payments Due by Period
|
||||||||||||||||||
|
|
Total
all
periods
|
Less
than 1
year
|
1 — 3
years
|
3 — 5
years
|
More
than 5
years
|
||||||||||||||
|
|
|||||||||||||||||||
|
Contractual Obligation (in thousands)
|
|||||||||||||||||||
|
Debt interest obligations
(1)
|
$
|
2,050
|
|
$
|
450
|
|
$
|
1,350
|
|
$
|
250
|
|
$
|
—
|
|
||||
|
Operating lease obligations
(2)
|
21,257
|
|
5,857
|
|
7,874
|
|
4,560
|
|
2,966
|
|
|||||||||
|
Purchase obligations
(3)
|
34,365
|
|
33,222
|
|
1,047
|
|
96
|
|
—
|
|
|||||||||
|
Total
|
$
|
57,672
|
|
$
|
39,529
|
|
$
|
10,271
|
|
$
|
4,906
|
|
$
|
2,966
|
|
||||
(1)
Debt interest obligations include interest payments on fixed-term debt, line-of-credit borrowings and annual facility fees on the Company’s primary line-of-credit facility. Interest on line-of-credit facilities was estimated based on historical borrowings and repayment patterns. The Company’s primary line-of-credit facility requires the Company pay an annual facility fee from 0.15% to 0.30%, depending on the Company’s leverage ratio, on the unused portion of the facilities.
(2)
Includes real estate and auto leases and other equipment.
(3)
Represents the Company's purchase obligations, which consist of commitments primarily related to the acquisition, construction or expansion of facilities and equipment, consulting and service agreements, pension fund contributions and minimum purchase quantities of certain raw materials. The Company currently is not a party to any long-term supply contracts with respect to the purchase of raw materials or finished goods.
Off-Balance Sheet Arrangements
The Company did not have any off-balance sheet arrangements as of
December 31, 2016
.
42
Contingencies
From time to time, we are subject to various claims, lawsuits, legal proceedings (including litigation, arbitration or regulatory actions) and other matters arising in the ordinary course of business. Periodically, we evaluate the status of each matter and assess our potential financial exposure.
The Company records a provision for a liability when we believe that (a) it is probable that a loss has been incurred, and (b) the amount is reasonably estimable. Significant judgment is required to determine both probability and the estimated amount. The outcomes of claims, lawsuits, legal proceedings and other matters brought against the Company are subject to significant uncertainty, some of which are inherently unpredictable and/or beyond our control. Therefore, although management considers the likelihood of such an outcome to be remote, if one or more of these matters were resolved against the Company for amounts in excess of management’s expectations, they could have a material adverse impact on our business, results of operations, financial position and liquidity and the Company’s Consolidated Financial Statements could be materially adversely affected.
See “Item 3 — Legal Proceedings” and “Note 9 — Commitments and Contingencies” to the Company’s Consolidated Financial Statements.
Inflation
The Company believes that the effect of inflation on the Company has not been material in the three most recent fiscal years ended December 31, 2016, 2015 and 2014, respectively, as general inflation rates have remained relatively low. The Company’s main raw material is steel. Increases in steel prices may adversely affect the Company’s gross profit margin if it cannot recover the higher costs through price increases of its products. See “Item 1 — Raw Materials” and “Item 1A — Risk Factors.”
Indemnification
In the normal course of business, to facilitate transactions of services and products, we have agreed to indemnify certain parties with respect to certain matters. These agreements may limit the time within which an indemnification claim can be made and the amount of the claim. In addition, we have entered into indemnification agreements with our officers and directors, and the Company’s bylaws as permitted by the Company’s certificate of incorporation require the Company to indemnify corporate servants, including our officers and directors, to the fullest extent permitted by law. The Company maintains directors and officers liability insurance coverage to reduce its exposure to such obligations. The Company has not incurred significant obligations under indemnification provisions historically, and does not expect to incur significant obligations in the future. It is not possible to determine the maximum potential amount under these indemnities due to the limited history of prior indemnification claims and the unique facts and circumstances involved in each particular agreement. Accordingly, the Company has not recorded any liability for costs related these indemnities through December 31, 2016.
We have operations both within the United States and internationally, and we are exposed to market risks in the ordinary course of our business, including changes to foreign currency exchange rates and interest rates.
Foreign Currency Exchange Risk
The Company has foreign currency exchange rate risk in its international operations, and through purchases from foreign vendors. Changes in the values of currencies of foreign countries affect our financial position, income statement and cash flows when translated into United States dollars. The Company does not currently hedge this risk. The Company estimates that if the exchange rate were to change by 10% in any one country where the Company has operations, the change in net income would not be material to the Company’s operations taken as a whole.
The translation adjustment on the Company's underlying assets and liabilities resulted in a decrease in accumulated other comprehensive income of
$3.9 million
for the year ended
December 31, 2016
, primarily due to the effect of the strengthening of the United States dollar in relation to most foreign currencies, partly offset by the weakening of the United States dollar in relation to the Canadian dollar, New Zealand dollar and South Africa rand during
2016
.
43
Interest Rate Risk
The Company has no variable interest-rate debt outstanding. The Company estimates that a hypothetical 100 basis point change in U.S. interest rates would not be material to the Company’s operations taken as a whole.
44
SIMPSON MANUFACTURING CO., INC.
INDEX TO CONSOLIDATED FINANCIAL STATEMENTS
|
Consolidated financial statements
|
|
|
|
|
|
Financial Statement Schedule
|
|
45
Report of Independent Registered Public Accounting Firm
Board of Directors and Stockholders
Simpson Manufacturing Co., Inc.
We have audited the accompanying consolidated balance sheets of Simpson Manufacturing Co., Inc. (a Delaware corporation) and subsidiaries (the “Company”) as of December 31, 2016 and 2015, and the related consolidated statements of operations, comprehensive income, changes in shareholders’ equity, and cash flows for the years ended December 31, 2016 and 2015. Our audits of the basic consolidated financial statements included the financial statement schedule listed in the index appearing under Item 15(a)2. These financial statements and financial statement schedule are the responsibility of the Company’s management. Our responsibility is to express an opinion on these financial statements and financial statement schedule based on our audits.
We conducted our audits in accordance with the standards of the Public Company Accounting Oversight Board (United States). Those standards require that we plan and perform the audit to obtain reasonable assurance about whether the financial statements are free of material misstatement. An audit includes examining, on a test basis, evidence supporting the amounts and disclosures in the financial statements. An audit also includes assessing the accounting principles used and significant estimates made by management, as well as evaluating the overall financial statement presentation. We believe that our audits provide a reasonable basis for our opinion.
In our opinion, the consolidated financial statements referred to above present fairly, in all material respects, the financial position of Simpson Manufacturing Co., Inc. and subsidiaries as of December 31, 2016 and 2015, and the results of their operations and their cash flows for the years ended December 31, 2016 and 2015 in conformity with accounting principles generally accepted in the United States of America. Also in our opinion, the related financial statement schedule, when considered in relation to the basic consolidated financial statements taken as a whole, present fairly, in all material respects, the information set forth therein.
We also have audited, in accordance with the standards of the Public Company Accounting Oversight Board (United States), the Company’s internal control over financial reporting as of December 31, 2016, based on criteria established in the 2013
Internal Control-Integrated Framework
issued by the Committee of Sponsoring Organizations of the Treadway Commission (COSO), and our report dated February 28, 2017 expressed an unqualified opinion thereon.
/s/ Grant Thornton LLP
San Francisco, California
February 28, 2017
46
Report of Independent Registered Public Accounting Firm
Board of Directors and Stockholders
Simpson Manufacturing Co., Inc.
We have audited the internal control over financial reporting of Simpson Manufacturing Co., Inc. (a Delaware corporation) and subsidiaries (the “Company”) as of December 31, 2016, based on criteria established in the 2013
Internal Control-Integrated Framework
issued by the Committee of Sponsoring Organizations of the Treadway Commission (COSO). The Company’s management is responsible for maintaining effective internal control over financial reporting and for its assessment of the effectiveness of internal control over financial reporting, included in the accompanying Management’s Report on Internal Controls over Financial Reporting. Our responsibility is to express an opinion on the Company’s internal control over financial reporting based on our audit.
We conducted our audit in accordance with the standards of the Public Company Accounting Oversight Board (United States). Those standards require that we plan and perform the audit to obtain reasonable assurance about whether effective internal control over financial reporting was maintained in all material respects. Our audit included obtaining an understanding of internal control over financial reporting, assessing the risk that a material weakness exists, testing and evaluating the design and operating effectiveness of internal control based on the assessed risk, and performing such other procedures as we considered necessary in the circumstances. We believe that our audit provides a reasonable basis for our opinion.
A company’s internal control over financial reporting is a process designed to provide reasonable assurance regarding the reliability of financial reporting and the preparation of financial statements for external purposes in accordance with generally accepted accounting principles. A company’s internal control over financial reporting includes those policies and procedures that (1) pertain to the maintenance of records that, in reasonable detail, accurately and fairly reflect the transactions and dispositions of the assets of the company; (2) provide reasonable assurance that transactions are recorded as necessary to permit preparation of financial statements in accordance with generally accepted accounting principles, and that receipts and expenditures of the company are being made only in accordance with authorizations of management and directors of the company; and (3) provide reasonable assurance regarding prevention or timely detection of unauthorized acquisition, use, or disposition of the company’s assets that could have a material effect on the financial statements.
Because of its inherent limitations, internal control over financial reporting may not prevent or detect misstatements. Also, projections of any evaluation of effectiveness to future periods are subject to the risk that controls may become inadequate because of changes in conditions, or that the degree of compliance with the policies or procedures may deteriorate.
In our opinion, the Company maintained, in all material respects, effective internal control over financial reporting as of December 31, 2016, based on criteria established in the 2013
Internal Control-Integrated Framework
issued by COSO.
We also have audited, in accordance with the standards of the Public Company Accounting Oversight Board (United States), the consolidated financial statements of the Company as of and for the year ended December 31, 2016, and our report dated February 28, 2017 expressed an unqualified opinion on those financial statements.
/s/ Grant Thornton LLP
San Francisco, California
February 28, 2017
47
Report of Independent Registered Public Accounting Firm
To the Board of Directors and Stockholders of Simpson Manufacturing Co., Inc.:
In our opinion, the consolidated statements of operations, comprehensive income, stockholders’ equity and cash flows for the year ended December 31, 2014 present fairly, in all material respects, the results of operations and cash flows of Simpson Manufacturing Co., Inc. and its subsidiaries for the year ended December 31, 2014, in conformity with accounting principles generally accepted in the United States of America. In addition, in our opinion, the financial statement schedule for the year ended December 31, 2014 presents fairly, in all material respects, the information set forth therein when read in conjunction with the related consolidated financial statements. These financial statements and financial statement schedule are the responsibility of the Company's management. Our responsibility is to express an opinion on these financial statements and financial statement schedule based on our audit. We conducted our audit of these statements in accordance with the standards of the Public Company Accounting Oversight Board (United States). Those standards require that we plan and perform the audit to obtain reasonable assurance about whether the financial statements are free of material misstatement. An audit includes examining, on a test basis, evidence supporting the amounts and disclosures in the financial statements, assessing the accounting principles used and significant estimates made by management, and evaluating the overall financial statement presentation. We believe that our audit provides a reasonable basis for our opinion.
PricewaterhouseCoopers LLP
San Francisco, California
March 2, 2015
48
Simpson Manufacturing Co., Inc. and Subsidiaries
(In thousands, except per share data)
|
|
December 31,
|
||||||
|
|
2016
|
2015
|
|||||
|
ASSETS
|
|
|
|
|
|||
|
Current assets
|
|
|
|
|
|||
|
Cash and cash equivalents
|
$
|
226,537
|
|
$
|
258,825
|
|
|
|
Trade accounts receivable, net
|
112,423
|
|
106,011
|
|
|||
|
Inventories
|
232,274
|
|
195,757
|
|
|||
|
Deferred income taxes
|
—
|
|
16,203
|
|
|||
|
Other current assets
|
14,013
|
|
12,476
|
|
|||
|
Total current assets
|
585,247
|
|
589,272
|
|
|||
|
Property, plant and equipment, net
|
232,810
|
|
213,716
|
|
|||
|
Goodwill
|
124,479
|
|
123,950
|
|
|||
|
Equity investment
|
2,500
|
|
—
|
|
|||
|
Intangible assets
|
22,864
|
|
27,675
|
|
|||
|
Other noncurrent assets
|
12,074
|
|
6,696
|
|
|||
|
Total assets
|
$
|
979,974
|
|
$
|
961,309
|
|
|
|
LIABILITIES AND STOCKHOLDERS’ EQUITY
|
|||||||
|
Current liabilities
|
|||||||
|
Trade accounts payable
|
27,674
|
|
21,309
|
|
|||
|
Accrued liabilities
|
60,477
|
|
54,761
|
|
|||
|
Accrued profit sharing trust contributions
|
6,549
|
|
5,799
|
|
|||
|
Accrued cash profit sharing and commissions
|
10,527
|
|
8,502
|
|
|||
|
Accrued workers’ compensation
|
3,569
|
|
4,593
|
|
|||
|
Total current liabilities
|
108,796
|
|
94,964
|
|
|||
|
Long-term liabilities
|
5,336
|
|
16,521
|
|
|||
|
Total liabilities
|
114,132
|
|
111,485
|
|
|||
|
Commitments and contingencies (Note 9)
|
|
|
|
|
|||
|
Stockholders’ equity
|
|||||||
|
Preferred stock, par value $0.01; authorized shares, 5,000; issued and outstanding shares, none
|
—
|
|
—
|
|
|||
|
Common stock, par value $0.01; authorized shares, 160,000; issued and outstanding shares, 47,437 and 48,184 at December 31, 2016 and 2015, respectively
|
473
|
|
481
|
|
|||
|
Additional paid-in capital
|
255,917
|
|
238,212
|
|
|||
|
Retained earnings
|
642,422
|
|
639,707
|
|
|||
|
Accumulated other comprehensive loss
|
(32,970
|
)
|
(28,576
|
)
|
|||
|
Total stockholders’ equity
|
865,842
|
|
849,824
|
|
|||
|
Total liabilities and stockholders’ equity
|
$
|
979,974
|
|
$
|
961,309
|
|
|
The accompanying notes are an integral part of these consolidated financial statements
49
Simpson Manufacturing Co., Inc. and Subsidiaries
(In thousands, except per share data)
|
|
Years Ended December 31,
|
||||||||||
|
|
2016
|
2015
|
2014
|
||||||||
|
Net sales
|
$
|
860,661
|
|
$
|
794,059
|
|
$
|
752,148
|
|
||
|
Cost of sales
|
448,211
|
|
435,140
|
|
410,118
|
|
|||||
|
Gross profit
|
412,450
|
|
358,919
|
|
342,030
|
|
|||||
|
Operating expenses:
|
|
|
|
|
|
|
|||||
|
Research and development and other engineering
|
46,248
|
|
46,196
|
|
39,018
|
|
|||||
|
Selling
|
98,343
|
|
90,663
|
|
92,031
|
|
|||||
|
General and administrative
|
129,162
|
|
113,428
|
|
111,500
|
|
|||||
|
Impairment of goodwill
|
—
|
|
—
|
|
530
|
|
|||||
|
Net gain on disposal of assets
|
(780
|
)
|
(389
|
)
|
(325
|
)
|
|||||
|
|
272,973
|
|
249,898
|
|
242,754
|
|
|||||
|
Income from operations
|
139,477
|
|
109,021
|
|
99,276
|
|
|||||
|
Interest income
|
570
|
|
655
|
|
901
|
|
|||||
|
Interest expense
|
(1,147
|
)
|
(997
|
)
|
(855
|
)
|
|||||
|
Income before taxes
|
138,900
|
|
108,679
|
|
99,322
|
|
|||||
|
Provision for income taxes
|
49,166
|
|
40,791
|
|
35,791
|
|
|||||
|
Net income
|
$
|
89,734
|
|
$
|
67,888
|
|
$
|
63,531
|
|
||
|
Earnings per common share:
|
|
|
|
|
|
|
|||||
|
Basic
|
$
|
1.87
|
|
$
|
1.39
|
|
$
|
1.30
|
|
||
|
Diluted
|
$
|
1.86
|
|
$
|
1.38
|
|
$
|
1.29
|
|
||
|
Weighted average number of shares outstanding
|
|
|
|
|
|
|
|||||
|
Basic
|
48,084
|
|
48,952
|
|
48,977
|
|
|||||
|
Diluted
|
48,295
|
|
49,181
|
|
49,194
|
|
|||||
The accompanying notes are an integral part of these consolidated financial statements
50
Simpson Manufacturing Co., Inc. and Subsidiaries
Consolidated Statements of Comprehensive Income
(In thousands)
|
|
Year End December 31,
|
||||||||||
|
|
2016
|
2015
|
2014
|
||||||||
|
Net income
|
$
|
89,734
|
|
$
|
67,888
|
|
$
|
63,531
|
|
||
|
Other comprehensive income:
|
|
|
|
|
|
|
|||||
|
Translation adjustment, net of tax expense of ($222),
($57) and ($63) for 2016, 2015 and 2014, respectively
|
(3,920
|
)
|
(20,939
|
)
|
(24,896
|
)
|
|||||
|
Unamortized pension adjustments, net of tax benefit of $88, $82, and $67 for 2016, 2015 and 2014, respectively
|
(474
|
)
|
(457
|
)
|
(370
|
)
|
|||||
|
Comprehensive income
|
$
|
85,340
|
|
$
|
46,492
|
|
$
|
38,265
|
|
||
The accompanying notes are an integral part of these consolidated financial statements
51
Simpson Manufacturing Co., Inc. and Subsidiaries
Consolidated Statements of Stockholders’ Equity
For the years ended December 31,
2014
,
2015
and
2016
(In thousands, except per share data)
|
Additional
Paid-in Capital |
Accumulated
Other Comprehensive Income (Loss) |
|||||||||||||||||||||||||
|
|
Common Stock
|
Retained
Earnings |
Treasury
Stock |
|
||||||||||||||||||||||
|
|
Shares
|
Par Value
|
Total
|
|||||||||||||||||||||||
|
Balance, January 1, 2014
|
48,712
|
|
$
|
486
|
|
$
|
207,418
|
|
$
|
615,289
|
|
$
|
18,086
|
|
$
|
—
|
|
$
|
841,279
|
|
||||||
|
Net income
|
—
|
|
—
|
|
—
|
|
63,531
|
|
—
|
|
—
|
|
63,531
|
|
||||||||||||
|
Translation adjustment, net of tax
|
—
|
|
—
|
|
—
|
|
—
|
|
(24,896
|
)
|
—
|
|
(24,896
|
)
|
||||||||||||
|
Pension adjustment, net of tax
|
—
|
|
—
|
|
—
|
|
—
|
|
(370
|
)
|
—
|
|
(370
|
)
|
||||||||||||
|
Options exercised
|
161
|
|
2
|
|
4,580
|
|
—
|
|
—
|
|
—
|
|
4,582
|
|
||||||||||||
|
Stock-based compensation expense
|
—
|
|
—
|
|
12,354
|
|
—
|
|
—
|
|
—
|
|
12,354
|
|
||||||||||||
|
Tax benefit of options exercised
|
—
|
|
—
|
|
(268
|
)
|
—
|
|
—
|
|
—
|
|
(268
|
)
|
||||||||||||
|
Repurchase of common stock
|
(95
|
)
|
—
|
|
—
|
|
—
|
|
—
|
|
(2,981
|
)
|
(2,981
|
)
|
||||||||||||
|
Retirement of common stock
|
—
|
|
(1
|
)
|
—
|
|
(2,980
|
)
|
—
|
|
2,981
|
|
—
|
|
||||||||||||
|
Cash dividends declared on common stock, $0.545 per share
|
—
|
|
—
|
|
—
|
|
(26,666
|
)
|
—
|
|
—
|
|
(26,666
|
)
|
||||||||||||
|
Shares issued from release of restricted stock units
|
177
|
|
2
|
|
(3,504
|
)
|
—
|
|
—
|
|
—
|
|
(3,502
|
)
|
||||||||||||
|
Common stock issued at $35.87 per share
|
11
|
|
—
|
|
402
|
|
—
|
|
—
|
|
—
|
|
402
|
|
||||||||||||
|
Balance, December 31, 2014
|
48,966
|
|
489
|
|
220,982
|
|
649,174
|
|
(7,180
|
)
|
—
|
|
863,465
|
|
||||||||||||
|
Net income
|
—
|
|
—
|
|
—
|
|
67,888
|
|
—
|
|
—
|
|
67,888
|
|
||||||||||||
|
Translation adjustment, net of tax
|
—
|
|
—
|
|
—
|
|
—
|
|
(20,939
|
)
|
—
|
|
(20,939
|
)
|
||||||||||||
|
Pension adjustment, net of tax
|
—
|
|
—
|
|
—
|
|
—
|
|
(457
|
)
|
—
|
|
(457
|
)
|
||||||||||||
|
Options exercised
|
331
|
|
3
|
|
9,717
|
|
—
|
|
—
|
|
—
|
|
9,720
|
|
||||||||||||
|
Stock-based compensation expense
|
—
|
|
—
|
|
10,997
|
|
—
|
|
—
|
|
—
|
|
10,997
|
|
||||||||||||
|
Tax benefit of options exercised
|
—
|
|
—
|
|
(318
|
)
|
—
|
|
—
|
|
—
|
|
(318
|
)
|
||||||||||||
|
Repurchase of common stock
|
(1,339
|
)
|
—
|
|
—
|
|
—
|
|
—
|
|
(47,144
|
)
|
(47,144
|
)
|
||||||||||||
|
Retirement of common stock
|
(13
|
)
|
—
|
|
(47,131
|
)
|
47,144
|
|
—
|
|
||||||||||||||||
|
Cash dividends declared on common stock, $0.62 per share
|
—
|
|
—
|
|
—
|
|
(30,224
|
)
|
—
|
|
—
|
|
(30,224
|
)
|
||||||||||||
|
Shares issued from release of restricted stock units
|
210
|
|
2
|
|
(3,718
|
)
|
—
|
|
—
|
|
—
|
|
(3,716
|
)
|
||||||||||||
|
Common stock issued at $34.32 per share
|
16
|
|
—
|
|
552
|
|
—
|
|
—
|
|
—
|
|
552
|
|
||||||||||||
|
Balance, December 31, 2015
|
48,184
|
|
481
|
|
238,212
|
|
639,707
|
|
(28,576
|
)
|
—
|
|
849,824
|
|
||||||||||||
|
Net income
|
—
|
|
—
|
|
—
|
|
89,734
|
|
—
|
|
|
|
89,734
|
|
||||||||||||
|
Translation adjustment, net of tax
|
—
|
|
—
|
|
—
|
|
—
|
|
(3,920
|
)
|
—
|
|
(3,920
|
)
|
||||||||||||
|
Pension adjustment, net of tax
|
—
|
|
—
|
|
—
|
|
—
|
|
(474
|
)
|
—
|
|
(474
|
)
|
||||||||||||
|
Options exercised
|
270
|
|
3
|
|
7,973
|
|
—
|
|
—
|
|
—
|
|
7,976
|
|
||||||||||||
|
Stock-based compensation expense
|
—
|
|
—
|
|
13,186
|
|
—
|
|
—
|
|
—
|
|
13,186
|
|
||||||||||||
|
Tax benefit of options exercised
|
—
|
|
—
|
|
251
|
|
—
|
|
—
|
|
—
|
|
251
|
|
||||||||||||
|
Repurchase of common stock
|
(1,244
|
)
|
—
|
|
—
|
|
—
|
|
—
|
|
(53,502
|
)
|
(53,502
|
)
|
||||||||||||
|
Retirement of common stock
|
—
|
|
(13
|
)
|
—
|
|
(53,489
|
)
|
—
|
|
53,502
|
|
—
|
|
||||||||||||
|
Cash dividends declared on common stock, $0.70 per share
|
—
|
|
—
|
|
—
|
|
(33,530
|
)
|
—
|
|
—
|
|
(33,530
|
)
|
||||||||||||
|
Shares issued from release of restricted stock units
|
217
|
|
2
|
|
(4,020
|
)
|
—
|
|
—
|
|
—
|
|
(4,018
|
)
|
||||||||||||
|
Common stock issued at $32.45 per share
|
10
|
|
—
|
|
315
|
|
—
|
|
—
|
|
—
|
|
315
|
|
||||||||||||
|
Balance, December 31, 2016
|
47,437
|
|
$
|
473
|
|
$
|
255,917
|
|
$
|
642,422
|
|
$
|
(32,970
|
)
|
$
|
—
|
|
$
|
865,842
|
|
||||||
The accompanying notes are an integral part of these consolidated financial statements
52
Simpson Manufacturing Co., Inc. and Subsidiaries
(In thousands)
|
|
Years Ended December 31,
|
||||||||||
|
|
2016
|
2015
|
2014
|
||||||||
|
Cash flows from operating activities
|
|
|
|
|
|
|
|||||
|
Net income
|
$
|
89,734
|
|
$
|
67,888
|
|
$
|
63,531
|
|
||
|
Adjustments to reconcile net income to net cash provided by operating activities:
|
|
|
|
|
|
|
|||||
|
Gain on sale of assets
|
(780
|
)
|
(389
|
)
|
(325
|
)
|
|||||
|
Depreciation and amortization
|
27,927
|
|
26,821
|
|
27,918
|
|
|||||
|
Write-off of software development project
|
2,212
|
|
3,140
|
|
—
|
|
|||||
|
Impairment of goodwill
|
—
|
|
—
|
|
530
|
|
|||||
|
Gain on contingent consideration adjustment
|
—
|
|
(245
|
)
|
(545
|
)
|
|||||
|
Deferred income taxes
|
(869
|
)
|
2,537
|
|
2,181
|
|
|||||
|
Noncash compensation related to stock plans
|
13,946
|
|
11,958
|
|
13,190
|
|
|||||
|
Excess tax benefit of options exercised
|
(273
|
)
|
(78
|
)
|
(79
|
)
|
|||||
|
Provision for (recovery of) doubtful accounts
|
(83
|
)
|
440
|
|
151
|
|
|||||
|
Changes in operating assets and liabilities, net of effects of acquisitions and dispositions:
|
|
|
|
|
|
|
|||||
|
Trade accounts receivable
|
(7,548
|
)
|
(16,818
|
)
|
(4,568
|
)
|
|||||
|
Inventories
|
(36,617
|
)
|
17,208
|
|
(22,428
|
)
|
|||||
|
Other current assets
|
(2,180
|
)
|
6,274
|
|
(3,683
|
)
|
|||||
|
Other noncurrent assets
|
336
|
|
(1,301
|
)
|
(600
|
)
|
|||||
|
Trade accounts payable
|
5,785
|
|
(1,035
|
)
|
(11,266
|
)
|
|||||
|
Accrued liabilities
|
272
|
|
(5,148
|
)
|
2,270
|
|
|||||
|
Accrued profit sharing trust contributions
|
757
|
|
417
|
|
(382
|
)
|
|||||
|
Accrued cash profit sharing and commissions
|
2,064
|
|
2,530
|
|
81
|
|
|||||
|
Other long-term liabilities
|
242
|
|
(2,930
|
)
|
2,607
|
|
|||||
|
Accrued workers’ compensation
|
(1,024
|
)
|
492
|
|
(490
|
)
|
|||||
|
Income taxes payable
|
1,046
|
|
2,446
|
|
(872
|
)
|
|||||
|
Net cash provided by operating activities
|
94,947
|
|
114,207
|
|
67,221
|
|
|||||
|
Cash flows from investing activities
|
|
|
|
|
|
|
|||||
|
Capital expenditures
|
(42,002
|
)
|
(34,186
|
)
|
(23,715
|
)
|
|||||
|
Business acquisitions, net of cash acquired
|
(5,361
|
)
|
(4,179
|
)
|
(220
|
)
|
|||||
|
Invest in Equity Investments
|
(2,500
|
)
|
—
|
|
—
|
|
|||||
|
Loan made to customer
|
—
|
|
—
|
|
(281
|
)
|
|||||
|
Loan repayment by customer
|
—
|
|
244
|
|
39
|
|
|||||
|
Proceeds from sale of assets
|
1,320
|
|
293
|
|
672
|
|
|||||
|
Net cash used in investing activities
|
(48,543
|
)
|
(37,828
|
)
|
(23,505
|
)
|
|||||
|
Cash flows from financing activities
|
|
|
|
|
|
|
|||||
|
Repayment of line of credit and other borrowings
|
—
|
|
(17
|
)
|
(77
|
)
|
|||||
|
Contingent consideration of asset acquisitions
|
(27
|
)
|
(1,177
|
)
|
(1,293
|
)
|
|||||
|
Debt issuance costs
|
(1,125
|
)
|
—
|
|
—
|
|
|||||
|
Repurchase of common stock
|
(53,502
|
)
|
(47,144
|
)
|
(2,981
|
)
|
|||||
|
Issuance of Company’s common stock
|
7,976
|
|
9,720
|
|
4,582
|
|
|||||
|
Excess tax benefit of options exercised
|
273
|
|
78
|
|
79
|
|
|||||
|
Dividends paid
|
(32,711
|
)
|
(29,352
|
)
|
(25,918
|
)
|
|||||
|
Net cash used in financing activities
|
(79,116
|
)
|
(67,892
|
)
|
(25,608
|
)
|
|||||
|
Effect of exchange rate changes on cash
|
424
|
|
(9,969
|
)
|
(9,009
|
)
|
|||||
|
Net increase (decrease) in cash and cash equivalents
|
(32,288
|
)
|
(1,482
|
)
|
9,099
|
|
|||||
|
Cash and cash equivalents at beginning of year
|
258,825
|
|
260,307
|
|
251,208
|
|
|||||
|
Cash and cash equivalents at end of year
|
$
|
226,537
|
|
$
|
258,825
|
|
$
|
260,307
|
|
||
|
Supplemental Disclosure of Cash Flow Information
|
|||||||||||
|
Cash paid during the year for
|
|
|
|
|
|
|
|||||
|
Interest
|
$
|
284
|
|
$
|
249
|
|
$
|
117
|
|
||
|
Income taxes
|
49,425
|
|
34,008
|
|
34,977
|
|
|||||
|
Noncash activity during the year for
|
|
|
|
|
|
|
|||||
|
Capital expenditures
|
$
|
2,318
|
|
$
|
1,214
|
|
$
|
1,031
|
|
||
|
Stock-based compensation
|
315
|
|
552
|
|
402
|
|
|||||
|
Dividends declared but not paid
|
8,535
|
|
7,716
|
|
6,843
|
|
|||||
|
Contribution in excess of pension benefit cost
|
—
|
|
—
|
|
39
|
|
|||||
The accompanying notes are an integral part of these consolidated financial statements
53
Simpson Manufacturing Co., Inc. and Subsidiaries
Notes to Consolidated Financial Statements
|
1.
|
Operations and Summary of Significant Accounting Policies
|
Nature of Operations
Simpson Manufacturing Co., Inc., through its subsidiary Simpson Strong-Tie Company Inc. and its other subsidiaries (collectively, the “Company”), designs, engineers and is a leading manufacturer of wood construction products, including connectors, truss plates, fastening systems, fasteners and shearwalls, and concrete construction products, including adhesives, specialty chemicals, mechanical anchors, powder actuated tools and fiber reinforcing materials. The Company markets its products to the residential construction, industrial, commercial and infrastructure construction, remodeling and do-it-yourself markets.
The Company operates exclusively in the building products industry. The Company’s products are sold primarily in the United States, Canada, Europe, the South Pacific and in Asia up until 2015 when the Company closed the sales offices there. Revenues have some geographic market concentration in the United States. A portion of the Company’s business is therefore dependent on economic activity within the North America segment. The Company is dependent on the availability of steel, its primary raw material.
Out-of-Period Adjustment
In the first quarter of 2014, the Company recorded an out-of-period adjustment, which increased gross profit, income from operations and net income in total by
$2.3 million
,
$2.0 million
and
$1.3 million
, respectively. The adjustment resulted from an over-statement of prior periods' workers compensation expense, net of cash profit sharing expense, and was not material to the current period's or any prior period's financial statements.
Principles of Consolidation
The consolidated financial statements include the accounts of Simpson Manufacturing Co., Inc. and its subsidiaries. Investments in
50%
or less owned entities are accounted for using either cost or the equity method. The Company consolidates all variable interest entities ("VIEs") where it is the primary beneficiary. There were no VIEs as of
December 31, 2016
or
2015
. All significant intercompany transactions have been eliminated.
Use of Estimates
The preparation of consolidated financial statements in conformity with accounting principles generally accepted in the United States of America, as amended from time to time ("GAAP") requires management to make estimates and assumptions that affect the reported amounts of assets and liabilities and disclosure of contingent assets and liabilities at the date of the Consolidated Financial Statements and the reported amounts of revenues and expenses during the reporting period. Actual results could differ from those estimates.
Revenue Recognition
The Company recognizes revenue when the earnings process is complete, net of applicable provision for discounts, returns and incentives, whether actual or estimated based on the Company’s experience. This generally occurs when products are shipped to the customer in accordance with the sales agreement or purchase order, ownership and risk of loss pass to the customer, collectability is reasonably assured and pricing is fixed or determinable. The Company’s general shipping terms are F.O.B. shipping point, where title is transferred and revenue is recognized when the products are shipped to customers. When the Company sells F.O.B. destination point, title is transferred and the Company recognizes revenue on delivery or customer acceptance, depending on terms of the sales agreement. Service sales, representing after-market repair and maintenance, engineering activities, software license sales and service and lease income, though significantly less than
1%
of net sales and not material to the Consolidated Financial Statements, are recognized as the services are completed or the software products and services are delivered. If actual costs of sales returns, incentives and discounts were to significantly exceed the recorded estimated allowances, the Company’s sales would be adversely affected.
Sales Incentive and Advertising Allowances
The Company records estimated reductions to revenues for sales incentives, primarily rebates for volume discounts, and allowances for co-operative advertising.
54
Allowances for Sales Discounts
The Company records estimated reductions to revenues for discounts taken on early payment of invoices by its customers.
Cash Equivalents
The Company considers all highly liquid investments with an original or remaining maturity of three months or less at the time of purchase to be cash equivalents.
Allowance for Doubtful Accounts
The Company assesses the collectability of specific customer accounts that would be considered doubtful based on the customer’s financial condition, payment history, credit rating and other factors that the Company considers relevant, or accounts that the Company assigns for collection. The Company reserves for the portion of those outstanding balances that the Company believes it is not likely to collect based on historical collection experience. The Company also reserves
100%
of the amounts that it deems uncollectable due to a customer’s deteriorating financial condition or bankruptcy. If the financial condition of the Company’s customers were to deteriorate, resulting in probable inability to make payments, additional allowances may be required.
Inventory Valuation
Inventories are stated at the lower of cost or net realizable value. Cost includes all costs incurred in bringing each product to its present location and condition, as follows:
|
•
|
Raw materials and purchased finished goods for resale — principally valued at cost determined on a weighted average basis; and
|
|
•
|
In-process products and finished goods — cost of direct materials and labor plus attributable overhead based on a normal level of activity.
|
The Company applies net realizable value and obsolescence to the gross value of the inventory. The Company estimates net realizable value based on estimated selling price less further costs to completion and disposal. The Company impairs slow-moving products by comparing inventories on hand to projected demand. If on-hand supply of a product exceeds projected demand or if the Company believes the product is no longer marketable, the product is considered obsolete inventory. The Company revalues obsolete inventory to its net realizable value. The Company has consistently applied this methodology. The Company believes that this approach is prudent and makes suitable impairments for slow-moving and obsolete inventory. When impairments are established, a new cost basis of the inventory is created. Unexpected change in market demand, building codes or buyer preferences could reduce the rate of inventory turnover and require the Company to recognize more obsolete inventory.
Warranties and recalls
The Company provides product warranties for specific product lines and records estimated recall expenses in the period in which the recall occurs, none of which has been material to the Consolidated Financial Statements. In a limited number of circumstances, the Company may also agree to indemnify customers against legal claims made against those customers by the end users of the Company’s products. Historically, payments made by the Company, if any, under such agreements have not had a material effect on the Company’s consolidated results of operations, cash flows or financial position
Fair Value of Financial Instruments
The “Fair Value Measurements and Disclosures” topic of the Financial Accounting Standards Board (“FASB”) Accounting Standards Codification
™
(“ASC”) establishes a valuation hierarchy for disclosure of the inputs used to measure fair value. This hierarchy prioritizes the inputs into three broad levels as follows: Level 1 inputs are quoted prices (unadjusted) in active markets for identical assets or liabilities; Level 2 inputs are quoted prices for similar assets and liabilities in active markets or inputs that are observable for the asset or liability, either directly or indirectly through market corroboration, for substantially the full term of the financial instrument; Level 3 inputs are unobservable inputs based on the Company’s assumptions used to measure assets and liabilities at fair value. A financial asset’s or liability’s classification within the hierarchy is determined based on the lowest level input that is significant to the fair value measurement.
55
As of
December 31, 2016
, the Company’s investments consisted of only money market funds, and as of December 31, 2015, its investments consisted of only United States Treasury securities and money market funds, which are the Company’s primary financial instruments, maintained in cash equivalents and carried at cost, approximating fair value, based on Level 1 inputs. The balance of the Company’s primary financial instruments was as follows:
|
(in thousands)
|
At December 31,
|
|||||
|
2016
|
2015
|
|||||
|
United States Treasury securities and money market funds
|
$
|
2,832
|
|
$
|
76,047
|
|
The carrying amounts of trade accounts receivable, accounts payable and accrued liabilities approximate fair value due to the short-term nature of these instruments. The fair value of the Company’s contingent consideration related to acquisitions is classified as Level 3 within the fair value hierarchy as it is based on unobserved inputs and assumptions. In 2014, the fair value of the contingent consideration related to the acquisition of Bierbach GmbH & Co. KG ("Bierbach"), a Germany company, was decreased from
$0.8 million
to
$0.2 million
as a result of not retaining Bierbach's historical customers and increased competition.
Property, Plant and Equipment
Property, plant and equipment are carried at cost. Major renewals and betterments are capitalized. Maintenance and repairs are expensed on a current basis. When assets are sold or retired, their costs and accumulated depreciation are removed from the accounts, and the resulting gains or losses are reflected in the accompanying Consolidated Statements of Operations.
The “Intangibles—Goodwill and Other” topic of the FASB ASC provides guidance on capitalization of the costs incurred for computer software developed or obtained for internal use. The Company capitalizes qualified external costs and internal costs related to the purchase and implementation of software projects used for business operations and engineering design activities. Capitalized software costs primarily include purchased software and external consulting fees. Capitalized software projects are amortized over the estimated useful lives of the software.
Depreciation and Amortization
Depreciation of software, machinery and equipment is provided using accelerated methods over the following estimated useful lives:
|
Software
|
3 to 5 years
|
|
Machinery and equipment
|
3 to 10 years
|
Buildings and site improvements are depreciated using the straight-line method over their estimated useful lives, which range from
15
to
45
years. Leasehold improvements are amortized using the straight-line method over the shorter of the expected life or the remaining term of the lease. Amortization of purchased intangible assets with finite useful lives is computed using the straight-line method over the estimated useful lives of the assets.
In-Process Research and Development Assets
In-process research and development (“IPR&D”) assets represent capitalized incomplete research projects that the Company acquired through business combinations. Such assets are initially measured at their acquisition-date fair values and are required to be classified as indefinite-lived assets until the successful completion of the associated research and development efforts. During the development period after the date of acquisition, these assets will not be amortized until the research and development projects are completed and the resulting assets are ready for their intended use. The Company performs an impairment test annually and more frequently if events or changes in circumstances indicate it that is more likely than not that the asset is impaired. On successful completion of the research and development project the Company makes a determination about the then-remaining useful life and begins amortization. As of December 31, 2016, the Company had
no
IPR&D assets.
Cost of Sales
The types of costs included in cost of sales include material, labor, factory and tooling overhead, shipping, and freight costs. Major components of these expenses are material costs, such as steel, packaging and cartons, personnel costs, and facility costs, such as rent, depreciation and utilities, related to the production and distribution of the Company’s products. Inbound freight charges,
56
purchasing and receiving costs, inspection costs, warehousing costs, internal transfer costs, and other costs of the Company’s distribution network are also included in cost of sales.
Tool and Die Costs
Tool and die costs are included in product costs in the year incurred.
Shipping and Handling Fees and Costs
The Company’s general shipping terms are F.O.B. shipping point. Shipping and handling fees and costs are included in revenues and product costs, as appropriate, in the year incurred.
Product and Software Research and Development Costs
Product research and development costs, which are included in operating expenses and are charged against income as incurred, were
$9.9 million
,
$10.3 million
and
$11.2 million
in
2016
,
2015
and
2014
, respectively. The types of costs included as product research and development expenses are typically related to salaries and benefits, professional fees and supplies. In
2016
,
2015
and
2014
, the Company incurred software development expenses related to its expansion into the plated truss market and some of the software development costs were capitalized. See "Note 5 — Property, Plant and Equipment." The Company amortizes acquired patents over their remaining lives and performs periodic reviews for impairment. The cost of internally developed patents is expensed as incurred.
Selling Costs
Selling costs include expenses associated with selling, merchandising and marketing the Company’s products. Major components of these expenses are personnel, sales commissions, facility costs such as rent, depreciation and utilities, professional services, information technology costs, sales promotion, advertising, literature and trade shows.
Advertising Costs
Advertising costs are included in selling expenses, are expensed when the advertising occurs, and were
$7.1 million
,
$6.4 million
and
$7.3 million
in
2016
,
2015
, and
2014
, respectively.
General and Administrative Costs
General and administrative costs include personnel, information technology related costs, facility costs such as rent, depreciation and utilities, professional services, amortization of intangibles and bad debt charges.
Income Taxes
Income taxes are calculated using an asset and liability approach. The provision for income taxes includes federal, state and foreign taxes currently payable and deferred taxes, due to temporary differences between the financial statement and tax bases of assets and liabilities. In addition, future tax benefits are recognized to the extent that realization of such benefits is more likely than not.
Sales Taxes
The Company presents taxes collected and remitted to governmental authorities on a net basis in the accompanying Consolidated Statements of Operations.
Foreign Currency Translation
The local currency is the functional currency of most of the Company’s operations in Europe, Canada, Asia, Australia, New Zealand and South Africa. Assets and liabilities denominated in foreign currencies are translated using the exchange rate on the balance sheet date. Revenues and expenses are translated using average exchange rates prevailing during the year. The translation adjustment resulting from this process is shown separately as a component of stockholders’ equity. Foreign currency transaction gains or losses are included in general and administrative expenses.
57
Sales Office Closing
The Company substantially completed the liquidation of its Asia sales offices as of December 31, 2015, and does not expect to recognize significant additional costs in future periods related to this event. Accordingly, the Company reclassified
$0.2 million
of its accumulated other comprehensive income, related to foreign exchange losses from its Asia sales offices, to its consolidated statement of operations. This amount is classified as a loss on disposal of assets and was recorded in the Asia/Pacific segment.
The following table provides a rollforward of the liability balance for such expenses, as well as other non-employee costs associated with the Asia sales office closing, as of
December 31, 2016
:
|
(in thousands)
|
Operating Leases Obligation
|
Employee Severance Obligation
|
Other Associated Costs
|
Total
|
|||||||||||
|
Balance at January 1, 2016
|
$
|
—
|
|
$
|
301
|
|
$
|
352
|
|
$
|
653
|
|
|||
|
Charges
|
406
|
|
441
|
|
98
|
|
945
|
|
|||||||
|
Cash payments
|
(406
|
)
|
(742
|
)
|
(413
|
)
|
(1,561
|
)
|
|||||||
|
Balance at December 31, 2016
|
$
|
—
|
|
$
|
—
|
|
$
|
37
|
|
$
|
37
|
|
|||
For the year ended
December 31, 2016
, the Company had recorded employee severance obligation expenses of
$0.4 million
and made corresponding payments totaling
$0.7 million
. In addition, during 2016, the Company incurred operating leases charges of
$0.4 million
and made corresponding payments for the closed sales offices.
Common Stock
Subject to the rights of holders of any preferred stock that may be issued in the future, holders of common stock are entitled to receive such dividends, if any, as may be declared from time to time by the Company’s Board of Directors out of legally available funds, and in the event of liquidation, dissolution or winding-up of the Company, to share ratably in all assets available for distribution. The holders of common stock have no preemptive or conversion rights. Subject to the rights of any preferred stock that may be issued in the future, the holders of common stock are entitled to
one
vote per share on any matter submitted to a vote of the stockholders, except that, subject to compliance with pre-meeting notice and other conditions pursuant to the Company’s Bylaws, stockholders currently may cumulate their votes in an election of directors, and each stockholder may give one candidate a number of votes equal to the number of directors to be elected multiplied by the number of shares held by such stockholder or may distribute such stockholder’s votes on the same principle among as many candidates as such stockholder thinks fit. A director in an uncontested election is elected if the votes cast “for” such director’s election exceed the votes cast “against” such director’s election, except that, if a stockholder properly nominates a candidate for election to the Board of Directors, the candidates with the highest number of affirmative votes (up to the number of directors to be elected) are elected. There are no redemption or sinking fund provisions applicable to the common stock.
In 1999, the Company declared a dividend distribution of
one
right per share of our common stock to purchase Series A Participating preferred stock (each, a "Right," or collectively, the "Rights"). Pursuant to the Amended and Restated Rights Agreement dated as of June 15, 2009 (the "Rights Agreement"), by and between the Company and Computershare Trust Company, N.A,, a federally chartered trust company, as rights agent, the Rights would be exercisable, unless redeemed earlier by the Company, if a person or group acquired, or obtained the right to acquire,
15%
or more of the outstanding shares of common stock or commenced a tender or exchange offer that would result in it acquiring
15%
or more of the outstanding shares of common stock, either event occurring without the prior consent of the Company. The amount of Series A Participating preferred stock that the holder of a Right was entitled to receive and the purchase price payable on exercise of a Right were both subject to adjustment. Any person or group that would acquire
15%
or more of the outstanding shares of common stock without the prior consent of the Company would not be entitled to this purchase. Any stockholder who held
25%
or more of the Company’s common stock when the Rights were originally distributed would not be treated as having acquired
15%
or more of the outstanding shares unless such stockholder’s ownership would be increased to more than
40%
of the outstanding shares.
Under the Rights Agreement, the Rights were scheduled to expire June 14, 2019 and might be redeemed by the Company at
one
cent per Right prior to their scheduled expiration. The Rights did not have voting or dividend rights and, until they become exercisable, had no dilutive effect on the earnings of the Company. One million shares of the Company’s preferred stock have been designated Series A Participating preferred stock and reserved for issuance on exercise of the Rights.
No event has made the Rights exercisable. On October 25, 2016, the Company's Board of Directors voted to terminate the Rights Agreement. On November 9, 2016, the Company entered into an amendment (the “Rights Agreement First Amendment”) to the
58
Rights Agreement. The Rights Agreement First Amendment amended the definition of “Final Expiration Date” under the Rights Agreement to mean “November 9, 2016.” Accordingly, the Rights Agreement First Amendment accelerated the final expiration of the Rights from June 14, 2019, to November 9, 2016.
Preferred Stock
The Board has the authority to issue the authorized and unissued preferred stock in
one
or more series with such designations, rights and preferences as may be determined from time to time by the Board. Accordingly, the Board is empowered, without stockholder approval, to issue preferred stock with dividend, redemption, liquidation, conversion, voting or other rights that could adversely affect the voting power or other rights of the holders of the Company’s common stock.
Stock Repurchase Program
The Company announced a stock repurchase program in 2015.
In 2015, the Company's Board of Directors authorized the Company to repurchase up to
$50.0 million
of the Company's common stock through December 31, 2015. For the fiscal year ended
December 31, 2015
, the Company purchased a total of
1,338,894
shares of its common stock, which included the
689,184
shares pursuant to the September 2015
$25 million
accelerated share repurchase program ("2015 ASR Agreement") that the Company entered into with Wells Fargo Bank, National Association ("Wells Fargo"). As of December 31, 2015, the terms of the 2015 ASR Agreement were completed. The Company paid Wells Fargo
$25 million
and Wells Fargo delivered to the Company
689,184
shares of the Company’s common stock, which had an average share price of
$36.27
per share. At an average price of
$35.21
, the Company spent approximately
$47.1 million
on the
1,338,894
shares repurchased during the twelve months ended
December 31, 2015
. All shares repurchased during 2015 were retired.
At its meeting in August 2016, the Company’s Board of Directors authorized the Company to repurchase up to
$125.0
million of the Company’s common stock. This authorization increased and extended the
$50.0 million
repurchase authorization from February 2016 and will remain in effect through December 31, 2017. For the fiscal year ended
December 31, 2016
, the Company purchased a total of
1,244,003
shares of its common stock, which included the
1,137,656
shares pursuant to the August 2016
$50 million
accelerated share repurchase program ("2016 ASR Agreement") that the Company entered into with Wells Fargo. As of December 31, 2016, the terms of the 2016 ASR Agreement were completed. The Company paid Wells Fargo
$50 million
and Wells Fargo delivered to the Company
1,137,656
shares of the Company’s common stock, which had an average share price of
$43.95
per share. At an average price of
$43.01
, the Company spent approximately
$53.5 million
on the
1,244,003
shares repurchased during the twelve months ended
December 31, 2016
. All shares repurchased during 2016 were retired.
See the "Consolidated Statements of Stockholders’ Equity."
Net Income per Common Share
Basic net income per common share is computed based on the weighted average number of common shares outstanding. Potentially dilutive shares, using the treasury stock method, are included in the diluted per-share calculations for all periods when the effect of their inclusion is dilutive.
59
The following shows a reconciliation of basic earnings per share (“EPS”) to diluted EPS:
|
|
Fiscal Year Ended December 31,
|
||||||||||
|
(in thousands, except per-share amounts)
|
2016
|
2015
|
2014
|
||||||||
|
Net income available to common stockholders
|
$
|
89,734
|
|
$
|
67,888
|
|
$
|
63,531
|
|
||
|
Basic weighted average shares outstanding
|
48,084
|
|
48,952
|
|
48,977
|
|
|||||
|
Dilutive effect of potential common stock equivalents
|
211
|
|
229
|
|
217
|
|
|||||
|
Diluted weighted average shares outstanding
|
48,295
|
|
49,181
|
|
49,194
|
|
|||||
|
Net earnings per share:
|
|
|
|
|
|
|
|||||
|
Basic
|
$
|
1.87
|
|
$
|
1.39
|
|
$
|
1.30
|
|
||
|
Diluted
|
$
|
1.86
|
|
$
|
1.38
|
|
$
|
1.29
|
|
||
|
Potentially dilutive securities excluded from earnings per diluted share because their
|
|||||||||||
|
effect is anti-dilutive
|
—
|
|
—
|
|
—
|
|
|||||
Anti-dilutive shares attributable to outstanding stock options were excluded from the calculation of diluted net income per share.
The potential tax benefits derived from the amount of the average stock price for the period in excess of the grant date fair value of stock options, known as the windfall tax benefit, is added to the proceeds of stock option exercises under the treasury stock method for computing the amount of dilutive securities used to determine the outstanding shares for the calculation of diluted earnings per share.
Comprehensive Income or Loss
Comprehensive income is defined as net income plus other comprehensive income or loss. Other comprehensive income or loss consists of changes in cumulative translation adjustments and changes in unamortized pension adjustments recorded directly in accumulated other comprehensive income within stockholders’ equity. The following shows the components of accumulated other comprehensive income or loss as of
December 31, 2016
and
2015
, respectively:
|
Foreign Currency Translation
|
Pension Benefit
|
Total
|
|||||||||
|
(in thousands)
|
|||||||||||
|
Balance, January 1, 2014
|
$
|
18,283
|
|
$
|
(197
|
)
|
$
|
18,086
|
|
||
|
Other comprehensive income before reclassification net of tax benefit (expense) of ($63) and $67, respectively
|
(24,896
|
)
|
(370
|
)
|
(25,266
|
)
|
|||||
|
Balance, December 31, 2014
|
(6,613
|
)
|
(567
|
)
|
(7,180
|
)
|
|||||
|
Other comprehensive loss net of tax benefit (expense) of ($57) and $82, respectively
|
(20,708
|
)
|
(457
|
)
|
(21,165
|
)
|
|||||
|
Amounts reclassified from accumulative other comprehensive income, net of $0 tax
|
(231
|
)
|
—
|
|
(231
|
)
|
|||||
|
Balance, December 31, 2015
|
(27,552
|
)
|
(1,024
|
)
|
(28,576
|
)
|
|||||
|
Other comprehensive loss net of tax benefit (expense) of ($222) and $87, respectively
|
(3,920
|
)
|
(474
|
)
|
(4,394
|
)
|
|||||
|
Amounts reclassified from accumulative other comprehensive income, net of $0 tax
|
—
|
|
—
|
|
—
|
|
|||||
|
Balance, December 31, 2016
|
$
|
(31,472
|
)
|
$
|
(1,498
|
)
|
$
|
(32,970
|
)
|
||
The
2015
translation adjustment of
$0.2 million
in cumulative currency translation adjustments was related to the liquidation of the Asia sales offices. This amount is classified as a net loss on disposal of assets in the accompanying Consolidated Statements of Operations.
Concentration of Credit Risk
Financial instruments that potentially subject the Company to concentrations of credit risk consist of cash in banks, short-term investments in money market funds and trade accounts receivable. The Company maintains its cash in demand deposit and money market accounts held primarily at
fifteen
banks.
60
Accounting for Stock-Based Compensation
The Company currently maintains an equity incentive plan, the Simpson Manufacturing Co., Inc. Amended and Restated 2011 Incentive Plan (the “2011 Plan”), which was adopted on April 26, 2011 and amended and restated on April 21, 2015. The 2011 Plan amended and restated in their entirety, and incorporated and superseded, both the Simpson Manufacturing Co., Inc. 1994 Stock Option Plan (the “1994 Plan”), which was principally for the Company’s employees, and the Simpson Manufacturing Co., Inc. 1995 Independent Director Stock Option Plan (the “1995 Plan”), which was for its independent directors. Awards previously granted under the 1994 Plan or the 1995 Plan will not be affected by the adoption of the 2011 Plan and will continue to be governed by the 1994 Plan or the 1995 Plan, respectively.
Under the 1994 Plan and the 1995 Plan, the Company could grant incentive stock options and non-qualified stock options, although the Company granted only non-qualified stock options thereunder. The Company generally granted options under each of the 1994 Plan and the 1995 Plan once each year. Options vest and expire according to terms established at the grant date. Stock options granted under the 1994 Plan typically vested evenly over the requisite service period of
four
years and have a term of
seven
years. Options granted under the 1995 Plan were fully vested on the date of grant. Shares of common stock issued on exercise of stock options under the 1994 Plan and the 1995 Plan are registered under the Securities Act of 1933, as amended (the "Securities Act").
Under the 2011 Plan, the Company may grant incentive stock options, non-qualified stock options, restricted stock and restricted stock units, although the Company currently intends to award primarily performance-based and/or time-based restricted stock units ("RSUs") and to a lesser extent, if at all, non-qualified stock options. The Company does not currently intend to award incentive stock options or restricted stock. Under the 2011 Plan, no more than
16.3 million
shares of the Company’s common stock in aggregate (including shares already issued pursuant to prior awards) may be issued under the 2011 Plan, including shares reserved for issuance on exercise of options previously granted under the 1994 Plan and the 1995 Plan. Shares of common stock to be issued pursuant to the 2011 Plan are registered under the Securities Act.
Subject to certain adjustment, the following limits shall apply with respect to any awards under the Plan that are intended to qualify for the performance-based exception from the tax deductibility limitations of section 162(m) of the U.S. Internal Revenue Code of 1986, as amended from time to time: (i) the maximum aggregate number of shares of the Company’s common stock that may be subject to stock options granted in any calendar year to any one participant shall be
150,000
shares; and (ii) the maximum aggregate number of shares of the Company’s common stock issuable or deliverable under RSUs granted in any calendar year to any one participant shall be
100,000
shares.
The following table shows the Company’s stock-based compensation activity:
|
|
Fiscal Years Ended December 31,
|
||||||||||
|
(in thousands)
|
2016
|
2015
|
2014
|
||||||||
|
Stock-based compensation expense recognized in operating expenses
|
$
|
13,113
|
|
$
|
11,212
|
|
$
|
12,299
|
|
||
|
Tax benefit of stock-based compensation expense in provision for income taxes
|
4,757
|
|
3,987
|
|
4,384
|
|
|||||
|
Stock-based compensation expense, net of tax
|
$
|
8,356
|
|
$
|
7,225
|
|
$
|
7,915
|
|
||
|
Fair value of shares vested
|
$
|
13,186
|
|
$
|
10,997
|
|
$
|
12,354
|
|
||
|
Proceeds to the Company from the exercise of stock-based compensation
|
$
|
7,976
|
|
$
|
9,720
|
|
$
|
4,582
|
|
||
|
Tax benefit from exercise of stock-based compensation, including shortfall tax benefits
|
$
|
(251
|
)
|
$
|
(318
|
)
|
$
|
(268
|
)
|
||
The stock-based compensation expense included in cost of sales, research and development and engineering expense, selling expense, or general and administrative expense depends on the job functions performed by the employees to whom the stock options were granted, or the restricted stock units were awarded.
The following table shows the expense related to the Company's stock-based compensation capitalized in inventory.
|
|
At The Fiscal Year Ended December 31,
|
||||||||||
|
(in thousands)
|
2016
|
2015
|
2014
|
||||||||
|
Stock-based compensation cost capitalized in inventory
|
$
|
434
|
|
$
|
368
|
|
$
|
559
|
|
||
61
The assumptions used to calculate the fair value of options or restricted stock units are evaluated and revised, as necessary, to reflect market conditions and the Company’s experience. See "Note 13 — Stock-Based Compensation."
Goodwill Impairment Testing
The Company tests goodwill for impairment at the reporting unit level on an annual basis (in the fourth quarter for the Company). The Company also reviews goodwill for impairment whenever events or changes in circumstances indicate the carrying value of an asset may not be recoverable. These events or circumstances could include a significant change in the business climate, legal factors, operating performance indicators, competition, or disposition or relocation of a significant portion of a reporting unit.
The reporting unit level is generally one level below the operating segment and is at the country level except for the United States, Denmark, Australia, and S&P Clever reporting units.
The Company has determined that the United States reporting unit includes
four
components: Northwest United States, Southwest United States, Northeast United States and Southeast United States (collectively, the “U.S. Components”). The Company aggregates the U.S. Components into a single reporting unit because management concluded that they are economically similar and that the goodwill is recoverable from the U.S. Components working in concert. The U.S. Components are economically similar because of a number of factors, including, selling similar products to shared customers and sharing assets and services such as intellectual property, manufacturing assets for certain products, research and development projects, manufacturing processes, management of inventory excesses and shortages and administrative services. These activities are managed centrally at the U.S. Components level and costs are allocated among the
four
U.S. Components.
The Company determined that the Australia reporting unit includes
four
components: Australia, New Zealand, South Africa and United Arab Emirates (collectively, the “AU Components”). The Company aggregates the AU Components into a single reporting unit because management concluded that they are economically similar and that the goodwill is recoverable from the AU Components working in concert. The AU Components are economically similar because of a number of factors, including that New Zealand, South Africa and United Arab Emirates operate as extensions of their Australian parent company selling similar products and sharing assets and services such as intellectual property, manufacturing assets for certain products, management of inventory excesses and shortages and administrative services. These activities are managed centrally at the AU Components level and costs are allocated among the AU Components.
The Company has determined that the S&P Clever reporting unit includes
eight
components: S&P Switzerland, S&P Poland, S&P Austria, S&P The Netherlands, S&P Portugal, S&P Germany, S&P France and S&P Nordic (collectively, the "S&P Components”). The Company aggregates the S&P Components into a single reporting unit because management concluded that they are economically similar and that the goodwill is recoverable from the S&P Components working in concert. The S&P Components are economically similar because of a number of factors, including sharing assets and services such as intellectual property, manufacturing assets for certain products, research and development projects, manufacturing processes, management of inventory excesses and shortages and administrative services. These activities are managed centrally at the S&P Components level and costs are allocated among the S&P Components.
For certain reporting units, the Company may first assess qualitative factors related to the goodwill of the reporting unit to determine whether it is necessary to perform a two-step impairment test. If the Company judges that it is more likely than not that the fair value of the reporting unit is greater than the carrying amount of the reporting unit, including goodwill, no further testing is required. If the Company judges that it is more likely than not that the fair value of the reporting unit is less than the carrying amount of the reporting unit, including goodwill, management will perform a two-step impairment test on goodwill. In the first step ("Step 1"), the Company compares the fair value of the reporting unit to its carrying value. The fair value calculation uses the income approach (discounted cash flow method) and the market approach, equally weighted. If the Company judges that the carrying value of the net assets assigned to the reporting unit, including goodwill, exceeds the fair value of the reporting unit, a second step of the impairment test must be performed to determine the implied fair value of the reporting unit’s goodwill. If the Company judges that the carrying value of a reporting unit’s goodwill exceeds its implied fair value, the Company would record an impairment charge equal to the difference between the implied fair value of the goodwill and the carrying value.
Determining the fair value of a reporting unit or an indefinite-lived purchased intangible asset is a judgment involving significant estimates and assumptions. These estimates and assumptions include revenue growth rates, operating margins and working capital requirements used to calculate projected future cash flows, risk-adjusted discount rates, selected multiples, control premiums and future economic and market conditions (Level 3 fair value inputs). The Company bases its fair value estimates on assumptions that it believes to be reasonable, but that are unpredictable and inherently uncertain. Actual future results may differ from those estimates.
62
Assumptions about a reporting unit’s operating performance in the first year of the discounted cash flow model used to determine whether or not the goodwill related to that reporting unit is impaired are derived from the Company’s budget. The fair value model considers such factors as macro-economic conditions, revenue and expense forecasts, product line changes, material, labor and overhead costs, tax rates, working capital levels and competitive environment. Future estimates, however derived, are inherently uncertain but the Company believes that this is the most appropriate source on which to base its fair value calculation.
The Company uses these parameters only to provide a basis for the determination of whether or not the goodwill related to a reporting unit is impaired. No inference whatsoever should be drawn from these parameters about the Company’s future financial performance and they should not be taken as projections or guidance of any kind.
The
2016
,
2015
and
2014
annual testing of goodwill for impairment did not result in impairment charges. The impairment charge taken in the third quarter of 2014 was associated with assets in the Germany reporting unit acquired from Bierbach in 2013. The factors that led to the third quarter impairment were a failure to retain Bierbach's historical customers and increased competition, which led to the reduction in the contingent consideration liability related to the Bierbach acquisition and resulted in management performing an impairment test to evaluate the recoverability of the Germany reporting unit's goodwill. The test resulted in the impairment of all of the reporting unit’s goodwill in the amount of
$0.5 million
. In connection with the impairment of the goodwill, the Company also reviewed associated long-lived assets in Germany, such as property and equipment and intangible assets, for recoverability by comparing the projected undiscounted net cash flows associated with those assets to their carrying values. No impairment of long-lived assets was required as a result of that review during the third quarter of 2014.
The annual changes in the carrying amount of goodwill, by segment, as of
December 31, 2015
and
2016
, were as follows, respectively:
|
(in thousands)
|
North
America |
Europe
|
Asia
Pacific |
Total
|
|||||||||||
|
Balance as of January 1, 2015:
|
|||||||||||||||
|
Goodwill
|
$
|
95,192
|
|
$
|
51,202
|
|
$
|
1,567
|
|
$
|
147,961
|
|
|||
|
Accumulated impairment losses
|
(10,666
|
)
|
(13,414
|
)
|
—
|
|
(24,080
|
)
|
|||||||
|
84,526
|
|
37,788
|
|
1,567
|
|
123,881
|
|
||||||||
|
Goodwill acquired
|
1,860
|
|
210
|
|
—
|
|
2,070
|
|
|||||||
|
Foreign exchange
|
(552
|
)
|
(1,278
|
)
|
(171
|
)
|
(2,001
|
)
|
|||||||
|
Balance as of December 31, 2015:
|
0
|
|
|||||||||||||
|
Goodwill
|
96,500
|
|
50,135
|
|
1,396
|
|
148,031
|
|
|||||||
|
Accumulated impairment losses
|
(10,666
|
)
|
(13,415
|
)
|
—
|
|
(24,081
|
)
|
|||||||
|
85,834
|
|
36,720
|
|
1,396
|
|
123,950
|
|
||||||||
|
Goodwill acquired
|
—
|
|
1,848
|
|
—
|
|
1,848
|
|
|||||||
|
Foreign exchange
|
93
|
|
(952
|
)
|
(21
|
)
|
(880
|
)
|
|||||||
|
Reclassifications
(1)
|
(439
|
)
|
—
|
|
—
|
|
(439
|
)
|
|||||||
|
Balance as of December 31, 2016:
|
0
|
|
|||||||||||||
|
Goodwill
|
96,154
|
|
51,031
|
|
1,375
|
|
148,560
|
|
|||||||
|
Accumulated impairment losses
|
(10,666
|
)
|
(13,415
|
)
|
—
|
|
(24,081
|
)
|
|||||||
|
$
|
85,488
|
|
$
|
37,616
|
|
$
|
1,375
|
|
$
|
124,479
|
|
||||
(1)
Reclassifications in 2016 of
$0.2 million
in patents,
$0.1 million
in non-compete agreements,
$46 thousand
in customer relationships and other assets, with a corresponding
$0.4 million
decrease in goodwill related to the EBTY acquisition.
Amortizable Intangible Assets
The total gross carrying amount and accumulated amortization of intangible assets, most of which are or will be, subject to amortization at
December 31, 2016
, were
$51.4 million
and
$28.6 million
, respectively. The aggregate amount of amortization expense of intangible assets for the years ended
December 31, 2016
,
2015
and
2014
was
$6.0 million
,
$6.1 million
and
$7.2 million
, respectively.
63
The annual changes in the carrying amounts of patents, unpatented technologies, customer relationships and non-compete agreements and other intangible assets subject to amortization as of
December 31, 2015
, and
2016
were as follows, respectively:
|
(in thousands)
|
Gross
Carrying
Amount
|
Accumulated
Amortization
|
Net
Carrying
Amount
|
||||||||
|
Patents
|
|||||||||||
|
Balance at January 1, 2015
|
$
|
1,758
|
|
$
|
(1,577
|
)
|
$
|
181
|
|
||
|
Acquisition
|
1,062
|
|
—
|
|
$
|
1,062
|
|
||||
|
Amortization
|
—
|
|
(102
|
)
|
(102
|
)
|
|||||
|
Foreign exchange
|
(7
|
)
|
—
|
|
(7
|
)
|
|||||
|
Removal of fully amortized assets
|
(1,300
|
)
|
1,300
|
|
—
|
|
|||||
|
Balance, at December 31, 2015
|
1,513
|
|
(379
|
)
|
1,134
|
|
|||||
|
Amortization
|
—
|
|
(149
|
)
|
(149
|
)
|
|||||
|
Reclassifications
(1)
|
212
|
|
—
|
|
212
|
|
|||||
|
Foreign exchange
|
(7
|
)
|
—
|
|
(7
|
)
|
|||||
|
Balance at December 31, 2016
|
$
|
1,718
|
|
$
|
(528
|
)
|
$
|
1,190
|
|
||
(1)
Reclassifications in 2016 of
$0.2 million
in patents,
$0.1 million
in non-compete agreements,
$46 thousand
in customer relationships and other assets, with a corresponding
$0.4 million
decrease in goodwill related to the EBTY acquisition.
|
(in thousands)
|
Gross
Carrying
Amount
|
Accumulated
Amortization
|
Net
Carrying
Amount
|
||||||||
|
Unpatented Technology
|
|||||||||||
|
Balance at January 1, 2015
|
$
|
22,797
|
|
$
|
(7,665
|
)
|
$
|
15,132
|
|
||
|
Amortization
|
—
|
|
(2,061
|
)
|
(2,061
|
)
|
|||||
|
Foreign exchange
|
(123
|
)
|
—
|
|
(123
|
)
|
|||||
|
Removal of fully amortized assets
|
(1,070
|
)
|
1,070
|
|
—
|
|
|||||
|
Balance, at December 31, 2015
|
21,604
|
|
(8,656
|
)
|
12,948
|
|
|||||
|
Amortization
|
—
|
|
(2,058
|
)
|
(2,058
|
)
|
|||||
|
Reclassifications
(2)
|
1,512
|
|
—
|
|
1,512
|
|
|||||
|
Foreign exchange
|
(243
|
)
|
$
|
—
|
|
(243
|
)
|
||||
|
Removal of fully amortized assets
|
(1,711
|
)
|
1,711
|
|
—
|
|
|||||
|
Balance at December 31, 2016
|
$
|
21,162
|
|
$
|
(9,003
|
)
|
$
|
12,159
|
|
||
(2)
Reclassifications in 2016 of
$1.5 million
in unpatented technology for completed IPR&D, with a corresponding reduction in indefinite-lived IPR&D intangibles.
|
(in thousands)
|
Gross
Carrying
Amount
|
Accumulated
Amortization
|
Net
Carrying
Amount
|
||||||||
|
Non-Compete Agreements,
Trademarks and Other
|
|||||||||||
|
Balance at January 1, 2015
|
$
|
10,839
|
|
(5,374
|
)
|
5,465
|
|
||||
|
Acquisition
|
25
|
|
—
|
|
25
|
|
|||||
|
Amortization
|
—
|
|
(2,039
|
)
|
(2,039
|
)
|
|||||
|
Foreign exchange
|
(76
|
)
|
—
|
|
(76
|
)
|
|||||
|
Removal of fully amortized assets
|
(210
|
)
|
210
|
|
—
|
|
|||||
|
Balance, at December 31, 2015
|
10,578
|
|
(7,203
|
)
|
3,375
|
|
|||||
|
Acquisition
|
1,212
|
|
—
|
|
1,212
|
|
|||||
|
Amortization
|
—
|
|
(2,040
|
)
|
(2,040
|
)
|
|||||
|
Reclassifications
(1)
|
119
|
|
—
|
|
119
|
|
|||||
|
Foreign exchange
|
(39
|
)
|
—
|
|
(39
|
)
|
|||||
|
Removal of fully amortized asset
|
(5,143
|
)
|
5,143
|
|
—
|
|
|||||
|
Balance at December 31, 2016
|
$
|
6,727
|
|
$
|
(4,100
|
)
|
$
|
2,627
|
|
||
(1)
Reclassifications in 2016 of
$0.2 million
in patents,
$0.1 million
in non-compete agreements,
$46 thousand
in customer relationships and other assets, with a corresponding
$0.4 million
decrease in goodwill related to the EBTY acquisition.
64
|
(in thousands)
|
Gross
Carrying
Amount
|
Accumulated
Amortization
|
Net
Carrying
Amount
|
||||||||
|
Customer Relationships
|
|||||||||||
|
Balance at January 1, 2015
|
$
|
21,346
|
|
(11,671
|
)
|
9,675
|
|
||||
|
Acquisition
|
474
|
|
—
|
|
474
|
|
|||||
|
Amortization
|
—
|
|
(1,881
|
)
|
(1,881
|
)
|
|||||
|
Foreign exchange
|
(178
|
)
|
—
|
|
(178
|
)
|
|||||
|
Removal of fully amortized assets
|
(400
|
)
|
400
|
|
—
|
|
|||||
|
Balance, at December 31, 2015
|
21,242
|
|
(13,152
|
)
|
8,090
|
|
|||||
|
Amortization
|
—
|
|
(1,793
|
)
|
(1,793
|
)
|
|||||
|
Reclassifications
(1)
|
46
|
|
—
|
|
46
|
|
|||||
|
Foreign exchange
|
(71
|
)
|
—
|
|
(71
|
)
|
|||||
|
Balance at December 31, 2016
|
$
|
21,217
|
|
$
|
(14,945
|
)
|
$
|
6,272
|
|
||
(1)
Reclassifications in 2016 of
$0.2 million
to patents,
$0.1 million
in non-compete agreements,
$46 thousand
in customer relationships and other assets, with a corresponding
$0.4 million
decrease in goodwill related to the EBTY acquisition.
At
December 31, 2016
, estimated future amortization of intangible assets was as follows:
(in thousands)
|
2017
|
$
|
4,728
|
|
|
2018
|
3,526
|
|
|
|
2019
|
3,447
|
|
|
|
2020
|
3,416
|
|
|
|
2021
|
2,937
|
|
|
|
Thereafter
|
4,194
|
|
|
|
$
|
22,248
|
|
|
Indefinite-Lived Intangible Assets
The annual changes in the carrying amounts of indefinite-lived trade name and IPR&D assets not subject to amortization as of
December 31, 2015
and
2016
, respectively, were as follows:
|
(in thousands)
|
Net
Carrying |
||||||||||
|
Indefinite-Lived Intangibles
|
Trade Name
|
IPR&D
|
Amount
|
||||||||
|
Balance, at January 1, 2015
|
$
|
616
|
|
$
|
1,518
|
|
$
|
2,134
|
|
||
|
Reclassifications
|
—
|
|
—
|
|
—
|
|
|||||
|
Foreign exchange
|
—
|
|
(6
|
)
|
(6
|
)
|
|||||
|
Balance, at December 31, 2015
|
616
|
|
1,512
|
|
2,128
|
|
|||||
|
Reclassifications
(2)
|
—
|
|
(1,512
|
)
|
(1,512
|
)
|
|||||
|
Foreign exchange
|
—
|
|
—
|
|
—
|
|
|||||
|
Balance at December 31, 2016
|
$
|
616
|
|
$
|
—
|
|
$
|
616
|
|
||
(2)
Reclassifications in 2016 of
$1.5 million
to unpatented technology for completed IPR&D, with a corresponding reduction in indefinite-lived IPR&D intangibles.
65
Amortizable and indefinite-lived assets, net, by segment, as of
December 31,
2015
and
2016
, respectively, were as follows:
|
|
December 31, 2015
|
||||||||||
|
|
Gross
Carrying Amount |
Accumulated
Amortization |
Net
Carrying Amount |
||||||||
|
(in thousands)
|
|||||||||||
|
Total Intangible Assets
|
|||||||||||
|
North America
|
$
|
27,475
|
|
$
|
(14,941
|
)
|
$
|
12,534
|
|
||
|
Europe
|
29,590
|
|
(14,449
|
)
|
15,141
|
|
|||||
|
Total
|
$
|
57,065
|
|
$
|
(29,390
|
)
|
$
|
27,675
|
|
||
|
|
At December 31, 2016
|
||||||||||
|
|
Gross
Carrying Amount |
Accumulated
Amortization |
Net
Carrying Amount |
||||||||
|
(in thousands)
|
|||||||||||
|
Total Intangible Assets
|
|||||||||||
|
North America
|
$
|
23,562
|
|
$
|
(13,811
|
)
|
$
|
9,751
|
|
||
|
Europe
|
27,880
|
|
(14,767
|
)
|
13,113
|
|
|||||
|
Total
|
$
|
51,442
|
|
$
|
(28,578
|
)
|
$
|
22,864
|
|
||
Recently Adopted Accounting Standards
In August 2014, the FASB issued Accounting Standards Update No. 2014-15 (Topic 205-40),
Disclosure of Uncertainties about an Entity’s Ability to Continue as a Going Concern
(“ASU 2014-15”). ASU 2014-15 requires management to evaluate relevant conditions, events and certain management plans that are known or reasonably knowable as of the evaluation date when determining whether substantial doubt about an entity’s ability to continue as a going concern exists. Under ASU 2014-5, the emergence of substantial doubt about a company’s ability to continue as a going concern is the trigger for providing footnote disclosure. Therefore, for each annual and interim reporting period, management should evaluate whether there are conditions that give rise to substantial doubt within one year from the financial statement issuance date. During the fourth quarter of 2016, the Company adopted ASU 2014-15 and applied the guidance prospectively. Adoption of ASU 2014-15 has had no material effect on the Company’s consolidated financial statements and footnote disclosures.
In July 2015, the FASB issued Accounting Standards Update No. 2015-11, (Topic 330),
Simplifying the Measurement of Inventory
(“ASU 2015-11”). The objective is to reduce the complexity related to inventory subsequent measurement and disclosure requirements. ASU 2015-11 amendments do not apply to inventory that is measured using last-in, first-out or the retail inventory method. The amendments apply to all other inventory, which includes inventory that is measured using first-in, first-out or average cost. Inventory within the scope of the new guidance should be measured at the lower of cost and net realizable value. Net realizable value is the estimated selling prices in the ordinary course of business, less reasonably predictable costs of completion, disposal and transportation. The amendments more closely align with the measurement of inventory in International Financial Reporting Standards. ASU 2015-11 will be effective for fiscal years beginning after December 15, 2016, including interim periods within those fiscal years. The amendments in ASU 2015-11 should be applied prospectively with earlier application permitted as of the beginning of an interim or annual reporting period. During the first quarter of 2016, the Company elected to adopt ASU 2015-11 ahead of its required effective date and applied the guidance prospectively. Early adoption of ASU 2015-11 has had no material effect on the Company's consolidated financial statements and footnote disclosures.
In November 2015, the FASB issued Accounting Standards Update No. 2015-17, Income Taxes (Topic 740),
Balance Sheet Classification of Deferred Taxes
("ASU 2015-17"). The objective is to simplify the presentation of deferred income taxes; the amendments require that deferred tax assets and liabilities be classified as noncurrent in a classified consolidated balance sheets. ASU 2015-17 will be effective for fiscal years beginning after December 15, 2016, including interim periods within those fiscal years. Earlier application is permitted for all entities as of the beginning of an interim or annual reporting period. The amendment may be applied either prospectively to all deferred tax liabilities and assets or retrospectively to all periods presented. During the first quarter of 2016, the Company elected to adopt ASU 2015-17 ahead of its required effective date and applied the guidance prospectively with no change to prior period's amounts disclosed in our consolidated balance sheets and related notes to the consolidated financial statements.
Early adoption of ASU 2015-17, in the first quarter of 2016, resulted in the Company offsetting all of its deferred income tax assets and liabilities, as of January 1, 2016, by taxing jurisdiction and classifying those balances as noncurrent. The result was a
$4.1 million
increase in "Other noncurrent assets," from
$6.7 million
to
$10.8 million
, and a
$12.1 million
decrease in "Deferred income tax and other long-term liabilities," from
$16.5 million
to
$4.4 million
.
66
Recently Issued Accounting Standards Not Yet Adopted
In May 2014, the FASB issued Accounting Standards Update No. 2014-09,
Revenue from Contracts with Customers
("ASU 2014-09"). ASU 2014-09 supersedes nearly all existing revenue recognition guidance under GAAP. The amendments provide a revenue recognition five-step model to be applied to all revenue contracts with customers. In 2016, the FASB issued final amendments to clarify the implementation guidance for principal versus agent considerations, identifying performance obligations and the accounting for licenses of intellectual property. The standard is effective for annual and interim periods beginning after December 15, 2017. The Company expects to adopt the new standard effective January 1, 2018. The new standard also permits two methods of adoption: retrospectively to each prior reporting period presented (full retrospective method), or retrospectively with the cumulative effect of initially applying the guidance recognized at the date of initial application (the modified retrospective method). The Company is currently in the process of determining its method of adoption, which depends in part upon the completion of the analysis on the impact this guidance has on the Company's revenue arrangements. The Company expects to complete its analysis of the impact of the updated revenue-recognition guidance on the Company's revenue arrangements by October of 2017. The Company’s approach includes performing a detailed review of key contracts representative of the Company’s products. In addition, comparing historical accounting policies and practices to the new standard on the Company’s revenue arrangements. Based on current information and subject to future events and circumstances, the Company does not know whether the new revenue recognition standard will have a material impact on its financial statements upon adoption.
In February 2016, the FASB issued Accounting Standards Update No. 2016-02, (Topic 842),
Leases
(“ASU 2016-02”).
ASU 2016-02 core requirement is to recognize the assets and liabilities that arise from leases including those leases classified as operating leases. The amendments require a lessee to recognize in the statement of financial position a liability to make lease payments (the lease liability) and a right-of-use asset representing its right to use the underlying asset for the lease term. For leases with a term of 12 months or less, a lessee is permitted to make an accounting policy election by class of underlying asset not to recognize lease assets and lease liabilities. If a lessee makes this election, it should recognize lease expense for such leases generally on a straight-line basis over the lease term. The lessor accounting application is largely unchanged from that applied previously under GAAP. In transition, lessees and lessors are required to recognize and measure leases at the beginning of the earliest period presented using a modified retrospective approach. The amendments in this ASU are effective for fiscal years beginning after December 15, 2018, including interim periods within those fiscal years. Early application of the amendments in this Update is permitted for all entities. Based on current information and subject to future events and circumstances, the Company does not know whether the new operating lease standard will have a material impact on its financial statements upon adoption.
In March 2016, the FASB issued Accounting Standards Update No. 2016-09 (Topic 718), Compensation - Stock Compensation:
Improvements to Employee Share-Based Payment Accounting
(“ASU 2016-09”). The amendments simplify several aspects of the accounting for employee share-based payment transactions including accounting for income taxes, forfeitures, statutory tax withholding requirements, and classification in the statement of cash flows. ASU 2016-09 is effective for fiscal years, and interim periods within those fiscal years, beginning after December 15, 2016. Based on current information and subject to future events and circumstances, the Company does not believe the improved stock compensation standard will have a material impact on its financial statements upon adoption.
|
2.
|
Acquisitions
|
In December 2015, the Company purchased all of the business assets including intellectual property from Blue Heron Enterprises, LLC, and Fox Chase Enterprises, LLC (collectively, "EBTY"), both New Jersey limited liability companies, for
$3.4 million
in cash. EBTY manufactured and sold hidden deck clips and products and systems using a patented design. EBTY's patented design for hidden deck clips and products and systems will complement the Company's line of hidden clips and fastener systems. The Company's measurement of assets acquired included goodwill of
$2.0 million
, which was assigned to the North America segment, and intangible assets of
$1.1 million
, both of which are subject to tax-deductible amortization. Net assets consisting of inventory and equipment accounted for the balance of the purchase price. The weighted-average amortization period for the intangible assets is
7
years.
In August 2016, the Company purchased all of the outstanding shares of Multi Services Dêcoupe S.A. ("MS Decoupe"), a Belgium public limited company, for
$6.9 million
. MS Decoupe primarily manufactures and distributes wood construction, plastic and metal labeling products in Belgium and the Netherlands, including distributing the Company's products manufactured at the Company's production facility in France. With this acquisition, the Company could potentially offer the Belgium market a wider-range of its products, shorten delivery lead times, and expand the Company's sales presence into the Netherlands market. The Company's provisional measurement of assets acquired and liabilities assumed included cash and cash equivalents of
$1.5 million
, other current assets of
$2.1 million
, non-current assets of
$5.0 million
, current liabilities of
$0.7 million
and non-current deferred
67
income tax liabilities of
$1.0 million
. Included in non-current assets was goodwill of
$1.9 million
, which was assigned to the Europe segment, and intangible assets of
$1.2 million
, both of which are not subject to tax-deductible amortization. The estimated weighted-average amortization period for the intangible assets is
7
years.
Under the business combinations topic of the FASB ASC 805, the Company accounted for these acquisitions as business combinations and ascribed acquisition-date fair values to the acquired assets and assumed liabilities. Fair value of intangible assets was based on Level 3 inputs.
The results of operations of the businesses acquired in 2014 through 2016 are included in the Company’s consolidated results of operations since the date of the acquisition. They were not material to the Company on an individual or aggregate basis, and accordingly, pro forma results of operations have not been presented.
See “Note 15 — Subsequent Events” for the Company’s acquisitions that took place following December 31, 2016.
|
3.
|
Trade Accounts Receivable, net
|
Trade accounts receivable consisted of the following:
|
|
December 31,
|
||||||
|
(in thousands)
|
2016
|
2015
|
|||||
|
Trade accounts receivable
|
$
|
116,368
|
|
$
|
109,859
|
|
|
|
Allowance for doubtful accounts
|
(895
|
)
|
(1,142
|
)
|
|||
|
Allowance for sales discounts
|
(3,050
|
)
|
(2,706
|
)
|
|||
|
|
$
|
112,423
|
|
$
|
106,011
|
|
|
The Company sells products on credit and generally does not require collateral.
|
4.
|
Inventories
|
The components of inventories consisted of the following:
|
|
December 31,
|
||||||
|
(in thousands)
|
2016
|
2015
|
|||||
|
Raw materials
|
$
|
86,524
|
|
$
|
75,950
|
|
|
|
In-process products
|
20,902
|
|
18,828
|
|
|||
|
Finished products
|
124,848
|
|
100,979
|
|
|||
|
|
$
|
232,274
|
|
$
|
195,757
|
|
|
68
|
5.
|
Property, Plant and Equipment, net
|
Property, plant and equipment consisted of the following:
|
|
December 31,
|
||||||
|
(in thousands)
|
2016
|
2015
|
|||||
|
Land
|
$
|
32,127
|
|
$
|
28,698
|
|
|
|
Buildings and site improvements
|
183,882
|
|
171,890
|
|
|||
|
Leasehold improvements
|
5,550
|
|
5,560
|
|
|||
|
Machinery and equipment
|
248,861
|
|
232,560
|
|
|||
|
|
470,420
|
|
438,708
|
|
|||
|
Less accumulated depreciation and amortization
|
(273,302
|
)
|
(257,115
|
)
|
|||
|
|
197,118
|
|
181,593
|
|
|||
|
Capital projects in progress
|
35,692
|
|
32,123
|
|
|||
|
|
$
|
232,810
|
|
$
|
213,716
|
|
|
Included in property, plant and equipment at
December 31, 2016
and
2015
, are fully depreciated assets with an original cost of
$166.7 million
and
$156.7 million
, respectively. These fully depreciated assets are still in use in the Company’s operations.
The Company capitalizes certain development costs associated with internal use software, including external direct costs of materials and services and payroll costs for employees devoting time to a software project. As of
December 31, 2016
and
2015
, depreciable capitalized software development costs were
$4.6 million
and
$1.6 million
, respectively, and included in capital projects in progress at
December 31, 2016
and
2015
, were software in development costs of
$13.5 million
and
$12.2 million
, respectively. Costs incurred during the preliminary project stage, as well as costs for maintenance and training, are expensed as incurred.
Depreciation expense was
$21.6 million
for the year ended
December 31, 2016
and
$20.4 million
for both of the years ended December 31,
2015
and
2014
.
In December 2015, the Company purchased for
$12.6 million
a manufacturing facility in West Chicago for the purposes of combining the operations of its two leased chemical facilities into one owned facility. During 2016, the Company incurred
$7.3 million
in improvement costs to build out of the new facility. In 2016, the Company approved the expansion of the McKinney facility, which it estimates will cost
$17.0 million
to
$19.0 million
.
6. Investments
At December 23, 2016, the Company acquired a
25.0%
equity interest in Ruby Sketch Pty Ltd. (“Ruby Sketch”), an Australian proprietary limited company, for
$2.5 million
, for which the Company accounts for its ownership interest using the equity accounting method. Ruby Sketch develops software that assists in designing residential structures, primarily used in Australia and potentially for the North America market. The Company’s future relationship with Ruby Sketch also could potentially include the specification of the Company’s products in the Ruby Sketch software. The Company has no obligation to make any additional capital contributions to Ruby Sketch.
69
|
7.
|
Accrued Liabilities
|
Accrued liabilities consisted of the following:
|
|
December 31,
|
||||||
|
(in thousands)
|
2016
|
2015
|
|||||
|
Sales incentive and advertising accruals
|
$
|
25,761
|
|
$
|
22,235
|
|
|
|
Vacation liability
|
7,432
|
|
7,001
|
|
|||
|
Dividend payable
|
8,535
|
|
7,716
|
|
|||
|
Labor related liabilities
|
8,431
|
|
7,720
|
|
|||
|
Other
|
10,318
|
|
10,089
|
|
|||
|
|
$
|
60,477
|
|
$
|
54,761
|
|
|
|
8.
|
Debt
|
The Company has revolving lines of credit with various banks in the United States and Europe. Total available credit at
December 31, 2016
was
$303.8 million
, including revolving credit lines and an irrevocable standby letter of credit in support of various insurance deductibles.
The Company’s primary credit facility is a revolving line of credit with
$300.0 million
in available credit. On July 25, 2016, the Company entered into a second amendment (the "Amendment") to the credit facility. For additional information about the Amendment, see the Company's Current Report on Form 8-K dated July 28, 2016. As amended, this credit facility expires on July 23, 2021. Amounts borrowed under this credit facility will bear interest at an annual rate equal to either, at the Company’s option, (a) the rate for Eurocurrency deposits for the corresponding deposits of United States dollars appearing on Reuters LIBOR1screen page (the “LIBOR Rate”), adjusted for any reserve requirement in effect, plus a spread of
0.60%
to
1.45%
, determined quarterly based on the Company’s leverage ratio (at
December 31, 2016
, the LIBOR Rate was
0.72%
), or (b) a
base rate
, plus a spread of
0.00%
to
0.45%
, determined quarterly based on the Company’s leverage ratio. The base rate is defined in a manner such that it will not be less than the LIBOR Rate. The Company will pay fees for standby letters of credit at an annual rate equal to the applicable spread described above, and will pay market-based fees for commercial letters of credit. The Company is required to pay an annual facility fee of
0.15%
to
0.30%
of the available commitments under the credit agreement, regardless of usage, with the applicable fee determined on a quarterly basis based on the Company’s leverage ratio. The Company was also required to pay customary fees as specified in a separate fee agreement between the Company and Wells Fargo Bank, National Association, in its capacity as the Administrative Agent under the credit facility.
In addition to the $300.0 million credit facility, the Company’s borrowing capacity under other revolving credit lines totaled
$3.8 million
at
December 31, 2016
. The other revolving credit lines charge interest ranging from
0.48%
to
7.75%
and have maturity dates from March 2017 to December 2017. The Company had
no
outstanding balance on any of its revolving credit lines at
December 31, 2016
and 2015, respectively.
The Company and its subsidiaries are required to comply with various affirmative and negative covenants. The covenants include provisions that would limit the availability of funds as a result of a material adverse change to the Company’s financial position or results of operations. The Company was in compliance with its financial covenants under the loan agreement as of
December 31, 2016
.
The Company incurs interest costs, which include interest, maintenance fees and bank charges. The amount of costs incurred, capitalized, and expensed for the years ended
December 31, 2016
,
2015
and
2014
, consisted of the following:
|
|
Years Ended December 31,
|
||||||||||
|
2016
|
2015
|
2014
|
|||||||||
|
Interest costs incurred
|
$
|
1,167
|
|
$
|
1,133
|
|
$
|
953
|
|
||
|
Less: Interest capitalized
|
(20
|
)
|
(136
|
)
|
(98
|
)
|
|||||
|
Interest expense
|
$
|
1,147
|
|
$
|
997
|
|
$
|
855
|
|
||
70
|
9.
|
Commitments and Contingencies
|
Leases
Certain properties occupied by the Company are leased. The leases expire at various dates through 2026 and generally require the Company to assume the obligations for insurance, property taxes and maintenance of the facilities.
Rental expense for
2016
,
2015
and
2014
with respect to all leased property was approximately
$5.9 million
,
$6.6 million
and
$6.9 million
, respectively.
At
December 31, 2016
, minimum rental commitments under all non-cancelable leases were as follows:
(in thousands)
|
2017
|
$
|
5,857
|
|
|
2018
|
4,539
|
|
|
|
2019
|
3,335
|
|
|
|
2020
|
2,738
|
|
|
|
2021
|
1,822
|
|
|
|
Thereafter
|
2,966
|
|
|
|
Total
|
$
|
21,257
|
|
Some of these minimum rental commitments contain renewal options and provide for periodic rental adjustments based on changes in the consumer price index or current market rental rates. Other rental commitments provide options to cancel early without penalty. Future minimum rental payments, under the earliest cancellation options, are included in minimum rental commitments in the table above.
Other Contractual Obligations
Purchase obligations consist of commitments primarily related to the acquisition, construction or expansion of facilities and equipment, consulting agreements, and minimum purchase quantities of certain raw materials. The Company is not a party to any long-term supply contracts with respect to the purchase of raw materials or finished goods. Debt interest obligations include annual facility fees on the Company’s primary line-of-credit facility. Interest on line-of-credit facilities was estimated based on historical borrowings and repayment patterns.
At
December 31, 2016
, other contractual obligations were as follows:
(in thousands)
|
As of December 31, 2016
|
Debt Interest Obligations
|
Purchase Obligations
|
Total
|
||||||||
|
2017
|
$
|
450
|
|
$
|
33,222
|
|
$
|
33,672
|
|
||
|
2018
|
450
|
|
847
|
|
1,297
|
|
|||||
|
2019
|
450
|
|
104
|
|
554
|
|
|||||
|
2020
|
450
|
|
96
|
|
546
|
|
|||||
|
2021
|
250
|
|
96
|
|
346
|
|
|||||
|
Thereafter
|
—
|
|
—
|
|
—
|
|
|||||
|
Total
|
$
|
2,050
|
|
$
|
34,365
|
|
$
|
36,415
|
|
||
Employee Relations
Approximately
20%
of the Company’s employees are represented by labor unions and are covered by collective bargaining agreements. The Company’s facility in Stockton, California, is also a union facility with two collective bargaining agreements, which also cover tool and die craftsmen and maintenance workers and sheetmetal workers, respectively. These two contracts will expire in July and September 2019, respectively. The Company’s facility in San Bernardino County, California, has
two
of the
71
Company's collective bargaining agreements,
one
with tool and die craftsmen and maintenance workers, and the other with sheetmetal workers. These
two
contracts expire in February 2017 and June 2018, respectively. The Company expects to agree with the San Bernardino tool and die craftsmen and maintenance workers union to extend the existing labor union contract that expires in February 2017, while the parties are negotiating a new agreement. The Company has not begun negotiations to extend the sheetmetal workers union labor contract that expires in June 2018. The Company believes that, even if new agreements are not reached before the existing labor union contracts expire, it is not likely to have a material adverse effect on the Company’s ability to provide products to customers or on the Company’s profitability.
Environmental
The Company’s policy with regard to environmental liabilities is to accrue for future environmental assessments and remediation costs when information becomes available that indicates that it is probable that the Company is liable for any related claims and assessments and the amount of the liability is reasonably estimable. The Company does not believe that any such matters will have a material adverse effect on the Company’s financial condition, cash flows or results of operations.
Litigation
From time to time, the Company is involved in various legal proceedings and other matters arising in the normal course of business. Corrosion, hydrogen enbrittlement, cracking, material hardness, wood pressure-treating chemicals, misinstallations, misuse, design and assembly flaws, manufacturing defects, labeling defects, product formula defects, inaccurate chemical mixes, adulteration, environmental conditions, or other factors can contribute to failure of fasteners, connectors, anchors, adhesives, specialty chemicals, such as fiber reinforced polymers, and tool products. In addition, inaccuracies may occur in product information, descriptions and instructions found in catalogs, packaging, data sheets, and the Company’s website.
As of February 28, 2017, the Company is not a party to any legal proceedings, other than ordinary routine litigation incidental to the Company’s business, which the Company expects individually or in the aggregate to have a material adverse effect on the Company’s financial condition, cash flows or results of operations. Nonetheless, the resolution of any claim or litigation is subject to inherent uncertainty and could have a material adverse effect on the Company’s financial condition, cash flows or results of operations.
Potential Third-Party Claims
Nishimura v. Gentry Homes, Ltd.,
Civil No. 11-1-1522-07, was filed in the Hawaii First Circuit court on July 20, 2011. The
Nishimura
case involves claims by homeowners at a Honolulu development, Ewa by Gentry, related to alleged corrosion of strap-tie holdowns and mud-sill anchor products supplied by the Company. Ewa by Gentry consists of approximately
2,400
homes.
The Company is not currently a party to the
Nishimura
case. The plaintiff homeowners originally sued the developer Gentry Homes, Ltd. (“Gentry”) as well as the Company. In 2012 and 2013, the Hawaii First Circuit granted the Company’s motions to dismiss and for summary judgment, resulting in the dismissal of all of the plaintiff homeowners’ claims against the Company, and the Company is not currently a party to the proceedings. The dismissed claims against the Company remain subject to potential appeal by the plaintiffs. Further, Gentry may in the future seek to sue the Company for indemnity or contribution if Gentry is ultimately found liable for any loss suffered by the plaintiff homeowners.
The Company initially understood from Gentry there were no significant damages claims related to Ewa by Gentry development. In May 2015, the plaintiff homeowners filed a second amended complaint to name a new representative plaintiff because the original representative plaintiffs had not suffered damage. In August 2016, Gentry advised the Company for the first time that other plaintiff homeowners had documented serious corrosion of mudsill anchors and strap-tie holdowns in a substantial number of homes. The plaintiff homeowners and Gentry are currently proceeding in arbitration and the Hawaii state court lawsuit has been stayed pending the conclusion of arbitration. Gentry has not asserted any third party claim against the Company, but has reserved the right to seek to do so.
In the
Nishimura
case and in the arbitration, the plaintiff homeowners seek damages according to proof. At this time, the Company cannot reasonably ascertain the likelihood that Gentry will be found responsible for substantial damages to the homeowners; whether, if so, Gentry would proceed against the Company; whether any legal theory against the Company might be viable, or the extent of the liability the Company might face if Gentry were to proceed against it.
The Company admits no liability in connection with the
Nishimura
case. It will vigorously defend any claims, whether appeal by the plaintiff homeowners, or third party claims by Gentry. Based on facts currently known to the Company and subject to future
72
events and circumstances, the Company believes that all or part of any claims that any party might seek to allege against it related to the Nishimura case may be covered by its insurance policies.
Charles Vitale, et al. v. D.R. Horton, Inc. and D.R. Horton-Schuler Homes, LLC
, Civil No. 15-1-1347-07, a putative class action lawsuit, was filed in the Hawaii First Circuit on July 13, 2015, in which homeowner plaintiffs allege that all homes built by D.R Horton/D.R. Horton-Schuler Homes in the State of Hawaii have strap-tie holdowns that are suffering premature corrosion. The complaint alleges that various manufacturers make strap-tie holdowns that suffer from such corrosion, but does not identify the Company’s products specifically. The Company is not currently a party to the
Vitale
lawsuit, but the lawsuit in the future could potentially involve the Company’s strap-tie holdowns.
Given the preliminary nature and the complexities involved in the
Nishimura
and
Vitale
proceedings, the Company is unable to estimate reasonably a likelihood of possible loss or range of possible loss until the Company knows, among other factors, (i) whether it will be named in the lawsuit by any party; (ii) the specific claims and the legal theories on which they are based (iii) what claims, if any, will survive dispositive motion practice, (iv) the extent of the claims, including the size of any potential class, particularly as damages are not specified or are indeterminate, (v) how the discovery process will affect the litigation, (vi) the settlement posture of the other parties to the litigation, (vii) the extent to which the Company’s insurance policies will cover the claims or any part thereof, if at all, (viii) whether class treatment is appropriate; and (ix) any other factors that may have a material effect on the litigation.
While it is not feasible to predict the outcome of proceedings, to which the Company is not currently a party, or reasonably estimate a possible loss or range of possible loss for the Company related to such matters, in the opinion of the Company, either the likelihood of loss from such proceedings is remote or any reasonably possible loss associated with the resolution of such proceedings is not expected to be material to the Company’s financial position, results of operations or cash flows either individually or in the aggregate. Nonetheless, the resolution of any claim or litigation is subject to inherent uncertainty and could have a material adverse effect on the Company’s financial condition, cash flows or results of operations.
|
10.
|
Income Taxes
|
The provision for income taxes from operations consisted of the following:
|
|
Years Ended December 31,
|
||||||||||
|
(in thousands)
|
2016
|
2015
|
2014
|
||||||||
|
Current
|
|
|
|
|
|
|
|||||
|
Federal
|
$
|
39,649
|
|
$
|
29,684
|
|
$
|
25,178
|
|
||
|
State
|
7,053
|
|
5,001
|
|
4,391
|
|
|||||
|
Foreign
|
3,333
|
|
3,568
|
|
4,041
|
|
|||||
|
Deferred
|
0
|
|
|
|
|
|
|||||
|
Federal
|
260
|
|
2,390
|
|
2,264
|
|
|||||
|
State
|
13
|
|
753
|
|
142
|
|
|||||
|
Foreign
|
(1,142
|
)
|
(605
|
)
|
(225
|
)
|
|||||
|
|
$
|
49,166
|
|
$
|
40,791
|
|
$
|
35,791
|
|
||
Income and loss from operations before income taxes for the years ended
December 31, 2016
,
2015
, and
2014
, respectively, consisted of the following:
|
|
Years Ended December 31,
|
||||||||||
|
(in thousands)
|
2016
|
2015
|
2014
|
||||||||
|
Domestic
|
$
|
131,827
|
|
$
|
106,381
|
|
$
|
90,142
|
|
||
|
Foreign
|
7,073
|
|
2,298
|
|
9,180
|
|
|||||
|
|
$
|
138,900
|
|
$
|
108,679
|
|
$
|
99,322
|
|
||
73
Reconciliations between the statutory federal income tax rates and the Company’s effective income tax rates as a percentage of income before income taxes for its operations were as follows:
|
|
Years Ended December 31,
|
|||||||
|
(in thousands)
|
2016
|
2015
|
2014
|
|||||
|
Federal tax rate
|
35.0
|
%
|
35.0
|
%
|
35.0
|
%
|
||
|
State taxes, net of federal benefit
|
3.4
|
%
|
3.3
|
%
|
3.0
|
%
|
||
|
Tax benefit of domestic manufacturing deduction
|
(2.5
|
)%
|
(2.3
|
)%
|
(2.4
|
)%
|
||
|
Change in valuation allowance
|
(0.1
|
)%
|
1.3
|
%
|
1.5
|
%
|
||
|
Difference between United States statutory and foreign local tax rates
|
(0.3
|
)%
|
0.2
|
%
|
(0.4
|
)%
|
||
|
Change in uncertain tax position
|
(0.2
|
)%
|
0.3
|
%
|
(0.8
|
)%
|
||
|
Other
|
0.1
|
%
|
(0.3
|
)%
|
0.1
|
%
|
||
|
Effective income tax rate
|
35.4
|
%
|
37.5
|
%
|
36.0
|
%
|
||
The tax effects of the significant temporary differences that constitute the deferred tax assets and liabilities at
December 31, 2016
and
2015
, respectively, were as follows:
|
|
December 31,
|
||||||
|
(in thousands)
|
2016
|
2015
|
|||||
|
Deferred asset taxes
|
|
|
|
|
|||
|
State tax
|
$
|
2,518
|
|
$
|
1,762
|
|
|
|
Workers’ compensation
|
1,381
|
|
1,777
|
|
|||
|
Health claims
|
755
|
|
746
|
|
|||
|
Vacation liability
|
1,485
|
|
1,410
|
|
|||
|
Allowance for doubtful accounts
|
123
|
|
205
|
|
|||
|
Inventories
|
6,833
|
|
6,112
|
|
|||
|
Sales incentive and advertising allowances
|
1,126
|
|
963
|
|
|||
|
Acquisition costs
|
528
|
|
—
|
|
|||
|
Unrealized foreign exchange gain or loss
|
678
|
|
247
|
|
|||
|
Stock-based compensation
|
5,550
|
|
5,629
|
|
|||
|
Foreign tax credit carryforwards
|
1,288
|
|
1,345
|
|
|||
|
Uncertain tax positions’ unrecognized tax benefits
|
104
|
|
134
|
|
|||
|
Foreign tax loss carry forward
|
6,841
|
|
7,082
|
|
|||
|
Other
|
1,259
|
|
1,433
|
|
|||
|
$
|
30,469
|
|
$
|
28,845
|
|
||
|
Less valuation allowances
|
(6,868
|
)
|
(7,576
|
)
|
|||
|
23,601
|
|
21,269
|
|
||||
|
Deferred tax liabilities
|
|
|
|
|
|||
|
Depreciation
|
$
|
(6,138
|
)
|
$
|
(5,265
|
)
|
|
|
Goodwill and other intangibles amortization
|
(14,126
|
)
|
(11,835
|
)
|
|||
|
Tax effect on cumulative translation adjustment
|
(667
|
)
|
(974
|
)
|
|||
|
Other
|
(744
|
)
|
(1,023
|
)
|
|||
|
(21,675
|
)
|
(19,097
|
)
|
||||
|
Total Deferred tax
|
$
|
1,926
|
|
$
|
2,172
|
|
|
Prospective adoption of ASU 2015-17, in the first quarter of 2016, resulted in the Company offsetting all of its deferred income
tax assets and liabilities, as of January 1, 2016, by taxing jurisdiction and classifying those balances as noncurrent. The result was
74
$4.1 million
being classified as "Other noncurrent assets," and a
$1.9 million
being classified as "Deferred income tax and other long-term liabilities." The offsetting of all of the Company's deferred income tax assets and liabilities as of December 31, 2016, by taxing jurisdiction, resulted in
$4.3 million
being classified as "Other noncurrent assets" and
$2.4 million
being classified as "Deferred income tax and other long-term liabilities."
At
December 31, 2016
, the Company had
$30.8 million
of pre-tax loss carryforwards in various foreign taxing jurisdictions, which includes approximately
$4.3 million
that were generated by the Company’s Beijing and Thailand subsidiaries that are in the process of liquidating. Tax loss carryforwards of
$1.5 million
,
$1.2 million
,
$1.7 million
,
$1.5 million
,
$0.3 million
,
$92 thousand
and
$0.3 million
will expire in 2017, 2018, 2019, 2020, 2021, 2022, and 2023 respectively, if not used. The remaining tax losses can be carried forward indefinitely.
At
December 31, 2016
, and
2015
, the Company had deferred tax valuation allowances of
$6.9 million
and
$7.6 million
, respectively. The valuation allowance decreased
$0.7 million
and
$0.8 million
for the years ended
December 31, 2016
and
2015
, respectively.
The Company does not provide for federal income taxes on the undistributed earnings of its international subsidiaries because such earnings are reinvested and, in the Company’s opinion, will continue to be reinvested indefinitely. At
December 31, 2016
,
2015
and
2014
, the Company had not provided for federal income taxes on undistributed earnings of
$57.7 million
,
$51.6 million
and
$45.6 million
, respectively, from its international subsidiaries. Should these earnings be distributed in the form of dividends or otherwise, the Company would be subject to both United States income taxes and withholding taxes in various international jurisdictions. These taxes may be partially offset by United States foreign tax credits. Determination of the related amount of unrecognized deferred United States income taxes is not practicable because of the complexities associated with this hypothetical calculation. United States federal income taxes are provided on the earnings of the Company’s foreign branches, which are included in the United States federal income tax return.
A reconciliation of the beginning and ending amounts of unrecognized tax benefits in
2016
,
2015
and
2014
, respectively, was as follows, including foreign translation amounts:
|
Reconciliation of Unrecognized Tax Benefits
|
2016
|
2015
|
2014
|
||||||||
|
Balance at January 1
|
$
|
1,107
|
|
$
|
1,307
|
|
$
|
3,456
|
|
||
|
Additions based on tax positions related to prior years
|
204
|
|
310
|
|
7
|
|
|||||
|
Reductions based on tax positions related to prior years
|
—
|
|
(514
|
)
|
(1,146
|
)
|
|||||
|
Additions for tax positions of the current year
|
155
|
|
191
|
|
165
|
|
|||||
|
—
|
|
—
|
|
(680
|
)
|
||||||
|
Lapse of statute of limitations
|
(347
|
)
|
(187
|
)
|
(495
|
)
|
|||||
|
Balance at December 31
|
$
|
1,119
|
|
$
|
1,107
|
|
$
|
1,307
|
|
||
There are
no
tax positions included in the balance of unrecognized tax benefits at
December 31, 2016
and
2014
. A tax position of
$0.2 million
is included at December 31, 2015, which, if recognized, would reduce the effective tax rate.
The Company recognizes accrued interest and penalties related to unrecognized tax benefits in income tax expense, which is a continuation of the Company’s historical accounting policy. During the years ended
December 31, 2016
,
2015
and
2014
, accrued interest decreased by
$61 thousand
,
$30 thousand
and
$0.2 million
, respectively, as a result of the reversal of accrued interest associated with the lapses of statutes of limitations. The Company had accrued
$0.2 million
for each of the fiscal years ended
2016
,
2015
and
2014
, for the potential payment of interest, before income tax benefits.
At
December 31, 2016
, the Company remained subject to United States federal income tax examinations for the tax years 2013 through
2016
. In addition, the Company remained subject to state, local and foreign income tax examinations primarily for the tax years 2011 through
2016
.
|
11.
|
Retirement Plans
|
The Company has
five
defined contribution retirement plans covering substantially all salaried employees and nonunion hourly employees. On January 1, 2015, the Simpson Manufacturing Co., Inc. 401(k) Profit Sharing Plan for Salaried Employees was amended, restated and superseded by the Simpson Manufacturing Co., Inc. 401(k) Profit Sharing Plan (the “Restated Plan”), and the Simpson Manufacturing Co., Inc. 401(k) Profit Sharing Plan for Hourly Employees was merged with and incorporated into the Restated Plan. The Restated Plan, covering United States employees, provides for quarterly contributions, limited to
3%
of
75
the employees quarterly eligible compensation, that does not require Board approval and for annual contributions in amounts that the Board authorizes, subject to certain limitations, but in no event are total contributions more than the amounts permitted under the Internal Revenue Code as deductible expense. The other
four
plans, covering the Company’s European and Canadian employees, require the Company to make contributions ranging from
3%
to
15%
of the employees’ compensation. The total cost for these retirement plans for the years ended
December 31, 2016
,
2015
and
2014
, was
$10.1 million
,
$9.5 million
and
$8.0 million
, respectively.
The Company also contributes to various industry-wide, union-sponsored pension funds for hourly employees who are union members and a statutorily required pension fund for employees in Switzerland. Payments to these funds aggregated
$3.1 million
,
$2.5 million
and
$2.3 million
for the years ended
December 31, 2016
,
2015
and
2014
, respectively.
Settlement of Pension Withdrawal Liability
Under the Company's collective bargaining arrangement with the tool and die craftsman and maintenance union, the Company has been contributing to a defined-benefit pension plan. In 2014, the Company and the union formally notified the defined-benefit pension plan administrator of their intent to withdraw from the plan. In the third quarter of 2014, the plan administrator responded by issuing a demand letter informing the Company that the annual withdrawal liability payment to be made by the Company was
$145,400
and the payments were to be made in perpetuity.
Due to the amount and duration of payments, the Company was required to calculate and record a pension expense and liability based on the annual payments in perpetuity. At December 31, 2014, the Company discounted the payment estimate using a discount rate of
4.5%
, which approximates the credit-adjusted risk-free rate for the Company and recorded a long-term liability of
$3.3 million
with a corresponding defined-benefit expense in cost of sales. On a quarterly basis, the Company re-evaluated the number of years that payments are required and the discount rate used to calculate the long-term liability and adjusted it as facts and circumstances changed. All adjustments to the long-term liability were charged to cost of sales in the accompanying Consolidated Statements of Operations. Because of the funding status of the plan, the annual withdrawal liability payments were recorded as interest expense on the long-term liability.
In September of 2015, the defined-benefit pension plan trustees and the Company agreed to settle this long-term pension withdrawal liability, which at the time had a
$3.0
million balance, for
$2.0
million. As a result of the settlement, the Company reduced the long-term pension withdrawal liability by
$1.0
million with a corresponding defined benefit expense reduction in cost of sales. The
$2.0
million long-term pension withdrawal liability was fully paid as of September 30, 2015.
|
12.
|
Related Party Transactions
|
In March 2013, the Company extended its lease on a property in Addison, Illinois, which is co-owned by Gerald Hagel, a vice president of Simpson Strong-Tie Company Inc. since March 2007. The extension was for an additional
five
years through 2018. The Company paid
$0.3 million
in 2016 to lease the property from Mr. Hagel and his wife, Susan Hagel, a former employee of Simpson Strong-Tie Company Inc.
In 2016, the Company paid Tacit Knowledge, Inc. ("Tacit Knowledge"), a consultant on a software implementation project,
$1.9 million
for its services. The project started in 2015 and is expected to be continuing in 2017. Chris Andrasick, the Company's Director James S. Andrasick’s son, co-founded Tacit Knowledge in 2002. Tacit Knowledge was sold to Newgistics, Inc. ("Newgistics") in 2013. Chris Andrasick was hired by Newgistics in 2013, as its Chief Strategy and Innovation Officer for Digital Commerce, but has had no financial interest in Tacit Knowledge since the 2013 acquisition, other than in his role as an officer of Newgistics. The payments that the Company made to Tacit Knowledge in 2016 were less than
0.5%
of Newgistics' consolidated gross revenues for the fiscal year ended December 31, 2016.
In 2016, Karen Colonias, the Company’s Chief Executive Officer, was named as a director of Reliance Steel & Aluminum Co. (“Reliance”). Reliance, through its subsidiaries, has been a provider of steel processing and handling services for the Company for several years. In 2016, the Company paid Reliance
$0.7 million
for its services. The relationship between the Company and Reliance is expected to be continuing in 2017.
|
13.
|
Stock-Based Compensation
|
The Company has
one
stock-based incentive plan, the 2011 Plan, which incorporates and supersedes its
two
previous plans except for awards previously granted under the two plans (see "Note 1 —
Accounting for Stock-Based Compensation
). Generally,
76
participants of the 2011 Plan are granted stock-based awards, and among which the performance-based awards may vest, only if the applicable Company-wide or profit-center operating goals, or both, or strategic goals, established by the Compensation and Leadership Development Committee (the "Committee") of the Board of Directors at the beginning of the year, are met.
The Company granted restricted stock units (“RSUs”) under the 2011 Plan in 2014, 2015 or 2016. The fair value of each restricted stock unit award is estimated on the measurement date as determined in accordance with GAAP and is based on the closing market price of the underlying stock on the day preceding the measurement date. The fair value excludes the present value of the dividends that the RSUs do not participate in. The RSUs may be time-based, performance-based or time- and performance-based. The restrictions on one quarter of the time-based RSUs generally lapse on the date of the award and each of the first, second and third anniversaries of the date of the award (the “Vesting Schedule”). The restrictions on the performance-based RSUs, which are made to the Company’s named executive officers and certain members of the Company’s senior management in addition to their time-based RSUs, generally lapse following a period set for the RSUs on the date of the award, and shares of the Company’s common stock underlying such awards are subject to performance-based adjustment before becoming vested. In addition, some of the time-based RSUs made to the Company’s employees require the underlying shares to be subject to performance-based adjustment before such awards may vest according to the Vesting Schedule.
On February 4, 2017,
616,679
RSUs were awarded to the Company's employees, including officers, at an estimated value of
$43.75
per share, based on the closing price on February 14, 2017. On April 20, 2016,
1,800
RSUs were awarded to each of the Company’s six non-employee directors at an estimated value of
$38.00
per share based on the closing price on April 19, 2016. There were no restrictions on the non-employee directors’ RSUs granted on April 20, 2016.
The following table summarizes the Company’s unvested restricted stock unit activity for the year ended
December 31, 2016
:
|
|
Shares
(in thousands) |
Weighted-
Average Price |
Aggregate
Intrinsic Value * (in thousands) |
|||||||
|
Unvested Restricted Stock Units (RSUs)
|
||||||||||
|
Outstanding at January 1, 2016
|
527
|
|
$
|
31.56
|
|
$
|
17,994
|
|
||
|
Awarded
|
442
|
|
31.98
|
|
|
|
||||
|
Vested
|
(343
|
)
|
31.64
|
|
|
|
||||
|
Forfeited
|
(11
|
)
|
32.02
|
|
|
|
||||
|
Outstanding at December 31, 2016
|
615
|
|
$
|
31.81
|
|
$
|
26,915
|
|
||
|
Outstanding and expected to vest at December 31, 2016
|
601
|
|
$
|
31.81
|
|
$
|
26,282
|
|
||
* The intrinsic value is calculated using the closing price per share of
$43.75
, as reported by the New York Stock Exchange on
December 31, 2016
.
The total intrinsic value of RSUs vested during the years ended
December 31, 2016
,
2015
and
2014
was
$10.8 million
,
$10.3 million
and
$9.1 million
respectively, based on the market value on the award date.
No
stock options were granted under the 2011 Plan in
2014
,
2015
or
2016
.
The following table summarizes the Company’s stock option activity for the year ended
December 31, 2016
:
|
|
Shares
(in thousands) |
Weighted-
Average Exercise Price |
Weighted-
Average Remaining Contractual Life |
Aggregate
Intrinsic Value* (in thousands) |
||||||||
|
Non-Qualified Stock Options
|
||||||||||||
|
Outstanding at January 1, 2016
|
523
|
|
$
|
29.55
|
|
2.1
|
$
|
2,406
|
|
|||
|
Exercised
|
(271
|
)
|
$
|
29.48
|
|
|
|
|
||||
|
Forfeited
|
(1
|
)
|
$
|
21.25
|
|
|||||||
|
Outstanding and exercisable at December 31, 2016
|
251
|
|
$
|
29.66
|
|
1.1
|
$
|
3,538
|
|
|||
* The intrinsic value represents the amount by which the fair market value of the underlying common stock exceeds the exercise price of the option, and is calculated using the closing price per share of
$43.75
, as reported by the New York Stock Exchange on
December 31, 2016
.
77
The total intrinsic value of stock options exercised during each of the three years ended
December 31, 2016
,
2015
and
2014
, was
$3.1 million
,
$2.4 million
and
$0.8 million
, respectively.
As of January 1, 2015, there were
99 thousand
unvested stock options with a weighted average grant-date fair value of
$10.33
per share. These stock options vested in the first quarter of 2015 and, as of
December 31, 2016
, the Company had
no
unvested stock options.
As of
December 31, 2016
, there was
$24.8 million
total unrecognized compensation cost related to unvested stock-based compensation arrangements under the 2011 Plan for awards made through February 2016 and those expected to be made through February 2017. The portion of this cost related to RSUs awarded through February 2016 is expected to be recognized over a weighted-average period of
1.7
years
.
The Company also maintains an employee stock bonus plan (the "Stock Bonus Plan"), which was adopted in 1994, amended on December 7, 2015, and approved by the Company's stockholders on April 20, 2016, whereby it awards shares of the Company's common stock to employees, who do not otherwise participate in any of the Company’s stock-based incentive plans and meet minimum service requirements as determined by the Committee. The number of shares awarded, as well as the period of service, is determined by the Committee. The Company committed to issuing
12 thousand
shares for
2016
(
3 thousand
of which are expected to be settled in cash for the Company's foreign employees) and issued
10 thousand
and
16 thousand
shares for
2015
and
2014
, respectively, which resulted in pre-tax compensation charges of
$0.8 million
,
$0.7 million
and
$0.9 million
for each of the years ended
December 31, 2016
,
2015
and
2014
, respectively. These employees are also awarded cash bonuses, which are included in these charges, to compensate for their income taxes payable as a result of the stock bonuses. Shares have generally been issued under the Stock Bonus Plan following the year in which the respective employee reached his or her
ten
th anniversary of employment with the Company.
|
14.
|
Segment Information
|
The Company is organized into
three
reporting segments. The segments are defined by the regions where the Company’s products are manufactured, marketed and distributed to the Company’s customers. The three regional segments are the North America segment (comprising primarily the Company's operations in the United States and Canada), the Europe segment and the Asia/Pacific segment (comprising the Company’s operations in Asia, the South Pacific, South Africa and the Middle East). These segments are similar in several ways, including the types of materials used, the production processes, the distribution channels and the product applications.
The Administrative & All Other column primarily includes expenses such as self-insured workers compensation claims for employees of the Company’s venting business, which was sold in 2010, stock-based compensation for certain members of management, interest expense, foreign exchange gains or losses and income tax expense, as well as revenues and expenses related to real estate activities, such as rental income and depreciation expense on the Company’s property in Vacaville, California, which the Company has leased to a third party for a
10
-year term expiring in August 2020.
The following table shows certain measurements used by management to assess the performance of the segments described above as of
December 31, 2016
,
2015
and
2014
, respectively:
|
(in thousands)
|
North
America |
Europe
|
Asia/
Pacific |
Administrative
& All Other |
Total
|
||||||||||||||
|
2016
|
|||||||||||||||||||
|
Net sales
|
$
|
742,021
|
|
$
|
111,274
|
|
$
|
7,366
|
|
$
|
—
|
|
$
|
860,661
|
|
||||
|
Sales to other segments *
|
2,512
|
|
570
|
|
28,690
|
|
—
|
|
31,772
|
|
|||||||||
|
Income (loss) from operations
|
137,311
|
|
895
|
|
2,140
|
|
(869
|
)
|
139,477
|
|
|||||||||
|
Depreciation and amortization
|
19,433
|
|
5,809
|
|
1,208
|
|
1,477
|
|
27,927
|
|
|||||||||
|
Significant non-cash charges
|
9,124
|
|
1,052
|
|
113
|
|
3,657
|
|
13,946
|
|
|||||||||
|
Provision for income taxes
|
45,547
|
|
1,428
|
|
721
|
|
1,470
|
|
49,166
|
|
|||||||||
|
Capital expenditures and business acquisitions, net of
cash acquired
|
37,652
|
|
8,461
|
|
1,250
|
|
—
|
|
47,363
|
|
|||||||||
|
Total assets
|
853,826
|
|
165,121
|
|
25,118
|
|
(64,091
|
)
|
979,974
|
|
|||||||||
78
|
(in thousands)
|
North
America
|
Europe
|
Asia/
Pacific
|
Administrative
& All Other
|
Total
|
||||||||||||||
|
2015
|
|||||||||||||||||||
|
Net sales
|
$
|
676,618
|
|
$
|
108,068
|
|
$
|
9,373
|
|
$
|
—
|
|
$
|
794,059
|
|
||||
|
Sales to other segments *
|
2,857
|
|
931
|
|
20,496
|
|
—
|
|
24,284
|
|
|||||||||
|
Income (loss) from operations
|
109,446
|
|
3,795
|
|
(3,445
|
)
|
(775
|
)
|
109,021
|
|
|||||||||
|
Depreciation and amortization
|
17,812
|
|
5,773
|
|
1,785
|
|
1,451
|
|
26,821
|
|
|||||||||
|
Significant non-cash charges
|
8,221
|
|
1,251
|
|
131
|
|
2,355
|
|
11,958
|
|
|||||||||
|
Provision for income taxes
|
36,999
|
|
1,692
|
|
581
|
|
1,519
|
|
40,791
|
|
|||||||||
|
Capital expenditures and asset acquisitions, net of
cash acquired
|
33,336
|
|
4,177
|
|
825
|
|
27
|
|
38,365
|
|
|||||||||
|
Total assets
|
748,241
|
|
168,305
|
|
24,366
|
|
20,397
|
|
961,309
|
|
|||||||||
|
(in thousands)
|
North
America
|
Europe
|
Asia/
Pacific
|
Administrative
& All Other
|
Total
|
||||||||||||||
|
2014
|
|||||||||||||||||||
|
Net sales
|
$
|
613,843
|
|
$
|
123,177
|
|
$
|
15,128
|
|
$
|
—
|
|
$
|
752,148
|
|
||||
|
Sales to other segments *
|
4,134
|
|
1,170
|
|
17,933
|
|
—
|
|
23,237
|
|
|||||||||
|
Income (loss) from operations
|
94,888
|
|
5,005
|
|
(1,566
|
)
|
949
|
|
99,276
|
|
|||||||||
|
Depreciation and amortization
|
18,129
|
|
6,755
|
|
1,554
|
|
1,480
|
|
27,918
|
|
|||||||||
|
Impairment of long-lived asset
|
—
|
|
530
|
|
—
|
|
—
|
|
530
|
|
|||||||||
|
Significant non-cash charges
|
9,722
|
|
1,164
|
|
203
|
|
2,101
|
|
13,190
|
|
|||||||||
|
Provision for (benefit from) income taxes
|
30,287
|
|
2,437
|
|
882
|
|
2,185
|
|
35,791
|
|
|||||||||
|
Capital expenditures and asset acquisitions, net of
cash acquired
|
20,160
|
|
2,977
|
|
798
|
|
—
|
|
23,935
|
|
|||||||||
|
Total assets
|
679,844
|
|
180,005
|
|
29,552
|
|
83,664
|
|
973,065
|
|
|||||||||
* Sales to other segments are eliminated on consolidation.
Cash collected by the Company’s United States subsidiaries is routinely transferred into the Company’s cash management accounts, and therefore has been included in the total assets of “Administrative & All Other.” Cash and short-term investment balances in “Administrative & All Other” were
$137.4 million
,
$164.1 million
and
$167.4 million
as of
December 31, 2016
,
2015
and
2014
, respectively. As of
December 31, 2016
, the Company had
$87.2 million
, or
38.5%
, of its cash and cash equivalents held outside the United States in accounts belonging to the Company’s various foreign operating entities. The majority of this balance is held in foreign currencies and could be subject to additional taxation if it were repatriated to the United States. The Company currently has no plans to repatriate cash and cash equivalents held outside the United States as the Company expects to use such funds for future international growth and acquisitions.
The significant non-cash charges comprise compensation related to the awards under the Company's stock-based incentive plans and the Company's employee stock bonus plan. The Company’s measure of profit or loss for its reportable segments is income (loss) from operations. The reconciling amounts between consolidated income before tax and consolidated income from operations are net interest income, which is primarily attributed to “Administrative & All Other.”
79
The following table shows the geographic distribution of the Company’s net sales and long-lived assets as of
December 31, 2016
,
2015
and
2014
, respectively:
|
|
2016
|
2015
|
2014
|
||||||||||||||||||||
|
(in thousands)
|
Net
Sales |
Long-Lived
Assets |
Net
Sales |
Long-Lived
Assets |
Net
Sales |
Long-Lived
Assets |
|||||||||||||||||
|
United States
|
$
|
702,071
|
|
$
|
192,787
|
|
$
|
639,443
|
|
$
|
171,367
|
|
$
|
572,112
|
|
$
|
158,161
|
|
|||||
|
Canada
|
38,269
|
|
4,473
|
|
36,122
|
|
4,275
|
|
40,996
|
|
5,195
|
|
|||||||||||
|
Denmark
|
15,728
|
|
1,249
|
|
14,987
|
|
1,381
|
|
15,121
|
|
1,518
|
|
|||||||||||
|
United Kingdom
|
20,905
|
|
1,183
|
|
22,924
|
|
1,357
|
|
24,893
|
|
1,377
|
|
|||||||||||
|
France
|
33,062
|
|
8,349
|
|
31,147
|
|
8,621
|
|
37,312
|
|
8,145
|
|
|||||||||||
|
Germany
|
20,751
|
|
12,582
|
|
19,974
|
|
13,358
|
|
27,202
|
|
15,379
|
|
|||||||||||
|
Switzerland
|
6,549
|
|
8,469
|
|
5,538
|
|
9,071
|
|
4,960
|
|
9,506
|
|
|||||||||||
|
Poland
|
6,633
|
|
1,830
|
|
6,417
|
|
893
|
|
7,491
|
|
1,071
|
|
|||||||||||
|
The Netherlands
|
4,909
|
|
21
|
|
4,773
|
|
15
|
|
4,539
|
|
30
|
|
|||||||||||
|
Belgium
|
1,286
|
|
1,798
|
|
—
|
|
—
|
|
—
|
|
—
|
|
|||||||||||
|
China/Hong Kong
|
151
|
|
6,881
|
|
4,097
|
|
7,510
|
|
9,646
|
|
8,966
|
|
|||||||||||
|
Australia
|
4,741
|
|
239
|
|
3,121
|
|
274
|
|
3,245
|
|
267
|
|
|||||||||||
|
New Zealand
|
2,474
|
|
163
|
|
2,154
|
|
142
|
|
2,237
|
|
82
|
|
|||||||||||
|
Chile
|
1,572
|
|
56
|
|
902
|
|
91
|
|
573
|
|
149
|
|
|||||||||||
|
Other countries
|
1,560
|
|
590
|
|
2,460
|
|
731
|
|
1,821
|
|
929
|
|
|||||||||||
|
|
$
|
860,661
|
|
$
|
240,670
|
|
$
|
794,059
|
|
$
|
219,086
|
|
$
|
752,148
|
|
$
|
210,775
|
|
|||||
Net sales and long-lived assets, net of intangible assets, are attributable to the country where the sales or manufacturing operations are located.
Wood construction products include connectors, truss plates, fastening systems, fasteners and pre-fabricated shearwalls and are used for connecting and strengthening wood-based construction primarily in the residential construction market. Concrete construction products include adhesives, specialty chemicals, mechanical anchors, carbide drill bits, powder actuated tools and reinforcing fiber materials and are used for restoration, protection or strengthening concrete, masonry and steel construction in residential, industrial, commercial and infrastructure construction. The following table show the distribution of the Company’s net sales by product for the years ended
December 31, 2016
,
2015
and
2014
, respectively:
|
(in thousands)
|
2016
|
2015
|
2014
|
||||||||
|
Wood Construction
|
$
|
732,414
|
|
$
|
674,274
|
|
$
|
636,003
|
|
||
|
Concrete Construction
|
128,247
|
|
119,481
|
|
115,921
|
|
|||||
|
Other
|
—
|
|
304
|
|
224
|
|
|||||
|
Total
|
$
|
860,661
|
|
$
|
794,059
|
|
$
|
752,148
|
|
||
No customer accounted for as much as 10% of net sales for the years ended
December 31, 2016
,
2015
and
2014
.
|
15.
|
Subsequent Events
|
Dividend Declaration
At its meeting on
January 30, 2017
, the Company’s Board of Directors declared a cash dividend of
$0.18
per share of our common stock, estimated to be
$8.6 million
in total. The record date for the dividend will be
April 6, 2017
, and it will be paid on
April 27, 2017
.
80
Acquisition of Gbo Fastening Systems AB
On
January 3, 2017
, the Company acquired Gbo Fastening Systems AB ("Gbo Fastening Systems"), a Sweden limited company, for approximately
$10.2 million
. Gbo Fastening Systems manufacturers and sells a complete line of CE-marked structural fasteners, unique fastener dimensioning software for wood construction applications currently sold mostly in northern and eastern Europe, which is expected to complement the Company's line of wood construction products in Europe.
Acquisition of CG Visions, Inc.
On
January 9, 2017
, the Company acquired CG Visions, Inc. ("CG Visions"), an Indiana company, for up to approximately
$21.5 million
, including an earn-out of
$2.15 million
, which is subject to meeting sales targets, and subject to specified holdback provisions and post-closing adjustment. CG Visions provides scalable technologies and services in building information modeling ("BIM") technologies, estimation tools and software solutions to a number of the top 100 mid-sized to large builders in the United States, which will complement and support the Company's sales in North America.
Both acquisition transactions will be recorded as business combinations in accordance with the business acquisition method. Because the transactions were so recent, the Company is in the process of evaluating the information required to determine the preliminary purchase allocation for each acquisition.
|
16.
|
Selected Quarterly Financial Data (Unaudited)
|
The following table sets forth selected quarterly financial data for each of the quarters in
2016
and
2015
, respectively:
(in thousands, except per share amounts)
|
|
2016
|
2015
|
|||||||||||||||||||||||||||||
|
|
Fourth
Quarter |
Third
Quarter |
Second
Quarter |
First
Quarter |
Fourth
Quarter |
Third
Quarter |
Second
Quarter |
First
Quarter |
|||||||||||||||||||||||
|
|
|||||||||||||||||||||||||||||||
|
Net sales
|
$
|
200,192
|
|
$
|
230,974
|
|
$
|
229,973
|
|
$
|
199,523
|
|
$
|
184,764
|
|
$
|
216,139
|
|
$
|
216,665
|
|
$
|
176,491
|
|
|||||||
|
Cost of sales
|
105,226
|
|
117,499
|
|
118,486
|
|
107,000
|
|
102,002
|
|
115,798
|
|
118,347
|
|
98,993
|
|
|||||||||||||||
|
Gross profit
|
94,966
|
|
113,475
|
|
111,487
|
|
92,523
|
|
82,762
|
|
100,341
|
|
98,318
|
|
77,498
|
|
|||||||||||||||
|
Research and development and other engineering
|
12,441
|
|
10,932
|
|
11,452
|
|
11,423
|
|
11,548
|
|
13,935
|
|
10,517
|
|
10,197
|
|
|||||||||||||||
|
Selling
|
24,030
|
|
24,304
|
|
24,822
|
|
25,187
|
|
22,508
|
|
22,535
|
|
23,013
|
|
22,607
|
|
|||||||||||||||
|
General and administrative
|
32,376
|
|
32,543
|
|
34,945
|
|
29,298
|
|
26,553
|
|
28,648
|
|
29,794
|
|
28,433
|
|
|||||||||||||||
|
Impairment of goodwill
|
—
|
|
—
|
|
—
|
|
—
|
|
—
|
|
—
|
|
—
|
|
—
|
|
|||||||||||||||
|
Gain on sale of assets
|
(17
|
)
|
(81
|
)
|
(656
|
)
|
(26
|
)
|
(332
|
)
|
(26
|
)
|
(15
|
)
|
(16
|
)
|
|||||||||||||||
|
Income from operations
|
26,136
|
|
45,777
|
|
40,924
|
|
26,641
|
|
22,485
|
|
35,249
|
|
35,009
|
|
16,277
|
|
|||||||||||||||
|
Interest expense, net
|
(177
|
)
|
(82
|
)
|
(83
|
)
|
(235
|
)
|
(77
|
)
|
(175
|
)
|
(54
|
)
|
(35
|
)
|
|||||||||||||||
|
Income before income taxes
|
25,959
|
|
45,695
|
|
40,841
|
|
26,406
|
|
22,408
|
|
35,074
|
|
34,955
|
|
16,242
|
|
|||||||||||||||
|
Provision for
income taxes
|
8,565
|
|
15,898
|
|
14,640
|
|
10,063
|
|
7,675
|
|
13,479
|
|
13,446
|
|
6,191
|
|
|||||||||||||||
|
Net income
|
$
|
17,394
|
|
$
|
29,797
|
|
$
|
26,201
|
|
$
|
16,343
|
|
$
|
14,733
|
|
$
|
21,595
|
|
$
|
21,509
|
|
$
|
10,051
|
|
|||||||
|
Earnings per common share:
|
|
|
|
|
|
|
0
|
|
|
|
|
|
|
|
|
|
|||||||||||||||
|
Basic
|
$
|
0.37
|
|
$
|
0.62
|
|
$
|
0.54
|
|
$
|
0.34
|
|
$
|
0.30
|
|
$
|
0.44
|
|
$
|
0.44
|
|
$
|
0.20
|
|
|||||||
|
Diluted
|
0.36
|
|
0.62
|
|
0.54
|
|
0.34
|
|
0.30
|
|
0.44
|
|
0.43
|
|
0.20
|
|
|||||||||||||||
|
Cash dividends declared per
common share
|
$
|
0.18
|
|
$
|
0.18
|
|
$
|
0.18
|
|
$
|
0.16
|
|
$
|
0.16
|
|
$
|
0.16
|
|
$
|
0.16
|
|
$
|
0.14
|
|
|||||||
81
Basic and diluted income per common share for each of the quarters presented above is based on the respective weighted average numbers of common and dilutive potential common shares outstanding for each quarter, and the sum of the quarters may not necessarily be equal to the full year basic and diluted net income per common share amounts
.
SCHEDULE II
Simpson Manufacturing Co., Inc. and Subsidiaries
VALUATION AND QUALIFYING ACCOUNTS
for the years ended
December 31, 2016
,
2015
and
2014
|
Column A
|
Column B
|
Column C
|
Column D
|
Column E
|
||||||||||||||
|
|
|
Additions
|
|
|
||||||||||||||
|
|
|
Charged
|
Charged
|
|
|
|||||||||||||
|
|
Balance at
|
to Costs
|
to Other
|
|
Balance
|
|||||||||||||
|
(in thousands)
|
Beginning
|
and
|
Accounts —
|
|
at End
|
|||||||||||||
|
Classification
|
of Year
|
Expenses
|
Write-offs
|
Deductions
|
of Year
|
|||||||||||||
|
Year to date December 31, 2016
|
|
|
|
|
|
|
|
|
|
|
||||||||
|
Allowance for doubtful accounts
|
$
|
1,142
|
|
$
|
(83
|
)
|
|
|
$
|
164
|
|
$
|
895
|
|
||||
|
Allowance for sales discounts
|
2,706
|
|
344
|
|
—
|
|
—
|
|
3,050
|
|
||||||||
|
Allowance for deferred tax assets
|
7,575
|
|
358
|
|
|
|
1,065
|
|
6,868
|
|
||||||||
|
Year to date December 31, 2015
|
|
|
|
|
|
|
|
|
|
|
||||||||
|
Allowance for doubtful accounts
|
929
|
|
440
|
|
—
|
|
227
|
|
1,142
|
|
||||||||
|
Allowance for sales discounts
|
2,089
|
|
617
|
|
—
|
|
—
|
|
2,706
|
|
||||||||
|
Allowance for deferred tax assets
|
6,754
|
|
1,577
|
|
—
|
|
756
|
|
7,575
|
|
||||||||
|
Year to date December 31, 2014
|
|
|
|
|
|
|
|
|
|
|
||||||||
|
Allowance for doubtful accounts
|
945
|
|
151
|
|
—
|
|
167
|
|
929
|
|
||||||||
|
Allowance for sales discounts
|
1,451
|
|
638
|
|
—
|
|
—
|
|
2,089
|
|
||||||||
|
Allowance for deferred tax assets
|
5,546
|
|
1,397
|
|
—
|
|
189
|
|
6,754
|
|
||||||||
83
None
Disclosure Controls and Procedures.
As of
December 31, 2016
, the Company carried out an evaluation, under the supervision and with the participation of the Company’s management, including the chief executive officer (“CEO”) and the chief financial officer (“CFO”), of the effectiveness of the Company’s disclosure controls and procedures (as defined in Rule 13a-15(e) under the Exchange Act. Disclosure controls and procedures are controls and other procedures designed reasonably to assure that information required to be disclosed in the Company’s reports filed or submitted under the Exchange Act, such as this Annual Report on Form 10-K, is recorded, processed, summarized and reported within the time periods specified in the Securities and Exchange Commission’s rules and forms. Disclosure controls and procedures are also designed reasonably to assure that this information is accumulated and communicated to the Company’s management, including the CEO and the CFO, as appropriate to allow timely decisions regarding required disclosure. Based on this evaluation, as of December 31,
2016
, the Company's CEO and CFO have concluded that the Company's disclosure controls and procedures were effective at the reasonable assurance level.
Management’s Report on Internal Control over Financial Reporting.
The Company’s management is responsible for establishing and maintaining adequate internal control over financial reporting. The Company’s management assessed the effectiveness of the Company’s internal control over financial reporting as of
December 31, 2016
, using the criteria established in Internal Control - Integrated Framework (2013) issued by the Committee of Sponsoring Organizations of the Treadway Commission (“COSO”) and concluded that the Company's internal control over financial reporting was effective as of
December 31, 2016
. Grant Thornton LLP, an independent registered public accounting firm that audited the Company’s Consolidated Financial Statements, has also audited the effectiveness of the Company’s internal control over financial reporting as of
December 31, 2016
, as stated in their report included in the Company's Consolidated Financial Statements.
Changes in Internal Control over Financial Reporting
. There were no changes in our internal control over financial reporting identified in management's evaluation pursuant to Rules 13a-15(d) or 15d-15(d) of the Exchange Act during the three months ended December 31, 2016, that materially affected, or are reasonably likely to materially affect, our internal control over financial reporting.
Inherent Limitations of Disclosure Controls and Procedures and Internal Control over Financial Reporting.
The Company’s management, including the CEO and the CFO, does not, however, expect that the Company’s disclosure controls and procedures or the Company’s internal control over financial reporting will necessarily prevent all fraud and material errors. Internal control over financial reporting, no matter how well conceived and operated, can provide only reasonable, not absolute, assurance that the objectives of the control system are met. In addition, the design of a control system must reflect the facts that there are resource constraints and that the benefits of controls must be considered relative to their costs. The inherent limitations in internal control over financial reporting include the realities that judgments can be faulty and that breakdowns can occur because of simple error or mistake. Controls also can be circumvented by the individual acts of some persons, by collusion of two or more people, or by management override of controls. The design of any system of internal control is also based in part on assumptions about the likelihood of future events, and there can be only reasonable, not absolute, assurance that any design will succeed in achieving its stated goals under all potential events and conditions. Over time, controls may become inadequate because of changes in circumstances, or the degree of compliance with the policies and procedures may deteriorate.
None.
The information required by this Item will be contained in the Company’s proxy statement for the 2017 Annual Meeting of Stockholders to be filed with the SEC not later than 120 days following the end of the Company’s fiscal year ended
December 31, 2016
, which information is incorporated herein by reference.
84
The information required by this Item will be contained in the Company’s proxy statement for the 2017 Annual Meeting of Stockholders to be filed with the SEC not later than 120 days following the end of the Company’s fiscal year ended
December 31, 2016
, which information is incorporated herein by reference.
(a) The following documents are filed as part of this Annual Report on Form 10-K:
1. Consolidated financial statements
The following consolidated financial statements are filed as a part of this report:
Reports of Independent Registered Public Accounting Firms
Consolidated Balance Sheets as of
December 31, 2016
and
2015
Consolidated Statements of Operations for the years ended
December 31, 2016
,
2015
and
2014
Consolidated Statements of Comprehensive Income for the years ended
December 31, 2016
,
2015
and
2014
Consolidated Statements of Stockholders’ Equity for the years ended
December 31, 2016
,
2015
and
2014
Consolidated Statements of Cash Flows for the years ended
December 31, 2016
,
2015
and
2014
Notes to Consolidated Financial Statements
2. Financial Statement Schedules
The following consolidated financial statement schedule for each of the years in the three-year period ended
December 31, 2016
, is filed as part of this Annual Report on Form 10-K:
Schedule II — Valuation and Qualifying Accounts—Years ended
December 31, 2016
,
2015
and
2014
85
All other schedules have been omitted as the required information is not present or is not present in amounts sufficient to require submission of the schedule, or because the information required is included in the consolidated financial statements and related notes thereto.
(b) Exhibits
The following exhibits are either incorporated by reference into, or filed or furnished with, this Annual Report on Form 10-K, as indicated below.
|
3.1
|
Certificate of Incorporation of Simpson Manufacturing Co., Inc., as amended, is incorporated by reference to Exhibit 3.1 of its Quarterly Report on Form 10-Q for the quarter ended September 30, 2007.
|
|
3.2
|
Bylaws of Simpson Manufacturing Co., Inc., as amended through October 19, 2016, are incorporated by reference to Exhibit 3.2 of its Current Report on Form 8-K filed on October 25, 2016.
|
|
4.1
|
Certificate of Designation, Preferences and Rights of Series A Participating Preferred Stock of Simpson Manufacturing Co., Inc., dated July 30, 1999, is incorporated by reference to Exhibit 4.2 of its Registration Statement on Form 8-A dated August 4, 1999.
|
|
10.1
|
Form of Indemnification Agreement between Simpson Manufacturing Co., Inc. and its directors and executive officers, as well as the officers of Simpson Strong-Tie Company Inc., is incorporated by reference to Exhibit 10.2 of Simpson Manufacturing Co., Inc.’s Annual Report on Form 10-K for the year ended December 31, 2004.
|
|
10.2
|
Credit Agreement, dated as of July 27, 2012, among Simpson Manufacturing Co., Inc., as Borrower, Wells Fargo Bank, National Association ("Wells Fargo"), MUFG Union Bank, N.A. (f/k/a Union Bank, N.A.), HSBC Bank USA, N.A., and Bank of Montreal, as Lenders, Wells Fargo in its separate capacities as Swing Line Lender and L/C issuer and as Administrative Agent, and Simpson Strong-Tie Company Inc., and Simpson Strong-Tie International, Inc. as Guarantors, is incorporated by reference to Exhibit 10.1 of Simpson Manufacturing Co., Inc.’s Current Report on Form 8-K dated August 1, 2012.
|
|
10.3
|
Second amendment to the unsecured credit agreement, dated as of July 25, 2016, among the Company, as Borrower, Wells Fargo Bank, National Association ("Wells Fargo"), MUFG Union Bank, N.A. (f/k/a Union Bank, N.A.), HSBC Bank USA, N.A., and Bank of Montreal, as Lenders, Wells Fargo in its separate capacities as Swing Line Lender and L/C issuer and as Administrative Agent, and Simpson Strong-Tie Company Inc., and Simpson Strong-Tie International, Inc. as Guarantors, is incorporated by reference to Exhibit 10.1 of Simpson Manufacturing Co., Inc.’s Current Report on Form 8-K dated July 25, 2016.
|
|
10.4
|
Simpson Manufacturing Co., Inc. Executive Officer Cash Profit Sharing Plan, as amended through February 25, 2008, is incorporated by reference to Exhibit 10.3 of Simpson Manufacturing Co., Inc.’s Quarterly Report on Form 10-Q for the quarter ended June 30, 2008.
|
|
10.5
|
Simpson Manufacturing Co., Inc. 1994 Stock Option Plan, as amended through February 13, 2008, is incorporated by reference to Exhibit 10.1 of Simpson Manufacturing Co., Inc.’s Quarterly Report on Form 10-Q for the quarter ended June 30, 2008.
|
|
10.6
|
Simpson Manufacturing Co., Inc. 1995 Independent Director Stock Option Plan, as amended through November 18, 2004, is incorporated by reference to Exhibit 10.2 of Simpson Manufacturing Co., Inc.’s Quarterly Report on Form 10-Q for the quarter ended June 30, 2008.
|
|
10.7
|
Simpson Manufacturing Co., Inc. Amended and Restated 2011 Incentive Plan is incorporated by reference to Exhibit A of Simpson Manufacturing Co., Inc.’s Schedule 14A Proxy Statement dated March 9, 2015.
|
|
10.8
|
Simpson Manufacturing Co., Inc. 401(k) Profit Sharing Plan is incorporated by reference to Exhibit 4.5 of Simpson Manufacturing Co., Inc.’s Registration Statement on Form S-8, File Number 333-173811, dated December 15, 2015.
|
|
10.9
|
Compensation of Named Executive Officers and Directors is incorporated by reference to Item 5.02 of Simpson Manufacturing Co., Inc.’s Current Report on Form 8-K dated February 4, 2017, Item 5.02 of Simpson
|
86
Manufacturing Co., Inc.’s Current Report on Form 8-K dated December 6, 2016 and Item 5.02 of Simpson Manufacturing Co., Inc.’s Current Report on Form 8-K filed on October 25, 2016.
|
10.10
|
Form of Simpson Manufacturing Co., Inc. 2017 Performance Based Restricted Stock Unit Agreement is filed herewith.
|
|
10.11
|
Form of Simpson Manufacturing Co., Inc. 2017 Time Based Restricted Stock Unit Agreement is filed herewith.
|
|
21.
|
List of Subsidiaries of the Registrant is filed herewith.
|
|
23.1
|
Consent of Grant Thornton LLP is filed herewith.
|
|
23.2
|
Consent of PricewaterhouseCoopers LLP is filed herewith.
|
|
31.1
|
Chief Executive Officer's Rule 13a-14(a)/15d-14(a) Certification is filed herewith.
|
|
31.2
|
Chief Financial Officer's Rule 13a-14(a)/15d-14(a) Certification is filed herewith.
|
|
32.
|
Section 1350 Certifications are furnished herewith.
|
|
99.1
|
Simpson Manufacturing Co., Inc. 1994 Employee Stock Bonus Plan, as amended through December 7, 2015, is incorporated by reference to Exhibit A of Simpson Manufacturing Co., Inc.’s Schedule 14A Proxy Statement dated March 10, 2016.
|
|
99.2
|
Form of Simpson Manufacturing Co., Inc. 2017 Time & Performance Based Restricted Stock Unit Agreement is filed herewith.
|
|
101
|
Financial statements from the annual report on Form 10-K of Simpson Manufacturing Co., Inc. for the year ended
December 31, 2016
, formatted in XBRL, are filed herewith and include: (i) the Consolidated Balance Sheets, (ii) the Consolidated Statements of Operations, (iii) the Statement of Comprehensive Income, (iv) the Consolidated Statements of Stockholders’ Equity, (v) the Consolidated Statements of Cash Flows and (vi) the Notes to Consolidated Financial Statements.
|
87
SIGNATURES
Pursuant to the requirements of Section 13 or 15(d) of the Securities Exchange Act of 1934, the Registrant has duly caused this report to be signed on its behalf by the undersigned, thereunto duly authorized.
|
Dated:
|
February 28, 2017
|
|
Simpson Manufacturing Co., Inc.
|
|
|
|
(Registrant)
|
|
|
|
By
|
/s/Brian J. Magstadt
|
|
|
|
|
Brian J. Magstadt
|
|
|
|
|
Chief Financial Officer
|
|
|
|
|
and Duly Authorized Officer
|
|
|
|
|
of the Registrant
|
|
|
|
|
(principal accounting and financial officer)
|
|
Pursuant to the requirements of the Securities Exchange Act of 1934, this report has been signed below by the following persons on behalf of the Registrant and in the capacities and on the dates indicated below.
|
Signature
|
|
Title
|
|
Date
|
|
|
|
|
|
|
|
Chief Executive Officer:
|
|
|
|
|
|
|
|
|
|
|
|
/s/Karen Colonias
|
|
President, Chief Executive
|
|
February 28, 2017
|
|
(Karen Colonias)
|
|
Officer and Director
|
|
|
|
|
|
(principal executive officer)
|
|
|
|
Chief Financial Officer:
|
|
|
|
|
|
|
|
|
|
|
|
/s/Brian J. Magstadt
|
|
Chief Financial Officer,
|
|
February 28, 2017
|
|
(Brian J. Magstadt)
|
|
Treasurer and Secretary
|
|
|
|
|
|
(principal accounting and financial officer)
|
|
|
|
|
|
|
|
|
|
Directors:
|
|
|
|
|
|
|
|
|
|
|
|
/s/Peter N. Louras, Jr.
|
|
Chairman of the Board and Director
|
|
February 28, 2017
|
|
(Peter N. Louras, Jr.)
|
|
|
|
|
|
/s/Thomas J Fitzmyers
|
|
Vice Chairman of the Board
|
|
February 28, 2017
|
|
(Thomas J Fitzmyers)
|
|
and Director
|
|
|
|
/s/James S. Andrasick
|
|
Director
|
|
February 28, 2017
|
|
(James S. Andrasick)
|
|
|
|
|
|
|
|
|
|
|
|
/s/Jennifer A. Chatman
|
|
Director
|
|
February 28, 2017
|
|
(Jennifer A. Chatman)
|
|
|
|
|
|
|
|
|
|
|
|
/s/Gary M. Cusumano
|
|
Director
|
|
February 28, 2017
|
|
(Gary M. Cusumano)
|
|
|
|
|
|
|
|
|
|
|
|
/s/Celeste Volz Ford
|
|
Director
|
|
February 28, 2017
|
|
(Celeste Volz Ford)
|
|
|
|
|
|
/s/Robin G. MacGillivray
|
|
Director
|
|
February 28, 2017
|
|
(Robin G. MacGillivray)
|
|
|
|
|
88
TABLE OF CONTENTS
Part IItem 1. BusinessItem 1A. Risk FactorsItem 1B. Unresolved Staff CommentsItem 2. PropertiesItem 3. Legal ProceedingsItem 4. Mine Safety DisclosuresPart IIItem 5. Market For Registrant S Common Equity, Related Stockholder Matters and Issuer Purchases Of Equity SecuritiesItem 6. Selected Financial DataItem 7. Management S Discussion and Analysis Of Financial Condition and Results Of OperationsItem 7A. Quantitative and Qualitative Disclosures About Market RiskItem 8. Consolidated Financial Statements and Supplementary DataItem 9. Changes in and Disagreements with Accountants on Accounting and Financial DisclosuresItem 9A. Controls and ProceduresItem 9B. Other InformationPart IIIItem 10. Directors, Executive Officers and Corporate GovernanceItem 11. Executive CompensationItem 12. Security Ownership Of Certain Beneficial Owners and Management and Related Stockholder MattersItem 13. Certain Relationships and Related Transactions, and Director IndependenceItem 14. Principal Accounting Fees and ServicesPart IVItem 15. Exhibits and Financial Statement Schedules