SUPERIOR INDUSTRIES INTERNATIONAL INC
10-Ks and 10-Qs
|
|
|
|
|
|
|
|
|
|
|
|
|
|
|
|
|
|
|
|
|
|
|
|
|
|
|
|
|
|
|
|
|
|
|
|
|
|
|
|
|
|
|
|
|
|
|
|
|
|
|
|
|
UNITED STATES
SECURITIES AND EXCHANGE COMMISSION
WASHINGTON, D.C. 20549
FORM 10-K
|
þ
|
ANNUAL REPORT PURSUANT TO SECTION 13 OR 15(d) OF THE SECURITIES EXCHANGE ACT OF 1934
|
For the fiscal year ended
December 25, 2016
Commission file number:
1-6615
SUPERIOR INDUSTRIES INTERNATIONAL, INC.
(Exact Name of Registrant as Specified in Its Charter)
|
Delaware
|
|
95-2594729
|
|
(State or Other Jurisdiction of Incorporation or Organization)
|
|
(I.R.S. Employer Identification No.)
|
|
|
|
|
|
26600 Telegraph Road, Suite 400
|
|
|
|
Southfield, Michigan
|
|
48033
|
|
(Address of Principal Executive Offices)
|
|
(Zip Code)
|
Registrant’s Telephone Number, Including Area Code:
(248) 352-7300
Securities registered pursuant to Section 12(b) of the Act:
|
Title of Each Class
|
Name of Each Exchange on Which Registered
|
|
|
Common Stock, $0.01 par value
|
New York Stock Exchange
|
|
Securities registered pursuant to Section 12(g) of the Act: None
Indicate by check mark if the registrant is a well-known seasoned issuer, as defined in Rule 405 of the Securities Act. Yes [ ] No [X]
Indicate by check mark if the registrant is not required to file reports pursuant to Section 13 or Section 15(d) of the Act. Yes [ ] No [X]
Indicate by check mark whether the registrant: (1) has filed all reports required to be filed by Section 13 or 15(d) of the Securities Exchange Act of 1934 during the preceding 12 months (or for such shorter period that the registrant was required to file such reports), and (2) has been subject to such filing requirements for the past 90 days. Yes [X] No [ ]
Indicate by check mark whether the registrant has submitted electronically and posted on its corporate Web site, if any, every Interactive Data File required to be submitted and posted pursuant to Rule 405 of Regulation S-T (§ 232.405 of this chapter) during the preceding 12 months (or for such shorter period that the registrant was required to submit and post such files). Yes [X] No [ ]
Indicate by check mark if the disclosure of delinquent filers pursuant to Item 405 of Regulation S-K (§ 229.405) is not contained herein, and will not be contained, to the best of the registrant’s knowledge, in definitive proxy or information statements incorporated by reference in Part III of this Form 10-K or any amendment to this Form 10-K. [X]
Indicate by check mark whether the registrant is a large accelerated filer, an accelerated filer, a non-accelerated filer, or a smaller reporting company. See the definitions of “large accelerated filer,” “accelerated filer” and “smaller reporting company” in Rule 12b-2 of the Exchange Act.
|
Large accelerated filer [ ]
|
Accelerated filer [X]
|
Non-accelerated filer [ ]
|
Smaller reporting company [ ]
|
Indicate by check mark whether the registrant is a shell company (as defined in Rule 12b-2 of the Act). Yes [ ] No [X]
The aggregate market value of the registrant’s $0.01 par value common equity held by non-affiliates as of the last business day of the registrant’s most recently completed second quarter was $657,508,000, based on a closing price of $25.86. On
February 28, 2017
, there were 24,937,711 shares of common stock issued and outstanding.
DOCUMENTS INCORPORATED BY REFERENCE
Portions of the registrant’s
2017
Annual Proxy Statement, to be filed with the Securities and Exchange Commission within 120 days after the close of the registrant’s fiscal year, are incorporated by reference into Part III of this Form 10-K.
SUPERIOR INDUSTRIES INTERNATIONAL, INC.
ANNUAL REPORT ON FORM 10-K
TABLE OF CONTENTS
|
|
|
PAGE
|
||
|
|
|
|||
|
|
|
|||
|
|
|
|||
|
|
|
|||
|
|
|
|||
|
|
|
|||
|
|
|
|||
|
|
|
|
|
|
|
|
|
|
|
|
|
|
|
|||
|
|
|
|||
|
|
|
|||
|
|
|
|||
|
|
|
|||
|
|
|
|||
|
|
|
|||
|
|
|
|||
|
|
|
|
|
|
|
|
|
|
|
|
|
|
|
|||
|
|
|
|||
|
|
|
|||
|
|
|
|||
|
|
|
|||
|
|
|
|
|
|
|
|
|
|
|
|
|
|
|
|||
|
|
|
|||
|
|
|
|
|
|
|
|
|
|
||
CAUTIONARY STATEMENT REGARDING FORWARD-LOOKING INFORMATION
The Private Securities Litigation Reform Act of 1995 provides a safe harbor for forward-looking statements made by us or on our behalf. We have included or incorporated by reference in this Annual Report on Form 10-K (including in the sections entitled "Risk Factors" and "Management’s Discussion and Analysis of Financial Condition and Results of Operations") and from time to time our management may make statements that may constitute “forward-looking statements” within the meaning of Section 27A of the Securities Exchange Act of 1933 and Section 21E of the Securities Act of 1934. These forward-looking statements are based upon management's current expectations, estimates, assumptions and beliefs concerning future events and conditions and may discuss, among other things, anticipated future performance (including sales and earnings), expected growth, future business plans and costs and potential liability for environmental-related matters. Any statement that is not historical in nature is a forward-looking statement and may be identified by the use of words and phrases such as “expects,” “anticipates,” “believes,” “will,” “will likely result,” “will continue,” “plans to” and similar expressions. These statements include our belief regarding general automotive industry and market conditions and growth rates, as well as general domestic and international economic conditions.
Readers are cautioned not to place undue reliance on forward-looking statements. Forward-looking statements are necessarily subject to risks, uncertainties and other factors, many of which are outside the control of the company, which could cause actual results to differ materially from such statements and from the company's historical results and experience. These risks, uncertainties and other factors include, but are not limited to, those described in Part I - Item 1A - "Risk Factors" and Part II - Item 7 - "Management's Discussion and Analysis of Financial Condition and Results of Operations" of this Annual Report on Form 10-K and elsewhere in the Annual Report and those described from time to time in our other reports filed with the Securities and Exchange Commission.
Readers are cautioned that it is not possible to predict or identify all of the risks, uncertainties and other factors that may affect future results and that the risks described herein should not be considered to be a complete list. Any forward-looking statement speaks only as of the date on which such statement is made, and the company undertakes no obligation to update or revise any forward-looking statement, whether as a result of new information, future events or otherwise.
Description of Business and Industry
The principal business of Superior Industries International, Inc. (referred to herein as the “company” or “we,” “us” and “our”) is the design and manufacture of aluminum wheels for sale to original equipment manufacturers ("OEMs"). We are one of the largest suppliers of cast aluminum wheels to the world's leading automobile and light truck manufacturers, with manufacturing operations in the United States ("U.S.") and Mexico. Customers in North America represent the principal market for our products. Our OEM aluminum wheels are primarily sold for factory installation, as either optional or standard equipment, on many vehicle models manufactured by BMW, Fiat Chrysler Automobiles N.V. ("FCA"), Ford, General Motors ("GM"), Mitsubishi, Nissan, Subaru, Tesla, Toyota and Volkswagen.
Historically our business focus primarily was on providing wheels for relatively high-volume programs with lower degrees of competitive differentiation. In order to improve our strategic position, we continue to augment our product portfolio with wheels containing higher technical content and greater differentiation. We believe this direction is consistent with the trend of the market and needs of our customers. In connection with this strategic advancement, we opened a new plant in Mexico in 2015 and continue to invest in new manufacturing processes targeting the more sophisticated finishes and larger diameter products which typically have more value. At the same time, we also continue to explore and implement operating improvements to enhance efficiencies and lower cost. As part of our continued strategy to provide our customers with premium finishes, we began building a physical vapor deposition ("PVD") finishing facility next to one of our already existing facilities. PVD is a finishing method that creates bright chrome-like surfaces with an environmentally friendly process. Because the majority of our customer programs are planned two or three years in advance, the upgrade of our product portfolio will evolve over time.
The diversification of the product portfolio into larger wheels and premium finishes could result in higher margins and continued growth in earnings. The diluted earnings per share has improved significantly over the last three years due mainly to the improvement in gross margin, which is attributed to increased unit sales and cost efficiency initiatives. The charts below show our 2016 major customers, key highlights for 2016 and the improvement in diluted earnings per share.
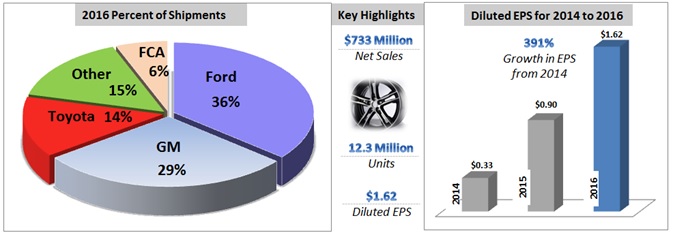
Demand for our products is mainly driven by light-vehicle production levels in North America. The North American light-vehicle production level in 2016 was 17.8 million vehicles, a 3 percent or 0.4 million unit increase over 2015. The 2016 North American production level was one of the highest in the history of the industry. We track annual production rates based on information from
Ward's Automotive Group
. Current economic conditions, low consumer interest rates and relatively inexpensive gas prices have generally been supportive of market growth and, in addition, the record high average age of vehicles on the road appears to be contributing to higher rates of vehicle replacement. It was reported in 2016 that the average age of all light vehicles in the U.S. increased to an all-time high of 11.6 years, according to IHS Automotive.
In 2015, production of automobiles and light-duty trucks in North America reached 17.4 million units, an increase of 3 percent over 2014. Production in 2014 reached 16.9 million units, an increase of 5 percent, from 16.1 million vehicles in 2013.
1
Raw Materials
The raw materials used in manufacturing our products are readily available and are obtained through numerous suppliers with whom we have established trade relations. Purchased aluminum accounted for the vast majority of our total raw material requirements during 2016. The majority of our aluminum requirements are met through purchase orders with certain major producers, with physical supply primarily coming from North American production locations. Generally, aluminum purchase orders are fixed as to minimum and maximum quantities, which the producers must supply and we must purchase during the term of the orders. During 2016, we were able to successfully secure aluminum commitments from our primary suppliers to meet production requirements and we anticipate being able to source aluminum requirements to meet our expected level of production in 2017. We procure other raw materials through numerous suppliers with whom we have established trade relationships.
When market conditions warrant, we may also enter into purchase commitments to secure the supply of certain commodities used in the manufacture of our products, such as aluminum, natural gas and other raw materials. We had no purchase commitments in place for the delivery of aluminum, natural gas or other raw materials in 2016.
Customer Dependence
We have proven our ability to be a consistent producer of high quality aluminum wheels with the capability to meet our customers' price, quality, delivery and service requirements. We strive to continually enhance our relationships with our customers through continuous improvement programs, not only through our manufacturing operations but in the engineering, design, development and quality areas as well. These key business relationships have resulted in multiple vehicle supply contract awards with our key customers in the past few years.
Ford, GM, Toyota and FCA were our only customers individually accounting for more than 10 percent of our consolidated trade sales. Net sales to these customers in 2016, 2015 and 2014 were as follows (dollars in millions):
|
2016
|
2015
|
2014
|
||||||||||
|
Percent of Net Sales
|
Dollars
|
Percent of Net Sales
|
Dollars
|
Percent of Net Sales
|
Dollars
|
|||||||
|
Ford
|
38%
|
$271.4
|
44%
|
$315.1
|
44%
|
$321.6
|
||||||
|
GM
|
30%
|
$216.4
|
24%
|
$175.6
|
24%
|
$175.8
|
||||||
|
Toyota
|
14%
|
$98.4
|
14%
|
$104.5
|
12%
|
$88.3
|
||||||
|
FCA
|
6%
|
$44.4
|
8%
|
$56.3
|
10%
|
$72.0
|
||||||
The loss of all or a substantial portion of our sales to Ford, GM, Toyota or FCA
would have a significant adverse effect on our financial results. See also Item 1A - "Risk Factors" of this Annual Report.
Foreign Operations
We manufacture a significant portion of our products in Mexico that are sold both in the U.S. and Mexico. Net sales of wheels manufactured in our Mexico operations in 2016 totaled $612.3 million and represented 84 percent of our total net sales. We anticipate that the portion of our products produced in Mexico versus the U.S. will remain comparable in 2017. Net property, plant and equipment used in our operations in Mexico totaled $189.6 million at December 31, 2016. The overall cost for us to manufacture wheels in Mexico currently is lower than the cost to manufacture wheels in the U.S., in particular, because of reduced labor costs relating to lower prevailing wage rates. Such current advantages to manufacturing our product in Mexico may be affected by changes in cost structures, tariffs imposed by the U.S., trade protection laws, policies and other regulations affecting trade and investments, social, political, labor, or general economic conditions in Mexico. Other factors that can affect the business and financial results of our Mexican operations include, but are not limited to, valuation of the peso, availability and competency of personnel and tax regulations in Mexico. See also Item 1A, "Risk Factors - Our international operations and international trade agreements make us vulnerable to risks associated with doing business in foreign countries that can affect our business, financial condition and results of operations" and Item 1A, "Risk Factors - Fluctuations in foreign currencies may adversely impact our financial condition."
2
Net Sales Backlog
We receive OEM purchase orders typically for one year for vehicle wheel programs that usually last three to five years. We manufacture and ship based on customer release schedules, normally provided on a weekly basis, which can vary in part due to changes in market demand, industry and/or customer maintenance cycles, new program introductions or dealer inventory levels. While we have long term commitments for our wheel programs from our customers, the quantity is restricted to weekly demand schedules. Since the release schedules are based on weekly demand from our customers, the backlog is not significant and is not a meaningful indicator of our future operating results.
Competition
Competition in the market for aluminum wheels is based primarily on price, technology, quality, delivery and overall customer service. We are the largest producer of aluminum wheels for OEM installations in North America. We currently supply approximately 21 percent of the aluminum wheels installed on passenger cars and light-duty trucks in North America. Competition is global in nature with a significant volume of exports from Asia into North America. There are several competitors with facilities in North America but we have more than twice the North American production capacity of any competitor based on our current estimation. See also Item 1A., "Risk Factors" of this Annual Report. Other types of road wheels, such as those made of steel, also compete with our products. According to
Ward's Automotive Group,
the aluminum wheel penetration rate on passenger cars and light-duty trucks in the U.S. was 81 percent for the 2016 model year and 79 percent for the 2015 model year, compared to 81 percent for the 2014 model year. We expect the aluminum wheel penetration rate to remain relatively stable. However, several factors can affect this rate including price, fuel economy requirements and styling preference. Although aluminum wheels currently are more costly than steel, aluminum is a lighter material than steel, which is desirable for fuel efficiency and generally viewed as aesthetically superior to steel and thus, more desirable to the OEMs and their customers.
Research and Development
Our policy is to continuously review, improve and develop our engineering capabilities to satisfy our customer requirements in the most efficient and cost effective manner available. We strive to achieve this objective by attracting and retaining top engineering talent and by maintaining the latest state-of-the-art computer technology to support engineering development. A fully staffed engineering center, located in Fayetteville, Arkansas, supports our research and development manufacturing needs. We also have a technical sales function at our corporate headquarters in Southfield, Michigan that maintains a complement of engineering staff located near some of our largest customers' headquarters and engineering and purchasing offices.
Research and development costs (primarily engineering and related costs), which are expensed as incurred, are included in cost of sales in our consolidated income statements. Amounts expended on research and development costs during each of the last three years were $3.8 million in 2016; $2.6 million in 2015; and $4.4 million in 2014.
Government Regulation
Safety standards in the manufacture of vehicles and automotive equipment have been established under the National Traffic and Motor Vehicle Safety Act of 1966, as amended. We believe that we are in compliance with all federal standards currently applicable to OEM suppliers and to automotive manufacturers.
Environmental Compliance
Our manufacturing facilities, like most other manufacturing companies, are subject to solid waste, water and air pollution control standards mandated by federal, state and local laws. Violators of these laws are subject to fines and, in extreme cases, plant closure. We believe our facilities are in material compliance with all presently applicable standards. However, costs related to environmental protection may grow due to increasingly stringent laws and regulations. The cost of environmental compliance was approximately $0.4 million in 2016, $0.7 million in 2015 and $0.4 million in 2014. We expect that future environmental compliance expenditures will approximate these levels and will not have a material effect on our consolidated financial position. Furthermore, climate change legislation or regulations restricting emission of "greenhouse gases" could result in increased operating costs and reduced demand for the vehicles that use our products. See also Item 1A, - "Risk Factors - We are subject to various environmental laws" of this Annual Report.
3
Employees
As of December 31, 2016, we had approximately 4,189 full-time employees and 682 contract employees compared to approximately 3,050 full-time employees and 719 contract employees at December 31, 2015. None of our employees are covered by a collective bargaining agreement. The increase in employees in 2016 was due in part to the operational inefficiencies we experienced at one of our plants. See Item 7, "Management's Discussion and Analysis of Financial Conditions and Results of Operations."
Fiscal Year End
Our fiscal year is the 52- or 53-week period ending generally on the last Sunday of the calendar year. The fiscal years 2016, 2015 and 2014 comprised the 52-week periods ended on December 25, 2016, December 27, 2015 and December 28, 2014, respectively. For convenience of presentation, all fiscal years are referred to as beginning as of January 1, and ending as of December 31, but actually reflect our financial position and results of operations for the periods described above.
Segment Information
We operate as a single integrated business and, as such, have only one operating segment - automotive wheels. Financial information about this segment and geographic areas is contained in Note 5, "Business Segments" in Notes to Consolidated Financial Statements in Item 8, "Financial Statements and Supplementary Data" of this Annual Report.
Seasonal Variations
The automotive industry is cyclical and varies based on the timing of consumer purchases of vehicles, which in turn vary based on a variety of factors such as general economic conditions, availability of consumer credit, interest rates and fuel costs. While there have been no significant seasonal variations in the past few years, production schedules in our industry can vary significantly from quarter to quarter to meet the scheduling demands of our customers.
History
We were initially incorporated in Delaware in 1969. Our entry into the OEM aluminum wheel business in 1973 resulted from our successful development of manufacturing technology, quality control and quality assurance techniques that enabled us to satisfy the quality and volume requirements of the OEM market for aluminum wheels. The first aluminum wheel for a domestic OEM customer was a Mustang wheel for Ford Motor Company. We reincorporated in California in 1994, and in 2015, we moved our headquarters from Van Nuys, California to Southfield, Michigan and reincorporated in Delaware. Our stock is traded on the New York Stock Exchange under the symbol "SUP."
Available Information
Our Annual Report on Form 10-K, quarterly reports on Form 10-Q and any amendments thereto are available, without charge, on or through our website, www.supind.com, under “Investors,” as soon as reasonably practicable after they are filed electronically with the Securities and Exchange Commission ("SEC"). The public may read and copy any materials filed with the SEC at the SEC's Public Reference Room at 100 F Street, NE, Washington, DC 20549. Information on the operation of the Public Reference Room can be obtained by calling the SEC at 1-800-SEC-0330. The SEC also maintains a website, www.sec.gov, which contains these reports, proxy and information statements and other information regarding the company. Also included on our website, www.supind.com, under "Investor," is our Code of Conduct, which, among others, applies to our Chief Executive Officer ("CEO"), Chief Financial Officer and Chief Accounting Officer. Copies of all SEC filings and our Code of Conduct are also available, without charge, upon request from Superior Industries International, Inc., Shareholder Relations, 26600 Telegraph Road, Suite 400, Southfield, MI 48033.
The content on any website referred to in this Annual Report on Form 10-K is not incorporated by reference in this Annual Report on Form 10-K.
The following discussion of risk factors contains “forward-looking” statements, which may be important to understanding any statement in this Annual Report or elsewhere. The following information should be read in conjunction with Item 7. "Management's
4
Discussion and Analysis of Financial Condition and Results of Operations ("MD&A")" and Item 8, "Financial Statements and Supplementary Data" of this Annual Report.
Our business routinely encounters and addresses risks and uncertainties. Our business, results of operations and financial condition could be materially adversely affected by the factors described below. Discussion about the important operational risks that our business encounters can also be found in the MD&A section and in the business description in Item 1, "Business" of this Annual Report. Below, we have described our present view of the most significant risks and uncertainties we face. Additional risks and uncertainties not presently known to us, or that we currently do not consider significant, could also potentially impair our business, results of operations and financial condition. Our reactions to these risks and uncertainties as well as our competitors' reactions will affect our future operating results.
Risks Relating To Our Company
The automotive industry is cyclical and volatility in the automotive industry could adversely affect our financial performance.
The majority of our sales are made in domestic U.S. markets and almost exclusively within North America. Therefore, our financial performance depends largely on conditions in the U.S. automotive industry, which in turn can be affected significantly by broad economic and financial market conditions. Consumer demand for automobiles is subject to considerable volatility as a result of consumer confidence in general economic conditions, levels of employment, prevailing wages, fuel prices and the availability and cost of consumer credit. With steady improvement in the North American automotive industry since the global recession that began in 2008, vehicle production levels in 2016 reached the highest level in the last decade. However, there can be no guarantee that the improvements in recent years will be sustained or that reductions from current production levels will not occur in future periods. Demand for aluminum wheels can be further affected by other factors, including pricing and performance comparisons to competitive materials such as steel. Finally, the demand for our products is influenced by shifts of market share between vehicle manufacturers and the specific market penetration of individual vehicle platforms being sold by our customers.
A limited number of customers represent a large percentage of our sales. The loss of a significant customer or decrease in demand could adversely affect our operating results.
Ford, GM, Toyota and FCA, together, represented approximately 88 percent of our total sales in 2016. Our OEM customers are not required to purchase any minimum amount of products from us. Increasingly global procurement practices, the pace of new vehicle introduction and demand for price reductions may make it more difficult to maintain long-term supply arrangements with our customers, and there are no guarantees that we will be able to negotiate supply arrangements with our customers on terms acceptable to us in the future. The contracts we have entered into with most of our customers provide that we will manufacture wheels for a particular vehicle model, rather than manufacture a specific quantity of products. Such contracts range from one year to the life of the model (usually three to five years), typically are non-exclusive and do not require the purchase by the customer of any minimum number of wheels from us. Therefore, a significant decrease in consumer demand for certain key models or group of related models sold by any of our major customers, or a decision by a manufacturer not to purchase from us, or to discontinue purchasing from us, for a particular model or group of models, could adversely affect our results of operations and financial condition.
We operate in a highly competitive industry.
The automotive component supply industry is highly competitive, both domestically and internationally. Competition is based on a number of factors, including price, technology, quality, delivery and overall customer service and available capacity to meet customer demands. Some of our competitors are companies, or divisions or subsidiaries of companies, which are larger and have greater financial and other resources than we do. We cannot ensure that our products will be able to compete successfully with the products of these competitors. In particular, our ability to increase manufacturing capacity typically requires significant investments in facilities, equipment and personnel. Our operating facilities are at full or near to full capacity levels which may cause us to incur labor costs at premium rates in order to meet customer requirements, experience increased maintenance expenses or require us to replace our machinery and equipment on an accelerated basis. Furthermore, the nature of the markets in which we compete has attracted new entrants, particularly from low cost countries. As a result, our sales levels and margins continue to be adversely affected by pricing pressures reflective of significant competition from producers located in low-cost foreign markets, such as China. Such competition with lower-cost structures poses a significant threat to our ability to compete internationally and domestically. These factors have led to our customers awarding business to foreign competitors in the past, and they may continue to do so in the future. In addition, any of our competitors may foresee the course of market development more accurately, develop products that are superior to our products, have the ability to produce similar products at a lower cost or adapt more quickly to
5
new technologies or evolving customer requirements. Consequently, our products may not be able to compete successfully with competitors' products.
We experience continual pressure to reduce costs.
The vehicle market is highly competitive at the OEM level, which drives continual cost-cutting initiatives by our customers. Customer concentration, relative supplier fragmentation and product commoditization have translated into continual pressure from OEMs to reduce the price of our products. It is possible that pricing pressures beyond our expectations could intensify as OEMs pursue restructuring and cost-cutting initiatives. If we are unable to generate sufficient production cost savings in the future to offset such price reductions, our gross margin, rate of profitability and cash flows could be adversely affected. In addition, changes in OEMs' purchasing policies or payment practices could have an adverse effect on our business. Our OEM customers typically attempt to qualify more than one wheel supplier for the programs we participate in and for programs we may bid on in the future. As such, our OEM customers are able to negotiate favorable pricing or may decrease sales volume. Such actions may result in decreased sales volumes and unit price reductions for our company, resulting in lower revenues, gross profit, operating income and cash flows.
We may be unable to successfully implement cost-saving measures or achieve expected benefits under our plans to improve operations.
As part of our ongoing focus to provide high quality products, we continually analyze our business to further improve our operations and identify cost-cutting measures. We may be unable to successfully identify or implement plans targeting these initiatives, or fail to realize the benefits of the plans we have already implemented, as a result of operational difficulties, a weakening of the economy or other factors. Cost reductions may not fully offset decreases in the prices of our products due to the time required to develop and implement cost reduction initiatives. Additional factors such as inconsistent customer ordering patterns, increasing product complexity and heightened quality standards are making it increasingly more difficult to reduce our costs. It is possible that as we incur costs to implement improvement strategies, the impact on our financial position, results of operations and cash flow may be negative.
Interruption in our production capabilities could result in increased freight costs or contract cancellations.
In the last six months of 2016, we experienced significant operating inefficiencies primarily in one of our manufacturing facilities. The inefficiencies stemmed from a variety of issues that reduced production rates. Contributing factors to the inefficiencies included an electricity outage and unanticipated equipment reliability issues which reduced finished goods and work-in-process inventories. We also experienced several new product launches and significant ramp-up in demand for newer products for which unusually high scrap rates were occurring. Lower than normal production yields coupled with the loss of inventory safety stock resulted in a series of expedited shipments to customers. The higher than normal costs included approximately $13 million in freight expediting costs and additional costs related to the production inefficiencies.
An interruption in production capabilities at any of our facilities as a result of equipment failure, interruption of raw materials or other supplies, labor disputes or other reasons could result in our inability to produce our products, which would reduce our sales and operating results for the affected period and harm our customer relationships. We have, from time to time, undertaken significant re-tooling and modernization initiatives at our facilities, which in the past have caused, and in the future may cause, unexpected delays and plant underutilization, and such adverse consequences may continue to occur as we continue to modernize our production facilities. In addition, we generally deliver our products only after receiving the order from the customer and thus typically do not hold large inventories. In the event of a production interruption at any of our manufacturing facilities, even if only temporary, or if we experience delays as a result of events that are beyond our control, delivery times to our customers could be severely affected. Any significant delay in deliveries to our customers could lead to premium freight costs and other performance penalties, as well as contract cancellations, and cause us to lose future sales and expose us to other claims for damages. Our manufacturing facilities are also subject to the risk of catastrophic loss due to unanticipated events such as fires, earthquakes, explosions or violent weather conditions. We have in the past, and may in the future, experience plant shutdowns or periods of reduced production which could have a material adverse effect on our results of operations or financial condition.
Similarly, it also is possible that our customers may experience production delays or disruptions for a variety of reasons, which could include supply-chain disruption for parts other than wheels, equipment breakdowns or other events affecting vehicle assembly rates that impact us, work stoppages or slow-downs at factories where our products are consumed, or even catastrophic events such as fires, disruptive weather conditions or natural disasters. Such disruptions at the customer level may cause the affected customer to halt or limit the purchase of our products.
6
We may be unable to successfully launch new products and/or achieve technological advances.
In order to effectively compete in the automotive supply industry, we must be able to launch new products and adopt technology to meet our customers' demand in a timely manner. However, we cannot ensure that we will be able to install and certify the equipment needed for new product programs in time for the start of production, or that the transitioning of our manufacturing facilities and resources under new product programs will not impact production rates or other operational efficiency measures at our facilities. In addition, we cannot ensure that our customers will execute the launch of their new product programs on schedule. We are also subject to the risks generally associated with new product introductions and applications, including lack of market acceptance, delays in product development and failure of products to operate properly. Further, changes in competitive technologies may render certain of our products obsolete or less attractive. Our ability to anticipate changes in technology and to successfully develop and introduce new and enhanced products on a timely basis will be a significant factor in our ability to remain competitive. Our failure to successfully and timely launch new products or adopt new technologies, or a failure by our customers to successfully launch new programs, could adversely affect our results. We cannot ensure that we will be able to achieve the technological advances that may be necessary for us to remain competitive or that certain of our products will not become obsolete.
Our international operations and international trade agreements make us vulnerable to risks associated with doing business in foreign countries that can affect our business, financial condition and results of operations.
We manufacture a substantial portion of our products in Mexico, have a minor investment in a wheel manufacturing company in India and we sell our products internationally. Accordingly, unfavorable changes in foreign cost structures, trade protection laws, regulations and policies affecting trade and investments and social, political, labor or economic conditions in a specific country or region, among other factors, could have a negative effect on our business and results of operations. Legal and regulatory requirements differ among jurisdictions worldwide. Violations of these laws and regulations could result in fines, criminal sanctions, prohibitions on the conduct of our business and damage to our reputation. Although we have policies, controls and procedures designed to ensure compliance with these laws, our employees, contractors, or agents may violate our policies.
Changes in U.S. social, political, regulatory and economic conditions or in laws and policies governing foreign trade, manufacturing, development and investment in the countries where we currently develop and sell products could adversely affect our business.
A significant portion of our business activities are conducted in Mexico. New leadership in the U.S. federal government is not supportive of certain existing international trade agreements, including the North American Free Trade Agreement (“NAFTA”). If the U.S. withdraws from or materially modifies NAFTA or certain other international trade agreements, our business, financial condition and results of operations could be adversely affected. Proposals to institute a border adjustment of 20% for imports could have a negative impact on our operations.
Fluctuations in foreign currencies may adversely impact our financial condition.
Due to the growth of our operations outside of the U.S., we have experienced increased exposure to foreign currency gains and losses in the ordinary course of our business. As a result, fluctuations in the exchange rate between the U.S. dollar, the Mexican peso and any currencies of other countries in which we conduct our business may have a material impact on our financial condition, as cash flows generated in foreign currencies may be used, in part, to service our U.S. dollar-denominated liabilities, or vice versa.
Fluctuations in foreign currency exchange rates may also affect the value of our foreign assets as reported in U.S. dollars, and may adversely affect reported earnings and, accordingly, the comparability of period-to-period results of operations. Changes in currency exchange rates may affect the relative prices at which we and our foreign competitors sell products in the same market. In addition, changes in the value of the relevant currencies may affect the cost of certain items required in our operations. We cannot ensure that fluctuations in exchange rates will not otherwise have a material adverse effect on our financial condition or results of operations or cause significant fluctuations in quarterly and annual results of operations.
Our business requires us to settle transactions between currencies in both directions - i.e., peso to U.S. dollar and vice versa. To the greatest extent possible, we attempt to match the timing of transaction settlements between currencies to create a “natural hedge.” Based on the current business model and levels of production and sales activity, the net imbalance between currencies depends on specific circumstances. While changes in the terms of the contracts with our customers will be creating an imbalance between currencies that we are hedging with foreign currency forward contracts, there can be no assurances that our hedging program will effectively offset the impact of the imbalance between currencies or that the net transaction balance will not change significantly in the future.
To manage this risk, we may enter into foreign currency forward and option contracts with financial institutions to protect against foreign exchange risks associated with certain existing assets and liabilities, certain firmly committed transactions and forecasted
7
future cash flows. We have a program to hedge a portion of our material foreign exchange exposures, typically for up to 36 months. However, we may choose not to hedge certain foreign exchange exposures for a variety of reasons including, but not limited to, accounting considerations and the prohibitive economic cost of hedging particular exposures. There is no guarantee that our hedge program will effectively mitigate our exposures to foreign exchange changes which could have material adverse effects on our cash flows and results of operations.
Increases in the costs and restrictions on availability of raw materials could adversely affect our operating margins and cash flow.
Generally, we obtain our raw materials, supplies and energy requirements from various sources. Although we currently maintain alternative sources, our business is subject to the risk of price increases and periodic delays in delivery. Fluctuations in the prices of raw materials may be driven by the supply/demand relationship for that commodity or governmental regulation. In addition, if any of our suppliers seek bankruptcy relief or otherwise cannot continue their business as anticipated, the availability or price of raw materials could be adversely affected.
Although we are able to periodically pass certain aluminum cost increases on to our customers, we may not be able to pass along all changes in aluminum costs, or there may be a delay in passing the aluminum costs onto our customers. Our customers are not obligated to accept energy or other supply cost increases that we may attempt to pass along to them. This inability to pass on these cost increases to our customers could adversely affect our operating margins and cash flow, possibly resulting in lower operating income and profitability.
Aluminum and alloy pricing may have a material effect on our operating margins and results of operations.
The cost of aluminum is a significant component in the overall cost of a wheel and in our selling prices to OEM customers. The price for aluminum we purchase is adjusted monthly based primarily on changes in certain published market indices, but the timing of such adjustments is based on specific customer agreements and can vary from monthly to quarterly. As a result, the timing of aluminum price adjustments flowing through sales rarely will match the timing of such changes in cost and can result in fluctuations to our gross profit. This is especially true during periods of frequent increases or decreases in the market price of aluminum.
The aluminum we use to manufacture wheels also contains additional alloying materials, including silicon. The cost of alloying materials also is a component of the overall cost of a wheel. The price of the alloys we purchase is also based on certain published market indices; however, most of our customer agreements do not provide price adjustments for changes in market prices of alloying materials. Increases or decreases in the market prices of these alloying materials could have a material effect on our operating margins and results of operations.
We are subject to various environmental laws.
We incur significant costs to comply with applicable environmental, health and safety laws and regulations in the ordinary course of our business. We cannot ensure that we have been or will be at all times in complete compliance with such laws and regulations. Failure to be in compliance with such laws and regulations could result in material fines or sanctions. Additionally, changes to such laws or regulations may have a significant impact on our cash flows, financial condition and results of operations.
We are also subject to various foreign, federal, state and local environmental laws, ordinances and regulations, including those governing discharges into the air and water, the storage, handling and disposal of solid and hazardous wastes, the remediation of soil and groundwater contaminated by hazardous substances or wastes and the health and safety of our employees. The nature of our current and former operations and the history of industrial uses at some of our facilities expose us to the risk of liabilities or claims with respect to environmental and worker health and safety matters which could have a material adverse effect on our financial health. In addition, some of our properties are subject to indemnification and/or cleanup obligations of third parties with respect to environmental matters. However, in the event of the insolvency or bankruptcy of such third parties, we could be required to bear the liabilities that would otherwise be the responsibility of such third parties.
Further, changes in legislation or regulation imposing reporting obligations on, or limiting emissions of greenhouse gases from, or otherwise impacting or limiting our equipment and operations or from the vehicles that use our products could adversely affect demand for those vehicles or require us to incur costs to become compliant with such regulations.
We are from time to time subject to litigation, which could adversely impact our financial condition or results of operations.
The nature of our business exposes us to litigation in the ordinary course of our business. We are exposed to potential product liability and warranty risks that are inherent in the design, manufacture and sale of automotive products, the failure of which could
8
result in property damage, personal injury or death. Accordingly, individual or class action suits alleging product liability or warranty claims could result. Although we currently maintain what we believe to be suitable and adequate product liability insurance in excess of our self-insured amounts, we cannot assure you that we will be able to maintain such insurance on acceptable terms or that such insurance will provide adequate protection against potential liabilities. In addition, if any of our products prove to be defective, we may be required to participate in a recall. A successful claim brought against us in excess of available insurance coverage, if any, or a requirement to participate in any product recall, could have a material adverse effect on our results of operations or financial condition. We cannot give assurance that any current or future claims will not adversely affect our cash flows, financial condition or results of operations.
We may be unable to attract and retain key personnel.
Our success depends, in part, on our ability to attract, hire, train and retain qualified managerial, engineering, sales and marketing personnel. We face significant competition for these types of employees in our industry. We may be unsuccessful in attracting and retaining the personnel we require to conduct our operations successfully. In addition, key personnel may leave us and compete against us. Our success also depends to a significant extent on the continued service of our senior management team. We may be unsuccessful in replacing key managers who either resign or retire. The loss of any member of our senior management team or other experienced senior employees could impair our ability to execute our business plans and strategic initiatives, cause us to lose customers and experience reduced net sales, or lead to employee morale problems and/or the loss of other key employees. In any such event, our financial condition, results of operations, internal control over financial reporting or cash flows could be adversely affected.
We may be unable to maintain effective internal control over financial reporting.
Management is responsible for establishing and maintaining adequate internal control over financial reporting. Many of our key controls rely on maintaining personnel with an appropriate level of accounting knowledge, experience and training in the application of accounting principles generally accepted in the U.S. in order to operate effectively. Material weaknesses or deficiencies may cause our financial statements to contain material misstatements, unintentional errors, or omissions, and late filings with regulatory agencies may occur.
Our share repurchase program may limit our flexibility to pursue other initiatives.
Although our existing cash and funds available under our senior secured credit facility are currently adequate to fund our approved common stock repurchase plan, dedication of our financial resources to the repurchase of outstanding shares will reduce our liquidity and working capital, which in turn may limit our flexibility to pursue other initiatives to grow our business or to return capital to our shareholders through other means. After making such expenditures, a significant change in our business, the economy or an unexpected decrease in our cash flow for any reason could result in the need for additional outside financing.
A disruption in our information technology systems, including a disruption related to cybersecurity, could adversely affect our financial performance.
A cyber-attack that bypasses our information technology ("IT") security systems causing an IT security breach may lead to a material disruption of our IT business systems and/or the loss of business information resulting in adverse consequences to our business, including: an adverse impact on our operations due to the theft, destruction, loss, misappropriation or release of confidential data or intellectual property, operational or business delays resulting from the disruption of IT systems and subsequent clean-up and mitigation activities, an inability to timely prepare and file our financial reports with the Securities Exchange Commission and negative publicity resulting in reputation or brand damage with our customers, partners or industry peers.
We may be unable to successfully achieve expected benefits from our joint ventures or acquisitions.
As we continue to expand globally, we have engaged, and may continue to engage, in joint ventures and we may pursue acquisitions that involve potential risks, including failure to successfully integrate and realize the expected benefits of such joint ventures or acquisitions. Integrating acquired operations is a significant challenge, and there is no assurance that we will be able to manage the integrations successfully. Failure to successfully integrate operations or to realize the expected benefits of such joint ventures or acquisitions may have an adverse impact on our results of operations and financial condition.
9
Our financial statements are subject to changes in accounting standards that could adversely impact our profitability or financial position.
Our consolidated financial statements are subject to the application of generally accepted accounting principles in the United States of America ("U.S. GAAP"), which are periodically revised and/or expanded. Accordingly, from time to time, we are required to adopt new or revised accounting standards issued by recognized authoritative bodies, including the Financial Accounting Standards Board ("FASB"). Recently, accounting standard setters issued new guidance which further interprets or seeks to revise accounting pronouncements related to revenue recognition and lease accounting as well as to issue new standards expanding disclosures. The impact of accounting pronouncements that have been issued but not yet implemented is disclosed in our annual and quarterly reports on Form 10-K and Form 10-Q. An assessment of proposed standards is not provided, as such proposals are subject to change through the exposure process and, therefore, their effects on our consolidated financial statements cannot be meaningfully assessed. It is possible that future accounting standards we are required to adopt could change the current accounting treatment that we apply to our consolidated financial statements and that such changes could have a material adverse effect on our reported results of operations and financial position.
Unanticipated changes in our effective tax rate, the adoption of new tax legislation or exposure to additional income tax liabilities could adversely affect our profitability.
We are subject to income taxes in the U.S. and other international jurisdictions. Our income tax provision and cash tax liability in the future could be adversely affected by changes in the distribution of earnings in countries with differing statutory tax rates, changes in the valuation of deferred tax assets and liabilities, changes in tax laws and the discovery of new information in the course of our tax return preparation process. We are also subject to ongoing tax audits. These audits can involve complex issues, which may require an extended period of time to resolve and can be highly judgmental. Tax authorities may disagree with certain tax reporting positions taken by us and, as a result, assess additional taxes against us. We regularly assess the likely outcomes of these audits in order to determine the appropriateness of our tax provision.
None.
Our worldwide headquarters is located in Southfield, Michigan. We currently maintain and operate a total of five facilities that manufacture aluminum wheels for the automotive industry. Four of these five facilities are located in Chihuahua, Mexico and one facility is located in Fayetteville, Arkansas. One of the facilities in Chihuahua, Mexico is new, with construction completed in 2014. The new facility also produces aluminum wheels for the automotive industry, and production levels reached initial rated capacity in the fourth quarter of 2015. An expansion to this facility was completed during the first quarter of 2016. Excluding the Rogers, Arkansas location which was closed in 2014, the five active facilities encompass 2,540,000 square feet of manufacturing space. We own all of our manufacturing facilities, and we lease our worldwide headquarters located in Southfield, Michigan and other temporary facilities.
In general, our manufacturing facilities, which have been constructed at various times over the past several years, are in good operating condition and are adequate to meet our current production capacity requirements. There are active maintenance programs to keep these facilities in good condition, and we have an active capital spending program to replace equipment as needed to maintain factory reliability and remain technologically competitive on a worldwide basis.
Additionally, reference is made to Note 1, "Summary of Significant Accounting Policies," Note 8, "Property, Plant and Equipment" and Note 11, "Leases and Related Parties", in Notes to the Consolidated Financial Statements in Item 8, "Financial Statements and Supplementary Data" of this Annual Report.
We are party to various legal and environmental proceedings incidental to our business. Certain claims, suits and complaints arising in the ordinary course of business have been filed or are pending against us. Based on facts now known, we believe all such matters are adequately provided for, covered by insurance, are without merit, and/or involve such amounts that would not
10
materially adversely affect our consolidated results of operations, cash flows or financial position. See also under Item 1A, "Risk Factors - We are from time to time subject to litigation, which could adversely impact our financial condition or results of operations" of this Annual Report.
Not applicable.
Information regarding executive officers who are also Directors is contained in our 2017 Annual Proxy Statement under the caption “Election of Directors.” Such information is incorporated into Part III, Item 10, "Directors, Executive Officers and Corporate Governance." With the exception of the CEO, all executive officers are appointed annually by the Board of Directors and serve at the will of the Board of Directors. For a description of the CEO’s employment agreement, see “Employment Agreements” in our 2017 Annual Proxy Statement, which is incorporated herein by reference.
Listed below are the name, age, position and business experience of each of our officers, as of the filing date, who are not directors:
|
Assumed
|
|||
|
Name
|
Age
|
Position
|
Position
|
|
Scot S. Bowie
|
43
|
Vice President and Corporate Controller
|
2015
|
|
Corporate Controller, Black Diamond Equipment
|
2014
|
||
|
Chief Accounting Officer, Affinia Group Inc.
|
2011
|
||
|
Corporate Controller of External Reporting, Affinia Group Inc.
|
2008
|
||
|
Parveen Kakar
|
50
|
Senior Vice President
Sales, Marketing and Product Development
|
2014
|
|
Senior Vice President, Corporate Engineering and Product Development
|
2008
|
||
|
Vice President, Program Development
|
2003
|
||
|
Lawrence R. Oliver
|
52
|
Senior Vice President, Manufacturing Operations
|
2015
|
|
Vice President, Operations, GAF Materials Corporation
|
2014
|
||
|
Vice President, Operations & Integrated Supply Chain, Ingersoll Rand PLC
|
2011
|
||
|
General Manager and Director of Texas Operations, Residential, Commercial Water, ITT Corporation
|
2009
|
||
|
Kerry A. Shiba
|
62
|
Executive Vice President and Chief Financial Officer
|
2010
|
|
Director, Ramsey Industries, LLC, a manufacturer of winches, truck mounted cranes and industrial drives
|
2010
|
||
|
Senior Vice President and Chief Financial Officer, Remy International, a manufacturer of electrical automotive components
|
2006
|
||
|
James F. Sistek
|
53
|
Senior Vice President, Business Operations and Systems
|
2014
|
|
Chief Executive Officer and Founder, Infologic, Inc.
|
2013
|
||
|
Vice President, Shared Services and Chief Information Officer, Visteon Corporation
|
2009
|
||
11
Performance Graph
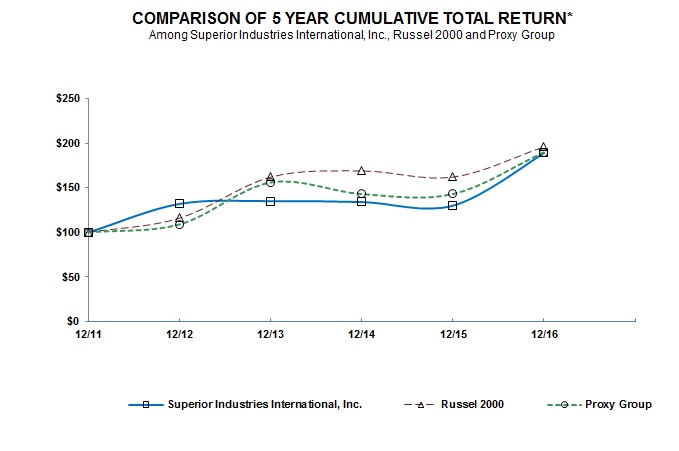
The following graph compares the cumulative total stockholder return from December 31, 2011 through December 31, 2016, for our common stock, the Russell 2000 and a peer group
(1)
of companies that we have selected for purposes of this comparison. We have assumed that dividends have been reinvested, and the returns of each company in the Russell 2000 and the peer group have been weighted to reflect relative stock market capitalization. The graph below assumes that $100 was invested on December 31, 2011, in each of our common stock, the stocks comprising the Russell 2000 and the stocks comprising the peer group.
|
|
Superior Industries
International, Inc.
|
Russel 2000
|
Proxy Peers
|
||||||||
|
2011
|
$
|
100
|
|
$
|
100
|
|
$
|
100
|
|
||
|
2012
|
$
|
132
|
|
$
|
116
|
|
$
|
109
|
|
||
|
2013
|
$
|
135
|
|
$
|
162
|
|
$
|
156
|
|
||
|
2014
|
$
|
134
|
|
$
|
169
|
|
$
|
143
|
|
||
|
2015
|
$
|
130
|
|
$
|
162
|
|
$
|
143
|
|
||
|
2016
|
$
|
190
|
|
$
|
196
|
|
$
|
189
|
|
||
(1)
We do not believe that there is a single published industry or line of business index that is appropriate for comparing stockholder returns. As a result, we have selected a peer group comprised of companies as disclosed in the 2017 Annual Proxy Statement.
12
Dividends
Per share cash dividends declared totaled $0.72 during each of 2016 and 2015. Continuation of dividends is contingent upon various factors, including economic and market conditions, none of which can be accurately predicted, and the approval of our Board of Directors.
Holders of Common Stock
As of February 28, 2017, there were approximately 393 holders of record of our common stock.
Quarterly Common Stock Price Information
Our common stock is traded on the New York Stock Exchange under the symbol "SUP".
The following table sets forth the high and low sales price per share of our common stock during the fiscal periods indicated.
|
|
2016
|
2015
|
|||||||||||||
|
|
High
|
Low
|
High
|
Low
|
|||||||||||
|
First Quarter
|
$
|
23.43
|
|
$
|
16.35
|
|
$
|
20.12
|
|
$
|
17.63
|
|
|||
|
Second Quarter
|
$
|
27.90
|
|
$
|
21.53
|
|
$
|
19.68
|
|
$
|
18.17
|
|
|||
|
Third Quarter
|
$
|
32.12
|
|
$
|
24.76
|
|
$
|
20.22
|
|
$
|
16.60
|
|
|||
|
Fourth Quarter
|
$
|
30.12
|
|
$
|
22.45
|
|
$
|
20.45
|
|
$
|
17.75
|
|
|||
Purchases of Equity Securities by the Issuer and Affiliated Purchasers
The following table shows our purchases of our common stock during the fourth quarter of 2016:
|
(d)
|
||||||||||||||
|
Maximum Dollar
|
||||||||||||||
|
(c)
|
Value of Shares
|
|||||||||||||
|
Total Number of
|
That May Yet be
|
|||||||||||||
|
(a)
|
Shares Purchased
|
Purchased Under
|
||||||||||||
|
Total Number
|
(b)
|
as Part of Publicly
|
Publicly Announced
|
|||||||||||
|
of Shares
|
Average Price
|
Announced
|
Programs
(1)
|
|||||||||||
|
Period
|
Purchased
|
Paid Per Share
|
Programs
|
(in thousands)
|
||||||||||
|
September 26, 2016 to October 23, 2016
|
—
|
|
$
|
—
|
|
—
|
|
$
|
46,746,883
|
|
||||
|
October 24, 2016 to November 20, 2016
|
239,745
|
|
$
|
23.62
|
|
239,745
|
|
$
|
41,073,118
|
|
||||
|
November 21, 2016 to December 31, 2016
|
60,686
|
|
$
|
25.23
|
|
60,686
|
|
$
|
39,538,761
|
|
||||
|
Total
|
300,431
|
|
$
|
23.94
|
|
300,431
|
|
|||||||
|
(1)
|
In October 2014, our Board of Directors approved a stock repurchase program (the "2014 Repurchase Program") authorizing the repurchase of up to $30.0 million of our common stock. Under the 2014 Repurchase Program, we repurchased common stock from time to time on the open market or in private transactions, totaling 1,056,954 shares of company stock at a cost of $19.6 million in 2015 and 585,970 shares for $10.3 million in January of 2016.
|
In January of 2016, our Board of Directors approved a new stock repurchase program (the “2016 Repurchase Program”), authorizing the repurchase of up to an additional $50.0 million of common stock. Under the 2016 Repurchase Program, we repurchased common stock from time to time on the open market or in private transactions, totaling 454,718 shares of company stock at a cost of $10.4 million in 2016.
13
Recent Sales of Unregistered Securities
During the fiscal year 2016, there were no sales of unregistered securities.
Securities Authorized for Issue Under Equity Compensation Plans
The information about securities authorized for issuance under Superior’s equity compensation plans is included in Note 15, “Stock-Based Compensation” in Notes to Consolidated Financial Statements in Item 8 and will also be included in our 2017 Annual Proxy Statement under the caption “Securities Authorized for Issuance under the Equity Compensation Plans.”
The following selected consolidated financial data should be read in conjunction with Item 7, "Management's Discussion and Analysis of Financial Condition and Results of Operations" and Item 8, "Financial Statements and Supplementary Data" of this Annual Report.
Our fiscal year is the 52- or 53-week period ending generally on the last Sunday of the calendar year. The fiscal years 2016, 2015, 2014 and 2013 comprised the 52-week periods ended on December 25, 2016, December 27, 2015, December 28, 2014 and December 29, 2013, respectively. The 2012 fiscal year comprised the 53-week period ended December 30, 2012. For convenience of presentation, all fiscal years are referred to as beginning as of January 1, and ending as of December 31, but actually reflect our financial position and results of operations for the periods described above.
|
Fiscal Year Ended December 31,
|
2016
|
2015
|
2014
|
2013
|
2012
|
|||||||||||||||
|
Income Statement (000s)
|
|
|
|
|
||||||||||||||||
|
Net sales
|
$
|
732,677
|
|
$
|
727,946
|
|
$
|
745,447
|
|
$
|
789,564
|
|
$
|
821,454
|
|
|||||
|
Value added sales
(1)
|
$
|
408,690
|
|
$
|
360,846
|
|
$
|
369,355
|
|
$
|
400,591
|
|
$
|
397,915
|
|
|||||
|
Closure and Impairment Costs
(2)
|
$
|
1,458
|
|
$
|
7,984
|
|
$
|
8,429
|
|
$
|
—
|
|
$
|
—
|
|
|||||
|
Gross profit
|
$
|
86,204
|
|
$
|
71,217
|
|
$
|
50,222
|
|
$
|
64,061
|
|
$
|
60,607
|
|
|||||
|
Income from operations
|
$
|
54,602
|
|
$
|
36,294
|
|
$
|
17,913
|
|
$
|
34,593
|
|
$
|
32,880
|
|
|||||
|
Income before income taxes
|
|
|
|
|
|
|
|
|
||||||||||||
|
and equity earnings
|
$
|
54,721
|
|
$
|
35,283
|
|
$
|
15,702
|
|
$
|
36,841
|
|
$
|
34,489
|
|
|||||
|
Income tax provision
(3)
|
$
|
(13,340
|
)
|
$
|
(11,339
|
)
|
$
|
(6,899
|
)
|
$
|
(14,017
|
)
|
$
|
(3,598
|
)
|
|||||
|
Net income
|
$
|
41,381
|
|
$
|
23,944
|
|
$
|
8,803
|
|
$
|
22,824
|
|
$
|
30,891
|
|
|||||
|
Adjusted EBITDA
(4)
|
$
|
88,511
|
|
$
|
76,053
|
|
$
|
55,753
|
|
$
|
63,616
|
|
$
|
59,599
|
|
|||||
|
Balance Sheet (000s)
|
|
|
|
|
|
|
|
|
||||||||||||
|
Current assets
|
$
|
254,081
|
|
$
|
245,820
|
|
$
|
276,011
|
|
$
|
384,218
|
|
$
|
404,908
|
|
|||||
|
Current liabilities
|
$
|
85,964
|
|
$
|
73,862
|
|
$
|
71,962
|
|
$
|
99,430
|
|
$
|
66,578
|
|
|||||
|
Working capital
|
$
|
168,117
|
|
$
|
171,958
|
|
$
|
204,049
|
|
$
|
284,788
|
|
$
|
338,330
|
|
|||||
|
Total assets
|
$
|
542,756
|
|
$
|
539,929
|
|
$
|
579,910
|
|
$
|
653,388
|
|
$
|
599,601
|
|
|||||
|
Long-term debt
|
$
|
—
|
|
$
|
—
|
|
$
|
—
|
|
$
|
—
|
|
$
|
—
|
|
|||||
|
Shareholders' equity
|
$
|
398,226
|
|
$
|
413,912
|
|
$
|
439,006
|
|
$
|
483,063
|
|
$
|
466,905
|
|
|||||
|
Financial Ratios
|
|
|
|
|
|
|
|
|
||||||||||||
|
Current ratio
(5)
|
3.0:1
|
|
3.3:1
|
|
3.8:1
|
|
3.9:1
|
|
6.1:1
|
|
||||||||||
|
Return on average shareholders' equity
(6)
|
10.2
|
%
|
5.6
|
%
|
1.9
|
%
|
4.8
|
%
|
6.7
|
%
|
||||||||||
|
Share Data
|
|
|
|
|
|
|
|
|
||||||||||||
|
Net income
|
|
|
|
|
|
|
|
|
||||||||||||
|
- Basic
|
$
|
1.63
|
|
$
|
0.90
|
|
$
|
0.33
|
|
$
|
0.83
|
|
$
|
1.13
|
|
|||||
|
- Diluted
|
$
|
1.62
|
|
$
|
0.90
|
|
$
|
0.33
|
|
$
|
0.83
|
|
$
|
1.13
|
|
|||||
|
Shareholders' equity at year-end
|
$
|
15.84
|
|
$
|
15.86
|
|
$
|
16.42
|
|
$
|
17.79
|
|
$
|
17.11
|
|
|||||
|
Dividends declared
|
$
|
0.72
|
|
$
|
0.72
|
|
$
|
0.72
|
|
$
|
0.20
|
|
$
|
1.12
|
|
|||||
14
(1)
Value added sales is a key measure that is not calculated according to U.S. GAAP. In the discussion of operating results, we provide information regarding value added sales. Value added sales represents net sales less the value of aluminum and services provided by outside service providers that are included in net sales. As discussed further below, arrangements with our customers allow us to pass on changes in aluminum prices and outside service provider costs; therefore, fluctuations in underlying aluminum prices and the use of outside service providers generally do not directly impact our profitability. Accordingly, value added sales is worthy of being highlighted for the benefit of users of our financial statements. Our intent is to allow users of the financial statements to consider our net sales information both with and without the aluminum and outside service provider cost components thereof. Management uses value added sales as a key metric to determine growth of the company because it eliminates the volatility of aluminum prices. During 2015, we modified the presentation of value added sales to also exclude third-party manufacturing costs passed directly through to customers and retrospectively applied this modification to 2012 through 2014. See the Non-GAAP Financial Measures section of this Annual Report for a reconciliation of value added sales to net sales.
(2)
See Note 2, "Restructuring in Notes to Consolidated Financial Statements" in Item 8, "Financial Statements and Supplementary Data" in this Annual Report for a discussion of restructuring charges. During 2016, we sold the shut-down Rogers facility for total proceeds of $4.3 million, resulting in a $1.4 million gain on sale. Prior to selling the facility, we incurred $1.5 million of further closure costs including carrying costs for the closed facility and $0.3 million in depreciation. During 2015, the shutdown of the Rogers facility resulted in a gross margin loss of $8.0 million. We incurred $4.3 million in restructuring costs related to an impairment of fixed assets and other associated costs such as asset relocation costs. Additionally, we incurred $2.0 million of further closure costs including carrying costs for the closed facility and $1.7 million in depreciation. The adjusted EBITDA impact of the Rogers facility closure for 2015 was $6.3 million, which includes the $4.3 million of restructuring costs and $2.0 million of carrying costs related to the closed facility. During 2014, we had $8.4 million of restructuring costs related to the closure of the Rogers facility. The carrying costs for the closed facility are not included in the restructuring line in the Consolidated Income Statements of our Consolidated Financial Statements.
(3)
See Note 10, "Income Taxes in Notes to Consolidated Financial Statements" in Item 8, "Financial Statements and Supplementary Data" in this Annual Report for a discussion of material items impacting the 2016, 2015 and 2014 income tax provisions.
(4)
Adjusted EBITDA is a key measure that is not calculated according to GAAP. Adjusted EBITDA is defined as earnings before interest income and expense, income taxes, depreciation, amortization, restructuring and other closure costs and impairments of long-lived assets and investments. We use Adjusted EBITDA as an important indicator of the operating performance of our business. We use Adjusted EBITDA in internal forecasts and models when establishing internal operating budgets, supplementing the financial results and forecasts reported to our Board of Directors and evaluating short-term and long-term operating trends in our operations. We believe the Adjusted EBITDA financial measure assists in providing a more complete understanding of our underlying operational measures to manage our business, to evaluate our performance compared to prior periods and the marketplace, and to establish operational goals. We believe that these non-GAAP financial adjustments are useful to investors because they allow investors to evaluate the effectiveness of the methodology and information used by management in our financial and operational decision-making. Adjusted EBITDA is a non-GAAP financial measure and should not be considered in isolation or as a substitute for financial information provided in accordance with GAAP. This non-GAAP financial measure may not be computed in the same manner as similarly titled measures used by other companies. See the Non-GAAP Financial Measures section of this Annual Report for a reconciliation of our Adjusted EBITDA to net income.
(5)
The current ratio is current assets divided by current liabilities.
(6)
Return on average shareholders' equity is net income divided by average shareholders' equity. Average shareholders' equity is the beginning of the year shareholders' equity plus the end of year shareholders' equity divided by two.
The following discussion of our financial condition and results of operations should be read in conjunction with our Consolidated Financial Statements and the Notes to the Consolidated Financial Statements included in Item 8, "Financial Statements and Supplementary Data" in this Annual Report. This discussion contains forward-looking statements, which involve risks and uncertainties. For cautions about relying on such forward-looking statements, please refer to the section entitled “Forward Looking Statements” at the beginning of this Annual Report immediately prior to Item 1. Our actual results could differ materially from those anticipated in the forward-looking statements as a result of certain factors, including but not limited to those discussed in Item 1A, "Risk Factors" and elsewhere in this Annual Report.
Executive Overview
Historically our business focus primarily was on providing wheels for relatively high-volume programs with lower degrees of competitive differentiation. In order to improve our strategic position, we have augmented our product portfolio with wheels containing higher technical content and greater differentiation. We believe this direction is consistent with the trend of the market and needs of our customers. In connection with this strategic advancement, we opened a new plant in Mexico in 2015 and continue
15
to invest in new manufacturing processes targeting the more sophisticated finishes and larger diameter products which typically have more value. The manufacturing facility in Mexico commenced initial commercial production during the first quarter of 2015 and reached initial rated capacity during the fourth quarter of 2015. We completed a project to expand production capacity at this facility during the first quarter of 2016. The total costs incurred were $132.7 million, of which $127.0 million related to the initial rated capacity of the new facility and $5.7 million related to the expansion. As part of our continued strategy to provide our customers with premium finishes, we began building a physical vapor deposition ("PVD") finishing facility next to one of our already existing facilities. PVD is a finishing method that creates bright chrome-like finishes that are produced with an environmentally safe process. The addition of PVD wheel coating capability and capacity will be completed during 2017 and will be operational in 2018. The total anticipated expenditure on the PVD expansion is $30.0 million. Because the majority of our customer programs are planned two or three years in advance, the upgrade of our product portfolio will occur over time.
During the last three years we have seen a transformation of the company. During this transformational period we have embarked on strategic initiatives that have contributed to a significant increase to earnings. The chart below highlights three key indicators of our growth. Diluted earnings per share increased by almost 5 times, Adjusted EBITDA has grown 59 percent and the return on equity has grown 830 basis points during the last three years. The improvement in earnings is the culmination of improvements in gross margin, lower selling, general and administrative expenses and a lower tax rate.
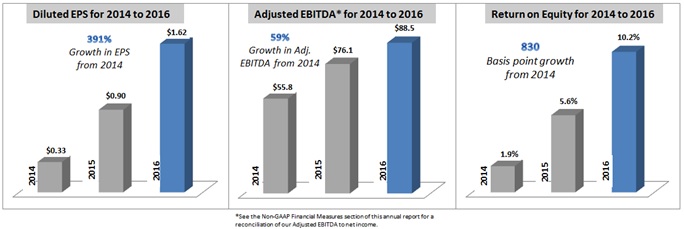
I
ncluded in 2016 Adjusted EBITDA are significant operating inefficiencies incurred primarily in one of our manufacturing facilities in the last six months of 2016. The inefficiencies stemmed from a variety of issues that reduced production rates. Contributing factors to the inefficiencies included an electricity outage and unanticipated equipment reliability issues which reduced finished goods and work-in-process inventories. We also experienced several new product launches and significant ramp-up in demand for newer products for which unusually high scrap rates were occurring. Lower than normal production yields coupled with the loss of inventory safety stock resulted in a series of expedited shipments to customers and other operating inefficiencies. The higher than normal costs included approximately $13 million in freight expediting costs, which primarily related to the last six months. By the end of January 2017,
the affected plant returned to near full capacity and the expedited shipments ceased.
We continue to focus on programs to reduce overall costs through improved operational and procurement practices, capital reinvestment and more rigorous factory maintenance to improve equipment reliability. These investments will typically consist of equipment upgrades and other capital projects focused on improving equipment reliability, increasing production efficiency and enhancing manufacturing process control to better accommodate newer, more complex wheel programs. Our capital investment projects increased in 2016 following a significant decrease in 2015 from the 2014 level when the construction of the new plant in Mexico was in process. It is possible that capital expenditure levels will continue at higher levels as we continue to focus on achieving further improvements to operational efficiencies and manufacturing process capabilities.
Net sales in 2016 increased $4.8 million to $732.7 million from $727.9 million in 2015. Value added sales in 2016 increased $47.9 million to $408.7 million from $360.8 million in 2015, reflecting improvement in unit volume. See the Non-GAAP Financial Measures section of this annual report for a reconciliation of value added sales to net sales. In 2016, wheel shipments increased 9.0 percent to 12.3 million compared to 11.2 million in 2015, which is higher than the increase in North American production of passenger cars and light-duty trucks.
Overall North American production of passenger cars and light-duty trucks in 2016 was reported by industry publications as increasing by 2.5 percent versus 2015 with production of light-duty trucks, which includes pick-up trucks, SUV's, vans and "crossover vehicles", increasing 6 percent and production of passenger cars decreasing 3 percent. Current production levels of
16
the North American automotive industry now have reached the highest level in the past decade. Results for 2016, 2015 and 2014 reflect the continuing trend of growth since the 2009 recession. Current economic conditions and low consumer interest rates have been generally supportive of market growth and, in addition, the continuing high levels in the average age of vehicles on the road appears to be contributing to higher rates of vehicle replacement.
During the last three years we have seen a significant increase in cash from operations. We have utilized the cash from operations to continue enhancing the operational efficiencies of the company and enhance shareholder value. As part of our commitment to enhancing shareholder value, we have been repurchasing our common stock. In October 2014, our Board of Directors approved the 2014 Repurchase Program, authorizing the repurchase of up to $30.0 million of our common stock. Under the 2014 Repurchase Program, we repurchased 1,056,954 shares of company stock at a cost of $19.6 million in 2015 and 585,970 shares for $10.3 million in January 2016. In January of 2016, our Board of Directors approved the 2016 Repurchase Program, authorizing the repurchase of up to $50.0 million of common stock. Under the 2016 Repurchase Program, we repurchased 454,718 shares of company stock at a cost of $10.4 million in 2016. The enhancements to shareholder value have resulted in an increase in share price over the last three years. The chart below highlights the cash from operations and the stock performance in the last three years.
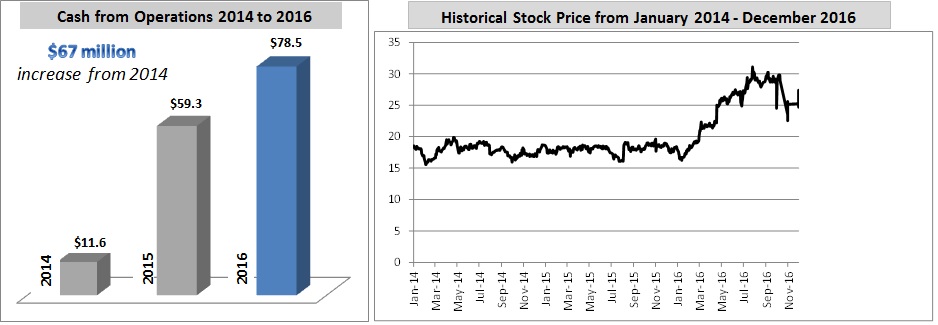
Historical stock price - The chart shows the historical stock price from
January 1, 2014 to December 31, 2016.
Listed in the table below are several key indicators we use to monitor our financial condition and operating performance.
Results of Operations
|
Fiscal Year Ended December 31,
|
2016
|
2015
|
2014
|
||||||||||
|
(Thousands of dollars, except per share amounts)
|
|||||||||||||
|
Net sales
|
$
|
732,677
|
|
$
|
727,946
|
|
$
|
745,447
|
|
||||
|
Value added sales
(1)
|
$
|
408,690
|
|
$
|
360,846
|
|
$
|
369,355
|
|
||||
|
Gross profit
|
$
|
86,204
|
|
$
|
71,217
|
|
$
|
50,222
|
|
||||
|
Percentage of net sales
|
11.8
|
%
|
9.8
|
%
|
6.7
|
%
|
|||||||
|
Income from operations
|
$
|
54,602
|
|
$
|
36,294
|
|
$
|
17,913
|
|
||||
|
Percentage of net sales
|
7.5
|
%
|
5.0
|
%
|
2.4
|
%
|
|||||||
|
Net income
|
$
|
41,381
|
|
$
|
23,944
|
|
$
|
8,803
|
|
||||
|
Percentage of net sales
|
5.6
|
%
|
3.3
|
%
|
1.2
|
%
|
|||||||
|
Diluted earnings per share
|
$
|
1.62
|
|
$
|
0.90
|
|
$
|
0.33
|
|
||||
|
Adjusted EBITDA
(2)
|
$
|
88,511
|
|
$
|
76,053
|
|
$
|
55,753
|
|
||||
|
Percentage of net sales
(3)
|
12.1
|
%
|
10.4
|
%
|
7.5
|
%
|
|||||||
|
Percentage of value added sales
(4)
|
21.7
|
%
|
21.1
|
%
|
15.1
|
%
|
|||||||
17
(1)
Value added sales is a key measure that is not calculated according to GAAP. In the discussion of operating results, we provide information regarding value added sales. Value added sales represents net sales less the value of aluminum and services provided by outside service providers that are
included in net sales. As discussed further below, arrangements with our customers allow us to pass on changes in aluminum prices and outside service provider costs; therefore, fluctuations in underlying aluminum prices and the use of outside service providers generally do not directly impact our profitability. Accordingly, value added sales is worthy of being highlighted for the benefit of users of our financial statements. Our intent is to allow users of the financial statements to consider our net sales information both with and without the aluminum and outside service provider cost components thereof. Management utilizes value added sales as a key metric to determine growth of the company because it eliminates the volatility of aluminum prices. See the Non-GAAP Financial Measures section of this annual report for a reconciliation of value added sales to net sales.
(2)
Adjusted EBITDA is a key measure that is not calculated according to GAAP. Adjusted EBITDA is defined as earnings before interest income and expense, income taxes, depreciation, amortization, restructuring and other closure costs and impairments of long-lived assets and investments. We use Adjusted EBITDA as an important indicator of the operating performance of our business. We use Adjusted EBITDA in internal financial forecasts and models when establishing internal operating budgets, supplementing the financial results and forecasts reported to our Board of Directors and evaluating short-term and long-term operating trends in our operations. We believe the Adjusted EBITDA financial measure assists in providing a more complete understanding of our underlying operational measures to manage our business, to evaluate our performance compared to prior periods and the marketplace and to establish operational goals. We believe that these non-GAAP financial measures are useful to investors because they allow investors to evaluate the effectiveness of the methodology and information used by management in our financial and operational decision-making. Adjusted EBITDA is a non-GAAP financial measure and should not be considered in isolation or as a substitute for financial information provided in accordance with GAAP. This non-GAAP financial measure may not be computed in the same manner as similarly titled measures used by other companies. See the Non-GAAP Financial Measures section of this annual report for a reconciliation of our Adjusted EBITDA to net income.
(3)
Adjusted EBITDA: Percentage of net sales is a key measure that is not calculated according to GAAP. Adjusted EBITDA as a percentage of net sales is defined as Adjusted EBITDA divided by net sales. See the Non-GAAP Financial Measures section of this annual report for a reconciliation of Adjusted EBITDA.
(4)
Adjusted EBITDA: Percentage of value added sales is a key measure that is not calculated according to GAAP. Adjusted EBITDA as a percentage of value added sales is defined as Adjusted EBITDA divided by value added sales. See the Non-GAAP Financial Measures section of this annual report for a reconciliation of Adjusted EBITDA and value added sales.
2014 Restructuring Actions and Ongoing Cost
During the third quarter of 2014, we completed a review of initiatives to reduce costs and enhance our competitive position. Based on this review, we committed to a plan to close operations at our Rogers, Arkansas facility, which was completed during the fourth quarter of 2014. The closure resulted in a reduction of workforce of approximately 500 employees and a shift in production to other facilities. The total cost incurred as a result of the Rogers facility closure is $15.9 million, of which $4.1 million was paid in cash.
As of December 31, 2016, estimated remaining cash payments total $0.2 million, mainly for final moving costs.
During 2016, we sold the Rogers facility for total proceeds of $4.3 million, resulting in a $1.4 million gain on sale. Rogers incurred $1.5 million in closure and operating costs during 2016, which included $0.3 million in depreciation. During 2015, we completed the shutdown of the Rogers facility which resulted in a gross margin loss of $8.0 million. We incurred $4.3 million in restructuring costs related to an impairment of fixed assets and other associated costs such as asset relocation costs. Additionally, we also experienced $2.0 million of further carrying costs associated with the closed facility and $1.7 million in depreciation. The closure of our Rogers facility negatively impacted gross profit by $8.4 million, which includes $5.4 million of depreciation accelerated due to shortened useful lives for assets idled when operations ceased at the Rogers facility. The Rogers facility adjusted EBITDA impact was a negative $3.0 million, negative $6.3 million and a positive $0.2 million in 2014, 2015 and 2016, respectively. See the Non-GAAP Financial Measures section of this annual report for a reconciliation of Adjusted EBITDA to net income, and value added sales to net sales.
In addition, other measures were taken to reduce costs, including the sale of the company's two aircraft, which was completed in 2015. The results for 2014 reflect the impact of costs related to these actions, totaling $1.3 million in SG&A for the write-down of the carrying value of an aircraft we sold in 2015 and a small loss on the sale of our second aircraft.
18
2016 versus 2015
Net Sales
The following table summarizes the impact that volume, aluminum and product mix had on the change in sales from 2015 to 2016:
|
Net Sales Comparison
|
Year Ended
|
|||||
|
(Dollars in thousands)
|
||||||
|
Year ended December 31, 2015
|
$
|
727,946
|
|
|||
|
Volume
|
60,827
|
|
||||
|
Aluminum prices
|
(61,460
|
)
|
||||
|
Other
|
|
5,364
|
|
|||
|
Year ended December 31, 2016
|
|
$
|
732,677
|
|
||
Net sales in 2016 increased $4.8 million to $732.7 million from $727.9 million in 2015. Wheel shipments increased by 9 percent in 2016 compared to 2015 resulting in $60.8 million higher sales compared to 2015. Net sales were unfavorably impacted by a decline in the value of the aluminum component of sales which we generally pass through to our customers and resulted in $61.5 million lower revenues. The average selling price of our wheels decreased 8 percent due to the unfavorable impact of the decline in aluminum value. Increases in unit shipments to GM, Nissan, Toyota and Subaru were partially offset by decreases in unit shipments to Ford and FCA. Wheel program development revenues totaled $10.0 million in 2016 and $6.9 million in 2015.
U.S. Operations
Net sales of our U.S. plants in 2016 decreased 32 percent, to $120.4 million from $177.2 million in 2015, reflecting a decrease in unit shipments and a decrease in the average selling price of our wheels. Unit shipments from our U.S. plants decreased 28 percent in 2016, primarily reflecting the reallocation of production volume to our plants in Mexico. The decline in volume resulted in $50.5 million lower sales. The average selling price of our wheels decreased 7 percent primarily due to the decline in the value of the aluminum component coupled with the mix of wheel sizes and finishes sold. The lower aluminum value decreased revenues by approximately $9.4 million when compared to 2015.
Mexico Operations
Net sales of our Mexico plants in 2016 increased 11 percent, to $612.3 million from $550.7 million in 2015, reflecting a 20 percent increase in unit shipments offset partially by an 8 percent decrease in the average selling prices of our wheels. The unit shipment volume increase in 2016 resulted in $111.3 million higher sales. The 8 percent decrease in the average selling price of our wheels was primarily a result of the lower pass-through price of aluminum partially offset by a favorable mix of wheel sizes and finishes sold. The lower aluminum value decreased revenues by approximately $52.1 million when compared to 2015.
Our major customer mix, based on unit shipments, is shown below:
|
Fiscal Year Ended December 31,
|
2016
|
|
2015
|
|
2014
|
|
|
Ford
|
36
|
%
|
42
|
%
|
42
|
%
|
|
GM
|
29
|
%
|
25
|
%
|
24
|
%
|
|
Toyota
|
14
|
%
|
14
|
%
|
12
|
%
|
|
FCA
|
6
|
%
|
8
|
%
|
10
|
%
|
|
Other international customers
|
15
|
%
|
11
|
%
|
12
|
%
|
|
Total
|
100
|
%
|
100
|
%
|
100
|
%
|
According to
Ward's Auto Info Bank
, overall North American production of passenger cars and light-duty trucks in 2016 increased approximately 3 percent, while production of the specific passenger car and light-duty truck programs using our wheels increased 1 percent. In contrast to the overall market, our total shipments increased by 9 percent, resulting in our share of the North American aluminum wheel market increasing by 1 percentage point on a year-over-year basis. The increase in market share was 4 percentage points in passenger car programs, offset by a 3 percentage point decline in light-duty trucks.
19
According to
Ward's Automotive Group,
the aluminum wheel penetration rate on passenger cars and light-duty trucks in the U.S. was 81 percent for the 2016 model year and 79 percent for the 2015 model year, compared to 81 percent for the 2014 model year. We expect the ratio of aluminum to steel wheels to remain relatively stable.
At the customer level, shipments in 2016 to Ford decreased 7 percent compared to 2015, as shipments of passenger car wheels decreased 20 percent and light-duty truck wheels decreased 2 percent. At the program level, the major unit shipment decreases for the F-Series trucks, Fiesta, Escape, Focus, Fusion and Taurus were offset partially by increases for the Edge, Explorer, MKZ, Flex, MKS, Expedition and MKC.
Shipments to GM in 2016 increased 28 percent compared to 2015, as the unit volume of passenger car wheels increased nearly 4 times and light-duty truck wheel shipments increased less than 1 percent. The major unit shipment increases to GM were for the K2XX platform vehicles, Malibu, Traverse and Volt, partially offset by shipment decreases for the SRX, Terrain, Enclave, Impala, ATS and Colorado.
Shipments to Toyota in 2016 increased 7 percent compared to 2015, as shipments of light-duty truck wheels increased 24 percent and passenger car wheels decreased 24 percent. The major unit shipment increases to Toyota were for the Tacoma, Highlander and Sienna, partially offset by unit shipment decreases for the Avalon, Venza and Tundra.
Shipments to FCA in 2016 decreased 15 percent compared to 2015, as passenger car wheel shipments increased 82 percent and the unit volume of light-duty truck wheels decreased 23 percent. The major unit shipment decreases to FCA were for the Town and Country, Durango, Journey and Magnum/Charger which were partially offset by unit shipment increases for the Dodge-Ram trucks and Dodge Challenger.
Shipments to other international customers in 2016 increased 45 percent compared to 2015, as shipments of passenger car wheels increased 39 percent and shipments of light-duty truck wheels increased 66 percent. The higher unit volumes included increases of 86 percent to Nissan, 17 percent to Mazda, 16 percent to Subaru and 20 percent to BMW, while unit volumes decreased 20 percent to VW. At the program level, major unit shipment increases to international customers were for Nissan's Sentra, Kicks, Altima and Note, Toyota Scion iA which is manufactured by Mazda, BMW X3 and Subaru's Impreza and Legacy, offset partially by unit shipment decreases for the Nissan Titan, Mazda 2, Nissan Versa and VW Jetta.
Cost of Sales
Aluminum, natural gas and other direct material costs are a significant component of our costs to manufacture wheels. These costs are substantially the same for all of our plants since many common suppliers service both our U.S. and Mexico operations. Consolidated cost of sales includes costs for both our U.S. and international operations, which are principally our wheel manufacturing operations in Mexico, and certain costs that are not allocated to a specific operation. These unallocated expenses include corporate services that are primarily incurred in the U.S. but are not charged directly to our world-wide operations, such as engineering services for wheel program development and manufacturing support, environmental and other governmental compliance services.
In 2016, consolidated cost of goods sold decreased $10.2 million to $646.5 million, or 88 percent of net sales, compared to $656.7 million, or 90 percent of net sales, in 2015. Cost of sales in 2016 primarily reflects a decline in aluminum prices of approximately $53.8 million, which we generally pass through to our customers, offset by an increase in freight, maintenance and supply costs. Freight costs increased $16.4 million to $20.4 million in 2016, compared to $4.0 million in 2015 due mainly to expedited shipments of approximately $13 million to customers arising from the operating inefficiencies discussed in the executive overview section. Repair and maintenance costs increased $4.3 million and supply costs increased $3.4 million in 2016 when compared to 2015. Cost of sales associated with corporate services such as engineering support for wheel program development and manufacturing support increased $2.4 million in 2016 when compared to 2015 primarily due to pre-production charges incurred on new product platforms and increased compensation costs.
U.S. Operations
Cost of sales for our U.S. operations decreased in 2016 by $61.6 million, or 30 percent when compared to 2015. The 2016 decline in cost of sales for our U.S. plant primarily reflects the effect of reallocating production volume to our Mexico facilities which resulted in a 28 percent decline in unit shipments and the reduction of labor and aluminum costs by $6.1 million and $10.9 million, respectively, when compared to 2015. Lower aluminum prices also contributed to the decline.
Mexico Operations
Cost of sales for our Mexico operations increased by $51.4 million in 2016 when compared to 2015, which is mainly driven by a 20 percent increase in wheel shipments. During 2016, plant labor and benefit costs, including overtime premiums, increased
20
approximately $4.6 million, primarily as a result of higher average headcount and wage increases. Direct material and contract labor costs increased approximately $1.9 million from 2015 primarily due to the 20 percent rise in unit shipments. The increase in direct material costs was more than offset by a decrease of approximately $42.9 million of aluminum purchase costs which we generally pass through to our customers. Depreciation increased $0.8 million in 2016 compared to 2015. Supply and small tool costs increased $4.5 million and plant repair and maintenance expenses increased $4.9 million in 2016 compared to 2015.
Gross Profit
Consolidated gross profit increased $15.0 million for 2016 to $86.2 million, or 12 percent of net sales, compared to $71.2 million, or 10 percent of net sales, last year. The increase in gross profit primarily reflects the favorable impact of the 9 percent increase in unit shipments and cost reduction resulting from the shift in manufacturing from our U.S. facility to facilities in Mexico. Partially offsetting the increase in gross profit were operating inefficiencies incurred in one of our manufacturing facilities in the last six months of 2016.
The cost of aluminum is a component of our selling prices to OEM customers and a significant component of the overall cost of a wheel. The price for aluminum we purchase is adjusted monthly based primarily on changes in certain published market indices. Our selling prices are adjusted periodically based upon aluminum market price changes, but the timing of such adjustments is based on specific customer agreements and can vary from monthly to quarterly. Even if aluminum selling price adjustments were to perfectly match changes in aluminum purchase prices, an increasing aluminum price will result in a declining gross margin percentage - i.e., same gross profit dollars divided by increased sales dollars equals lower gross profit percentage. The opposite is true in periods during which the price of aluminum decreases. In addition, although our sales are continuously adjusted for aluminum price changes, these adjustments rarely will match exactly the changes in our aluminum purchase prices and cost of sales. As estimated by the company, when compared to 2015, the unfavorable impact on gross profit related to such differences in timing of aluminum adjustments was approximately $7.7 million in 2016.
Selling, General and Administrative Expenses
Selling, general and administrative expenses were $31.6 million, or 4 percent of net sales, in 2016 compared to $34.9 million, or 5 percent of net sales, in 2015. The 2016 decrease is primarily attributable to a $1.4 million gain on sale of the Rogers facility in the last quarter of 2016, a $1.0 million reduction of severance costs and a $1.4 million decline in compensation and employee benefit costs.
Income from Operations
Consolidated income from operations increased $18.3 million in 2016 to $54.6 million, or 7 percent of net sales, from $36.3 million, or 5 percent of net sales, in 2015.
Consolidated income from operations in 2016 was favorably impacted by a 9 percent increase in unit shipments, which was partially offset by operating inefficiencies incurred in one of our manufacturing facilities as more fully explained in the cost of sales discussion above.
U.S. Operations
Operating income from our U.S. operations for 2016 increased by $5.5 million compared to 2015. Operating income increased in 2016 as improved cost performance offset the impact of a 28 percent decrease in unit shipments. The overall cost improvement resulted from improved productivity, as well as lower supply and repair and maintenance costs. However, the lower production levels had an unfavorable impact on operating income due to lower absorption of fixed overhead costs in 2016 when compared to 2015.
Mexico Operations
Operating income from our Mexico operations increased by $12.8 million in 2016 compared to 2015 and reflects a $12.5 million increase in gross profit in 2016. The increase in gross profit primarily reflects a 20 percent increase in unit shipments and a favorable mix of wheel sizes and finishes sold, when compared to 2015.
U.S. versus Mexico Production
During 2016, wheels produced by our Mexico and U.S. operations accounted for 86 percent and 14 percent, respectively, of our total production. During 2015, wheels produced by our Mexico and U.S. operations accounted for 78 percent and 22 percent, respectively, of our total production.
21
Interest Income, net and Other Income (Expense), net
Net interest income was $0.2 million and $0.1 million in 2016 and 2015, respectively due to the increase in the average cash balance which was mainly related to the increase in operating income.
Net other income (expense) was expense of $0.1 million and $1.1 million in 2016 and 2015, respectively.
Also included in other income (expense) net are foreign exchange losses of $0.4 million and $1.2 million in 2016 and 2015, respectively.
Effective Income Tax Rate
Our income before income taxes was $54.7 million in 2016 and $35.3 million in 2015. The effective tax rate on the 2016 pretax income was 24.4 percent compared to 32.1 percent in 2015.
The 2016 effective income tax rate was 24.4 percent. The effective tax rate was lower than the U.S. federal statutory rate primarily as a result of income in jurisdictions where the statutory rate is lower than the U.S. rate and tax benefits due to the release of tax liabilities related to uncertain tax positions as a result of settlements with various tax jurisdictions.
Our effective income tax rate for 2015 was 32.1 percent. The effective tax rate was lower than the U.S. federal statutory rate primarily as a result of net decreases in the liability for uncertain tax positions partially offset by the reversal of deferred tax assets related to stock based compensation.
We are a multinational company subject to taxation in many jurisdictions. We record liabilities dealing with uncertainty in the application of complex tax laws and regulations in the various taxing jurisdictions in which we operate. If we determine that payment of these liabilities will be unnecessary, we reverse the liability and recognize the tax benefit during the period in which we determine the liability no longer applies. Conversely, we record additional tax liabilities or valuation allowances in a period in which we determine that a recorded liability is less than we expect the ultimate assessment to be or that a tax asset is impaired. The effects of recording liability increases and decreases are included in the effective income tax rate.
Net Income
Net income in 2016 was $41.4 million, or 6 percent of net sales compared to $23.9 million, or 3 percent of net sales in 2015. Earnings per share were $1.62 and $0.90 per diluted share in 2016 and 2015, respectively.
2015 versus 2014
Net Sales
Net sales in 2015 decreased $17.5 million to $727.9 million from $745.4 million in 2014. Wheel shipments increased by 1 percent in 2015 compared to 2014 with the higher volume resulting in $6.7 million higher sales compared to 2014. Net sales were unfavorably impacted by a decline in the value of the aluminum component of sales which we generally pass through to our customers and resulted in $11.3 million lower revenues. The average selling price of our wheels decreased 2 percent as the unfavorable impact of the decline in aluminum value and the mix of wheel sizes and finishes sold was offset partially by a favorable change in the volume of wheels sold. Decreases in unit shipments to FCA, BMW, Mitsubishi, Nissan, Tesla and VW were partially offset by increases in unit shipments to Ford, GM, Mazda, Subaru and Toyota. Wheel program development revenues totaled $6.9 million in 2015 and $9.0 million in 2014.
U.S. Operations
Net sales of our U.S. wheel plants in 2015 decreased $84.3 million, or 32 percent, to $177.2 million from $261.5 million in 2014, reflecting a decrease in unit shipments and a decrease in the average selling price of our wheels. Unit shipments from our U.S. plants decreased 32 percent in 2015, primarily reflecting the reallocation of production volume from the Rogers facility to our plants in Mexico. The decline in volume resulted in $80.4 million lower sales. The volume impact and the 1 percent decrease in the average selling price of our wheels, primarily due to the mix of wheel sizes and finishes sold, was partially offset by an increase in the pass-through price of aluminum. The lower aluminum value decreased revenues by approximately $2.7 million when compared to 2014.
Mexico Operations
22
Net sales of our Mexico wheel plants in 2015 increased $66.8 million, or 14 percent, to $550.7 million from $483.9 million in 2014, reflecting a 17 percent increase in unit shipments offset partially by a 2 percent decrease in the average selling prices of our wheels. Unit shipments increased in 2015 with the increase in volume resulting in $83.2 million higher sales. The 2 percent decrease in the average selling price of our wheels primarily was a result of an unfavorable mix of wheel sizes and finishes sold and the lower pass-through price of aluminum. The lower aluminum value decreased revenues by approximately $8.6 million when compared to 2014.
Cost of Sales
In 2015, consolidated cost of goods sold decreased $38.5 million to $656.7 million, or 90 percent of net sales, compared to $695.2 million, or 93 percent of net sales, in
2014
. C
ost of sales in 2015 primarily reflects a decrease in
labor and other
costs, reflective of the reallocation of production from the U.S. to facilities in Mexico, as well as due to a decline in aluminum prices, which we generally pass through to our customers, when compared to 2014
. Plant labor and benefit costs decreased $23.3 million to $93.5 million in 2015, from $116.8 million in
2014
. Direct material and subcontract costs increased approximately $3.2 million to $414.1 million from $410.9 million in
2014 primarily due to the 1 percent rise in sales volume
. However, the increase in direct material costs was offset by a decrease of approximately $5.3 million of aluminum price which we generally pass through to our customers. Repair and maintenance costs declined $4.6 million to $22.1 million in
2015
, compared to $26.7 million in
2014
and supply costs decreased $4.4 million to $19.1 million in
2015
, from $23.5 million in
2014
. Cost of goods sold for our U.S. operations decreased $82.4 million, while cost of goods sold for our Mexico operations increased $44.4 million, when comparing
2015
to
2014 due to the change in units sold as discussed below
.
Cost of sales associated with corporate services such as engineering support for wheel program development and manufacturing support decreased $0.7 million in 2015 when compared to 2014.
U.S. Operations
Cost of sales for our U.S. operations decreased by $82.4 million, or 31 percent, in 2015, when compared to 2014. Cost of sales for our U.S. plants in 2015 primarily reflects the effect of reallocating production volume to Mexico facilities which resulted in a 32 percent decline in unit shipments and reduced labor and other costs, when compared to 2014. During 2015, plant labor and benefit costs, including overtime premiums, decreased approximately $26.8 million, or 46 percent, primarily as a result of reduced headcount and decreases in contract labor, when compared to 2014. The rise in aluminum prices, which we generally pass through to our customers, was $0.5 million. Other favorable changes in 2015 included a $3.9 million decrease in supply and small tool costs and a $4.4 million decrease in plant repair and maintenance costs. These cost reductions largely reflect the decline in production volumes due to the closure of the Roger’s facility.
Mexico Operations
Cost of sales for our Mexico operations increased by $44.4 million in 2015 when compared to 2014, which is mainly driven by a 17% increase in wheel shipments. During 2015, plant labor and benefit costs, including overtime premiums, increased approximately $3.5 million, or a 6 percent increase, when compared to last year, primarily as a result of higher average headcount and wage increases.
Direct material and subcontract costs increased approximately $41.3 million to $307.2 million from $265.9 million in
2014 primarily due to the 17 percent rise in unit shipments
. The increase in direct material costs was partially offset by a decrease of approximately $7.1 million of aluminum price which we generally pass through to our customers. Depreciation increased $7.9 million to $24.9 million from $17.0 million in 2014 due to the addition of the new plant in 2015.
Supply and small tool costs decreased $0.4 million and plant repair and maintenance expenses decreased $0.2 million.
Gross Profit
Consolidated gross profit increased $21.0 million for 2015 to $71.2 million, or 10 percent of net sales, compared to $50.2 million, or 7 percent of net sales, last year. The increase in gross profit primarily reflects the favorable impact of the 1 percent increase in unit shipments and the decrease in labor and other costs which relates to the shift in manufacturing from our Rogers facility to facilities in Mexico.
When comparing 2015 with 2014, the unfavorable impact on gross profit related to such differences in timing of aluminum adjustments was approximately $6.1 million in 2015; however, this impact was offset by unreimbursed cost increases for aluminum alloying premiums.
Selling, General and Administrative Expenses
Selling, general and administrative expenses were $34.9 million, or 5 percent of net sales, in 2015 and $32.3 million, or 4 percent of net sales, in 2014. The 2015 increase is primarily attributable to higher professional service fees of $1.4 million and legal fees of $0.6 million. The higher level of professional service and legal fees incurred during 2015 relate to costs incurred in association
23
with the move of the corporate office from California to Michigan. We incurred recruiting costs, severance, relocation, duplicative costs and training costs of $4.1 million to ensure a successful transition.
Income from Operations
Consolidated income from operations increased $18.4 million in 2015 to $36.3 million, or 5 percent of net sales, from $17.9 million, or 2 percent of net sales, in 2014. Income from our Mexico operations increased $21.3 million and income from our U.S. operations increased $0.6 million, when comparing 2015 to 2014. Offsetting these increases were costs relating to relocating our corporate office. Included below are the major items that impacted income from operations for our U.S. and Mexico operations during 2015.
Consolidated income from operations in 2015 was unfavorably impacted by start-up costs associated with our new plant in Mexico and the transition of our corporate office. While initial commercial production began in the first quarter of 2015, cost absorption was sub-optimal until production volumes reach planned levels towards the end of 2015.
U.S. Operations
Operating income from our U.S. operations for 2015 increased by $0.6 million compared to 2014. Operating income increased in 2015 as lower costs overall offset the impact of a 32 percent decrease in unit shipments. The overall cost improvement included reductions in labor due to the reallocation of production to Mexico facilities and improved productivity, as well as lower supply and repair and maintenance costs as more fully explained in the cost of sales discussion above. However, the lower production levels had an unfavorable impact on operating income due to lower absorption of fixed overhead costs in 2015 when compared to 2014. As a percentage of net sales, our gross margin decreased 2 percent in 2015 when compared to 2014.
Mexico Operations
Operating income from our Mexico operations increased by $21.3 million in 2015 compared to 2014. Income from operations in 2015 reflects a $22.4 million increase in gross profit, as compared to 2014. The increase in gross profit in 2015 is due to a 17 percent increase in unit shipments offset by lower average selling price due to an unfavorable mix of wheel sizes and finishes sold, when compared to 2014.
U.S. versus Mexico Production
During 2015, wheels produced by our Mexico and U.S. operations accounted for 78 percent and 22 percent, respectively, of our total production. During 2014, wheels produced by our Mexico and U.S. operations accounted for 69 percent and 31 percent, respectively, of our total production.
Interest Income, net and Other Income (Expense), net
Net interest income was $0.1 million and $1.1 million in 2015 and 2014, respectively due to the increase in the average cash balance which was mainly related to the increase in operating income. Net other income (expense) was expense of $1.1 million and $3.3 million in 2015 and 2014, respectively. Included in other income (expense) in 2014 was a $2.5 million impairment charge for an equity investment accounted for under the cost method of accounting. In 2010 we acquired a minority interest in Synergies Casting Limited ("Synergies"), a private aluminum wheel manufacturer based in Visakhapatnam, India. In October 2014, a typhoon caused significant damage to the facilities and operations of Synergies and, in the fourth quarter of 2014, we tested the $4.5 million carrying value of our investment for impairment. Based on our evaluation, we determined that an other-than-temporary impairment existed and wrote the investment down to its estimated fair value of $2.0 million. Also included in other income (expense) net are foreign exchange losses of $1.2 million and $1.0 million in 2015 and 2014, respectively.
Effective Income Tax Rate
Our income before income taxes was $35.3 million in 2015 and $15.7 million in 2014. The effective tax rate on the 2015 pretax income was 32.1 percent in 2015 compared to 43.9 percent in 2014.
Our effective income tax rate for 2015 was 32.1 percent. The effective tax rate was lower than the US federal statutory rate primarily as a result of net decreases in the liability for uncertain tax positions partially offset by the reversal of deferred tax assets related to stock based compensation.
Our effective income tax rate for 2014 was 43.9 percent. The effective tax rate was higher than the US federal statutory rate primarily as a result of valuation allowances established for foreign deferred tax assets and various permanent differences including non-deductible expenses related to recent tax law changes in Mexico partially offset by a favorable net impact of a reduction in the liability for unrecognized tax positions.
24
Net Income
Net income in 2015 was $23.9 million, or 3 percent of net sales, and included an income tax provision of $11.3 million compared to $8.8 million, or 1 percent of net sales in 2014, including an income tax provision of $6.9 million. Earnings per share were $0.90 and $0.33 per diluted share in 2015 and 2014, respectively.
Liquidity and Capital Resources
Our sources of liquidity include cash and cash equivalents, short-term investments, net cash provided by operating activities, our senior secured revolving credit facility discussed below and other external sources of funds. During the three years ended December 31, 2016, we had no bank or other interest-bearing debt. At December 31, 2016, our cash, cash equivalents and short-term investments totaled $58.5 million compared to $53.0 million at year-end 2015 and $66.2 million at the end of 2014.
Our working capital requirements, investing activities and cash dividend payments have historically been funded from internally generated funds, proceeds from the exercise of stock options or existing cash, cash equivalents and short-term investments, and we believe these sources will continue to meet our capital requirements in the foreseeable future. Our working capital decreased in 2016, primarily due to an increase in accounts payable related to timing of payments. In December 2014, we entered into a senior secured revolving credit facility (discussed below) to provide financing, as necessary, for general corporate purposes.
As part of our commitment to enhancing shareholder value, we have been repurchasing our common stock. In October 2014, our Board of Directors approved the 2014 Repurchase Program, authorizing the repurchase of up to $30.0 million of our common stock. Through December 31, 2015, we repurchased 1,056,954 shares of company stock at a cost of $19.6 million under the 2014 Repurchase Program. The 2014 Repurchase Program was completed in January 2016, with purchases since December 31, 2015 of 585,970 shares for a cost of $10.3 million. In January of 2016, our Board of Directors approved a new stock repurchase program (the “2016 Repurchase Program”), authorizing the repurchase of up to $50.0 million of common stock. Under the 2016 Repurchase Program, we may repurchase common stock from time to time on the open market or in private transactions. The timing and extent of the repurchases under the 2016 Repurchase Program will depend upon market conditions and other corporate considerations in our sole discretion. Through December 31, 2016, we repurchased 454,718 shares of company stock at a cost of $10.4 million under the 2016 Repurchase Program.
On December 19, 2014, we entered into a senior secured credit agreement (the "Credit Agreement") with J.P. Morgan Securities LLC, JPMorgan Chase Bank, N.A. (“JPMCB”) and Wells Fargo Bank, National Association (together with JPMCB, the “Lenders”). The Credit Agreement consists of a senior secured revolving credit facility in an initial aggregate principal amount of $100.0 million (the “Facility”). In addition, the company is entitled to request, subject to certain terms and conditions and the agreement of the Lenders, an increase in the aggregate revolving commitments under the Facility or to obtain incremental term loans in an aggregate amount not to exceed $50.0 million, which are uncommitted to by any lender. The company intends to use the proceeds of the Facility to finance the working capital needs, and for the general corporate purposes of the company and its subsidiaries. At December 31, 2016, the company had $97.2 million of availability under the Facility after giving effect to $2.8 million in outstanding letters of credit.
The following table summarizes the cash flows from operating, investing and financing activities as reflected in the consolidated statements of cash flows.
|
Fiscal Year Ended December 31,
|
2016
|
2015
|
2014
|
|||||||||
|
(Thousands of dollars)
|
|
|
|
|||||||||
|
Net cash provided by operating activities
|
$
|
78,491
|
|
$
|
59,349
|
|
$
|
11,627
|
|
|||
|
Net cash used in investing activities
|
(35,038
|
)
|
(34,946
|
)
|
(110,435
|
)
|
||||||
|
Net cash used in financing activities
|
(37,327
|
)
|
(31,348
|
)
|
(33,612
|
)
|
||||||
|
Effect of exchange rate changes on cash
|
(376
|
)
|
(3,470
|
)
|
(4,430
|
)
|
||||||
|
Net (decrease) increase in cash and cash equivalents
|
$
|
5,750
|
|
$
|
(10,415
|
)
|
$
|
(136,850
|
)
|
|||
25
2016 versus 2015
Our liquidity remained strong in 2016. Working capital (current assets minus current liabilities) and our current ratio (current assets divided by current liabilities) were $168.1 million and 3.0:1, respectively, at December 31, 2016, versus $172.0 million and 3.3:1 at December 31, 2015. The 2016 decrease in working capital resulted primarily from an increase in accounts payable related to timing of payments which was partially offset by an increase in inventory. We generate our principal working capital resources primarily through operations. The increase in cash from working capital in 2016 primarily reflects a significant increase in net income and an increase in accounts payable offset by increased inventories. Assuming continuation of our historically strong liquidity, which includes funds available under our revolving credit facility, we believe we are well positioned to take advantage of new and complementary business opportunities, and to fund our working capital and capital expenditure requirements for the foreseeable future.
Net cash provided by operating activities increased $19.1 million to $78.5 million for 2016, compared to net cash provided by operating activities of $59.3 million for 2015. The increase in operating activities relates primarily to the $17.4 million increase in net income. Additional sources of cash flow related to an $15.9 million increase in accounts payable and an $8.0 million decrease in accounts receivable. Offsetting amounts were cash flow uses of $22.3 million increase in inventories and a $4.7 million decrease in income tax payable.
Our principal investing activities during 2016 were the funding of $39.6 million of capital expenditures and $4.3 million proceeds from the sale of the Rogers facility. Principal investing activities during 2015 included the funding of $39.5 million of capital expenditures and the purchase of $1.0 million of certificates of deposit, partially offset by the receipt of $3.8 million cash proceeds from maturing certificates of deposit and $1.9 million proceeds from sales of fixed assets.
Our principal financing activities during 2016 consisted of the repurchase of our common stock for cash totaling $20.7 million and payment of cash dividends on our common stock totaling $18.3 million, partially offset by the receipt of cash proceeds from the exercise of stock options totaling $1.6 million. Financing activities during 2015 consisted of the repurchase of our common stock for cash totaling $19.6 million and payment of cash dividends on our common stock totaling $19.1 million, partially offset by the receipt of cash proceeds from the exercise of stock options totaling $7.3 million.
2015 versus 2014
Working capital (current assets minus current liabilities) and our current ratio (current assets divided by current liabilities) were $172.0 million and 3.3:1, respectively, at December 31, 2015, versus $204.0 million and 3.8:1 at December 31, 2014. The 2015 decrease in working capital resulted primarily from expenditures for an expansion to our new Mexican wheel plant, repurchases of our common stock (see Item 5, "Market for Registrant's Common Equity, Related Stockholder Matters and Issuer Purchases of Equity Securities" in this Annual Report) and timing of activity affecting the working capital accounts. We generate our principal working capital resources primarily through operations. The increase in cash from working capital in 2015 primarily reflects a lower balance of inventory and prepaid aluminum in addition to a higher balance in accrued expenses, offset by higher accounts receivable, and lower accounts payable.
Net cash provided by operating activities increased $47.7 million to $59.3 million for 2015, compared to net cash provided by operating activities of $11.6 million for 2014. The primary operating activities during 2015 included net income of $23.9 million and depreciation of $34.5 million. Additional sources of cash flow related to an $11.5 million decrease in inventories, $4.7 million increase in income tax payable and $4.6 million increase in other current liabilities. Offsetting amounts were cash flow uses of $14.0 million increase in accounts receivable, $2.1 million increase in other assets and a $1.1 million decrease in accounts payable.
Our principal investing activities during 2015 were the funding of $39.5 million of capital expenditures and the purchase of $1.0 million of certificates of deposit, partially offset by the receipt of $3.8 million cash proceeds from maturing certificates of deposit and $1.8 million proceeds from sales of fixed assets. Principal investing activities during 2014 included the funding of $112.6 million of capital expenditures and the purchase of $3.8 million of certificates of deposit, partially offset by the receipt of $3.8 million cash proceeds from maturing certificates of deposit and $1.9 million proceeds from sales of fixed assets.
Our principal financing activities during 2015 consisted of the repurchase of our common stock for cash totaling $19.6 million and payment of cash dividends on our common stock totaling $19.1 million, partially offset by the receipt of cash proceeds from the exercise of stock options totaling $7.3 million. Financing activities during 2014 consisted of the repurchase of our common stock for cash totaling $21.8 million and payment of cash dividends on our common stock totaling $19.4 million, partially offset by the receipt of cash proceeds from the exercise of stock options totaling $7.4 million.
26
Risk Management
We are subject to various risks and uncertainties in the ordinary course of business due, in part, to the competitive global nature of the industry in which we operate, to changing commodity prices for the materials used in the manufacture of our products, and to development of new products.
We have operations in Mexico with sale and purchase transactions denominated in both pesos and dollars. The peso is the functional currency of certain of our operations in Mexico. The settlement of accounts receivable and accounts payable transactions denominated in a non-functional currency results in foreign currency transaction gains and losses. In 2016, the value of the Mexican peso decreased by 19 percent in relation to the U.S. dollar. For the years ended December 31, 2016, 2015 and 2014, we had foreign currency transaction losses of $0.4 million, $1.2 million and $1.0 million, respectively, which are included in other income (expense) in the Consolidated Income Statements in Item 8, "Financial Statements and Supplementary Data" of this Annual Report.
Since 1990, the Mexican peso has experienced periods of relative stability followed by periods of major declines in value. The impact of changes in value of our foreign operations relative to the U.S. dollar has resulted in a cumulative unrealized translation loss at December 31, 2016 of $105.2 million. Translation gains and losses are included in other comprehensive income (loss) in the Consolidated Statements of Shareholders' Equity in Item 8, "Financial Statements and Supplementary Data" of this Annual Report.
Changes in currency exchange rates may affect the relative prices at which we and our foreign competitors sell products in the same market. In addition, changes in the value of the relevant currencies may affect the cost of certain items required in our operations. Due to customer requirements, a significant shift is occurring in the currency denominated in our contracts with our customers. As a result of this change we currently project that in 2016 and beyond the vast majority of our revenues will be denominated in the U.S. dollar, rather than a more balanced mix of U.S. dollar and Mexican peso. In the past we have relied upon significant revenues denominated in the Mexican peso to provide a "natural hedge" against foreign exchange rate changes impacting our peso denominated costs incurred at our facilities in Mexico. Accordingly, the foreign exchange exposure associated with peso denominated costs is a growing risk factor and could have a material adverse effect on our operating results.
We are entering into foreign currency forward and option contracts with financial institutions to protect against foreign exchange risks associated with certain existing assets and liabilities, certain firmly committed transactions and forecasted future cash flows. We have implemented a program to hedge a portion of our material foreign exchange exposures, typically for up to 36 months. However, we may choose not to hedge certain foreign exchange exposures for a variety of reasons, including but not limited to accounting considerations and the prohibitive economic cost of hedging particular exposures. We do not use derivative contracts for trading, market-making, or speculative purposes. For additional information on our derivatives, see Notes 4 and 15 of the Notes to the Financial Statements in Item 8, "Financial Statements and Supplementary Data" of this Annual Report.
When market conditions warrant, we may enter into purchase commitments to secure the supply of certain commodities used in the manufacture of our products, such as aluminum, natural gas and other raw materials. We previously had several purchase commitments for the delivery of natural gas through 2015. These natural gas contracts were considered to be derivatives under U.S. GAAP, and when entering into these contracts, it was expected that we would take full delivery of the contracted quantities of natural gas over the normal course of business. Accordingly, at inception, these contracts qualified for the normal purchase, normal sale ("NPNS") exemption provided for under U.S. GAAP.
Contractual Obligations
Contractual obligations as of December 31, 2016 are as follows (amounts in millions):
|
|
Payments Due by Fiscal Year
|
|||||||||||||||||||||||||||
|
Contractual Obligations
|
2017
|
2018
|
2019
|
2020
|
2021
|
Thereafter
|
|
Total
|
||||||||||||||||||||
|
Retirement plans
|
$
|
1.2
|
|
$
|
1.4
|
|
$
|
1.4
|
|
$
|
1.5
|
|
$
|
1.4
|
|
$
|
46.4
|
|
$
|
53.3
|
|
|||||||
|
Purchase obligations
|
0.3
|
|
—
|
|
—
|
|
—
|
|
—
|
|
—
|
|
0.3
|
|
||||||||||||||
|
Operating leases
|
0.8
|
|
0.7
|
|
0.4
|
|
0.4
|
|
0.4
|
|
1.8
|
|
4.5
|
|
||||||||||||||
|
Total
|
$
|
2.3
|
|
$
|
2.1
|
|
$
|
1.8
|
|
$
|
1.9
|
|
$
|
1.8
|
|
$
|
48.2
|
|
$
|
58.1
|
|
|||||||
27
The table above includes, under Purchase Obligations, amounts committed related to expansion or purchase of equipment. The table above does not reflect unrecognized tax benefits of $5.3 million, for which the timing of settlement is uncertain, and a $24.8 million liability carried on our consolidated balance sheet at December 31, 2016 for derivative financial instruments maturing in 2017 through 2019.
Off-Balance Sheet Arrangements
As of December 31, 2016, we had no significant off-balance sheet arrangements.
Inflation
Inflation has not had a material impact on our results of operations or financial condition for the three years ended December 31, 2016. Cost increases in our principal raw material, aluminum, fundamentally are passed through to our customers, with timing of the pass-through dependent on the specific commercial agreements. Wage increases have averaged approximately 3 percent during this period. Cost increases for labor, other raw materials and for energy may not be recovered in our selling prices. Additionally, competitive global pricing pressures are expected to continue, which may lessen the possibility of recovering these types of cost increases in selling prices.
NON-GAAP FINANCIAL MEASURES
In this annual report, we discuss two important measures that are not calculated according to U.S. GAAP, value added sales and Adjusted EBITDA.
Value added sales is a key measure that is not calculated according to GAAP. In the discussion of operating results, we provide information regarding value added sales. Value added sales represent net sales less the value of aluminum and services provided by OSP’s that are included in net sales. As discussed further below, arrangements with our customers allow us to pass on changes in aluminum prices and OSP costs; therefore, fluctuations in underlying aluminum price and the use of OSP’s generally does not directly impact our profitability. Accordingly, value added sales is worthy of being highlighted for the benefit of users of our financial statements. Our intent is to allow users of the financial statements to consider our net sales information both with and without the aluminum and OSP cost components thereof. Management utilizes value added sales as a key metric to determine growth of the company because it eliminates the volatility of aluminum prices.
|
Fiscal Year Ended December 31,
|
2016
|
2015
|
2014
|
2013
|
2012
|
||||||||||
|
(Thousands of dollars)
|
|||||||||||||||
|
Net Sales
|
$
|
732,677
|
|
$
|
727,946
|
|
$
|
745,447
|
|
$
|
789,564
|
|
$
|
821,454
|
|
|
Less, aluminum value and OSP
|
(323,987
|
)
|
(367,100
|
)
|
(376,092
|
)
|
(388,973
|
)
|
(423,539
|
)
|
|||||
|
Value added sales
|
$
|
408,690
|
|
$
|
360,846
|
|
$
|
369,355
|
|
$
|
400,591
|
|
$
|
397,915
|
|
Adjusted EBITDA is a key measure that is not calculated according to GAAP. Adjusted EBITDA is defined as earnings before interest income and expense, income taxes, depreciation, amortization, restructuring charges and other closure costs and impairments of long-lived assets and investments. We use Adjusted EBITDA as an important indicator of the operating performance of our business. Adjusted EBITDA is used in our internal forecasts and models when establishing internal operating budgets, supplementing the financial results and forecasts reported to our Board of Directors and evaluating short-term and long-term operating trends in our operations. We believe the Adjusted EBITDA financial measure assists in providing a more complete understanding of our underlying operational measures to manage our business, to evaluate our performance compared to prior periods and the marketplace and to establish operational goals. Adjusted EBITDA is a non-GAAP financial measure and should not be considered in isolation or as a substitute for financial information provided in accordance with GAAP. This non-GAAP financial measure may not be computed in the same manner as similarly titled measures used by other companies.
Adjusted EBITDA as a percentage of net sales is a key measure that is not calculated according to GAAP. Adjusted EBITDA as a percentage of net sales is defined as Adjusted EBITDA divided by net sales.
Adjusted EBITDA as a percentage of value added sales is a key measure that is not calculated according to GAAP. Adjusted EBITDA as a percentage of value added sales is defined as Adjusted EBITDA divided by value added sales.
The following table reconciles our net income, the most directly comparable GAAP financial measure, to our Adjusted EBITDA:
28
|
Fiscal Year Ended December 31,
|
2016
|
2015
|
2014
|
2013
|
2012
|
||||||||||
|
(Thousands of dollars)
|
|||||||||||||||
|
Net income
|
$
|
41,381
|
|
$
|
23,944
|
|
$
|
8,803
|
|
$
|
22,824
|
|
$
|
30,891
|
|
|
Interest income, net
|
(245
|
)
|
(103
|
)
|
(1,095
|
)
|
(1,691
|
)
|
(1,252
|
)
|
|||||
|
Income tax provision
|
13,340
|
|
11,339
|
|
6,899
|
|
14,017
|
|
3,598
|
|
|||||
|
Depreciation
(1)
|
34,261
|
|
34,530
|
|
35,582
|
|
28,466
|
|
26,362
|
|
|||||
|
Closure costs (excluding accelerated depreciation)
(2)
|
1,210
|
|
6,343
|
|
5,564
|
|
—
|
|
—
|
|
|||||
|
Gain on sale of facility
(2)
|
(1,436
|
)
|
—
|
|
—
|
|
—
|
|
—
|
|
|||||
|
Adjusted EBITDA
|
$
|
88,511
|
|
$
|
76,053
|
|
$
|
55,753
|
|
$
|
63,616
|
|
$
|
59,599
|
|
|
Adjusted EBITDA as a percentage of net sales
|
12.1
|
%
|
10.4
|
%
|
7.5
|
%
|
8.1
|
%
|
7.3
|
%
|
|||||
|
Adjusted EBITDA as a percentage of value added sales
|
21.7
|
%
|
21.1
|
%
|
15.1
|
%
|
15.9
|
%
|
15.0
|
%
|
|||||
(1)
Depreciation expense in 2016 and 2015 includes $0.2 million and $1.7 million, respectively of accelerated depreciation charges as a result of shortened estimated useful lives due to restructuring activities described in Note 2, "Restructuring" in Notes to Consolidated Financial Statements in Item 8, "Financial Statements and Supplementary Data" in this Annual Report.
(2)
In the fourth quarter of 2016, we sold the Rogers facility for total proceeds of $4.3 million, resulting in a $1.4 million gain on sale. Prior to the sale in 2016, Rogers incurred $1.5 million in closure and operating costs, which included $0.3 million in depreciation. The Rogers facility adjusted EBITDA was a positive $0.2 million in 2016 due to the $1.4 million gain on sale. During 2015, we had completed the shutdown of the Rogers facility which resulted in a gross margin loss of $8.0 million. We incurred $4.3 million in restructuring costs related to an impairment of fixed assets and other associated costs such as asset relocation costs. Additionally, we also experienced $2.0 million of further closure costs including inefficiencies and $1.7 million in depreciation. The adjusted EBITDA impact of the Rogers facility closure for 2015 was $6.3 million, which includes the $4.3 million of restructuring costs and $2.0 million of inefficiency costs related to the closure. During 2014, we recorded $3.1 million of restructuring costs excluding accelerated depreciation and we impaired an investment by $2.5 million.
Critical Accounting Policies and Estimates
The preparation of consolidated financial statements in conformity with U.S. GAAP requires management to apply significant judgment in making estimates and assumptions that affect amounts reported therein, as well as financial information included in this Management's Discussion and Analysis of Financial Condition and Results of Operations. These estimates and assumptions, which are based upon historical experience, industry trends, terms of various past and present agreements and contracts and information available from other sources that are believed to be reasonable under the circumstances, form the basis for making judgments about the carrying values of assets and liabilities that are not readily apparent through other sources. There can be no assurance that actual results reported in the future will not differ from these estimates, or that future changes in these estimates will not adversely impact our results of operations or financial condition. As described below, the most significant accounting estimates inherent in the preparation of our financial statements include estimates and assumptions as to revenue recognition, inventory valuation, amortization of preproduction costs, impairment of and the estimated useful lives of our long-lived assets, the fair value of stock-based compensation, as well as those used in the determination of liabilities related to self-insured portions of employee benefits, workers' compensation, derivatives and deferred income taxes.
Wheel Revenue Recognition
- Our products are manufactured to customer specifications under standard purchase orders. We ship our products to OEM customers based on release schedules provided weekly by our customers. Our sales and production levels are highly dependent upon the weekly forecasted production levels of our customers. Sales of these products, net of estimated pricing adjustments and their related costs are recognized when title and risk of loss transfers to the customer, generally upon shipment. A portion of our selling prices to OEM customers is attributable to the aluminum content of our wheels. Our selling prices are adjusted periodically for changes in the current aluminum market based upon specified aluminum price indices during specific pricing periods, as agreed with our customers. See
Preproduction Costs and Revenue Recognition Related to Long-Term Supply Arrangements
below for a discussion of tooling reimbursement revenues.
Derivative Financial Instruments and Hedging Activities -
In order to hedge exposure related to fluctuations in foreign currency rates and the cost of certain commodities used in the manufacture of our products, we periodically may purchase derivative financial instruments such as forward contracts, options or collars to offset or mitigate the impact of such fluctuations. Programs to hedge currency rate exposure may address ongoing transactions including, foreign-currency-denominated receivables and payables, as well as specific transactions related to purchase obligations. Programs to hedge exposure to commodity cost fluctuations would be based on underlying physical consumption of such commodity. At December 31, 2016, we held forward currency exchange contracts as discussed below.
29
We account for our derivative instruments as either assets or liabilities and carry them at fair value.
For derivative instruments that hedge the exposure to variability in expected future cash flows that are designated as cash flow hedges, the effective portion of the gain or loss on the derivative instrument is reported as a component of accumulated other comprehensive income ("AOCI") in shareholders’ equity and reclassified into income in the same period or periods during which the hedged transaction affects earnings. The ineffective portion of the gain or loss on the derivative instrument, if any, is recognized in current income. To receive hedge accounting treatment, cash flow hedges must be highly effective in offsetting changes to expected future cash flows on hedged transactions. For forward exchange contracts designated as cash flow hedges, changes in the time value are included in the definition of hedge effectiveness. Accordingly, any gains or losses related to this component are reported as a component of AOCI in shareholders’ equity and reclassified into income in the same period or periods during which the hedged transaction affects earnings. Derivatives that do not qualify as hedges are adjusted to fair value through current income. See Note 4, "Derivative Financial Instruments" in Notes to Consolidated Financial Statements in Item 8 for further discussion of derivatives.
When market conditions warrant, we may also enter into contracts to secure the supply of certain commodities used in the manufacture of our products, such as aluminum, natural gas and other raw materials. We previously had several purchase commitments for the delivery of natural gas through the end of 2015. These natural gas contracts were considered to be derivative instruments under U.S. GAAP and when entering into these contracts, it was expected that we would take full delivery of the contracted quantities of natural gas over the normal course of business. Accordingly, at inception, these contracts qualified for the normal purchase normal sale exemption provided for under U.S. GAAP. As such, we do not account for these purchase commitments as derivatives unless there is a change in the facts or circumstances that causes management to believe that these commitments would not be used in the normal course of business. See Note 18, "Risk Management" in Notes to Consolidated Financial Statements in Item 8 for additional information pertaining to these purchase commitments.
Fair Value Measurements -
The company applies fair value accounting for all financial assets and liabilities and non-financial assets and liabilities that are recognized or disclosed at fair value in the financial statements on a recurring basis, while other assets and liabilities are measured at fair value on a nonrecurring basis, such as when we have an asset impairment. Fair value is estimated by applying the following hierarchy, which prioritizes the inputs used to measure fair value into three levels and bases the categorization within the hierarchy upon the lowest level of input that is available and significant to the fair value measurement:
Level 1 - Quoted prices in active markets for identical assets or liabilities.
Level 2 - Observable inputs other than quoted prices in active markets for identical assets and liabilities, quoted prices for identical or similar assets or liabilities in inactive markets, or other inputs that are observable or can be corroborated by observable market data for substantially the full term of the assets or liabilities.
Level 3 - Inputs that are generally unobservable and typically reflect management’s estimate of assumptions that market participants would use in pricing the asset or liability.
Our derivatives are over-the-counter customized derivative transactions and are not exchange traded. We estimate the fair value of these instruments using industry-standard valuation models such as a discounted cash flow. These models project future cash flows and discount the future amounts to a present value using market-based expectations for interest rates, foreign exchange rates, commodity prices and the contractual terms of the derivative instruments. The discount rate used is the relevant interbank deposit rate (e.g., LIBOR) plus an adjustment for non-performance risk. In certain cases, market data may not be available and we may use broker quotes and models (e.g., Black-Scholes) to determine fair value. This includes situations where there is lack of liquidity for a particular currency or commodity or when the instrument is longer dated.
Inventories
- Inventories are stated at the lower of cost or market value and categorized as raw material, work-in-process or finished goods. When necessary, management uses estimates of net realizable value to record inventory reserves for obsolete and/or slow-moving inventory. Our inventory values, which are based upon standard costs for raw materials and labor and overhead established at the beginning of the year, are adjusted to actual costs on a first-in, first-out ("FIFO") basis. Current raw material prices and labor and overhead costs are utilized in developing these adjustments.
Preproduction Costs and Revenue Recognition Related to Long-Term Supply Arrangements
-
We incur preproduction engineering and tooling costs related to the products produced for our customers under long-term supply agreements. We expense all preproduction engineering costs for which reimbursement is not contractually guaranteed by the customer or which are in excess of the contractually guaranteed reimbursement amount. We amortize the cost of the customer-owned tooling over the expected life of the wheel program on a straight line basis. Also, we defer any reimbursements made to us by our customers and recognize the tooling reimbursement revenue over the same period in which the tooling is in use. Changes in the facts and circumstances of individual wheel programs may accelerate the amortization of both the cost of the customer-owned tooling and the deferred tooling reimbursement revenues. Recognized tooling reimbursement revenues, which totaled approximately $8.0 million, $5.8
30
million and $8.2 million, in 2016, 2015 and 2014, respectively, are included in net sales in the Consolidated Income Statements in Item 8, "Financial Statements and Supplementary Data" of this Annual Report. The following tables summarize the unamortized customer-owned tooling costs included in our non-current assets, and the deferred tooling revenues included in accrued liabilities and other non-current liabilities:
|
December 31,
|
2016
|
2015
|
||||||
|
(Dollars in Thousands)
|
||||||||
|
Unamortized Preproduction Costs
|
||||||||
|
Preproduction costs
|
$
|
78,299
|
|
$
|
73,095
|
|
||
|
Accumulated amortization
|
(65,100
|
)
|
(58,632
|
)
|
||||
|
Net preproduction costs
|
$
|
13,199
|
|
$
|
14,463
|
|
||
|
Deferred Tooling Revenue
|
||||||||
|
Accrued liabilities
|
$
|
5,419
|
|
$
|
2,908
|
|
||
|
Other non-current liabilities
|
2,593
|
|
1,266
|
|
||||
|
Total deferred tooling revenue
|
$
|
8,012
|
|
$
|
4,174
|
|
||
Impairment of Long-Lived Assets and Investments
- In accordance with U.S. GAAP, management evaluates the recoverability and estimated remaining lives of long-lived assets whenever facts and circumstances suggest that the carrying value of the assets may not be recoverable or the useful life has changed. See Note 1, "Summary of Significant Accounting Policies" in Notes to Consolidated Financial Statements in Item 8 for further discussion of asset impairments.
When facts and circumstances indicate that there may have been a loss in value, management will also evaluate its cost and equity method investments to determine whether there was an other-than-temporary impairment. If a loss in the value of the investment is determined to be other than temporary, then the decline in value is recognized in earnings. See Note 9, "Investment in Unconsolidated Affiliate" in Notes to Consolidated Financial Statements in Item 8 for discussion of our investment.
Retirement Plans
- Subject to certain vesting requirements, our unfunded retirement plan generally provides for a benefit based on final average compensation, which becomes payable on the employee's death or upon attaining age 65, if retired. The net periodic pension cost and related benefit obligations are based on, among other things, assumptions of the discount rate, future salary increases and the mortality of the participants. The net periodic pension costs and related obligations are measured using actuarial techniques and assumptions. See Note 12, "Retirement Plans" in Notes to Consolidated Financial Statements in Item 8 for a description of these assumptions.
The following information illustrates the sensitivity to a change in certain assumptions of our unfunded retirement plans as of December 31, 2016. Note that these sensitivities may be asymmetrical and are specific to 2016. They also may not be additive, so the impact of changing multiple factors simultaneously cannot be calculated by combining the individual sensitivities shown.
The effect of the indicated increase (decrease) in selected factors is shown below (in thousands):
|
|
|
Increase (Decrease) in:
|
|||||||||||
|
|
|
Projected Benefit
|
|||||||||||
|
|
Percentage
|
Obligation at
|
2016 Net Periodic
|
||||||||||
|
Assumption
|
Change
|
December 31, 2016
|
Pension Cost
|
||||||||||
|
Discount rate
|
+
|
1.0
|
%
|
$
|
(3,157
|
)
|
$
|
(162
|
)
|
||||
|
Rate of compensation increase
|
+
|
1.0
|
%
|
$
|
457
|
|
$
|
58
|
|
||||
Stock-Based Compensation
- We account for stock-based compensation using the fair value recognition in accordance with U.S. GAAP. We use the Black-Scholes option-pricing model to determine the fair value of any stock options granted, which requires us to make estimates regarding dividend yields on our common stock, expected volatility in the price of our common stock, risk free interest rates, forfeiture rates and the expected life of the option. To the extent these estimates change, our stock-based compensation expense would change as well. The fair value of any restricted shares awarded is calculated using the closing market price of our common stock on the date of issuance. We recognize these compensation costs net of the applicable forfeiture rates and recognize the compensation costs for only those shares expected to vest on a straight-line basis over the requisite service
31
period of the award, which is generally the option vesting term of three or four years. We estimated the forfeiture rate based on our historical experience.
Workers' Compensation and Loss Reserves
- We self-insure any losses arising out of workers' compensation claims. Workers' compensation accruals are based upon reported claims in process and actuarial estimates for losses incurred but not reported. Loss reserves, including incurred but not reported reserves, are estimated using actuarial methods and ultimate settlements may vary significantly from such estimates due to increased claim frequency or the severity of claims.
Accounting for Income Taxes
- We account for income taxes using the asset and liability method. The asset and liability method requires the recognition of deferred tax assets and liabilities for expected future tax consequences of temporary differences that currently exist between the tax basis and financial reporting basis of our assets and liabilities. We calculate current and deferred tax provisions based on estimates and assumptions that could differ from actual results reflected on the income tax returns filed during the following years. Adjustments based on filed returns are recorded when identified in the subsequent years.
The effect on deferred taxes for a change in tax rates is recognized in income in the period that the tax rate change is enacted. In assessing the realizability of deferred tax assets, we consider whether it is more likely than not that some portion of the deferred tax assets will not be realized. A valuation allowance is provided for deferred income tax assets when, in our judgment, based upon currently available information and other factors, it is more likely than not that all or a portion of such deferred income tax assets will not be realized. The determination of the need for a valuation allowance is based on an on-going evaluation of current information including, among other things, historical operating results, estimates of future earnings in different taxing jurisdictions and the expected timing of the reversals of temporary differences. We believe that the determination to record a valuation allowance to reduce a deferred income tax asset is a significant accounting estimate because it is based, among other things, on an estimate of future taxable income in the U.S. and certain other jurisdictions, which is susceptible to change and may or may not occur, and because the impact of adjusting a valuation allowance may be material.
In determining when to release the valuation allowance established against our net deferred income tax assets, we consider all available evidence, both positive and negative. Consistent with our policy, the valuation allowance against our net deferred income tax assets will not be reversed until such time as we have generated three years of cumulative pre-tax income and have reached sustained profitability, which we define as two consecutive one-year periods of pre-tax income.
We account for our uncertain tax positions utilizing a two-step approach to evaluate tax positions. Step one, recognition, requires evaluation of the tax position to determine if based solely on technical merits it is more likely than not to be sustained upon examination. Step two, measurement, is addressed only if a position is more likely than not to be sustained. In step two, the tax benefit is measured as the largest amount of benefit, determined on a cumulative probability basis, which is more likely than not to be realized upon ultimate settlement with tax authorities. If a position does not meet the more likely than not threshold for recognition in step one, no benefit is recorded until the first subsequent period in which the more likely than not standard is met, the issue is resolved with the taxing authority, or the statute of limitations expires. Positions previously recognized are derecognized when we subsequently determine the position no longer is more likely than not to be sustained. Evaluation of tax positions, their technical merits and measurements using cumulative probability are highly subjective management estimates. Actual results could differ materially from these estimates.
Presently, we have not recorded a deferred tax liability for temporary differences related to investments in foreign subsidiaries that are essentially permanent in duration. These temporary differences may become taxable upon a repatriation of earnings from the subsidiaries or a sale or liquidation of the subsidiaries. At this time the company does not have any plans to repatriate income from its foreign subsidiaries.
New Accounting Standards
In May 2014 the FASB issued ASU 2014-09, Revenue from Contracts with Customers. This update outlines a single, comprehensive model for accounting for revenue from contracts with customers. We plan to adopt this update on January 1, 2018. The guidance permits two methods of adoption: retrospectively to each prior reporting period presented (full retrospective method), or retrospectively with the cumulative effect of initially applying the guidance recognized at the date of initial application (modified retrospective method). We anticipate adopting the standard using the modified retrospective method. There may be differences in timing of revenue recognition under the new standard compared to recognition under ASC 605 - Revenue Recognition.
In July 2015, the FASB issued an ASU entitled
“Simplifying the Measurement of Inventory.” The ASU replaces the current lower of cost or market test with a lower of cost or net realizable value test when cost is determined on a first-in, first-out or average cost basis. The standard is effective for public entities for annual reporting periods beginning after December 15, 2016, and interim
32
periods therein. It is to be applied prospectively and early adoption is permitted. We are evaluating the impact this guidance will have on our financial position and statement of operations.
In February of 2016, the FASB issued ASU 2016-02, Leases (Topic 842) ("ASU 2016-02"). ASU 2016-02 requires an entity to recognize right-of-use assets and lease liabilities on its balance sheet and disclose key information about leasing arrangements. ASU 2016-02 offers specific accounting guidance for a lessee, a lessor and sale and leaseback transactions. Lessees and lessors are required to disclose qualitative and quantitative information about leasing arrangements to enable a user of the financial statements to assess the amount, timing and uncertainty of cash flows arising from leases. For public companies, ASU 2016-02 is effective for annual reporting periods beginning after December 15, 2018, including interim periods within that reporting period, and requires a modified retrospective adoption, with early adoption permitted. We are evaluating the impact this guidance will have on our financial position and statement of operations.
In March 2016, the FASB issued an ASU entitled "Stock Compensation (Topic 718): Improvements to Employee Share-Based Payment Accounting." The objective of the ASU is to simplify several aspects of the accounting for employee share-based payment transactions, including the income tax consequences, classification of awards as either equity or liabilities, and classification on the statement of cash flows. This ASU is effective for fiscal years beginning after December 15, 2016, including interim periods within those fiscal years. Early adoption is permitted. We are evaluating the impact this guidance will have on our financial position and statement of operations.
In August 2016, the FASB issued an ASU entitled "Statement of Cash Flows (Topic 740): Classification of Certain Cash Receipts and Cash Payments." The objective of the ASU is to address the diversity in practice in the presentation of certain cash receipts and cash payments in the statement of cash flows. This ASU is effective for fiscal years beginning after December 15, 2017, including interim periods within those fiscal years. Early adoption is permitted. We are evaluating the impact this guidance will have on our statement of cash flows.
In October 2016, the FASB issued an ASU entitled "Income Taxes (Topic 230): Intra-Entity Transfers of Assets Other than Inventory." The objective of the ASU is to improve the accounting for the income tax consequences of intra-entity transfers of assets other than inventory. This ASU is effective for fiscal years beginning after December 15, 2016, including interim periods within those fiscal years. Early adoption is permitted. We are evaluating the impact this guidance will have on our financial position and statement of operations.
In November 2016, the FASB issued an ASU entitled "Statement of Cash Flows (Topic 230): Restricted Cash." The objective of the ASU is to address the diversity in practice that exists in the classification and presentation of changes in restricted cash on the statement of cash flows. This ASU is effective for fiscal years beginning after December 15, 2017, including interim periods within those fiscal years. Early adoption is permitted. We are evaluating the impact this guidance will have on our statement of cash flows.
In January 2017, the FASB issued an ASU entitled "Business Combinations (Topic 805): Clarifying the Definition of a Business." The objective of the ASU is to assist entities with evaluating whether transactions should be accounted for as acquisitions (or disposals) of assets or businesses. This ASU is effective for fiscal years beginning after December 15, 2017, including interim periods within those fiscal years. Early adoption is permitted. We are evaluating the impact this guidance will have on our financial position and statement of operations.
In January 2017, the FASB issued an ASU entitled "Intangibles - Goodwill and Other (Topic 350): Simplifying the Test for Goodwill Impairment." The objective of the ASU is to simplify how an entity is required to test goodwill for impairment by eliminating Step 2 from the goodwill impairment test. Step 2 measures a goodwill impairment loss by comparing the implied fair value of a reporting unit’s goodwill with the carrying amount of that goodwill. This ASU is effective for fiscal years beginning after December 15, 2019, including interim periods within those fiscal years. Early adoption is permitted. We are evaluating the impact this guidance will have on our financial position and statement of operations.
Foreign Currency.
A significant portion of our business operations are conducted in Mexico. As a result, we have a certain degree of market risk with respect to our cash flows due to changes in foreign currency exchange rates when transactions are denominated in currencies other than our functional currency, including inter-company transactions.
In accordance with our corporate risk management policies, we may enter into foreign currency forward and option contracts with financial institutions to protect against foreign exchange risks associated with certain existing assets and liabilities, certain firmly
33
committed transactions and forecasted future cash flows. We have implemented a program to hedge a portion of our material foreign exchange exposures, for up to approximately 36 months. However, we may choose not to hedge certain foreign exchange exposures for a variety of reasons including, but not limited to, accounting considerations and the prohibitive economic cost of hedging particular exposures. We do not use derivative contracts for trading, market-making, or speculative purposes. For additional information on our derivatives, see Note 4, "Derivative Financial Instruments" in Notes to Consolidated Financial Statements in Item 8.
At December 31, 2016 the fair value liability of foreign currency exchange derivatives was $24.8 million. The potential loss in fair value for such financial instruments from a 10 percent adverse change in quoted foreign currency exchange rates would be $13.9 million at December 31, 2016.
During 2016, the Mexican peso to U.S. dollar exchange rate averaged 18.61 pesos to $1.00. Based on the balance sheet at December 31, 2016, the value of net assets for our operations in Mexico was 2,363 million pesos. Accordingly, a 10 percent change in the relationship between the peso and the U.S. dollar may result in a translation impact of between $11.5 million and $14.1 million, which would be recognized in other comprehensive (loss) income.
Our business requires us to settle transactions between currencies in both directions - i.e., peso to U.S. dollar and vice versa. To the greatest extent possible, we attempt to match the timing of transaction settlements between currencies to create a “natural hedge.” For 2016, we had a $0.4 million net foreign exchange transaction loss related to the peso. Based on the current business model and levels of production and sales activity, the net imbalance between currencies depends on specific circumstances. While changes in the terms of the contracts with our customers will be creating an imbalance between currencies that we are hedging with foreign currency forward contracts, there can be no assurances that our hedging program will effectively offset the impact of the imbalance between currencies or that the net transaction balance will not change significantly in the future.
Commodity Purchase Commitments.
When market conditions warrant, we enter into purchase commitments to secure the supply of certain commodities used in the manufacture of our products, such as aluminum, natural gas and other raw materials. However, we do not enter into derivatives or other financial instrument transactions for speculative purposes. At December 31, 2016, we had no purchase commitments in place for the delivery of aluminum, natural gas or other raw materials in 2017.
See the section captioned "Risk Management" in Item 7, "Management's Discussion and Analysis of Financial Condition and Results of Operations" for a further discussion about the market risk we face.
34
Index to the Consolidated Financial Statements of Superior Industries International, Inc.
|
|
PAGE
|
|
|
|
|
Report of Independent Registered Public Accounting Firm
|
|
|
|
|
|
Financial Statements
|
|
|
|
|
|
Consolidated Income Statements for the Fiscal Years 2016, 2015 and 2014
|
|
|
Consolidated Statements of Comprehensive Income for the Fiscal Years 2016, 2015, 2014
|
|
|
|
|
|
Consolidated Balance Sheets as of the Fiscal Year End 2016 and 2015
|
|
|
|
|
|
Consolidated Statements of Shareholders’ Equity for the Fiscal Years 2016, 2015 and 2014
|
|
|
|
|
|
Consolidated Statements of Cash Flows for the Fiscal Years 2016, 2015 and 2014
|
|
|
|
|
|
Notes to Consolidated Financial Statements
|
|
35
REPORT OF INDEPENDENT REGISTERED PUBLIC ACCOUNTING FIRM
To the Board of Directors and Stockholders of
Superior Industries International, Inc.
Southfield, Michigan
We have audited the accompanying consolidated balance sheets of Superior Industries International, Inc. and subsidiaries (the “Company”) as of December 25, 2016 and December 27, 2015, and the related consolidated income statements, statements of comprehensive income, shareholders’ equity, and cash flows for each of the three years in the periods ended December 25, 2016, December 27, 2015, and December 28, 2014. Our audits also include the financial statement schedule listed in the Index at Item 15. These financial statements and financial statement schedule are the responsibility of the Company’s management. Our responsibility is to express an opinion on these financial statements and financial statement schedule based on our audits.
We conducted our audits in accordance with the standards of the Public Company Accounting Oversight Board (United States). Those standards require that we plan and perform the audit to obtain reasonable assurance about whether the financial statements are free of material misstatement. An audit includes examining, on a test basis, evidence supporting the amounts and disclosures in the financial statements. An audit also includes assessing the accounting principles used and significant estimates made by management, as well as evaluating the overall financial statement presentation. We believe that our audits provide a reasonable basis for our opinion.
In our opinion, such consolidated financial statements present fairly, in all material respects, the financial position of Superior Industries International, Inc. and subsidiaries as of December 25, 2016 and December 27, 2015, and the results of their operations and their cash flows for each of the three years in the periods ended December 25, 2016, December 27, 2015, and December 28, 2014, in conformity with accounting principles generally accepted in the United States of America. Also, in our opinion, such financial statement schedule, when considered in relation to the basic consolidated financial statements taken as a whole, presents fairly, in all material respects, the information set forth therein.
We have also audited, in accordance with the standards of the Public Company Accounting Oversight Board (United States), the Company’s internal control over financial reporting as of December 25, 2016, based on the criteria established in
Internal Control - Integrated Framework (2013)
issued by the Committee of Sponsoring Organizations of the Treadway Commission and our report dated March 3, 2017 expressed an unqualified opinion on the Company’s internal control over financial reporting.
/s/ Deloitte & Touche LLP
Detroit, Michigan
March 3, 2017
36
REPORT OF INDEPENDENT REGISTERED PUBLIC ACCOUNTING FIRM
To the Board of Directors and Stockholders of
Superior Industries International, Inc.
Southfield, Michigan
We have audited the internal control over financial reporting of Superior Industries International, Inc. and subsidiaries (the “Company”) as of December 25, 2016, based on criteria established in
Internal Control - Integrated Framework (2013)
issued by the Committee of Sponsoring Organizations of the Treadway Commission. The Company’s management is responsible for maintaining effective internal control over financial reporting and for its assessment of the effectiveness of internal control over financial reporting, included in the accompanying Management's Report on Internal Control over Financial Reporting. Our responsibility is to express an opinion on the Company’s internal control over financial reporting based on our audit.
We conducted our audit in accordance with the standards of the Public Company Accounting Oversight Board (United States). Those standards require that we plan and perform the audit to obtain reasonable assurance about whether effective internal control over financial reporting was maintained in all material respects. Our audit included obtaining an understanding of internal control over financial reporting, assessing the risk that a material weakness exists, testing and evaluating the design and operating effectiveness of internal control based on the assessed risk, and performing such other procedures as we considered necessary in the circumstances. We believe that our audit provides a reasonable basis for our opinion.
A company’s internal control over financial reporting is a process designed by, or under the supervision of, the company’s principal executive and principal financial officers, or persons performing similar functions, and effected by the company’s board of directors, management, and other personnel to provide reasonable assurance regarding the reliability of financial reporting and the preparation of financial statements for external purposes in accordance with generally accepted accounting principles. A company’s internal control over financial reporting includes those policies and procedures that (1) pertain to the maintenance of records that, in reasonable detail, accurately and fairly reflect the transactions and dispositions of the assets of the company; (2) provide reasonable assurance that transactions are recorded as necessary to permit preparation of financial statements in accordance with generally accepted accounting principles, and that receipts and expenditures of the company are being made only in accordance with authorizations of management and directors of the company; and (3) provide reasonable assurance regarding prevention or timely detection of unauthorized acquisition, use, or disposition of the company’s assets that could have a material effect on the financial statements.
Because of the inherent limitations of internal control over financial reporting, including the possibility of collusion or improper management override of controls, material misstatements due to error or fraud may not be prevented or detected on a timely basis. Also, projections of any evaluation of the effectiveness of the internal control over financial reporting to future periods are subject to the risk that the controls may become inadequate because of changes in conditions, or that the degree of compliance with the policies or procedures may deteriorate.
In our opinion, the Company maintained, in all material respects, effective internal control over financial reporting as of December 25, 2016, based on the criteria established in
Internal Control - Integrated Framework (2013)
issued by the Committee of Sponsoring Organizations of the Treadway Commission.
We have also audited, in accordance with the standards of the Public Company Accounting Oversight Board (United States), the consolidated financial statements and financial statement schedule as of and for the year ended December 25, 2016 of the Company and our report dated March 3, 2017 expressed an unqualified opinion on those financial statements and financial statement schedule.
/s/ Deloitte & Touche LLP
Detroit, Michigan
March 3, 2017
37
SUPERIOR INDUSTRIES INTERNATIONAL, INC.
(Dollars in thousands, except per share data)
|
Fiscal Year Ended December 31,
|
2016
|
2015
|
2014
|
|||||||||
|
NET SALES
|
$
|
732,677
|
|
$
|
727,946
|
|
$
|
745,447
|
|
|||
|
Cost of sales:
|
||||||||||||
|
Cost of sales
|
645,015
|
|
650,717
|
|
686,796
|
|
||||||
|
Restructuring costs (Note 2)
|
1,458
|
|
6,012
|
|
8,429
|
|
||||||
|
646,473
|
|
656,729
|
|
695,225
|
|
|||||||
|
GROSS PROFIT
|
86,204
|
|
71,217
|
|
50,222
|
|
||||||
|
Selling, general and administrative expenses
|
31,602
|
|
34,923
|
|
32,309
|
|
||||||
|
INCOME FROM OPERATIONS
|
54,602
|
|
36,294
|
|
17,913
|
|
||||||
|
Interest income, net
|
245
|
|
103
|
|
1,095
|
|
||||||
|
Other expense, net
|
(126
|
)
|
(1,114
|
)
|
(3,306
|
)
|
||||||
|
INCOME BEFORE INCOME TAXES
|
54,721
|
|
35,283
|
|
15,702
|
|
||||||
|
Income tax provision
|
(13,340
|
)
|
(11,339
|
)
|
(6,899
|
)
|
||||||
|
NET INCOME
|
$
|
41,381
|
|
$
|
23,944
|
|
$
|
8,803
|
|
|||
|
EARNINGS PER SHARE - BASIC
|
$
|
1.63
|
|
$
|
0.90
|
|
$
|
0.33
|
|
|||
|
EARNINGS PER SHARE - DILUTED
|
$
|
1.62
|
|
$
|
0.90
|
|
$
|
0.33
|
|
|||
The accompanying notes are an integral part of these consolidated financial statements.
38
SUPERIOR INDUSTRIES INTERNATIONAL, INC.
CONSOLIDATED STATEMENTS OF COMPREHENSIVE INCOME
(Dollars in thousands)
|
Fiscal Year Ended December 31,
|
2016
|
2015
|
2014
|
|||||||||
|
Net income
|
$
|
41,381
|
|
$
|
23,944
|
|
$
|
8,803
|
|
|||
|
Other comprehensive (loss) income, net of tax:
|
||||||||||||
|
Foreign currency translation loss
|
(16,904
|
)
|
(16,810
|
)
|
(13,369
|
)
|
||||||
|
Change in unrecognized losses on derivative instruments:
|
||||||||||||
|
Change in fair value of derivatives
|
(11,062
|
)
|
(7,189
|
)
|
(7,598
|
)
|
||||||
|
Tax benefit
|
4,250
|
|
2,665
|
|
2,833
|
|
||||||
|
Change in unrecognized losses on derivative instruments, net of tax
|
(6,812
|
)
|
(4,524
|
)
|
(4,765
|
)
|
||||||
|
Defined benefit pension plan:
|
||||||||||||
|
Actuarial gains (losses) on pension obligation, net of curtailments and amortization
|
799
|
|
1,807
|
|
(4,686
|
)
|
||||||
|
Tax (provision) benefit
|
(295
|
)
|
(761
|
)
|
1,758
|
|
||||||
|
Pension changes, net of tax
|
504
|
|
1,046
|
|
(2,928
|
)
|
||||||
|
Other comprehensive (loss) income, net of tax
|
(23,212
|
)
|
(20,288
|
)
|
(21,062
|
)
|
||||||
|
Comprehensive income (loss)
|
$
|
18,169
|
|
$
|
3,656
|
|
$
|
(12,259
|
)
|
|||
The accompanying notes are an integral part of these consolidated financial statements.
39
SUPERIOR INDUSTRIES INTERNATIONAL, INC.
(Dollars in thousands)
|
Fiscal Year Ended December 31,
|
2016
|
2015
|
|||||
|
ASSETS
|
|
|
|||||
|
Current assets:
|
|
|
|||||
|
Cash and cash equivalents
|
$
|
57,786
|
|
$
|
52,036
|
|
|
|
Short-term investments
|
750
|
|
950
|
|
|||
|
Accounts receivable, net
|
99,331
|
|
112,588
|
|
|||
|
Inventories
|
82,837
|
|
61,769
|
|
|||
|
Income taxes receivable
|
3,682
|
|
1,104
|
|
|||
|
Other current assets
|
9,695
|
|
14,476
|
|
|||
|
Assets held for sale
|
—
|
|
2,897
|
|
|||
|
Total current assets
|
254,081
|
|
245,820
|
|
|||
|
Property, plant and equipment, net
|
227,403
|
|
234,646
|
|
|||
|
Investment in unconsolidated affiliate
|
2,000
|
|
2,000
|
|
|||
|
Non-current deferred income taxes, net
|
28,838
|
|
25,598
|
|
|||
|
Other non-current assets
|
30,434
|
|
31,865
|
|
|||
|
Total assets
|
$
|
542,756
|
|
$
|
539,929
|
|
|
|
LIABILITIES AND SHAREHOLDERS' EQUITY
|
|
|
|
|
|||
|
Current liabilities:
|
|
|
|
|
|||
|
Accounts payable
|
$
|
37,856
|
|
$
|
20,913
|
|
|
|
Accrued expenses
|
46,315
|
|
46,214
|
|
|||
|
Income taxes payable
|
1,793
|
|
6,735
|
|
|||
|
Total current liabilities
|
85,964
|
|
73,862
|
|
|||
|
Non-current income tax liabilities
|
5,301
|
|
4,510
|
|
|||
|
Non-current deferred income tax liabilities, net
|
3,628
|
|
8,094
|
|
|||
|
Other non-current liabilities
|
49,637
|
|
39,551
|
|
|||
|
Commitments and contingent liabilities (Note 18)
|
—
|
|
—
|
|
|||
|
Shareholders' equity:
|
|
|
|
|
|||
|
Preferred stock, $0.01 par value
|
|
|
|
|
|||
|
Authorized - 1,000,000 shares
|
|
|
|
|
|||
|
Issued - none
|
—
|
|
—
|
|
|||
|
Common stock, $0.01 par value
|
|
|
|
|
|||
|
Authorized - 100,000,000 shares
|
|
|
|
|
|||
|
Issued and outstanding - 25,143,950 shares
|
|||||||
|
(26,098,895 shares at December 31, 2015)
|
89,916
|
|
88,108
|
|
|||
|
Accumulated other comprehensive loss
|
(124,925
|
)
|
(101,713
|
)
|
|||
|
Retained earnings
|
433,235
|
|
427,517
|
|
|||
|
Total shareholders' equity
|
398,226
|
|
413,912
|
|
|||
|
Total liabilities and shareholders' equity
|
$
|
542,756
|
|
$
|
539,929
|
|
|
The accompanying notes are an integral part of these consolidated financial statements.
40
SUPERIOR INDUSTRIES INTERNATIONAL, INC.
CONSOLIDATED STATEMENTS OF SHAREHOLDERS' EQUITY
FISCAL YEAR ENDED DECEMBER 31, 2014
(Dollars in thousands, except per share data)
|
Accumulated Other Comprehensive Income (Loss)
|
||||||||||||||||||||||||||
|
|
Common Stock
|
Unrecognized
|
|
|
||||||||||||||||||||||
|
|
Number of Shares
|
Amount
|
Gains/Losses on Derivative Instruments
|
Pension Obligations
|
Cumulative Translation Adjustment
|
Retained Earnings
|
Total
|
|||||||||||||||||||
|
BALANCE AT FISCAL YEAR END 2013
|
27,155,550
|
|
$
|
75,305
|
|
$
|
—
|
|
$
|
(2,258
|
)
|
$
|
(58,105
|
)
|
$
|
468,121
|
|
$
|
483,063
|
|
||||||
|
Net income
|
8,803
|
|
8,803
|
|
||||||||||||||||||||||
|
Change in unrecognized gains/losses on derivative instruments, net of tax
|
(4,765
|
)
|
—
|
|
(4,765
|
)
|
||||||||||||||||||||
|
Change in employee benefit plans, net of taxes
|
—
|
|
(2,928
|
)
|
—
|
|
(2,928
|
)
|
||||||||||||||||||
|
Net foreign currency translation adjustment
|
—
|
|
—
|
|
(13,369
|
)
|
—
|
|
(13,369
|
)
|
||||||||||||||||
|
Stock options exercised
|
453,745
|
|
7,423
|
|
—
|
|
—
|
|
—
|
|
—
|
|
7,423
|
|
||||||||||||
|
Restricted stock awards granted, net of forfeitures
|
210,512
|
|
—
|
|
—
|
|
—
|
|
—
|
|
—
|
|
—
|
|
||||||||||||
|
Stock-based compensation expense
|
—
|
|
2,315
|
|
—
|
|
—
|
|
—
|
|
—
|
|
2,315
|
|
||||||||||||
|
Tax impact of stock options
|
—
|
|
(416
|
)
|
—
|
|
—
|
|
—
|
|
—
|
|
(416
|
)
|
||||||||||||
|
Common stock repurchased
|
(1,089,560
|
)
|
(3,154
|
)
|
—
|
|
—
|
|
—
|
|
(18,636
|
)
|
(21,790
|
)
|
||||||||||||
|
Cash dividends declared ($0.72 per share)
|
—
|
|
—
|
|
—
|
|
—
|
|
—
|
|
(19,330
|
)
|
(19,330
|
)
|
||||||||||||
|
BALANCE AT FISCAL YEAR END 2014
|
26,730,247
|
|
$
|
81,473
|
|
$
|
(4,765
|
)
|
$
|
(5,186
|
)
|
$
|
(71,474
|
)
|
$
|
438,958
|
|
$
|
439,006
|
|
||||||
The accompanying notes are an integral part of these consolidated financial statements.
41
SUPERIOR INDUSTRIES INTERNATIONAL, INC.
CONSOLIDATED STATEMENTS OF SHAREHOLDERS' EQUITY
FISCAL YEAR ENDED DECEMBER 31, 2015
(Dollars in thousands, except per share data)
|
Accumulated Other Comprehensive Income (Loss)
|
||||||||||||||||||||||||||
|
|
Common Stock
|
Unrecognized
|
|
|
||||||||||||||||||||||
|
|
Number of Shares
|
Amount
|
Gains/Losses on Derivative Instruments
|
Pension Obligations
|
Cumulative Translation Adjustment
|
Retained Earnings
|
Total
|
|||||||||||||||||||
|
BALANCE AT FISCAL YEAR END 2014
|
26,730,247
|
|
$
|
81,473
|
|
$
|
(4,765
|
)
|
$
|
(5,186
|
)
|
$
|
(71,474
|
)
|
$
|
438,958
|
|
$
|
439,006
|
|
||||||
|
Net income
|
23,944
|
|
23,944
|
|
||||||||||||||||||||||
|
Change in unrecognized gains/losses on derivative instruments, net of tax
|
(4,524
|
)
|
—
|
|
(4,524
|
)
|
||||||||||||||||||||
|
Change in employee benefit plans, net of taxes
|
—
|
|
1,046
|
|
—
|
|
1,046
|
|
||||||||||||||||||
|
Net foreign currency translation adjustment
|
|
|
—
|
|
—
|
|
(16,810
|
)
|
—
|
|
(16,810
|
)
|
||||||||||||||
|
Stock options exercised
|
420,642
|
|
7,265
|
|
—
|
|
—
|
|
—
|
|
—
|
|
7,265
|
|
||||||||||||
|
Restricted stock awards granted, net of forfeitures
|
4,960
|
|
—
|
|
—
|
|
—
|
|
—
|
|
—
|
|
—
|
|
||||||||||||
|
Stock-based compensation expense
|
—
|
|
2,807
|
|
—
|
|
—
|
|
—
|
|
—
|
|
2,807
|
|
||||||||||||
|
Tax impact of stock options
|
—
|
|
—
|
|
—
|
|
—
|
|
—
|
|
—
|
|
—
|
|
||||||||||||
|
Common stock repurchased
|
(1,056,954
|
)
|
(3,437
|
)
|
—
|
|
—
|
|
(16,201
|
)
|
(19,638
|
)
|
||||||||||||||
|
Cash dividends declared ($0.72 per share)
|
—
|
|
—
|
|
—
|
|
—
|
|
—
|
|
(19,184
|
)
|
(19,184
|
)
|
||||||||||||
|
BALANCE AT FISCAL YEAR END 2015
|
26,098,895
|
|
$
|
88,108
|
|
$
|
(9,289
|
)
|
$
|
(4,140
|
)
|
$
|
(88,284
|
)
|
$
|
427,517
|
|
$
|
413,912
|
|
||||||
The accompanying notes are an integral part of these consolidated financial statements.
42
SUPERIOR INDUSTRIES INTERNATIONAL, INC.
CONSOLIDATED STATEMENTS OF SHAREHOLDERS' EQUITY
FISCAL YEAR ENDED DECEMBER 31, 2016
(Dollars in thousands, except per share data)
|
Accumulated Other Comprehensive Income (Loss)
|
||||||||||||||||||||||||||
|
|
Common Stock
|
Unrecognized
|
|
|
||||||||||||||||||||||
|
|
Number of Shares
|
Amount
|
Gains/Losses on Derivative Instruments
|
Pension Obligations
|
Cumulative Translation Adjustment
|
Retained Earnings
|
Total
|
|||||||||||||||||||
|
BALANCE AT FISCAL YEAR END 2015
|
26,098,895
|
|
$
|
88,108
|
|
$
|
(9,289
|
)
|
$
|
(4,140
|
)
|
$
|
(88,284
|
)
|
$
|
427,517
|
|
$
|
413,912
|
|
||||||
|
Net income
|
41,381
|
|
41,381
|
|
||||||||||||||||||||||
|
Change in unrecognized gains/losses on derivative instruments, net of tax
|
(6,812
|
)
|
—
|
|
(6,812
|
)
|
||||||||||||||||||||
|
Change in employee benefit plans, net of taxes
|
—
|
|
504
|
|
—
|
|
504
|
|
||||||||||||||||||
|
Net foreign currency translation adjustment
|
—
|
|
—
|
|
(16,904
|
)
|
—
|
|
(16,904
|
)
|
||||||||||||||||
|
Stock options exercised
|
86,908
|
|
1,641
|
|
—
|
|
—
|
|
—
|
|
—
|
|
1,641
|
|
||||||||||||
|
Restricted stock awards granted, net of forfeitures
|
(1,165
|
)
|
—
|
|
—
|
|
—
|
|
—
|
|
—
|
|
—
|
|
||||||||||||
|
Stock-based compensation expense
|
—
|
|
3,618
|
|
—
|
|
—
|
|
—
|
|
—
|
|
3,618
|
|
||||||||||||
|
Tax impact of stock options
|
—
|
|
92
|
|
—
|
|
—
|
|
—
|
|
—
|
|
92
|
|
||||||||||||
|
Common stock repurchased
|
(1,040,688
|
)
|
(3,543
|
)
|
—
|
|
—
|
|
—
|
|
(17,176
|
)
|
(20,719
|
)
|
||||||||||||
|
Cash dividends declared ($0.72 per share)
|
—
|
|
—
|
|
—
|
|
—
|
|
—
|
|
(18,487
|
)
|
(18,487
|
)
|
||||||||||||
|
BALANCE AT FISCAL YEAR END 2016
|
25,143,950
|
|
$
|
89,916
|
|
$
|
(16,101
|
)
|
$
|
(3,636
|
)
|
$
|
(105,188
|
)
|
$
|
433,235
|
|
$
|
398,226
|
|
||||||
The accompanying notes are an integral part of these consolidated financial statements.
43
SUPERIOR INDUSTRIES INTERNATIONAL, INC.
(Dollars in thousands)
|
Fiscal Year Ended December 31,
|
2016
|
2015
|
2014
|
||||||||
|
CASH FLOWS FROM OPERATING ACTIVITIES:
|
|||||||||||
|
Net income
|
$
|
41,381
|
|
$
|
23,944
|
|
$
|
8,803
|
|
||
|
Adjustments to reconcile net income to net cash provided by operating activities:
|
|||||||||||
|
Depreciation
|
34,261
|
|
34,530
|
|
35,582
|
|
|||||
|
Income tax, non-cash changes
|
(4,669
|
)
|
(9,531
|
)
|
(5,771
|
)
|
|||||
|
Impairments of long-lived assets and other charges
|
—
|
|
2,688
|
|
2,500
|
|
|||||
|
Stock-based compensation
|
3,618
|
|
2,807
|
|
2,315
|
|
|||||
|
Other non-cash items
|
812
|
|
1,400
|
|
2,560
|
|
|||||
|
Changes in operating assets and liabilities:
|
|||||||||||
|
Accounts receivable
|
8,043
|
|
(14,030
|
)
|
(16,184
|
)
|
|||||
|
Inventories
|
(22,339
|
)
|
11,509
|
|
(9,297
|
)
|
|||||
|
Other assets and liabilities
|
6,244
|
|
2,469
|
|
(9,138
|
)
|
|||||
|
Accounts payable
|
15,880
|
|
(1,132
|
)
|
(6,109
|
)
|
|||||
|
Income taxes
|
(4,740
|
)
|
4,695
|
|
6,366
|
|
|||||
|
NET CASH PROVIDED BY OPERATING ACTIVITIES
|
78,491
|
|
59,349
|
|
11,627
|
|
|||||
|
CASH FLOWS FROM INVESTING ACTIVITIES:
|
|
|
|
|
|||||||
|
Additions to property, plant and equipment
|
(39,575
|
)
|
(39,543
|
)
|
(112,556
|
)
|
|||||
|
Proceeds from sales and maturities of investments
|
200
|
|
3,750
|
|
3,750
|
|
|||||
|
Purchase of investments
|
—
|
|
(950
|
)
|
(3,750
|
)
|
|||||
|
Proceeds from sales of fixed assets
|
4,337
|
|
1,815
|
|
1,873
|
|
|||||
|
Other
|
—
|
|
(18
|
)
|
248
|
|
|||||
|
NET CASH USED IN INVESTING ACTIVITIES
|
(35,038
|
)
|
(34,946
|
)
|
(110,435
|
)
|
|||||
|
CASH FLOWS FROM FINANCING ACTIVITIES:
|
|
|
|
|
|||||||
|
Cash dividends paid
|
(18,340
|
)
|
(19,082
|
)
|
(19,351
|
)
|
|||||
|
Cash paid for common stock repurchase
|
(20,719
|
)
|
(19,638
|
)
|
(21,790
|
)
|
|||||
|
Proceeds from exercise of stock options
|
1,641
|
|
7,265
|
|
7,423
|
|
|||||
|
Excess tax benefits from exercise of stock options
|
91
|
|
107
|
|
106
|
|
|||||
|
NET CASH USED IN FINANCING ACTIVITIES
|
(37,327
|
)
|
(31,348
|
)
|
(33,612
|
)
|
|||||
|
Effect of exchange rate changes on cash
|
(376
|
)
|
(3,470
|
)
|
(4,430
|
)
|
|||||
|
Net increase (decrease) in cash and cash equivalents
|
5,750
|
|
(10,415
|
)
|
(136,850
|
)
|
|||||
|
Cash and cash equivalents at the beginning of the period
|
52,036
|
|
62,451
|
|
199,301
|
|
|||||
|
Cash and cash equivalents at the end of the period
|
$
|
57,786
|
|
$
|
52,036
|
|
$
|
62,451
|
|
||
The accompanying notes are an integral part of these consolidated financial statements.
44
SUPERIOR INDUSTRIES INTERNATIONAL, INC.
NOTES TO CONSOLIDATED FINANCIAL STATEMENTS
December 31
,
2016
Nature of Operations
Headquartered in Southfield, Michigan, the principal business of Superior Industries International, Inc. (referred to herein as the “company” or “we,” “us” and “our”) is the design and manufacture of aluminum wheels for sale to original equipment manufacturers ("OEMs"). We are one of the largest suppliers of cast aluminum wheels to the world’s leading automobile and light truck manufacturers, with manufacturing operations in the United States and Mexico. Customers in North America represent the principal market for our products. As described in Note 5, "Business Segments," the company operates as a single integrated business and, as such, has only one operating segment - automotive wheels.
Presentation of Consolidated Financial Statements
The consolidated financial statements include the accounts of the company and its wholly owned subsidiaries. All intercompany transactions are eliminated in consolidation.
We have made a number of estimates and assumptions related to the reporting of assets, liabilities, revenues and expenses to prepare these financial statements in conformity with U.S. GAAP as delineated by the FASB in its ASC. Generally, assets and liabilities that are subject to estimation and judgment include the allowance for doubtful accounts, inventory valuation, amortization of preproduction costs, impairment of and the estimated useful lives of our long-lived assets, self-insurance portions of employee benefits, workers' compensation and general liability programs, fair value of stock-based compensation, income tax liabilities and deferred income taxes. While actual results could differ, we believe such estimates to be reasonable.
Our fiscal year is the 52- or 53-week period ending generally on the last Sunday of the calendar year. The fiscal years 2016, 2015 and 2014 comprised the 52-week periods ended on December 25, 2016, December 27, 2015 and December 28, 2014, respectively. For convenience of presentation, all fiscal years are referred to as beginning as of January 1, and ending as of December 31, but actually reflect our financial position and results of operations for the periods described above.
Cash and Cash Equivalents
Cash and cash equivalents generally consist of cash, certificates of deposit and fixed deposits and money market funds with original maturities of three months or less. Our cash and cash equivalents are not subject to significant interest rate risk due to the short maturities of these investments. Certificates of deposit and fixed deposits whose original maturity is greater than three months and is one year or less are classified as short-term investments and certificates of deposit and fixed deposits whose maturity is greater than one year at the balance sheet date are classified as non-current assets in our consolidated balance sheets. The purchase of any certificates of deposit or fixed deposits that are classified as short-term investments or non-current assets appear in the investing section of our consolidated statements of cash flows. At times throughout the year and at year-end, cash balances held at financial institutions were in excess of federally insured limits.
Restricted Deposits
We purchase certificates of deposit that mature within twelve months and are used to secure or collateralize letters of credit securing our workers’ compensation obligations. At
December 31
,
2016
and
2015
, certificates of deposit totaling
$0.8 million
and
$1.0 million
, respectively, were restricted in use and were classified as short-term investments on our consolidated balance sheet.
Derivative Financial Instruments and Hedging Activities
In order to hedge exposure related to fluctuations in foreign currency rates and the cost of certain commodities used in the manufacture of our products, we periodically may purchase derivative financial instruments such as forward contracts, options or collars to offset or mitigate the impact of such fluctuations. Programs to hedge currency rate exposure may address ongoing transactions including, foreign-currency-denominated receivables and payables, as well as specific transactions related to purchase obligations. Programs to hedge exposure to commodity cost fluctuations would be based on underlying physical consumption of such commodity. At
December 31
,
2016
and
2015
, we held forward currency exchange contracts discussed below.
45
We account for our derivative instruments as either assets or liabilities and carry them at fair value.
For derivative instruments that hedge the exposure to variability in expected future cash flows that are designated as cash flow hedges, the effective portion of the gain or loss on the derivative instrument is reported as a component of accumulated other comprehensive income ("AOCI") in shareholders’ equity and reclassified into income in the same period or periods during which the hedged transaction affects earnings. The ineffective portion of the gain or loss on the derivative instrument, if any, is recognized in current income. To receive hedge accounting treatment, cash flow hedges must be highly effective in offsetting changes to expected future cash flows on hedged transactions. For forward exchange contracts designated as cash flow hedges, changes in the time value are included in the definition of hedge effectiveness. Accordingly, any gains or losses related to this component are reported as a component of AOCI in shareholders’ equity and reclassified into income in the same period or periods during which the hedged transaction affects earnings. Derivatives that do not qualify as hedges are adjusted to fair value through current income. See Note 4, "Derivative Financial Instruments" for additional information pertaining to our derivative instruments.
We enter into contracts to purchase certain commodities used in the manufacture of our products, such as aluminum, natural gas and other raw materials. These contracts are considered to be derivative instruments under U.S. GAAP. However, upon entering into these contracts, we expect to fulfill our purchase commitments and take full delivery of the contracted quantities of these commodities during the normal course of business. Accordingly, under U.S. GAAP, these purchase contracts are not accounted for as derivatives because they qualify for the normal purchase normal sale exception under U.S. GAAP, unless there is a change in the facts or circumstances that causes management to believe that these commitments would not be used in the normal course of business. See Note 18, "Risk Management" for additional information pertaining to these purchase commitments.
Non-Cash Investing Activities
As of
December 31
,
2016
,
2015
and
2014
,
$4.0 million
,
$1.1 million
and
$6.4 million
, respectively, of equipment had been purchased but not yet paid for and are included in accounts payable and accrued expenses in our consolidated balance sheets.
Accounts Receivable
We maintain an allowance for doubtful accounts receivable based upon the expected collectability of all trade receivables. The allowance is reviewed continually and adjusted for amounts deemed uncollectible by management.
Inventories
Inventories, which are categorized as raw materials, work-in-process or finished goods, are stated at the lower of cost or market using the first-in, first-out method. When necessary, management uses estimates of net realizable value to record inventory reserves for obsolete and/or slow-moving inventory. Aluminum is the primary material component in our inventories. Our aluminum requirements are supplied from
two
primary vendors, each accounting for more than 10 percent of our aluminum purchases during
2016
and
2015
.
Property, Plant and Equipment
Property, plant and equipment are carried at cost, less accumulated depreciation. The cost of additions, improvements and interest during construction, if any, are capitalized. Our maintenance and repair costs are charged to expense when incurred. Depreciation is calculated generally on the straight-line method based on the estimated useful lives of the assets.
|
Classification
|
Expected Useful Life
|
|
|
|
|
Computer equipment
|
3 to 5 years
|
|
Production machinery and equipment
|
7 to 10 years
|
|
Buildings
|
25 years
|
When property, plant and equipment is replaced, retired or disposed of, the cost and related accumulated depreciation are removed from the accounts. Property, plant and equipment no longer used in operations, which are generally insignificant in amount, are stated at the lower of cost or estimated net realizable value. Gains and losses, if any, are recorded as a component of operating income if the disposition relates to an operating asset. If a non-operating asset is disposed of, any gains and losses are recorded in other income or expense in the period of disposition or write down.
46
Preproduction Costs and Revenue Recognition Related to Long-Term Supply Arrangements
We incur preproduction engineering and tooling costs related to the products produced for our customers under long-term supply agreements. We expense all preproduction engineering costs for which reimbursement is not contractually guaranteed by the customer or which are in excess of the contractually guaranteed reimbursement amount. We amortize the cost of the customer-owned tooling over the expected life of the wheel program on a straight-line basis. Also, we defer any reimbursements made to us by our customer and recognize the tooling reimbursement revenue over the same period in which the tooling is in use. Changes in the facts and circumstances of individual wheel programs may accelerate the amortization of both the cost of customer-owned tooling and the deferred tooling reimbursement revenues. Recognized tooling reimbursement revenues, which totaled
$8.0 million
,
$5.8 million
and
$8.2 million
in
2016
,
2015
and
2014
, respectively, are included in net sales in the consolidated income statements. The following tables summarize the unamortized customer-owned tooling costs included in our other non-current assets, and the deferred tooling revenues included in accrued expenses and other non-current liabilities:
|
December 31,
|
2016
|
2015
|
||||||
|
(Dollars in Thousands)
|
||||||||
|
Customer-Owned Tooling Costs
|
||||||||
|
Preproduction costs
|
$
|
78,299
|
|
$
|
73,095
|
|
||
|
Accumulated amortization
|
(65,100
|
)
|
(58,632
|
)
|
||||
|
Net preproduction costs
|
$
|
13,199
|
|
$
|
14,463
|
|
||
|
Deferred Tooling Revenue
|
||||||||
|
Accrued expenses
|
$
|
5,419
|
|
$
|
2,908
|
|
||
|
Other non-current liabilities
|
2,593
|
|
1,266
|
|
||||
|
Total deferred tooling revenue
|
$
|
8,012
|
|
$
|
4,174
|
|
||
Impairment of Long-Lived Assets and Investments
In accordance with ASC 360 entitled "Property, Plant and Equipment", management evaluates the recoverability and estimated remaining lives of long-lived assets. The company reviews long-lived assets for impairment whenever facts and circumstances suggest that the carrying value of the assets may not be recoverable or the useful life has changed.
When facts and circumstances indicate that there may have been a loss in value, management will also evaluate its cost method investments to determine whether there was an other-than-temporary impairment. If a loss in the value of the investment is determined to be other than temporary, then the decline in value is recognized as a loss. See Note 9, "Investment in Unconsolidated Affiliate" and Note 2, "Restructuring," for discussion of investment impairment.
Foreign Currency Transactions and Translation
We have wholly-owned foreign subsidiaries with operations in Mexico whose functional currency is the peso. In addition, we have operations with U.S. dollar functional currencies with transactions denominated in pesos and other currencies. These operations had monetary assets and liabilities that were denominated in currencies that were different than their functional currency and were translated into the functional currency of the entity using the exchange rate in effect at the end of each accounting period. Any gains and losses recorded as a result of the remeasurement of monetary assets and liabilities into the functional currency are reflected as transaction gains and losses and included in other expense, net in the consolidated income statements. We had foreign currency transaction losses of
$0.4 million
,
$1.2 million
and
$1.0 million
for the years ended
December 31
,
2016
,
2015
and
2014
, respectively, which are included in other expense, net in the consolidated income statements. In addition, we have a minority investment in India that has a functional currency of the Indian rupee.
When our foreign subsidiaries translate their financial statements from the functional currency to the reporting currency, the balance sheet accounts are translated using the exchange rates in effect at the end of the accounting period and retained earnings is translated using historical rates. The income statement accounts are generally translated at the weighted average of exchange rates during the period and the cumulative effect of translation is recorded as a separate component of accumulated other comprehensive income (loss) in shareholders' equity, as reflected in the consolidated statements of shareholders' equity. The value of the Mexican peso decreased by
19 percent
in relation to the U.S. dollar in
2016
.
47
Revenue Recognition
Sales of products and any related costs are recognized when title and risk of loss transfers to the purchaser, generally upon shipment. Tooling reimbursement revenues related to initial tooling reimbursed by our customers are deferred and recognized over the expected life of the wheel program on a straight line basis, as discussed above.
Research and Development
Research and development costs (primarily engineering and related costs) are expensed as incurred and are included in cost of sales in the consolidated income statements. Amounts expensed during each of the three years in the period ended
2016
,
2015
and
2014
were
$3.8 million
,
$2.6 million
and
$4.4 million
, respectively.
Value-Added Taxes
Value-added taxes that are collected from customers and remitted to taxing authorities are excluded from sales and cost of sales.
Stock-Based Compensation
We account for stock-based compensation using the estimated fair value recognition method in accordance with U.S. GAAP. We recognize these compensation costs net of the applicable forfeiture rate and recognize the compensation costs for only those shares expected to vest on a straight-line basis over the requisite service period of the award, which is generally the vesting term of three to four years. We estimate the forfeiture rate based on our historical experience. See Note 15 - Stock-Based Compensation for additional information concerning our share-based compensation awards.
Income Taxes
We account for income taxes using the asset and liability method. The asset and liability method requires the recognition of deferred tax assets and liabilities for expected future tax consequences of temporary differences that currently exist between the tax basis and financial reporting basis of our assets and liabilities. We calculate current and deferred tax provisions based on estimates and assumptions that could differ from actual results reflected on the income tax returns filed during the following years. Adjustments based on filed returns are recorded when identified in the subsequent years.
The effect on deferred taxes for a change in tax rates is recognized in income in the period that the tax rate change is enacted. In assessing the realizability of deferred tax assets, we consider whether it is more likely than not that some portion of the deferred tax assets will not be realized. A valuation allowance is provided for deferred income tax assets when, in our judgment, based upon currently available information and other factors, it is more likely than not that all or a portion of such deferred income tax assets will not be realized. The determination of the need for a valuation allowance is based on an on-going evaluation of current information including, among other things, historical operating results, estimates of future earnings in different taxing jurisdictions and the expected timing of the reversals of temporary differences. We believe that the determination to record a valuation allowance to reduce a deferred income tax asset is a significant accounting estimate because it is based, among other things, on an estimate of future taxable income in the U.S. and certain other jurisdictions, which is susceptible to change and may or may not occur, and because the impact of adjusting a valuation allowance may be material.
In determining when to release the valuation allowance established against our net deferred income tax assets, we consider all available evidence, both positive and negative. Consistent with our policy, the valuation allowance against our net deferred income tax assets will not be reversed until such time as we have generated three years of cumulative pre-tax income and have reached sustained profitability, which we define as two consecutive one year periods of pre-tax income.
We account for uncertain tax positions utilizing a two-step approach to evaluate tax positions. Step one, recognition, requires evaluation of the tax position to determine if based solely on technical merits it is more likely than not to be sustained upon examination. Step two, measurement, is addressed only if a position is more likely than not to be sustained. In step two, the tax benefit is measured as the largest amount of benefit, determined on a cumulative probability basis, which is more-likely-than-not to be realized upon ultimate settlement with tax authorities. If a position does not meet the more-likely-than-not threshold for recognition in step one, no benefit is recorded until the first subsequent period in which the more likely than not standard is met, the issue is resolved with the taxing authority, or the statute of limitations expires. Positions previously recognized are derecognized when we subsequently determine the position no longer is more likely than not to be sustained. Evaluation of tax positions, their technical merits, and measurements using cumulative probability are highly subjective management estimates. Actual results could differ materially from these estimates.
48
Presently, we have not recorded a deferred tax liability for temporary differences related to investments in foreign subsidiaries that are essentially permanent in duration. These temporary differences may become taxable upon a repatriation of earnings from the subsidiaries or a sale or liquidation of the subsidiaries. At this time the company does not have any plans to repatriate income from its foreign subsidiaries.
Earnings Per Share
As summarized below, basic earnings per share is computed by dividing net income for the period by the weighted average number of common shares outstanding for the period. For purposes of calculating diluted earnings per share, net income is divided by the total of the weighted average shares outstanding plus the dilutive effect of our outstanding stock options under the treasury stock method, which includes consideration of stock-based compensation required by U.S. GAAP.
|
Year Ended December 31,
|
2016
|
2015
|
2014
|
|||||||||
|
(Dollars in thousands, except per share amounts)
|
|
|
|
|||||||||
|
Basic Earnings Per Share
|
|
|
|
|||||||||
|
Reported net income
|
$
|
41,381
|
|
$
|
23,944
|
|
$
|
8,803
|
|
|||
|
Weighted average shares outstanding
|
25,439
|
|
26,599
|
|
26,908
|
|
||||||
|
Basic earnings per share
|
$
|
1.63
|
|
$
|
0.90
|
|
$
|
0.33
|
|
|||
|
Diluted Earnings Per Share
|
|
|
||||||||||
|
Reported net income
|
$
|
41,381
|
|
$
|
23,944
|
|
$
|
8,803
|
|
|||
|
Weighted average shares outstanding
|
25,439
|
|
26,599
|
|
26,908
|
|
||||||
|
Weighted average dilutive stock options
|
100
|
|
34
|
|
112
|
|
||||||
|
Weighted average shares outstanding - diluted
|
25,539
|
|
26,633
|
|
27,020
|
|
||||||
|
Diluted earnings per share
|
$
|
1.62
|
|
$
|
0.90
|
|
$
|
0.33
|
|
|||
The following potential shares of common stock were excluded from the diluted earnings per share calculations because they would have been anti-dilutive due to their exercise prices exceeding the average market prices for the respective periods: for the year ended
December 31
,
2016
no options to purchase were excluded; for the year ended
December 31
,
2015
options to purchase
147,150
shares at prices ranging from
$21.84
to
$22.57
; and for the year ended
December 31
,
2014
options to purchase
985,677
shares at prices ranging from
$22.57
to
$43.22
. In addition, the performance shares discussed in Note 15, "Stock-Based Compensation" are not included in the diluted income per share because the performance metrics had not been met as of the year ended
December 31
,
2016
.
New Accounting Pronouncements
In May 2014 the FASB issued ASU 2014-09, Revenue from Contracts with Customers. This update outlines a single, comprehensive model for accounting for revenue from contracts with customers. We plan to adopt this update on January 1, 2018. The guidance permits two methods of adoption: retrospectively to each prior reporting period presented (full retrospective method), or retrospectively with the cumulative effect of initially applying the guidance recognized at the date of initial application (modified retrospective method). We anticipate adopting the standard using the modified retrospective method. There may be differences in timing of revenue recognition under the new standard compared to recognition under ASC 605 - Revenue Recognition.
In July 2015, the FASB issued an ASU entitled
“Simplifying the Measurement of Inventory.” The ASU replaces the current lower of cost or market test with a lower of cost or net realizable value test when cost is determined on a first-in, first-out or average cost basis. The standard is effective for public entities for annual reporting periods beginning after December 15, 2016, and interim periods therein. It is to be applied prospectively and early adoption is permitted. We are evaluating the impact this guidance will have on our financial position and statement of operations.
In February of 2016, the FASB issued ASU 2016-02, Leases (Topic 842) ("ASU 2016-02"). ASU 2016-02 requires an entity to recognize right-of-use assets and lease liabilities on its balance sheet and disclose key information about leasing arrangements. ASU 2016-02 offers specific accounting guidance for a lessee, a lessor and sale and leaseback transactions. Lessees and lessors are required to disclose qualitative and quantitative information about leasing arrangements to enable a user of the financial statements to assess the amount, timing and uncertainty of cash flows arising from leases. For public companies, ASU 2016-02
49
is effective for annual reporting periods beginning after December 15, 2018, including interim periods within that reporting period, and requires a modified retrospective adoption, with early adoption permitted. We are evaluating the impact this guidance will have on our financial position and statement of operations.
In March 2016, the FASB issued an ASU entitled "Stock Compensation (Topic 718): Improvements to Employee Share-Based Payment Accounting." The objective of the ASU is to simplify several aspects of the accounting for employee share-based payment transactions, including the income tax consequences, classification of awards as either equity or liabilities, and classification on the statement of cash flows. This ASU is effective for fiscal years beginning after December 15, 2016, including interim periods within those fiscal years. Early adoption is permitted. We are evaluating the impact this guidance will have on our financial position and statement of operations.
In August 2016, the FASB issued an ASU entitled "Statement of Cash Flows (Topic 740): Classification of Certain Cash Receipts and Cash Payments." The objective of the ASU is to address the diversity in practice in the presentation of certain cash receipts and cash payments in the statement of cash flows. This ASU is effective for fiscal years beginning after December 15, 2017, including interim periods within those fiscal years. Early adoption is permitted. We are evaluating the impact this guidance will have on our statement of cash flows.
In October 2016, the FASB issued an ASU entitled "Income Taxes (Topic 230): Intra-Entity Transfers of Assets Other than Inventory." The objective of the ASU is to improve the accounting for the income tax consequences of intra-entity transfers of assets other than inventory. This ASU is effective for fiscal years beginning after December 15, 2016, including interim periods within those fiscal years. Early adoption is permitted. We are evaluating the impact this guidance will have on our financial position and statement of operations.
In November 2016, the FASB issued an ASU entitled "Statement of Cash Flows (Topic 230): Restricted Cash." The objective of the ASU is to address the diversity in practice that exists in the classification and presentation of changes in restricted cash on the statement of cash flows. This ASU is effective for fiscal years beginning after December 15, 2017, including interim periods within those fiscal years. Early adoption is permitted. We are evaluating the impact this guidance will have on our statement of cash flows.
In January 2017, the FASB issued an ASU entitled "Intangibles - Goodwill and Other (Topic 350): Simplifying the Test for Goodwill Impairment." The objective of the ASU is to simplify how an entity is required to test goodwill for impairment by eliminating Step 2 from the goodwill impairment test. Step 2 measures a goodwill impairment loss by comparing the implied fair value of a reporting unit’s goodwill with the carrying amount of that goodwill. This ASU is effective for fiscal years beginning after December 15, 2019, including interim periods within those fiscal years. Early adoption is permitted. We are evaluating the impact this guidance will have on our financial position and statement of operations.
During 2014, we completed a review of initiatives to reduce costs and enhance our competitive position. Based on this review, we committed to a plan to close operations at our Rogers, Arkansas facility, which was completed during the fourth quarter of 2014. The action was undertaken in order to reduce costs and enhance our global competitive position. D
uring 2016, we sold the Rogers facility for total proceeds of
$4.3 million
, resulting in a
$1.4 million
gain on sale, which is recorded as a reduction to selling, general and administrative expense in the consolidated income statements.
The total cost incurred as a result of the Rogers facility closure was
$15.9 million
, of which
$1.5 million
,
$6.0 million
and
$8.4 million
was recognized as of December 31, 2016, 2015 and 2014, respectively.
The following table summarizes the Rogers, Arkansas plant closure costs and classification in the consolidated income statement for the years ended December 31, 2016, 2015 and 2014:
50
|
Year Ended December 31, 2016
|
Year Ended December 31, 2015
|
Year Ended December 31, 2014
|
Total Costs
|
Classification
|
|||||||||||||
|
(Dollars in thousands)
|
|||||||||||||||||
|
Accelerated and other depreciation of assets idled
(1)
|
$
|
248
|
|
$
|
1,641
|
|
$
|
5,365
|
|
$
|
7,254
|
|
Cost of sales, Restructuring costs
|
||||
|
Severance costs
(2)
|
—
|
|
114
|
|
1,897
|
|
2,011
|
|
Cost of sales, Restructuring costs
|
||||||||
|
Equipment removal and impairment, inventory written-down, lease termination and other costs
(3)
|
1,210
|
|
4,257
|
|
1,167
|
|
6,634
|
|
Cost of sales, Restructuring costs
|
||||||||
|
Total restructuring costs included in cost of sales
|
1,458
|
|
6,012
|
|
8,429
|
|
15,899
|
|
|||||||||
|
Gain on sale of the facility
|
(1,436
|
)
|
—
|
|
—
|
|
$
|
(1,436
|
)
|
Selling, general and administrative expense
|
|||||||
|
$
|
22
|
|
$
|
6,012
|
|
$
|
8,429
|
|
$
|
14,463
|
|
||||||
(1)
Cost of sales includes accelerated depreciation due to shorter useful lives for assets to be retired after operations ceased at the Rogers facility.
(2)
The closure resulted in a reduction of workforce of approximately 500 employees and a shift in production to other facilities.
(3)
We incurred other associated costs such as moving costs, impairment of assets and other closing costs. In 2016, the majority of the costs related to closing, maintenance and other costs. In 2015, we determined that some of the assets would not ultimately be transferred to other facilities and recorded a
$2.7 million
impairment. In 2014, the majority of the restructuring costs related to inventory write-downs, moving costs and other costs.
Changes in the accrued expenses related to restructuring liabilities during the years ended December 31, 2016 and 2015 were less than
$0.1 million
.
In addition, other measures in 2014 were taken to reduce costs including the sale of the company's two aircraft. One airplane was sold for cash in September 2014, incurring a
$0.2 million
loss on sale and the other airplane was impaired
$1.1 million
at the end of 2014 and subsequently sold in February 2015. The impairment of
$1.1 million
was included in selling, general and administrative expense in the consolidated income statement
for the year ended
December 31
, 2014.
The company applies fair value accounting for all financial assets and liabilities and non-financial assets and liabilities that are recognized or disclosed at fair value in the financial statements on a recurring basis, while other assets and liabilities are measured at fair value on a nonrecurring basis, such as when we have an asset impairment. Fair value is estimated by applying the following hierarchy, which prioritizes the inputs used to measure fair value into three levels and bases the categorization within the hierarchy upon the lowest level of input that is available and significant to the fair value measurement:
Level 1 – Quoted prices in active markets for identical assets or liabilities.
Level 2 – Observable inputs other than quoted prices in active markets for identical assets and liabilities, quoted prices for identical or similar assets or liabilities in inactive markets, or other inputs that are observable or can be corroborated by observable market data for substantially the full term of the assets or liabilities.
Level 3 – Inputs that are generally unobservable and typically reflect management’s estimate of assumptions that market participants would use in pricing the asset or liability.
The carrying amounts for cash and cash equivalents, investments in certificates of deposit, accounts receivable, accounts payable and accrued expenses approximate their fair values due to the short period of time until maturity.
51
Cash and Cash Equivalents
Included in cash and cash equivalents are highly liquid investments that are readily convertible to known amounts of cash, and which are subject to an insignificant risk of change in value due to interest rate, quoted price or penalty on withdrawal. A debt security is classified as a cash equivalent if it meets these criteria and if it has a remaining time to maturity of three months or less from the date of acquisition. Amounts on deposit and available upon demand, or negotiated to provide for daily liquidity without penalty, are classified as cash and cash equivalents. Time deposits, certificates of deposit and money market accounts that meet the above criteria are reported at par value on our balance sheet and are excluded from the table below.
Derivative Financial Instruments
Our derivatives are over-the-counter customized derivative transactions and are not exchange traded. We estimate the fair value of these instruments using industry-standard valuation models such as a discounted cash flow. These models project future cash flows and discount the future amounts to a present value using market-based expectations for interest rates, foreign exchange rates, commodity prices and the contractual terms of the derivative instruments. The discount rate used is the relevant interbank deposit rate (e.g., LIBOR) plus an adjustment for non-performance risk. In certain cases, market data may not be available and we may use broker quotes and models (e.g., Black-Scholes) to determine fair value. This includes situations where there is lack of liquidity for a particular currency or commodity or when the instrument is longer dated.
Cash Surrender Value
The cash surrender value of the life insurance policies is the sum of money the insurance company will pay to the company in the event the policy is voluntarily terminated before its maturity or the insured event occurs. Over the term of the life insurance contracts, the cash surrender value changes as a result of premium payments and investment income offset by investment losses, charges and miscellaneous fees. The amount of the asset recorded for the investment in the life insurance contracts is equal to the cash surrender value which is the amount that will be realized under the contract as of the balance sheet date if the insured event occurs.
The following tables categorize items measured at fair value at
December 31
,
2016
and
2015
:
|
Fair Value Measurement at Reporting Date Using
|
|||||||||||||||
|
Quoted Prices
|
Significant Other
|
Significant
|
|||||||||||||
|
in Active Markets
|
Observable
|
Unobservable
|
|||||||||||||
|
for Identical Assets
|
Inputs
|
Inputs
|
|||||||||||||
|
December 31, 2016
|
(Level 1)
|
(Level 2)
|
(Level 3)
|
||||||||||||
|
(Dollars in thousands)
|
|||||||||||||||
|
Assets
|
|||||||||||||||
|
Certificates of deposit
|
$
|
750
|
|
$
|
—
|
|
$
|
750
|
|
$
|
—
|
|
|||
|
Cash surrender value
|
7,480
|
|
—
|
|
7,480
|
|
—
|
|
|||||||
|
Derivative contracts
|
13
|
|
—
|
|
13
|
|
—
|
|
|||||||
|
Total
|
8,243
|
|
—
|
|
8,243
|
|
—
|
|
|||||||
|
Liabilities
|
|||||||||||||||
|
Derivative contracts
|
24,773
|
|
—
|
|
24,773
|
|
—
|
|
|||||||
|
Total
|
$
|
24,773
|
|
$
|
—
|
|
$
|
24,773
|
|
$
|
—
|
|
|||
52
|
Fair Value Measurement at Reporting Date Using
|
|||||||||||||||
|
Quoted Prices
|
Significant Other
|
Significant
|
|||||||||||||
|
in Active Markets
|
Observable
|
Unobservable
|
|||||||||||||
|
for Identical Assets
|
Inputs
|
Inputs
|
|||||||||||||
|
December 31, 2015
|
(Level 1)
|
(Level 2)
|
(Level 3)
|
||||||||||||
|
(Dollars in thousands)
|
|||||||||||||||
|
Assets
|
|||||||||||||||
|
Certificates of deposit
|
$
|
950
|
|
$
|
—
|
|
$
|
950
|
|
$
|
—
|
|
|||
|
Cash surrender value
|
6,923
|
|
—
|
|
6,923
|
|
—
|
|
|||||||
|
Derivative contracts
|
113
|
|
—
|
|
113
|
|
—
|
|
|||||||
|
Total
|
7,986
|
|
—
|
|
7,986
|
|
—
|
|
|||||||
|
Liabilities
|
|||||||||||||||
|
Derivative contracts
|
14,159
|
|
—
|
|
14,159
|
|
—
|
|
|||||||
|
Total
|
$
|
14,159
|
|
$
|
—
|
|
$
|
14,159
|
|
$
|
—
|
|
|||
We use derivatives to partially offset our business exposure to foreign currency risk. We may enter into forward contracts, option contracts, swaps, collars or other derivative instruments to offset some of the risk on expected future cash flows and on certain existing assets and liabilities. However, we may choose not to hedge certain exposures for a variety of reasons including, but not limited to, accounting considerations and the prohibitive economic cost of hedging particular exposures. There can be no assurance the hedges will offset more than a portion of the financial impact resulting from movements in foreign currency exchange rates.
To help protect gross margins from fluctuations in foreign currency exchange rates, certain of our subsidiaries whose functional currency is the U.S. dollar hedge a portion of forecasted foreign currency costs. Generally, we may hedge portions of our forecasted foreign currency exposure associated with costs, typically for up to
36 months
.
We record all derivatives in the consolidated balance sheets at fair value. Our accounting treatment for these instruments is based on the hedge designation. The effective portions of cash flow hedges are recorded in AOCI until the hedged item is recognized in earnings. The ineffective portions of cash flow hedges are recorded in cost of sales. Derivatives that are not designated as hedging instruments are adjusted to fair value through earnings in the financial statement line item to which the derivative relates. All derivatives were designated as hedging instruments at December 31, 2016 and 2015.
Deferred gains and losses associated with cash flow hedges of foreign currency costs are recognized as a component of cost of sales in the same period as the related cost is recognized. Our foreign currency transactions hedged with cash flow hedges as of
December 31
,
2016
, are expected to occur within
1 month
to
36 months
.
Derivative instruments designated as cash flow hedges must be de-designated as hedges when it is probable the forecasted hedged transaction will not occur in the initially identified time period or within a subsequent two-month time period. Deferred gains and losses in AOCI associated with such derivative instruments are reclassified immediately into other expense. Any subsequent changes in fair value of such derivative instruments are reflected in other expense unless they are re-designated as hedges of other transactions.
We had no gains or losses recognized in other expense for foreign currency forward and option contracts not designated as hedging instruments during 2016, 2015 and 2014.
53
The following tables display the fair value of derivatives by balance sheet line item:
|
December 31, 2016
|
Other Current Assets
|
Accrued Expenses
|
Other Non-current Liabilities
|
||||||
|
(Dollars in thousands)
|
|||||||||
|
Foreign exchange forward contracts and collars designated as hedging instruments
|
$
|
13
|
|
$
|
10,076
|
|
$
|
14,697
|
|
|
Total derivative financial instruments
|
$
|
13
|
|
$
|
10,076
|
|
$
|
14,697
|
|
|
December 31, 2015
|
Other Current Assets
|
Accrued Expenses
|
Other Non-current Liabilities
|
||||||
|
(Dollars in thousands)
|
|||||||||
|
Foreign exchange forward contracts and collars designated as hedging instruments
|
$
|
113
|
|
$
|
9,629
|
|
$
|
4,530
|
|
|
Total derivative financial instruments
|
$
|
113
|
|
$
|
9,629
|
|
$
|
4,530
|
|
The following tables summarize the notional amount and estimated fair value of our derivative financial instruments:
|
December 31, 2016
|
Notional U.S. Dollar Amount
|
Fair Value
|
||||
|
(Dollars in thousands)
|
||||||
|
Foreign currency forward contracts and collars designated as hedging instruments
|
$
|
160,461
|
|
$
|
24,760
|
|
|
Total derivative financial instruments
|
$
|
160,461
|
|
$
|
24,760
|
|
|
December 31, 2015
|
Notional U.S. Dollar Amount
|
Fair Value
|
||||
|
(Dollars in thousands)
|
||||||
|
Foreign exchange forward contracts and collars designated as hedging instruments
|
$
|
162,590
|
|
$
|
14,046
|
|
|
Total derivative financial instruments
|
$
|
162,590
|
|
$
|
14,046
|
|
Notional amounts are presented on a gross basis. The notional amounts of the derivative financial instruments do not represent amounts exchanged by the parties and, therefore, are not a direct measure of our exposure to the financial risks described above. The amounts exchanged are calculated by reference to the notional amounts and by other terms of the derivatives, such as interest rates, foreign currency exchange rates or commodity volumes and prices.
The following tables provide the impact of derivative instruments designated as cash flow hedges on our consolidated income statement:
|
Year Ended December 31, 2016
|
Amount of Gain or (Loss) Recognized in AOCI on Derivatives, net of tax (Effective Portion)
|
Amount of Pre-tax Gain or (Loss) Reclassified from AOCI into Income (Effective Portion)
|
Amount of Pre-tax Gain or (Loss) Recognized in Income on Derivatives (Ineffective Portion and Amount Excluded from Effectiveness Testing)
|
||||||
|
(Dollars in thousands)
|
|||||||||
|
Foreign exchange forward contracts and collars
|
$
|
(6,812
|
)
|
$
|
(13,597
|
)
|
$
|
(156
|
)
|
|
Total
|
$
|
(6,812
|
)
|
$
|
(13,597
|
)
|
$
|
(156
|
)
|
54
|
Year Ended December 31, 2015
|
Amount of Gain or (Loss) Recognized in AOCI on Derivatives, net of tax (Effective Portion)
|
Amount of Pre-tax Gain or (Loss) Reclassified from AOCI into Income (Effective Portion)
|
Amount of Pre-tax Gain or (Loss) Recognized in Income on Derivatives (Ineffective Portion and Amount Excluded from Effectiveness Testing)
|
||||||
|
(Dollars in thousands)
|
|||||||||
|
Foreign exchange forward contracts and collars
|
$
|
(4,524
|
)
|
$
|
(9,960
|
)
|
$
|
19
|
|
|
Total
|
$
|
(4,524
|
)
|
$
|
(9,960
|
)
|
$
|
19
|
|
The company's CEO is the chief operating decision maker ("CODM") because he has final authority over performance assessment and resource allocation decisions. The CODM evaluates both consolidated and disaggregated financial information for each of the company's business units in deciding how to allocate resources and assess performance. Each manufacturing facility manufactures the same products, ships products to the same group of customers, utilizes the same cast manufacturing process and, as a result, production can generally be transferred among our facilities. Accordingly, we operate as a single integrated business and, as such, have only one operating segment - automotive wheels.
|
Geographic information
|
||||||||||||
|
Net sales by geographic location is the following:
|
||||||||||||
|
Year Ended December 31,
|
2016
|
2015
|
2014
|
|||||||||
|
(Dollars in thousands)
|
|
|
|
|||||||||
|
Net sales:
|
|
|
|
|||||||||
|
U.S.
|
$
|
120,395
|
|
$
|
177,198
|
|
$
|
261,478
|
|
|||
|
Mexico
|
612,282
|
|
550,748
|
|
483,969
|
|
||||||
|
Consolidated net sales
|
$
|
732,677
|
|
$
|
727,946
|
|
$
|
745,447
|
|
|||
|
Long Lived Assets
|
||||||||||
|
Long-lived assets includes property, plant and equipment, net, by geographic location as follows:
|
||||||||||
|
December 31,
|
|
2016
|
2015
|
|||||||
|
(Dollars in thousands)
|
|
|
|
|||||||
|
Property, plant and equipment, net:
|
|
|
|
|||||||
|
U.S.
|
|
$
|
37,795
|
|
$
|
44,274
|
|
|||
|
Mexico
|
|
189,608
|
|
190,372
|
|
|||||
|
Consolidated property, plant and equipment, net
|
|
$
|
227,403
|
|
$
|
234,646
|
|
|||
|
December 31,
|
2016
|
2015
|
||||||
|
(Dollars in thousands)
|
|
|
||||||
|
Trade receivables
|
$
|
91,213
|
|
$
|
103,202
|
|
||
|
Other receivables
|
9,037
|
|
10,253
|
|
||||
|
|
100,250
|
|
113,455
|
|
||||
|
Allowance for doubtful accounts
|
(919
|
)
|
(867
|
)
|
||||
|
Accounts receivable, net
|
$
|
99,331
|
|
$
|
112,588
|
|
||
55
The following percentages of our consolidated net sales were made to Ford, GM, Toyota and Fiat Chrysler Automobiles:
2016
-
38 percent
,
30 percent
,
14 percent
and
6 percent
, respectively;
2015
-
44 percent
,
24 percent
,
14 percent
and
8 percent
, respectively; and
2014
-
44 percent
,
24 percent
,
12 percent
and
10 percent
, respectively.
The accounts receivable from GM, Ford and Toyota at
December 31
,
2016
represented approximately
39 percent
,
32 percent
and
14 percent
, respectively of the total accounts receivables. The accounts receivable from Ford, GM and Toyota at
December 31
,
2015
, represented approximately
35 percent
,
27 percent
and
13 percent
, respectively of the total accounts receivables.
|
December 31,
|
2016
|
2015
|
|||||
|
(Dollars in thousands)
|
|
|
|||||
|
Raw materials
|
$
|
40,255
|
|
$
|
19,148
|
|
|
|
Work in process
|
21,447
|
|
21,063
|
|
|||
|
Finished goods
|
21,135
|
|
21,558
|
|
|||
|
Inventories
|
$
|
82,837
|
|
$
|
61,769
|
|
|
Service wheel and supplies inventory included in other non-current assets in the consolidated balance sheets totaled
$6.5 million
and
$6.9 million
at
December 31
,
2016
and
2015
, respectively. Included in raw materials were operating supplies and spare parts totaling
$10.3 million
and
$9.2 million
at
December 31
,
2016
and
2015
, respectively.
|
December 31,
|
2016
|
2015
|
|||||
|
(Dollars in thousands)
|
|
|
|||||
|
Land and buildings
|
$
|
67,915
|
|
$
|
73,803
|
|
|
|
Machinery and equipment
|
485,185
|
|
486,612
|
|
|||
|
Leasehold improvements and others
|
4,868
|
|
4,204
|
|
|||
|
Construction in progress
|
26,301
|
|
20,455
|
|
|||
|
|
584,269
|
|
585,074
|
|
|||
|
Accumulated depreciation
|
(356,866
|
)
|
(350,428
|
)
|
|||
|
Property, plant and equipment, net
|
$
|
227,403
|
|
$
|
234,646
|
|
|
Depreciation expense was
$34.3 million
,
$34.5 million
and
$35.6 million
for the years ended
December 31
,
2016
,
2015
and
2014
, respectively. In 2014, depreciation expense includes
$6.5 million
of accelerated depreciation charges as a result of shortened estimated useful lives due to restructuring activities described in Note 2, "Restructuring".
On June 28, 2010, we executed a share subscription agreement (the "Agreement") with Synergies, a private aluminum wheel manufacturer based in Visakhapatnam, India, providing for our acquisition of a minority interest in Synergies. The total cash investment in Synergies amounted to
$4.5 million
, representing
12.6 percent
of the outstanding equity shares of Synergies. Our Synergies investment is accounted for using the cost method. During 2011, a group of existing equity holders, including the company, made a loan of
$1.5 million
to Synergies for working capital needs. The company's share of this unsecured advance was
$0.5 million
. The remaining principal balance of the unsecured advance was paid in full during the first quarter of
2015
.
In October 2014, a typhoon caused significant damage to the facilities and operations of Synergies, and in the fourth quarter of 2014, we tested the
$4.5 million
carrying value of our investment for impairment. Based on our evaluation, we determined there was an other-than-temporary impairment and wrote the investment down to its estimated fair value of
$2.0 million
, with the
$2.5 million
loss recognized in income for the year ended
December 31
, 2014. The valuation was based on an income approach using current financial forecast data, and rates and assumptions market participants would use in pricing the investment. There was no further impairment in 2016 and 2015.
56
Income before income taxes from domestic and international jurisdictions is comprised of the following:
|
Year Ended December 31,
|
2016
|
2015
|
2014
|
|||||||||
|
(Dollars in thousands)
|
|
|
|
|||||||||
|
Income before income taxes:
|
|
|
|
|||||||||
|
Domestic
|
$
|
18,499
|
|
$
|
25,069
|
|
$
|
8,328
|
|
|||
|
Foreign
|
36,222
|
|
10,214
|
|
7,374
|
|
||||||
|
|
$
|
54,721
|
|
$
|
35,283
|
|
$
|
15,702
|
|
|||
The provision for income taxes is comprised of the following:
|
Year Ended December 31,
|
2016
|
2015
|
2014
|
|||||||||
|
(Dollars in thousands)
|
|
|
|
|||||||||
|
Current taxes
|
|
|
|
|||||||||
|
Federal
|
$
|
(5,017
|
)
|
$
|
(10,900
|
)
|
$
|
(2,976
|
)
|
|||
|
State
|
450
|
|
481
|
|
(453
|
)
|
||||||
|
Foreign
|
(10,639
|
)
|
(2,099
|
)
|
(8,660
|
)
|
||||||
|
Total current taxes
|
(15,206
|
)
|
(12,518
|
)
|
(12,089
|
)
|
||||||
|
Deferred taxes
|
|
|
|
|
||||||||
|
Federal
|
(1,199
|
)
|
(961
|
)
|
657
|
|
||||||
|
State
|
(332
|
)
|
(576
|
)
|
(109
|
)
|
||||||
|
Foreign
|
3,397
|
|
2,716
|
|
4,642
|
|
||||||
|
Total deferred taxes
|
1,866
|
|
1,179
|
|
5,190
|
|
||||||
|
Income tax provision
|
$
|
(13,340
|
)
|
$
|
(11,339
|
)
|
$
|
(6,899
|
)
|
|||
The following is a reconciliation of the U.S. federal tax rate to our effective income tax rate:
|
Year Ended December 31,
|
2016
|
2015
|
2014
|
|||||
|
Statutory rate
|
(35.0
|
)%
|
(35.0
|
)%
|
(35.0
|
)%
|
||
|
State tax provisions, net of federal income tax benefit
|
(6.3
|
)
|
3.8
|
|
(0.5
|
)
|
||
|
Permanent differences
|
(0.8
|
)
|
(1.5
|
)
|
(5.3
|
)
|
||
|
Tax credits
|
0.6
|
|
0.9
|
|
2.8
|
|
||
|
Foreign income taxes at rates other than the statutory rate
|
11.7
|
|
2.3
|
|
(0.5
|
)
|
||
|
Valuation allowance and other
|
5.1
|
|
(5.6
|
)
|
(8.4
|
)
|
||
|
Changes in tax liabilities, net
|
0.5
|
|
6.4
|
|
4.2
|
|
||
|
Share based compensation
|
(1.2
|
)
|
(4.4
|
)
|
—
|
|
||
|
Other
|
1.0
|
|
1.0
|
|
(1.2
|
)
|
||
|
Effective income tax rate
|
(24.4
|
)%
|
(32.1
|
)%
|
(43.9
|
)%
|
||
Our effective income tax rate for 2016 was
24.4 percent
. The effective tax rate was lower than the U.S. federal statutory rate primarily as a result of income in jurisdictions where the statutory rate is lower than the U.S. rate and tax benefits due to the release of tax liabilities related to uncertain tax positions.
Our effective income tax rate for 2015 was
32.1 percent
. The effective tax rate was lower than the U.S. federal statutory rate primarily as a result of net decreases in the liability for uncertain tax positions partially offset by the reversal of deferred tax assets related to share-based compensation shortfalls.
57
Our effective income tax rate for 2014 was
43.9 percent
. The effective tax rate was higher than the U.S. federal statutory rate primarily as a result of valuation allowances established for foreign deferred tax assets and various permanent differences including non-deductible expenses related to recent tax law changes in Mexico.
Tax effects of temporary differences that gave rise to significant portions of the deferred tax assets and deferred liabilities are as follows:
|
December 31,
|
2016
|
2015
|
||||||
|
(Dollars in thousands)
|
|
|
||||||
|
Deferred income tax assets:
|
|
|
||||||
|
Accrued liabilities
|
$
|
6,120
|
|
$
|
3,981
|
|
||
|
Hedging and foreign currency losses
|
9,475
|
|
8,469
|
|
||||
|
Deferred compensation
|
11,723
|
|
11,833
|
|
||||
|
Inventory reserves
|
3,563
|
|
3,079
|
|
||||
|
Net loss carryforwards and credits
|
3,123
|
|
5,891
|
|
||||
|
Competent authority deferred tax assets and other foreign timing differences
|
5,135
|
|
4,836
|
|
||||
|
Other
|
462
|
|
(683
|
)
|
||||
|
Total before valuation allowance
|
39,601
|
|
37,406
|
|
||||
|
Valuation allowance
|
(3,123
|
)
|
(5,891
|
)
|
||||
|
Net deferred income tax assets
|
36,478
|
|
31,515
|
|
||||
|
Deferred income tax liabilities:
|
|
|
|
|
||||
|
Property, plant and equipment
|
(11,268
|
)
|
(14,011
|
)
|
||||
|
Deferred income tax liabilities
|
(11,268
|
)
|
(14,011
|
)
|
||||
|
Net deferred income tax assets
|
$
|
25,210
|
|
$
|
17,504
|
|
||
The classification of our net deferred tax asset is shown below:
|
December 31,
|
2016
|
2015
|
||||||
|
(Dollars in thousands)
|
|
|
||||||
|
Long-term deferred income tax assets
|
$
|
28,838
|
|
$
|
25,598
|
|
||
|
Long-term deferred income tax liabilities
|
(3,628
|
)
|
(8,094
|
)
|
||||
|
Net deferred tax asset
|
$
|
25,210
|
|
$
|
17,504
|
|
||
Realization of any of our deferred tax assets at
December 31
,
2016
is dependent on the company generating sufficient taxable income in the future. The determination of whether or not to record a full or partial valuation allowance on our deferred tax assets is a critical accounting estimate requiring a significant amount of judgment on the part of management. In determining when to release the valuation allowance established against our deferred income tax assets, we consider all available evidence, both positive and negative. We perform our analysis on a jurisdiction by jurisdiction basis at the end of each reporting period. The decrease in the valuation allowance of
$2.8 million
relates to the reduction of State net operating loss carryforwards the company is not more likely than not to utilize prior to expiration.
As of
December 31
,
2016
we have cumulative state NOL carryforwards of
$49.1 million
that expire in the years
2017
to
2032
. Also, we have
$0.3 million
of state tax credit carryforwards which expire in the years
2021
to
2024
.
In general, it is our practice and intention to reinvest the earnings of the operations of our non-U.S. subsidiaries. As of December 25, 2016, we have not made a provision for U.S. or additional foreign withholding taxes. The basis difference in our non-U.S. subsidiaries that result from undistributed earnings of approximately
$168.9 million
as these earnings are considered indefinitely reinvested in the non-U.S. subsidiaries. Determination of the deferred income tax liability on the basis differences is not practicable.
58
We account for our uncertain tax positions in accordance with U.S. GAAP. A reconciliation of the beginning and ending amounts of these tax benefits is as follows:
|
Year Ended December 31,
|
2016
|
2015
|
2014
|
|||||||||
|
(Dollars in thousands)
|
||||||||||||
|
Beginning balance
|
$
|
7,318
|
|
$
|
7,193
|
|
$
|
9,462
|
|
|||
|
Increases (decreases) due to foreign currency translations
|
—
|
|
—
|
|
(244
|
)
|
||||||
|
Increases (decreases) as a result of positions taken during:
|
|
|
|
|
||||||||
|
Prior periods
|
(3,872
|
)
|
1,238
|
|
(2,553
|
)
|
||||||
|
Current period
|
—
|
|
1,798
|
|
956
|
|
||||||
|
Settlements with taxing authorities
|
—
|
|
—
|
|
—
|
|
||||||
|
Expiration of applicable statutes of limitation
|
—
|
|
(2,911
|
)
|
(428
|
)
|
||||||
|
Ending balance
(1)
|
$
|
3,446
|
|
$
|
7,318
|
|
$
|
7,193
|
|
|||
(1)
Excludes
$1.8 million
,
$2.1 million
and
$6.4 million
of potential interest and penalties associated with uncertain tax positions in
2016
,
2015
and
2014
, respectively.
Our policy regarding interest and penalties related to uncertain tax positions is to record interest and penalties as an element of income tax expense. The balance sheets at
December 31
,
2016
and
2015
include the liability for uncertain tax positions, cumulative interest and penalties accrued on the liabilities totaling
$5.3 million
and
$7.2 million
, respectively. During
2016
, we reversed certain liabilities related to various jurisdictions in the amount of
$3.9 million
and a net benefit for penalties and interest of
$0.3 million
. Included in the unrecognized tax benefits of
$5.3 million
is
$1.7 million
that, if recognized, would affect our annual effective tax rate. Within the next twelve-month period we expect a decrease in unrecognized tax benefits of
$0.1 million
.
We conduct business internationally and, as a result, one or more of our subsidiaries files income tax returns in U.S. federal, U.S. state and certain foreign jurisdictions. Accordingly, in the normal course of business, we are subject to examination by taxing authorities throughout the world, including, but not limited to Mexico, the Netherlands, Costa Rica, India, Cyprus and the U.S. We are no longer under examination by the taxing authority regarding any U.S. federal income tax returns for years before
2013
while the years open for examination under various state and local jurisdictions vary. In 2014, the Internal Revenue Service ("IRS") completed its audit of the 2011 tax year of Superior Industries International and subsidiaries.
Total income tax payments net of refunds were
$21.9 million
in
2016
,
$12.6 million
in
2015
and
$9.9 million
in
2014
.
We lease certain land, facilities and equipment under long-term operating leases expiring at various dates through 2026. Total lease expense for all operating leases amounted to
$1.9 million
in
2016
,
2015
and
2014
. During 2015, we moved our headquarters from Van Nuys, California to Southfield, MI.
Our former headquarters in Van Nuys, California is leased from the Louis L. Borick Foundation (the "Foundation"). The Foundation is controlled by Mr. Steven J. Borick, the former Chairman and CEO of the company, as President and Director of the Foundation.
The lease provided for annual lease payments of approximately
$427,000
, through March 2015. In November 2014, the lease was amended to extend the lease term from March 2015 to March 2017, and to reduce the amount of office space and annual rent. As amended, beginning April 2015, the annual lease payment is approximately
$225,000
. The future minimum lease payments that are payable to the Foundation for the Van Nuys administrative office lease total
$0.1 million
. Total lease payments to these related entities were
$0.2 million
,
$0.3 million
and
$0.4 million
for
2016
,
2015
and
2014
, respectively. We also have a lease for our headquarters in Southfield, Michigan from October 2015 to September 2026 which is with an unrelated party.
59
The following are summarized future minimum payments under all leases:
|
Year Ended December 31,
|
Operating Leases
|
|||
|
(Dollars in thousands)
|
||||
|
2017
|
$
|
769
|
|
|
|
2018
|
700
|
|
||
|
2019
|
429
|
|
||
|
2020
|
424
|
|
||
|
2021
|
377
|
|
||
|
Thereafter
|
1,791
|
|
||
|
|
$
|
4,490
|
|
|
Purchase Agreement
In the first quarter of 2015, we entered into an agreement to purchase a subscription to online software provided by New Generation Software Inc. (“NGS”). Our Senior Vice President, Business Operations, is a board member and passive investor and our Vice President of Information Technology is also a passive investor in NGS. We made payments to NGS of
$243,000
and
$351,000
during the 2016 and 2015 fiscal year, respectively. The transaction was entered into in the ordinary course of business and is an arms-length transaction.
We have an unfunded salary continuation plan covering certain directors, officers and other key members of management. We purchase life insurance policies on certain participants to provide in part for future liabilities. Cash surrender value of these policies, totaling
$7.5 million
and
$6.9 million
at
December 31
,
2016
and
2015
, respectively, are included in other non-current assets in the company's consolidated balance sheets. Subject to certain vesting requirements, the plan provides for a benefit based on final average compensation, which becomes payable on the employee's death or upon attaining age
65
, if retired. The plan was closed to new participants effective
February 3, 2011
. We have measured the plan assets and obligations of our salary continuation plan for all periods presented.
The following table summarizes the changes in plan benefit obligations:
|
Year Ended December 31,
|
2016
|
2015
|
||||||
|
(Dollars in thousands)
|
|
|
||||||
|
Change in benefit obligation
|
|
|
||||||
|
Beginning benefit obligation
|
$
|
28,399
|
|
$
|
30,047
|
|
||
|
Service cost
|
—
|
|
44
|
|
||||
|
Interest cost
|
1,216
|
|
1,230
|
|
||||
|
Actuarial gain
|
(464
|
)
|
(1,372
|
)
|
||||
|
Benefit payments
|
(1,539
|
)
|
(1,550
|
)
|
||||
|
Ending benefit obligation
|
$
|
27,612
|
|
$
|
28,399
|
|
||
60
|
Year Ended December 31,
|
2016
|
2015
|
||||||
|
(Dollars in thousands)
|
|
|
||||||
|
Change in plan assets
|
|
|
||||||
|
Fair value of plan assets at beginning of year
|
$
|
—
|
|
$
|
—
|
|
||
|
Employer contribution
|
1,539
|
|
1,550
|
|
||||
|
Benefit payments
|
(1,539
|
)
|
(1,550
|
)
|
||||
|
Fair value of plan assets at end of year
|
$
|
—
|
|
$
|
—
|
|
||
|
Funded Status
|
$
|
(27,612
|
)
|
$
|
(28,399
|
)
|
||
|
Amounts recognized in the consolidated balance sheets consist of:
|
|
|
|
|
||||
|
Accrued expenses
|
(1,177
|
)
|
(1,524
|
)
|
||||
|
Other non-current liabilities
|
(26,435
|
)
|
(26,875
|
)
|
||||
|
Net amount recognized
|
$
|
(27,612
|
)
|
$
|
(28,399
|
)
|
||
|
Amounts recognized in accumulated other comprehensive loss consist of:
|
|
|
|
|
||||
|
Net actuarial loss
|
$
|
5,692
|
|
$
|
6,492
|
|
||
|
Prior service cost
|
(1
|
)
|
(1
|
)
|
||||
|
Net amount recognized, before tax effect
|
$
|
5,691
|
|
$
|
6,491
|
|
||
|
Weighted average assumptions used to determine benefit obligations:
|
|
|
|
|
||||
|
Discount rate
|
4.4
|
%
|
4.4
|
%
|
||||
|
Rate of compensation increase
|
3.0
|
%
|
3.0
|
%
|
||||
Components of net periodic pension cost are described in the following table:
|
Year Ended December 31,
|
2016
|
2015
|
2014
|
|||||||||
|
(Dollars in thousands)
|
|
|
|
|||||||||
|
Components of net periodic pension cost:
|
|
|
|
|||||||||
|
Service cost
|
$
|
—
|
|
$
|
44
|
|
$
|
84
|
|
|||
|
Interest cost
|
1,216
|
|
1,230
|
|
1,171
|
|
||||||
|
Amortization of actuarial loss
|
335
|
|
535
|
|
328
|
|
||||||
|
Net periodic pension cost
|
$
|
1,551
|
|
$
|
1,809
|
|
$
|
1,583
|
|
|||
|
Weighted average assumptions used to determine net periodic pension cost:
|
|
|
|
|
||||||||
|
Discount rate
|
4.4
|
%
|
4.2
|
%
|
4.8
|
%
|
||||||
|
Rate of compensation increase
|
3.0
|
%
|
3.0
|
%
|
3.0
|
%
|
||||||
The decrease in the 2016 net periodic pension cost compared to the 2015 cost was primarily due to decreased amortization of actuarial losses and decreased service cost from terminations and retirements. The increase in the 2015 net periodic pension cost compared to the 2014 cost was primarily due to increased amortization of actuarial losses offset by decreased service cost from terminations and retirements.
61
Benefit payments during the next ten years, which reflect applicable future service, are as follows:
|
Year Ended December 31,
|
Amount
|
||
|
(Dollars in thousands)
|
|
||
|
|
|
||
|
2017
|
$
|
1,203
|
|
|
2018
|
$
|
1,429
|
|
|
2019
|
$
|
1,405
|
|
|
2020
|
$
|
1,461
|
|
|
2021
|
$
|
1,433
|
|
|
Years 2022 to 2026
|
$
|
8,012
|
|
The following is an estimate of the components of net periodic pension cost in
2017
:
|
Estimated Year Ended December 31,
|
2017
|
||
|
(Dollars in thousands)
|
|
|
|
|
|
|
|
|
|
Service cost
|
$
|
—
|
|
|
Interest cost
|
1,189
|
|
|
|
Amortization of actuarial loss
|
270
|
|
|
|
Estimated 2017 net periodic pension cost
|
$
|
1,459
|
|
Other Retirement Plans
We also contribute to employee retirement savings plans in the U.S. and Mexico that cover substantially all of our employees. The employer contribution totaled
$1.4 million
,
$1.5 million
and
$2.0 million
for the three years ended
December 31
,
2016
,
2015
and
2014
, respectively.
|
December 31,
|
2016
|
2015
|
||||||
|
(Dollars in thousands)
|
|
|
||||||
|
Payroll and related benefits
|
$
|
12,766
|
|
$
|
13,538
|
|
||
|
Current portion of derivative liability
|
10,076
|
|
9,629
|
|
||||
|
Dividends
|
5,127
|
|
4,964
|
|
||||
|
Taxes, other than income taxes
|
7,325
|
|
7,354
|
|
||||
|
Deferred tooling revenue
|
5,419
|
|
2,908
|
|
||||
|
Current portion of executive retirement liabilities
|
1,177
|
|
1,524
|
|
||||
|
Other
|
4,425
|
|
6,297
|
|
||||
|
Accrued liabilities
|
$
|
46,315
|
|
$
|
46,214
|
|
||
On December 19, 2014, we entered into a senior secured credit agreement (the "Credit Agreement") with J.P. Morgan Securities LLC, JPMorgan Chase Bank, N.A. (“JPMCB”) and Wells Fargo Bank, National Association (together with JPMCB, the “Lenders”).
The Credit Agreement consists of a senior secured revolving credit facility in an initial aggregate principal amount of
$100.0 million
(the “Facility”). In addition, the company is entitled to request, subject to certain terms and conditions and the agreement of the Lenders, an increase in the aggregate revolving commitments under the Facility or to obtain incremental term loans in an aggregate amount not to exceed
$50.0 million
, which currently is uncommitted to by any Lenders. As of December 31, 2016, the company had
$97.2 million
of availability under the Facility after giving effect to
$2.8 million
in outstanding letters of credit.
62
The Credit Agreement expires on December 19, 2019 and borrowings under the Facility accrue interest at (i) a
London interbank
offered rate plus a margin of between
0.75 percent
and
1.25 percent
based on the total leverage ratio of Superior and its subsidiaries on a consolidated basis, (ii) a rate based on
JPMCB’s prime rate
plus a margin of between
0.00 percent
and
0.25 percent
based on the total leverage ratio of the company and its subsidiaries on a consolidated basis or (iii) a combination thereof. Commitment fees are
0.2 percent
on the unused portion of the facility. The commitment fees are included in our consolidated financial statements line, interest income, net.
Generally, all amounts under the Facility are guaranteed by certain of the U.S. subsidiaries of the company and are secured by a first priority security interest in and lien on the personal property of the company and the U.S. guarantors (as defined in the Credit Agreement) and a pledge of and first perfected security interest in the equity interests of the company’s existing and future U.S. subsidiaries and
65 percent
of the equity interests in certain non-U.S. direct material subsidiaries of the company and the U.S. guarantors under the Facility.
The Credit Agreement contains certain customary restrictive covenants, including, among others, financial covenants requiring the maintenance of a maximum total leverage ratio and a minimum fixed charge coverage ratio, and also includes, without limitation, covenants, in each case with certain exceptions and allowances, limiting the ability of the company and its subsidiaries to incur indebtedness, grant liens, make investments, dispose of assets, make certain restrictive payments, make optional payments and modifications of subordinated debt instruments, enter into certain transactions with affiliates, enter into swap agreements, make capital expenditures or make changes to its lines of business. At
December 31
,
2016
, we were in compliance with all covenants contained in the Credit Agreement. At
December 31
,
2016
and
2015
, we had no borrowings under this facility other than the outstanding letters of credit referred to above.
The Credit Agreement contains customary default provisions, representations and warranties and restrictive covenants. The Credit Agreement also contains a provision permitting the lenders to accelerate the repayment of all loans outstanding under the Facility during an event of default.
2008 Equity Incentive Plan
Our 2008 Equity Incentive Plan, as amended (the "Plan"), authorizes us to issue up to
3.5 million
shares of common stock, along with non-qualified stock options, stock appreciation rights, restricted stock and performance units to our officers, key employees, non-employee directors and consultants. At
December 31
,
2016
, there were
1.8 million
shares available for future grants under this Plan. No more than
600,000
shares may be used under the Plan as “full value” awards, which include restricted stock and performance stock units. It is our policy to issue shares from authorized but not issued shares upon the exercise of stock options.
During the first quarter of 2015, the company implemented a long term incentive program for the benefit of certain members of company management. The program was designed to strengthen employee retention and to provide a more structured incentive program to stimulate improvement in future company results. Per the terms of the program, participants were granted, in 2015 and 2016, time value restricted stock units (“RSUs”), vesting ratably over a three year time period, and performance restricted stock units (“PSUs”), with a three year cliff vesting. Upon vesting, each restricted stock award is exchangeable for one share of the company’s common stock, with accrued dividends. The PSUs are categorized further into three individual categories whose vesting is contingent upon the achievement of certain targets as follows:
|
•
|
40% of the PSUs vest upon certain Return on Invested Capital targets for 2016 and 2015 units
|
|
•
|
40% of the PSUs vest upon certain Cumulative EPS targets for 2016 units
|
|
•
|
40% of the PSUs vest upon certain EBITDA margin targets for 2015 units
|
|
•
|
20% of the PSUs vest upon certain market based Shareholder Return targets for 2016 and 2015 units.
|
Other Awards
During 2014, we granted
132,455
restricted shares, including
50,000
shares vesting April 30, 2017, and
82,455
shares vesting on December 31, 2016 under an Executive Employment Agreement (the "Employment Agreement"). The fair value of each of these restricted shares was
$19.44
. These grants were made outside of the Plan as inducement grants in connection with the appointment of our current CEO and company President. Beginning in 2015, the CEO will be granted restricted stock unit awards each year under Superior's 2008 Equity Incentive Plan, or any successor equity plan. Under the CEO's Employment Agreement, time-vested restricted stock units will be granted each year with cliff vesting at the third fiscal year end following grant. The CEO will also
63
be granted performance-vested restricted stock units each year, vesting based on company performance goals established by the independent compensation committee during the three fiscal years following the grant.
We have elected to adopt the alternative transition method for calculating the initial pool of excess tax benefits and to determine the subsequent impact of the tax effects of employee stock-based compensation awards that are outstanding on shareholders' equity and the consolidated statements of cash flows.
Options
Options are granted at not less than fair market value on the date of grant and expire no later than
ten
years after the date of grant. Options and restricted shares granted under this Plan generally require no less than a
three
year ratable vesting period. Stock option activity in
2016
and
2015
are summarized in the following table:
|
|
Outstanding
|
Weighted
Average
Exercise
Price
|
Remaining
Contractual
Life in Years
|
Aggregate
Intrinsic
Value
|
||||||||
|
Balance at December 31, 2014
|
1,819,444
|
|
$
|
20.28
|
|
|
|
|||||
|
Granted
|
—
|
|
$
|
—
|
|
|
|
|||||
|
Exercised
|
(420,642
|
)
|
$
|
17.29
|
|
|
|
|||||
|
Canceled
|
(117,269
|
)
|
$
|
21.80
|
|
|
|
|||||
|
Expired
|
(905,500
|
)
|
$
|
22.05
|
|
|||||||
|
Balance at December 31, 2015
|
376,033
|
|
$
|
18.89
|
|
3.6
|
$
|
452,128
|
|
|||
|
Granted
|
—
|
|
—
|
|
||||||||
|
Exercised
|
(86,908
|
)
|
$
|
18.77
|
|
|||||||
|
Canceled
|
(24,750
|
)
|
$
|
21.51
|
|
|||||||
|
Expired
|
(32,750
|
)
|
$
|
17.56
|
|
|||||||
|
Balance at December 31, 2016
|
231,625
|
|
$
|
18.88
|
|
|||||||
|
Options vested or expected to vest at December 31, 2016
|
231,625
|
|
$
|
18.88
|
|
3.1
|
$
|
1,845,263
|
|
|||
|
Exercisable at December 31, 2016
|
231,625
|
|
$
|
18.88
|
|
3.1
|
$
|
1,845,263
|
|
|||
We received cash proceeds of
$1.6 million
,
$7.3 million
and
$7.4 million
from stock options exercised in
2016
,
2015
and
2014
, respectively. The total intrinsic value of options exercised was
$0.7 million
and
$0.8 million
, during the years ended
December 31
,
2016
and
2015
, respectively. Upon the exercise of stock options and the issuance of restricted stock awards, it is our policy to only issue shares from authorized common stock.
The aggregate intrinsic value represents the total pretax difference between the closing stock price on the last trading day of the reporting period and the option exercise price, multiplied by the number of in-the-money options. This is the amount that would have been received by the option holders had they exercised and sold their options on that day. This amount varies based on changes in the fair market value of our common stock. The closing price of our common stock on the last trading day of our fiscal year was
$26.85
.
64
Stock options outstanding at
December 31
,
2016
and
2015
are summarized in the following tables:
|
Range of
Exercise Prices
|
Options
Outstanding
at 12/31/2016
|
Weighted
Average Remaining
Contractual Life (in Years)
|
Weighted
Average Exercise
Price
|
Options
Exercisable
at 12/31/2016
|
Weighted
Average Exercise
Price
|
||||||||||||||||||
|
|
|
|
|
|
|
|
|||||||||||||||||
|
$
|
15.17
|
|
—
|
|
$
|
16.54
|
|
54,625
|
|
3.0
|
$
|
15.68
|
|
54,625
|
|
$
|
15.68
|
|
|||||
|
$
|
16.55
|
|
—
|
|
$
|
17.58
|
|
36,000
|
|
5.5
|
$
|
16.95
|
|
36,000
|
|
$
|
16.95
|
|
|||||
|
$
|
17.59
|
|
—
|
|
$
|
20.20
|
|
54,000
|
|
2.3
|
$
|
18.16
|
|
54,000
|
|
$
|
18.16
|
|
|||||
|
$
|
20.21
|
|
—
|
|
$
|
22.21
|
|
51,000
|
|
1.4
|
$
|
21.84
|
|
51,000
|
|
$
|
21.84
|
|
|||||
|
$
|
22.22
|
|
—
|
|
$
|
22.57
|
|
36,000
|
|
4.4
|
$
|
22.57
|
|
36,000
|
|
$
|
22.57
|
|
|||||
|
|
|
|
|
|
|
231,625
|
|
3.1
|
$
|
18.88
|
|
231,625
|
|
$
|
18.88
|
|
|||||||
|
Range of
Exercise Prices
|
Options
Outstanding
at 12/31/2015
|
Weighted
Average Remaining
Contractual Life (in Years)
|
Weighted
Average Exercise
Price
|
Options
Exercisable
at 12/31/2015
|
Weighted
Average Exercise
Price
|
||||||||||||||||||
|
|
|
|
|
|
|
|
|||||||||||||||||
|
$
|
15.17
|
|
—
|
|
$
|
16.54
|
|
84,250
|
|
4.0
|
$
|
15.74
|
|
84,250
|
|
$
|
15.74
|
|
|||||
|
$
|
16.55
|
|
—
|
|
$
|
17.63
|
|
89,833
|
|
3.6
|
$
|
17.23
|
|
89,833
|
|
$
|
17.23
|
|
|||||
|
$
|
17.64
|
|
—
|
|
$
|
20.20
|
|
61,500
|
|
3.1
|
$
|
18.21
|
|
61,500
|
|
$
|
18.21
|
|
|||||
|
$
|
20.21
|
|
—
|
|
$
|
22.17
|
|
79,250
|
|
2.4
|
$
|
21.84
|
|
79,250
|
|
$
|
21.84
|
|
|||||
|
$
|
22.18
|
|
—
|
|
$
|
22.57
|
|
61,200
|
|
5.4
|
$
|
22.55
|
|
61,200
|
|
$
|
22.55
|
|
|||||
|
|
|
|
|
|
|
376,033
|
|
3.6
|
$
|
18.89
|
|
376,033
|
|
$
|
18.89
|
|
|||||||
Restricted Stock Awards
Restricted stock awards, or “full value” awards, generally vest ratably over no less than a
three
year period. Shares of restricted stock granted under the Plan are considered issued and outstanding at the date of grant, have the same dividend and voting rights as other outstanding common stock, are subject to forfeiture if employment terminates prior to vesting, and are expensed ratably over the vesting period. Dividends paid on the restricted shares granted under the Plan are non-forfeitable if the restricted shares do not ultimately vest. Restricted stock activity in
2016
and
2015
are summarized in the following table:
|
|
Number of Awards
|
Weighted Average Grant Date Fair Value
|
Weighted Average Remaining Amortization Period (in Years)
|
|||||
|
Balance at December 31, 2014
|
252,476
|
|
$
|
18.93
|
|
|
||
|
Granted
|
23,814
|
|
$
|
18.31
|
|
|
||
|
Vested
|
(65,293
|
)
|
$
|
18.61
|
|
|
||
|
Canceled
|
(18,704
|
)
|
$
|
18.56
|
|
|||
|
Balance at December 31, 2015
|
192,293
|
|
$
|
19.20
|
|
1.7
|
||
|
Granted
|
—
|
|
$
|
—
|
|
|||
|
Vested
|
(42,546
|
)
|
$
|
18.47
|
|
|||
|
Canceled
|
(5,452
|
)
|
$
|
18.75
|
|
|||
|
Balance at December 31, 2016
|
144,295
|
|
$
|
19.43
|
|
0.5
|
||
Restricted Stock Units
65
Restricted stock unit activity in
2016
and
2015
are summarized in the following table:
|
|
Number of Awards
|
Weighted Average Grant Date Fair Value
|
Weighted Average Remaining Amortization Period (in Years)
|
|||||
|
Balance at December 31, 2014
|
—
|
|
$
|
—
|
|
|
||
|
Granted
|
54,428
|
|
$
|
18.78
|
|
|
||
|
Vested
|
—
|
|
$
|
—
|
|
|
||
|
Canceled
|
(1,105
|
)
|
$
|
18.78
|
|
|||
|
Balance at December 31, 2015
|
53,323
|
|
$
|
18.78
|
|
2.1
|
||
|
Granted
|
84,200
|
|
$
|
23.71
|
|
|||
|
Vested
|
(7,227
|
)
|
$
|
18.78
|
|
|||
|
Canceled
|
(2,729
|
)
|
$
|
18.78
|
|
|||
|
Balance at December 31, 2016
|
127,567
|
|
$
|
22.03
|
|
1.7
|
||
Restricted Performance Stock Units
Restricted performance stock unit activity in
2016
and
2015
are summarized in the following table:
|
|
Number of Awards
|
Weighted Average Grant Date Fair Value
|
Weighted Average Remaining Amortization Period (in Years)
|
|||||
|
Balance at December 31, 2014
|
—
|
|
$
|
—
|
|
|
||
|
Granted
|
109,354
|
|
$
|
18.78
|
|
|
||
|
Vested
|
—
|
|
$
|
—
|
|
|
||
|
Canceled
|
(2,707
|
)
|
$
|
18.78
|
|
|||
|
Balance at December 31, 2015
|
106,647
|
|
$
|
18.78
|
|
2.0
|
||
|
Granted
|
127,139
|
|
$
|
23.14
|
|
|||
|
Vested
|
—
|
|
$
|
—
|
|
|||
|
Canceled
|
(6,593
|
)
|
$
|
19.92
|
|
|||
|
Balance at December 31, 2016
|
227,193
|
|
$
|
21.72
|
|
1.6
|
||
Stock Based Compensation
Stock-based compensation expense related to our equity incentive plans in accordance with U.S. GAAP was allocated as follows:
|
Year Ended December 31,
|
2016
|
2015
|
2014
|
|||||||||
|
(Thousands of dollars)
|
|
|
|
|||||||||
|
Cost of sales
|
$
|
472
|
|
$
|
370
|
|
$
|
113
|
|
|||
|
Selling, general and administrative expenses
|
3,218
|
|
2,437
|
|
2,202
|
|
||||||
|
Stock-based compensation expense before income taxes
|
3,690
|
|
2,807
|
|
2,315
|
|
||||||
|
Income tax benefit
|
(1,361
|
)
|
(1,044
|
)
|
(740
|
)
|
||||||
|
Total stock-based compensation expense after income taxes
|
$
|
2,329
|
|
$
|
1,763
|
|
$
|
1,575
|
|
|||
As of
December 31
,
2016
a total of
$3.7 million
of unrecognized stock-based compensation expense related to non-vested awards is expected to be recognized over a weighted average period of approximately
1.6 years
. There were no significant capitalized stock-based compensation costs at
December 31
,
2016
or
2015
.
66
In October 2014, our Board of Directors approved a stock repurchase program (the "2014 Repurchase Program") which authorized the repurchase of up to
$30.0 million
of our common stock. Under the 2014 Repurchase Program, we repurchased common stock from time to time on the open market or in private transactions. Shares repurchased under the 2014 Repurchase Program during 2015 totaled
1,056,954
shares at a cost of
$19.6 million
. The 2014 Repurchase Program was completed in the beginning of 2016, with purchases of
585,970
shares for a cost of
$10.3 million
. The repurchased shares described above were either canceled and retired or added to treasury stock after the reincorporation in Delaware in 2015.
In January of 2016, our Board of Directors approved another stock repurchase program (the “2016 Repurchase Program”), authorizing the repurchase of up to
$50.0 million
of common stock. Under the 2016 Repurchase Program, we may repurchase common stock from time to time on the open market or in private transactions. The timing and extent of the repurchases under the 2016 Repurchase Program will depend upon market conditions and other corporate considerations in our sole discretion. During
2016
, we repurchased
454,718
shares of company stock at a cost of
$10.4 million
under the 2016 Repurchase Program. In aggregation of the 2014 Repurchase Program and 2016 Repurchase Program we purchased
$20.7 million
in company stock during 2016.
(Dollars in thousands, except per share amounts)
|
|
First
|
Second
|
Third
|
Fourth
|
|
|||||||||||||||
|
Year 2016
|
Quarter
|
Quarter
|
Quarter
|
Quarter
|
Year
|
|||||||||||||||
|
Net sales
|
$
|
186,065
|
|
$
|
182,709
|
|
$
|
175,580
|
|
$
|
188,323
|
|
$
|
732,677
|
|
|||||
|
Gross profit
|
$
|
27,715
|
|
$
|
29,540
|
|
$
|
10,981
|
|
$
|
17,968
|
|
$
|
86,204
|
|
|||||
|
Income from operations
|
$
|
18,722
|
|
$
|
19,540
|
|
$
|
5,250
|
|
$
|
11,090
|
|
$
|
54,602
|
|
|||||
|
Income before income taxes
|
$
|
19,022
|
|
$
|
19,247
|
|
$
|
4,910
|
|
$
|
11,542
|
|
$
|
54,721
|
|
|||||
|
Income tax (provision) benefit
|
$
|
(4,558
|
)
|
$
|
(6,082
|
)
|
$
|
1,064
|
|
$
|
(3,764
|
)
|
$
|
(13,340
|
)
|
|||||
|
Net income
|
$
|
14,464
|
|
$
|
13,165
|
|
$
|
5,974
|
|
$
|
7,778
|
|
$
|
41,381
|
|
|||||
|
Income per share:
|
||||||||||||||||||||
|
Basic
|
$
|
0.56
|
|
$
|
0.52
|
|
$
|
0.24
|
|
$
|
0.31
|
|
$
|
1.63
|
|
|||||
|
Diluted
|
$
|
0.56
|
|
$
|
0.52
|
|
$
|
0.23
|
|
$
|
0.31
|
|
$
|
1.62
|
|
|||||
|
Dividends declared per share
|
$
|
0.18
|
|
$
|
0.18
|
|
$
|
0.18
|
|
$
|
0.18
|
|
$
|
0.72
|
|
|||||
|
|
First
|
Second
|
Third
|
Fourth
|
|
|||||||||||||||
|
Year 2015
|
Quarter
|
Quarter
|
Quarter
|
Quarter
|
Year
|
|||||||||||||||
|
Net sales
|
$
|
173,729
|
|
$
|
183,940
|
|
$
|
175,656
|
|
$
|
194,621
|
|
$
|
727,946
|
|
|||||
|
Gross profit
|
$
|
11,222
|
|
$
|
19,920
|
|
$
|
16,484
|
|
$
|
23,591
|
|
$
|
71,217
|
|
|||||
|
Income from operations
|
$
|
3,669
|
|
$
|
11,039
|
|
$
|
8,059
|
|
$
|
13,527
|
|
$
|
36,294
|
|
|||||
|
Income before income taxes
|
$
|
3,572
|
|
$
|
10,734
|
|
$
|
7,615
|
|
$
|
13,362
|
|
$
|
35,283
|
|
|||||
|
Income tax (provision) benefit
|
$
|
762
|
|
$
|
(4,200
|
)
|
$
|
(2,669
|
)
|
$
|
(5,232
|
)
|
$
|
(11,339
|
)
|
|||||
|
Net income
|
$
|
4,334
|
|
$
|
6,534
|
|
$
|
4,946
|
|
$
|
8,130
|
|
$
|
23,944
|
|
|||||
|
Income per share:
|
||||||||||||||||||||
|
Basic
|
$
|
0.16
|
|
$
|
0.24
|
|
$
|
0.19
|
|
$
|
0.31
|
|
$
|
0.90
|
|
|||||
|
Diluted
|
$
|
0.16
|
|
$
|
0.24
|
|
$
|
0.19
|
|
$
|
0.31
|
|
$
|
0.90
|
|
|||||
|
Dividends declared per share
|
$
|
0.18
|
|
$
|
0.18
|
|
$
|
0.18
|
|
$
|
0.18
|
|
$
|
0.72
|
|
|||||
67
We are subject to various risks and uncertainties in the ordinary course of business due, in part, to the competitive global nature of the industry in which we operate, changing commodity prices for the materials used in the manufacture of our products and the development of new products.
The functional currency of certain foreign operations in Mexico is the Mexican peso. The settlement of accounts receivable and accounts payable for our operations in Mexico requires the transfer of funds denominated in the Mexican peso, the value of which decreased
19 percent
in relation to the U.S. dollar in 2016. Foreign currency transaction losses totaled
$0.4 million
,
$1.2 million
and
$1.0 million
in 2016, 2015 and 2014, respectively. All transaction gains and losses are included in other expense, net in the consolidated income statements.
As it relates to foreign currency translation gains and losses, however, since 1990, the Mexican peso has experienced periods of relative stability followed by periods of major declines in value. The impact of these changes in value relative to our Mexico operations resulted in a cumulative unrealized translation loss at
December 31
,
2016
of
$105.2 million
. Translation gains and losses are included in other comprehensive income in the consolidated statements of comprehensive income (loss).
When market conditions warrant, we may also enter into purchase commitments to secure the supply of certain commodities used in the manufacture of our products, such as aluminum, natural gas and other raw materials. At
December 31
,
2016
, we did not have any purchase commitments in place for the delivery of aluminum, natural gas or other raw materials in 2017.
We are party to various legal and environmental proceedings incidental to our business. Certain claims, suits and complaints arising in the ordinary course of business have been filed or are pending against us. Based on facts now known, we believe all such matters are adequately provided for, covered by insurance, are without merit and/or involve such amounts that would not materially adversely affect our consolidated results of operations, cash flows or financial position.
68
None.
Evaluation of Disclosure Controls
The company's management, with the participation of the CEO and Chief Financial Officer, evaluated the effectiveness of the company's disclosure controls and procedures (as defined in Rules 13a-15(e) and 15d-15(e) under the Exchange Act) as of December 31, 2016. Our disclosure controls and procedures are designed to ensure that information required to be disclosed in reports we file or submit under the Exchange Act is recorded, processed, summarized and reported within the time periods specified in SEC rules and forms and that such information is accumulated and communicated to our management, including our CEO and Chief Financial Officer, to allow timely decisions regarding required disclosures.
Based on this evaluation, our Chief Executive Officer and Chief Financial Officer concluded that, as of December 31, 2016 our disclosure controls and procedures were effective.
Management's Report on Internal Control Over Financial Reporting
Management is responsible for establishing and maintaining adequate internal control over financial reporting. As defined in Rule 13a-15(f) under the Exchange Act, internal control over financial reporting is a process designed to provide reasonable assurance regarding the reliability of financial reporting and the preparation of financial statements for external purposes in accordance with generally accepted accounting principles. The company's internal control over financial reporting includes those policies and procedures that (i) pertain to the maintenance of records that, in reasonable detail, accurately and fairly reflect the transactions and dispositions of the assets of the company; (ii) provide reasonable assurance that transactions are recorded as necessary to permit preparation of financial statements in accordance with generally accepted accounting principles, and that receipts and expenditures of the company are being made only in accordance with authorizations of management and directors of the company; and (iii) provide reasonable assurance regarding prevention or timely detection of unauthorized acquisition, use, or disposition of the company's assets that could have a material effect on the financial statements.
Because of its inherent limitations, internal control over financial reporting may not prevent or detect all misstatements. Also, projections of any evaluation of effectiveness to future periods are subject to the risk that controls may become inadequate because of changing conditions, or that the degree of compliance with policies or procedures may deteriorate.
A material weakness is a deficiency, or combination of deficiencies, in internal control over financial reporting, such that there is a reasonable possibility that a material misstatement of the company's annual or interim financial statements will not be prevented or detected on a timely basis.
Management performed an assessment of the effectiveness of the company's internal control over financial reporting as of December 31, 2016 based upon criteria established in the
2013
Internal Control -- Integrated Framework
issued by the Committee of Sponsoring Organizations of the Treadway Commission (COSO). Based on our assessment, management determined that our internal control over financial reporting was effective as of December 31, 2016 based on the criteria in the
2013 Internal Control -- Integrated Framework
issued by COSO.
The effectiveness of the company's internal control over financial reporting as of December 31, 2016 has been audited by Deloitte and Touche LLP, an independent registered public accounting firm, as stated in their report, which is included in this Annual Report.
Changes in Internal Control Over Financial Reporting
There has been no change in our internal control over financial reporting during the most recent fiscal quarter ended December 31, 2016 that has materially affected, or is reasonably likely to materially affect, our internal control over financial reporting.
None.
69
Except as set forth herein, the information required by this Item is incorporated by reference to our 2017 Annual Proxy Statement.
Executive Officers
- The names of corporate executive officers as of fiscal year end who are not also Directors are listed at the end of Part I of this Annual Report. Information regarding executive officers who are Directors is contained in our 2017 Annual Proxy Statement under the caption “Proposal No. 1 - Election of Directors.” Such information is incorporated herein by reference. With the exception of the CEO, all executive officers are appointed annually by the Board of Directors and serve at the will of the Board of Directors. For a description of the CEO’s employment agreement, see “Executive Compensation and Related Information - Compensation Discussion and Analysis” in our 2017 Annual Proxy Statement, which is incorporated herein by reference.
Code of Ethics
- Included on our website, www.supind.com, under “Investors,” is our Code of Conduct, which, among others, applies to our CEO, Chief Financial Officer and Chief Accounting Officer. Copies of our Code of Conduct are available, without charge, from Superior Industries International, Inc., Shareholder Relations, 26600 Telegraph Road, Suite 400, Southfield, MI 48033.
Information relating to Executive Compensation is set forth under the captions “Compensation of Directors” and “Executive Compensation and Related Information - Compensation Discussion and Analysis” in our 2017 Annual Proxy Statement, which is incorporated herein by reference.
Information related to Security Ownership of Certain Beneficial Owners and Management and Related Stockholder Matters is set forth under the caption “Voting Securities and Principal Ownership” in our 2017 Annual Proxy Statement. Also see Note 15, "Stock Based Compensation" in Notes to the Consolidated Financial Statements in Item 8, "Financial Statements and Supplementary Data" of this Annual Report.
Information related to Certain Relationships and Related Transactions is set forth under the caption, “Certain Relationships and Related Transactions,” in our 2017 Annual Proxy Statement, and in Note 11, "Leases and Related Parties" in Notes to the Consolidated Financial Statements in Item 8, "Financial Statements and Supplementary Data" of this Annual Report.
Information related to Principal Accountant Fees and Services is set forth under the caption “Proposal No. 5 - Ratification of Independent Registered Public Accounting Firm - Principal Accountant Fees and Services” in our 2017 Annual Proxy Statement and is incorporated herein by reference.
70
|
(a)
|
The following documents are filed as a part of this report:
|
|
1.
|
Financial Statements: See the “Index to the Consolidated Financial Statements and Financial Statement Schedule” in Item 8 of this Annual Report.
|
|
2.
|
Financial Statement Schedule
|
Schedule II – Valuation and Qualifying Accounts for the Years Ended
December 31
,
2016
,
2015
and
2014
|
3.
|
Exhibits
|
|
2.1
|
Agreement and Plan of Merger of Superior Industries International, Inc., a Delaware corporation (Incorporated by reference to Exhibit 2.1 to the Registrant's Current Report on Form 8-K filed May 21, 2015).
|
|
3.1
|
Certificate of Incorporation of the Registrant (Incorporated by reference to Exhibit 3.1 to Registrant’s Current Report on Form 8-K filed May 21, 2015).
|
|
3.2
|
Amended and Restated By-Laws of the Registrant effective as of October 25, 2016 (Incorporated by reference to Exhibit 3.2 to Registrant’s Current Report on Form 8-K filed May 21, 2015).
|
|
4.1
|
Form of Superior Industries International, Inc.'s Common Stock Certificate (Incorporated by reference to Exhibit 4.1 to the Registrant's Current Report on Form 8-K filed May 21, 2015).
|
|
10.1
|
2003 Equity Incentive Plan of the Registrant (Incorporated by reference to Exhibit 99.1 to Registrant's Form S-8 dated July 28, 2003. Registration No. 333-107380). *
|
|
10.2
|
Salary Continuation Plan of The Registrant, amended and restated as of November 14, 2008 (Incorporated by reference to Exhibit 10.12 to Registrant’s Annual Report on Form 10-K for the year ended December 31, 2008). *
|
|
10.3
|
2008 Equity Incentive Plan of the Registrant (Incorporated by reference to Exhibit A to Registrant’s Definitive Proxy Statement on Schedule 14A filed on April 28, 2008).*
|
|
10.4
|
2008 Equity Incentive Plan Notice of Stock Option Grant and Agreement (Incorporated by reference to Exhibit 10.2 to Registrant’s Form S-8 filed November 10, 2008. Registration No. 333-155258).*
|
|
10.5
|
Employment letter between the Registrant and Kerry A. Shiba, Senior Vice President and Chief Financial Officer (Incorporated by reference to Exhibit 10.1 to Registrant's Quarterly Report on Form 10-Q for the period ended September 26, 2010).*
|
|
10.6
|
Form of Notice of Grant and Restricted Stock Agreement pursuant to Registrant's 2008 Equity Incentive Plan (Incorporated by reference to Exhibit 10.1 to Registrant's Current Report on Form 8‑K filed May 20, 2010).*
|
|
10.7
|
Second Amendment to Sublease Agreement dated April 1, 2010 by and among The Louis L. Borick Trust and The Nita Borick Management Trust and Registrant (Incorporated by reference to Exhibit 10.1 to Registrant's Current Report on Form 8-K filed March 25, 2010).
|
|
10.8
|
2010 Employee Incentive Plan of the Registrant (Incorporated by reference to exhibit 10.14 to Registrant’s Annual Report on Form 10-K for the year ended December 31, 2010).*
|
|
10.9
|
Superior Industries International, Inc. Annual Incentive Performance Plan (Incorporated by reference to Exhibit 10.1 to Registrant’s Current Report on Form 8-K dated March 24, 2011).*
|
|
10.10
|
Superior Industries International, Inc. CEO Annual Incentive Performance Plan (Incorporated by reference to Exhibit 10.2 to Registrant’s Current Report on Form 8-K dated March 24, 2011).*
|
|
10.11
|
Superior Industries International, Inc. Executive Change in Control Severance Plan (Incorporated by reference to Exhibit 10.4 to Registrant’s Current Report on Form 8-K dated March 24, 2011).*
|
|
10.12
|
Amended and Restated 2008 Equity Incentive Plan of the Registrant (Incorporated by reference to Exhibit 10.1 to Registrant’s Current Report on Form 8-K filed May 23, 2013).*
|
71
|
10.13
|
Amended and Restated Executive Employment Agreement, dated August 10, 2016, between the Registrant and Donald J. Stebbins. (Incorporated by reference to Exhibit 10.1 to Registrant’s Current Report on Form 8-K dated August 11, 2016).*
|
|
10.14
|
Credit agreement dated December 19, 2014 between Superior Industries International, Inc. and JPMorgan Chase Bank, N.A. and Wells Fargo Bank, National Association (Incorporated by reference to Exhibit 10.1 to Registrant’s Current Report on Form 8-K filed December 23, 2014).
|
|
10.15
|
Amendment No. 1 to the Credit Agreement dated as of March 3, 2015, by and among Superior Industries International, Inc., the Lenders from time to time a party thereto and JP Morgan Chase Bank, N.A. as Administrative Agent (Incorporated by reference to Exhibit 10.2 to Registrant’s Quarterly Report on Form 10-Q for the quarter ended March 29, 2015).
|
|
10.16
|
Consent and Amendment No. 2 dated as of October 14, 2015 to the Credit Agreement dated as of December 19, 2014, by and among Superior Industries International, Inc., the Lenders from time to time party thereto and JP Morgan Chase Bank, N.A., as Administrator (Incorporated by reference to Exhibit 10.2 to Registrant’s Quarterly Report on Form 10-Q for the quarter ended September 27, 2015).
|
|
10.17
|
Form of Restricted Stock Unit Agreement under the Superior Industries International, Inc. Amended and Restated 2008 Equity Incentive Plan (Incorporated by reference to Exhibit 10.24 to Registrant's Annual Report on Form 10-K for the year ended December 31, 2015).*
|
|
10.18
|
Form of Performance Based Restricted Stock Unit Agreement under the Superior Industries International, Inc. Amended and Restated 2008 Equity Incentive Plan (Incorporated by reference to Exhibit 10.24 to Registrant's Annual Report on Form 10-K for the year ended December 31, 2015).*
|
|
10.19
|
Form of Non-Employee Director Restricted Stock Unit Agreement under the Superior Industries International, Inc. Amended and Restated 2008 Equity Incentive Plan (Incorporated by reference to Exhibit 10.1 to Registrant's Quarterly Report on Form 10-Q filed on July 29, 2016).*
|
|
10.20
|
Superior Industries International, Inc. Annual Incentive performance Plan (Incorporated by reference to Annex A to Registrant's Definitive Proxy Statement on Schedule 14-A filed on March 28, 2016).*
|
|
11
|
Computation of Earnings Per Share (contained in Note 1 – Summary of Significant Accounting Policies in Notes to Consolidated Financial Statements in Item 8 – Financial Statements and Supplementary Data of this Annual Report on Form 10-K).
|
|
21
|
List of Subsidiaries of the Company (filed herewith).
|
|
23
|
Consent of Deloitte and Touche LLP, our Independent Registered Public Accounting Firm (filed herewith).
|
|
31.1
|
Chief Executive Officer Certification Pursuant to 18 U.S.C. Section 1350, as Adopted Pursuant to Section 302(a) of the Sarbanes-Oxley Act of 2002 (filed herewith).
|
|
31.2
|
Chief Financial Officer Certification Pursuant to 18 U.S.C. Section 1350, as Adopted Pursuant to Section 302(a) of the Sarbanes-Oxley Act of 2002 (filed herewith).
|
|
32
|
Certification of Donald J. Stebbins, Chief Executive Officer and President, and Kerry A. Shiba, Executive Vice President and Chief Financial Officer, Pursuant to 18 U.S.C. Section 1350, as Adopted Pursuant to Section 906 of the Sarbanes-Oxley Act of 2002 (furnished herewith).
|
|
101
|
Interactive data file (furnished electronically herewith pursuant to Rule 406T of Regulation S-T).
|
* Indicates management contract or compensatory plan or arrangement.
** Filed herewith.
72
SUPERIOR INDUSTRIES INTERNATIONAL, INC.
ANNUAL REPORT ON FORM 10-K
Schedule II
VALUATION AND QUALIFYING ACCOUNTS
FOR THE YEARS ENDED DECEMBER 31,
2016
,
2015
AND
2014
(Dollars in thousands)
|
|
Additions
|
|
|
|||||||||||||||||
|
Balance at
Beginning of
Year
|
Charge to
Costs and
Expenses
|
Other
Comprehensive
Income (Loss)
|
Deductions
From
Reserves
|
Balance at
End of
Year
|
||||||||||||||||
|
2016
|
||||||||||||||||||||
|
Allowance for doubtful accounts receivable
|
$
|
867
|
|
$
|
403
|
|
$
|
—
|
|
$
|
(351
|
)
|
$
|
919
|
|
|||||
|
Valuation allowances for deferred tax assets
|
$
|
5,891
|
|
$
|
698
|
|
$
|
—
|
|
$
|
(3,466
|
)
|
$
|
3,123
|
|
|||||
|
2015
|
|
|
|
|
|
|
|
|
|
|
||||||||||
|
Allowance for doubtful accounts receivable
|
$
|
514
|
|
$
|
380
|
|
$
|
—
|
|
$
|
(27
|
)
|
$
|
867
|
|
|||||
|
Valuation allowances for deferred tax assets
|
$
|
3,911
|
|
$
|
1,980
|
|
$
|
—
|
|
$
|
—
|
|
$
|
5,891
|
|
|||||
|
2014
|
|
|
|
|
|
|
|
|
|
|
||||||||||
|
Allowance for doubtful accounts receivable
|
$
|
910
|
|
$
|
(426
|
)
|
$
|
—
|
|
$
|
30
|
|
$
|
514
|
|
|||||
|
Valuation allowances for deferred tax assets
|
$
|
3,398
|
|
$
|
473
|
|
$
|
40
|
|
$
|
—
|
|
$
|
3,911
|
|
|||||
S-1
SUPERIOR INDUSTRIES INTERNATIONAL, INC.
ANNUAL REPORT ON FORM 10-K
SIGNATURES
Pursuant to the requirements of Section 13 or 15(d) of the Securities Exchange Act of 1934, the Registrant has duly caused this report to be signed on its behalf by the undersigned, thereunto duly authorized.
|
|
|
|
|
|
|
SUPERIOR INDUSTRIES INTERNATIONAL, INC.
|
||||
|
(Registrant)
|
||||
|
|
|
|
|
|
|
|
By
|
/s/ Donald J. Stebbins
|
March 3, 2017
|
|
|
|
|
Donald J. Stebbins
|
|
|
|
|
|
Chief Executive Officer and President
|
|
|
Pursuant to the requirements of the Securities Exchange Act of 1934, this report has been signed below by the following persons on behalf of the registrant and in the capacity and on the dates indicated.
|
|
|
|
|
/s/ Donald J. Stebbins
|
Chief Executive Officer and President
|
March 3, 2017
|
|
Donald J. Stebbins
|
(Principal Executive Officer)
|
|
|
|
|
|
|
/s
/ Kerry A. Shiba
|
Executive Vice President and Chief Financial Officer
|
March 3, 2017
|
|
Kerry A. Shiba
|
(Principal Financial Officer)
|
|
|
/s
/ Scot S. Bowie
|
Vice President and Corporate Controller
|
March 3, 2017
|
|
Scot S. Bowie
|
(Principal Accounting Officer)
|
|
|
|
|
|
|
/s
/ Margaret S. Dano
|
Chairman of the Board
|
March 3, 2017
|
|
Margaret S. Dano
|
|
|
|
/s
/ Michael R. Bruynesteyn
|
Director
|
March 3, 2017
|
|
Michael R. Bruynesteyn
|
|
|
|
/s
/ Jack A. Hockema
|
Director
|
March 3, 2017
|
|
Jack A. Hockema
|
||
|
|
|
|
|
/s
/ Paul J. Humphries
|
Director
|
March 3, 2017
|
|
Paul J. Humphries
|
|
|
|
|
|
|
|
/s
/ James S. McElya
|
Director
|
March 3, 2017
|
|
James S. McElya
|
|
|
|
|
|
|
|
/s
/ Timothy C. McQuay
|
Director
|
March 3, 2017
|
|
Timothy C. McQuay
|
|
|
|
/s
/ Ellen B. Richstone
|
Director
|
March 3, 2017
|
|
Ellen B. Richstone
|
|
|
|
|
|
|
|
/s
/ Francisco S. Uranga
|
Director
|
March 3, 2017
|
|
Francisco S. Uranga
|
|
|
TABLE OF CONTENTS
Part IItem 1 - BusinessItem 1A - Risk FactorsItem 1B - Unresolved Staff CommentsItem 2 - PropertiesItem 3 - Legal ProceedingsItem 4 - Mine Safety DisclosuresItem 4A - Executive Officers Of The RegistrantPart IIItem 5 - Market For Registrant's Common Equity, Related Stockholder Matters and Issuer Purchases Of Equity SecuritiesItem 6 - Selected Financial DataItem 7 - Management's Discussion and Analysis Of Financial Condition and Results Of OperationsItem 7A - Quantitative and Qualitative Disclosures About Market RiskItem 8 - Financial Statements and Supplementary DataNote 1 - Summary Of Significant Accounting PoliciesNote 2 - RestructuringNote 3 - Fair Value MeasurementsNote 4 - Derivative Financial InstrumentsNote 5 - Business SegmentsNote 6 - Accounts ReceivableNote 7 - InventoriesNote 8 - Property, Plant and EquipmentNote 9 - Investment in Unconsolidated AffiliateNote 10 - Income TaxesNote 11 - Leases and Related PartiesNote 12 - Retirement PlansNote 13 - Accrued ExpensesNote 14 - Line Of CreditNote 15 - Stock-based CompensationNote 16 - Common Stock Repurchase ProgramsNote 17 - Quarterly Financial Data (unaudited)Note 18 - Risk ManagementItem 9 - Changes in and Disagreements with Accountants on Accounting and Financial DisclosureItem 9A - Controls and ProceduresItem 9B - Other InformationPart IIIItem 10 - Directors, Executive Officers and Corporate GovernanceItem 11 - Executive CompensationItem 12 - Security Ownership Of Certain Beneficial Owners and Management and Related Stockholder MattersItem 13 - Certain Relationships and Related Transactions, and Director IndependenceItem 14 - Principal Accountant Fees and ServicesPart IVItem 15 - Exhibits and Financial Statement Schedules